Everybody's - CSE
372
BANK OF CEYLON Annual Report 2014 Truly Bank Everybody’s
-
Upload
khangminh22 -
Category
Documents
-
view
0 -
download
0
Transcript of Everybody's - CSE

BANK OF CEYLON
Annual Report 2014
TrulyBank
Everybody’s

Our website is available on multiple platforms from
mobile devices to laptops. For a more interactive
report, visit www.boc.lk
ContentsOur Vision and Mission / 4
How We Fulfilled Our Mission / 5
Financial Highlights / 6
Awards / 7
About This Report / 8
Infrastructure Growth / 9
Reaching Out to Everybody / 10
From Grassroots to Giants / 12
From Then to Now… / 16
The Stature of Our Leadership / 18
Outgoing Chairman’s Review / 22
New Chairman’s Message / 26
Shaping the Future / 29
General Manager’s Review / 30
Board of Directors / 36
New Board of Directors / 40
Stakeholder Engagement / 42
Determining Material Issues / 44
Corporate Management / 46
Executive Management / 56
Management Discussion
and Analysis / 62
Financial Review / 70
Operational Review
- Retail Banking / 76
- Corporate and Offshore Banking / 82
- International, Treasury, Investment
and Overseas Branches / 86
Information Technology / 91
Employee Report / 93
Social Report / 102
Value Addition Statement / 104
Environment Report / 105
Snapshots of Social and
Environment Reports / 106
Independent Assurance Report / 107
GRI Index / 109
Corporate Governance / 114
Board Subcommittee Reports / 138
Risk Management / 147
Financial Reports
Annual Report of the Directors
on the State of Affairs of Bank of Ceylon / 162
Directors’ Interests in Contracts / 167
Directors’ Statement on Internal Control
over Financial Reporting / 171
Independent Assurance Report / 173
Directors’ Responsibility for Financial Reporting / 174
Report of the Auditor General / 175
Income Statement / 176
Statement of Other Comprehensive Income / 177
Statement of Financial Position / 178
Statement of Changes in Equity / 179
Statement of Cash Flows / 180
Notes to the Financial Statements / 182
Supplementary Information
Capital Adequacy / 326
Compliance Requirements Enforced by
Colombo Stock Exchange (CSE) / 332
Compliance Requirements Enforced by
Central Bank of Sri Lanka (CBSL) / 334
Income Statement in USD / 338
Statement of Other Comprehensive Income
in USD / 339
Statement of Financial Position in USD / 340
Quarterly Performance / 341
Share and Debenture Information / 344
Ten Year Statistical Summary - Bank / 346
Subsidiaries and Associates / 349
BoC Correspondent Banks by Country / 352
Exchange Companies by Country / 359
Glossary of Financial/Banking Terms / 360
Corporate and Overseas Offices / 366
Corporate Information / Inner Back Cover

TrulyBank
Everybody’s
The Bank of Ceylon is now Sri Lanka’s largest bank and we are proud to celebrate our 75th year in a long and distinguished history marked by many milestones of national and international signiicance. For many years we have been ranked among the top 1,000 banks in the world and as Sri Lanka’s number one brand, while our list of awards and achievements simply gets longer with every passing year.
Our primary purpose has always been to create value for every one of our thousands of stakeholders; our investors, business partners, regulators, communities... and of course, our customers. Our stakeholders’ ambitions remain our priority as we shape livelihoods, broaden horizons and make real people’s dreams - wherever and whoever they are.
Today it is our heritage, size and strength that makes us one of the most powerful leaders in the local banking industry - a position we intend to evolve further in the years that lie ahead. Because that’s what it means to be best, beyond. And that’s what it means to be truly everybody’s bank.
Bank of CeylonTruly Everybody’s Bank

2
BANK OF CEYLON . Annual Report 2014
‘Best Beyond’ is our theme in our 75th anniversary, as we reinforce our claim to be the best, in inancial strength, technology, customer service, good governance and business excellence.

3
Truly Everybody’s Bank
* First local bank that has over LKR 1 trillion asset base
* Ranked by Brand Finance Lanka as the No.1 Brand in Sri Lanka for the last six consecutive years
* Fitch Rating Lanka AA+ (lka) - a highest rating awarded to a local commercial bank
* Ranked one of the top 1,000 banks in the world by The Banker Magazine, UK in 2012, 2013 and 2014
* Listed as one of Asia’s Best Brands 2013 by the CMO Council India
* Gold Award winner under many categories at the National Business Excellence Awards in 2011, 2012, 2013 and 2014
* The irst Sri Lankan Bank to issue an international bond (USD 500 million ive year tenure bond issue)
Beyond’‘Best
B usiness Excellence
E xceeding customer expectations
S peedy delivery
T echnologically driven

4
BANK OF CEYLON . Annual Report 2014
NationBankersto the
Our Vision
Our MissionCustomersFoster mutually rewarding customer relationshipswith all our customers, exceeding their expectations.
StafGive all our staf the recognition and rewards to be thebest team of achievers in service excellence.
OwnersBe a proitable catalyst for equitable developmentcovering urban and rural areas.
SocietyProvide world-class banking services across the nationas a beacon for progress and growth.

5
Truly Everybody’s Bank
How We Fulilled Our Mission
2010 2011 2012 2013 2014
LKR Bn Nos
72
03
82
53
0
56
2
59
6 71
5
69
3 75
5 84
2
77
8
934
83
8
1,3
29
Loans and Advances
Total Assets
Deposits
Number of Customers ('000)
1,1
94
9,3
21
10
,17
9
10,5
76
10,9
44
11
,49
6
1,0
48
2010 2011 2012 2013 2014
LKR Mn Nos
79.6
14
68
,20
4
8,1
15
7,7
90
8,8
83
8,5
77
93
.6
15
6
10
419
6
95
23
6
24
58
3.5
Welfare
Training
Headcount
Customers
Society
Staff
920 Promotions
1,340 Training programmes
covering all employees
2010 2011 2012 2013 2014
Number of Customer
Touch Points
879 9
70 1,0
51
1,1
39
1,1
60
2010 2011 2012 2013 2014
Value Addition
LKR Bn
34
42
58
56
59
2010 2011 2012 2013 2014
ROAE
%
24.0
33.5
31
.2
22.2
20
.5
Owners

6
BANK OF CEYLON . Annual Report 2014
Financial Highlights
Bank Group
2014 2013 Change % 2014 2013 Change %
Results of Operations (LKR million)
Total income 126,546 127,464 (0.7) 133,023 134,230 (0.9)
Net interest income 38,450 37,143 3.5 40,754 39,342 3.6
Profit before financial VAT, NBT and taxation 24,343 18,420 32.2 25,074 18,632 34.6
Profit before taxation 20,291 15,709 29.2 21,431 16,105 33.1
Profit after taxation 13,574 12,087 12.3 14,372 12,148 18.3
Value to Government 17,615 11,679 50.8 18,010 12,059 49.3
Financial Position (LKR million)
Total assets 1,329,020 1,193,581 11.3 1,365,404 1,225,762 11.4
Gross loans and advances 777,505 755,385 2.9 801,584 777,927 3.0
Loans and advances net of
provisioning for impairment 741,348 725,332 2.2 763,772 746,572 2.3
Deposits due to customers 933,966 842,070 10.9 943,934 850,768 11.0
Total liabilities 1,254,214 1,135,881 10.4 1,279,823 1,158,850 10.4
Total equity 74,806 57,700 29.6 85,581 66,912 27.9
Per Share Data (LKR)
Earnings per share 2,715 2,417 12.3 2,885 2,447 17.9
Net assets per share 14,961 11,540 29.6 16,879 13,123 28.6
Performance Ratios (%)
Return on average assets 1.6 1.4 0.2 1.7 1.4 0.3
Return on average equity 20.5 22.2 (1.7) 18.8 19.4 (0.6)
Interest margin 3.0 3.3 (0.3) 3.1 3.4 (0.3)
Cost to income 44.0 49.1 (5.1) 46.6 52.0 (5.4)
Loans to deposit 83.2 89.6 (6.4) 84.9 91.4 (6.5)
Debt to equity (Times) 293.1 336.3 (43.2) - - -
Impairment provision as a percentage of
gross loans and advances 4.7 4.0 0.7 4.7 4.0 0.7
Statutory Ratio (%)
Liquid assets ratio (Domestic)
(minimum requirement 20%) 30.8 27.7 3.1 - - -
Capital Adequacy Ratios (%)
Core capital adequacy ratio
(minimum requirement 5%) 9.5 8.4 1.1 9.8 8.9 1.6
Capital adequacy ratio
(minimum requirement 10%) 13.6 12.1 1.5 14.0 12.9 1.7

7
Truly Everybody’s Bank
Winner of the Excellence in Local
Market Reach Category
Runner-up of the Excellence in
Corporate Social Responsibility
Compliance award was
received for the banking
sector at Annual Report
Award Ceremony
2014 conducted by the
Institute of Chartered
Accountants of Sri Lanka
Runner-up of the Banking Sector
No.1 brand in the country for sixth consecutive year ranked by
“Brand Finance Lanka”, a subsidiary of Brand Finance network (UK)
Brand Value - LKR 30.83 billion
Ranked above all Sri Lankan banks by “The Banker“ in the top 1,000 banks
in the world for two consecutive years
Ranked 994 position in the world
National Business Excellence Awards 2014 by the National Chamber of Commerce of Sri Lanka
Awards
International ARC Awards 2014
Traditional Annual Report:
(International Banks) - SILVER
Financial Data: (International Banks) -
GOLD
Written Text: (International Banks) -
SILVER
Bank of Ceylon Annual Report 2013 was recognized among ARC 100 Top Annual Reports 2014
SAFA Awards 2012 (Conducted in 2014)
Public Sector Banking Institutions : 1st Runner –up
SAFA Awards 2013 (Conducted in 2014)
Public Sector Banking Institutions : Winner
Bank of Ceylon was
presented with the
Global Commerce
Excellence Award
in recognition of
supporting the Sri
Lankan economy
Global Ratings
Fitch Ratings: reaffirmed as
BB- with stable outlook
Moody’s : reaffirmed as
B1 with stable outlook
Local Ratings
Fitch Ratings Lanka Ltd: reaffirmed as
AA+ (lka) with stable outlook
ICRA Lanka Limited:
(SL) AAA with stable outlook

8
BANK OF CEYLON . Annual Report 2014
About This Report
Scope and Boundary
This Annual Integrated Report covers the
period 1 January 2014 to 31 December 2014.
Material events after this date up to the sign
off by the Board of Directors on 18 March
2015 are also included. The report presents
a balanced and comprehensive but concise
analysis of the Bank’s strategy, performance
and outlook for the future.
The report covers the Group’s operations
in Sri Lanka, India, Maldives, Seychelles
and United Kingdom through branch
offices and subsidiaries. A large proportion
of the information in this report relates to
the holding company, Bank of Ceylon, the
highest contributor to the Group’s profits.
Information relating to the Group or its
subsidiaries is clearly indicated to differentiate
from the Bank’s operations. The data used in
the narratives refers to the Bank of Ceylon
unless otherwise indicated due to its relative
size within the Group.
This integrated report conforms to the
requirements of the Bank of Ceylon
Ordinance No. 53 of 1938, the Banking Act
No. 30 of 1988 and subsequent amendments
thereto, the Continuing Listing Requirements
of the Colombo Stock Exchange, the Code
of Best Practice on Corporate Governance
jointly issued by the Institute of Chartered
Accountants of Sri Lanka and the Securities
and Exchange Commission of Sri Lanka,
the International Integrated Reporting (IIR)
Framework issued by the International
Integrated Reporting Council (IIRC) and the
G4 Guidelines issued by the Global Reporting
Initiative (GRI). The Financial Statements
have been prepared in accordance with
the Sri Lanka Accounting Standards which
comprises the latest International Accounting
Standards.
Reporting to Stakeholders
Bank has a diverse range of stakeholders
with varied information needs. Our primary
report is the integrated report and is aimed
principally at the capital providers.
The materiality principal has been applied
in accessing the areas to be covered in this
integrated report.
Materiality
The focus of the report provides financial
and non-financial information on material
developments and issues that shaped our
performance during the reporting period and
are likely to impact our future performance.
A material development or issue is defined
as one that substantively affects our ability
to create value in the short, medium or long
term to our stakeholders. Ability to manage
these developments affects the performance
and seeks proactive engagement of the
stakeholders to stay informed about likely
developments in order to mitigate risks that
may arise and to evaluate opportunities for
growth and enhance performance.
Fundamentals
Understanding the ability to create value over
time depends on resources and relationships
used and affected by the Bank (collectively
known as capital). The Bank has adopted the
categorization of the IIR Framework issued
by the IIRC in identifying the capital types
and this report aims to provide an insight
into how this capital is used and affected.
Financial capital - Financial capital includes
reserves generated through share capital,
other equity-related funding and retained
profits generated from operations that are
used to fund the business activities.
Manufactured capital - The Bank’s
manufactured capital is in the form of
tangible and intangible infrastructure.
Intellectual capital - Intellectual capital
includes brand and reputation and the
collective expedient knowledge of the staff.
Human capital - The Bank has an
employee base with skills, capabilities,
knowledge and experience to deliver value to
the customers.
Social and relationship capital - This
captures corporate relationships with the
stakeholders and the Bank’s image as a
concerned corporate citizen.
Natural capital - As a financial services
provider the Bank ensures deploying
the operations in a way that promotes
preservation of natural capital.
Assurance
Assurance on the Financial Statements
and the Directors’ Statement on Internal
Control is provided by the Auditor General’s
Department who was assisted by a firm of
Chartered Accountants in public practice.
The Bank has voluntarily obtained
independent external assurance on the
sustainability aspect which includes social
and environmental performance indicators
from M/s BDO Partners.
Forward Looking Statements
This report contains certain forward looking
statements that relate to plans, objectives,
goals, strategies, future operations and
performance of the Bank and its subsidiaries.
Forward looking statements can be generally
identified as those containing words such
as “anticipates”, “assumes”, “believes”,
“estimates”, “expects”, “should”, “will”,
“will likely result”, “forecast”, “outlook”,
“projects”, “may” or similar expressions. By
their nature, forward looking statements
involve risk and uncertainty because they
relate to future events and circumstances
and there are many factors that could cause
actual results and developments to differ
materially from those expressed or implied
by these forward looking statements.
Therefore there is no representation or
warranty, that such forward looking
statements will be achieved. BoC undertakes
no obligation to update the historical
information or forward looking statements in
this report.

9
Truly Everybody’s Bank
Infrastructure Growth
Local
branches
Foreign
branches
Other service
points
ATMs SME centers School
savings units
Added during the year 5 1 1 17 1 283
At the year end 570 3 47 540 15 4,120
Following the significant investment in
branch infrastructure last year with the
conversion of 227 other service points
to fully fledged branches in addition to
opening 16 new branches, this year, we
focused on consolidation and improving
branch profitability. Accordingly, only two
new branches were opened during the
year including one overseas in Seychelles.
Four other service points were upgraded
to branches.
Seychelles is the first branch of Bank
of Ceylon in the African Continent and
offers a wide range of financial solutions
including corporate, retail, offshore
and internet banking. This branch was
opened as a step forward in fulfilling
BoC’s strategic aspiration of becoming
Sri Lanka’s international bank, to reach
potential overseas markets. Now the
Bank operates three branches in Chennai,
Male, Seychelles and a subsidiary in
London.
Branches were closely scrutinized for
performance. Initiatives were launched
to improve service efficiency, thereby
reducing costs whilst offering a positive
customer experience. One of the key
areas of focus was to encourage usage
of ATMs by eliminating the withdrawal
fee. As a founding partnership of the
common ATM switch, which connects
the ATM networks of BoC with those of
participating banks, BoC customers enjoy
access to the largest ATM network in
the industry with over 2,500 ATM touch
points, yet some prefer to use the branch
counters for basic cash transactions. Apart
from engaging in front end initiatives
to assist customers in the use of ATMs,
back office support was provided to
sustain the strategy, for example ATM
downtime was minimized by streamlining
a SMS facility to alert ATM breakdowns,
whilst identified IT product leaders were
specially trained in ATM technology.
Further, an incentive scheme for cash
loading officers was introduced to
minimize ATM stockout. Whilst 17 new
ATMs were installed, 70 outdated ATM
machines were replaced, increasing
efficiency of the delivery channel.
Investments in SME centres and
school saving units are part of the
Bank’s sustained financial literacy
programme. Our SME centres encourage
entrepreneurial growth by offering
access to technical expertise and financial
knowledge to be commercially viable.
The school saving unit programme was
initiated to inculcate the savings habit
from a young age. Student managers
take leadership in operating the mini-
banks and in actively encouraging
fellow students to cultivate the savings
habit. The students are trained by the
Bank to carry out their duties. 27,736
new accounts were opened in 2014,
cumulating to 653,823.
One of the key areas of focus was to encourage usage of ATMs by eliminating the withdrawal fee.

10
BANK OF CEYLON . Annual Report 2014
Ofering the biggest network of branches and service accessibility, the Bank of Ceylon reaches out to Sri Lankans – everywhere
Reaching out
To everybody
Customer Touch PointsCustomers
OverOver
1,10011 million
As Bankers to the Nation, Bank of Ceylon
reaches out to every Sri Lankan through
its network of 573 branches - all of which
offer online access as well. The Bank also
operates 536 ATM service points in small
towns and major cities across the island.
The Bank of Ceylon counts 12 subsidiaries
and five associate companies in the Group.
The first overseas branch was in London,
UK. The Bank has now diversified its
operations in the United Kingdom by
upgrading its London branch to be a fully
fledged bank operating as a subsidiary of
BoC, as Bank of Ceylon UK Ltd.
BoC services are also available in the
Maldives, Chennai and Seychelles.
The Bank of Ceylon now owns the
biggest worldwide network with over
859 overseas correspondent banks and
exchange companies. We have also
expanded our services through our
exchange house representatives in Qatar,
the United Arab Emirates, Kuwait,
Bahrain, Oman, the Kingdom of Saudi
Arabia, Israel, Jordan, Italy, South Korea,
France and Japan, in order to serve the
thousands of Sri Lankan expatriates who
live and work overseas.
Global Destinations
Over
800

11
Truly Everybody’s Bank
TrincomaleeBranches - 15ATMs - 11OSP - 01
VavuniyaBranches - 08ATMs - 06OSP - 01
PolonnaruwaBranches - 14ATMs - 12
MullaitivuBranches - 07ATMs - 05OSP - 01
PuttalamBranches - 21ATMs - 15OSP - 01
Nuwara EliyaBranches - 19ATMs - 15OSP - 01
MoneragalaBranches - 15ATMs - 10OSP - 01
RatnapuraBranches - 24ATMs - 23OSP - 01
AmparaBranches - 22ATMs - 12OSP - 01
BatticaloaBranches - 20ATMs - 08OSP - 01
ColomboBranches - 76ATMs - 121OSPs - 20
JaffnaBranches - 36ATMs - 19OSP - 01
AnuradhapuraBranches - 32ATMs - 29OSPs - 02
BadullaBranches - 22ATMs - 17OSP - 01
HambantotaBranches - 17ATMs - 17OSP - 01
GalleBranches - 24ATMs - 21OSP - 01
GampahaBranches - 40ATMs - 54OSPs - 03
MataleBranches - 13ATMs - 12OSPs - 02
KegalleBranches - 20ATMs - 13OSP - 01
KandyBranches - 36ATMs - 26OSP - 01
MataraBranches - 21ATMs - 21OSP - 01
KurunegalaBranches - 34ATMs - 37OSP - 01
KilinochchiBranches - 06ATMs - 02OSP - 01
MannarBranches - 07ATMs - 03OSP - 01
KalutaraBranches - 21ATMs - 27OSP - 01
Province Branches ATMs Other
Service
Points
(OSPs)
Central Province 67 53 4
Eastern Province 55 29 3
North Central Province 47 42 2
Northern Province 63 34 5
North Western Province 56 52 2
Sabaragamuwa Province 46 40 2
Southern Province 63 59 3
Province Branches ATMs Other
Service
Points
(OSPs)
Uva Province 39 29 2
Western Province North 61 82 6
Western Province South 66 99 5
Corporate Branches 6 16 13
Premier Banking 1 1 -
Overseas Branches 3 4 -
Total 573 540 47
Service Network
Our website is available on multiple platforms from
mobile devices to laptops. For more details on service
network visit www.boc.lk
Kilinochchi
Mannar
Puttalam
Kurunegala
Kandy
Gampaha
Kalutara
Galle
Ratnapura
Matara
Hambantota
Moneragala
Nuwara Eliya
Badulla
Ampara
Matale
Batticaloa
Polonnaruwa
Anuradhapura
Trincomalee
Vavuniya
Mullaitivu
Jaffna
Colombo
Kegalle

12
BANK OF CEYLON . Annual Report 2014
The Bank of Ceylon ofers the widest range of products and services to suit all Sri Lankans. From infants to senior citizens, we have something for everyone…
From grassroots
to giants
After 75 years of success, Bank of Ceylon is firmly established as Sri Lanka’s premier financial services
organization. Today the Bank’s portfolio of products and services is diverse and comprehensive, to facilitate
commercial banking, personal banking, development financing, mortgage financing, lease financing,
investment banking, Islamic banking, bancassurance, corporate financing, primary dealing, pawning, credit card
facilities, off shore banking, foreign currency operations, internet banking and other financial services.
The Bank of Ceylon now leads in the local banking industry as the biggest in terms of profit, assets, deposits,
advances and foreign currency remittances.

13
Truly Everybody’s Bank
Personal Banking
Demand Deposits
• CurrentAccounts
• PrestigePlusCurrentAccounts
Time Deposits
• NormalFixedDeposits
• SavingsCertiicates
• 7DaysCallDeposits
• SeniorCitizensFixedDeposits
Lending Products
• TermLoans
• PersonalLoans
• SMELoans
• Overdraftfacilities
• LeaseFinancing
• SpecialLoansSchemes
Other Products and Services
• InternetBanking
• MobileBanking(BOCPaymate)
• Bancassurance
• Credit/Debitcardfacilities
Savings Deposits
• NormalSavings
• RanKekuluGinum
• 14+Teenagers’SavingsAccount
• 18+SavingsAccount
• KanthaRanGinum
• BOCPranama
• SeniorCitizensSavingsAccount
• RanGoviThenpathu
• RanaviruRanGinum
• SamurdhiSavings
• DheevaraThenpathu
• 3GSavings
Investment/Retirement Schemes
• BOCRanUlpataInvestmentScheme
• BOCAbhimanaRetirementScheme

14
BANK OF CEYLON . Annual Report 2014
International, Treasury and Investment
Foreign Currency Accounts
• NRFCAccounts(Current/Savings/
Fixed)
• RFC(Savings/Fixed)
• DualCitizenshipForeignCurrency
Fixed Deposits (DCFD)
• ResidentNonNationalForeign
Currency Accounts (RNNFC)
(Savings/ Current/ Fixed)
• RanKekuluNRFC/RFC
• ResidentGuestForeignCurrency
(RGFCA)
• ForeignExchangeEarnersAccount
(FEEA)
• InwardRemittancesDistribution
Accounts (IRDA)
• SpecialForeignInvestmentDeposit
Account (SFIDA)
(Savings /Fixed)
• DiplomaticForeignCurrency
Account (DFA)
• NonResidentRupeeAccount
(NRRA)
(Savings/ Current/ Fixed)
Foreign Currency Accounts
• SeniorFIDA
• NonResidentNonNationalForeign
Currency Account (NRNNFCA)
(Savings)
• OutwardInvestmentAccount(OIA)
• ForeignCurrencyAccountforan
Agent of Foreign Shipping Line/
Airline (FCAASA)
(Savings/ Current)
• SeniorForeignNationalSpecial
Account
• ForeignCurrencyAccountsfor
International Service Providers and
their Employees (FCAISPE)
(Savings/ Current/ Fixed)
• SecuritiesInvestmentAccount(SIA)
• DiplomaticRupeeAccount(DRA)
• NonResidentBlockedAccounts
(NRBA) and Migrant Blocked
Accounts (MBA)
Treasury Products and Services
• TreasuryBillsandBonds
• ForeignExchangeSwaps
• ForeignExchangeOptions
• ForwardContracts
• REPO
• ReverseREPO
• Debentures
• International/LocalBonds
• MoneyMarketOperations
• ForeignExchangeRates
• SriLankaDevelopmentBonds
• BondSwaps
• CurrencyOptions
Other Products and Services
• BOCSmartRemit
• SWIFT
• WebBasedFundTransferSystem
• SLIPS
• RTGSFundTransfer
• TrusteeandCustodialServices
• DebtandEquityFinancing
• CorporateAdvisoryServices
From Grassroots to Giants

15
Truly Everybody’s Bank
Corporate Banking
Development Banking
Corporate Facilities
• TermLoans
• Overdrafts
• International/LocalBankGuarantees
• ProjectFinancing/LoanSyndication
• OnlineEPF/ETFPayments
Development Lending
• SMELoans
• AgricultureandDairy
• Fishery
• MicroFinancing,MicroSmalland
Medium Enterprises
• Self-employment
• SpecialCreditSchemeforPublicand
Personal Transport
• EducationalLoans
• SpecialLoanSchemesfor
Pensioners, Members of Associations
and forces.
• BOChousingLoanScheme
• BOCPersonalLoanScheme
• BOCEducationalLoanScheme
• BOCComputerLoanScheme
• BOCDiviMaga
(An amalgamated self-employment
credit scheme)
Islamic Banking Products
Deposits Products
• BOCAn-NoorCurrentAccount
• BOCAn-NoorSavingsAccount
(Mudaraba)
• BOCAn-NoorChildrenSavings
Account (Athfal)
• NRFCAthfalSavingsAccount
• An-NoorNRFCSavingsAccount
(Murabaha)
Lending Products
• TermLoans(Murabaha)
• An-NoorWakala
• LocalMurabaha
• LettersofGuarantee(Local)
• An-NoorTradeFinance
• An-NoorLeasing(Ijarah)
• Ijarah(Leasing)USDbased
Trade Finance Products
• LettersofCredit(Onlinefacility
available)
• ShippingGuarantees
• BillsAcceptance
• CollectionBills
• PledgeLoans
• HypothecationLoans
• TrustReceipts
• SeriesofLoans
• NegotiationBills
• BillsDiscounting
• PurchaseandCollectionofExportBills
• StatusReport
• DutyRebates

16
BANK OF CEYLON . Annual Report 2014
Our journey is a long and fascinating one… beginning in 1939 with an asset base of LKR 7.8 million... and our irst branch in Kandy by 1941...
From then
to now…
The Bank of Ceylon was founded in 1939, with Sir Ernest
de Silva as its first Chairman. At the time, Ceylon was a
British colony and the then governor Sir Andrew Caldecott
ceremoniously opened the bank on 1 August 1939. Two
years later, in 1941, BoC started to expand beyond the city of
Colombo.
On 15 August 1941 the Bank of Ceylon opened its first branch
office at 22A, Ward Street, Kandy.
Subsequently the Bank began expanding its presence with
branches in major cities such as Galle, Jaffna, Kurunegala,
Batticaloa, Trincomalee, Badulla, and Panadura. Today, it has
widened the reach with 570 domestic branches and three
overseas branches.
September 1939 saw Bank of Ceylon record an excellent
balance sheet shortly after inception. In the years that
followed, the Bank continued to grow and today it stands
over LKR 1 trillion.
1941
1939
First branch of the Bank opens in Kandy
BoC issues its first Financial Statement
17
Truly Everybody’s Bank
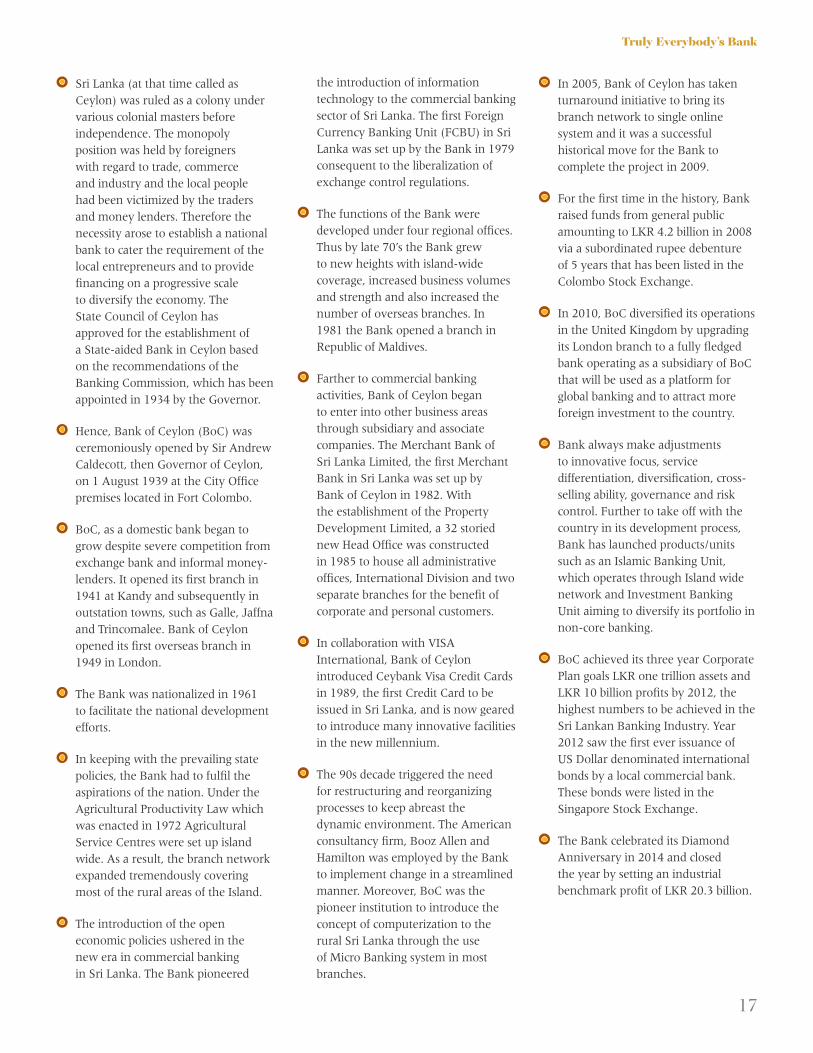
Sri Lanka (at that time called as
Ceylon) was ruled as a colony under
various colonial masters before
independence. The monopoly
position was held by foreigners
with regard to trade, commerce
and industry and the local people
had been victimized by the traders
and money lenders. Therefore the
necessity arose to establish a national
bank to cater the requirement of the
local entrepreneurs and to provide
financing on a progressive scale
to diversify the economy. The
State Council of Ceylon has
approved for the establishment of
a State-aided Bank in Ceylon based
on the recommendations of the
Banking Commission, which has been
appointed in 1934 by the Governor.
Hence,BankofCeylon(BoC)was
ceremoniously opened by Sir Andrew
Caldecott, then Governor of Ceylon,
on 1 August 1939 at the City Office
premises located in Fort Colombo.
BoC, as a domestic bank began to
grow despite severe competition from
exchange bank and informal money-
lenders. It opened its first branch in
1941 at Kandy and subsequently in
outstation towns, such as Galle, Jaffna
and Trincomalee. Bank of Ceylon
opened its first overseas branch in
1949 in London.
The Bank was nationalized in 1961
to facilitate the national development
efforts.
In keeping with the prevailing state
policies, the Bank had to fulfil the
aspirations of the nation. Under the
Agricultural Productivity Law which
was enacted in 1972 Agricultural
Service Centres were set up island
wide. As a result, the branch network
expanded tremendously covering
most of the rural areas of the Island.
The introduction of the open
economic policies ushered in the
new era in commercial banking
in Sri Lanka. The Bank pioneered
the introduction of information
technology to the commercial banking
sector of Sri Lanka. The first Foreign
Currency Banking Unit (FCBU) in Sri
Lanka was set up by the Bank in 1979
consequent to the liberalization of
exchange control regulations.
The functions of the Bank were
developed under four regional offices.
Thus by late 70’s the Bank grew
to new heights with island-wide
coverage, increased business volumes
and strength and also increased the
number of overseas branches. In
1981 the Bank opened a branch in
Republic of Maldives.
Farther to commercial banking
activities, Bank of Ceylon began
to enter into other business areas
through subsidiary and associate
companies. The Merchant Bank of
Sri Lanka Limited, the first Merchant
Bank in Sri Lanka was set up by
Bank of Ceylon in 1982. With
the establishment of the Property
Development Limited, a 32 storied
newHeadOficewasconstructed
in 1985 to house all administrative
offices, International Division and two
separate branches for the benefit of
corporate and personal customers.
In collaboration with VISA
International, Bank of Ceylon
introduced Ceybank Visa Credit Cards
in 1989, the first Credit Card to be
issued in Sri Lanka, and is now geared
to introduce many innovative facilities
in the new millennium.
The 90s decade triggered the need
for restructuring and reorganizing
processes to keep abreast the
dynamic environment. The American
consultancy firm, Booz Allen and
HamiltonwasemployedbytheBank
to implement change in a streamlined
manner. Moreover, BoC was the
pioneer institution to introduce the
concept of computerization to the
rural Sri Lanka through the use
of Micro Banking system in most
branches.
In 2005, Bank of Ceylon has taken
turnaround initiative to bring its
branch network to single online
system and it was a successful
historical move for the Bank to
complete the project in 2009.
For the first time in the history, Bank
raised funds from general public
amounting to LKR 4.2 billion in 2008
via a subordinated rupee debenture
of 5 years that has been listed in the
Colombo Stock Exchange.
In 2010, BoC diversified its operations
in the United Kingdom by upgrading
its London branch to a fully fledged
bank operating as a subsidiary of BoC
that will be used as a platform for
global banking and to attract more
foreign investment to the country.
Bank always make adjustments
to innovative focus, service
differentiation, diversification, cross-
selling ability, governance and risk
control. Further to take off with the
country in its development process,
Bank has launched products/units
such as an Islamic Banking Unit,
which operates through Island wide
network and Investment Banking
Unit aiming to diversify its portfolio in
non-core banking.
BoC achieved its three year Corporate
Plan goals LKR one trillion assets and
LKR 10 billion profits by 2012, the
highest numbers to be achieved in the
Sri Lankan Banking Industry. Year
2012 saw the first ever issuance of
US Dollar denominated international
bonds by a local commercial bank.
These bonds were listed in the
Singapore Stock Exchange.
The Bank celebrated its Diamond
Anniversary in 2014 and closed
the year by setting an industrial
benchmark profit of LKR 20.3 billion.
18
BANK OF CEYLON . Annual Report 2014
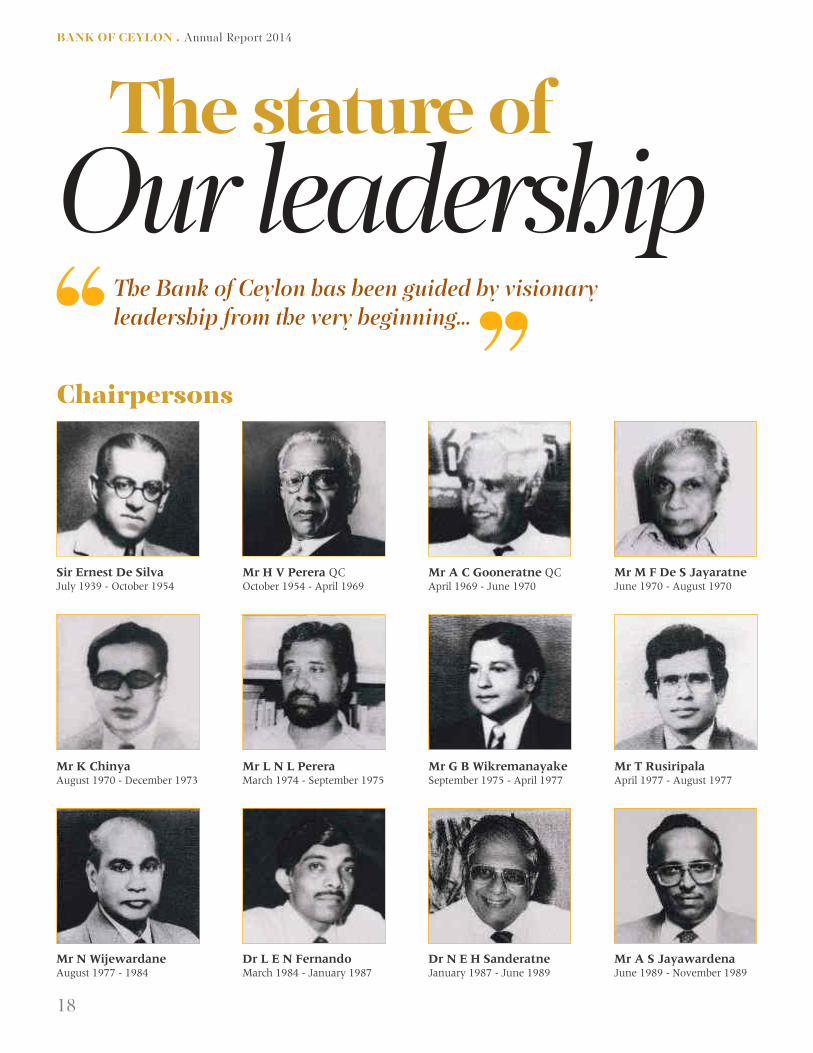
The Bank of Ceylon has been guided by visionary leadership from the very beginning…
The stature of
Our leadership
Chairpersons
Sir Ernest De SilvaJuly 1939 - October 1954
Mr K ChinyaAugust 1970 - December 1973
Mr N WijewardaneAugust 1977 - 1984
Mr H V Perera QCOctober 1954 - April 1969
Mr L N L PereraMarch 1974 - September 1975
Dr L E N FernandoMarch 1984 - January 1987
Mr A C Gooneratne QCApril 1969 - June 1970
Mr G B WikremanayakeSeptember 1975 - April 1977
Dr N E H SanderatneJanuary 1987 - June 1989
Mr M F De S JayaratneJune 1970 - August 1970
Mr T RusiripalaApril 1977 - August 1977
Mr A S JayawardenaJune 1989 - November 1989

19
Truly Everybody’s Bank
Mr Jehan K CassimNovember 1989 - August 1994
Mrs Sumi MoonesingheDecember 2002 - December 2003
Dr Gamini WickramasingheMay 2007 - January 2013
Mr R N AsirwathamAugust 1994 - August 1997
Mr Chrisantha PereraFebruary 2004 - April 2004
Mr Razik Zarook PCJanuary 2013 - December 2013
Mrs Dayani De SilvaSeptember 1997 - November 2000
Mr Manik NagahawatteMay 2004 - December 2005
Air Chief Marshal Harsha AbeywickremaMarch 2014 - January 2015
Deshamanya Ken BalendraDecember 2000 - November 2002
Mr Udayasri KariyawasamDecember 2005 - May 2007

20
BANK OF CEYLON . Annual Report 2014
The Stature of Our Leadership
General Managers
Mr W B MackayJuly 1939 - 1942
Mr S M Sirimanne1969 - July 1974
Mr C J E AnthoniszDecember 1977 - March 1981
Mr J H Mortlock1942 - July 1949
Mr M MoheedJuly 1974 - March 1976
Mr L PiyadasaMarch 1981 - June 1986
Mr A T Hunter1949 - June 1952
Mr E C G WickremasingheMarch 1976 - January 1977
Mr R N B TalwatteJune 1986 - November 1988
Mr C LoganathanJanuary 1953 - 1969
Mr A S JayawardenaFebruary 1977 - November 1977
Mrs R L NanayakkaraNovember 1988 - April 1996

21
Truly Everybody’s Bank
Mrs M S JayasingheApril 1996 - July 2000
Mr A Sarath de SilvaAugust 2000 - August 2002
Mr S N P PalihenaSeptember 2002 - February 2007
Ms W A NalaniAugust 2011 - June 2012
Mr B A C FernandoFebruary 2007 - August 2011
Mr K DharmasiriJune 2012 - January 2013

22
BANK OF CEYLON . Annual Report 2014
Outgoing Chairman’s
Review
AIR CHIEF MARSHAL
HARSHA ABEYWICKREMA

23
Truly Everybody’s Bank
Consolidating Market Leadership
2014 was a challenging year for the
financial sector in Sri Lanka. Against this
backdrop Bank of Ceylon has delivered
a strong performance whilst also
consolidating its market leadership in key
areas of growth. The Bank delivered the
highest ever recorded profit before tax
of LKR 20.3 billion for our stakeholders
which is the largest profit recorded by
any individual entity in the country. We
are the leading provider of capital in the
country and also have the largest deposit
base, a testimony to our commitment to
balance key stakeholder needs beyond
traditional business models and the
reason why Bank of Ceylon remains the
leading brand in the country.
The Board’s main concerns are to ensure
that the Management is well prepared
for the future taking into account both
global and local developments and also
able to face the challenges that may arise
in achievement of agreed strategic goals.
Key trends shaping the banking sector
globally include the rapid advancement
of technology in financial services, the
changing expectations and preferences
of customers, regulatory changes,
compliance failures in the financial sector
and divergent global economic growth.
As a state owned enterprise, we also
align our strategy to the Government
strategy supporting the socio economic
development through provision of
financial infrastructure necessary to
stimulate or steer economic activity.
The Bank has focussed on addressing
these challenges in a holistic manner
and is undertaking transformation in
key business processes to drive change
throughout the organization. The Board
is confident that the changes undertaken
will improve customer experience,
compliance, the risk management
capability and the profitability of the
Bank. The Corporate Management team
headed by the General Manager are
experienced banking professionals who
understand the unique stakeholder focus
of the Bank and are committed to driving
the changes necessary for the Bank
to retain its leadership position in the
market.
Focus on Results
The Board together with the
Management, has focussed on balanced
results in a number of key areas.
This approach has resulted in a strong
financial and social performance as
detailed throughout this report, whilst we
observed areas for improvement in the
environmental performance. Group profit
before tax was LKR 21.4 billion, a growth
of 33% over the previous year driven
by strong growth in fee and commission
income, net gains from trading and net
gains from financial investments.
Total asset growth was 11% stemming
from the growth of treasury portfolios due
to weak credit growth observed during
2014, thus positioning the Bank for
strategic growth on reversal of the weak
investment environment observed during
the year. We continue to be a main
contributor to the Treasury of the Sri
Lankan Government having contributed
LKR 6,846 million as dividends in 2014.
The Bank’s soundness indicators reflect
a healthy position with improved capital
adequacy and liquid asset ratios reflecting
the growth of lower risk weighted asset
portfolios. The infusion of LKR 5 billion
share capital in December 2014 also
served to enhance our capital adequacy
ratios and a further improvement
is expected with the LKR 5 billion
The Bank delivered the highest recorded proit before tax of LKR 20.3 billion...
scheduled for 2015. The Bank’s Core
Capital Ratio of 9.5% compares well with
the country’s regulatory minimum of 5%.
We are also pleased to observe that Bank
of Ceylon’s credit rating by Fitch Ratings
Lanka Ltd is one of the highest among
local commercial banks in the country
atAA+.Further,internationalratings
are on par with the country ratings, the
maximum that is possible for a state
owned institution.
Responding to Change
The financial sector consolidation
proposals revealed in early 2014 was
a key development and resulted in a
number of mergers and acquisitions
of finance companies during the year.
Bank of Ceylon had commenced its
restructuring of the Group in 2013 to
consolidate Merchant Bank of Sri Lanka
and Finance PLC with its subsidiaries
MCSL Financial Services Limited and
MBSL Savings Bank to overcome the
capital adequacy shortfalls of MBSL
Savings Bank and facilitate a stronger
competitive position for all three entities.
The merger was completed in January
2015 with all three entities having a

24
BANK OF CEYLON . Annual Report 2014
Outgoing Chairman’s Review
combined reach of 50 branches and
consolidating its competitiveness as
a finance company. It is noteworthy
that the merger process was completed
without any employees being made
redundant due to the growth plans
formulated by the Group.
Changes in the operating environment
arising from monetary and fiscal policy
are more fully described throughout the
report in relation to the performance of
the Bank. The governance and reporting
structures set in place by the Board of
Directors enabled early identification of
trends and formulation of appropriate
response plans together with information
provided by the Corporate Management
of the Bank and joint deliberations,
discussion and concurrence with the
Board who are the final approving
authority.
have been successful as observed in the
leasing and housing loans which have
remarkable improvements in turnaround
times. The promise of the “Wenesa”
programme will be realized commencing
2015 as the transformation of people
and processes gains momentum with
the roll out across more geographic
regions. Successful implementation of
the core banking system is also a key
project that was completed facilitating
the streamlining of business processes
further and also ensuring better reporting
and analytics for enhanced performance
management.
Governance
Appointment of Directors is in accordance
with the Bank of Ceylon Ordinance
which specifies that six Directors will be
appointed by the Minister in charge of the
subject of Finance and Planning which
will include one ex-officio representative
from the Ministry. This number is below
the minimum number of directors
specified in the Banking Act Direction
No.11 of 2007 on Corporate Governance
for Licensed Commercial Banks which
states that the number should be
between 7 and 13. The Board has made
recommendations to amend the Bank of
Ceylon Ordinance in this regard to resolve
the conflict in the legal enactments
impacting the operations of the Bank.
Group proit before tax was LKR 21.4 billion, a growth of 33% over the previous year driven by strong growth in fee and commission income, net gains from trading and net gains from inancial investments
In discharge of its responsibility to
provide strategic guidance, the Board
initiated an undertaking to review the
Bank’s readiness for the future taking
into account the changing customer
preferences and the increasing digitization
of service delivery. The result was
the “Wenesa” programme which was
formulated to drive holistic change
in business processes throughout the
Bank with the objective of enhancing
the customer experience. The Board
of Directors reviewed the plans and
ensured that sufficient resources in terms
of human, financial and technological
capital have been allocated to facilitate
a successful outcome. The Boston
Consulting Group (BCG) was appointed
as consultants to the project to ensure
that we had expert opinion and counsel
on proposed solutions and prioritization
of activities. Process changes implemented
1939IncorporationBank of Ceylon incorporated as the
nation’s first indigenous bank under
the Bank of Ceylon Ordinance

25
Truly Everybody’s Bank
The governance structures set in place by
successive Boards have proved to be in
compliance with regulatory requirements
and function well. We have deepened
the succession planning that commenced
in 2013 and also focussed on capacity
building of these key employees to
enhance their competencies and skills to
add value to their prospective roles.
The Board composition has ensured a
balance of skills and experience within
the Board of Directors facilitating
active participation, contribution and
deliberation of matters set before the
Board. There is sufficient diversity with
regards to age and gender within the
Board to ensure different perspectives on
matters discussed.
The Board has reviewed the revised Code
of Best Practice on Corporate Governance
issued jointly by the Securities &
Exchange Commission and the Institute
of Chartered Accountants of Sri Lanka
in July 2013 and have agreed on the
changes necessary for compliance with
the same.
Acknowledgements
I wish to thank the members of the
Board who have contributed actively at
meetings and also served as members of
Board Subcommittees discharging specific
oversight functions. The Corporate
Management Team have provided us
with useful insights on matters impacting
their key lines of business which have
proved invaluable in determining strategy
for the Bank and I thank them on behalf
of the Board for their dedication and
commitment.
I extend my appreciation to the officials
of the Ministry of Finance and Planning
who have assisted us in aligning our
strategy to country strategy to achieve
a mutually beneficial outcome. I also
wish to acknowledge the co-operation
of the officials at the Central Bank of
Sri Lanka who have assisted to provide
clarification and clearances to facilitate
compliance with regulations. I also thank
the Auditor General and M/s Ernst &
Young, Chartered Accountants who
assists the Auditor General for auditing
the Financial Statements in an efficient
and timely manner. As the outgoing
Chairman, I extend my congratulations
to the incoming Chairman and Board of
Directors and wish them success in taking
this great institution into its next period
of growth.
The result was the “Wenesa” programme which was formulated to drive holistic change in business processes throughout the Bank with the objective of enhancing the customer experience.
1941First BranchFirst branch of the Bank
opened in Kandy
1940Introduction of cheques by a
commercial bank
Air Chief Marshal Harsha Abeywickrema
Chairman
15 January 2015
Colombo

26
BANK OF CEYLON . Annual Report 2014
New Chairman’s
Message
RONALD C PERERA PC

27
Truly Everybody’s Bank
It is indeed my pleasure to address the
stakeholders of Bank of Ceylon at the
outset of my taking over the reins of the
Board of Directors. This is a period of great
importance for the Bank where it has
been revisiting the 75 year old corporate
story with the view to deliver the best
possible results for all the stakeholders.
The Bank’s theme for the future, “Best
beyond 75”, encapsulates the futuristic
sights to be adopted; delivering Business
excellence, Exceeding customer
expectations, Speedy delivery and
Technology driven. I am looking forward
to embrace changes to achieve the set
goals as elaborated below.
Customer Centric Transformation
Bank of Ceylon has facilitated the
country’s economic activity for 75 years
and we are committed to enabling
individuals and businesses grow and
prosper whilst contributing to the
development of capital markets in the
country. This promise requires us to
challenge how we do business at all
levels and drive change in our key
business lines and processes to deliver
financial services to the most demanding
generation of customers, employees and
business partners who are now shaping
our stakeholder value propositions in
an unprecedented manner. We see the
potential to address inequalities across
markets using technology to provide
equal access to financial services and cross
border connectivity to facilitate trade.
Embracing these opportunities whilst
addressing the internal and external
challenges requires a holistic approach to
driving coordinated change throughout
the organization. The “Wenesa”
programme commenced in 2014 to drive
the organization wide transformation
process in our people, the business
process and technology which has
already delivered some positive results.
The Board is committed to orchestrating
these changes, consolidating the Bank’s
leadership position in the industry whilst
transforming to become a customer
centric bank.
An Employee Focus
Change has to begin with the employees
who are the main agents of change and
also its key beneficiaries. The talent
management programmes of the Bank
are being reviewed to focus on the key
areas where changes in competencies,
attitudes and skills are imperative to
entrench new ways of doing business.
There is a strong foundation to build on.
A deep understanding of our customers
and the business of banking has been
our competitive edge and the present
need is to provide impetus for growth to
cater to changing customer preferences.
A sales focus for frontline staff who are
well supported by highly specialised staff
at regional and head office level is a key
component of the holistic programme of
change. Identifying and addressing issues
related to achieving this transformation
is a priority as we are cognizant that this
is fundamental to achieving our goals.
A robust, change focussed employee
development programme coupled with
performance based incentives and
succession planning are key elements
tying the overall programme of
transformation within the Bank as success
depends on alignment of the Bank’s goals
with the career aspirations of this key
stakeholder group.
The talent management programmes of the Bank are being reviewed to focus on the key areas where changes in competencies, attitudes and skills are imperative to entrench new ways of doing business.

28
BANK OF CEYLON . Annual Report 2014
New Chairman’s Message
Technology
Technology is another pillar of the
holistic programme of change being
implemented as it presents exciting
opportunities for scalable growth and
taking modern banking to the rural
villages engaging them more fully as
participants in our country’s progress.
Considerable investments are in the
pipeline to facilitate an enhanced
customer experience for customers who
increasingly choose to interact with
the Bank using mobiles, tablets and
computers. The country’s 100% mobile
penetration rate, increasing proportion
of smart phones, the increasing volume
of internet transactions are testimony to
the need for this transformation and how
it will transform banking in the country
very quickly. Further, investments in
IT projects that serve to automate and
enhance operational efficiencies are also
being implemented to enhance employee
productivity and improve operational cost
to income ratios. Consequently, capacity
building within the IT department
is a strategic imperative reinforcing
the need for change to be employee
focussed. Projects to enhance the Bank’s
compliance and risk management
capability are also under implementation
in response to the prevailing environment
of heightened volatility due to escalation
of geopolitical risk and rapid regulatory
change.
Governance
The new Board appointed by the Minister
in charge of Finance in January 2015
comprises experienced professionals
from diverse fields with experience in
leading entities within the corporate
sector. Consequently, the transition has
been smooth both at Board level and
at Board Subcommittees which have
oversight responsibility for key areas. Key
Management Personnel are providing us
insights into the key business processes as
part of a comprehensive induction process
which facilitates the transition.
Recent developments in international
financial markets have highlighted
the need for good governance beyond
oversight of financial performance and
stewardship of financial assets. The
Board is committed to good governance
based on sustainability principles which
embrace concern for the people, the
planet and profits in the long term. The
belief that good governance must extend
beyond a compliance model ensures that
we continue to benchmark international
best practices to evaluate possible
solutions that can improve governance
within the Bank.
Acknowledgements
I take this opportunity to thank the
Minister and officials of the Ministry
of Finance for their support in our
endeavours. I count on the support of
the Auditor General and officials in his
department in providing assurance on
the Financial Statements. Officials of
the Central Bank of Sri Lanka engage
with the Bank on a regular basis and
we thank them for their diligence and
willing assistance with clarifications. I
also wish to thank the outgoing members
of the Board and the Chairman for their
stewardship and a smooth transition.
I look forward to working together with
the management team at Bank of Ceylon
to raise the bar on performance and set
new milestones in the future.
Ronald C Perera PC
Chairman
18 March 2015
Colombo

29
Truly Everybody’s Bank
Shaping the Future
The Bank of Ceylon has embarked on an
ambitious transformation journey named
“Wenesa” to enhance and sustain its
leadership position.
The objective of the transformation
program is to dramatically enhance
the Bank’s capabilities across eight core
dimensions.
The Bank has retained the Boston
Consulting Group (BCG), a leading
international management consulting
firm to provide expert advice and to guide
the Bank through this journey.
Through a transformed branch network
and setting up best-in-class digital
channels, the Bank is building capabilities
to offer its customers an unmatched
experience across the island. Additionally,
the Bank is taking measures to simplify
processes not only to enhance efficiency
but also to provide more responsive
customer service in all urban, semi-urban
and rural areas.
Change has to begin within and keeping
that philosophy in mind the Bank is
adopting measures to further invest in
its employees. A range of initiatives are
being undertaken to instill a performance
oriented culture in the Bank.
Investment in technology is at the core
of this transformation. The program aims
to significantly enhance the technological
capabilities of the Bank to meet the
future needs of both internal and external
stakeholders.
The Bank is as always committed
to nation building and through this
programme it is designing innovative
offerings to support entrepreneurs and
SMEs across the island. The programme
will empower and create value for
thousands of smaller businesses across the
nation.
While Bank of Ceylon is focused
on growth it is cognizant of the
importance of risk management and
good governance. The program is
undertaking specific measures to improve
overall asset quality and reduce Bank
wide risk. Strengthening recovery and
risk management structures is a key
component of this transformation.
The Board of Directors is committed
to supporting the management of the
Bank as they execute this large scale
transformation. Together everyone will
strive to build lasting capabilities to ensure
that Bank of Ceylon maintains its market
leadership and continues to reach greater
heights.
Vision 2020
Enhancing Bank’s capabilities
focussing on enhancing profitability
Retail Advances
(Housing,Pawning,
Leasing, Credit Cards)
Branch
Transformation
Digital Channels
ITHRandOrganization
SME
Recovery and Risk
Management
Corporate1
6
2 4
3
7
5
8
Eight Core Dimensions that “Wenesa” Transformation Targets Across the Bank
The transformation programme “Wenesa” seeks to bring about a step change in customer experience and operational eiciency and it has already begun to yield beneits to the Bank
Towards a new look

30
BANK OF CEYLON . Annual Report 2014
General Manager’s
Review
D M GUNASEKARA

31
Truly Everybody’s Bank
Bank of Ceylon celebrates 75 years of
existence as the first indigenous bank
in the country and it is a fitting time
to review our relevance to the country
and its citizens. From its inception prior
to independence, the Bank has been a
catalyst for socio economic progress in the
country by facilitating financial inclusion
and providing the financial infrastructure
necessary to stimulate economic activity
in bustling cities and remote villages.
Today, the Bank is relevant to the largest
corporates in the country as well as to
the individuals in newly settled villages,
in line with its vision of being Bankers to
the Nation, serving all customer segments
with a wide product portfolio that meets
all their investment, financing and
transactional needs from cradle to grave.
This has enabled us to become the leading
brand in the country in the sector with
more than 11 million customers whilst
maintaining our record of being the most
profitable bank in Sri Lanka. We are also
ranked amongst the World’s Top 1000
Banks ahead of all other Banks in the
country.
Strong Performance
The Bank recorded LKR 20.3 billion as
profit before tax which is a key milestone
in our history as the highest ever recorded
profit for the banking industry and a
testimony to our ability to perform in
a challenging operating environment
reflecting a growth of 29% over 2013.
This was achieved despite declining
interest rates, higher non performing
loans, paucity of credit growth leading
to high levels of liquidity and moderated
growth in trade volumes. Profit growth
was driven by strong growth in fee based
income of 42%, gains from trading and
investments and enhanced employee
productivity. The highest contributor to
operating income continued to be Net
Interest Income (NII) accounting for
68% whilst fee based income accounted
for 16% and net gains from trading
amounted to a further 9%. NII growth
was a challenge amounting to LKR
38.5 billion, a mere 3.5% growth over
2013, reflecting the pressure on Net
Interest Margins (NIM) inevitable in a
declining interest regime. Net operating
income for the year was LKR 48.6 billion
which reflected a growth of 15% due to
increased operating income. Streamlining
processes and implementation of 5S
programme to enhance the customer
experience coupled with enhanced
employee productivity curtailed growth of
operating expenses. The resulting Return
on Average Equity (ROAE) was 20.5%
for 2014, well above the industry average
of 16.5%.
Total assets grew by 11% to LKR 1.3
trillion, consolidating our position as the
largest bank in Sri Lanka. Disappointing
credit growth due to weak investment
impacted the entire industry presenting
challenges in asset and liability
management and managing high liquidity
levels whilst balancing short term and
long term earnings. Consequently,
Today, the Bank is relevant to the largest corporates in the country as well as to the individuals in newly settled villages, in line with its vision of being Bankers to the Nation
treasury portfolios (comprising derivative
financial instruments, reverse repurchase
agreements, financial assets held for
trading, financial investments held to
maturity, available for sale and loans &
receivable) increased significantly by
31% to LKR 439 billion accounting for
33% of total assets at the close of the
year. Monetary policy measures aimed
at stimulating credit growth through
decreased interest rates results towards
the latter half of the year resulting in a
modest 3% growth in loans and advances
as the Bank was also impacted by the
decreased borrowing of state owned
enterprises. Accordingly, gross loans
and advances increased from LKR 755
billion to LKR 778 billion driven largely
by growth of the retail banking portfolio.
Key initiatives driving retail growth
focussed on enhancing the customer
experience by reducing processing times
and providing tailored solutions.
Deposit growth was strong at 11% par
with the industry growth of 11.9% due to
growth in both foreign currency deposits
and local currency deposits. Further,
strengthening our market leadership in
this key area is supported by a network
of 570 branches in the country and a
presence in 115 countries through three

32
BANK OF CEYLON . Annual Report 2014
General Manager’s Review
branches, 100 exchange houses and
759 correspondent banks. Accordingly,
deposits increased from LKR 842.1 billion
in 2013 to LKR 934.0 billion in 2014,
and continues to be the main source
of funding for the Bank accounting for
70% of total liabilities and equity. Equity
increased by 30% during the year from
LKR 57.7 billion to LKR 74.8 billion
accounting for 6% of total liabilities and
equity. Equity growth was driven mainly
by an infusion of LKR 5 billion as share
capital and retained earnings growth of
43% to LKR 45 billion. The island wide
branch network, a growing presence
overseas, an enviable customer base and
a deep understanding of our customer
needs honed over 75 years places the
Bank in a strong competitive position for
growth.
The Bank’s core capital and capital
adequacy ratios which stand at 9.5% and
13.6%, are comfortably above regulatory
minimums. Additionally, our cost to
income ratio also improved from 49%
to 44% as we curtailed the growth of
expenses through a number of initiatives.
Our Operating Environment
The global economy struggled to gather
momentum with weaker than expected
growth of 3.3% maintaining the same
rate of growth as in 2013 as estimated
by the International Monetary Fund
in its January 2015 Update on the
World Economic Outlook. Advanced
economies continued to struggle with the
legacies of the global financial crisis and
emerging economic growth moderated
in comparison to growth rates that
prevailed in 2013. USA, Sri Lanka’s top
export destination, performed better
than expected with growth estimated
at 2.4% supported by improvement in
labour markets. Sri Lanka’s second largest
export destination UK also evinced signs
of recovery with growth increasing to
2.6% in 2014 in line with forecasts.
Performance of other key markets such
as India, Germany and Italy were below
expectations, mainly due to investment
factors and moderation in external
demand. Another key development that
shaped 2014 was the appreciation of the
US dollar by 6% during the year whilst
most other currencies depreciated during
the year reflecting the divergent growth
amongst major economies. The sharp
decline in oil prices which continued from
September, stemming from weak demand
from major economies, is expected
to stimulate growth in oil importing
countries. Interest rates and risk spreads
were trending upward in emerging
economies which remained vulnerable
to reversals of capital flows adding to the
uncertainty on growth.
Sri Lanka’s GDP growth rate was 7.4%
strongly supported by the growth
of the services and industrial sectors
and comparing well with countries
in South Asia. Fiscal and monetary
policy was directed at stimulating
private sector investment and included
initiatives to maintain a low interest
and inflation regime whilst simplifying
the tax regime and reducing income tax
rates to regionally competitive levels.
Measures were also taken to improve the
performance of state owned enterprises
to reduce Government expenditure. The
country experienced a period of low
inflation and low interest rates as a result
of the policy measures implemented
which supported a relatively stable
currency which depreciated only 0.26%
against a strengthening US Dollar. Growth
of the trade deficit was curtailed to
10.5% of GDP due to increased exports
driven by strengthening demand in
major export markets. Exports grew by
10% driven by textiles and garments,
coconut and tea. Imports growth was
a more moderate 7.8% driven by
petroleum products, motor vehicles and
consumer goods. Increased earnings from
tourism enhanced the potential of this
sector during the year as it won many
accolades from travel associations of high
repute. The Bank was well positioned to
capture a market share of the increased
remittances from migrant workers who
used the increasingly more convenient
1943Bank declared the
First dividend
1942Pettah BranchFirst branch in the Colombo city,
the Pettah Branch, opened to
support Commercial activities

33
Truly Everybody’s Bank
2014 has been an exciting year for the Bank as we focussed on our future catering to the Millennials entering the workforce as our customers and employees
formal channels for their remittances
as a result of continuous infrastructure
development in rural areas.
Growth of the banking sector was
impacted by lacklustre credit growth
of 14% as pawning portfolios were
rationalised due to the continued
volatility of gold prices. Profitability of the
sector as measured by ROAE improved
marginally from 16% to 16.5% supported
by growth in both net interest income and
non interest income, enhanced employee
productivity and improved cost efficiency
ratios across the sector. Asset quality as
measured by non performing loans to
total loans and advances improved from
5.6% to 4.2% moving in tandem with the
net non performing loans to total loans
and advances which improved from 3.8%
to 2.6%. Liquidity levels increased due
to weakness in credit demand as funds
were temporarily parked in treasury
portfolios. Capital adequacy ratio and
the core capital ratio for the sectors
declined marginally optimizing the use of
funds and remaining comfortably above
regulatory minimum levels.
Fit for the Future
2014 has been an exciting year for the
Bank as we focussed on our future
catering to the Millennials entering
the workforce as our customers and
employees. A tech savvy and demanding
generation expecting services at the
click of a mouse presents challenges
to many organizations and the Bank
determined to move early in this
regard to position ourselves to cater
to the changing customer preferences.
Accordingly, Boston Consulting Group
was engaged by the Board to assist the
Bank in facilitating the transformation
process which was the outcome of wide
stakeholder consultations, internal
deliberation, brainstorming and debate.
The transformation programme was
aptly titled “Wenesa”, the Sinhalese word
for change, as it was the only truism
and common factor in all the initiatives
implemented which was organization
wide, varied and impactful. A handpicked
team of employees representing the
key departments and with a varied
combination of skills was deployed on
a full time basis to drive the changes
identified and prioritized according to a
detailed implementation plan. We have
already witnessed the results of quick
wins implemented, such as the processing
of housing loans and leasing which
have served to enhance the customer
experience through reduced processing
times and meaningful documentation.
Lean initiatives, increased digitization of
processes and the 5S roll out at branch
level have supported the “Wenesa”
programme outcomes as well as with the
concepts permeating our culture at all
levels of the organization.
We have also taken steps to ensure that
our team is future ready, as they are the
owners of the transformed processes and
their commitment is key to successful
transformation. A comprehensive
communication programme was
undertaken to apprise all employees of
the rationale for change and how it will
impact their work. Training opportunities
were also provided to ensure that they
would be able to work productively
and efficiently in a highly digitised
environment and also to assist customers
1944 1945Deposit base exceeded
LKR 100 million
The Bank widened into the
periphery by opening branches in
Jaffna and Trincomalee

34
BANK OF CEYLON . Annual Report 2014
General Manager’s Review
with the transformation on to digital
platforms. Employee productivity has
improved as a result of these initiatives
enabling us to increase the number of
staff engaged in revenue generating
activities building more sales focussed
teams.
The Board and the Corporate
Management team served as steering
committees for the transformation
projects, monitoring its progress and
ensuring sufficient allocation of resources
for effective and timely completion of
the numerous activities that made up
the total project. Guidance of the Board
has been invaluable in driving the
projects and I appreciate their counsel
and guidance in driving these projects
to ensure that the Bank is fit to lead the
industry and shape how Sri Lankans bank
in the future.
Our ability to attract talent has also
supported our growth plans as we
recruited 236 employees from Generation
Y to ensure that there is understanding of
the generation within the Bank and the
access to different skills developed by this
generation in order to compete effectively.
Another key component of the fit for
the future initiative was the successful
implementation of the new core banking
system which enables digitization of more
processes, better reporting and analytics.
This project also contributed significantly
to enhance employee productivity,
although the full impact will be felt only
in 2015.
Way Forward
We expect the reduced oil prices to
stimulate economic growth in the
country, particularly in the industrial
sector. Recovery in key export markets
is also encouraging for growth in exports
strengthening trade volumes. Demand
for imported goods is also expected to
increase as disposable incomes in the
country increase further supporting
growth in trade volumes. Monetary policy
and fiscal policy direction will play a key
role in the performance of the sector
and will be closely monitored due to
heightened uncertainty in this regard. We
expect interest rates and inflation to move
upwards during the year in line with
other developing countries presenting
new challenges in asset and liability
management for the sector in order to
sustain earnings growth. Exchange rate
volatility may increase in comparison to
2014 in response to both external and
internal factors.
Bank of Ceylon will continue
implementation of its “Wenesa”
programme streamlining processes
and enhancing employee productivity
to improve the customer experience.
Increased digitization to enhance both
the customer experience as well as
support productivity will transform the
operations of the Bank, shaping the
way Sri Lankans bank throughout the
island. The new digital platforms will also
enable the launch of more transactional
products that will leverage on the
country’s 100% mobile penetration and
the growth in smart phones which now
accounts for approximately 20% of the
mobile phone market. As disposable
incomes are expected to increase
we see potential for growth in retail
banking with an increased volume of
transactions becoming digitised through
growth in cards and online transactions.
Corporate banking is also expected to
grow as investment factors strengthen
and reduced oil prices support country
competitiveness in exports.
1946Foreign DepartmentForeign Department opened in Colombo Fort to
facilitate transactions of foreign exchange business

35
Truly Everybody’s Bank
Bank of Ceylon is well positioned to
reap the benefits of a strong island wide
presence and its unparalleled overseas
networks in growing both retail and
corporate banking segments, gaining
market share and consolidating its
position as Bankers to the Nation.
A strong employee focus has served
us well over our 75 years and we will
continue to develop our employees to
equip them for career progression in a
rapidly evolving operating environment.
There is a greater degree of specialization
that will be required and our forecasted
growth presents exciting opportunities
for employees of talent, ability and
ambition. We strongly believe that our
unique culture, which is the commonality
within, is the key differentiator in a very
competitive market and ensuring that
we continue to maintain this edge is
good business. Additionally, a pension
fund was set up for employees of the
Bank who joined after 1 January 1996
providing a pension to those who retire
from the service of the Bank if they
have completed 10 years of service.
This is extended to all employees who
will join the Bank in the future as well,
significantly increasing our ability to
attract and retain employees.
As disposable incomes are expected to increase we see potential for growth in retail banking with an increased volume of transactions becoming digitised through growth in cards and online transactions.
We remain committed to our sustainable
financing business model which goes
beyond economic profit to embrace social
and environmental aspects in how we
measure our results, a philosophy that
has served us well over the years.
Acknowledgements
I take this opportunity to thank all
our customers for their cooperation
and support over the years and the
employees of the Bank for their
enthusiasm in embracing the changes
that are being implemented throughout
the organization. I also wish to thank
the Board for their wise counsel and
guidance in matters of governance and
strategic direction which has set strong
foundations for sustainable growth.
My sincere thanks go to the Secretary
to the Treasury, Central Bank Officials
and Auditor General who have engaged
with us on a proactive basis facilitating
compliance on regulatory matters. I also
thank the officials of the Ministry of
Finance and Planning who have assisted
us and paved the way for enhancing our
share capital by LKR 10 billion through
the 2014/15 Government budget.
D M Gunasekara
General Manager
18 March 2015
Colombo
1949 1953Beyond local boundariesFirst overseas branch opened in
London
First native General ManagerThe first Ceylonese General Manager
of the Bank was appointed

36
BANK OF CEYLON . Annual Report 2014
Board ofDirectors

37
Truly Everybody’s Bank
Left to right
Mr Lalith P Withana
Independent Non- Executive Director
Mr Chandrasiri de Silva
Non- Executive Director
Ms Nalini D Abeywardene
Non- Executive Director
Air Chief Marshal Harsha Abeywickrema
Chairman, Independent Non-Executive Director
Mr Raju Sivaraman
Independent Non-Executive Director
Ms K M A Nelumani Daulagala
Non-Executive Ex officio Director
Mr R M Ananda Ratnayake
Alternate to Non- Executive Ex officio Director
Ms Janaki Senanayake Siriwardane
Secretary to the Board/Secretary, Bank of Ceylon

38
BANK OF CEYLON . Annual Report 2014
Board of Directors
Air Chief Marshal (ACM) Harsha Abeywickrema
Chairman, Independent Non-Executive Director
ACM Abeywickrema was appointed as
the Chairman of the Board of Bank of
Ceylonon15March2014.Heisthe
former Commander of the
Sri Lanka Air Force.
HewastheChairmanoftheBoard
HumanResourcesandRemuneration
Committee.
During the year under review, he
was also the Chairman of Property
Development PLC and Koladeniya
Hydropower(Private)Limited,whichare
subsidiaries of the Bank.
HeisaDirectorofSunshineHoldings
PLC.
Hebroughtinhisapparentleadership
qualities, experience in the public sector,
management and administrative skills to
the Board.
HeholdsaMasterofArts(MA)Degree
in International Studies from the King’s
College, University of London, UK and a
Master of Science (MSc) in Management
from the General Sir John Kotelawala
DefenceUniversity,SirLanka.Heis
also a graduate of the Royal College of
Defence Studies, London, UK and the Air
Command and Staff College of the Air
University, USA.
ACM Abeywickrema resigned from the
Board with effect from 16 January 2015.
Ms K M A Nelumani Daulagala
Non-Executive Ex officio Director
Ms Daulagala was appointed to the
Board on 29 January 2014 representing
the Ministry charged with the subject of
Finance.
She was a member of the Board Audit
and Integrated Risk Management
Committees.
She served as a member on the Board
of Sri Lanka Insurance Corporation
Limited, Employees’ Trust Fund Board
and the Board of Trustees of State
Institutions Temporary Surplus Trust
Fund. Also served as the Director General,
Department of Public Enterprises,
Ministry of Finance and Planning.
She brought in her over 20 years of
experience at Central Bank of Sri Lanka
(CBSL) where she held senior positions of
Chief Accountant, Director of Department
of Financial Stability Studies. Presently
she is serving as Director, Supervision of
Non Bank Financial Institutions.
Ms Daulagala holds a Master of Business
Administration (MBA) Degree from
the University of Sri Jayawardenapura,
Colombo and a Master of Science
(MSc) Degree in Financial and Business
Economics from the University of
Essex, UK. She is a Fellow member of
the Chartered Institute of Management
Accountants (FCMA), UK.
Ms Daulagala ceased to be a Board
member with effect from 6 February
2015.
Mr Raju Sivaraman
Independent Non-Executive Director
Mr Sivaraman was first appointed to the
Board in 9 January 2006 and re-appointed
in June 2007, May 2010 and May 2013.
HealsofunctionedasActingChairman,
Bank of Ceylon during the period 30
December 2013 to 14 March 2014.
HeservedastheChairmanoftheBoard
Nomination and Corporate Governance
Committee and as a member of the Board
Audit, Integrated Risk Management and
HumanResourcesandRemuneration
Committees.
Mr Sivaraman served as the Chairman of
Property Development PLC, Koladeniya
Hydropower(Private)Limitedand
MBSLInsuranceCompanyLimited.He
was a member of the National Police
Commission.HealsoservedasaDirector
on many Boards including Merchant
Bank of Sri Lanka PLC (now Merchant
Bank of Sri Lanka & Finance PLC),
MCSL Financial Services Limited (now
merged with Merchant Bank of Sri Lanka
& Finance PLC), Mireka Capital Land
(Private)Limited,MirekaHomes(Private)
Limited, Road Development Authority,
Design Centre, Milco (Private) Limited
and Ceylease Limited (now merged with
Merchant Bank of Sri Lanka & Finance
PLC).HewasalsoaCouncilmemberand
the Treasurer of the Sri Lanka Institute of
Architects.
HeistheManagingDirectorofArch-Triad
Consultants (Private) Limited and Ram
Developers (Private) Limited and also the
sole proprietor of M/s Triad Consultants,
Chartered Architects and Engineers.
Hecountsover30yearsofexperiencein
management and architecture. During his
tenure of 9 years of services on the Board,
he brought a wealth of experience gained
in public and private sectors across diverse
fields.

39
Truly Everybody’s Bank
HeisaCharteredArchitect,Fellow
member of the Institute of Architects of
Sri Lanka and holds a Master’s Degree
in Architecture from the University of
Moratuwa.
HeresignedfromtheBoardon8January
2015 on completion of 9 years of service
on the Board.
Ms Nalini D Abeywardene
Non-Executive Director
Ms Abeywardene was first appointed to
the Board in May 2010 and re-appointed
in May 2013.
SheservedontheBoardHuman
Resources and Remuneration Committee.
ShewasaCommissioneroftheHuman
Rights Commission of Sri Lanka during
the period 2006 to 2009. She served as
a Director on the Boards of BOC Travels
(Private)LimitedandHotelsColombo
(1963) Limited which are subsidiaries of
the Bank.
She is a member of the Board of
ManagementoftheGalleHeritage
Foundation of the Ministry of National
Heritage.
She brought to the Board her extensive
experience in the field of commercial law
and more than 25 years of management
experience in the private sector tea
industry.
Ms Abeywardene is an Attorney-at-Law.
She resigned with effect from 16 January
2015.
Mr Chandrasiri de Silva
Non-Executive Director
Mr Chandrasiri de Silva was first
appointed to the Board in May 2010 and
re-appointed in May 2013.
HeservedontheBoardHuman
Resources and Remuneration Committee
and Nomination and Corporate
Governance Committee during the year
under review.
HehasservedastheChairmanofPeople’s
Travels Limited and Director of People’s
Bank, People’s Merchant Bank PLC and
People’s Insurance Company Limited.
During his tenure as a Director of the
Bank, he was the Chairman of BOC
Travels (Private) Limited and a Director
ofHotelsColombo(1963)Limited,which
are subsidiaries of the Bank.
HebroughttotheBoardhisspecialized
experience and knowledge in the fields of
law, business and insurance.
HeisanAttorney-at-Lawandholdsa
Master’s Degree in International Trade
Law from the University of Wales, UK.
HeresignedfromtheBoardwitheffect
from 16 January 2015.
Mr Lalith P Withana
Independent Non-Executive Director
Mr Withana was appointed to the Board
on19June2013.Hehasservedasa
Director on the Board during the period
26 May 2004 to 06 December 2005 as
well.
HewastheChairmanoftheBoard
Audit and Integrated Risk Management
Committees and a member of the
Nomination and Corporate Governance
Committee.
HehasservedasaDirectorontheBoards
of Dankotuwa Porcelain PLC, Merchant
Bank of Sri Lanka PLC (now Merchant
Bank of Sri Lanka & Finance PLC),
Ceylease Limited (now merged with
Merchant Bank of Sri Lanka & Finance
PLC) and Seylan Bank PLC and was a
Commissioner of the Telecommunication
Regulatory Commission.
HeistheChiefOperatingOficerof
Dilmah Group.
Mr Withana brought to the Board his
experience over 20 years in management
positions in the corporate sector, out
of which more than 12 years at senior
management levels in diversified fields
such as banking, trade, procurement and
IT.Hehasservedinorganizationssuch
as Brandix Group, M/s Ernst & Young,
Chartered Accountants, Amro Bank, IBM
World Trade Corporation, Carsons and
Cumberbatch PLC, Yamaha (USA), Orit
Apparels Lanka (Private) Limited and Orit
Trading Lanka (Private) Limited.
HeholdsaMasterofBusiness
Administration (MBA) Degree from the
University of Sri Jayawardenepura and a
BachelorofArts(BA)Hons.Degreefrom
theUniversityofManchester,UK.Heisa
Fellow member of the Chartered Institute
of Management Accountants (FCMA),
UK, a Fellow of the Institute of Chartered
Accountants of Sri Lanka (FCA) and a
Project Management Professional (PMP).
Mr Withana resigned from the Board
with effect from 16 January 2015.
Mr R M Ananda Ratnayake
Alternate Director to Non-Executive Ex officio
Director
Mr Ratnayake was the Alternate to Ex
officio Directors on the Board from 30
January 2013.
HeisamemberontheBoardsofWest
Coast Power (Private) Limited and De
La Rue Lanka Currency & Security Print
(Private) Limited.
HeispresentlytheAdditionalDirector
General of the Department of Treasury
Operations of the Ministry of Finance.
Mr Ratnayake has experience in the
public sector for over 21 years in several
senior capacities.
Mr Ratnayake holds a Master’s Degree
in Public Management from the National
University of Singapore, Post Graduate
Diploma in Managerial Control and
Management Information Systems
from Maastricht School of Management
(MSM) of The Netherlands, Post Graduate
Diploma in Business and Financial
Administration from the Institute of
Chartered Accountants of Sri Lanka and
Bachelor of Commerce (B.Com.- Special)
Hons.DegreefromtheUniversityof
Kelaniya,SriLanka.HeisaFellow
member of the Association of Public
Finance Accountants of Sri Lanka and a
member of the Academy of Accounting
Technicians of Sri Lanka.
HeceasedtobeAlternateDirectorwith
effect from 6 February 2015.

40
BANK OF CEYLON . Annual Report 2014
Board ofDirectors
Mr Ronald C Perera PC
Chairman
Independent Non-Executive Director
Ms Pushpa Wellappili
Non-Executive Ex officio Director
Mr Ranel T Wijesinha
Independent Non-Executive Director
New
Mr Brian J Sinniah
Independent Non-Executive Director
Mr Aruna Priyadarsha
Kurumbalapitiya
Alternate Director to Non-Executive
Ex officio Director

41
Truly Everybody’s Bank
Mr Ronald C Perera
President’s Counsel
Chairman, Independent Non-Executive Director
Mr Perera, PC, has been appointed as the
Chairman, Bank of Ceylon with effect from 28
January 2015.
HeistheChairmanoftheBoardHuman
Resources and Remuneration Committee and
a member on the Nomination and Corporate
Governance Committee and Intergrated Risk
Management Commette.
Heisanexperiencedlawyerwithawide
practice in the original courts as well as in
the Court of Appeal and Supreme Court of
Sri Lanka especially in the areas of civil and
criminal litigation, negotiation and drafting
of commercial and transport contracts and
agreements. Mr Perera has specialized in
Commercial Law, Banking Law, Industrial
Law, Injunctions, Defamation, Election
Petitions, Civil Appeals, Revision Applications,
Writ Applications, and Fundamental Rights
Cases. Additionally, he has appeared in several
Commercial Arbitrations.
Mr Perera is a Director of Mireka Capital Land
(Private)LimitedandMirekaHomes(Private)
Limited.
HeholdsaBachelorofLaws(LLB)degree
from the University of Colombo and also
holds a LLM in International Trade Law from
Northumbria University, UK.
Ms Pushpa Wellappili
Non-Executive Ex officio Director
Ms Wellappili was appointed as the Ex
officio Director representing the Ministry of
Finance on the Board of Bank of Ceylon on
12 February 2015. She is a member of all
Board subcommittees viz. Audit Committee,
Integrated Risk Management Committee,
HumanResourcesandRemuneration
Committee and Nomination and Corporate
Governance Committee.
She is an Officer of the Sri Lanka
Administrative Service and counts over 30
years of experience in management in the
public sector. Ms Wellappili has served as
a Director on the Boards of Management
of Sri Lanka Telecom, Sri Lanka Tea Board,
Post Graduate Institute of Science, National
Police Academy, Institute of Policy Studies
and Sri Lanka Institute of Development
Administration until end of 2014. Also she
has held the positions of Additional Secretary
to the President, Director General, Public
Finance Department of the General Treasury,
DirectorintheMinistryofHousingandUrban
Development and Assistant Commissioner of
Probation and Childcare Services.
She is presently a Deputy Secretary to the
Treasury of the Ministry of Finance and serves
as a Director of Insurance Board of Sri Lanka.
SheholdsaBachelorofScience(Hons)
degree in Mathematics and Statistics from the
University of Jaffna, Bachelor of Laws (LLB)
Degree from the Open University of Sri Lanka,
Master’s Degree in Law from the University
of Colombo and a Postgraduate Diploma in
Urban Development from the Institute of
HousingandUrbanDevelopmentStudiesin
Rotterdam, Netherlands.
Mr Ranel T Wijesinha
Independent Non-Executive Director
Mr Ranel T Wijesinha, appointed to the
Board on 9 February 2015, is Chairman
of the Audit Committee and a Director of
HotelsColombo(1963)Limited,whichisa
subsidiary, of the Bank.
Presently an independent management
consultant, he is a Fellow of the Institute
of Chartered Accountants of Sri Lanka
and holds a Masters Degree in Business
Administration from the University of
Pittsburgh, in Pennsylvania, USA. A Past
President of CA Sri Lanka and a Past
President of the 23 nation Confederation
of Asian and Pacific Accountants, Mr
Wijesinha has a unique blend of work
experience, locally and overseas, in public
practice and private industry and in advisory
and regulatory roles for Governments.
HavingbegunhiscareerwithKPMGSri
Lanka, he worked overseas as a Manager
with Deloitte in the Bahamas, where he
co-managed projects with the firm’s US
offices. On his return to Sri Lanka, he set
up the first Business Development Division
fortheJohnKeellsHoldingsGroup.
Functioning as its first director, he designed
and implemented several restructuring
and turnaround strategies for subsidiaries
within the group, advised on new projects,
acquisitions and divestments. Pursuant
to his move into independent consulting,
he was invited to the Partnership of
Coopers & Lybrand, to revive its consulting
divisionandservedasPartnerandHead
of Consulting of PricewaterhouseCoopers,
Sri Lanka, consequent to the firm’s global
merger.
Mr Wijesinha has previously served as a
regulator, on the Securities and Exchange
Commission, the first Consumer Affairs
Council and the Sri Lanka Accounting and
Auditing Standards Monitoring Board.
Hehasrecentlyperformedadvisoryworkin
the public sector for foreign Governments
in several post soviet nations, as an
independent international consultant to
the Asian Development Bank. In February
2015, he was appointed as a Commissioner
of the Securities and Exchange Commission
of Sri Lanka.
Mr Brian J Sinniah
Independent Non-Executive Director
Mr Sinniah was appointed as a Director to the
Board of Bank of Ceylon with effect from 9
February 2015.
HeistheChairmanofBoardIntegratedRisk
Management Committee and a member of
AuditCommittee,HumanResourcesand
Remuneration Committee and Nomination
and Corporate Governance Committee.
Heisanexperiencedbankerwithmorethan
35yearsinthebankingindustry.Hehasheld
various senior positions in branch banking,
operations, credit, recoveries and risk and
compliance at a leading commercial bank in
the country.
HewasalsoaconsultantforSarvodaya
Economic Enterprise Development Services
(GTE) Ltd (SEEDS), the economic arm of
the well-known Sarvodaya Movement, a
leading local Non Government Organization,
providing micro finance throughout the island
and contributed to the floating of Deshodaya
Development Finance Company Ltd which is
now in operation.
HeisaDirectorofMerchantBankofSri
Lanka & Finance PLC which is a subsidiary
ofBankofCeylon.HeistheChiefFinancial
Officer of the Global Group of Companies.
Mr Aruna Priyadarsha Kurumbalapitiya
Alternate Director to Non-Executive Ex officio
Director
Mr Kurumbalapitiya was appointed as
the Alternate to Ex officio Director on 26
February 2015.
Hehasexperienceinthepublicsectorand
finance and has served as the Deputy Director
of Department of Public Finance.
Presently he is the Director of Macro Accounts
and Accrual Accounts, Department of State
Accounts, Ministry of Finance.
HeholdsaBachelorofScience(Public)
Special Degree from the University of Sri
Jayawardenepura,HigherNationalDiploma
inAccountancy(HNDA)andPostgraduate
Diploma in Accounting and Financial
Management from the University of Sri
Jayawardenepura.HeisaFellowmemberof
Public Finance Accountants of Sri Lanka and
Member of Certified Business Accountant,
Chartered Accountants in Sri Lanka.

42
BANK OF CEYLON . Annual Report 2014
Stakeholder Engagement
Stakeholder Engagement is embedded into the Bank’s governance and policy framework through our Corporate Vision. It is also encapsulated in the Sustainability Policy approved by the Board of Directors in 2013. The following table summarises key areas of this policy.
Employees
Customers
Investors
Primary Engagement Mechanisms
• Employeeengagementsurveys
• Consultativemeetingswiththe
trade unions
• Employeesuggestionschemes
• Grievancereportingprocedure
• Socialentertainmentandsportevents
• Welfarefacilitiestostaffmembers
Primary Engagement Mechanisms
• Onlineandlocalengagementbybranch
teams and relationship managers
• Customersatisfactionsurveys
• Marketresearch
• Production,promotioncampaignsand
facilitation programmes
• Provincecustomerday
Primary Engagement Mechanisms
• Onetoonemeetingswithlarge
investors
• Relationshipswithintermediaries
• Investorpresentation
• Roadshows
Needs Identified
• Developmentandcareerprogression
• Performanceenablingenvironment
• Worklifebalance
• Healthandsafety
• Collectivebargaining
• Equalopportunity
• Specialneedsofkeygroupssuchas
women
Needs Identified
• Customerservice
• Convenienceoftransacting
• Upholdingcustomercharter
• Improvinginancialinclusionthrough
appropriate products, education advice
and consultation
• Communicationinlanguageofchoice
Needs Identified
• Comprehensivebutconciseinformation
on operations and future outlook at
regular intervals
• Returnscommensuratewithrisks
assumed
• Exitmechanisms
Stakeholder Management Framework
We will invest in developing our
employees in an environment where
they are treated with respect, while their
professional development and economic
wellbeing is enhanced.
Stakeholder Management Framework
We uphold the rights of our customers in
line with our customer charter ensuring
that they understand the terms and
conditions relating to services accessed by
them.
Stakeholder Management Framework
We commit to providing a balanced
review of our performance and prospects
in our communications with investors
ensuring a competitive return to their
investment.

43
Truly Everybody’s Bank
Government and Regulators
Community
Suppliers and Service Providers
Primary Engagement Mechanisms
• Continuousdialogueswiththe
Government ministries and SOE’s
• Meetings,policytrendanalysisand
industry forums
• Continuousupdatingbasedon
regulatory requirement of Government
and regulators
Primary Engagement Mechanisms
• Localbranchengagement,media,social
events and sponsorships.
• Higherdegreeofparticipation
Primary Engagement Mechanisms
• Regularmeetings,written
communications
• Transparentbiddingprocess
• Relationshipbuilding
Needs Identified
• Stabilityandgrowthofinancialsector
• Largefundingneedsofthe
Government’s capital expenditure
• Responsiblebusinesspractices
• Alignmentofnationalprioritiesto
Bank’s strategy
• Financialinclusion
• Financingandfacilitationof
infrastructure projects
• Compliancewithregulatorydirection
and contribution to on-going dialogue
on financial sector reform
• Valueaddition
Needs Identified
• Responsiblebusinesspractices
• Communitydevelopment
• Communityempowerment
• Employment
• Financialstrengthandcredibility
Needs Identified
• Businessgrowth
• Responsiblebusinesspractices
• Easeoftransacting
• Strategicpartnerships
• Transformationinprocurementprocess
• Opencommunication
Stakeholder Management Framework
The Bank is committed to meet its
economic, social and environmental
obligations in line with the country’s
strategy. The corporate plan of the Bank
has adopted a sustainable integration
programme with Government’s
development programme.
Stakeholder Management Framework
We engage with local communities to
develop economic activity providing
opportunities and facilitating their socio
economic wellbeing.
Stakeholder Management Framework
We recognise excellence in service by our
suppliers and look to support their growth
through mutually rewarding partnerships.

44
BANK OF CEYLON . Annual Report 2014
Determining Material Issues
The material issues that impact the Bank
and its stakeholders are identified in the
Bank’s Sustainability Policy which also
assigns accountability to the relevant
heads of departments to measure and
monitor the activities. Progress on the
material issues determined are monitored
on an organizational basis by the
Sustainability Committee which is chaired
by the General Manager of the Bank.
The process adopted for identifying the
material issues is given below:
Members of the Sustainability Committee
have collectively identified the material
issues taking into account the impact
of the Bank’s operations on the key
stakeholder groups and the Bank’s
sustainable growth in the long term.
In evaluating the impact of issues, we
have considered both the frequency of
occurrence and the severity of impact on
the stakeholder groups and the Bank.
The G4 guidelines published by the
Global Reporting Initiative (GRI) were
used to provide guidance as to material
aspects and indicators that should be
included in the report, virtuous cycle for
measurement, monitoring and improving
on the identified indicators.
This procedure is followed annually
and the list is amended as deemed
necessary in order to reflect the changing
value creation model of the Bank and
stakeholder needs. The Bank found
reporting under “core” option is more
suitable and accordingly this year
the Bank reports, under GRI G4 “in
accordance core” option by shifting from
comprehensive option adopted
last year.
Identify matters that can impact the
Bank’s value creation process with
reference to the stock of capitals and
stakeholders impacted by the Bank
Evaluate their significance to the Bank
and the impacted stakeholders
Prioritize matters based on their relative
importance
Determining matters to be disclosed in the
Integrated Report of the Bank
In evaluating the impact of issues, we have considered both the frequency of occurrence and the severity of impact on the stakeholder groups and the Bank.
1956Became the largest lender to the
private sector of the economy

45
Truly Everybody’s Bank
Category Economic Environmental
Aspect Economic Performance (EC 1/EC 3) Energy (EN 3/EN 6)
Indirect Economic Impacts (EC 7) Products and Services (EN 27)
Category Social
Sub
Category
Labour Practices and Decent
Work
Human Rights Society Product
Responsibility
Aspect Employment
(LA 1/LA 2)
Non-discrimination(HR3) Local Communities (SO 1)
(FS 13) (FS 14)
Product and Services
Labelling (PR 4)
(FS 6) (FS 7)
Labour Management Relations
(LA 4)
Freedom of Association
and Collective Bargaining
(HR4)
Anti-Corruption (SO 3) Marketing
Communication (PR 7)
OccupationalHealthandSafety
(LA 5/LA 8)
ChildLabour(HR5) Compliance (SO 8) Customer Privacy
(PR 8)
Training and Education
(LA 9/LA 10/LA 11)
Forced or Compulsory
Labour(HR6)
Compliance
(PR 9)
Diversity and Equal Opportunity
(LA 12)
SecurityPractices(HR7)
Equal Remuneration for men and
women (LA 13)
HumanRightsGrievance
Mechanisms(HR12)
Labour Practices and Grievance
Mechanisms (LA 16)
H
M
L
L M H
LA 16
EC 1 / EC 3 EC 7 LA 1 / LA 2
LA 4 HR4 SO 3
SO 8 PR 8 PR 9
EN 3 / EN 6 LA 13 EN 27 LA 5 / LA 8
LA 9 / LA 10 / LA 11
LA 12 HR5
HR6
HR3
PR 7
HR12
PR 4
FS 13FS 7
Import
ance
to t
he
Ban
k
Importance to the Stakeholders
SO 1
FS 14
FS 6
HR7
1956 1957Bank introduced mobile banking
service ‘a bank of wheels’
Bank’s assets reached LKR 742
million, an increase of LKR 119
million over the previous year

46
BANK OF CEYLON . Annual Report 2014
Left to right
Mr Senarath Bandara
Mr D M Gunasekara
Mr P A Lionel
Mr W P Russel Fonseka
CorporateManagement
Mr S M S C Jayasuriya
Mr K E D Sumanasiri
Mr P J Jayasinghe
Mr D P K Gunasekara

47
Truly Everybody’s Bank
Left to right
Mr Lalith J Fernando
Ms S H Ranawaka
Mr G L Palitha Jinasoma
Mr G H Chandrasiri
Dr Indunil Liyanage
Ms Janaki Senanayake Siriwardane
Mr P M Liyanage
Mr M M Luxaman Perera

48
BANK OF CEYLON . Annual Report 2014
Corporate Management
Mr D M Gunasekara
General Manager
Skills and Experience
Mr Gunasekara is a Career banker with
31 years of diversified banking experience
covering corporate and offshore banking,
sales and channel management and
international banking operations. Prior
to his being appointed as the General
Manager, he has held a number of key
corporate management positions in these
areas.Hepossessesextensiveexperience
in credit management and administration.
Hehassuccessfullycompletedthe
programme on Corporate Management
for Sri Lanka (LKCM2 AOTS) in Japan;
an Advanced Management Programme
conducted by Wharton University of
Pennsylvania, USA. Mr Gunasekara
graduated from the University of
Colombo, Sri Lanka, with a Special
Degree in Public Finance and Taxation in
1981.HeisanAssociateMemberofthe
Institute of Bankers of Sri Lanka.
Appointment to the Corporate
Management
HewasappointedastheGeneral
Manager/Chief Executive Officer of Bank
of Ceylon on 8 January 2013. Prior to his
appointment as the General Manager/
Chief Executive Officer, he served from
October 2010, as the Deputy General
Manager in charge of Retail Banking and
Sales and Channel Management.
Positions Held During the Year
HeisaNon-ExecutivenomineeDirector
on the Boards of BOC Travels (Private)
Limited, BOC Property Development &
Management (Private) Limited, Property
Development PLC., BOC Management
& Support Services (Private) Limited.,
Bank of Ceylon (UK) Limited, Ceybank
HolidayHomes(Private)Limited,Hotels
Colombo (1963) Limited, Merchant Bank
of Sri Lanka & Finance PLC, Ceybank
Asset Management Limited, Institute of
Bankers of Sri Lanka, Credit Information
Bureau of Sri Lanka, Lanka Financial
Services Bureau Limited, LankaClear
(Private) Limited, Sri Lanka Banks’
Association (Guarantee) Limited and
the Financial Ombudsman Sri Lanka
(Guarantee) Limited.
Career Milestones
Mr Gunasekara commenced his career
with the Bank in 1983 and over the
years received training and exposure
in a number of areas and at different
levels concentrating mostly on credit
managementandadministration.He
served at the London branch from
1997–2000.Hehasmadeanimportant
contribution through his services as
a resource person of Bank’s Central
Training Institute and with the Institute of
BankersofSriLanka.HeisalsoaCouncil
Member of the Association of Professional
Bankers.
Mr P A Lionel
Senior Deputy General Manager
(International, Treasury and Investment)
Skills and Experience
Mr Lionel joined the Bank’s service in
1983.Heisacareerbankercounting
over 31 years of experience in banking
and financial services specializing in the
areas of treasury, international operations
and investment banking and has been
involved in managing assets and liabilities,
fund raising activities, securities trading,
risk management in relation to treasury
andcrossboarderfunding.Hehaslair
for developing and marketing treasury
products.HeobtainedhisBachelorofArts
Degree from the University of Colombo,
Sri Lanka in 1980.
Appointment to the Corporate
Management
HewasappointedastheDeputyGeneral
Manager (International, Treasury and
Investment) in March 2012. Previously,
he held the position of Deputy General
Manager(HROperationsandInvestment
Banking) from October 2010 to March
2012.
Positions Held During the Year
Mr Lionel serves as a director on the
BoardsofLankaHospitalCorporations
PLC,LankaHospitalsDiagnostics,
Property Development PLC, Koladeniya
Hydropower(Private)Limited,Ceybank
Asset Management Limited, and Lanka
Securities(Private)Limited.Heisa
member of the Governing Board of the
Institute of Bankers of Sri Lanka, and
also a member of the Cabinet appointed
Procurement Committee of Ceylon
Petroleum Corporation. Mr Lionel holds
the esteemed presidency of the Sri Lanka
FOREX Association which is the apex
body of treasury and dealing activities.
As the president, he has initiated number
of activities to enhance knowledge of
FOREX community and also to develop
FOREX market in Sri Lanka.

49
Truly Everybody’s Bank
Career Milestones
HeheldthepositionsofCEOofthe
Primary Dealer Unit of the Bank and
headed the Treasury and Investment
Unit.Hereceivedabroadexposure
and an extensive training in treasury
management and FOREX dealing
activities in London from 1988 to 1989,
andalsoservedastheHeadofTreasuryat
the BoC Branch in Karachi, Pakistan.
Hehasbeenfunctioningintheareasof
treasury, international and Investment
for over 25 years and innovations of
BoC treasury was completely handled
by Mr Lionel. All large syndications in
the international market have been
structuredunderhispatronage.He
also led the launch of two USD Bond
transactions, mobilizing one billion US
Dollars. Recently, launch of rupee option
by Bank of Ceylon was also one of his
achievements.
Mr Senarath Bandara
Deputy General Manager (Product and
Development Banking)
Skills and Experience
Mr Bandara is a career banker counting
over 25 years of experience in diversified
fields, both in the local and international
banking arena.
HeisaPhysicalSciencegraduateof
University of Kelaniya, Sri Lanka and
holds a Master of Business Administration
with a Merit Pass from the Postgraduate
Institute of Management, University of
SriJayewardenepura,SriLanka.Heisa
Fellow member of the Institute of Bankers
of Sri Lanka and obtained a Postgraduate
Diploma in Bank Management from the
same institute, achieving the best student
award in 1998.
Appointment to the Corporate
Management
HewasappointedasaDeputyGeneral
ManagerinMarch2012.Hiscurrent
business portfolio includes product
management, islamic financing,
development banking, electronic banking
and credit/debit cards operations.
Positions Held During the Year
HeisanomineedirectorofBoCto
Regional Development Bank, Merchant
Bank of Sri Lanka & Finance PLC and
MBSL Insurance Company Limited and
an alternate director to Mireka Capital
(Private)LimitedandCeybankHoliday
Homes(Private)Limited.
Career Milestones
Mr Bandara was a member of the
Executive Management since January
2008 holding the position of Assistant
General Manager overseeing diverse
business fields, viz. Overseas branches,
international, corporate relations and as
the Chief Executive Officer of Bank of
Ceylon (UK) Limited at different periods.
HejoinedtheBankinJanuary1990asa
management trainee and rose up in his
career, gaining diverse experience both
locally and abroad mainly in the fields
of information systems, investments,
treasury management,international
banking operations and corporate
banking.Hesuccessfullyspearheaded
the process of converting Bank of Ceylon
operations in London from branch to
subsidiary status in 2010 gaining sound
fundamental knowledge of regulations
and compliances in the banking arena.
Hepresentlyprovidesleadershipfor
several technology driven development
projects in the Bank “Signature” and
“Wenesa” are two such key projects
currently being overseen by Mr Bandara.
Hehadbeenaresourcepersonatthe
Institute of Bankers of Sri Lanka too,
in the field of credit and investment
management.
Prior to joining the Bank, he was an
Assistant Lecturer at the University of
Kelaniya and also served at the Mahaweli
Authority.
Mr W P Russel Fonseka
Deputy General Manager (Retail Banking)/
Acting Chief Financial Officer
Skills and Experience
Mr Fonseka possesses over 25 years of
hand on experience in banking operations
with specialized knowledge in financial
management and strategic planning.
Graduated from the University of
Sri Jayewardenepura, Sri Lanka with
a Bachelor of Science (Special) Degree
in Business Administration and holds a
Postgraduate Diploma in Management
from the Postgraduate Institute
of Management, University of Sri
Jayewardenepura, Sri Lanka and a Master
of Business Administration from the
University of Southern Queensland.
HeisaFellowMemberoftheInstituteof
Chartered Accountants of Sri Lanka and
also an Associate Member of the Institute
of Bankers of Sri Lanka.
Appointment to the Corporate
Management
Appointed as the Deputy General
Manager (Retail Banking) in May 2013.
Prior to that, he held the positions of
Deputy General Manager (Finance and
Planning) from March 2012 to May
2013.HealsoservesastheActingChief
Financial Officer of the Bank from 25
July 2014.
Positions Held During the Year
Mr Fonseka is the Chairman on the Board
of Transnational Lanka Records Solutions
(Private) Limited since November 2012.
Hehasbeenservingasanomineedirector
on the Board of Mireka Capital Land
(Private) Limited since 2008 and also on
theBoardofMirekaHomes(Private)
Limited.HeservesasadirectorofMBSL
Insurance Company Limited since 2013
and also acts as the Chairman of the
Audit Committee of MBSL Insurance
Company Limited.

50
BANK OF CEYLON . Annual Report 2014
Corporate Management
Healsoservesasanalternatedirector
on the Board of LankaClear (Private)
Limited. Mr Fonseka also acts as the
Chairman of the Audit Committee, a
Board sub committee of LankaClear
(Private) Limited since November 2012.
HeisanAlternateDirectorontheBoard
and also acts as the Chairman of the
Audit Committee of Merchant Bank of
Sri Lanka & Finance PLC, one of the
subsidiary company of Bank of Ceylon,
from August 2013.
Career Milestones
HejoinedtheBankinJanuary1990.
Commenced his career with retail
banking and then specialized in financial
management and strategic planning of the
Bank, whilst acquiring wide experience in
all aspects of commercial banking.
HealsoservedinBankofCeylon,London
branch where he obtained comprehensive
experience in treasury and international
banking activities.
Prior to being appointed to the Corporate
Management, he held the position of
Assistant General Manager (Budget and
Strategic Planning) from 2008 to March
2012.
Mr P J Jayasinghe
Deputy General Manager (Recovery)
Skills and Experience
Mr Jayasinghe is a career banker counting
over 37 years of experience in diversified
banking operations.
HegraduatedfromtheUniversityof
Sri Jayewardenepura with a (Special)
DegreeinCommerce.HeisanAssociate
Member of the Institute of Bankers of
Sri Lanka and also holds an Advanced
NationalDiplomainHumanResource
Management from the National Institute
of Business Management.
Appointment to the Corporate
Management
HewasappointedastheDeputyGeneral
Manager (Recovery) in April 2014 and
prior to that he served as the Deputy
GeneralManager(HumanResource)
from March 2012.
Positions Held During the Year
In addition to his portfolio as DGM
(Recovery), presently, Mr Jayasinghe
serves as a Director on the Boards of BOC
Property Development & Management
(Private)LimitedandCeybankHoliday
Homes(Private)Limitedandasa
member of ALCO, Credit Committee,
NPA Monitoring Committee, Foreclosed
Properties Committee, IT Steering
Committee.HeisanAlternateMember
of the Board of Governors of the Institute
of Bankers of Sri Lanka (IBSL) and a
member of the Audit Committee of IBSL.
Career Milestones
HavingjoinedtheBankin1977,
Mr Jayasinghe has covered the areas
of retail banking, wholesale banking,
international banking, treasury
operations, offshore banking, trade
finance operations, credit, recovery and
human resource management in the
Bank.Hehascontributedtoenhancethe
knowledge and skills of staff of the Bank,
as an associate faculty member on credit
evaluation and administration, credit
policy, international and trade finance
during the last 15 years.
HehasservedasamemberoftheHuman
Resource Policy Committee, Chairman
- Scholarships Committee, member of
Trustees of BOC Pension Trust Fund,
Ex-officio Manager of BOC Widows &
Orphans’ Fund, and BOC Provident Fund,
Operational Risk Management Executive
Committee, Judging panel of Quality
Circle Competition and on the Judging
panel of Sri Lankan Entrepreneurs Award
– 2011 organized by the Federation of
Chambers of Commerce and Industries of
Sri Lanka (FCCISL).
Mr D P K Gunasekara
Deputy General Manager
(Corporate and Off-Shore Banking)
Skills and Experience
Mr Gunasekara carries more than 34
years of vast experience in different
business operations in the Bank.
HeisaBachelorofScience(Business
Administration) graduate of the
University of Sri Jayewardenepura
and holds a Post Graduate Diploma in
Business and Finance Administration
from the Institute of Chartered
Accountants of Sri Lanka. Mr Gunasekara
is an Associate Member of the Institute
of Bankers of Sri Lanka. Mr Gunasekara
has also obtained a Master of Business
Administration from the University of
Southern Queensland, Australia.
Appointment to the Corporate
Management
HewasappointedastheDeputyGeneral
Manager (Corporate and Offshore
Banking)inMay2013.Hepreviously
held the position of Deputy General
Manager (Retail Banking) from February
to May 2013.

51
Truly Everybody’s Bank
Positions Held During the Year
HeservesasaDirectorontheBoards
of BOC Travels (Private) Limited, BOC
Management & Support Services (Private)
LimitedandHotelsColombo(1963)
Limited.
Career Milestones
Mr Gunasekara joined the Bank in 1980
and commenced his career with retail
banking, gathering vast experience in the
branch network and later on served in
Central Cash and Accounts Departments.
In 1992, he joined the Treasury Division
as a dealer and gathered an extensive
knowledge gaining experience in treasury
and money market operations locally
as well as overseas at Bank of Ceylon
Londonbranch.Healsoservedasthe
HeadofTreasuryintheBankofCeylon
Chennai branch, India during the period
of 2000-2003 and as the Deputy Manager,
Chennai branch from 2008 to 2010.
Mr Gunasekara served as the Manager/
Senior Dealer in the BoC Treasury Bills/
Bonds Unit and as the first Chief Dealer
in the Ceybank Securities Limited
which was formed, as a separate entity
to exclusively deal with Government
Securities.Hehascoveredalmostall
the positions in the Bank of Ceylon
Dealingroom.Hewasoneofthepioneer
members in setting up of middle office
in the Bank of Ceylon Treasury Division.
Mr Gunasekara also held the positions
of Assistant General Manager (Overseas
Branches) and Assistant General Manager
(Corporate Relations) since October 2010.
Mr K E D Sumanasiri
Deputy General Manager (Human Resource)
Skills and Experience
Mr Sumanasiri possesses 25 years of
rich and diversified experience in retail
banking, micro finance, corporate finance
and human resource development.
HegraduatedfromtheUniversityof
Sri Jayewardenepura, Sri Lanka with
aBachelorofScience(Hons.)Degree
inBusinessAdministration.Heisan
Associate Member of the Institute of
Bankers of Sri Lanka and also successfully
completed the Special Management
CourseforHigherManagementand
Public Policy for Business Leaders
conducted at the Post Graduate Institute
for Management Studies (PIM) of
University of Sri Jayewardenepura,
Sri Lanka.
Appointment to the Corporate
Management
Appointed as the Deputy General
Manager(HumanResource)inApril
2014 and prior to that he served as the
Deputy General Manager (Recovery)
from May 2013.
Career Milestones
Commencing his banking career in 1990,
Mr Sumanasiri held several key positions
whileservinginthebranchnetwork.He
had also been a Faculty Member at the
Bank’s Training Institute, holding the
positionofManager(Training).Hereadily
responded to uplifting the knowledge of
the staff and was very instrumental in
their career development. Mr Sumanasiri
held the position of Assistant General
Manager (Northern Province), soon after
the three decade conflict period came to
an end in the Northern part of Sri Lanka,
and played a lead role in the uplifting of
livelihood of the resettled people.
Hecontributedimmenselytotheboom
of the economy of the Northern Province.
Heprovidesleadershipandguidanceto
propel BoC to a greater height.
Mr S M S C Jayasuriya
Deputy General Manager (Finance and
Planning)
Skills and Experience
Mr Jayasuriya, counting over 28 years of
service in Banking, was in the Domestic
Banking in the early part of his career and
later specialized in treasury, investment
banking and international banking.
HegraduatedfromtheUniversityofSri
Jayewardenepura, Sri Lanka in 1979
withBachelorofScienceDegree.Heis
an Associate Member of the Institute of
Bankers of Sri Lanka (AIB), an Associate
Member of the Chartered Institute of
Management Accountants (CIMA)
(UK), a Member of the Chartered Global
Management Accountants (CGMA)
and also a Member of the Chartered
Shipbrokers (MICS) (UK).
Appointment to the Corporate
Management
HewasappointedastheDeputyGeneral
Manager (Finance and Planning) in May
2013.Hiscurrentportfolioincludes,
financial accounting, budget, strategic
planning, MIS, treasury back office, tax
and central cash management.
Positions Held During the Year
Mr Jayasuriya serves as a Director on
the Boards of Transnational Lanka
Records Solutions (Private) Limited and
MBSLInsuranceCompanyLimited.He
is also an Alternate Director for BOC
Property Development & Management
(Private) Limited, Credit Information
BureauofSriLanka(CRIB).Healso
serves as a member in the Investment
Committee, Assets and Liability

52
BANK OF CEYLON . Annual Report 2014
Corporate Management
Management Committee (ALCO), Credit
Committee and IT Steering Committee.
HeistheChairpersonoftheInvestment
Committee of the Bank’s Pension Fund/
Provident Fund/W/W&OP Fund and
serves as Ex-officio Trustee since 2009.
HeisalsotheChairmanoftheDamage
Assessment and Restoration Committee.
Career Milestones
Mr Jayasuriya joined the Treasury
Division as a Dealer in 1991 and had
gathered extensive knowledge and
experience in treasury management
duringthelast22yearsintheHead
Office, London branch and Chennai
branch.HeservedastheHeadofTreasury
Bank of Ceylon Branch in Chennai,
Indiafrom1997to2000.Hehasmade
immense contribution towards the
Treasury Division specially managing
the liquidity position of the Bank and
maximizing foreign exchange income.
Mr Jayasuriya played a very active role
in both USD 500 million international
bond issues and was a member of the
road show team. In addition, he played
key roles in Debenture issues done by
BoC to enhance the Tier II Capital and
Debenture issue of Urban Development
Authority.Hehasusedhisrelationship
with international banks to mobilize a
substantial amount of funding through
several syndicated loans and bilateral
facilities in order to manage the liquidity
position of the Bank. Mr Jayasuriya was
a member of the Executive Committee
of the Sri Lanka FOREX Association for
many years.
Mr Jayasuriya was a member of the
Executive Management since November
2009.HeheldthepositionsofAssistant
General Manager (Treasury) and Assistant
General Manager (Investment Banking)
prior to his appointment to the Corporate
Management.HewasalsotheCEOofthe
Primary Dealer Unit of the Bank.
Before joining the Bank, he worked in
the Ceylon Shipping Corporation for five
years and ended as an Assistant Manager.
Mr G H Chandrasiri
Deputy General Manager (Support Services)
Skills and Experience
Mr Chandrasiri has over 28 years of vast
experience in banking operations with
special exposure on business process re-
engineering, productivity management
and organizational restructuring.
HeisanAssociateMemberofthe
Institute of Bankers of Sri Lanka and
also obtained a Postgraduate Executive
Diploma in Bank Management from
thesameinstitute.Hegraduatedfrom
the University of Sri Jayewardenepura,
Sri Lanka with a (special) Degree in
CommerceandholdsHigherNational
Diploma in Accountancy from Sri Lanka
TechnicalCollegeandHigherNational
Diploma in Management from the Open
UniversityofSriLanka.Heisalsoa
licentiate of the Institute of Chartered
Accountants of Sri Lanka.
Appointment to the Corporate
Management
HewasappointedastheDeputyGeneral
Manager (Support Services) in September
2013.
Positions Held During the Year
Mr Chandrasiri serves as a Non-Executive
DirectorontheBoardofHotelsColombo
(1963) Limited since September 2013.
Career Milestones
HejoinedtheBankinOctober1986
and started his career from Ballaketuwa
Agriculture Service Centre. Whilst
acquiring a wide experience in Domestic
Banking, he also served in Lebanon as a
BoC representative in 1993/1994. Prior
to his appointment to the Corporate
Management, he held the positions of
Assistant General Manager (Business
Process Re-Engineering Project) and
Assistant General Manager (Uva
Province).
Mr G L Palitha Jinasoma
Deputy General Manager (Sales and Channel
Management)
Skills and Experience
Mr Jinasoma has over 31 years of
experience in the banking field, gaining a
vast knowledge in domestic and overseas
business operations.
HegraduatedfromtheUniversityof
Kelaniya, Sri Lanka with Bachelor of Arts
in Economics, specializing in Statistics.
HeholdsaMasterofArtsinEconomics
from the University of Colombo and a
Master of Business Administration from
the University of Rajarata, Sri Lanka.
HehasfollowedaCertiicateCoursein
“Advertising” under “SPAACS” which
was recognized by Accredited
Association of Advertising Agencies (4A’s)
ofSriLanka.HeisalsoanAssociate
Member of the Institute of Bankers of
Sri Lanka.

53
Truly Everybody’s Bank
Appointment to the Corporate
Management
Appointed as the Deputy General
Manager (Sales and Channel
Management) in June 2014.
Positions Held During the Year
Mr Jinasoma serves as a Director on the
Board of BOC Travels (Private) Limited.
Career Milestones
Joining the Bank in 1983, Mr Jinasoma
rose up in the career, holding several
keypositionsintheBank.Hewasable
to gain a vast knowledge and experience
in lending, while serving to retail
and corporate customers of the Bank
throughoutthecountry.Healsoserved
in BoC Chennai branch and BoC Male
branch, and obtained a good exposure in
credit management.
Mr Jinasoma held the position of
Assistant General Manager (Uva
Province) and played a leading role in
uplifting the banking business in Uva
Province.HewastheCountryManagerof
the Chennai branch, before he assumed
duties as the Deputy General Manager
(Sales and Channel Management).
Ms S H Ranawaka
Chief Legal Officer
Skills and Experience
Ms Ranawaka counts over 28 years of
experience in the Bank alone and over 34
years of experience in the legal field.
She holds a Master’s Degree in
International Trade Law awarded by the
University of Wales and Post Attorney
Diplomas in Banking and Insurance Laws
and International Trade Law awarded by
the Sri Lanka Law College.
Appointment to the Corporate
Management
She was appointed as the Chief Legal
Officer of Bank of Ceylon in April 2012.
Positions Held During the Year
She is a Director of BOC Property
Development & Management (Private)
Limited, a subsidiary of the Bank and an
Alternate Director on the Board of Mireka
Capital Land (Private) Limited. She is an
Associate Faculty Member of the Central
Training Institute of the Bank.
Career Milestones
Ms Ranawaka is an Attorney-at-Law by
profession and started her career in the
Galle Bar in 1980 and joined Bank of
Ceylon, Legal Department in June 1986.
She is a member of the Bar Association
of Sri Lanka and the President of the
Corporate Lawyers Association of Sri
Lanka.
Ms Janaki Senanayake
Siriwardane
Secretary to the Board/Secretary,
Bank of Ceylon
Skills and Experience
Counting over 17 years of experience in
the Bank, Ms Siriwardane specializes in
company secretarial work and Corporate
Governance practices.
Ms Siriwardane is an Attorney-at-Law by
profession and holds a Bachelor’s Degree
in Law. She also holds a Master’s Degree
in Business Administration from the
University of Colombo, Sri Lanka.
Appointment to the Corporate
Management
Ms Siriwardane was elevated to the grade
of Deputy General Manager in October
2010.
Positions Held During the Year
She is a Nominee Director of Ceybank
HolidayHomes(Private)Limitedand
serves as its Company Secretary and also
of BOC Management & Support Services
(Private) Limited.
Career Milestones
Ms Siriwardane joined the Bank of
Ceylon in January 1996 as its Assistant
Secretary to the Board. She was
appointed as Secretary to the Board /
Secretary, Bank of Ceylon in December
2005.
In addition to her work as the Secretary
to the Board/Secretary, Bank of
Ceylon, she serves as the Secretary to
all the Subcommittees of the Board.
She facilitates Bank’s compliance with
the Corporate Governance rules and
practices.
Prior to joining Bank of Ceylon, she
practiced as an Attorney-at-Law in the
private bar. She also worked in several
private sector companies handling
company secretarial work including IPOs,
mergers etc and carried out legal and
HRwork.ShewasavisitingLecturerin
Commercial and Industrial Law at the
Industrial Management Department of
the University of Kelaniya, Sri Lanka.
Mr Lalith J Fernando
Chief Risk Officer
Skills and Experience
Mr Fernando joined the Bank Service
in 1986 and counts over 28 years of
experience in banking and financial
services.Heisanexpertindiverseields
including branch banking, investment
banking, international banking and
treasury operations.
Mr Fernando holds a Bachelor of
Science Degree in Statistics from the
University of Peradeniya, Sri Lanka and

54
BANK OF CEYLON . Annual Report 2014
Corporate Management
obtained his Master of Science Degree
in Management from the University of
SriJayewardenepura,SriLanka.Heis
also a Fellow Member of the Institute of
Bankers of Sri Lanka.
Appointment to the Corporate
Management
HewasappointedastheChiefRisk
Officer since April 2013.
Positions Held During the Year
Mr Fernando serves as a Director on the
Board of BOC Travels (Private) Limited.,
since 2012.
Career Milestones
Engaged in Risk Management related
activities of the Bank for the last 12 years.
Hewasinstrumentalinestablishingthe
Integrated Risk Management Division of
the Bank.
HehasbeenawardedtheFinancial
Risk Manager designation by the Global
Association of Risk Professionals - USA.
This designation is globally regarded as
having gained risk management expertise.
Heisalsoarenownedresourceperson
in Risk Management for the University
of Sri Jayewardenepura, Sri Lanka, the
Institute of Bankers of Sri Lanka and the
Centre for Banking Studies of Central
Bank of Sri Lanka. On the invitation of
Saudi Monetary Agency, he successfully
conducted several programmes on Credit
Risk Management to Saudi bankers at the
Institute of Banking Riyadh as well.
Prior to joining the Bank, he was a
graduate teacher in Mathematics and
Physics.Healsoheldthepositions
of Assistant General Manager (Risk
Management/ Compliance) and that of
Acting Chief Risk Officer of the Bank
before being appointed to the Corporate
Management.
Mr M M Luxaman Perera
Head of IT
Skills and Experience
Counting over 29 years in the banking
career, he has gained a wide range of
experience in ICT in different capacities.
Mr Perera is a science graduate from the
UniversityofColombo.HeholdsaMaster
of Science in Computer Science and also
a Master of Business Administration from
the University of Colombo, Sri Lanka.
HeisamemberoftheComputerSociety
of Sri Lanka and a member of the British
Computer Society, too.
Appointment to the Corporate
Management
HewasappointedastheHeadofITin
August 2013.
Career Milestones
Mr Perera joined the Bank in 1986 as
aSystemsAnalystProgrammer.He
commenced his career with Core Banking
ApplicationSystems.Hisexperiencewas
enriched through his active involvement
in multiple ICT projects. Prior to being
appointed to the Corporate Management
he held the position of Assistant Director
IT (Application Systems).
HehasalsoservedattheStandardBank
of South Africa during the period from
1996 to 1997.
Dr Indunil Liyanage
Chief Marketing Officer
Skills and Experience
Havingservedformanyorganizationsin
the field of marketing since 1989,
Dr Indunil Liyanage counts over 25
years of experience in financial services
industry, fast moving consumer goods
(FMCG), electronics and agriculture
sectors in Sri Lanka.
Dr Liyanage holds a Doctor of Philosophy
(PhD) from the Faculty of Graduate
Studies (FGS), University of Colombo, Sri
Lanka.HehasaMasterofScience(MSc)
in Management from the University
ofSriJayewardenepura,SriLanka.He
also holds a Postgraduate Diploma in
Marketing from the Chartered Institute of
Marketing UK.
1961NationalizationThe Bank was nationalized in terms
of the Finance Act no. 65 of 1961
1958Pension scheme was set up for
every permanent employee

55
Truly Everybody’s Bank
Dr Liyanage is a Chartered Marketer
since 1997, attached to the first batch
of Chartered Marketers in Sri Lanka
and a Fellow Member of the Chartered
Institute of Marketing (FCIM) and a
Fellow Member of the Sri Lanka Institute
ofMarketing(FSLIM).Heisamember
of the Chartered Institute of Marketing
(UK) since 1995 and a member of
Alumni Associations of the University
of Sri Jayewardenepura (AAUSJP),
University of Colombo (AAUOC) and
Faculty of Graduate Studies of University
ofColombo(AAUOC-FGS).Hehas
participated in many international
training programmes including Strategic
Management Executive programme
which was held at the National University
of Singapore (NUS) in 2009.
Appointment to the Corporate
Management
Appointed as the Chief Marketing Officer
of Bank of Ceylon in September 2012.
Career Milestones
Prior to joining Bank of Ceylon,
Dr Liyanage has served as the Assistant
VicePresident-HeadofMarketingat
National Development Bank PLC, Sri
Lanka.Hehasalsoheldseniorpositions
previously in multinationals and local
organizations in the capacity of Product/
Brand Manager and Marketing Manager.
Throughout his marketing career he has
built several key international and local
brands/ products in the country.
Dr Liyanage was honoured with the
“50 Most Talented CMOs Award” at the
Golden Globe Tiger Awards 2013, World
Marketing Summit held in Malaysia
and was the first Sri Lankan selected
for the “Intercultural Education for
Global Managers” programme at the
Japan America Institute of Management
Science(JAIMS)inHawaii,USA.He
was awarded a full scholarship by
the Fujitsu Foundation of Japan to
complete this programme, in recognition
of his academic excellence and
potential contribution to international
understanding and goodwill in 1996.
Mr P M Liyanage
Chief Internal Auditor
Skills and Experience
Mr Maduwantha Liyanage is an Associate
Member of the Institute of Chartered
Accountants of Sri Lanka with 15 years of
post-qualified experience.
HeholdsaBScAccountancyand
Financial Management (Special)
degree from the University of Sri
Jayewardenapura, Sri Lanka.
Mr Liyanage has successfully completed
the Certified Information Systems Auditor
(CISA) Examination conducted by the
ISACA – USA.
Appointment to the Corporate
Management
Appointed as the Chief Internal Auditor
of Bank of Ceylon in December 2014.
Career Milestones
Prior to joining the Bank of Ceylon as the
Chief Internal Auditor, he has served at
the Commercial Credit and Finance PLC,
and Pan Asia Bank in the same capacity.
Mr Liyanage has served Bank of Ceylon
in Assistant General Manager grade
during the period 2006 – 2008 as the
Internal Auditor.
Mr Liyanage’s exposure also includes
LankaClear (Private) Limited, (National
ChequeClearingHouse)inthecapacityof
Finance & Administration Manager and
Ernst and Young as a Qualified Assistant.
1961 1964Predominant PositionBank built a market share of 50% in deposits,
60% in investments and 30% of advances
reflecting growing public confidence
Celebrated
25th anniversary

56
BANK OF CEYLON . Annual Report 2014
Executive
2
Management
Mr D N L Fernando
Chief Executive Officer -
Bank of Ceylon (UK) Ltd
Mr W M S Wanasinghe
Assistant General Manager -
Marketing
Mr K T Karunaratne
Assistant General Manager -
Support Services
Mr D K N Piyasoma
Assistant General Manager -
Southern Province
Mr D M L C Kumara
Assistant General Manager -
Accounting and Tax
Ms C K Jayarathne
Assistant General Manager -
Pettah Branch
Mr G D Silva
Assistant General Manager -
Training and Development
Mr R M Haputhanthiri
Country Manager - Seychelles

57
Truly Everybody’s Bank
Mr H S Jayawardana
Assistant General Manager -
Consumer Product
Management
Mr J M D B Jayasundera
Assistant General Manager -
Investigations
Mr P M Premadasa
Assistant General Manager -
Sabaragamuwa Province
Mr C Amarasinghe
Assistant General Manager -
Offshore Banking
Mr W C K
Wickramarachchi
Assistant General Manager -
Branch Credit
Mr K P Anandanadesan
Assistant General Manager -
Eastern Province
Mr D M G C Devasinghe
Assistant General Manager -
Trade Services
Mr H M P B Herath
Assistant General Manager -
North Central Province

58
BANK OF CEYLON . Annual Report 2014
Executive Management
Ms W I Hettihewa
Assistant General Manager -
Administrative Services
Mr D M L B Dassanayake
Country Manager - Male
Mr M T M Jalaldeen
Assistant General Manager -
Organization Transformation
Project
Mr S M W Samarakoon
Assistant General Manager -
International
Mr M J P Salgado
Assistant General Manager -
Province Sales Management
Mr J M A Ariyaratne
Assistant General Manager -
Business Process
Re-engineering Project
Mr W A C Tissera
Assistant General Manager -
Product and Development
Banking
Mr R M D V Jayabahu
Assistant General Manager -
Budget, Strategic Planning and
MIS

59
Truly Everybody’s Bank
Mr G H Wickremasinghe
Assistant General Manager -
Treasury Back Office
Mr S Hewavitharana
Assistant General Manager -
Central Province
Mr P G G Tissera
Assistant General Manager -
Treasury
Mr A De S Pinnaduwage
Assistant General Manager -
Compliance
Mr G A Jayashantha
Assistant General Manager -
Risk Management
Mr T M T Tennakoon
Assistant General Manager -
Uva Province
Mr R P D K Ratnasinghe
Assistant General Manager -
Western Province North
Mr B M Premaratne
Assistant General Manager -
HumanResourceOperations

60
BANK OF CEYLON . Annual Report 2014
Executive Management
Mr J A A Jayasinghe
Assistant General Manager -
Information Systems Audit
Mr D R L Perera
Assistant General Manager -
Recovery Corporate
Mr E M Jayarathne
Assistant General Manager -
North Western Province
Mr W N P Surawimala
Country Manager - Chennai
Mr T A D Kularatne
Assistant General Manager -
Corporate Credit
Mr K T A E De Silva
Assistant General Manager -
BOC Card Centre
Mr D S
Muthukudaarachchi
Assistant General Manager -
Corporate Relations
Mr S A Hemajith
Assistant General Manager -
Metropolitan
Mr B Nanthakumar
Assistant General Manager -
Northern Province

61
Truly Everybody’s Bank
Mr Jagath Kurundukumbura
Assistant Director IT
(Operations/Technical Support)
Ms G Jayasinghe
Deputy Chief Legal Officer
(Credit)
Ms M D Munasinghe
Deputy Chief Legal Officer
(Recovery)
Mr Y P Warnasekara
Assistant General Manager -
Superannuation Schemes
Mr M D A Karunaratne
Assistant Director IT
(Delivery Channel)
Mr W N I B S M Fernando
Assistant General Manager -
Western Province South
Ms H M C M Maldeni
Assistant Director IT
(Application Systems)
Mr W Y Bandula
Assistant General Manager -
Investment Operations
Ms D Kitulgoda
Deputy Chief Legal Officer
(International and Investment
Banking)

62
BANK OF CEYLON . Annual Report 2014
Management Discussion and Analysis
Growth
Total assets, loans and advances and
deposits grew by 11%, 3% and 11%
respectively despite the moderation
in growth experienced during the
year.
2010 2011 2012 2013 2014
Growth
LKR Bn
Loans & Advances
Deposits
Total Assets
38
25
30
720
562
59
58
38
715
693
1,0
48
75
5 842
1,1
94
77
89
34
1,3
29
Financial Stability
Bank’s strong balance sheet which
makes up almost 1/5th of that of
the industry evinces the soundness
of the Bank as well as its systemic
importance. The Bank has no
solvency issues as short term and
long term obligations can be met
as they become due in the normal
course of business. The Bank also
maintains an adequate capital
cushion to absorb any economic/
financial shocks which is illustrated
by the Bank’s Capital Adequacy
Ratios which are well above the
minimum regulatory requirement.
Profitability
Profit before tax increased 29% over
the previous year strongly supported
by growth in fee based income and
gains from treasury operations (net
gains from trading and financial
investments).
2010 2011 2012 2013 2014
Profitability
LKR Bn
10
.1
16
.5
19
.8
15.7
20.3
Market Leadership
Market leadership in key drivers:
Deposits - 20%
Loans and advances - 20%
Assets - 19%
Inward remittances - 40%
A household name that is embedded
in the socio economic framework
of the country with the capacity to
finance the nation’s largest projects
gives us a unique and advantageous
position for growth.
Bank of Ceylon is a penetrative mass bank focussing on delivering imaginative inancial services to individuals, corporates, Government and other institutions.
Our Performance at a Glance
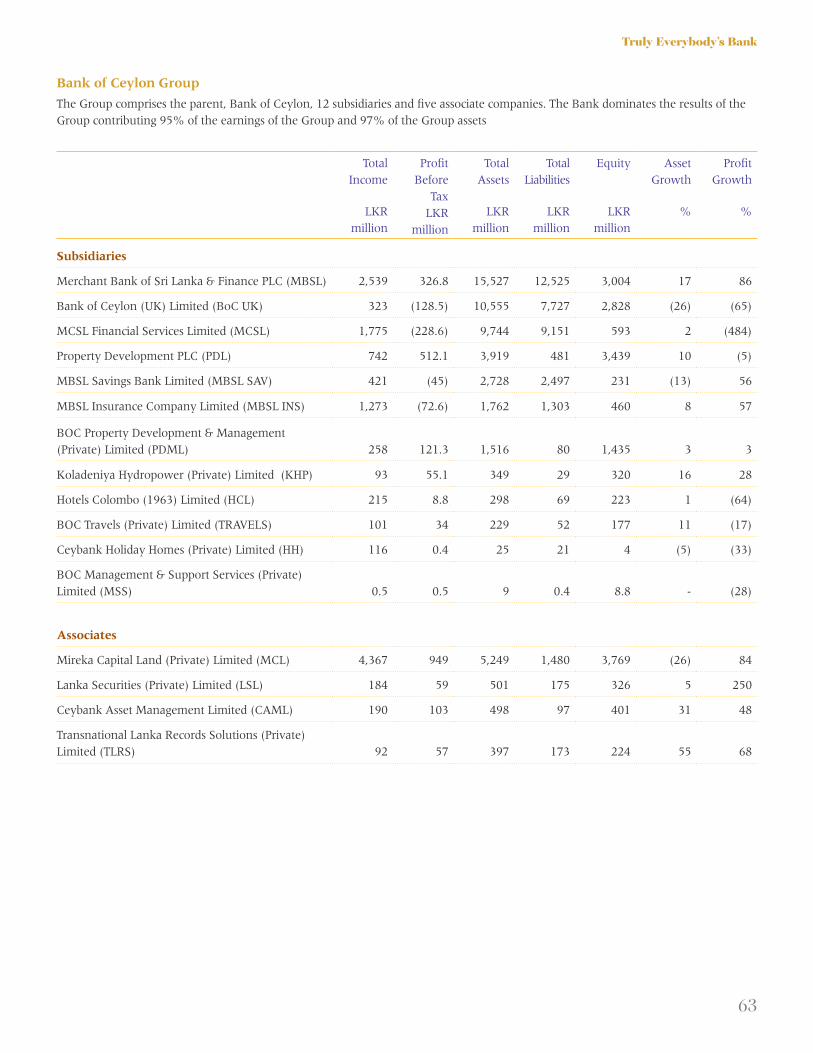
63
Truly Everybody’s Bank
Total
Income
LKR
million
Profit
Before
Tax
LKR
million
Total
Assets
LKR
million
Total
Liabilities
LKR
million
Equity
LKR
million
Asset
Growth
%
Profit
Growth
%
Subsidiaries
Merchant Bank of Sri Lanka & Finance PLC (MBSL) 2,539 326.8 15,527 12,525 3,004 17 86
Bank of Ceylon (UK) Limited (BoC UK) 323 (128.5) 10,555 7,727 2,828 (26) (65)
MCSL Financial Services Limited (MCSL) 1,775 (228.6) 9,744 9,151 593 2 (484)
Property Development PLC (PDL) 742 512.1 3,919 481 3,439 10 (5)
MBSL Savings Bank Limited (MBSL SAV) 421 (45) 2,728 2,497 231 (13) 56
MBSL Insurance Company Limited (MBSL INS) 1,273 (72.6) 1,762 1,303 460 8 57
BOC Property Development & Management
(Private) Limited (PDML) 258 121.3 1,516 80 1,435 3 3
KoladeniyaHydropower(Private)Limited(KHP) 93 55.1 349 29 320 16 28
HotelsColombo(1963)Limited(HCL) 215 8.8 298 69 223 1 (64)
BOC Travels (Private) Limited (TRAVELS) 101 34 229 52 177 11 (17)
CeybankHolidayHomes(Private)Limited(HH) 116 0.4 25 21 4 (5) (33)
BOC Management & Support Services (Private)
Limited (MSS) 0.5 0.5 9 0.4 8.8 - (28)
Associates
Mireka Capital Land (Private) Limited (MCL) 4,367 949 5,249 1,480 3,769 (26) 84
Lanka Securities (Private) Limited (LSL) 184 59 501 175 326 5 250
Ceybank Asset Management Limited (CAML) 190 103 498 97 401 31 48
Transnational Lanka Records Solutions (Private)
Limited (TLRS) 92 57 397 173 224 55 68
Bank of Ceylon Group
The Group comprises the parent, Bank of Ceylon, 12 subsidiaries and five associate companies. The Bank dominates the results of the
Group contributing 95% of the earnings of the Group and 97% of the Group assets

64
BANK OF CEYLON . Annual Report 2014
Management Discussion and Analysis
Group Structure
Bank of Ceylon
Subsidiaries
BoC UK 100%
KHP95.55%
HH100%
MCSL 80.09%
MBSL INS
60.68%
MBSL SAV
54.25%
PDL 95.55%
HCL99.99%
MSS 100%
PDML 100%
TRAVELS 100%
MBSL 72.14%
100%
42.86%
42.86%
14.28%
50.11%
41.56%
84.12%
75.2%
20.92%
20%
Associates
CAML 43.36%
SDL 41.67%*
TLRS 24.69%
MCL 40%
LSL 40.92%
* Southern Development Financial Company
Limited (SDL) is not in operation.

65
Truly Everybody’s Bank
Core Areas of Operation
Bank of Ceylon is a penetrative mass bank focussing on delivering imaginative financial services to individuals, corporates, Government
and other institutions. Our core areas of operations are:
Key Business
Lines
Description Significance
Retail Banking Caters to the transactional, investment and financing needs of over 11 million
customers ranging from high net worth individuals to infants in newly settled
villages through the largest banking network in the country.
35% of revenue
46% of loan portfolio
70% of deposits
Corporate and
Off-Shore Banking
Provides tailored solutions to medium and large institutions from the corporate
and public sector through an innovative range of products leveraging our
unparalleled correspondent banking and branch network.
28% of revenue
52% of loan portfolio
28% of deposits
65% of total borrowings
International and
Treasury Operations
Responsible for the fund management activities of the Bank and inter bank
transactions whilst managing exposure to exchange rate, interest rate and
liquidity risk arising from the normal activities of the Bank. It also provides
a range of services to customers including trading in treasury bills and bonds,
derivative products such as currency and interest rate swaps, forward exchange
contracts and investment activities. The division oversees the Bank’s foreign
subsidiary, foreign branches and correspondent banking relationships in 115
countries.
33% of revenue
75% of total investments
17% of total borrowings
Operating Environment
Global economic growth during 2014 was
weaker than expected remaining at 3.3%
in line with the growth rate for 2013 as
estimated by the International Monetary
Fund in its January 2015 update on the
World Economic Outlook. Advanced
economies grew at 1.8% and USA was
the only advanced economy to grow
stronger than expected during 2014 with
growth estimated at 2.4% supported by
declining unemployment which was a
key concern. Growth in the Euro Area
was a mere 0.8% which was weaker than
expected mainly due to weak investments
and declining inflation and inflation
expectations. Japan is technically in
recession from the third quarter of 2014
but is expected to rebound in 2015 due
to policy responses, a weaker yen and
lower oil prices. Emerging market and
developing economies growth continues
to account for much of the growth but
was also weaker than expected with
growth estimated to be 4.4% for 2014.
Developing Asian economies continue
to account for the bulk of the growth at
6.5% marginally lower than the 2013
growth rate of 6.6% due to declining
investment and lower growth in China.
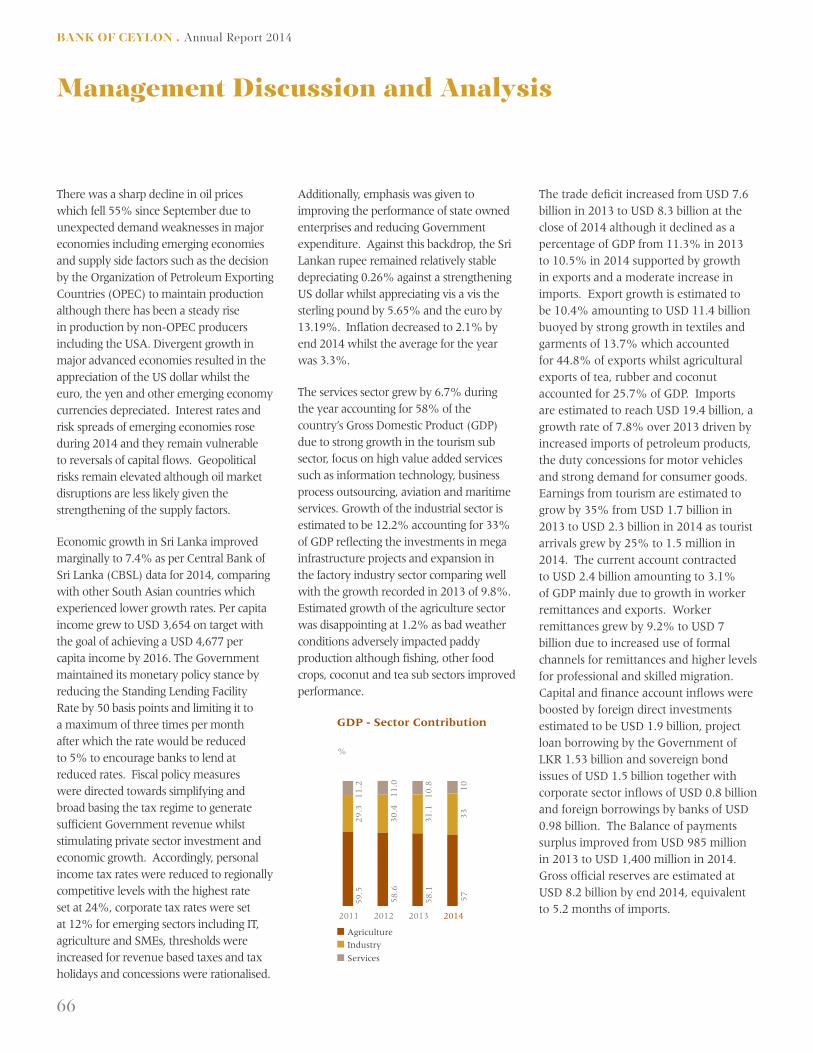
66
BANK OF CEYLON . Annual Report 2014
Management Discussion and Analysis
There was a sharp decline in oil prices
which fell 55% since September due to
unexpected demand weaknesses in major
economies including emerging economies
and supply side factors such as the decision
by the Organization of Petroleum Exporting
Countries (OPEC) to maintain production
although there has been a steady rise
in production by non-OPEC producers
including the USA. Divergent growth in
major advanced economies resulted in the
appreciation of the US dollar whilst the
euro, the yen and other emerging economy
currencies depreciated. Interest rates and
risk spreads of emerging economies rose
during 2014 and they remain vulnerable
to reversals of capital flows. Geopolitical
risks remain elevated although oil market
disruptions are less likely given the
strengthening of the supply factors.
Economic growth in Sri Lanka improved
marginally to 7.4% as per Central Bank of
Sri Lanka (CBSL) data for 2014, comparing
with other South Asian countries which
experienced lower growth rates. Per capita
income grew to USD 3,654 on target with
the goal of achieving a USD 4,677 per
capita income by 2016. The Government
maintained its monetary policy stance by
reducing the Standing Lending Facility
Rate by 50 basis points and limiting it to
a maximum of three times per month
after which the rate would be reduced
to 5% to encourage banks to lend at
reduced rates. Fiscal policy measures
were directed towards simplifying and
broad basing the tax regime to generate
sufficient Government revenue whilst
stimulating private sector investment and
economic growth. Accordingly, personal
income tax rates were reduced to regionally
competitive levels with the highest rate
set at 24%, corporate tax rates were set
at 12% for emerging sectors including IT,
agriculture and SMEs, thresholds were
increased for revenue based taxes and tax
holidays and concessions were rationalised.
Additionally, emphasis was given to
improving the performance of state owned
enterprises and reducing Government
expenditure. Against this backdrop, the Sri
Lankan rupee remained relatively stable
depreciating 0.26% against a strengthening
US dollar whilst appreciating vis a vis the
sterling pound by 5.65% and the euro by
13.19%. Inflation decreased to 2.1% by
end 2014 whilst the average for the year
was 3.3%.
The services sector grew by 6.7% during
the year accounting for 58% of the
country’s Gross Domestic Product (GDP)
due to strong growth in the tourism sub
sector, focus on high value added services
such as information technology, business
process outsourcing, aviation and maritime
services. Growth of the industrial sector is
estimated to be 12.2% accounting for 33%
of GDP reflecting the investments in mega
infrastructure projects and expansion in
the factory industry sector comparing well
with the growth recorded in 2013 of 9.8%.
Estimated growth of the agriculture sector
was disappointing at 1.2% as bad weather
conditions adversely impacted paddy
production although fishing, other food
crops, coconut and tea sub sectors improved
performance.
GDP - Sector Contribution
%
29.3
59.5
11.2
30.4
5
8.6
11.0
31.1
5
8.1
10.8
33
57
10
Agriculture
Industry
Services
2011 2012 2013 2014
The trade deficit increased from USD 7.6
billion in 2013 to USD 8.3 billion at the
close of 2014 although it declined as a
percentage of GDP from 11.3% in 2013
to 10.5% in 2014 supported by growth
in exports and a moderate increase in
imports. Export growth is estimated to
be 10.4% amounting to USD 11.4 billion
buoyed by strong growth in textiles and
garments of 13.7% which accounted
for 44.8% of exports whilst agricultural
exports of tea, rubber and coconut
accounted for 25.7% of GDP. Imports
are estimated to reach USD 19.4 billion, a
growth rate of 7.8% over 2013 driven by
increased imports of petroleum products,
the duty concessions for motor vehicles
and strong demand for consumer goods.
Earnings from tourism are estimated to
grow by 35% from USD 1.7 billion in
2013 to USD 2.3 billion in 2014 as tourist
arrivals grew by 25% to 1.5 million in
2014. The current account contracted
to USD 2.4 billion amounting to 3.1%
of GDP mainly due to growth in worker
remittances and exports. Worker
remittances grew by 9.2% to USD 7
billion due to increased use of formal
channels for remittances and higher levels
for professional and skilled migration.
Capital and finance account inflows were
boosted by foreign direct investments
estimated to be USD 1.9 billion, project
loan borrowing by the Government of
LKR 1.53 billion and sovereign bond
issues of USD 1.5 billion together with
corporate sector inflows of USD 0.8 billion
and foreign borrowings by banks of USD
0.98 billion. The Balance of payments
surplus improved from USD 985 million
in 2013 to USD 1,400 million in 2014.
Gross official reserves are estimated at
USD 8.2 billion by end 2014, equivalent
to 5.2 months of imports.
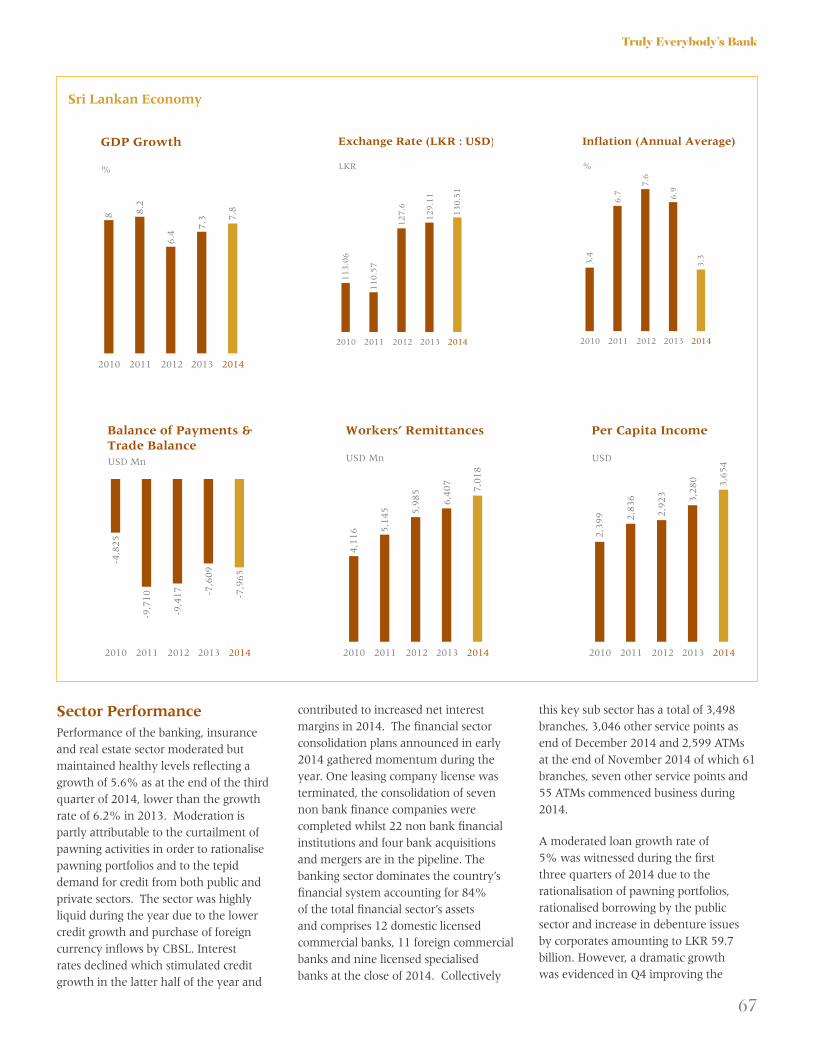
67
Truly Everybody’s Bank
Sri Lankan Economy
2010 2011 2012 2013 2014
GDP Growth
%
8 8.2
6.4
7.3 7
.8
2010 2011 2012 2013 2014
Exchange Rate (LKR : USD)
LKR
113.0
6
110.5
7
127.6
129.1
1
130.5
1
2010 2011 2012 2013 2014
Inflation (Annual Average)
%
3.4
6.7
7.6
6.9
3.3
2010 2011 2012 2013 2014
Balance of Payments &
Trade Balance
USD Mn
-4,8
25
-9,7
10
-9,4
17 -7
,609
-7,9
65
2010 2011 2012 2013 2014
Workers’ Remittances
USD Mn
4,1
16 5
,14
5 5,9
85
6,4
07
7,0
18
2010 2011 2012 2013 2014
Per Capita Income
USD
2,3
99 2,8
36
2,9
23
3,2
80 3,6
54
Sector Performance
Performance of the banking, insurance
and real estate sector moderated but
maintained healthy levels reflecting a
growth of 5.6% as at the end of the third
quarter of 2014, lower than the growth
rate of 6.2% in 2013. Moderation is
partly attributable to the curtailment of
pawning activities in order to rationalise
pawning portfolios and to the tepid
demand for credit from both public and
private sectors. The sector was highly
liquid during the year due to the lower
credit growth and purchase of foreign
currency inflows by CBSL. Interest
rates declined which stimulated credit
growth in the latter half of the year and
contributed to increased net interest
margins in 2014. The financial sector
consolidation plans announced in early
2014 gathered momentum during the
year. One leasing company license was
terminated, the consolidation of seven
non bank finance companies were
completed whilst 22 non bank financial
institutions and four bank acquisitions
and mergers are in the pipeline. The
banking sector dominates the country’s
financial system accounting for 84%
of the total financial sector’s assets
and comprises 12 domestic licensed
commercial banks, 11 foreign commercial
banks and nine licensed specialised
banks at the close of 2014. Collectively
this key sub sector has a total of 3,498
branches, 3,046 other service points as
end of December 2014 and 2,599 ATMs
at the end of November 2014 of which 61
branches, seven other service points and
55 ATMs commenced business during
2014.
A moderated loan growth rate of
5% was witnessed during the first
three quarters of 2014 due to the
rationalisation of pawning portfolios,
rationalised borrowing by the public
sector and increase in debenture issues
by corporates amounting to LKR 59.7
billion.However,adramaticgrowth
was evidenced in Q4 improving the

68
BANK OF CEYLON . Annual Report 2014
Management Discussion and Analysis
annual average growth to 14% against
8.8% in 2013. Total asset growth was
17% up to November 2014 mainly
driven by growth in liquid assets and
treasury instruments which moderated
towards the last quarter of 2014. Overall
asset quality and levels of provisioning
improved as the sector had significant
levels of provisions in the previous years
and had consequently strengthened credit
sanctioning and monitoring processes.
Deposit growth moderated to 12.4%
in 2014 due to declining interest rates
and high levels of liquidity. The sector
increased its borrowings through both
foreign currency borrowings and issue of
debentures.
Earnings of the banking sector increased
due to declining rates coupled together
with the maturity mismatches which
resulted in increased Net Interest Margins
(NIM). Increased proportions of current
and savings accounts in the deposit mix
also favourably impacted to the NIM.
Focus on cost to income ratios resulted in
operational efficiencies for customers and
higher productivity for banks. Fee based
income declined overall due to intense
price competition to attract trade volumes
witnessed in both exports and imports
and offset the favourable impact from
increased remittances. The sector raised
foreign currency borrowings of USD 1.59
billion during the year. The banking
sector remains well capitalised with core
capital adequacy ratio (Tier I) at 13.1%
and the total capital adequacy ratio
(Tier II) at 15.6% a marginal decrease
from 13.7% and 16.3% respectively
comparing to 2013.
The Central Bank has issued a number
of directives during the year covering
a range of topics, including financial
reporting, corporate governance, issuance
of foreign currency notes, lending rates
and risk management.
Asset Composition
LKR Bn
1,9
75
1
,10
0
2,6
01
1,0
80
3,1
49
1
,24
1
3,4
27
1,7
19
3,8
95
47
5 57
1 70
8 79
6 1,1
24
1
,95
3
Investment
Loans and Advances
Other Assets
2010 2011 2012 2013 2014
2010 2011 2012 2013 2014
Branch Density
Bank branches per
100,000 population
11.4
5
12
.46
13.3
8
13.6
3
13.7
7
Banking sector soundness indicators
%
2011 2012 2013 2014
Total Capital Adequacy Ratio - (Tier II) 16.0 16.4 16.3 15.6
Core Capital Adequacy Ratio - (Tier I) 14.4 14.7 13.7 13.1
Liquidity Ratio 26.8 26.6 31.9 32.2
Branch Density by Province*
Province November 2014
Density Rank
Western 21.18 2
Southern 16.62 4
Sabaragamuwa 13.66 8
North Western 13.12 9
Central 14.49 7
Uva 14.7 6
North Central 16.14 5
Eastern 16.82 3
Northern 21.66 1
* Bank branches per 100,000
population
Liabilities
LKR Bn
50
72
,586
635
3,0
73
80
43
,625
1,0
15
4,1
70
1,4
48
29
5 371
43
6
49
0
569
4,6
87
Deposits
Borrowings
Equity & Reserves
2010 2011 2012 2013 2014

69
Truly Everybody’s Bank
2010 2011 2012 2013 2014
CAR and Liquidity Ratio
%
16
.23
1.1
26
.81
6.0
26
.61
6.4
31
.91
6.3
32
.21
5.6
CAR
Liquidity Ratio
2010 2011 2012 2013 2014
ROAE & ROAA
%2.7
22.0
19.8
2.4
20.3
2.4
16.0
1.9
16.5
2.0
ROAE
ROAA
Strategy
As a state owned bank, our role always
focussed on being the catalyst for
development in the country. It is a
multi-faceted role as it means that we
need to be relevant to the under banked
populations for their socio economic
progress, large corporates who drive
economic growth through private
enterprise and to the public sector
institutions engaging in provision of
facilities throughout the island.
A nostalgic review of our performance
over the 75 years reveals how BoC has
touched lives, often being the first bank in
a village that is now a town and the first
bank for many entrepreneurs who are
large corporates today.
Strategy for 2014 was also stakeholder
focussed in line with BoC’s mission
and aligned to the country’s goal of
increasing per capita income to USD
4,677 by 2016. The Bank will leverage
competitive strengths which include
market leadership in the financial services
sector, a motivated and inspired team,
an unparalleled reach across and within
country borders, the most valued brand
in the country and a technology platform
to drive innovation and shape the way Sri
Lankans bank.
Customers Employees
• Inclusivegrowth
• Focusoncustomerconvenience
• Comprehensiveproductrange
• FinancialSecurity
• Talentattraction
• Learninganddevelopment
• Rewardandrecognition
• Postretirementbeneits
Government and RegulatorsOwners/Investors Community
• Goodgovernance
• Compliancewithregulatory
requirements
• SustainableGrowthand
Profitability
• Safeguardassetqualityand
soundness of the Bank
• Facilitatinginancialtransactions
within and across borders
• Facilitatesocioeconomicprogress
in our communities
• Upholdandnurtureourcultural
heritage and values
• Minimizeimpactonenvironment
• Focusingongeneralwealth
Strategy for 2014 was also stakeholder focussed in line with BoC’s mission and aligned to the country’s goal of increasing per capita income to USD 4,677 by 2016.

70
BANK OF CEYLON . Annual Report 2014
Management Discussion and Analysis
Financial Review
Bank of Ceylon as the largest Sri Lankan
bank proved once again that it is a giant
that can sail well in stormy seas; by
recording the highest ever profit of the
Bank’s history at LKR 20.3 billion, during
a year full of challenges. A glance at the
Bank’s past performances furthers the
impression, since we have consistently
posted sound results that are above the
industry averages as well as our own
past performances. Thus, Bank of Ceylon
has been an apt benchmark for the Sri
Lankan banking industry over the years,
constantly raising the industrial bar of
performance. As at the end of the period
under review, we had the ownership of
the industrial highs in terms of not only
profit but also of total assets, loans and
advances and deposits. Bank of Ceylon’s
business strategy of maintaining a strong
financial position to optimize the profit
generation is discussed further in this
report.
A snapshot of our numbers as compared
to the previous year is tabulated below.
2014 was a mixed year for the banking
sector with growth moderating due to
low credit demand, modest growth in
trade volumes and a moderation of the
economic growth rate whilst earnings
were bolstered by declining rates which
enhanced net interest margins. Bank of
Ceylon has leveraged its key strengths
such as its single borrower limit, customer
base and footprint to facilitate growth
together with its customers.
Assets
Total assets of the Bank grew by 11% to
LKR 1.3 trillion, maintaining the Bank’s
position as the largest financial institution
in Sri Lanka and accounting for 20% of
the industry’s loans and advances.
Gross loans and advances to customers
represent 59% of total assets of the
Bank. Given the challenging operating
environment, the impact of the declining
pawning portfolio and settlement of short
term loans granted just prior to 2013
year end, the Bank grew its loan book
marginally by 3%. Pawning declined by
around 42% due to conversion of auction
rejected pawning articles to gold stocks,
which have been marked to market.
Personal loans, leasing, housing loans,
term loans and overdraft contributed the
most to growth.
2010 2011 2012 2013 2014
Gross Loans
LKR Bn
38
2
562
71
5 755
77
8
Growth was driven by a concerted
sales effort from corporate and retail
banking divisions based on a client
focussed strategy. Corporate banking
division contributed the most to growth
through financing infrastructure projects
and increased trade activities during
the year. Following the drive for SME
lending in line with national priorities,
contribution from retail banking division
was substantial as well. At end 2014, the
corporate portfolio accounted for 52%
of total advances whilst retail portfolio
accounted for 46% and overseas branches
accounted for the balance 2%.
Net loans and advances stood at LKR 741
billion which is stated after adjustments
for foreseeable losses as per Sri Lanka
Accounting Standards (LKASs) and Sri
Lanka Financial Reporting Standards
(SLFRSs). The portfolio illustrates a
healthy balance between the private
sector and the public sector and remains
well diversified.
Description 2014
LKR million
2013
LKR million
Change
LKR million
Change %
Pre-tax profits 20,291 15,709 4,582 29.2
Total assets 1,329,020 1,193,581 135,439 11.3
Gross loans and
advances 777,505 755,385 22,120 2.9
Deposits 933,966 842,070 91,896 10.9

71
Truly Everybody’s Bank
Composition of
Loan Portfolio
LKR Bn
85
53
13
65
9
15
61
02
17
81
01
18
1
24
4
36
7
45
7 47
6
47
21
25
Direct Government
State Owned Enterprises
Private Sector
2010 2011 2012 2013 2014
Asset growth was mainly driven
by treasury managed portfolios as
weak demand for credit necessitated
investment of funds in alternative assets
on a temporary basis due to excess
liquidity which is reflected in the 164%
increment of reverse repo balances.
Financial investments held to maturity
accounted for 16% of assets consisting of
Government treasury bills and bonds.
Impairment Provision on Loans
and Advances
The impairment provision increased from
LKR 30.1 billion in 2013 to LKR 36.2
billion in 2014 showing a 20% increase.
However,theBankwasabletoreducethe
non performing advances (NPA) by 9%
from previous year which was defined as
per CBSL guidelines.
Provision Coverage
2014 2013
LKR million LKR million
NPA+Interestreceivable 41,228 44,238
Impairment provision 36,157 30,053
Coverage 88% 68%
The increase in impairment provision
made as per SLFRSs shows the Bank’s
prudential aspect on maintaining
adequate level of provisioning, compliant
with local and international standards.
The decline in gold prices since 2012,
continued to impact the pawning
portfolio which has been marked
tomarket.However,theNPAratio
improved from 4.3% at end 2013, to
3.8% by end 2014 as a result of devolving
gold articles to the Bank. Despite the
pressure, the Bank continued its trend
of maintaining a gross NPA ratio below
the industry average due to strengthened
credit appraisal and post disbursement
monitoring.
2012 2013 2014
Impairment Provision
LKR Mn
13
,97
8
21
,92
2
26
,01
9
8,9
70
8,1
31 1
0,1
38
Collective
Individual
Deposits
BoC is the market leader in deposits
with a market share of 20%. The Bank
engaged in a savings mobilisation
campaign during the early part of the
year, to increase the low cost fund base
and improve the proportion of current
and savings account balances (CASA) to
Deposit Composition
LKR Bn
28
0
30
2
29
8
31
9
24
4 28
7
39
5
52
3
53
14
03
CASA
Time
2010 2011 2012 2013 2014
total deposits. Thus CASA improved to
43.2% from 37.9%, above the industry
average of 39%, accounting for 22% of
banking sector CASA. Leveraging on the
confidence instilled by its state ownership
and brand franchise, market position and
extensive branch network, this growth
was achieved in the midst of institutional
depositors diverting part of their funds
to debt instruments to secure more
stability in their portfolio returns. Foreign
currency deposits account for 24% of
total deposits, sourced mainly from
remittances channelled through BoC by
migrant workers. Further, repricing of
time deposits at lower rate helped the
Bank to achieve a favourable deposit mix.
These factors combined ,BoC enjoyed a
relatively lower cost of fund.
CASA improved to 43.2% from 37.9%, above the industry average of 39%

72
BANK OF CEYLON . Annual Report 2014
2010 2011 2012 2013 2014
CASA
%
53.4
51.3
43.0
37.9
43.2
Borrowings and Debt Securities
Borrowings and debt securities increased
during the year mainly on account of
issuance of a debenture and funds raised
through securities sold under repurchase
agreements. The Bank raised LKR 8
billion in September 2014, through
this issue of listed, rated, unsecured,
subordinated, redeemable debentures
with five and eight year tenures. The
proceeds were used to strengthen BoC’s
Tier II capital base and reduce asset and
liability maturity mismatches arising
from long term infrastructure project
financing, whilst taking advantage of the
comparatively low interest rates in the
market.
Profitability
A strong balanced performance resulted
in a 29% growth of profit before tax
to LKR 20.3 billion boosted by positive
growth across key sources of income and
cost efficiencies. Despite the pressure on
interest margins common to the industry,
BoC was able to grow its net interest
income by 3.5% leveraging on the
improved CASA ratio and the re-pricing
of term deposits at lower interest rates.
Net gains from financial investments
contributed to the increase in profit by
LKR 2.9 billion and accounted for 15%
of non interest income in 2014. The gain
from foreign exchange grew by 20% from
LKR 2.7 billion to LKR 3.2 billion mainly
due to the growth in trade volumes.
The fact that all of the Bank’s sources
of income, grew positively in these
challenging times, proves that the Bank
has a robust revenue generating portfolio,
strengthening its resilience in challenging
times.
2010 2011 2012 2013 2014
Profit Before Tax and
After Tax
LKR Bn
10
.16
.4
16
.511
.9
19
.814
.4 15.7
12
.1
20
.31
3.6
PBT
PAT
Net Interest Income (NII)
Interest income is the largest contributor
to the Bank’s total revenue, accounting
for 85% of total income. Despite a
marginal growth in loans and advances,
interest income decreased by 6% from
LKR 114.9 billion in 2013 to LKR 107.4
billion in 2014 due to interest rates
recording a declining trend given the
monetary policy measures adopted by the
CBSL since December 2012. Similarly,
interest expense decreased by 11% to
LKR 68.9 billion in 2014 compared to
LKR 77.7 billion in 2013, despite an
increase in deposits and borrowings.
Consequently the NII which contributed
68% (76 % in 2013) to the total
operating income increased by 3% to LKR
38.5 billion in 2014 from LKR 37.1 billion
in 2013 . Net interest margin (NIM)
narrowed to 3% from 3.3% in 2013.
2010 2011 2012 2013 2014
NIM
%
3.1 3.2
3.7
3.3
3.0
Fee and Commission Income
Fee and commission income which
represented 16% of the total operating
income recorded a significant increase of
42% to LKR 9.2 billion over the previous
year driven by growth of business
volumes in trade services. Growth in fees
was focused on issue of guarantees and
bills acceptance. Our market leadership
together with the expert knowledge in
trade finance ensured a steady stream of
recurring fee based income.
Management Discussion and Analysis
Financial Review

73
Truly Everybody’s Bank
2010 2011 2012 2013 2014
Fee and Commission Income
LKR Bn
6.0
6.7
7.3
6.5
9.2
Net Gains from Trading
Net gains from trading contributed
9% to total operating income growth.
This included income earned from
purchase and sale of foreign exchange
and financial instruments including
government securities, corporate debt
and equities and dividend income earned
from investments in equities. The most
significant earnings were derived from
trade of foreign exchange being LKR 3.2
billion contributing 66% to the total net
gains from trading. Foreign exchange
income grew by 20% mainly due to the
growth in trade volumes.
2010 2011 2012 2013 2014
Exchange Earnings
LKR Mn
409
1,5
92
3,9
86
2,6
81 3
,22
3
Net Gains from Financial
Investments
Net gains from financial investments
contributed 5% to total operating income
and grew by 577% to LKR 2.9 billion.
This mainly includes gains from disposal
of financial instruments, dividend income
and gains through treasury bills and
bonds.
Other Operating Income
Other operating income mainly comprises
service income, dividend income and
other miscellaneous sources of income.
Service income being LKR 1.3 billion is
the most significant item of which LKR
714 million amounts to loan processing
charges.
Impairment Charges for Loans
and Advances
Impairment charges on loans increased
marginally by 4% to LKR 7.2 billion
against previous year attributed to an
increase in individual impairment. The
provision for collective impairment
declined by 33% reflecting significant
improvement in the quality of the
portfolio and initiatives taken to
rationalise the pawning portfolio.
Operating Expenses
Consequent to improved operational
efficiencies, total operating expenses
recorded a mere growth of 2% against
the comparative year in contrast
to the growth of 13% in 2013. The
main contributor for this increase is
the provision made on gold stocks. In
the event the effect of this provision,
which amounts to LKR 562 million is
excluded, it can be construed that the
Bank’s operating expenses have been
controlled to the level as that of the
comparative year. Personnel expenses
comprise of 57% of Bank’s operating
expenses. Apart from personnel expenses,
operating expenses also include office
administration and establishment
expenses and fixed asset maintenance
expenses which are incurred in line with
equipping branches with technology
development and upgrading of branches
to a consistent standard as per the
corporate goals.
2010 2011 2012 2013 2014
Operating Expenses
LKR Mn
16,0
77
16,9
55 20,8
70
23,6
82
24,2
59
Shareholders’ Funds
Shareholders’ funds increased
significantly from LKR 57.7 billion to
LKR 74.8 billion. Stated capital increased
by LKR 5 billion to LKR 10 billion,
subsequent to the capital infusion by
the shareholder, the Government of Sri
Lanka, strengthening the Tier I capital
adequacy ratio to 9.5% as at year end.
The statutory requirement is 5%.
Dividends
The Board of BoC, in consultation with
the Ministry of Finance and Planning has
paid a dividend of LKR 6.8 billion taking
into account the investment plans and
capital plans of the Bank.
2010 2011 2012 2013 2014
Dividend Paid
LKR Mn
3,0
96 3,9
10
5,3
46
5,3
46 6
,84
6

74
BANK OF CEYLON . Annual Report 2014
Performance Ratios
The performance ratios provide valuable
testimony to the balanced performance
delivered in 2014 with key indicators
moving positively.
2014
%
2013
%
Cost to Income Ratio 44.0 49.1
Return on Average
Assets (ROAA)
1.6 1.4
Return on Average
Equity (ROAE)
20.5 22.2
2010 2011 2012 2013 2014
ROAA
%
1.6
2.1
2.1
1.4
1.6
2010 2011 2012 2013 2014
ROAE
%
24.0
33.5
31.2
22.2
20.5
2010 2011 2012 2013 2014
CAR
%
13.7
10
.9
11
.5
12.1
13.6
2010 2011 2012 2013 2014
Cost to Income
%
57
.3
51.1
42.7 49
.1
44
.0
The cost to income ratio improved from
49.1% to 44% compared to previous
year due to effective cost management
strategies coupled with improved income.
We are aggressively pursuing strategies
to further improve cost to income ratio
such as leveraging on technology to
reduce costs, engaging in business process
re-engineering to improve efficiency and
investing more in our staff to develop a
highly productive team. ROAA moved
in tandem reflecting the success of this
aggressive strategy and effective asset and
liability management. ROAE declined
marginally due to the LKR 5 billion
capital infusion made in December 2014.
Management Discussion and Analysis
Financial Review
1966Medical benefit scheme for
employees was established
1967Staff training school
established to uplift
employees’ skills
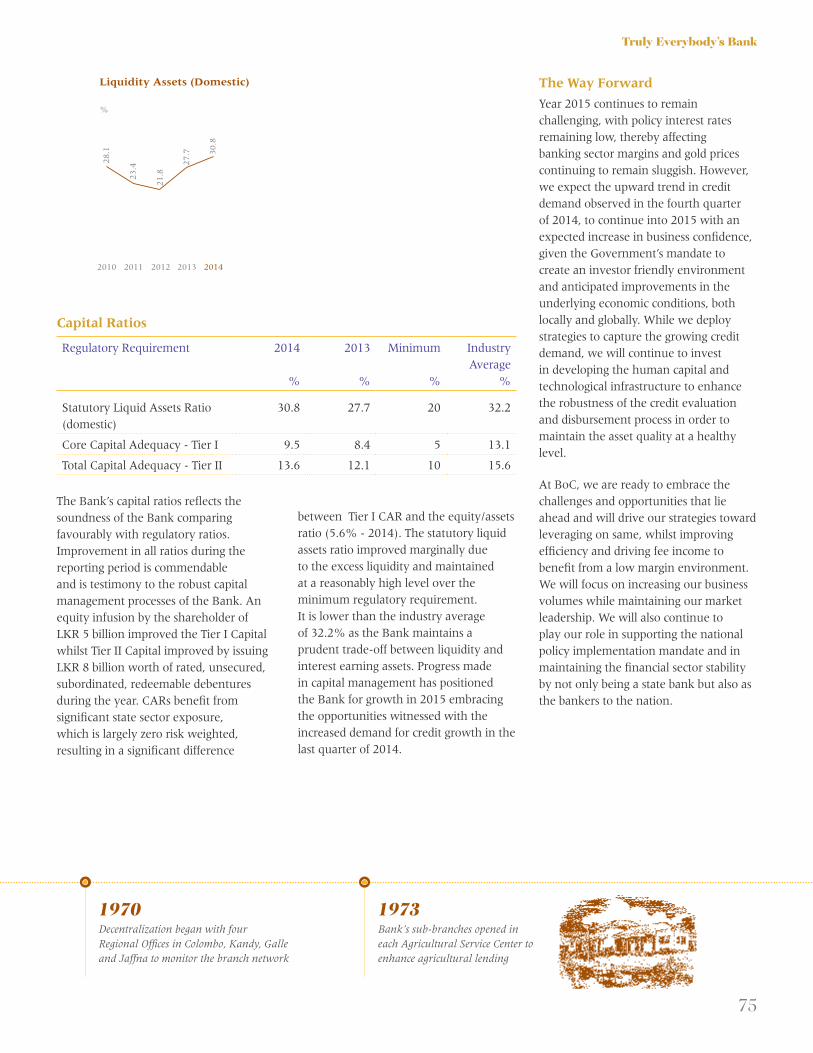
75
Truly Everybody’s Bank
Capital Ratios
Regulatory Requirement 2014
%
2013
%
Minimum
%
Industry
Average
%
Statutory Liquid Assets Ratio
(domestic)
30.8 27.7 20 32.2
Core Capital Adequacy - Tier I 9.5 8.4 5 13.1
Total Capital Adequacy - Tier II 13.6 12.1 10 15.6
The Bank’s capital ratios reflects the
soundness of the Bank comparing
favourably with regulatory ratios.
Improvement in all ratios during the
reporting period is commendable
and is testimony to the robust capital
management processes of the Bank. An
equity infusion by the shareholder of
LKR 5 billion improved the Tier I Capital
whilst Tier II Capital improved by issuing
LKR 8 billion worth of rated, unsecured,
subordinated, redeemable debentures
during the year. CARs benefit from
significant state sector exposure,
which is largely zero risk weighted,
resulting in a significant difference
between Tier I CAR and the equity/assets
ratio (5.6% - 2014). The statutory liquid
assets ratio improved marginally due
to the excess liquidity and maintained
at a reasonably high level over the
minimum regulatory requirement.
It is lower than the industry average
of 32.2% as the Bank maintains a
prudent trade-off between liquidity and
interest earning assets. Progress made
in capital management has positioned
the Bank for growth in 2015 embracing
the opportunities witnessed with the
increased demand for credit growth in the
last quarter of 2014.
2010 2011 2012 2013 2014
Liquidity Assets (Domestic)
%28.1
23.4
21.8
27.7
30.8
The Way Forward
Year 2015 continues to remain
challenging, with policy interest rates
remaining low, thereby affecting
banking sector margins and gold prices
continuingtoremainsluggish.However,
we expect the upward trend in credit
demand observed in the fourth quarter
of 2014, to continue into 2015 with an
expected increase in business confidence,
given the Government’s mandate to
create an investor friendly environment
and anticipated improvements in the
underlying economic conditions, both
locally and globally. While we deploy
strategies to capture the growing credit
demand, we will continue to invest
in developing the human capital and
technological infrastructure to enhance
the robustness of the credit evaluation
and disbursement process in order to
maintain the asset quality at a healthy
level.
At BoC, we are ready to embrace the
challenges and opportunities that lie
ahead and will drive our strategies toward
leveraging on same, whilst improving
efficiency and driving fee income to
benefit from a low margin environment.
We will focus on increasing our business
volumes while maintaining our market
leadership. We will also continue to
play our role in supporting the national
policy implementation mandate and in
maintaining the financial sector stability
by not only being a state bank but also as
the bankers to the nation.
1970 1973Decentralization began with four
Regional Offices in Colombo, Kandy, Galle
and Jaffna to monitor the branch network
Bank’s sub-branches opened in
each Agricultural Service Center to
enhance agricultural lending

76
BANK OF CEYLON . Annual Report 2014
Management Discussion and Analysis
The operational review provides a narrative on the performance of our key business segments.
The divisional performance of the Bank by core area of operation is given
below and this report will cover the performance of each division.
Operating
Profit Before
Taxes
LKR million
Assets
LKR million
Retail Banking 3,206 389,085
Corporate Banking 6,245 411,206
International and Treasury 11,903 469,534
Retail Banking
The Retail Banking business of Bank of
Ceylon is relevant across all customer
segments island- wide supporting their
wealth creation process in investment,
financing and transactional needs. This
key division that has the largest customer
base of the Bank, is driven by a passion
for customer service excellence, financial
inclusion and facilitating customer
convenience.
Growth through customer focus
and inclusive banking
Extensive reach
BoC has one of the largest customer reach
in the industry of over 2,500 customer
touch points, including the common ATM
facility. Apart from offering our customers
convenience in banking, the Bank offers
access to finance to the under-served and
rural communities.
2010 2011 2012 2013 2014
30
1 340
30
9
390
31
5
43
4
558
504
563
54
0
Retail Branches
ATM
Operational Review
1978Non Resident Foreign Currency
(NRFC) deposits scheme
introduced
1979Foreign Currency Banking
Unit set up to undertake
off-shore operations

77
Truly Everybody’s Bank
28% of customers have maintained accounts at the Bank for over 10 years.
Strong customer base
Retail banking unit serves over 11 million
savings customers, more than half the
Sri Lankan population of over 20 million.
Reinforcing our relationship as a total
solution provider, the Bank cross sells
products and brick walls customers, whilst
maximising its wallet share.
2011 2012 2013 2014
No. of Customers Mn
9.9 10.3 10.7
11.3
Comprehensive product portfolio
Retail Banking builds customer loyalty
by offering a wide product portfolio that
is affordable and relevant to the evolving
needs of its diverse customer base. 28%
of customers have maintained accounts at
the Bank for over 10 years.
Investment in technology
The division is committed to offer better
service to its customers by investing in
technology. Initiatives launched during
the year include :
• SMSalertsforATMtransactionsand
online fund transfers
• Upgradeofsystemsconnecting
exchange houses
• Newbankingapplication,VisaMoney
• Upgradeofcorebankingsystemwith
enhanced security features
• NewAnti-MoneyLaundering(AML)
system
The retail banking division dominates
the industry as market leader, growing
its loan base to over LKR 353 billion in
2014 and contributed 27% to the total
assets of the Bank, 45% to gross lending,
52% to net interest income and generated
Geographical Distribution of Deposits
Western Province
Southern Province
Central Province
Northern Province
Eastern Province
North Central Province
North Western Province
Sabaragamuwa Province
Uva Province
51%
8%
9%
6%
3%
5%
8%
7% 3%
36% of the total fee based income of the
Bank through marketing of trade services,
guarantees, remittances and credit and
debit cards. It contributes the most to the
Bank’s deposit base accounting for 68%
of total deposits.
The division serves the consumers, Small
and Medium Enterprises (SME) and
micro finance markets. BoC is committed
towards financial inclusion and has been
the first bank in villages that have now
become towns playing a key role in their
socio economic progress. 96% of the total
deposit base comprise of deposit accounts
which are less than LKR 100,000
indicating the Bank’s reach to low and
middle income earning individuals.
Further, 47% of deposits were accounted
for by branches outside the Western
Province, the most economically
developed, in which province the main
seaport, main airport and capital city are
located. Retail Banking strategies are
aligned with national priorities and the
division is well positioned to support
it’s clients’ growth as they seek to move
beyond their traditional markets whether
they move to another province or
overseas.
1979 1979Celebrated 40th Anniversary and
service awards for employees who
completed 25 years in the Bank
are introduced
An in-house journal
was introduced to
coincide with the
celebrations

78
BANK OF CEYLON . Annual Report 2014
Management Discussion and Analysis
Performance
Key Performance Indicators 2014 2013 change %
Financial
Deposits (LKR million) 642,515 540,241 19
Loans and advances (LKR million) 353,062 347,117 2
Net interest income (LKR million) 20,114 24,892 (19)
Fee and commission (LKR million) 3,350 2,355 42
Operating profit before taxes (LKR million) 3,206 7,644 (58)
Non Performing Advance (NPA) Ratio (%) 5.4 6.6 1.2 bp
Environmental
Environment friendly lending (LKR million) 175 >1,200 (85)
Social
Micro finance beneficiaries 108,487 97,985 11
SME Centers 15 14 1
Deposits
Growth in retail banking deposits was
19% despite the challenging market
environment of declining interest rates
attributed to the monetary policy adopted
by the Central Bank of Sri Lanka and
availability of alternative investment
options offering a better return. The
division continued to exceed industry
growth rates by leveraging on the
extensive branch network, strong brand
franchise and launch of innovative new
products.
Growth was mainly from savings
accounts, as the division sought to
generate sustainable low cost funds
for the Bank. A marketing campaign
to mobilize accounts targeting minors
and senior citizens was launched in
early 2014, in which market segments
withdrawals are minimal. Abhimana, a
new pension scheme was particularly
successful with over 21,000 accounts
being opened within five months of
launch, raising LKR 159 million funds at
year end. BoC understood and fulfilled
the market need with a comprehensive
pension scheme. Consequently, the
retail banking division’s ratio of current
Operational Review - Retail Banking
Growth in retail banking deposits was 19% despite the challenging market environment of declining interest rates
2010 2011 2012 2013 2014
Retail Banking Deposit Growth
Vs Industry Deposit Growth
%
16
23
19
18
18
9
16
15
19
12
Retail
Industry
1980Set up the
Computer Division
1980The authorised share capital
raised from LKR 120 million
to LKR 1,000 million

79
Truly Everybody’s Bank
and savings accounts to total deposits,
commonly termed as CASA, improved
from 48% in 2013 to 53% in 2014,
comfortably higher than the industry
benchmark of 39%. Foreign currency
deposits supported by migrant employee
remittance flows, accounted for 13 % of
total retail deposits.
2010 2011 2012 2013 2014
CASA - Retail Segment
%
60.0
57.4
52.1
48.4 53.4
Loans and Advances
Gross loans and advances grew
moderately by 2% to LKR 353 billion,
attributed to poor credit demand and
contraction in the pawning portfolio
following the decline in international
gold prices. Key products contributing
to growth were term loans, leasing and
housing.
The NPA ratio improved during the year
from 6.6% to 5.4%, stemming from the
improvement in quality of the pawning
portfolio.
Pawning
Gold prices remained low and the Bank
continued to control the growth of the
pawning portfolio whilst addressing
the deterioration in asset quality. BoC
adopted a prudential method to address
troublesome non performing pawning
advances by transferring LKR 19 billion
worth of long outstanding, auction
rejected pawning articles to gold in hand
stock by acquiring such articles to the
Bank. Exposure to pawning has reduced
from 20% of the Bank’s total loans and
advances in 2012 to 9% in 2014.
Small and Medium Enterprises
(SME)
SMEs account for 80-90 per cent of all
enterprises in Sri Lanka. Developing
the SME sector is therefore, a national
priority given their role in sustaining the
country’s economic growth.
Stemming from the Bank’s link to
the Government, BoC is passionately
committed towards the SMEs, offering
traditional long/short-term lending
instruments including trade finance,
term loans and overdraft through more
specific tailor-made products to finance
their identified needs, on flexible and
affordable terms. The Bank participates
in credit lines to lend at concessionary
rates. The main sectors assisted include
agriculture, fishing, animal husbandry,
plantations including tea, rubber and
coconut, factory modernisations,
infrastructure development, tourism and
education.
Apart from providing access to finance,
branches and SME centers conduct
workshops on technical skills, finance
literacy and business knowledge to assist
SMEs to remain commercially viable.
During the year, nine entrepreneurial
skill development programmes and one
dedicated staff training programme have
been conducted by the SME unit covering
931 individuals.
Despite the significant opportunity for
lending, SMEs remain underserved,
considering the inherent risks involved
in lending to this market segment. Bank
of Ceylon understands these risks better
given its island wide positioning through
branches and 15 SME centers and close
engagement with the communities,
facilitating effective mitigation of same.
The Division leverages on the strong
competencies of its dedicated relationship
officers who are well experienced, trained
and knowledgeable in SME lending.
Micro Finance
BoC contributes further towards the
socio economic development of the
rural community by developing micro
entrepreneurs and making financial
services available, accessible and
affordable to them.
Theinitialstepinthe‘BOCMITHURU’
micro finance programme, is to establish
small groups of five to eight members
who adopt the articles of association/
constitution and by-laws recommended
by the Bank. They are encouraged
to cultivate a savings habit, resolve
hardships and motivate and inspire each
other to improve their socio economic
status. These groups have a formal agenda
for their meetings and also learn cash
management, how to lead, organise and
manage micro enterprises. The groups are
mentored by a BoC Officer who attends
their meetings regularly and monitors
1981 1985Fully fledged branch
opened in Male
New 32 storey Head Office opened
at Echelon square, the tallest
building in Sri Lanka at the time

80
BANK OF CEYLON . Annual Report 2014
Management Discussion and Analysis
their progress. Once the small groups
are established and function credibly,
a few groups band together and form
development societies through which the
Bank is able to actively engage with the
communities and finance, monitor and
guide their progress. Currently there are
191 such societies consisting of 20,809
small groups and benefiting over 100,000
individuals. During the year we disbursed
LKR 168 million to 1,609 groups.
Leasing
The leasing portfolio was affected by
intense competition from other banks
and financial institutions, weak demand
for automobiles given the increased
import duties and asset quality challenges
common to the industry. Despite the
challenges, the retail banking division
recorded a growth of 45% to LKR 27.1
billion, following successful targeted
marketing campaigns, automation of
Operational Review - Retail Banking
leasing process, speedy delivery and
competitive interest rates and align with
direct sales agents. NPA was managed
prudently during the year and the ratio
declined from 5.9% to 4.5% by year end.
Housing Loans
Housingloansgrewby14%toLKR37.5
billion mainly attributed to competitive
pricing, prompt approval of loans and
flexible terms to suit the repayment
capacity. Tie ups with major housing
projects at concessionary interest also
contributed to growth.
The Bank foresees potential in the
housing loan market segment. To secure
greater market share, BoC is reviewing
the processes and systems to improve
customer experience. Regional housing
loan centres will be set up in each district
to expedite credit evaluation and the
turnaround time is expected to reduce to
15 days. Two pilot centers have already
been set up in Peliyagoda and Wellawatta.
Islamic Banking
The Bank’s An-Noor’ Islamic Banking
Unit, was launched in 2009 as an
alternative form of banking in line with
the Bank’s strategy of financial inclusivity.
Key products and services include deposit
products and personal financial services.
All islamic banking products have been
computerized to enable efficient service
delivery to BoC’s islamic banking clients
and dedicated team has been developed
to drive the growth of the unit through
the Bank’s branch network.
Geographical Distribution of
Micro Finance Portfolio
Western Province
Southern Province
Central Province
Northern Province
Eastern Province
North Central Province
North Western Province
Sabaragamuwa Province
Uva Province
7%6%
5%
28%
14%
20%
3%
2%
15%
Multi-Channel Delivery
Technology plays a key role in banking
today, providing cost effective and
convenient solutions to customers to
access products and services in their
own time and privacy. BoC, readily
invests in technology and pursue a
multi-channel distribution strategy, to
complement existing ‘brick and mortar’
branch network. Maintaining traditional
branch network is also important to
the Bank’s financial inclusivity policy,
to serve customers who may not be as
technologically savvy.
Payment Cards
With cards gaining prominence in the
world as economies move towards
increasing volumes of cashless
transactions, use of BoC’s Debit Cards is
aggressively promoted. Increased volumes
of card transactions has the potential
to reduce branch costs and improve
profitability.
To encourage customers to migrate to
ATMs, the Bank issued pre-printed debit
cards immediately on account opening,
waived off card issuance fees and cash
withdrawal fees from BoC ATMs and
appointed dedicated Customer Service
Officers at branches in the outstations, to
assist and train customers in completing
basic transactions. Free SMS alerts for
ATM transactions were also launched
this year, building customer confidence
in the system. The Division’s efforts
were rewarded with the number of ATM
transactions growing by 18% during the
year.

81
Truly Everybody’s Bank
779,671 debit cards were issued during
the year, increasing the portfolio to
2,427,161 cards at year end. 608 new
merchants were added for Point of
Sale (POS) transactions, offering debit
card customers access to more than
3,988 merchants in Sri Lanka. Targeted
marketing campaigns were successful in
growing the number of active cards and
debit card purchases contributing to the
growth in fee income.
BoC was the first bank to introduce VISA
credit cards to Sri Lanka, 25 years ago.
Today, competition is fierce with credit
card service providers offering discounts
and other benefits to gain market share.
The Bank consciously limited its portfolio
growth to avoid asset quality challenges
seenintheindustry.However,BoCsees
potential for growth and has invested in
an enhanced security system, disaster
recovery system and data mining system
to support future growth in volumes.
Electronic Banking
Online banking and mobile banking
have gathered momentum in Sri Lanka,
with the growing popularity of modern
telecommunication technology and 100%
mobile penetration in the country. Given
the ease of transacting for customers
and the potential to enhance fee based
income, the Bank focused on increasing
its competitive position in this fast
growing segment.
Mobile cash products can be used by
account holders to make utility bill
payments or remit money island wide
and are delivered via a secure SMS
service.
The Bank invested in system upgrades
and new applications to improve service
quality for secure and fast online fund
transfers. BoC’s systems connecting
exchange houses were upgraded to
provide real time updating of accounts
whilst SMS notifications are now being
provided within 15 minutes of fund
transfer, offering beneficiaries speedy
confirmation on the repatriation and
receipt of funds.
The web page was re-designed to be
more user friendly and the core system
was upgraded with enhanced security
features to monitor and combat the threat
of cyber crime. A new online application,
Visa Money Transfer was successfully
launched offering real time transfer of
funds through Visa International.
Way Forward
Competition in deposit mobilisation is
expected to intensify in 2015 as demand
for credit increases with policy measures
taken to stimulate private sector growth.
Given the intensified competition,
pressure on net interest margins is likely
to continue.
Retail banking will focus on increasing fee
based income by growing trade volumes
to SME and encouraging customers to
use multi-channel delivery systems as an
alternative to branch banking. Growth
of the retail banking credit portfolio will
improve with increased demand from
pawning (under controlled measures),
housing and SME. Supporting the growth
of SME will continue to be a high priority,
which aligns well with national priorities.
Market leadership will be maintained
by offering products with strong value
propositions that appeal to diverse
customer base and create a positive
customer experience.
2011 2012 2013 2014
Credit Card Transactions
Nos 000’
1,0
80
1,1
26
1,2
36
1,2
71
2011 2012 2013 2014
Debit Card Transactions
Nos 000’
22,3
08
26,9
16 32,4
26
34,4
77
2011 2012 2013 2014
Internet Banking
Transactions
Nos ‘000
9
258
631
986

82
BANK OF CEYLON . Annual Report 2014
Management Discussion and Analysis
Operational Review - Corporate and Offshore Banking
Driving growth through deeper relationships
Largest single borrower
limit
Capacity to support the growth ambitions of our
corporate customers plus financial expertise.LKR 24.0 billion
Deeper relationships A high level of customer engagement has increased
the average number of products used by a customer
deepening the relationships.
2014
231,060 customers
2013
283,614 customers
Increased market share
of import business
volumes
Network of 759 correspondent banks and 100 exchange
houses. Build customer confidence and ease to trade
internationally.
2014
27%2013
24%Low NPA Our prudent risk management system is entwined in
aggressive loan growth strategy<2.1% NPA ratio
Below industry average of 4.2%
The corporate banking division
commands an asset base of over LKR
411 billon, serving customers in both the
private and public sector. Our customers
typically access a range of products that
cater to their long, medium and short
term financing and transactional needs
which are supported by well scattered
networks of branches and correspondent
banks. Corporate banking has been at
the lead of national development since
inception with unmatched expertise
across all industry sectors.
The corporate banking segment
comprises of corporate lending, lending
to Government and State Owned
Enterprises, trade finance and offshore
banking. Products and services include
term lending, cash management,
investment services, project finance,
working capital finance and dealing in
foreign currency transactions.
Performance
Key Performance Indicators 2014
LKR
million
2013
LKR
million
change
%
Financial
Loans and advances 393,099 374,453 4.1
Net interest income 8,074 7,252 11.3
Fee and commission income 4,089 3,028 35.0
Operating profit before taxes 6,245 6,497 (3.9)
NPA ratio 2.1% 2.1% -
1988Entered into the Electronic
Banking Era with the introduction
of Automated Teller Machines and
Cheque Guarantee Cards
1989Issued the first Credit Card in
Sri Lanka to celebrate the golden
jubilee of the Bank in collaboration
with VISA international

83
Truly Everybody’s Bank
The corporate banking portfolio
contributes 31% to the total assets,
21% to net interest income and 26% to
operating profit before taxes of the Bank.
It is also the largest contributor to loans
and advances and fee based income of
the Bank accounting for 52% and 44%
respectively.
The division’s strategic priorities
were growth and profitability whilst
maintaining asset quality through
deeper customer relationships, service
excellence and increased transaction
volumes. 2014 proved to be a challenging
year for corporate banking due to the
continued low demand for credit by the
private sector exacerbated by the ease
of access to foreign financial markets
and development of local corporate debt
and equity markets. Additionally, the
state owned enterprises also rationalised
borrowings in line with their improved
profitability further reducing overall
demand for credit. The excess liquidity
in the market increased pressure on net
interest margin as the Bank adjusted its
interest downward in line with market
lending rates. Despite these challenges
corporate banking was able to record
a growth of 4% in loans and advances
mainly due to funding of large ticket
deals in infrastructure development
and services. We leveraged our single
borrower limit and skilful relationship
management to successfully negotiate
and execute these deals in an intensely
competitive market.
Pressure on interest rates resulted the
interest income to decline by 9% to
LKR 31,242 million, despite the growth
inportfolio.However,thelageffecton
the decrease in interest rate on loans,
attributed to an increase in interest
income. Fee and commission income
also increased during the year by 35%
resulting through commission from trade
products such as letters of credit and
guarantees.
2010 2011 2012 2013 2014
Gross Loans and AdvancesLKR Bn
38
22
09
562
27
3
715
35
8
755
37
7
778
393
Total Bank
Corporate division
The corporate banking portfolio remains
well diversified. Loan concentration has
improved during the year compared to
the previous year. Whilst the division
strived to acquire new customers in
the competitive environment through
continuous marketing efforts, it focused
on a strategy of increasing the share of
wallet of existing customers. Staff of
the division is the critical success factor
in efforts to strengthen and maintain
excellent client service.
Corporate banking continued to
maintain a healthy loan portfolio as
evident from the low NPA ratio of 2.1%,
which is below the industry average of
4.2%. Apart from the Bank’s internal
controls and systems that support timely
monitoring and management of the
portfolio, the improvement in NPA ratio
was achieved by leveraging on the strong
relationship management skills of the
staff, the in-depth knowledge of our
customer base and assessment of their
ability to meet economic challenges and
the offer of structured financial solutions
that supports the customer’s business
models.
Due to declining interest rates, deposits
declinedby3%.Howeverthedivision
was able to fund as much as 63% of its
own asset portfolio through deposits.
Leveraging on extensive branch network,
large corporates with distributor networks
were offered tailored solutions which also
facilitated the growth of their business
partners enabling mutual growth that
reached communities throughout
the country. This also increased the
opportunities for cross sell to retail
banking and facilitated improving the
CASA mix for the Bank and growing
SME portfolio whilst improving the
supply chain management of the
customer.
1989 1991Restructuring process commenced with
International Consultants to keep up
with the environmental changes
Changed the recruitment process, moving
into a district based selection procedure

84
BANK OF CEYLON . Annual Report 2014
Off Shore Banking (FCBU)
The FCBU gross loan base increased by
3% from USD 1,329.1 million to USD
1,375.5 million during the year despite
the relaxation of exchange controls
allowing easier access to foreign currency
loans for local companies and reducing
the demand for FCBU loans.
FCBU operations are impacted by intense
competition for trade finance business
from the foreign banks domiciled locally,
which banks directly utilized their own
low cost fund base to offer lower rates to
attract higher business volumes. Thus,
the unit differentiates itself through its
customized service offering appropriate,
timely, well-structured financial solutions
under one roof.
Trade services
BoC is the market leader in trade services.
Our competitive advantage is the wide
and well established network of over
759 correspondent banks and expert
knowledge in trade finance. The Bank
continuously invest in people, offering
training in new areas of international
trade and documentation, to be geared
to cater to the various working capital
needs of customers stemming from their
alignment to the strategy of the country.
Products are appropriately priced to
capture higher volumes of business.
Although trade transactions are centrally
processed, the Bank is able to capture
trade finance volumes initiated in the
provinces, through its document imaging
system expanded to 50 branches in 2014,
which system is fully integrated into the
Bank trade system.
A key strategy is to drive the changes
needed to strengthen trade capability and
capturing increased trade flows in line
with the economic growth of the country.
Initiatives being implemented under
the “Wenesa” programme to improve
effectiveness and efficiency of delivery
such as faster turnaround times.
Sri Lanka’s earnings from exports,
continued to perform well from last year,
growing 7% by 2014. Export growth was
mainly driven by textiles, garments, tea
and coconut exports and was attributed
to favourable economic developments
in the export destinations, continuous
improvement in domestic industries
with new technologies and overall
improvement in the macroeconomic
environment.
Management Discussion and Analysis
BoC is the market leader in trade services. Our competitive advantage is the wide and well established network of over 759 correspondent banks and expert knowledge in trade inance.
Operational Review - Corporate and Offshore Banking
1992Global RecognitionFirst Sri Lankan commercial bank to be ranked
among the best 200 banks in Asia and 1,000
banks in the world by “Banker” magazine.
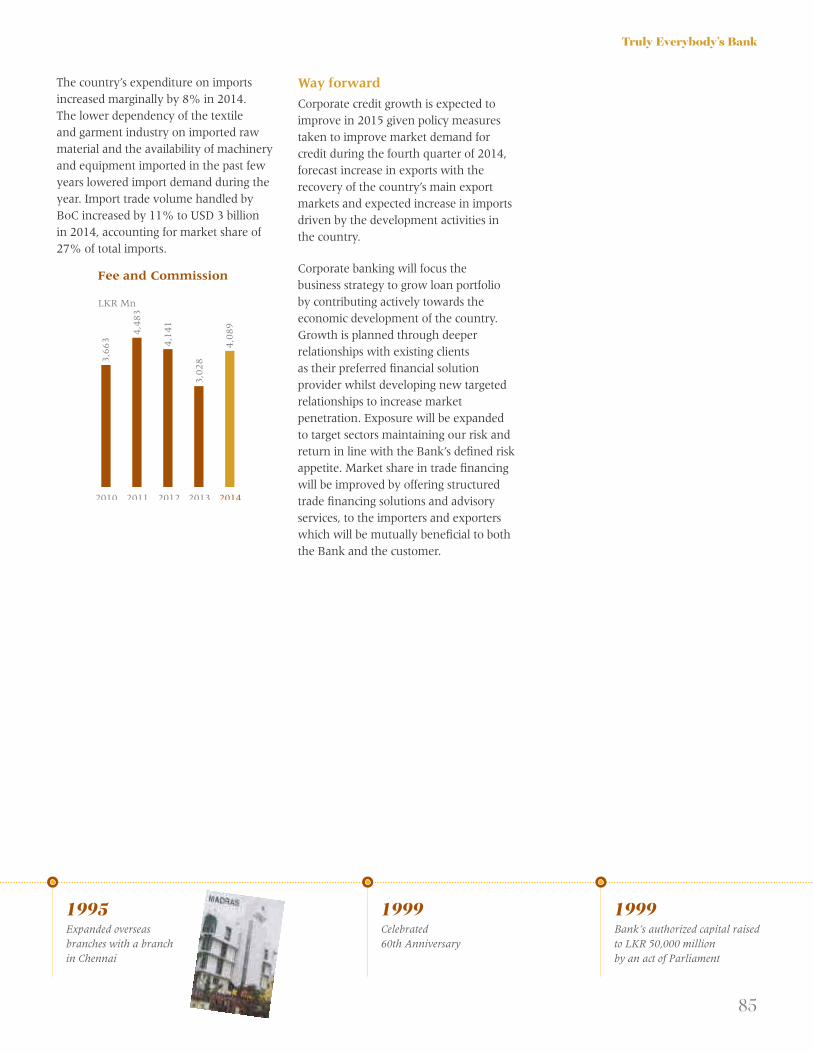
85
Truly Everybody’s Bank
The country’s expenditure on imports
increased marginally by 8% in 2014.
The lower dependency of the textile
and garment industry on imported raw
material and the availability of machinery
and equipment imported in the past few
years lowered import demand during the
year. Import trade volume handled by
BoC increased by 11% to USD 3 billion
in 2014, accounting for market share of
27% of total imports.
2010 2011 2012 2013 2014
Fee and Commission
LKR Mn
3,6
63
4,4
83
4,1
41
3,0
28
4,0
89
Way forward
Corporate credit growth is expected to
improve in 2015 given policy measures
taken to improve market demand for
credit during the fourth quarter of 2014,
forecast increase in exports with the
recovery of the country’s main export
markets and expected increase in imports
driven by the development activities in
the country.
Corporate banking will focus the
business strategy to grow loan portfolio
by contributing actively towards the
economic development of the country.
Growth is planned through deeper
relationships with existing clients
as their preferred financial solution
provider whilst developing new targeted
relationships to increase market
penetration. Exposure will be expanded
to target sectors maintaining our risk and
return in line with the Bank’s defined risk
appetite. Market share in trade financing
will be improved by offering structured
trade financing solutions and advisory
services, to the importers and exporters
which will be mutually beneficial to both
the Bank and the customer.
1999Bank’s authorized capital raised
to LKR 50,000 million
by an act of Parliament
1999Celebrated
60th Anniversary
1995Expanded overseas
branches with a branch
in Chennai

86
BANK OF CEYLON . Annual Report 2014
Management Discussion and Analysis
This division comprises of treasury, international, investment and overseas branches. Treasury is responsible for asset and liability
management, liquidity management, interest rate risk management, money market dealing, foreign exchange management, investment
in Government securities, equity trading, fund management, maintenance of reserve ratio, liquidity ratio and pricing of products.
Performance
2014
LKR million
2013
LKR million
Growth
%
Capital gains on sale of shares 2,788 (165) 1,790
Capital gains - Government securities 1,162 674 72
Exchange income 3,195 3,221 (1)
Dividends 858 713 20
Commission and fee income 993 789 26
Profit from overseas branches 1,537 1,283 20
The Bank structured irst ever USD-Rupee currency option allowing clients to hedge exchange rate risk
All key income sources have shown a
significant improvement compared to last
year.
Treasury engages in foreign currency
transactions on behalf of the customers
as well as the Bank. Treasury provides
services of trading in treasury bills and
bonds, derivative products such as
currency swaps, interest rate swaps,
forward exchange contracts, currency
options etc.
Interest rates were in downward trend
during the most part of the year, as
the Central Bank of Sri Lanka (CBSL)
pursued a relatively relaxed monetary
policy stance. In the beginning of the
year, the standing repurchase facility
where the CBSL absorbed overnight
excess liquidity from banking system
was renamed as Standing Deposit
Facility (SDF) and the standing reverse
repurchase facility where the Central
Bank injected overnight liquidity was
renamed as Standing Lending Facility
(SLF). Accordingly, SLF Rate was reduced
by 50 basis points to 8%, thereby
compressing the Standing Rate Corridor
to 150 basis points. In September 2014,
CBSL decided to limit the access for
banks to SDF of the Central Bank at the
6.50% to a maximum of three times per
calendar month, and any deposits at the
SDF window exceeding three times to be
accepted at a reduced interest rate of 5%.
This resulted in a drop in the interest rate
of repo market.
Operational Review - International, Treasury, Investment and Overseas Branches
2004Introduced International
Comprehensive Banking System (ICBS),
an online, centralized computer system

87
Truly Everybody’s Bank
The division operated in an environment of excess liquidity, low interest rates and a very competitive market.
Commercial banks’ lending and deposit
rates continued the downward pattern
throughout the year 2014. Monthly
Average Weighted Deposit Rate (AWDR)
declined to 6.20% from 9.37%, Average
Weighted Fixed Deposit Rate (AWFDR)
declined to 7.33% from 11.78% and
weekly Average Weighted Prime Lending
Rate (AWPLR) declined to 6.33% from
9.88% during the year.
Banks’ deposit base grew at a healthy
pace even in a low interest rate scenario.
The Asset and Liability Management
Committee (ALCO) decided to reduce
fixed deposit rates several times during
the year. Consequently the rupee
financial cost reduced from 9.9% to 6.9%
during 2014, continuing its downward
trend.
The division operated in an environment
of excess liquidity, low interest rates and a
very competitive market.
The Bank structured first ever USD-Rupee
currency option allowing clients to hedge
exchange rate risk with greater flexibility
on market rates going beyond the
traditional forward exchange contracts.
This is a first step in introducing derivative
financial instruments to the market
providing customers a wider choice in
managing risk.
The rupee appreciated during the early
part of the 2014 due to the large inflows
to the country. The value of the rupee
showed slight depreciation during the
latter part of the year but overall showed
less volatility during the year. USD/LKR
rate was depreciated only by 0.26%
during the year 2014.
Bank made an exchange income of LKR
3.2 billion for the year 2014.
Jan
Feb
Mar
Ap
r
May Jun
Jul
Au
gS
ep
Oct
No
vD
ec
Exchange Rate (USD:LKR)
13
0.7
6
13
1.0
11
30
.78
13
0.6
11
30
.51
13
0.3
61
30
.15
13
0.1
51
30
.31
13
1.0
1 13
1.5
1
13
1.5
1
2010 2011 2012 2013 2014
Exchange Income
L K R Mn
40
9
1,7
46
5,8
09
3,2
21
3,1
95
Bank’s liquidity position remained
healthy while managing the expansion
of the total assets of the Bank. The Bank
maintained its liquidity ratio above
the regulatory norm of 20% for both
domestic and foreign currency liabilities.
Liquid asset ratios as at 31 December
2014 for domestic and foreign banking
units were 30.8% and 25.9% respectively.
Significant part of the Bank’s funding base
comprises of customer deposits (76% of
the total funding mix). The total growth
of the balance sheet of LKR 135.4 billion
was mainly funded by deposits (LKR
91.9 billion) and borrowings (LKR 19.5
billion).
Treasury was successful in managing the
Bank’s excess liquidity position. Bank
used excess liquidity to generate US
Dollar funds by swapping two currencies
at cheaper rates. Further, the Bank
also invested in Government securities
and other financial instruments to ease
the excess liquidity in addition to loan
disbursements to the private sector.
2005Balance sheet reached LKR 300 billion,
largest asset base of any Sri Lankan
Bank at the time
2004Introduction of Bank of
Ceylon flag

88
BANK OF CEYLON . Annual Report 2014
Management Discussion and Analysis
We remain the market leader in NRFC deposits with a 35% market share despite intense competition from other Sri Lankan banks who have intensiied their overseas operations.
Operational Review - International, Treasury, Investment and Overseas Branches
International
International Division is responsible for
promotion of NRFC deposits, inward
remittances and correspondence banking
relationships. The Bank maintains
relationship with 100 exchange houses
and deploys 25 representatives abroad to
assist Sri Lankan migrant employees with
the remittance transactions covering 115
Countries.
Borrowing Mix
LKR Bn
Local Currency
Foreign Currency
2010 2011 2012 2013 2014
49
96
84
96
19
28
9
19
88
3
19
11
09
Deposit Mix
LKR Bn
Foreign Currency
Local Currency
2010 2011 2012 2013 2014
16
6
15
7
18
4
20
5
23
0
36
4 43
8
50
9
63
7
70
4
Funding Mix
LKR Bn
Deposits
Borrowings
2010 2011 2012 2013 2014
53
0
59
5
69
3
84
2
93
4
14
5 18
0
28
1
28
1 30
0
The NRFC/RFC/RNNFC portfolio growth
recorded an increase of 13% amounting
to USD 1,245 million. As the market
leader in NRFC deposits, our market share
marginally increased from 34.8% in 2013
to 35.1% in 2014 leveraging our overseas
network. Foreign currency deposits grew
at 10% from USD 1,575 million to USD
1,726 million.
We remain the market leader in NRFC
deposits with a 35% market share despite
intense competition from other Sri
Lankan banks who have intensified their
overseas operations.
2008Raised USD 21.6 million via
a private placement of 5 year
subordinate dollar debentures
2008Issued first ever listed,
subordinate, rupee debentures of
5 years raising LKR 4.2 billion
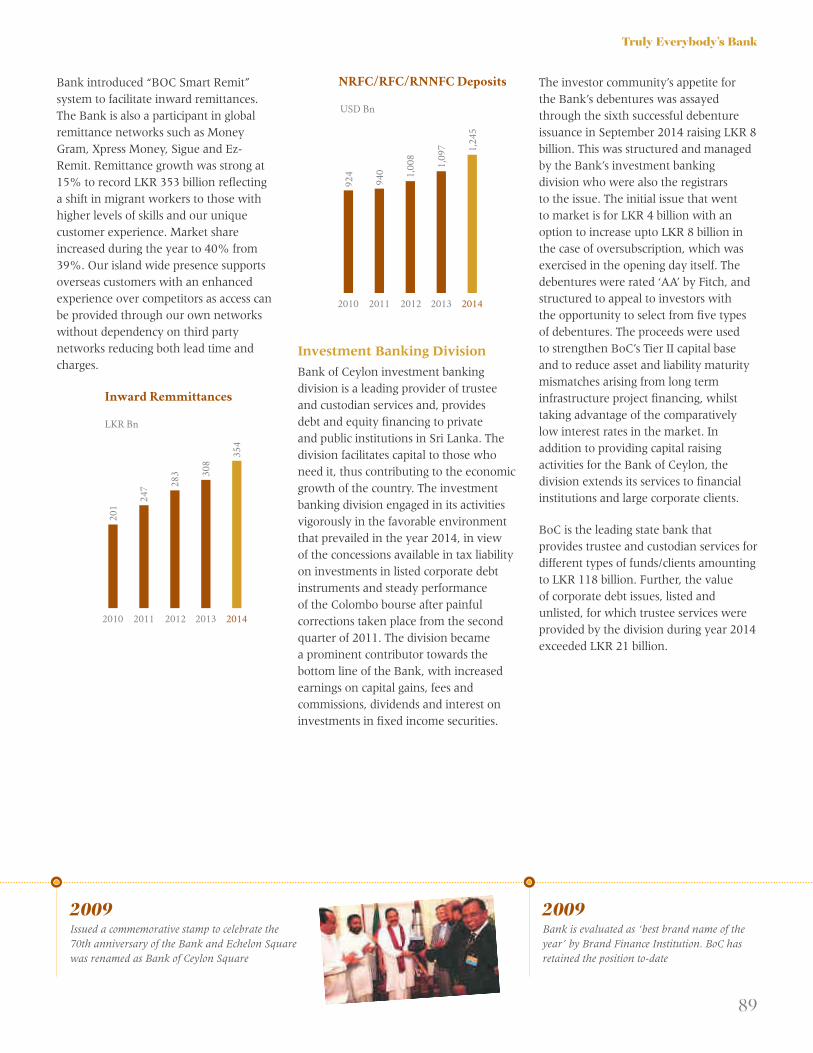
89
Truly Everybody’s Bank
Bank introduced “BOC Smart Remit”
system to facilitate inward remittances.
The Bank is also a participant in global
remittance networks such as Money
Gram, Xpress Money, Sigue and Ez-
Remit. Remittance growth was strong at
15% to record LKR 353 billion reflecting
a shift in migrant workers to those with
higher levels of skills and our unique
customer experience. Market share
increased during the year to 40% from
39%. Our island wide presence supports
overseas customers with an enhanced
experience over competitors as access can
be provided through our own networks
without dependency on third party
networks reducing both lead time and
charges.
2010 2011 2012 2013 2014
Inward Remmittances
LKR Bn
20
1
24
7 28
3 30
8
35
4
2010 2011 2012 2013 2014
NRFC/RFC/RNNFC Deposits
USD B n
92
4
94
0 1,0
08
1,0
97 1,2
45
Investment Banking Division
Bank of Ceylon investment banking
division is a leading provider of trustee
and custodian services and, provides
debt and equity financing to private
and public institutions in Sri Lanka. The
division facilitates capital to those who
need it, thus contributing to the economic
growth of the country. The investment
banking division engaged in its activities
vigorously in the favorable environment
that prevailed in the year 2014, in view
of the concessions available in tax liability
on investments in listed corporate debt
instruments and steady performance
of the Colombo bourse after painful
corrections taken place from the second
quarter of 2011. The division became
a prominent contributor towards the
bottom line of the Bank, with increased
earnings on capital gains, fees and
commissions, dividends and interest on
investments in fixed income securities.
The investor community’s appetite for
the Bank’s debentures was assayed
through the sixth successful debenture
issuance in September 2014 raising LKR 8
billion. This was structured and managed
by the Bank’s investment banking
division who were also the registrars
to the issue. The initial issue that went
to market is for LKR 4 billion with an
option to increase upto LKR 8 billion in
the case of oversubscription, which was
exercised in the opening day itself. The
debentures were rated ‘AA’ by Fitch, and
structured to appeal to investors with
the opportunity to select from five types
of debentures. The proceeds were used
to strengthen BoC’s Tier II capital base
and to reduce asset and liability maturity
mismatches arising from long term
infrastructure project financing, whilst
taking advantage of the comparatively
low interest rates in the market. In
addition to providing capital raising
activities for the Bank of Ceylon, the
division extends its services to financial
institutions and large corporate clients.
BoC is the leading state bank that
provides trustee and custodian services for
different types of funds/clients amounting
to LKR 118 billion. Further, the value
of corporate debt issues, listed and
unlisted, for which trustee services were
provided by the division during year 2014
exceeded LKR 21 billion.
2009Bank is evaluated as ‘best brand name of the
year’ by Brand Finance Institution. BoC has
retained the position to-date
2009Issued a commemorative stamp to celebrate the
70th anniversary of the Bank and Echelon Square
was renamed as Bank of Ceylon Square

90
BANK OF CEYLON . Annual Report 2014
Management Discussion and Analysis
Operational Review - International, Treasury, Investment and Overseas Branches
The Investment banking division
continues to make progress doubling the
profit in year 2014 compared with the
previous year. Bank intends to enhance
the product mix and invest in key growth
areas with the intention of continuing
and strengthening the performance of the
division.
Overseas Branches
Bank has three overseas branches located
in India, Maldives and Seychelles and
wholly owned subsidiary in UK. These
branches and subsidiary provide deposits,
advances, remittances, trade finance
facilities and treasury products etc.
Male branch and Chennai branch
operations were commenced in 1981
and 1995 respectively. Newly opened
Seychelles branch operation commenced
in January 2014. Seychelles is the first
branch of Bank of Ceylon on the African
continent and offers a wide range of
financial solutions including corporate,
retail, offshore and internet banking. The
branch was opened as a step forward
in fulfilling BoC’s strategic aspiration of
becoming Sri Lanka’s international bank,
to reach potential overseas markets. Two
foreign branches namely BoC Chennai
and BoC Male were able to attract more
corporate and retail customers during
the year 2014 leading to low cost of
funds. Chennai branch grew its loans
and advances portfolio by 37% and
Male branch grew its loans and advances
portfolio by 39%.
The performance of the two overseas
branches is as follows.
2010 2011 2012 2013 2014
Profit from Overseas Branches
LKR Mn
Chennai
Male
23
34
68
28
88
03
42
54
24
40
48
80
48
71
,05
5
Way Forward
Asset and liability management
continues to be the key focus of the
Treasury division and the Bank is well
positioned to take advantage of growth
opportunities in both investment products
and loan products. We expect a new
Treasury system and ALM system to be
implemented in 2015 further enhancing
our capabilities to monitor market risk
and funding risk and increasing our
ability to quickly respond to market
changes.
Initiatives have been launched to
expand our overseas agent networks
and remittance partnerships to support
the growth of remittances and foreign
currency deposits. We will also look to
new markets for growth opportunities
to ensure that our network growth
keeps pace with our ambitions providing
a strong competitive edge. Improving
the customer experience is necessary
for growth in this lucrative business
and initiatives have been planned for
implementation in 2015 to facilitate
new customer acquisition and retention
and growth of business with existing
customers.
Strengthening of equity and debt markets
provides increased opportunities for
investments and earnings from fee
based income by providing intermediary
services. The Bank is well positioned to
capture market share in this segment.
We will continue to build on our success
achieved this year to gain a greater
market share.
Bank expects the overseas market to
further consolidate on its position to
establish sustainable foreign currency
flow to the country and Bank. In view of
this, the Bank is exploring the possibilities
to open another branch in India.

91
Truly Everybody’s Bank
Facilitating the transformation of the Bank, IT is a key support department that impacts all aspects of our business. Like the
investment in people, IT also takes time to demonstrate tangible benefits and requires human action to maximise its utility. The results
discussed below relate mainly to bold investment decisions taken in previous years coupled with impeccable execution during project
implementation.
Technology driven Banking delivered. Anytime, Anywhere.
Electronic transaction volume
growth
A key indicator of success in IT
transformation is the increased volumes
of transaction using electronic channels.
We are encouraged by the growth we
have seen in this area and continue
to drive migration by enhancing the
customer experience and adding new
transactional products.
Smooth transition to new Core
Banking System
The transition to the new core banking
system will be completed by April 2015
providing a solid foundation for new
applications that will further enhance the
customer and employee experience. It is
the culmination of carefully sequenced
and coordinated activities impacting
almost every key business process.
2011 2012 2013 2014
ATM (Usage million)
Internet Banking (Usage thousands)
22
27
3234
986
631
258
9
Customer
convenience
Energy
Efficiency
Streamlining
business process
Quality
Assurance
14
Projects
Technology driven banking is a key
component of our strategy as it enables
scalable growth and exciting opportunities
to take banking to every Sri Lankan’s
home. IT also enables operational
efficiencies in terms of service lead times
which provide a competitive edge as it
enhances the customer experience. The
Bank’s internal controls, compliance
and risk management functions place
significant reliance on IT systems
necessitating upgrades to keep pace with
an increasingly complex operating and
regulatory environment. Consequently IT
is the nerve centre of the Bank managed
by an experienced and skilled talent
pool who are responsible for delivery
of this key strategic pillar. This year’s
results have been encouraging as we
completed 14 projects during the year
focusing customer convenience, driving
operational efficiencies and quality
assurance.
Delivering Customer Convenience
A 100% mobile penetration rate coupled
with rapidly increasing penetration rates
of smart phones and internet connections
creates a conducive environment for
rapid progress in delivering customer
convenience through electronic platforms.
Bank of Ceylon has a number of planned
initiatives in this regard and we discuss
below the more significant developments
completed during the year.
The Bank improved its internet banking
product by expanding the range of
services that can be facilitated through
the portal enabling customers to conduct
their transactions from their homes or
offices. The growing number of customers
registering for online banking and growth
in the volume of transactions observed
subsequent to the re-launch of the
product is encouraging. We expect the
trends observed to gather momentum as a
tech hungry generation Y demands more
services to be delivered via the internet at
increasing levels of sophistication.
Launch of the visa fast funds during the
year facilitated remittances in real time
from our agent network and exchange
houses in 115 countries, connecting
migrant workers with their families
through our island wide branch network.
This key development enables the Bank
to retain and grow its market share in
remittances.
Information Technology
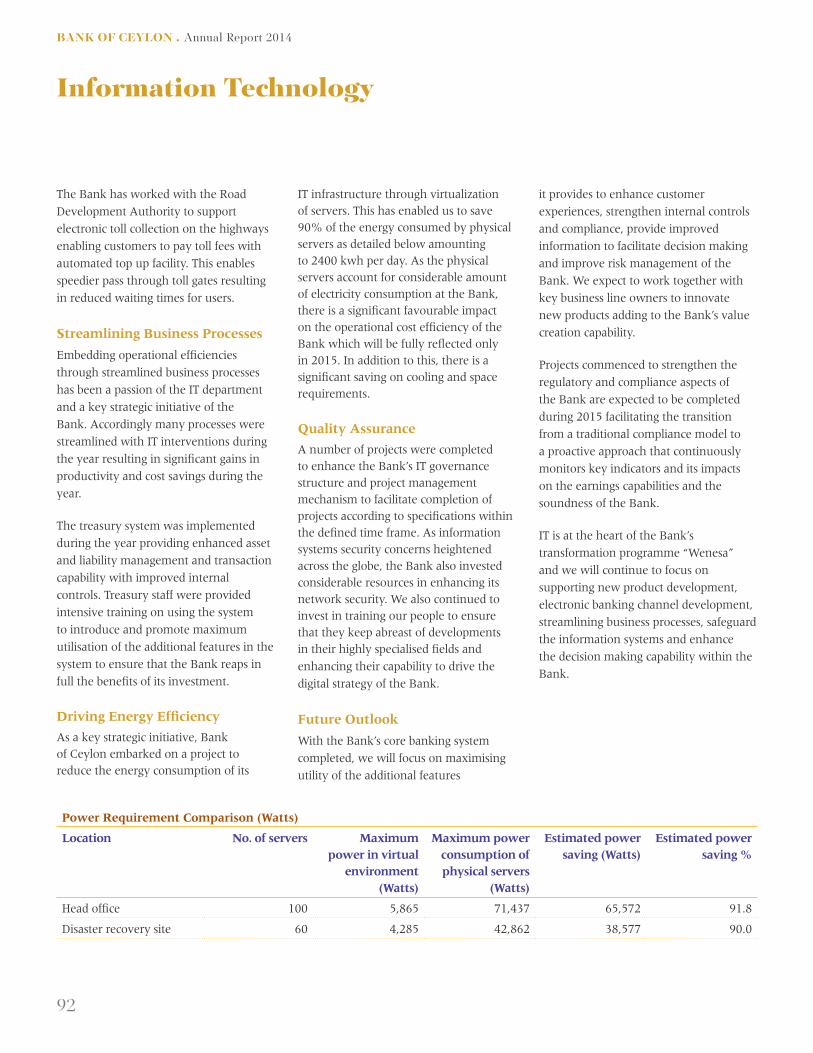
92
BANK OF CEYLON . Annual Report 2014
The Bank has worked with the Road
Development Authority to support
electronic toll collection on the highways
enabling customers to pay toll fees with
automated top up facility. This enables
speedier pass through toll gates resulting
in reduced waiting times for users.
Streamlining Business Processes
Embedding operational efficiencies
through streamlined business processes
has been a passion of the IT department
and a key strategic initiative of the
Bank. Accordingly many processes were
streamlined with IT interventions during
the year resulting in significant gains in
productivity and cost savings during the
year.
The treasury system was implemented
during the year providing enhanced asset
and liability management and transaction
capability with improved internal
controls. Treasury staff were provided
intensive training on using the system
to introduce and promote maximum
utilisation of the additional features in the
system to ensure that the Bank reaps in
full the benefits of its investment.
Driving Energy Efficiency
As a key strategic initiative, Bank
of Ceylon embarked on a project to
reduce the energy consumption of its
IT infrastructure through virtualization
of servers. This has enabled us to save
90% of the energy consumed by physical
servers as detailed below amounting
to 2400 kwh per day. As the physical
servers account for considerable amount
of electricity consumption at the Bank,
there is a significant favourable impact
on the operational cost efficiency of the
Bank which will be fully reflected only
in 2015. In addition to this, there is a
significant saving on cooling and space
requirements.
Quality Assurance
A number of projects were completed
to enhance the Bank’s IT governance
structure and project management
mechanism to facilitate completion of
projects according to specifications within
the defined time frame. As information
systems security concerns heightened
across the globe, the Bank also invested
considerable resources in enhancing its
network security. We also continued to
invest in training our people to ensure
that they keep abreast of developments
in their highly specialised fields and
enhancing their capability to drive the
digital strategy of the Bank.
Future Outlook
With the Bank’s core banking system
completed, we will focus on maximising
utility of the additional features
it provides to enhance customer
experiences, strengthen internal controls
and compliance, provide improved
information to facilitate decision making
and improve risk management of the
Bank. We expect to work together with
key business line owners to innovate
new products adding to the Bank’s value
creation capability.
Projects commenced to strengthen the
regulatory and compliance aspects of
the Bank are expected to be completed
during 2015 facilitating the transition
from a traditional compliance model to
a proactive approach that continuously
monitors key indicators and its impacts
on the earnings capabilities and the
soundness of the Bank.
IT is at the heart of the Bank’s
transformation programme “Wenesa”
and we will continue to focus on
supporting new product development,
electronic banking channel development,
streamlining business processes, safeguard
the information systems and enhance
the decision making capability within the
Bank.
Power Requirement Comparison (Watts)
Location No. of servers Maximum
power in virtual
environment
(Watts)
Maximum power
consumption of
physical servers
(Watts)
Estimated power
saving (Watts)
Estimated power
saving %
Headofice 100 5,865 71,437 65,572 91.8
Disaster recovery site 60 4,285 42,862 38,577 90.0
Information Technology

93
Truly Everybody’s Bank
Employee Report
Driving Productivity by
Developing People
Developing Talent
We invested LKR 244.5 million on
training and developing our people in
2014 through our dedicated training
facilities and at external and overseas
locations achieving a coverage of more
than 50% of our team. Our consistent
and comprehensive talent development
programmes enabled us to promote 920
people during 2014, a ratification of our
commitment to developing our people as
the majority of our team join the Bank at
entry level.
2010 2011 2012 2013 2014
Training Expenses
LKR Mn
14
6 156
19
6
23
6
24
5
Employee Productivity
Employee productivity has been a
key focus and initiatives such as 5S
implementation and team rewards
have driven general productivity and
achievement of focussed goals. Profit per
employee has increased by 18% from
LKR 1.36 million to LKR 1.61 million in
Bank of Ceylon as one of the leading employers in the financial services sector has a comprehensive talent management programme
which has consistently produced leaders of high calibre who have grown the Bank to its current position, a fitting testimony to its scope
and effectiveness.
2014 as many employees retired during
the year and productivity initiatives
facilitated the increased workload to be
absorbed by the remaining cadre.
2010 2011 2012 2013 2014
7,7
23
8,7
95
14,1
38
14
,349
14
,75
4
Revenue Per Employee
Profit per Employee
LKR 000
1,2
25
1,9
16
2,5
41
1,7
68
2,3
66
Retaining Talent
We are able to retain our talent due to:
• Comprehensivecareerdevelopment
initiatives
• Employeebeneitsincludingpension
benefits
• Highlevelsofemployeeengagement
• Corporateculturepromotingteam
work
Freedom for Collective Bargaining
94% of staff are members of a
trade union
The Bank has cordial relations with
the trade unions who are signatories
to the collective agreement ensuring
preservation of the rights of employees
and uniform application of the policies of
the Bank.
Diversity
Bank of Ceylon is an equal opportunity
employer and has a higher rate of female
participation than the country’s workforce
rate of female participation.
Female participation at Bank
54%
Female participation in labour force
35.3%
Our team of 8,577 employees located
throughout the island are our key
strength as they have delivered the results
outlined in this report in pursuit of our
strategic goals whilst upholding our
values.
Employee Retention Rate
99%

94
BANK OF CEYLON . Annual Report 2014
Employee Report
We added 237 new recruits to our team
and promoted 920 employees to new
positions of responsibility based on their
performance and the business needs of
the Bank. The Bank invested LKR 244.5
million in developing our talent pool
through a comprehensive training and
development programme as a cornerstone
ofourHumanResource(HR)strategy
which included local, overseas and
e-learning training programmes during
the year. Retention remains high at 99%
due to high satisfaction levels in our team.
The Bank maintains cordial industrial
relations with key trade unions in the
financial services sector and 94% of our
team are members of at least one trade
union.
Our Team Profile
As an equal opportunity employer we
have 47% female participation in our
workforce which improves to 54% when
consideringthepermanentcadre.High
levels of representation are observed
throughout the provinces with the lowest
representation of 39% observed in the
Eastern Province whilst the Southern
Province has a female participation of
64%.However,weobservelowerlevels
of female representation at Executive and
Corporate Management levels indicating
issues with willingness or circumstances
of female employees to undertake
greater responsibilities and we are taking
necessary action to address these issues
through counselling and encouragement.
We believe that there has been sufficient
inspiration provided institutionally as
we have had a number of female leaders
By Nature of Employment and Gender
Employment Base 2014 2013
Male Female Total % by
nature of
employment
Male Female Total % by
nature of
employment
Permanent – Full time 3,966 4,611 8,577 87 4,240 4,643 8,883 88
Outsourced 1,267 27 1,294 13 1133 18 1151 12
On contract 7 1 8 - 10 1 11 -
Total 5,240 4,639 9,879 100 5,383 4,662 10,045 100
% by gender 53 47 100 54 46 100
at the highest levels throughout the
history of the Bank and are concerned
that this trend is more a reflection of the
changing social structures in the country
which require attention on an industry
basis to arrive at holistic solutions. The
employee age distribution reflects a
healthy talent pipeline up to Branch
Manager and allied officer grades, a result
of careful succession planning and talent
development initiatives of the Bank.
2009Launched the Islamic
Banking Unit with an
island-wide coverage

95
Truly Everybody’s Bank
By Employment Category
Category 2014 2013
Male Female Total Male Female Total
Corporate Management 12 2 14 12 2 14
Executive Management 44 6 50 38 6 44
Chief Manager 66 34 100 62 25 87
Senior Manager 116 59 175 111 41 152
Branch Manager and other
Officer Grades
1,519 2,032 3,551 1,575 1,809 3,384
Banking/ Management
Trainees
70 184 254 70 97 167
Staff Assistant and
Allied Grades
1,532 2,201 3,733 1,782 2,648 4,430
Office Assistant and
Allied Grades
607 93 700 590 15 605
Total 3,966 4,611 8,577 4,240 4,643 8,883
By Geographical Distribution
2014 2013
Province Male Female Total Male Female Total
Western Province 1,787 2,150 3,937 1,893 2,092 3,985
Central Province 315 378 693 352 398 750
Eastern Province 280 173 453 295 180 475
Northern Province 272 246 518 283 251 534
North Central Province 304 274 578 316 275 591
North Western Province 321 376 697 356 387 743
Sabaragamuwa Province 233 300 533 255 315 570
Southern Province 267 460 727 288 486 774
Uva Province 187 254 441 202 259 461
Total 3,966 4,611 8,577 4,240 4,643 8,883
2010 2011Converted the London
Branch into a subsidiary
Fitch Rating Lanka Ltd upgraded the
Bank’s rating to AA+ (lka) stable outlook,
which the Bank maintains upto now

96
BANK OF CEYLON . Annual Report 2014
Employee Report
Management Approach
TheHRandRemunerationCommitteeof
the Board has oversight responsibility for
the talent management and succession
planning at the Bank. The committee
comprises of four Non-Executive
Directors and approve reporting and
governance structures for the Bank,
recruitment, promotion and performance
evaluations of General Manager, Deputy
By Age Distribution According to Employment Category
Age D
istr
ibu
tio
n
Co
rpo
rate
Man
agem
en
t
Ex
ecu
tiv
e
Man
agem
en
t
Ch
ief
Man
ager
Sen
ior
Man
ager
Bra
nch
Man
ager
an
d o
ther
Offi
cer
Gra
des
Ban
kin
g/
Man
agem
en
t
Tra
inees
Sta
ff A
ssis
tan
t
an
d A
llie
d G
rad
es
Offi
ce A
ssis
tan
t
an
d A
llie
d G
rad
es
To
tal
2014
To
tal
2013
55-60 8 38 71 97 1,216 203 105 1,738 1,904
45-54 6 12 27 40 461 154 142 842 1,084
35-44 2 36 473 3 91 177 782 745
25-34 2 1,401 234 2,260 230 4,127 3,417
18-24 17 1,025 46 1,088 1,733
Total 14 50 100 175 3,551 254 3,733 700 8,577 8,883
General Managers and members of staff
inthealliedgradesandapprovetheHR
policies and monitor performance of the
HRDepartment.TheBoardofDirectors,
the General Manager, Deputy General
Managers and members of staff in the
allied grades and Compliance Officer
are considered as Key Management
Personnels.
GoalsandtargetsoftheHRDepartment
are set in line with the overall corporate
plan to meet the strategic business needs
oftheBankbytheHRandRemuneration
Committee and the Deputy General
ManagerHRisheldresponsiblefor
successful implementation. The Bank’s
HRisasfollows:
Board of
Directors
HR and Remuneration
Committee
General
Manager
HR Policy
Committee
HR
Department
2012Became the first bank in
Sri Lanka to surpass
LKR 1 trillion asset base
2012Issued US Dollar denominated 500 million,
5 year bonds listed in Singapore Stock
Exchange for the first time in Sri Lankan
commercial banking history

97
Truly Everybody’s Bank
HR Policy Framework
A comprehensive policy framework
based on Sri Lankan labour laws and
international best practice such as
the Decent Work Programme of the
International Labour Organization (ILO)
has been developed and approved by
the Board of Directors to ensure that
human rights are upheld and that the
culture of the organisation facilitates
high performance. The policy framework
has six key components that address the
recruitment, development and retention
of our employees as depicted below.
It also embodies principles of equal
remuneration for men and women, no
child labour and forced labour in line
with international best practice. The
Bank’s policy is to give first opportunity
to internal candidates when filling
vacancies prior to recruitment of external
candidates. This policy has given greater
opportunity for internal candidates who
aspire to progress in their careers and
creates a loyal and dedicated team with
proven ability to handle challenges.
The policies are reviewed and revised
at the necessity of the Bank to ensure
that they are relevant and in line with
best practice. The employees are issued
anEmployeeHandbookencapsulating
theHRethicstoensurecompliancewith
the policy framework of the Bank and
to address other administrative matters.
Management of the Bank strictly adheres
to the policies and processes specified
with regard to transfers and promotions.
Dissatisfied employees have recourse
to a well defined appeal process which
isclearlysetoutintheEmployeeHand
Book. A well-defined transfer policy is
also in place to ensure the transparency of
the transfers.
Talent Acquisition
As one of the largest employers in
the financial services sector, the Bank
continues to attract talent with a large
number of applications for each position
filled during the year. The Bank recruits
mainly Management Trainees and
Trainee Staff Assistants which are entry
level positions for new entrants to the
workforce. Every new recruit goes
through an extensive and transparent
selection process. Prior to recruitment of
Management Trainees and Trainee Staff
Assistants, all candidates face written
examinations conducted independently
by the Department of Examinations
and a rigorous interview process. When
recruiting for branches, we strive to
maintain a balance of people from
the area together with experienced
employees from other locations to ensure
branches have the required mix of skills.
We are an equal opportunity employer
and recruit based on business needs,
screening applicants in a structured
manner irrespective of their gender,
ethnicity or geographic location to ensure
that our recruits are people of talent,
ability and ambition. 99% of the new
recruitments consist of employees less
than the age category of 30 years and
comprise of 69% female representation.
Our entry level wage rates are above
industry levels.
Talent Management at BOC
Talent
Acquisition
Compensation
and Recognition
Development
and Retention
Employee
Engagement
Tale
nt
Att
ract
ion
Equ
al
Opport
un
ity
Com
pen
sati
on
and B
enefi
ts
Per
form
ance
-
bas
ed A
ppra
isal
Indu
stri
al
Rel
atio
ns
Work
-lif
e
Bal
ance
Gri
evan
ce
Han
dlin
g
Car
eer
pat
h
Dev
elopm
ent
Skill D
evel
opm
ent
and T
rain
ing
Aw
ards
and
Rec
ogn
itio
n
2012 2012Obtained an international rating equal in par
with sovereign rating (Fitch : BB-/Stable,
Moody’s : B1/Stable)
Exceeded 1,000 customer
service points
Kilinochchi
Mannar
Puttalam
Kurunegala
Kandy
Gampaha
Kalutara
Galle
Ratnapura
Matara
Hambantota
Moneragala
Nuwara Eliya
Badulla
Ampara
Matale
Batticaloa
Polonnaruwa
Anuradhapura
Trincomalee
Vavuniya
Mullaitivu
Jaffna
Colombo
Kegalle

98
BANK OF CEYLON . Annual Report 2014
Employee Report
Compensation and Benefits
Employee remuneration is determined by
theHRandRemunerationCommitteein
consultation with the Minister in charge
of the subject of Finance and Planning
in accordance with the provisions of
the Bank of Ceylon Ordinance. The
remuneration framework is revised
once in three years incorporating the
provisions of the collective agreements
signed with trade unions. There is no
differentiation for gender or age in the
remuneration of our employees.
Some non salary benefits provided to
permanent staff of the Bank include:
• Housing,vehicleanddistressloansat
concessionary interest rates
• Comprehensivemedicalassistance
• Compensationincaseofpersonal
accident whilst engaged in official
duties
• Financialsupportforpursuitof
professional and post graduate studies
and reimbursement of membership fee
of professional bodies
• Accesstoholidaybungalowslocatedat
popular locations
• Subsidisedmealsforstaffthroughthe
HeadOficecanteenandtransport
subsidies for staff
• Encouragingmembersinsports
activities and facilitating Gymnasium,
Library, Yoga ,etc
• Funeralexpensesofemployeesto
immediate family
Bank of Ceylon has a wide range of
benefits under a contributory provident
fund and a widows’/widowers’ and
orphans’ pension fund. Additionally, the
Bank’s pension assures a post retirement
financial umbrella. All three funds are
managed by Boards of trustees which
include team members and pensioner
representatives. Trustees ensure that
funds are prudently invested yielding
value over time. Annual actuarial
valuations are done to determine funding
gaps and remedial actions. Members raise
questions on the management of funds at
the annual general meetings.
Employee Development
Our core strategy is to develop our talent
pools using external qualifications that
enable career progression, provide on the
job training, internal technical training
programmes and soft skills development.
The career progression of our team
together with the growth of the Bank
is testimony to the effectiveness of this
strategy which was developed over
decades and the learning and mentoring
culture that pervades the remotest branch
of the Bank. We continue to recruit
mainly at entry levels and therefore
rely on our training and development
activities to ensure our business
growth is achieved and our ability to
compete effectively in the market with
international and private sector banks.
Our success is measured by the gains in
employee productivity.
Recruitments in 2014
Category Age
Group
Gender Total
Male Female
Assistant Transport Manager 41 1 1
Management Trainee 21 - 28 46 145 191
Trainee Assistant Legal Officer 29 1 1
System Analyst / Programmer
(Probation)
25 - 30 11 7 18
Staff Assistant (Probation) 33 1 1
Trainee Audit Assistant 23 - 28 15 10 25
Total 73 164 237
20142013Celebrated
75th Anniversary
Issued USD 500 million bond
for second consecutive year

99
Truly Everybody’s Bank
The Bank has a comprehensive
development and training programme
to facilitate the career progression
of our employees within the Bank.
Consequently, the Bank invested LKR
244.5 million in training and leadership
activities in 2014 including both internal
and external training programmes. Both
local and overseas training has been
provided to ensure that our employees
collectively have the skills necessary for
our sustained business growth. Purpose
built training facilities are available within
the Bank for training throughout the year
to all employees facilitating uninterrupted
delivery of our training catalogue to
ensure a high coverage of employees and
provide sufficient depth in training.
All employees are covered by the
performance based appraisal system
in place which measures their
performance with agreed quantitative
and qualitative objectives which also
serve to identify their training needs
and readiness for career progression
opportunities. The Bank’s training and
development processes ensure that
all staff are provided lifelong learning
opportunities in areas relevant to the
Bank and have relationships with
professional organizations of relevance
and repute. The Bank is an approved
employer with these institutions to
enable completion of their internship
with relevant work experience under the
guidance of mentors who are qualified
in the respective fields. Employees are
eligible to an honorarium payment on the
completion of professional qualifications
and reimbursement of membership fees.
Additionally, the Bank also provides
financial assistance to employees who
pursue post graduate qualifications in
fields relevant to their work. Completion
of such professional exams and other
profession related achievements
are recognised in their performance
appraisals.
Succession Planning
It is necessary that the Bank has a
sufficient talent pipeline for our business
needs which also serves to facilitate
realization of the career goals of our
employees. The Board and Corporate
Management have focussed on succession
planning in 2013 and increased the depth
of the plan in 2014 to Senior Manager
Number of Employees Trained During 2014
Category Number of employees Average hours of training
2014 2013 2014 2013
Male Female Male Female Male Female Male Female
Corporate Management 12 2 15 2 51 32 44 12
Executive Management 44 6 39 6 26 31 21 19
Senior Management 303 172 373 179 33 48 18 34
Executives 1,464 2,006 1,445 1,793 20 24 19 16
Trainees and Others 2,143 2,425 2,368 2,663 60 75 59 64
Total 3,966 4,611 4,240 4,643 190 210 161 145
Both local and overseas training has been provided to ensure that our employees collectively have the skills necessary for our sustained business growth.
2014 2014Entered the African continent by
opening a branch in Seychelles
Obtained the services of
Boston Consulting Group to
reshape the business processes

100
BANK OF CEYLON . Annual Report 2014
Employee Report
level. The Employee Development plans
support the succession planning process
enabling identification of potential talent
for grooming. We are confident that the
succession plans put in place go beyond
the requirements of the provisions of
the banking act direction on Corporate
Governance for Licensed Commercial
Banks in Sri Lanka enhancing the stability
of the Bank.
The Bank has a process in place to
identify employees with high potential.
These employees are identified early
and the necessary training and work
experience is provided in order to groom
them for future leadership roles.
Industrial Relations
The Bank of Ceylon has six registered
Trade Unions that actively engage
with the management in the collective
bargaining process. Over 94% of the
staff are members of these unions and
the Bank has collective agreements with
the unions from 1989 which were last
revised in 2012. Under the latest revision,
employees were awarded many benefits
and rewards. The Bank has a continuous
dialogue with officials of the trade
unions on a proactive basis to facilitate
harmonious industrial relations.
Employee Engagement
The Bank has a large number of
associations and committees which have
been formed by employees with common
interests and they organise activities
throughout the year providing informal
platforms for people to come together
building camaraderie amongst our
employees and enhancing co-operation
between departments. The focus of these
associations range from religious activities,
literary and cultural interests and sports
and provide employees with opportunities
for leadership and interactions outside
their work role. Many of these activities
surface hidden talents and abilities of our
employees which enhances their sense of
well-being at the workplace.
Ensuring that employees maintain a
work life balance appropriate to their
circumstances and career goals is
necessary for healthy levels of employee
engagementandretention.TheHR
departments seeks to identify and address
suchissuesthroughtheproactiveHR
forums initiated in 2013 and we are
encouraged by the progress made in this
regard. The Bank continuously takes
measures to ensure that the health and
safety of the employees are assured to a
satisfactory level. Prevention of hazards,
ill health and occupational diseases are
main concerns in implementing safety
actions at BoC. During the year, 23
employees have been granted accidental
leave. Further the Bank conducted 56
security programmes for internal security
personnel during 2014.
The Bank also encourages use of leisure
facilities provided to our staff through
concessionary rates at rest-inns and
holiday homes to ensure that they have
affordable opportunities for quality leisure
time with their families.
The Bank has an established mechanism
for handling alleged grievances and a
formal inquiry process that complies with
the labour laws of the country. Active
trade unions also provide a platform for
employees with grievances for aspects
covered by the collective agreements
ensuringthatHRpoliciesareappliedina
consistent and fair manner. The ”Whistle
Blowing Policy’’ of the Bank enables all
employees to submit complaints to the
Complaints Overseer.
No. of Training Programmes and Participants in
2014
Description No. of Training
Programmes
No. of
Participants
In-House 929 45,688
Local Institutions 299 5,815
Other Training 5 1,960
Overseas 107 347
Total 1,340 53,810
The Employee Development plans support the succession planning process enabling identiication of potential talent for grooming.

101
Truly Everybody’s Bank
Our employee retention rate is 99%
which is testimony to the effectiveness
oftheHRpolicyframeworkandits
implementation. Statistics of employees
who terminated their services are given
below and are tracked to ensure we
remain effective at retaining talent. As
may be observed from the employee
turnover, 90% of our employee turnover
is due to reaching retirement age whilst
only 10% have left the organization due
to other reasons.
Way Forward
The Bank will continue to drive the
transformation work commenced in
2014 through the “Wenesa” programme
to embed smarter working within
a technology enabled environment
to optimise employee productivity
throughout the organization. We are
excited and inspired by the quick wins
witnessed towards the end of the fourth
quarter and are focussing efforts to
manage the organizational change.
Streamlining and digitising processes will
be a key driver for employee productivity
together with rewards and recognition
programmes that will support the change.
The Bank will continue to invest in
training and developing our people with
increased emphasis on nurturing a sales
culture and catering to an increasingly
technology dependant customer base.
Total number of incidents of discrimination and
corrective actions taken
Male Female Total
Total number of human rights grievances
brought forward from 2013 5 1 6
Total number of human rights grievances
reported in 2014 10 4 14
Total number of grievances resolved during the year 7 2 9
Total number of grievances outstanding
at the end of the year 2014 8 3 11
Employee Turnover
Resignations During 2014
Age Group Female Male Total
20 - 29 27 12 39
30 - 39 4 4 8
40 - 49 2 1 3
Total 33 17 50
% 66 34 100
Retirements During 2014
Female Male Total
156 303 459
Runner-up IBSL inter-bank quiz competition 2014
National Productivity Awards 2013 - Conducted by
National Productivity Secretariat
75th Anniversary Celebration - BoC Walk
Talent show - “Prathiba Prabah”

102
BANK OF CEYLON . Annual Report 2014
Social Report
The Bank’s 75th anniversary is a fitting
time to review our relevance and
significance to the communities we
operate in. Often being the first bank in
villages, we operationalized our financial
inclusion policy to make banking services
available to all Sri Lankans by making
our services available island wide. The
presence of a bank provides a platform for
economic activity developing livelihoods
as village entrepreneurs are provided
convenient access to transactional,
investment and financing needs. We are
indeed proud to have been the catalyst
for the socio economic development in
villages that have transformed to towns
and cities over the years providing
opportunity for growth to Sri Lankans.
Our island-wide customer service point
network received special recognition
at the National Business Excellence
Awards 2014 with the winner’s trophy
for ‘Excellence in Local Market Reach’.
Our engagement, at both branch level
and corporate level, in activities to
address social and cultural needs observed
in the community goes beyond mere
philanthropy to encompass sustainable
projects and tasks. All branches engage
with the local community and carry
out philanthropic activities supporting
education, health and well-being and
local culture. Further, branches with
spearheading by the head office, are
involved in providing financial assistance
and guidance for needy segments with
the view of livelihood development. This
report captures some significant activities
conducted at corporate level in line with
disbursing the Bank’s corporate social
responsibility.
Infrastructure Development
Education
BoC facilitated for bridging the gap
between North and South by sponsoring
the construction of Jaffna railway under
“Uthuru Mithuru Project” which was
completed this year.
The“Hapana”programme,assistsschool
children to prepare for the Grade five
scholarship examination and reduces the
disparity in quality of education provided
across the island.
Grade five scholarship students and
undergraduate university students
who excelled at the respective public
examinations were recognised for their
achievement by the grant of scholarships
to further their studies.
Offered internship at the Bank for under
graduates and students studying for
professional examinations, providing
hands on experience in subject matters
74 programmes
were conducted
covering more than
33,000 students
over 700 schools
2,000 “Ran Kekulu Scholarships”
LKR 20 million
95“18+Scholarships”
LKR 2.95 million
1,069 students
Preserving National Heritage
Sponsored cultural pageants of historical
significance including the Kandy Esala
Perahera and Kataragama Perahera,
protecting our traditions and fostering a
cultural and religious identity.
LKR 36.5 million

103
Truly Everybody’s Bank
Health and well-being
Entrepreneurship
Sports
Refurbished and maintain the children’s
wardattheCancerHospital.
ConstructedanAyurvedaHospitalfor
disabled soldiers.
The BOC Mithuru micro finance scheme,
supports upliftment of livelihoods of the
under privileged segment in the country
Given dengue fever has reached an
epidemic level in the country, the
Bank conducted a dengue prevention
awareness programme at branch level
Development of Colombo National
Hospitallandscapingprojecttoprovide
a clean, healthy environment to the
patients
Branches and SME centres conducted
knowledge and skills workshops,
promoting sustainable business practices
amongst rural entrepreneurs.
Conducted an island wide blood donation
campaign for the National Blood Bank
Assisted villages located in drought
stricken areas of the country by
distribution of drinking water for
Sponsored national athletic events to
support a healthy society and promote
national harmony.
Relay Carnival and Junior National
Athletic Championships in 2014
conducted by National Athletic
AssociationLKR 15.5 million
Covering all branches
LKR 5.6 million
LKR 2 million
9 workshops
Donated > 744 pints
450 families in 08 villages
LKR 5.0 million
As at end 2014
> 116,596 beneficiaries
> LKR 1,776 million
disbursed
Precautionary Approach
We accept principle 15 in the Rio declaration of 1992 and are using this principle, as the
situation demands, in finding the balance between sustainability and development.
Membership in Industry Related Associations
• AsiaPaciicRuralandAgriculturalCreditAssociation(APRACA)
• AssociationofBankingSectorRiskProfessionals,SriLanka
• InstituteofBankersofSriLanka
• InternationalChamberofCommerce,SriLanka
• TheNationalChamberofCommerce,SriLanka
• SriLankaBanksAssociation(Guarantee)Limited
• SriLankaLawLibrary
• TheCeylonChamberofCommerce
• TheFinancialOmbudsmanofSriLanka(Guarantee)Limited
• AssociationofComplianceOficersofBanks,SriLanka
• BarAssociationofSriLanka

104
BANK OF CEYLON . Annual Report 2014
Economic Value Addition
Economic Value Added (EVA) indicates the true economic profit of a company. EVA is an estimate of the amount by which earnings
exceed or fall short of required minimum return for shareholders at comparable risks. EVA of the Bank stood at LKR 13,612 million as
of 31 December 2014 against LKR 10,805 million in 2013.
2014 2013 Change
LKR million LKR million %
Invested CapitalShareholders' funds 74,806 57,700 30Add: Cumulative Provision for loan losses and provision for impairment 36,882 30,078 23
111,688 87,778 27
Return on Invested Capital
Profit after taxation 13,574 12,087 12Add: Provision for loan losses 7,911 6,923 14Less: Loans written off (55) (50) 10
Total return on invested capital 21,430 18,960 13
Opportunity cost of invested Capital* (7,818) (8,155) (4)
Economic Value Added 13,612 10,805 26
*Weightedaverage12monthsTreasurybillrate+1%RiskPremium 7.00% 9.29%
Value Addition
An analysis of the Bank’s value creation and allocation among the key stakeholders is depicted below
2014 2013 Change LKR million LKR million %
Value Added Income earned by providing banking services 118,513 123,562 (4.1)Cost of services (59,923) (64,102) (6.5)Value added by banking services 58,590 59,460 (1.5)Non banking income 8,033 3,902 105.9Impairment charges for loans and other losses (7,911) (6,923) 14.3 58,712 56,439 4.0
Value Allocation To employees Salaries, wages and other benefits 13,716 14,669 (6.5)
To Government Dividends paid to Government of Sri Lanka 6,846 5,346 28.1Income tax 5,602 3,703 51.3Value added tax 4,052 2,711 49.5 16,500 11,760 40.3
To providers of external funds Interest on other borrowings 13,808 16,256 (15.1)Interest on debt issued 5,654 5,977 (5.4) 19,462 22,233 (12.5) To expansion and growth Retained profit 6,728 6,741 (0.2)Depreciation and amortization 1,191 1,117 6.6Deferred taxation 1,115 (81) 1,476.5 9,034 7,777 16.2 58,712 56,439 4.0
Value Addition Statement
How we add value to nation

105
Truly Everybody’s Bank
Environment Report
To be a responsible corporate citizen by operating the business in an environmentally responsible manner,
Bank of Ceylon is committed towards its environmental footprint.
Environment sustainable practices adopted in 2014 include the following.
Recycled Papers
Animal Protection
Responsible lending
Reduced Employee Electricity
Consumption
Planted Trees Encouraged Environmental Friendly
Energy Generation
268,357 kg of waste paper were recycled
and saved
• 4,562fullygrowntrees
• 470,967litersofoil
• 1,073,428kwhofelectricity
• 8,528,385litersofwater
• 805cubicmeteroflandill
• Reducedgreenhousegasemissionby
268,357 kg of carbon equivalent
Contributes LKR 37,500 per month to
the cattle protection trust which creates
a positive impact to the Bank and society
at large.
2014 contribution: LKR 450,000
Screened projects for environmental
impact during the credit evaluation stage.
Planted 100,000 trees at a cost of LKR 11
million, to mark the 75th anniversary of
BoC. Of these, chosen types of saplings
are being nurtured and maintained by the
Bank for a period of three years till they
mature into fully grown trees.
Committed LKR 175 million to
Hydropowerenergyproject.
Resource 2014 2013
Consumption Per head
Consumption
Consumption Per head
Consumption
Electricity (Mwh) 16,651 1.94 17,490 1.97
Water (Liters) 304,850 35.54 300,156 33.79
Fuel (Liters) 663,689 77.38 681,563 76.73

106
BANK OF CEYLON . Annual Report 2014
Snapshots of Social and Environment Reports
1000th “Hapana” programme was conducted in July 2014 at Balangoda Ananda
Maithriya Maha Vidyalaya covering 110 schools in the area
Blood donation campaign
Dengue prevention campaign
Thuru Mithuru tree planting projects
Contribution to the health and well-being
Jaffna railway “Uthuru Mithuru” Project

107
Truly Everybody’s Bank
Independent Assurance Report
Independent Assurance Report
to the Stakeholders of Bank of
Ceylon on the Sustainability
Report – 2014
Introduction and Scope of the
Engagement
The management of Bank of Ceylon
(“Bank”) engaged us to provide an
independent assurance on the following
elements of the Sustainability Report
2014 (“the Report”).
• Reasonableassuranceonthe
information on financial performance
as specified on page 104 of the Report.
• Limitedassuranceonkeyperformance
indicators and other information
presented in the Report, prepared in
accordance with the requirements
of Global Reporting Initiative G4 in
accordance with – core guideline.
Responsibility of the
Management on the Report
The Management of the bank is
responsible for the preparation and
presentation of the Report in accordance
with the Bank’s sustainability practices
and policies which are derived from
Global Reporting Initiatives (GRI-G4)
Sustainability Reporting Guidelines.
Responsibilities include among other
things, identification of stakeholders
and material issues, determining the
sustainable performance criteria for
reporting and establishing appropriate
processes and internal control systems
to measure and report the sustainability
performance criteria.
Our Responsibility
Our responsibility is to perform a
reasonable and limited assurance
engagement and express conclusions
based on the work performed in
accordance with Sri Lanka Standard on
Assurance Engagements (SLSAE 3000):
‘Assurance Engagements other than
AuditsorReviewsofHistoricalFinancial
Information’, issued by the Institute
of Chartered Accountants of Sri Lanka
(‘ICASL’).
Reasonable assurance is a high level of
assurance.However,reasonableassurance
is not an absolute level of assurance
because there are inherent limitations of
assurance engagement.
A limited assurance engagement
is substantially less in scope than a
reasonable assurance engagement and
consequently does not enable to obtain
assurance that we would become aware
of all significant matters that might be
identified in a reasonable assurance
engagement.
This Report is made solely to the Bank
in accordance with our engagement
letter dated 04 March, 2015. We disclaim
any assumption of responsibility for any
reliance on this Report to any person
other than the Bank or for any purpose
other than that for which it was prepared.
In conducting our engagement, we
have complied with the independence
requirements of the Code of Ethics for
professional Accountants issued by the
ICASL.
Assurance Procedures Carried
Out
Financial Information
We reconciled the information on
financial performance as reported on
page 104 of the Report with the audited
financial statements of the Bank for the
years ended 31st December, 2013 and
2014.
Key Performance Indicators
We reviewed the reliability of the data/
information on Key Performance
Indicators for the year ended 31st
December, 2014 based on reviews of:
• thesystemsusedtogenerate,aggregate
and report these information;
• theinformationreportedbythe
relevant business units to corporate
level;
• theinformationvalidationprocessesat
corporate and business level;
• theinformationtrendsindiscussions
with management and
• thecalculationperformedbytheBank
on a sample basis through recalculation.

108
BANK OF CEYLON . Annual Report 2014
Independent Assurance Report
Other Information
We planned and performed following
assurance procedures on other
information presented in the Report:
• InquiringrelevantBank’spersonnelto
understand the process for collection,
analysis, aggregation and presentation
of information in the Report.
• Reviewingthesystemusedtogenerate,
aggregate and report the information in
the Report
• Interviewingtheseniormanagement
and relevant staff at corporate level
and selected business unit level and
obtained the evidence concerning
sustainability strategy and policies for
material issues and implementation of
those across operation of the Bank.
• Reviewingandvalidatingthe
information contained in the Report.
• Readingtheinformationpresentedin
the Report to determine whether that
information is in line with our overall
knowledge of, and experience with,
sustainability performance of the Bank.
Conclusion
Based on the procedures performed, as
described above, we conclude that:
• Theinformationoninancial
performance as specified on page
104 of the Report is properly derived
from the audited financial statements
of the Bank for the years ended 31st
December, 2013 and 2014.
• Nothinghascometoourattention
that causes us to believe that key
performance indicators and other
information presented in the Report
are not presented, in all material
respects, in accordance with the Bank’s
sustainability practices and policies
which are derived from GRI (G4)
Sustainability Reporting Guidelines.
CHARTERED ACCOUNTANTS
Colombo
31 March 2015
TS/cc

109
Truly Everybody’s Bank
GRI IndexGRI G4 content index - “In accordance - Core”
No. Disclosure Item Location/Reference Page
No.
Strategy and Analysis
G4-1 Statement from the most senior decision maker Chairman’s Statements 23-28
Organizational Profile
G4-3 Name of the organization Corporate Information Inner
Back
Cover
G4-4 Primary brands, products, and/or services From Grassroots to Giants 12-15
G4-5 Location of organization’s headquarters Corporate Information Inner
Back
Cover
G4-6 Number of countries where the organization operates and names of countries
where the organization has significant operations
About This Report 8
G4-7 Nature of ownership and legal form Corporate Information Inner
Back
Cover
G4-8 Markets served Reaching Out to Everybody 10-11
G4-9 Scale of the reporting organization FinancialHighlights 6
G4-10 Employee details Employee Report 93-101
G4-11 Percentage of total employees covered by collective bargaining agreements Employee Report 100
G4-12 Describe the organization’s supply chain Stakeholder Engagement 43
G4-13 Significant changes during the reporting period regarding the organization’s
size, structure, ownership, or its supply chain
No significant change -
G4-14 Report whether and how the precautionary approach or principle is addressed
by the organization
Social Report 103
G4-15 Externally developed economic, environmental, and social charters, principles,
or other initiatives to which the organization subscribes or endorses
Social Report 103
G4-16 Memberships of associations and/or national/international advocacy
organizations
Social Report 103
Identified Material Aspects and Boundaries
G4- 17 Entities included in the organization’s consolidated financial statements or
equivalent documents
Management Discussion
and Analysis
63-64
G4-18 Process for defining the content and the Aspect Boundaries Determining Material
Issues
44

110
BANK OF CEYLON . Annual Report 2014
No. Disclosure Item Location/Reference Page
No.
G4-19 Material aspects Determining Material
Issues
45
G4-20 Aspect boundary within the organization Determining Material
Issues
45
G4-21 Aspect boundary outside the organization Determining Material
Issues
45
G4-22 The effect of any restatement of information provided in previous reports,
and the reasons for such restatements
No significant change
G4-23 Significant changes from previous reporting period in the Scope and Aspect
Boundaries.
Determining Material
Issues
44-45
Stakeholder Engagement
G4-24 Stakeholder groups engaged by the organization. Stakeholder Engagement 42-43
G4-25 The basis for identification and selection of stakeholders Stakeholder Engagement 42-43
G4-26 Approach to stakeholder engagement Stakeholder Engagement 42-43
G4-27 Key topics and concerns that have been raised through stakeholder
engagement and the organization’s response
Stakeholder Engagement 42-43
Report Profile
G4-28 Reporting period About This Report 8
G4-29 Date of most recent previous report 31 December 2013
G4-30 Reporting cycle Annually
G4-31 Contact point for questions regarding the report or its contents Corporate Information Inner
Back
Cover
G4-32 Compliance with GRI G4 Guidelines, GRI Content Index and the External
Assurance Report.
G4 Standard Disclosures
and Assurance Report
107-113
G4-33 Policy and current practice with regard to seeking external assurance for the
Report
About This Report 8
Governance
G4-34 Governance structure of the organization Corporate Governance 114-115
Ethics and Integrity
G4-56 Organization’s values, principles, standards and norms of behaviour such as
codes of conducts and codes of ethics.
Corporate Governance 123
GRI Index

111
Truly Everybody’s Bank
No. Disclosure Item Location/Reference Page
No.
Specific Standard Disclosures
G4-DMA Disclosures on Management Approach Throughout the report
Economic
Aspect: Economic Performance
G4-EC1 Direct Economic value generated and distributed Value Addition Statement 104
G4-EC3 Coverage of the organization’s defined benefit plan obligations Financial Statements 273-279
Aspect: Indirect Economic Impacts
G4-EC7 Development and impact of infrastructure investments and services supported Social Report 102-103
Environmental
Aspect: Energy
G4-EN3 Energy consumption within the organization Environment Report 105
G4-EN6 Reduction of energy consumption Environment Report 105
Aspect: Products and Services
G4-EN27 Extent of impact mitigation of environmental impacts of product and services Environment Report 105
Social
Sub Category: Labour Practices and Decent Work
Aspect: Employment
G4-LA1 Total number and rates of new employee hires and employee turnover by age
group, gender and region
Employee Report 98, 101
G4-LA2 Benefits provided to full-time employees that are not provided to temporary
or part-time employees, by major operations
Employee Report 98
Aspect: Labour- Management relations
G4-LA4 Minimum notice periods regarding operational changes, including whether
these are specified in collective agreements
3 months
Aspect: Occupational Health and Safety
G4-LA5 Percentage of total workforce represented in formal joint management-
worker health and safety committees
Employee Report 100
G4-LA8 Healthandsafetytopicscoveredinformalagreementswithtradeunions Covered in collective
bargaining agreement
Aspect: Training and Education
G4-LA9 Average hours of training per year per employee by gender, and by employee
category
Employee Report 99

112
BANK OF CEYLON . Annual Report 2014
GRI Index
No. Disclosure Item Location/Reference Page
No.
G4-LA10 Programmes for skills management and lifelong learning that support the
continued employability of employees and assist them in managing career
endings
Employee Report 99
G4-LA11 Percentage of employees receiving regular performance and career
development reviews, by gender and by employee category
Employee Report 99-100
Aspect: Diversity and Equal Opportunity
G4-LA12 Composition of governance bodies and breakdown of employees per
employee category according to gender, age, group, minority group
membership, and other indicators of diversity
Employee Report 95-96
Aspect: Equal Remuneration Women and Men
G4-LA13 Ratio of basic salary and remuneration of women to men by employee
category, by significant locations of operation
Male-female basic salary is
same
Aspect: Labour Practices Grievance Mechanisms
G4-LA16 Number of grievances about labour practices filed, addressed, and resolved
through formal grievance mechanisms
Employee Report 101
Sub Category :Human Rights
Aspect: Non discrimination
G4-HR3 Total number of incidents of discrimination actions taken Employee Report 101
Aspect: Freedom of Association and Collective Bargaining
G4-HR4 Operations identified in which the right to exercise freedom of association and
collective bargaining may be violated or at significant risk, and measures taken
to support these rights
No such operations
Aspect: Child Labour
G4-HR5 Operations identified as having significant risk for incidents of child labour Employee Report 97
Aspect: Forced or compulsory labour
G4-HR6 Operations identified as having significant risk for incidents of forced or
compulsory labour
No compulsory labour
Aspect: Security Practices
G4-HR7 Percentage of security personnel trained in the organization’s human rights
policies or procedures that are relevant to operations
Employee Report 100

113
Truly Everybody’s Bank
No. Disclosure Item Location/Reference Page
No.
Aspect: Human Rights Grievance Mechanisms
G4-HR12 Number of grievances about human rights impacts filed, addressed, and
resolved through formal grievance mechanisms
Employee Report 101
Sub Category: Society
Aspect: Local communities
G4-SO1 Percentage of operations with implemented local community engagement,
impact assessments and development programmes
Social Report 102-103
FS-13 Access points in low-populated or economically disadvantaged areas by type Reaching Out to Everybody 10-11
FS-14 Initiatives to improve access to financial services for disadvantaged people Retail Banking 79-80
Aspect: Anti-corruption
G4-SO3 Operations assessed for risks related to corruption and the significant risks
identified
Risk Report 152-157
Aspect: Compliance
G4- SO8 Monitory value of significant fines and total number of non- monetary
sanctions for non compliance with laws and regulations
None
Sub Category: Product Responsibility
Aspect : Product and Services Labelling
G4-PR 4 Total number of incidents of non compliance with regulations and voluntary
codes concerning product and service information and labelling, by type of
outcomes.
None
FS -6 Percentage of the portfolio for business lines by specific region, size and by
sector
Management Discussion
and Analysis
62
FS- 7 Monetary value of product and services designed to deliver a special social
benefit for each business line broken down by purpose
Retail Banking 79-80
Aspect: Marketing Communications
G4-PR 7 Total number of incidents of non compliance with regulations and voluntary
codes concerning marketing communications, including advertising,
promotion, and sponsorship by type of outcomes
None
Aspect: Customer Privacy
G4-PR8 Total number of substantiated complaints regarding breaches of customer
privacy and losses of customer data
None
Aspect: Compliance
G4-PR9 Monetary value of significant fines for non compliance with laws and
regulations concerning the provision and use of products and services
None

114
BANK OF CEYLON . Annual Report 2014
Corporate Governance
Commitment to good governance
Bank of Ceylon is committed to
upholding high standards of corporate
governance to protect the interests of all
stakeholders and provide a framework
for long term value creation to its
shareholder. Corporate Governance of
the Bank is in compliance with the Bank
of Ceylon Ordinance No.53 of 1938 and
amendments thereto, the Banking Act
Direction No.11 of 2007 on Corporate
Governance for Licensed Commercial
Banks issued by the Central Bank of
Sri Lanka, Section 7.10 of the Continuing
Listing Requirements on Corporate
Governance and the voluntary Code of
Best Practice on Corporate Governance
jointly issued by the Institute of Chartered
Accountants of Sri Lanka and the
Securities and Exchange Commission in
2007.
The first part of this report is arranged
according to the principles enumerated
in the Code of Best Practice on Corporate
Governance (jointly issued by the
Securities and Exchange Commission of
Sri Lanka and the Institute of Chartered
Accountants of Sri Lanka) which is
structured to facilitate comprehensive
disclosure in a concise manner.
As the Bank is complying with the
Banking Act Direction No.11 of 2007 as
set out on pages 123 to 137, the Colombo
Stock Exchange has exempted the Bank
from disclosure of compliance with the
Directions stipulated in Section 7.10 of
the Continuing Listing Requirements
on Corporate Governance. The Auditor
General has reviewed the Bank’s
compliance with the Banking Act
Direction and has provided assurance on
the same to the Central Bank of Sri Lanka
in compliance with the direction.
An Effective Board (Principle A.1)
The Board of Directors is the highest
decision making body of the Bank
of Ceylon. It comprises six Non-
Executive Directors appointed by the
Minister of Finance of which one will
be a representative of the Ministry of
Finance referred to as the Ex officio
Director in accordance with the Bank
of Ceylon Ordinance No.53 of 1938 and
its amendments. An Alternate Director
is appointed for the Ex officio Director
from the Ministry of Finance to ensure
representation of the Ministry at all
meetings of the Board. Directors are
appointed for a period of three years and
can be extended.
The Directors as at year end 2014 ;
• AirChiefMarshalHarsha
Abeywickrema
Chairman, w.e.f. 15.03.2014
Independent Non-Executive Director
• MsKMANelumaniDaulagala
Non-Executive Ex officio Director
(Mr R M Ananda Ratnayake
Alternate to Ex officio Director)
• MrRajuSivaraman
(Acting Chairman till 14.03.2014)
Independent Non-Executive Director
• MsNaliniDAbeywardena
Non-Executive Director
• MrChandrasirideSilva
Non-Executive Director
• MrLalithPWithana
Independent Non-Executive Director
All the above Directors resigned in
January/February 2015.
With their resignations, the newly
appointed Minister of Finance appointed
four new Directors in accordance with
normal practice due to the change of
Government. An Alternate Director also
has been appointed for the Ex officio
Director. The Board of Directors so
appointed are as follows -
• MrRonaldCPerera,President’s
Counsel – Chairman,
Independent Non-Executive Director
• MsPushpaWellappili
Non-Executive Ex officio Director
(Mr A P Kurumbalapitiya – Alternate
Director to Ex officio Director)
• MrRanelTWijesinha
Independent Non-Executive Director
• MrBrianJSinniah
Independent Non-Executive Director
Profiles of the Directors are given on
pages 38 to 41.
Board Balance and Diversity
During the year under review
• ThreeIndependentDirectors
including the Chairman
• 33%Female67%Male

115
Truly Everybody’s Bank
The Bank is in the process of amending
the Bank of Ceylon Ordinance to increase
the number of Directors to comply
with Section 3(2)(i) of the Banking Act
Direction No.11 of 2007 on Corporate
Governance which requires the number
of Directors to be not less than seven and
not more than 13.
The Secretary to the Board/Secretary,
Bank of Ceylon, Ms Janaki Senanayake
Siriwardane is an Attorney-at-Law and
holds a LLB and a MBA.
Board Subcommittee Areas of Oversight Composition
Audit Committee
Report of the Audit Committee is given on
pages 138 to 140
Financial Reporting
Internal Controls
Internal Audit
External Audit
During the year under review:
Comprised of three Non-Executive
Directors of whom two were Independent
Directors including the Chairman.
Current Committee:
Comprises three Non-Executive Directors
of whom two are Independent Directors
including the Chairman.
Nomination and Corporate
Governance Committee
Report of the Nomination and Corporate
Governance Committee is given on
pages 145 and 146
Implement procedure for
appointment of Key Management
Personnel
Succession Planning
Effectiveness of the Board and its
Committees
Code of Ethics
During the year under review:
Comprised of three Non-Executive
Directors of whom two were Independent
Directors including the Chairman.
Current Committee:
Comprises three Non-Executive Directors
of whom two are Independent Directors
including the Chairman.
Integrated Risk Management
Committee
Report of the Integrated Risk
Management Committee is given on pages
141 and 142
Risk appetite
Risk governance
Risk policy frameworks
Risk monitoring and compliance
Risk management
During the year under review:
Comprised of three Non-Executive
Directors of whom two were Independent
Directors including the Chairman.
Current Committee:
Comprises three Non-Executive Directors
of whom two are Independent Directors
including the Chairman.
Human Resources and Remuneration
Committee
ReportoftheHumanResourcesand
Remuneration Committee is given on
pages 143 and 144
Remuneration policy
Goals and targets for General
Manager and Key Management
Personnel
Performance evaluation
HRPolicy
Organization structure
During the year under review:
Comprised of four Non-Executive Directors
of whom two were independent Directors
including the Chairman.
Current Committee:
Comprises three Non-Executive Directors
of whom two are Independent Directors
including the Chairman.
The Board has appointed four Board
subcommittees in compliance with
governance codes and best practice to
ensure due attention is given to specific
areas.

116
BANK OF CEYLON . Annual Report 2014
Corporate Governance
Regular Meetings (Principle A 1.1)
Board meetings were held on a fortnightly basis during the year under review whilst special Board meetings were convened depending
on the need. During 2014 the Board held 31 meetings including special meetings. Additionally, the following subcommittees also met
regularly. Summary of the attendance at meetings during the year under review is given below -
Directors Board Audit
Committee
Human
Resources and
Remuneration
Committee
Integrated
Risk
Management
Committee
Nomination
and
Corporate
Governance
Committee
AirChiefMarshalHarshaAbeywickrema
(Appointed w.e.f 15.03.2014)
25 2
Mr K M M Siriwardane* 2 1
Ms K M A Nelumani Daulagala
(Appointed w.e.f 29.01.2014)
27 6 2
Mr Raju Sivaraman 31 9 3 5 2
Ms Nalini D Abeywardene 29 3
Mr Chandrasiri de Silva 31 3 2
Mr Lalith P Withana 30 9 5 1
Mr R M Ananda Ratnayake
(as Alternate Director to
Ex officio Director)
1 1 1
Total No. of Meetings 31 9 3 5 2
* Mr K M M Siriwardane, who was the Director General, Department of Fiscal Policy, Ministry of Finance and Planning was the Ex
officio Director of the Bank in the month of January 2014, until the appointment of Ms K M A Nelumani Daulagala as the Ex officio
Director.

117
Truly Everybody’s Bank
Board Highlights 2014
• “Wenesa”Project-EngagingTheBostonConsultingGrouptoreviewtheBank’s
operations and prepare a strategic plan for the Bank.
• LiaisingwiththeMinistryofFinancetoobtainadditionalsharecapitalofLKR10
billion which was approved in the National Budget 2015.
• IncreasedthesharecapitalbyLKR5billionduringtheyearwhichispending
allotment.
• UpgradingtheinformationtechnologysystemsattheBankinaccordancewith
the IT strategy to become a technologically driven Bank.
• CoincidingwiththeBank’s75thAnniversarylaunchingofseveralCSRactivities.
Board members have been provided with
iPads to access their Board papers via
secure connections. This ensures that all
Directors receive information at the same
time.
The General Manager is invited to all
Board meetings together with any
other executives whose presence
may be required and regularly make
presentations to the Board on matters
including progress in implementation of
the strategic goals, financial, social and
environmental performance, changes and
challenges presented by the operating
environment, recommend policy
frameworks and executive governance
structures.
Executive Committees are also in place with the approval of the Board to facilitate collaboration, deliberation and debate on matters
considered critical for the Bank’s operations as listed below -
Management
CommitteesPurpose and tasks
Assets and
Liabilities
Management
Committee
The Bank’s Assets and Liabilities Management Committee (ALCO) manages the various financial risks of the
Bank such as market, interest rate, liquidity and exchange. The ALCO reviews market and credit portfolio
risks, as well as interest rate risk inherent in the Bank’s balance sheet and trading book. It meets regularly to
ensure that the level of interest rate and foreign exchange exposures are within regulatory and internal limits,
to maximize the Bank’s net interest income, to ensure adequate liquidity and to maximize the return on the
Bank’s capital, net of fixed assets.
Credit Committee The purpose of the Credit Committee is to maintain the quality and review the trends affecting Bank’s credit
portfolio, oversee the effectiveness and administration of credit-related policies and provide oversight and report
to the Board regarding the credit-related aspects of the Bank from time to time.
HumanResource
Policy Committee
TheobjectivesoftheHumanResourcePolicyCommitteeistoassisttheBoardinfulillingitsresponsibilitiesby
recommending to the Board on the effective implementation and application of sound human resource policies
that are aligned with the organization’s Values, Vision, Mission and Aspirations.
IT Steering
Committee
The IT Steering Committee to follows-up on the adequate implementation of the Bank’s Information
Technology strategic plan and ensures that all technology related initiatives are in support of the business
strategy. In addition this committee will ensure that all related policies and procedures are well implemented.
Investment
Committee
The purpose of the Investment Committee is to monitor the investment portfolio through setting up and
reviewing the objectives, guidelines and functions related to investment activities of the Bank and exercise its
authority in investment decisions. Primary objectives of investment include preservation of capital, maintenance
of liquidity, protection against credit and market risks and maximization of return of the investment portfolio of
the Bank.
NPA Committee The Non Performing Assets Committee is formed at Bank of Ceylon with the main objective of deciding on
downgrading non performing loans to Doubtful or Bad, and to ensure a work out plan is put in place, resolve
overdue and problematic accounts to reduce risk exposure, enhance overall Bank position and reduce /
eliminate provisions.

118
BANK OF CEYLON . Annual Report 2014
Corporate Governance
Management
CommitteesPurpose and tasks
Business
Continuity
Management
Steering
Committee
The Business Continuity Management Steering Committee is tasked with making strategic recovery and
continuity planning decisions for the Bank.
Reward and
Recognition
Policy Committee
The Bank’s Reward and Recognition Policy Committee sets out the process by which staff is rewarded for their
commitment to supporting the Bank’s objectives in the performance of their duties. The Committee implements
policy to provide a coherent and practical approach to recognise employee’s performance.
Operational Risk
Management
Executive
Committee
The Operational Risk Management Executive Committee is created within Bank of Ceylon in order to review,
discuss and coordinate the various issues relating to Operational Risk Management process for the purpose of
ensuring better management and measurement of the various related operational risks.
Fraud Risk
Committee
This Committee reviews and assess the effectiveness of risk management and control processes within the
organization to mitigate fraud risk of the Bank.
Sustainability
Committee
The Committee shall be responsible to the Board for overseeing the Bank’s Corporate Sustainability (“CS”)
policies (principally environmental, social, ethical and economic matters).
Forged Cheque
and Fraud
Committee
This Committee is formed to review and take required decisions in relation to writing off losses sustained due to
forged instruments and other fraudulent activities at branches and business units.
Idle Asset
Committee
The Idle Asset Committee manages and monitors the process of disposal of immovable properties vested in the
Bank as per rules stipulated in Bank of Ceylon Ordinance and Office Instructions Circulars. Further the Idle
Asset Committee is responsible for providing necessary guidelines and instructions to foreclosed properties unit
in order to dispose the properties at correct price.

119
Truly Everybody’s Bank
Board Responsibilities (Principle
A.1.2)
The Board responsibilities are set out
in the Board Charter which includes
a schedule of powers reserved for the
Board.
Key Board Responsibilities and
Powers Reserved for the Board
• Settingstrategicdirection
• Financialreporting
• Corporategovernance
• Strengtheningthesafetyandsoundness
of the Bank
• Overseeingthebusinessandaffairsof
the Bank
• Approvingmajorhumanresource
policies
The Board has provided guidance for
the formulation of the Bank’s three year
rolling strategic plan and has reviewed
and approved the same at meetings
convened specifically for this purpose.
Implementation of the strategic plan is
monitored by the Board whilst specialised
areas identified for oversight by Board
subcommittees have been monitored by
the subcommittees who have reported on
progress and concerns to the Board.
The Nomination and Corporate
Governance Committee assists the Board
in ensuring that the General Manager
and key management personnel have
the necessary skills, experience and
knowledge to implement strategy by
reviewing the appointment criteria.
Succession plan for the Bank is also
reviewed by the same committee
annually to ensure sufficient depth in top
management.TheHumanResourcesand
Remuneration Committee evaluates the
performance of the top management.
The Audit Committee is tasked with
ensuring effective systems to secure
integrity of information, internal controls
and is supported by the Internal Audit
function of the Bank. The Directors’
Statement on Internal Control over
Financial Reporting on page 171 and
the Independent Assurance provided
by the Auditor General on the same on
page 173 provide further information
in this regard. The Board Integrated
Risk Management Committee is tasked
with risk management and ensuring
compliance with laws and regulations
and is supported by the Bank’s Risk
Management and Compliance functions.
The Nomination and Corporate
Governance Committee also is tasked
with review of the Bank’s Code of
Conduct which communicates the ethical
standards expected of all employees
and Directors. Activities of the Audit,
Integrated Risk Management, Nomination
andCorporateGovernanceandHuman
Resources and Remuneration Committees
are detailed in the relevant Committee
reports on pages 138 to 146.
The Board has adopted a customer
charter, transparent procurement
procedures,HumanResourcepolicies
and a Sustainability Policy to ensure that
all stakeholder interests are given due
consideration in corporate decisions. The
activities done under above policies are
set out in the Social Report on pages
102 to 103. Additionally, the corporate
mission set out on pages 04 to 05 together
with the related key performance
measures also serves to reinforce this at
all levels of the Bank.
The Audit Committee and Board review
accounting policies annually to ensure
that they are in line with the business
model of the Bank and the Sri Lanka
Accounting Standards. Clarification is
sought from the Auditor General and/
or the external audit firm appointed by
the Auditor General to assist him when
significant changes in accounting policies
are deemed necessary.
The Board also engages in other activities
considered vital to enhance the growth,
soundness and profitability of the Bank.
In pursuance of these objectives, the
Board engaged The Boston Consulting
Group in 2014 to make recommendations
and prepare a strategic business plan to
ensure that the Bank is able to compete
effectively in a rapidly growing economy
with best in class practices. The Board
also acted as the Steering Committee
in this exercise named as “Wenesa”,
meaning “change”, to ensure that the
strategic objectives of the assignment
were met and sufficient resources were
provided to facilitate implementation of
the same.
Act in Accordance with laws
(Principle A.1.3)
The Board has put in place a framework
of policies, procedures and a risk
management framework to ensure
compliance with relevant laws, CBSL
guidelines and international best
practices with regard to the operations
of the Bank. The Board obtains
independent professional advice as and
when necessary in accordance with the
Board approved Policy on Independent
Professional Advice.
Access to advice and services of
Company Secretary (Principle
A.1.4)
All Directors have the opportunity
to obtain the advice and services of
the Company Secretary referred to as
Secretary to the Board in the Bank
who is responsible for ensuring follow
up of Board procedures, compliance
with rules and regulations, directions
and statutes, keeping and maintaining
minutes and relevant records of the
Bank. The appointment and removal of
the Secretary to the Board is a matter
involving the full Board.
Independent judgement
(Principle A.1.5)
The Directors bring diverse
skills,perspectives and experience to
the Board enriching the discussion and
debate on matters set before the Board
and take decisions using independent
judgement including decisions on issues
of strategy, performance, resources, key
appointments and standards of business
conduct. Composition of the Board
ensures that there is a sufficient balance
of power and contribution by all Directors

120
BANK OF CEYLON . Annual Report 2014
Corporate Governance
and minimises the tendency for one or
few members of the Board to dominate
the Board processes or decision making.
Dedicate adequate time and
effort to matters of the Board and
the Bank (Principle A.1.6)
Dates of regular Board meetings and
Board subcommittee meetings are
scheduled well in advance and the
relevant papers are circulated a week
prior to the meeting. There is provision
to circulate papers closer to the meeting
on an exceptional basis. Each Director
spent over 120 hours for deliberation at
the Board during the year under review
in addition to their preparation time. For
subcommittees a minimum of 50 hours
for the year were spent at meetings.
Training for Directors
(Principle A.1.7)
The Directors are conscious of the need
to keep abreast of current developments
affecting the sector both globally and
locally with particular reference to
regulatory changes and the country’s
economy. During the year, they have
attended identified training sessions
including Director Forums organised by
the Central Bank of Sri Lanka. Newly
appointed Directors are provided with an
orientation pack with all relevant external
and internal regulation documents.
Management also makes presentations
on technical details and table changes in
the regulatory framework to ensure that
the Board is aware of key developments
affecting the business operations of the
Bank.
Division of Responsibilities
between the Chairman and CEO
(Principle A.2)
The positions of the Chairman and
the Chief Executive Officer referred to
as the General Manager in the Bank
have been separated in line with best
practice in order to maintain a balance
of power and authority. The separation
is clearly articulated in the enabling
enactment of the Bank of Ceylon. The
Chairman is a Non-Executive Director
whilst the General Manager is the Chief
Executive Officer who is not a member
of the Board. The Board appoints the
General Manager with the approval of
the Minister of Finance. There is a Board
Charter in place clearly defining the
roles of the Chairman and the General
Manager.
The Chairman’s role
(Principle A.3)
The Chairman provides leadership to the
Board, preserving order and facilitating
the effective discharge of the duties of the
Board and is responsible for ensuring the
effective participation of all Directors and
maintaining open lines of communication
with key management personnel, acting
as a sounding board on strategic and
operational matters.
Financial Acumen (Principle A.4)
When considering the year under review,
the Chairman of the Audit Committee,
Mr Lalith P Withana is a Fellow member
of the Institute of Chartered Accountants
of Sri Lanka and both he and Ms K M A
Nelumani Daulagala are Fellow members
of the Chartered Institute of Management
Accountants, UK and hold Master’s
degrees in Business Administration. The
Chairman, Bank of Ceylon has a Master
of Science degree in Management whilst
other Directors have held positions as
Directors in companies in the financial
services sector and had business
experience.
When considering the current Board of
Directors, the Chairman of the Audit
Committee, Mr Ranel T Wijesinha is
a Fellow member of the Institute of
Chartered Accountants of Sri Lanka. Mr
Brian Sinniah is an experienced banker
whilst Ms Pushpa Wellappili is the Deputy
Secretary to the Treasury in the Ministry
of Finance. The new Chairman, Bank of
Ceylon was a Director of the same Bank
at an earlier occasion and has specialised
in commercial and banking law.
Board Balance (Principle A.5)
The Board comprises solely of Non-
Executive Directors of whom three
are Independent Directors. The Non-
Executive Directors are professionals/
academics/business leaders, holding
senior positions in their respective fields.
The independence of the Directors are
recognised based on the criteria specified
in the Banking Act Direction No.11
of 2007. Accordingly, the following
Directors were deemed to be independent
during the year under review:
• AirChiefMarshalHarsha
Abeywickrema - Chairman
• MrRajuSivaraman
• MrLalithPWithana
On the same basis, the following current
Directors are deemed to be independent:
• MrRonaldCPereraPC-Chairman
• MrRanelTWijesinha
• MrBrianJSinniah
Role of Chairman
• LeadingtheBoard.
• Facilitatingeffectivecontribution
of Directors.
• ProperbrieingofDirectors.

121
Truly Everybody’s Bank
Appointment of a Senior Independent
Director is not necessary as the roles of
the Chairman and Chief Executive Officer
are segregated.
Board minutes are prepared in order to
record any concerns of the Board as a
whole or those of individual Directors
regarding matters placed for their
approval/guidance/action. These minutes
are circulated and formally approved
at the subsequent Board meeting.
Additionally, Directors have access to the
past Board papers and minutes in case of
need via electronic means at all times.
Supply of Relevant Information
(Principle A.6)
The Chairman ensures that all Directors
are properly briefed on issues arising
at Board Meetings by requiring
management to provide comprehensive
information including both quantitative
and qualitative information for the
monthly Board Meetings seven days prior
to the Board/Subcommittee meetings.
The Chairman, General Manager and
Secretary to the Board/Secretary, Bank
of Ceylon have pre board meetings with
a view to ensuring that all necessary
information is provided to the Board. The
Board has the right to seek independent
professional advice at the Bank’s expense.
Any Director who does not attend a
meeting is updated on proceedings prior
to the next meeting through:
• Formallydocumentedminutesof
discussions.
• ByclarifyingmattersfromtheSecretary
to the Board.
• Separatediscussionsatthestartof
meetings regarding matters arising from
the previous meeting.
• ArchivedminutesandBoardpapers
accessible electronically at the
convenience of the Directors.
Directors have the opportunity to interact
with senior management at Board
Meetings when required.
Appointments to the Board and
Re-Election (Principles A.7 and
A.8)
Whilst the Board has a Nomination and
Corporate Governance Committee with
a formal Terms of Reference, Directors
are appointed by the Minister of Finance.
Profiles of all Directors are published in
the Bank’s website and on pages 38 to 41
of this report. No Director has exceeded
the nine years period of service falling in
line with the provisions of the Banking
Act Direction No.11 of 2007.
Appraisal of Board Performance
(Principle A.9)
The Board and its committees annually
appraise their own performance to
ensure that they are discharging their
responsibilities satisfactorily. This process
requires each Director to fill a Board
Performance Evaluation Form. The
responses are collated by the Secretary to
the Board who compiles a report under
the guidance of the Nomination and
Corporate Governance Committee which
is submitted to the Board and discussed at
a Board Meeting.
Disclosure of Information in
respect of Directors (Principle
A.10)
Information specified in the code with
regard to Directors are disclosed within
this Annual Report as follows:
• Name,qualiications,expertise,material
business interests and brief profiles on
pages 38 to 41.
• Relatedpartytransactionsonpages292
to 293.
• Membershipofsubcommitteeson
pages 138 to 146.
• AttendanceatBoardMeetingsand
subcommittee meetings on page 116.
Appraisal of Chief Executive
Officer (Principle A.11)
The Board discussed and set financial
and non-financial targets to be achieved
during the year under the leadership
of the Chief Executive Officer referred
to as the General Manager in the Bank
with reference to the short, medium
and long term objectives of the Bank
by the beginning of 2014. The targets
for 2015 have also been set at the time
of reporting. The General Manager’s
performance is evaluated annually.
Directors’ and Executive
Remuneration (Principle B.1, B.2
and B.3)
Directors’ Remuneration Policy is in
accordance with the circulars and letters
issued by the Minister of Finance. No
Director is involved in determining his/
herownremuneration.TheHuman
Resources and Remuneration Committee
makes recommendations to the Board
with regard to the remuneration of the
General Manager and key management
personnel which is reviewed and revised
every three years. The Board in turn
makes recommendations to the Minister
of Finance who is the final authority
for approval of the General Manager’s
and key management personnel’s
remuneration. The composition and
reportoftheHumanResourcesand
Remuneration Committee are given
on pages 143 and 144. The aggregate
remuneration to Directors is given on
page 208.
Relations with Shareholders
(Principle C.1)
The Government of Sri Lanka is the sole
shareholder of the Bank of Ceylon and
the Annual Report is circulated through
the Ministry of Finance to the Parliament.
The Annual Report is printed in English,
Sinhalese and Tamil, the official languages
of the country.
The Board liaises with the Ministry of
Finance to ensure that there is alignment
with the socio economic development
goals of the country and for other matters
concerning the Ministry in its capacity
as the sole shareholder of the Bank.
During the year 2014, LKR 10 billion
was allocated in the National Budget to
increase the share capital of the Bank.
Out of that LKR 5 billion was issued and
is pending allotment.

122
BANK OF CEYLON . Annual Report 2014
Corporate Governance
Disclosure of Major Transactions
(Principle C.2)
The Bank’s future strategies and their
potential impact have been disclosed
in the following sections of this annual
report:
•NewChairman’sMessageonpages27
and 28
•GeneralManager’sReviewonpages
31 to 35
•ManagementDiscussionandAnalysis
on pages 62 to 90
Accountability and Audit
(Principle D.1.)
The Bank’s position and prospects have
been discussed in detail in the following
sections of this Annual Report:
• Chairmen’sReview/Messageonpages
22 to 28.
• GeneralManager’sReviewonpages
31 to 35
•ManagementDiscussionandAnalysis
on pages 62 to 90
Every effort has been made to present
a balanced and understandable
assessment of the Bank’s financial
position, performance and prospects
in compliance with the various legal
enactments applicable, the Sri Lanka
Accounting Standards, the G4 standard
on Sustainability Reporting published
by the Global Reporting Initiative and
the Integrated Reporting Framework
published by the International Integrated
Reporting Council.
The Bank has also complied with the
requirements of the Central Bank of Sri
Lanka, the Colombo Stock Exchange and
published interim financial reports in the
English, Sinhala and Tamil newspapers
and on the Bank’s website within 45
days of each quarter. Price sensitive
information which may have an impact
on the debt securities issued by the
Bank of Ceylon has been disclosed in a
comprehensive but concise manner to
the Colombo Stock Exchange on a timely
basis.
Reports required by regulators including
Central Bank of Sri Lanka, the
Department of Inland Revenue,
Sri Lanka Accounting and Auditing
Standards Monitoring Board, and the
Colombo Stock Exchange have been filed
in a timely manner in compliance with
specified requirements. The Directors’
Report on pages 162 to 166 contains the
declarations required in the Code. The
Statement of Directors’ Responsibility
and Report of the Auditor General
includes a statement about their reporting
responsibilities and are given on pages
174 and 175 respectively.
The Management Discussion and
Analysis is set out on pages 62 to 69. The
declaration of the Directors confirming
that the business is a going concern is
included in the Report of the Directors on
page 166.
Audit Committee and Internal
Control (Principles D.2. and D.3)
The Board is responsible for formulating
and implementing appropriate and
adequate internal control systems to
safeguard the assets of the Bank and
has appointed an Audit Committee
to assist in discharge of this duty. The
principal responsibility of the Audit
Committee is oversight over financial
reporting, internal controls, internal audit
and external audit. Its duties include
gaining assurance on the control over
financial processes and the integrity of
the Bank’s financial reports, monitoring
the performance and reviewing work of
the Chief Internal Auditor. The Terms
of Reference for the Audit Committee
complies with the Code of Best Practice
on Corporate Governance issued by the
Central Bank of Sri Lanka. The Audit
Committee Report is given on page 138
to 140 of this Annual Report and provides
information on the composition of the
Committee, key responsibilities and
activities during the year.
The Audit Committee comprises
three Directors and is chaired by an
Independent Non-Executive Director.
Members are selected to provide a
broad set of financial, commercial and
other relevant experience to meet the
Committee’s objectives. The General
Manager, the Chief Financial Officer,
Deputy General Manager (Finance and
Planning), Chief Internal Auditor, Chief
Risk Officer and the representative of
the Auditor General (AG) and auditors
assisting the AG are invited to attend the
meetings.
The Board Audit Committee has
responsibility to the Board to ensure
that the system of internal controls is
sufficient and effective. Reviews of the
adequacy and effectiveness of these
internal control systems are carried out
by the Internal Audit Department who
reports on a regular basis to the Board
Audit Committee. The Committee also
has a key role in relation to the Auditor
General who conducts the external audit
of the Bank, whose primary relationship
is with the Committee.

123
Truly Everybody’s Bank
Code of Business Conduct and
Ethics and Corporate Governance
Report (Principles D.4 and D.5)
The Bank has two Codes of Ethics, one
applicable to all Directors and the other
to the employees. The Nomination and
Corporate Governance Committee of
the Board is responsible for review of
these. The Corporate Governance Report
(which this paragraph is part of) on
pages 114 to 137 provides information
regarding the Corporate Governance
practices in the Bank in compliance with
the Banking Act Direction No. 11 of 2007
and amendments thereto on Corporate
Governance issued by the Central Bank of
Sri Lanka.
Additionally, the Bank has in place a
number of mechanisms to prevent bribery
and corruption in the workplace.
• AllemployeesandDirectorshaveto
submit an annual assets and liability
declarationtotheHumanResources
Department of the Bank and Ministry
of Finance respectively.
• Transparentprocurementprocedures
covering Tender Boards at various levels
of the Bank are in place.
• Keydecisionsregardingcredit,
investment and purchasing are
delegated to committees who take
decisions on a collective basis.
• Directorsdeclaretheirinterests,
obligations if any.
Shareholder Relations
(Principles E and F)
As the sole shareholder is the
Government of Sri Lanka, the relevant
provisions of the Code are not applicable
to the Bank.
Level of compliance with the Banking Act Direction No.11 of 2007 and subsequent amendments thereto on Corporate
Governance for Licensed Commercial Banks in Sri Lanka issued by the Central Bank of Sri Lanka (CBSL) during the year 2014.
Section Principle Compliance and Implementation
3 (1) Responsibilities of the Board
The Board has
strengthened the safety
and the soundness of the
Bank in the following
manner:
a. Strategic objectives and
corporate values
The Bank’s strategic objectives and corporate values are determined by the Board and are
incorporated in the Corporate Plan for the period 2014 -2016. These are communicated to all
levels of staff through regular briefing sessions and at off-site discussion meetings where the
Corporate Plan is launched and reinforced by the Corporate Management Team. Additionally
thevaluesareincludedintheEmployeeHandBookwhichisalsoavailableontheintranet.
b. Overall Business Strategy
including Risk Policy and
Management
The Bank strategy is set by the Board in consultation with the senior management of the
Bank for the period 2014 -2016 which has been approved by the Board. The risk appetite,
policy, management framework and mechanisms have also been approved by the Board in
line with the strategic plan. Measurable goals for the Bank as a whole have been set and
performance is measured in line with these goals also at off-site discussion meetings.
c. Risk management The Board has appointed a Board Integrated Risk Management Committee tasked with
approving the Bank’s Risk Policy, defining the risk appetite, identifying principal risks, setting
governance structures and implementing systems to measure, monitor and manage the
principal risks. The following reports provide further insights in this regard:
Risk Management Report on pages 147 to 159.
Integrated Risk Management Committee Report on pages 141 and 142.
d. Communication with all
stakeholders
The Board has approved and implemented a Communication Policy covering all stakeholders.

124
BANK OF CEYLON . Annual Report 2014
Corporate Governance
Section Principle Compliance and Implementation
e. Internal Control System
and Management
Information Systems
The Board Audit Committee is tasked with reviewing the adequacy and the integrity of the
Bank’s internal control system and the Board reviews the adequacy of the management
information system (MIS). Accordingly, the Audit Committee reviewed reports from the
Internal Audit Department which reports directly to the Audit Committee and also from the
external auditors in carrying out this function. Board has reviewed the adequacy of MIS and
Internal Control System.
f. Key Management
Personnel
The Board has identified as Key Management Personnel, the members of the Board, the
General Manager and other members of the Corporate Management and Compliance Officer.
g. Define areas of authority
and Key Responsibilities
for Directors and Key
Management Personnel
Areas of authority and key responsibilities have been defined for the Directors and Key
Management Personnel during 2014 through the Board Charter and position descriptions
respectively.
h. Oversight of affairs
of the Bank by Key
Management Personnel
Key Management Personnel make regular presentations to the Board on matters under their
purview and are also called in by the Board to explain matters relating to their areas.
i. Assess effectiveness
of own Governance
practices
The Nomination and Corporate Governance Committee monitors the compliance with
the applicable governance practices. The Board appraises their performance by filling the
Board Evaluation Form which is filled by each Director in relation to business strategy and
contributions of Board members based on their field of expertise. The responses are collated
and submitted to the Board generally through the Nomination and Corporate Governance
Committee.
j. Succession Plan for Key
Management Personnel
A Succession Plan for the Key Management Personnel is in place. New Succession Plan is
being reviewed and has to be approved by the Board.
k. Regular meetings with
Key Management
Personnel
Key Management Personnel regularly present or are called in for discussions at the meetings
of the Board and its subcommittees on policy and other matters relating to their areas.
l. Regulatory environment
and maintaining an
effective relationship
with regulator
On appointment as Directors the Board is furnished with all applicable regulatory
requirements. They are also briefed about developments in the regulatory environment at
Board Meetings to ensure that their knowledge is updated regularly to facilitate effective
discharge of their responsibilities.
Compliance Reports submitted to CBSL which includes all returns to regulators are presented
to the Board monthly and monitored closely by the Board.
m HiringexternalAuditors As provided for in the constitution of the country, the Auditor General is the external auditor
for the Bank as it is a State Owned Enterprise.
3 1 (ii) Appointment of
Chairman and CEO and
defining and approving
their functions and
responsibilities
The Board has appointed the Chief Executive Officer referred to as the General Manager with
the approval of the Minister of Finance and the Chairman is appointed by the same Minister
as provided for in the Bank of Ceylon Ordinance No. 53 of 1938 and its amendments. The
Board has also approved their functions and responsibilities maintaining the balance of power
between the two roles through the Board Charter.

125
Truly Everybody’s Bank
Section Principle Compliance and Implementation
3.1. (iii) Regular Board Meetings Regular fortnightly Board meetings are held and special meetings are scheduled as and when
the need arises. The Board met 31 times during 2014. The Bank has minimised obtaining
approval via circular resolutions and it is done only on an exceptional basis and such
resolutions are ratified by the Board at the next meeting.
3.1.(iv) Arrangements for
Directors to include
proposals in the agenda
Meetings are scheduled and informed to the Board at the beginning of each calendar year to
enable submission of proposals to the agenda for regular meetings.
3.1.(v) Notice of Meetings Notice of Meetings are given through an Annual Calendar at the beginning of the year.
Agenda and Board papers for the Board meetings are circulated to the Directors seven days
prior to the meetings through a secure e-solution.
3.1 (vi) Directors’ Attendance The Directors are apprised of their attendance in accordance with the Corporate Governance
Code. Details of the Directors’ attendance are set out on page 116. No Director has been
absent from three consecutive meetings.
3.1 (vii) Company Secretary The Board has appointed Secretary to the Board who satisfies the provisions of Section 43 of
the Banking Act No.30 of 1988 and its amendment and whose primary responsibilities shall
be to handle the secretariat services to the Board and carry out other functions specified in
the statutes and other regulations.
3. 1 (viii) Director’s access to advice
and services of Company
Secretary
All members of the Board have opportunity to obtain advice and services of the Secretary to
the Board who is a an Attorney-at-Law and who is responsible to the Board for follow up of
Board procedures, compliance with rules and regulations, directions and statutes and keeping
and maintaining minutes and relevant records of the Bank.
3.1 (ix) Maintenance of Board
Minutes
Secretary to the Board maintains the minutes of the Board Meetings and circulates same
to all Board Members. The minutes are approved at the subsequent Board Meeting.
Additionally, the Directors have access to the past Board papers and Minutes through a secure
electronic link.
3.1 (x) Minutes to be of
sufficient detail and
serve as a reference
for regulators and
supervisory authorities
The Minutes of the meetings include:
(a) a summary of data and information used by the Board in its deliberations;
(b) the matters considered by the Board;
(c) the fact-finding discussions and the issues of contention or dissent
(d) the testimonies and confirmations of relevant executives with regard to the Board’s
strategies and policies and adherence to relevant laws and regulations;
(e) matters regarding the risks to which the Bank is exposed to and an overview of the risk
management measures including reports of the Board Integrated Risk Management
Committee; and
(f) the decisions and Board resolutions including reports of all Board subcommittees.
3.1 (xi) Directors’ ability to seek
independent professional
advice
The Directors are able to obtain independent professional advice, as and when necessary,
in discharging their responsibilities in accordance with the Policy for Directors’ Access to
Independent Professional Advice.
3.1 (xii) Dealing with Conflicts of
Interest
The Directors are conscious of their obligation to deal with situations where there is a conflict
of interest in accordance with the applicable regulations. Board approved Policy on Conflict
of Interest is in place. As a practice at every Board meeting held on a fortnightly basis,
Directors are required to declare any interests etc. Directors abstain from participating in
the discussions, voicing their opinion or approving in situations where there is a conflict of
interest. Additionally he/she is not counted in the quorum in such instances.

126
BANK OF CEYLON . Annual Report 2014
Corporate Governance
Section Principle Compliance and Implementation
3.1 (xiii) Schedule of matters
reserved for Board
decision
The powers reserved for the Board are included in the Board Charter ensuring that the
direction and control of the Bank is within the Board’s authority in line with regulatory
codes, guidelines and international best practice.
3.1 (xiv) Inform Central Bank if
there are solvency issues
The Board is aware of the need to inform the Director of Bank Supervision prior to taking
any decision or action if the Bank is about to become insolvent or about to suspend payments
to its depositors and other creditors. Monthly financial statements give that assurance to the
Board. Such a situation has not arisen.
3.1 (xv) Capital adequacy The Board monitors capital adequacy and other prudential measures viz a viz regulatory
requirements. The Bank is in compliance with the minimum capital requirements.
3. 1 (xvi) Publish Corporate
Governance Report in
Annual Report
The Board publishes the Corporate Governance Report in the Bank’s Annual Report. These
disclosures form part of such report.
3.1 (xvii) Self-assessment of
Directors
The Board has adopted a scheme of self-assessment to be undertaken by each Director
annually and records of these assessments are maintained with the Secretary to the Board/
Secretary, Bank of Ceylon
3.(2) The Boards composition
3.(2) (i) Number of Directors As per CBSL Governance direction, the number of Directors should not be less than seven
and not more than thirteen. The Bank’s Board comprises six Directors as per Bank of Ceylon
Ordinance No.53 of 1938 and its amendments. The Bank is in the process of amending the
Bank of Ceylon Ordinance to facilitate compliance with this requirement.
3.(2) (ii) Period of service of a
Director
The period of service of a Director is limited to nine years as per the Corporate Governance
Direction for Licensed Commercial Banks. There are no Directors whose tenure of service has
exceeded nine years on the Board. Details of their appointments are given on pages 38 and 39
3.(2) (iii) Board Balance There are no Executive Directors in Bank of Ceylon.
3.(2) (iv) Independent Non-
Executive Directors
The Bank has three Independent Non-Executive Directors as required by the Direction.
3.(2) (v) Alternate Independent
Directors
No Alternate Director has been appointed to represent an Independent Director.
3.(2) (vi) Criteria for Non-
Executive Directors
The full Board who are Non-Executive Directors are persons with credible track records and
can bring in independent judgement to bear on issues of strategy, performance and resources.
3.(2) (vii) More than half the
quorum to comprise
Non-Executive Directors
All Directors are Non-Executive Directors.

127
Truly Everybody’s Bank
Section Principle Compliance and Implementation
3.(2)
(viii)
Identify Independent
Non-Executive Directors
in communications
and disclose categories
of Directors in Annual
Report
The Independent Non-Executive Directors are expressly identified as such in all corporate
communications that disclose the names of Directors of the Bank. The composition of the
Board, by category of Directors, including the names of the Chairman, Non-Executive
Directors and Independent Non-Executive Directors are given on page 114 of the Corporate
Governance Report.
3.(2)(ix) Succession planning
and appointments to the
Board
Appointments to the Board are made by the Minister of Finance in terms of the provisions of
Bank of Ceylon Ordinance No.53 of 1938 and its amendments.
3.(2)(x) Re-election of Directors.
Filling casual vacancies
This does not arise since Minister of Finance appoints them.
3.(2) (xi) Communication of
reasons for removal or
resignation of Directors
The shareholder, the Government of Sri Lanka does the appointments through the Minister
of Finance and the resignations are also submitted to him whilst keeping the CBSL and the
Colombo Stock Exchange informed.
3.(2)(xii) Prohibition of Directors
or Employees of a bank
becoming a Director at
another bank
The Minister of Finance takes into account this requirement when considering appointments
ofDirectors.However,aDeputyGeneralManagerhasbeenappointedtotheBoardof
Pradeshiya Sanwardana Bank as per the requirement of the enabling enactment of this Bank
(viz. Pradeshiya Sanwardana Bank Act No.41 of 2008).
3.(3) Criteria to assess fitness and propriety of directors
3.(3)(i) Age of Director should
not exceed 70
There are no directors who are over 70 years of age.
3.(3)(ii) Directors should not be
Directors of more than 20
companies
No Director holds directorships in 20 companies.
3.(4) Management Functions delegated by the Board
3.(4) (i) Understand and study
delegation arrangements
The Board periodically reviews and approves the delegation arrangements in place and
ensures that the extent of delegation addresses is the needs of the Bank whilst enabling the
Board to discharge their functions effectively.
3.(4)(ii) Extent of delegation
should not hinder Board
ability to discharge its
functions
3.(4)(iii) Review delegation
arrangements periodically
to ensure relevance to
operations of the Bank
3.(5) The Chairman and Chief Executive Officer
3.(5)(i) Separation of roles The position of Chairman and the Chief Executive Officer, (General Manager) are held by
two different individuals.

128
BANK OF CEYLON . Annual Report 2014
Corporate Governance
Section Principle Compliance and Implementation
3.(5)(ii) Non-Executive Chairman
and appointment of a
Senior Independent
Director
Since the Chairman of Bank of Ceylon is an Independent Non-Executive Director, the need
to appoint a Senior Independent Director does not arise.
3.(5)(iii) Disclosure of identity of
Chairman and CEO and
any relationships with
the Board members
The identity of the Chairman and the General Manager are disclosed in the Annual Report on
pages 38, 41 and 48 and there are many references to these roles throughout.
There are no material financial, business or family relationships between the Chairman,
General Manager and other members of the Board as per annual declarations taken as at year
end 2014.
3 (5) (iv) Chairman shall
(a) provide leadership to
the Board;
(b) ensure that the Board
works effectively
and discharges its
responsibilities;
(c) ensure that all key
and appropriate issues
are discussed by the
Board in a timely
manner.
The Chairman provides leadership to the Board and ensures that the Board functions
effectively in discharging its responsibilities. The Board in a timely manner deliberates all key
issues.
3 (5) (v) Responsibility for agenda
lies with Chairman but
may be delegated to
Company Secretary
The Secretary to the Board/Secretary, Bank of Ceylon draws up the agenda for the meetings
under the authority delegated by the Chairman based on the memoranda submitted through
the General Manager and any other relevant items proposed by any Board member.
3 (5) (vi) Ensure that Directors
are properly briefed
and provided adequate
information
The Chairman ensures that the Board is adequately briefed and informed regarding the matters
arising at Board. The following procedures are in place to ensure this:
• BoardpapersarecirculatedsevendayspriortotheBoardmeetings
• RelevantmembersoftheManagementteamareonhandforexplanationsandclariications.
• ManagementinformationisprovidedinagreedformatsonaregularbasistoenableDirectorsto
assess the performance and stability of the Bank.
• DirectorsareabletoseekindependentprofessionaladviceonaneedsbasisattheBank’s
expense.

129
Truly Everybody’s Bank
Section Principle Compliance and Implementation
3 (5) (vii) Encourage active
participation by all
Directors and lead in
acting in the interests of
the Bank
This requirement is complied with and addressed in the self evaluation process.
3.(5)(viii) Encourage participation
of Non-Executive
Directors and
relationships between
Non-Executive and
Executive Directors
Bank’s Board consists of all Non-Executive Directors.
3(5)(ix) Refrain from direct
supervision of Key
Management Personnel
and executive duties
The Chairman does not get involved in the direct supervision of Key Management Personnel
or any other executive duties.
3(5)(x) Ensure effective
communication with
shareholders
Effective communication is maintained with the Government of Sri Lanka who is the
sole shareholder. The Ex officio Director acts as the channel between the Board and the
shareholder.
3(5)(xi) CEO functions as the
apex executive in
charge of the day to day
operations
The day to day operations of the Bank is the responsibility of the General Manager.
3.(6) Board appointed committees
3 (6)(i) Establishing Board
sub-committees, their
functions and reporting
Four subcommittees have been established by the Board with written Terms of Reference
for each. The Secretary to the Board/Secretary, Bank of Ceylon serves as the Secretary
for all subcommittees and maintains minutes and records with oversight by the respective
Chairpersons. The reports of the subcommittees are included in the Annual Report.
Audit Committee on pages 138 to 140.
Integrated Risk Management Committee on pages 141 to 142.
HumanResourcesandRemunerationCommitteeonpages143to144.
Nomination and Corporate Governance Committee on pages 145 to 146.
3 (6) (ii) Audit Committee
a. Chairman to be an
Independent Non-
Executive Director
with qualifications
and experience in
accountancy and/or audit
The Chairman of the Audit Committee is an Independent Non-Executive Director who has
the required qualifications as indicated under their profiles.

130
BANK OF CEYLON . Annual Report 2014
Corporate Governance
Section Principle Compliance and Implementation
b. Committee to comprise
solely of Non-Executive
Directors
All members of the Audit Committee are Non-Executive Directors.
c. Audit Committee
functions
In accordance with the Terms of Reference, the Audit Committee makes the following
recommendations:
• TheimplementationoftheCentralBankguidelinesissuedtoauditorsfromtimetotime.
• Theapplicationoftherelevantaccountingstandards.
Since the Auditor General is the external auditor of the Bank, the Committee has no role to
play in the engagement of the external auditor.
d. Review and monitor
external auditor’s
independence and
objectivity and the
effectiveness of the audit
processes
The Bank’s auditor being the Auditor General, his independence and effectiveness is
guaranteed under the Constitution of Sri Lanka.
e. Provision of non-audit
services by external
auditor
This does not arise since the Auditor General is the auditor of the Bank.
f. Determines scope of
audit
The scope and extent of audit have been determined by the Auditor General and it is stated
that M/s Ernst & Young (E&Y), Chartered Accountants who assisted the Auditor General
could make further changes/amendments to the scope having considered the volume and
risks associated.
g. Review financial
information of the Bank
The Audit Committee reviews the financial information of the Bank, in order to monitor the
integrity of the financial statements of the Bank, its annual report, accounts and quarterly
reports prepared for disclosure, and the significant financial reporting judgments contained
therein. The review focuses on the following:
• majorjudgmentalareas;
• anychangesinaccountingpoliciesandpractices;
• signiicantadjustmentsarisingfromtheaudit;
• thegoingconcernassumption;
• thecompliancewithrelevantaccountingstandardsandotherlegalrequirements.
The Audit Committee makes their recommendations to the Board on the above.

131
Truly Everybody’s Bank
Section Principle Compliance and Implementation
h. Discussions with external
auditor on interim and
final audits
The Audit Committee discusses issues, problems and reservations arising from the interim
and final audits. The representative of the Auditor General was present at the Committee
meetings along with representatives of E&Y, Chartered Accountants, who assisted the Auditor
General in the year 2014 audit. No request was made in the year under review to discuss any
matter in the absence of the Management. Going forward, it has now been introduced as a
permanent agenda item of the Committee.
i. Review of Management
Letter and Bank’s
response
The Audit Committee has reviewed the external auditor’s Management Letter and the
management’s response thereto.
j. Review of Internal Audit
function
The Audit Committee has oversight of the Internal Audit function and carries out the following
duties with regard to the same:
• Reviewstheadequacyofthescope,functionsandresourcesoftheInternalAuditdepartment,
and ensures that the department has the necessary authority to carry out its work;
• ReviewstheInternalAuditprogrammeandresultsoftheauditsandensuresthatappropriate
actions are taken on the recommendations of the internal audit department;
• ReviewsappraisalsoftheperformanceoftheheadandseniorstaffmembersoftheInternal
Audit department;
• Recommendsanyappointmentorterminationofthehead,seniorstaffmembers;
• EnsuresthatthecommitteeisappraisedofresignationsofseniorstaffmembersoftheInternal
Audit department including the Chief Internal Auditor, and provides an opportunity to the
resigning senior staff members to submit reasons for resigning;
• Ensuresthattheinternalauditfunctionisindependentoftheactivitiesitauditsandthatitis
performed with impartiality, proficiency and due professional care;
• TherewerenooutsourcedfunctionsofInternalAuditduring2014andprovisionsinthisregard
were not applicable. (In 2015 some IS Audit Functions are outsourced to an external expert
with Audit Committee recommendation).
k. Internal Investigations The Audit Committee has reviewed the major findings of internal investigations and
management’s responses thereto.
l. Attendees at Audit
Committee Meetings
The General Manager, Chief Internal Auditor, Chief Risk Officer, Chief Financial Officer and
representatives of the external auditors appointed to assist the Auditor General viz. M/s E&Y,
Chartered Accountants and Auditor General’s representative normally attend meetings. Other
Board members may also attend meetings upon the invitation of the Committee.
m. Explicit authority,
resources and access to
information
The Audit Committee has:
• explicitauthoritytoinvestigateintoanymatterwithinitstermsofreference;
• theresourceswhichitneedstodoso;
• fullaccesstoinformation;and
• authoritytoobtainexternalprofessionaladviceandtoinviteoutsiderswithrelevant
experience to attend, if necessary.
n. Regular Meetings The Audit Committee has scheduled regular meetings. Accordingly, the Committee met nine
times during the year. Members of the Audit Committee are served with due notice of issues
to be discussed and the conclusions in discharging its duties and responsibilities are recorded
in the Minutes of the meetings maintained by the Secretary to the Board/Secretary, Bank of
Ceylon.

132
BANK OF CEYLON . Annual Report 2014
Corporate Governance
Section Principle Compliance and Implementation
o. Disclosure in Annual
Report
The Report of the Audit Committee on pages 138 to 140 includes the following:
• DetailsoftheactivitiesoftheAuditCommittee;and
• ThenumberofAuditCommitteemeetingsheldintheyear;and
Details of attendance of each individual Director at such meetings are given on page 116.
p. Maintain Minutes of
meetings
The Secretary to the Board/Secretary, Bank of Ceylon serves as the Secretary for the Audit
Committee and maintains minutes of the committee meetings.
q. Whistle Blower Policy
and relationship with
external auditor
The Bank has a Board approved Whistle Blower Policy whereby an employee of the Bank
may, in confidence, raise concerns about possible improprieties in financial reporting, internal
control or other matters. Significant findings are reported to the Audit Committee for follow
up action.
The Audit Committee is the key representative body for overseeing the Bank’s relations with
the external auditor.
HumanResourcesandRemunerationCommittee
3 (6) (iii)
a
HRandRemuneration
Committee
Remuneration policy
(salaries, allowances and
other financial payments)
relating to Directors,
Chief Executive
Officer (CEO) and key
management personnel
of the Bank.
The Remuneration for Directors is according to the circulars/letters issued by the Ministry of
Finance and the Bank of Ceylon Ordinance No. 53 of 1938 and its amendments. The Bank
has also adopted a Remuneration Policy based on the said circulars.
The Committee makes recommendations of the remuneration of General Manager and Key
Management Personnel once in three years and submit to the Board and finally obtains the
approval of the Minister of Finance.
b Set goals and targets for
the Directors, CEO and
the Key Management
Personnel (KMP).
No targets for the Directors are set since all of them are Non-Executive Directors. Goals and
targets for the KMPs are documented and detailed in the Action Plan prepared based on the
Corporate Plan of the Bank. The General Manager is responsible for the implementation of
the Corporate Plan through the KMPs. Performance on same is reviewed by the full Board
on a periodic basis. A separate evaluation of the performance of the General Manager is also
carried out on an annual basis by the full Board.
c Evaluating the
performance of the CEO
and Key Management
Personnel
The Committee evaluated the performance of the General Manager and KMPs.

133
Truly Everybody’s Bank
Section Principle Compliance and Implementation
d The CEO shall be present
at all meetings of the
committee, except when
matters relating to the
CEO are being discussed.
This has been complied with.
Nomination Committee
3(6) (iv)
a.
Appointment of
Directors, CEO and Key
Management Personnel
Directors are appointed by the Minister of Finance. General Manager is appointed by the
Board with the approval of the said Minister. There is a Board approved procedure/scheme
for the appointment of Key Management Personnel.
b. Re-election of Directors Does not arise since the Minister of Finance appoints them.
c. Eligibility criteria for
appointments to key
managerial positions
including CEO
The General Manager is appointed based on the Bank’s accepted procedure with the approval
of the Board of Directors and the Minister of Finance as specified in the Bank of Ceylon
Ordinance No.53 of 1938 and its amendments. The Board approved promotion schemes
stipulate the attributes required to be eligible to be selected or promoted to the other key
management positions. This will be relooked at with the assistance of the external consultants
the Bank has hired with the review of job descriptions.
d. Fit and Proper persons Annual declarations from Directors, ensuring that they are fit and proper persons to hold
office as specified in the criteria given in Direction 3(3) and as set out in the Statutes is sent to
CBSL.
e. Succession Plan and new
expertise
The Bank has developed a Succession Plan for the Key Management Personnel.
The latest succession plan is in placed and has to be approved by the Board.
3 (6) (v) Integrated Risk Management Committee/Board Risk Management Committee
a. Composition of Risk
Management Committee
The Committee comprises three Non-Executive Directors, General Manager, Chief Risk
Officer who supervises credit, market, liquidity, operational, reputational and strategic risks.
The Chief Internal Auditor and Chief Financial Officer participate at all Committee meetings
at the request of the Committee. The Committee works closely with Key Management
Personnel within the framework of authority and responsibility assigned to the Committee.
b. Risk Assessment of the
Bank and its Group
Independent Integrated Risk Management Division of the Bank assesses the credit, market,
liquidity, operational, strategic and reputational risks of the Bank on a monthly basis and
the summary reports are submitted to the Committee at least quarterly and then to the next
immediate Board meeting. Overall risk assessment of the Bank will be strengthened through
the assistance of the external consultants engaged by the Bank.
In the case of subsidiaries and associates a risk management dash board has been developed
to address the risks.

134
BANK OF CEYLON . Annual Report 2014
Corporate Governance
Section Principle Compliance and Implementation
c. Review of management
level committees on
risk and address specific
risks and manage those
risk within qualitative
and quantitative risk
limits as specified by the
Committee
Risk indicators which have gone beyond the specified quantitative and qualitative risk limits
are submitted to the Committee.
d. Corrective action to
mitigate risks exceeding
prudential levels
The Committee takes prompt corrective action to mitigate the effects of specific risks in the
case such risks are at levels beyond the prudent levels decided by the Committee on the basis
of the Bank’s policies and regulatory and supervisory requirements.
e. Frequency of meetings The Committee has regular meetings and schedules additional meetings when required.
Measures will be taken to increase the frequency of the meetings depending on the business.
The agenda covers matters assessing all aspects of risk management including updated
Business Continuity Plan.
f. Actions against officers
responsible for failure
to identify specific risks
or implement corrective
action
Formal documented disciplinary action procedure is in place at the Bank.
g. Risk assessment report to
Board
The minutes of the meeting are submitted to the next immediate Board meeting together
with the recommendations and risk management reports.
h Compliance function A compliance function has been established to assess the Bank’s compliance with laws,
regulations, regulatory guidelines, internal controls and approved policies on all areas of
business operations. This function is headed by a dedicated Compliance Officer (a Key
Management Personnel) who reports to the Integrated Risk Management Committee and is
responsible for providing the following:
• Adetailedquarterlyreportonstatutoryandmandatoryreportingrequirementsindicating
the status of compliance to the Committee and the Board; and
• AmonthlycompliancereporttotheBoard.
The compliance function will initiate action to assess the Bank’s compliance with internal
controls and approved policies on all areas of business operations.

135
Truly Everybody’s Bank
Section Principle Compliance and Implementation
3 (7) Related Party Transactions
3(7)(i) Avoid conflict of interest There is a Board approved Policy on Related Party Transactions. This policy identifies related
parties, types of related party transactions and restrictions on offering more favourable
treatment to related parties in order for Board members to avoid any Conflict of Interest in
this regard.
Directors who have related party transactions are individually requested to declare their
transactions. Transactions are monitored through an automated system which will be
improved.
3(7)(ii) Related party transactions
covered by direction
Definitions of related party transactions covered by the above Board process and declarations
by Directors and Key Management Personnel include :
a) The grant of any type of accommodation, as defined in the Monetary Board’s Directions
on maximum amount of accommodation,
b) The creation of any liabilities of the Bank in the form of deposits, borrowings and
investments,
c) The provision of any services of a financial or non-financial nature provided to the Bank
or received from the Bank, and
d) The creation or maintenance of reporting lines and information flows between the
Bank and any related parties which may lead to the sharing of potentially proprietary,
confidential or otherwise sensitive information that may give benefits to such related
parties.
3 (7) (iii) Monitoring of related
party transactions
defined as more
favourable treatment
The Bank has implemented a Board approved process to monitor related party transactions
which is monitored by the Compliance Unit. This monitory system would be further
improved to cover all the products of the Bank.
3 (7) (iv) Granting accommodation
to Directors or close
relation to a Director
All accommodations to Directors and/or their close relatives are approved by the Board and
prescribed security is taken. The concerned Director does not participate in the deliberations
or decisions.
3 (7) (v) Accommodations granted
to persons, or concerns
of persons, or close
relations of persons,
who subsequently are
appointed as Directors of
the Bank
This situation has not arisen in the Bank to date.
3 (7) (vi) Favourable treatment or
accommodation to Bank
employees or their close
relations
No favourable treatment /accommodation is provided to Bank employees, close relations
other than under general staff benefits. Circular instructions have been issued in this regard.
Bank employees are also not given any favourable treatment/accommodation.
3 (7) (vii) Not remitting
accommodations granted
under (v) and (vi) above
without approval of the
Monetary Board
Such a situation has not arisen during the year 2014.

136
BANK OF CEYLON . Annual Report 2014
Corporate Governance
Section Principle Compliance and Implementation
3(8) Disclosures
3.(8) (i) Publish annual and
quarterly financial
statements
Annual audited financial statements and quarterly financial statements are prepared and
published in accordance with the formats prescribed by the supervisory and regulatory
authorities and applicable accounting standards in Sinhala, Tamil and English.
3. (8) (ii) Disclosures in Annual
Report
a. A statement to the effect
that the annual audited
financial statements
have been prepared
in line with applicable
accounting standards and
regulatory requirements,
inclusive of specific
disclosures.
A statement to this effect is included in the following:
Directors’ Responsibility to Financial Reporting on page 174.
Annual Report of the Board of Directors on the State of Affairs of the Bank on pages
162 to 166.
b. Report by the Board
on the Bank’s internal
control mechanism
The Annual Report includes the following reports where the Board confirms that the
financial reporting system has been designed to provide reasonable assurance regarding the
reliability of financial reporting, and that the preparation of financial statements for external
purposes have been done in accordance with relevant accounting principles and regulatory
requirements:
Directors’ Statement on Internal Control on pages 171 to 172.
Annual Report of the Board of Directors on the State of Affairs of the Bank on pages
162 to 166.
c Auditor’s certification
on the effectiveness
of the internal control
mechanism
The Bank has obtained a certificate on the Effectiveness of Internal Controls over Financial
Reporting from the Auditor General which is published on page 173.
d Details of Directors, Details of Directors are given on pages 38 to 41.
Directors’ interests in contracts with the Bank are given on pages 167 to 170.
Remunerations paid by the Bank are given in Notes to the Financial statements on page 208.

137
Truly Everybody’s Bank
Section Principle Compliance and Implementation
e Total net accommodation
granted to each category
of related party and as a
percentage of the Bank’s
regulatory capital
“Total net accommodation” granted to each category of related party during the year 2014 as
a % of the Bank’s regulatory capital is given below
LKR ‘000 %
Key Management Personnels (KMPs) and their
Close Family Members (CFMs) 16,021 0.02
Subsidiaries 2,160,847 2.70
Associates 199,529 0.25
Government and Government
related entities (Refer definition in note 55.4) 926,446,393 1,159.08
f. Aggregate values of
remuneration to, and
transactions with Key
Management Personnel
The aggregate amount of remuneration paid by the Bank and transactions with KMPs
(including their CFMs) for the year 2014 are stated below –
LKR ‘000
Short-term employment benefits 92,617
Post employment benefits 24,138
In addition to above, the Bank has also paid non cash benefits such as use of vehicles to
KMPs in line with the approved benefit plan of the Bank.
LKR ‘000
Loans 58,262
Overdrafts 3,411
Credit cards 1,713
Due to customers (Deposits) 104,469
Debentures 7,569
Undrawn facilities 18,598
g. External auditors
certification of
compliance with these
Corporate Governance
Directions
The Bank has obtained a certification from the Auditor General in compliance with Corporate
Governance Direction. All findings of the Auditors have been incorporated in this Corporate
Governance Report and any recommendations will be dealt within 2015.
h. Report confirming
compliance with
prudential requirements,
regulations, laws and
internal controls
The Statement of Directors’ Responsibility for Financial Reporting on pages 174 clearly sets
out details regarding compliance with prudential requirements, regulations, laws and internal
controls.
i. Non compliance Report There were no supervisory concern lapses in the Bank’s Risk Management Systems or
non compliance with these directions that have been pointed out by the Director of Banks
Supervision of the CBSL and to be disclosed to the public if directed by the Monetary Board
and therefore there is no disclosure in this regard.
3.(9) Transitional and other
general provisions
The Bank has taken all possible measures to comply with all applicable provisions of this
Direction that are not inconsistent with the provisions of Bank of Ceylon ordinance No. 53 of
1938 and its amendment, the enabling enactment.

138
BANK OF CEYLON . Annual Report 2014
Board Subcommittee Reports
Terms of Reference, Principal
Focus and Medium of Reporting
The terms of reference of the Audit
Committee are governed by the Audit
Committee Charter, approved and
adopted by the Board. The Audit
Committee focuses principally on assisting
the Board in fulfilling its duties by
providing an independent and objective
review of the financial reporting process.
The proceedings of the Audit Committee
are tabled at the meetings of the Board,
follow up action is taken on outstanding
matters on a regular basis and approval of
the Board is obtained for implementation
of the recommendations made by the
Committee. The effectiveness of the
Committee, is evaluated annually by each
member of the Committee and the results
are communicated to the Board. The
Secretary to the Board functions as the
Secretary to the Audit Committee.
Composition
The Audit Committee comprised of the
following Non-Executive Directors during
the period 01.01.2014 to 31.12.2014 and
the wide range of experience brought to
the Committee, appears in the Directors’
biographical details on pages 38 to 39.
• MrLalithPWithana-Chairman
Independent Non-Executive Director
(Resigned w.e.f. 16.01.2015)
• MrKMMSiriwardane-Member
Non-Executive Ex officio Director
(Ceased to be a Director w.e.f.
28.01.2014)
• MrRajuSivaraman-Member
Independent Non-Executive Director
(Resigned w.e.f. 08.01.2015)
• MsKMANelumaniDaulagala-
Member
Non-Executive Ex officio Director
(Appointed w.e.f. 06.02.2014 and
resigned w.e.f. 06.02.2015)
Meetings
The Committee met nine times during the
year under review and the attendance of
Committee members is provided in the
table on page 116. The quorum of the
Committee is two. A representative of
the Auditor General (External Auditor
of the Bank), the Chief Internal Auditor,
the General Manager, the Chief Financial
Officer and the Chief Risk Officer of the
Bank are present at the meetings by
invitation. Partners and officials of M/s
Ernst & Young, Chartered Accountants
who were the external auditors appointed
by the Auditor General to assist in
the annual audit of the Consolidated
Financial Statements of the Bank and its
subsidiaries for the year 2014, were also
present at the meetings during the year.
Members of the Management are invited
to attend meetings when the Committee
requires their presence.
Activities Performed
Regulatory Compliance and Internal
Controls
The Committee:
• Reviewedthecompliancewith
mandatory banking and other statutory
requirements.
• Reviewedandimprovedtheprocesses
of internal control.
• Reviewedthepostimplementation
review of the application systems in the
Bank.
• Reviewedtheprogressoftheactions
taken in relation to the findings of the
statutory examinations carried out by
the regulators.
The Statement by the Directors, on
Internal Control and the Auditor
General’s report thereon is provided
on pages 171 to 173. Accordingly, the
Committee is of the view that necessary
checks and balances are in place to
provide reasonable assurance that the
Bank’s assets are safeguarded and that the
financial position and the results disclosed
in the Financial Statements are free from
any material misstatements.
Financial Reporting
The Committee:
• Reviewedthemonthlyandquarterly
Financial Statements.
• Reviewedsigniicantjudgments,
estimates and conclusions on the loan
loss provisions relating to individually
significant loans and the adequacy of
collective impairment allowances on
other loans.
• ReviewedtheBank’saccounting
policies and their application to
reporting of the Bank’s activities and
financial performance.
• AssistedtheBoardinensuringthat
Annual Audited Financial Statements
are prepared and published in
accordance with the requirements
prescribed by the supervisory and
regulatory authorities and applicable
accounting standards.
Audit Committee Report

139
Truly Everybody’s Bank
Internal Audit
The Committee:
• Reviewedtheindependence,objectivity
and performance of the internal audit
function as well as the adequacy of the
department’s resources
• Reviewedtheeffectivenessofthe
implementation of the Internal Audit
Plan for year 2014.
• Reviewedthesigniicantinternalaudit
findings and Management’s responses
thereto with a view to taking timely
corrective action.
• ReviewedtheadoptionoftheRisk
Based Internal Control Check List, Risk
Based Audit Guidelines and Internal
Audit Procedures of the Bank.
• EvaluatedtheperformanceoftheChief
Internal Auditor and reviewed the
evaluation of the senior audit staff of
the Internal Audit Department.
External Audit
The External Audit is carried out by
the Auditor General in terms of the
Constitution of the country. The Auditor
General, was assisted by M/s Ernst &
Young, Chartered Accountants, during
the year 2014.
The Committee:
• ReviewedthereportoftheAuditor
General to the Parliament of Sri Lanka
on the accounts of the Bank for the
year ended 31 December 2013, the
Management Letter, the Management’s
responses thereto and followed up on
corrective measures taken by the Bank.
• Reviewedtheoutcomeofthemeeting
of the Parliamentary Committee on
Public Enterprises, in relation to the
above.
• Reviewedandfollowedupupon
interim audit issues identified by the
Auditors pertaining to the audit for the
years 2013 and 2014.
Supervision and Audit of
Subsidiaries and Associates of
Bank of Ceylon
The Committee:
• Reviewedtheauditscarriedouton
certain subsidiaries based on the policy
on Internal Audit of subsidiaries.
• ConductedmeetingswiththeDirectors
of subsidiaries.
Procedure for Complaints
The Committee reviewed the reports
submitted, based on the Bank’s
“Whistleblower Policy” which indicates
the procedure for the receipt, retention
and treatment of complaints received
regarding accounting, internal control
and audit matters. The policy was also
reviewed during the year.
Reconstitution of the Audit
Committee
Pursuant to a reconstitution of the Board,
the present Audit Committee comprises
of the following members, whose profiles
are provided on page 41.
• MrRanelTWijesinha-Chairman
Independent Non-Executive Director
(Appointed w.e.f. 27.02.2015)
• MsPushpaWellappili-Member
Non-Executive Ex officio Director
(Appointed w.e.f. 27.02.2015)
• MrBrianJSinniah-Member
Independent Non-Executive Director
(Appointed w.e.f. 27.02.2015)
Upon the appointment of the above
mentioned Audit Committee, the
Committee reviewed the Audit
Committee Charter, minutes of the
immediately preceding Audit Committee
meeting and had discussions with key
management personnel, the Chief
Internal Auditor and the External
Auditors appointed by the Auditor
General, M/s Ernst & Young, Chartered
Accountants, in respect of the Financial
Statements for the year ended 31
December 2014. Interim and final audit
issues raised by the external auditors and
the manner, in which they were resolved,
were also reviewed and where necessary
further action initiated.
The Committee at its first meeting,
further resolved to begin a process to
assess risk exposures, identify gaps and
weaknesses and areas of non compliance
with procedures, in order to strengthen
relevant risk management and mitigation
measures.
Initiatives were accordingly undertaken,
to review specific systems, procedures
and controls and the scope, approach,
methodology and effectiveness, of the
functions of the office of Chief Internal
Auditor, and the office of the Chief Risk
Officer, and such other key management
positions, as might be deemed necessary.
The corresponding structure, composition,
qualifications, skills and experience,
of resources of these offices were also
reviewed.
Arising therefrom, the following specific
tasks were undertaken:
• Pursuanttoeventswhichoccurred
subsequent to the year end, the
Committee, commissioned M/s Ernst
& Young, Chartered Accountants to
perform an independent procedural
and compliance review of the functions
of the Primary Dealer Unit of the Bank.
Approval of the Auditor General’s
Department was sought and obtained
for this limited scope engagement.
Gaps and weaknesses in systems,
procedures and controls, areas of non
compliance with manuals of procedure
and related risk exposures, were
addressed. Measures were also taken to
strengthen, the scope and effectiveness
of the work of the office of the Chief
Internal Auditor and the office of the
Chief Risk Officer in relation to this
Unit.
• Pursuanttoareviewoftherationale
and adequacy of the loan loss
provisioning effected at year end,
and with a view to implementing
measures to minimize the incidence
and quantum of loan loss provisioning,

140
BANK OF CEYLON . Annual Report 2014
Board Subcommittee Reports
the Committee, through the medium of
the office of the Chief Internal Auditor,
reviewed the credit evaluation process
on account of a selected sample of
significant borrowers.
Key issues and concerns were
identified, and the following were
developed:
• Recommendationsforstrengthening
overall credit evaluation, which
inter alia included greater in depth
assessment of project concepts and
structuring, deeper industry or sectoral
insights, more extensive due diligence
of project promoters, and strengthening
of oversight and monitoring.
• TheCommitteemetwith
representatives of the Boston
Consulting Group, who in the year
2014 had been engaged to perform
a transformation assignment for the
Bank, and sought their agreement
to inter alia review the scope and
effectiveness of several functions,
including the office of the Chief Risk
Officer and the credit evaluation
process, by benchmarking these
functions, against international best
practices.
• Invitedproposalsfromindependent
professional services firms to perform
a limited scope engagement for the
following:
- To review the policies and
procedures prevalent in the Bank,
and compliance therewith and
to report on factual findings, in
relation to stocks of pawned gold
acquired by the Bank pursuant to
auctions.
- To review the policies and
procedures prevalent in the Bank,
and compliance therewith and
to report on factual findings,
in relation to the opening and
operation of the Seychelles branch
of the Bank of Ceylon.
Ranel T Wijesinha
Chairman, Audit Committee
18 March 2015
Colombo
Audit Committee Report

141
Truly Everybody’s Bank
Chairman’s Statement
Roles of the Committee
The main role and responsibility of
the Committee is to assist the Board in
fulfilling its oversight responsibilities for
all aspects of risk management. In this
connection the Committee focuses on
and reviews risks such as credit, market,
liquidity, operational and strategic risks
through appropriate risk indicators and
management information.
In addition to the above, the Committee
is responsible for reviewing and/or
recommending the following which are
identified in the Charter of the Integrated
Risk Management Committee:
• Policies,programmesandManagement
Committee Charters relating to risk
management and compliance.
• Risklimitsandpoliciesthatestablish
appetite for credit, market, liquidity,
operational and other risks, as
recommended by the Chief Risk Officer.
• Adequacyandeffectivenessofall
Management Level Committees such as
the Credit Committee and Assets and
Liabilities Management Committee to
address specific risks and to manage
those risks within quantitative and
qualitative risk limits as specified by the
Committee.
• Riskmanagementreportsontherisk
profile of the Bank, as well as emerging
market and regulatory risks and actions
undertaken to identify, measure,
monitor and control such risks.
• Correctiveactiontomitigatetheeffects
of specific risks in case such risks are
beyond the prudent levels decided
by the Committee on the basis of the
Bank’s policies and regulatory and
supervisory requirements.
• Appropriateactionsagainsttheoficers
responsible for failure to identify
specific risks and prompt corrective
action as directed by the Director of
Bank Supervision of Central Bank of Sri
Lanka or otherwise.
• Adequacyandeffectivenessof
risk identification, measurement,
monitoring and mitigation relating to
credit, market, liquidity, operational
and compliance risks.
Composition and Quorum
The Integrated Risk Management
Committee comprised of 3 members of
the Board during the year 2014. Presently
it comprises 3 members.
The Committee during the year 2014
comprised of the following members:
• MrLalithPWithana-Chairman
Independent Non-Executive Director
(Resigned w.e.f. 16.01.2015)
• MrKMMSiriwardane-Member
Non-Executive Ex officio Director
(Ceased to be a Director w.e.f.
28.01.2014)
• MrRajuSivaraman-Member
Independent Non-Executive Director
(Resigned w.e.f. 08.01.2015)
• MsKMANelumaniDaulagala
- Member
Non-Executive Ex officio Director
(Appointed w.e.f. 06.02.2014 and
resigned w.e.f. 06.02.2015)
The composition of the new committee is
as follows:
• MrBrianJSinniah-Chairman
Independent Non-Executive Director
(Appointed w.e.f. 27.02.2015)
• MrRonaldCPereraPC-Member
Independent Non-Executive Director
(Appointed w.e.f. 27.02.2015)
• MsPushpaWellappili-Member
Non-Executive Ex officio Director
(Appointed w.e.f. 27.02.2015)
Permanent management representatives
on the Committee:
• MrDMGunasekara-GeneralManager
• MrLalithJFernando-ChiefRiskOficer
The experience of the Committee
members can be seen from the Directors’
biographical details appearing on pages 38
and 39 of this Annual Report.
The quorum of the Committee is two
members.
The Secretary, Bank of Ceylon/Secretary
to the Board functions as the Secretary
to the Committee. The Chief Financial
Officer and the Chief Internal Auditor are
invited to be present at the meetings. The
other members of the staff are invited to
attend the meetings when the Committee
requires their presence.
Meetings and Activities
The Committee met 5 times during the
year under review. The attendance of
Committee members at meetings is given
in the table on page 116.
Activities carried out by the
Committee during the year under
review are summarised below:
• Reviewedand/recommendedthe
following policies based on which the
risk profile of the Bank is assessed -
a) Credit Risk Management Policy
b) Market Risk Management Policy
Integrated Risk Management Committee Report

142
BANK OF CEYLON . Annual Report 2014
c) Operational Risk Management Policy
d) Stress Testing Policy
e) Integrated Risk Management Policy
f) Compliance Policy
g) Operational Risk Management Policy
for Electronic Banking and Electronic
Money Activities
h) Foreign Exchange Risk Management
Policy
• TheIndependentIntegratedRisk
Management Division of the Bank
assessed the risks of the Bank on a
monthly basis and summary reports
were submitted before the Committee.
The Committee reviewed them and
submitted its recommendation to
the Board immediately through
minutes of the meeting and specific
recommendations.
• RiskAppetiteandLimitSettingfor
2014 was established.
• Monitoredquantitativeandqualitative
risks which have gone beyond
the limits and made the necessary
recommendations.
• Followeduponthearrangementsthat
are at an advanced stage to purchase
a state-of-the-art risk management
system for managing credit, operational
and market risks and also an Anti
Money Laundering Software Solution.
• Recommendedtheadoptionofthe
revised Internal Capital Adequacy
Assessment Process (ICAAP) for
Chennai Branch.
• Reviewedthecomprehensive
Compliance Reports submitted by the
Compliance Officer.
• Reviewedtheimplementationof5S
System in the Branches.
• ImprovedtheRiskManagementDash
board to support the subsidiaries to
manage their risk functions. Also a
team from the Risk Management
Division has been created to assist
subsidiaries in their risk matters.
• MonitoredKeyRiskIndicatorsinthe
Branch network, critical businesses and
support divisions.
• Reviewedtheresultsoftherisk
and control self assessment at the
International and Treasury Division.
• Recommendedadoptionoftherevised
Business Continuity Plan 2014.
• RecommendedadoptionoftheTerms
and Reference of the Operational Risk
Management Committee and Fraud
Risk Management Committee.
• Revised/RevisitedtheCharter
of Integrated Risk Management
Committee.
The Committee reported to the
Board by way of minutes giving its
recommendations. All minutes of the
Committee meetings are tabled and
ratified at meetings of the Board and
follow up action is taken on outstanding
matters.
The members of the Integrated Risk
Management Committee collectively
evaluated the performance of the
Committee.
With a view to strengthening this
function further the Committee has
embarked on a benchmarking exercise
with international best practices of
risk management. Plans are also afloat
to improve the risk reports that are
generated. The Committee is of the
view that the Bank is on the right
path towards meeting the challenges
of risk management and compliance
safeguarding the interests of Bank’s
stakeholders.
On behalf of the Integrated Risk
Management Committee.
Brian J Sinniah
Chairman, Integrated Risk Management
Committee
18 March 2015
Colombo
Integrated Risk Management Committee Report
Board Subcommittee Reports

143
Truly Everybody’s Bank
Chairman’s Statement
Role of the Committee
The main responsibilities of the
Committee, which are mainly based on
the Banking Act Direction No. 11 of 2007
on Corporate Governance for Licensed
Commercial Banks in Sri Lanka issued
by the Central Bank of Sri Lanka are as
follows:
• DeterminingtheRemunerationPolicy
(salaries, allowances and other financial
payments) relating to the General
Manager (GM) and Key Management
Personnel (KMP) of the Bank.
• SettinggoalsandtargetsfortheGM
and KMP.
• EvaluatingtheperformanceoftheGM
and KMP against the set targets and
goals periodically and determining the
basis for revising remuneration, benefits
and other payments of performance
based incentives.
• Reviewingstaffmattersreferredtoitby
the Board.
• DeterminingtheHumanResource
Policy and Organizational Structure of
the Bank.
In the Bank, the Directors, GM, Deputy
General Managers (DGMs), members of
staff in the allied grade and Compliance
Officer are considered as KMPs.
Goals and targets for GM and DGMs are
embodied in the rolling Corporate Plan
and Action Plan. The GM is responsible
for the implementation of the Corporate
Plan through the DGMs. Targets for
Directors are not given since all the
Directors are Non-Executive.
Composition and Quorum
The Committee comprised of 4 members
of the Board during the year 2014.
Presently it comprises 3 members.
The following Directors served as the
members of the Committee during
the year under review:
• AirChiefMarshalHarsha
Abeywickrema - Chairman
Independent Non-Executive Director
(Resigned w.e.f. 16.01.2015)
• MrRajuSivaraman-Member
Independent Non-Executive Director
(Resigned w.e.f. 08.01.2015)
• MrChandrasirideSilva-Member
Non-Executive Director
(Resigned w.e.f. 16.01.2015)
• MsNaliniDAbeywardene-Member
Non-Executive Director
(Resigned w.e.f. 16.01.2015)
Mr Raju Sivaraman, Director was the
Chairman of the Committee until
02.01.2014 till the appointment of ACM
HarshaAbeywickrema,astheChairman
of the Committee.
ThecurrentHumanResourcesand
Remuneration Committee comprises the
following members:
• MrRonaldCPereraPC-Chairman
Independent Non-Executive Director
(Appointed w.e.f. 18.02.2015)
• MsPushpaWellappili-Member
Non Executive Ex officio Director
(Appointed w.e.f. 18.02.2015)
• MrBrianJSinniah-Member
Independent Non Executive Director
(Appointed w.e.f. 18.02.2015)
The quorum of the Committee is two
members. The GM is present at all
meetings except when matters relating
to GM are discussed. The other members
of the staff are invited to attend the
meetings when the Committee requires
their presence. The Secretary of the
Bank/Secretary to the Board functions as
Secretary to the Committee.
Meetings and Activities
The Committee has met 3 times during
the year under review. The attendance of
members at meetings is given in page 116
All minutes of the Committee meetings
are tabled and ratified at meetings of
the Board and approval of the Board
thus is obtained for implementation
of the recommendations made by the
Committee. Follow up action is taken on
outstanding matters on a regular basis.
According to aforesaid Banking Act
Direction No. 11 of 2007, this Committee
has to determine the Remuneration
PolicyrelatingtoDirectors.However,
in the case of Bank of Ceylon, the
remuneration of Directors is determined
in accordance with the circulars and
instructions issued by the Ministry of
Finance on behalf of the Government
of Sri Lanka, the sole shareholder of
the Bank. The provisions in the Bank of
Ceylon Ordinance No.53 of 1938 and
its amendments, the Act of Parliament
that established Bank of Ceylon are also
taken into consideration with regard
to the Directors’ remuneration and
benefits given to them. The Bank has a
Remuneration Policy in place prepared
based on the above provisions, which is
reviewed as and when new regulations
are issued by the Ministry. This policy was
revised within the year under review.
The details of the remuneration given to
Human Resources and Remuneration Committee Report
144
BANK OF CEYLON . Annual Report 2014
Directors are fully disclosed in the Annual
Report on a yearly basis.
The remuneration of employees is revised
once in 3 years with the approval of
the Minister in charge of the subject
of Finance in accordance with the
provisions of Bank of Ceylon Ordinance.
Prior to finalizing the salaries of the
Senior Management (viz. GM, DGMs
and Assistant General Managers), the
Committee deliberates on the proposals
and makes its recommendation.
During the year under review the
Committee has carried out the
following activities:
• Reviewedthetrainingneedsof
the Bank and made the necessary
recommendations.
• RecommendedtheManPowerPlanof
the Bank for the year under review.
• Revisited/revisedtheRemuneration
Policy of the Chairman and Directors of
Bank of Ceylon.
• RecommendedtheDisciplinaryCode
for Chennai Branch.
• Facilitatedtheperformanceevaluation
of GM through this Committee.
• Carriedoutaperformanceappraisalof
the KMPs.
• Revised/revisitedtheHumanResources
and Remuneration Committee Charter.
• Evaluatedtheperformanceofthe
Committee and submitted to the Board.
The Committee shall continue to assist
the Board in its oversight responsibilities
in regard to human resource and
remuneration matters.
OnbehalfoftheHumanResourcesand
Remuneration Committee.
Ronald C Perera PC
Chairman,HumanResourcesand
Remuneration Committee
18 March 2015
Colombo
Human Resources and Remuneration Committee Report
Board Subcommittee Reports

145
Truly Everybody’s Bank
Chairman’s Statement
Roles of the Committee
The Committee is mainly responsible for
the following:
• Implementingprocedurestoselect/
appoint the General Manager (GM) and
Key Management Personnel (KMP).
• Settingthecriteriasuchas
qualifications, experience and key
attributes for eligibility to be considered
for appointment or promotion to the
post of GM and the key management
positions.
• EnsuringthatGMandKMPareit
and proper persons to hold office
as specified in the criteria given in
Direction No. 3(3) of the Banking Act
Direction No. 11 of 2007 on Corporate
Governance for Licensed Commercial
Banks in Sri Lanka issued by the
Central Bank of Sri Lanka and as set
out in the statutes.
• Consideringandrecommending
from time to time, the requirements
of additional/ new expertise and
succession arrangements for KMP.
• Determiningthemethodsand
execution of the annual evaluations
of the Board’s and each Board
Committee’s effectiveness and
supporting the annual performance
evaluation process.
• ReviewingperiodicallytheBank’sCode
of Ethics.
The Composition of the
Committee
The Committee comprised of 3 members
of the Board during the year 2014.
Presently it comprises 3 members.
The following Directors served as
members of the Committee during
the year under review:
• MrRajuSivaraman-Chairman
Independent Non-Executive Director
(Resigned w.e.f. 08.01.2015)
• MrChandrasirideSilva-Member
Non-Executive Director
(Resigned w.e.f. 16.01.2015)
• MrLalithPWithana-Member
Independent Non-Executive Director
(Resigned w.e.f. 16.01.2015)
The General Manager attends the
meetings by invitation. Other members
of staff are invited to attend the meetings
when the Committee requires their
presence. The Secretary of the Bank/
Secretary to the Board functions as the
Secretary to the Committee.
The current Nomination and Corporate
Governance Committee comprises the
following members:
• MrRonaldCPereraPC-Chairman
Independent Non-Executive Director
(Appointed w.e.f. 18.03.2015)
• MsPushpaWellappili-Member
Non-Executive Ex officio Director
(Appointed w.e.f. 18.03.2015)
• MrBrianJSinniah-Member
Independent Non-Executive Director
(Appointed w.e.f. 18.03.2015)
Meetings
The Committee met 2 times during the
year under review. The attendance of
Committee Members at meetings is given
on page 116.
Reporting to the Board
All minutes of the Committee meetings
are tabled and ratified at meetings of
the Board and approval of the Board
thus is obtained for implementation
of the recommendations made by the
Committee. Follow up action is taken on
outstanding matters on a regular basis.
Appointments Made to the Board
According to the aforesaid Banking Act
Direction No. 11 of 2007, this Committee
has to implement a procedure to select/
appointnewDirectors.However,in
the case of Bank of Ceylon, which is
fully owned by the Government of Sri
Lanka, the appointment of Directors are
carried out by the Minister in charge of
the subject of Finance, as provided in
the Bank of Ceylon Ordinance No.53
of 1938 and its amendments. As such
this Committee does not play any role
in connection with the appointment of
Directors.
The major initiative during the year
under review was the commencement
of a transformation exercise for the Bank
with the assistance of an international
consulting group in order to elevate the
Bank to better heights.
Nomination and Corporate Governance Committee Report

146
BANK OF CEYLON . Annual Report 2014
Activities that have been performed
during the year under review
• Recommendedtheamended
Disciplinary Code of the Bank.
• Recommendedbenchmarkingthe
Performance Appraisal System of the
Bank with industry best practices.
• ReviewedtheCommunicationPolicyof
the Bank.
• ReviewedtheSuccessionPlan.
• ReviewedtheCodeofEthicsof
employees and Directors.
• Discussedtheareasforimprovement
highlighted in the Auditor General’s
report of factual findings on the
compliance requirements of the
Corporate Governance Directions
issued by the Central Bank of Sri
Lanka.
• TheCommitteerevieweditsown
performance and ensured the
Committee’s effectiveness and smooth
functioning.
• Revisited/reviewedtheexistingcharter
of the Nomination and Corporate
Governance Committee.
The Committee will endeavour to
enhance good Corporate Governance
practices in the Bank.
On behalf of the Nomination and
Corporate Governance Committee.
Ronald C Perera PC
Chairman, Nomination and Corporate
Governance Committee
18 March 2015
Colombo
Nomination and Corporate Governance Committee Report
Board Subcommittee Reports

147
Truly Everybody’s Bank
Risk Management
Bank NPA
3.8%
Industry NPA
4.2%
Asset Quality
Improved asset quality that is above
the industry norm, was achieved
through strong credit sanctioning
and monitoring processes along with
efficient collection process.
Diversified Business Lines
Endeavour to improve commercial
loan portfolio proved success during
the past three years thus reducing
concentration of loans to state sector
and pawning advances, which
provide a strong foundation for
sustainable growth.
2012 2013 2014
Commercial Loans as % of Total Loans
59
%4
1%
47
%5
3%
46
%5
4%
Commercial Other
Strong Risk Culture
Extensive training on risk
management principles, the Bank’s
risk appetite and planned initiatives
have enabled the Bank to maintain a
disciplined approach and to respond
effectively.
2012 2013 2014
Actual Loss as a % of Operational Risk Capital Charge
1.1
7%
0.2
5%
0.1
5%
Strong Capital
An effective capital management
framework embedded in the
risk culture facilitates risk return
trade-off. An infusion of fresh
capital in both forms of equity
and subordinated debt resulted in
strengthening capital base along with
accumulated retained earnings.
2012 2013 2014
Capital Adequacy
11.5%
5%
10%
12.1%13.6%
T I
RegulatoryT II
RegulatoryT I
T II
Improved Margins
Improved deposit mix, better Asset
and Liability Management (ALM)
initiatives and containment of NPA
enabled the Bank to improve Net
Interest Income (NII) and in-turn
increase profitability.
2012 2013 2014
Net Interest Income
LKR Mn
35
,32
0 37
,14
3 38
,45
0
Effective Risk Management
Liquidity Management
A healthy funding mix of borrowings and deposits combined with a deposit base
diversified by type and maturity facilitates effective management of liquidity.
Deposits Vs Borrowings
Deposits
Borrowings20132012
74%70%
30%
26%
2014
75%
25%

148
BANK OF CEYLON . Annual Report 2014
Risk Management
First Line of Defence
Business Operations
Ownership
Second Line of Defence
Risk Management
Insight, Appetite and
Review
Third Line of Defence
Compliance and Audit
Internal and External
Assurance
• Ensuresbusiness
activities are
conducted in
defined controlled
environments
• Identify,monitorand
control risks
• Executetherisk
appetite
• Developandreview
policies, frameworks,
tools and processes
• Deinestandards
and oversee related
consequence
management
• Establishriskappetite
• Oversee,monitorand
challenge the business
• Provideinsights
• Carryoutstresstesting
• Compliance
• InternalAudit
• Independent
assurance and
oversight of the
robustness of the risk
management function
Evolution of risk management function
has been rapid as the financial services
industry globally dealt with consequences
of insufficient focus on this vital area
which is tasked with managing potential
risks that may impede achievement of the
corporate objectives. Financial industry
players assume appropriately priced risks,
and prudently manage them within
a well-articulated risk management
framework.
At Bank of Ceylon, we have a proactive
and forward looking risk management
philosophy that is clearly communicated
throughout the Bank, which is necessary
for the creation and evolution of an
appropriate risk culture that balances
growth and risk. Risk philosophy of the
Bank is aligned with the vision, mission,
policies, and goals in order to ensure
an efficient resource allocation within
an appropriate strategic management
framework. Our internal processes ensure
that the returns are commensurate with
the risks assumed and managed within
the defined risk appetite.
Risk Governance
Risk management is effected through a
risk governance structure based on the
three lines of defence model and a policy
framework that is clearly communicated
and understood throughout the Bank.
The governance structure comprises
Board, Board subcommittees and
Risk
Governance
Risk Appetite
Risk Management Techniques
•Regulatoryframework
•Boardandseniormanagementoversight
•Guidelines,policies,processesandstandards
•Measuring,monitoringandreporting
•Businessstrategiesandobjectives
•Capitaladequacy
•Riskappetitemeasures
Management Committees. Chief Risk
Officer (CRO), under the supervision
of the Integrated Risk Management
Committee (IRMC) which is a
Board subcommittee, heads the risk
management division of the Bank.
Risks arise in the business units of
the Bank including departments that
are responsible for the initial risk
assessments which are then reviewed
by the Independent Integrated Risk
Management Division (IIRMD) where
necessary and escalated to the Board
/ management level committees as
appropriate. An experienced senior
team of banking professionals nurture a
risk culture throughout the Bank which
is enhanced through comprehensive
awareness programmes.
The Board has overall responsibility to
ensure that the most significant risks
to the Bank are competently managed.
Risk Management Framework
Three Lines of Defence Model

149
Truly Everybody’s Bank
The establishment of a sound capital
assessment process through defining
the risk appetite and setting tolerance
for risks also lies with the Board.
IRMC assists the Board in fulfilling its
oversight responsibilities with respect to
the operation and effectiveness of risk
management function of the Bank.
As an oversight of the risk management
function of the Bank, IIRMD functions
as a separate division, independent from
revenue generating Strategic Business
Units (SBU). New standards for financial
institutions introduced by the Basel
Committee and Central Bank of Sri
Lanka (CBSL) are integrated into the risk
management strategy and framework of
the Bank through IIRMD.
Capital
Planning
Strategy Risk
Risk Appetite and Strategic
Planning Process
ICAAP and
Stress Testing
The strategic planning describes
the Bank’s philosophy towards risk
management and broad measures
employed to balance risk and
performance. Risk appetite statement
formally articulates the Bank’s willingness
to accept risks. This is critically important
as the Board approves the risk appetite
statement and ensures its consistency
with the Bank’s risk and strategic goals.
The analysis of the Bank’s current and
future capital requirements in relation to
its strategic objectives is a vital element of
the strategic planning process.
Risk Appetite
The risk appetite defines the level of risks
that the Bank is prepared to tolerate in
pursuit of its business strategy. The Board
determines the overall risk appetite of
the Bank with inputs from the IIRMD,
taking into account the risk reward
trade-off and the resources available for
implementation of the business strategy.
Both the strategic plan and the risk
appetite statement of the Bank are
guided by a set of principles, where the
Bank assigns metrics / thresholds to
operationalize the intended behaviour
and to evaluate performance against
stated goals.
Risk Limiting Thresholds
Top and emerging risks embedded across
our operations are addressed in the Risk
Appetite through a framework of limits
and thresholds. Effective thresholds are
essential in managing aggregate risks
within acceptable levels. Quantifiable
risk limits are cascaded from Risk
Appetite through a top down approach
and operationalized through formal
frameworks. Qualitative risk aspects are
guided by expression of principles.
Stress Testing
Stress testing is an integrated, multi-
variant and probabilistic test that shows
degrees of severity of unforeseen
scenarios. Stressed scenarios enable
managers to assess the Bank’s potential
vulnerability to plausible adverse
events and also allow them to identify
Risk Appetite Framework
Key Risks Aspect Risk Limiting Thresholds
Credit
Risk
Default
Risk
• GrossNonPerformingAssets
• ProvisionCover
Concentration
Risk
• SingleBorrowerLimitsforGroupsandIndividuals
• IndustrySector
Market
Risk
Foreign
Exchange Risk
• Exposurelimits
• VaRlimits
Interest Rate
Risk
• Gaplimits
• PVBPlimits
Equity Price
Risk
• Portfoliolimits
• VaRlimits
Liquidity
Risk
• LiquidAssetsRatio
• MaturityGaplimits
• AdvancestoDepositsRatio
• LiquidityCoverageRatio
Operational
Risk
• Losslimits
Board of Directors
Integrated Risk Management Committee Audit Committee
Management Committees
Risk Management Audit Compliance Finance
Risk Management Governance Structure
150
BANK OF CEYLON . Annual Report 2014
Risk Management
opportunities for rapid and effective
responses.
The Bank runs a stress testing programme
on a regular basis and the results are
reported to appropriate levels. The stress
testing framework will cover a number
of different types of scenarios, some are
bank specific and some are systemic.
Typically stress tests use three levels
of severity for each scenario. i.e. mild,
moderate and severe.
All stress tests are documented, and the
results are used to calibrate the thresholds
and boundaries of the risk appetite.
Internal Capital Adequacy
Assessment Process (ICAAP)
ICAAP is a strong component of a
robust risk management framework to
determine the adequate capitalisation of
the Bank, given the risks endured as well
as future risks arising from growth and
changes in the business model. This is
necessary as minimum regulatory capital
requirements under Pillar I of the Basel
II framework address only credit, market
and operational risks on an average basis.
Through ICAAP, the capital planning
process takes into account the demand for
capital under Pillar II in addition to the
Pillar I requirements and a range of stress
scenarios against the available capital.
Following Pillar II risks are covered in the
ICAAP.
1. Concentration risk
2. Liquidity risk
3. Interest rate risk in the banking book
4. Reputation risk
5. Strategic risk
6. Compliance risk
ICAAP ensures that the Bank’s overall
risk and rewards are aligned with Risk
Appetite through the strategic planning
process.
The ICAAP Steering Committee which
is headed by the General Manager is
the principal management committee
responsible for the development and
implementation of a sound ICAAP
across the Bank to assess, quantify and
monitor risk in addition to the regulatory
compliance. It comprises Chief Risk
Officer, Chief Financial Officer and heads
of Strategic Business Units (SBUs).
Credit Risk Management
Credit risk is the potential loss to the
Bank due to the failure of a customer
or counterparty to meet its obligations
in accordance with agreed terms and
conditions. The Bank’s credit risk
that incurs mainly from lending and
investment activities account for over
80% of the total risk weighted assets.
As the Bank caters to diversified customer
base across the country and three
overseas locations, it is paramount to
create uniform measures. Our customer
base has varied demands ranging
from rural credit that amounts to few
thousands to the multi-billion facilities for
most affluent corporate customers. The
goal of the Bank’s credit risk management
is to maximize risk adjusted rate of return
by maintaining credit risk exposures
within acceptable parameters. The
successful management of credit risk is
a critical factor for the Bank’s dominant
market position.
Credit Risk Governance
Overall responsibility of credit risk
management lies with the Board which
approves policies and procedures that
are in place for managing credit risk at
both individual and portfolio levels. The
Credit Committee which is headed by the
General Manager of the Bank is the main
management level committee responsible
for credit risk management.
The Credit Committee
• Formulates,reviewsandrevises
policies and procedures relating
to credit facilities, whilst ensuring
compliance with statutory and
regulatory requirements
• Approvessanctioningofcreditupto
its delegated authority limit or makes
appropriate recommendations to the
Board
• Reviewsthecreditlimitsfromtime
to time with a view to monitor and
ensure maintenance of credit quality
• Monitors,reviewsandrenews
portfolio exposures and concentration
risk and takes remedial actions in
respect of non-performing advances
IIRMD measures and tracks the status of
the credit portfolio, undertakes impact
studies and identifies early warning
signals pointing to a deterioration of the
financial health of the borrowers. Credit
risk management reports are presented to

151
Truly Everybody’s Bank
the Credit Committee and the IRMC on a
regular basis to ascertain performance and
portfolio concentration.
Credit risk management policy lays
down the conditions and guidelines
for granting, maintenance, monitoring
and management of credit at both the
transaction and portfolio levels. This
policy is consistent with prudent practices,
regulatory requirements and nature and
complexity of the Bank’s activities.
Identification, Assessment and
Monitoring
The Bank has a well established process
for approving new credits and for
the renewal of existing credit. All the
potential credit exposures of the Bank are
first evaluated by transaction originators
who are the risk owners of the credit
mechanism. Credit proposals exceeding
a certain threshold are referred to IIRMD
for independent evaluation.
An internally developed corporate
borrower rating model which
encompasses both the financial and
non-financial parameters in compliance
with Basel II guidelines is in place. In
addition, credit scoring models are being
deployed to assess retail credits. These
indicators help to measure the risk profile
of the credit portfolios in an objective
manner while complementing the Bank’s
endeavours in progressing towards Basel
II advanced approaches.
Collateral Management
The primary source of repayment
of credit exposure being cash flows,
collateral obtained by the Bank act
as secondary source of recovery.
Collateral is the security provided by the
borrower, generally in the form of an
asset, which can be used by the Bank
to mitigate possible credit loss in the
event of a default. Procedures have been
implemented to ensure that the value of
Credit Risk Environment Credit Granting Process Credit AdministrationCredit Risk Mitigation
and Control
• Deinedriskappetite
• Robustriskgovernance
structure
• Comprehensivepolicy
framework
• Segregationofduties
in credit approval/ risk
management/credit
administration
• Nurturingacultureof
risk awareness through
sustained training,
communication and
feedback
• Understandingcustomers
and their operating
environment
• Welldeinedriskacceptance
criteria
• Delegatedapproval
authotiry at multiple levels
• Internalcreditratingmodels
• Risklimitingthresholdsset
in line with risk appetite
• Structuredand
comprehensive credit
appraisal
• Reviewoflargecredit
exposures by CRO
• Postcreditmonitoring-
emphasis on relationship
management, internal and
external early warning
signals
• Regulardiscussionswith
clients to initiate remedial
action where necessary
• Portfoliomanagement
- industry, product and
geographic diversification
• Interimreviewsofselected
large exposures
• Postsanctioningreviewof
large exposures by Credit
Quality Assurance Unit
• Consistentcreditrisk
mitigation strategies
• Valuationandregular
updation of collateral
• Evaluationofrisk
mitigants (eg:- credit
insurance, guarantees)
with the consideration of
counterparty risks, and legal
implications
• Independentassurance
through internal credit audit
process
the collateral is reviewed and updated
regularly to provide the anticipated
secondary source of repayment in an
eventuality.
Concentration Risk
The Bank monitors credit risk on a
portfolio basis to manage concentration
risk. Concentration risk in credit portfolio
arises due to uneven distribution
of loans and advances to individual
borrowers (single /name concentration)
or to industries and geographical regions
(sector concentration). The Bank’s loan
portfolio is diversified across different
industries and geographic regions.
The Bank has established appropriate
limits to maintain concentration risk
at an acceptable level and significant
concentrations are reported to the
Credit Committee, IRMC and the Board
for review. Analytical tools are used to
quantify the concentration risk of the
Bank.
Credit Risk Management Framework

152
BANK OF CEYLON . Annual Report 2014
Risk Management
Risk Factor Risk Indicators Remarks
Default Risk
Potential loss due to borrower/counterparty unable
or unwilling to meet its obligations
1s tQuarter
3rdQuarter
2ndQuarter
4thQuarter
Non Performing Advances
%
2013
2014
5.4
23
.35 3.6
74
.28
4.3
34
.47
4.3
23
.78
Concentration Risk
Credit exposure being concentrated on one or few
lending sectors, groups, insufficient diversification
Concentration by Industry Sector
Agriculture and fisheries
Banking finance and insurance
Hotels , travels and s ervices
Hous ing, cons truction and
infras tructure
Manufacturing
Commercial trade
Sovereign and direct government
Trans portation and logis tics
Other commercial s ervices
Cons umption and others
11%1%
3%
18%
6%
28%
11%
5%1%
16%
Concentration by Geographic Region
Eastern Province
Southern Province
Central Province
North Western Province
Uva Province
Overs eas Branches
Nothern Province
Wes tern Province
North Central Province
Sabaragamuwa Province
Offs hore Banking Unit
1% 4% 4%4%
3%2%2%
48%
5%
3%
24%
Credit Risk Register
Significant
concentration on
Western Province is
mainly due to financing
infrastructure projects
from which the country
and economy would
benefit as a whole.
The Bank’s continuous
reviewing and strong
follow up mechanism
for speedy recovery of
its NPA yielded very
good results.
70% of the credit
exposure is
collateralized mitigating
the default risk.
Sector exposures are
within the risk appetite
limits (in absolute
terms).
Collateral wise Exposure
Cash
Property
Govt Securities / Gurantees
Movables
Pledged against Gold
Others
Unsecured
1%13%
35%
30%
7%
10%
4%

153
Truly Everybody’s Bank
Market Risk Management
Market risk is defined as the potential for
change in the market value of our trading
and investment positions. Market risk
can arise from changes in interest rates,
foreign exchange rates, equity prices and
commodity prices. The main objective of
market risk management is to optimise
the risk reward relationship without
exposing the Bank to unacceptable losses.
Market Risk Governance
The Bank has a comprehensive
framework for managing the market
risk as laid down in the Market Risk
Management Policy, along with other
policies covering Asset and Liability
Management, Foreign Exchange
Risk, Liquidity Risk and the Treasury
Management. These form the basis for
structure, processes and controls in line
with Basel II Standardised Measurement
Method prescribed by the CBSL. These
policies provide guidance on:
• Establishingandmaintainingan
appropriate structure for managing
market risk
• Ensuringtreasuryoperationsare
efficiently and effectively managed
• Establishingappropriaterisklimiting
thresholds for all areas of treasury
activities, including trading and
investments
• Monitoringandmanaging
impacts arising from the operating
environment on relevant parameters,
including results of stress testing
The Asset and Liability Management
Committee (ALCO) is the key
management committee that has
responsibility for managing market
risk. ALCO comprises of key corporate
management members chaired by
the General Manager. The Committee
manages these risks through constant
monitoring and implementing corrective
actions through various mechanisms
such as the management of advances,
deposits and investment portfolios. Key
functions of the committee include
decisions on product pricing, determining
the optimum mix of assets and liabilities
and stipulating the liquidity gap position
and interest rate risk limits, formulating
views on interest rates, setting benchmark
lending rates and determining the asset
and liability management strategy in light
of the current and expected operating
environment.
The Middle Office function plays a key
role in monitoring market risk and is
guided by a comprehensive framework of
treasury operating limits approved by the
Board.
Identification, Assessment and
Monitoring
The Bank manages the risk in its trading
and non-trading portfolios through a
comprehensive market risk management
framework which includes risk appetite
limits, market limits, Value at Risk (VaR)
limits, stress testing and sensitivity
analysis.
Equity investments are made in
accordance with the Bank’s Investment
Policy which has defined criteria to
manage diversification and portfolio
limits to ensure risk reward balance
is maintained within the defined risk
appetite.
Stress scenarios are evaluated to analyse
how the Bank`s profitability, liquidity
and capital adequacy would be affected
if business conditions become more
challenging as a result of market volatility.
Limit threshold exceptions are escalated
to ALCO, IRMC and the Board at regular
intervals.
Risk Factor Risk Indicators Remarks
Foreign Exchange Risk:
Risk arising from foreign exchange
positions
Feb
Ap
r
Jun
Au
g
Oct
Dec
10
100
1,000
10,000
100,000
Forex VaRLKR Mn
(Logarithmic Scale)
VaR
R isk Appetite
Market Risk Register
Forex VaR was well within
the risk appetite limit
throughout the year given
the moderate level of open
positions maintained.
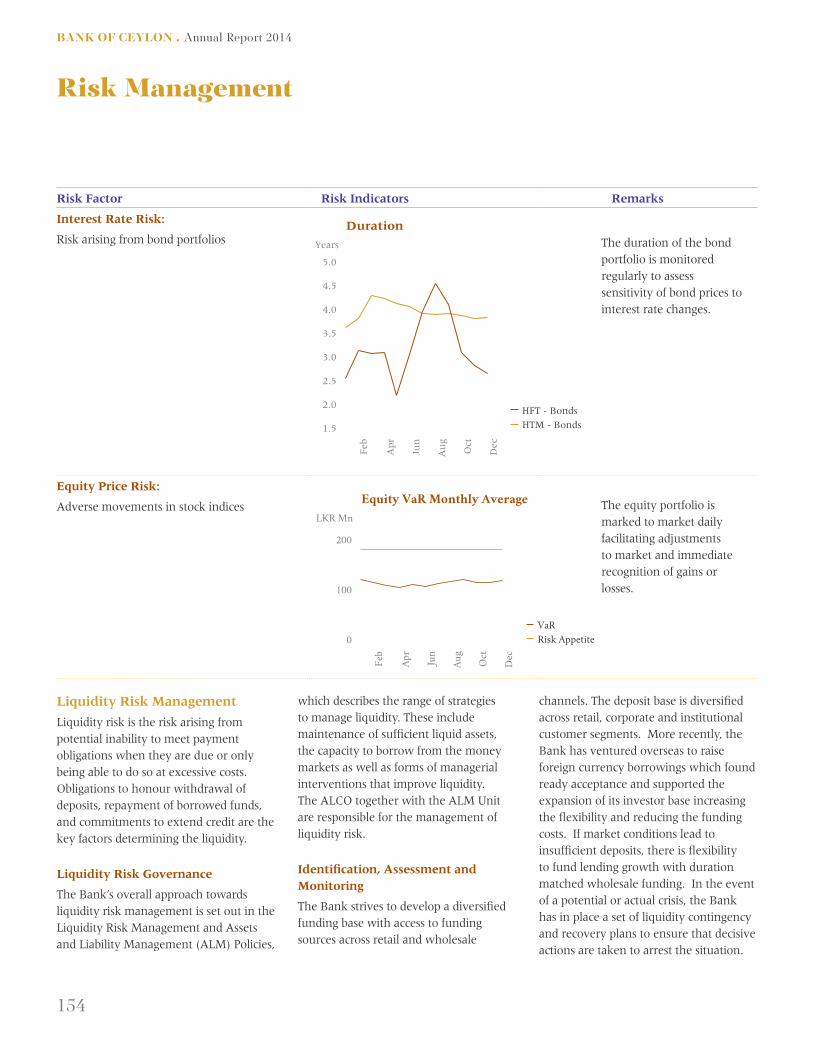
154
BANK OF CEYLON . Annual Report 2014
Risk Management
The duration of the bond
portfolio is monitored
regularly to assess
sensitivity of bond prices to
interest rate changes.
The equity portfolio is
marked to market daily
facilitating adjustments
to market and immediate
recognition of gains or
losses.
Liquidity Risk Management
Liquidity risk is the risk arising from
potential inability to meet payment
obligations when they are due or only
being able to do so at excessive costs.
Obligations to honour withdrawal of
deposits, repayment of borrowed funds,
and commitments to extend credit are the
key factors determining the liquidity.
Liquidity Risk Governance
The Bank’s overall approach towards
liquidity risk management is set out in the
Liquidity Risk Management and Assets
and Liability Management (ALM) Policies,
which describes the range of strategies
to manage liquidity. These include
maintenance of sufficient liquid assets,
the capacity to borrow from the money
markets as well as forms of managerial
interventions that improve liquidity.
The ALCO together with the ALM Unit
are responsible for the management of
liquidity risk.
Identification, Assessment and
Monitoring
The Bank strives to develop a diversified
funding base with access to funding
sources across retail and wholesale
channels. The deposit base is diversified
across retail, corporate and institutional
customer segments. More recently, the
Bank has ventured overseas to raise
foreign currency borrowings which found
ready acceptance and supported the
expansion of its investor base increasing
the flexibility and reducing the funding
costs. If market conditions lead to
insufficient deposits, there is flexibility
to fund lending growth with duration
matched wholesale funding. In the event
of a potential or actual crisis, the Bank
has in place a set of liquidity contingency
and recovery plans to ensure that decisive
actions are taken to arrest the situation.
Risk Factor Risk Indicators Remarks
Interest Rate Risk:
Risk arising from bond portfolios
Feb
Ap
r
Jun
Au
g
Oct
Dec
1.5
2.0
2.5
3.0
3.5
4.0
4.5
5.0
Duration
Years
HFT - Bonds
HTM - Bonds
Equity Price Risk:
Adverse movements in stock indices
Feb
Ap
r
Jun
Au
g
Oct
Dec
0
100
200
Equity VaR Monthly Average
LKR Mn
VaR
Risk Appetite

155
Truly Everybody’s Bank
Unencumbered securities
available for funding
have improved in 2014
indicating a comfortable
liquidity position.
As may be observed, the
favourable gap in the
1-3 year band provides
leverage for growth and
there is sufficient time
for managing the over 5
year’s gap with appropriate
strategies as opportunities
arise in the operating
environment.
Risk Factor Risk Indicators Remarks
Liquidity Risk:
Inability to meet obligations as and when they
fall due
Feb
Ap
r
Jun
Au
g
Oct
Dec
50,000
100,000
150,000
200,000
Unencumbered Securities available for Funding
LKR Mn
2013
2014
0-1 month
1-3 months
3-6 months
6-9 months
9-12 months
1-3 years
3-5 years
Over 5 years
-10-15 -5 0 5 10 15 20 25 30
Maturity Analysis of Assets and Liabilities
%
Gap
Outflows
Inflows
Liquidity Risk Register
Operational Risk Management
Operational risk is the risk of loss
resulting from inadequate or failed
internal processes, people and systems or
from external events. It originates from
both business and support units of the
Bank and is distinct and controlled within
the criteria set out in the risk appetite
through an effective and efficient system
of internal controls.
Operational Risk Governance
The Board approves the operational risk
management policies and procedures
with recommendations from the IRMC.
IIRMD is responsible for identification,
measurement, monitoring and reporting
operational risk and also review of policy
frameworks and procedures related to
operational risk. It is supported by the
Operational Risk Management Executive
Committee (ORMEC) and the Fraud Risk
Management Committee headed by the
CRO. These committees review reports
and recommend corrective actions on a
regular basis and make amendments to
policies and procedures if required.
Additionally, IIRMD has oversight
responsibility for the Business Continuity
Plan and reports to the ORMEC
and IRMC on a regular basis on its
functioning. Also CRO is a member of
the Corporate Information Security
Committee chaired by the General
Manager which directs the information
security initiatives of the Bank.
IIRMD is represented in all new product
initiative committees and appropriate
sign off is provided prior to implementing
new or improved products and processes.
Similarly, all system developments, new
system acquisitions and upgrades are
reviewed by the IIRMD.
Identification, Assessment and
Monitoring
IIRMD uses several techniques to
identify, assess and monitor operational
risks which include Key Risk Indicators
(KRI), Risk and Control Self Assessments
(RCSA), Internal Loss Data Collection
and Analysis, root cause analysis and
lessons learned exercises. It also reviews
and analyses external events to identify
areas of risk and appropriate mitigating
activities.
KRIs are used to alert the Bank on
impending problems in a timely fashion.
Branch level and department level KRIs
are captured and reported to appropriate
authorities on a regular basis.

156
BANK OF CEYLON . Annual Report 2014
Risk Management
Risk Factor Risk Indicators
Key Risk Indicators (KRIs)
KRIs is a measurable metric or indicator
that tracks exposure or loss.
Audit IssueManagement Index
Bus ines s ContinuityIndex
Cus tomer Satis factionIndex
Information Security Index
Proces s QualityIndex
Staff Satis faction& Competence Index
Regulatory Index
0 5 10 15 20
No of Key Risk Indicators Defined
No. of Indicators
The number of KRIs defined reflect the importance of this area to the Bank. As may be
observed, the process quality index and the customer satisfaction index have been the
focus of attention with a relative higher number of indicators being tracked to ensure
positive results to drive business growth and efficiency in processes enhancing the
customer experience.
Operational Risk Register
RCSA is a methodology that involves
review and assessment of the operational
risks across the Bank and the internal
controls designed to manage those risks.
IIRMD conducts RCSA in critical business
and support units periodically to take risk
mitigating measures.
Loss data reports are evaluated, reviewed
and aggregated to ORMEC, IRMC and the
Board to take appropriate actions on a
regular basis.
Control and Mitigation
The Bank has in place a policy and
procedure framework for managing
operational risks. These include
segregation of duties, clear management
reporting lines, robust internal controls
and business continuity planning
together with more targeted actions such
as insurance, information security and
outsourcing.
Insurance instruments are used as a risk
transfer strategy to mitigate high severity
risk from non-controllable sources.
Ceybank Insurance Services Unit of
the Bank assesses the risk involved and
obtains insurance to adequately cover
these risks.
In accordance with the Business
Continuity Management Policy all
critical business and support units have
developed their own unit business
continuity plans. Two test runs were
successfully completed during the year
under review and detailed results were
reported to relevant authorities. A
disaster recovery centre is in place outside
Colombo City limits with alternate
arrangements to facilitate continuing key
operations in the event of various pre-
defined disaster scenarios.
Legal risk is assessed by ORMEC with the
assistance of the Chief Legal Officer for
legal implications arising from the Bank’s
operational risk issues.

157
Truly Everybody’s Bank
Frequency of Occurrence
Internal fraud
External fraud
Employment practices and
workplace safety
Execution, delivery and
process management
20132014
6%39%
2%
59%41%
3%
50%
Risk Factor Risk Indicators
Loss data Management
Severity of Risk Events
20132014
12%56%
8%
36%
67%
4%
17%
Internal fraud
External fraud
Employment practices and
workplace safety
Execution, delivery and
process management
The frequency and severity of loss incidents have reduced with significant reduction in
external fraud events due to tightening of controls and security.
Strategic Risk Management
Strategic risk arises from the Bank’s
inability to implement appropriate
business plans, strategies, decision
making, resource allocation and to adapt
to changes in business environment.
The Bank operates in a highly
competitive, dynamic and regulated
environment. Inability to respond to
frequent changes will adversely affect
the profitability, capital adequacy and
liquidity. The Bank’s strategic direction
is well articulated in the Corporate Plan
and the Corporate Budget. The Bank has
in place a robust mechanism to ensure
the congruence of the actual performance
with the strategic direction.
As part of the Bank’s ICAAP, strategic risk
is assessed using a score card based model.
Strategic Risk Index 2014
Risk Indicator Weighted Score
Industry/System 5.25
Competition 7.81
Strategic Plan 19.69
Access to Capital
Markets
3.75
Management 9.38
Total 45.88%
Risk level – Low risk
According to the strategic risk score card
parameters the Bank reflects lower risk.
Reputation Risk Management
In a volatile global marketplace, where
media coverage is almost simultaneous
across the world and where reputation
is seen as a key source of competitive
advantage, trust and confidence are
understood to be the key business drivers.
For a bank which deals with public
money, reputation is a source of strength.
Reputation risk management can be
a matter of corporate trust, and also
serves as a tool in crisis prevention.

158
BANK OF CEYLON . Annual Report 2014
Risk Management
The Bank is therefore dedicated to
managing reputation risk by promoting
strong corporate governance and risk
management practices at all levels of the
organization.
The Bank has not faced any material
adverse publicity, deposit runs or
regulatory penalties, and has created a
strong brand recall in the minds of Sri
Lankan customers.
The Bank uses a scorecard approach to
assess the reputation risk.
Reputation Risk Index 2014
Risk Indicator Weighted score
Operational loss
events
11.46
Business loss events 6.11
Market perception 24.44
Management 8.33
Total 50.34%
Risk level - Low risk
The results of the scorecard, shows lower
risk for reputation risk. The consistent
positioning of Bank of Ceylon as the
leading brand in the country provides
a high degree of comfort on the Bank’s
ability to manage this risk.
Compliance Risk Management
Compliance risk is the risk of legal or
regulatory sanctions, financial losses, or
loss to reputation a bank may suffer as
a result of its failure to comply with all
applicable laws, regulations, and codes of
conduct and standards of good practices.
The Bank has a compliance programme to
provide a framework that fosters a culture
of compliance throughout the Bank.
The Bank has a separate division headed
by the Compliance Officer who reports
to the Board and IRMC to manage the
Bank’s compliance risk as per CBSL
requirements. The compliance division
comprises of the regulatory compliance
unit and the Anti-Money Laundering
(AML) Unit. This division is responsible
for ensuring that the Bank, complies
with regulatory requirements, internal
guidelines with the Bank’s compliance
policy.
The Board approved compliance policy
of the Bank encapsulates the Bank’s
compliance philosophy, principles
governing the compliance function, the
structure and processes to ensure effective
and timely management of compliance risk.
The Bank also has an AML policy
which comprehensively covers AML
compliance standards which apply to all
business units within the Bank. The Bank
Compliance Framework
Reg
ula
tory
Cu
stom
er D
ue
Dilig
ence
An
ti M
on
ey
Lau
nder
ing
Kn
ow
You
r
Cu
stom
er
Indu
stry
Bes
t
Pra
ctic
e
Sta
tuto
ry

159
Truly Everybody’s Bank
takes into account, the regulatory/legal
requirements, the strategic challenges
and opportunities that regulatory
developments may present for the Bank’s
business model and how the Bank should
discharge its corporate responsibility in
formulating these policies.
Monitoring and Risk Assessment
The compliance division assesses and
monitors broad areas of compliance risk
across the Bank adopting a risk based
approach and proactively identifies,
monitors, and takes measures to
mitigate compliance risk . The unit
is responsible for dissemination of
regulatory requirements to business
units for necessary action and ensuring
that they operate within oversight and
implementation of compliance program
within the boundaries set by the Bank
and the regulator. The compliance unit
conducts periodic risk assessments to help
identify risk and develop a compliance
work plan that is reviewed and approved
by the IRMC. Other functions include
facilitating incorporation of regulatory
requirements into operational procedures,
corrective actions to remedy instances
of non compliance and to mitigate
compliance risk exposure.
Reporting
Keeping the Board and Corporate
Management informed of regulatory
issues and developments is a vital part
of the compliance function. Compliance
status of the Bank is submitted to the
Board monthly and quarterly basis
covering the following:
• complianceonstatutory/mandatory
reporting requirements
• signiicantnewregulations/Directions
• signiicantnoncomplianceevents
including regulatory and potential
breaches
• trainingundertakenandidentiication
of training needs
• compliancemonitoringonregulatory/
AML
• Detailsofcompliancetestingcarriedout
IT solutions have been implemented to
identify unusual transaction patterns,
suspicious transactions, screening
and enable reports to the Financial
Intelligence Unit. The new development
enables the compliance unit to operate
in efficiently and timely manner. The
compliance unit activities contribute
towards establishing a compliance culture
that fosters prudent risk management
and strict compliance with regulatory
requirements.
CBSL has issued 17 Directions during
2014 of which 15 are applicable to the
Bank and the Bank has complied with.
Statutory Compliance
The compliance function at the Bank is
performed to comply with all relevant
laws, regulations and guidelines inclusive
of Convention on the Suppression of
Terrorist Financing Act - No.25 of 2005,
Prevention of Money Laundering Act
- No.5 of 2006, Financial Transaction
Reporting Act - No.6 of 2006 and
Customer Charter of Licensed Banks
issued by CBSL. Further, the Bank has
registered with USA to comply with
Foreign Account Tax Compliance Act
(FATCA) in the year 2014. Reporting of
transactions of USA clients to the Internal
Revenue Service (IRS) will commence
from March 2015.
Way Forward
We realize that the risks threatening
the future are constantly evolving
and our capabilities must develop as
rapidly. We are continuously increasing
our investment in risk management
and believe that technology can help,
especially in breaking down the barriers
between the risk and control oversight
functions.
Given the nature of risk management,
we focus more on qualitative value
drivers together with a limited number
of quantitative drivers. After all, when
risk management is fully embedded in
the Bank’s processes and culture, risk
management is everyone’s responsibility,
thus emphasizing the importance of an
enterprise wide view of risk through the
ICAAP framework.
Amid volatile external environment and
persistent regulatory challenges, we strive
to achieve strategic objectives through
optimum risk return trade-off.

TrulyBank
Everybody’s

161
FinancialReports
Financial Reports
Annual Report of the Directors on the State of Affairs of Bank of Ceylon 162
Directors’ Interests in Contracts 167
Directors’ Statement on Internal Control over Financial Reporting 171
Independent Assurance Report 173
Directors’ Responsibility for Financial Reporting 174
Report of the Auditor General 175
Income Statement 176
Statement of Other Comprehensive Income 177
Statement of Financial Position 178
Statement of Changes in Equity 179
Statement of Cash Flows 180
Notes to the Financial Statements 182

162
BANK OF CEYLON . Annual Report 2014
1. General
The Board of Directors of Bank of Ceylon has pleasure in
presenting their report on the affairs of the Bank together
with the audited consolidated Financial Statements for
the year ended 31December 2014 of the Bank and the
Group and the Auditor General’s report on those Financial
Statements, conforming to the requirements of the Bank
of Ceylon Ordinance No.53 of 1938 and Banking Act
No.30 of 1988 and its amendments thereto. The report also
includes certain disclosures laid down by the Colombo Stock
Exchange listing rules and certain disclosures required to
be made under the Banking Act Direction No.11 of 2007
on Corporate Governance for licensed commercial banks
issued by the Central Bank of Sri Lanka and subsequent
amendments thereto. The Directors reviewed and approved
the Financial Statements on 18 March 2015.
Bank of Ceylon is a licensed commercial bank under the
Banking Act No. 30 of 1988 and amendments thereto and
was duly incorporated on 1August 1939 under Bank of
Ceylon Ordinance No.53 of 1938 and amendments thereto.
The Bank is wholly owned by Government of Sri Lanka. The
unsecured subordinated redeemable debentures issued by
the Bank are listed on the Colombo Stock Exchange.
2. Review of the Business2.1 Principal activities of the Bank
The principal activities of the Bank during the year were
commercial banking, personal banking, development
financing, mortgage financing, lease financing, investment
banking, Islamic banking, bancassurance, corporate
financing, dealing in Government securities, pawn broking,
credit card facilities, off shore banking, foreign currency
operations, electronic banking services and other financial
services.
2.2 Subsidiaries and associates
The principal activities of subsidiaries and associates are
given under significant accounting policies to the Financial
Statements on page 182 and 183.
There were no significant changes in the nature of the
principal activities of the Bank and the Group during the
year under review, other than changes mentioned under
Significant Accounting Policies.
2.3 Changes to the group structure
The changes to the group structure during the year is given
in Note 29 and 30 to Financial Statements on pages from 239
to 246 of this Annual Report.
2.4 Vision, mission and corporate conduct
The Bank’s Vision and Mission are given on page 4 of this
Annual Report. The Bank maintains high ethical standards
in its activities whilst pursuing the objectives stated under
‘Vision’ and ‘Mission’.
2.5 Review of the year’s performance
The Chairman’s message on pages 22 to 28 deals with the
year’s performance of the Bank /Group and on the Sri
Lankan economy.
The General Manager’s review on pages 30 to 35 provides a
detailed description of the operations of the Bank during the
year under review.
Financial review on pages 70 to 75, provides a detailed
analysis of business operations of the Bank. These reports
that provide a fair review of Bank’s affairs form an integral
part of the Annual Report.
2.6 Branch expansion during the year
The Bank extended its services through the addition of a
new local branch, a new foreign branch and a new extension
office during the period under review. The number of
other service points upgraded to branch level was four.
The network was further expanded enhancing customer
convenience. The Bank installed 17 ATMs during the year
across the island bringing out the total to 540. This number
does not include peer banks’ ATMs through which customers
of Bank of Ceylon can transact.
2.7 Corporate donations
The Bank has granted no donations for the year 2014
but the Bank has incurred LKR 99 million on Corporate
Sustainability and Responsibility (CSR) activities.
2.8 Directors’ responsibilities for financial reporting
The Directors are responsible for the preparation of the
Financial Statements that will reflect a true and fair view of
the state of affairs. The Directors are of the view that these
Financial Statements have been prepared in conformity with
the requirements of the Sri Lanka Accounting Standards,
Banking Act No. 30 of 1988 and its amendments, Bank of
Ceylon Ordinance No.53 of 1938 and its amendments and
the listing rules of the Colombo Stock Exchange. In the case
of subsidiaries, the Financial Statements are prepared also in
accordance with the provisions of the Companies Act No.7 of
2007.
The statement of Directors’ responsibility for financial
reporting is given on page 174 of this annual report and
forms an integral part of this report of the Directors.
Annual Report of the Directors on the State of Affairs of Bank of Ceylon

163
Truly Everybody’s Bank
2.9 Auditor’s report
The Auditor General is the Auditor of Bank of Ceylon in
terms of the provisions of Article 154 of the Constitution of
the Democratic Socialist Republic of Sri Lanka. Report of the
Auditor General on the Financial Statements of the Bank and
the Consolidated Financial Statements of the Bank and its
subsidiaries as at 31 December 2014 is given on page 175 of
this Annual Report.
2.10 Accounting policies
The Group and the Bank prepared their Financial Statements
in accordance with Sri Lanka Accounting Standards (LKAS)
and Sri Lanka Financial Reporting Standards(SLFRS).
The accounting policies adopted in the preparation of
Financial Statements are given on pages 182 to 203. There
have been no material changes in the accounting policies
adopted by the Bank during the year under review.
3 Future Developments
An overview of the future plans and developments of the
Bank is presented in the Chairman’s message on pages 22
to 28 and financial review on pages 70 to 75 of this Annual
Report.
4 Total income
The main income of the Group is interest income, which
comprises 84% of the total income. The total income of the
Group for the year 2014 was LKR 133,023 million as against
LKR 134,230 million in comparison to the previous year. The
Bank’s total income accounted for 95% (2013: 95%) of total
income of the Group.
5 Dividends and Reserves5.1 Profit and appropriations
The Bank recorded a pre-tax profit of LKR 20,291 million in
2014 reflecting an increase of 29%, compared to LKR 15,709
million recorded for the previous year. After deducting LKR
6,717 million (2013 : LKR 3,622 million) for income tax, the
profit after tax for the year 2014 amounted to LKR 13,574
million, which is a 12% increase compared to LKR 12,087
million profit after tax reported in 2013.
Details of profit relating to the Bank and the Group are given
in Table 1.
The pre tax profit of the Group also increased from LKR
16,105 million to LKR 21,431 million, an increase of 33% in
comparison to the previous year. After deducting LKR 7,059
million for income tax (2013 : LKR 3,956 million) the profit
after tax for the year of the Group increased to LKR 14,372
million in 2014 from the profit after tax of LKR 12,148
million reported in 2013.
Table 1 LKR million
Bank Group
2014 2013 2014 2013
Profit for the year after payment of all expenses and providing for depreciation,
impairment on loans and other losses, contingencies before taxes
24,343 18,420 25,074 18,632
Value Added Tax (VAT) and Nation Building Tax (NBT) on financial services (4,052) (2,711) (4,105) (2,756)
Share of profit/(loss) associate companies before tax - - 462 229
Profit before income tax 20,291 15,709 21,431 16,105
Income tax expense (6,717) (3,622) (7,059) (3,956)
Profit for the year 13,574 12,087 14,372 12,148
Other comprehensive income, net of tax 5,378 18 6,239 1,501
Total comprehensive income for the year, net of tax 18,952 12,105 20,611 13,649
Appropriations
Transfers to permanent reserve fund (272) (253) (272) (253)
Transfers to primary dealer risk reserve - (74) - (74)
Transfers from primary dealer risk reserve 897 897
Transfers to investment fund account (480) (2,340) (480) (2,379)
Transfers from investment fund account 7,537 - 7,709
Transfers to statutory reserve - - (12) (18)
Dividends (6,846) (5,346) (6,846) (5,346)

164
BANK OF CEYLON . Annual Report 2014
5.2 Dividends
The Bank determines the dividends in consultation with the
Government, the shareholder of the Bank, prudently, based
on profits after deduction of tax, loan loss provision and any
such portion for reserves. Accordingly, a sum of LKR 6,846
million has been paid by the Bank as dividends for the year
(2013: LKR 5,346 million).
5.3 Reserves
The total reserves of the Group stood at LKR 74,394 million
as at 31 December 2014 (2013 : LKR 60,616 million). The
Group reserves consist of the following;
LKR’ million
2014 2013
Permanent reserve fund 3,810 3,538
Revaluation reserve 13,808 9,600
Primary dealer special risk reserve - 897
Exchange translation reserve 710 946
Investment fund account - 7,229
Available for sale reserve 7,762 4,516
Other reserves 642 629
Retained profits 47,662 33,261
Total 74,394 60,616
6 Property, Plant and Equipment
The total capital expenditure incurred by the Group on the
acquisition of property, plant and equipment during the
year amounted to LKR 1,869 million (2013 : LKR 1,813
million) the details of which are given in Note 32 of Financial
Statements on pages 249 to 265 of this Annual Report.
7 Value of Freehold Properties
The value of freehold properties owned by the Group as
at 31 December 2014 is included in Note 32 of Financial
Statements at LKR 14,473 million (2013 : LKR 10,878
million).
8 Stated Capital and Shareholding8.1 Stated capital
The total issued and fully paid up capital of the Bank as at
31 December 2014 was LKR 5,000 million. During the year
2014 the Government of Sri Lanka has allotted LKR 5,000
million capital to the Bank. This allocation is reported under
capital pending allotment as of 31 December 2014.
8.2 Shareholding
The Government of Sri Lanka is the sole shareholder of the
Bank.
9 Issue of Subordinated Debentures
The Group had issued subordinated listed debentures
amounting to LKR 7,675 million as at 31 December 2014
(2013 : LKR 8,000 million). The proceeds of these debentures
were utilized to bridge the maturity gaps and to strengthen
the supplementary capital base of the Bank. The details
of debentures outstanding as at the date of Statement of
Financial Position are given in Note 41 and Note 45 of the
Financial Statements on pages 270 to 272 and 279 to 282.
10 Share Information
The earnings per share and net assets per share of the Group
were LKR 2,884.82 and LKR 16,878.79 respectively, for the
period under review.
11 Corporate Sustainability and Responsibility
The programmes carried out under the Corporate
Sustainability and Responsibility (CSR) are detailed on pages
102 to 106 under the Social and Environment Report.
12 Directors
The Board of Directors of Bank of Ceylon as at
31 December 2014 consisted of six members. The Directors
of the Bank do not hold any executive positions in the Bank.
They bring a wide range of skills and experience to the
Board. The qualifications and experience of the Directors are
given on pages 36 to 41 of this Annual Report.
12.1 List of Directors
The Directors of the Bank as at the date of the Financial
Statements, viz, 31 December 2014 are as follows;
Name of the Director Executive/
Non Executive
Status
Status of
Independence
Air Chief Marshal
Harsha Abeywickrema
Non-Executive Independent
Mr Raju Sivaraman Non-Executive Independent
Ms K M A Nelumani
Daulagala
Non-Executive
Ex officio
Non-Independent
Ms Nalini D
Abeywardene
Non-Executive Non-Independent
Mr Chandrasiri de Silva Non-Executive Non-Independent
Mr Lalith P Withana Non-Executive Independent
Mr R M Ananda
Rathnayake (Alternate to
Ex officio Director)
Non-Executive
Ex officio
Non-Independent
All the above Directors have resigned in January/February
2015.
Annual Report of the Directors on the State of Affairs of Bank of Ceylon

165
Truly Everybody’s Bank
The present Board of Directors are as follows;
Name of the Director Executive/
Non-Executive
Status
Status of
Independence
Mr Ronald C Perera PC Non-Executive Independent
Ms Pushpa Wellappili Non-Executive
Ex officio
Non-Independent
Mr Ranel T Wijesinha Non-Executive Independent
Mr Brian J Sinniah Non-Executive Independent
Mr A P Kurumbalapitiya
(Alternate to
Ex officio Director)
Non-Executive
Ex officio
Non-Independent
The Directors are classified as Independent Directors on
the basis given in Banking Act Direction No.11 of 2007 on
Corporate Governance for licensed commercial banks issued
by Central Bank of Sri Lanka.
12.2 Board subcommittees
The Board has formed four subcommittees complying with
the aforesaid Banking Act Direction No.11 of 2007 to ensure
oversight control over affairs of the Bank. The subcommittee
composition is given on page 115 of this Annual Report.
12.3 Directors’ meetings
Attendance of Directors at Board and subcommittee meetings
are given on page 116 of this Annual Report.
12.4 Directors’ interests in contracts
Directors’ interests in contracts with the Bank, both direct
and indirect are given on pages 167 to 170. These interests
have been declared at meetings of the Board of Directors.
Except for the contracts given therein the Directors have no
any direct or indirect interest in other contracts or proposed
contracts with the Bank.
12.5 Directors’ interests in debentures issued by the Bank/
Group
There were no debentures registered in the name of any
Director.
12.6 Directors’ allowances/fees
The allowances /fees payable to Board of Directors are made
in terms of the provisions /contents in the Public Enterprises
Circular No. PED 58(2) dated 15 September 2011, letters
dated 12 November 2013 and 18 June 2014 all issued by the
Department of Public Enterprises of the Ministry of Finance
and Planning and Bank of Ceylon Ordinance No. 53 of 1938
and its amendments.
The Directors’ remuneration in respect of the Group and the
Bank for the financial year ended 31 December 2014 are
given on page 208.
13 Risk Management and System of Internal
Controls13.1 Risk management
The Board of Directors assumes overall responsibility for
managing risks. The specific measures taken by the Bank in
mitigating the risks are detailed on pages 147 to 159 of this
Annual Report.
13.2 Internal control
The Board of Directors has ensured the implementation of an
effective and comprehensive system of internal controls in
the Bank through the Audit Committee.
The Audit Committee helps the Board of Directors to
discharge their fiduciary responsibilities. The Report of the
Chairman of the Audit Committee is contained on pages 138
to 140 of this Annual Report. The Directors are satisfied with
the effectiveness of the system of internal controls during
the year under review and up to the date of the Annual
Report and the Financial Statements. The Board has issued a
statement on the internal control mechanism of the Bank as
per Direction No.3 (8)(ii)(b) of Banking Act Direction No.11
of 2007 on Corporate Governance for licensed commercial
banks. The above report is given on pages 171 and 172 of
this Annual Report. The Board has confirmed that financial
reporting system has been designed to provide reasonable
assurance regarding the reliability of financial reporting and
that the preparation of Financial Statements for external
purposes has been done in accordance with relevant
accounting principles and regulatory requirements.
The Board has obtained an assurance report from the Auditor
General on Directors’ statement on internal control and it is
given on page 171 of this Annual Report.
14. Corporate Governance
The Board of Directors is committed towards maintaining
an effective corporate governance structure and process.
The financial, operational and compliance functions of the
Bank are directed and controlled effectively within Corporate
Governance practices. These procedures and practices that
are in conformity with Corporate Governance directions
issued by the Central Bank of Sri Lanka under Banking
Act Direction No. 11 of 2007 and the Code of Best Practice
on Corporate Governance issued jointly by the Securities
and Exchange Commission of Sri Lanka and The Institute
of Chartered Accountants of Sri Lanka are described in the

166
BANK OF CEYLON . Annual Report 2014
Corporate Governance report appearing on pages 114 to 137
of this Annual Report.
The Board has obtained a report from the Auditor General on
the compliance with the provisions of the above mentioned
Direction No. 11 of 2007.
15. Human Resources
One of the most valuable assets of the Bank is its employees
and it is important for the Bank to develop them. Several
measures were taken to strengthen the much-valued human
capital in order to optimize their contribution towards the
achievement of corporate objectives. The Bank’s human
resource management policies and practices are detailed in
the Employee Report on pages 93 to 101 of this report.
16. Compliance with Laws and Regulations
The Directors, to the best of their knowledge and belief
confirm that the Group has not engaged in any activities
contravening the laws and regulations. Details of the Bank’s
compliance with the laws and regulations are given on pages
158 to 159 under report on risk and compliance which forms
an integral part of this report.
17. Outstanding Litigation
In the opinion of the Directors and as confirmed by the
Bank’s lawyers the litigation currently pending against
the Bank will not have a material impact on the reported
financial results or future operations of the Bank.
18. Statutory Payments
The Board confirms that all statutory payments due to the
Government and in relation to employees have been made
on time.
19. Environmental Protection
The Bank has not engaged in any activity, which has caused
detriment to the environment. Further, precautions taken to
protect the environment are given in sustainability report on
page 105.
20. Post Balance Sheet Events
The Directors are of the view that no material events have
arisen in the interval between the end of the financial year
and the date of this report that would require adjustments or
disclosures.
21. Going Concern
The Directors are confident that the resources of the Bank
are adequate to continue its operations. Therefore, it has
applied the going concern basis in preparing the Financial
Statements.
By order of the Board
Janaki Senanayake Siriwardane
Secretary, Bank of Ceylon/Secretary to the Board
18 March 2015
Colombo
Annual Report of the Directors on the State of Affairs of Bank of Ceylon

167
Truly Everybody’s Bank
Related party disclosures as required by the Sri Lanka Accounting Standard - LKAS 24 on ‘Related Party Disclosures’ are detailed in
Note 55 to the Financial Statements on pages 292 to 297.
In addition, the Bank carries out transactions in the ordinary course of business in an arm’s length basis with entities where the Chairman or a
Director of the Bank is the Chairman or a Director of such entities, are detailed below:
Company Relationship
Nature of
transactions
Limit
‘000*
Balance/
amount
outstanding
as at
31.12.2014
‘000*
Balance/
amount
outstanding
as at
31.12.2013
‘000* Security
Air Chief Marshal Harsha Abeywickrema
Property Development PLC Chairman Current account 12,231
Time deposit 1,137,546
Debentures 204,036
Repo balance 224,358
Rent paid in advance 258,518
Deposit for fuel 907
Letters of credit 5,000 - Related bills of
exchange and
shipping documents
Letters of guarantee 3,993
Koladeniya Hydropower
(Private) Limited
Chairman Current account 2,719
Repo balance 15,099
Mr Raju Sivaraman***
MBSL Insurance Company
Limited
Chairman Current account 10,535
Letters of guarantee 100
MCSL Financial Services
Limited
Director Savings account 17,380 5,084
Savings account USD 11 USD 11
**1,451 **1,429
EURO 4 EURO 4
**683 **769
AUD 0.6 AUD 0.5
**68 **60
SGD 0.2 SGD 0.2
**16 **17
Current account 71,489 52,648
Time deposit 49,290 72,785
* Currencies not specifically mentioned are in LKR
** LKR equivalent amount
*** Mr Raju Sivaraman is the Managing Director of Arch-Triad Consultants (Private) Limited and the company has been appointed as the
consultants for the projects of constructing BoC branch office complex at Nugegoda, Holiday Homes (phase II) at Nuwara Eliya, BoC
Hambantota branch and BoC Eastern Province Office.
Directors’ Interests in Contracts

168
BANK OF CEYLON . Annual Report 2014
Company Relationship
Nature of
transactions
Limit
‘000*
Balance/
amount
outstanding
as at
31.12.2014
‘000*
Balance/
amount
outstanding
as at
31.12.2013
‘000* Security
Series of loan 925,000 52,912 203,948
Lease receivable/
Hire purchase
receivable backed
by Power of
Attorney
Overdraft 97,000 - -
Money market loan 400,000 350,174
Repo balance - 25,004
Letters of credit 10,000 2,500
Letters of guarantee 6,500
Other payable 5,273 6,180
Mireka Capital Land
(Private) Limited
Director Current account 891 3,104
Current account USD 8 USD 13
**992 **1,737
Time deposit 39,540 94,236
Time deposit USD 64 USD 62
**8,437 **8,097
Letters of credit - USD 11 Fixed deposits
**1,397
Letters of guarantee 32,140 32,640
Mireka Homes (Private) Limited Director Current account 112,287 61,050
USD 74 USD 22
**9,763 **2,915
Time deposit 125,502 21,281
Loan USD 40,000 USD 6,933 USD 14,000 Fixed deposits
**5,260,200 **911,768 **1,832,670
Overdraft 100,000
Letters of credit (USD 40,000) USD 135 USD 2,245
Related bills
of exchange
and shipping
documents
(**5,260,200) **17,760 **293,835
EURO 2 EURO 15
**374 **2,260
- GBP 5
**1,150
* Currencies not specifically mentioned are in LKR
** LKR equivalent amount
}
}
Directors’ Interests in Contracts

169
Truly Everybody’s Bank
Company Relationship
Nature of
transactions
Limit
‘000*
Balance/
amount
outstanding
as at
31.12.2014
‘000*
Balance/
amount
outstanding
as at
31.12.2013
‘000* Security
Merchant Bank of
Sri Lanka & Finance PLC
Director Current account 97,443
Time deposit 138,627
Overdraft 110,000 48,447 Lease agreements
backed by Power of
Attorney
Repo balance 465,159
Letters of guarantee 1,000 Counter Indemnity
of the company
Series of loans 600,000 Lease agreements
backed by Power
of Attorney
Money market loans 100,000
Investments in
debenture 212,661
Ms Nalini D Abeywardene
Hotels Colombo (1963)
Limited
Director Savings account 13,214 3,912
Current account 13,449 11,647
Time deposit 123,257 114,717
Loan 4,773 7,801
Other receivable 17,402 23,038
BOC Travels (Private)
Limited
Director Current account 25,826 9,085
Time deposit 121,642 110,846
Leasing 5,661 6,967
Debenture 10,347 10,347
Overdraft 7,600 Book debts
Letters of guarantee 55,150 Time deposits and
debentures
Other receivable - 12
Other payable 34,597 689
Mr Chandrasiri de Silva
Hotels Colombo (1963)
Limited
Director Savings account 13,214 3,912
Current account 13,449 11,647
Time deposit 123,257 114,717
Loan 4,773 7,801
Other receivable 17,402 23,038
}
* Currencies not specifically mentioned are in LKR

170
BANK OF CEYLON . Annual Report 2014
Company Relationship
Nature of
transactions
Limit
‘000*
Balance/
amount
outstanding
as at
31.12.2014
‘000*
Balance/
amount
outstanding
as at
31.12.2013
‘000* Security
BOC Travels (Private)
Limited
Chairman Current account 25,826 9,085
Time deposit 121,642 110,846
Leasing 5,661 6,967
Debenture 10,347 10,347
Overdraft 7,600 Book debts
Letters of guarantee 55,150 Time deposits and
debentures
Other receivable - 12
Other payable 34,597 689
Ms K M A Nelumani Daulagala
Sri Lanka Insurance
Corporation Limited
Director Savings account 101,623
USD 241
**31,677
Current account 111,422
USD 2
**276
Time deposit 5,720,657
Overdraft 4
Repo balance 13,309
Debenture 1,380,015
Employee Trust Fund Board Director Current account 213,944
Time deposit 1,833,207
Repo balance 398,432
Debenture 422,902
Mr R M Ananda Ratnayake
De La Rue Lanka Currency
& Security Print (Private)
Limited
Director Current account 3,098 9,113
GBP 41 GBP 54
**8,447 **11,602
Time deposit 9,212 8,253
Overdraft 30,000 18,239 26,291 Mortgage over
commercial property
Letters of guarantee 400 400 - Fixed deposits
50 50 -
* Currencies not specifically mentioned are in LKR
** LKR equivalent amount
}
Directors’ Interests in Contracts

171
Truly Everybody’s Bank
Responsibility
In line with the Banking Act Direction No. 11 of 2007, section
3(8)(ii)(b), the Board of Directors presents this report on Internal
Control over Financial Reporting.
The Board of Directors (“Board”) is responsible for the adequacy
and effectiveness of the internal control mechanism in place at
Bank of Ceylon, (“the Bank”). In considering such adequacy and
effectiveness, the Board recognizes that the business of banking
requires reward to be balanced with risk on a managed basis and as
such the internal control systems are primarily designed with a view
to highlighting any deviations from the limits and indicators which
comprise the risk appetite of the Bank. In this light, the system of
internal controls can only provide reasonable, but not absolute
assurance, against material misstatement of financial information
and records or against financial losses or fraud.
The Board has established an ongoing process for identifying,
evaluating and managing the significant risks faced by the Bank
and this process includes enhancing the system of internal control
over financial reporting as and when there are changes to business
environment or regulatory guidelines. The process is regularly
reviewed by the Board and is in accordance with the guidance for
Directors of banks on the directors’ statement on internal control
issued by the Institute of Chartered Accountants of Sri Lanka. The
Board has assessed the internal control over financial reporting
taking into account principles for the assessment of internal control
system as given in that guidance.
The Board is of the view that the system of internal controls over
financial reporting in place is sound and adequate to provide
reasonable assurance regarding the reliability of financial reporting,
and that the preparation of Financial Statements for external
purposes is in accordance with relevant accounting principles and
regulatory requirements.
The management assists the Board in the implementation of the
Board’s policies and procedures on risk and control by identifying
and assessing the risks faced, and in the design, operation and
monitoring of suitable internal controls to mitigate and control these
risks.
Key features of the process adopted in applying
in reviewing the design and effectiveness of the
internal control system over financial reporting
The key processes that have been established in reviewing the
adequacy and integrity of the system of internal controls with
respect to financial reporting include the following:
• VariouscommitteesareestablishedbytheBoardtoassistthe
Board in ensuring the effectiveness of bank’s daily operations
and that the Bank’s operations are in accordance with the
corporate objectives, strategies and the annual budget as
well as the policies and business directions that have been
approved.
• TheInternalAuditDivisionoftheBankchecksforcompliance
with policies and procedures and the effectiveness of the
internal control systems on an ongoing basis using samples
and rotational procedures and highlights significant findings
in respect of any non compliance. Audits are carried out on
all units and branches, the frequency of which is determined
by the level of risk assessed, to provide an independent and
objective report. The annual audit plan is reviewed and
approved by the Board Audit Committee. Findings of the
Internal Audit Department are submitted to the Board Audit
Committee for review at their periodic meetings.
• TheBoardAuditCommitteeoftheBankreviewsinternal
control issues identified by the Internal Audit Department,
the external auditors, regulatory authorities and the
management, and evaluates the adequacy and effectiveness of
the risk management and internal control systems. They also
review the internal audit functions with particular emphasis
on the scope of audits and quality of the same. All minutes
of the Board Audit Committee meetings are forwarded to
the Board. Further details of the activities undertaken by
the Audit Committee of the Bank are set out in the Audit
Committee Report on pages 138 to 140.
• Inassessingtheinternalcontrolsystemoverinancial
reporting, identified officers of the Bank collated all
procedures and controls that are connected with significant
accounts and disclosures of the Financial Statements of
the Bank. These in turn were observed and checked by
the Internal Audit Department for suitability of design and
effectiveness on an ongoing basis.
• TheBankadoptedthenewSriLankaAccountingStandards
comprising LKAS and SLFRS in 2012. The processes and
procedures initially applied to adopt the aforementioned
Accounting Standards were further strengthened during the
years 2013 and 2014 based on the feedback received from
internal and external auditors, regulators and the Board Audit
Committee. The Bank is in the process of updating procedures
interalia relating to impairment of loans and advances of the
Bank and foreign branches, Financial Statement disclosures
related to risk management and related parties. The Bank has
also recognized the need to introduce an automated financial
reporting process in order to comply with the requirements
of recognition, measurement, classification and disclosure
of the financial instruments more effectively and efficiently
and to facilitate the “Financial Statement Close” process. The
assessment did not include subsidiary companies of the Bank.
Directors’ Statement on Internal Control over Financial Reporting

172
BANK OF CEYLON . Annual Report 2014
Directors’ Statement on Internal Control over Financial Reporting
• Thecommentsmadebytheexternalauditorsinconnection
with internal control system over financial reporting in
previous years were reviewed during the year and appropriate
steps have been taken to rectify them. The recommendations
made by the external auditors in 2014 in connection with
the internal control system over financial reporting will be
addressed in the future.
Confirmation
Based on the above processes, the Board confirms that the financial
reporting system of the Bank has been designed to provide a
reasonable assurance regarding the reliability of financial reporting
and the preparation of financial statements for external purposes
and has been done in accordance with Sri Lanka Accounting
Standards and regulatory requirements of Central Bank of
Sri Lanka.
By order of the Board
Chairman - Audit Committee
Chairman
Director
Colombo, Sri Lanka
25 March 2015

173
Truly Everybody’s Bank
Independent Assurance Report
The Chairman
Bank of Ceylon
Assurance Report of the Auditor General to the
Board of Directors on the Directors’ Statement on
Internal Control of Bank of Ceylon
Introduction
This report is to provide assurance on the Directors’ Statement on
Internal Control over financial reporting (“Statement”) of Bank of
Ceylon included in the annual report for the year ended
31 December 2014. In carrying out this assurance engagement I was
assisted by a firm of Chartered Accountants in public practice.
Management’s Responsibility
Management is responsible for the preparation and presentation of
the Statement in accordance with the “Guidance for Directors of
Banks on the Directors’ Statement on Internal Control” issued in
compliance with section 3(8)(ii)(b) of the Banking Act Direction
No. 11 of 2007, by the Institute of Chartered Accountants of
Sri Lanka.
My Responsibility and Compliance with SLSAE 3050
My responsibility is to issue a report to the Board of Directors on
the Statement based on the work performed. I conducted my
engagement in accordance with Sri Lanka Standard on Assurance
Engagements SLSAE 3050 – Assurance Report for Banks on
Directors’ Statement on Internal Control issued by the Institute of
Chartered Accountants of Sri Lanka.
Summary of work performed
My engagement has been conducted to assess whether the
Statement is supported by the documentation prepared by or for
Directors; and appropriately reflected the process the Directors have
adopted in reviewing the system of internal control over financial
reporting of the Bank.
The procedures performed were limited primarily to inquiries of
bank personnel and the existence of documentation on a sample
basis that supported the process adopted by the Board of Directors.
SLSAE 3050 does not require me to consider whether the
Statement covers all risks and controls or to form an opinion on the
effectiveness of the Bank’s risk and control procedures.
SLSAE 3050 also does not require me to consider whether the
processes described to deal with material internal control aspects of
any significant problems disclosed in the annual report will, in fact,
remedy the problems.
Conclusion
Based on the procedures performed, nothing has come to my
attention that causes me to believe that the Statement included
in the annual report is inconsistent with my understanding of the
process the Board of Directors has adopted in the review of the
design and effectiveness of internal control over financial reporting
of the Bank.
W P C Wickramaratne
Auditor General (Acting)

174
BANK OF CEYLON . Annual Report 2014
Directors’ Responsibiliy for Financial Reporting
This Statement by the Board of Directors is made especially to
distinguish the respective responsibilities of the Directors and
Auditors in relation to financial reporting. The responsibility of
Directors in relation to financial reporting of the Bank of Ceylon
and the Group is set out in the following statement.
Financial Statements
In terms of the provisions of Bank of Ceylon Ordinance No. 53 of
1938 and its amendments read with the Banking Act No. 30 of
1988 and its amendments and Directions, the Directors of the Bank
are responsible for ensuring that the Bank maintains proper books
of accounts which disclose with reasonable accuracy at any time
the financial position of the Bank and prepares proper Financial
Statements for each financial year giving a true and fair view of the
state of affairs of the Bank.
The Directors acknowledge that in preparing the Financial
Statements for the year 2014 presented in this Annual Report,
the most appropriate accounting policies have been used and
applied consistently supported by judgements and estimates that
are reasonable and prudent. Material departures, if any, have been
disclosed and explained.
The Financial Statements for the year 2014 presented in this Annual
Report are in conformity with the requirements of the Bank of
Ceylon Ordinance No. 53 of 1938 and its amendments, Banking
Act No. 30 of 1988 and its amendments and Directions issued
under it, the Sri Lanka Accounting Standards and other regulatory
requirements. These Financial Statements reflect a true and fair
view of the state of affairs of the Bank of Ceylon and the Group as
at 31 December 2014.
Going concern
The Directors are of the view that the Bank and the Group have
adequate resources to continue in business for the foreseeable
future. Accordingly, they have continued to adopt the going
concern basis in preparing the Financial Statements.
Internal controls, risk management and compliance
The Directors are also responsible for the system of internal financial
controls and risk management and place considerable importance
on maintaining a strong control environment to protect and
safeguard the Bank’s assets and prevent fraud and mismanagement.
Whilst inherent and residual risks cannot be completely eliminated,
the Bank endeavours to minimize them by ensuring that
appropriate infrastructure, controls, systems and ethical behaviour
are applied and practiced within predetermined procedures and
constraints.
A report by the Directors on the Bank’s internal control mechanism
confirming that the financial reporting system has been designed to
provide reasonable assurance regarding the reliability of financial
reporting is given on pages 171 and 172 of this Annual Report.
The Directors and Management have put in place risk management
policies and guidelines. Management committees are established
to monitor and manage material risks. Arrangements are made
to submit reports on risk to the Integrated Risk Management
Committee on a quarterly basis for discussion. Compliance with
applicable laws, regulations, rules, directives and guidelines are
monitored by the Independent Integrated Risk Management
Division and reported to the Board.
The Audit Committee and Integrated Risk Management Committee,
on an ongoing basis, have acted in strengthening the effectiveness
of internal controls and risk management procedures. The reports of
the Audit Committee and Integrated Risk Management Committee
are included on page 138 and 142 respectively of this Annual
Report.
Audit report
Pursuant to provisions of Article 154 of the Constitution of the
Democratic Socialist Republic of Sri Lanka, the Auditor General
is the Auditor of the Bank and issues the final opinion on the
Financial Statements of the Bank. The responsibilities of the Auditor
in relation to the Financial Statements are set out in the Report
of the Auditor General on page 175 of this Annual Report. The
Auditor General’s certification on the effectiveness of the Bank’s
internal control mechanism is given on page 173 of this Annual
Report.
Compliance
The Directors to the best of their knowledge and belief, are satisfied
that all statutory payments in relation to all relevant regulatory and
statutory authorities which were due and payable by the Bank and
its subsidiaries as at the Statement of Financial Position date have
been paid or where relevant provided for.
The Directors are of the view that they have discharged their
responsibilities as set out in this statement.
By order of the Board,
Janaki Senanayake Siriwardane
Secretary, Bank of Ceylon/Secretary to the Board
18 March 2015
Colombo

175
Truly Everybody’s Bank
Report of the Auditor General
The Chairman
Bank of Ceylon
Report of the Auditor General on the Financial
Statements of the Bank of Ceylon and its subsidiaries
for the year ended 31 December 2014The audit of the financial statements of the Bank of Ceylon (“the
Bank”) , the consolidated financial statements of the Bank and
its subsidiaries (“Group”), for the year ended 31 December 2014
comprising the statements of financial position as at
31 December 2014, and the income statement and statement of
other comprehensive income, statements of changes in equity and
cash flow statements for the year then ended, and a summary of
significant accounting policies and other explanatory information,
was carried out under my direction in pursuance of provisions
in Article 154(I) of the Constitution of the Democratic Socialist
Republic of Sri Lanka. To carry out this audit I was assisted by a
firm of Chartered Accountants in public practice. The financial
statements of the subsidiaries were audited by firms of Chartered
Accountants in public practice appointed by the members of the
respective subsidiaries.
Board’s Responsibility for the Financial StatementsThe Board of Directors (“Board”) is responsible for the preparation
of these financial statements that give a true and fair view in
accordance with Sri Lanka Accounting Standards, and for such
internal control as Board determines is necessary to enable the
preparation of financial statements that are free from material
misstatement, whether due to fraud or error.
Auditor’s ResponsibilityMy responsibility is to express an opinion on these financial
statements based on my audit. I conducted my audit in accordance
with Sri Lanka Auditing Standards. Those standards require that
I comply with ethical requirements and plan and perform the
audit to obtain reasonable assurance about whether the financial
statements are free from material misstatement.
An audit involves performing procedures to obtain audit evidence
about the amounts and disclosures in the financial statements. The
procedures selected depend on the auditor’s judgment, including
the assessment of the risks of material misstatement of the financial
statements, whether due to fraud or error. In making those risk
assessments, the auditor considers internal control relevant to the
Bank’s preparation of the financial statements that give a true and
fair view in order to design audit procedures that are appropriate
in the circumstances, but not for the purpose of expressing an
opinion on the effectiveness of the Bank’s internal control. An audit
also includes evaluating the appropriateness of accounting policies
used and the reasonableness of accounting estimates made by
Board, as well as evaluating the overall presentation of the financial
statements.
I believe that the audit evidence I have obtained is sufficient and
appropriate to provide a basis for my audit opinion.
Opinion - GroupIn my opinion, the consolidated financial statements give a true and
fair view of the financial position of the Group as at 31 December
2014, and of its financial performance and cash flows for the year
then ended in accordance with Sri Lanka Accounting Standards.
Opinion – BankIn my opinion, the financial statements give a true and fair view of
the financial position of the Bank as at 31 December 2014, and of
its financial performance and cash flows for the year then ended in
accordance with Sri Lanka Accounting Standards.
ExemptionThe Bank has been exempted from the provisions of Part II of the
Finance Act, No. 38 of 1971 by an Order of then Minister of Finance
published in the Government Gazette No. 715 of 14 May 1992 by
virtue of powers vested in him by Section 5 (1) of the said Finance
Act.
Report to ParliamentMy report to Parliament in pursuance of provisions in Article
154 (6) of the constitution will be tabled in due course.
W P C Wickramaratne
Auditor General (Acting)

176
BANK OF CEYLON . Annual Report 2014
Income Statement
Bank Group
For the year ended 31 December Note 2014 2013 Change 2014 2013 ChangeNo. LKR '000 LKR '000 % LKR '000 LKR '000 %
Total income 7 126,545,943 127,464,058 (0.7) 133,023,345 134,229,641 (0.9)
Interest income 8.1 107,394,796 114,863,091 (6.5) 111,950,598 119,504,363 (6.3)
Less : Interest expenses 8.2 68,944,411 77,719,731 (11.3) 71,196,536 80,162,512 (11.2)
Net interest income 8 38,450,385 37,143,360 3.5 40,754,062 39,341,851 3.6
Fee and commission income 9 9,188,079 6, 457,118 42.3 9,510,215 6,789,600 40.1
Less : Fee and commission expenses 9 1,088,207 720,232 51.1 1,186,436 854,587 38.8
Net fee and commission income 9 8,099,872 5,736,886 41.2 8,323,779 5,935,013 40.2
Net gains /(losses) from trading 10 4,859,913 3,232,748 50.3 5,038,541 3,268,177 54.2
Net gains from financial investments 11 2,880,854 425,543 577.0 2,900,005 469,989 517.0
Net gains/(losses) from financial instruments
designated at fair value through profit or loss - - - - - -
Other operating income 12 2,222,301 2,485,558 (10.6) 3,623,986 4,197,512 (13.7)
Total operating income 56,513,325 49,024,095 15.3 60,640,373 53,212,542 14.0
Less : Impairment charge/(reversal) for loans
and other losses 13 7,910,916 6,922,902 14.3 7,931,525 7,339,144 8.1
Net operating income 48,602,409 42,101,193 15.4 52,708,848 45,873,398 14.9
Less : Operating expenses
Personnel expenses 14 13,715,847 14,669,120 (6.5) 15,055,755 15,906,831 (5.4)
Other expenses 15 10,543,654 9,012,465 17.0 12,579,356 11,334,577 11.0
Total operating expenses 24,259,501 23,681,585 2.4 27,635,111 27,241,408 1.4
Operating profit before Value Added Tax (VAT)
and Nation Building Tax (NBT) 24,342,908 18,419,608 32.2 25,073,737 18,631,990 34.6
Less : Value Added Tax (VAT) and Nation
Building Tax (NBT) on financial services 4,051,951 2,710,836 49.5 4,105,175 2,756,179 48.9
Operating profit after Value Added Tax (VAT)
and Nation Building Tax (NBT) 20,290,957 15,708,772 29.2 20,968,562 15,875,811 32.1
Share of profit /(loss) of associate companies
before tax 16 - - - 462,436 228,813 102.1
Profit before income tax 20,290,957 15,708,772 29.2 21,430,998 16,104,624 33.1
Less : Income tax expense 17 6,716,900 3,621,659 85.5 7,058,656 3,956,302 78.4
Profit for the year 13,574,057 12,087,113 12.3 14,372,342 12,148,322 18.3
Profit attributable to :
Equity holder of the Bank 13,574,057 12,087,113 12.3 14,424,118 12,234,412 17.9
Non controlling interest - - - (51,776) (86,090) 39.9
Profit for the year 13,574,057 12,087,113 12.3 14,372,342 12,148,322 18.3
Earnings per share:
Basic earnings per share (LKR) 18.1 2,714.81 2,417.42 12.3 2,884.82 2,446.88 17.9
Diluted earnings per share (LKR) 18.2 2,521.39 2,417.42 4.3 2,679.29 2,446.88 9.5
Dividend per share (LKR) 18.3 1,369.28 1,069.28 28.1 1,369.28 1,069.28 28.1
The notes from pages 182 to 324 form an integral part of these Financial Statements.

177
Truly Everybody’s Bank
Statement of Other Comprehensive Income
Bank Group
For the year ended 31 December Note 2014 2013 Change 2014 2013 Change
No. LKR '000 LKR '000 % LKR '000 LKR '000 %
Profit for the year 13,574,057 12,087,113 12.3 14,372,342 12,148,322 18.3
Items that will not be reclassified to profit or loss
Revaluation gains / (losses) on property, plant and
equipment 3,557,500 - - 4,676,153 1,737,252 169.2
Deferred tax effect on revaluation (gains) / losses (181,125) - - (492,204) (480,294) (2.5)
Actuarial gains / (losses) on defined benefit plans (1,343,892) (408,625) (228.9) (1,352,033) (395,668) (241.7)
Deferred tax effect on actuarial (gains) / losses 376,290 114,415 228.9 376,906 111,824 237.1
2,408,773 (294,210) 918.7 3,208,822 973,114 229.7
Items that are or may be reclassified to profit or loss
Exchange differences on translation of foreign operations 48.5 (81,617) (197,220) 58.6 (235,165) (52,743) (345.9)
Net gains /(losses) on re measuring available for sale
financial investments 3,050,950 509,527 498.8 3,259,512 574,903 467.0
Share of other comprehensive income of associate
companies - - - 5,586 5,543 0.8
2,969,333 312,307 850.8 3,029,933 527,703 474.2
Other comprehensive income for the year, net of tax 5,378,106 18,097 29,618.2 6,238,755 1,500,817 315.7
Total comprehensive income for the year 18,952,163 12,105,210 56.6 20,611,097 13,649,139 51.0
Attributable to:
Equity holder of the Bank 18,952,163 12,105,210 56.6 20,611,316 13,684,287 50.6
Non controlling interest - - - (219) (35,148) 99.4
Total comprehensive income for the year 18,952,163 12,105,210 56.6 20,611,097 13,649,139 51.0
The notes from pages 182 to 324 form an integral part of these Financial Statements.

178
BANK OF CEYLON . Annual Report 2014
Bank Group
As at 31 December Note 2014 2013 Change 2014 2013 Change
No. LKR '000 LKR '000 % LKR '000 LKR '000 %
Assets
Cash and short term funds 20 29,165,464 24,901,189 17.1 29,958,559 25,182,043 19.0
Balances with Central Banks 21 30,422,373 28,699,132 6.0 30,422,373 28,699,132 6.0
Placements with banks 22 19,766,889 19,315,520 2.3 21,393,574 21,157,190 1.1
Derivative financial instruments 23 1,714,556 3,261,073 (47.4) 1,714,556 3,261,073 (47.4)
Reverse repurchase agreements 58,953,093 22,319,717 164.1 60,236,389 22,851,895 163.6
Financial assets - Held for trading 24 17,862,433 13,539,791 31.9 18,437,958 13,898,242 32.7
Financial investments - Loans and receivables 25 129,145,330 129,108,613 0.0 129,966,806 130,190,296 (0.2)
Loans and advances to customers 26 741,347,635 725,331,966 2.2 763,772,052 746,571,819 2.3
Financial investments - Available for sale 27 14,361,543 10,325,214 39.1 17,611,160 12,852,445 37.0
Financial investments - Held to maturity 28 216,517,438 156,899,761 38.0 216,740,132 157,441,572 37.7
Investment in subsidiary companies 29 6,213,048 6,828,699 (9.0) - - -
Investment in associate companies 30 842,988 842,988 - 1,870,035 1,471,267 27.1
Investment properties 31 - - - 148,876 151,914 (2.0)
Property, plant and equipment 32 16,188,333 12,006,180 34.8 25,646,016 20,622,161 24.4
Leasehold properties 33 107,467 83,026 29.4 144,501 121,417 19.0
Intangible assets 34 384,577 501,064 (23.2) 531,667 669,657 (20.6)
Deferred tax assets 35 - - - 8,933 47,818 (81.3)
Other assets 36 46,027,228 39,616,967 16.2 46,800,078 40,572,450 15.3
Total assets 1,329,020,395 1,193,580,900 11.3 1,365,403,665 1,225,762,391 11.4
Liabilities
Due to banks 37 889,876 1,166,427 (23.7) 949,127 1,336,267 (29.0)
Derivative financial instruments 38 734,548 274,948 167.2 734,548 274,948 167.2
Due to customers 39 933,966,169 842,070,000 10.9 943,934,463 850,767,521 11.0
Other borrowings 40 246,736,462 235,370,269 4.8 252,168,157 240,802,111 4.7
Debt securities issued 41 20,762,198 20,968,357 (1.0) 26,218,337 24,986,818 4.9
Current tax liabilities - - - 291,193 251,475 15.8
Deferred tax liabilities 35 1,071,335 151,623 606.6 3,288,860 2,034,216 61.7
Insurance provision - Life 42.1 - - - 349,901 220,748 58.5
Insurance provision - Non life 42.2 - - - 607,306 670,073 (9.4)
Other liabilities 43 17,534,179 11,521,521 52.2 19,103,242 13,158,933 45.2
Subordinated term debts 45 32,519,715 24,357,595 33.5 32,177,810 24,347,248 32.2
Total liabilities 1,254,214,482 1,135,880,740 10.4 1,279,822,944 1,158,850,358 10.4
Equity
Share capital 46 10,000,000 5,000,000 100.0 10,000,000 5,000,000 100.0
Permanent reserve fund 47 3,809,955 3,538,455 7.7 3,809,955 3,538,455 7.7
Retained earnings 44,861,045 31,418,794 42.8 47,661,936 33,261,300 43.3
Other reserves 48 16,134,913 17,742,911 (9.1) 22,922,049 23,816,578 (3.8)
Total equity attributable to the Bank 74,805,913 57,700,160 29.6 84,393,940 65,616,333 28.6
Non controlling interest - - - 1,186,781 1,295,700 (8.4)
Total equity 74,805,913 57,700,160 29.6 85,580,721 66,912,033 27.9
Total liabilities and equity 1,329,020,395 1,193,580,900 11.3 1,365,403,665 1,225,762,391 11.4
Commitments and contingencies 50 721,763,406 655,441,409 10.1 722,823,188 656,226,093 10.1
Net assets per share (LKR) 14,961.18 11,540.03 29.6 16,878.79 13,123.27 28.6
The notes from pages 182 to 324 form an integral part of these Financial Statements.
These Financial Statements give a true and fair view of the state of affairs of Bank of Ceylon and the Group as at 31 December 2014 and its profit for the year then ended.
W P Russel FonsekaActg. Chief Financial Officer
The Board of Directors is responsible for the preparation and presentation of these Financial Statements.Approved and signed for and on behalf of the Board,
Ronald C Perera PC Ranel T Wijesinha D M Gunasekara
Chairman Director General Manager
18 March 2015
Colombo
Statement of Financial Position

179
Truly Everybody’s Bank
Bank
Other reserves
Note
No.
Share
capital
LKR ' 000
Capital
pending
allotment
LKR ' 000
Permanent
reserve fund
LKR ' 000
Available for
sale reserve
[Note 48.6]
LKR ' 000
Investment
fund account
LKR ' 000
Other
reserves
LKR ' 000
Revaluation
reserve
LKR ' 000
Retained
earnings
LKR ' 000
Total equity
LKR ' 000
Balance as at 1 January 2013 5,000,000 - 3,285,955 3,403,188 4,716,685 1,685,594 5,222,314 27,639,146 50,952,882
Total comprehensive income for the year
Profit for the year - - - - - - - 12,087,113 12,087,113
Other comprehensive income, net of tax - - - 509,527 - (197,220) - (294,210) 18,097
Total comprehensive income for the year - - - 509,527 - (197,220) - 11,792,903 12,105,210
Dividends for 2013 18.3 - - - - - - - (5,346,410) (5,346,410)
Transfers to investment fund account 48.1.1 - - - - 2,340,405 - - (2,340,405) -
Transfers to permanent reserve fund 47 - - 252,500 - - - - (252,500) -
Revaluation gains / (losses) on property, plant and equipment 48.2 - - - - - - (16,003) - (16,003)
Deferred tax effect on revaluation (gains) /losses 48.2 - - - - - - 4,481 - 4,481
Transfers to primary dealer special risk reserve 48.3 - - - - - 73,940 - (73,940) -
Balance as at 31 December 2013 5,000,000 - 3,538,455 3,912,715 7,057,090 1,562,314 5,210,792 31,418,794 57,700,160
Balance as at 1 January 2014 5,000,000 - 3,538,455 3,912,715 7,057,090 1,562,314 5,210,792 31,418,794 57,700,160
Total comprehensive income for the year
Profit for the year - - - - - - - 13,574,057 13,574,057
Other comprehensive income, net of tax - - - 3,050,950 - (81,617) 3,376,375 (967,602) 5,378,106
Total comprehensive income for the year - - - 3,050,950 - (81,617) 3,376,375 12,606,455 18,952,163
Dividends for 2014 18.3 - - - - - - - (6,846,410) (6,846,410)
Shares under pending allotment 46 - 5,000,000 - - - - - - 5,000,000
Transfers to investment fund account 48.1.1 - - - - 480,066 - - (480,066) -
Transfers from investment fund account 48.1.1 - - - - (7,537,156) - - 7,537,156 -
Transfers to permanent reserve fund 47 - - 271,500 - - - (271,500) -
Transfers from primary dealer special risk reserve 48.3 - - - - - (896,616) - 896,616 -
Balance as at 31 December 2014 5,000,000 5,000,000 3,809,955 6,963,665 - 584,081 8,587,167 44,861,045 74,805,913
Group
Other reserves
Note
No.
Share
capital
LKR ' 000
Capital
pending
allotment
LKR ' 000
Permanent
reserve fund
LKR ' 000
Available for
sale reserve
[Note 48.6]
LKR ' 000
Investment
fund account
LKR ' 000
Other
reserves
LKR ' 000
Revaluation
reserve
LKR ' 000
Retained
earnings
LKR ' 000
Non
controlling
interest
LKR ' 000
Total equity
LKR ' 000
Balance as at 1 January 2013 5,000,000 - 3,285,955 3,970,915 4,849,948 2,432,526 8,367,737 29,318,089 1,417,493 58,642,663
Total comprehensive income for the year
Profit for the year - - - - - - - 12,234,412 (86,090) 12,148,322
Other comprehensive income, net of tax - - - 544,746 - (52,743) 1,216,233 (258,360) 50,941 1,500,817
Total comprehensive income for the year - - - 544,746 - (52,743) 1,216,233 11,976,052 (35,149) 13,649,139
Dividends for 2013 18.3 - - - - - - - (5,346,410) - (5,346,410)
Subsidiary dividends to non controlling interest - - - - - - - - (30,952) (30,952)
Transfers to investment fund account 48.1.1 - - - - 2,378,600 - - (2,378,600) - -
Transfers to permanent reserve fund 47 - - 252,500 - - - - (252,500) - -
Revaluation gains / (losses) on property, plant and
equipment 48.2 - - - - - - (16,003) - - (16,003)
Deferred tax effect on revaluation (gains)/losses 48.2 - - - - - - 4,481 - - 4,481
Transfers to other reserves 48.7 - - - - - 18,332 - (18,332) - -
Acquisition, disposal, merger and changes in non
controlling interest - - - - - - 27,866 36,941 (55,692) 9,115
Transfers to primary dealer special risk reserve 48.3 - - - - - 73,940 - (73,940) -
Balance as at 31 December 2013 5,000,000 - 3,538,455 4,515,661 7,228,548 2,472,055 9,600,314 33,261,300 1,295,700 66,912,033
Balance as at 1 January 2014 5,000,000 - 3,538,455 4,515,661 7,228,548 2,472,055 9,600,314 33,261,300 1,295,700 66,912,033
Total comprehensive income for the year
Profit for the year - - - - - - - 14,424,118 (51,776) 14,372,342
Other comprehensive income, net of tax - - - 3,237,677 - (235,165) 4,152,855 (968,169) 51,557 6,238,755
Total comprehensive income for the year - - - 3,237,677 - (235,165) 4,152,855 13,455,949 (219) 20,611,097
Dividends for 2014 18.3 - - - - - - - (6,846,410) - (6,846,410)
Shares under pending allotment 46 - 5,000,000 - - - - - - - 5,000,000
Subsidiary dividends to non controlling interest - - - - - - - - (30,237) (30,237)
Transfers to investment fund account 48.1.1 480,066 - (480,066) -
Transfers from investment fund account 48.1.1 - - - - (7,708,614) - - 7,708,614 - -
Transfers to permanent reserve fund 47 - - 271,500 - - - - (271,500) - -
Transfers to other reserves 48.7 - - - - - 12,144 - (12,144) - -
Acquisition and changes in non controlling interest - - - 8,666 - - 54,458 (50,423) (78,463) (65,762)
Transfers from primary dealer special risk reserve 48.3 - - - - - (896,616) - 896,616 - -
Balance as at 31 December 2014 5,000,000 5,000,000 3,809,955 7,762,004 - 1,352,418 13,807,627 47,661,936 1,186,781 85,580,721
The notes from pages 182 to 324 form an integral part of these Financial Statements.
Statement of Changes in Equiy

180
BANK OF CEYLON . Annual Report 2014
Statement of Cash Flows
Bank Group
For the year ended 31 December Note
No.
2014
LKR '000
2013
LKR '000
2014
LKR '000
2013
LKR '000
Cash flows from operating activities
Profit before income tax 20,290,957 15,708,772 21,430,998 16,104,624
Adjustments for:
Net interest income 8 (38,450,385) (37,143,360) (40,754,062) (39,341,851)
Dividend income on trading securities 10 (201,667) (138,173) (213,504) (153,098)
Dividends from subsidiaries and associates 12 (291,921) (244,386) - -
Share of profit of associate companies before tax 16 - - (462,436) (228,813)
Change in operating assets 49.1 (73,088,309) (77,016,684) (73,103,345) (82,264,945)
Change in operating liabilities 49.2 125,532,757 119,165,110 125,942,026 119,104,860
Other non cash items included in profit before tax 49.3 14,025,014 6,860,242 14,347,223 7,722,380
Other net gains from investing activities (2,880,854) (425,544) (2,900,005) (469,989)
44,935,592 26,765,977 44,286,895 20,473,168
Contribution paid to defined benefit plans (4,967,636) (4,668,297) (4,985,051) (4,672,881)
Interest received 79,891,805 83,182,750 84,051,193 87,390,368
Interest paid (54,609,106) (53,834,481) (52,811,684) (49,524,430)
Dividends received 201,667 138,173 213,504 153,098
Net cash from operating activities before income tax 65,452,322 51,584,122 70,754,857 53,819,323
Income tax paid (2,406,682) (4,533,553) (2,619,449) (4,705,085)
Net cash from operating activities 63,045,640 47,050,569 68,135,408 49,114,238
Cash flows from investing activities
Net increase in financial investments - Held to maturity (49,400,784) (45,566,069) (49,410,838) (45,357,623)
Net decrease in financial investments - Available for sale 1,049,153 2,360,218 535,384 2,173,080
Net (increase)/decrease in financial investments - Loans and
receivables (36,717) (29,901,754) 223,490 (31,007,945)
Increase in interest in subsidiaries (84,350) (35,851) (84,350) (35,851)
Purchase of investment properties - - - (7,730)
Purchase of property, plant and equipment and leasehold
properties (1,743,088) (1,682,211) (1,896,198) (1,804,821)
Purchase of intangible assets (63,900) (262,860) (89,845) (372,298)
Proceeds from sale of property, plant and equipment 42,196 108,919 78,578 137,794
Dividends received 656,373 575,013 434,776 395,804
Interest received 22,359,076 23,053,575 22,757,168 23,413,612
Net cash used in investing activities (27,222,041) (51,351,020) (27,451,835) (52,465,978)

181
Truly Everybody’s Bank
Bank Group
For the year ended 31 December Note
No.
2014
LKR '000
2013
LKR '000
2014
LKR '000
2013
LKR '000
Cash flows from financing activities
Net increase / (decrease) in other borrowings (13,380,347) 20,361,456 (13,318,440) 16,248,865
Proceeds from non controlling interest on issue of rights in subsidiary - - 1,090 21,954
Proceeds from issue of debentures 8,000,000 8,000,000 9,675,000 11,000,000
Payments on redemption of debentures - (9,684,601) (656,371) (9,917,054)
Dividends paid to Government of Sri Lanka (6,846,410) (5,346,410) (6,846,410) (5,346,410)
Dividends paid to non controlling interest - - (30,237) (30,952)
Interest payments on borrowings and debt securities (17,292,671) (17,707,813) (20,580,967) (22,966,256)
Net cash used in financing activities (29,519,428) (4,377,368) (31,756,335) (10,989,853)
Net increase/ (decrease) in cash and cash equivalents during the year 6,304,171 (8,677,819) 8,927,238 (14,341,593)
Cash and cash equivalents at the beginning of the year 38,103,096 46,780,915 40,955,175 55,296,768
Cash and cash equivalents at the end of the year 44,407,267 38,103,096 49,882,413 40,955,175
Note
Analysis of cash and cash equivalents
Cash and short term funds 20 29,165,464 24,901,189 29,958,559 25,182,043
Due from banks with maturity less than three months 15,792,334 13,550,595 20,533,636 16,240,285
Bank overdrafts 37 (550,531) (348,688) (609,782) (467,153)
Cash and cash equivalents at the end of the year 44,407,267 38,103,096 49,882,413 40,955,175
The notes from pages 182 to 324 form an integral part of these Financial Statements.

182
BANK OF CEYLON . Annual Report 2014
Notes to the Financial StatementsSigniicant Accounting Policies
1. Reporting Entity
Bank of Ceylon (the “Bank”) is a Government owned bank
domiciled in Sri Lanka, duly incorporated on 1 August 1939
under the Bank of Ceylon Ordinance No.53 of 1938. It is a
licensed commercial bank established under the Banking
Act No.30 of 1988 and amendments thereto. The registered
office of the Bank is situated at “BOC Square”, No.01, Bank
of Ceylon Mawatha, Colombo 01, Sri Lanka. The debentures
issued by the Bank are listed on Colombo Stock Exchange
and the senior notes amounting to USD 1,000 million are
listed on Singapore Stock Exchange.
The staff strength of the Bank as at 31 December 2014 was
8,577 (2013: 8,883).
Consolidated Financial Statements
The Consolidated Financial Statements prepared as at and
for the year ended 31 December 2014 comprise the Bank
(“Parent”), its subsidiaries (together referred to as the
“Group”) and the Group’s interests in its associate companies.
Approval of Financial Statements by the Board of
Directors
The Financial Statements for the year ended 31 December
2014 were authorized for issue on 18 March 2015 by the
Board of Directors.
1.1 Principal activities
Bank
The principal activities of the Bank during the year were
commercial banking, personal banking, development
financing, mortgage financing, lease financing, investment
banking, Islamic banking, bancassurance, corporate
financing, primary dealing, pawning, credit card facilities, off
shore banking, foreign currency operations, internet banking
and other financial services.
Subsidiaries
The principal activities of the subsidiaries of the Bank are as
follows:
Name of the Company Principal Business Activities
Property Development PLC Own, maintain and manage the Bank of Ceylon head office building
Merchant Bank of Sri Lanka & Finance PLC Leasing, hire purchase, corporate and retail credit, corporate advisory services, capital
market operations, margin trading, micro financing and agricultural credit facilities.
BOC Management & Support Services
(Private) Limited
Provides management services to the Bank
BOC Property Development & Management
(Private) Limited
Renting of office space of BOC Merchant Tower in Colombo 03 and Ceybank House in
Kandy
BOC Travels (Private) Limited Engages in travel related services
Hotels Colombo (1963) Limited Provides hotel services
MCSL Financial Services Limited Acceptance of deposits, granting lease facilities, hire purchase, loans and other credit
facilities, real estate developments and related services
Ceybank Holiday Homes (Private) Limited Operating of pilgrims rests, holiday homes and guest houses
MBSL Insurance Company Limited Underwriting of all classes of life and general insurance
Koladeniya Hydropower (Private) Limited Hydropower generation
Bank of Ceylon (UK) Limited Registered under the Financial Services Authority of United Kingdom and provides
financial services including accepting deposits and dealing in investments
MBSL Savings Bank Limited Licensed Specialized Bank and provides financial services including accepting deposits,
lease financing, hire purchase financing and pawning services.

183
Truly Everybody’s Bank
Associates
The principal activities of the associates of the Bank are as follows
Name of the Company Principal Business Activities
Ceybank Asset Management Limited Management of Unit Trust Funds and other private portfolios
Southern Development Financial Company
Limited
Not in operation
Lanka Securities (Private) Limited Registered stock broker engages in equity trading, debt trading and margin trading
Mireka Capital Land (Private) Limited Purchasing, hiring and acquiring real estate properties, real estate developments and
providing
Transnational Lanka Records Solutions
(Private) Limited
Renting properties and real estates.
There were no significant changes in the nature of principal
activities of the Bank, subsidiaries and associates during the
year under review.
Based on the financial institution consolidation process of
Central Bank of Sri Lanka MBSL Savings Bank Limited and
MCSL Financial Services Limited have been amalgamated
with Merchant Bank of Sri Lanka & Finance PLC (formerly
known as Merchant Bank of Sri Lanka PLC) consequent to
which the amalgamated company or the surviving entity
is the Merchant Bank of Sri Lanka & Finance PLC. The
amalgamation took effect on 01 January 2015.
The Management of the Southern Development Financial
Company Limited (SDFCL) has decided to wind up the
company and operations of the company have been closed
accordingly. Under this ground the Bank has decided to
write off the investment in SDFCL against the impairment
provision which has been already made. This investment will
be written off from BoC books after obtaining the approval
from the Ministry of Finance and Planning.
2. Directors’ Responsibility for Financial
Statements
The Board of Directors is responsible for the preparation
and presentation of the Financial Statements of the Bank
and its subsidiaries and associates in compliance with the
requirements of the Bank of Ceylon Ordinance No.53 of
1938 and its amendments, Banking Act No. 30 of 1988 and
its amendments thereto and Sri Lanka Accounting Standards.
3. Basis of Preparation3.1 Statement of compliance
The Consolidated Financial Statements of the Group and
the separate Financial Statements of the Bank have been
prepared in accordance with Sri Lanka Accounting Standards
comprising of Sri Lanka Financial Reporting Standards
(SLFRSs) and Sri Lanka Accounting Standards (LKASs) laid
down by the Institute of Chartered Accountants of Sri Lanka.
(together referred to as SLFRS in these Financial Statements).
The preparation and presentation of these Financial
Statements are in compliance with the requirements of the
Bank of Ceylon Ordinance and the Companies Act No.07 of
2007. The presentation of the Financial Statements is also in
compliance with the requirements of the Banking Act No.30
of 1988.
The Group has prepared Financial Statements which comply
with SLFRSs and LKASs applicable for the year ended 31
December 2014, together with the comparative year data as
at and for the year ended 31 December 2013, as described in
the accounting policies.
3.2 Basis of measurement
The Consolidated Financial Statements have been prepared
on the basis of historical cost convention except for the
following:
• Financialassetsandliabilitiesheldfortradingare
measured at fair value
• Derivativeinancialinstrumentsaremeasuredatfair
value
• Availableforsaleinancialassetsaremeasuredatfair
value
• Owneroccupiedfreeholdlandandbuildingsaremeasured
at revalued amount less any subsequent accumulated
depreciation and impairment losses
• Deinedbeneitobligationsareactuariallyvaluedand
recognized as the present value of the defined benefit
obligation less total of the fair value of plan assets
No adjustments have been made for inflationary factors
affecting the Financial Statements.

184
BANK OF CEYLON . Annual Report 2014
Notes to the Financial Statements
3.3 Functional and presentation currency
Items included in the Consolidated Financial Statements
are measured and presented in Sri Lankan Rupees (“LKR”)
which is the functional currency of the primary economic
environment in which the Bank operates. Except as
otherwise indicated, financial information presented in LKR
has been rounded to the nearest thousand unless indicated
otherwise.
3.4 Presentation of Financial Statements
The Bank and the Group present its Statement of Financial
Position broadly in order of their relative liquidity.
Financial assets and financial liabilities are offset and the
net amount is reported in the Consolidated Statement of
Financial Position only when there is a legally enforceable
right to offset the recognized amounts and there is an
intention to settle on a net basis, or to realize the assets and
settle the liabilities simultaneously. Income and expenses
are not offset in the Consolidated Income Statement unless
required or permitted by any accounting standard or
interpretation, and as specifically disclosed in the accounting
policies of the Group.
3.5 Comparative information
The comparative information is reclassified wherever
necessary to conform to the current year’s presentation.
3.6 Use of significant accounting judgments, estimates
and assumptions
The preparation of the Consolidated Financial Statements
requires management to exercise judgments, estimates and
assumptions that affect the application of accounting policies
and the reported amounts of assets, liabilities, income and
expenses. Actual results may differ from these estimates.
The judgments, estimates and assumptions are based on
historical experience and various other factors that are
believed to be reasonable under the circumstances and
reviewed on an ongoing basis. Revisions to accounting
estimates are recognized in the period in which the estimates
are revised and/or in future periods if the revision affects
future periods too.
In the process of applying the Group’s accounting policies,
management has made the following judgments, estimates
and assumptions, which have the most significant effect
on the amounts recognized in the Consolidated Financial
Statements.
Commitment
All discernible risks are accounted for in determining the
amount of all known and measurable liabilities.
Contingent liabilities
Contingent liabilities are possible obligations whose
existence will be confirmed only by uncertain future events
or present obligations where the transfer of economic
benefit is not probable or cannot be reliably measured.
Contingent liabilities are not recognized in the Statement of
Financial Position but are disclosed unless its occurrence is
remote.
Going concern
The management has made an assessment on the Bank’s
ability to continue as a going concern and is satisfied that it
has the resources to continue in business for the foreseeable
future. Furthermore, management is not aware of any
material uncertainties that may cast significant doubt upon
the Bank’s ability to continue as a going concern.
Therefore, the Financial Statements continue to be prepared
on the going concern basis.
Fair value of financial instruments
When the fair value of financial assets and financial liabilities
recorded in the Statement of Financial Position cannot be
derived from active markets, they are determined using
variety of valuation techniques that include the use of
mathematical models. The inputs to these models are taken
from observable markets where possible, however if such
data are not available, a degree of judgment is exercised in
establishing fair values which minimize the effect of use of
unobservable inputs.
Impairment losses on loans and advances
The Group reviews its individually significant loans
and advances at each reporting date to assess whether
an impairment loss should be recorded in the Income
Statement. In particular, management’s judgment is
required in the estimation of the amount and timing of
future cash flows when determining the impairment loss.
These estimates are based on assumptions about a number
of factors and actual results may differ, resulting in future
changes to the allowance.
Loans and advances that have been assessed individually and
found to be not impaired and all individually insignificant
loans and advances are assessed collectively, in groups of
assets with similar risk characteristics, to determine whether
provision should be made based on incurred loss events for
which there is objective evidence, but the effects of which
are not yet evident. The collective assessment takes account
of data from the loan portfolio (such as loan type, levels of
arrears etc.), and judgments on the effect of concentrations of

185
Truly Everybody’s Bank
risks and economic data (including levels of unemployment,
real estate price indices, country risk and the performance of
different individual groups).
Impairment of available for sale investments
The Group reviews its debt securities classified as available
for sale investments at each reporting date to assess whether
they are impaired. The Group also records impairment
charges on available for sale equity investments when there
has been a significant or prolonged decline in the fair value
below their cost. The determination of what is ‘significant or
prolonged’ requires judgment. In making this judgment, the
Group evaluates, among other factors, historical share price
movements and duration and extent to which the fair value
of an investment is less than its carrying value.
Defined benefit obligation
The cost of the defined benefit pension plans and other post-
employment benefit plans are determined using an actuarial
valuation. An actuarial valuation involves making various
assumptions determining the discount rates, expected rates
of return on assets, future salary increases, mortality rates
and future pension increases. Due to the long term nature
of these plans, such estimates are subject to significant
uncertainty. All assumptions are reviewed at each reporting
date.
Fair value of property, plant and equipment
The freehold land and buildings and the buildings on
leasehold land of the Group are reflected at fair value.
The Group engaged independent valuation specialists to
determine fair value of such properties in terms of the SLFRS
13- Fair Value Measurement.
Taxation
The Group is subject to income tax and other taxes including
Value Added Tax (VAT) on financial services. The Group
recognizes assets and liabilities as current, differed and other
taxes based on estimates of whether additional taxes will
be due. Where the final tax outcome of these matters is
different from the amounts that were initially recorded, such
differences will impact the income and differed tax amounts
in the period in which the determination is made.
Useful life time of the property, plant and equipment
The Group reviews the residual values, useful lives and
methods of depreciation of Property, Plant and Equipment
at each reporting date. Judgment of the management is
exercised in the estimation of these values, rates, methods
and hence they are subject to uncertainty.
Classification of investment properties
Management is required to use its judgment to determine
whether a property qualified as an investment property.
A property that is held to earn rentals or for capital
appreciation or both and which generates cash flows largely
independently of the other assets held by the group are
accounted for as investment properties. On the other hand,
a property that is used for operations or in the process of
providing services or for administration purposes and which
do not directly generates cash flows as stand-alone assets are
accounted as property, plant and equipment.
Changes in accounting policies and disclosures, new and
amended standards and interpretations
The Bank and the Group has adopted the following new
standards, with effect from 1 January 2014.
• ConsolidatedFinancialStatements(SLFRS10)
The nature and the effect of changes are explained under
note No. 4.1 Basis of Consolidation
• JointArrangements(SLFRS11)
This standard replaces LKAS 31- Interest in Joint Ventures
and has removed the option to account for jointly
controlled entities using proportionate consolidation
method by recommending the equity method. SLFRS 11
does not have any effect on the Consolidated Financial
Statements of the Group as at the reporting date.
• DisclosureofInterestinOtherEntities(SLFRS12)
SLFRS 12 includes all the disclosures that were previously
included under LKAS 27- Consolidated and Separate
Financial Statements, LKAS 31- Interest in Joint Ventures
and LKAS 28- Investment in Associates. The Group has
expanded disclosures about its interest in subsidiaries and
involvement with associate companies as per the new
disclosure requirements under SLFRS 12.
• FairValueMeasurement(SLFRS13)
In accordance with the SLFRS 13 “Fair Value” is the price
that would be received to sell an asset or paid to transfer
a liability in an orderly transaction between market
participants at the measurement date in the principal or,
in its absence, the most advantageous market to which
the Group has access at that date. The measurement of
fair value of financial assets and liabilities are described in
more detail under note No. 4.4.11 Determination of fair
value of financial assets and liabilities and measurement
of fair value of property, plant and equipment is described
under note 4.5.2.1 Recognition and measurement of
property, plant and equipment.

186
BANK OF CEYLON . Annual Report 2014
Notes to the Financial Statements
3.7 Materiality and Aggregation
In compliance with LKAS 01-Presentation of Financial
Statements, each material class of similar items is presented
separately in the Financial Statements. Items of dissimilar
nature or functions are presented separately unless they are
immaterial.
4. Significant Accounting Policies
The significant accounting policies applied by the Bank and
the Group in preparation of its Financial Statements are
included below and have been consistently applied to all
periods presented in these Financial Statements of the Group
and the Bank, unless otherwise indicated.
4.1 Basis of consolidation
The Group’s Financial Statements comprise consolidation of
the Financial Statements of the Bank and its subsidiaries in
terms of the SLFRS10 – Consolidated Financial Statements
and LKAS 27 – Consolidated and separate Financial
Statements.
The Bank’s Financial Statements comprise the amalgamation
of the Financial Statements of the domestic banking unit, the
off-shore banking unit and the international operations of
the Bank.
4.1.1 Subsidiaries
Subsidiaries are entities controlled by the Bank. The Bank
controls an entity if it is exposed, or has rights, to variable
returns from its involvement with the investee and has
the ability to affect those returns through its power over
the investee. The Financial Statements of subsidiaries are
included in the Consolidated Financial Statements from
the date that control commences until the date that control
ceases. The Financial Statements have been prepared using
uniform accounting policies for like transactions and other
events in similar circumstances.
The Consolidated Financial Statements are prepared to
common financial year end of 31 December.
There are no significant restrictions on the ability of
subsidiaries to transfer funds to the parent in the form of cash
dividends or to repay loans and advances. All subsidiaries
of the Bank have been incorporated in Sri Lanka except for
Bank of Ceylon (UK) Limited, which is incorporated in the
United Kingdom.
A list of the Bank’s subsidiaries is given in note No.1.1 to the
Financial Statements.
4.1.2 Associates
Associates are those entities in which the Bank has
significant influence, but not control, over the financial
and operating policies. Investments in associate entities are
accounted for using the equity method (equity-accounted
investees) and are recognized initially at cost. The cost of the
investment includes transaction costs.
The Consolidated Financial Statements include the Bank’s
share of the profit or loss and other comprehensive income,
after adjustments to align the accounting policies with
those of the Group, from the date that significant influence
commences until the date that significant influence ceases.
When the Bank’s share of losses exceeds its interest in an
equity accounted investee, the carrying amount of that
interest, including any long term investments, is reported
at nil, and the recognition of further losses is discontinued
except to the extent that the Group has an obligation or has
made payments on behalf of the investee. If the associate
subsequently reports profits, the Bank’s resumes recognizing
it share of those profits only after its share of the profits
equals the share of losses not recognized.
A list of the Bank’s associates is shown in note No.1.1 to the
Financial Statements.
4.1.3 Business combinations
Business combinations are accounted for using the
acquisition method. As of the acquisition date, the amount
of non-controlling interest is measured either at fair value or
at the non-controlling interest’s proportionate share of the
acquirer’s identifiable net assets.
Acquisition related cost are costs the acquirer incurs to effect
a business combination. Those costs include finder’s fees,
advisory, legal, accounting, valuation and other professional
law consulting fees, general administrative costs, including
the cost of maintaining an internal acquisition department,
and cost of registering and issuing debt and equity securities.
Acquisition related costs, other than those associated with
the issue of debt or equity securities are expensed in the
periods in which the costs are incurred and the services are
received.
The Group elects on a transaction by transaction basis
whether to measure non-controlling interest at its fair value,
or at its proportionate share of the recognized amount of the
identifiable net assets, at the acquisition date. Transaction
costs, other than those associated with the issue of debt or
equity securities, that the Group incurs in connection with a
business combination are expensed as incurred.

187
Truly Everybody’s Bank
4.1.4 Acquisitions of non-controlling interests
Acquisitions of non-controlling interests are accounted for as
transactions with equity holders in their capacity as equity
holders. Therefore, no goodwill is recognized as a result of
such transactions.
4.1.5 Loss of control
Upon the loss of control, the Group derecognizes the
assets and liabilities of the subsidiary, carrying amount of
non-controlling interests and the cumulative translation
differences recorded in equity related to the subsidiary.
Further parent’s share of components previously recognized
in Statement of Other Comprehensive Income (OCI) is
reclassified to Income Statement or retained earnings as
appropriate. Any surplus or deficit arising on the loss of
control is recognized in the Income Statement. If the Group
retains any interest in the previous subsidiary, then such
interest is measured at fair value at the date that control is
lost. Subsequently, it is accounted for as an equity-accounted
investee or in accordance with the Group’s accounting policy
for financial instruments depending on the level of influence
retained.
4.1.6 Transactions eliminated on consolidation
All intra group balances, income and expenses (except for
foreign currency translation gains or losses) arising from
intra group transactions are eliminated on consolidation.
Unrealized gains and losses resulting from transactions
between the Group and its associates are also eliminated on
consolidation to the extent of the Group’s interests in the
associates.
Unrealized losses are eliminated in the same way as
unrealized gains, but only to the extent that there is no
evidence of impairment.
4.2 Foreign currency
4.2.1 Foreign currency transactions
Transactions in foreign currencies are translated into the
respective functional currency of the operation at the spot
exchange rate at the date of the transaction. Monetary assets
and liabilities denominated in foreign currencies at the
reporting date are re translated into the functional currency
at the spot exchange rate at that date and all differences
arising on non-trading activities are taken to ‘Other operating
income’ in the Income Statement.
Non-monetary assets and liabilities denominated in foreign
currencies that are measured at fair value are re translated
into the functional currency at the spot exchange rate at the
date on which the fair value is determined.
Foreign currency differences arising on re translation are
recognized in the Income Statement.
Non-monetary assets and liabilities that are measured in
terms of historical cost in a foreign currency are translated
using the exchange rate at the date of the initial transaction.
Forward exchange contracts are valued at the forward
market rates ruling on the reporting date and resulting
net unrealized gains or losses are dealt with the income
statement.
4.2.2 Foreign operations
The results and financial position of foreign operations,
whose functional currencies are not Sri Lankan Rupees, are
translated into Sri Lankan Rupees as follows.
The assets and liabilities of foreign operations are translated
into Sri Lankan Rupees at spot exchange rates as at the
reporting date. The income and expenses of foreign
operations are translated at monthly average rate for the
year. Foreign currency differences on the translation of
foreign operations are recognized in OCI.
When a foreign operation is disposed off, the relevant
amount in the translation is transferred to the Income
Statement as part of the profit or loss on disposal in other
operating expenses or other operating income.
4.3 Cash and cash equivalents
Cash and cash equivalents include local and foreign currency
notes and coins on hand, unrestricted balances held with
central banks, balances with other banks and highly liquid
financial assets with original maturities of less than three
months, which are subject to insignificant risk of changes
in their fair value, and are used by the Group in the
management of its short term commitments.
Cash and cash equivalents are carried at amortized cost in the
Statement of Financial Position.
4.3.1 Cash flow statement
Consolidated Statement of Cash Flows has been prepared
by using of ‘Indirect Method’ in accordance with LKAS
07- Statement of Cash Flows, whereby the profit is adjusted
to derive the cash flows from operating activities. Cash
and cash equivalents comprise cash in hand, amounts due
from / due to other banks, other short term highly liquid
investment with maturity less than three months from date
of acquisition.

188
BANK OF CEYLON . Annual Report 2014
Notes to the Financial Statements
4.4 Financial assets and financial liabilities
4.4.1 Date of recognition
All financial assets and liabilities are initially recognized on
the settlement date, i.e., the date that the Group becomes a
party to the contractual provisions of the instrument. This
includes “regular way trades”. Regular way trade means
purchases or sales of financial assets that require delivery
of assets within the time frame generally established by
regulation or convention in the market place.
4.4.2 Initial measurement of financial instruments
The classification of financial instruments at initial
recognition depends on their purpose and characteristics and
the management’s intention in acquiring them.
Financial assets and liabilities are initially measured at their
fair value plus transaction cost, except in the case of financial
assets and liabilities recorded at fair value through profit
or loss. Transaction cost in relation to financial assets and
liabilities at fair value through profit or loss are dealt with in
the statement of income.
For the purpose of measuring financial assets and liabilities
following classification is made:
• Fairvaluethroughproitorloss
• Heldtomaturityinvestments
• Loansandreceivable
• Availableforsaleinancialassets
4.4.3 Financial assets and liabilities at fair value through profit
or loss
Financial assets and liabilities are classified as fair value
through profit or loss (FVTPL) if they are held for trading
or are designated at fair value through profit or loss. Upon
initial recognition, transaction cost are directly attributable to
the acquisition are recognized in profit or loss as incurred.
Derivatives recorded at fair value through profit or loss
The Group uses derivatives such as cross currency swaps,
forward foreign exchange contracts. Derivatives are recorded
at fair value and carried as assets when their fair value is
positive and as liabilities when their fair value is negative.
Changes in the fair value of derivatives are included in ‘Net
trading income’.
Financial assets and liabilities held for trading
Financial assets and liabilities held for trading are recorded
in the Statement of Financial Position at fair value. Changes
in fair value are and dividend recognized in ‘Net trading
income’. Interest income or expense is recorded in ‘Interest
income’ according to the terms of the contract, or when the
right to the payment has been established. Debt securities
that have been acquired principally for the purpose of
selling or repurchasing in the near term are included in this
classification.
4.4.4 Held to maturity financial investments
Held to maturity (HTM) financial investments are non-
derivative financial assets with fixed or determinable
payments and fixed maturities that the Group has the
positive intent and ability to hold to maturity.
After initial measurement, HTM financial assets are
subsequently measured at amortized cost using the Effective
Interest Rate (EIR) less impairment. Amortized cost is
calculated by taking into account any discount or premium
on acquisition and fees that are an integral part of the EIR.
The amortization is included in ‘Interest income’ in the
Income Statement. The losses arising from impairment of
such investments are recognized in the Income Statement
under “Impairment charge/ (reversal) for loans and
other losses”. A sale or reclassification of a more than
insignificant amount of HTM investments would result in the
reclassification of all HTM investments as available for sale,
and would prevent the Group from classifying any financial
asset as held to maturity for the current and the following
two financial years. However, sales and reclassifications
in any of the following circumstances would not trigger a
reclassification:
• Salesorreclassiicationsthataresoclosetomaturitythat
changes in the market rate of interest would not have a
significant effect on the financial asset’s fair value
• SalesorreclassiicationsaftertheGrouphascollected
substantially all of the asset’s original principal
• Salesorreclassiicationsattributabletonon-recurring
isolated events beyond the Group’s control that could not
have been reasonably anticipated
4.4.5 Placements with banks and loans and advances to
customers
‘Placements with banks’ and ‘Loans and advances to
customers’ include non-derivative financial assets with fixed
or determinable payments that are not quoted in an active
market, other than:
•ThosethattheBankintendstosellimmediatelyorin
the near term and those that the Bank, upon initial
recognition, designates as at fair value through profit or
loss
•ThosethattheBank,uponinitialrecognition,designates
available for sale

189
Truly Everybody’s Bank
•Thoseforwhichthebankmaynotrecoversubstantially
all of its initial investment, other than those due to credit
deterioration
After initial measurement, ‘Placements with banks’ and
‘Loans and advances to customers’ are subsequently
measured at amortized cost using the EIR, less allowance
for impairment. Amortized cost is calculated by taking
into account any discount or premium on acquisition
and fees and costs that are an integral part of the EIR.
The amortization is included in ‘Interest income’ in the
Income Statement. The losses arising from impairment are
recognized in the Income Statement under ‘Impairment
charge / (reversal) for loans and other losses’.
The Group writes off certain loans and advances and
placements with banks when they are determined to be
uncollectible.
4.4.6 Available for sale financial investments
Available for sale (AFS) financial investments include equity
and debt securities. Equity investments classified as AFS are
those which are neither classified as held for trading nor
designated at fair value through profit or loss.
Debt securities in this category are intended to be held for
an indefinite period of time and may be sold in response to
needs for liquidity or in response to changes in the market
conditions. The Group has not designated any loans or
receivables as AFS.
After initial measurement, AFS financial investments are
subsequently measured at fair value. Unrealized gains and
losses are recognized directly in equity (OCI) in the ‘Available
for sale reserve’. When the investment is disposed of, the
cumulative gain or loss previously recognized in equity is
recognized in the Income Statement under ‘Other operating
income’. Where the Group holds more than one investment
in the same security, they are deemed to be disposed of on a
first in first out basis. Interest earned whilst holding available
for sale financial investments is reported as interest income
using the EIR. Dividends earned whilst holding available
for sale financial investments are recognized in the Income
Statement as ‘Other operating income’ when the right of
the payment has been established. The losses arising from
impairment of investments’ are removed from the ‘Available
for sale reserve’ and recognized in the Income Statement in
“Impairment (charge) / reversal for loans and other losses”.
4.4.7 ‘Day one’ profit or loss
When the transaction price differs from the fair value of
other observable current market transactions in the same
instrument or based on a valuation technique whose
variables include only data from observable markets, the
Group immediately recognizes the difference between the
transaction price and fair value (a ‘Day one’ profit or loss) in
‘Net trading income’. In cases where fair value is determined
using data which is not observable, the difference between
the transaction price and model value is only recognized in
the Income Statement over the life of the instrument.
4.4.8 Debt securities issued and other borrowings
Financial instruments issued by the Group that are not
designated at fair value through profit or loss, are classified as
liabilities under ‘Debt securities issued and other borrowings’,
where the substance of the contractual arrangement results
in the Group having an obligation either to deliver cash
or another financial asset to the holder, or to satisfy the
obligation other than by the exchange of a fixed amount of
cash or another financial asset for a fixed number of own
equity shares.
After initial measurement, debt securities issued and other
borrowings are subsequently measured at amortized cost
using EIR. Amortized cost is calculated by taking into account
any discount or premium on the issue and costs that are an
integral part of EIR.
4.4.9 De recognition
4.4.9.1 De recognition of financial assets
The Group derecognizes a financial asset when the
contractual rights to the cash flows from the financial asset
expire, or when it transfers the financial asset in a transaction
in which substantially all the risks and rewards of ownership
of the financial asset are transferred or in which the Group
neither transfers nor retains substantially all the risks and
rewards of ownership and it does not retain control of the
financial asset.
Any interest in transferred financial assets that qualify for
derecognition that are created or retained by the Group is
recognized as a separate asset or liability in the Statement
of Financial Position. On derecognition of a financial assets,
the difference between the carrying amount of the asset
(or the carrying amount allocated to the portion of the asset
transferred), and the sum of (i) the consideration received
(including any new asset obtained less any new liability
assumed) and (ii) any cumulative gain or loss that had been
recognized in OCI is recognized in the Income Statement.
The Group enters into transactions whereby it transfers assets
recognized on its Statement of Financial Position, but retains
either all or substantially all of the risks and rewards of the

190
BANK OF CEYLON . Annual Report 2014
Notes to the Financial Statements
transferred assets or a portion of them. If all or substantially
all risks and rewards are retained, then the transferred assets
are not derecognized. Transfers of assets with retention of all
or substantially all risks and rewards include, for example,
securities lending and repurchase transactions.
When assets are sold to a third party with a concurrent total
rate of return swap on the transferred assets, the transaction
is accounted for as a secured financing transaction similar
to repurchase transactions as the Group retains all or
substantially all the risks and rewards of ownership of such
assets.
In transactions in which the Group neither retains nor
transfers substantially all the risks and rewards of ownership
of a financial asset and it retains control over the asset, the
Group continues to recognize the asset to the extent of its
continuing involvement, determined by the extent to which
it is exposed to changes in the value of the transferred asset.
In certain transactions the Group retains the obligation
to service the transferred financial asset for a fee. The
transferred asset is derecognized if it meets the derecognition
criteria. An asset or liability is recognized for the servicing
contract, depending on whether the servicing fee is more
than adequate (asset) or is less than adequate (liability) for
performing the service.
Continuing involvement that takes the form of a guarantee
over the transferred asset is measured at the lower of the
original carrying amount of the asset and the maximum
amount of consideration that the Group could be required to
repay.
4.4.9.2 De recognition of financial liabilities
A financial liability is derecognized when the obligation
under the liability is discharged or cancelled or expired.
Where an existing financial liability is replaced by another
from the same lender on substantially different terms, or the
terms of an existing liability are substantially modified, such
an exchange or modification is treated as a derecognition of
the original liability and the recognition of a new liability.
The difference between the carrying value of the original
financial liability and the consideration paid is recognized in
the Income Statement.
4.4.10 Repurchase and reverse repurchase agreements
Securities sold under agreements to repurchase at a specified
future date are not derecognized from the Statement of
Financial Position as the Group retains substantially all of
the risks and rewards of ownership. The corresponding
cash received is recognized in the Statement of Financial
Position as an asset with a corresponding obligation to return
it, including accrued interest as a liability within ‘Other
borrowings’ , reflecting the transaction’s economic substance
as a borrowing to the Group. The difference between the sale
and repurchase prices is treated as interest expense and is
accrued over the life of agreement using EIR.
Conversely, securities purchased under agreements to resell
at a specified future date are not recognized in the Statement
of Financial Position. The consideration paid, including
accrued interest, is recorded in the Statement of Financial
Position, within ‘Reverse repurchase agreements’, reflecting
the transaction’s economic substance as an advance granted
by the Group. The difference between the purchase and
resale prices is recorded in ‘Interest income’ and is accrued
over the life of the agreement using the EIR.
4.4.11 Determination of fair value
‘Fair value’ is the price that would be received to sell an
asset or paid to transfer a liability (exit price) in an orderly
transaction between market participants at the measurement
date in the principal or, in its absence, the most advantageous
market to which the Group has access at that date. The fair
value of a liability reflects its non-performance risk.
When available, the Group measures the fair value of an
instrument using the quoted price in an active market for
that instrument (Level 01 valuation). A market is regarded
as active if transactions for the asset or liability take place
with sufficient frequency and volume to provide pricing
information on an ongoing basis
If there is no quoted price in an active market, then the
Group uses valuation techniques that maximize the use
of relevant observable inputs and minimize the use of
unobservable inputs. The chosen valuation technique
incorporates all of the factors that market participants would
take into account in pricing a transaction.
The best evidence of the fair value of a financial instrument
at initial recognition is normally the transaction price i.e.
the fair value of the consideration given or received. If the
Group determines that the fair value at initial recognition
differs from the transaction price and the fair value is
evidenced neither by a quoted price in an active market for
an identical asset or liability (Level 01 valuation) nor based
on a valuation technique that uses only data from observable
markets (Level 02 valuation), then the financial instrument
is initially measured at fair value, adjusted to defer the
difference between the fair value at initial recognition
and the transaction price. Subsequently, that difference is

191
Truly Everybody’s Bank
recognized in profit or loss on an appropriate basis over the
life of the instrument but no later than when the valuation
is wholly supported by observable market data or the
transaction is closed out.
Fair values reflect the credit risk of the instrument and
include adjustments to take account of the credit risk of the
Group entity and the counterparty where appropriate. Fair
value estimates obtained from models are adjusted for any
other factors, such as liquidity risk or model uncertainties;
to the extent that the Group believes a third-party market
participant would take them into account in pricing a
transaction.
The fair value of a demand deposit is not less than the
amount payable on demand, discounted from the first date
on which the amount could be required to be paid.
A fair value measurement of a non-financial asset takes into
account a market participant’s ability to generate economic
benefits by using the asset in its highest and best use or by
selling it to another market participant that would use the
asset in its highest and best use.
The Group recognizes transfers between levels of the fair
value hierarchy as of the end of the reporting period during
which the change has occurred.
4.4.12 Offsetting
Financial assets and liabilities are offset and the net
amount presented in the Statement of Financial Position
when, and only when, the Group has a legal right to set
off the recognized amounts and it intends either to settle
on a net basis or to realize the asset and settle the liability
simultaneously.
Income and expenses are presented on a net basis only when
permitted under LKASs / SLFRSs, or for gains and losses
arising from a group of similar transactions such as in the
Group’s trading activity.
4.4.13 Impairment of financial assets
At each reporting date, the Group assesses whether there
is objective evidence that a financial asset or a group of
financial assets is impaired. A financial asset or a group
of financial assets is impaired, when objective evidence
demonstrates that a loss event has occurred after the initial
recognition of the asset(s), and that the loss event has an
impact on the estimated future cash flows of the asset(s) that
can be estimated reliably.
Those impairment of financial assets carried at amortized cost
The Group assesses at each reporting date, whether there
is any objective evidence that a financial asset or group of
financial assets is impaired.
The Group first assesses individually whether objective
evidence of impairment exist for financial assets that
are individually significant and that are not individually
significant assesses individually or collectively.
Objective evidence that financial assets (including equity
securities) are impaired can include significant financial
difficulty of the borrower or issuer, default or delinquency by
a borrower, restructuring of a loan or advance by the Group
on terms that the Group would not otherwise consider,
indications that a borrower or issuer will enter bankruptcy,
the disappearance of an active market for a security, or other
observable data relating to a group of assets such as adverse
changes in the payment status of borrowers or issuers in the
Group, or economic conditions that correlate with defaults in
the Group.
If there is objective evidence that an impairment loss has
been incurred, the amount of the loss is measured as the
difference between the assets’s carrying amount and the
present value of estimated future cash flows (excluding
future expected credit losses that have not yet been
incurred). The carrying amount of the asset is reduced
through the use of an allowance account and the amount
of the loss is recognized in the Income Statement. Interest
income continues to be accrued on the reduced carrying
amount and is accrued using the rate of interest used to
discount the future cash flows for the purpose of measuring
the impairment loss. The interest income is recorded as part
of ‘Interest income’.
All individually significant loans and advances found not to
be specifically impaired are then collectively assessed for any
impairment that has been incurred but not yet identified.
Loans and advances that are not individually significant are
collectively assessed for impairment by grouping together
loans and advances with similar risk characteristics.
In assessing collective impairment the Group uses statistical
modeling of historical trends of the probability of default,
timing of recoveries and the amount of loss incurred,
adjusted for management’s judgment as to whether current
economic and credit conditions are such that the actual losses
are likely to be greater or less than suggested by historical
modeling.

192
BANK OF CEYLON . Annual Report 2014
Notes to the Financial Statements
Impairment of loans and advances portfolios are based on the
judgments in past experience of portfolio behavior. However,
these portfolios are not gone through the full economic life
cycle. It may not encounter any future uncertainties that
could arise. Therefore, to avoid this limitation an economic
factor adjustment has been incorporated in the Financial
Statements.
Loans together with the associated allowance are written
off when there is no realistic prospect of future recovery
and all collateral has been realized or has been transferred
to the Group. If in a subsequent year, the amount of the
estimated impairment loss increases or decreases because
of an event occurring after the impairment was recognized,
the previously recognized impairment loss is increased or
reduced by adjusting the allowance account. If a write off
is later recovered, the recovery is recognized in the ‘Other
operating income’.
Impairment assessment of held to maturity financial assets
Impairment losses on held to maturity financial assets
measured at amortized cost are calculated as the difference
between the carrying amount of the financial asset and the
present value of estimated future cash flows discounted at
the asset’s original effective interest rate. Impairment losses
are recognized in the Income Statement and reflected in an
“Impairment (charges)/ reversal for loans and other losses.
Impairment assessment of available for sale investments,
Impairment losses on AFS investment securities are
recognized by transferring the cumulative loss that has
been recognized in OCI to the Income Statement as a
reclassification adjustment. The cumulative loss that is
reclassified from OCI to the Income Statement is the
difference between the acquisition cost, net of any principal
repayment and amortization, and the current fair value, less
any impairment loss previously recognized in the Income
Statement. Changes in impairment provisions attributable to
time value are reflected as a component of Interest income.
If, in a subsequent period, the fair value of an impaired AFS
debt security increases and the increase can be objectively
related to an event occurring after the impairment loss was
recognized in the Income Statement, the impairment loss is
reversed, with the amount of the reversal recognized in the
Income Statement. However, any subsequent recovery in the
fair value of an impaired AFS equity security is recognized in
OCI.
Renegotiated loans
Where possible, the Group seeks to restructure loans
rather than take possession of collateral. This may involve
extending the payment arrangements and agreement of new
loan conditions. Once the terms have been renegotiated, any
impairment is measured using the original EIR as calculated
before the modification of terms and the loan is no longer
considered past due. Management continually reviews
renegotiated loans to ensure that all criteria are met and that
future payments are likely to occur. The loans continue to be
subject to an individual or collective impairment assessment,
calculated using the loan’s original EIR.
. Collateral valuation
The Group seeks to use collateral, where possible, to mitigate
its risks on financial assets. The collateral comes in various
forms such as cash, securities, letters of credit / guarantees,
real estate, receivables, inventories, other non-financial assets
and credit enhancements such as netting agreements.
The fair value of collateral is generally assessed, at a
minimum, at inception and based on the guidelines issued by
Central Bank of Sri Lanka
Non-financial collateral, such as real estate, is valued based
on data provided by third parties such as independent valuers
and Audited Financial Statements.
Collateral repossessed
The Group’s policy is to dispose of repossessed properties in
an orderly fashion. The proceeds are used to reduce or repay
the outstanding claim. In general, the Group doesn’t occupy
repossessed properties for business use.
4.5 Non-financial assets
4.5.1 Investment property
4.5.1.1 Recognition and measurement
Investment property is property held either to earn rental
income or for capital appreciation or for both, but not for sale
in the ordinary course of business, use in the production or
supply of goods or services or for administrative purposes.
Investment property is accounted for under Cost Model
in the Financial Statements. Accordingly, after initial
recognition as an asset, the property is carried at its cost, less
accumulated depreciation and impairment losses.
4.5.1.2 Depreciation
Depreciation is provided on a straight line basis over the
estimated life of the class of asset from the date of purchase
up to the date of disposal. Provision for depreciation is made
over the period of 20 years at the rate of 5% per annum
using the straight-line method for buildings classified as
investment property. Land is not depreciated.

193
Truly Everybody’s Bank
4.5.1.3 Derecognition
Investment properties are derecognized when they are
disposed of, or permanently withdrawn from use since no
future economic benefits are expected. Transfers are made to
and from investment property only when there is a change
in use. When the use of a property changes such that it is
reclassified as property, plant and equipment, its fair value
at the date of reclassification becomes its cost for subsequent
accounting.
4.5.2 Property, plant and equipment
4.5.2.1 Recognition and measurement
Property, plant and equipment (PPE) are recognized if it is
probable that future economic benefits associated with the
assets will flow to the Group and the cost of the asset can be
reliably measured.
Cost includes expenditures that are directly attributable to
the acquisition of the asset. The cost of self constructed assets
includes the cost of materials and direct labour, any other
costs directly attributable to bringing the assets to a working
condition for their intended use, the costs of dismantling
and removing the items and restoring the site on which
they are located. Purchased software that is integral to the
functionality of the related equipment is capitalized as part of
that equipment.
Items of PPE are measured at cost less accumulated
depreciation and accumulated impairment losses.
Revaluation model is applied for entire class of freehold land
and buildings and buildings on leasehold lands. The Market
participant’s ability to generate economic benefits by using
the asset in its highest and best use or by selling it to another
market participant that would use the asset in its highest and
best use are takes into account in measuring the fair value.
Such properties that carried at revaluation amount being
their fair value at the date of revaluation, less any subsequent
accumulated depreciation and subsequent accumulated
impairment losses. Freehold land and building of the Group
are revalued every three to five years or more frequently if
the fair values are substantially different from their carrying
amounts to ensure that the carrying amounts do not differ
from the fair values at the reporting date. Any surplus arising
on revaluation of an asset is recognized in the OCI except to
the extent that surplus reverse a previous revaluation deficit
on the same asset recognized in the OCI, in which case the
credit to that extent is recognized in the statement of OCI.
Any deficit in on revaluation is recognized in the OCI Income
except to the extent of that it reverses a previous revaluation
surplus on the same asset, in which case the debit to that
extent is recognized in OCI.
Accumulated depreciation as at revaluation date is eliminated
against the gross carrying amount of assets and the net
amount restated to the revalued amount of the assets. Where
the carrying value of the PPE are reviewed for impairment,
when an event or changes in circumstances indicate that the
carrying value may not be recoverable.
When parts of an item of PPE have different useful lives, they
are accounted for as separate items (major components) of
PPE.
4.5.2.2 Subsequent costs
The cost of replacing a part of an item of PPE is recognized
in the carrying amount of the item if it is probable that the
future economic benefits embodied within the part will
flow to the Group and its cost can be measured reliably. The
costs of the day to day servicing of PPE are recognized in the
Income Statement as incurred.
4.5.2.3 Depreciation
Depreciation is recognized in Income Statement on a straight
line basis over the estimated useful lives of each part of
an item of PPE since this method most closely reflects the
expected pattern of consumption of the future economic
benefits embodied in the asset. Leased assets under finance
leases are depreciated over the shorter of the lease term
and their useful lives. Land is not depreciated. Further, cost
of expansion and major renovations on the building are
depreciated over the remaining useful lives of the original
buildings.
Provisioning for depreciation of PPE is made on pro rata
basis.
The Group’s estimated useful lives for the current and
comparative periods are as follows:
Freehold buildings 40 - 60 years
Office equipment 08 years
Furniture and fittings 08 years
Computer equipment 05 years
Motor vehicles 04 years
Power plant 20 years
Depreciation methods, useful lives and residual values
are reassessed at each financial year end and adjusted if
appropriate.
4.5.2.4 Derecognition
The carrying amount of an item of PPE is derecognized on
disposal, replacement or when no future economic benefits
are expected from its use. The gain or loss arising from the
derecognition of an item of PPE is included in the Other

194
BANK OF CEYLON . Annual Report 2014
Notes to the Financial Statements
BANK OF CEYLON . Annual Report 2014
operating income / expenses in the Income Statement in the
year the item is derecognized.
4.5.2.5 Useful life and residual values
Residual value is the amount that an Group could receive for
the asset at the reporting date if the asset were already at the
age and in the condition that it will be in when the Group
expects to dispose of it.
The residual and useful life of an asset are reviewed at least
at each reporting date, changes in the residual value and
useful life are accounted for prospectively as a change in an
accounting estimate only if the residual value is material.
4.5.2.6 Capital work in progress
Capital work in progress is stated at cost. These are expenses
of a capital nature directly incurred in the construction of
buildings, awaiting capitalization.
4.5.3 Leased assets
The determination of whether an arrangement is,
or contains, a lease is based on the substance of the
arrangement at the inception date. The arrangement is
assessed for whether fulfillment of the arrangement is
dependent on the use of a specific asset or assets or the
arrangement conveys a right to use the asset or assets,even if
that right is not explicitly specified in an arrangement.
Group as a lessee
Finance leases that transfer substantially all the risks and
benefits incidental to ownership of the leased item to the
Group, are capitalized at the commencement of the lease
at the fair value of the leased property or, if lower, at the
present value of the minimum lease payments. Lease
payments are apportioned between finance charges and
reduction of the lease liability so as to achieve a constant rate
of interest on the remaining balance of the liability. Finance
charges are recognized in finance costs in the Income
Statement.
A leased asset is depreciated over the useful life of the asset.
However, if there is no reasonable certainty that the Group
will obtain ownership by the end of the lease term, the asset
is depreciated over the shorter of the estimated useful life of
the asset and the lease term.
Operating lease payments are recognized as an operating
expense in the Income Statement on a straight line basis over
the lease term.
Group as a lessor
Leases in which the Group does not transfer substantially all
the risks and benefits of ownership of an asset are classified
as operating leases. Initial direct costs incurred in negotiating
an operating lease are added to the carrying amount of the
leased asset and recognized over the lease term on the same
basis as rental income.
Contingent rents are recognized as revenue in the period in
which they are earned.
4.5.4 Borrowing costs
Borrowing costs directly attributable to the acquisition,
construction or production of an asset that necessarily takes
a substantial period of time to get ready for its intended use
or sale are capitalized as part of the cost of the asset. All other
borrowing costs are expensed in the period in which they
occur. Borrowing costs consist of interest and other costs that
an entity incurs in connection with the borrowing of funds.
4.5.5 Intangible assets
Intangible assets represent the value of computer application
software and licenses, other than software applied to the
operation software system of computers.
Intangible assets acquired by the Group are stated at cost less
accumulated amortization and accumulated impairment losses.
Subsequent expenditure incurred on intangible assets is
capitalized only when it increases the future economic
benefits embodied in the specific asset to which it relates. All
other expenditure is expensed as incurred.
Amortization is recognized in the Income Statement on
a straight line basis over the estimated useful lives of the
intangible assets, from the date that it is available for use
since this most closely reflects the expected pattern of
consumption of the future economic benefits embodied
in the asset. The estimated useful life of intangible assets
is five years or the best estimate of its useful economic life
whichever is lower. The unamortized balances of intangible
assets with finite lives are reviewed for impairment
whenever there is an indication for impairment and
recognized as expenses in the Income Statement to the
extent that they are no longer probable of being recovered
from the expected future benefits. Amortization methods,
useful lives and residual values are reviewed at each financial
year end and adjusted if appropriate.
Intangible assets are derecognized when it reveals that they
will not generate economic benefits or circumstances indicate
that the carrying value is impaired.

195
Truly Everybody’s Bank
Gains or losses arising from derecognition of an intangible
assets are measured as the difference between the net
disposal proceeds and the carrying amount of the assets and
are recognized in Income Statement.
4.5.6 Gold inventory
The gold inventory is valued at lower of cost and net
realizable value. Cost includes all cost of purchase, cost of
conversion and other costs incurred in bringing the inventory
to its present location and condition. Net realizable value is
the estimated selling price in the ordinary course of business
less the estimated cost necessary to make the sale.
4.5.7 Impairment of non-financial assets
The Bank assesses at each reporting date whether there is an
indication that an asset may be impaired. If any indication
exists, or when annual impairment testing for an asset is
required, the Bank estimates the asset’s recoverable amount.
An asset’s recoverable amount is the higher of an asset’s or
the fair value of the Cash Generating Unit’s (CGU) fair value
less costs to sell and its value in use. Where the carrying
amount of an asset or CGU exceeds its recoverable amount,
the asset is considered impaired and is written down to its
recoverable amount.
In assessing value in use, the estimated future cash flows
are discounted to their present value using a pre tax
discount rate that reflects current market assessments of
the time value of money and the risks specific to the asset,
in determining fair value less costs to sell, an appropriate
valuation model is used. These calculations are corroborated
by valuation multiples, quoted share prices for publicly
traded subsidiaries or other valuable fair value indicators.
4.5.8 Fiduciary Services
The Group provides fiduciary services that result in the
holding of the assets on behalf of its customers. Assets
held in fiduciary capacity are not reported in the Financial
Statements, as they are not assets of the Group.
4.6 Employee benefits
4.6.1 Defined Contribution Plans
A Defined Contribution Plan (DCP) is a post-employment
benefit plan under which an entity pays fixed contributions
into a separate entity and will have no legal or constructive
obligation to pay further amounts. Obligations for
contributions to defined contribution plans are recognized
as an expense in the Income Statement when they are due
in respect of service rendered before the end of the reporting
period. Prepaid contributions are recognized as an asset
to the extent that a cash refund or a reduction in future
payments is available. Contributions to a DCP that is due
more than 12 months after the end of the reporting period
in which the employees render the service are discounted to
their present value at the reporting date.
Bank of Ceylon Provident Fund
All employees of the Bank are members of the ‘Bank of
Ceylon Provident Fund’ to which the Bank contributes 12%
of employee’s monthly gross salary excluding overtime while
employees contribute 8%. The Bank’s Provident Fund is an
approved fund, which is independently administered.
Employees’ Provident Fund
The subsidiaries and their employees (other than Bank of
Ceylon and its employees) contribute 12% (15% by Property
Development PLC) and 8% (10% by Property Development
PLC’s employees) respectively on salary of each employee
to Employees’ Provident Fund, in terms of the Employees’
Provident Fund Act No. 15 of 1958 as amended.
Employees’ Trust Fund
All employees of the Bank and its subsidiaries are members
of the Employees’ Trust Fund to which the Bank / the Group
contributes 3% of the employee’s monthly gross salary
excluding overtime, in terms of Employees’ Trust Fund Act
No.46 of 1980.
4.6.2 Defined benefit plans
A Defined Benefit Plan (DBP) is a post-employment benefit
plan other than a DCP. The Group’s net obligation in respect
of DBP’s pension plans is calculated separately for each plan
by estimating the amount of future benefit that employees
have earned in return for their service in the current and
prior periods and discounting that benefit to determine its
present value, and then deducting the fair value of any plan
assets. The discount rate is the yield at the reporting date
on long term treasury bond rate for discount rates actually
used that have maturity dates approximating the terms of
the Group’s obligations. The calculation is performed by a
qualified actuary using the Projected Unit Credit method.
The Group recognizes all actuarial gains and losses arising
from DBP in the OCI and the expenses related to DBP under
personnel expenses in the Income Statement.
Bank of Ceylon Pension Trust Fund
The ‘Bank of Ceylon Pension Trust Fund’ is a funded, non-
contributory, defined retirement benefit plan, operated
for the payment of pensions until death of the permanent
employees who have completed a minimum of ten years
of continuous service with the Bank, at their retirement
on reaching the retirement age on or after 55 years or
on medical grounds, before reaching retirement age. The

196
BANK OF CEYLON . Annual Report 2014
Notes to the Financial Statements
pension is computed as a percentage of the last drawn salary
excluding certain allowances.
Contributions to the Pension Trust Fund are made monthly,
based on the advice of a qualified actuary, currently at 57%
of gross salary. The Fund is valued by a qualified actuary
annually. The subsidiaries and associate companies of the
Group do not have pension funds.
Pension for Employees Joined after the year 1996
Under the directions of the Ministry of Finance and Planning,
this pension scheme was approved by the Board of Directors
of the Bank with effect from 16 December 2014 for the
employees recruited to the Bank on or after 01 January
1996. Minimum period of 120 months uninterrupted active
service in the Bank at the time of retirement is required to
be eligible for any retirement benefit under this pension
scheme. Further the beneficiaries under this pension scheme
will not be entitled for rights and privileges under the current
service gratuity scheme of the Bank except death gratuity
payment. Contribution to this pension scheme is made
monthly, based on the advice of a qualified actuary, currently
at 12% of gross salary. The liability under this pension
scheme has been valued by a qualified actuary at the year-
end. As at the year end the scheme is unfunded. Necessary
steps are being made to establish a “Trust “and create a fund
which will administrated separately from the other funds of
the Bank.
Bank of Ceylon Widows’/Widowers’ and Orphans’ Pension
Fund
The Bank is liable for and guarantees the payments to the
beneficiaries of the ‘Bank of Ceylon Widows’ / Widowers’
and Orphans’ Pension Fund’ to which the Bank’s employees
monthly contribute 8% of their gross salary. The Bank’s
liability towards the beneficiaries of the employees arises
when an employee who has contributed to the fund for five
continuous years dies while in service or on the death of a
pensioner where the Bank will be liable to pay Widows’ and
Orphans’ Pension to his / her beneficiaries monthly. The
pension to the beneficiaries of an employee who dies while
in service is based on the last drawn salary excluding certain
allowances.
The Fund is valued by a qualified actuary annually. Funding
would be done in consultation with the actuary, trustees and
beneficiaries.
Both the Pension Fund and the Widows’ / Widowers’ and
Orphans’ Pension Fund are approved by the Government
and are independently administered.
Provision for gratuity
In compliance with the Gratuity Act No 12 of 1983 provision
is made in the accounts from the first year of service for
gratuity payable to employees who has not completed ten
years of service as they are not in pensionable service of
the Bank. Provision has not been made in the Financial
Statements for retirement gratuity for the employees who
are eligible for the retirement benefits under the pension
schemes in force. However, employees whose services are
terminated after five years other than by retirement are
eligible to receive a terminal gratuity under the Payment of
Gratuity Act No. 12 of 1983, at the rate of one half of the
basic or consolidated wage or salary, cost of living and all
other allowances applicable to the last month of the financial
year, for each year of continuous service.
In terms of LKAS 19 -Employee Benefits, The Bank and its
subsidiaries have calculated the post employment benefit
obligations, based on the actuarial valuation method
recommended in the standard. The gratuity liabilities are not
externally funded.
4.7 Provisions
A provision is recognized if as a result of a past event, when
the Group has a present (legal or constructive) obligation that
can be estimated reliably, and it is probable that an outflow
of economic benefits will be required to settle the obligation.
If the effect of the time value of money is material, provisions
are determined by discounting the expected future cash
outflows at a current pre tax rate that reflects current
market assessments of the time value of money and,
where appropriate, the risks specific to the liability. Where
discounting is used, the increase in the provision due to the
passage at time is recognized as finance cost.
4. 8 Financial guarantees
In the ordinary course of business, the Group gives financial
guarantees, consisting of letters of credit, guarantees and
acceptances. Financial guarantees are initially recognized in
the Financial Statements (within ‘Other liabilities’) at fair
value, being the premium received. Subsequent to initial
recognition, the Group’s liability under each guarantee is
measured at the higher of the amount initially recognized
less cumulative amortization recognized in the Income
Statement, and the best estimate of expenditure required
to settle any financial obligation arising as a result of the
guarantee.
Any increase in the liability relating to financial guarantees
is recorded in the Income Statement under ‘Impairment
losses ’. The premium received is recognized in the Income
197
Truly Everybody’s Bank
Statement under ‘Fee and commission income’ on a straight
line basis over the life of the guarantee.
4.9 Recognition of income and expenditure
4.9.1 Interest
Interest income and expense are recognized in Income
Statement using the effective interest method. The effective
interest rate is the rate that exactly discounts the estimated
future cash payments and receipts through the expected life
of the financial asset or liability (or, where appropriate, a
shorter period) to the carrying amount of the financial asset
or liability. When calculating the effective interest rate, the
Group estimates future cash flows considering all contractual
terms of the financial instrument, but not future credit losses.
The calculation of the effective interest rate includes all fees
paid or received that are an integral part of the effective
interest rate. Transaction costs include incremental costs
that are directly attributable to the acquisition or issue of a
financial asset or liability.
Interest income and expense presented in the Income
Statement include:
Interest on financial assets and financial liabilities measured
at amortized cost calculated on an effective interest basis
Interest on available for sale investment securities calculated
on an effective interest basis
Interest income and expense on all held for trading assets
and liabilities are considered to be incidental to the Group’s
trading operations and are presented in “Interest income”
together with all other changes in the fair value of trading
assets and liabilities in “Net trading income”.
Fair value changes on derivatives held for risk management
purposes, and other financial assets and liabilities carried at
fair value through profit or loss, are presented in net income
from other financial instruments at fair value through profit
or loss in the OCI.
Once a financial asset or a group of similar financial assets
has been written down as a result of an impairment loss,
interest income is thereafter recognized using the rate
of interest used to discount the future cash flows for the
purpose of measuring the impairment loss.
4.9.2 Fee and commission
The Group earns fee and commission income from a diverse
range of services it provides to its customers.
Fee income can be divided into the following two categories:
•Feeincomeearnedfromservicesthatareprovidedovera
certain period of time
Fees earned for the provision of services over a period
of time are accrued over that period. These fees include
commission income and asset management, custody and
other management and advisory fees.
Credit related fees are deferred and recognized as an
adjustment to the EIR on the loan.
• Feeincomefromprovidingtransactionservices
Fees arising from negotiating or participating in the
negotiation of a transaction for a third party, such as
the arrangement of the acquisition of shares or other
securities or the purchase or sale of businesses, are
recognized on completion of the underlying transaction.
Fees or components of fees that are linked to a
certain performance are recognized after fulfilling the
corresponding criteria.
4.9.3 Net trading income
Net trading income comprises gains and losses related
Changes in fair value of financial assets and liabilities “Held
for trading”, related interest and dividend income. Further
this includes foreign exchange income too.
4.9.4 Net income from other financial instruments at fair value
through profit or loss
Net income from other financial instruments at fair value
through profit or loss relates to non-trading derivatives
held for risk management purposes that do not form part of
qualifying hedge relationships and includes all realized and
unrealized fair value changes, interest and dividend income
derived from such instruments.
4.9.5 Dividends
Dividend income is recognized when the right to receive the
payment is established.
4.9.6 Rental income
Rental income is recognized on an accrual basis
4.9.7 Other income
Other income is recognized on an accrual basis.
4.9.8 Lease payments
Payments made under operating leases are recognized in
the Income Statement on a straight line basis over the term
of the lease. Lease incentives received are recognized as an
integral part of the total lease expense, over the term of the
lease.

198
BANK OF CEYLON . Annual Report 2014
Notes to the Financial Statements
Minimum lease payments made under finance leases are
apportioned between the finance expense and the reduction
of the outstanding liability. The finance expense is allocated
to each period during the lease term so as to produce a
constant periodic rate of interest on the remaining balance of
the liability.
Contingent lease payments are accounted for by revising the
minimum lease payments over the remaining term of the
lease when the lease adjustment is confirmed.
4.9.9 Other expenses
All other expenses have been recognized in the Financial
Statements as they are incurred in the period to which they
relate. All expenditure incurred in the operation of the
business and in maintaining the capital assets in a state of
efficiency has been charged to revenue in arriving at the
Group’s profit for the year.
4.10 Income tax expense
4.10.1 Current tax
Income tax expense comprises current and deferred tax.
Current tax and deferred tax are recognized in the Income
Statement except to the extent that it relates to items
recognized directly in equity or in OCI.
Current tax is the expected tax payable or receivable on the
taxable income or loss for the year, using tax rates enacted
or substantively enacted at the reporting date, and any
adjustment to tax payable in respect of previous years.
4.10.2 Deferred tax
Deferred tax is recognized in respect of temporary differences
between the carrying amounts of assets and liabilities for
financial reporting purposes and the amounts used for
taxation purposes.
Deferred tax is not recognized for the following temporary
differences:
•Theinitialrecognitionofgoodwill
•Theinitialrecognitionofassetsorliabilitiesina
transaction that is not a business combination and that
affects neither accounting nor taxable profit nor loss
•Differencesrelatingtoinvestmentsinsubsidiariestothe
extent that it is probable that they will not reverse in the
foreseeable future
Deferred tax is measured at the tax rates that are expected to
be applied to the temporary differences when they reverse,
based on the laws that have been enacted or substantively
enacted by the reporting date. Deferred tax assets and
liabilities are offset if there is a legally enforceable right to
offset current tax liabilities against current tax assets, and
they relate to income taxes levied by the same tax authority
on the same taxable entity, or on different tax entities, but
they intend to settle current tax liabilities and assets on a
net basis or their tax assets and liabilities will be realized
simultaneously.
A deferred tax asset is recognized for unused tax losses,
tax credits and deductible temporary differences to the
extent that it is probable that future taxable profits will be
available against which they can be utilized. Deferred tax
assets are reviewed at each reporting date and are reduced
to the extent that it is no longer probable that the related tax
benefit will be realized.
4.10.3 Value Added Tax (VAT) on financial services
The base for Value Added Tax computation is arrived
by aggregating the accounting profit before income tax
and emoluments of employees, which is adjusted for the
depreciation computed on prescribed rates.
During the year, the Group’s total value addition was
subjected to a 12% (2013 : 12%) VAT as per Section 25 (a)
of the Value Added Tax Act No.14 of 2002 and amendments
thereto. Also the Group is following value attributable
method to compute VAT on financial services.
4.10.4 Withholding tax on dividends
•WithholdingtaxondividendsdistributedbytheBank.
No withholding tax is paid by the Bank since Bank
distributes dividend to its single shareholder, the
Government of Sri Lanka.
•WithholdingTaxondividendsdistributedbythe
subsidiaries and associates
Dividend distributed out of taxable profit of the
subsidiaries and associate companies attracts a 10%
deduction at source and is not available for set off against
the tax liability of the Bank, since it is treated as a final
tax. Thus, the withholding tax deducted at source is added
to the tax expense in preparing the Consolidated Financial
Statements as a consolidation adjustment.
4.10.5 Economic Service Charge (ESC)
As per provisions of the Economic Service Charge (ESC) Act
No.13 of 2006 and amendments thereafter, ESC is payable
at 0.25% on Bank’s liable turn over and is deductible from
income tax payable. With effect from 1 April 2012 as per
the ESC amendment Act No.11 of 2012 ESC is payable only
on exempted turnover of the Bank and is deductible from

199
Truly Everybody’s Bank
income tax payable. ESC is not payable on turnover on
which income tax is payable.
4.10.6 Crop Insurance Levy (CIL)
As per the provisions of the section 15 of the Finance Act No.
12 of 2013, the CIL was introduced with effect from 1 April
2013 and is payable 1% of the profit after tax to the National
Insurance Trust Fund Board.
4.10.7 Nation Building Tax (NBT) on Financial Services
NBT on financial services is calculated in accordance with
Nation Building Tax (NBT) Act, No 9 of 2009 and subsequent
amendments thereto with effect from 01 January 2014. NBT
on financial services is calculated at 2% of the value addition
used for the purpose of VAT on Financial Services.
4.11 Stated capital and reserves
The Group classifies capital instruments as financial liabilities
or equity instruments in accordance with the substance of
the contractual terms of the instruments. Accordingly they
are presented as a component of equity or financial liability.
4.12 Earnings Per Share
The Group presents Basic and Diluted Earnings Per Share
(EPS) for its ordinary shares. Basic EPS is calculated
by dividing the profit or loss attributable to ordinary
shareholders of the Bank by the weighted average number
of ordinary shares outstanding during the period. Diluted
EPS is determined by adjusting the profit or loss attributable
to ordinary shareholders and the weighted average number
of ordinary shares outstanding for the effects of all dilutive
potential ordinary shares, which comprise share options
granted to employees.
4.13 Segment reporting
An operating segment is a component of the Group that
engages in business activities from which it may earn
revenues and incur expenses, including revenues and
expenses that relating to transactions with any of the Group’s
other components, whose operating results are reviewed by
the management to make decision about resource allocation
to each segment and assess its performance.
The Group comprises the following major business segments:
Retail banking, Corporate banking, International treasury
and investments, Other non banking and group functions.
4.14 Events after the reporting period
Where necessary all material events after the reporting
date have been considered and appropriate adjustments /
disclosures have been made in the Financial Statements as
per the LKAS 10 -Events after the Reporting Period.
5 Insurance Business5.1 Reinsurance
The Group cedes insurance risk in the normal course of
business for all of its businesses. Reinsurance assets represent
balances due from reinsurance companies. Amounts
recoverable from reinsurers are estimated in a manner
consistent with the outstanding claims provision or settled
claims associated with the reinsurer’s policies and are in
accordance with the related reinsurance contract.
Reinsurance assets are reviewed for impairment at each
reporting date or more frequently when an indication of
impairment arises during the reporting year. Impairment
occurs when there is objective evidence as a result of
an event that occurred after initial recognition of the
reinsurance asset that the Group may not receive all
outstanding amounts due under the terms of the contract
and the event has a reliably measurable impact on the
amounts that the Group will receive from the reinsurer. The
impairment loss is recorded in the Income Statement.
The Group also assumes reinsurance risk in the normal
course of business for life insurance and non life insurance
contracts where applicable. Premiums and claims on
assumed reinsurance are recognized as revenue or expenses
in the same manner as they would be if the reinsurance were
considered direct business, taking into account the product
classification of the reinsured business. Reinsurance liabilities
represent balances due to reinsurance companies. Amounts
payable are estimated in a manner consistent with the
related reinsurance contract.
Premiums and claims are presented on a gross basis for both
ceded and assumed reinsurance.
Reinsurance assets or liabilities are derecognized when the
contractual rights are extinguished or expire or when the
contract is transferred to another party.
5.2 Insurance receivables
Insurance receivables are recognized when due and
measured on initial recognition at the fair value of the
consideration received or receivable. The carrying value of
insurance receivables is reviewed for impairment whenever
events or circumstances indicate that the carrying amount
may not be recoverable, with the impairment loss recorded
in the Income Statement.
5.3 Deferred expenses
5.3.1 Deferred Acquisition Costs (DAC)
The costs of acquiring new businesses including commission,
underwriting, marketing and policy issue expenses,

200
BANK OF CEYLON . Annual Report 2014
Notes to the Financial Statements
which vary with and directly related to production of new
businesses and/or investment contracts with Discretionary
Participation Features (DPF), are deferred to the extent
that these costs are recoverable out of future premiums. All
other acquisition costs are recognized as an expense when
incurred. Subsequent to initial recognition, DAC for general
insurance is amortized over the period on the basis unearned
premium is amortized. The reinsurances’ share of deferred
acquisition cost is amortized in the same manner as the
underlying assets amortization is recorded in the Income
Statement.
Changes in the expected useful life or the expected pattern
of consumption of future economic benefits embodied in
the assets are accounted for by changing the amortization
period and are treated as a change in an accounting estimate.
DAC are derecognized when the related contracts are either
expired or cancelled.
5.4 Reinsurance commissions
Commissions receivable on outwards reinsurance contracts
are deferred and amortized.
5.5 Insurance contract liabilities
5.5.1 Life Insurance Contract Liabilities
Life insurance liabilities are recognized when contracts are
entered into and premiums are received. These liabilities
are measured by using the net premium method. The
liability is determined as the sum of the discounted value
of the expected future benefits, claims handling and
policy administration expenses, policyholder options and
guarantees and investment income from assets backing such
liabilities, which are directly related to the contract, less the
discounted value of the expected theoretical premiums that
would be required to meet the future cash outflows based on
the valuation assumptions used.
The liability is either based on current assumptions or
calculated using the assumptions established at the time
the contract was issued, in which case a margin for risk
and adverse deviation is generally included. A separate
reserve for longevity may be established and included in
the measurement of the liability. Furthermore, the liability
for life insurance contracts comprises the provision for
unearned premiums and unexpired risks, as well as for
claims outstanding, which includes an estimate of the
incurred claims that have not yet been reported to the
Group. Adjustments to the liabilities at each reporting date
are recorded in the Income Statement. Profits originated
from margins of adverse deviations on run-off contracts
are recognized in the Income Statement over the life of the
contract, whereas losses are fully recognized in the Income
Statement during the first year of run off. The liability is
derecognized when the contract expires, is discharged or is
cancelled.
At each reporting date, an assessment is made of whether
the recognized life insurance liabilities are adequate, net
of related Present Value Interest Factor (PVIF) and DAC,
by using an existing liability adequacy test. The liability
value is adjusted to the extent that it is insufficient to meet
future benefits and expenses. In performing the adequacy
test, current best estimates of future contractual cash flows,
including related cash flows such as claims handling and
policy administration expenses, policyholder options and
guarantees, as well as investment income from assets backing
such liabilities, are used. A number of valuation methods
are applied, including discounted cash flows, option pricing
models and stochastic modelling. To the extent that the test
involves discounting of cash flows, the interest rate applied
may be based on management’s prudent expectation of
current market interest rates. Any inadequacy is recorded in
the Income Statement, initially by impairing PVIF and DAC
and, subsequently, by establishing a technical reserve for
the remaining loss. In subsequent periods, the liability for a
block of business that has failed the adequacy test is based on
the assumptions that are established at the time of the loss
recognition. The assumptions do not include a margin for
adverse deviation.
5.5.2 Non-life insurance contract liabilities
Non-life insurance contract liabilities are recognized when
contracts are entered into and premiums are charged. These
liabilities are known as the outstanding claims provision,
which are based on the estimated ultimate cost of all claims
incurred but not settled at the reporting date, whether
reported or not, together with related claims handling costs
and reduction for the expected value of salvage and other
recoveries. Delays can be experienced in the notification and
settlement of certain types of claims, therefore the ultimate
cost of these cannot be known with certainty at the reporting
date. The liability is calculated at the reporting date using
a range of standard actuarial claim projection techniques,
based on empirical data and current assumptions that may
include a margin for adverse deviation. The liability is not
discounted for the time value of money. No provision for
equalization or catastrophe reserves is recognized. The
liabilities are derecognized when the contract expires, is
discharged or is cancelled.
The liabilities are derecognized when the contract expires, is
discharged or is cancelled.

201
Truly Everybody’s Bank
This calculation uses current estimates of future contractual
cash flows after taking account of the investment return
expected to arise on assets relating to the relevant non life
insurance technical provisions. If these estimates show that
the carrying amount of the unearned premiums (less related
deferred acquisition costs) is inadequate, the deficiency is
recognized in the Income Statement by setting up a provision
for liability adequacy.
The provision for unearned premiums represents premiums
received for risks that have not yet expired. Generally the
reserve is released over the term of the contract and is
recognized as premium income. At each reporting date the
Group reviews its unexpired risk and a liability adequacy
test is performed to determine whether there is any overall
excess of expected claims and deferred acquisition costs over
unearned premiums. This calculation uses current estimates
of future contractual cash flows after taking account of
the investment return expected to arise on assets relating
to the relevant non-life insurance technical provisions.
If these estimates show that the carrying amount of the
unearned premiums (less related deferred acquisition costs)
is inadequate, the deficiency is recognized in the Income
Statement by setting up a provision for liability adequacy.
5.6 Investment contract liabilities
Investment contracts are classified between contracts with
and without DPF. The accounting policies for investment
contract liabilities with DPF are the same as those for life
insurance contract liabilities.
Investment contract liabilities without DPF are recognized
when contracts are entered into and premiums are charged.
These liabilities are initially recognized at fair value this being
the transaction price excluding any transaction costs directly
attributable to the issue of the contract. Subsequent to initial
recognition investment, contract liabilities are measured at
fair value through profit or loss.
Deposits and withdrawals are recorded directly as an
adjustment to the liability in the Statement of Financial
Position. Fair value adjustments are performed at each
reporting date and are recognized in the Income Statement.
Fair value is determined through the use of prospective
discounted cash flow techniques. For unitized contracts, fair
value is calculated as the number of units allocated to the
policyholder in each unit linked fund multiplied by the unit
price of those funds at the reporting date. The fund assets
and fund liabilities used to determine the unit prices at the
reporting date are valued on a basis consistent with their
measurement basis in the Statement of Financial Position
adjusted to take account of the effect on the liabilities of the
deferred tax on unrealized gains on assets in the fund.
Non unitized contracts are subsequently also carried at fair
value, which is determined by using valuation techniques
such as discounted cash flows and stochastic modeling.
Models are validated, calibrated and periodically reviewed by
an independent qualified person.
The liability is derecognized when the contract expires,
is discharged or is cancelled. For a contract that can be
cancelled by the policyholder, the fair value cannot be less
than the surrender value.
When contracts contain both a financial risk component
and a significant insurance risk component and the cash
flows from the two components are distinct and can be
measured reliably, the underlying amounts are unbundled.
Any premiums relating to the insurance risk component are
accounted for on the same bases as insurance.
5.7 Discretionary Participation Features (DPF)
A DPF is a contractual right that gives holders of these
contracts the right to receive as a supplement to guaranteed
benefits, significant additional benefits which are based on
the performance of the assets held within the DPF portfolio.
Under the terms of the contracts surpluses in the DPF
funds can be distributed to policyholders and shareholders
on a 90/10 basis. The Group has the discretion over the
amount and timing of the distribution of these surpluses
to policyholders. All DPF liabilities including unallocated
surpluses, both guaranteed and discretionary, at annually
are held within insurance or investment contract liabilities as
appropriate.
5.8 Classification of financial instruments between debt
and equity
A financial instrument is classified as debt if it has a
contractual obligation to:
•Delivercashoranotherinancialassettoanotherentity;
or
• Exchangeinancialassetsorinancialliabilitieswith
another entity under conditions that are potentially
unfavorable to the Group
If the Group does not have an unconditional right to
avoid delivering cash or another financial asset to settle its
contractual obligation, the obligation meets the definition of
a financial liability.

202
BANK OF CEYLON . Annual Report 2014
Notes to the Financial Statements
5.9 Other financial liabilities and insurance payables
Other financial liabilities are recognized when due and
measured on initial recognition at the fair value of the
consideration received less directly attributable transaction
costs. Subsequent to initial recognition, they are measured at
amortized cost using the effective interest rate method.
5.10 De recognition of financial liabilities and insurance
payables
Financial liabilities and insurance payables are derecognized
when the obligation under the liability is discharged,
cancelled or expired.
5.11 Income recognition
5.11.1 Gross premiums
Gross recurring premiums on life and investment contracts
with DPF are recognized as revenue when receivable from
the policyholder. For single premium business, revenue is
recognized on the date on which the policy is effective.
Gross general insurance written premiums comprise the total
premiums receivable for the whole period of cover provided
by contracts entered into during the accounting period and
are recognized on the date on which the policy commences.
5.11.2 Reinsurance premiums
Gross reinsurance premiums on life and investment contracts
are recognized as an expense when the date on which the
policy is effective.
Gross general reinsurance premiums written comprise the
total premiums payable for the whole cover provided by
contracts entered into the period and are recognized on the
date on which the policy incepts. Premiums include any
adjustments arising in the accounting period in respect of
reinsurance contracts incepting in prior accounting periods.
Unearned reinsurance premiums are those proportions of
premiums written in a year that relate to periods of risk after
the balance sheet date. Unearned reinsurance premiums are
deferred over the term of the underlying direct insurance
policies for risks attaching contracts and over the term of the
reinsurance contract for losses occurring contracts.
5.12 Unearned premium reserve
Unearned premium reserve represents the portion of the
premium written in the year but relating to the unexpired
term of coverage. Unearned premiums are calculated on the
1/24th basis.
5.13 Benefits, claims and expenses recognition
5.13.1 Gross Benefits and Claims
Gross benefits and claims for life insurance contracts and for
investment contracts with DPF include the cost of all claims
arising during the year including internal and external claims
handling costs that are directly related to the processing
and settlement of claims and policyholder bonuses declared
on DPF contracts, as well as changes in the gross valuation
of insurance and investment contract liabilities with DPF.
Death claims and surrenders are recorded on the basis of
notifications received. Maturities and annuity payments are
recorded when due. Interim payments and surrenders are
accounted at the time of settlement.
General insurance include all claims occurring during
the year, whether reported or not, related internal and
external claims handling costs that are directly related to
the processing and settlement of claims, a reduction for the
value of salvage and other recoveries, and any adjustments to
claims outstanding from previous years.
Claims expenses and liabilities for outstanding claims are
recognized in respect of direct and inward reinsurance
business. The liability covers claims reported but not yet paid,
Incurred but Not Reported (IBNR) claims and the anticipated
direct and indirect costs of settling those claims. Claims
outstanding are assessed by review of individual claim files
and estimating changes in the ultimate cost of settling claims.
The provision in respect of IBNR is actuarially valued on
an annual basis to ensure a more realistic estimation of the
future liability based on past experience and trends.
While the Directors consider that the provision for claims is
fairly stated on the basis of information currently available,
the ultimate liability will vary as a result of subsequent
information and events. This may result in adjustment to
the amounts provided. Such amounts are reflected in the
Financial Statements for that period. The methods used and
the estimates made are reviewed regularly.
5.13.2 Reinsurance claims
Reinsurance claims are recognized when the related gross
insurance claim is recognized according to the terms of the
relevant contract.
6. New accounting standards issued but not
effective as at the reporting date
The following Sri Lanka Accounting Standards were issued
by the Institute of Chartered Accountants of Sri Lanka and is
effective for the periods commencing on or after 1 January
2015.

203
Truly Everybody’s Bank
(i) SLFRS 9 – Financial Instruments: Classification and
Measurement
SLFRS 9 states a logical principle base to classify financial
assets and financial liabilities which is driven by cash flow
characteristics and the business model in which an assets
or liability is held. Further this standard recommends the
assessment of impairment based on more timely recognition
of expected credit losses and entities are required to account
for expected credit losses from the initial recognition
of financial instruments and it lowers the threshold for
recognition of full life time expected losses. By aligning
financial accounting treatment with risk management
activities,
SLFRS 9 specifies enhanced models & disclosure
requirements for hedge accounting too.
SLFRS 9 will become effective on 1 January 2018 and will
have an effect an classification and measurement of the
Group’s financial assets.
(ii) SLFRS 14 – Regulatory Deferral Accounts
SLFRS 14 specifies the financial reporting requirements for
regulatory deferral account balances that arise when an
entity provides goods or services to customers at a price or
rate that is subject to rate regulation. SLFRS 14 will become
effective on 1 January 2016. The impact on implementation
of the above standard has not been quantified yet.
(iii) SLFRS 15 – Revenue from Contracts with Customers
SLFRS 15 states the principles that an entity shall apply to
report useful information to users of Financial Statements
about the nature, amount, timing and uncertainty of revenue
and cash flows arising from a contract with a customer.
SLFRS 15 will become effective on 1 January 2017. The
impact on implementation of the above standard has not
been quantified yet.

204
BANK OF CEYLON . Annual Report 2014
Notes to the Financial Statements
BANK OF CEYLON . Annual Report 2014
Bank Group
For the year ended 31 December 2014
LKR '000
2013
LKR '000
2014
LKR '000
2013
LKR '000
7 Total income
Interest income [Note 8.1] 107,394,796 114,863,091 111,950,598 119,504,363
Fee and commission income [Note 9] 9,188,079 6,457,118 9,510,215 6,789,600
Net gains /(losses) from trading [Note 10] 4,859,913 3,232,748 5,038,541 3,268,177
Net gains from financial investments [Note 11] 2,880,854 425,543 2,900,005 469,989
Other operating income [Note 12] 2,222,301 2,485,558 3,623,986 4,197,512
Total income 126,545,943 127,464,058 133,023,345 134,229,641
8 Net interest income
8.1 Interest income
Reverse repurchase agreements 2,667,364 2,363,091 2,739,360 2,367,384
Placements with banks 775,648 601,390 853,250 723,697
Financial assets - Held for trading 823,894 1,253,218 867,843 1,280,091
Financial investments - Loans and receivables 6,537,984 5,892,122 6,609,654 6,020,067
Loans and advances to customers 73,539,022 87,143,820 77,657,869 91,342,815
Financial investments - Available for sale 412,305 284,873 495,953 374,253
Financial investments - Held to maturity 22,638,579 17,324,577 22,726,669 17,396,056
Total interest income 107,394,796 114,863,091 111,950,598 119,504,363
Interest income on loans and advances to customers includes interest on impaired loans LKR 328.7 million for the year 2014
(2013 : LKR 153.3 million).
Bank Group
For the year ended 31 December 2014
LKR '000
2013
LKR '000
2014
LKR '000
2013
LKR '000
8.2 Interest expenses
Due to banks 93 210,911 46,642 386,302
Due to customers 49,481,400 55,275,008 50,542,334 56,255,147
Other borrowings 13,808,587 16,256,289 14,373,159 17,150,735
Debt securities issued 2,201,824 2,964,431 2,781,894 3,357,236
Subordinated term debts 3,452,507 3,013,092 3,452,507 3,013,092
Total interest expenses 68,944,411 77,719,731 71,196,536 80,162,512
Net interest income 38,450,385 37,143,360 40,754,062 39,341,851
8.3 Net interest income from Sri Lanka Government
securities
Interest income 24,265,949 19,105,110 24,419,518 19,311,770
Less : Interest expenses 3,573,225 5,209,070 3,573,277 5,238,555
Net interest income from Sri Lanka Government securities 20,692,724 13,896,040 20,846,241 14,073,215

205
Truly Everybody’s Bank
8.4 Notional tax credit on secondary market transactions
In terms of the Section 137 of the Inland Revenue Act No. 10 of 2006 and the amendments thereto, a company which derives interest
income from the secondary market transactions in Government securities would be entitled to a notional tax credit (being one ninth
(1/9) of the net interest income), provided such interest income form a part of statutory income of the company for that year of
assessment. Accordingly, the net interest earned by the Bank and the Group on secondary market transactions in Government securities
for the year has been grossed up in the Financial Statements and the resulting notional tax credit amounted to a sum of LKR 2,311.8
million (2013 : LKR 1,599.4 million) for the Bank and LKR 2,340.3 million (2013 : LKR 1,629.9 million) for the Group.
Bank Group
For the year ended 31 December 2014
LKR '000
2013
LKR '000
2014
LKR '000
2013
LKR '000
9 Net fee and commission income
Fee and commission income 9,188,079 6,457,118 9,510,215 6,789,600
Less : Fee and commission expenses 1,088,207 720,232 1,186,436 854,587
Net fee and commission income 8,099,872 5,736,886 8,323,779 5,935,013
9.1 Net fee and commission income
Trade and other related activities 3,002,954 2,518,851 3,128,641 2,566,160
Loans 465,614 168,219 474,467 180,258
Credit cards 715,488 631,523 715,488 631,523
Travel and remittances 585,186 477,538 585,186 477,538
Custodial services 43,215 39,254 43,215 39,254
Deposits 1,755,522 942,666 1,755,621 943,781
Guarantees 1,326,689 944,837 1,326,832 944,943
Other financial services 205,204 13,998 294,329 151,556
Net fee and commission income 8,099,872 5,736,886 8,323,779 5,935,013
10 Net gains / (losses) from trading
Foreign exchange 3,223,299 2,681,323 3,246,895 2,705,249
Interest rates
Gains / (losses) on mark to market valuation on securities (47,519) 347,494 (47,519) 347,494
Gains / (losses) on sale of securities 963,865 231,096 963,865 231,206
Equities
Gains / (losses) on mark to market valuation on securities 461,422 (170,346) 579,419 (157,677)
Gains / (losses) on sale of securities 57,179 5,008 82,377 (11,193)
Dividend income 201,667 138,173 213,504 153,098
Net gains / (losses) from trading 4,859,913 3,232,748 5,038,541 3,268,177
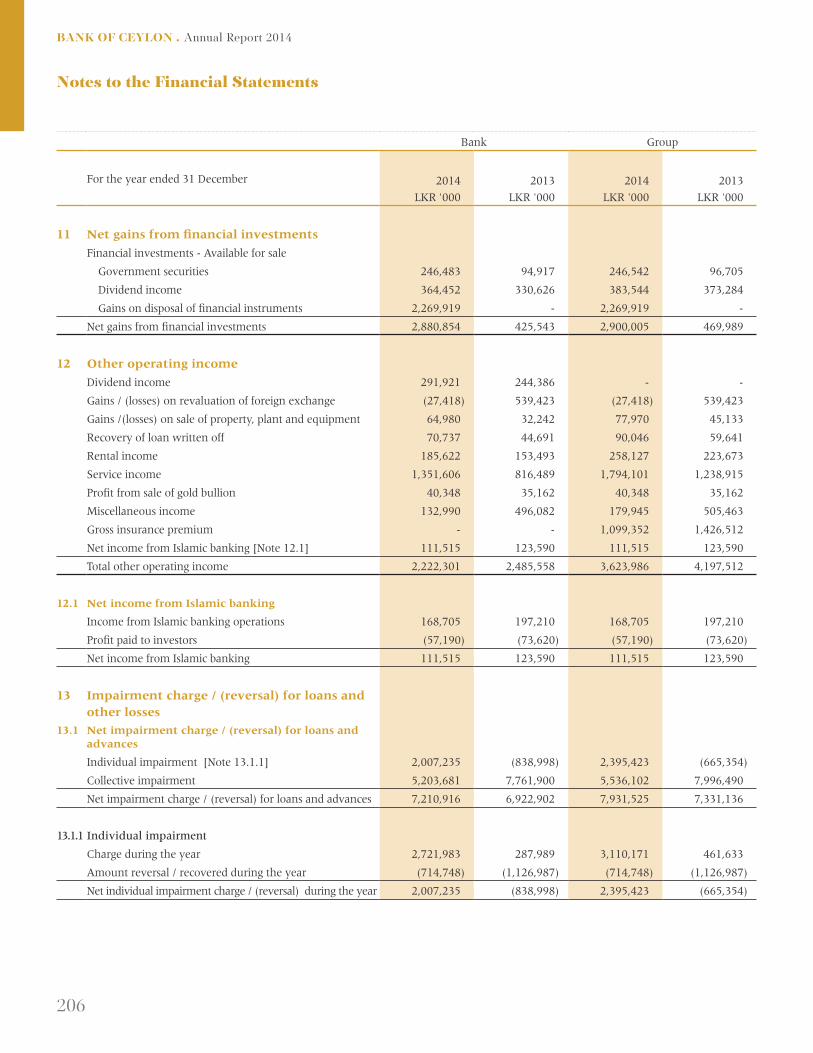
206
BANK OF CEYLON . Annual Report 2014
Notes to the Financial Statements
Bank Group
For the year ended 31 December 2014
LKR '000
2013
LKR '000
2014
LKR '000
2013
LKR '000
11 Net gains from financial investments
Financial investments - Available for sale
Government securities 246,483 94,917 246,542 96,705
Dividend income 364,452 330,626 383,544 373,284
Gains on disposal of financial instruments 2,269,919 - 2,269,919 -
Net gains from financial investments 2,880,854 425,543 2,900,005 469,989
12 Other operating income
Dividend income 291,921 244,386 - -
Gains / (losses) on revaluation of foreign exchange (27,418) 539,423 (27,418) 539,423
Gains /(losses) on sale of property, plant and equipment 64,980 32,242 77,970 45,133
Recovery of loan written off 70,737 44,691 90,046 59,641
Rental income 185,622 153,493 258,127 223,673
Service income 1,351,606 816,489 1,794,101 1,238,915
Profit from sale of gold bullion 40,348 35,162 40,348 35,162
Miscellaneous income 132,990 496,082 179,945 505,463
Gross insurance premium - - 1,099,352 1,426,512
Net income from Islamic banking [Note 12.1] 111,515 123,590 111,515 123,590
Total other operating income 2,222,301 2,485,558 3,623,986 4,197,512
12.1 Net income from Islamic banking
Income from Islamic banking operations 168,705 197,210 168,705 197,210
Profit paid to investors (57,190) (73,620) (57,190) (73,620)
Net income from Islamic banking 111,515 123,590 111,515 123,590
13 Impairment charge / (reversal) for loans and
other losses
13.1 Net impairment charge / (reversal) for loans and
advances
Individual impairment [Note 13.1.1] 2,007,235 (838,998) 2,395,423 (665,354)
Collective impairment 5,203,681 7,761,900 5,536,102 7,996,490
Net impairment charge / (reversal) for loans and advances 7,210,916 6,922,902 7,931,525 7,331,136
13.1.1 Individual impairment
Charge during the year 2,721,983 287,989 3,110,171 461,633
Amount reversal / recovered during the year (714,748) (1,126,987) (714,748) (1,126,987)
Net individual impairment charge / (reversal) during the year 2,007,235 (838,998) 2,395,423 (665,354)
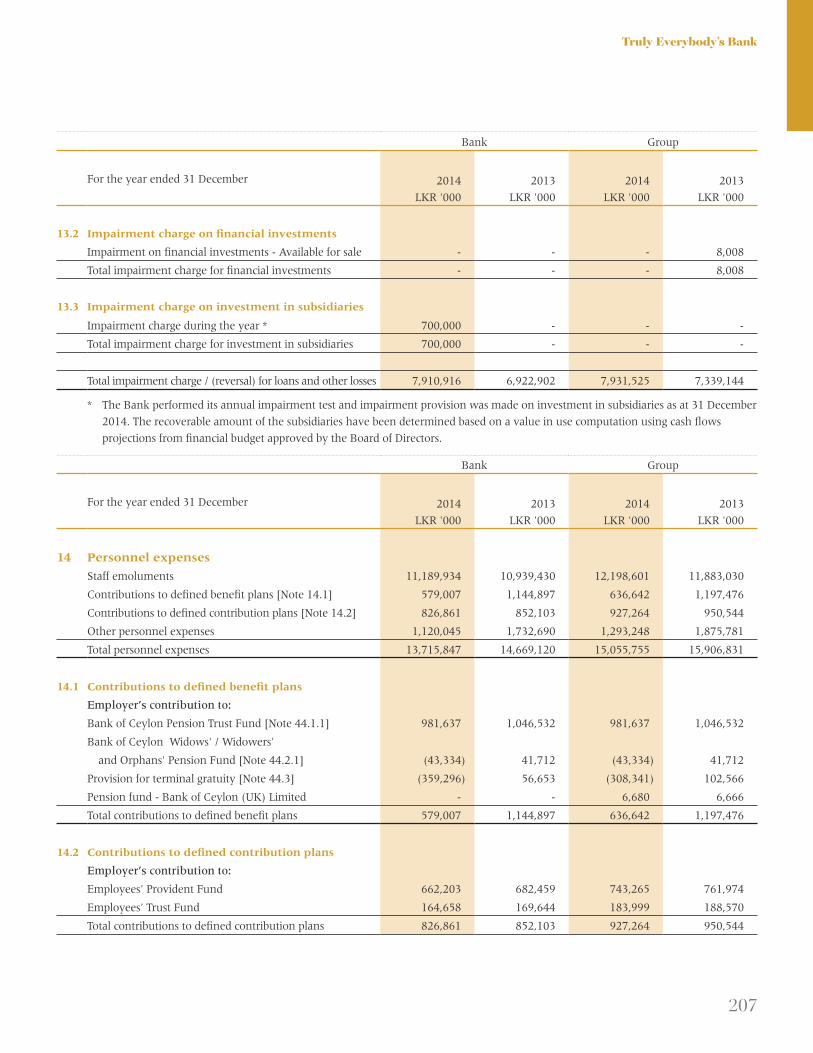
207
Truly Everybody’s Bank
Bank Group
For the year ended 31 December 2014
LKR '000
2013
LKR '000
2014
LKR '000
2013
LKR '000
13.2 Impairment charge on financial investments
Impairment on financial investments - Available for sale - - - 8,008
Total impairment charge for financial investments - - - 8,008
13.3 Impairment charge on investment in subsidiaries
Impairment charge during the year * 700,000 - - -
Total impairment charge for investment in subsidiaries 700,000 - - -
Total impairment charge / (reversal) for loans and other losses 7,910,916 6,922,902 7,931,525 7,339,144
* The Bank performed its annual impairment test and impairment provision was made on investment in subsidiaries as at 31 December
2014. The recoverable amount of the subsidiaries have been determined based on a value in use computation using cash flows
projections from financial budget approved by the Board of Directors.
Bank Group
For the year ended 31 December 2014
LKR '000
2013
LKR '000
2014
LKR '000
2013
LKR '000
14 Personnel expenses
Staff emoluments 11,189,934 10,939,430 12,198,601 11,883,030
Contributions to defined benefit plans [Note 14.1] 579,007 1,144,897 636,642 1,197,476
Contributions to defined contribution plans [Note 14.2] 826,861 852,103 927,264 950,544
Other personnel expenses 1,120,045 1,732,690 1,293,248 1,875,781
Total personnel expenses 13,715,847 14,669,120 15,055,755 15,906,831
14.1 Contributions to defined benefit plans
Employer’s contribution to:
Bank of Ceylon Pension Trust Fund [Note 44.1.1] 981,637 1,046,532 981,637 1,046,532
Bank of Ceylon Widows' / Widowers'
and Orphans' Pension Fund [Note 44.2.1] (43,334) 41,712 (43,334) 41,712
Provision for terminal gratuity [Note 44.3] (359,296) 56,653 (308,341) 102,566
Pension fund - Bank of Ceylon (UK) Limited - - 6,680 6,666
Total contributions to defined benefit plans 579,007 1,144,897 636,642 1,197,476
14.2 Contributions to defined contribution plans
Employer’s contribution to:
Employees' Provident Fund 662,203 682,459 743,265 761,974
Employees' Trust Fund 164,658 169,644 183,999 188,570
Total contributions to defined contribution plans 826,861 852,103 927,264 950,544

208
BANK OF CEYLON . Annual Report 2014
Notes to the Financial Statements
Bank Group
For the year ended 31 December 2014
LKR '000
2013
LKR '000
2014
LKR '000
2013
LKR '000
15 Other expenses
Directors' emoluments 6,826 2,852 21,113 60,501
Auditors' remuneration
Audit fees 20,694 16,786 32,564 26,987
Non audit service fees - - 1,125 3,200
Deposit insurance premium * 860,955 917,165 872,987 926,822
Professional and legal expenses 286,193 70,789 367,859 119,132
Donation to approved charities - - 70 86
Depreciation of property plant and equipment 1,019,315 977,446 1,414,410 1,327,183
Revaluation loss on buildings 64,010 - 64,010 -
Intangible assets written off 9,970 - 9,970 -
Amortization of leasehold properties 1,562 1,959 2,919 3,316
Amortization of intangible assets 170,417 137,798 213,528 166,741
Fixed assets maintenance expenses 3,313,337 3,006,892 2,910,794 2,510,780
Expenses on gold in hand 562,404 - 562,404 -
Reinsurance premium, claims and other benefits - - 914,423 1,076,097
Office administration and establishment expenses 4,227,971 3,880,778 5,191,180 5,113,732
Total other expenses 10,543,654 9,012,465 12,579,356 11,334,577
* As per the Deposit Insurance Scheme (presently known as the Sri Lanka Deposit Insurance and Liquidity Support Scheme)
introduced under the Banking Act Direction No. 05 of 2010, the Bank is required to make quarterly payments of 0.1% or 0.125% on
the eligible deposit liabilities, with effect from 1 October 2010. The premium rate depends on the Capital Adequacy Ratio (CAR) of
the immediate preceding Audited Financial Statements.
Group
For the year ended 31 December 2014
LKR '000
2013
LKR '000
16 Share of profit /(loss) of associate companies before tax
Ceybank Asset Management Limited 44,580 30,088
Lanka Securities (Private) Limited 24,282 (16,214)
Mireka Capital Land (Private) Limited 379,649 206,400
Southern Development Financial Company Limited (79) 208
Transnational Lanka Records Solutions (Private) Limited 14,004 8,331
Total share of profit / (loss) of associate companies before tax 462,436 228,813

209
Truly Everybody’s Bank
Bank Group
For the year ended 31 December 2014
LKR '000
2013
LKR '000
2014
LKR '000
2013
LKR '000
17 Income tax expense
17.1 The components of income tax expense
Current tax expense
Income tax on profits for the year 5,633,864 3,657,004 5,926,722 3,914,673
Adjustments in respect of prior years (31,841) 45,415 (46,297) 45,791
Deferred tax expense
Charge / (reversal) of deferred tax [Note 35] 1,114,877 (80,760) 1,178,231 (4,162)
Income tax expense for the year 6,716,900 3,621,659 7,058,656 3,956,302
17.2 Reconciliation of accounting profit and income tax
expense
Accounting profit before income tax 20,290,957 15,708,772 21,430,998 16,104,624
Less : Share of profit / (loss) of associate companies - - 462,436 228,813
20,290,957 15,708,772 20,968,562 15,875,811
Add : Dividend income from subsidiaries and associates - - 291,921 244,386
20,290,957 15,708,772 21,260,483 16,120,197
Add : Disallowable expenses 24,587,347 12,926,911 26,165,804 17,452,052
44,878,304 28,635,683 47,426,287 33,572,249
Less: Allowable expenses 18,135,087 9,227,476 19,309,592 13,722,616
Less: Tax exempt income 8,074,710 7,224,487 8,366,631 7,259,433
Taxable income 18,668,507 12,183,720 19,750,064 12,590,200
Current tax at rate of 28% (2013 - 28%) 5,227,182 3,411,442 5,530,018 3,625,266
Effect of different tax rates in the Group - - (48,053) 9,320
Effect of different tax rates in other countries 406,682 245,562 406,682 245,562
10% withholding tax on inter company dividends - - 27,311 23,117
Share of tax on profits of associates - - 10,764 11,408
Adjustment in respect of current income tax of prior years (31,841) 45,415 (46,297) 45,791
Deferred tax charge / (reversal) [Note 35] 1,114,877 (80,760) 1,178,231 (4,162)
Income tax expense for the year 6,716,900 3,621,659 7,058,656 3,956,302
The effective income tax rate 33.1% 23.1% 32.9% 24.6%

210
BANK OF CEYLON . Annual Report 2014
Notes to the Financial Statements
17 Income tax expense (Contd.)
2014 2013
17.3 The tax liabilities of resident companies are computed at the standard rate of 28%,
except following companies which enjoy full or partial exemptions and concessions
Tax rates applicable on local operations
BOC Travels (Private) Limited 12% 12%
Hotels Colombo (1963) Limited 12% 12%
Koladeniya Hydropower (Private) Limited * Nil Nil
Tax rates applicable on foreign operations
Banking operations in Male 25% 25%
Banking operations in Chennai 40% 40%
Banking operation in Seychelles 30% N/A
Bank of Ceylon (UK) Limited 21% 20%
* In accordance with the agreement with Board of Investment of Sri Lanka (BOI), Koladeniya Hydropower (Private) Limited is entitled
to a tax exemption period of five years from the year in which the company commences to make profits or not later than two years
from the date of commencement of commercial operations, whichever is earlier, provided the company make the minimum capital
investment of USD 2.07 million or its equivalent in Sri Lankan Rupees within a period of two years from the date of agreement. The
company has complied with minimum capital investment criteria and therefore is entitled to five years tax exemption commencing
from 1 January 2012.
18. Earnings per share and Dividend per share18.1 Basic earnings per share
In accordance with the Sri Lanka Accounting Standard - LKAS 33 “Earnings Per Share”, basic earnings per share is calculated by dividing
the profit or loss attributable to ordinary shareholder of the Bank (the numerator) by the weighted average number of ordinary shares in
issue (the denominator) during the year.
Bank Group
For the year ended 31 December 2014 2013 2014 2013
Profit attributable to ordinary shareholder of the Bank (LKR '000) 13,574,057 12,087,113 14,424,118 12,234,412
Weighted average number of ordinary shares in issue 5,000,000 5,000,000 5,000,000 5,000,000
Basic earnings per share (LKR) 2,714.81 2,417.42 2,884.82 2,446.88

211
Truly Everybody’s Bank
18.2 Diluted earnings per share
Diluted earnings per share is calculated by dividing the profit or loss attributable to ordinary shareholder of the Bank
(the numerator) by the weighted average number of ordinary shares in issue during the year after adjusting for effect of all dilutive
potential ordinary shares (the denominator).
Bank Group
For the year ended 31 December 2014 2013 2014 2013
Profit attributable to ordinary shareholder of the Bank (LKR '000) 13,574,057 12,087,113 14,424,118 12,234,412
Weighted average number of ordinary shares in issue
during the year 5,000,000 5,000,000 5,000,000 5,000,000
Weighted average number of potential ordinary shares
under pending allotment during the year 383,562 - 383,562 -
Weighted average number of ordinary shares after
adjusting for dilution 5,383,562 5,000,000 5,383,562 5,000,000
Diluted earnings per share (LKR) 2,521.39 2,417.42 2,679.29 2,446.88
18.3 Dividend per share
Dividend per share is calculated by dividing the total profit distributed to shareholder (the numerator) by the weighted average number
of ordinary shares in issue (the denominator) during the year.
Bank Group
For the year ended 31 December 2014 2013 2014 2013
Total profit distributed to shareholder during the year (LKR '000) 6,846,410 5,346,410 6,846,410 5,346,410
Weighted average number of ordinary shares in issue 5,000,000 5,000,000 5,000,000 5,000,000
Dividend per share (LKR) 1,369.28 1,069.28 1,369.28 1,069.28

212
BANK OF CEYLON . Annual Report 2014
Notes to the Financial Statements
As at 31 December 2014
Held for
trading
LKR ‘000
Held to
maturity
LKR ‘000
Amortized
cost
LKR ‘000
Available
for sale
LKR ‘000
Total
LKR ‘000
19 Analysis of financial instruments
by measurement basis
19.1 Bank
Financial assets
Cash and short term funds - - 29,165,464 - 29,165,464
Balances with Central Banks - - 30,422,373 - 30,422,373
Placements with banks - - 19,766,889 - 19,766,889
Derivative financial instruments 1,714,556 - - - 1,714,556
Reverse repurchase agreements - - 58,953,093 - 58,953,093
Financial assets - Held for trading 17,862,433 - - - 17,862,433
Financial investments - Loans and receivables - - 129,145,330 - 129,145,330
Loans and advances to customers - - 741,347,635 - 741,347,635
Financial investments - Available for sale - - - 14,361,543 14,361,543
Financial investments - Held to maturity - 216,517,438 - - 216,517,438
Total financial assets 19,576,989 216,517,438 1,008,800,784 14,361,543 1,259,256,754
As at 31 December 2014
Held for
trading
LKR '000
Amortized
cost
LKR '000
Total
LKR '000
Financial liabilities
Due to banks - 889,876 889,876
Derivative financial instruments 734,548 - 734,548
Due to customers - 933,966,169 933,966,169
Other borrowings - 246,736,462 246,736,462
Debt securities issued - 20,762,198 20,762,198
Subordinated term debts - 32,519,715 32,519,715
Total financial liabilities 734,548 1,234,874,420 1,235,608,968

213
Truly Everybody’s Bank
As at 31 December 2013
Held for
trading
LKR ‘000
Held to
maturity
LKR ‘000
Amortized
cost
LKR ‘000
Available
for sale
LKR ‘000
Total
LKR ‘000
19.1 Bank
Financial assets
Cash and short term funds - - 24,901,189 - 24,901,189
Balances with Central Banks - - 28,699,132 - 28,699,132
Placements with banks - - 19,315,520 - 19,315,520
Derivative financial instruments 3,261,073 - - - 3,261,073
Reverse repurchase agreements - - 22,319,717 - 22,319,717
Financial assets - Held for trading 13,539,791 - - - 13,539,791
Financial investments - Loans and receivables - - 129,108,613 - 129,108,613
Loans and advances to customers - - 725,331,966 - 725,331,966
Financial investments - Available for sale - - - 10,325,214 10,325,214
Financial investments - Held to maturity - 156,899,761 - - 156,899,761
Total financial assets 16,800,864 156,899,761 949,676,137 10,325,214 1,133,701,976
As at 31 December 2013
Held for Amortized Total
trading cost
LKR '000 LKR '000 LKR '000
Financial liabilities
Due to banks - 1,166,427 1,166,427
Derivative financial instruments 274,948 - 274,948
Due to customers - 842,070,000 842,070,000
Other borrowings - 235,370,269 235,370,269
Debt securities issued - 20,968,357 20,968,357
Subordinated term debts - 24,357,595 24,357,595
Total financial liabilities 274,948 1,123,932,648 1,124,207,596

214
BANK OF CEYLON . Annual Report 2014
Notes to the Financial Statements
19 Analysis of financial instruments by measurement basis (Contd.)
As at 31 December 2014
Held for
trading
LKR ‘000
Held to
maturity
LKR ‘000
Amortized
cost
LKR ‘000
Available for
sale
LKR ‘000
Total
LKR ‘000
19.2 Group
Financial assets
Cash and short term funds - - 29,958,559 - 29,958,559
Balances with Central Banks - - 30,422,373 - 30,422,373
Placements with banks - - 21,393,574 - 21,393,574
Derivative financial instruments 1,714,556 - - - 1,714,556
Reverse repurchase agreements - - 60,236,389 - 60,236,389
Financial assets - Held for trading 18,437,958 - - - 18,437,958
Financial investments - Loans and receivables - - 129,966,806 - 129,966,806
Loans and advances to customers - - 763,772,052 - 763,772,052
Financial investments - Available for sale - - - 17,611,160 17,611,160
Financial investments - Held to maturity - 216,740,132 - - 216,740,132
Total financial assets 20,152,514 216,740,132 1,035,749,753 17,611,160 1,290,253,559
As at 31 December 2014
Held for Amortized Total
trading cost
LKR '000 LKR '000 LKR '000
Financial liabilities
Due to banks - 949,127 949,127
Derivative financial instruments 734,548 - 734,548
Due to customers - 943,934,463 943,934,463
Other borrowings - 252,168,157 252,168,157
Debt securities issued - 26,218,337 26,218,337
Subordinated term debts - 32,177,810 32,177,810
Total financial liabilities 734,548 1,255,447,894 1,256,182,442

215
Truly Everybody’s Bank
As at 31 December 2013
Held for
trading
LKR ‘000
Held to
maturity
LKR ‘000
Amortized
cost
LKR ‘000
Available for
sale
LKR ‘000
Total
LKR ‘000
19.2 Group
Financial assets
Cash and short term funds - - 25,182,043 - 25,182,043
Balances with Central Banks - - 28,699,132 - 28,699,132
Placements with banks - - 21,157,190 - 21,157,190
Derivative financial instruments 3,261,073 - - - 3,261,073
Reverse repurchase agreements - - 22,851,895 - 22,851,895
Financial assets - Held for trading 13,898,242 - - - 13,898,242
Financial investments - Loans and receivables - - 130,190,296 - 130,190,296
Loans and advances to customers - - 746,571,819 - 746,571,819
Financial investments - Available for sale - - - 12,852,445 12,852,445
Financial investments - Held to maturity - 157,441,572 - - 157,441,572
Total financial assets 17,159,315 157,441,572 974,652,375 12,852,445 1,162,105,707
As at 31 December 2013
Held for Amortized Total
trading cost
LKR '000 LKR '000 LKR '000
Financial liabilities
Due to banks - 1,336,267 1,336,267
Derivative financial instruments 274,948 - 274,948
Due to customers - 850,767,521 850,767,521
Other borrowings - 240,802,111 240,802,111
Debt securities issued - 24,986,818 24,986,818
Subordinated term debts - 24,347,248 24,347,248
Total financial liabilities 274,948 1,142,239,965 1,142,514,913
20 Cash and short term funds
Bank Group
As at 31 December 2014
LKR '000
2013
LKR '000
2014
LKR '000
2013
LKR '000
Local currency in hand 23,744,062 19,183,784 23,777,765 17,282,326
Foreign currency in hand 702,854 1,146,014 721,896 1,169,975
Balances with other banks 4,718,548 4,571,391 5,458,898 6,729,742
Total cash and short term funds 29,165,464 24,901,189 29,958,559 25,182,043
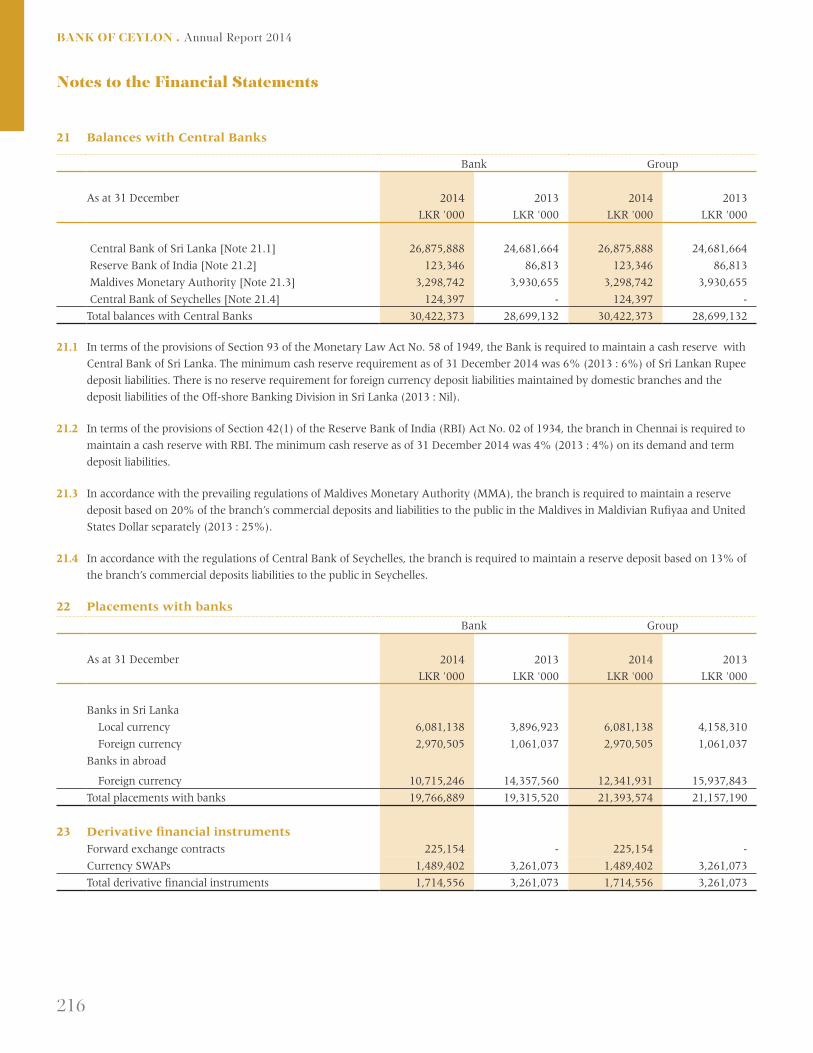
216
BANK OF CEYLON . Annual Report 2014
Notes to the Financial Statements
21 Balances with Central Banks
Bank Group
As at 31 December 2014
LKR '000
2013
LKR '000
2014
LKR '000
2013
LKR '000
Central Bank of Sri Lanka [Note 21.1] 26,875,888 24,681,664 26,875,888 24,681,664
Reserve Bank of India [Note 21.2] 123,346 86,813 123,346 86,813
Maldives Monetary Authority [Note 21.3] 3,298,742 3,930,655 3,298,742 3,930,655
Central Bank of Seychelles [Note 21.4] 124,397 - 124,397 -
Total balances with Central Banks 30,422,373 28,699,132 30,422,373 28,699,132
21.1 In terms of the provisions of Section 93 of the Monetary Law Act No. 58 of 1949, the Bank is required to maintain a cash reserve with
Central Bank of Sri Lanka. The minimum cash reserve requirement as of 31 December 2014 was 6% (2013 : 6%) of Sri Lankan Rupee
deposit liabilities. There is no reserve requirement for foreign currency deposit liabilities maintained by domestic branches and the
deposit liabilities of the Off-shore Banking Division in Sri Lanka (2013 : Nil).
21.2 In terms of the provisions of Section 42(1) of the Reserve Bank of India (RBI) Act No. 02 of 1934, the branch in Chennai is required to
maintain a cash reserve with RBI. The minimum cash reserve as of 31 December 2014 was 4% (2013 : 4%) on its demand and term
deposit liabilities.
21.3 In accordance with the prevailing regulations of Maldives Monetary Authority (MMA), the branch is required to maintain a reserve
deposit based on 20% of the branch’s commercial deposits and liabilities to the public in the Maldives in Maldivian Rufiyaa and United
States Dollar separately (2013 : 25%).
21.4 In accordance with the regulations of Central Bank of Seychelles, the branch is required to maintain a reserve deposit based on 13% of
the branch’s commercial deposits liabilities to the public in Seychelles.
22 Placements with banks
Bank Group
As at 31 December 2014
LKR '000
2013
LKR '000
2014
LKR '000
2013
LKR '000
Banks in Sri Lanka
Local currency 6,081,138 3,896,923 6,081,138 4,158,310
Foreign currency 2,970,505 1,061,037 2,970,505 1,061,037
Banks in abroad
Foreign currency 10,715,246 14,357,560 12,341,931 15,937,843
Total placements with banks 19,766,889 19,315,520 21,393,574 21,157,190
23 Derivative financial instruments
Forward exchange contracts 225,154 - 225,154 -
Currency SWAPs 1,489,402 3,261,073 1,489,402 3,261,073
Total derivative financial instruments 1,714,556 3,261,073 1,714,556 3,261,073

217
Truly Everybody’s Bank
24 Financial assets - Held for trading
Bank Group
As at 31 December 2014
LKR '000
2013
LKR '000
2014
LKR '000
2013
LKR '000
Treasury bills 10,207,422 7,372,137 10,207,422 7,372,137
Treasury bonds 4,565,393 3,810,889 4,565,393 3,810,889
Sri Lanka sovereign bonds 141,022 129,949 141,022 129,949
Quoted equities [Note 24.1] 2,948,596 2,226,816 3,518,833 2,583,212
Quoted units in unit trusts [Note 24.2] - - 2,784 2,055
Quoted debt securities [Note 24.3] - - 2,504 -
Total financial assets - Held for trading 17,862,433 13,539,791 18,437,958 13,898,242
The Bank has not pledged any treasury bills or treasury bonds - held for trading as collateral as at 31 December 2014 (2013 : Nil).
Bank
As at 31 December 2014 2013
No of
ordinary
shares
Cost of
invest-
ment
LKR’000
Market
price per
share
LKR
Market
value
LKR’000
No of
ordinary
shares
Cost of
invest-
ment
LKR’000
Market
price per
share
LKR
Market
value
LKR’000
24.1 Quoted equities
Bank, Finance and Insurance
Chilaw Finance PLC - - - - 828,189 21,762 12.40 10,270
Hatton National Bank PLC 84,425 19,345 194.90 16,454 84,425 19,345 147.00 12,410
Softlogic Finance PLC - - - - 102,201 6,685 25.30 2,586
19,345 16,454 47,792 25,266
Beverage, Food and Tobacco
Bairaha Farms PLC 34,900 15,807 125.00 4,363 34,900 15,807 128.80 4,495
Cargills (Ceylon) PLC 1,095,930 238,325 153.00 167,677 809,600 192,779 147.00 119,011
Ceylon Tobacco Company PLC 64,247 73,151 1,060.10 68,108 - - - -
Distilleries Company of Sri Lanka PLC 273,153 55,584 210.00 57,362 249,602 46,334 193.00 48,173
HVA Foods PLC 20,000 905 10.20 204 20,000 905 9.90 198
Lanka Milk Foods (CWE) PLC 236,842 31,378 120.40 28,516 775,151 102,696 105.30 81,623
Lucky Lanka Milk Processing PLC -
Voting 1,000,000 6,000 4.90 4,900 - - - -
Lucky Lanka Milk Processing PLC -
Non voting 91,900 276 2.80 257 - - - -
Renuka Foods PLC - - - - 580,146 11,247 16.50 9,572
421,426 331,387 369,768 263,072

218
BANK OF CEYLON . Annual Report 2014
Notes to the Financial Statements
24 Financial assets - Held for trading (Contd.)
Bank
As at 31 December 2014 2013
No of
ordinary
shares
Cost of
invest-
ment
LKR’000
Market
price per
share
LKR
Market
value
LKR’000
No of
ordinary
shares
Cost of
invest-
ment
LKR’000
Market
price per
share
LKR
Market
value
LKR’000
24.1 Quoted equities (Contd.)
Chemicals and Pharmaceuticals
Chemanex PLC 100,000 16,685 80.00 8,000 100,000 16,685 85.00 8,500
CIC Holdings PLC - Voting 650,100 111,195 85.00 55,259 650,100 111,195 47.90 31,140
CIC Holdings PLC - Non voting 141,400 15,732 66.40 9,389 141,400 15,732 34.50 4,878
Haycarb PLC 251,067 48,262 173.00 43,435 251,067 48,262 189.80 47,653
Lankem Ceylon PLC 72,400 32,703 110.10 7,971 72,400 32,703 122.10 8,840
224,577 124,054 224,577 101,011
Construction and Engineering
Access Engineering PLC 1,259,532 30,208 32.10 40,431 1,467,036 30,585 22.10 32,421
Colombo Dockyard PLC 851,183 194,360 193.00 164,278 413,700 106,214 189.60 78,438
MTD Walkers PLC - - - - 815,205 47,540 32.00 26,087
224,568 204,709 184,339 136,946
Diversified Holdings
Aitken Spence PLC 1,633,360 263,949 103.50 169,053 1,522,400 252,738 102.30 155,742
Browns Investments PLC 3,073,412 13,317 1.90 5,839 3,073,412 13,317 2.30 7,069
Carson Cumberbatch PLC 167,623 82,400 430.40 72,145 167,623 82,400 350.00 58,668
C T Holdings PLC 141,348 22,417 143.00 20,213 323,495 52,967 140.10 45,322
Expolanka Holdings PLC 1,657,820 15,481 8.60 14,257 857,820 6,226 7.50 6,434
F L C Holdings PLC 200,000 991 2.00 400 200,000 991 2.20 440
Hayleys PLC 73,984 22,578 339.90 25,147 99,184 29,843 293.00 29,061
Hemas Holdings PLC 131,574 5,512 74.30 9,776 484,800 20,035 34.00 16,483
John Keells Holdings PLC 725,649 182,208 250.00 181,412 149,997 36,515 227.30 34,094
John Keells Holdings PLC - Warrants 0023 25,000 1,947 72.50 1,813 - - - -
Richard Pieris and Company PLC 6,673,126 88,850 8.50 56,722 4,832,300 71,707 6.30 30,443
Softlogic Holdings PLC 595,300 15,704 16.50 9,822 595,300 15,704 8.40 5,001
Sunshine Holdings PLC - - - - 626,800 31,361 28.00 17,550
The Colombo Fort Land & Building PLC 149,500 10,307 28.30 4,231 149,500 10,307 28.20 4,216
Vallibel One PLC 1,567,604 48,546 23.90 37,466 1,265,400 41,487 16.50 20,879
774,207 608,296 665,598 431,402
Footware and Textiles
ODEL PLC 197,400 8,796 22.00 4,343 197,400 8,796 21.00 4,145
8,796 4,343 8,796 4,145
Health Care
Asiri Surgical Hospital PLC - - - - 233,046 2,357 10.30 2,400
Nawaloka Hospitals PLC 90,700 392 3.30 299 130,700 565 3.00 392
The Lanka Hospital Corporation PLC 2,500 111 48.00 120 2,500 111 40.50 101
503 419 3,033 2,893

219
Truly Everybody’s Bank
Bank
As at 31 December 2014 2013
No of
ordinary
shares
Cost of
invest-
ment
LKR’000
Market
price per
share
LKR
Market
value
LKR’000
No of
ordinary
shares
Cost of
invest-
ment
LKR’000
Market
price per
share
LKR
Market
value
LKR’000
Hotels and Travels
Aitken Spence Hotel Holdings PLC 2,357,252 217,402 78.50 185,044 1,625,600 156,566 69.90 113,629
Amaya Leisure PLC 527,635 49,801 85.00 44,849 102,000 12,801 74.00 7,548
Asian Hotels & Properties PLC 2,367,741 225,781 67.80 160,533 2,232,400 216,192 64.20 143,320
Citrus Leisure PLC 100,000 10,112 16.80 1,680 100,000 10,112 14.60 1,460
Eden Hotel Lanka PLC 609,600 38,087 25.70 15,667 609,600 38,087 29.00 17,678
Galadari Hotels (Lanka) PLC 61,030 927 14.50 885 - - - -
John Keells Hotels PLC 833,487 13,531 17.00 14,169 - - - -
Marawila Resorts PLC 50,000 632 6.00 300 50,000 631 5.30 265
Tal Lanka Hotels PLC 447,400 30,043 34.40 15,391 447,400 30,043 27.80 12,438
Tangerine Beach Hotels PLC 50,000 5,056 83.80 4,190 50,000 5,056 68.00 3,400
The Fortress Resorts PLC 1,461,100 50,506 16.90 24,693 1,461,100 50,506 13.40 19,579
The Kingsbury PLC 208,008 3,308 18.00 3,744 153,184 2,282 13.20 2,022
The Lighthouse Hotel PLC 100,000 6,124 55.00 5,500 100,000 6,124 44.00 4,400
Trans Asia Hotels PLC 477,200 48,407 92.10 43,950 477,200 48,407 79.90 38,128
699,717 520,595 576,807 363,867
Investment Trust
Ceylon Guardian Investment Trust PLC 91,700 29,682 194.90 17,872 66,700 24,626 181.90 12,133
Ceylon Investment PLC 442,000 72,718 97.50 43,095 442,000 72,718 77.00 34,034
Lanka Century Investments PLC 385,000 23,271 15.60 6,006 385,000 23,271 14.10 5,429
Renuka Holdings PLC 524,645 18,444 31.50 16,526 176,723 9,568 30.60 5,408
144,115 83,499 130,183 57,004
Land and Property
C T Land Development PLC - - - - 1,025,674 33,138 30.90 31,693
East West Properties PLC 103,282 1,560 12.80 1,322 307,216 4,649 11.50 3,533
Overseas Realty (Ceylon) PLC 62,987 1,776 26.30 1,657 300,000 5,435 18.30 5,490
3,336 2,979 43,222 40,716

220
BANK OF CEYLON . Annual Report 2014
Notes to the Financial Statements
24 Financial assets - Held for trading (Contd.)
Bank
As at 31 December 2014 2013
No of
ordinary
shares
Cost of
invest-
ment
LKR’000
Market
price per
share
LKR
Market
value
LKR’000
No of
ordinary
shares
Cost of
invest-
ment
LKR’000
Market
price per
share
LKR
Market
value
LKR’000
24.1 Quoted equities (Contd.)
Manufacturing
Abans Electricals PLC 17,880 4,931 118.50 2,119 17,880 4,931 105.10 1,879
ACL Cables PLC 456,324 32,995 76.40 34,863 201,419 14,369 64.90 13,072
Acme Printing & Packaging PLC 1,078,700 35,020 11.00 11,866 1,078,700 35,020 9.70 10,463
Alumex PLC 196,882 2,756 15.90 3,130 - - - -
Central Industries PLC 48,525 3,729 86.00 4,173 - - - -
Ceylon Grain Elevators PLC 71,800 16,089 41.00 2,944 71,800 16,089 35.50 2,549
Chevron Lubricants Lanka PLC 31,557 10,850 399.60 12,610 - - - -
Dipped Products PLC - - - - 792,400 98,031 90.00 71,316
Hayleys Fibre PLC 145,300 7,867 42.60 6,190 145,300 7,867 25.00 3,633
Kelani Tyres PLC 715,996 50,997 78.80 56,420 800,130 42,343 49.50 39,606
Lanka Cement PLC 9,583,809 83,858 6.60 63,253 9,583,809 83,858 6.60 63,253
Lanka Tiles PLC 973,200 130,512 110.00 107,052 973,200 130,512 78.90 76,785
Lanka Walltiles PLC 409,515 37,754 97.30 39,846 410,040 37,802 53.90 22,101
Orient Garments PLC 348,900 10,906 15.00 5,234 348,900 10,906 8.00 2,791
Piramal Glass Ceylon PLC 3,288,600 32,322 4.90 16,114 3,288,600 32,322 4.50 14,799
Royal Ceramics Lanka PLC 1,754,958 206,116 116.90 205,155 711,339 86,729 84.60 60,179
Sierra Cables PLC 2,400 14 3.90 9 2,400 14 1.80 4
Textured Jersey Lanka PLC 510,308 8,683 20.60 10,512 980,308 14,413 15.20 14,901
Tokyo Cement Company (Lanka) PLC
- Voting - - - - 894,477 24,944 28.50 25,493
Tokyo Cement Company (Lanka) PLC
- Non voting 513,007 20,948 46.90 24,060 717,420 29,024 23.40 16,788
696,347 605,550 669,174 439,612
Motors
C M Holdings PLC 50,857 17,422 129.10 6,566 50,857 17,422 83.60 4,252
Diesel & Motor Engineering PLC 36,356 55,836 636.00 23,122 36,356 55,836 481.00 17,487
Sathosa Motors PLC 16,000 6,198 245.00 3,920 16,000 6,198 259.10 4,146
United Motors Lanka PLC 264,916 27,230 103.60 27,445 - - - -
106,686 61,053 79,456 25,885
Oil Palms
Bukit Darah PLC 47,957 37,098 715.00 34,289 47,957 37,098 619.90 29,729
37,098 34,289 37,098 29,729

221
Truly Everybody’s Bank
Bank
As at 31 December 2014 2013
No of
ordinary
shares
Cost of
invest-
ment
LKR’000
Market
price per
share
LKR
Market
value
LKR’000
No of
ordinary
shares
Cost of
invest-
ment
LKR’000
Market
price per
share
LKR
Market
value
LKR’000
Plantations
Agalawatte Plantations PLC 45,600 4,608 27.10 1,236 45,600 4,608 23.90 1,090
Balangoda Plantations PLC 30,000 2,184 26.50 795 30,000 2,184 31.00 930
Elpitiya Plantations PLC - - - - 700 22 16.60 12
Horana Plantations PLC 513,000 43,752 24.10 12,363 513,000 43,752 23.80 12,209
Kahawatte Plantations PLC 838,629 33,921 35.50 29,771 931,300 37,669 38.80 36,134
Kegalle Plantations PLC 50,600 13,703 94.00 4,756 50,600 13,703 102.90 5,207
Kotagala Plantations PLC 486,665 34,711 31.60 15,379 486,665 34,711 37.00 18,007
Namunukula Plantations PLC 80,000 12,458 89.40 7,152 80,000 12,458 84.70 6,776
Watawala Plantations PLC 350,100 10,998 18.80 6,582 350,100 10,998 9.90 3,466
156,335 78,034 160,105 83,831
Power and Energy
F L C Hydro Power PLC 173,194 1,427 5.70 987 223,194 1,839 5.00 1,116
Laugfs Gas PLC - Voting 168,727 4,688 40.50 6,833 168,727 4,688 28.40 4,792
Laugfs Gas PLC - Non voting 3,420,538 142,754 37.20 127,244 3,212,400 134,532 21.50 69,066
Panasian Power PLC 1,029,200 6,407 3.20 3,293 1,029,200 6,407 2.50 2,573
Resus Energy PLC 1,117,700 45,609 18.10 20,230 1,117,700 45,609 17.60 19,672
Vallibel Power Erathna PLC 1,650,000 14,025 7.20 11,880 850,000 9,111 5.80 4,930
214,910 170,467 202,186 102,149
Services
John Keells PLC 250,200 22,759 90.30 22,593 41,287 3,426 71.20 2,940
22,759 22,593 3,426 2,940
Stores and Supplies
Hunters & Company PLC 27,100 21,923 386.20 10,466 27,100 21,923 271.50 7,358
21,923 10,466 21,923 7,358
Telecommunications
Dialog Axiata PLC 562,308 5,950 13.30 7,479 7,279,132 76,523 9.00 65,512
Sri Lanka Telecom PLC 214,000 7,496 49.90 10,679 214,000 7,496 37.00 7,918
13,446 18,158 84,019 73,430
Trading
Brown & Company PLC 396,073 82,233 107.00 42,380 314,700 73,471 82.70 26,025
Ceylon & Foreign Trades PLC 830,100 8,533 7.50 6,226 830,100 8,533 6.40 5,313
Singer Sri Lanka PLC 22,437 2,308 117.90 2,645 47,437 4,879 89.00 4,222
93,074 51,251 86,883 35,560
Total quoted equities 3,883,168 2,948,596 3,598,385 2,226,816

222
BANK OF CEYLON . Annual Report 2014
Notes to the Financial Statements
24 Financial assets - Held for trading (Contd.)
Group
As at 31 December 2014 2013
No of
ordinary
shares
Cost of
invest-
ment
LKR’000
Market
price per
share
LKR
Market
value
LKR’000
No of
ordinary
shares
Cost of
invest-
ment
LKR’000
Market
price per
share
LKR
Market
value
LKR’000
24.1 Quoted equities (Contd.)
Banks, Finance and Insurance
A I A Insurance Lanka PLC 2,078 667 302.00 628 - - - -
Amana Takaful PLC - - - - 174,639 265 1.60 279
Asia Asset Finance PLC 1,020,000 1,889 1.90 1,938 - - - -
Asia Capital PLC - - - - 4,200 202 17.00 71
Chilaw Finance PLC 4,753 110 27.10 129 832,942 21,872 12.40 10,328
Citizens Development Business
Finance PLC - Non voting 9,639 732 74.00 713 - - - -
Commercial Bank of Ceylon PLC
- Voting - - - - 52,095 5,504 120.40 6,272
Commercial Bank of Ceylon PLC
- Non voting 33,018 3,681 125.10 4,131 14,428 1,287 93.00 1,342
DFCC Bank PLC 120,000 24,993 219.00 26,280 91,868 18,235 129.00 11,851
First Capital Holdings PLC 17,714 935 47.00 833 147,696 2,688 17.50 2,585
Hatton National Bank PLC - Voting 84,425 19,345 194.90 16,454 84,425 19,345 147.00 12,410
Hatton National Bank PLC - Non voting - - - - 137,469 18,324 119.00 16,359
HNB Assurance PLC 28,600 2,584 83.50 2,388 38,852 2,555 52.50 2,040
Janashakthi Insurance Company PLC - - - - 392,000 7,744 12.70 4,978
Lanka Orix Leasing Company PLC 75,000 9,626 88.00 6,600 75,000 9,625 72.60 5,445
Lanka Ventures PLC - - - - 900 40 41.00 37
National Development Bank PLC - - - - 227,950 37,481 160.50 36,586
Nations Trust Bank PLC 50,000 4,804 97.00 4,850 113,940 8,206 62.20 7,087
People's Leasing & Finance PLC - - - - 199,300 3,587 13.40 2,671
Sampath Bank PLC 5,000 1,416 236.30 1,182 39,637 8,888 171.90 6,814
Sanasa Development Bank PLC 152,350 12,059 90.90 13,849 - - - -
Seylan Bank PLC - Voting 199,968 18,115 95.00 18,997 212,152 19,145 64.20 13,620
Seylan Bank PLC - Non voting 445,138 22,587 57.50 25,595 30,272 1,045 31.00 938
SMB Leasing PLC - - - - 712,740 889 0.80 570
Softlogic Capital PLC 70,999 504 7.20 511 - - - -
Softlogic Finance PLC - - - - 102,201 6,685 25.30 2,586
Swarnamahal Financial Services PLC 25,831 143 2.10 54 25,831 143 2.10 54
Union Bank of Colombo PLC 662,300 14,969 25.30 16,756 67,300 1,411 16.60 1,117
Vallibel Finance PLC 319,054 14,399 46.00 14,676 - - - -
153,558 156,564 195,166 146,040

223
Truly Everybody’s Bank
Group
As at 31 December 2014 2013
No of
ordinary
shares
Cost of
invest-
ment
LKR’000
Market
price per
share
LKR
Market
value
LKR’000
No of
ordinary
shares
Cost of
invest-
ment
LKR’000
Market
price per
share
LKR
Market
value
LKR’000
Beverage, Food and Tobacco
Bairaha Farms PLC 34,900 15,807 125.00 4,363 45,899 19,053 128.80 5,912
Cargills (Ceylon) PLC 1,095,930 238,325 153.00 167,677 809,600 192,779 147.00 119,011
Ceylon Tobacco Company PLC 64,247 73,151 1,060.10 68,108 - - - -
Distilleries Company of Sri Lanka PLC 459,770 91,629 210.00 96,552 330,602 60,285 193.00 63,806
HVA Foods PLC 20,000 905 10.20 204 20,000 905 9.90 198
Lanka Milk Foods (CWE) PLC 236,842 31,378 120.40 28,516 775,151 102,696 105.30 81,623
Lucky Lanka Milk Processing PLC
- Voting 4,053,822 24,251 4.90 19,864 - - - -
Lucky Lanka Milk Processing PLC
- Non voting 226,600 680 2.80 634 - - - -
Raigam Wayamba Salterns PLC - - - - 1,100,000 4,050 2.20 2,420
Renuka Agri Foods PLC 80,521 372 4.80 387 347,100 1,389 3.70 1,284
Renuka Foods PLC 1,318 28 23.90 32 580,146 11,247 16.50 9,572
Three Acre Farms PLC 201,581 10,853 51.00 10,281 25,876 1,160 36.90 955
487,379 396,618 393,564 284,781
Chemical and Pharmaceuticals
Chemanex PLC 109,519 17,521 80.00 8,762 101,000 16,844 85.00 8,585
CIC Holdings PLC - Voting 667,200 112,622 85.00 56,712 673,107 113,000 47.90 32,242
CIC Holdings PLC - Non voting 186,249 18,717 66.40 12,367 162,735 17,186 34.50 5,614
Haycarb PLC 265,827 50,844 173.00 45,988 281,067 53,509 189.80 53,347
Lankem Ceylon PLC 72,400 32,703 110.10 7,971 72,400 32,703 122.10 8,840
PC Pharma PLC 1,400,000 4,045 1.40 1,960 - - - -
Muller and Phipps (Ceylon) PLC 375,000 700 1.50 563 150,000 334 1.10 165
237,152 134,323 233,576 108,793
Construction and Engineering
Access Engineering PLC 1,754,974 46,850 32.10 56,335 1,467,036 30,585 22.10 32,421
Colombo Dockyard PLC 858,710 196,184 193.00 165,731 426,505 109,057 189.60 80,865
Lankem Developments PLC - - - - 175,063 1,651 5.10 893
MTD Walkers PLC - - - - 815,205 47,540 32.00 26,087
243,034 222,066 188,833 140,266

224
BANK OF CEYLON . Annual Report 2014
Notes to the Financial Statements
24 Financial assets - Held for trading (Contd.)
Group
As at 31 December 2014 2013
No of
ordinary
shares
Cost of
invest-
ment
LKR’000
Market
price per
share
LKR
Market
value
LKR’000
No of
ordinary
shares
Cost of
invest-
ment
LKR’000
Market
price per
share
LKR
Market
value
LKR’000
24.1 Quoted equities (Contd.)
Diversified Holdings
Aitken Spence PLC 1,794,357 280,225 103.50 185,716 1,527,400 253,238 102.30 156,253
Browns Investments PLC 8,718,326 28,391 1.90 16,565 6,473,412 29,922 2.30 14,889
Carson Cumberbatch PLC 167,623 82,400 430.40 72,145 167,623 82,400 350.00 58,668
C T Holdings PLC 161,348 26,623 143.00 23,073 343,495 57,173 140.10 48,124
Expolanka Holdings PLC 1,814,861 16,989 8.60 15,608 1,778,820 13,557 7.50 13,341
F L C Holdings PLC 302,300 1,558 2.00 605 377,300 1,931 2.20 830
Hayleys PLC 73,984 22,578 339.90 25,147 99,184 29,843 293.00 29,061
Hemas Holdings PLC 131,574 5,512 74.30 9,776 832,300 35,027 34.00 28,298
John Keells Holdings PLC 815,478 203,574 250.00 203,870 150,122 36,540 227.30 34,123
John Keells Holdings PLC - Warrants 0022 48,297 3,837 68.00 3,284 - - - -
John Keells Holdings PLC - Warrants 0023 305,323 22,088 72.50 22,136 - - - -
PCH Holdings PLC 1,000,000 2,730 2.40 2,400 - - - -
Richard Pieris & Company PLC 6,673,126 88,850 8.50 56,722 4,832,300 71,707 6.30 30,443
Softlogic Holdings PLC 702,953 17,541 16.50 11,599 895,300 18,469 8.40 7,521
Sunshine Holdings PLC - - - - 626,800 31,361 28.00 17,550
Taprobane Holdings PLC 2,000,000 10,063 4.60 9,200 70,757 304 2.80 198
The Colombo Fort Land & Building PLC 149,500 10,307 28.30 4,231 212,299 15,502 28.20 5,987
Vallibel One PLC 2,548,339 69,093 23.90 60,905 2,447,013 64,335 16.50 40,376
892,359 722,982 741,309 485,662
Footware and Textiles
Hayleys MGT Knitting Mills PLC 166,239 2,927 17.40 2,893 - - - -
ODEL PLC 197,400 8,796 22.00 4,343 197,400 8,796 21.00 4,145
11,723 7,236 8,796 4,145
Health Care
Asiri Hospital Holdings PLC 50,000 1,150 21.60 1,080 - - - -
Asiri Surgical Hospital PLC - - - - 233,046 2,357 10.30 2,400
Nawaloka Hospitals PLC 4,575,085 17,642 3.30 15,098 2,130,700 8,905 3.00 6,392
The Lanka Hospital Corporation PLC 2,500 111 48.00 120 32,500 1,668 40.50 1,316
18,903 16,298 12,930 10,108

225
Truly Everybody’s Bank
Group
As at 31 December 2014 2013
No of
ordinary
shares
Cost of
invest-
ment
LKR’000
Market
price per
share
LKR
Market
value
LKR’000
No of
ordinary
shares
Cost of
invest-
ment
LKR’000
Market
price per
share
LKR
Market
value
LKR’000
Hotels and Travels
Aitken Spence Hotel Holdings PLC 2,420,471 223,197 78.50 190,007 1,639,600 158,152 69.90 114,608
Amaya Leisure PLC 536,405 50,515 85.00 45,594 118,700 14,807 74.00 8,784
Asian Hotels & Properties PLC 2,573,955 241,212 67.80 174,514 2,350,998 226,046 64.20 150,934
Beruwala Resorts PLC 108,992 205 1.90 207 - - - -
Citrus Leisure PLC 100,000 10,112 16.80 1,680 210,900 13,387 14.60 3,079
Dolphin Hotels PLC 15,000 533 55.20 828 25,000 888 44.90 1,123
Eden Hotel Lanka PLC 737,343 41,764 25.70 18,950 722,850 41,399 29.00 20,963
Galadari Hotels (Lanka) PLC 479,146 7,158 14.50 6,948 - - - -
John Keells Hotels PLC 864,428 14,050 17.00 14,695 - - - -
Marawila Resorts PLC 529,584 3,849 6.00 3,178 50,000 631 5.30 265
Palm Garden Hotels PLC 36,868 4,845 80.00 2,949 24,020 3,971 62.60 1,504
Pegasus Hotels of Ceylon PLC - - - - 29,968 1,240 35.10 1,052
Serendib Hotels PLC - Non voting 39,037 958 23.30 910 40,940 702 15.60 639
Tal Lanka Hotels PLC 447,400 30,043 34.40 15,391 447,400 30,043 27.80 12,438
Tangerine Beach Hotels PLC 50,000 5,056 83.80 4,190 50,000 5,056 68.00 3,400
The Fortress Resorts PLC 1,461,100 50,506 16.90 24,693 1,461,100 50,506 13.40 19,579
The Kingsbury PLC 2,122,089 44,759 18.00 38,198 2,836,984 60,406 13.20 37,448
The Lighthouse Hotel PLC 100,000 6,124 55.00 5,500 108,000 6,592 44.00 4,752
Trans Asia Hotels PLC 477,200 48,407 92.10 43,950 477,200 48,407 79.90 38,128
783,293 592,382 662,233 418,696
Information Technology
PC House PLC - - - - 343,278 2,432 0.60 206
- - 2,432 206
Investment Trust
Ceylon Guardian Investment Trust PLC 96,700 30,682 194.90 18,847 67,200 24,709 181.90 12,224
Ceylon Investment PLC 478,020 76,512 97.50 46,607 442,000 72,718 77.00 34,034
Gurdian Capital Partners PLC 18,472 1,006 43.50 804 18,470 1,538 29.00 536
Lanka Century Investments PLC 437,500 24,109 15.60 6,825 385,000 23,271 14.10 5,429
Renuka Holdings PLC 651,632 24,363 31.50 20,526 560,569 38,980 30.60 17,153
156,672 93,609 161,216 69,376

226
BANK OF CEYLON . Annual Report 2014
Notes to the Financial Statements
24 Financial assets - Held for trading (Contd.)
Group
As at 31 December 2014 2013
No of
ordinary
shares
Cost of
invest-
ment
LKR’000
Market
price per
share
LKR
Market
value
LKR’000
No of
ordinary
shares
Cost of
invest-
ment
LKR’000
Market
price per
share
LKR
Market
value
LKR’000
24.1 Quoted equities (Contd.)
Land and Property
Colombo Land & Development
Company PLC 231,283 9,274 36.80 8,511 80,500 4,254 39.20 3,156
C T Land Development PLC - - - - 1,025,674 33,138 30.90 31,693
East West Properties PLC 195,393 2,837 12.80 2,501 307,216 4,649 11.50 3,533
Equity One PLC 26,664 977 44.50 1,187 29,540 2,051 26.20 774
Seylan Developments PLC 30,066 436 14.10 424 55,000 508 9.00 495
On'ally Holdings PLC - - - - 1,282 105 47.50 61
Overseas Realty (Ceylon) PLC 122,987 3,092 26.30 3,235 460,050 8,075 18.30 8,419
16,616 15,858 52,780 48,131
Manufacturing
Abans Electricals PLC 149,953 21,416 118.50 17,769 25,200 6,507 105.10 2,649
ACL Cables PLC 488,824 35,505 76.40 37,346 201,719 14,396 64.90 13,092
ACL Plastics PLC 12,200 1,639 125.00 1,525 - - - -
Acme Printing & Packaging PLC 1,078,700 35,020 11.00 11,866 1,310,700 41,289 9.70 12,714
Alumex PLC 196,882 2,756 15.90 3,130 - - - -
Bogala Graphite Lanka PLC 34,830 878 31.30 1,090 34,829 1,416 18.40 641
Central Industries PLC 203,128 15,638 86.00 17,469 193,627 14,757 55.50 10,746
Ceylon Grain Elevators PLC 155,410 20,281 41.00 6,372 120,410 18,771 35.50 4,275
Chevron Lubricants Lanka PLC 31,557 10,850 399.60 12,610 - - - -
Dankotuwa Porcelain PLC 188,753 2,747 14.50 2,737 - - - -
Dipped Products PLC - - - - 792,400 98,031 90.00 71,316
Hayleys Fibre PLC 145,300 7,867 42.60 6,190 146,423 7,914 25.00 3,661
Kelani Cables PLC - - - - 1,070 81 74.00 79
Kelani Tyres PLC 743,796 53,019 78.80 58,611 800,130 42,343 49.50 39,606
Lanka Aluminium Industries PLC - - - - 37,500 1,476 29.60 1,110
Lanka Cement PLC 9,583,809 83,858 6.60 63,253 9,639,259 85,790 6.60 63,619
Lanka Tiles PLC 973,200 130,512 110.00 107,052 973,200 130,512 78.90 76,785
Lanka Walltiles PLC 409,515 37,754 97.30 39,846 410,040 37,802 53.90 22,101
Laxapana Batteries PLC - - - - 188,935 1,297 4.00 756
Orient Garments PLC 348,900 10,906 15.00 5,234 348,900 10,906 8.00 2,791
Pelwatte Sugar Industries PLC 68,400 2,925 23.50 1,607 68,400 2,925 23.50 1,607
Piramal Glass Ceylon PLC 3,288,600 32,322 4.90 16,114 6,144,534 53,500 4.50 27,650
Printcare PLC - - - - 25,000 1,293 27.00 675
Royal Ceramics Lanka PLC 1,799,958 211,263 116.90 210,415 756,339 91,876 84.60 63,986
Sierra Cables PLC 2,400 14 3.90 9 92,400 477 1.80 166
Textured Jersey Lanka PLC 1,007,754 18,387 20.60 20,760 980,308 14,413 15.20 14,901
Tokyo Cement Company (Lanka) PLC
- Voting - - - - 894,477 24,944 28.50 25,493
Tokyo Cement Company (Lanka) PLC
- Non voting 513,007 20,948 46.90 24,060 882,820 33,213 23.40 20,658
756,505 665,065 735,929 481,077

227
Truly Everybody’s Bank
Group
As at 31 December 2014 2013
No of
ordinary
shares
Cost of
invest-
ment
LKR’000
Market
price per
share
LKR
Market
value
LKR’000
No of
ordinary
shares
Cost of
invest-
ment
LKR’000
Market
price per
share
LKR
Market
value
LKR’000
Motors
C M Holdings PLC 66,857 19,533 129.10 8,631 52,285 17,671 83.60 4,371
Diesel & Motor Engineering PLC 36,356 55,836 636.00 23,122 37,356 56,948 481.00 17,968
Sathosa Motors PLC 20,648 7,944 245.00 5,059 30,980 11,824 259.10 8,027
United Motors Lanka PLC 264,916 27,230 103.60 27,445 40,000 5,015 113.70 4,548
110,543 64,257 91,458 34,914
Oil Palms
Bukit Darah PLC 47,957 37,098 715.00 34,289 47,957 37,098 619.90 29,729
37,098 34,289 37,098 29,729
Plantations
Agalawatte Plantations PLC 52,830 4,825 27.10 1,432 52,830 4,864 23.90 1,263
Balangoda Plantations PLC 517,609 16,972 26.50 13,717 39,734 2,843 31.00 1,232
Elpitiya Plantations PLC 225,379 5,667 22.70 5,116 700 22 16.60 12
Horana Plantations PLC 513,000 43,752 24.10 12,363 513,000 43,752 23.80 12,209
Kahawatte Plantations PLC 838,629 33,921 35.50 29,771 931,300 37,669 38.80 36,134
Kegalle Plantations PLC 63,600 15,004 94.00 5,978 50,600 13,703 102.90 5,207
Kotagala Plantations PLC 623,762 40,085 31.60 19,711 499,665 35,366 37.00 18,488
Namunukula Plantations PLC 80,000 12,458 89.40 7,152 80,000 12,458 84.70 6,776
Talawakelle Tea Estate PLC 85,025 2,970 33.00 2,806 - - - -
Watawala Plantations PLC 350,100 10,998 18.80 6,582 375,190 11,302 9.90 3,714
186,652 104,628 161,979 85,035
Power and Energy
F L C Hydro Power PLC 173,194 1,427 5.70 987 223,194 1,839 5.00 1,116
Lanka IOC PLC 100,000 6,000 60.00 6,000 - - - -
Laugfs Gas PLC - Voting 176,227 4,955 40.50 7,137 177,227 5,118 28.40 5,033
Laugfs Gas PLC - Non voting 3,421,628 142,778 37.20 127,285 3,303,490 136,439 21.50 71,025
Panasian Power PLC 1,029,200 6,407 3.20 3,293 1,029,200 6,407 2.50 2,573
Resus Energy PLC 1,290,582 49,020 18.10 23,360 1,320,051 50,346 17.60 23,233
Vallibel Power Erathna PLC 1,650,000 14,025 7.20 11,880 1,298,650 11,713 5.80 7,532
224,612 179,942 211,862 110,512
Services
John Keells PLC 250,200 22,759 90.30 22,593 41,287 3,426 71.20 2,940
Kalamazoo Systems PLC 135 172 1,133.20 153 109 194 1,033.30 113
22,931 22,746 3,620 3,053

228
BANK OF CEYLON . Annual Report 2014
Notes to the Financial Statements
24 Financial assets - Held for trading (Contd.)
Group
As at 31 December 2014 2013
No of
ordinary
shares
Cost of
invest-
ment
LKR’000
Market
price per
share
LKR
Market
value
LKR’000
No of
ordinary
shares
Cost of
invest-
ment
LKR’000
Market
price per
share
LKR
Market
value
LKR’000
24.1 Quoted equities (Contd.)
Stores and Supplies
Colombo City Holdings PLC 1,215 792 627.50 762 - - - -
Hunters & Company PLC 27,100 21,923 386.20 10,466 27,100 21,923 271.50 7,358
22,715 11,228 21,923 7,358
Telecommunications
Dialog Axiata PLC 812,308 9,200 13.30 10,804 7,279,132 76,523 9.00 65,512
Sri Lanka Telecom PLC 214,000 7,496 49.90 10,679 214,000 7,496 37.00 7,918
16,696 21,483 84,019 73,430
Trading
Brown & Company PLC 418,073 85,293 107.00 44,734 321,700 74,867 82.70 26,605
Ceylon & Foreign Trades PLC 930,100 9,575 7.50 6,976 1,524,110 15,687 6.40 9,754
C. W. Mackie PLC 42,483 3,060 59.00 2,506 21,700 1,806 60.80 1,319
Tess Agro PLC - Non voting 165,570 215 1.30 215 - - - -
Singer Sri Lanka PLC 23,985 2,492 117.90 2,828 47,437 4,879 89.00 4,222
100,635 57,259 97,239 41,900
Total quoted equities 4,479,076 3,518,833 4,097,962 2,583,212
Group
As at 31 December 2014 2013
No of
units
Cost of
invest-
ment
LKR’000
Market
price per
unit
LKR
Market
value
LKR’000
No of
units
Cost of
invest-
ment
LKR’000
Market
price per
unit
LKR
Market
value
LKR’000
24.2 Quoted units in unit trusts
Namal Acuity Value Fund 30,900 2,863 90.10 2,784 30,900 2,863 66.50 2,055
Total quoted units in unit trusts 2,863 2,784 2,863 2,055
Group
As at 31 December 2014 2013
No of
debentures
Cost of
investment
LKR ‘000
Market
value
LKR ‘000
No of
debentures
Cost of
investment
LKR ‘000
Market
value
LKR ‘000
24.3 Quoted debt securities
Commercial Credit and Finance PLC 20,000 2,141 2,504 - - -
Total quoted debt securities 2,141 2,504 - -

229
Truly Everybody’s Bank
Bank Group
As at 31 December 2014
LKR '000
2013
LKR '000
2014
LKR '000
2013
LKR '000
25 Financial investments - Loans and receivables
Sri Lanka Development Bonds [Note 25.1] 113,120,697 113,184,772 113,120,697 113,184,772
Government of Sri Lanka Restructuring Bonds [Note 25.2] 8,968,474 8,968,474 8,968,474 8,968,474
Debentures [Note 25.3] 2,086,851 1,727,207 1,974,776 1,600,933
Trust certificates [Note 25.4] 85,667 49,995 85,667 78,217
Commercial papers [Note 25.5] 101,465 105,341 139,358 340,112
Government securities - Other countries 4,782,176 5,072,824 4,782,176 5,072,824
Other investments - - 895,658 944,964
Total financial investments - Loans and receivables 129,145,330 129,108,613 129,966,806 130,190,296
Bank/Group
As at 31 December 2014 2013
Date of
maturity
Cost of
investment
LKR ‘000
Carrying
value
LKR ‘000
Date of
maturity
Cost of
investment
LKR ‘000
Carrying
value
LKR ‘000
25.1 Sri Lanka Development Bonds
(US Dollar bonds)
6 months LIBOR plus 230 basis points - - - 16.03.2014 3,927,150 3,963,478
6 months LIBOR plus 225 basis points - - - 13.03.2014 6,545,250 6,604,681
6 months LIBOR plus 365 basis points - - - 29.06.2014 3,272,625 3,273,345
6 months LIBOR plus 365 basis points - - - 18.08.2014 1,963,575 1,993,497
6 months LIBOR plus 265 basis points 16.03.2015 9,862,875 9,949,993 - - -
6 months LIBOR plus 385 basis points 26.03.2015 657,525 664,897 26.03.2015 654,525 661,930
6 months LIBOR plus 400 basis points 22.02.2016 2,630,100 2,671,699 22.02.2016 2,618,100 2,660,408
6 months LIBOR plus 325 basis points 30.06.2017 1,972,575 1,972,967 - - -
6 months LIBOR plus 375 basis points 30.06.2017 3,287,625 3,288,368 - - -
6 months LIBOR plus 415 basis points 01.07.2018 92,457,220 94,572,773 01.07.2018 92,035,378 94,027,433
Total Sri Lanka Development Bonds 110,867,920 113,120,697 111,016,603 113,184,772
Bank/Group
As at 31 December 2014 2013
Rate
Date of
issue
Date of
maturity
Cost of
investment
LKR ‘000
Carrying
value
LKR ‘000
Cost of
investment
LKR ‘000
Carrying
value
LKR ‘000
25.2 Government of Sri Lanka
Restructuring Bonds
For recapitalization purposes 12% 24.09.1993 24.03.2023 4,780,000 5,015,714 4,780,000 5,015,714
For settlement of loans 12% 24.03.1993 24.03.2023 3,767,000 3,952,760 3,767,000 3,952,760
Total Government of Sri Lanka
Restructuring Bonds 8,547,000 8,968,474 8,547,000 8,968,474

230
BANK OF CEYLON . Annual Report 2014
Notes to the Financial Statements
25 Financial investments - Loans and receivables (Contd.)
Bank
As at 31 December 2014 2013
No of
debentures
Cost of
investment
LKR ‘000
Amortized
cost
LKR ‘000
No of
debentures
Cost of
investment
LKR ‘000
Amortized
cost
LKR ‘000
25.3 Debentures
Abans (Private) Limited
Fixed rate of 14.00% LKR 100/- each
maturing in December 2016 720,700 72,070 77,153 720,700 72,070 72,364
Alliance Finance Company PLC
Fixed rate of 18.50% LKR 100/- each
maturing in September 2015 1,000,000 100,000 104,667 1,000,000 100,000 104,664
Central Finance Company PLC
Fixed rate of 14.25% LKR 1,000/- each
maturing in June 2016 8,800 8,800 9,113 8,800 8,800 9,112
HDFC Bank of Sri Lanka
Fixed rate of 15.00% LKR 100/- each
maturing in October 2017 779,400 77,940 80,883 779,400 77,940 79,947
Hayleys PLC
Fixed rate of 14.25% LKR 1,000/- each
maturing in July 2016 57,700 57,700 59,759 57,700 57,700 59,766
Hemas Holdings PLC
Fixed rate of 11.00% LKR 100/- each
maturing in April 2019 173,500 17,350 17,818 - - -
Kotagala Plantations PLC
Fixed rate of 14.25% LKR 100/- each
maturing in May 2018 165,975 16,598 18,019 - - -
Fixed rate of 14.50% LKR 100/- each
maturing in May 2019 165,975 16,598 17,806 - - -
Fixed rate of 14.75% LKR 100/- each
maturing in May 2020 165,975 16,598 17,826 - - -
Fixed rate of 15.00% LKR 100/- each
maturing in May 2021 165,975 16,598 17,847 - - -
Lanka Orix Leasing Company PLC
Fixed rate of 11.70% LKR 100/- each
maturing in September 2015 1,000,000 100,000 105,907 1,000,000 100,000 105,881
Fixed rate of 9.00% LKR 100/- each
maturing in November 2019 1,000,000 100,000 100,907 - - -
LB Finance PLC
Fixed rate of 12.30% LKR 100/- each
maturing in December 2016 1,000,000 100,000 100,864 100,000 100,000 100,872
Fixed rate of 15.00% LKR 100/- each
maturing in November 2018 445,200 44,520 51,337 445,200 44,520 45,068

231
Truly Everybody’s Bank
Bank
As at 31 December 2014 2013
No of
debentures
Cost of
investment
LKR ‘000
Amortized
cost
LKR ‘000
No of
debentures
Cost of
investment
LKR ‘000
Amortized
cost
LKR ‘000
Merchant Bank of Sri Lanka & Finance PLC
Fixed rate of 11.60% LKR 100/- each
maturing in November 2014 - - - 1,400,000 140,000 148,203
Fixed rate of 16.70% LKR 100/- each
maturing in March 2018 938,600 93,860 97,845 938,600 93,860 97,807
Fixed rate of 9.00% LKR 100/- each
maturing in November 2019 1,135,200 113,520 114,816 - - -
National Development Bank PLC
Fixed rate of 13.42% LKR 100/- each
maturing in December 2018 542,700 54,270 57,823 542,700 54,270 54,495
People's Leasing Company PLC
Fixed rate of 11.55% LKR 100/- each
maturing in December 2014 - - - 1,000,000 100,000 105,833
Fixed rate of 9.63% LKR 100/- each
maturing in September 2018 73,500 7,350 7,535 - - -
Richard Pieris Company PLC
Fixed rate of 10.75% LKR 100/- each
maturing in May 2017 156,500 15,650 16,062 - - -
Sampath Bank PLC
Fixed rate of 8.25% LKR 100/- each
maturing in December 2019 1,000,000 100,000 100,348 - - -
Sampath Leasing & Factoring Limited
Fixed rate of 16.65% LKR 100/- each
maturing in July 2015 500,000 50,000 54,211 500,000 50,000 54,196
Senkadagala Finance PLC
Fixed rate of 17.00% LKR 100/- each
maturing in May 2016 181,097 18,110 18,877 181,097 18,110 18,875
Fixed rate of 15.00% LKR 100/- each
maturing in December 2018 817,653 81,765 82,462 817,653 81,765 82,426
Seylan Bank PLC
Fixed rate of 8.60% LKR 100/- each
maturing in December 2019 1,500,000 150,000 150,271 - - -
Singer Sri Lanka PLC
Fixed rate of 17.00% LKR 100/- each
maturing in October 2015 377,713 37,771 37,761 377,713 37,771 37,761
Softlogic Finance PLC
Fixed rate of 10.00% LKR 100/- each
maturing in August 2019 190,900 19,090 19,565 - - -
Urban Development Authority
Fixed rate of 11.00% LKR 100/- each
maturing in October 2015 5,352,400 538,266 549,369 5,352,400 538,266 549,937
Total debentures 2,024,424 2,086,851 1,675,072 1,727,207

232
BANK OF CEYLON . Annual Report 2014
Notes to the Financial Statements
25 Financial investments - Loans and receivables (Contd.)
25.3 Debentures (Contd.)
Group
As at 31 December 2014 2013
No of
debentures
Cost of
investment
LKR ‘000
Amortized
cost
LKR ‘000
No of
debentures
Cost of
investment
LKR ‘000
Amortized
cost
LKR ‘000
Abans (Private) Limited
Fixed rate of 14.00% LKR 100/- each
maturing in December 2016 720,700 72,070 77,153 720,700 72,070 72,364
Alliance Finance Company PLC
Fixed rate of 18.50% LKR 100/- each
maturing in September 2015 1,000,000 100,000 104,667 1,000,000 100,000 104,664
Central Finance Company PLC
Fixed rate of 14.25% LKR 1,000/- each
maturing in June 2016 8,800 8,800 9,113 8,800 8,800 9,112
HDFC Bank of Sri Lanka
Fixed rate of 15.00% LKR 100/- each
maturing in October 2017 779,400 77,940 80,883 779,400 77,940 79,947
Hayleys PLC
Fixed rate of 14.25% LKR 1,000/- each
maturing in July 2016 57,700 57,700 59,759 57,700 57,700 59,766
Hemas Holdings PLC
Fixed rate of 11.00% LKR 100/- each
maturing in April 2019 173,500 17,350 17,818 - - -
Kotagala Plantations PLC
Fixed rate of 14.25% LKR 100/- each
maturing in May 2018 165,975 16,598 18,019 - - -
Fixed rate of 14.50% LKR 100/- each
maturing in May 2019 165,975 16,598 17,806 - - -
Fixed rate of 14.75% LKR 100/- each
maturing in May 2020 165,975 16,598 17,826 - - -
Fixed rate of 15.00% LKR 100/- each
maturing in May 2021 165,975 16,598 17,847 - - -
Lanka Orix Leasing Company PLC
Fixed rate of 11.70% LKR 100/- each
maturing in September 2015 1,050,000 105,000 111,151 1,050,000 105,000 111,141
Fixed rate of 9.00% LKR 100/- each
maturing in November 2019 1,000,000 100,000 100,907 - - -
LB Finance PLC
Fixed rate of 12.30% LKR 100/- each
maturing in December 2016 1,000,000 100,000 100,864 100,000 100,000 100,872
Fixed rate of 15.00% LKR 100/- each
maturing in November 2018 445,200 44,520 51,337 445,200 44,520 45,068
National Development Bank PLC
Fixed rate of 13.42% LKR 100/- each
maturing in December 2018 542,700 54,270 57,823 542,700 54,270 54,495

233
Truly Everybody’s Bank
Group
As at 31 December 2014 2013
No of
debentures
Cost of
investment
LKR ‘000
Amortized
cost
LKR ‘000
No of
debentures
Cost of
investment
LKR ‘000
Amortized
cost
LKR ‘000
People's Leasing Company PLC
Fixed rate of 11.30% LKR 1,000/- each
maturing in June 2014 - - - 200,000 20,000 21,139
Fixed rate of 11.55% LKR 100/- each
maturing in December 2014 - - - 1,000,000 100,000 105,833
Fixed rate of 17.00% LKR 100/- each
maturing in March 2018 500,000 50,000 58,445 500,000 50,000 56,434
Fixed rate of 9.63% LKR 100/- each
maturing in September 2018 73,500 7,350 7,535 - - -
Richard Pieris Company PLC
Fixed rate of 10.75% LKR 100/- each
maturing in May 2017 156,500 15,650 16,062 - - -
Sampath Bank PLC
Fixed rate of 8.25% LKR 100/- each
maturing in December 2019 1,000,000 100,000 100,348 - - -
Sampath Leasing & Factoring Limited
Fixed rate of 16.65% LKR 100/- each
maturing in July 2015 500,000 50,000 54,211 500,000 50,000 54,196
Senkadagala Finance PLC
Fixed rate of 17.00% LKR 100/- each
maturing in May 2016 362,194 36,220 37,758 362,194 36,220 37,749
Fixed rate of 15.00% LKR 100/- each
maturing in December 2018 817,653 81,765 82,462 817,653 81,765 82,426
Seylan Bank PLC
Fixed rate of 15.50% LKR 100/- each
maturing in February 2018 150,000 15,000 17,018 150,000 15,000 17,019
Fixed rate of 8.60% LKR 100/- each
maturing in December 2019 1,500,000 150,000 150,271 - - -
Singer Sri Lanka PLC
Fixed rate of 15.50% LKR 100/- each
maturing in July 2015 10,000 1,000 998 10,000 1,000 1,010
Fixed rate of 17.00% LKR 100/- each
maturing in October 2015 377,713 37,771 37,761 377,713 37,771 37,761
Softlogic Finance PLC
Fixed rate of 10.00% LKR 100/- each
maturing in August 2019 190,900 19,090 19,565 - - -
Urban Development Authority
Fixed rate of 11.00% LKR 100/- each
maturing in October 2015 5,352,400 538,266 549,369 5,352,400 538,266 549,937
Total debentures 1,906,154 1,974,776 1,550,322 1,600,933

234
BANK OF CEYLON . Annual Report 2014
Notes to the Financial Statements
25 Financial investments - Loans and receivables (Contd.)
Bank Group
As at 31 December 2014 2013 2014 2013
Cost of
invest-
ment
LKR ‘000
Carrying
value
LKR ‘000
Cost of
invest-
ment
LKR ‘000
Carrying
value
LKR ‘000
Cost of
invest-
ment
LKR ‘000
Carrying
value
LKR ‘000
Cost of
invest-
ment
LKR ‘000
Carrying
value
LKR ‘000
25.4 Trust certificates
Associated Motor Finance Company PLC - - - - - - 14,550 14,550
Commercial Credit and Finance PLC 75,660 85,667 - - 75,660 85,667 - -
Mercantile Investments and Finance PLC - - - - - - 12,000 13,672
Senkadagala Finance PLC - - 22,592 28,169 - - 22,592 28,169
Vallibel Finance PLC - - 17,579 21,826 - - 17,579 21,826
Total trust certificates 75,660 85,667 40,171 49,995 75,660 85,667 66,721 78,217
25.5 Commercial papers
Abans (Private) Limited - - 98,877 105,341 - - 98,877 105,341
First Capital Holdings PLC - - - - 33,980 37,893 33,980 34,771
Commercial Credit and Finance PLC - - - - - - 100,000 100,000
Softlogic Finance PLC 99,590 101,465 - - 99,590 101,465 100,000 100,000
Total commercial papers 99,590 101,465 98,877 105,341 133,570 139,358 332,857 340,112
26 Loans and advances to customers 26 .1 Net loans and advances to customers
As at 31 December 2014 2013
Individually
significant
loans
LKR ‘000
Retail loans
LKR ‘000
Staff loans
LKR ‘000
Total
LKR ‘000
Individually
significant
loans
LKR ‘000
Retail loans
LKR ‘000
Staff loans
LKR ‘000
Total
LKR ‘000
26.1.1 Bank
Gross loans and advances 434,156,401 330,540,200 12,808,314 777,504,915 397,512,598 344,935,201 12,937,347 755,385,146
Less : Individual impairment 10,057,121 - 80,881 10,138,002 7,994,362 - 136,405 8,130,767
Collective impairment 472,421 25,546,857 - 26,019,278 295,583 21,626,830 - 21,922,413
Net loans and advances 423,626,859 304,993,343 12,727,433 741,347,635 389,222,653 323,308,371 12,800,942 725,331,966
26.1.2 Group
Gross loans and advances 443,107,569 345,645,854 12,831,052 801,584,475 403,691,920 361,082,306 13,153,138 777,927,364
Less : Individual impairment 10,844,181 - 80,881 10,925,062 8,623,763 - 136,405 8,760,168
Collective impairment 482,644 26,404,717 - 26,887,361 310,473 22,284,904 - 22,595,377
Net loans and advances 431,780,744 319,241,137 12,750,171 763,772,052 394,757,684 338,797,402 13,016,733 746,571,819

235
Truly Everybody’s Bank
Bank Group
2014
LKR '000
2013
LKR '000
2014
LKR '000
2013
LKR '000
26.2 Movement in individual and collective impairment
for loans and advances to customers
26.2.1 Movement in individual impairment
As at 1 January 8,130,767 8,969,765 8,760,168 8,991,553
Charge during the year 2,721,983 287,989 3,110,171 461,633
Amount recovered / reversed during the year (714,748) (1,126,987) (714,748) (1,126,987)
Amount written off - - (345) (412)
Other movements - - (230,184) 434,381
As at 31 December 10,138,002 8,130,767 10,925,062 8,760,168
26.2.2 Movement in collective impairment
As at 1 January 21,922,413 13,977,744 22,595,377 14,781,310
Charge during the year 5,203,681 7,761,900 5,536,102 7,996,490
Amount written off (54,691) (50,371) (224,057) (101,201)
Other movements 3,669 233,140 35,733 (81,222)
Impairment adjustment for gold stock* (1,055,794) - (1,055,794) -
As at 31 December 26,019,278 21,922,413 26,887,361 22,595,377
Total individual and collective impairment 36,157,280 30,053,180 37,812,423 31,355,545
* This represents the impairment charge relating to the auction rejected pawned articles devolved by the Bank during the year.
As at 31 December 2014 2013
Local
currency
loans
LKR ‘000
Foreign
currency
loans
LKR ‘000
Total
LKR ‘000
Local
currency
loans
LKR ‘000
Foreign
currency
loans
LKR ‘000
Total
LKR ‘000
26.3 Analysis of gross loans and
advances - By product
26.3.1 Bank
Term loans 124,099,056 186,862,571 310,961,627 107,828,340 171,111,928 278,940,268
Loans under schemes 35,334,191 825,587 36,159,778 34,017,331 - 34,017,331
Housing loans 38,169,603 - 38,169,603 33,711,540 - 33,711,540
Trade finance 16,892,456 43,908,470 60,800,926 17,431,503 44,011,953 61,443,456
Personal loans 57,902,737 - 57,902,737 40,882,088 - 40,882,088
Overdrafts 127,539,066 12,965,821 140,504,887 117,018,469 9,283,688 126,302,157
Credit cards 2,829,387 - 2,829,387 2,651,703 - 2,651,703
Lease rentals receivable [Note 26.5] 30,239,149 598,066 30,837,215 22,044,606 641,727 22,686,333
Pawning 76,434,744 - 76,434,744 131,386,116 - 131,386,116
Foreclosed properties 657,434 480,139 1,137,573 839,056 - 839,056
Staff loans 12,808,314 12,937 12,821,251 12,937,347 - 12,937,347
Other 7,303,635 1,641,552 8,945,187 9,587,751 - 9,587,751
Gross loans and advances 530,209,772 247,295,143 777,504,915 530,335,850 225,049,296 755,385,146

236
BANK OF CEYLON . Annual Report 2014
Notes to the Financial Statements
26 Loans and advances to customers (Contd.)
26.3 Analysis of gross loans and advances - By product (Contd.)
As at 31 December 2014 2013
Local
currency
loans
LKR ‘000
Foreign
currency
loans
LKR ‘000
Total
LKR ‘000
Local
currency
loans
LKR ‘000
Foreign
currency
loans
LKR ‘000
Total
LKR ‘000
26.3.2 Group
Term loans 130,526,349 188,313,799 318,840,148 112,094,142 172,299,818 284,393,960
Loans under schemes 35,761,416 825,587 36,587,003 34,665,221 - 34,665,221
Housing loans 38,195,506 301,370 38,496,876 33,711,540 300,912 34,012,452
Trade finance 17,878,989 43,908,470 61,787,459 18,328,059 44,011,953 62,340,012
Personal loans 58,991,509 - 58,991,509 41,501,777 - 41,501,777
Overdrafts 127,490,619 12,965,821 140,456,440 116,943,334 9,687,350 126,630,684
Credit cards 2,829,387 - 2,829,387 2,651,703 - 2,651,703
Lease rentals receivable [Note 26.5] 43,173,127 598,066 43,771,193 32,352,554 641,727 32,994,281
Pawning 76,608,119 - 76,608,119 131,660,366 - 131,660,366
Foreclosed properties 657,434 480,139 1,137,573 839,056 - 839,056
Staff loans 13,057,327 31,261 13,088,588 13,147,526 5,612 13,153,138
Other 7,348,628 1,641,552 8,990,180 13,084,714 - 13,084,714
Gross loans and advances 552,518,410 249,066,065 801,584,475 550,979,992 226,947,372 777,927,364
Bank Group
As at 31 December 2014
LKR '000
2013
LKR '000
2014
LKR '000
2013
LKR '000
26.4 Analysis of gross loans and advances - By currency
Sri Lankan Rupee 530,209,772 530,335,850 552,518,410 550,979,992
United States Dollar 234,853,588 210,686,897 234,853,588 211,391,470
Great Britain Pound 399,683 400,856 2,170,605 1,594,359
Euro 447,480 1,264,644 447,480 1,264,644
Maldevian Rufiyaa 7,668,892 9,481,549 7,668,892 9,481,549
Indian Rupee 3,886,909 3,052,378 3,886,909 3,052,378
Other currencies 38,591 162,972 38,591 162,972
Gross loans and advances 777,504,915 755,385,146 801,584,475 777,927,364
26.5 Lease rentals receivable
Gross lease rentals receivable
Less than one year 13,703,533 10,303,899 17,946,217 15,070,619
One to five years 24,190,374 17,634,964 35,854,360 26,394,153
More than five years 43,169 14,800 43,169 14,800
37,937,076 27,953,663 53,843,746 41,479,572
Unearned finance income (7,099,861) (5,267,330) (10,072,553) (8,485,291)
Gross lease rentals receivable 30,837,215 22,686,333 43,771,193 32,994,281
Allowance for impairment losses (1,406,191) (606,205) (2,161,554) (1,072,805)
Net lease rentals receivable 29,431,024 22,080,128 41,609,639 31,921,476

237
Truly Everybody’s Bank
Bank Group
As at 31 December 2014
LKR '000
2013
LKR '000
2014
LKR '000
2013
LKR '000
27 Financial investments - Available for sale
Quoted investments
Treasury bills - Investment fund account - 11,110 - 168,008
Treasury bonds - Investment fund account - - - 449,531
Treasury bills 1,932,324 440,100 2,599,681 602,834
Treasury bonds 478,575 23,536 1,477,887 664,390
Government securities - Other countries 1,383,460 1,186,224 1,593,537 1,408,777
Equities and unit trusts [Note 27.1] 10,144,583 7,023,942 11,496,886 7,894,394
13,938,942 8,684,912 17,167,991 11,187,934
Unquoted investments
Equities [Note 27.2] 422,601 1,640,302 443,169 1,664,511
Total financial investments - Available for sale 14,361,543 10,325,214 17,611,160 12,852,445
As at 31 December 2014 2013
No of
ordinary
shares / units
Cost of
investment
LKR’000
Market
value
LKR ‘000
No of
ordinary
shares / units
Cost of
investment
LKR’000
Market
value
LKR ‘000
27.1 Quoted equities and unit trusts -
Bank
27.1.1 Quoted equity shares
National Development Bank PLC 16,371,076 691,862 4,092,769 16,371,076 691,862 2,627,558
People's Leasing & Finance PLC 11,453,600 206,165 280,613 11,453,600 206,165 153,478
Seylan Bank PLC 13,198,305 466,700 1,253,839 13,198,305 466,700 847,331
1,364,727 5,627,221 1,364,727 3,628,367
27.1.2 Units in unit trusts
Ceybank Unit Trust 116,860,134 1,772,504 3,774,582 109,257,002 1,553,990 2,819,923
Ceybank Century Growth Fund 8,284,896 146,101 628,741 8,036,697 130,027 459,297
Ceybank Surekum Gilt Edged Fund 11,007,965 110,246 114,039 11,007,965 110,246 116,355
2,028,851 4,517,362 1,794,263 3,395,575
Total quoted equities and unit trusts 3,393,578 10,144,583 3,158,990 7,023,942
27.1 Quoted equities and unit trusts -
Group
27.1.3 Quoted equity shares
National Development Bank PLC 16,371,076 691,862 4,092,769 16,371,076 691,862 2,627,558
People's Leasing & Finance PLC 11,453,600 206,165 280,613 11,453,600 206,165 153,478
Seylan Bank PLC 13,198,305 466,700 1,253,839 13,198,305 466,700 847,331
The Lanka Hospital Corporation PLC 21,329,000 213,290 1,023,792 21,329,000 213,290 863,824
1,578,017 6,651,013 1,578,017 4,492,191
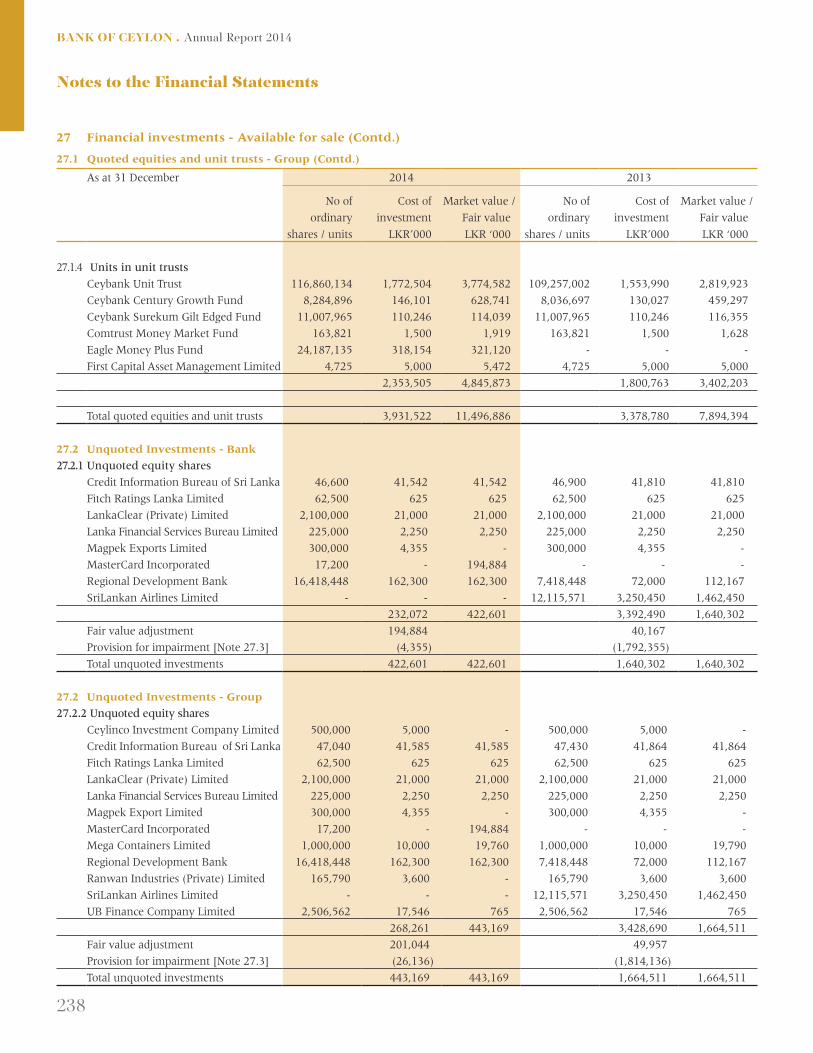
238
BANK OF CEYLON . Annual Report 2014
Notes to the Financial Statements
27 Financial investments - Available for sale (Contd.)
27.1 Quoted equities and unit trusts - Group (Contd.)
As at 31 December 2014 2013
No of
ordinary
shares / units
Cost of
investment
LKR’000
Market value /
Fair value
LKR ‘000
No of
ordinary
shares / units
Cost of
investment
LKR’000
Market value /
Fair value
LKR ‘000
27.1.4 Units in unit trusts
Ceybank Unit Trust 116,860,134 1,772,504 3,774,582 109,257,002 1,553,990 2,819,923
Ceybank Century Growth Fund 8,284,896 146,101 628,741 8,036,697 130,027 459,297
Ceybank Surekum Gilt Edged Fund 11,007,965 110,246 114,039 11,007,965 110,246 116,355
Comtrust Money Market Fund 163,821 1,500 1,919 163,821 1,500 1,628
Eagle Money Plus Fund 24,187,135 318,154 321,120 - - -
First Capital Asset Management Limited 4,725 5,000 5,472 4,725 5,000 5,000
2,353,505 4,845,873 1,800,763 3,402,203
Total quoted equities and unit trusts 3,931,522 11,496,886 3,378,780 7,894,394
27.2 Unquoted Investments - Bank
27.2.1 Unquoted equity shares
Credit Information Bureau of Sri Lanka 46,600 41,542 41,542 46,900 41,810 41,810
Fitch Ratings Lanka Limited 62,500 625 625 62,500 625 625
LankaClear (Private) Limited 2,100,000 21,000 21,000 2,100,000 21,000 21,000
Lanka Financial Services Bureau Limited 225,000 2,250 2,250 225,000 2,250 2,250
Magpek Exports Limited 300,000 4,355 - 300,000 4,355 -
MasterCard Incorporated 17,200 - 194,884 - - -
Regional Development Bank 16,418,448 162,300 162,300 7,418,448 72,000 112,167
SriLankan Airlines Limited - - - 12,115,571 3,250,450 1,462,450
232,072 422,601 3,392,490 1,640,302
Fair value adjustment 194,884 40,167
Provision for impairment [Note 27.3] (4,355) (1,792,355)
Total unquoted investments 422,601 422,601 1,640,302 1,640,302
27.2 Unquoted Investments - Group
27.2.2 Unquoted equity shares
Ceylinco Investment Company Limited 500,000 5,000 - 500,000 5,000 -
Credit Information Bureau of Sri Lanka 47,040 41,585 41,585 47,430 41,864 41,864
Fitch Ratings Lanka Limited 62,500 625 625 62,500 625 625
LankaClear (Private) Limited 2,100,000 21,000 21,000 2,100,000 21,000 21,000
Lanka Financial Services Bureau Limited 225,000 2,250 2,250 225,000 2,250 2,250
Magpek Export Limited 300,000 4,355 - 300,000 4,355 -
MasterCard Incorporated 17,200 - 194,884 - - -
Mega Containers Limited 1,000,000 10,000 19,760 1,000,000 10,000 19,790
Regional Development Bank 16,418,448 162,300 162,300 7,418,448 72,000 112,167
Ranwan Industries (Private) Limited 165,790 3,600 - 165,790 3,600 3,600
SriLankan Airlines Limited - - - 12,115,571 3,250,450 1,462,450
UB Finance Company Limited 2,506,562 17,546 765 2,506,562 17,546 765
268,261 443,169 3,428,690 1,664,511
Fair value adjustment 201,044 49,957
Provision for impairment [Note 27.3] (26,136) (1,814,136)
Total unquoted investments 443,169 443,169 1,664,511 1,664,511

239
Truly Everybody’s Bank
Bank Group
As at 31 December 2014
LKR '000
2013
LKR '000
2014
LKR '000
2013
LKR '000
27.3 Movement in provision for impairment on
unquoted investments
Balance as at 1 January 1,792,355 1,792,355 1,814,136 1,806,128
Provision made / (reversal) during the year (1,788,000) - (1,788,000) (8,008)
Balance as at 31 December 4,355 1,792,355 26,136 1,814,136
28 Financial investments - Held to maturity
28.1 Government securities
Treasury bills 19,059,875 21,915,732 19,157,253 22,303,978
Treasury bonds 197,457,563 134,984,029 197,512,789 135,036,637
216,517,438 156,899,761 216,670,042 157,340,615
28.2 Debt securities - - 70,090 100,957
- - 70,090 100,957
Total financial investments - Held to maturity 216,517,438 156,899,761 216,740,132 157,441,572
The Bank has pledged treasury bonds held to maturity of LKR 57,873.5 million as collateral as at 31 December 2014
(2013 : LKR 44,792.1 million).
29 Investment in subsidiary companies
Bank
As at 31 December 2014
LKR '000
2013
LKR '000
Investment in quoted subsidiaries [Note 29.3] 2,982,905 2,898,556
Investment in unquoted subsidiaries [Note 29.4] 3,930,143 3,930,143
Total investment in subsidiaries 6,913,048 6,828,699
Provision for impairment of investment in subsidiaries
[Note 29.2] (700,000) -
Carrying value of investment in subsidiary companies 6,213,048 6,828,699
29.1 Movement in investment in subsidiary companies
Balance as at 1 January 6,828,699 6,792,848
Increase in investment 84,349 35,851
Balance as at 31 December 6,913,048 6,828,699
29.2 Movement in provision for impairment of investment in
subsidiaries
Balance as at 1 January - -
Impairment charge during the year 700,000 -
Balance as at 31 December 700,000 -

240
BANK OF CEYLON . Annual Report 2014
Notes to the Financial Statements
29 Investment in subsidiary companies (Contd.)
As at 31 December 2014 2013
Cost
LKR ‘000
Market value/
Directors’
valuation
LKR ‘000
Cost
LKR ‘000
Market value/
Directors’
valuation
LKR ‘000
29.3 Investment in quoted subsidiaries
Property Development PLC 860,270 6,085,835 775,921 4,098,624
(63,064,957 Ordinary shares )
Merchant Bank of Sri Lanka & Finance PLC 2,122,635 1,704,362 2,122,635 1,324,533
(97,392,136 Ordinary shares )
Total investment in quoted subsidiaries 2,982,905 7,790,197 2,898,556 5,423,157
29.4 Investment in unquoted subsidiaries
BOC Management & Support Services (Private)
Limited 1,000 1,000 1,000 1,000
(100,000 Ordinary shares)
BOC Property Development & Management
(Private) Limited 1,010,000 1,010,000 1,010,000 1,010,000
(100,999,998 Ordinary shares)
BOC Travels (Private) Limited 2,500 2,500 2,500 2,500
( 250,004 Ordinary shares )
Bank of Ceylon (UK) Limited 2,683,859 1,983,859 2,683,859 2,683,859
(15,000,000 Ordinary shares)
Hotels Colombo (1963) Limited 100,737 100,737 100,737 100,737
(10,073,667 Ordinary shares )
MCSL Financial Services Limited 132,047 132,047 132,047 132,047
(61,499,807 Ordinary shares )
Total investment in unquoted subsidiaries 3,930,143 3,230,143 3,930,143 3,930,143

241
Truly Everybody’s Bank
Ownership interest %
held by the Bank
Place of business 2014 2013
29.5 Information relating to subsidiaries of the Bank
Property Development PLC (PDL) Colombo, Sri Lanka 95.55 94.09
Merchant Bank of Sri Lanka & Finance PLC (MBSL) ** Colombo, Sri Lanka 72.14 72.14
BOC Management & Support Services (Private) Limited (MSS) Colombo, Sri Lanka 100.00 100.00
BOC Property Development & Management (Private) Limited (PDML) Colombo, Sri Lanka 100.00 100.00
BOC Travels (Private) Limited (TRAVELS) Colombo, Sri Lanka 100.00 100.00
Hotels Colombo (1963) Limited (HCL) Colombo, Sri Lanka 99.99 99.99
MCSL Financial Services Limited (MCSL) ** Colombo, Sri Lanka 80.09 80.09
Ceybank Holiday Homes (Private) Limited (HH) * Colombo, Sri Lanka 100.00 100.00
MBSL Insurance Company Limited (MBSL INS) * Colombo, Sri Lanka 60.68 56.34
MBSL Savings Bank Limited (MBSL SAV) * & ** Colombo, Sri Lanka 54.25 54.25
Koladeniya Hydropower (Private) Limited (KHP) * Colombo, Sri Lanka 95.55 94.09
Bank of Ceylon (UK) Limited (UK) London, United Kingdom 100.00 100.00
* Ceybank Holiday Homes (Private) Limited, MBSL Insurance Company Limited, MBSL Savings Bank Limited and Koladeniya
Hydropower (Private) Limited are indirect subsidiaries of Bank of Ceylon.
** MCSL Financial Services Limited and MBSL Savings Bank Limited have been amalgamated with Merchant Bank of Sri Lanka &
Finance PLC (formally known as Merchant Bank of Sri Lanka PLC) with effect from 1 January 2015 and will operate as a finance
company registered under the Finance Business Act No. 42 of 2011.
2014
PDL MBSL MCSL MBSL INS MBSL SAV KHP
29.6 Material Non Controlling Interest (NCI) of subsidiaries
Equity interest % held by the NCI 4.45 27.86 19.91 39.32 45.75 4.45
Profit / (Loss) allocated during the year (LKR’000) 16,427 67,665 (45,505) (37,425) (20,585) 1,688
Accumulated balance of NCI as at 31 December (LKR’000) 153,018 836,539 118,139 175,616 (8,024) 14,258
Dividends paid to NCI (LKR’000) 11,431 18,806 - - - -
2013
PDL MBSL MCSL MBSL INS MBSL SAV KHP
Equity interest % held by the NCI 5.91 27.86 19.91 43.66 45.75 5.91
Profit / (Loss) allocated during the year (LKR’000) 23,214 32,580 9,867 (48,596) (48,684) 2,105
Accumulated balance of NCI as at 31 December (LKR’000) 183,720 774,752 163,529 174,154 11,402 16,699
Dividends paid to NCI (LKR’000) 10,724 18,806 1,421 - - -

242
BANK OF CEYLON . Annual Report 2014
Notes to the Financial Statements
29 Investment in subsidiary companies (Contd.)
29.7 Summarized financial information of subsidiaries with material non controlling interest
2014
PDL
LKR ‘000
MBSL
LKR ‘000
MCSL
LKR ‘000
MBSL INS
LKR ‘000
MBSL SAV
LKR ‘000
KHP
LKR ‘000
Income Statement
Total income 742,461 2,539,186 1,774,636 1,431,028 420,822 92,885
Profit/ (Loss) before tax 512,077 326,833 (228,551) (85,720) (44,994) 55,080
Profit / (Loss) after tax 369,148 242,876 (228,551) (85,720) (44,994) 37,923
Other comprehensive income 158,843 46,401 578 (6,344) 2,534 (59)
Total comprehensive income 527,991 289,277 (227,973) (92,064) (42,460) 37,864
Statement of Financial Position
Total assets 3,919,232 15,527,333 9,743,811 1,749,305 2,728,250 349,318
Total liabilities 480,618 12,524,680 9,150,444 1,302,672 2,497,038 28,904
Net assets 3,438,614 3,002,653 593,367 446,633 231,212 320,414
Dividends paid 198,000 67,500 - - - -
Statement of Cash Flows
Operating cash flows 215,264 (1,627,251) 306,476 (132,529) 22,047 60,302
Investing cash flows 10,551 (187,854) (7,448) (11,350) (27,515) 951
Financing cash flows (180,782) 1,459,348 - 199,298 - -
Net increase / (decrease) in cash and
cash equivalents 45,033 (355,757) 299,028 55,419 (5,468) 61,253

243
Truly Everybody’s Bank
2013
PDL
LKR ‘000
MBSL
LKR ‘000
MCSL
LKR ‘000
MBSL INS
LKR ‘000
MBSL SAV
LKR ‘000
KHP
LKR ‘000
Income Statement
Total income 755,066 2,355,366 1,673,560 1,461,135 475,261 82,126
Profit/ (Loss) before tax 536,573 175,882 59,514 (170,791) (103,057) 42,955
Profit / (Loss) after tax 392,786 116,940 49,558 (170,791) (103,057) 35,610
Other comprehensive income 35,619 37,777 3,911 8,104 26,930 (74)
Total comprehensive income 428,405 154,717 53,469 (162,687) (76,127) 35,536
Statement of Financial Position
Total assets 3,575,094 13,268,800 9,510,821 1,629,452 3,151,822 302,115
Total liabilities 466,472 10,487,924 8,689,480 1,290,053 2,878,150 19,565
Net assets 3,108,622 2,780,876 821,341 339,399 273,672 282,550
Dividends paid 181,500 67,500 10,000 - - -
Statement of Cash Flows
Operating cash flows 243,386 (70,420) 110,805 (71,174) (151,836) 61,633
Investing cash flows (107,252) (164,392) 48,003 (69,342) 28,419 (3,663)
Financing cash flows (111,837) 942,145 (10,000) (101,237) 148,750 (52,500)
Net increase / (decrease) in cash and
cash equivalents 24,297 707,333 148,808 (241,753) 25,333 5,470

244
BANK OF CEYLON . Annual Report 2014
Notes to the Financial Statements
30 Investment in associate companies
30.1 Unquoted associates
Bank Group
As at 31 December 2014 2013 2014 2013
Cost
LKR ‘000
Directors’
valuation
LKR ‘000
Cost
LKR ‘000
Directors’
valuation
LKR ‘000
Equit
value
LKR ‘000
Directors’
valuation
LKR ‘000
Equity
value
LKR ‘000
Directors’
valuation
LKR ‘000
Ceybank Asset Management Limited 31,048 31,048 31,048 31,048 173,919 173,919 139,679 139,679
(1,240,002 ordinary shares )
Lanka Securities (Private) Limited 41,940 41,940 41,940 41,940 133,279 133,279 130,375 130,375
(3,495,000 Ordinary shares )
Mireka Capital Land (Private) Limited 750,000 750,000 750,000 750,000 1,507,515 1,507,515 1,147,342 1,147,342
(75,000,000 ordinary shares )
Southern Development Financial
Company Limited 25,000 - 25,000 - - - 4,221 4,221
(2,500,001 ordinary shares)
Transnational Lanka Records Solutions
(Private) Limited 20,000 20,000 20,000 20,000 55,322 55,322 49,650 49,650
(2,000,000 ordinary shares )
Total investment in unquoted associates 867,988 842,988 867,988 842,988 1,870,035 1,870,035 1,471,267 1,471,267
Provision for impairment of investment in
associates (25,000) - (25,000) - - - - -
Net investment in unquoted associates 842,988 842,988 842,988 842,988 1,870,035 1,870,035 1,471,267 1,471,267
Bank Group
Cost Equity value
2014
LKR '000
2013
LKR '000
2014
LKR '000
2013
LKR '000
30.2 Movement in investment in associate companies
Balance as at 1 January 867,988 867,988 1,471,267 1,268,995
Share of profit/(loss) before tax - - 462,436 228,813
Share of tax - - (10,764) (11,408)
Share of other comprehensive income - - 5,586 5,543
Dividends - - (51,232) (22,520)
Other adjustments - - (7,258) 1,844
Balance as at 31 December 867,988 867,988 1,870,035 1,471,267

245
Truly Everybody’s Bank
Bank Group
2014
LKR '000
2013
LKR '000
2014
LKR '000
2013
LKR '000
30.3 Movement in provision for impairment of
investment in associate companies
Balance as at 1 January 25,000 25,000 - -
Amount provided during the year - - - -
Balance as at 31 December 25,000 25,000 - -
Carrying value of investment in associate companies 842,988 842,988 1,870,035 1,471,267
30.4 Share holding structure of associate companies of the Bank
Equity interest % Shareholding structure
Name of the company Place of business 2014 2013 Name Holding %
Ceybank Asset Management
Limited (CAML)
Colombo, Sri Lanka 43.36 43.36 Bank of Ceylon 43.36
Sri Lanka Insurance Corporation 26.57
Administrator to the Unit Trust of India 17.48
Carson Cumberbatch PLC 12.59
Lanka Securities (Private)
Limited (LSL)
Colombo, Sri Lanka 40.92 40.92 First Capital Securities Corporation Limited 51.00
Merchant Bank of Sri Lanka & Finance PLC 29.00
Bank of Ceylon 20.00
(Bank of Ceylon total holding 40.92%)
Mireka Capital Land
(Private) Limited (MCL)
Colombo, Sri Lanka 40.00 40.00 Overseas Realty Ceylon PLC
Bank of Ceylon
60.00
40.00
Southern Development
Financial Company
Limited (SDFC)*
Matara, Sri Lanka 41.67 41.67 Bank of Ceylon 41.67
People's Bank 41.67
Southern Development Authority of
Sri Lanka
16.66
Transnational Lanka Records
Solutions (Private)
Limited (TLRS)
Colombo, Sri Lanka 24.69 24.69 Transnational (Pte) Ltd - Singapore 62.96
Bank of Ceylon 24.69
Seylan Bank PLC 12.35
* A provision of LKR 25 million, which is also the Bank’s investment in SDFC was made in view of the continuous losses incurred by the
company.
The Board of Directors of Bank of Ceylon has granted approval for the writing off of the investment of LKR 25 million of SDFC subject to
obtaining a written consent of the Minister in charge. The Ministry of Finance and Planing approval for the above decision is pending.

246
BANK OF CEYLON . Annual Report 2014
Notes to the Financial Statements
30 Investment in associate companies (Contd.)
30.5 Summarized financial information of associates
2014
LSL
LKR '000
CAML
LKR '000
TLRS
LKR '000
MCL
LKR '000
Income Statement
Total income 184,405 190,367 92,176 4,367,019
Profit/ (Loss) before tax 59,339 102,814 56,721 949,122
Profit / (Loss) after tax 52,237 87,482 54,890 947,227
Other comprehensive income (3,200) 15,827 - 81
Total comprehensive income 49,037 103,309 54,890 947,308
Statement of Financial Position
Current assets 483,946 405,251 16,033 4,029,305
Total assets 501,450 498,407 396,669 5,249,133
Current liabilities 151,367 76,660 26,262 1,476,012
Total liabilities 175,746 97,302 172,595 1,480,347
Net assets 325,704 401,105 224,074 3,768,786
Total dividends paid 21,844 17,160 31,914 46,875
Dividends received to the Bank (net) 15,445 6,737 7,745 16,875
2013
LSL
LKR '000
CAML
LKR ‘000
TLRS
LKR '000
MCL
LKR '000
SDFC
LKR ‘000
Income Statement
Total income 72,815 152,575 57,337 3,234,419 4,076
Profit/ (Loss) before tax (39,623) 69,390 33,743 516,000 499
Profit / (Loss) after tax (49,031) 56,785 33,369 510,999 499
Other comprehensive income 1,336 4,025 - - 7,802
Total comprehensive income (47,695) 60,810 33,369 510,999 8,301
Statement of Financial Position
Current assets 450,133 311,758 14,666 7,073,834 25,834
Total assets 477,862 379,018 256,331 7,093,993 30,408
Current liabilities 131,264 36,927 36,927 4,225,639 916
Total liabilities 159,255 56,879 55,232 4,225,639 20,278
Net assets 318,607 322,139 201,099 2,868,354 10,130
Total dividends paid - 14,300 66,100 - -
Dividends received to the Bank (net) - 5,733 15,498 - -

247
Truly Everybody’s Bank
31 Investment properties
Group
2014
LKR '000
2013
LKR '000
Cost
Balance as at 1 January 165,876 158,146
Additions during the year - 7,730
Balance as at 31 December 165,876 165,876
Less : Accumulated depreciation
Balance as at 1 January 13,962 11,099
Charge for the year 3,038 2,863
Balance as at 31 December 17,000 13,962
Net investment properties 148,876 151,914
Investment properties were not held by the Bank for the current year and for the previous year.
Rental income earned from investment properties of the Group was LKR 14.4 million in 2014 (2013 : LKR 16.6 million).

248
BANK OF CEYLON . Annual Report 2014
Notes to the Financial Statements
Note :
* The fair value of the investment properties as at 31 December 2014 was based on market valuations carried out in the year 2010,
2011 and 2013 by Mr D N Dhammika Baranage [RICS (UK), DIV AIS (SL)] and Mr H A W Perera [B Sc Estate Management and
Valuation (Special)] and Mr Samantha Kumara Madawan Arachchi [B Sc Estate Management and Valuation (Special), City Planning
(JP), Dip(UPM)NI, AIREV], who are independent valuers not connected with the company. The directors have reviewed values of the
investment properties as at 31 December 2014 and concluded that there was no impairment.
** Professional valuation has been carried out by Mr A G Gunarathna [B Sc Estate Management and Valuation- (Sri Lanka)] on
31 December 2014.
31.2 Fair value of investment properties
The company uses unobservable market inputs in determining the fair value of the investment properties (i.e. falling under
Level 3 of the fair value hierarchy)
The significant assumptions used by the valuer are as follows:
Valuation technique Significant unobservable inputs
Investment method - Estimated rental value per sq. ft.
- Growth in future rentals
- Anticipated maintenance cost
- Discount rate
Market approach - Current depreciated value of the building
31.1 Investment properties held by the Group
As at 31 December 2014 2013
Cost
Building
(sq.ft)
Extent
of land
(Perches)
Land
LKR ‘000
Building
LKR ‘000
Total
LKR ‘000
Fair value
Total
LKR ‘000
Cost
Total
LKR ‘000
Fair value
Total
LKR ‘000
No. 64 and 66, Nonagama Road,
Pallegama, Embilipitiya. * - 16.61 1,750 - 1,750 13,000 1,750 13,000
No. 300/8, Thalawathugoda Road,
Madiwela, Kotte. * 2,000 16.15 2,465 2,635 5,100 14,727 5,100 14,727
No. 385/1, Kotte Road, Pittakotte. * 2,896 19.01 2,958 1,730 4,688 5,298 4,688 5,298
No. 116/4,116/7,116/25,116/26,
116/27,116/29
1st Cross Street, Colombo 01. * - 12.35 1,249 - 1,249 2,602 1,249 2,602
No. 43,45,49,51 and 53,
New Olcott Mawatha, Colombo 11. * - 7.50 9,950 - 9,950 75,000 9,950 75,000
No. 102 & 104, Dam Street, Colombo 12. * 20,368 50.70 17,970 11,989 29,959 233,000 29,959 233,000
Kumbuththukuliya watte,
Bangadeniya Road, Puttalam. * - 80.00 600 - 600 3,400 600 3,400
Mirissawelawatta hena;
Thekkawatta, Dambadeniya * - 188.00 162 - 162 600 162 600
No. 50/21, Old Kesbawa Road,
Raththanapitiya, Boralesgamuwa. ** 44,877 364.35 65,604 44,396 110,000 297,000 110,000 298,015
No. 64, Gabadawa Estate, Pitipana,
Homagama * - 20.80 1,427 - 1,427 2,900 1,427 2,900
No. 2, Plan No. 1206, Silverberst
Estate, Pitipana, Homagama * - 107.00 991 - 991 2,014 991 2,014
Total 105,126 60,750 165,876 649,541 165,876 650,556

249
Truly Everybody’s Bank
32 Property, plant and equipment
Freehold
land
LKR ‘000
Freehold
building
LKR ‘000
Buildings
on
leasehold
land
LKR ‘000
Equipment
[Note
32.12.1]
LKR ‘000
Motor
vehicles
LKR ‘000
Leasehold
motor
vehicles
LKR ‘000
Capital
work in
progress
LKR ‘000
2014
Total
LKR ‘000
2013
Total
LKR ‘000
32.1 Bank
Cost or valuation
As at 1 January 5,790,472 2,458,029 1,345,956 8,815,160 968,161 50,377 130,516 19,558,671 18,210,197
Additions during the year
Acquisitions 25,633 36,214 8,509 1,241,355 53,309 - 350,834 1,715,854 1,682,211
Capitalizations - 180,574 - 17,523 - - (198,097) - -
Revaluation during the year
Revaluation surplus 2,853,249 704,251 - - - - - 3,557,500 -
Impairment to profit /loss (6,633) (57,377) - - - - - (64,010) -
Transfer of accumulated
depreciation on asset
revaluation - (275,937) - - - - - (275,937) -
Disposals during the year - - - (107,596) (29,532) - (4,952) (142,080) (293,407)
Exchange rate adjustments - - - (1,654) (77) - - (1,731) (6,319)
Transfers/ adjustments 1,232 40,496 (42,999) (306) - - - (1,577) (34,011)
8,663,953 3,086,250 1,311,466 9,964,482 991,861 50,377 278,301 24,346,690 19,558,671
Accumulated depreciation
As at 1 January - 196,831 420,925 6,305,530 582,018 47,187 - 7,552,491 6,779,370
Charge for the year - 73,595 82,697 724,501 135,332 3,190 - 1,019,315 977,446
Transfer of accumulated
depreciation on assets
revaluation - (275,937) - - - - - (275,937) -
Disposals during the year - - - (105,178) (28,748) - - (133,926) (200,727)
Exchange rate adjustments - - - (3,539) (47) - - (3,586) (3,598)
Transfers/ adjustments - 5,511 (5,511) - - - - - -
- - 498,111 6,921,314 688,555 50,377 - 8,158,357 7,552,491
Net book value as at
31 December 2014 8,663,953 3,086,250 813,355 3,043,168 303,306 - 278,301 16,188,333
Net book value as at
31 December 2013 5,790,472 2,261,198 925,031 2,509,630 386,143 3,190 130,516 12,006,180

250
BANK OF CEYLON . Annual Report 2014
Notes to the Financial Statements
32 Property, plant and equipment (Contd.)
Freehold
land
LKR ‘000
Freehold
building
LKR ‘000
Buildings
on
leasehold
land
LKR ‘000
Equipment
[Note
32.12.1]
LKR ‘000
Motor
vehicles
LKR ‘000
Leasehold
motor
vehicles
LKR ‘000
Capital
work in
progress
LKR ‘000
2014
Total
LKR ‘000
2013
Total
LKR ‘000
32.2 Group
Cost or valuation
As at 1 January 6,113,433 4,764,073 7,703,608 9,966,227 1,053,241 66,941 130,517 29,798,040 27,024,922
Additions during the year
Acquisitions 25,633 88,598 30,073 1,299,137 74,689 - 350,834 1,868,964 1,812,813
Capitalizations - 180,574 - 17,523 - - (198,097) - -
Revaluation during the year
Revaluation surplus 2,853,249 847,344 975,561 - - - - 4,676,154 1,737,252
Impairment to profit /loss (6,633) (57,377) - - - - - (64,010) -
Transfer of accumulated
depreciation on assets
revaluation - (327,552) (635,091) - - - - (962,643) (488,755)
Disposals during the year - (2,452) - (161,389) (36,509) - (4,952) (205,302) (331,853)
Exchange rate adjustments (16,108) (16,664) - (3,241) (77) - - (36,090) 26,938
Transfers/ adjustments 1,232 25,895 (42,999) 14,295 - - - (1,577) 16,723
As at 31 December 8,970,806 5,502,439 8,031,152 11,132,552 1,091,344 66,941 278,302 35,073,536 29,798,040
Accumulated depreciation
As at 1 January - 563,455 1,078,611 6,854,717 624,612 54,484 - 9,175,879 8,587,059
Charge for the year - 129,659 313,137 814,239 148,101 6,232 - 1,411,368 1,324,320
Transfer of accumulated
depreciation on assets
revaluation - (327,552) (635,091) - - - - (962,643) (505,493)
Disposals during the year - (2,144) - (158,393) (31,866) - - (192,403) (228,583)
Exchange rate adjustments - (41) - (4,593) (47) - - (4,681) (1,483)
Transfers/ adjustments - 335 (5,510) 5,175 - - - - 59
As at 31 December - 363,712 751,147 7,511,145 740,800 60,716 - 9,427,520 9,175,879
Net book value as at
31 December 2014 8,970,806 5,138,727 7,280,005 3,621,407 350,544 6,225 278,302 25,646,016 -
Net book value as at
31 December 2013 6,113,433 4,200,618 6,624,997 3,111,510 428,629 12,457 130,517 - 20,622,161
32.3 Title restriction on property, plant and equipment
There were no restrictions that existed in the title of the property, plant and equipment of the Bank and the Group as at the reporting
date.
32.4 Property, plant and equipment pledged as security for liabilities
No freehold property, plant and equipment have been pledged as security for any liability.

251
Truly Everybody’s Bank
32.5 Compensation from third parties for items of property, plant and equipment
There were no compensation received / receivable from third parties for items of property, plant and equipment which were impaired or
given up.
32.6 Fully depreciated property, plant and equipment
The initial cost of fully depreciated property, plant and equipment which are still in use as are as follows ;
Bank Group
As at 31 December 2014
LKR '000
2013
LKR '000
2014
LKR '000
2013
LKR '000
Motor vehicles 547,205 389,929 547,687 391,634
Computer equipments 2,847,124 2,783,091 2,866,185 2,824,048
Equipment, furniture and fittings 840,822 687,665 918,881 763,960
Buildings on leasehold lands 139,578 106,721 139,578 106,721
Plant and machinery 789,087 657,064 789,087 657,064
5,163,816 4,624,470 5,261,418 4,743,427
32.7 Temporarily idle property, plant and equipment
There were no temporarily idle property, plant and equipment as at the reporting date.
32.8 Property, plant and equipment retired from active use
The Bank held no property, plant and equipment retired from active use and which were not classified as held for sale in accordance
with SLFRS 5 -” Non-current assets held for sale and discontinued operations”.
32.9 Freehold properties (revalued freehold properties)
The carrying value of the freehold revalued properties, if they were carried at cost less accumulated depreciation would be as follows :
As at 31 December 2014 2013
Cost
Accumulated
depreciation Net book value Cost
Accumulated
depreciation Net book value
LKR '000 LKR '000 LKR '000 LKR '000 LKR '000 LKR '000
32.9.1 Bank
Land 269,654 - 269,654 244,021 - 244,021
Building 1,004,223 (454,788) 549,435 968,009 (429,683) 538,326
1,273,877 (454,788) 819,089 1,212,030 (429,683) 782,347
32.9.2 Group
Land 279,615 - 279,615 253,982 - 253,982
Building 2,034,813 (847,063) 1,187,750 1,946,215 (820,648) 1,125,567
2,314,428 (847,063) 1,467,365 2,200,197 (820,648) 1,379,549

252
BANK OF CEYLON . Annual Report 2014
Notes to the Financial Statements
32 Property, plant and equipment (Contd.)
32.10 Revaluation of leasehold / freehold properties - Group
The following buildings on leasehold / freehold lands of the subsidiaries were revalued during the year by professionally qualified
independent valuers.
Leasehold properties
2014
Details of properties Valuer
Basis of
valuation
Carrying
value
LKR ‘000
Revalued amount
of building
LKR ‘000
Surplus/
(Loss) of building
LKR ‘000
Property Development PLC
Bank of Ceylon Head Office Building
“BOC Square”, Colombo 01
(Revalued as at 31 December 2014)
M/s P B Kalugalagedara
& Associates
Investment
method
5,045,433 6,015,937 970,504
BOC Property Development &
Management (Private) Limited
Bank of Ceylon - Ceybank house
No. 86, Sri Dalada Veediya, Kandy
(Revalued as at 31 December 2014)
M/s P B Kalugalagedara
& Associates
Market value
method
445,441 450,498 5,057
Freehold properties
2014
Details of properties Valuer
Basis of
valuation
Carrying
value
Revalued amount
of building
LKR ‘000
Surplus/
(Loss) of building
LKR ‘000
BOC Property Development &
Management (Private) Limited
Bank of Ceylon - Merchant Tower
St. Micheal’s Road, Kollupitiya
(Revalued as at 31 December 2014)
M/s P B Kalugalagedara
& Associates
Investment
method
1,554,907 1,698,000 143,093

253
Truly Everybody’s Bank
32.11 Unobservable inputs considered in measuring fair value
The following table depicts information about significant unobservable inputs used in measuring fair value of the assets categorized
under Level 3 of the fair value hierarchy.
32.11.1 Bank
2014
Type of asset
Fair value as at
31.12.2014
LKR ‘000
Valuation
technique
Significant
unobservable
inputs
Range of
estimates for
unobservable
inputs
Sensitivity of fair value to
unobservable inputs
Freehold land 8,663,953 Market comparable
method
Estimated cost per
perch
LKR 17,500 -
LKR 10,000,000
Positively correlated
sensitivity
Freehold buildings 3,086,251 Market comparable
method
Rental value basis
Estimated cost per
square feet
Estimated rental
value per square feet
Expected market
rental growth
Discount rate
LKR 1,000 -
LKR 10,000
LKR 38 -
LKR 150
0%
3.33% - 5.55%
Positively correlated
sensitivity
Positively correlated
sensitivity
Positively correlated
sensitivity
Negatively correlated
sensitivity
32.11.2 Group
2014
Type of asset
Fair value as at
31.12.2014
LKR ‘000
Valuation
technique
Significant
unobservable
inputs
Range of estimates
for unobservable
inputs
Sensitivity of fair value
to unobservable inputs
Freehold land 8,970,807 Market comparable
method
Estimated cost per
perch
LKR 17,500 -
LKR 10,000,000
Positively correlated
sensitivity
Freehold buildings 5,138,727 Market comparable
method
Rental value basis
Investment method
Estimated cost per
square feet
Estimated rental
value per square feet
Expected market
rental growth
Discount rate
Discount rate
LKR 1,000 -
LKR 10,000
LKR 38 -
LKR 150
5%
3.3% - 5.5%
3.3% - 5.5%
Positively correlated
sensitivity
Positively correlated
sensitivity
Positively correlated
sensitivity
Negatively correlated
sensitivity
Negatively correlated
sensitivity

254
BANK OF CEYLON . Annual Report 2014
Notes to the Financial Statements
32 Property, plant and equipment (Contd.)
32.12 Equipment
Computer
equipment
LKR '000
Furniture
and
fittings
LKR '000
Office
equipment
LKR '000
2014
Total
LKR '000
2013
Total
LKR '000
32.12.1 Bank
Cost
Balance as at 1 January 4,411,570 2,393,508 2,010,082 8,815,160 8,034,015
Additions during the year
Acquisitions 758,472 328,786 154,097 1,241,355 974,750
Capitalizations 2,656 14,867 - 17,523 -
Disposals during the year (61,985) (23,335) (22,276) (107,596) (186,928)
Exchange rate adjustments (1,515) (41) (98) (1,654) (5,945)
Adjustments / Transfers - (196) (110) (306) (732)
Balance as at 31 December 5,109,198 2,713,589 2,141,695 9,964,482 8,815,160
Accumulated depreciation
Balance as at 1 January 3,604,745 1,453,455 1,247,330 6,305,530 5,799,523
Charge for the year 332,714 225,151 166,636 724,501 694,623
Disposals during the year (61,399) (22,318) (21,461) (105,178) (185,326)
Exchange rate adjustments (3,175) (354) (10) (3,539) (3,290)
Balance as at 31 December 3,872,885 1,655,934 1,392,495 6,921,314 6,305,530
Net book value as at
31 December 2014 1,236,313 1,057,655 749,200 3,043,168 -
Net book value as at
31 December 2013 806,825 940,053 762,752 - 2,509,630

255
Truly Everybody’s Bank
Computer
equipment
LKR '000
Furniture
and
fittings
LKR '000
Office
equipment
LKR '000
Power
Plant
LKR '000
2014
Total
LKR '000
2013
Total
LKR '000
32.12.2 Group
Cost
Balance as at 1 January 4,739,114 2,830,285 2,097,829 298,999 9,966,227 9,092,202
Additions during the year
Acquisitions 771,158 366,616 161,315 48 1,299,137 1,075,599
Capitalizations 2,656 14,867 - - 17,523 4,882
Disposals during the year (107,316) (30,277) (23,796) - (161,389) (202,514)
Exchange rate adjustments (1,995) (1,148) (98) - (3,241) (5,099)
Adjustments / Transfers 27 6,015 8,253 - 14,295 1,157
Balance as at 31 December 5,403,644 3,186,358 2,243,503 299,047 11,132,552 9,966,227
Accumulated depreciation
Balance as at 1 January 3,858,902 1,672,469 1,298,794 24,552 6,854,717 6,268,869
Charge for the year 358,441 264,045 176,803 14,950 814,239 786,209
Disposals during the year (106,685) (28,693) (23,010) (5) (158,393) (198,353)
Exchange rate adjustments (3,442) (1,141) (10) - (4,593) (2,756)
Adjustments / Transfers 26 4,027 1,122 - 5,175 748
Balance as at 31 December 4,107,242 1,910,707 1,453,699 39,497 7,511,145 6,854,717
Net book value as at
31 December 2014 1,296,402 1,275,651 789,804 259,550 3,621,407 -
Net book value as at
31 December 2013 880,212 1,157,816 799,035 274,447 - 3,111,510

256
BANK OF CEYLON . Annual Report 2014
Notes to the Financial Statements
32 Property, plant and equipment (Contd.)
Name of premises Extent
(Perches)
Building
(Square feet)
Date of
valuation Valuer Basis of valuation
32.13 Details of revaluation of freehold
properties
Central Province
Galaha Branch 15.00 8,410 30.11.2014 R H Jayawardana Contractor's method
59/37, Deltota Road, Galaha
Gampola Branch 175.00 9,832 30.11.2014 R H Jayawardana Contractor's method
79, Kadugannawa Road, Gampola
Hatton Branch 85.65 8,784 30.11.2012 K T D Tissera Contractor's method
46, Circular Road, Hatton
Hatton Staff Quarters 40.00 5,560 30.11.2012 K T D Tissera Contractor's method
110, Hatton House Road, Hatton
Kandy 2nd City Branch
22, Dalada Veediya, Kandy
42.81 27,081 30.11.2012 A G Gunarathne Depreciated replacement
cost
Maskeliya Branch 42.05 6,402 30.11.2012 K T D Tissera Contractor's method
66, Upcot Road, Maskeliya
Nawalapitiya Branch 21.92 6,150 30.11.2012 T B Balasuriya Market value
106, Gampola Road, Nawalapitiya
Nuwara Eliya Branch 133.50 17,737 30.11.2012 K T D Tissera Contractor's method
43, Lawson Street, Nuwara Eliya
Nuwara Eliya Staff Quarters 96.39 4,646 31.12.2014 K T D Tissera Contractor's method
14,19, Hill Street, Nuwara Eliya
Thalawakele Branch 25.30 7,236 30.11.2014 R H Jayawardana Contractor's method
23,25,29, Hatton Road, Talawakelle
Thalawakele Staff Quarters 160.00 4,898 30.11.2014 R H Jayawardana Contractor's method
Talawakele Estate Plantation
Nuwara Eliya Property 67.54 3,820 31.12.2014 K T D Tissera Contractor's method
12, Hill Street, Nuwara Eliya
Eastern Province
Batticaloa Branch 65.00 6,997 30.11.2014 S Sivaskantha Market value
21 & 21 1/1 Govington Road, Batticaloa
Mutur Branch 71.00 11,847 30.11.2014 P P T Mohideen Market value
Main street, Mutur
Potuvil Branch 10.70 4,977 30.11.2014 S Sivaskantha Market value
Main Street, Pottuvil
Trincomalee Branch 90.00 10,710 30.11.2014 P P T Mohideen Investment method
88, Inner Harbour Road, Trincomalee
Trincomalee City Branch 21.90 2,670 30.11.2014 P P T Mohideen Market value
09, Main Street, Trincomalee
Valachchenai Branch 47.34 6,391 30.11.2014 P P T Mohideen Market value
Main Street, Valachchenai

257
Truly Everybody’s Bank
Carrying value of
land
Revalued amount
of land
Surplus/(Loss) of
land
Carrying value of
buildings
Revalued amount
of buildings
Surplus/(Loss) of
buildings
Total revaluation
surplus/(loss)
LKR ‘000 LKR ‘000 LKR ‘000 LKR ‘000 LKR ‘000 LKR ‘000 LKR ‘000
1,991 15,000 13,009 6,268 17,661 11,393 24,402
74,836 180,675 105,839 15,259 15,806 547 106,386
86,667 120,000 33,333 12,000 20,000 8,000 41,333
33,962 48,000 14,038 9,934 12,000 2,066 16,104
182,170 214,000 31,830 14,977 16,000 1,023 32,853
24,659 31,000 6,341 9,307 13,000 3,693 10,034
13,000 14,000 1,000 9,600 14,000 4,400 5,400
309,867 460,000 150,133 37,038 40,000 2,962 153,095
33,778 56,000 22,222 3,733 3,000 (733) 21,489
12,454 29,920 17,466 5,079 14,305 9,226 26,692
7,747 9,600 1,853 10,128 12,240 2,112 3,965
58,712 55,000 (3,712) 19,185 25,000 5,815 2,103
839,843 1,233,195 393,352 152,508 203,012 50,504 443,856
19,209 26,000 6,791 11,417 16,000 4,583 11,374
4,626 8,000 3,374 238 25,200 24,962 28,336
4,722 10,750 6,028 13,377 15,750 2,373 8,401
34,450 49,500 15,050 11,492 22,180 10,688 25,738
28,209 24,000 (4,209) 868 4,800 3,932 (277)
19,953 28,400 8,447 10,440 19,000 8,560 17,007
111,169 146,650 35,481 47,832 102,930 55,098 90,579

258
BANK OF CEYLON . Annual Report 2014
Name of premises Extent
(Perches)
Building
(Square feet)
Date of
valuation Valuer Basis of valuation
32.13 Details of revaluation of freehold
properties (Contd.)
Northern Province
Jaffna Area Office and Branch 166.25 21,393 30.11.2014 S Sivaskantha Market value
56, Stanley Road, Jaffna
Mannar Branch 63.22 5,720 30.11.2014 S Sivaskantha Market value
52, Pallimunai Road, Grand Bazaar,
Mannar
Nelliadi Branch 162.04 7,661 30.11.2014 S Sivaskantha Contractor's method
Thikkam Road, Karaveddy, Nelliady
Karainagar Branch 22.11 2,718 30.11.2014 S Sivaskantha Contractor's method
Post Office View, Karainagar
North Western Province
Alawwa Branch 31.80 7,300 30.11.2014 D C Sosa Market value
64, Giriulla Road, Alawwa
Chilaw Branch
Radaguru Edmund Peiris Mawatha,
Chilaw
37.75 8,304 11.12.2014 G H K
Wickrematilleke
Depreciated replacement
cost
Dummalasooriya Branch
227, Kuliyapitiya - Madampe Road,
Dummalasooriya
41.68 5,611 30.11.2014 Sumedha Hapugoda Contractor's method
North Western Province Office
18, Mihindu Mawatha, Kurunegala
225.00 17,210 30.11.2012 D C Sosa Market value
Kurunegala Super Grade Branch - 12,242 30.11.2014 R H Jayawardana Investment method
Commercial Complex, Kurunegala
Kurunegala 2nd City Branch (bazaar) 49.75 16,677 30.11.2014 R H Jayawardana Contractor's method
34, Colombo Road, Kurunegala
Madampe Branch
10, Station Road, Madampe
114.50 7,032 30.11.2014 Sumedha Hapugoda Contractor's method
Narammala Branch
139, Negombo Road, Narammala
117.50 9,296 30.11.2014 D C Sosa Depreciated replacement
cost
Madurankuliya Branch
No 66 , Colombo Road, Madurankuliya
46.00 5,746 30.11.2014 G H K
Wickrematilleke
Depreciated replacement
cost
Sabaragamuwa Province
Balangoda Branch 14.50 3,516 30.11.2012 A G Gunarathne Investment method
137, Main Street, Balangoda
Dehiowita Branch 38.69 3,819 30.11.2014 H A Jayaratne Market value
62 Main Street, Dehiowita
Kegalle Branch 118.24 15,447 30.11.2014 H A Jayaratne Market value
110, Colombo Road, Kegalle
Ratnapura Branch 99.70 9,808 30.11.2014 W D P Rupananda Contractor's method
6, Dharmapala Mawatha, Ratnapura
Ratnapura Branch (BMC.1/L) 31.69 - 30.11.2014 W D P Rupananda Market value
58, Main Street, Ratnapura
Notes to the Financial Statements
32 Property, plant and equipment (Contd.)

259
Truly Everybody’s Bank
Carrying value of
land
Revalued amount
of land
Surplus/(Loss) of
land
Carrying value of
buildings
Revalued amount
of buildings
Surplus/(Loss) of
buildings
Total revaluation
surplus/(loss)
LKR ‘000 LKR ‘000 LKR ‘000 LKR ‘000 LKR ‘000 LKR ‘000 LKR ‘000
64,749 249,500 184,751 31,412 36,500 5,088 189,839
5,570 9,500 3,930 5,381 7,850 2,469 6,399
16,000 17,750 1,750 63,765 28,750 (35,015) (33,265)
2,848 3,300 452 6,432 5,700 (732) (280)
89,167 280,050 190,883 106,990 78,800 (28,190) 162,693
42,000 32,440 (9,560) 16,969 21,900 4,931 (4,629)
38,750 47,000 8,250 10,429 19,000 8,571 16,821
7,460 23,000 15,540 6,786 12,000 5,214 20,754
126,402 157,500 31,098 18,333 29,975 11,642 42,740
- - - 36,047 69,778 33,731 33,731
102,555 174,125 71,570 20,426 18,616 (1,810) 69,760
11,994 34,900 22,906 9,455 13,100 3,645 26,551
38,437 63,000 24,563 52,781 34,243 (18,538) 6,025
13,200 11,000 (2,200) 30,631 25,000 (5,631) (7,831)
380,798 542,965 162,167 201,857 243,612 41,755 203,922
18,643 21,750 3,107 2,489 1,770 (719) 2,388
3,498 8,000 4,502 1,352 6,000 4,648 9,150
80,250 104,190 23,940 18,964 22,047 3,083 27,023
49,000 69,500 20,500 11,742 7,600 (4,142) 16,358
28,000 58,000 30,000 - - - 30,000
179,391 261,440 82,049 34,547 37,417 2,870 84,919

260
BANK OF CEYLON . Annual Report 2014
Name of premises Extent
(Perches)
Building
(Square feet)
Date of
valuation Valuer Basis of valuation
32.13 Details of revaluation of freehold
properties (Contd.)
Southern Province
Ambalangoda Branch 58.00 5,600 14.12.2012 D P L C De Silva Rental value basis
274, Main Street, Ambalangoda
Ambalantota Branch
11 Wanduruppa Road, Ambalantota
38.00 5,981 30.11.2012 G A Gunawardene Depreciated replacement
cost
Beliatta Branch 53.02 6,200 30.11.2014 Upali Rajapaksa Contractor's method
No.67, Walasmulla Road, Beliatta
Galle Province Office 32.62 13,160 01.01.2015 K T D Tissera Contractor's method
2, Light House Street, Fort, Galle
Galle Branch 31.50 12,600 01.01.2015 K T D Tissera Contractor's method
2, Gamini Road, Galle
Hakmana Branch 36.70 3,490 30.11.2014 Upali Rajapaksa Contractor's method
Beliatta Road, Hakmana
Imaduwa Branch 83.50 3,395 30.11.2014 Upali Rajapaksa Contractor's method
Ahangama Road, Imaduwa
Matara Branch 104.40 15,905 30.11.2014 Upali Rajapaksa Contractor's method
11, Kumaratunga Mawatha, Matara
Matara City Branch 49.25 7,105 30.11.2014 Upali Rajapaksa Contractor's method
Gunawardena Mawatha, Matara
Nagoda Branch, Nagoda 40.00 - 30.11.2014 Upali Rajapaksa Market value
Tangalle Branch
No. 145/147, Sea Street, Tangalle
21.05 5,373 30.11.2014 W D P Rupananda Contractor's method
Weeraketiya Branch 36.89 4,055 30.11.2014 S Sivaskantha Contractor's method
Belliatta Road, Weeraketiya
Weligama Branch
239, Main Street, Weligama
97.75 8,100 30.11.2014 W D P Rupananda Contractor's method
Uva Province
Badulla Uva Province Office 118.75 7,366 30.11.2014 D P L C De Silva Market value
Bank Road, Badulla
Bandarawela Branch 9.52 7,731 30.11.2012 K T D Tissera Contractor's method
230, Badulla Road, Bandarawela
Ettampitiya Branch 20.35 2,560 30.11.2014 D P L C De Silva Market value
No 23, Nuwara Eliya Road, Ettampitiya
Haputale Branch 130.63 5,200 30.11.2014 D P L C De Silva Market value
20, Station Road, Haputale
Monaragala Branch and Manager’s
Quarters and Staff Quarters
160.00 15,000 30.11.2014 D P L C De Silva Market value
401, Wellawaya Road, Moneragala
Notes to the Financial Statements
32 Property, plant and equipment (Contd.)

261
Truly Everybody’s Bank
Carrying value of
land
Revalued amount
of land
Surplus/(Loss) of
land
Carrying value of
buildings
Revalued amount
of buildings
Surplus/(Loss) of
buildings
Total revaluation
surplus/(loss)
LKR ‘000 LKR ‘000 LKR ‘000 LKR ‘000 LKR ‘000 LKR ‘000 LKR ‘000
40,000 49,000 9,000 36,001 15,000 (21,001) (12,001)
8,369 14,000 5,631 9,567 12,000 2,433 8,064
20,383 37,800 17,417 43,932 31,000 (12,932) 4,485
49,000 130,000 81,000 16,192 20,000 3,808 84,808
49,940 155,000 105,060 22,104 20,000 (2,104) 102,956
5,282 28,700 23,418 3,514 8,300 4,786 28,204
12,838 20,000 7,162 2,367 8,000 5,633 12,795
47,220 186,600 139,380 11,447 18,150 6,703 146,083
43,000 114,350 71,350 50,656 34,600 (16,056) 55,294
9,359 9,400 41 - - - 41
12,500 19,000 6,500 37,202 23,000 (14,202) (7,702)
1,231 20,250 19,019 36,212 13,500 (22,712) (3,693)
16,835 44,000 27,165 12,749 24,000 11,251 38,416
315,957 828,100 512,143 281,943 227,550 (54,393) 457,750
15,000 11,750 (3,250) 9,000 9,844 844 (2,406)
17,973 25,000 7,027 15,452 20,000 4,548 11,575
8,216 5,792 (2,424) 7,578 9,721 2,143 (281)
18,577 18,313 (264) 8,430 7,760 (670) (934)
30,018 50,000 19,982 30,600 31,650 1,050 21,032
89,784 110,855 21,071 71,060 78,975 7,915 28,986

262
BANK OF CEYLON . Annual Report 2014
Name of premises Extent
(Perches)
Building
(Square feet)
Date of
valuation Valuer Basis of valuation
32.13 Details of revaluation of freehold
properties (Contd.)
Western Province North
Borella Branch 42.29 19,280 30.11.2012 P P T Mohideen Investment method
71, Danister de Silva Mawatha, Borella
City Office 39.50 24,952 30.11.2012 K T D Tissera Contractor's method
41, Bristol Street, Colombo 1
York Street Branch 170.00 261,610 31.12.2014 K T D Tissera Contractor's method
York Street, Colombo 01
Grand Pass Branch
703, Sirimavo Bandaranayake
Mawatha, Grandpass
20.12 6,210 30.11.2014 A G Gunaratna Cost and income
approaches
Gampaha Branch 34.06 - 30.11.2014 D C Sosa Market value
No.170,Colombo Road, Gampaha
Ja-Ela Branch 40.64 8,090 30.11.2014 D C Sosa Market value
19, Negombo Road, Ja-Ela
Kadawatha Branch 28.86 6,181 30.11.2012 D H W Disanayake Market value
469, Ragama Road, Kadawatha
Negombo Branch 97.25 16,760 30.11.2014 D C Sosa Market value
118, Rajapakse Broadway, Negombo
Pettah Branch 28.29 24,530 22.12.2014 K T D Tissera Contractor's method
212/63, Gas Work Street, Colombo 11
Western Province South
Aluthgama Branch
267, Galle Road, Aluthgama
36.60 7,151 30.11.2012 A G Gunaratna Depreciated replacement
cost
Bambalapitiya Branch - 7,776 30.11.2014 A G Gunaratna Income method
No.10, Unity Plaza Bldg., Galle Road,
Colombo 4
Beruwala Branch 21.50 4,712 30.11.2014 L S K De Silva Market value
No.165A, Galle Road, Beruwala
Dehiwala Branch
207, Galle Road, Dehiwela
22.00 12,422 24.12.2014 R W M S B
Rajapakse
Contractor's method
Horana Branch
87, Anguruwathota Road, Horana
70.00 8,568 30.11.2012 A G Gunaratna Depreciated replacement
cost
Idama Branch
707, Galle Road, Moratuwa
60.00 8,272 22.12.2014 R W M S B
Rajapakse
Contractor's method
Kalutara Area Office 52.65 3,300 30.11.2014 L S K De Silva Market value
108, Old Road, Kalutara
Kalutara Branch
218, Galle Road, Kalutara South, Kalutara
45.86 11,436 30.11.2014 D P L C De Silva Market value
Maharagama Branch and Central
Training Institute
185.10 82,121 30.11.2014 A G Gunaratna Cost and income
approaches
No.88, Highlevel Road, Maharagama
Matugama Branch 9.00 4,400 30.11.2014 D P L C De Silva Market value
No72, Agalawatte Road, Matugama
Nugegoda Branch
174, Highlevel Road, Nugegoda
67.50 53,419 24.12.2014 R W M S B
Rajapakse
Market value
Notes to the Financial Statements
32 Property, plant and equipment (Contd.)

263
Truly Everybody’s Bank
Carrying value of
land
Revalued amount
of land
Surplus/(Loss) of
land
Carrying value of
buildings
Revalued amount
of buildings
Surplus/(Loss) of
buildings
Total revaluation
surplus/(loss)
LKR ‘000 LKR ‘000 LKR ‘000 LKR ‘000 LKR ‘000 LKR ‘000 LKR ‘000
167,899 163,000 (4,899) 43,470 62,000 18,530 13,631
211,000 280,000 69,000 80,100 95,000 14,900 83,900
660,328 1,000,000 339,672 665,778 750,000 84,222 423,894
59,000 70,420 11,420 24,697 21,480 (3,217) 8,203
58,446 102,180 43,734 - - - 43,734
58,594 81,280 22,686 15,473 19,836 4,363 27,049
22,420 24,500 2,080 12,658 14,830 2,172 4,252
103,988 171,160 67,172 31,196 39,950 8,754 75,926
177,978 212,000 34,022 18,499 36,000 17,501 51,523
1,519,653 2,104,540 584,887 891,871 1,039,096 147,225 732,112
23,000 25,620 2,620 34,309 37,800 3,491 6,111
- - - 99,683 171,600 71,917 71,917
28,173 42,800 14,627 10,072 4,200 (5,872) 8,755
71,120 77,500 6,380 25,992 33,500 7,508 13,888
52,478 60,000 7,522 7,006 8,950 1,944 9,466
55,938 135,000 79,062 14,366 9,750 (4,616) 74,446
10,283 34,000 23,717 1,336 3,500 2,164 25,881
66,028 77,630 11,602 9,888 23,194 13,306 24,908
326,692 443,458 116,766 138,836 171,542 32,706 149,472
10,391 27,000 16,609 4,835 14,298 9,463 26,072
229,000 235,000 6,000 96,889 265,000 168,111 174,111

264
BANK OF CEYLON . Annual Report 2014
Name of premises Extent
(Perches)
Building
(Square feet)
Date of
valuation Valuer Basis of valuation
32.13 Details of revaluation of freehold
properties (Contd.)
Panadura Branch 80.00 10,529 30.11.2014 D P L C De Silva Market value
No.4, Super Grade Branch,
Susantha Mawatha, Panadura
Wadduwa Branch 27.70 - 30.11.2014 D P L C De Silva Market value
557A, Galle Road, Wadduwa
Wellawatte Branch 51.25 15,832 30.11.2014 A G Gunaratna Cost approach
149, Galle Road, Colombo 6
Bulathsinhala Branch
09, Bulathsinhala-Horana Road,
Bulathsinhala
53.85 6,304 30.11.2014 S Sivaskantha Contractor's method
Holiday Homes and Rests
Badulla Fernham Bungalow and Property 222.25 4,580 30.11.2012 P P T Mohideen Market value
153, Spring Valley Road, Badulla
Bandarawela Holiday Home 115.00 3,028 30.11.2012 K T D Tissera Contractor's method
Bandarawela
Dickoya Upper Glencarn Bungalow 189.65 8,665 30.11.2012 P P T Mohideen Market value
Dickoya
Dickoya lower Glencarn Bungalow 100.00 5,925 30.11.2012 P P T Mohideen Market value
Dickoya
Haputale Woodland Bungalow 120.00 3,010 30.11.2012 P P T Mohideen Market value
Haputale
Jaffna Bank Rest 166.25 - 30.11.2014 S Sivaskantha Market value
34-34/3, Rasavinthoddam Road, Jaffna
Lindula Ridge Holiday Home 175.00 3,010 30.11.2012 P P T Mohideen Market value
Lindula
Nuwara Eliya Holiday Home 35.27 3,388 31.12.2014 K T D Tissera Contractor's method
16, Hill Street, Nuwara Eliya
Others
General Manager’s Bungalow 79.80 6,380 30.11.2014 A G Gunaratna Cost approach
75, Ananda Kumaraswamy Mawatha,
Colombo 7
Darley Road Stores 151.00 29,946 22.12.2014 K T D Tissera Contractor's method
481, T B Jayah Mawatha, Colombo 10
Walker's & Sons Limited 57.00 - 30.11.2014 P P T Mohideen Market value
28, St. Michael's Road, Colombo 03
World Trade Centre
08, 8-2/1, Bank of Ceylon Mawatha,
Colombo 01
- 6,345 30.11.2014 P P T Mohideen Rental value basis
Total
Notes to the Financial Statements
* Since the building has been condemned, the valuer has not considered the value of the building.
32 Property, plant and equipment (Contd.)

265
Truly Everybody’s Bank
Carrying value of
land
Revalued amount
of land
Surplus/(Loss) of
land
Carrying value of
buildings
Revalued amount
of buildings
Surplus/(Loss) of
buildings
Total revaluation
surplus/(loss)
LKR ‘000 LKR ‘000 LKR ‘000 LKR ‘000 LKR ‘000 LKR ‘000 LKR ‘000
48,447 120,000 71,553 12,173 22,948 10,˙775 82,328
18,850 34,625 15,775 - - - 15,775
184,500 230,625 46,125 36,450 36,962 512 46,637
6,770 29,750 22,980 2,276 11,250 8,974 31,954
1,131,670 1,573,008 441,338 494,111 814,494 320,383 761,721
14,400 20,000 5,600 2,640 * - 5,600
45 8,000 7,955 607 6,000 5,393 13,348
2,571 3,800 1,229 12,960 17,450 4,490 5,719
1,429 2,500 1,071 7,199 14,800 7,601 8,672
8,120 10,800 2,680 3,104 5,900 2,796 5,476
66,224 86,250 20,026 - - - 20,026
1,250 3,000 1,750 3,150 6,800 3,650 5,400
30,116 35,000 4,884 6,198 10,000 3,802 8,686
124,155 169,350 45,195 35,858 60,950 27,732 72,927
315,250 359,100 43,850 3,800 7,975 4,175 48,025
590,000 880,000 290,000 13,500 20,000 6,500 296,500
130,500 174,700 44,200 - - - 44,200
- - - 103,500 168,800 65,300 65,300
1,035,750 1,413,800 378,050 120,800 196,775 75,975 454,025
5,817,337 8,663,953 2,846,616 2,439,377 3,083,611 646,874 3,493,490

266
BANK OF CEYLON . Annual Report 2014
Notes to the Financial Statements
Bank Group
2014
LKR '000
2013
LKR '000
2014
LKR '000
2013
LKR '000
33 Leasehold properties
Cost
Balance as at 1 January 100,712 100,703 166,945 166,936
Additions during the year 27,234 - 27,234 -
Transfers during the year (1,231) - (1,231) -
Capitalized during the year - 9 - 9
Balance as at 31 December 126,715 100,712 192,948 166,945
Accumulated amortization
Balance as at 1 January 17,686 15,727 45,528 42,212
Amortization during the year 1,562 1,959 2,919 3,316
Balance as at 31 December 19,248 17,686 48,447 45,528
Net book value 107,467 83,026 144,501 121,417
Leasehold properties represent the leasehold interest in the lands held for own use. The value of buildings situated in the leasehold land
is shown separately under property, plant and equipment. The interest on leasehold land is stated at cost less accumulated amortization.
Bank Group
2014
LKR '000
2013
LKR '000
2014
LKR '000
2013
LKR '000
34 Intangible assets
Cost
Balance as at 1 January 2,193,067 1,930,207 2,444,545 2,068,778
Additions during the year 63,900 262,860 89,845 372,298
Derecognized during the year (207,189) - (207,189) (310)
Exchange rate adjustment - - (7,150) 3,779
Balance as at 31 December 2,049,778 2,193,067 2,320,051 2,444,545
Accumulated amortization
Balance as at 1 January 1,692,003 1,554,205 1,774,888 1,606,823
Amortization during the year 170,417 137,798 213,528 166,741
Derecognized during the year (197,219) - (197,219) (310)
Exchange rate adjustment - - (2,813) 1,634
Balance as at 31 December 1,665,201 1,692,003 1,788,384 1,774,888
Net book value 384,577 501,064 531,667 669,657
Intangible assets represent the value of computer applications, software and subsequent modifications including costs directly
attributable in customizing for its intended use, and are carried at cost less accumulated amortization and any impairment losses.

267
Truly Everybody’s Bank
34.1 Fully amortized intangible assets
The initial cost of fully amortized intangible assets which are still in use are as follows:
Bank Group
As at 31 December 2014
LKR '000
2013
LKR '000
2014
LKR '000
2013
LKR '000
Computer software 1,204,306 1,384,871 1,204,306 1,384,871
1,204,306 1,384,871 1,204,306 1,384,871
35 Deferred tax (assets) / liabilities
The following table shows deferred tax recorded in the Statement of Financial Position and charge/ (reversal) recorded in the income tax
expense.
2014 2013
Deferred
tax assets
LKR ‘000
Deferred
tax
liabilities
LKR ‘000
Income
Statement
LKR ‘000
OCI /
Equity
LKR ‘000
Deferred
tax assets
LKR ‘000
Deferred
tax
liabilities
LKR ‘000
Income
Statement
LKR ‘000
OCI/
Equity
LKR ‘000
35.1 Bank
Retirement benefits - (558,775) 36,542 (376,290) - (219,027) 67,608 (114,415)
Impairment allowance for loans and
advances - (890,683) - - - (890,683) - -
Revaluation of property, plant and
equipment - 486,706 - 181,125 - 305,581 - (4,481)
Other temporary differences - 2,034,087 1,078,335 - - 955,752 (148,368) -
- 1,071,335 1,114,877 (195,165) - 151,623 (80,760) (118,896)
35.2 Group
Retirement benefits (6,627) (566,631) 71,743 (376,906) (3,967) (264,128) 88,988 (111,824)
Impairment allowance for loans and
advances - (890,683) - - - (890,683) - -
Revaluation of property, plant and
equipment 3,703 2,454,030 - 492,204 (33,816) 1,999,345 - 475,813
Share of undistributed profit of
associates - 95,067 39,612 - - 55,455 55,455 -
Other temporary differences (6009) 2,197,077 1,066,876 - (10,035) 1,134,227 (148,605) -
(8,933) 3,288,860 1,178,231 115,298 (47,818) 2,034,216 (4,162) 363,989

268
BANK OF CEYLON . Annual Report 2014
Notes to the Financial Statements
Bank Group
As at 31 December 2014
LKR '000
2013
LKR '000
2014
LKR '000
2013
LKR '000
36 Other assets
Consumable stock in hand 508,916 378,941 667,016 475,925
Pre paid staff cost 6,758,431 7,586,328 6,761,021 7,588,623
Cheques in transit - Foreign 37,400 78,788 37,400 78,788
Cheques in transit - Local 1,178,953 1,747,372 1,178,953 1,747,372
Tax recoverable 594,397 1,681,305 648,637 1,718,122
Gold bullion and coins in hand 28,580 20,766 28,580 20,766
Gold and silver stock 18,372,267 - 18,372,267 -
Other 18,548,284 28,123,467 19,106,204 28,942,854
Total other assets 46,027,228 39,616,967 46,800,078 40,572,450
37 Due to banks
Call money borrowings - 550,115 - 601,490
Deposits from other banks 339,345 267,624 339,345 267,624
Bank overdrafts 550,531 348,688 609,782 467,153
Total due to banks 889,876 1,166,427 949,127 1,336,267
38 Derivative financial instruments
Forward exchange contracts 734,548 274,948 734,548 274,948
Total derivative financial instruments 734,548 274,948 734,548 274,948
39 Due to customers
39.1 By product
Local currency deposits
Current account deposits 87,398,313 65,933,070 87,145,245 65,743,929
Current account deposits with Islamic banking 340,231 121,480 340,231 121,480
Savings deposits 234,761,158 179,304,839 235,271,986 179,779,726
Savings deposits with Islamic banking 1,591,176 1,460,610 1,591,176 1,460,610
Time deposits 379,759,684 387,972,612 388,469,837 395,417,150
Certificates of deposit 4,315 4,315 15,691 17,822
Other deposits 3,387,893 2,093,399 3,387,940 2,093,448
Total local currency deposits 707,242,770 636,890,325 716,222,106 644,634,165
Foreign currency deposits
Current account deposits 14,748,715 16,462,897 15,111,128 16,868,071
Savings deposits 64,510,392 55,658,778 64,960,644 56,112,521
Savings deposits with Islamic banking 96,618 116,000 96,618 116,000
Time deposits 146,962,493 132,296,839 147,138,786 132,391,603
Other deposits 405,181 645,161 405,181 645,161
Total foreign currency deposits 226,723,399 205,179,675 227,712,357 206,133,356
Total deposits 933,966,169 842,070,000 943,934,463 850,767,521

269
Truly Everybody’s Bank
Bank Group
As at 31 December 2014
LKR '000
2013
LKR '000
2014
LKR '000
2013
LKR '000
39.2 By currency
Sri Lankan Rupee 704,269,427 636,848,749 713,248,764 644,592,589
United States Dollar 166,375,143 144,321,189 166,452,745 144,370,621
Great Britain Pound 28,274,652 27,768,614 29,173,928 28,663,797
Maldevian Rufiyaa 12,957,947 12,527,691 12,957,947 12,527,691
Seychellois Rupee 792,587 - 792,587 -
Euro 9,160,804 9,039,374 9,172,884 9,048,440
Australian Dollar 8,024,573 7,743,147 8,024,573 7,743,147
Indian Rupee 2,781,700 2,488,616 2,781,700 2,488,616
Other 1,329,336 1,332,620 1,329,335 1,332,620
Total deposits 933,966,169 842,070,000 943,934,463 850,767,521
Note : The maturity analysis of deposits is given in Note 54.
Bank Group
As at 31 December 2014
LKR '000
2013
LKR '000
2014
LKR '000
2013
LKR '000
40 Other borrowings
Senior notes 132,513,748 131,768,257 132,513,748 131,768,257
Promissory notes - - - 14,875
Term borrowings from banks abroad 46,249,909 60,392,602 46,626,407 60,707,194
Term borrowings from banks and other financial
institutions in Sri Lanka 12,945,087 6,602,834 18,363,274 12,166,412
Refinance borrowings 3,744,881 4,616,649 3,744,881 4,616,649
Securities sold under repurchase agreements 51,282,837 31,989,927 50,919,847 31,528,724
Total other borrowings 246,736,462 235,370,269 252,168,157 240,802,111
40.1 Maturity of borrowings
Within 12 months 90,448,767 86,636,783 94,511,016 91,894,729
After 12 months 156,287,695 148,733,486 157,657,141 148,907,382
Total other borrowings 246,736,462 235,370,269 252,168,157 240,802,111

270
BANK OF CEYLON . Annual Report 2014
Notes to the Financial Statements
Bank Group
As at 31 December 2014
LKR '000
2013
LKR '000
2014
LKR '000
2013
LKR '000
41 Debt securities issued
41.1 Senior debentures
Listed debentures
Secured , redeemable debentures of LKR100 each - - 284,069 905,513
Unsecured redeemable debentures of LKR100 each - - 5,172,070 3,079,457
Unlisted debentures
Unsecured redeemable debentures of LKR100 each
(private placement) 20,762,198 20,968,357 20,762,198 20,975,376
Secured, redeemable debentures of LKR100 each
(private placement) - - - 26,472
Total debt securities issued 20,762,198 20,968,357 26,218,337 24,986,818
Bank Group
2014
LKR '000
2013
LKR '000
2014
LKR '000
2013
LKR '000
41.2 The movement in senior debentures
Balance as at 1 January 20,968,357 23,296,349 24,986,818 24,481,798
Issued during the year - - 2,000,000 3,000,000
Redemptions - (2,193,155) (656,371) (2,431,780)
Amortization adjustments (206,159) (134,837) (112,110) (63,200)
Balance as at 31 December 20,762,198 20,968,357 26,218,337 24,986,818
41.3 Maturity of senior debentures
Within 12 months 17,362,198 - 17,646,268 656,372
After 12 months 3,400,000 20,968,357 8,572,069 24,330,446
Total debt securities issued 20,762,198 20,968,357 26,218,337 24,986,818
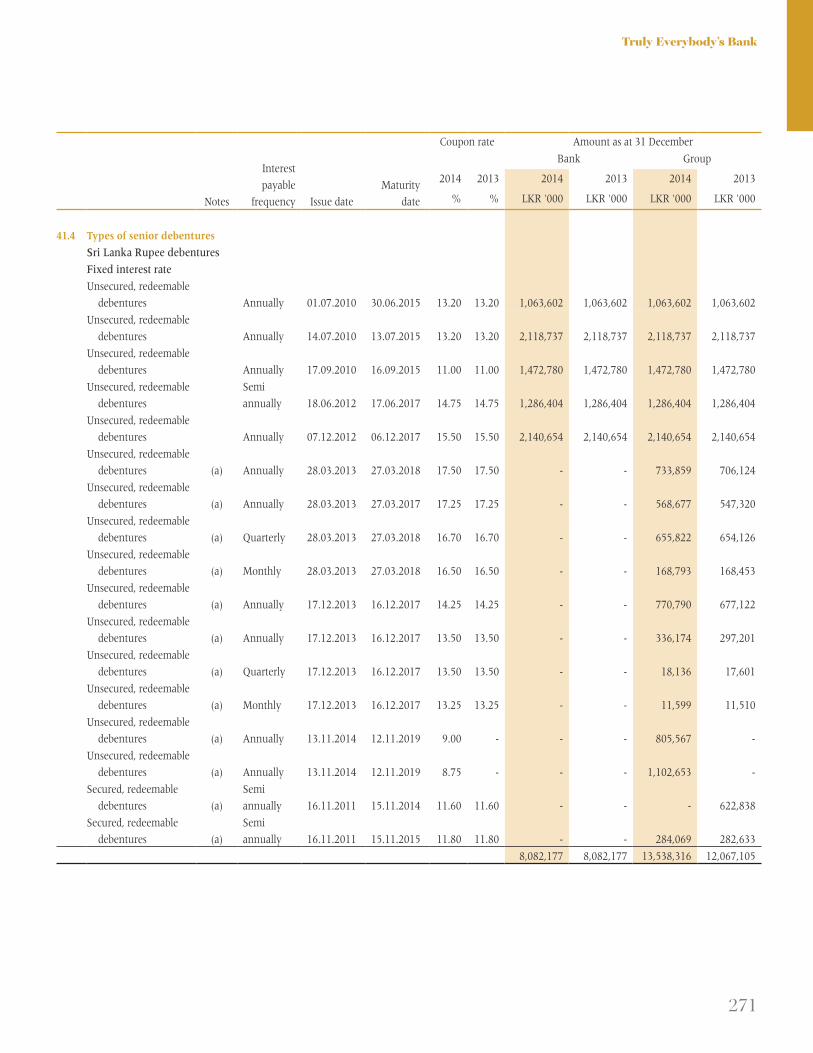
271
Truly Everybody’s Bank
Notes
Interest
payable
frequency Issue date
Maturity
date
Coupon rate Amount as at 31 December
Bank Group
2014 2013 2014 2013 2014 2013
% % LKR '000 LKR '000 LKR '000 LKR '000
41.4 Types of senior debentures
Sri Lanka Rupee debentures
Fixed interest rate
Unsecured, redeemable
debentures Annually 01.07.2010 30.06.2015 13.20 13.20 1,063,602 1,063,602 1,063,602 1,063,602
Unsecured, redeemable
debentures Annually 14.07.2010 13.07.2015 13.20 13.20 2,118,737 2,118,737 2,118,737 2,118,737
Unsecured, redeemable
debentures Annually 17.09.2010 16.09.2015 11.00 11.00 1,472,780 1,472,780 1,472,780 1,472,780
Unsecured, redeemable
debentures
Semi
annually 18.06.2012 17.06.2017 14.75 14.75 1,286,404 1,286,404 1,286,404 1,286,404
Unsecured, redeemable
debentures Annually 07.12.2012 06.12.2017 15.50 15.50 2,140,654 2,140,654 2,140,654 2,140,654
Unsecured, redeemable
debentures (a) Annually 28.03.2013 27.03.2018 17.50 17.50 - - 733,859 706,124
Unsecured, redeemable
debentures (a) Annually 28.03.2013 27.03.2017 17.25 17.25 - - 568,677 547,320
Unsecured, redeemable
debentures (a) Quarterly 28.03.2013 27.03.2018 16.70 16.70 - - 655,822 654,126
Unsecured, redeemable
debentures (a) Monthly 28.03.2013 27.03.2018 16.50 16.50 - - 168,793 168,453
Unsecured, redeemable
debentures (a) Annually 17.12.2013 16.12.2017 14.25 14.25 - - 770,790 677,122
Unsecured, redeemable
debentures (a) Annually 17.12.2013 16.12.2017 13.50 13.50 - - 336,174 297,201
Unsecured, redeemable
debentures (a) Quarterly 17.12.2013 16.12.2017 13.50 13.50 - - 18,136 17,601
Unsecured, redeemable
debentures (a) Monthly 17.12.2013 16.12.2017 13.25 13.25 - - 11,599 11,510
Unsecured, redeemable
debentures (a) Annually 13.11.2014 12.11.2019 9.00 - - - 805,567 -
Unsecured, redeemable
debentures (a) Annually 13.11.2014 12.11.2019 8.75 - - - 1,102,653 -
Secured, redeemable
debentures (a)
Semi
annually 16.11.2011 15.11.2014 11.60 11.60 - - - 622,838
Secured, redeemable
debentures (a)
Semi
annually 16.11.2011 15.11.2015 11.80 11.80 - - 284,069 282,633
8,082,177 8,082,177 13,538,316 12,067,105

272
BANK OF CEYLON . Annual Report 2014
Notes to the Financial Statements
Notes
Interest
payable
frequency Issue date
Maturity
date
Coupon rate Amount as at 31 December
Bank Group
2014 2013 2014 2013 2014 2013
% % LKR '000 LKR '000 LKR '000 LKR '000
41.4 Types of senior debentures (Contd.)
Floating interest rate
Unsecured, redeemable
debentures
(6 months TB rate
(Gross) plus 150
basis points) (b)
Semi
annually 31.03.2010 30.03.2014 - 12.78 - - - 7,019
Unsecured, redeemable,
debentures
(12 months TB rate
(Gross) plus 150
basis points) (c) Annually 03.08.2010 02.08.2015 8.81 13.19 5,382,540 5,470,052 5,382,540 5,470,052
Unsecured, redeemable,
debentures
(12 months TB rate
(Gross) plus 150
basis points) (c) Annually 03.08.2010 02.08.2015 8.81 13.19 1,811,431 1,840,883 1,811,431 1,840,883
Unsecured, redeemable
debentures
(12 months TB rate
(Gross) plus 150
basis points) (c) Annually 03.08.2010 02.08.2015 8.81 13.19 5,486,050 5,575,245 5,486,050 5,575,245
Secured, redeemable
debentures
(6 months TB rate
(Gross) plus 150
basis points) (b)
Semi
annually 10.01.2010 09.01.2014 12.28 12.28 - - - 26,472
Secured, redeemable
debentures
(6 months TB rate
(Gross) plus 160
basis points)
(a)/
(b)
Semi
annually 16.11.2011 15.11.2014 12.47 12.47 - - - 42
12,680,021 12,886,180 12,680,021 12,919,713
Total debt securities issued 20,762,198 20,968,357 26,218,337 24,986,818
Notes :
(a) Debentures that are listed in Colombo Stock Exchange.
(b) Weighted average 6 months treasury bill interest rate before deducting 10% withholding tax at the primary quotations as announced by
Central Bank of Sri Lanka, at the preceding week of the interest resetting date.
(c) Weighted average 12 months treasury bill interest rate before deducting 10% withholding tax at the primary quotations as announced
by Central Bank of Sri Lanka, at the preceding week of the interest resetting date.
41 Debt securities issued (Contd.)

273
Truly Everybody’s Bank
42 Insurance provision
Group
2014
LKR '000
2013
LKR '000
42.1 Insurance provision - Life
Balance as at 1 January 220,748 166,087
Increase in life fund 114,508 49,462
Fair value reserve 1,091 1,150
Unclaimed benefits 13,554 4,049
Balance as at 31 December 349,901 220,748
42.2 Insurance provision - Non life
Provision for reported claims by policy holders 111,263 135,651
Provision for claims on Incurred But Not Reported (IBNR) 47,733 34,690
Outstanding claims provision 158,996 170,341
Provision for unearned premiums 448,310 499,732
Balance as at 31 December 607,306 670,073
Bank Group
As at 31 December 2014
LKR '000
2013
LKR '000
2014
LKR '000
2013
LKR '000
43 Other liabilities
Cheques sent on clearing 731,212 1,238,087 731,212 1,238,087
Lease creditors
Within 12 months 2,467 5,077 6,842 15,785
Later than 12 months - 2,467 17,214 53,012
Employee benefit liabilities 1,995,622 1,338,312 2,300,104 1,602,502
Other 14,804,878 8,937,578 16,047,870 10,249,547
Total other liabilities 17,534,179 11,521,521 19,103,242 13,158,933
44 Employee retirement benefit plans
The Bank has a pension scheme established under an Industrial Award which is solely funded by the Bank. There is also a Widows’/
Widowers’ and Orphans’ Pension Scheme established by the members who joined the Bank before 1 January 1996.
The assets of these two plans are held independently of the Bank’s assets and administered by Boards of Trustees/ Managers,
representing the management and the employees, as provided in the Trust Deed/ Rules of the respective funds.
Both funds are subject to annual audits independent to the audit of the Bank, by a firm/s of Chartered Accountants appointed by the
members and actuarial valuations are carried out at least once in three years, as per the rules governing these funds.
44.1 Bank of Ceylon Pension Trust Fund
An actuarial valuation of the Pension Trust Fund as at 31 December 2014 was carried out by M/s Piyal S Goonetilleke and Associates.
The valuation has been done using the “Projected Unit Credit Method”, which is recommended in the Sri Lanka Accounting
Standard -LKAS 19 “Employee Benefits”. The benefit is available to all permanent employees who have joined the Bank prior to
1 January 1996. The results of the actuarial valuation of the Pension Trust Fund is summarized as follows:

274
BANK OF CEYLON . Annual Report 2014
Notes to the Financial Statements
44 Employee retirement benefit plans (Contd.)
44.1 Bank of Ceylon Pension Trust Fund (Contd.)
Bank/Group
As at 31 December 2014
LKR '000
2013
LKR '000
44.1.1 Net benefit expense (recognized under personnel expense)
Current service cost 638,870 728,127
Interest cost on benefit obligation 5,400,215 5,109,473
Interest income on plan assets (5,057,448) (4,791,068)
Net benefit expense 981,637 1,046,532
44.1.2 Retirement benefit liability
Fair value of plan assets 53,839,059 51,725,608
Defined benefit obligation (55,816,255) (52,685,023)
Total retirement benefit liability (1,977,196) (959,415)
44.1.3 Changes in fair value of plan assets
Opening fair value of plan assets 51,725,608 48,989,562
Expected return 5,057,448 4,791,068
Contribution by employer 1,268,167 1,494,423
Benefits paid (4,402,156) (4,148,850)
Actuarial gains 189,992 599,405
Closing fair value of plan assets 53,839,059 51,725,608
44.1.4 Changes in the present value of the defined benefit obligation
Opening defined benefit obligation 52,685,023 49,848,517
Interest cost 5,400,215 5,109,473
Current service cost 638,870 728,127
Benefits paid (4,402,156) (4,148,850)
Loss due to change in assumptions 783,172 -
Actuarial losses on obligation 711,131 1,147,756
Closing defined benefit obligation 55,816,255 52,685,023
44.1.5 Plan assets consist of the following
Fixed deposits 13,102,360 18,215,000
Treasury bonds 4,144,337 4,733,268
Debentures 23,253,230 16,458,710
Investments in shares 5,261,613 4,838,507
Government bonds 3,000,000 3,000,000
Others 5,077,519 4,480,123
Total plan assets 53,839,059 51,725,608

275
Truly Everybody’s Bank
Bank/Group
2014 2013
44.1.6 Actuarial assumptions
Future salary increment rate 6.50% p.a 7.00% p.a
Increase in future Cost of Living Allowance (COLA) 5.50% p.a 6.50% p.a
Increase in pension in payment (basic) Nil Nil
Discount rate 9.50% p.a 10.25% p.a
Rate of return on plan assets 9.00% p.a 10.00% p.a
Attrition rate Nil Nil
Mortality table A67-70 A67-70
Increase / decrease in the following assumptions will change the present value of defined benefit obligation as illustrated
below;˙
1% increase 1% decrease
LKR'000 LKR'000
Discount rate 51,841,940 60,372,790
Salary increment 56,109,260 55,533,690
Further, the remaining years of benefit payments are expected to be 17.7 years.
The following payments are expected from the Pension Trust Fund in future years.
Bank/Group
As at 31 December 2014
LKR '000
2013
LKR '000
Within the next 12 months 1,063,418 1,264,425
Between 2 and 5 years 2,469,592 3,632,960
Between 5 and 10 years 886,665 1,685,935
Beyond 10 years 281,751 730,798
Total expected payments 4,701,426 7,314,118
44.2 Bank of Ceylon Widows’ / Widowers’ and Orphans’ Pension Fund
An actuarial valuation of the Widows’/Widowers’ and Orphans’ Pension Fund as at 31 December 2014 was carried out by
M/s Piyal S Goonetilleke and Associates.
The valuation has been done using the “Projected Unit Credit Method”, which is recommended in the Sri Lanka Accounting
Standard -LKAS 19 “Employee Benefits”.

276
BANK OF CEYLON . Annual Report 2014
Notes to the Financial Statements
44 Employee retirement benefit plans (Contd.)
44.2 Bank of Ceylon Widows’ / Widowers’ and Orphans’ Pension Fund (Contd.)
The results of the actuarial valuation of the Widows’/Widowers’ and Orphans’ Pension Fund is summarized as follows;
Bank/Group
As at 31 December 2014
LKR '000
2013
LKR '000
44.2.1 Net benefit expense (recognized under personnel expenses)
Current service cost 66,884 76,101
Interest cost on benefit obligation 1,368,547 1,267,255
Interest income on plan assets (1,478,765) (1,301,644)
Net benefit expense (43,334) 41,712
44.2.2 Retirement benefit assets
Fair value of plan assets 16,362,449 14,730,725
Defined benefit obligation (13,476,610) (13,351,682)
Retirement benefit assets * 2,885,839 1,379,043
* The above retirement benefit asset have not been recognized in the Financial Statements.
Bank/Group
As at 31 December 2014
LKR '000
2013
LKR '000
44.2.3 Changes in fair value of plan assets
Opening fair value of plan assets 14,730,725 12,976,540
Expected return 1,478,765 1,301,644
Contribution paid in to plan 149,488 176,983
Actual employer contribution 456,000 456,000
Benefits paid (560,791) (512,470)
Actuarial gains on plan asset 108,262 332,028
Closing fair value of plan assets 16,362,449 14,730,725

277
Truly Everybody’s Bank
Bank/Group
As at 31 December 2014
LKR '000
2013
LKR '000
44.2.4 Changes in the present value of the defined benefit obligation
Opening defined benefit obligation 13,351,682 12,363,460
Interest cost 1,368,547 1,267,255
Current service cost 66,884 76,101
Benefits paid (560,791) (512,470)
Gain due to change in assumptions (155,812) -
Actuarial (gains)/losses on obligation (593,900) 157,336
Closing defined benefit obligation 13,476,610 13,351,682
44.2.5 Plan assets consist of the following
Fixed deposits 8,640,000 6,882,000
Treasury bonds 501,175 501,176
Debentures 5,504,950 5,504,950
Smart saver 827,188 827,188
Others 889,136 1,015,411
Total plan assets 16,362,449 14,730,725
44.2.6 Actuarial assumptions
Future salary increment rate 6.50% p.a 7.00% p.a
Increase in future Cost of Living Allowance (COLA) 4.50% p.a 6.50% p.a
Increase in widows' /widowers' and orphans' pension in payment (basic) Nil Nil
Discounting rate 9.50% p.a 10.25% p.a
Rate of return on plan assets 9.00% p.a 10.00% p.a
Attrition rate Nil Nil
Mortality table RP 2000 A67-70
Increase / decrease in the following assumptions will have an impact on the present value of defined benefit obligation as
illustrated below;
1% increase 1% decrease
LKR '000 LKR '000
Discount rate 12,001,550 15,241,950
Salary increment 13,485,370 13,468,150
Further, the remaining years of benefit payments are expected to be 16.5 years.

278
BANK OF CEYLON . Annual Report 2014
Notes to the Financial Statements
44 Employee retirement benefit plans (Contd.)
44.3 Provision for terminal gratuity
Bank Group
2014
LKR '000
2013
LKR '000
2014
LKR '000
2013
LKR '000
Balance as at 1 January 378,897 294,220 643,087 533,447
Provision / (reversal) during the year (359,296) 56,653 (308,341) 102,566
Actuarial losses 3,514 35,001 17,999 22,045
Payment made during the year (4,689) (6,977) (22,104) (18,537)
Adjustment / transfers - - (7,733) 3,566
Balance as at 31 December 18,426 378,897 322,908 643,087
Total employee benefit liabilities 1,995,622 1,338,312 2,300,104 1,602,502
44.3.1 Gratuity Fund
Provision had been made to meet the Bank’s obligation to pay gratuity in terms of the Payment of Gratuity Act No. 12 of 1983, to all
those employees who have joined after 1 January 1996. Provision also included those who have joined the Bank prior to 1 January
1996 and leave the Bank without being entitled to a pension.
Consequent to the entitlement of pension rights for employees who joined subsequent to 1 January 1996, the Bank’s obligation to pay
gratuity has ceased since beneficiaries of the new pension scheme will not be entitled for rights and privileges under the Gratuity Fund.
Therefore, major part of provisions made by the Bank o/a of gratuity has been transferred to the pension scheme established for
employees who joined after 1 January 1996. However, employees whose services are terminated other than by retirement are eligible to
receive a terminal gratuity under the Payment of Gratuity Act No. 12 of 1983, at the rate of one half of the basic or consolidated wage or
salary, cost of living and all other allowances applicable to the last month of the financial year, for each year of continuous service.
An actuarial valuation of the Gratuity Fund as at 31 December 2014 was carried out by M/s Piyal S Goonetilleke and Associates, a firm
of professional actuaries.
The valuation has been done using the “Projected Unit Credit Method”, which is recommended in the Sri Lanka Accounting
Standard -LKAS 19 “Employee Benefits”.
The principal actuarial assumptions used in the valuation were as follows :
Bank/Group
2014 2013
Future salary increment rate 6.50% p.a 7.00% p.a
Increase in future Cost of Living Allowance (COLA) 5.50% p.a 6.50% p.a
Discount rate 9.50% p.a 10.25% p.a
Mortality table RP2000 GA1983
Increase / decrease in the following assumptions will change the present value of defined benefit obligation as illustrated below:
1% increase 1% decrease
LKR '000 LKR '000
Discount rate 15,990 21,390
Salary increment 21,450 15,900

279
Truly Everybody’s Bank
44.4 Post 1996 pension reserve
Employees who joined the Bank subsequent to 1 January 1996 were not entitled to a pension plan until their pension rights were
approved by the Board of Directors of Bank of Ceylon under the directions of the Ministry of Finance and Planning on 16 December 2014.
Permanent employees who were recruited to the Bank on or after 1 January 1996 and who are in active service of the Bank as at
16 December 2014 as well as those who will be recruited to the permanent cadre of the Bank on or after 16 December 2014 are covered
under the new pension scheme.
Subsequent to the establishment of pension rights for all Bank employees, the provision for retirement gratuity payable does not exist.
An actuarial valuation of the post 1996 pension reserve as at 31 December 2014 was carried out by M/s Piyal S Goonetilleke and
Associates a firm of professional actuaries.
The results of the actuarial valuation of the pension reserve indicates an obligation of LKR 2,487 million as at 31 December 2014.
The provisions made by the Bank on prudential grounds and the gratuity liability balance is adequate to meet the post 1996 pension
obligations in full.
45 Subordinated term debts
Bank Group
As at 31 December 2014
LKR '000
2013
LKR '000
2014
LKR '000
2013
LKR '000
Unsecured, subordinated, redeemable debentures 32,519,715 24,357,595 32,177,810 24,347,248
of LKR 100 each
Total subordinated term debts 32,519,715 24,357,595 32,177,810 24,347,248
All subordinated debentures are listed in Colombo Stock Exchange
Bank Group
2014
LKR '000
2013
LKR '000
2014
LKR '000
2013
LKR '000
45.1 The movement in subordinated term debts
Balance as at 1 January 24,357,595 23,818,024 24,347,248 23,801,505
Issued during the year 8,000,000 8,000,000 7,675,000 8,000,000
Redemptions - (7,641,985) - (7,635,813)
Amortization adjustments 162,120 181,556 155,562 181,556
Balance as at 31 December 32,519,715 24,357,595 32,177,810 24,347,248
45.2 Maturity of subordinated terms debts
Within 12 months 5,519,715 - 5,514,431 -
After 12 months 27,000,000 24,357,595 26,663,379 24,347,248
Total subordinated term debts 32,519,715 24,357,595 32,177,810 24,347,248

280
BANK OF CEYLON . Annual Report 2014
45 Subordinated term debts (Contd.)
Notes Interest payable frequency Issue date
45.3 Types of debentures
Sri Lanka Rupee debentures
Fixed interest rate
Unsecured, subordinated, redeemable debentures (a) Annually 28.06.2010
Unsecured, subordinated, redeemable debentures (a) Annually 08.12.2011
Unsecured, subordinated, redeemable debentures (a) Semi annually 08.12.2011
Unsecured, subordinated, redeemable debentures (a) Annually 30.11.2012
Unsecured, subordinated, redeemable debentures (a) Semi annually 30.11.2012
Unsecured, subordinated, redeemable debentures (a) Annually 25.10.2013
Unsecured, subordinated, redeemable debentures (a) Semi annually 25.10.2013
Unsecured, subordinated, redeemable debentures (a) Annually 25.10.2013
Unsecured, subordinated, redeemable debentures (a) Annually 25.10.2013
Unsecured, subordinated, redeemable debentures (a) Annually 25.10.2013
Unsecured, subordinated, redeemable debentures (a) Annually 22.09.2014
Unsecured, subordinated, redeemable debentures (a) Annually 22.09.2014
Unsecured, subordinated, redeemable debentures (a) Annually 22.09.2014
Floating interest rate
Unsecured, subordinated, redeemable debentures (a)/(b ) Semi annually 28.06.2010
(6 months TB rate (gross) plus 75 basis points)
Unsecured, subordinated, redeemable debentures (a)/(b ) Semi annually 08.12.2011
(6 months TB rate (gross) plus 75 basis points)
Unsecured, subordinated, redeemable debentures (a)/(b ) Semi annually 30.11.2012
(6 months TB rate (gross) plus 125 basis points)
Unsecured, subordinated, redeemable debentures (a)/(b ) Semi annually 25.10.2013
(6 months TB rate (gross) plus 100 basis points)
Unsecured, subordinated, redeemable debentures (a)/(b ) Semi annually 25.10.2013
(6 months TB rate (gross) plus 100 basis points)
Unsecured, subordinated, redeemable debentures (a)/(b ) Semi annually 22.09.2014
(6 months TB rate (gross) plus 50 basis points)
Unsecured, subordinated, redeemable debentures (a)/(b ) Semi annually 22.09.2014
(6 months TB rate (gross) plus 50 basis points)
Total subordinated debentures
Notes to the Financial Statements

281
Truly Everybody’s Bank
Coupon rate Amount as at 31 December
Bank Group
2014 2013 2014 2013 2014 2013
Maturity date % % LKR '000 LKR '000 LKR '000 LKR '000
27.06.2015 11.50 11.50 1,135,783 1,135,783 1,130,499 1,130,499
07.12.2016 11.00 11.00 3,926,514 3,926,514 3,926,514 3,926,514
07.12.2016 10.50 10.50 2,315 2,315 2,315 2,315
29.11.2017 16.00 16.00 6,034,052 6,034,052 6,028,990 6,028,990
29.11.2017 15.25 15.25 40,189 40,189 40,189 40,189
24.10.2018 13.00 13.00 3,869,827 3,869,827 3,869,827 3,869,827
24.10.2018 12.60 12.60 220,369 220,369 220,369 220,369
24.10.2021 13.25 13.25 1,226,594 1,226,594 1,226,594 1,226,594
24.10.2022 13.25 13.25 1,227,617 1,227,617 1,227,617 1,227,617
24.10.2023 13.75 13.75 1,638,142 1,638,142 1,638,142 1,638,142
21.09.2019 8.00 - 5,234,969 - 5,234,969 -
21.09.2019 7.75 - 216,182 - 216,182 -
21.09.2022 8.25 - 1,873,793 - 1,873,793 -
26,646,346 19,321,403 26,636,000 19,311,056
27.06.2015 7.24 9.47 3,927,586 3,928,928 3,927,586 3,928,928
07.12.2016 7.24 10.36 1,102,401 1,105,616 1,102,401 1,105,616
29.11.2017 7.74 11.03 423 424 423 424
24.10.2018 7.92 11.12 203 204 203 204
24.10.2021 7.92 11.12 1,014 1,020 1,014 1,020
21.09.2019 7.42 - 841,711 - 510,152 -
21.09.2022 7.42 - 31 - 31 -
5,873,369 5,036,192 5,541,810 5,036,192
32,519,715 24,357,595 32,177,810 24,347,248

282
BANK OF CEYLON . Annual Report 2014
Notes to the Financial Statements
45 Subordinated term debts (Contd.)
45.3 Types of debentures (Contd.)
Notes :
(a) Debentures that are listed in Colombo Stock Exchange. Some of these have been traded in Colombo Stock Exchange
during the year 2014.
2010/2015 - ( Highest price - LKR 100.00, lowest price - LKR 100.00, last transaction price - LKR 100.00)
2011/2016 - ( Highest price - LKR 100.00, lowest price - LKR 100.00, last transaction price - LKR 100.00)
2012/2017 - ( Highest price - LKR 104.00, lowest price - LKR 104.00, last transaction price - LKR 104.00)
2013/2018 - ( Highest price - LKR 111.85, lowest price - LKR 111.85, last transaction price - LKR 111.85)
2013/2021 - ( Highest price - LKR 125.55, lowest price - LKR 125.55, last transaction price - LKR 125.55)
2013/2023 - ( Highest price - LKR 131.43, lowest price - LKR 131.43, last transaction price - LKR 131.43)
2013/2019 - ( Highest price - LKR 99.94, lowest price - LKR 99.94, last transaction price - LKR 99.94)
(b) Weighted average 6 months treasury bill interest rate before deducting 10% withholding tax at the primary quotations
as announced by Central Bank of Sri Lanka, at the preceding week of the interest resetting date.
46 Share capital
Bank Group
2014
LKR '000
2013
LKR '000
2014
LKR '000
2013
LKR '000
Authorized
50,000,000 ordinary shares 50,000,000 50,000,000 50,000,000 50,000,000
Balance as at 1 January (issued and fully paid) 5,000,000 5,000,000 5,000,000 5,000,000
(5,000,000 ordinary shares)
Assigned capital * 5,000,000 - 5,000,000 -
(5,000,000 ordinary shares)
Balance as at 31 December 10,000,000 5,000,000 10,000,000 5,000,000
(10,000,000 ordinary shares)
* Assigned capital
Government of Sri Lanka has allotted LKR 5,000 million capital to the Bank as the first phase of the total allotment
of LKR 10,000 million as stipulated in the National Budget 2015. This allocation is reported under capital pending
allotment as of 31 December 2014. The Bank is making arrangements to issue five million ordinary shares at
LKR 1,000 each to Government of Sri Lanka.
47 Permanent reserve fund
Bank Group
2014
LKR '000
2013
LKR '000
2014
LKR '000
2013
LKR '000
Balance as at 1 January 3,538,455 3,285,955 3,538,455 3,285,955
Transfers during the year 271,500 252,500 271,500 252,500
Balance as at 31 December 3,809,955 3,538,455 3,809,955 3,538,455

283
Truly Everybody’s Bank
The permanent reserve fund is maintained as required by Bank of Ceylon Ordinance (Chapter 397) whereby the Bank
must, out of net profit after taxation but before any dividend is declared, transfer to a reserve a sum equivalent to not
less than 20% of such profit until the reserve is equivalent to 50% of the issued and paid up capital and thereafter, an
appropriate amount determined at 2% per annum in terms of section 20(1) and (2) of the Banking Act No. 30 of 1988
until the reserve is equal to the paid up capital.
In order to meet the requirement, an amount of LKR 271.5 million was transferred to the reserve during the year
2014 (2013 : LKR 252.5 million).
The balance in the permanent reserve fund will be used only for the purposes specified in the Section 20 (2) of the
Banking Act No. 30 of 1988.
Bank Group
2014
LKR '000
2013
LKR '000
2014
LKR '000
2013
LKR '000
48 Other reserves
Investment fund account [Note 48.1.1] - 7,057,090 - 7,228,548
Revaluation reserve [Note 48.2] 8,587,167 5,210,792 13,807,627 9,600,314
Primary dealer special risk reserve [Note 48.3] - 896,616 - 896,616
Free reserve [Note 48.4] 169,067 169,067 366,644 366,644
Exchange translation reserve [Note 48.5] 415,014 496,631 710,383 945,548
Available for sale reserve [Note 48.6] 6,963,665 3,912,715 7,762,004 4,515,661
Statutory reserve - Other [Note 48.7] - - 275,391 263,247
16,134,913 17,742,911 22,922,049 23,816,578
48.1 Investment Fund Account (IFA)
As per the guidelines issued by Central Bank of Sri Lanka, based on Government budget proposals - 2011, banks
were required to establish and operate a fund, titled as “Investment Fund Account (IFA)” with effect from 1 January
2011. As and when taxes are paid, after 1 January 2011, the Bank should transfer 8% of profits calculated for VAT on
financial services and 5% of the adjusted profit calculated for income tax purposes (before tax).
The Circular No.02/17/800/0014/02 dated 31 July 2014 issued by Central Bank of Sri Lanka stated that the operations
of the investment fund account will cease with effect from 1 October 2014.
Therefore we have transferred the remaining balance in IFA to retained earnings through the Statement of Changes in
Equity.
Bank Group
2014
LKR '000
2013
LKR '000
2014
LKR '000
2013
LKR '000
48.1.1 Movement in investment fund account
Balance as at 1 January 7,057,090 4,716,685 7,228,548 4,849,948
Transfers from retained earnings 480,066 2,340,405 480,066 2,378,600
Transfers to retained earnings (7,537,156) - (7,708,614) -
Balance as at 31 December - 7,057,090 - 7,228,548

284
BANK OF CEYLON . Annual Report 2014
Notes to the Financial Statements
48 Other reserves (Contd.)
Bank Group
2014
LKR '000
2013
LKR '000
2014
LKR '000
2013
LKR '000
48.2 Revaluation reserve
Balance as at 1 January 5,210,792 5,222,314 9,600,314 8,367,737
Net gains / (losses) on revaluation of properties 3,557,500 (16,003) 4,632,965 1,664,685
Deferred tax effect on revaluation (gains)/losses (181,125) 4,481 (480,110) (459,977)
Acquisition, disposal and changes in non controlling interest - - 54,458 27,869
Balance as at 31 December 8,587,167 5,210,792 13,807,627 9,600,314
The revaluation reserve represents the surpluses arising on the revaluation of freehold properties which are still in use.
The Bank has carried out a revaluation of all it’s freehold land and buildings and recognized LKR 3.6 billion revaluation
surplus as of 31 December 2014.
According to the regulatory directives, issued by Central Bank of Sri Lanka, the Bank can consider the revaluation
surplus as supplementary capital in computing capital adequacy ratio, once in every seven years.
Bank Group
2014
LKR '000
2013
LKR '000
2014
LKR '000
2013
LKR '000
48.3 Primary dealer special risk reserve
Balance as at 1 January 896,616 822,676 896,616 822,676
Transfers during the year (896,616) 73,940 (896,616) 73,940
Balance as at 31 December - 896,616 - 896,616
The Bank has been maintaining the primary dealer special risk reserve since 2005 as per the direction issued by the
Public Debt Department of Central Bank of Sri Lanka. However according to the confirmation received from the Public
Debt Department of Central Bank of Sri Lanka on the cessation of maintaining a special risk reserve in 2014, the Bank
transferred the balance to the retained earnings.
Bank Group
2014
LKR '000
2013
LKR '000
2014
LKR '000
2013
LKR '000
48.4 Free reserve
Balance as at 1 January 169,067 169,067 366,644 366,644
Balance as at 31 December 169,067 169,067 366,644 366,644
Free reserve has been created for unforeseeable risks and future losses.

285
Truly Everybody’s Bank
Bank Group
2014
LKR '000
2013
LKR '000
2014
LKR '000
2013
LKR '000
48.5 Exchange translation reserve
Balance as at 1 January 496,631 693,851 945,548 998,291
Exchange differences on translation of foreign operations (81,617) (197,220) (235,165) (52,743)
Balance as at 31 December 415,014 496,631 710,383 945,548
This represents the exchange differences arising from translating investments made in the capital and net exchange
movement arising on the translation of net equity of Bank of Ceylon (UK) Limited and foreign branches, and also
exchange differences arising from translation of the results of foreign branches for this year from the average rate to
the exchange rate ruling at the year end.
Bank Group
2014
LKR '000
2013
LKR '000
2014
LKR '000
2013
LKR '000
48.6 Available for sale reserve
Balance as at 1 January 3,912,715 3,403,188 4,515,661 3,970,915
Net gains/(losses) on remeasuring financial investments 3,050,950 509,527 3,246,343 544,746
Balance as at 31 December 6,963,665 3,912,715 7,762,004 4,515,661
48.7 Statutory reserve - Other
Balance as at 1 January - - 263,247 244,915
Transfers during the year - - 12,144 18,332
Balance as at 31 December - - 275,391 263,247
Statutory reserve - other, represents the reserve funds maintained by Merchant Bank of Sri Lanka & Finance PLC in
terms of Direction No. 05 of 2006 issued by Central Bank of Sri Lanka under Section No.34 of the Finance Leasing Act
No.56 of 2000 and MCSL Financial Services Limited in terms of Direction No. 01 of 2003 issued by Central Bank of
Sri Lanka.
Bank Group
For the year ended 31 December 2014
LKR '000
2013
LKR '000
2014
LKR '000
2013
LKR '000
49 Notes to the Statement of Cash Flows
49.1 Change in operating assets
Change in deposits with regulatory authorities (1,723,241) 1,264,108 (1,723,241) 1,264,108
Loans and advances to customers (26,621,248) (32,652,885) (28,197,251) (36,266,683)
Net (increase)/ decrease in financial assets - Held for trading (996,620) 149,415 1,196,104 (885,299)
Net increase in reverse repurchase agreements (36,633,376) (21,522,292) (37,384,494) (21,428,100)
Net (increase)/ decrease in derivative financial instruments 1,546,517 (2,753,622) 1,546,517 (2,753,622)
Change in other operating assets (8,660,341) (21,501,408) (8,540,980) (22,195,349)
(73,088,309) (77,016,684) (73,103,345) (82,264,945)

286
BANK OF CEYLON . Annual Report 2014
Notes to the Financial Statements
49 Notes to the Statement of Cash Flows (Contd.)
Bank Group
For the year ended 31 December 2014
LKR '000
2013
LKR '000
2014
LKR '000
2013
LKR '000
49.2 Change in operating liabilities
Decrease in deposits from banks (478,394) (9,165,515) (529,769) (9,229,140)
Increase in deposits from customers 95,068,191 141,272,381 95,665,201 141,892,610
Net increase/ (decrease) in securities lent and repurchase
agreements 19,292,910 (7,316,045) 19,391,123 (8,020,511)
Net increase/ (decrease) in short term borrowings 5,495,066 (10,468,558) 5,334,802 (11,564,825)
Net increase in derivative financial instruments 459,600 200,634 459,600 200,634
Change in other operating liabilities 5,695,384 4,642,213 5,621,069 5,826,092
125,532,757 119,165,110 125,942,026 119,104,860
49.3 Other non cash items included in
profit before tax
Exchange revaluation 27,418 (396,660) 27,418 (396,660)
Contribution paid to defined benefit plans 579,007 1,144,897 636,642 1,197,476
Loan impairment charges 7,210,916 6,922,902 7,931,525 7,331,136
Depreciation of property, plant and equipment 1,019,315 977,446 1,414,410 1,327,183
Amortization of intangible assets and leasehold lands 171,979 139,757 216,447 170,057
Accrual for expenses and other non cash items 5,016,379 (1,928,100) 4,120,781 (1,906,812)
14,025,014 6,860,242 14,347,223 7,722,380
50 Commitments and contingencies
In the normal course of business, the Bank undertakes commitments and incurs contingent liabilities with legal
recourse to its customers to accommodate the financial and investment needs of clients, to conduct trading activities,
and to manage its own exposure to risk. These financial instruments generate interest or fees and carries elements
of credit risk in excess of those amounts recognized as assets and liabilities in the Statement of Financial Position.
However no material losses are anticipated as a result of these transactions.
These commitments and contingencies are quantified below :
Bank Group
As at 31 December 2014
LKR '000
2013
LKR '000
2014
LKR '000
2013
LKR '000
Contingent liabilities [Note 50.1] 416,395,424 364,749,512 417,177,851 365,190,796
Undrawn and undisbursed facilities [Note 50.2] 297,007,904 285,944,245 297,016,457 285,953,702
Capital commitments [Note 50.3] 6,611,334 3,936,404 6,858,547 4,209,094
Lease commitments [Note 50.4] 1,748,744 811,248 1,770,333 872,501
Total commitments and contingencies 721,763,406 655,441,409 722,823,188 656,226,093

287
Truly Everybody’s Bank
Bank Group
As at 31 December 2014
LKR '000
2013
LKR '000
2014
LKR '000
2013
LKR '000
50.1 Contingent liabilities
Acceptances and documentary credit 179,707,248 163,754,104 179,963,895 163,977,738
Bills for collection 4,626,332 3,947,225 4,626,332 3,947,225
Forward exchange contracts 128,030,237 127,685,402 128,030,237 127,685,402
Guarantees 99,102,841 69,275,083 99,300,121 69,441,991
Other commitments 4,928,766 87,698 5,257,266 138,440
Total contingent liabilities 416,395,424 364,749,512 417,177,851 365,190,796
50.2 Undrawn and undisbursed facilities
Undisbursed amount of loans 38,917,230 38,496,890 38,925,783 38,506,347
Undrawn limits of overdrafts 69,574,333 75,172,736 69,574,333 75,172,736
Undrawn limits of credit cards 5,398,764 4,796,756 5,398,764 4,796,756
Undrawn limits of letters of credit 104,954,776 71,903,943 104,954,776 71,903,943
Undrawn limits of letters of guarantee 78,162,801 95,573,920 78,162,801 95,573,920
Total undrawn and undisbursed facilities 297,007,904 285,944,245 297,016,457 285,953,702
50.3 Capital commitments
Capital expenditure approved by the Directors for which no provision has been made in the Financial Statements,
amounts to:
Bank Group
As at 31 December 2014LKR '000
2013LKR '000
2014LKR '000
2013LKR '000
50.3.1 Capital commitments in relation to property, plant and equipment
Approved and contracted for 1,688,548 1,439,648 1,741,657 1,439,648
Approved but not contracted for 3,989,026 2,033,207 4,061,544 2,181,934
5,677,574 3,472,855 5,803,201 3,621,582
50.3.2 Capital commitments in relation to intangible assets
Approved and contracted for 382,760 221,549 382,760 221,549
Approved and not contracted for 551,000 242,000 672,586 365,963
933,760 463,549 1,055,346 587,512
Total capital commitments 6,611,334 3,936,404 6,858,547 4,209,094
50.4 Lease commitments
50.4.1 Operating lease commitments
Future minimum lease payments under non cancellable operating leases where the Bank is the lessee are as follows;
Bank Group
As at 31 December 2014LKR '000
2013LKR '000
2014LKR '000
2013LKR '000
Not later than 1 year 978,805 326,763 978,805 326,763
Later than 1 year and not later than 5 years 756,694 475,429 756,694 475,429
Later than 5 years 10,778 1,512 10,778 1,512
1,746,277 803,704 1,746,277 803,704

288
BANK OF CEYLON . Annual Report 2014
Notes to the Financial Statements
50 Commitments and contingencies (Contd.)
50.4 Lease commitments (Contd.)
Future minimum lease payments under non cancellable financing leases where the Bank is the lessee are as follows;
50.4.2 Finance lease commitments
Bank Group
As at 31 December 2014
LKR '000
2013
LKR '000
2014
LKR '000
2013
LKR '000
Not later than 1 year 2,467 5,077 6,842 15,785
Later than 1 year and not later than 5 years - 2,467 12,368 53,012
Later than 5 years - - 4,846 -
2,467 7,544 24,056 68,797
Total lease commitments 1,748,744 811,248 1,770,333 872,501
51 Litigation
Litigations are anticipated in the context of business operations due to the nature of the transactions involved. The
Bank and the Group’s companies are involved in various such legal actions and the controls have been established to
deal with such legal claims. There are pending litigations existing as at the end of the reporting period against the Bank
resulting through normal business operations.
Litigations against the Bank have been assessed in terms of the probability of any claims or damages arising against
the Bank, which require provisions to be made in the Financial Statements as per LKAS 37 - “Provisions, Contingent
Liabilities and Contingent Assets.”
As at 31 December 2014, claims for the legal cases against the Bank amounted to LKR 320 million. The Bank is of the
view that there is no probability of such pending cases having any significant or material impact to the Bank’s business
operations, liquidity or financial position. Accordingly, no provision has been made in these Financial Statements in
respect of pending litigations against the Bank.
52 Assets pledged as security
The securities sold under repurchase agreements, debentures and debt securities issued by the Bank and the Group and
details of assets pledged by the Bank and the Group, to secure those liabilities are given below:
Bank Group
As at 31 December 2014
LKR '000
2013
LKR '000
2014
LKR '000
2013
LKR '000
Securities sold under repurchase agreements 51,282,837 31,989,927 51,282,837 31,528,724
Refinance purposes - - 1,156,609 1,659,900
51,282,837 31,989,927 52,439,446 33,188,624
Secured by ;
Treasury bonds 57,837,480 44,792,077 57,837,480 44,792,077
Lease / hire purchase rentals receivable - - 1,151,859 1,652,150
Fixed deposits - - 4,750 7,750
57,837,480 44,792,077 58,994,089 46,451,977

289
Truly Everybody’s Bank
53 Events after the reporting date
No circumstances have arisen since the reporting date which would require adjustments to or disclosure in these
Financial Statements other than the item disclosed below.
53.1 Super gain tax
Government of Sri Lanka, in its interim budget 2015 presented to the Parliament on 29 January 2015, has imposed a
super gain tax of 25% on the profits of any company or an individual exceeding LKR 2,000 million earned in the year
of assessment 2013/14 as a one off tax, which is yet to be enacted.
53.2 Merger
Subsequent to the reporting date three of the Bank’s subsidiaries namely Merchant Bank of Sri Lanka & Finance PLC,
MBSL Savings Bank Limited and MCSL Financial Services Limited merged as single entity in 1 January 2015 in line
with the banking sector consolidation road map introduced by Central Bank of Sri Lanka.
54 Maturity analysis of assets and liabilities
The analysis of total assets and liabilities of the Bank and the Group into relevant maturity groupings based on the
remaining period as at 31 December 2014 in to the contractual maturity date is given in the table below :
Bank Group
As at 31 December 2014
Within
12 months
LKR ‘000
After
12 months
LKR ‘000
Total
LKR ‘000
Within
12 months
LKR ‘000
After
12 months
LKR ‘000
Total
LKR ‘000
Assets
Cash and short term funds 29,165,464 - 29,165,464 29,958,559 - 29,958,559
Balances with Central Banks 29,016,252 1,406,121 30,422,373 29,016,252 1,406,121 30,422,373
Placements with banks 19,766,889 - 19,766,889 21,393,574 - 21,393,574
Derivative financial instruments 1,714,556 - 1,714,556 1,714,556 - 1,714,556
Reverse repurchase agreements 58,953,093 - 58,953,093 60,236,389 - 60,236,389
Financial assets - Held for trading 17,862,433 - 17,862,433 18,437,958 - 18,437,958
Financial investments - Loans and
receivables 16,857,588 112,287,742 129,145,330 18,013,335 111,953,471 129,966,806
Loans and advances to customers 512,970,459 228,377,176 741,347,635 521,477,898 242,294,154 763,772,052
Financial investments - Available
for sale 2,562,402 11,799,141 14,361,543 3,908,582 13,702,578 17,611,160
Financial investments - Held to
maturity 42,052,438 174,465,000 216,517,438 42,219,906 174,520,226 216,740,132
Investment in subsidiary
companies - 6,213,048 6,213,048 - - -
Investment in associate companies - 842,988 842,988 - 1,870,035 1,870,035
Investment properties - - - 96,865 52,011 148,876
Property, plant and equipment - 16,188,333 16,188,333 - 25,646,016 25,646,016
Leasehold properties - 107,467 107,467 - 144,501 144,501
Intangible assets - 384,577 384,577 - 531,667 531,667
Deferred tax assets - - - - 8,933 8,933
Other assets 45,567,511 459,717 46,027,228 46,212,846 587,232 46,800,078
Total assets 776,489,085 552,531,310 1,329,020,395 792,686,720 572,716,945 1,365,403,665
Percentage 58.4% 41.6% 100.0% 58.1% 41.9% 100.0%

290
BANK OF CEYLON . Annual Report 2014
Notes to the Financial Statements
54 Maturity analysis of assets and liabilities (Contd.)
Bank Group
As at 31 December 2014
Within
12 months
LKR ‘000
After
12 months
LKR ‘000
Total
LKR ‘000
Within
12 months
LKR ‘000
After
12 months
LKR ‘000
Total
LKR ‘000
Liabilities
Due to banks 889,876 - 889,876 949,127 - 949,127
Derivative financial instruments 734,548 - 734,548 734,548 - 734,548
Due to customers 890,798,299 43,167,870 933,966,169 898,753,216 45,181,247 943,934,463
Other borrowings 90,448,767 156,287,695 246,736,462 94,511,016 157,657,141 252,168,157
Debt securities issued 17,362,198 3,400,000 20,762,198 17,646,268 8,572,069 26,218,337
Current tax liabilities - - - 291,193 - 291,193
Deferred tax liabilities - 1,071,335 1,071,335 - 3,288,860 3,288,860
Insurance provision - Life - - - - 349,901 349,901
Insurance provision - Non life - - - - 607,306 607,306
Other liabilities 17,526,012 8,167 17,534,179 18,540,135 563,107 19,103,242
Subordinated term debts 5,519,715 27,000,000 32,519,715 5,514,431 26,663,379 32,177,810
Equity - 74,805,913 74,805,913 - 85,580,721 85,580,721
Total liabilities and equity 1,023,279,415 305,740,980 1,329,020,395 1,036,939,934 328,463,731 1,365,403,665
Percentage 77.0% 23.0% 100.0% 75.9% 24.1% 100.0%
Net gap (246,790,330) 246,790,330 - (244,253,214) 244,253,214 -

291
Truly Everybody’s Bank
The analysis of total assets and liabilities of the Bank and the Group in to relevant maturity groupings based on the remaining
period as at 31 December 2013 in to the contractual maturity date is given in the table below :
Bank Group
As at 31 December 2013
Within
12 months
LKR ‘000
After
12 months
LKR ‘000
Total
LKR ‘000
Within
12 months
LKR ‘000
After
12 months
LKR ‘000
Total
LKR ‘000
Assets
Cash and short term funds 24,901,189 - 24,901,189 25,182,043 - 25,182,043
Balances with Central Banks 27,501,904 1,197,228 28,699,132 27,501,904 1,197,228 28,699,132
Placements with banks 19,315,520 - 19,315,520 21,157,190 - 21,157,190
Derivative financial instruments 3,261,073 - 3,261,073 3,261,073 - 3,261,073
Reverse repurchase agreements 22,319,717 - 22,319,717 22,851,895 - 22,851,895
Financial assets - Held for trading 10,245,314 3,294,477 13,539,791 10,556,130 3,342,112 13,898,242
Financial investments - Loans and
receivables 21,776,780 107,331,833 129,108,613 21,998,930 108,191,366 130,190,296
Loans and advances to customers 389,989,285 335,342,681 725,331,966 395,251,159 351,320,660 746,571,819
Financial investments - Available
for sale 860,666 9,464,548 10,325,214 1,410,592 11,441,853 12,852,445
Financial investments - Held to
maturity 48,819,056 108,080,705 156,899,761 48,969,258 108,472,314 157,441,572
Investment in subsidiary
companies - 6,828,699 6,828,699 - - -
Investment in associate companies - 842,988 842,988 - 1,471,267 1,471,267
Investment properties - - - - 151,914 151,914
Property, plant and equipment - 12,006,180 12,006,180 6,528 20,615,633 20,622,161
Leasehold properties - 83,026 83,026 - 121,417 121,417
Intangible assets - 501,064 501,064 - 669,657 669,657
Deferred tax assets - - - 33,548 14,270 47,818
Other assets 39,150,680 466,287 39,616,967 39,939,370 633,080 40,572,450
Total assets 608,141,184 585,439,716 1,193,580,900 618,119,620 607,642,771 1,225,762,391
Percentage 51.0% 49.0% 100.0% 50.4% 49.6% 100.0%

292
BANK OF CEYLON . Annual Report 2014
Notes to the Financial Statements
54 Maturity analysis of assets and liabilities (Contd.)
Bank Group
As at 31 December 2013
Within
12 months
LKR ‘000
After
12 months
LKR ‘000
Total
LKR ‘000
Within
12 months
LKR ‘000
After
12 months
LKR ‘000
Total
LKR ‘000
Liabilities
Due to banks 1,166,427 - 1,166,427 1,336,267 - 1,336,267
Derivative financial instruments 274,948 - 274,948 274,948 - 274,948
Due to customers 806,941,764 35,128,236 842,070,000 809,457,102 41,310,419 850,767,521
Other borrowings 86,636,783 148,733,486 235,370,269 91,894,729 148,907,382 240,802,111
Debt securities issued - 20,968,357 20,968,357 656,372 24,330,446 24,986,818
Current tax liabilities - - - 251,457 18 251,475
Deferred tax liabilities - 151,623 151,623 - 2,034,216 2,034,216
Insurance provision - Life - - - - 220,748 220,748
Insurance provision - Non life - - - - 670,073 670,073
Other liabilities 10,183,316 1,338,205 11,521,521 11,237,731 1,921,202 13,158,933
Subordinated term debts - 24,357,595 24,357,595 - 24,347,248 24,347,248
Equity - 57,700,160 57,700,160 - 66,912,033 66,912,033
Total liabilities and equity 905,203,238 288,377,662 1,193,580,900 915,108,606 310,653,785 1,225,762,391
As at 31 December 2013 75.8% 24.2% 100.0% 74.7% 25.3% 100.0%
Net gap - 2013 (297,062,054) 297,062,054 - (296,988,986) 296,988,986 -
55 Related party disclosures
The Bank has entered into transactions with parties who are defined as related parties in Sri Lanka Accounting
Standard - LKAS 24 -” Related Party Disclosures”, i.e. significant investors, subsidiary and associate companies, post
employment benefit plans for the Bank’s employees, Key Management Personnel (KMPs), Close Family Members
(CFMs) of KMPs and other related entities. Those transactions include lending activities, acceptance and placements,
off balance sheet transactions and provision of other banking and financial services that are carried out in the ordinary
course of business on an arm’s length basis at commercial rates, except for the transactions that KMPs have availed
under schemes uniformly applicable to all the staff at concessionary rates.
55.1 Parent and the ultimate controlling party
Bank of Ceylon is a Government owned bank.
55.2 Key Management Personnel (KMPs), their Close Family Members (CFMs) and other related entities
55.2.1 Compensation to Key Management Personnel (KMPs) and their Close Family Members (CFMs)
As per the Sri Lanka Accounting Standard -LKAS 24 - “Related Party Disclosures”, the KMPs include those who are
having authority and responsibility for planning, directing and controlling the activities of the Bank. Accordingly, the
Board of Directors and selected key members of the Corporate Management are identified as KMPs who meet the
above criteria.
CFMs are defined as family members who may be expected to influence, or be influenced by, that individual in their
dealings with the entity, i.e. spouse, children under 18 years of age and dependants of KMPs. Dependant is defined as
anyone who depends on the respective KMP for more than 50% of his or her financial needs.

293
Truly Everybody’s Bank
Bank Group
For the year ended 31 December 2014
LKR '000
2013
LKR '000
2014
LKR '000
2013
LKR '000
Compensation to KMPs of the Bank
Short term employment benefits 15,352 11,010 18,214 13,320
Post employment benefits 2,587 2,613 2,587 2,613
17,939 13,623 20,801 15,933
In addition to the above, the Bank has also provided non cash benefits such as vehicles to KMPs in line with the
approved benefit plan of the Bank.
55.2.2 Transactions, arrangements and agreements involving Key Management Personnel (KMPs), their Close Family
Members (CFMs) and other related entities
Other entities are those entities in which the KMPs and /or their CFMs have an interest over 50% of total
shareholding.
KMPs & CFMs Other entities
For the year ended 31 December 2014
LKR '000
2013
LKR '000
2014
LKR '000
2013
LKR '000
(a) Items in income statement
Interest income 627 683 - -
Interest expenses 880 1,190 - -
Other expenses * - - 9,353 3,732
* excluding the payments made as shown in Note 55.2.1
As at 31 December 2014
LKR '000
2013
LKR '000
2014
LKR '000
2013
LKR '000
(b) Items in statement of financial position
Assets
Loans 6,092 6,255 - -
Overdrafts 1,026 1,275 - -
Credit cards 674 224 - -
7,792 7,754 - -
Liabilities
Due to customers 21,759 8,361 - -
21,759 8,361 - -
(c ) Off balance sheet items
Undrawn facilities 5,005 9,550 - -
5,005 9,550 - -
(d) Average accommodations / due to customer balances
Loans 6,132 6,444 - -
Overdrafts 923 1,094 - -
Due to customers 14,781 12,947 - -

294
BANK OF CEYLON . Annual Report 2014
Notes to the Financial Statements
55 Related party disclosures (Contd.)
55.3 Transactions with Group related parties
The Group related parties include the subsidiaries and associate companies of the Bank.
55.3.1 Transactions with subsidiaries and associates companies of the Bank
The aggregate amount of income and expenses arising from the transactions during the year and amount due to and due
from the relevant related parties and total contract sum of off balance sheet transactions at the year end are summarized
below.
Subsidiary companies
of the Bank
Associate companies
of the Bank
For the year ended 31 December 2014
LKR '000
2013
LKR '000
2014
LKR '000
2013
LKR '000
(a) Items in income statement
Interest income 24,632 179,354 14,663 5,795
Interest expenses 244,673 425,040 17,230 22,070
Other income 356,921 293,874 42,940 21,582
Other expenses 646,720 612,251 20,672 25,468
Subsidiary companies
of the Bank
Associate companies
of the Bank
As at 31 December 2014
LKR '000
2013
LKR '000
2014
LKR '000
2013
LKR '000
(b) Items in statement of financial position
Assets
Loans 66,660 573,045 144,529 31,524
Overdrafts 48,447 75,174 - 91
Investments 212,661 246,010 - -
Placements 5,784,156 9,215,854 - -
Other receivables 276,827 356,413 - -
6,388,751 10,466,496 144,529 31,615
Liabilities
Due to customers 2,106,587 2,541,851 270,968 250,439
Securities sold under repurchase agreements 805,160 461,203 57,606 -
Debentures 341,906 10,347 - -
Other liabilities 94,849 200,376 2,058 1,780
3,348,502 3,213,777 330,632 252,219
(c ) Off balance sheet items
Letters of credit - - - 1,397
Guarantees 59,243 62,593 32,140 32,640
Undrawn facilities 2,175,741 1,643,304 55,000 79,909
2,234,984 1,705,897 87,140 113,946
(d) Average accommodations / due to customer balances
Loans 228,925 966,387 131,766 35,173
Overdrafts 42,892 116,489 133 7,975
Due to customers 2,319,143 2,342,249 231,518 189,523

295
Truly Everybody’s Bank
55.3.2 Transactions with subsidiaries and associate companies of the Group
In addition to the transactions between the Bank and its subsidiaries and associate companies, transactions which were
taken place between the subsidiaries and associate companies are also included in the section below:
Subsidiary companies Associate companies
For the year ended 31 December 2014
LKR '000
2013
LKR '000
2014
LKR '000
2013
LKR '000
(a) Items in Income Statement
Interest income 57,456 207,283 14,663 5,795
Interest expense 277,497 452,969 17,230 33,366
Other income 606,123 372,188 42,940 21,582
Other expenses 892,549 687,196 24,045 28,838
Subsidiary companies Associate companies
As at 31 December 2014
LKR '000
2013
LKR '000
2014
LKR '000
2013
LKR '000
(b) Items in Statement of Financial Position
Assets
Loans 66,660 577,012 144,529 31,524
Overdrafts 48,447 75,174 - 91
Investments 212,661 246,010 - -
Placements 5,784,156 9,215,854 - -
Other receivables 286,938 417,350 - -
6,398,862 10,531,400 144,529 31,615
Liabilities
Due to customers 2,113,304 2,594,062 270,968 250,439
Securities sold under repurchase agreements 805,160 461,203 57,606 -
Debentures 341,906 10,347 - -
Other liabilities 101,175 213,069 2,058 1,780
3,361,545 3,278,681 330,632 252,219
(c ) Off balance sheet items
Letters of credit - - - 1,397
Guarantees 59,243 62,593 32,140 32,640
Undrawn facilities 2,175,741 1,643,304 55,000 79,909
2,234,984 1,705,897 87,140 113,946
(d) Average accommodations / due to customer balances
Loans 231,625 969,470 131,766 35,173
Overdrafts 46,677 116,489 133 7,975
Due to customers 2,325,860 2,394,460 231,518 189,523

296
BANK OF CEYLON . Annual Report 2014
Notes to the Financial Statements
55 Related party disclosures (contd.)
55.4 Transactions with the significant investors having significant influence over the Bank and the post employment benefit
plans for Bank’s employees.
Significant investor of the Bank is the Government as it is a state owned entity. Government refers to the Government
of Sri Lanka, Government Corporations, Provincial Councils, Local Government bodies, other Government entities and
their subsidiaries. Post employment benefit plans are arrangements made by the Bank to provide post employment
benefit for its employees.
Transactions and arrangements entered into by the Bank with the Government and Government controlled entities
(significant investor) and post employment benefit plans which are individually significant and for other transactions
that are collectively, but not individually significant are as follows:
55.4.1 Transactions which are collectively significant
Significant investor Post employment benefit plans
For the year ended 31 December 2014
LKR '000
2013
LKR '000
2014
LKR '000
2013
LKR '000
(a) Items in Income Statement
Interest income 53,523,188 44,324,998 - -
Other income 2,176,547 1,328,749 - -
Interest expenses 12,261,228 8,858,532 6,264,541 10,619,058
Dividends paid 6,846,410 5,346,410 - -
Contribution made - - 2,693,384 2,960,719
(b) Items in Statement of Financial Position
Assets
Loans and advances 328,914,682 290,790,922 - -
Investment in securities and bonds 414,040,863 290,710,779 - -
Investment in equity instruments 1,126,648 4,277,026 - -
744,082,193 585,778,727 - -
Liabilities
Due to customers 164,152,416 113,565,125 34,598,638 36,273,553
Securities sold under repurchase agreements 41,484,975 20,434,888 1,570,389 367,628
Debentures 8,179,136 6,935,766 33,662,577 29,291,849
213,816,527 140,935,779 69,831,604 65,933,030
(c ) Off balance sheet items
Letters of credit 56,640,701 60,311,651 - -
Bills and acceptances 55,202,462 74,146,782 - -
Guarantees 17,499,071 13,274,268 - -
Forward exchange contracts 72,327,750 68,725,125 - -
201,669,984 216,457,826 - -
(d) Other transactions
Gross foreign exchange transactions
Sales 127,238,018 23,489,593 - -
Purchases 81,993,003 19,197,218 - -

297
Truly Everybody’s Bank
Significant investor Post employment benefit plans
As at 31 December 2014
LKR '000
2013
LKR '000
2014
LKR '000
2013
LKR '000
(e) Average accommodations / due to customers
Loans and advances 277,953,375 252,110,896 - -
Due to customers 115,432,228 101,502,713 32,907,367 32,846,278
Off balance sheet facilities 209,063,905 184,592,285 - -
55.4.2 Transactions which are individually significant
The Bank uses internal assessment methodology in order to identify significance of the transactions with the
Government and Government related entities. Accordingly, the transactions which have been considered in normal
day to day business operations which are carried on normal market conditions are considered as individually
significant transactions and reported below:
i The Government of Sri Lanka has allotted LKR 5,000 billion capital to the Bank as the first phase of the total allotment
of LKR 10,000 million as stipulated in National Budget 2015.
ii As stipulated in the Budget 2014, Bank of Ceylon’s investment in SriLankan Airlines was taken over by the
Government of Sri Lanka. This share buy back generated gains to the Bank by way of a provision reversal made on the
fall in value of the investment.
iii The Government of Sri Lanka, in terms of National Budget 2014 also made arrangements to settle long outstanding
loans to Bank of Ceylon from British Ceylon Corporation Lanka Ltd (BCC Lanka Ltd) and Lanka Salusala amounting
to LKR 294.2 million and LKR 35.0 million respectively.
55.4.3 Transactions with the significant investor - Group
Other than the transactions carried out by the Bank and balances held by the Bank with the Government, subsidiaries
of the Group have carried out following transactions with the Government and balances held with the Government as
follows:
Significant investor
As at 31 December 2014
LKR '000
2013
LKR '000
Investment in securities and bonds 1,818,605 2,100,514
Nostro balance with CBSL 137,486 106,922
Income from investment in securities and bonds 143,114 233,726
Apart from the transactions listed above, the Group carried out transactions with the Government of Sri Lanka and
other Government related entities in the form of providing services, investments in shares for trading purpose and
other financial service transactions including inter bank placements during the year ended 31 December 2014 on
comparable terms which are applicable to transactions between the Group and its unrelated customers.
56 Financial reporting by segment
Segmental information is presented in respect of Group business distinguishing the component of the Group that is
engaged in different business segments or operations within a particular economic environment which is subject to risk
and returns that are different from those of other segments.
56.1 Primary segment information - Operating segments -Group
Operating segments provide products and services whose risk and returns are different from other segments which
represents retail banking, corporate banking, international, treasury and investment, Group function and unallocated
segment.

298
BANK OF CEYLON . Annual Report 2014
56 Financial reporting by segment (Contd.)
56.1 Primary segment information - Operating segments -Group (Contd.)
Retail banking Corporate banking
For the year ended 31 December 2014 2013 2014 2013
LKR '000 LKR '000 LKR '000 LKR '000
Revenue from external customers:
Net interest income 20,114,226 24,892,002 8,073,919 7,251,504
Net fee and commission income 3,031,727 2,140,666 3,995,194 2,840,164
Other income 1,297,070 1,828,360 274,697 679,252
Total operating income 24,443,023 28,861,028 12,343,810 10,770,920
Impairement (charge)/reversal for loans and other losses (5,145,535) (6,653,066) (2,120,903) 258,247
Total operating expenses (16,091,497) (14,564,091) (3,977,846) (4,531,944)
Total expenses (21,237,032) (21,217,157) (6,098,749) (4,273,697)
Operating profit before VAT and NBT 3,205,991 7,643,871 6,245,061 6,497,223
VAT and NBT on financial services - - - -
Operating profit after VAT and NBT
Share of profit/(loss) of associate companies before tax - - - -
Profit/ (loss) before income tax 3,205,991 7,643,871 6,245,061 6,497,223
Income tax expense - - - -
Profit for the year
Total assets 389,085,482 356,467,732 411,205,706 397,754,640
Total liabilities 367,185,220 339,314,332 388,060,374 378,614,493
Cash flows from operating activities 33,628,329 31,075,094 13,498,527 9,053,754
Cash flows used in investing activities (543,552) (593,062) (574,454) (661,752)
Cash flows used in financing activities (9,110,991) (3,217,857) (9,628,968) (3,590,556)
Capital expenditure to non current assets - - - -
Depreciation and amortization expenses 348,765 333,735 368,593 372,389
Being the major customer of the Bank, “Government and State Owned Enterprises (SOEs)” represents 18% of revenue of the Bank,
(2013 : 18%) and included under Retail and Corporate segments. More details are given in the Note 55 - ‘Related party disclosures’.
Notes to the Financial Statements

299
Truly Everybody’s Bank
International, treasury and
investment
Group function Unallocated Total
2014 2013 2014 2013 2014 2013 2014 2013
LKR '000 LKR '000 LKR '000 LKR '000 LKR '000 LKR '000 LKR '000 LKR '000
9,449,501 4,367,552 2,304,007 2,196,565 812,409 634,228 40,754,062 39,341,851
609,055 578,630 215,719 192,479 472,084 183,074 8,323,779 5,935,013
6,098,856 3,397,706 2,833,378 2,808,777 1,058,531 (778,417) 11,562,532 7,935,678
16,157,412 8,343,888 5,353,104 5,197,821 2,343,024 38,885 60,640,373 53,212,542
- - (720,610) (408,234) 55,523 (536,091) (7,931,525) (7,339,144)
(4,254,298) (3,433,278) (3,286,891) (4,037,428) (24,579) (674,667) (27,635,111) (27,241,408)
(4,254,298) (3,433,278) (4,007,501) (4,445,662) 30,944 (1,210,758) (35,566,636) (34,580,552)
11,903,114 4,910,610 1,345,603 752,159 2,373,968 (1,171,873) 25,073,737 18,631,990
- - - - - - (4,105,175) (2,756,179)
20,968,562 15,875,811
- - 462,436 228,813 - - 462,436 228,813
11,903,114 4,910,610 1,808,039 980,972 2,373,968 (1,171,873) 21,430,998 16,104,624
- - - - - - (7,058,656) (3,956,302)
14,372,342 12,148,322
469,534,357 348,980,825 46,651,202 49,044,743 48,926,918 73,514,451 1,365,403,665 1,225,762,391
443,105,909 332,187,698 33,935,230 36,270,114 47,536,211 72,463,721 1,279,822,944 1,158,850,358
15,798,318 5,452,438 3,851,995 2,742,185 1,358,239 791,767 68,135,408 49,114,238
(26,115,957) (50,971,408) (149,522) (117,448) (68,350) (122,308) (27,451,835) (52,465,978)
(10,994,816) (3,150,272) (842,037) (343,964) (1,179,523) (687,204) (31,756,335) (10,989,853)
-
- - - - - - 1,986,043 2,184,849
420,877 326,725 223,915 210,197 268,707 254,194 1,630,857 1,497,240

300
BANK OF CEYLON . Annual Report 2014
Notes to the Financial Statements
56 Financial reporting by segment (Contd.)
56.2 Secondary segment information - Geographical segments
Geographical Segments provide products or services within a particular economic environment where risk and returns are different from
those of other economic environments. These segment comprise domestic operations, Off shore Banking Division and Overseas Banking
Units.
Bank Group
2014
LKR ‘000 %
2013
LKR ‘000 %
2014
LKR ‘000 %
2013
LKR ‘000 %
Assets
Domestic Banking Unit 1,069,304,673 80.5 927,016,489 77.6 1,095,133,083 80.2 944,942,649 77.1
Off shore Banking Division 241,154,979 18.1 250,329,609 21.0 241,154,979 17.7 250,329,609 20.4
Overseas Banking Units 18,560,743 1.4 16,234,802 1.4 29,115,603 2.1 30,490,133 2.5
1,329,020,395 100.0 1,193,580,900 100.0 1,365,403,665 100.0 1,225,762,391 100.0
Total income
Domestic Banking Unit 111,700,828 88.3 110,407,209 86.6 117,854,788 88.6 116,820,090 87.0
Off shore Banking Division 12,174,722 9.6 14,920,266 11.7 12,174,722 9.2 14,920,266 11.1
Overseas Banking Units 2,670,393 2.1 2,136,583 1.7 2,993,835 2.2 2,489,285 1.9
126,545,943 100.0 127,464,058 100.0 133,023,345 100.0 134,229,641 100.0
Profit before tax
Domestic Banking Unit 18,101,977 89.2 12,196,170 77.6 19,370,527 90.4 12,651,614 78.6
Off shore Banking Division 786,463 3.9 2,671,545 17.0 786,463 3.7 2,671,545 16.6
Overseas Banking Units 1,402,517 6.9 841,057 5.4 1,274,008 5.9 781,465 4.8
20,290,957 100.0 15,708,772 100.0 21,430,998 100.0 16,104,624 100.0
Profits after tax
Domestic Banking Unit 12,011,966 88.5 9,568,106 79.2 12,938,760 90.1 9,688,907 79.8
Off shore Banking Division 566,254 4.2 1,923,512 15.9 566,254 3.9 1,923,512 15.8
Overseas Banking Units 995,837 7.3 595,495 4.9 867,328 6.0 535,903 4.4
13,574,057 100.0 12,087,113 100.0 14,372,342 100.0 12,148,322 100.0

301
Truly Everybody’s Bank
57 Fair value of assets and liabilities
57.1 Valuation models
For all financial instruments where fair values are determined by referring to externally quoted prices or observable pricing inputs to
models, independent price determination or validation is obtained. In an inactive market, direct observation of a traded price may not
be possible. In these circumstances, the Bank uses alternative market information to validate the financial instrument’s fair value, with
greater weight given to information that is considered to be more relevant and reliable.
Fair values are determined according to the following hierarchy:
Level 1 : Quoted market price (unadjusted) : financial instruments with quoted price in active markets.
Level 2 : Valuation technique using non observable inputs : financial instruments with quoted prices for similar instruments in
active markets or quoted prices for identical or similar instruments in inactive markets and financial instruments are
valued using models where all significant inputs are observable.
Level 3 : Valuation technique with significant unobservable inputs : financial instruments are valued using valuation techniques
where one or few significant inputs are non observable.
The following tables show an analysis of financial instruments recorded at fair value by level of the fair value hierarchy.

302
BANK OF CEYLON . Annual Report 2014
Notes to the Financial Statements
57 Fair value of assets and liabilities (Contd.)
Bank Group
As at 31 December 2014Level 1
LKR ‘000
Level 2
LKR ‘000
Level 3
LKR ‘000
Total
LKR ‘000
Level 1
LKR ‘000
Level 2
LKR ‘000
Level 3
LKR ‘000
Total
LKR ‘000
57.2 Assets measured at fair
value - Fair value hierarchy
Financial assets
Derivative Financial instruments
Currency SWAPs - - 1,489,402 1,489,402 - - 1,489,402 1,489,402
Forward exchange contracts - 225,154 - 225,154 - 225,154 - 225,154
- 225,154 1,489,402 1,714,556 - 225,154 1,489,402 1,714,556
Financial assets - Held for trading
Treasury bills 10,207,422 - - 10,207,422 10,207,422 - - 10,207,422
Treasury bonds 4,088,760 476,633 - 4,565,393 4,088,760 476,633 - 4,565,393
Sri Lanka sovereign bonds 141,022 - - 141,022 141,022 - - 141,022
Other debt securities - - - - 2,504 - - 2,504
Quoted equities 2,948,596 - - 2,948,596 3,518,833 - - 3,518,833
Unit trusts - - - - 2,784 2,784
17,385,800 476,633 - 17,862,433 17,961,325 476,633 - 18,437,958
Financial investments - Available
for sale
Quoted investments
Treasury bills 1,932,324 - - 1,932,324 2,599,681 - - 2,599,681
Treasury bonds 413,604 64,971 - 478,575 1,412,916 64,971 - 1,477,887
Government securities - Other
countries 1,383,460 - - 1,383,460 1,593,537 - - 1,593,537
Equities 5,627,221 - - 5,627,221 6,651,013 - - 6,651,013
Unit trusts - 4,517,362 - 4,517,362 - 4,845,873 - 4,845,873
Unquoted investments
Equities - 194,884 227,717 422,601 - 194,884 248,285 443,169
9,356,609 4,777,217 227,717 14,361,543 12,257,147 5,105,728 248,285 17,611,160
Non financial assets
Property, plant and equipment - - 16,188,333 16,188,333 - - 25,646,016 25,646,016
- - 16,188,333 16,188,333 - - 25,646,016 25,646,016
Total 26,742,409 5,479,004 17,905,452 50,126,865 30,218,472 5,807,515 27,383,703 63,409,690
Financial Liabilities
Derivative financial instruments
Forward exchange contracts - 734,548 - 734,548 - 734,548 - 734,548
Total - 734,548 - 734,548 - 734,548 - 734,548

303
Truly Everybody’s Bank
Bank Group
As at 31 December 2013Level 1
LKR ‘000
Level 2
LKR ‘000
Level 3
LKR ‘000
Total
LKR ‘000
Level 1
LKR ‘000
Level 2
LKR ‘000
Level 3
LKR ‘000
Total
LKR ‘000
Financial assets
Derivative financial instruments
Currency SWAPs - - 2,889,583 2,889,583 - - 2,889,583 2,889,583
Forward exchange contracts - 371,490 - 371,490 - 371,490 - 371,490
- 371,490 2,889,583 3,261,073 - 371,490 2,889,583 3,261,073
Financial assets - Held for trading
Treasury bills 7,372,137 - - 7,372,137 7,372,137 - - 7,372,137
Treasury bonds 3,810,889 - - 3,810,889 3,810,889 - - 3,810,889
Sri Lanka sovereign bonds 129,949 - - 129,949 129,949 - - 129,949
Quoted equities 2,226,816 - - 2,226,816 2,585,267 - - 2,585,267
13,539,791 - - 13,539,791 13,898,242 - - 13,898,242
Financial investments -
Available for sale
Quoted investments -
Treasury bills 451,210 - - 451,210 770,842 - - 770,842
Treasury bonds 18,254 5,282 - 23,536 1,113,921 - - 1,113,921
Government securities - Other
countries 1,186,224 - - 1,186,224 1,408,777 - - 1,408,777
Equities 3,628,367 - - 3,628,367 4,492,191 - - 4,492,191
Unit trusts - 3,395,575 - 3,395,575 - 3,402,203 - 3,402,203
Unquoted investments
Equities - - 1,640,302 1,640,302 - - 1,664,511 1,664,511
5,284,055 3,400,857 1,640,302 10,325,214 7,785,731 3,402,203 1,664,511 12,852,445
Non financial assets
Property, plant and equipment - - 12,006,180 12,006,180 - - 20,622,161 20,622,161
- - 12,006,180 12,006,180 - - 20,622,161 20,622,161
Total 18,823,846 3,772,347 16,536,065 39,132,258 21,683,973 3,773,693 25,176,255 50,633,921
Financial Liabilities
Derivative financial instruments
Forward exchange contracts - 274,948 - 274,948 - 274,948 274,948
Total - 274,948 - 274,948 - 274,948 - 274,948

304
BANK OF CEYLON . Annual Report 2014
Notes to the Financial Statements
57 Fair value of assets and liabilities (Contd.)
57.3 Movements in level 3 assets measured at fair value
The following table shows a reconciliation of the opening and closing amounts of level 3 assets and liabilities which are recorded at fair
value.
Bank Group
As at 1
January
2014
Total gains/
(losses)
recorded
in profit or
loss
Total gains/
(losses)
recorded in
OCI
Purchases/
(sales)
and
adjust-
ments
As at 31
December
2014
As at 1
January
2014
Total gains/
(losses)
recorded
in profit or
loss
Total gains
(losses)
recorded in
OCI
Purchases/
(sales)
and adjust-
ments
As at 31
December
2014
LKR '000 LKR '000 LKR '000 LKR '000 LKR '000 LKR '000 LKR '000 LKR '000 LKR '000 LKR '000
Financial assets
Derivative financial
instruments
Currency SWAPs 2,889,583 - - (1,400,181) 1,489,402 2,889,583 - - (1,400,181) 1,489,402
Financial investments -
Available for sale
Unquoted investments
Equities 1,640,302 - (40,168) (1,372,417) 227,717 1,664,511 - (43,809) (1,372,417) 248,285
Total Level 3 financial
assets 4,529,885 - (40,168) (2,772,598) 1,717,119 4,554,094 - (43,809) (2,772,598) 1,737,687
Non financial assets
Property, plant and
equipment 12,006,180 (64,010) 3,557,500 688,663 16,188,333 20,622,161 (64,010) 4,676,153 411,712 25,646,016
Total Level 3 assets 16,536,065 (64,010) 3,517,332 (2,083,935) 17,905,452 25,176,255 (64,010) 4,632,344 (2,360,886) 27,383,703
Financial liabilities
Total Level 3 financial
liabilities - - - - - - - - - -

305
Truly Everybody’s Bank
Bank Group
As at 1
January
2013
Total gains/
(losses)
recorded
in profit or
loss
Total gains/
(losses)
recorded in
OCI
Purchases/
(sales) and
adjust-
ments
As at 31
December
2013
As at 1
January
2013
Total gains/
(losses)
recorded
in profit or
loss
Total gains
(losses)
recorded in
OCI
Purchases/
(sales)
and adjust
ments
As at 31
December
2013
LKR '000 LKR '000 LKR '000 LKR '000 LKR '000 LKR '000 LKR '000 LKR '000 LKR '000 LKR '000
Financial assets
Derivative financial
instruments
Currency SWAPs 65,000 - - 2,824,583 2,889,583 65,000 - - 2,824,583 2,889,583
Financial investments -
Available for sale
Unquoted investments
Equities 1,640,480 - - (178) 1,640,302 1,667,866 (8,008) 1,221 3,432 1,664,511
Total Level 3 financial
assets 1,705,480 - - 2,824,405 4,529,885 1,732,866 (8,008) 1,221 2,828,015 4,554,094
Non financial assets
Property, plant and
equipment 11,430,827 - - 575,353 12,006,180 18,437,863 - 173,252 2,011,046 20,622,161
Total Level 3 assets 13,136,307 - - 3,399,758 16,536,065 20,170,729 (8,008) 174,473 4,839,061 25,176,255
Financial liabilities
Total Level 3 financial
liabilities - - - - - - - - - -

306
BANK OF CEYLON . Annual Report 2014
Notes to the Financial Statements
57 Fair value of assets and liabilities (Contd.)
57.4 Unobservable inputs used in measuring fair value
The table below sets out information about significant unobservable inputs used as at 31 December 2014 in measuring
financial instruments categorized as level 3 in the fair value hierarchy
Type of financial
instrument
Fair
value
at 31
December
2014
LKR’000
Valuation
technique
Significant
unobservable
input
Range of estimates
(Weighted average) for
unobservable input
Fair value measurement
sensitivity to unobservable
input
Derivative financial
instruments
Currency SWAPs 1,489,402 Forward pricing
model
Foreign exchange
forward rate.
Negative 0.01 to positive
0.01 basis point.
Unfavourable or
favourable impact on
derivative assets value
of LKR 5.5 million
respectively.
Discount for
counterparty
credit risk.
AFS financial assets
in unquoted equity
shares
Regional Development
Bank
162,300 Discounted
cash flow
method
Constant
dividend model
Decreased by 5% and
increased by 5% for
existing cost of capital.
Impact to the fair value
will be within negative and
positive LKR 8 million
no significant impact to
the investment.
Credit Information
Bureau of Sri Lanka
41,542 Value at cost* * Fair value cannot be
reliably measured,
These are investments
in mutual entities that
provide transaction
processing and transaction
services to members on a
pricing basis intended to
recover the entities
operating cost.
Fitch Ratings Lanka
Limited
625 Value at cost*
LankaClear (Private)
Limited
21,000 Value at cost*
Lanka Financial Services
Bureau Limited
2,250 Value at cost*
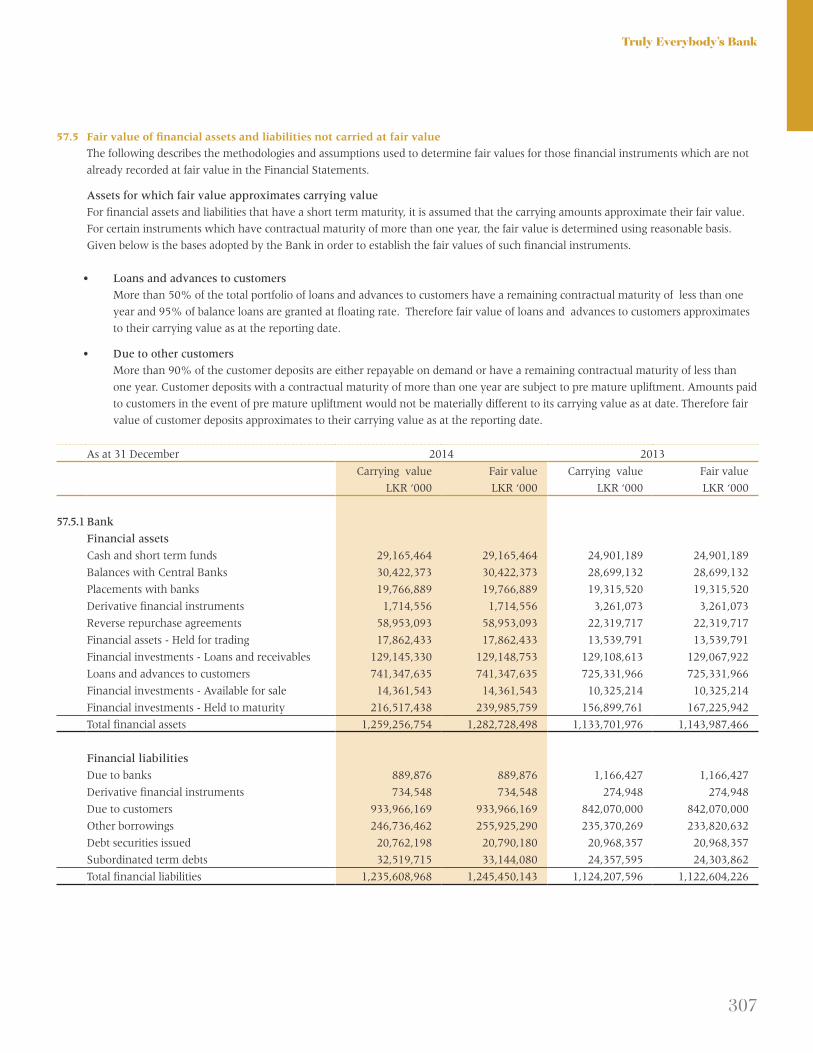
307
Truly Everybody’s Bank
57.5 Fair value of financial assets and liabilities not carried at fair value
The following describes the methodologies and assumptions used to determine fair values for those financial instruments which are not
already recorded at fair value in the Financial Statements.
Assets for which fair value approximates carrying value
For financial assets and liabilities that have a short term maturity, it is assumed that the carrying amounts approximate their fair value.
For certain instruments which have contractual maturity of more than one year, the fair value is determined using reasonable basis.
Given below is the bases adopted by the Bank in order to establish the fair values of such financial instruments.
• Loansandadvancestocustomers
More than 50% of the total portfolio of loans and advances to customers have a remaining contractual maturity of less than one
year and 95% of balance loans are granted at floating rate. Therefore fair value of loans and advances to customers approximates
to their carrying value as at the reporting date.
• Duetoothercustomers
More than 90% of the customer deposits are either repayable on demand or have a remaining contractual maturity of less than
one year. Customer deposits with a contractual maturity of more than one year are subject to pre mature upliftment. Amounts paid
to customers in the event of pre mature upliftment would not be materially different to its carrying value as at date. Therefore fair
value of customer deposits approximates to their carrying value as at the reporting date.
As at 31 December 2014 2013
Carrying value
LKR ‘000
Fair value
LKR ‘000
Carrying value
LKR ‘000
Fair value
LKR ‘000
57.5.1 Bank
Financial assets
Cash and short term funds 29,165,464 29,165,464 24,901,189 24,901,189
Balances with Central Banks 30,422,373 30,422,373 28,699,132 28,699,132
Placements with banks 19,766,889 19,766,889 19,315,520 19,315,520
Derivative financial instruments 1,714,556 1,714,556 3,261,073 3,261,073
Reverse repurchase agreements 58,953,093 58,953,093 22,319,717 22,319,717
Financial assets - Held for trading 17,862,433 17,862,433 13,539,791 13,539,791
Financial investments - Loans and receivables 129,145,330 129,148,753 129,108,613 129,067,922
Loans and advances to customers 741,347,635 741,347,635 725,331,966 725,331,966
Financial investments - Available for sale 14,361,543 14,361,543 10,325,214 10,325,214
Financial investments - Held to maturity 216,517,438 239,985,759 156,899,761 167,225,942
Total financial assets 1,259,256,754 1,282,728,498 1,133,701,976 1,143,987,466
Financial liabilities
Due to banks 889,876 889,876 1,166,427 1,166,427
Derivative financial instruments 734,548 734,548 274,948 274,948
Due to customers 933,966,169 933,966,169 842,070,000 842,070,000
Other borrowings 246,736,462 255,925,290 235,370,269 233,820,632
Debt securities issued 20,762,198 20,790,180 20,968,357 20,968,357
Subordinated term debts 32,519,715 33,144,080 24,357,595 24,303,862
Total financial liabilities 1,235,608,968 1,245,450,143 1,124,207,596 1,122,604,226

308
BANK OF CEYLON . Annual Report 2014
Notes to the Financial Statements
57 Fair value of assets and liabilities (Contd.)
As at 31 December 2014 2013
Carrying value
LKR ‘000
Fair value
LKR ‘000
Carrying value
LKR ‘000
Fair value
LKR ‘000
57.5.2 Group
Financial assets
Cash and short term funds 29,958,559 29,958,559 25,182,043 25,182,043
Balances with Central Banks 30,422,373 30,422,373 28,699,132 28,699,132
Placements with banks 21,393,574 21,393,574 21,157,190 21,157,190
Derivative financial instruments 1,714,556 1,714,556 3,261,073 3,261,073
Reverse repurchase agreements 60,236,389 60,236,389 22,851,895 22,851,895
Financial assets - Held for trading 18,437,958 18,437,958 13,898,242 13,898,242
Financial investments - Loans and receivables 129,966,806 129,970,229 130,190,296 130,149,465
Loans and advances to customers 763,772,052 763,772,052 746,571,819 746,571,819
Financial investments - Available for sale 17,611,160 17,611,160 12,852,445 12,852,445
Financial investments - Held to maturity 216,740,132 240,208,453 157,441,572 167,579,630
Total financial assets 1,290,253,559 1,313,725,303 1,162,105,707 1,172,202,934
Financial liabilities
Due to banks 949,127 949,127 1,336,267 1,336,267
Derivative financial instruments 734,548 734,548 274,948 274,948
Due to customers 943,934,463 943,934,463 850,767,521 850,767,521
Other borrowings 252,168,157 261,356,985 240,802,111 239,252,474
Debt securities issued 26,218,337 26,246,320 24,986,818 24,986,818
Subordinated term debts 32,177,810 32,802,175 24,347,248 24,293,515
Total financial liabilities 1,256,182,442 1,266,023,618 1,142,514,913 1,140,911,543
58 Risk management
58.1 Introduction
58.1.1 Overview
The Bank considers Credit risk, Market risk, Liquidity risk and Operational risk as key risks faced by the Bank. Information presented in
this note focuses on the Bank’s exposure to above risks.
58.1.2 Group risk management
Bank of Ceylon Group consist of 12 subsidiaries and five associate companies. Their principal activities spread over diverse range.
Their income and expenses are less than 5% of the Group’s income and expenses and their total assets and liabilites are less than 3%
of the Group’s total assets and liabilities. Therefore the affairs of subsidiaries and associates do not have significant impact to the risk
management.
However, the Bank is managing the strategic risk through comprehensive review of group activities on a quarterly basis. Senior officers
of the Bank are representing on such boards and these officers, are involved in risk and audit committees, so that the Bank closely
involves in risk and audit affairs of subsidiaries. On special circumstances Internal Auditor of the Bank carries out audits in subsidiaries.
In addition, the Bank has developed and implemented a reporting mechanism for subsidiaries through risk dash boards. The dash board
includes all the headline risk indicators of the respective subsidiary companies.

309
Truly Everybody’s Bank
58.1.3 Risk management framework
Risk management governance structure of the Bank, begins with oversight by the Board of Directors, which assures the performance
of overall risk management framework. The Board establishes the risk appetite and sets strategic direction through risk management
policies. The Bank’s Independent Integrated Risk Management Division (IIRMD) is headed by the Chief Risk Officer (CRO), who
directly reports to the Integrated Risk Management Committee (IRMC), which is a subcommittee of the Board. CRO is also a member
of management level committees such as Credit Committee, Asset and Liability Management Committee (ALCO), Operational Risk
Management Executive Committee (ORMEC), IT Steering Committee and Non Performing Advances Monitoring Committee, which
assist in managing various risks that the Bank is exposed to.
58.1.4 Risk measurement and reporting systems
The Bank’s risks are measured using a method that reflects both the expected loss likely to arise in normal circumstances and unexpected
losses, which are an estimate of the ultimate actual loss based on statistical models. The models make use of probabilities derived from
historical experience, adjusted to reflect the economic environment. The Bank also runs worst-case scenarios that would arise in the
event that extreme events which are unlikely to occur, in fact, do occur.
Monitoring and controlling risks are primarily performed based on limits established by the Bank. The risk appetite and limits for the
Bank are approved by the IRMC based on inputs from the IIRMD by considering the operating business environment and the types of
risk taking activities that are assumed in pursuit of the Bank’s strategic and financial objectives. In the limits setting process through risk
appetite statement, the Bank is controlling the risk-taking activities within the tolerance limits for Credit, Market, and Operational risk.
In addition to that the Bank has an internal process for assessing its overall capital adequacy in relation to the Bank’s risk profile and
a strategy for maintaining its capital levels. The Internal Capital Adequacy Assessment Process (ICAAP) sets out the framework for the
Bank’s internal governance, and the operation of the risk and capital planning. The process provides an assurance that the Bank has
adequate capital to support all risks in its business and an appropriate capital buffer based on its business profile.
The IRMC receives a comprehensive risk report on a regular basis which is designed to provide all the necessary information to assess
and manage risks of the Bank.
58.1.5 Risk mitigation
As part of its overall risk management, the Bank uses mitigation techniques and strategies to reduce the risk. In managing credit risks
the Bank actively uses counterparty evaluation to reduce its credit risks. Collaterals are used to further mitigate losses. Market risk is
mitigated using derivative instruments in limited context. Strong internal control mechanism is in place to manage operational risks and
insurance is used as a operational risk transfer strategy where necessary.
58.2 Credit risk
Credit risk management process is based on credit risk management policy and lending guidelines approved by the Board of Directors.
These documents lay down the conditions and guidelines for granting, maintenance, monitoring and management of credit, at both
transaction and portfolio levels.
58.2.1 Maximum exposure to credit risk
58.2.1.1 Collateral and other credit enhancements
The Bank obtains collateral from borrowers/ counterparties in order to mitigate credit risk. The amount / types of collateral required
depend on the credit risk assessment of the counterparty. Guidelines are in place covering the acceptability and valuation of each type of
collateral. The main types of collateral obtained are as follows.
•Forsecuritieslendingandreverserepurchasetransactions,cashorsecurities
•Forcommerciallending,chargesoverimmovableproperties,inventoryandtradereceivables
•Forpersonallending,mortgagesoverproperties,cashandcashequivalentsandgoldarticles
•ForGovernmentandStateOwnedEnterprises,SoveriegnGuarantee
The Bank monitors the market value of collateral, and will request additional collateral in accordance with the underlying agreement. It
is the Bank’s policy to dispose of repossessed properties in an orderly fashion. The proceeds are used to reduce or repay the outstanding
claim. In general, the Bank does not occupy repossessed properties for business use.
The following table shows the maximum exposure to credit risk, total fair value of collateral, any surplus collateral and the net exposure
to credit risk.

310
BANK OF CEYLON . Annual Report 2014
Notes to the Financial Statements
58 Risk management [Contd.]
58.2 Credit risk [Contd.]
58.2.1 Maximum exposure to credit risk [Contd.]
58.2.1.2 Types of collateral or other credit enhancements
Fair value of collateral and
As at 31 December 2014
Maximum
exposure to credit
risk Cash Gold
GOSL securities /
Guarantees
LKR ‘000 LKR ‘000 LKR ‘000 LKR ‘000
Cash and short term funds 29,165,464 24,446,916 - -
Balances with Central Banks 30,422,373 30,422,373 - -
Placements with banks 19,766,889 - - -
Derivative financial instruments 1,714,556 - - -
Reverse repurchase agreements 58,953,093 - - 58,953,093
Financial assets - Held for trading 17,862,433 - - 14,913,836
Financial investments - Loans and receivables 129,145,330 - - 126,871,348
Loans and advances to customers 777,504,915 32,178,836 102,506,473 269,326,338
Less : Impairment on loans and advances (36,157,280) - - -
Financial investments - Available for sale 14,361,543 - - 3,794,359
Financial investments - Held to maturity 216,517,438 - - 158,643,938
Total financial assets 1,259,256,754 87,048,125 102,506,473 632,502,912
Fair value of collateral and
As at 31 December 2013
Maximum
exposure to credit
risk Cash Gold
GOSL securities /
Guarantees
LKR ‘000 LKR ‘000 LKR ‘000 LKR ‘000
Cash and short term funds 24,901,189 20,371,373 - -
Balances with Central Banks 28,699,132 28,699,132 - -
Placements with banks 19,315,520 - - -
Derivative financial instruments 3,261,073 - - -
Reverse repurchase agreements 22,319,717 - - 22,319,717
Financial assets - Held for trading 13,539,791 - - 11,312,975
Financial investments - Loans and receivables 129,108,613 - - 127,226,070
Loans and advances to customers 755,385,146 45,037,932 176,422,361 205,389,764
Less : Impairment on loans and advances (30,053,180)
Financial investments - Available for sale 10,325,214 - 1,660,970
Financial investments - Held to maturity 156,899,761 - - 112,107,661
Total financial assets 1,133,701,976 94,108,437 176,422,361 480,017,157

311
Truly Everybody’s Bank
other credit enhancements held
Movables Property Others
Surplus
collateral Net collateral Net exposure
LKR ‘000 LKR ‘000 LKR ‘000 LKR ‘000 LKR ‘000 LKR ‘000
- - - - 24,446,916 4,718,548
- - - - 30,422,373 -
- - - - - 19,766,889
- - - - - 1,714,556
- - - - 58,953,093 -
- - - - 14,913,836 2,948,597
- - - - 126,871,348 2,273,982
74,463,145 131,950,477 31,105,556 (87,680,794) 553,850,031 223,654,884
- - - - - (36,157,280)
- - - - 3,794,359 10,567,184
- - - - 158,643,938 57,873,500
74,463,145 131,950,477 31,105,556 (87,680,794) 971,895,894 287,360,860
other credit enhancements held
Movables Property Others
Surplus
collateral Net collateral Net exposure
LKR ‘000 LKR ‘000 LKR ‘000 LKR ‘000 LKR ‘000 LKR ‘000
- - - - 20,371,373 4,529,816
- - - - 28,699,132 -
- - - - - 19,315,520
- - - - - 3,261,073
- - - - 22,319,717 -
- - - - 11,312,975 2,226,816
- - - - 127,226,070 1,882,543
57,976,312 132,462,987 33,584,099 (108,333,627) 542,539,828 212,845,318
(30,053,180)
- - - - 1,660,970 8,664,244
- - - - 112,107,661 44,792,100
57,976,312 132,462,987 33,584,099 (108,333,627) 866,237,726 267,464,250

312
BANK OF CEYLON . Annual Report 2014
Notes to the Financial Statements
58 Risk management [Contd.]
58.2 Credit risk [Contd.]
58.2.2 Credit quality by class of financial assets
IIRMD internally developed a corporate borrower rating system and credit scoring models. The borrower rating system
categorizes all performing corporate credits into nine grades on the basis of underlying credit quality. For consumer
lending, the Bank has developed credit-scoring models for processing loan applications and monitoring credit quality.
At each reporting date the Bank assesses whether there is objective evidence that a financial asset or a group of
financial assets is impaired. A financial asset or a group of financial assets is impaired when objective evidence
demonstrates that there is an incurred loss.
Impairment losses on assets carried at amortized cost are measured as the difference between the carrying amount
of the financial asset and the present value of estimated future cash flows discounted at the asset’s original effective
interest rate. Impairment losses are recognized in profit or loss and reflected in an impairment charges against loans
and advances.
A detailed note on impairment of loans and advances is in note 26 to the Financial Statements.
The Bank writes off certain loans and advances and investment securities when they are determined to be
uncollectible.
The table below shows the credit quality by class of asset for all financial assets exposed to credit risk, based on the
Bank’s internal credit rating system and intrinsic risk of the financial assets. High grade includes advances granted
to GOSL and loans and advances granted to corporate borrowers whose internal credit ratings are AAA, AA or A.
Standard grade consists of corporate borrowers whose internal credit rating is BBB, BB or B. Substandard grade
includes corporate borrowers whose credit rating is CCC, CC or C.

313
Truly Everybody’s Bank
Neither past due/Nor impaired
As at 31 December 2014
High grade Standard grade
Substandard
grade
Grades not
allocated /
Unrated
Past due
but not
individually
impaired
Individually
impaired Total
LKR ‘000 LKR ‘000 LKR ‘000 LKR ‘000 LKR ‘000 LKR ‘000 LKR ‘000
Cash and short term funds 29,165,464 - - - - - 29,165,464
Balances with Central Banks 30,422,373 - - - - - 30,422,373
Placements with banks 10,715,246 - - 9,051,643 - - 19,766,889
Derivative financial
instruments 1,714,556 - - - - - 1,714,556
Reverse repurchase
agreements 58,953,093 - - - - - 58,953,093
Financial assets - Held for
trading 14,913,836 - - 2,948,597 - - 17,862,433
Financial investments - Loans
and receivables 126,871,348 - - 2,273,982 - - 129,145,330
Loans and advances to
customers 196,133,149 40,964,259 131,266,488 241,123,639 148,178,332 19,839,048 777,504,915
Less : Impairment on loans
and advances - - - - - - (36,157,280)
Financial investments -
Available for sale 3,794,359 - - 10,567,184 - - 14,361,543
Financial investments - Held
to maturity 216,517,438 - - - - - 216,517,438
Total financial assets 689,200,862 40,964,259 131,266,488 265,965,045 148,178,332 19,839,048 1,259,256,754
Past due but not individually impaired
Age analysis of past due but not
individually impaired loans
Less than
30 days
31 to 60
days
61 to 90
days
91 to 180
days
181 days
and over Total
LKR ‘000 LKR ‘000 LKR ‘000 LKR ‘000 LKR ‘000 LKR ‘000
Loans and advances to customers 72,325,934 21,884,127 2,037,933 5,743,706 46,186,632 148,178,332
Note : Age analysis of past due but not individually impaired loans include facilities in arrears of one day and above.

314
BANK OF CEYLON . Annual Report 2014
Notes to the Financial Statements
58 Risk management [Contd.]
58.2 Credit risk [Contd.]
58.2.2 Credit quality by class of financial assets (Contd.)
Neither past due/Nor impaired
As at 31 December 2013
High grade Standard grade
Substandard
grade
Grades not
allocated /
Unrated
Past due
but not
individually
impaired
Individually
impaired Total
LKR ‘000 LKR ‘000 LKR ‘000 LKR ‘000 LKR ‘000 LKR ‘000 LKR ‘000
Cash and short term funds 24,901,189 - - - - - 24,901,189
Balances with Central Banks 28,699,132 - - - - - 28,699,132
Placements with banks 14,357,560 - - 4,957,960 - - 19,315,520
Derivative financial
instruments 3,261,073 - - - - - 3,261,073
Reverse repurchase
agreements 22,319,717 - - - - - 22,319,717
Financial assets - Held for
trading 11,312,975 - - 2,226,816 - - 13,539,791
Financial investments - Loans
and receivables 127,226,070 - - 1,882,543 - - 129,108,613
Loans and advances to
customers 140,091,047 35,210,823 147,334,945 298,375,117 119,440,120 14,933,094 755,385,146
Less : Impairment on loans
and advances - - - - - - (30,053,180)
Financial investments -
Available for sale 1,660,970 - - 7,201,794 - 1,462,450 10,325,214
Financial investments - Held
to maturity 156,899,761 - - - - 156,899,761
Total financial assets 530,729,494 35,210,823 147,334,945 314,644,230 119,440,120 16,395,544 1,133,701,976
Past due but not individually impaired
Age analysis of past due but not
individually impaired loans
Less than
30 days
31 to 60
days
61 to 90
days
91 to 180
days
181 days
and over Total
LKR ‘000 LKR ‘000 LKR ‘000 LKR ‘000 LKR ‘000 LKR ‘000
Loans and advances to customers 61,467,451 22,062,143 5,933,429 5,296,425* 24,680,672* 119,440,120
* This include LKR 11,860.4 million of pawning advances, which are secured by gold.
Note : Age analysis of past due but not individually impaired loans include facilities in arrears of one day and above.

315
Truly Everybody’s Bank
58.2.3 Analysis of risk concentration
At portfolio level, risk arise from concentration of exposures to individual / group of borrowers, industry / sectors and
geographical regions.
Country wise exposure
The Bank maintains exposures outside Sri Lanka mainly due to its three branches in India, Maldives and Seychelles
and the fully owned subsidiary operating in United Kingdom namely Bank of Ceylon (UK) Limited. All overseas
branches are operating with pre-set limits (credit limits as well as country limits) and are approved by the Board of
Directors while the credits are managed through delegated authority where the higher levels of authority is retained
within Head Office in Colombo.
Bank of Ceylon (UK) Limited is operating under regulatory purview of United Kingdom Prudential Regulation
Authority and by having the control over the decentralized credit decision through the Board of Directors appointed
by the Bank. The key staff including Chief Executive Officer and Deputy Chief Executive Officer are the employees
seconded from Bank of Ceylon. Subsidiary operations have established risk exposure levels as part of its risk
management framework.
Exposures in other countries include placements with banks and nostro account balances with correspondent banks
whose risks are managed through Board approved bank limits and country limits.
Borrowings in other countries include two senior notes, worth USD 500 million each, which are listed in Singapore
Stock Exchange.

316
BANK OF CEYLON . Annual Report 2014
Notes to the Financial Statements
58 Risk management [Contd.]
58.2 Credit risk [Contd.]
58.2.3 Analysis of risk concentration (Contd.)
Country wise exposure
As at 31 December 2014 Sri Lanka
United
Kingdom Maldives India
United States
of America Seychelles
Other
countries Total
LKR ‘000 LKR ‘000 LKR ‘000 LKR ‘000 LKR ‘000 LKR ‘000 LKR ‘000 LKR ‘000
Financial assets
Cash and short term funds 24,408,036 444,469 92,171 59,811 2,744,287 33,358 1,383,332 29,165,464
Balances with Central Banks 26,612,011 - 3,298,742 387,223 - 124,397 - 30,422,373
Placements with banks 9,160,983 9,555,918 - 1,049,988 - - - 19,766,889
Derivative financial instruments 1,714,556 - - - - - - 1,714,556
Reverse repurchase agreements 58,953,093 - - - - - - 58,953,093
Financial assets - Held for trading 17,862,433 - - - - - - 17,862,433
Financial investments - Loans and receivables 111,920,245 - 16,130,311 1,094,774 - - - 129,145,330
Loans and advances to customers 727,910,751 - 9,149,503 4,082,744 - 204,637 - 741,347,635
Financial investments - Available for sale 14,166,659 - - - 194,884 - - 14,361,543
Financial investments - Held to maturity 216,517,438 - - - - - - 216,517,438
Total financial assets 1,209,226,205 10,000,387 28,670,727 6,674,540 2,939,171 362,392 1,383,332 1,259,256,754
Financial liabilities
Due to banks 889,876 - - - - - - 889,876
Derivative financial instruments 734,548 - - - - - - 734,548
Due to customers 917,433,933 - 12,957,947 2,781,701 - 792,588 - 933,966,169
Other borrowings 67,934,622 - - 193,539 550,531 - 178,057,770 246,736,462
Debt securities issued 20,762,198 - - - - - - 20,762,198
Subordinated term debts 32,519,715 - - - - - - 32,519,715
Total financial liabilities 1,040,274,892 - 12,957,947 2,975,240 550,531 792,588 178,057,770 1,235,608,968

317
Truly Everybody’s Bank
As at 31 December 2013 Sri Lanka
United
Kingdom Maldives India
United States
of America Seychelles
Other
countries Total
LKR ‘000 LKR ‘000 LKR ‘000 LKR ‘000 LKR ‘000 LKR ‘000 LKR ‘000 LKR ‘000
Financial assets
Cash and short term funds 20,296,769 335,096 217,736 60,898 2,344,337 - 1,646,353 24,901,189
Balances with Central Banks 24,513,439 - 3,930,655 255,038 - - - 28,699,132
Placements with banks 4,993,602 9,402,682 - 1,908,421 - - 3,010,815 19,315,520
Derivative financial instruments 3,261,073 - - - - - - 3,261,073
Reverse repurchase agreements 22,319,717 - - - - - - 22,319,717
Financial assets - Held for trading 13,539,791 - - - - - - 13,539,791
Financial investments - Loans and receivable 124,051,825 - 5,056,788 - - - - 129,108,613
Loans and advances to customers 715,797,622 - 6,566,096 2,968,248 - - - 725,331,966
Financial investments - Available for sale 9,335,877 - 989,337 - - - 10,325,214
Financial investments - Held to maturity 156,899,761 - - - - - - 156,899,761
Total financial assets 1,095,009,476 9,737,778 15,771,275 6,181,942 2,344,337 - 4,657,168 1,133,701,976
Financial liabilities
Due to banks 877,499 - - - 288,928 - - 1,166,427
Derivative financial instruments 274,948 - - - - - - 274,948
Due to customers 827,053,693 - 12,527,691 2,488,616 - - - 842,070,000
Other borrowings 46,429,962 2,183,495 - - - - 186,756,812 235,370,269
Debt securities issued 20,968,357 - - - - - - 20,968,357
Subordinated term debts 24,357,595 - - - - - - 24,357,595
Total financial liabilities 919,962,054 2,183,495 12,527,691 2,488,616 288,928 - 186,756,812 1,124,207,596

318
BANK OF CEYLON . Annual Report 2014
Notes to the Financial Statements
58 Risk management [Contd.]
58.2 Credit risk [Contd.]
58.2.3 Analysis of risk concentration (Contd.)
Sector wise exposure
As at 31 December 2014
Agriculture
and
fisheries
Banking
finance and
insurance
business
Hotels,
travels and
services
Housing,
construction and
infrastructure
LKR ‘000 LKR ‘000 LKR ‘000 LKR ‘000
Cash and short term funds - 4,718,548 - -
Balances with Central Banks - - - -
Placements with banks - 19,766,889 - -
Derivative financial instruments - 1,714,556 - -
Reverse repurchase agreements - - - -
Financial assets - Held for trading 443,711 99,954 520,594 396,314
Financial investments - Loans and receivables - 1,293,096 - 549,369
Loans and advances to customers 85,648,355 9,248,650 22,649,081 137,240,838
Less : Impairment on loans and advances - - - -
Financial investments - Available for sale - 10,567,184 - -
Financial investments - Held to maturity - - - -
Total financial assets 86,092,066 47,408,877 23,169,675 138,186,521
As at 31 December 2013
Agriculture
and
fisheries
Banking
finance and
insurance
business
Hotels,
travels and
services
Housing,
construction and
infrastructure
LKR ‘000 LKR ‘000 LKR ‘000 LKR ‘000
Cash and short term funds - 6,513,731 - -
Balances with Central Banks - - - -
Placements with banks - 19,315,520 - -
Derivative financial instruments - 3,261,073 - -
Reverse repurchase agreements - - - -
Financial assets - Held for trading 346,904 82,269 363,868 177,661
Financial investments - Loans and receivables - 1,777,202 - -
Loans and advances to customers 115,795,394 6,814,722 23,323,850 97,347,861
Less : Impairment on loans and advances - - - -
Financial investments - Available for sale - 7,023,942 - -
Financial investments - Held to maturity - - - -
Total financial assets 116,142,298 44,788,459 23,687,718 97,525,522
* This excludes exposure to State Owned Enterprises (SOEs).

319
Truly Everybody’s Bank
Manufacturing
Commercial
trade
Sovereign
and direct
Government
Transportation
and
logistics
Other
commercial
services
Consumption
and
others Total
LKR ‘000 LKR ‘000 LKR ‘000 LKR ‘000 LKR ‘000 LKR ‘000 LKR ‘000
- - - - - 24,446,916 29,165,464
- - 30,422,373 - - - 30,422,373
- - - - - - 19,766,889
- - - - - - 1,714,556
- - 58,953,093 - - - 58,953,093
733,946 61,717 14,913,834 61,053 23,014 608,296 17,862,433
- 431,518 122,089,171 - - 4,782,176 129,145,330
48,374,369 215,272,526 87,281,104* 35,639,400 8,533,336 127,617,256 777,504,915
- - - - - - (36,157,280)
- - 2,410,899 - - 1,383,460 14,361,543
- - 216,517,438 - - - 216,517,438
49,108,315 215,765,761 532,587,912 35,700,453 8,556,350 158,838,104 1,259,256,754
Manufacturing
Commercial
trade
Sovereign
and direct
Government
Transportation
and
logistics
Other
commercial
services
Consumption
and
others Total
LKR ‘000 LKR ‘000 LKR ‘000 LKR ‘000 LKR ‘000 LKR ‘000 LKR ‘000
- - - - - 18,387,458 24,901,189
- - 28,699,132 - - - 28,699,132
- - - - - - 19,315,520
- - - - - - 3,261,073
- - 22,319,717 - - - 22,319,717
575,636 567,972 11,312,975 106,672 5,834 - 13,539,791
- 105,341 127,226,070 - - - 129,108,613
51,467,301 231,904,246 74,561,982* 26,116,228 12,707,933 115,345,629 755,385,146
- - - - - - (30,053,180)
- - 1,660,970 - 1,640,302 - 10,325,214
- - 156,899,761 ` - - 156,899,761
52,042,937 232,577,559 422,680,607 26,222,900 14,354,069 133,733,087 1,133,701,976

320
BANK OF CEYLON . Annual Report 2014
Notes to the Financial Statements
58 Risk management [Contd.]
58.2 Credit risk [Contd.]
58.2.4 Commitments and contingencies
To meet the financial needs of customers, the Bank enters into various irrevocable commitments and contingent
liabilities. Even though these obligations may not be recognized on the Statement of Financial Position, they do
contain credit risk and are therefore part of the overall risk of the Bank.
The table below shows the Bank’s maximum credit risk exposure for commitments and contingencies.
Bank
As at 31 December 2014
LKR '000
2013
LKR '000
Acceptances and documentary credits 179,707,248 163,754,104
Forward exchange contracts 128,030,237 127,685,402
Guarantees 99,102,841 69,275,083
406,840,326 360,714,589
58.3 Liquidity risk and funding management
ALCO being the main management committee for taking important decisions on managing liquidity and market risk,
the Bank’s funding plan is reviewed regularly and remedial measures are proposed to rectify any material deviation
which might lead to a stressed liquidity situation.
Treasury division prepares the maturity gap analysis on a monthly basis and submits to ALCO for decision making
purpose. Assets and liabilities of the Bank are positioned in to pre-defined time bands according to their residual term
to maturity. Assets and liability mis-matches are monitored against the limits to mitigate liquidity risk of the Bank.
The table below presents the contractual undiscounted maturity of the Bank’s financial liabilities as at 31 December
2014.
As at 31 December 2014 On demand
LKR ‘000
Less than 3
months
LKR ‘000
3 to 12
months
LKR ‘000
1 to 5
years
LKR ‘000
Over 5
years
LKR ‘000
Total
LKR ‘000
Due to banks - 889,876 - - - 889,876
Derivative financial
instruments - 734,548 - - - 734,548
Due to customers 403,450,918 236,850,325 257,768,988 59,201,398 96,749 957,368,378
Other borrowings - 70,021,433 28,714,737 177,251,262 857,915 276,845,347
Debt securities issued - - 19,554,494 4,469,324 - 24,023,818
Subordinated debentures - - 8,695,771 32,221,920 5,807,569 46,725,260
Total financial liabilities 403,450,918 308,496,182 314,733,990 273,143,904 6,762,233 1,306,587,227

321
Truly Everybody’s Bank
As at 31 December 2013 On demand
LKR ‘000
Less than 3
months
LKR ‘000
3 to 12
months
LKR ‘000
1 to 5
years
LKR ‘000
Over
5 years
LKR ‘000
Total
LKR ‘000
Due to banks 550,115 616,312 - - 1,166,427
Derivative financial
instruments - 274,948 - - - 274,948
Due to customers 236,585,484 326,874,514 255,745,428 52,285,006 28,359 871,518,791
Other borrowings - 36,369,823 41,589,663 157,074,075 711,378 235,744,939
Debt securities issued - - 2,686,344 23,799,957 - 26,486,301
Subordinated debentures - - 3,150,100 28,797,934 6,212,936 38,160,970
Total financial liabilities 237,135,599 364,135,597 303,171,535 261,956,972 6,952,673 1,173,352,376
Balances in the above tables do not tally directly with those in the Statement of Financial Position as these tables
incorporate, on an undiscounted basis, all cash flows relating to principal and future interest payments.
58.4 Market risk
Market risk is the risk that the fair value of the future cash flows of financial instruments will fluctuate due to changes
in market variables such as interest rates, foreign exchange rates, equity prices and commodity prices. The Bank
classifies exposures into either trading or non trading portfolios and manages each of these portfolios separately. The
market risk for the foreign exchange and equity trading portfolio are managed and monitored based on a Value at Risk
(VaR) methodology that reflects the interdependency between risk variables. Interest rate risk of the trading portfolio
is managed through Price Value per Basis Point (PVBP) and duration analysis.
Non trading portfolios are managed and monitored using sensitivity analysis and stress testing.
58.4.1 Currency risk
Currency risk is the risk that the value of financial instruments will fluctuate due to foreign exchange rates. The
Bank carries moderate level of open positions and therefore does not have significant sensitivity to profit and loss over
foreign currency trading transactions. A detailed limit structure along with VaR limits prescribed by the IIRMD govern
the foreign exchange risk. Currency VaR as at 31 December 2014 LKR 69,531 (2013: LKR 481,956) and our risk
appetite limit is LKR 15,000,000 (2013: LKR 7,210,000)

322
BANK OF CEYLON . Annual Report 2014
Notes to the Financial Statements
58 Risk management [Contd.]
58.4 Market risk [Contd.]
58.4.1 Currency Risk (Contd.)
As at 31 December 2014 2013
Foreign exchange position
Net
overall long
Net
overall short
Net
overall long
Net
overall short
LKR ‘000 LKR ‘000 LKR ‘000 LKR ‘000
Currency
United States Dollar - (14,527) 185,858 -
Great Britain Pound 661 - 158 -
Euro 329 - 1,659 -
Japanese Yen 82 - 238 -
Australian Dollar 47 - 232 -
Canadian Dollar 277 - 56 -
Swiss Franc 1,213 - - (331)
Singapore Dollar 1,254 - - (1,861)
Hong Kong Dollar - (1,043) - (1,513)
Sub total 3,863 (15,570) 188,201 (3,705)
Other currencies 1,684 (3,254) 4,159 (129)
Grand total 5,547 (18,824) 192,360 (3,834)
Higher of long or short (18,824) 192,360
Impact on Income Statement due to exchange rate shocks.
As at 31 December 2014 2013
Exchange rate shocks
Net open
position
(after rate
shocks)
Impact on
Income
Statement as at
31 December 2014
Net open
position
(after rate
shocks)
Impact on
Income
Statement as at
31 December 2013
LKR ‘000 LKR ‘000 LKR ‘000 LKR ‘000
5% (17,883) 941 201,978 9,618
10% (16,941) 1,882 211,596 19,236
-5% (19,765) (941) 182,742 (9,618)
-10% (20,706) (1,882) 173,124 (19,236)

323
Truly Everybody’s Bank
58.4.2 Interest rate risk
Interest rate risk arises from the possibility that changes in interest rate will affect future cash flows or the fair value of
the financial instruments.
PVBP and duration analysis are monitored weekly to assess the impact of interest rate changes on Bank’s trading
portfolios of treasury bonds and treasury bills.
As at 31 December 2014 2013
Held for trading bond portfolio
PVBP LKR 1.4 million LKR 1.3 million
Duration 3.2 Years 1.9 Years
Held for trading bill portfolio
PVBP LKR 0.1 million LKR 0.1 million
Duration 0.7 Years 0.7 Years
Available for sale bond portfolio
PVBP LKR 0.2 million LKR 0.2 million
Duration 4.3 Years 3.5 Years
Interest rate risk in the banking book is monitored by placing the interest sensitive assets and liabilities in pre
determined maturity buckets considering its residual time to maturity and setting and monitoring gap limits and the
repricing profile.
As at 31 December 2014
Upto 1
month
1-3
months
3-6
months
6-12
months
1-2
years
2-3
years
3-4
years
4-5
years
Over 5
years
Rate sensitive assets 11.5% 14.9% 6.5% 10.1% 13.8% 13.8% 7.5% 7.5% 14.4%
Rate sensitive liabilities 14.6% 11.9% 9.2% 14.2% 7.2% 7.2% 7.6% 7.6% 20.6%
Gap (3.1%) 3.0% (2.7%) (4.1%) 6.6% 6.6% (0.1%) (0.1%) (6.2%)
As at 31 December 2013
Upto 1
month
1-3
months
3-6
months
6-12
months
1-2
years
2-3
years
3-4
years
4-5
years
Over 5
years
Rate sensitive assets 10.7% 16.9% 10.5% 16.1% 4.6% 4.6% 8.1% 8.1% 20.4%
Rate sensitive liabilities 11.9% 14.1% 8.9% 13.1% 4.6% 4.6% 4.5% 17.4% 20.9%
Gap (1.2%) 2.8% 1.6% 3.0% 0.0% 0.0% 3.6% (9.3%) (0.5%)

324
BANK OF CEYLON . Annual Report 2014
Notes to the Financial Statements
58 Risk management [Contd.]
58.4 Market risk [Contd.]
58.4.3 Equity risk
Equity risk is the risk that the fair value of equity portfolio decreases due to a change in the level of equity indices and
individual stocks. Equity risk is monitored by stipulating overall portfolio limits and use of VaR methodology.
Equity VaR during the year ended 31 December 2014
LKR '000
2013
LKR '000
Highest 133,852 167,768
Lowest 105,152 119,750
Average 117,044 138,910
As at 31 December 123,183 121,513
58.5 Operational risk
Operational risk is the risk of loss resulting from inadequate or failed internal processes, people and systems or from
external events. This includes legal risk, but excludes strategic risk and reputation risk.
The Bank recognizes the significance of operational risk, which is inherent in all areas of business. The Bank seeks to
minimize exposure to operational risk, through implementing improved management and control mechanisms.
The Bank uses Basic Indicator Approach (BIA) to allocate capital for operational risk. Even though the capital allocated
for operational risk was significant, the actual operational loss was far below the allocated capital.
58.6 Capital management
The primary objective of capital management is to ensure maintenance of minimum regulatory capital requirement.
The Bank ensures that adequate capital has been allocated to achieve strategic objectives and within the risk appetite of
the Bank.
58.6.1 Capital adequacy
Capital Adequacy Ratio (CAR) is a measure of the Bank’s capital expressed as a percentage of risk weighted assets of
credit, market and operational aspects of the banking business. It is a measure of financial strength of the Bank which
indicates its ability to maintain adequate capital to face with unforeseen scenarios.
Central Bank of Sri Lanka (CBSL) defines and monitors CAR to ensure that banks are not participating or holding
investments that increase the risk of default and that they have enough capital to sustain operating losses and thereby
maintaining confidence in the banking system.
The Bank calculates CAR based on international convergence of capital measurement and capital standards, revised
framework, which is commonly known as Basel II framework. IIRMD actively and continuously monitor the CAR,
while stressing rigorously for worst possible scenarios. ICAAP factors out all possible risks such as reputation risk,
strategic risk, compliance risk, concentration risk and interest rate risk on banking book.

Truly Everybody’s Bank
325
Supplementary
InformationCapital Adequacy 326
Compliance Requirements Enforced by Colombo Stock Exchange (CSE) 332
Compliance Requirements Enforced by Central Bank of Sri Lanka (CBSL) 334
Income Statement in USD 338
Statement of Other Comprehensive Income in USD 339
Statement of Financial Position in USD 340
Quarterly Performance 341
Share and Debenture Information 344
Ten Year Statistical Summary - Bank 346
Subsidiaries and Associates 349
BoC Correspondent Banks by Country 352
Exchange Companies by Country 359
Glossary of Financial/Banking Terms 360
Corporate and Overseas Offices 366

BANK OF CEYLON . Annual Report 2014
326
Capital Management and Planning
The Bank seeks to optimize the use of its
financial capital to provide an attractive
return to providers of capital in accordance
with regulatory requirements and additional
safeguards included in the defined risk
appetite of the Bank. Accordingly the Chief
Financial Officer (CFO) is delegated with the
task of capital management and planning
with oversight responsibility exercised by
the Integrated Risk management Committee
and the Board. The CFO is assisted in his
task by the Asset and Liability Management
Committee who provides information
regarding their capital requirements and the
availability of capital, review the gaps and
provide insights on mechanisms available
for managing the same. The regulatory
requirements in Sri Lanka for managing
capital are based on the International
Convergence of Capital Measurement and
Capital Standards – a revised framework,
widely known as Basel II, issued by the
Basel Committee on banking supervision
of the Bank for International Settlements
(BIS) in June 2004 and revised thereafter
in June 2006. Although a revised Basel II
capital framework has been issued including
many changes in response to issues arising
from the global financial crisis, the Central
Bank of Sri Lanka has not announced a date
for transition. It is noteworthy that even
advanced economies implemented Basel III
only commencing 2013.
Capital Adequacy
Capital adequacy is the measure of a
bank's capital, expressed as a percentage
of a bank's risk weighted asset exposures.
For financial institutions, capital is a buffer
against insolvency. It is available to absorb
unforeseen losses so the bank can remain
in business. The more capital a bank has
relative to the risks it takes, the more
confident stakeholders are that it will meet
its obligations to them.
The Bank uses the Internal Capital
Adequacy Assessment Process (ICAAP)
as a key tool for capital management and
planning. In accordance with ICAAP,
the Bank assesses its forecast capital
requirement over a 3 year horizon, taking
into account the demand and supply of
capital, regulatory thresholds and internal
risk appetite using various scenarios,
including stress scenarios of varying scope
and severity.
Tier One Capital + Tier Two Capital
Risk Weighted AssetsCAR =
Capital Adequacy

Truly Everybody’s Bank
327
Capital Structure
The table below sets out the Bank’s capital structure, identifying separately Tier I and Tier II capital which adds up to the numerator of the
capital adequacy ratio. The Bank raised LKR 8 billion in debentures during the year and also received LKR 5 billion as share capital during the
year.
Bank Group
2014 2013 2014 2013
LKR million LKR million LKR million LKR million
Tier I: Core capital
Paid up ordinary shares 10,000 5,000 10,000 5,000
Permanent reserve fund 3,810 3,538 3,810 3,538
Published retained profit 44,861 31,419 47,662 33,261
General and other reserves 584 8,619 1,352 9,701
Non controlling interest (consistent with the above capital constituents) - - 1,187 1,296
Deductions
50% of investments in unconsolidated banking and financial subsidiaries (2,529) (2,469) - -
Other deductions (999) (809) (999) (809)
Total eligible core capital (Tier I capital) 55,727 45,298 63,012 51,987
Tier II: Supplementary capital
Revaluation reserve (as approved by Central Bank of Sri Lanka) 2,373 2,373 2,373 2,373
General provision 3,163 2,694 3,163 2,694
Approved subordinated term debt 21,800 17,800 21,800 17,800
Deductions (3,134) (2,777) (604) (308)
Total eligible supplementary capital (Tier II capital) 24,202 20,090 26,732 22,559
Total capital base 79,929 65,388 89,744 74,546

BANK OF CEYLON . Annual Report 2014
328
Risk Weighted Assets
Risk weighted assets are computed as per the CBSL direction which specifies the risk weight factors to be assigned to various asset classes as
enumerated below.
Computation of risk weighted assets
Bank Group
2014 2013 2014 2013
Risk
weight
factor
On
balance
sheet
assets
& credit
equivalent
of off
balance
sheet
assets
Risk
weighted
assets
On
balance
sheet
assets
& credit
equivalent
of off
balance
sheet
assets
Risk
weighted
assets
On
balance
sheet
assets
& credit
equivalent
of off
balance
sheet
assets
Risk
weighted
assets
On
balance
sheet
assets
& credit
equivalent
of off
balance
sheet
assets
Risk
weighted
assets
LKR
million
LKR
million
LKR
million
LKR
million
LKR
million
LKR
million
LKR
million
LKR
million
Assets
Claims on Government of Sri Lanka
and Central Bank of Sri Lanka 0 575,180 - 441,851 - 579,936 - 442,742 -
Claims on foreign sovereigns and
their Central Banks 0-150 13,939 13,198 10,232 9,610 13,939 13,198 10,232 9,610
Claims on Public Sector Entities (PSEs) 20-150 56,576 56,576 66,296 66,296 56,576 56,576 66,296 66,296
Claims on banks 20-150 27,198 13,209 35,554 20,910 28,825 14,836 37,396 22,752
Claims on financial institutions 20-150 3,180 1,897 4,123 3,181 3,180 1,897 4,123 3,181
Claims on corporates 20-150 136,589 134,942 125,984 123,104 160,283 158,637 150,112 147,233
Retail claims 75-100 181,805 151,471 155,881 133,290 181,805 151,470 155,881 133,290
Claims secured by residential property 50-100 49,258 32,906 35,457 23,220 49,258 32,906 35,457 23,220
Non Performing Assets (NPAs) 50-150 12,811 18,572 20,662 29,828 12,812 18,572 20,662 29,828
Cash items 0-20 48,613 1,153 42,295 4,389 49,406 1,153 42,576 4,389
Exposures collateralized by cash,
gold and government securities 0 269,080 - 300,699 - 269,080 - 300,699 -
property, plant and equipment 100 12,802 12,802 12,089 12,089 22,446 22,446 20,909 20,909
Other assets 100 52,825 52,825 39,786 39,786 59,240 59,240 40,944 40,944
Total exposure 1,439,856 489,551 1,290,909 465,703 1,486,786 530,931 1,328,029 501,652
Capital Adequacy

Truly Everybody’s Bank
329
Off balance sheet exposures
Bank Group
2014 2013 2014 2013
Credit
conversion
factor %
Assets Credit
equivalent
Assets Credit
equivalent
Assets Credit
equivalent
Assets Credit
equivalent
Direct credit substitutes 100 43,042 43,042 30,310 30,310 43,042 43,042 30,310 30,310
Transaction related contingencies 50 36,170 18,085 30,389 15,195 36,170 18,085 30,389 15,195
Short term self liquidating
trade related contingencies 20 190,964 38,193 178,554 35,711 190,964 38,193 178,554 35,711
Other commitments with an
original maturity of up to one
year or which can be
unconditionally cancelled at
any time 0 72,946 - 79,300 - 72,946 - 79,300 -
Commitments with an original
maturity up to 1 year and
maturity of over one year 20-50 36,988 17,942 38,029 17,522 36,988 17,942 38,029 17,522
Foreign exchange contracts 2-5 128,030 2,561 127,685 2,554 128,030 2,561 127,685 2,554
Total off balance sheet exposure 508,140 119,823 484,267 101,292 508,140 119,823 484,267 101,292

BANK OF CEYLON . Annual Report 2014
330
Market risk- The standardized measurement approach
Bank Group
2014 2013 2014 2013
LKR million LKR million LKR million LKR million
Capital charge for
Interest rate risk 315 141 315 141
Equity 533 422 533 422
Foreign exchange and gold 1,841 21 1,841 21
Total capital charge for market risk 2,689 584 2,689 584
Total risk weighted assets for market risk 26,894 5,838 26,894 5,838
Operational risk - The basic indicator approach
Bank Group
2014 2013 2014 2013
LKR million LKR million LKR million LKR million
Capital charge for operational risk
Total gross income of three consecutive years 146,714 134,422 169,932 145,577
Average gross income 48,905 44,807 56,644 48,526
Total capital charge for operational risk-(15%) 7,336 6,721 8,496 7,279
Total risk weighted assets for operational risk 73,357 67,211 84,966 72,789
In the Basic Indicator Approach (BIA), bank shall calculate its annual gross income for the most recent year by aggregating the gross income of
the last four financial quarters and follow same to calculate annual gross income for each of the two years preceding the most recent year.
Central Bank of Sri Lanka has given the guidelines to the Sri Lankan banks to move to The Standardized Approach (TSA) or Alternative
Standardized Approach (ASA) subject to the prior approval.
A Bank adopting TSA shall classify their business activities into eight business lines, namely, corporate finance, trading and sales, payment and
settlement, agency services, asset management, retail brokerage, retail banking and commercial banking. (Beta factor varies from 12% - 18%)
Under ASA, the operational risk capital requirement/methodology is the same as under TSA, except for two business lines, retail banking and
commercial banking business lines. For these business lines, use outstanding amount of loans and advances after multiplying by a fixed factor
‘m’ (0.035) as the exposure indicator which replaces gross income.
Capital Adequacy

Truly Everybody’s Bank
331
Market risk- The standardized measurement approach
Bank Group
2014 2013 2014 2013
LKR million LKR million LKR million LKR million
Computation of ratios
Total risk weighted assets
Total risk weighted assets for credit risk 489,551 465,703 530,931 501,652
Total risk weighted assets for market risk 26,894 5,838 26,894 5,838
Total risk weighted assets for operational risk 73,357 67,211 84,966 72,789
Sub total 589,802 538,752 642,791 580,279
Minimum capital charge
Credit risk 48,955 46,570 53,093 50,165
Market risk 2,689 584 2,689 584
Operational risk 7,336 6,721 8,496 7,279
Total eligible core capital (Tier 1 capital) 55,727 45,298 63,012 51,987
Total eligible supplementary capital (Tier II capital) 24,202 20,090 26,732 22,559
Total capital base 79,929 65,388 89,744 74,546
Core capital ratio 9.5% 8.4% 9.8% 8.9%
Capital adequacy ratio 13.6% 12.1% 14.0% 12.9%
The Bank’s capital adequacy ratios have improved during the year and are comfortably above regulatory requirements and also above industry
average indicating the soundness of the Bank.
The Way Forward
The Liquidity Coverage Ratio (LCR) will be implemented in Sri Lanka from 1 April 2015 with a minimum requirement of 60% and the
minimum requirement will be enhanced on a staggered basis to reach 100% by April 2019. There are additional proposals for systemically
important banks, including requirements for supplementary capital, augmented contingent capital and strengthened arrangements for cross
border supervision and resolution.

BANK OF CEYLON . Annual Report 2014
332
Compliance to the Listing Rules on contents of Annual Report, which were applicable to the Bank for the year ended 31 December 2014 are
summarized below:
Rule No. Requirement Period Date submitted
7.4 a (i) The Interim Financial Statements prepared on
quarterly basis, approved by the Board of Directors to
be submitted to CSE within 45 days from respective
quarter ends for the first three quarters and within two
months at the end of fourth quarter
Quarter 1 ended 31 March 2014
Quarter 2 ended 30 June 2014
Quarter 3 ended 30 September 2014
Quarter 4 ended 31 December 2014
13 May 2014
14 August 2014
14 November 2014
27 February 2015
Rule No. Requirement Compliance
7.4 b (i) Comply with LKAS 34 and disclose Group and Bank
separately
Complied with
7.4 b (ii) Disclose the additional notes and ratios as per Listing
Rules
Complied with
7.4 b (iii) Be signed by two Directors Complied with
7.4 b (iv) State whether the Financial Statements are audited or
not
Complied with
7.5 a Annual Report to be submitted to CSE within five
months from the closure of financial year
The Audited Financial Statements for
the year ended 31 December 2014
was submitted on 27 March 2015.
Annual Report for the year 2014 will be
submitted before the deadline
Rule No. Disclosure requirement Reference/Comments Page No.
7.6 (i) Names of persons who during the financial year were
Directors of the entity;
Annual Report of the Board of Directors on the
State of Affairs of Bank of Ceylon
164
7.6 (ii) Principal activities of the entity and its subsidiaries
during the year and any changes therein
Annual Report of the Board of Directors on the
State of Affairs of Bank of Ceylon
Significant Accounting Policies
162
182
7.6 (iii) The names and the number of shares held by the 20
largest holders of voting and non-voting shares and the
percentage of such shares held
Government of Sri Lanka is the sole shareholder
of Bank of Ceylon
344
7.6 (iv) The public holding percentage Not applicable
7.6 (v) A statement of each director’s holding and Chief
Executive Officer’s holding in shares of the entity at the
beginning and end of each financial year
Not applicable
7.6 (vi) Information pertaining to material foreseeable risk
factors of the entity
Risk Report 147-159
7.6 (vii) Details of material issues pertaining to employees and
industrial relations of the entity
No material issues occurred during the year
under review
7.6(viii) Extents,locations,valuations and the number of
buildings of the entity’s land holdings and investment
properties
Note 31 and 32 to the Financial Statements 247-248
249-265
Compliance Requirements Enforced by Colombo Stock Exchange (CSE)

Truly Everybody’s Bank
333
Rule No. Disclosure requirement Reference/Comments Page No.
7.6 (ix) Number of shares representing the entity’s stated capital Note 46 to the Financial Statements 282
7.6 (x) A distribution schedule of the number of holders in
each class of equity securities and percentage of their
total holdings
Investor Information 344
7.6 (xi) Ratios and market price information:
1. Dividend per share,net assets value per
share,interest rate of comparable government
securities,debt/equity ratio, interest cover and
liquid asset ratio
Note 18 to the Financial Statements,
Investor Information
210-211
343
2. Market information on listed debentures Note 45 to the Financial Statements,
Investor Information
279-282
344-345
3. Any changes in credit rating Awards 7
7.6 (xii) Significant changes in the entity’s or its subsidiaries’
fixed assets and the market value of the land, if the
value differs substantially from the book value
Note 32 to the Financial Statements 249-265
7.6 (xiii) During the year the entity has raised funds either
through a public issue, rights issue and private
placement
Note 41 and 45 to the Financial Statements 270-272
279-282
7.6 (xiv) Information in respect of each employee share
ownership or stock option scheme
Not applicable
7.6 (xv) Disclosures pertaining to Corporate Governance
practices in terms of Rules 7.10.3, 7.10.5 (c) and 7.10.6
(c) of Section 7 of the Rules
Exempted under Section 7.10 of Listing Rules
since the Bank complies with direction laid
down in the Banking Act Direction No.11 of
2007 on Corporate Governance
7.6 (xvi) Related party transactions exceeding 10% of the equity
or 5% of the total assets of the entity as per Audited
Financial Statements, whichever is lower
Investor Information 348

BANK OF CEYLON . Annual Report 2014
334
Compliance Requirements Enforced by Central Bank of Sri Lanka (CBSL)
Compliance to other disclosure requirements on Annual Financial Statements, which were applicable to Licensed Commercial Banks
are summerized below:
1. Information about the significance of financial instruments for financial position and performance
1.1 Statement of Financial Position
1.1.1 Disclosures on categories of financial assets and financial liabilities Note 19 to the Financial Statements
1.1.2 Other disclosures
(i) Special disclosures about financial assets and financial liabilities
designated to be measured at fair value through profit or loss,
including disclosures about credit risk and market risk, changes
in fair value attributable to these risks and the methods of
measurement
Note 4.4 to the Financial Statements
(ii) Reclassifications of financial instruments from one category to
another
None
(iii) Information about financial assets pledged as collateral and about
financial or non-financial assets held as collateral
Note 52 to the Financial Statements
(iv) Reconciliation of the allowance account for credit losses by class of
financial assets
Note 26.2 to the Financial Statements
(v) Information about compound financial instruments with multiple
embedded derivatives
None
(vi) Breaches of terms of loan agreements None
Compliance to the directions on Interim Financial Statements, which were applicable to the Bank for the year ended 31 December 2014 are
summarized below:
Circular No. Requirement Period Date published in
Sinhala, Tamil and
English news papers
02/04/003/0401/001 The publication should be made within two
months from the end of each quarter, at
least once in an English, Sinhala and Tamil
newspaper
Quarter 1 ended 31 March 2014
Quarter 2 ended 30 June 2014
Quarter 3 ended 30 September 2014
28 May 2014
28 August 2014
27 November 201430 September2005
02/04/003/0401/001 If the Bank publishes its Audited Financial
Statements within three months from the
end of the financial year, the requirement to
publish the Financial Statements for the 4th
quarter in terms of the circular dated
30 September 2005 would not be
mandatory
Quarter 4 ended 31 December 2014 30 March 2015
21 February 2006 (Audited)
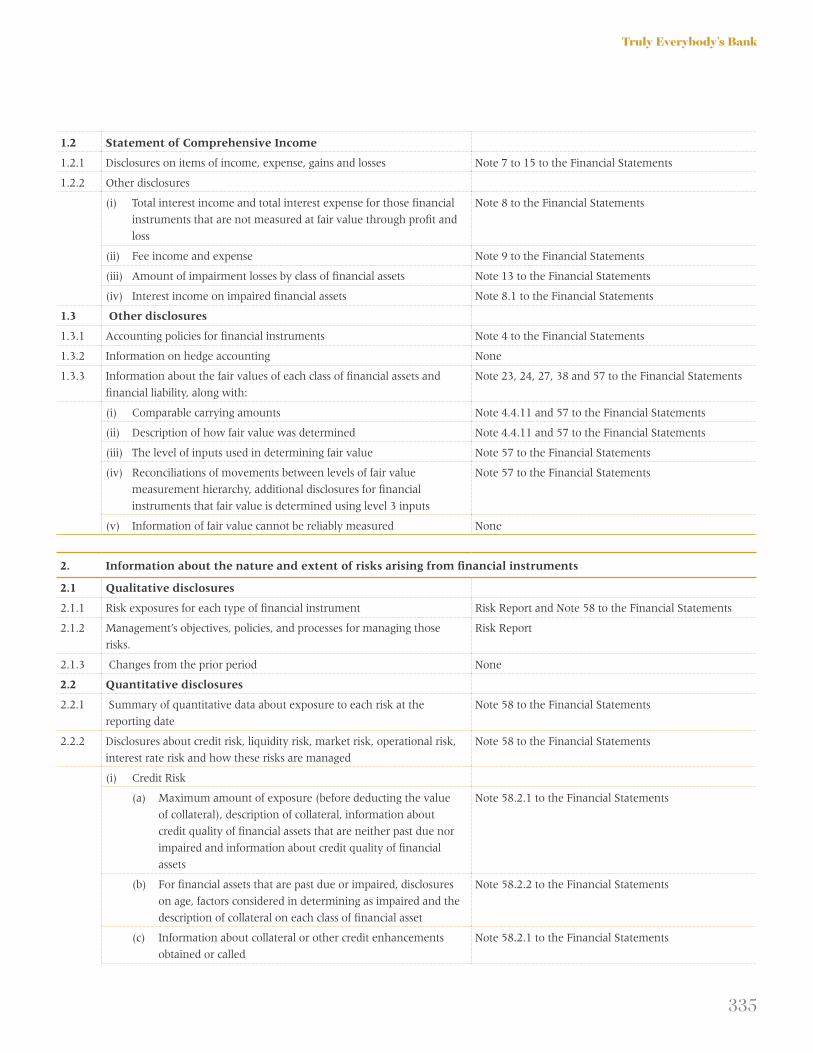
Truly Everybody’s Bank
335
1.2 Statement of Comprehensive Income
1.2.1 Disclosures on items of income, expense, gains and losses Note 7 to 15 to the Financial Statements
1.2.2 Other disclosures
(i) Total interest income and total interest expense for those financial
instruments that are not measured at fair value through profit and
loss
Note 8 to the Financial Statements
(ii) Fee income and expense Note 9 to the Financial Statements
(iii) Amount of impairment losses by class of financial assets Note 13 to the Financial Statements
(iv) Interest income on impaired financial assets Note 8.1 to the Financial Statements
1.3 Other disclosures
1.3.1 Accounting policies for financial instruments Note 4 to the Financial Statements
1.3.2 Information on hedge accounting None
1.3.3 Information about the fair values of each class of financial assets and
financial liability, along with:
Note 23, 24, 27, 38 and 57 to the Financial Statements
(i) Comparable carrying amounts Note 4.4.11 and 57 to the Financial Statements
(ii) Description of how fair value was determined Note 4.4.11 and 57 to the Financial Statements
(iii) The level of inputs used in determining fair value Note 57 to the Financial Statements
(iv) Reconciliations of movements between levels of fair value
measurement hierarchy, additional disclosures for financial
instruments that fair value is determined using level 3 inputs
Note 57 to the Financial Statements
(v) Information of fair value cannot be reliably measured None
2. Information about the nature and extent of risks arising from financial instruments
2.1 Qualitative disclosures
2.1.1 Risk exposures for each type of financial instrument Risk Report and Note 58 to the Financial Statements
2.1.2 Management’s objectives, policies, and processes for managing those
risks.
Risk Report
2.1.3 Changes from the prior period None
2.2 Quantitative disclosures
2.2.1 Summary of quantitative data about exposure to each risk at the
reporting date
Note 58 to the Financial Statements
2.2.2 Disclosures about credit risk, liquidity risk, market risk, operational risk,
interest rate risk and how these risks are managed
Note 58 to the Financial Statements
(i) Credit Risk
(a) Maximum amount of exposure (before deducting the value
of collateral), description of collateral, information about
credit quality of financial assets that are neither past due nor
impaired and information about credit quality of financial
assets
Note 58.2.1 to the Financial Statements
(b) For financial assets that are past due or impaired, disclosures
on age, factors considered in determining as impaired and the
description of collateral on each class of financial asset
Note 58.2.2 to the Financial Statements
(c) Information about collateral or other credit enhancements
obtained or called
Note 58.2.1 to the Financial Statements

BANK OF CEYLON . Annual Report 2014
336
(d) For other disclosures, refer Banking Act Direction No. 7
of 2011 on Integrated Risk Management Framework for
Licensed Banks (Section H)
Note 58.1.3 to the Financial Statements
(ii) Liquidity Risk
(a) A maturity analysis of financial liabilities Note 58.3 to the Financial Statements
(b) Description of approach to risk management Risk Report and Note 58.3 to the Financial Statements
(c ) For other disclosures, refer Banking Act Direction No. 7
of 2011 on Integrated Risk Management Framework for
Licensed Banks (Section H)
Note 58.3 to the Financial Statements
(iii) Market Risk
(a) A sensitivity analysis of each type of market risk to which the
entity is exposed
Note 58.4 to the Financial Statements
(b) Additional information, if the sensitivity analysis is not
representative of the entity’s risk exposure
Note 58.4 to the Financial Statements
(c ) For other disclosures, refer Banking Act Direction No. 7 of
2011 on Integrated Risk Management Framework for Licensed
Banks (Section H)
Note 58.4 to the Financial Statements
(iv) Operational Risk
Refer Banking Act Direction No. 7 of 2011 on Integrated Risk
Management Framework for Licensed Banks (Section H)
Note 58.5 to the Financial Statements
(v) Equity risk in the banking book
(a) Qualitative disclosures
• Differentiationbetweenholdingsonwhichcapitalgainsare
expected and those taken under other objectives including
for relationship and strategic reasons
Note 4.4.3 and 4.4.6 to the Financial Statements
• Discussionofimportantpoliciescoveringthevaluationand
accounting of equity holdings in the banking book
Note 4.4.3 and 4.4.6 to the Financial Statements
(b) Quantitative disclosures
• ValuedisclosedintheStatementofFinancialPositionof
investments, as well as the fair value of those investments;
for quoted securities, a comparison to publicly quoted share
values where the share price is materially different from fair
value
Note 24.1, 24.2 ,27.1 and 27.2 to the Financial
Statements
• Thetypesandnatureofinvestments Note 24.1, 24.2 ,27.1 and 27.2 to the Financial
Statements
• Thecumulativerealizedgains/(losses)arisingfromsalesand
liquidations in the reporting period
Note 10 to the Financial Statements
(vi) Interest rate risk in the banking book
(a) Qualitative disclosures
Nature of Interest Rate Risk in the Banking Book (IRRBB) and
key assumptions
Note 58.4.2 to the Financial Statements
(b) Quantitative disclosures
The increase /(decline) in earnings or economic value (or
relevant measure used by management) for upward and
downward rate shocks according to management’s method for
measuring IRRBB, broken down by currency (as relevant)
None
2.2.3 Information on concentrations of risk Note 58.2.3 to the Financial Statements
Compliance Requirements Enforced by Central Bank of Sri Lanka (CBSL)

Truly Everybody’s Bank
337
3. Other Disclosures
3.1 Capital
3.1.1 Capital structure
(i) Qualitative disclosures
Summary information on the terms and conditions of the
main features of all capital instruments, especially in the case of
innovative, complex or hybrid capital instruments
Debt - Note 45 to the Financial Statements
Equity – None
(ii) Quantitative disclosures
(a) The amount of Tier I capital, with separate disclosure of:
• Paidupsharecapital/commonstock Capital Adequacy
• Reserves Capital Adequacy
• Noncontrollinginterestsintheequityofsubsidiaries Capital Adequacy
• Innovativeinstruments None
• Othercapitalinstruments None
• DeductionsfromTierIcapital Capital Adequacy
(b) The total amount of Tier 2 and Tier 3 capital Capital Adequacy
(c) Other deductions from capital Capital Adequacy
(d) Total eligible capital Capital Adequacy
3.1.2 Capital adequacy
(i) Qualitative disclosures
A summary discussion of the bank’s approach to assessing the
adequacy of its capital or support current and future activities
Risk Report and Note 58.6 to the Financial Statements
(ii) Quantitative disclosures
(a) Capital requirements for credit risk, market risk and
operational risk
Capital Adequacy
(b) Total and Tier 1 capital ratio Capital Adequacy

BANK OF CEYLON . Annual Report 2014
338
Bank Group
For the year ended 31 December 2014 2013 2014 2013
USD‘000 USD‘000 USD‘000 USD‘000
Total income 962,290 973,714 1,011,546 1,025,397
Interest income 816,659 877,454 851,303 912,909Less : Interest expenses 524,272 593,711 541,398 612,372
Net interest income 292,387 283,743 309,905 300,537
Fee and commission income 69,869 49,327 72,318 51,867Less : Fee and commission expenses 8,275 5,502 9,022 6,528
Net fee and commission income 61,594 43,825 63,296 45,339
Net gains /(losses) from trading 36,956 24,695 38,314 24,966
Net gains from financial investments 21,907 3,251 22,052 3,590
Other operating income 16,899 18,987 27,559 32,065
Total operating income 429,743 374,501 461,126 406,497
Less : Impairment charge / (reversal) for loans and other losses 60,157 52,885 60,313 56,065
Net operating income 369,586 321,616 400,813 350,432
Less : Operating expenses
Personnel expenses 104,299 112,059 114,488 121,514
Other expenses 80,177 68,847 95,657 86,586
Total operating expenses 184,476 180,906 210,145 208,100
Operating profit before Value Added Tax (VAT) and Nation Building Tax (NBT) 185,110 140,710 190,668 142,332
Less:ValueAddedTax(VAT)andNationBuildingTax(NBT)oninancialservices 30,812 20,708 31,217 21,055
Operating profit after Value Added tax (VAT) and Nation building tax (NBT) 154,298 120,002 159,451 121,277
Share of profit / (loss) of associate companies before tax - - 3,516 1,748
Profit before income tax 154,298 120,002 162,967 123,025
Less : Income tax expense 51,077 27,666 53,676 30,223
Profit for the year 103,221 92,336 109,291 92,802
Profit attributable to :
Equity holder of the Bank 103,221 92,336 109,685 93,460
Non controlling interest - - (394) (658)Profit for the year 103,221 92,336 109,291 92,802
Earnings per share :
Basic earnings per share (USD) 20.64 18.47 21.94 18.69
Diluted earnings per share (USD) 19.17 18.47 20.37 18.69
Dividend per share (USD) 10.41 8.17 10.4 8.17
Exchange rate of 1 USD was LKR 131.5050 as at 31 December 2014 (LKR 130.9050 as at 31 December 2013).
The Income Statement given on this page does not form part of the Audited Financial Statements and it is solely for the convenience of the shareholders,
investors, bankers and other interested parties of the Financial Statements of the Bank.
Income Statement in USD

Truly Everybody’s Bank
339
Bank Group
For the year ended 31 December 2014 2013 2014 2013
USD‘000 USD‘000 USD‘000 USD‘000
Profit for the year 103,221 92,335 109,291 92,803
Items that will not be reclassified to profit or loss
Revaluation gains / (losses) on property, plant and equipment 27,052 - 35,559 13,271
Deferred tax effect on revaluation (gains) / losses (1,377) - (3,743) (3,669)
Actuarial gains / (losses) on defined benefit plans (10,219) (3,122) (10,281) (3,023)
Deferred tax effect on actuarial (gains) / losses 2,861 874 2,866 854
18,317 (2,248) 24,401 7,434
Items that are or may be reclassified to profit or loss
Exchange differences on translation of foreign operations (620) (1,506) (1,788) (403)
Net gains /(losses) on re measuring available for sale financial assets 23,200 3,892 24,786 4,392
Share of other comprehensive income of associate companies - - 42 42
22,580 2,386 23,040 4,031
Other comprehensive income for the year, net of tax 40,897 138 47,441 11,465
Total comprehensive income for the year 144,118 92,473 156,732 104,268
Attributable to:
Equity holder of the Bank 144,118 92,473 156,734 104,536
Non controlling interest - - (2) (268)
Total comprehensive income for the year 144,118 92,473 156,732 104,268
Exchange rate of 1 USD was LKR 131.5050 as at 31 December 2014, (LKR 130.9050 as at 31 December 2013).
The Statement of Other Comprehensive Income given on this page does not form part of the Audited Financial Statements and it is solely for the
convenience of the shareholders, investors, bankers and other interested parties of the Financial Statements of the Bank.
Statement of Other Comprehensive Income in USD

BANK OF CEYLON . Annual Report 2014
340
Bank Group
As at 31 December 2014 2013 2014 2013
USD ‘000 USD ‘000 USD ‘000 USD ‘000
Assets
Cash and short term funds 221,782 190,223 227,813 192,369
Balances with Central Banks 231,340 219,236 231,340 219,236
Placements with banks 150,313 147,554 162,683 161,622
Derivative financial instruments 13,038 24,912 13,038 24,912
Reverse repurchase agreements 448,296 170,503 458,054 174,569
Financial assets - Held for trading 135,831 103,432 140,207 106,170
Financial investments - Loans and receivables 982,056 986,277 988,303 994,540
Loans and advances to customers 5,637,410 5,540,903 5,807,932 5,703,157
Financial investments - Available for sale 109,209 78,876 133,920 98,181
Financial investments - Held to maturity 1,646,458 1,198,577 1,648,151 1,202,716
Investment in subsidiary companies 47,246 52,165 - -
Investment in associate companies 6,410 6,440 14,220 11,239
Investment properties - - 1,132 1,160
Property, plant and equipment 123,101 91,717 195,019 157,535
Leasehold properties 817 634 1,099 928
Intangible assets 2,924 3,828 4,043 5,116
Deferred tax assets - - 68 365
Other assets 350,004 302,639 355,881 309,940
Total assets 10,106,235 9,117,916 10,382,903 9,363,755
Liabilities
Due to banks 6,767 8,910 7,217 10,208
Derivative financial instruments 5,586 2,100 5,586 2,100
Due to customers 7,102,134 6,432,680 7,177,936 6,499,122
Other borrowings 1,876,252 1,798,024 1,917,556 1,839,518
Debt securities issued 157,881 160,180 199,371 190,877
Current tax liabilities - - 2,214 1,921
Deferred tax liabilities 8,147 1,158 25,009 15,540
Insurance provision - Life - - 2,661 1,686
Insurance provision - Non life - - 4,618 5,119
Other liabilities 133,334 88,014 145,266 100,522
Subordinated term debts 247,289 186,071 244,689 185,992
Total liabilities 9,537,390 8,677,137 9,732,123 8,852,605
Equity
Share capital 76,043 38,196 76,043 38,196
Permanent reserve fund 28,972 27,031 28,972 27,031
Retained earnings 341,136 240,012 362,434 254,087
Other reserves 122,694 135,540 174,306 181,938
Total equity attributable to the Bank 568,845 440,779 641,755 501,252
Non controlling interest - - 9,025 9,898
Total equity 568,845 440,779 650,780 511,150
Total liabilities and equity 10,106,235 9,117,916 10,382,903 9,363,755
Commitments and contingencies 5,488,486 5,007,001 5,496,545 5,012,995
Net assets per share (USD) 113.77 88.16 128.35 100.25
Exchange rate of 1 USD was LKR 131.5050 as at 31 December 2014 (LKR 130.9050 as at 31 December 2013). The Statement of Financial Position given on this page does not form part of the Audited Financial Statements and it is solely for the convenience of the shareholders, investors, bankers and other interested parties of the Financial Statements of the Bank.
Statement of Financial Position in USD

Truly Everybody’s Bank
341
Summary of the Income Statement LKR million
2014 2013
For the quarter ended 31-Mar 30-Jun 30-Sep 31-Dec 31-Mar 30-Jun 30-Sep 31-Dec
Bank
Net interest income 8,241 7,088 9,696 13,425 8,094 9,216 8,880 10,953
Non interest income 5,442 4,472 4,654 4,582 2,467 3,474 3,193 3,466
Non interest expense (5,858) (7,139) (6,694) (5,656) (5,154) (6,050) (6,277) (6,920)
Impairment (charge)/reversal for loans
and other losses (3,346) 1,209 (440) (5,334) (1,113) (2,387) (2,605) (817)
Operating profit before VAT and NBT 4,479 5,630 7,216 7,017 4,294 4,253 3,191 6,682
VATandNBToninancialservices (683) (849) (830) (1,690) (612) (782) (632) (685)
Profit before income tax 3,796 4,781 6,386 5,327 3,682 3,471 2,559 5,997
Income tax expense (1,203) (1,183) (1,384) (2,946) (1,084) (1,017) (881) (640)
Profit after income tax 2,593 3,598 5,002 2,381 2,598 2,454 1,678 5,357
Other comprehensive income 588 601 1,689 2,500 696 (191) (50) (437)
Total comprehensive income 3,181 4,199 6,691 4,881 3,294 2,263 1,628 4,920
Group
Net interest income 8,832 7,661 10,315 13,946 8,607 9,724 9,528 11,483
Non interest income 5,701 4,493 5,772 5,106 2,958 3,347 4,172 4,247
Non interest expense (6,544) (7,669) (8,112) (6,496) (5,947) (6,419) (7,675) (8,055)
Impairment (charge)/reversal for loans
and other losses (3,522) 990 (5,77) (4,822) (1,183) (2,431) (2,846) (879)
Operating profit before VAT and NBT 4,467 5,475 7,398 7,734 4,435 4,221 3,179 6,796
VATandNBToninancialservices (691) (858) (851) (1,705) (622) (790) (644) (700)
Operating profit after VAT and NBT 3,776 4,617 6,547 6,029 3,813 3,431 2,535 6,096
Share of profit/(loss) of associate
companies 91 76 160 135 33 22 94 80
Profit before income tax 3,867 4,693 6,707 6,164 3,846 3,453 2,629 6,176
Income tax expense (1,254) (1,261) (1,470) (3,074) (1,147) (1,117) (930) (762)
Profit after income tax 2,613 3,432 5,237 3,090 2,699 2,336 1,699 5,414
Other comprehensive income 642 719 1,848 3,031 397 47 156 901
Total comprehensive income 3,255 4,151 7,085 6,121 3,096 2,383 1,855 6,315
Quarterly Performance

BANK OF CEYLON . Annual Report 2014
342
Summary of the Statement of Financial Position LKR million
2014 2013
As at 31-Mar 30-Jun 30-Sep 31-Dec 31-Mar 30-Jun 30-Sep 31-Dec
Bank
Assets
Investments 382,315 410,807 413,939 443,896 278,758 298,272 361,737 339,865
Loans and advances to customers 733,431 698,209 708,865 741,348 737,133 734,602 697,768 725,332
Property, plant and equipment 12,579 12,592 12,842 16,680 11,988 12,199 12,523 12,590
Other assets 100,355 132,396 134,840 127,096 126,545 126,247 123,013 115,794
Total assets 1,228,680 1,254,004 1,270,486 1,329,020 1,154,424 1,171,320 1,195,041 1,193,581
Liabilities and equity
Due to customers 854,864 876,270 893,929 933,966 741,198 770,345 801,029 842,070
Debt securities and borrowed funds 300,913 297,855 291,088 300,018 328,598 328,771 322,113 280,696
Other liabilities 12,196 17,473 17,045 20,230 30,554 17,368 17,357 13,115
Equity 60,707 62,406 68,424 74,806 54,074 54,836 54,542 57,700
Total liabilities and equity 1,228,680 1,254,004 1,270,486 1,329,020 1,154,424 1,171,320 1,195,041 1,193,581
Group
Assets
Investments 381,899 411,143 414,539 444,862 275,835 296,784 360,356 338,706
Loans and advances to customers 755,345 719,622 730,879 763,772 756,178 754,119 718,497 746,572
Property , plant and equipment 21,475 21,412 21,555 26,471 19,168 19,374 19,698 21,565
Other assets 108,451 136,995 137,628 130,299 134,922 133,227 127,963 118,919
Total assets 1,267,170 1,289,172 1,304,601 1,365,404 1,186,103 1,203,504 1,226,514 1,225,762
Liabilities and equity
Due to customers 864,237 886,184 903,868 943,934 752,522 777,941 808,684 850,768
Debt securities and borrowed funds 315,825 309,153 300,726 310,564 337,247 341,521 334,144 290,136
Other liabilities 17,115 22,320 22,081 25,325 34,892 21,684 21,540 17,946
Equity 68,726 70,384 76,761 84,394 60,067 60,938 60,781 65,616
Non controlling interest 1,267 1,131 1,165 1,187 1,375 1,420 1,365 1,296
Total liabilities and equity 1267,170 1,289,172 1,304,601 1,365,404 1,186,103 1,203,504 1,226,514 1,225,762
Quarterly Performance

Truly Everybody’s Bank
343
Summary of the Financial Measures
2014 2013
As at 31-Mar 30-Jun 30-Sep 31-Dec 31-Mar 30-Jun 30-Sep 31-Dec
Bank
Profitability
Interest margin (%) 2.7 2.5 2.7 3.1 2.9 3.1 3.1 3.3
Return on assets (before tax) (%) 1.3 1.4 1.6 1.6 1.3 1.3 1.2 1.4
Return on equity (after tax) (%) 17.5 20.6 23.7 20.5 19.8 19.1 17.0 22.2
Investor information
Interest cover (times) 1.8 1.9 2.0 2.0 1.7 1.6 1.6 1.7
Net assets value per share (LKR) 12,141 12,481 13,685 14,961 10,815 10,967 10,908 11,540
Capital adequacy ratio
Core capital adequacy ratio, % (Tier I) 8.5 8.5 8.3 9.5 7.9 7.9 7.7 8.4
Total capital adequacy ratio, % (Tier I + II) 12.3 12.1 12.9 13.6 11.1 10.9 10.6 12.1
Assets quality
Gross non performing advances ratio (%) 5.4 4.3 4.3 3.8 3.4 3.7 4.5 4.3
(Net of interest in suspense)
Net non performing advances ratio (%) 3.7 2.6 2.5 1.6 2.2 2.5 3.1 2.8
(Net of interest in suspense and provisions)
Regulatory liquidity
Statutory liquid assets ratio
- Domestic banking unit (%) 28.8 30.5 29.4 30.8 24.4 27.1 27.2 27.7
- Off shore banking unit (%) 28.8 26.6 26.0 25.9 26.3 23.5 34.6 31.4
Group
Profitability
Interest margin (%) 2.8 2.6 2.8 3.2 3.0 3.2 3.2 3.4
Return on assets (before tax) (%) 1.2 1.4 1.6 1.7 1.4 1.3 1.2 1.4
Return on equity (after tax) (%) 15.3 17.5 20.8 18.9 18.0 16.6 14.9 19.4
Investor information
Net assets value per share (LKR) 13,745 14,077 15,352 16,879 12,013 12,188 12,156 13,123
Capital adequacy ratio
Core capital adequacy ratio, % (Tier I) 8.9 9.1 8.8 9.8 8.7 8.6 8.5 8.9
Total capital adequacy ratio, % (Tier I +II) 12.8 12.8 13.8 14.0 12.2 11.9 11.8 12.8

BANK OF CEYLON . Annual Report 2014
344
Share and Debenture Information
Share Information
As at 31 December 2014 2013
Shareholder
No. of
ordinary shares
Holding
%
No. of
Ordinary shares
Holding
%
Government of Sri Lanka 10,000,000 * 100 5,000,000 100
* This includes 5,000,000 nos of shares under pending allotment as of 31 December 2014
Debenture Information
The Bank has issued the following debentures which are listed on Colombo Stock Exchange (CSE)
Unsecured, subordinated, redeemable
debentures
(par value LKR 100)
Type Interest payable
frequency
Interest rate (per annum)
June 2010/2015 series A Annually 11.50%
B Semi annually 6 months TB rate (gross) plus 75 basis points
December 2011/2016 series A Annually 11.00%
B Semi annually 6 months TB rate (gross) plus 75 basis points
C Semi annually 10.50%
November 2012/2017 series A Annually 16.00%
B Semi annually 6 months TB rate (gross) plus 125 basis points
C Semi annually 15.30%
October 2013/2023 series A Annually 13.00%
B Annually 12.60%
C Semi annually 6 months TB rate (gross) plus 100 basis points
D Annually 13.20%
E Semi annually 6 months TB rate (gross) plus 100 basis points
F Annually 13.20%
H Annually 13.70%
September 2014/2022 series A Annually 8.00%
B Quarterly 7.75%
C Semi annually (6 months TB ( gross ) rate plus 50 basis points)
D Annually 8.25%
E Semi annually (6 months TB ( gross ) rate plus 50 basis points)

Truly Everybody’s Bank
345
Information on listed debentures
Following debentures have traded during the year and all other debentures have not been traded during the year ended 2013 and 2014.
31 December 2014 2013
Highest
LKR
Lowest
LKR
Last
traded
LKR
Interest
yield
%*
Yield
to
maturity
%*
Highest
LKR
Lowest
LKR
Last
traded
LKR
Interest
yield
%*
Yield
to
maturity
%*
BoC Debentures 2008/2013 ,
Unsecured, surbodinated, redeemable,
5 years, fixed rate (19.0%) N/A N/A N/A N/A N/A 95.50 95.50 95.50 43.77 19.90
BoC Debentures 2010/2015 ,
Unsecured, surbodinated, redeemable,
5 years, fixed rate (11.5%) 95.00 95.00 95.00 16.04 12.11 91.00 91.00 91.00 18.76 12.64
Unsecured, surbodinated, redeemable,
5 years, floating rate (06 months TB
rate (gross) plus 75 basis points ) 100.00 100.00 100.00 10.62 10.67 N/T N/T N/T N/T N/T
BoC Debentures 2011/2016 ,
Unsecured, surbodinated, redeemable,
5 years, fixed rate (11.0%) N/T N/T N/T N/T N/T 95.00 89.00 89.00 15.96 12.36
Unsecured, surbodinated, redeemable,
5 years, floating rate (06 months TB
rate (gross) plus 75 basis points ) 100.00 100.00 100.00 10.20 10.26 N/T N/T N/T N/T N/T
BoC Debentures 2012/2017 ,
Unsecured, surbodinated, redeemable,
5 years, fixed rate (16.0%) 104.00 104.00 104.00 14.46 15.38 N/T N/T N/T N/T N/T
BoC Debentures 2013/2023 ,
Unsecured, surbodinated, redeemable,
5 years, fixed rate (13.0%) N/T N/T N/T N/T N/T 100.00 100.00 100.00 12.96 13.00
Unsecured, surbodinated, redeemable,
5 years, fixed rate (12.60%) 111.85 111.85 111.85 8.86 11.27 N/T N/T N/T N/T N/T
Unsecured, surbodinated, redeemable,
8 years, fixed rate (13.25%) 125.55 111.13 125.55 8.26 10.55 N/T N/T N/T N/T N/T
Unsecured, surbodinated, redeemable,
10 years, fixed rate (13.75%) 131.43 112.50 131.43 8.59 10.46 N/T N/T N/T N/T N/T
BoC Debentures 2014/2022 ,
Unsecured, surbodinated, redeemable,
5 years, fixed rate (8.0%) 99.94 99.94 99.94 8.01 8.00 N/A N/A N/A N/A N/A
* as at date of last trade done.
N/T - Not Traded, N/A - Not Applicable

BANK OF CEYLON . Annual Report 2014
346
LKR million
For the year ended 31 December 2005 2006 2007 2008 2009 2010 2011 2012 2013 2014
Operating results
Income 27,324 35,192 50,159 60,182 63,461 63,363 70,457 110,138 127,464 126,546
Interest income 20,595 26,823 42,286 49,684 53,077 50,843 61,222 95,022 114,863 107,395
Interest expense (11,231) (15,744) (29,453) (35,989) (38,267) (31,200) (36,216) (59,701) (77,720) (68,944)
Net interest income 9,364 11,079 12,833 13,695 14,810 19,643 25,006 35,321 37,143 38,451
Other operating income 6,731 8,368 7,873 10,498 10,385 12,515 9,235 15,116 12,601 19,151
Other operating expense (12,059) (13,543) (14,315) (16,889) (17,992) (18,104) (15,241) (27,428) (31,324) (33,259)
Operating profit before
VAT and NBT 4,036 5,904 6,391 7,304 7,203 14,054 19,000 23,009 18,420 24,343
VAT and NBT on financial services (916) (1,767) (1,873) (2,073) (2,995) (4,001) (2,516) (3,214) (2,711) (4,052)
Profit before income tax 3,120 4,137 4,518 5,231 4,208 10,053 16,484 19,795 15,709 20,291
Income tax expense (1,225) (1,510) (1,675) (1,670) (1,124) (3,688) (4,567) (5,378) (3,622) (6,717)
Profit for the year 1,895 2,627 2,843 3,561 3,084 6,365 11,917 14,417 12,087 13,574
As at 31 December 2005 2006 2007 2008 2009 2010 2011 2012 2013 2014
Assets
Cash and short term funds 6,127 7,790 9,244 10,168 13,509 14,104 18,671 31,545 24,901 29,165
Balances with Central Banks 13,933 17,106 17,253 15,629 16,263 25,642 30,223 29,963 28,699 30,422
Placements with banks 36,851 23,735 19,722 16,403 45,867 42,709 14,581 19,394 19,315 19,767
Loans and advances to customers 166,604 224,962 284,496 271,105 265,065 368,302 543,149 691,899 725,332 741,348
Other financial assets 71,972 82,178 80,635 144,913 168,481 241,205 195,444 239,089 335,455 438,554
Investment in subsidiaries and
associates 4,225 3,711 3,650 3,603 4,037 6,124 7,084 7,636 7,672 7,056
Investment properties 1,236 1,088 559 - - - - -
Property, plant and equipment 4,769 5,145 4,982 5,018 5,724 5,621 10,595 11,516 12,089 16,296
Intangible assets 467 420 399 233 111 164 343 376 501 385
Other assets 13,537 12,164 16,961 17,304 19,184 16,377 18,183 16,803 39,617 46,027
Total assets 319,721 378,299 437,901 484,376 538,241 720,248 838,273 1,048,221 1,193,581 1,329,020
Ten Year Statistical Summary - Bank

Truly Everybody’s Bank
347
LKR million
As at 31 December 2005 2006 2007 2008 2009 2010 2011 2012 2013 2014
Liabilities
Due to banks * 2,215 6,508 10,128 1,166 890
Due to customers 232,822 262,990 308,856 316,070 408,607 530,092 595,774 693,441 842,070 933,966
Debt securities issued and
subordinated term debts 7,350 3,850 9,150 17,988 18,045 40,115 42,591 47,114 45,326 53,282
Other borrowings 54,686 81,106 84,658 111,100 67,302 105,169 138,389 233,795 235,370 246,736
Current tax liabilities 76 727 885 1,079 190 2,200 1,139 2,208 - -
Other liabilities 8,436 11,714 13,302 15,037 19,198 10,551 12,518 10,582 11,949 19,340
Total liabilities 303,370 360,387 416,851 461,274 513,342 690,342 796,919 997,268 1,135,881 1,254,214
Equity
Share capital 4,000 4,000 5,000 5,000 5,000 5,000 5,000 5,000 5,000 10,000
Permanent reserve fund 1,915 2,455 2,515 2,585 2,650 2,777 3,008 3,286 3,538 3,810
Retained earnings 9,475 10,298 12,161 14,335 15,820 14,564 21,733 27,639 31,419 44,861
Other reserves 961 1,159 1,374 1,182 1,429 7,565 11,613 15,028 17,743 16,135
Total equity 16,351 17,912 21,050 23,102 24,899 29,906 41,354 50,953 57,700 74,806
Total liabilities and equity 319,721 378,299 437,901 484,376 538,241 720,248 838,273 1,048,221 1,193,581 1,329,020
Commitments and contingencies 80,187 105,502 134,713 164,813 246,245 313,040 409,747 455,181 655,441 721,763
Ratios
Return on average assets (%) 1.1 1.2 1.1 1.1 0.8 1.6 2.1 2.1 1.4 1.6
Return on average equity (%) 11.9 15.3 14.6 16.1 12.9 24.0 33.5 31.2 22.2 20.5
Income growth (%) 14.1 28.8 42.5 20.0 5.5 (0.2) 11.2 56.3 15.7 (0.7)
Capital adequacy ratio (%)
- Tier I 12.7 11.9 11.4 11.3 11.2 10.3 7.8 8.3 8.4 9.5
- Tier I + Tier II 13.2 12.3 11.4 15.9 14.2 13.7 10.9 11.5 12.1 13.6
Capital funds to liabilities including
contingent liabilities (%) 4.3 3.8 3.8 3.7 3.3 3.1 3.4 3.5 3.2 3.8
Liquidity ratio - domestic (%) 26.9 22.2 21.2 24.2 21.1 28.7 23.4 21.8 27.7 30.8
Cost to income ratio (%) 72.6 68.9 67.5 64.2 68.3 53.7 51.1 42.7 49.1 44.0
Note : Highlighted information is based on LKASs/SLFRSs.
* From 2005 to 2009 due to banks amount is included in due to customers and other borrowings

BANK OF CEYLON . Annual Report 2014
348
As at 31 December 2005 2006 2007 2008 2009 2010 2011 2012 2013 2014
Other information
No of employees 8,891 8,363 8,253 7,912 7,538 8,204 8,115 7,790 8,883 8,577
No of branches 304 305 307 309 310 309 318 324 567 573
No of ATMs 104 190 203 251 329 352 404 451 523 540
No of advances (‘000) 1,285 1,541 1,867 1,839 2,011 2,261 2,837 3,363 3,193 2,384
No of deposits (‘000) 5,782 6,248 6,993 7,494 8,440 9,321 10,179 10,955 11,606 12,311
LKR million
As at 31 December 2005 2006 2007 2008 2009 2010 2011 2012 2013 2014
Cash flows from operating activities (8,961) (24,200) (13,713) 30,262 100,115 10,271 (42,348) (19,271) 47,051 63,046
Cash flows from investing activities (6,315) (8,998) 3,034 (67,091) (20,775) (59,418) 6,924 (52,965) (51,351) (27,222)
Cash flows from financing activities 25,309 21,746 8,120 34,433 (45,144) 46,554 12,476 89,640 (4,377) (29,519)
Capital expenditure on purchase of
property plant and equipments (927) (912) (544) (647) (1,446) (1,168) (1,905) (1,483) (1,682) (1,743)
Disclosure in terms of section 7.6 (xvi) of the Listing Rules of Colombo Stock Exchange on related party transactions
exceeding 10% of the equity or 5% of the total assets of the Bank
The Bank did not carry out any transactions exceeding 10% of the equity or 5% of the total assets of the Bank, whichever is lower, with
the related parties given in Note 55 to the Financial Statements, except for the transactions engaged with Government of Sri Lanka and
Government related entities.
Government of Sri Lanka, who holds 100% shareholding in Bank of Ceylon and Government related entities carry out transactions with the
Bank, in the ordinary course of business and the aggregate monetary value of these transactions exceeded the threshold given in Section
7.6 (xvi) of the Listing Rules of Colombo Stock Exchange. These transactions include;
1. Overdraft facility granted to the Deputy Secretary to the Treasury
2. Foreign currency loans granted to the Government of Sri Lanka and State Owned Enterprises
3. Investment in Sri Lanka Development Bonds and Restructuring Bonds issued by Government of Sri Lanka
4. Extending of trade finance credit and other related services to facilitate import transactions of the Government of Sri Lanka and State
Owned Enterprises
5. Deposits made by the Government and Government related entities with the Bank.
Most of these transactions are considered as recurrent nature transactions and the outstanding balances as at 31 December 2014 and the
transactions during the year 2014 are given in the Note 55.4 to the Financial Statements.
Ten Year Statistical Summary - Bank

Truly Everybody’s Bank
349
* as at 31 December 2014
Subsidiary companies Directors *
Property Development PLC
19th Floor,
BoC Head Office Building,
“BOC Square”, No. 01,
Bank of Ceylon Mawatha,
Colombo 01
Air Chief Marshal
Harsha Abeywickrema
(Chairman)
Mr D M Gunasekara
Mr P A Lionel
Dr M S Perera
Mr L N de Silva Wijeyeratne
Mr S E de Silva
Tel : 011 2544328
Fax : 011 2544329 Secretaries
e-mail : [email protected] M/sVarnersInternational
(Private) Limited
Merchant Bank of Sri Lanka & Finance PLC
BOC Merchant Tower,
No. 28, St. Michael’s Road,
Mr M R Shah
(Chairman)
Colombo 03 Mr D M Gunasekara
Mr Senarath Bandara
Tel : 011 4711711 Mr C R Jayawarna
011 2565636 Mr P G Rupasinghe
Fax : 011 2565666 Mr M S S Paramananda
e-mail : mbslbank@mbslbank
.com
Website : www.mbslbank.com
Mr W P Russel Fonseka
(Alternate director to
Mr D M Gunasekara)
Mr A M P Amarakoon
(Alternate Director to
Mr M S S Paramananda)
Secretary
Ms Karnika Jayathilake
BOC Management & Support Services (Private) Limited
25th Floor,
BoC Head Office Building,
Mr D M Gunasekara
(Chairman)
“BOC Square”, No. 01, Mr D P K Gunasekera
Bank of Ceylon Mawatha, Mr W A C Tissera
Colombo 01
Secretary
Tel : 011 2446790 Ms Janaki Senanayake
Siriwardane
Subsidiary companies Directors *
BOC Property Development & Management (Private)
Limited
10th Floor,
BOC Merchant Tower,
Mr D M Gunasekara
(Chairman)
No. 28, St. Michael’s Road, Mr P J Jayasinghe
Colombo 03 Ms S H Ranawaka
Mr K T Karunaratne
Tel : 011 2301911 Mr S M S C Jayasuriya
Fax : 011 2370607
e-mail : [email protected]
(Alternate director to
Mr D M Gunasekara)
Secretaries
M/s Corporate Services (Private)
Limited
BOC Travels (Private) Limited
1st Floor,
BoC Super Grade Branch
Building,
Mr Chandrasiri de Silva
(Chairman)
Ms Nalini D Abeywardene
Baseline Road, Mr D M Gunasekara
Colombo 08 Mr D P K Gunasekara
Mr Lalith J Fernando
Tel : 011 2688154-8 Mr G L Palitha Jinasoma
Fax : 011 2688175 Mr C Amarasinghe
e-mail : [email protected] (Alternate director to
Website : www.boctravels.com Mr D M Gunasekara)
Secretaries
M/s S S P Corporate Services
(Private) Limited
MBSL Savings Bank Limited
No.519,
T B Jayah Mawatha,
Mr M R Shah
(Chairman)
Colombo 10 Mr T Mutugala
Mr A B L A de Silva
Tel : 011 2374000 Mr K D A Fernando
Fax : 011 2374044 Mr H M A B Weerasekara
e-mail : savingsbank@
mbslsavingsbank.com
Mr H D P Jayathilaka
Website : www.mbslsavingsbank
.com
Secretary
Ms T T K Attanayake
Subsidiaries and Associates
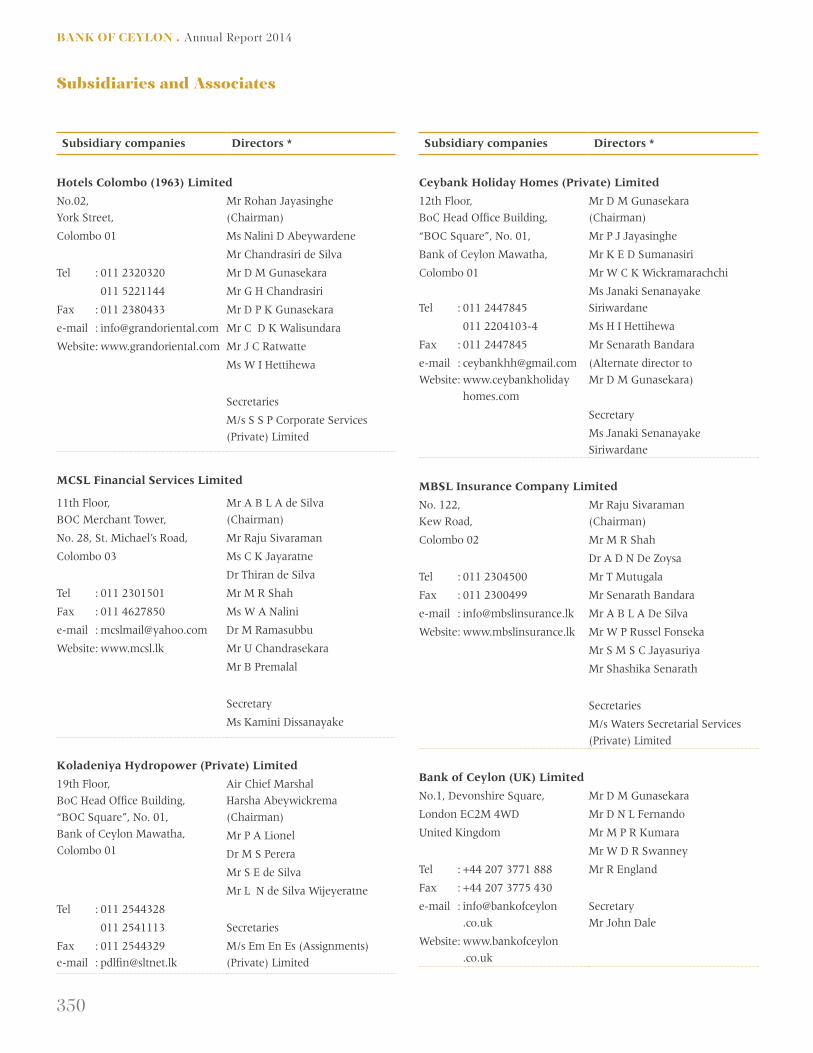
BANK OF CEYLON . Annual Report 2014
350
Subsidiary companies Directors *
Hotels Colombo (1963) Limited
No.02,
York Street,
Mr Rohan Jayasinghe
(Chairman)
Colombo 01 Ms Nalini D Abeywardene
Mr Chandrasiri de Silva
Tel : 011 2320320 Mr D M Gunasekara
011 5221144 Mr G H Chandrasiri
Fax : 011 2380433 Mr D P K Gunasekara
e-mail : [email protected] Mr C D K Walisundara
Website : www.grandoriental.com Mr J C Ratwatte
Ms W I Hettihewa
Secretaries
M/s S S P Corporate Services
(Private) Limited
MCSL Financial Services Limited
11th Floor,
BOC Merchant Tower,
Mr A B L A de Silva
(Chairman)
No. 28, St. Michael’s Road, Mr Raju Sivaraman
Colombo 03 Ms C K Jayaratne
Dr Thiran de Silva
Tel : 011 2301501 Mr M R Shah
Fax : 011 4627850 Ms W A Nalini
e-mail : [email protected] Dr M Ramasubbu
Website : www.mcsl.lk Mr U Chandrasekara
Mr B Premalal
Secretary
Ms Kamini Dissanayake
Koladeniya Hydropower (Private) Limited
19th Floor,
BoC Head Office Building,
“BOC Square”, No. 01,
Bank of Ceylon Mawatha,
Colombo 01
Air Chief Marshal
Harsha Abeywickrema
(Chairman)
Mr P A Lionel
Dr M S Perera
Mr S E de Silva
Mr L N de Silva Wijeyeratne
Tel : 011 2544328
011 2541113 Secretaries
Fax : 011 2544329
e-mail : [email protected]
M/s Em En Es (Assignments)
(Private) Limited
Subsidiary companies Directors *
Ceybank Holiday Homes (Private) Limited
12th Floor,
BoC Head Office Building,
Mr D M Gunasekara
(Chairman)
“BOC Square”, No. 01, Mr P J Jayasinghe
Bank of Ceylon Mawatha, Mr K E D Sumanasiri
Colombo 01 Mr W C K Wickramarachchi
Tel : 011 2447845
Ms Janaki Senanayake
Siriwardane
011 2204103-4 Ms H I Hettihewa
Fax : 011 2447845 Mr Senarath Bandara
e-mail : [email protected]
Website : www.ceybankholiday
homes.com
(Alternate director to
Mr D M Gunasekara)
Secretary
Ms Janaki Senanayake
Siriwardane
MBSL Insurance Company Limited
No. 122,
Kew Road,
Mr Raju Sivaraman
(Chairman)
Colombo 02 Mr M R Shah
Dr A D N De Zoysa
Tel : 011 2304500 Mr T Mutugala
Fax : 011 2300499 Mr Senarath Bandara
e-mail : [email protected] Mr A B L A De Silva
Website : www.mbslinsurance.lk Mr W P Russel Fonseka
Mr S M S C Jayasuriya
Mr Shashika Senarath
Secretaries
M/s Waters Secretarial Services
(Private) Limited
Bank of Ceylon (UK) Limited
No.1, Devonshire Square, Mr D M Gunasekara
London EC2M 4WD Mr D N L Fernando
United Kingdom Mr M P R Kumara
Mr W D R Swanney
Tel : +44 207 3771 888 Mr R England
Fax : +44 207 3775 430
e-mail : info@bankofceylon
.co.uk
Secretary
Mr John Dale
Website : www.bankofceylon
.co.uk
Subsidiaries and Associates

Truly Everybody’s Bank
351
Associate companies Directors*
Lanka Securities (Private) Limited
No.228/2,
Galle Road,
Ms Aamna Taseer
(Chairperson)
Colombo 04 Mr P A Lionel
Mr M Eshan ul-Haq
Tel : 011 4706757 Mr Farooq Bin Habib
011 2554942 Mr K U D Gamage
Fax : 011 4706767 Mr M R Shah
e-mail : [email protected]
Website : www.lsl.lk
Mr S A Taseer
(Alternate director to
Mr M Eshan ul-Haq)
Mr S Taseer
(Alternate director to
Mr Farooq Bin Habib)
Mr I Hafeez
(Alternate director to
Ms Aamna Taseer)
Secretaries
M/s S S P Corporate Services
(Private) Limited
Mireka Capital Land (Private) Limited
No. 324, Havelock Road,
Colombo 06
Mr S P Tao
(Chairman)
Mr Raju Sivaraman
Tel : 011 2596793 Mr W P Russel Fonseka
011 2505100 Mr H S Jayawardana
011 2346333 Mr M T Ong
Fax : 011 2449303 Mr H Z Cassim
e-mail : [email protected] Mr L R de Lanerolle
Website : www.havelockcity.com Mr A M de S Jayaratne
Dr Ranee Jayamaha
Mr Senarath Bandara
(Alternate director to
Mr Raju Sivaraman)
Ms S H Ranawaka
(Alternate director to
Mr W P Russel Fonseka)
Mr E P Ong
(Alternate director to Mr S P Tao )
Secretary
Ms Minoka Sirajinie Fernando
Associate companies Directors*
Transnational Lanka Records Solutions (Private) Limited
160/16, Kirimandala Mawatha,
Narahenpita,
Mr W P Russel Fonseka
(Chairman)
Colombo 05 Mr S M S C Jayasuriya
Mr D K W Liew
Tel : 011 7574574 Mr S J Jebarathnam
011 7574575 Mr D M H Liew
Fax : 011 4514588 Mr C R Norwood
e-mail : [email protected]
Website : www.transnational-grp
.com Secretaries
M/s P W Corporate Secretarial
(Private) Limited
Ceybank Asset Management Limited
No.54/C1, Ward Place, Mr K L Hewage (Chairman)
Colombo 07 Mr D M Gunasekara
Mr P A Lionel
Tel : 011 7602000-2 Mr M Selvanathan
Fax : 011 2683095 Mr C Sathkumara
e-mail : [email protected] Mr M S P R Perera
Website : www.ceybank.com Mr P Kudabalage
Shri B Babu Rao
Mr G A Jayashantha
(Alternate director to
Mr D M Gunasekara)
Mr U D Liyanagamage
(Alternate director to
Mr P Kudabalage)
Mr A P Weeratunge
(Alternate director to
Mr M Selvanathan)
Secretaries
M/s Carsons Management
Services (Private) Limited
Note : Southern Development Financial Company Limited is not in operation
* as at 31 December 2014

BANK OF CEYLON . Annual Report 2014
352
BoC Correspondent Banks by Country
AFGHANISTAN
1. DA Afghanistan Bank
ALBANIA
2. Raiffeisen Bank
ALGERIA
3. Banque Exterieure d’Algerie
ARGENTINA
4. Banco Credicoop Cooperativo Ltd
5. Banco Finansur SA
6. Banco Macro SA
ARMENIA
7. ArdshinInvest Bank CJSC
AUSTRALIA
8. Australia & New Zealand Banking
Group Ltd
9. HSBC Bank Australia Ltd.
10. National Australia Bank Ltd
11. Westpac Banking Corporation
AUSTRIA
12. Allgemeine Sparkasse Oberosterreich
Bank AG
13. Uni Credit Bank Austria AG
(Bank Austria Creditanstalt AG)
14. BAWAG PSK Bank
15. BKS Bank AG
16. Erste Bank der Oesterreichischen
Sparkassen AG
17. Erste Group Bank AG
18. Oberbank AG
19. OsterreichischeVolksbankenAG
20. Raiffeisen Bank International AG
21. Raiffeisenlandesbank Oberosterreich
Aktiengesellschaft
22. Salzburger Landes
Hypothekenbank AG
23. VorarlbergerLandes-und
Hypothekenbank Aktiengesellschaft
BAHRAIN
24. Ahli United Bank
25. Al Baraka Islamic Bank
26. Bahrain Islamic Bank
27. Arab Banking Corporation
28. BBK(Formerly Bank of Bahrain &
Kuwait BSC)
29. BMI Bank B S C (C)
30. Gulf International Bank
31. Habib Bank Limited
32. HSBC Bank Middle East
33. National Bank of Bahrain
34. The Arab Investment Company
BANGLADESH
35. Agrani Bank
36. Bangladesh Krishi Bank
37. BASIC Bank Ltd
(Bangladesh Small Industries &
Commerce Bank Ltd)
38. Janata Bank
39. Prime Bank Ltd
40. Pubali Bank Ltd
41. Sonali Bank
42. The Premier Bank Ltd
43. Uttara Bank Ltd
BELARUS
44. Belarus Bank
45. Belvnesheconombank
BELGIUM
46. AntwerpseDiamantBankNV
47. Banca Monte Paschi, Belgio
48. Byblos Bank Europe SA
49. DeutscheBankSA/NV
50. FortisBankNV/SA
51. INGBelgiumSA/NV
52. KBCBankNV
BERMUDA
53. Bank of Bermuda Ltd
BOTSWANA
54. Barclays Bank of Botswana Ltd
BRAZIL
55. Banco ABC Brazil S.A
56. Banco do Brazil
57. Banco Fibra SA
58. Banco Industrial eCommercial S.A
(BICBANCO)
59. Banco Indusval S.A
BULGARIA
60. Raiffeisenbank (Bulgaria) EAD
61. Teximbank
62. UniCredit BulBank AD
(Formerly Bulbank AD)
63. United Bulgarian Bank AD
64. Central Cooperative Bank
65. Investbank PLC
66. Municipal Bank PLC
CAMBODIA
67. ACLEDA Bank PLC
CANADA
68. Bank of Montreal
69. Bank of Nova Scotia
70. Canadian Imperial Bank of Commerce
71. HSBC Bank Canada
72. Royal Bank of Canada
73. Toronto Dominion Bank
CHILE
74. Corpbanca
CHINA
75. Bank of Changsha
76. Bank of China
77. Bank of Communications
78. Bank of Hangzhou Co. Ltd
79. Bank of Jiangsu Co. Ltd
80. Bank of Jiujiang Co. Ltd
81. Bank of Nanjing
82. Bank of Shaoxing Co.Ltd
83. Bank of Xi’an Co. Ltd
84. Changshu Rural Commercial Bank
85. China Construction Bank
Corporation
86. China Development Bank
Corporation
87. China Everbright Bank Co. Ltd
88. Evergrowing Bank Co. Ltd
89. Export Import Bank of China
90. OCBC Bank (CHINA) Ltd
91. Zhejiang Nanxun Rural
Cooperative Bank
92. Zhejiang Xiaoshan Rural
Cooperative Bank
COLOMBIA
93. Banco Popular
COOK ISLANDS
94. WSBC Bank Co. Ltd
CROATIA
95. Zagrebacka Banka dd

Truly Everybody’s Bank
353
CYPRUS
96. Alpha Bank Cyprus Ltd
97. Bank of Cyprus Public Company Ltd
98. Hellenic Bank Public Company Ltd.
99. National Bank of Greece (Cyprus) Ltd
CZECH REPUBLIC
100. Ceska Sporitelna A.S.
101. Ceskoslovenska
Obchodni Banka A.S.
102. GE Money Bank A.S.
103. Komercni Banka A.S.
104. LBBW Bank CZ A.S.
105. Raiffeisen Bank A.S.
106. UniCredit Bank CZECH Republic A.S.
DENMARK
107. ALS Skiern Bank
108. Danmarks National Bank
109. Danske Bank A/S
110. Jyske Bank A/S
111. Nordea Bank Danmark A/S
112. Nordjyske Bank A/S
113. Rinkjobing Landbo - bank
114. Skjern Bank
115. Spar Nord Bank A/S
116. SparebankVest
117. Sydbank A/S
118. VestjyskBank
ECUADOR
119. Banca International Produbanco
EGYPT
120. ABC Egypt (Arab Banking Corp.)
121. Arab International Bank
122. Bank of Alexandria
(ALEXBANK)
123. Banque Du Caire SAE
124. Banque Misr
125. Central Bank of Egypt
126. Commercial International Bank
(Egypt) SAE
EGYPT
127. Calyon Bank (Egypt) SAE
128. Egyptian Saudi Finance Bank
129. Faisal Islamic Bank of Egypt SAE
130. Mohandes Bank
131. National Bank of Egypt
132. Suez Canal Bank SAE
ESTONIA
133. SEB Bank
ETHIOPIA
134. Commercial Bank of Ethiopia
FIJI
135. National Bank of Fiji Limited
FINLAND
136. Aktia Bank PLC
137. Nordea Bank Finland PLC
138. OKO Osuuspankkien Keskuspankki
OYJ
139. Pohjola Bank PLC
140. Sampo Bank PLC
FRANCE
141. AL Khaliji France SA
142. Bank of India (Paris Branch)
143. Banque BIA
144. Banque De Neuflize, Schlumberger,
Mallet, Demachy
145. Banque D’Escompte
146. Banque Federative DU Credit Mutuel
147. Banque Palatine
148. Banque SBA
149. BNP Paribas
150. Calyon
151. CIC Lyonnaise De Banque
152. Credit Agricole
153. Credit Cooperatif
154. Credit DU Nord
155. Credit Industrial DEL’Quest
156. Credit Industrial ET Commercial (CIC)
157. Credit Lyonnais
158. HSBC Private Bank France SA
159. NATIXIS (Formerly Natexis Banque
Popularies)
160. Societe Generale
161. Union De Banques A Paris
(UBAF)-(Union De Banques Arabes
ET Francaises)
162. VTBBank(France)SA
(Formerly Banque Commerciale Pour
L’Europe Du Nordeurobank)
GEORGIA
163. Bank of Georgia
GERMANY
164. Baden Wuttenbergische Bank AG
165. Bankhaus Carlf Plump & Co.
166. Bankhaus Neelmeyer AG
167. Bayerische Landesbank
168. Berenberg Bank
169. BerlinerVolksbankEG
170. BHF Bank Aktiengeselschaft
171. Bremer Landesbank
172. CommerzBank AG
(Dusseldorf)
173. CommerzBank AG (Frankfurt)
174. Degussa Bank
175. Deutsche Bank AG
176. Deutsche Bundesbank
177. Deutsche PostBank AG
178. DVBBankAG
179. DZ Bank AG
180. FrankfurterVolksbankEG
181. Hamburger Sparkasse AG
182. HSBC Trinkaus & Burkhardt KGA
183. ING BHF – Bank AG
184. Kreissparkasse Esslingen-Nurtingen
185. Kreissparkasse Goppingen
186. Kreissparkasse Heilbronn
187. Landesbank Baden-Wurttemberg
188. Landesbank Berlin AG
(Merger of Bankgesel-Ischaft Berlin
AG & Landesbank Berlin AG)
189. Landesbank Hessen Thuringen
Girozentrale
190. LRP Landesbank Rheinland PFALZ
191. MainzerVolksbankeG
192. Nassauische Sparkasse
193. Nordeutsche Landes-bank
Girozentrale
194. NRW Bank
195. Oldenburgische Landesbank AG
196. Sparkasse Bielefeld
197. Sparkasse Dortmund
198. Sparkasse Duren
199. Sparkasse Essen
(Stadtsparkasse Essen)
200. Sparkasse Hannover
201. Sparkasse Herford
202. Sparkasse Pforzheim Calw
203. Stadtsparkasse Dusseldorf
204. Stadtsparkasse Monchengladbach
205. Stadtsparkasse Wuppertal
206. Standard Chartered Bank (Frankfurt)
207. UniCredit Bank AG (Bayerische
Hypo-undVereinsbankAG)
208. Westlab AG
GHANA
209. Ghana Commercial Bank Ltd
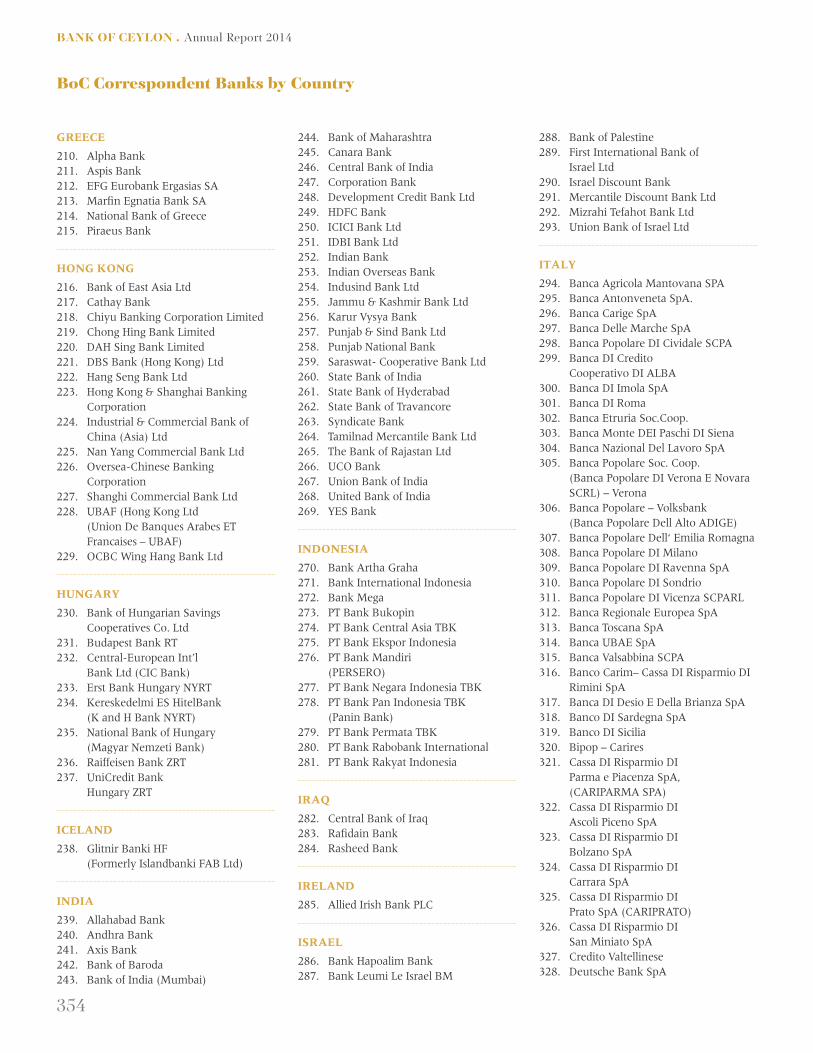
BANK OF CEYLON . Annual Report 2014
354
GREECE
210. Alpha Bank
211. Aspis Bank
212. EFG Eurobank Ergasias SA
213. Marfin Egnatia Bank SA
214. National Bank of Greece
215. Piraeus Bank
HONG KONG
216. Bank of East Asia Ltd
217. Cathay Bank
218. Chiyu Banking Corporation Limited
219. Chong Hing Bank Limited
220. DAH Sing Bank Limited
221. DBS Bank (Hong Kong) Ltd
222. Hang Seng Bank Ltd
223. Hong Kong & Shanghai Banking
Corporation
224. Industrial & Commercial Bank of
China (Asia) Ltd
225. Nan Yang Commercial Bank Ltd
226. Oversea-Chinese Banking
Corporation
227. Shanghi Commercial Bank Ltd
228. UBAF (Hong Kong Ltd
(Union De Banques Arabes ET
Francaises – UBAF)
229. OCBC Wing Hang Bank Ltd
HUNGARY
230. Bank of Hungarian Savings
Cooperatives Co. Ltd
231. Budapest Bank RT
232. Central-European Int’l
Bank Ltd (CIC Bank)
233. Erst Bank Hungary NYRT
234. Kereskedelmi ES HitelBank
(K and H Bank NYRT)
235. National Bank of Hungary
(Magyar Nemzeti Bank)
236. Raiffeisen Bank ZRT
237. UniCredit Bank
Hungary ZRT
ICELAND
238. Glitnir Banki HF
(Formerly Islandbanki FAB Ltd)
INDIA
239. Allahabad Bank
240. Andhra Bank
241. Axis Bank
242. Bank of Baroda
243. Bank of India (Mumbai)
244. Bank of Maharashtra
245. Canara Bank
246. Central Bank of India
247. Corporation Bank
248. Development Credit Bank Ltd
249. HDFC Bank
250. ICICI Bank Ltd
251. IDBI Bank Ltd
252. Indian Bank
253. Indian Overseas Bank
254. Indusind Bank Ltd
255. Jammu & Kashmir Bank Ltd
256. KarurVysyaBank
257. Punjab & Sind Bank Ltd
258. Punjab National Bank
259. Saraswat- Cooperative Bank Ltd
260. State Bank of India
261. State Bank of Hyderabad
262. State Bank of Travancore
263. Syndicate Bank
264. Tamilnad Mercantile Bank Ltd
265. The Bank of Rajastan Ltd
266. UCO Bank
267. Union Bank of India
268. United Bank of India
269. YES Bank
INDONESIA
270. Bank Artha Graha
271. Bank International Indonesia
272. Bank Mega
273. PT Bank Bukopin
274. PT Bank Central Asia TBK
275. PT Bank Ekspor Indonesia
276. PT Bank Mandiri
(PERSERO)
277. PT Bank Negara Indonesia TBK
278. PT Bank Pan Indonesia TBK
(Panin Bank)
279. PT Bank Permata TBK
280. PT Bank Rabobank International
281. PT Bank Rakyat Indonesia
IRAQ
282. Central Bank of Iraq
283. Rafidain Bank
284. Rasheed Bank
IRELAND
285. Allied Irish Bank PLC
ISRAEL
286. Bank Hapoalim Bank
287. Bank Leumi Le Israel BM
288. Bank of Palestine
289. First International Bank of
Israel Ltd
290. Israel Discount Bank
291. Mercantile Discount Bank Ltd
292. Mizrahi Tefahot Bank Ltd
293. Union Bank of Israel Ltd
ITALY
294. Banca Agricola Mantovana SPA
295. Banca Antonveneta SpA.
296. Banca Carige SpA
297. Banca Delle Marche SpA
298. Banca Popolare DI Cividale SCPA
299. Banca DI Credito
Cooperativo DI ALBA
300. Banca DI Imola SpA
301. Banca DI Roma
302. Banca Etruria Soc.Coop.
303. Banca Monte DEI Paschi DI Siena
304. Banca Nazional Del Lavoro SpA
305. Banca Popolare Soc. Coop.
(BancaPopolareDIVeronaENovara
SCRL)–Verona
306. BancaPopolare–Volksbank
(Banca Popolare Dell Alto ADIGE)
307. Banca Popolare Dell‘ Emilia Romagna
308. Banca Popolare DI Milano
309. Banca Popolare DI Ravenna SpA
310. Banca Popolare DI Sondrio
311. BancaPopolareDIVicenzaSCPARL
312. Banca Regionale Europea SpA
313. Banca Toscana SpA
314. Banca UBAE SpA
315. BancaValsabbinaSCPA
316. Banco Carim– Cassa DI Risparmio DI
Rimini SpA
317. Banca DI Desio E Della Brianza SpA
318. Banco DI Sardegna SpA
319. Banco DI Sicilia
320. Bipop – Carires
321. Cassa DI Risparmio DI
Parma e Piacenza SpA,
(CARIPARMA SPA)
322. Cassa DI Risparmio DI
Ascoli Piceno SpA
323. Cassa DI Risparmio DI
Bolzano SpA
324. Cassa DI Risparmio DI
Carrara SpA
325. Cassa DI Risparmio DI
Prato SpA (CARIPRATO)
326. Cassa DI Risparmio DI
San Miniato SpA
327. CreditoValtellinese
328. Deutsche Bank SpA
BoC Correspondent Banks by Country

Truly Everybody’s Bank
355
329. Hypo Alpe-Adria-Bank SpA
330. Intesa San Paolo SpA
(Formerly Banca Intesa SpA)
331. UBI Banca
332. UGF Banca
333. UniCredit Bank AG
(UniCredito Italiano SpA)
334. Unipol Banca SpA
JAMAICA
335. National Commercial Bank of
Jamaica Ltd
JAPAN
336. 77 Bank Ltd
337. Aozora Bank Ltd
338. Australia & New Zealand Banking
Group Ltd
339. AWA Bank Ltd
340. Bank of Kochi Ltd
341. Bank of Kyoto
342. Bank of Tokyo - Mitsubishi UFJ Ltd
343. Bank of Yokohama Ltd
344. Chiba Kogyo Bank Ltd
345. Chukyo Bank Ltd
346. Chuo Mitsui Trust and Banking Co.
Ltd
347. Gunma Bank Limited
348. Higashi-Nippon Bank
349. Hokuriku Bank Ltd
350. Kinki Osaka Bank Ltd
351. Kiyo Bank Ltd
352. Kyoto Shinkin Bank
353. Minato Bank Ltd
(Formerly Midori Bank Ltd)
354. Mitsubish Trust & Banking Co
355. Mizuho Bank Ltd
356. Nishi Nippon City Bank Ltd
357. Okazaki Shinkin Bank
358. Osaka City Shinkin Bank
359. Resona Bank Limited
360. Saitama Resona Bank Ltd
361. SETO Shinkin Bank
362. Shiga Bank Ltd
363. Shinkin Central Bank
364. Shinsei Bank Ltd
(Formerly Long Term
Credit Bank of Japan)
365. Standard Chartered Bank
366. Sugamo Shinkin Bank
367. Sumitomo Mitsui Banking
Corporation
368. The Asahi Shinkin Bank
369. The Ashikaga Bank Ltd
370. The Hokkaido Bank Limited
371. The Shikoku Bank Ltd
372. The Shizuoka Bank Ltd
373. The Yokohama Shinkin Bank
374. Tokushima Bank Ltd
375. Tokyo Tomin Bank Ltd
376. Tomato Bank Ltd
377. Towa Bank Ltd
378. Yamagata Bank Ltd
379. Yamaguchi Bank Ltd
380. Yamanashi Chuo Bank Ltd
JORDAN
381. Arab Bank PLC
382. Arab Jordan Investment Bank
383. Bank AL Etihad
384. Bank Audi SAL Audi Saradar Group
385. Bank of Jordan PLC
386. Cairo Amman Bank
387. Housing Bank for Trade & Finance
388. InvestBank (JIF Bank)
(Formerly Jordan Investbank &
Finance Bank)
389. Islamic International Arab Bank Ltd
390. Jordan Ahli Bank PLC
391. Jordan Commercial Bank
392. Jordan Dubai Islamic Bank
393. Jordan Kuwait Bank
KAZAKSTAN
394. JSC Bank CenterCredit
KENYA
395. Barclays Bank of Kenya Ltd
396. Kenya Commercial Bank Ltd
KOREA
397. CitiBank Korea Inc
398. Hana Bank
399. Kookmin Bank
400. Korea Development Bank
401. Korea Exchange Bank
402. Kyongnam Bank
403. Pusan Bank
404. The Kwangju Bank Ltd
405. Woori Bank
KUWAIT
406. AL Ahli Bank of Kuwait
407. Bank of Kuwait & The Middle East
408. Burgan Bank SAK
409. Commercial Bank of Kuwait SAK
410. Gulf Bank
411. Kuwait International Bank
412. National Bank of Kuwait
KYRGYSTAN
413. Asia Universal Bank
LATVIA
414. Parex Bank
415. Rietumu Bank
416. SEB Banka
LEBANON
417. Al Ahli International Bank SAL
418. Arab African International Bank
419. Arab Bank PLC
(Lebanon Branches
Centre) Beirut
420. Audi Private Bank SAL
421. Bank Audi SAL
422. Bank Bemo SAL
423. Bankmed SAL
424. Bank of Beirut SAL
425. Banque Libano Francaise
426. BBAC SAL
427. BLC Bank SAL
428. BLOM Bank SAL
429. Byblos Bank SAL
430. Credit Libanais SAL
431. First National Bank SAL
432. Fransbank SAL
433. IBL Bank
434. Jamal Trust Bank SAL
435. MEAB Bank
(Middle East & African Bank
SAL)
436. Near East Commercial Bank SAL
437. Societe Generale
Banque AU Liban SAL
438. Societe Nouvelle DE LA Banque De
Syrie Et Liban SAL
LIBYA
439. Gumhoria Bank
440. National Commercial Bank SAL
441. Umma Bank SAL
442. Wadha Bank
LITHUANIA
443. AB Bankas Hansa Bankas
444. AB Bankas Snoras
445. SEB Bank
446. UKIO Bank AS

BANK OF CEYLON . Annual Report 2014
356
MACAU
447. Banco Weng Hang SA
MADAGASCAR
448. Bank of Africa – Madagascar
449. Banque Centrale De Madagascar
MALAWI
450. National Bank of Malawi
MALAYSIA
451. Alliance Bank Malaysia, Berhad
452. Ambank Berhad
453. Bank Islam Malaysia Berhad
454. CIMB Bank Berhad
455. EON Bank Berhad
456. Malayan Banking Berhad
(MAYBANK)
457. OCBC (Malaysia) Berhad
458. Oversea-Chinese Banking
Corporation Ltd (Kuala Lumpur)
459. Public Bank Berhad
460. RHB Bank Berhad
461. Royal Bank of Scotland
462. United Overseas Bank (Malaysia)
Berhad
MALDIVES
463. Bank of Maldives PLC
464. Habib Bank Ltd
MALTA
465. BankofValleta
466. FIM Bank PLC Ltd
467. HSBC Bank Malta PLC
MAURITIUS
468. State Bank of Mauritius Ltd
469. The Mauritius Commercial Bank Ltd
MEXICO
470. Banco Nacional De Mexico SA
471. Banco Santander
Mexicano SPA
472. BBVABancomerSA
473. HSBC Mexico SA
MONGOLIA
474. Trade & Development
Bank of Mongolia
MOROCCO
475. Credit DU Marco SA
MOZAMBIQUE
476. Banco Internacional de
Mocombique SARL
NAMIBIA
477. Bank Windhoek Ltd
NEPAL
478. Himalanyan Bank Ltd
479. Nepal Bank Ltd
480. Nepal Credit Commercial Bank
481. Standard Chartered Bank Nepal Ltd
NETHERLANDS
482. ABN Ambro Bank –
Royal Bank of Scotland
483. FVanLanschotBankiersNV
484. HollandscheBank–UNIENV
485. INGBankNV
486. Rabobank Nederland
487. SNSBankNV
488. TheEconomyBankNV
489. YapiVeKrediBankasiAS
NEW ZEALAND
490. ANZ Bank National Bank Ltd
491. ASB International Bank
492. Bank of New Zealand
493. Westpac Banking Corporation
NIGERIA
494. First Bank of Nigeria PLC
495. Union Bank of Nigeria PLC
NORWAY
496. DNB NOR Bank ASA
497. Nordea Bank Norge AS
498. Sparebanken Hedmark
499. Sparebanken More
500. Sparebanken Nord Norge
OMAN
501. Bank Dhofar SAOG
502. Bank Sohar SAOG
503. Bankmuscat SAOG
504. National Bank of Oman SAOG
505. Oman Arab Bank SAOG
506. Oman International Bank
PAKISTAN
507. Allied Bank of Pakistan
508. Askaribank Limited
509. Atlas Bank
510. Bank Al Habib Limited
511. Bank of Khyber
512. Bank of Punjab
513. Dawood Islamic Bank Ltd
514. Faysal Bank Ltd
515. Habib Bank Ltd
516. Habib Metropolitan Bank Ltd
517. KASB Bank
518. MCB Bank Ltd
519. Meezan Bank Ltd
520. Mybank Ltd
521. National Bank of Pakistan
522. Soneri Bank Ltd
523. Standard Chartered Bank
(Pakistan) Ltd
524. United Bank Limited
PALESTINIAN AUTONOMOUS AREA
525. Arab Islamic Bank
PAPUA NEW GUINEA
526. Westpac Bank PNG Ltd.
PARAGUAY
527. Banco Amambay SA
PERU
528. Banco DE Creditio DEL Peru
PHILIPPINES
529. Metropolitan Bank & Trust Co.
530. Philippine National Bank
POLAND
531. Bank BGZ
532. Bank Gospodarstwa Krajowego
533. Bank Handlowy Warszawa SA
534. Bank Millennium SA
535. Bank Pekao SA
536. PKO Bank Polski SA
(Powszechna Kasa
Oszczednosci Bank
Polski SA
537. Kredyt Bank SA
538. Raiffeisen Bank Polska SA
BoC Correspondent Banks by Country

Truly Everybody’s Bank
357
PORTUGAL
539. Banco BPI SA
540. Banco Espirito Santo SA
541. BNP-Banco Portugues DE Negocios SA
542. Finibanco SA
543. Millennium BCP
QATAR
544. Barwa Bank
545. Doha Bank
546. Qatar International Islamic Bank
547. Qatar Islamic Bank SAQ
ROMANIA
548. Banca Commerciala Carpatica
549. Banca Commericla Romana SA
550. Banca Transilvania
551. BRD-Groupe Societe Generale SA
552. UniCredit Tiriac Bank
RUSSIA
553. Bank of Moscow
554. Bank for Development & Foreign
Economic Affairs
555. Bank Jugra
556. BIN Bank
557. International Moscow Bank
558. Bank Otkritie Financial Corporation
(JSC) (Formerly Nomos Bank)
559. M D M Bank
560. ROS Bank
561. Sberbank
562. Trans Credit Bank
563. Vnesheconombank
564. VTB-24(PJSC)
(FormerlyJSCVTBBank)
SAUDI ARABIA
565. Al Rajhi Bank
566. Bank Al Bilad
567. Bank Al Jazira
568. Banque Saudi Fransi
569. National Commercial Bank Limited
570. Riyad Bank
571. SAMBA Financial Group
572. Saudi British Bank
573. Saudi Hollandi Bank
574. Arab National Bank
SCOTLAND
575. Royal Bank of Scotland
SERBIA
576. Banca Intesa AD Beograd
577. National Bank of Serbia
SEYCHELLES
578. Seychelles International Mercantile
Banking(NOUVOBNQ)
SINGAPORE
579. Bank of India
580. DBS Bank Ltd
581. Dexia Banque Internationale A
Luxembourge
582. Far Eastern Bank Limited
583. Indian Bank
584. Oversea-Chinese Banking
Corporation Ltd
585. Skandinaviska Enskilda Banken AB
586. Standard Chartered Bank
587. State Bank of India
588. The Bank of East Asia Ltd
589. UCO Bank
590. Union DE Banques Arabes ET
Francaises (UBAF)
591. United Overseas Bank Ltd
592. VTBBankEuropePLC
593. ABN AMRO
SLOVAKIA
594. Ceskoslovenska Obchodni Banka AS
595. Postova Bank AS
596. Slovenska Sporitenlna AS
597. TARTA Bank AS
598. UniCredit Bank Slovakia AS
599. VseobecnaUverovaBankAS
SLOVENIA
600. AbankaVipaDD
601. Gorenjska Banka
602. Nova Kreditna Banka Maribor DD
603. Nova Ljubljanska Banka DD Ljubljana
SOLOMON ISLANDS
604. National Bank of Solomon Islands
SOMALIA
605. Commercial & Savings
Bank of Somalia
SOUTH AFRICA
606. ABSA Bank Ltd
607. FirstRand Bank Ltd
608. Nedcord Bank Ltd (NED Bank)
609. Standard Bank of South Africa Ltd
610. The Standard Chartered
Bank of South Africa, Johannesburg.
SPAIN
611. BancoBilbaoVizcayaArgentariaSA
612. Banco DE Europa SA
613. Banco De Sabadell SA
614. BancoDeValencia
615. Banco Guipuzcoano SA
616. Banco Intercontinental
Espanol (BANKINTER)
617. Banco Pastor SA
618. Banco Santander Central Hispano
619. Caixa’d Estalvis DE Catalunya
620. Caja DE Ahorrosy Pensiones DE
Barcelona LA Caixa
621. Caja Madrid
SWEDEN
622. Nordbanken AB (PUBL)
623. SEB Merchant Banking
624. Skandinaviska Enskilda
Banken AB (PUBL)
625. Svenska Handelsbanken AB (PUBL)
626. SWED Bank
SWITZERLAND
627. Banque Cantonale DE Genève
628. BanqueCantonaleVandoise
629. Banque DE Commerce
ET DE Placements
630. BNP Paribas (Sussie) SA
631. BSI SA
632. Credit Agricole (Sussie) SA
633. Credit Sussie
634. Faisal Private Bank (Switzerland) SA
635. Habib Bank AG, Zurich
636. Luzerner Kantonal Bank
637. UBS AG (Union Bank of Switzerland)
638. Zurcher Kantonalbank
TAIWAN
639. Bank of Taiwan
640. CTBC Bank Co. Ltd
641. Chinfon Commercial Bank
642. E-Sun Commercial Bank Ltd
643. First Commercial Bank
644. HUA NAN Commercial Bank

BANK OF CEYLON . Annual Report 2014
358
645. Mega International Commercial Bank
646. Shanghi Commercial &
Savings Bank Ltd
647. Shin Kong Bank
648. Taipei Fubon Commercial Bank
649. Taiwan Cooperative Bank
650. Union Bank of Taiwan
TANZANIA
651. NBC Limited
(National Bank of Commerce)
THAILAND
652. Bangkok Bank Public
Company Ltd
653. Bank of Ayudhya
Public Company Ltd
654. Export Import Bank of Thailand
655. Kasikornabank Public Company Ltd
656. Krung Thai Bank Public
Company Ltd
657. Siam City Bank Public Company Ltd
658. Siam Commercial Bank PCL
659. Standard Chartered Bank
(THAI) Public Company Ltd
660. United Overseas Bank
(Thai) Public Co. Ltd
TUNISIA
661. Banque Nationale Agricole
662. Attijari Bank
663. Societe Tunisienne DE Banque
TURKEY
664. AK Bank TAS
665. Anadolu Bank
666. Arab Turkish Bank
667. ASYA Katilim Bankasi AS
668. EURO Tekfen AS
669. ING Bank AS
670. Kuvoyt Turk Katilim Bankasi AS
671. Tekstil Bankasi AS
672. Turk Economi Bankasi
673. Turkiye Finance Katilinyu
Bankasi AS
674. Turkiye Halk Bankasi AS
675. Turkiye Garanti Bankasi AS
676. Turkiye IS Bankasi AS
677. TurkiyeVakilarBankasiTAO
678. Turkland Bank – T Bank
679. YapiVEKrediBankasiAS
UNITED ARAB EMIRATES (UAE)
680. Abu Dhabi Commercial Bank
681. Abu Dhabi Islamic Bank
682. Arab Bank for Investment &
Foreign Trade
683. Commercial Bank International PLC
684. Commercial Bank of Dubai PSC
685. Dubai Islamic Bank PLC
686. Emirates Bank NBD PJSC
687. First Gulf Bank
688. Mashreqbank PSC
689. Middle East Bank PJSC
690. National Bank of Abu Dhabi
691. National Bank of Fujirah
692. Noor Islamic Bank
693. Union National Bank
694. United Arab Bank
UGANDA
695. Barclays Bank of Uganda Ltd
UNITED KINGDOM (UK)
696. AIB Group
697. Barclays Bank PLC
698. Clydesdale Bank PLC
699. Gulf International Bank
(UK) Limited
700. Habib Bank AG Zurich
701. Habibsons Bank Ltd
702. HSBC Bank PLC
703. Investec Bank (UK) Ltd
704. Lloyds TSB Bank PLC
705. National Westminister Bank PLC
706. Royal Bank of Scotland PLC
707. Standard Bank PLC
708. Standard Chartered Bank
UKRAINE
709. UKREXIMBANK
(State Export-Import
Bank of Ukraine)
710. Calyon Bank
711. First Ukrainian
International Bank PJSC
712. OTP Bank – Public
Joint Stock Company
713. PJSC –ALFA Bank
714. Prominvest Bank
URUGUAY
715. The Banco DE LA
Republic Oriental Del Uruguay
UNITED STATES OF AMERICA (USA)
716. American Express Bank Ltd
717. Banco Del Pichincha CA
718. Bank of America NA
719. The Bank of New York Mellon
720. Bank of TAMPA
721. Branch Banking & Trust Co.
722. Brown Brothers Harriman & Co.
723. CITIBANK NA
724. COBank ACB
725. Commerce Bank NA
726. Deutsche Bank Trust Company
Americas
727. First Hawian Bank
728. French American Banking Corp
729. Habib American Bank
730. Hibernia National Bank
731. HSBC Bank USA
732. Huntington National Bank
733. Israel Discount Bank of New York
734. JP Morgan Chase Bank
735. LA Salle Bank Midwest
736. M & T Bank (Formerly Allfirst Bank)
737. National City Bank of Indiana
738. National Penn Bank
739. Northern Trust Company
740. PNC Bank NA
741. SAN Diego National Bank
742. SiliconValleyBank
743. Sovereign Bank
744. Standard Chartered Bank
745. State Street Bank & Trust Co.
746. Sun Trust Bank Ltd
747. UMB Bank NA
748. Union Bank of California NA
749. US Bank NA
750. Wells Fargo Bank NA
VIETNAM
751. BankForForeignTradeofVietnam
752. Bank For Investment & Development
ofVietnam
YEMEN
753. National Bank of Yemen
754. Yemen Bank for Reconstruction &
Development
755. Yemen Commercial Bank
756. Yemen Kuwait Bank
757. International Bank of Yemen YSC
ZAMBIA
758. Barclays Bank of Zambia Ltd
ZIMBABWE
759. Barclays Bank of Zimbabwe Limited
BoC Correspondent Banks by Country

Truly Everybody’s Bank
359
Exchange Companies by Country
AUSTRALIA
1. Auscey Financial Services Pty Ltd2. Aussie Forex & Finance Pty Ltd3. Cash Plus Forex Pty Ltd4. Ceylon Exchange Pty Ltd5. Ezy Processing Ltd
(USVirginIslands)
6. Kapruka Pty Ltd7. Serendib Financial Pty Ltd8. SL Money Transfer Pty Ltd
BAHRAIN
9. Bahrain Financing Co. 10. Ezremit Ltd11. National Finance &
Exchange Co. WLL12. Zenj Exchange Co.13. Zenj Exchange Co. WLL (Turbo Cash)
CYPRUS
14. Masari Payment Services Ltd
GREECE
15. International Express Remittance Services SA (IERS)
HONG KONG
16. Lotus Forex Ltd
ISRAEL
17. Tifco Logistics & Trade Ltd
ITALY
18. ValutransSpA.
JAPAN
19. Japan Remit Finance Co. Ltd20. Unidos Co. Ltd
JORDAN
21. Al Samhouri Exchange Company22. Alwaneh Exchange Co.23. Shift Financial Services Ltd
KUWAIT
24. Al Mulla International Exchange Co. Wll25. Al Muzaini Exchange Co. KSC (Closed)26. Bahrain Exchange Co. WLL
27. City International Exchange Co. WLL
28. Dollarco Exchange Co. Ltd29. Etemadco Exchange Co. WLL30. International Financial Line Co.31. Joyalukkas Exchange Co. WLL32. Kuwait Asian International Exchange
Co. WLL33. Kuwait Bahrain International
Exchange Co.34. Kuwait India International Exchange
Co.35. National Exchange Co. WLL36. National Money Exchange Co.WLL37. Oman Exchange Co. Ltd38. Security Exchange Co.WLL39. UAE Exchange Centre WLL
LEBANON
40. Services Exchange Co.
MALAYSIA
41. IME (M) SDN BHD42. Merchantrade Asia SDN BHD
OMAN
43. Asia Express Exchange44. Gulf Overseas Exchange Co. LLC45. Hamdan Exchange46. Majan Exchange LLC47. Modern Exchange Co. LLC48. Musandam Exchange49. Mustafa Sultan Exchange Co. LLC50. Oman & UAE Exchange Centre
Co. LLC51. Oman International Exchange LLC52. Oman United Exchange Co. LLC53. Purshottam Kanji Exchange Co. LLC
QATAR
54. Al Dar for Exchange Works55. Al Fardan Exchange Co. WLL56. Al Mana Exchange WLL57. AL Sadd Exchange58. Al Zaman Exchange WLL59. Al Mirqab Exchange Co.60. Arabian Exchange Company WLL61. City Exchange Co. WLL62. Eastern Exchange EST63. Gulf Exchange Company64. Habib Qatar International
Exchange Ltd65. Islamic Exchange66. National Exchange Co. WLL
SINGAPORE
67. HBZ International Exchange Co. (Singapore) Pvt Ltd
68. Mustafa Foreign Exchange
SWITZERLAND
69. Motherhouse GMBH
UAE
70. Al Ahalia Money Exchange Bureau71. Al Ansari Exchange EST72. Al Fardan Exchange73. Al Mona Exchange Co.LLC74. Al Razouki International Exchange
Co. LLC75. Al Rostamani International Exchange76. Delma Exchange77. Dubai Exchange Centre LLC78. Emirates India International
Exchange Co.79. Habib Exchange Co.LLC80. Hadi Express Exchange81. Joyalukkas Exchange82. Lari Exchange Establishment83. Lulu International Exchange LLC84. National Exchange Co.85. Orient Exchange Co.LLC86. Redha Al Ansari Exchange Est.87. UAE Exchange Centre88. Wall Street Exchange Centre89. Xpress Money Services Ltd90. Zareen Exchange
UNITED KINGDOM
91. 3R Telecom Ltd92. An Express Ltd93. Currency Exchange Corporation94. Global Exchange Ltd95. INTL FC Stone Ltd (IFL)96. Sigue Global Services Ltd
USA
97. Moneygram98. Prabhu Group INC99. RIA Financial Services
(Continental Exchange Solutions INC)100. Trans-fast Remittance LLC

BANK OF CEYLON . Annual Report 2014
360
Glossary of Financial/Banking Terms
AAccounting Policies
The specific principles, bases, conventions,
rules and practices adopted by an entity
in preparing and presenting Financial
Statements.
Accrual Basis
To recognize the effects of transactions and
other events as they occur, without waiting
for the receipt or payment of related cash or
its equivalent.
Actuarial Assumptions
An entity’s unbiased and mutually
compatible best estimates of the
demographic and financial variables that
will determine the ultimate cost of providing
post employment benefits.
Actuarial Gains and Losses
Actuarial gains and losses comprise the
effects of differences between the previous
actuarial assumptions and what has actually
occurred and the effects of changes in
actuarial assumptions.
Actuarial Present Value of Promised
Retirement Benefits
The present value of the expected payments
by a retirement benefit plan to existing and
past employees, attributable to the service
already rendered.
Actuarial Valuation
Fund value determined by computing its
normal cost, actuarial accrued liability,
actuarial value of its assets, and other
relevant costs and values.
Amortisation
The systematic allocation of the depreciable
amount of an asset over its useful life. In the
case of an intangible asset or goodwill, the
term ‘amortization’ is generally used instead
of ‘depreciation’. Both terms have the same
meaning.
Amortised Cost
The amount at which a financial asset or
liability is measured at initial recognition,
minus any repayment of principal,
minus any reduction for impairment or
uncollectibility, and plus or minus the
cumulative amortization using the effective
interest method of the difference between
that initial amount and maturity amount.
Anti Money Laundering (AML)
A set of procedures, laws or regulations
designed to prevent money laundering.
Money laundering is an activity which aims
to disguise the ownership of money that
has an illegal origin such as trading of drugs,
organized crimes, fraud and terrorism.
Associate Company
A company other than a subsidiary in which
a holding company has a participating
interest and exercises a significant influence
over its operating and financial policies.
Attrition Rate
A measure of how many employees leave
over a certain period of time.
BBasis Points
One hundredth of one percentage point.
Often used in quotations of spreads between
interest rates or to change in yield in
securities.
Bills of Exchange
A signed, written unconditional order
addressed by one person (the drawer)
directing another person (the drawee) to
pay a specified sum of money to the order
of a third person (the payee). The terms
bills of exchange and drafts are often used
interchangeably.
Borrowing Costs
Interest and other costs incurred by an
entity in connection with the borrowing of
funds.
CCapital Adequacy Ratio (Car)
The percentage of the risk adjusted assets
supported by capital, as defined under the
framework of risk based capital standards
developed by the Bank for International
Settlements (BIS) and as modified to suit
local requirements by Central Bank of Sri
Lanka.
Capital Reserves
Capital reserves consist of revaluation
reserves arising from revaluation of
properties owned by the Bank and
permanent reserve fund set aside for specific
purposes defined under the Banking Act
No. 30 of 1988 and shall not be reduced
or impaired without the approval of the
Monetary Board.
Cash Equivalents
Investments/assets that are readily
convertible to cash, subject only to an
insignificant risk of change in their value.
Collectively Assessed Loan
Impairment Provisions
Impairment assessment which carried
out on a collective basis for homogeneous
groups of loans that are not considered
individually significant, in order to cover
losses that has been incurred but has not yet
been identified at the reporting date.

Truly Everybody’s Bank
361
Compound Annual Growth Rate
(CAGR)
The year over year growth rate over a
specified period of time.
Consolidated Financial Statements
The Financial Statements of the Group
presented as those of a single entity.
Contingencies
A condition or situation at the reporting
date, the ultimate outcome of which, gain
or loss, will be confirmed only on the
occurrence or non occurrence of one or
more uncertain future events.
Contractual Maturity
Contractual maturity refers to the final
payment date of a loan or other financial
instrument, at which point all the remaining
outstanding principal will be repaid and
interest is due to be paid.
Corporate Governance
The process by which corporations are
directed and controlled. It is concerned
with the rights and responsibilities among
stakeholders used to determine and control
the strategic directions and performance of
the corporation.
Cost/Income Ratio
Operating expenses compared to net
income.
Country Risk
The credit risk associated with lending to
borrowers within a particular country,
sometimes taken to include sovereign risk.
Credit Risk
The risk of loss due to non payment of
a loan or other line of credit (either the
principal or interest or both), by the
borrower or a counter party.
Credit Ratings
An evaluation of a corporate’s ability to
repay its obligations or the likelihood of not
defaulting, carried out by an independent
rating agency.
DDealing Securities
Securities acquired and held with the
intention of reselling them in the short
term.
Debt Equity Ratio
Long term borrowings (refinance
borrowings + debentures) divided by
shareholder’s equity.
Deferred Taxation
Sum set aside for tax in the Financial
Statements that will become payable/
receivable in a financial year other than the
current financial year.
Defined Benefit Plans
Retirement benefit plans under which
amounts to be paid as retirement benefits
are determined by reference to a formula
usually based on employees’ remuneration
and/or years of service.
Depreciation
The systematic allocation of the depreciable
amount of an asset over its useful life.
Derivatives
A financial instrument, the price of which
has a strong relationship with an underlying
commodity, currency variable or financial
instrument.
Dividend Per Share (DPS)
Dividend per share is calculated by dividing
the total profit distributed to shareholders
by the weighted average number of
ordinary shares in issue during the year.
Documentary Letters of Credit (LC)
Written undertakings by a bank on behalf
of its customers (typically an importer),
authorizing a third party (eg. an exporter) to
draw drafts on the Bank up to a stipulated
amount under specific terms and conditions.
Such undertakings are established for the
purpose of facilitating international trade.
EEarnings Per Share (Eps)
Net profits earned during a period
attributable to ordinary shareholders of
a company divided by weighted average
number of shares in issue during the year.
Equity Method
A method of accounting whereby the
investment is initially recorded at cost and
adjusted thereafter for the post acquisition
change in the investor’s share of net assets
of the invested. The income statement
reflects the investor’s share of the results of
operations of the invested.
Events After the Balance Sheet Date
Events after the balance sheet date are those
events, both favourable and unfavourable,
that occur between the balance sheet date
and the date when the Financial Statements
are authorised for issue.
Effective Annual Rate
Return as a percentage of market value of
the investment.
Exchange Company/House
An overseas location where the Bank’s
representatives provide banking services as a
promotional tool.

BANK OF CEYLON . Annual Report 2014
362
FFair Value
The amount for which an asset could be
exchanged or a liability settled between
knowledgeable, willing parties in an arm’s
length transaction.
Finance Lease
Leases which transfer risks and rewards of
ownership. Title may or may not eventually
be transferred.
Financing Activities
Activities that result in changes in the size
and composition of the equity capital and
borrowings of the entity.
Financial Asset or Financial Liability
at Fair Value Through Profit or Loss
Financial asset or financial liability that is
held for trading or upon initial recognition
designated by the entity as at fair value
through profit or loss.
Financial Investments Available for
Sale
Available for sale financial investments are
those non derivative financial assets that
are designated as available for sale or are
not classified as loans and receivables, held
to maturity or financial assets at fair value
through profit or loss.
Financial Investments Held to
Maturity
Held to maturity financial investments are
non derivative financial assets with fixed or
determinable payments and fixed maturity
that an entity has the positive intention and
ability to hold to maturity.
Foreclosed Properties
Properties acquired in full or partial
settlement of debts, which will be held
with the intention of re sale at the earliest
opportunity.
Foreign Exchange Income
The gain recorded when assets or liabilities
denominated in foreign currencies are
translated into Sri Lankan rupees on the
balance sheet date at prevailing rates which
differ from those rates in force at inception
or on the previous balance sheet date.
Foreign exchange income also arises from
trading in foreign currencies.
Forward Exchange Contracts
Agreements between two parties to
exchange one currency for another at a
future date at a rate agreed upon today.
GGross Domestic Product (GDP)
The value of all goods and services produced
domestically in an economy during a
specified period, usually a year. Nominal
GDP, adjusted for inflation, gives GDP in
real terms.
Group
A parent and all its subsidiaries.
Guarantees
Primarily represent irrevocable assurances
that a bank will make payments in the
event that its customer is unable to perform
its financial obligations to third parties.
Certain other guarantees represent non
financial undertakings such as bid and
performance bonds.
HHistorical Cost Convention
Recording transactions at the actual value
received or paid.
IImpairment
This occurs when recoverable amount
declines below carrying amount.
Individually Significant Loan
Impairment Provisions
Impairment measured individually for
loans that are individually significant to the
Group.
Intangible Asset
An identifiable non monetary asset without
physical substance held for use in the
production or supply of goods or services,
for rental to others, or for administrative
purposes.
Interest Margin
Net interest income as a percentage of
average interest earning assets.
Interest Spread
Represents the difference between the
average interest rate earned on interest
earning assets and the average interest rate
incurred on interest bearing liabilities.
Investment Properties
Property that is held to earn rentals or for
capital appreciation or both and not for sale
or use in the ordinary course of business.
Investment Securities
Securities acquired and held for yield or
capital growth purposes and usually held to
maturity.
Glossary of Financial/Banking Terms

Truly Everybody’s Bank
363
KKey Management Personnel
Those persons having authority and
responsibility for planning, directing and
controlling the activities of the entity,
directly or indirectly.
Key Performance Indicators (KPI)
KPIs are quantifiable measurements, agreed
before hand that reflects the critical success
factors of a company.
LLiquid Assets
Assets that are held in cash or in a form that
can be converted to cash readily, such as
deposits with other banks, bills of exchange,
treasury bills.
Liquid Assets Ratio
Liquid assets expressed as a percentage of
total liabilities other than shareholders’
funds.
Loss Given Default (LGD)
LGD is the percentage of an exposure that
a lender expects to lose in the event of
default.
MMark to Market
The practice of periodically revaluing
marketable securities to their current
market value.
Market Risk
The risk that the value of an investment will
change due to changes in market factors.
Materiality
The relative significance of a transaction
or an event the omission or misstatement
of which could influence the economic
decisions of users of Financial Statements.
Minority Interest
That portion of the profit or loss and net
assets of a subsidiary attributable to equity
interests that are not owned, directly or
indirectly through subsidiaries, by the
parent.
Mortality Rate
A measure of the number of deaths in
some population, scaled to the size of that
population, per unit time.
NNet Asset Value Per Share
Shareholders’ equity divided by the number
of ordinary shares in issue.
Net Interest Income
The difference between what the Bank
earns on assets such as loans and securities
and what it pays on liabilities such as
deposits, refinance funds and interbank
borrowings.
Net Realisable Value
The estimated selling price in the ordinary
course of business, less the estimated costs
of completion and the estimated costs
necessary to make the sale.
Nostro Account
A foreign currency current account
maintained with another bank, usually but
not necessarily a foreign correspondent
bank. At the other bank, the deposit is called
a nostro account.
OOff Balance Sheet Transactions
Transactions not recognised as assets or
liabilities in the balance sheet but which
give rise to contingencies and commitments.
Operating Activities
The principal revenue producing activities
of an entity and other activities that are not
investing or financing activities.
Operational Risk
The risk of loss resulting from inadequate
or failed internal processes, people and
systems, or from external events.
PParent Company
A parent company is an entity that has one
or more subsidiaries.
Plan Assets of an Employee Benefit
Plan
Assets held by a long term employee benefit
fund.
Price Value Per Basic Point (PVBP)
Estimated change in the value of portfolio
due to one basic point change in interest
rate.
Primary Dealer Special Risk Reserve
Reserve maintained in order to strengthen
capital base further with development of
capital market.
Probability of Default (PD)
PD is an internal estimation for each
homogeneous groups of loans on the
likelihood that loans in a particular
homogeneous group being default.
Projected Unit Credit Method
An actuarial valuation method that sees
each period of service as giving rise to an
additional unit of benefit entitlement and
measures each unit separately to build up
the final obligation.

BANK OF CEYLON . Annual Report 2014
364
Property, Plant and Equipment (PPE)
Tangible assets that:
(a) are held for use in the production or
supply of goods or services, for rental to
others, or for administrative purposes;
and
(b) are expected to be used during more
than one period.
Prudence
Inclusion of a degree of caution in the
exercise of judgment needed in making
the estimates required under conditions of
uncertainty such that assets or income are
not overstated and liabilities or expenses are
not understated.
RRedemption
Repayment of principal monies.
Related Parties
Two parties where one controls the other
or exercise significant influence in financial
and operating decisions, directly or
indirectly.
Repos
Repurchase agreements relating to securities
sold to creditors (who lend money for
funding purposes), with the intention of
buying them back at a set price.
Return On Average Assets (ROAA)
Profit before tax expressed as a percentage
of average total assets. Used along with
ROAE, as a measure of profitability and
as a basis of intra industry performance
comparison.
Return On Average Equity (ROAE)
Profit after tax less preferred share
dividends, if any, expressed as a percentage
of average ordinary shareholders’ equity.
Revenue Reserves
Reserves set aside for future distribution and
investment.
Reverse Repos
The purchase of securities under an
agreement to resell at a given price on a
specific future date.
Risk Adjusted Assets
Used in the calculation of risk based capital
ratios. The face amount of lower risk assets
is discounted using risk weighting factors in
order to reflect a comparable risk per rupee
among all types of assets. The risk inherent
in off balance sheet instruments is also
recognised, first by adjusting notional values
to balance sheet (or credit) equivalents and
then by applying appropriate risk weighting
factors.
Risk Weighted Assets
On balance sheet assets and the credit
equivalent of off balance sheet assets
multiplied by the relevant risk weighting
factors.
SShareholders’ Equity
Shareholders’ equity consist of issued and
fully paid ordinary share capital plus capital
and revenue reserves.
Significant Influence
Significant influence is the power to
participate in the financial and operating
policy decisions of an investee but is not
controlled or jointly controlled over those
policies.
Solvency
The availability of cash over the long term
to meet financial commitments as they fall
due.
Subordinated Debenture
The claims of the debenture holders shall
in the event of winding up, rank after all
the claims of the secured and unsecured
creditors and any preferential claims under
any statutes, but in priority to and over
claims and rights of the shareholders.
Subsidiary Company
A company is a subsidiary of another
company if the parent company has the all
of the followings.
a) Power over the investee.
b) Exposure or rights to variable returns
from its involvement with the investee.
c) The ability to use its power over the
investee to effect the amount of the
investor’s returns.
Swaps
The simultaneous purchase and sale of
foreign exchange or securities, with the
purchase executed at once and the sale back
to the same party. Carried out on an agreed
upon price to be completed at a specified
future date. Swaps include interest rate
swaps, currency SWAPs and credit SWAPs.
Syndicated Loan
A large loan by a group of banks to a
large multinational firm or Government.
Syndicated loans allow the participating
banks to maintain diversification by not
lending too much to a single borrower.
TTier I Capital
Consists of the sum total of paid up ordinary
shares, non cumulative, non redeemable
preference shares, share premium, statutory
reserve fund, published retained profits,
general and other reserves, less goodwill.
Glossary of Financial/Banking Terms

Truly Everybody’s Bank
365
Tier II Capital
Consists of the sum total of revaluation
reserves, general provisions, hybrid capital
instruments and approved subordinated
debentures.
Total Capital
The sum of Tier I and Tier II capital.
UUnit Trust
An undertaking formed to invest in
securities under the terms of a trust deed.
Unsecured
Repayment of the principal and interest not
being secured by any specific asset.
VValue at Risk (VaR)
Estimated maximum loss that the Bank may
incur in a given horizon at 99% confidence
level.
Vostro Account
A local currency current account
maintained with a bank by another bank
(compare with nostro account).

BANK OF CEYLON . Annual Report 2014
366
BoC Card Centre
“Issuing and managing VISA and Master
credit cards. Franchising and servicing
merchants using point of sales machines
and internet payment gateway facility“
Level - 1, West Tower, World Trade Centre
Echelon Square, Colombo 1, Sri Lanka.
Tel : +94 11 2445799,2325088,2395806,
2205600, 2205620, 2205680
Fax : +94 11 2325099, 2325092, 2395807
Email : [email protected] / [email protected]/
Branch code : 731
BoC Premier Centre
“Dedicated centre for private banking”
21, Sir Ernest De Silva Mawatha,
Colombo 7, Sri Lanka.
Tel : +94 11 2694282 - 86
Fax : +94 11 2694280
Email : [email protected]
Branch code : 788
Correspondent Banking Unit
“Gateway to global banking and financial
relationships”
9th Floor, Bank of Ceylon Head Office,
“BOC Square”,
No. 1, Bank of Ceylon Mawatha,
Colombo 1, Sri Lanka.
Tel : +94 11 2445791
Fax : +94 11 2445791
Email : [email protected] / [email protected]
Branch code : 087
Credit Support Department
“Issuing of local and international
guarantees and documentation of credit
facilities”
3rd Floor, Bank of Ceylon Head Office,
“BOC Square”,
No. 1, Bank of Ceylon Mawatha,
Colombo 1, Sri Lanka.
Tel : +94 11 2541943
Fax : +94 11 2446820
Email : [email protected]
Branch code : 660
Dealing Room
“Providing money market and foreign
exchange related services”
7th Floor, Bank of Ceylon Head Office,
“BOC Square”,
No. 1, Bank of Ceylon Mawatha,
Colombo 1, Sri Lanka.
Tel : +94 11 2445785-7, 2386862
Fax : +94 11 2445788
Email : [email protected]
Branch code : 760
Electronic Banking Unit
“Management of ATM card operations,
facilitator for internet and mobile
banking”
21st Floor, Bank of Ceylon Head Office,
“BOC Square”,
No. 1, Bank of Ceylon Mawatha,
Colombo 1, Sri Lanka.
Tel : +94 11 2204650 - 63
Fax : +94 11 2447569
Email : [email protected], [email protected],
[email protected], [email protected],
Branch code : 777
Gold Shop
“Supplier of precious gold to the nation”
Ground Floor, Bank of Ceylon Head Office,
“BOC Square”, No. 1, Bank of Ceylon
Mawatha, Colombo 1, Sri Lanka.
Tel : +94 11 2345420
Fax : +94 11 2345420
Email : [email protected]
Branch code : 087
Inward Remittances Department
“Facilitator in processing inward
remittances to Sri Lanka”
8th Floor, Bank of Ceylon Head Office,
“BOC Square”,
No. 1, Bank of Ceylon Mawatha,
Colombo 1, Sri Lanka.
Tel : +94 11 2445792, 2541933
Fax : +94 11 2344845
Email : [email protected]
Branch code : 087
Corporate and Overseas Offices

Truly Everybody’s Bank
367
Islamic Banking Unit
“Brand house for all islamic banking
products and services”
25th Floor, Bank of Ceylon Head Office,
“BOC Square”,
No. 1, Bank of Ceylon Mawatha,
Colombo 1, Sri Lanka.
Tel : +94 11 2205030
Fax : +94 11 2445811
Email : [email protected]
Branch code : 776
Primary Dealer Unit
“Retail buying and selling of Government
securities”
7th Floor, Bank of Ceylon Head Office,
“BOC Square”, No. 1, Bank of Ceylon
Mawatha,
Colombo 1, Sri Lanka.
Tel : +94 11 2448830
Fax : +94 11 2448207
Email : [email protected]
Branch code : 099
Trade Promotion Department
“Service provider for migrant employee
community”
7th Floor, Bank of Ceylon Head Office,
“BOC Square”,
No. 1, Bank of Ceylon Mawatha,
Colombo 1, Sri Lanka.
Tel : +94 11 2447831, 2203626
Fax : +94 11 2346841
Email : [email protected]
Branch code : 087
Trade Services Department
“Providing trade finance facilities and
advisory services”
2nd Floor, Bank of Ceylon Head Office,
“BOC Square”, No. 1, Bank of Ceylon
Mawatha,
Colombo 1, Sri Lanka.
Tel : +94 11 2394310, 2203310
Fax : +94 11 2542170
Email : [email protected]
Branch code : 660
Overseas Branches
Male Branch
“Aage”12, Boduthakurufaanu Magu,
Henveiru, Male. 20094,
Republic of Maldives.
Tel : 00960 3323045
Email : [email protected]
SWIFTcode:BCEYMVMV
Branch code : 632
Chennai Branch
No.2, Zerat Garden, 2nd Lane, Off Casa
Major Road, Egmore, Chennai - 600 008.
Tel : 0091 44 2819 0972
0091 44 3951 9999
Email : [email protected]
SWIFT code : BCEYIN5M
Branch code : 758
Seychelles Branch
2-05, Capital City Building, Independence
Avenue,Victoria,Mahe,
Republic of Seychelles.
Tel : 00248 461 1880
00248 461 1889
Email : [email protected]
SWIFT code : BCEYSCSC
Branch code : 807

BANK OF CEYLON . Annual Report 2014
Notes

Designed & produced by
Digital Plates & Printing by
Aitken Spence Printing & Packaging (Pvt) Ltd
Photography by Dimitri Crusz & Studio Times

www.boc.lk