prelims-rns-fy16-final.pdf - Halfords Group plc
28
1 Halfords Group plc Preliminary Results: Financial Year 2016 Halfords Group plc, the UK’s leading retailer of motoring, cycling and leisure products and a leading independent operator in garage servicing and auto repair, today announces its preliminary results for the 52 weeks to 1 April 2016 (“the financial year”). The audited comparative period represents the 53 weeks to 3 April 2015 but we believe that the proforma 52-week results to 27 March 2015 better reflect the comparative performance of the business. On this basis, all commentary included in the summary statement, the Operational and Business Review and the Chief Financial Officer’s Report in respect of the comparative period is based on the proforma 52-week period to 27 March 2015 (“the prior year”) unless otherwise stated. All numbers shown in this statement are before non-recurring costs, unless otherwise stated. Group Financial Summary FY16 (audited 52 weeks) £m FY15 (audited 53 weeks) £m FY15 (proforma 52 weeks) £m 52 week change Like-for- Like Revenues (“LFL”) Total Group Revenue 1,021.5 1,025.4 1,004.9 +1.7% +1.5% Retail 868.5 875.1 857.9 +1.2% +1.3% Autocentres 153.0 150.3 147.0 +4.1% +2.5% Gross Margin Retail 51.2% 51.5% 51.5% -30 bps Autocentres 64.3% 63.4% 63.3% +90 bps Group Underlying EBITDA 114.6 113.3 109.9 +4.3% Profit Before Tax and non-recurring items 81.5 84.1 81.1 +0.5% Basic Earnings Per Share, before non-recurring items 33.2p 34.1p 32.7p +1.5% Profit Before Tax, after non-recurring items 79.8 83.8 80.8 -1.2% Basic Earnings Per Share, after non-recurring items 32.5p 33.8p 32.5p - Net Debt 47.9 61.8 61.8 -22.5% Proposed Full-Year Dividend Per Share 17.0p 16.5p 16.5p +3.0% Business Highlights A solid service-led Retail sales performance. Market share in Motoring and Cycling grew overall. Cycling was impacted by the weaker market conditions over the last year, Motoring and Autocentres continued to be robust. Moving Up A Gear strategy launched in November 2015 with good progress to date. Customer metrics and Retail colleague retention further improved. Launch of extended motorbike range and bulbs and battery fitting service, the world’s first 130% brighter bulb and new windscreen chip services. New ranges: Wiggins kids bikes, Boardman Performance and Orla Kiely cycling and leisure. Exclusive collaboration with Olympic cyclist Laura Trott to create a range of limited edition performance bikes for women under the Trott brand. Refurbishment of 25 Retail stores and 24 Autocentres, opening of 11 Autocentres and 6 Cycle Republic stores. Acquisition of Tredz and Wheelies post year end adds capabilities in online sales of premium bikes and PACs. Financial Highlights FY16 Group LFL +1.5%, Retail LFL +1.3%, Autocentres LFL +2.5% Group Underlying EBITDA up 4.3% Basic earnings per share up 1.5% Proposed full-year dividend per share of 17.0p up 3.0% Net Debt reduced to £47.9m, 0.4x EBITDA Net Debt of 1x EBITDA to be targeted over time, with flexibility to 1.5x for appropriate M&A
-
Upload
khangminh22 -
Category
Documents
-
view
2 -
download
0
Transcript of prelims-rns-fy16-final.pdf - Halfords Group plc

1
Halfords Group plc Preliminary Results: Financial Year 2016
Halfords Group plc, the UK’s leading retailer of motoring, cycling and leisure products and a leading independent
operator in garage servicing and auto repair, today announces its preliminary results for the 52 weeks to 1 April
2016 (“the financial year”). The audited comparative period represents the 53 weeks to 3 April 2015 but we
believe that the proforma 52-week results to 27 March 2015 better reflect the comparative performance of the
business. On this basis, all commentary included in the summary statement, the Operational and Business
Review and the Chief Financial Officer’s Report in respect of the comparative period is based on the proforma
52-week period to 27 March 2015 (“the prior year”) unless otherwise stated. All numbers shown in this statement
are before non-recurring costs, unless otherwise stated.
Group Financial Summary
FY16 (audited
52 weeks)
£m
FY15 (audited
53 weeks)
£m
FY15 (proforma 52 weeks)
£m
52 week change
Like-for-Like
Revenues (“LFL”)
Total Group Revenue 1,021.5 1,025.4 1,004.9 +1.7% +1.5%
Retail 868.5 875.1 857.9 +1.2% +1.3%
Autocentres 153.0 150.3 147.0 +4.1% +2.5%
Gross Margin
Retail 51.2% 51.5% 51.5% -30 bps
Autocentres 64.3% 63.4% 63.3% +90 bps
Group Underlying EBITDA 114.6 113.3 109.9 +4.3%
Profit Before Tax and non-recurring items 81.5 84.1 81.1 +0.5%
Basic Earnings Per Share, before non-recurring items 33.2p 34.1p 32.7p +1.5%
Profit Before Tax, after non-recurring items 79.8 83.8 80.8 -1.2%
Basic Earnings Per Share, after non-recurring items 32.5p 33.8p 32.5p -
Net Debt 47.9 61.8 61.8 -22.5%
Proposed Full-Year Dividend Per Share 17.0p 16.5p 16.5p +3.0%
Business Highlights
A solid service-led Retail sales performance. Market share in Motoring and Cycling grew overall. Cycling was
impacted by the weaker market conditions over the last year, Motoring and Autocentres continued to be
robust.
Moving Up A Gear strategy launched in November 2015 with good progress to date.
Customer metrics and Retail colleague retention further improved.
Launch of extended motorbike range and bulbs and battery fitting service, the world’s first 130% brighter bulb
and new windscreen chip services.
New ranges: Wiggins kids bikes, Boardman Performance and Orla Kiely cycling and leisure.
Exclusive collaboration with Olympic cyclist Laura Trott to create a range of limited edition performance bikes
for women under the Trott brand.
Refurbishment of 25 Retail stores and 24 Autocentres, opening of 11 Autocentres and 6 Cycle Republic
stores.
Acquisition of Tredz and Wheelies post year end adds capabilities in online sales of premium bikes and PACs.
Financial Highlights FY16
Group LFL +1.5%, Retail LFL +1.3%, Autocentres LFL +2.5%
Group Underlying EBITDA up 4.3%
Basic earnings per share up 1.5%
Proposed full-year dividend per share of 17.0p up 3.0%
Net Debt reduced to £47.9m, 0.4x EBITDA
Net Debt of 1x EBITDA to be targeted over time, with flexibility to 1.5x for appropriate M&A

2
Jill McDonald, Chief Executive, commented:
“This was a solid performance and we gained market share in both our motoring and cycling divisions. We also saw strong growth in our service-led offerings, including our 3Bs fitting in motoring, which is now complemented by a similar motorbike service. In cycling our sales improved in the second half of the year and cycle repair delivered good growth. The recent acquisition of Tredz alongside the continued expansion of Cycle Republic and the launch of our new Laura Trott range demonstrates the strength and breadth of our cycling proposition. In Autocentres, like-for-like sales grew for the 10
th consecutive quarter and customer service measures improved. I
am pleased with our progress. The Moving Up A Gear strategy aimed at driving sustainable long-term growth is developing well, including a step change in customer data collection and usage, the introduction of new services, product innovation and exciting collaborations.”
Quarterly Performance
Q1
FY16 % change
Q2 FY16
% change
Q3 FY16
% change
Q4 FY16
% change
Full year FY16
% change
TOTAL REVENUE
Halfords Group +3.6 0.0 +0.4 +3.2 +1.7
Retail +3.4 -0.7 -0.3 +3.3 +1.2
Autocentres +5.0 +4.2 +4.1 +2.8 +4.1
LFL REVENUE
Halfords Group +3.5 -0.2 +0.3 +2.6 +1.5
Retail +3.5 -0.6 0.0 +3.1 +1.3
Cycling +2.0 -7.6 +1.1 +1.9 -0.9
Motoring +4.3 +3.6 -0.6 +3.5 +2.5
Car Maintenance +5.9 +7.1 -0.1 +2.0 +3.4
Car Enhancement -0.3 +1.5 0.0 +3.9 +1.0
Travel Solutions +9.2 +1.1 -3.8 +9.5 +2.8
Autocentres +4.0 +2.6 +1.9 +1.7 +2.5
Adjusting for the timing of Easter, we estimate that the underlying Retail LFL for Q1 FY16 and Q4 FY16 was +4.2% and +1.1% respectively. Enquiries
Investors & Analysts (Halfords) +44 (0) 1527 513 113 Jonny Mason, Chief Financial Officer Adam Phillips, Head of Investor Relations Media (Maitland) +44 (0) 207 379 5151 Andy Donald Neil Bennett
Notes 1. Like-for-like sales represent revenues, including those attributable to Click & Collect, from stores and centres
trading for greater than 365 days, plus online revenues from direct deliveries. Where appropriate, revenues
denominated in foreign currencies have been translated at constant rates of exchange.
2. The Motoring category of sales comprises the aggregate of Car Maintenance, Car Enhancement and Travel Solutions
3. All numbers shown in this statement are before non-recurring items, unless stated otherwise.
4. Underlying EBITDA denotes earnings before net finance costs, tax, depreciation, amortisation and non-
recurring items.

3
Results Presentation A presentation for analysts and investors will be held on 1 June 2016 starting at 9.00am at JP Morgan, 60
Victoria Embankment, London, EC4Y 0JP. Attendance is by invitation only. A live webcast of the presentation
will be available at www.halfordscompany.com.
Notes to Editors www.halfords.com www.halfordscompany.com www.halfordsautocentres.com www.cyclerepublic.com www.boardmanbikes.com www.tredz.co.uk www.wheelies.co.uk www.bikereplacement.co.uk Halfords is the UK's leading retailer of motoring, cycling and leisure products and, through Halfords Autocentres,
also one of the UK's leading independent car servicing and repair operators. Customers shop at 462* Halfords
stores and 10* Cycle Republic shops in the UK and Republic of Ireland and at halfords.com for pick-up at their
local store or direct home delivery. Halfords Autocentres operates from 314* sites nationally and offers motorists
high-quality MOTs, repairs and car servicing at affordable prices. As of May 2016 customers can also shop at
four stores in South Wales and online at tredz.co.uk and wheelies.co.uk for cycling products and direct home
delivery.
Halfords employs approximately 11,000 colleagues and sells around 9,000 product lines in its Retail stores,
increasing to around 165,000 Retail products online. The Retail offering encompasses significant ranges in car
parts, cycling products, in-car technology, child seats, roof boxes and camping equipment. Halfords' own cycling
brands include Apollo, Carrera, Boardman and 13 cycles, augmented by a range of other brands of cycles and
accessories, including Kona, Mongoose, Raleigh and Pinarello. In motoring, the Halfords Essentials and
Halfords Advanced ranges are sold alongside brands such as Kärcher, General Electric, Bosch, Garmin and
TomTom. In Travel Solutions, Halfords sells a premium range of equipment including camping brands such as
CampinGaz and Outwell. Halfords offers customers expert advice and a fitting service called We-Fit for car
parts, child seats, satellite navigation and in-car entertainment systems, and a We-Repair service for cycles.
* as at 1 April 2016
Cautionary Statement
This report contains certain forward-looking statements with respect to the financial condition, results of
operations, and businesses of Halfords Group plc. These statements and forecasts involve risk, uncertainty and
assumptions because they relate to events and depend upon circumstances that will occur in the future. There
are a number of factors that could cause actual results or developments to differ materially from those expressed
or implied by these forward-looking statements. These forward-looking statements are made only as at the date
of this announcement. Nothing in this announcement should be construed as a profit forecast. Except as
required by law, Halfords Group plc has no obligation to update the forward-looking statements or to correct any
inaccuracies therein.

4
Chief Executive’s Statement
Summary of Group Results
Sales of £1,021.5m were up 1.7%, with like-for-like (“LFL”) revenue growth of 1.5%. Group gross margin was
broadly unchanged at 53.2%. Total operating costs rose by 1.8% reflecting volume-driven cost increases and
investments made in key areas of the business offset by targeted cost savings. Investment in the expansion of
Autocentres continued as the business added 11 centres and in Retail we opened six Cycle Republic shops.
Group earnings before non-recurring items, finance costs, depreciation and amortisation (“Underlying EBITDA”)
were up 4.3% to £114.6m. Group earnings before finance costs, tax and non-recurring items (“Underlying EBIT”)
were £84.5m, which compares with £84.6m in the prior year. Profit before tax and non-recurring items was
£81.5m and earnings per share before non-recurring items was 33.2p, up 0.5% and 1.5% respectively.
The cashflow performance remained robust with operating cashflows more than offsetting the impact of our
capital expenditure programme. Net debt at the end of the year was down £13.9m at £47.9m, with a net debt:
EBITDA ratio of 0.4:1 versus 0.6:1 in the prior year.
The Board has recommended a final dividend of 11.3 pence per share (FY15: 11.0 pence) which, if approved,
would take the full-year dividend to 17.0 pence per share, an increase of 3.0% on the prior year. If approved, the
final dividend will be paid on 26 August 2016 to shareholders on the register at the close of business on 5
August 2016. The Board continues to target to grow the dividend every year with an average cover of around 2
times over time.
We have announced today a target for debt of 1.0x EBITDA with a range up to 1.5x to allow for appropriate
M&A. This is a prudent level for debt, taking account of our regular strong cashflow, no pension deficit and
shorter, more flexible leases than many other UK retailers. Our priorities for capital allocation are explained later
in this report.
Operational Review: Retail
Halfords Retail achieved a solid year of sales performance in the context of the trading conditions, with sales up
1.2% to £868.5m. LFL growth of 1.3% reflected Motoring LFL of +2.5% and Cycling LFL of -0.9%. The weather
was not helpful, with both a wet summer and a mild winter, including the warmest December since records
began. Despite this, the motoring side of our business, which contributes around 70% of Group sales, was
resilient and reflected the healthy underlying market indicators and the service-led proposition.
Car Maintenance LFL revenues increased by 3.4%, driven by good growth in sales of car parts, workshop
products and the fitting and sale of bulbs, blades and batteries (“3Bs”). The Halfords own brand oil further
consolidated its number one market position and some of our innovations, such as 130% brighter bulbs,
performed strongly. Car Enhancement LFL revenues increased by 1.0%, supported by exclusive products,
innovation and expert service, and dash cams and in-car connectivity sales grew strongly. The growth in sales of
this “new technology” for the first time offset the continued decline of Sat Nav sales; the latter continuing to
decrease as a result of the structurally-declining market. Our We-Fit proposition drove an increase in sales of car
audio products and services. Travel Solutions LFL revenues increased 2.8%, driven by growth in child car seats
and camping equipment.
Cycling sales declined by 0.9% on a like-for-like basis. This was principally driven by the previously highlighted
challenging July and August for mainstream bikes, due to a number of factors including particularly strong
comparatives, poor weather and discounting across the market. Bike sales returned to growth in Q3 and Q4.
Parts, Accessories and Clothing (“PACs”) sales declined in the year and this is a focus area for us to improve
over the medium-term.
Service-related sales increased by 8.5%, driven in particular by cycle repair and elements of motoring fitting,
such as audio and roof boxes. We also introduced new services including 2Bs (bulbs and batteries) fitting for
motorbikes and windscreen chip repair for cars.
5
Online Retail revenues grew by 1.4% and represented 12.1% of total Retail sales (FY15: 12.1%). The
importance of our store network and service overlay continued to be highlighted by the strength of Click &
Collect, with around 90% of online orders picked up in store.
Operational Review: Autocentres
Total Autocentres revenues were up 4.1% and, on a LFL basis, up 2.5%. Gross margin improved by 90 basis
points in the year, reflecting a lower tyre mix and an increase in service, MOT and repair margins. Operating
costs increased by 5.8%, with the majority of the increase coming from new centres opened in recent years and
the balance due to pay rises, enhanced training and investments in support functions. Underlying EBITDA
increased by 13.2% to £8.6m.
Eleven new Autocentres were opened and two were closed, taking the total number of Autocentre locations to
314 at the end of the year. 24 centres were refurbished during the year, taking the total new or refurbished to just
over 10% of the estate. 10-15 new centres will be opened in the year ahead and any sub-optimal centres will
continue to be closed.
Market Update
Halfords principally operates in two broad markets: motoring and cycling. Around 70% of Group sales are
generated from products and services that are principally motoring related with the remaining 30% coming from
cycling.
Within motoring, the Halfords Group operates in two segments:
Car parts, accessories, consumables and technology. Halfords Retail competes in a portion of this market
worth circa £3bn, holding around a 15% market share.
Car servicing and aftercare, with a total market worth around £9bn. This is where Autocentres competes,
holding around 1.5% share of a highly fragmented market.
The number of cars on the road is rising with new car registrations in 2015 the highest on record. The average
age of cars in the UK is steady at around 7.5 years. Going forward we continue to anticipate the motoring market
to grow at an average rate of 2-3% per annum over the medium term.
As we have explained previously, the cycling market is not particularly well documented, with data difficult to
come by, reflecting the fragmented nature of the operators within it. As such, over the summer of
2015 we conducted our own extensive, bespoke customer and market research. This identified that Halfords had
market shares of around 24% for bikes, 15% for PACs and 10% for cycle repair. We also concluded that whilst
there had been particularly strong growth in the cycling market in 2013 and 2014, we remained confident in the
long-term market prospects albeit at a more moderate rate of 3-5% per annum.
Looking specifically at recent market performance, our analysis suggests that the market declined in the last 12
months, due to the reasons explained in the above operational review, with Halfords making share gains. This
decline was principally attributed to the summer of 2015. Since then we have observed a gradual stabilising of
market conditions, notwithstanding that it may take some time to return to consistent growth and the weather
continues to have an impact on the timing of customer purchase. However we remain confident in the long-term
growth prospects of the cycling market. Participation in the UK is still low and there is large scope for new
cyclists as well as increased spend from existing cyclists. This is supported by significant government support in
London and in many other cities, as well as consumer trends towards healthy activities.
Halfords Business Review
Our goal is to be customers’ first choice for their life on the move and we will achieve this by being Committed to
Making Customers’ Journeys Better.
In November we set out the evolution in strategy from Getting Into Gear to Moving Up A Gear. In Retail this new strategy has 5 key pillars:
1. Putting Customers in the Driving Seat – investing in customer data and insight capabilities to maximise
the lifetime customer value
2. Service in our DNA – embedding the focus on customer service

6
3. Building on our Uniqueness – exclusive products, relevant innovation and unique partnerships, such as
our collaboration with British Olympian and Tour de France winner Sir Bradley Wiggins
4. Better Shopping Experience – a seamless customer experience, online as well as in store
5. Fit for the Future Infrastructure – moving from fixing the basics to improving efficiency and fulfillment
Putting Customers in the Driving Seat
In recent months we have been rapidly improving our customer data knowledge and capability. We introduced e-
receipts in January across all stores and since then have collected over 1 million email addresses, of which the
majority are new contacts to our database. For the 12 months to the end of April 2016 we can match 15% of
Retail sales to customers, up from 3% as of November 2015. We have joined up our online and in-store
customer databases in Retail, meaning that we can now match online orders to customers when they collect in
store. Over the course of the year we will develop a complete single view of customer, which involves joining up
all of the numerous customer databases within Retail, Cycle Republic and Autocentres.
Investment in customer data has allowed us to move from generic email marketing to a more personalised
approach. In recent weeks we have started our first tailored email campaigns. For example, anyone buying a
bike and agreeing to submit their details will, for the first time, receive an email reminder to come in to have their
free 6-week bike check. Also, after any purchase online or in-store, the following day the customer will receive a
“we recommend” email containing 6 products; this is driven by a bespoke recommendation engine built for
Halfords. We will develop more of these tailored campaigns in the months ahead. This summer we will also
commence a customer discovery project, where we will use the enhanced data to segment customers and better
understand shopping habits. We will share some of these insights in due course.
There is more to be done. In FY17 the implementation of the new electronic point of sale (“EPOS”) system
towards the end of the year will, apart from delivering operational enhancements, provide benefits for customer
data, enabling store colleagues to look up customer details in a live customer database at the till and improving
the speed and accuracy of matching and customer interface.
Another key part of Putting Customers in the Driving Seat is a new brand positioning. Over the past few years
our messaging to consumers has been focused around price and spot buys, rather than creating a relationship
with the brand. In a few days’ time we will be launching a new Halfords Brand positioning and new brand look
and feel across a number of customer touch points, including advertising campaigns, website design and in-
store marketing, under the strapline of Halfords – For Life’s Journeys. This is a significant change of approach
and is designed to create a more emotional and relevant connection to the brand. We are also improving the
richness of online content, with more videos and “how to” guides, positioning Halfords as a friend in times of
need. At this stage we are not embarking on a complete and immediate change to external branding of stores or
a complete change of in-store point-of-sale collateral. Rather, these will change over time as and when they
come up for refresh, in order to provide a more cost-effective rollout.
In November we explained that we needed to improve our value perception. Value is an equation of the right
price, great service and outstanding quality. The relative importance of each factor varies by category and we
have assessed our products and services accordingly. We have already introduced new opening price points in
order to improve the value perception where we are, for example, competitive on pricing of the “better” and
“best” products but don’t have a “good” equivalent to our competitors.
Service in our DNA
Services and service-related sales are a key part of this pillar of the strategy. We have recently introduced new
services into our stores including windscreen chip repair and motorcycle bulb and battery fitting. We continue to
look to add to and enhance the suite of services we offer. In November we introduced a new KPI: service-related
sales. This is the income that Halfords derives from the sale of services and any associated products included
within the same transactions. Our aim is to grow this faster than overall sales; in FY16 we achieved growth of
8.5%.
Our customer service metrics continue to improve. The net promoter score is at its highest recorded level and
has increased significantly year on year. We have decided to continue to use net promoter score, but we have
opened up more channels for customers to give us their feedback including exit interviews as customers leave
the store, carried out by an external third party.

7
We remain committed to the 3-Gears training programme; 99% of eligible colleagues are at Gear 1, over 70% of
colleagues had qualified for Gear 2 by the end of FY16 and we also now have over 600 colleagues trained to
Gear 3 “guru” level. As of April 2016 we introduced the National Living Wage for our colleagues aged 25 and
over, and at the same time introduced our 20p supplement for all colleagues upon qualifying for Gear 1. This,
combined with other changes to our pay structures, lifted the pay of all colleagues of the Halfords Group to
above the minimum wage.
Our Retail apprenticeship scheme has now been in place for over a year and we have already placed nearly 200
trainees into permanent roles across our stores. We continue to build our pipeline of Assistant Store Managers
and Store Managers through our Aspire programme; in FY16 all but two of our store manager roles in our
Southern division were filled internally.
We have previously reported on the progress made on improving turnover of colleagues within 3 months of
joining. This continues to be around 9%, having been over 20% three years ago. We have now turned our focus
to improving the overall colleague turnover and this improved by 500 basis points within the last year. We were
pleased to once again be included within the Sunday Times Best Companies To Work For list, maintaining our
18th position, and our Retail colleague engagement score, surveyed annually each April, has been maintained at
82%; a strong result in the context of the more challenging trading conditions this year.
Building on our Uniqueness
Exclusive products, relevant innovation and unique partnerships all strengthen our clear differentiation as a
retailer. Over the last few months we have introduced the following new initiatives and products:
Launched the world’s first 130% brighter bulb. In Q4 this was our second highest selling bulb.
Introduced a lifetime guarantee on certain car batteries.
Extended our range of motorcycle products to include a 2B’s (bulbs and batteries) product and fitting service
for motorbikes, as well as a range of consumables and accessories.
Expanded our range in store and online of gifts and toys. For Christmas we had many new products
including camera drones and Disney Frozen roller skates, as well as gift versions of our popular tool
products.
Launched the new range of Boardman Performance bikes.
During the year we commenced joint sponsorship with Yuasa of last year’s winning team in the British Touring
Car Championships (“BTCC”). Halfords previously sponsored a BTCC team from 2004 to 2008.
In March we unveiled to the press our new Wiggins and Orla Kiely collaborations, which were both well received.
The partnership with Orla Kiely comprises a range of cycling and leisure products and accessories and has
recently launched online and in around 250 Halfords Retail stores. The Wiggins range comprises bikes for
toddlers to teenagers and priced at £99 to £450.
We have lots planned for FY17 including:
An exclusive collaboration with Olympic Gold Medalist and World Champion cyclist Laura Trott to create a
range of limited edition performance bikes for women under the Trott brand. These will be launched in stores
and online in July, priced from £449.
Our largest ever range of in-car connectivity products, with an emphasis on design, colour and technology,
such as solar-powered devices and branded items.
First to market with an exclusive launch of digital in-car adaptors.
Developing our trade offer, starting with the enabling of the trade cards to be used online.
Better Shopping Experience
Over the last three years we have been working hard to improve the in-store and online experience for
customers but, as we set out in November, there is more to be done. We continued to make ongoing
enhancements to our fulfillment proposition, such as adding specific delivery time slots and extending the online
order cut-off deadlines.
Since May 2013 we have refreshed 97 stores under the Getting Into Gear programme. Customer feedback has
been positive and the investments have justified themselves financially. As such we remain committed to the

8
continuation of a refresh programme, but we have slowed down the pace of roll-out whilst we create the “Store of
the Future” refresh concept. The initial design principles have now been agreed and we anticipate trialing the
first concept in the second half of this year. Store of the Future builds on many of the features of our recent store
refreshes and is building in technology to enable colleagues to better serve customers, create a hub for our We-
Fit services and create more flexible spaces.
We are not locking down the refresh concept at this stage; as we learn from the trial we will look to evolve the
concept over the next 12 months. In the meantime we will continue to roll out a number of existing refresh
concepts during FY17. Across both concepts, we anticipate refreshing 15 to 25 stores in the year.
Cycle Republic reached 10 stores by the end of the year and represented 0.5% of group revenue. It was a
difficult year to launch a new cycling concept because of the market conditions, but we are encouraged by the
progress of the brand. The next important step is to launch the new website, which will go live in the next few
weeks. In the year ahead, we will continue to roll out more stores, although fewer than last year, and will
continue to implement lessons to develop the concept. We anticipate that sales in FY17 will reach approximately
1% of group revenue and total capital expenditure for the three years to the end of FY17 will be around £5m, 4%
of the Group total.
Fit for the Future Infrastructure
In November we explained how investment in infrastructure remains a priority, but that the type of investment
moves from being about fixing the foundations to customer and colleague-facing enhancements. This change in
focus began during FY16 with projects such as the online marketplace, new tills in stores, electronic number-
plate lookups and bike finance online. There are also a number of developments that we have been working on
in recent months that will launch in the coming weeks: a transactional Cycle Republic website, contactless
payments in store and the ability to use trade cards online.
Looking ahead, our IT investment is focused on two key projects that we anticipate will be implemented over the
next 12 months: a new electronic point of sale (“EPOS”) system and a new people resource planning tool.
The EPOS system will be rolled out across all stores and also into Autocentres. This will be the first major
change to our EPOS system for many years. In Retail there will be numerous benefits, including:
improved customer data capability, including improved customer matching and the ability for colleagues to
look up customers within a live single view database;
an e-diary, with which customers can pre-book services, such as 3B fitting or cycle repair, and with which we
can allocate resource accordingly;
opportunities to improve in-store processes, such as goods in/out, processing vouchers and promotions, as
well as eradicating many paper-based processes; and
provides a modern and stable platform on which to implement other enhancements.
The new resource planning tool removes eleven systems and replaces them with one tool that we will use
across stores, autocentres, the support centre and distribution centres. Colleagues and line managers will be
able to log into the system to view and change shifts, as well as optimise scheduling of resource.
Our supply chain infrastructure has undergone significant change over the last 18 months, having moved in
October 2014 from 1-day-a-week deliveries to store to a 5-day-a-week in-house delivery arrangement and then,
in August 2015, to a 3-day-a-week outsourced delivery solution. This is now embedded, stable and working well;
providing the benefits of good availability on a cost effective basis. Availability has remained at strong levels
through the transition and thereafter. Concurrently, over the last few months we have been reviewing the long-
term supply chain requirements. We have concluded that in order to support our future growth we will develop
our warehouse infrastructure to improve customer service, but we do not anticipate such plans to cause any
significant ongoing changes to warehouse and distribution operating costs or to the capital expenditure guidance
we have previously given.
9
Autocentres
The Autocentres strategy was launched in November 2014 and remains in place, with the focus on building trust
with our customers. The strategy contains four elements:
To be first choice for motorists – attracting and building a loyal and satisfied customer base.
A service that customers come back for – developing a culture of great service delivered by engaged
colleagues, who value customer feedback.
Be a Grand Prix operation – creating centres that we can be proud of and that provide a great environment
for our customers.
Leverage the Halfords brand – exploring opportunities to cross-sell, jointly source products and operate
common offers across Autocentres and Retail.
We continued to make good progress and we are seeing the improvements come through in customer service
measures, but there remains much to be done.
The standards in our centres continued to improve, evidenced in an improvement in customer retention and net
promoter score. We have introduced a new quality team, with the objective of continuing to improve the quality of
workmanship. Following the trial of a new centre concept in Croydon in 2014 we have been rolling out to the rest
of the estate some of the elements that have worked well, including customer service pods, TV screens, Wi-Fi,
coffee and large viewing windows. In the year all eleven new centres were opened in the new concept style and
we also refreshed 24 centres. We will continue to refresh centres during FY17.
During the year we have increased the number of services you can book on the web and added timed slots. We
have trialled more customer-focused opening hours, such as Sundays and weekday evenings, and we are rolling
this out on a gradual basis. We also trialled interest-free credit during the year and rolled this out across the
business in February 2016.
In terms of leveraging the Halfords brand, we have continued to run a basic car check service consistently
across our stores and garages. In addition to using Halfords car batteries and oils, our garages are now also
using Halfords antifreeze. For the first time we have started to send emails to the Halfords Retail customer
database to promote Autocentres’ services.
We have continued to invest in our people; training around 750 technicians in the year and continuing to invest in
our apprentice scheme. Our training programmes are now externally recognised by the Automotive Technician
Accreditation. We are also introducing a new technician pay grading to suitably reward technicians and provide
a clearer development path.
Financial targets
In November we set out four key financial targets, which we reaffirm below and update with a specific debt
target:
Grow sales faster than the markets in which we operate. We anticipate that the motoring market will grow at
an average rate of 2-3% per annum and the cycling market at an average rate of 3-5% per annum on
average over the medium term. We will aim to beat whatever those growth rates are.
Maintain Group EBITDA % margin roughly flat over the next few years, as we continue to invest for
sustainable growth.
Grow the dividend per share every year with cover of around 2 times underlying earnings, on average over
time.
A debt target of 1.0x EBITDA with a range of up to 1.5x to allow for appropriate M&A. We have set out below
some important principles in this regard.
Capital structure and priorities
Our top priority will be to maintain a strong balance sheet. The debt target has been set at a prudent level, taking
into account the strong, regular cash flow generation, no pension deficit and shorter, more flexible leases than
many UK retailers.

10
Our priorities for use of cash, based on the balance sheet described above, will be firstly capital investment to
grow the business in line with previous guidance, secondly to pay and grow the ordinary dividend every year
within a cover ratio of 2x on average over time, thirdly for any appropriate M&A opportunities which may arise
and thereafter any excess cash would be available for additional distribution to shareholders.
The debt target and range is intended as guidance rather than a hard and fast rule. We anticipate moving
towards the debt target over time. Our clear priority at present is investment to deliver the Moving Up A Gear
strategy and for growth.
Acquisition of Tredz and Wheelies
Subsequent to the year end, on 23 May 2016 the Group acquired Tredz Limited (“Tredz”) and Wheelies Direct
Limited (“Wheelies”). Tredz is a UK-wide online retailer of premium bikes and cycling parts, accessories and
clothing. It also operates four stores in South Wales. Wheelies is the UK’s largest provider of bicycle
replacement for insurance companies.
Collectively, these businesses generated revenue of circa £32m for the year ended 29 February 2016, up from
circa £24m in the prior year, and EBITDA of £2.4m. The initial cash consideration is £18.4m and has been
settled from the Group’s existing borrowing facilities. Dependent upon the financial performance of Tredz in the
year ending 28 February 2017, there will be an element of deferred consideration payable in 12 months.
From a customer and supplier perspective the businesses will continue to trade on a standalone basis and will
continue to be led by the existing management teams. The businesses have strong web development capability
and are supported by office and warehousing premises in Swansea. The majority of sales are fulfilled from the
warehouse operation where a team of highly skilled and experienced bike technicians build bikes which are then
carefully boxed and delivered direct to customers’ homes.
This acquisition is a strong and complementary addition to the Group, extending our presence in the online
market for premium bikes, parts, accessories and clothing.
Community Engagement
Engaging with the wider community continues to be a priority for us and we are delighted to have been
recognised for our work in this area, most recently winning the National CSR Best Partnership in the Community
for our partnership with Re-Cycle.
We are committed to sharing our colleagues’ knowledge and expertise with their local communities. In FY16,
22,000 children and their parents attended free in-store bike workshops helping to improve their skills in basic
bike maintenance and cycling safely, giving them greater confidence to go out cycling more. We also helped
over 5,500 Cubs achieve their Cyclist Activity Badge, in partnership with the Scouts Association.
Following on from the opening of our Cycle Repair Academy inside Onley Prison two years ago, we are soon to
open a second academy in a different prison. The programme offers selected prisoners an opportunity to
become full-time Halfords bike technicians, helping them to rebuild their lives following their sentences and
providing Halfords with fully trained and committed colleagues. 15 have so far graduated and been offered jobs.
Three years ago Halfords established a long-term partnership with Re~Cycle, a UK based charity that transforms
lives through bicycle re-use. The partnership provides opportunities for customers to donate unwanted bikes via
national trade-in events and also at over 75 stores on an on-going basis. Over 20,000 bikes have been donated
so far, resulting in 300 tonnes of bikes being diverted from landfill /disuse and benefitting an estimated 120,000
beneficiaries in Africa. Our colleagues have also raised over £295,000 to help support the charity’s costs.
Building on the success of the Autocentres’ apprenticeship scheme, last year Halfords Retail launched its own
programme. Halfords goes above and beyond the usual apprenticeship model by offering a pre-apprenticeship
training scheme, which equips candidates with four qualifications for those completing the three weeks intensive
training: Halfords’ Gear 1 level training, a Retail Level 1 certificate, an Employability & Personal Development
Certificate, and Level 1 or 2 in Maths & English. The scheme is open to people who are not in education,
11
employment or training and on completion of this training, candidates are interviewed and, if successful, offered
apprenticeships.
Current Activity
As we look ahead there is plenty to do as we implement Moving Up A Gear and we’ve already built good
momentum. The year ahead will be a busy one, both for product developments and strategic progress.
In Motoring, we are embedding our new motorcycle product and service offer, building our new windscreen chip
repair service, launching exclusive in-car technology products, further expanding our ranges and developing our
trade offer. In Cycling we have just launched our Orla Kiely collaboration and there will be a refresh of our Apollo
and Carrera bike ranges, the launch of the Wiggins and Trott ranges and extended online PACs range through
Cycle Republic.
The key focuses under the Moving Up A Gear plan include building relationships with more of our customers,
growing more service-related revenue, continuing to improve our colleague training and retention, implementing
transformational colleague and customer-facing distribution and IT development and improving on our
successful store refresh programme with the Store of the Future concept.
In Autocentres we remain committed to new centre openings, along with the continuation of a roll-out across the
wider estate of the refresh programme. We are also investing in a new electronic point of sale system, which will
enable us to stock and sell Retail products in our centres, jointly source parts with Retail and implement an e-
diary.
I would like to thank all colleagues for their fantastic contribution, support and commitment to the further
progress and performance made in Halfords this year.
Jill McDonald
Chief Executive, 31 May 2016
12
CHIEF FINANCIAL OFFICER’S REPORT Halfords Group plc (“the Group” or “Group”)
The FY16 accounting period represents trading for the 52 weeks to 1 April 2016 (“the financial year”). The
comparative period FY15 represents trading for the 53 weeks to 3 April 2015. However, we believe that the 52
week proforma results for FY15 better reflect the underlying performance of the business when compared to
FY16. On this basis, all commentary included in this report in respect of the comparative period is based on the
52 week period to 27 March 2015 (“the prior year”) unless otherwise stated.
Reportable Segments Halfords Group operates through two reportable business segments:
Halfords Retail, operating in both the UK and Republic of Ireland; and
Halfords Autocentres, operating solely in the UK. All references to Group represent the consolidation of the Halfords (“Halfords Retail”/“Retail”) and Halfords
Autocentres (“Halfords Autocentres”/“Autocentres”) trading entities.
Financial Results
52 weeks
Ended 1 April 2016
Audited 53 weeks
Ended 3 April 2015
Unaudited 52 weeks
Ended 27 March
2015
52 week change
£m £m £m
Group Revenue 1,021.5 1,025.4 1,004.9 +1.7%
Group Gross Profit 543.1 546.3 535.1 +1.5%
Group Underlying EBIT* 84.5 87.6 84.6 -0.1%
Group Underlying EBITDA** 114.6 113.3 109.9 +4.3%
Net Finance Costs (3.0) (3.5) (3.5)
Profit Before Tax and non-recurring items
81.5 84.1 81.1 +0.5%
Profit Before Tax, after non-recurring items
79.8 83.8 80.8 -1.2%
Basic Earnings per Share, before non-recurring items
33.2p 34.1p 32.7p +1.5%
* EBIT denotes earnings before net finance costs, tax and non-recurring items
** EBITDA denotes earnings before net finance costs, tax, depreciation, amortisation and non-recurring items
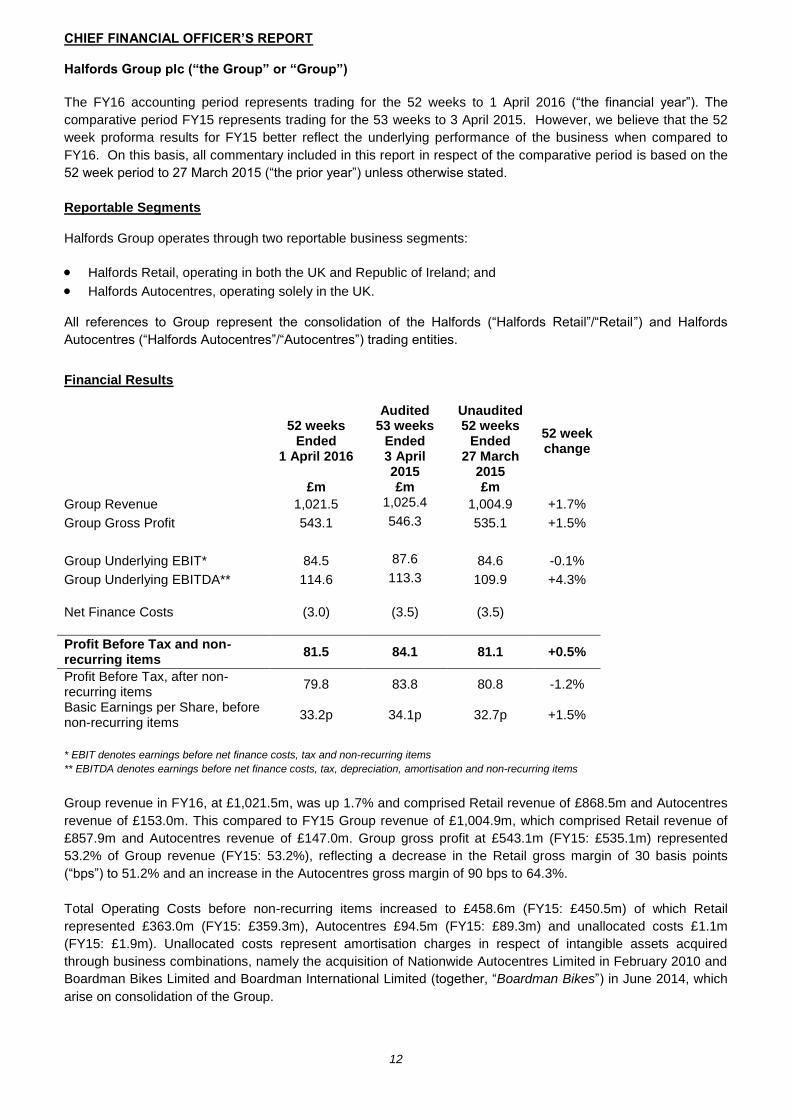
Group revenue in FY16, at £1,021.5m, was up 1.7% and comprised Retail revenue of £868.5m and Autocentres
revenue of £153.0m. This compared to FY15 Group revenue of £1,004.9m, which comprised Retail revenue of
£857.9m and Autocentres revenue of £147.0m. Group gross profit at £543.1m (FY15: £535.1m) represented
53.2% of Group revenue (FY15: 53.2%), reflecting a decrease in the Retail gross margin of 30 basis points
(“bps”) to 51.2% and an increase in the Autocentres gross margin of 90 bps to 64.3%.
Total Operating Costs before non-recurring items increased to £458.6m (FY15: £450.5m) of which Retail
represented £363.0m (FY15: £359.3m), Autocentres £94.5m (FY15: £89.3m) and unallocated costs £1.1m
(FY15: £1.9m). Unallocated costs represent amortisation charges in respect of intangible assets acquired
through business combinations, namely the acquisition of Nationwide Autocentres Limited in February 2010 and
Boardman Bikes Limited and Boardman International Limited (together, “Boardman Bikes”) in June 2014, which
arise on consolidation of the Group.

13
Group EBITDA before non-recurring items increased 4.3% to £114.6m (FY15: £109.9m), whilst net finance costs
were £3.0m (FY15: £3.5m).
Group Profit Before Tax and non-recurring items for the year was up 0.5% at £81.5m (FY15: £81.1m).
Non-recurring costs during the year represented organisational restructuring costs of £1.7m across Retail and
Autocentres. Net non-recurring costs in the prior year were £0.3m and are explained later in this report. Group
Profit Before Tax in the year after non-recurring items was £79.8m (FY15: £80.8m).
Halfords Retail
Revenue for the Retail business of £868.5m reflected, on a constant-currency basis, a like-for-like (“LFL”) sales
increase of 1.3%. Non-LFL stores, including 6 new Cycle Republic store openings since the prior year,
contributed £5.2m revenue in the year.
Motoring sales represented 66% of Retail sales and grew by 2.5%. Car Maintenance LFL revenues increased by
3.4%. Growth in sales of car parts and workshop products more than offset a decline in winter-related products.
The fitting and sale of bulbs, blades and batteries (“3Bs”) continued to grow, helped by new innovation in the
year such as the 130% brighter bulbs, and our Halfords branded oil maintained its number one market position.
Car Enhancement LFL revenues increased by 1.0%. Dash cams and in-car connectivity sales grew strongly,
reflecting Halfords’ authority in these categories, supported by exclusive products, innovation and expert service.
Audio sales increased, driven by good growth in fitting services. Sat Nav sales continued to be impacted by
structurally-declining markets, with sales down in the year. Travel Solutions LFL revenues increased 2.8%,
driven by child car seats and camping equipment.
Cycling sales declined by -0.9% on a like-for-like basis, driven by the -7.6% LFL recorded in Q2 offsetting
positive or flat LFL performance in each of the other quarters. Q2’s performance reflected particularly strong
comparatives exacerbated by poor weather, discounting across the market and annualising against the
Yorkshire Grand Départ of the Tour de France. Since then, bike sales have been in growth in each of Q3 and
Q4. Parts, Accessories and Clothing (“PACs”) sales declined in the year and this is a focus area for us to
improve over the medium-term, beginning with the launch of the new Cycle Republic website in a few weeks’
time. Cycle Repair sales grew strongly in the year, reflecting our investments in equipment and colleagues,
along with our focus on driving service-related sales.
Revenues for the Retail business (including Boardman Bikes) are split by category below:
FY16 (%)
FY15 (%)
Cycling 34.3 34.7
Car Maintenance 32.9 32.4
Car Enhancement 21.6 21.8
Travel Solutions 11.2 11.1 Total 100.0 100.0
52 Weeks 53 Weeks 52 Weeks
Ended 1 April 2016
£m
Ended 3 April 2015
£m See above
Ended 27 March 2015
£m
52 week change
Revenue 868.5
875.1 857.9 1.2%
Gross Profit 444.8 451.1 442.0 0.6%
Gross Margin 51.2% 51.5% 51.5%
Operating Costs (363.0) (365.7) (359.3) 1.0%
EBIT before non-recurring items 81.8 85.4 82.7 -1.1%
Non-recurring items (1.2) (0.3) (0.3) 275.7%
EBIT after non-recurring items 80.6 85.1 82.4 -2.2%
EBITDA before non-recurring items 106.0 105.4 102.4 3.5%
14
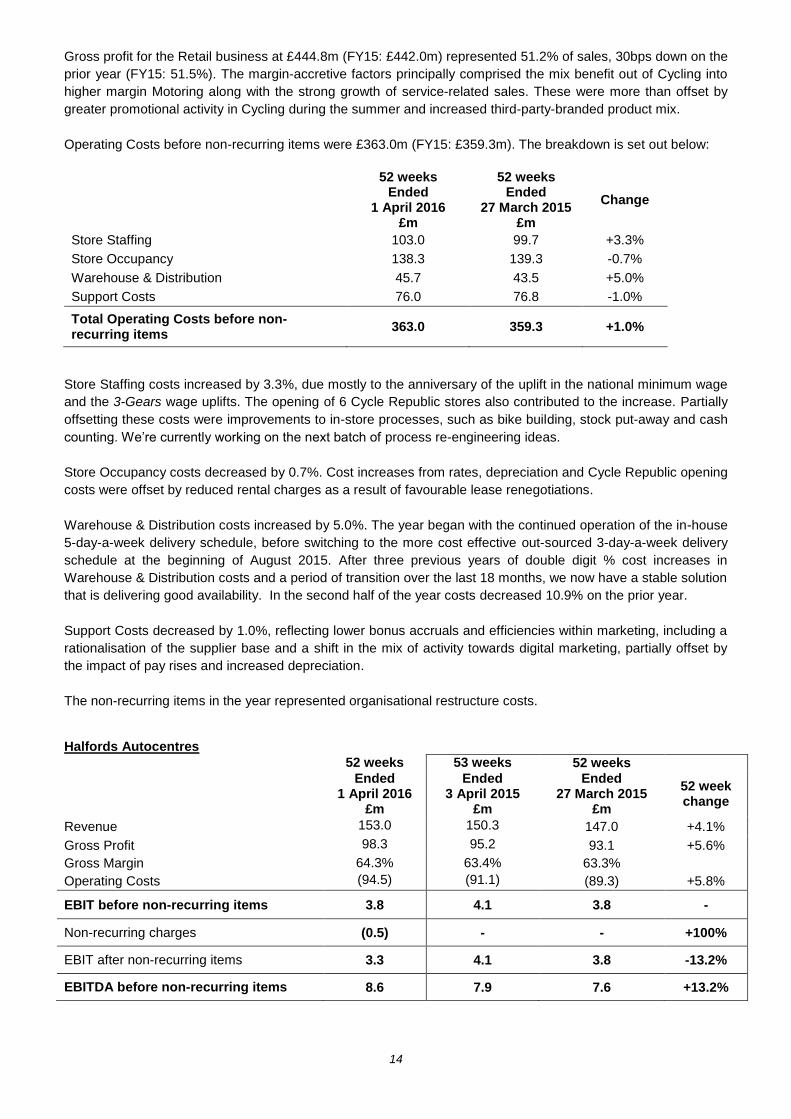
Gross profit for the Retail business at £444.8m (FY15: £442.0m) represented 51.2% of sales, 30bps down on the
prior year (FY15: 51.5%). The margin-accretive factors principally comprised the mix benefit out of Cycling into
higher margin Motoring along with the strong growth of service-related sales. These were more than offset by
greater promotional activity in Cycling during the summer and increased third-party-branded product mix.
Operating Costs before non-recurring items were £363.0m (FY15: £359.3m). The breakdown is set out below:
52 weeks Ended
1 April 2016 £m
52 weeks Ended
27 March 2015 £m
Change
Store Staffing 103.0 99.7 +3.3%
Store Occupancy 138.3 139.3 -0.7%
Warehouse & Distribution 45.7 43.5 +5.0%
Support Costs 76.0 76.8 -1.0%
Total Operating Costs before non-recurring items
363.0 359.3 +1.0%
Store Staffing costs increased by 3.3%, due mostly to the anniversary of the uplift in the national minimum wage
and the 3-Gears wage uplifts. The opening of 6 Cycle Republic stores also contributed to the increase. Partially
offsetting these costs were improvements to in-store processes, such as bike building, stock put-away and cash
counting. We’re currently working on the next batch of process re-engineering ideas.
Store Occupancy costs decreased by 0.7%. Cost increases from rates, depreciation and Cycle Republic opening
costs were offset by reduced rental charges as a result of favourable lease renegotiations.
Warehouse & Distribution costs increased by 5.0%. The year began with the continued operation of the in-house
5-day-a-week delivery schedule, before switching to the more cost effective out-sourced 3-day-a-week delivery
schedule at the beginning of August 2015. After three previous years of double digit % cost increases in
Warehouse & Distribution costs and a period of transition over the last 18 months, we now have a stable solution
that is delivering good availability. In the second half of the year costs decreased 10.9% on the prior year.
Support Costs decreased by 1.0%, reflecting lower bonus accruals and efficiencies within marketing, including a
rationalisation of the supplier base and a shift in the mix of activity towards digital marketing, partially offset by
the impact of pay rises and increased depreciation.
The non-recurring items in the year represented organisational restructure costs.
Halfords Autocentres
52 weeks 53 weeks 52 weeks
Ended 1 April 2016
£m
Ended 3 April 2015
£m
Ended 27 March 2015
£m
52 week change
Revenue 153.0 150.3 147.0 +4.1%
Gross Profit 98.3 95.2 93.1 +5.6%
Gross Margin 64.3% 63.4% 63.3%
Operating Costs (94.5) (91.1) (89.3) +5.8%
EBIT before non-recurring items 3.8 4.1 3.8 -
Non-recurring charges (0.5) - - +100%
EBIT after non-recurring items 3.3 4.1 3.8 -13.2%
EBITDA before non-recurring items 8.6 7.9 7.6 +13.2%

15
Autocentres generated total revenues of £153.0m (FY15: £147.0m), an increase of 4.1% on the prior year with a
LFL revenue increase of 2.5%. LFL tyre revenues decreased by 3.0% and represented 16.5% of total LFL
revenues (FY15: 17.5%). Online-booking revenues grew 18.6% in the year and represented 19% of sales.
Gross profit at £98.3m (FY15: £93.1m) represented a gross margin of 64.3%; an increase of 90 bps on the prior
year. The mix out of lower margin tyres combined with improved service, MOT and repair margins has driven the
variance.
Autocentres’ EBITDA before non-recurring items of £8.6m was 13.2% higher than FY15 (FY15: £7.6m), with the
upside in gross profit being offset by continued cost investments as part of the on-going growth strategy. EBIT
before non-recurring items was flat at £3.8m (FY15: £3.8m).
The non-recurring items in the year represented organisational restructure costs.
Portfolio Management The Retail store portfolio at 1 April 2016 comprised 472 stores (end of FY15: 467). The following table outlines the changes in the Retail store portfolio over the year:
Number Stores
Relocations 2 Belfast (Connswater) & Biggleswade
Lease re-gears 25
Shoreham, Putney, Eastleigh, Fareham, Watford, Hamilton, Peterhead, Glasgow (Rutherglen), Loughton, Newhaven, Hove,
Cardiff, Sheldon, Kingston-upon-Thames, Leicester (Putney Road), Camborne, Oldbury, Eastbourne, Southend, Newcastle (Kingston Park), Plymouth, Romford, Hedge End, Merthyr Tydfil, Gravesend
Rightsizes 1 Luton
Openings 6 Nottingham, Manchester, Bristol, Battersea, Fenchurch Street
(London) and Bloomsbury (London)
Closures 1 Newcastle (Newgate Street)
The six openings in the Retail portfolio were all Cycle Republic. Eleven new Autocentres were opened and two
were closed in the year, taking the total number of Autocentre locations to 314 as at 1 April 2016 (end of FY15:
305).
With the exception of eight long leasehold and two freehold properties within Autocentres, the Group’s operating
sites are occupied under operating leases, the majority of which are on standard lease terms, typically with a 5 to
15-year term at inception and with an average lease length of less than 7 years.
Management anticipates opening around 5 Cycle Republic stores and 10-15 Autocentres in FY17, as well as
refreshing 15 to 25 Retail stores and Autocentres.
Net Non-Recurring expenses
The following table outlines the components of the non-recurring items recognised in the year:
FY16 £m
FY15 £m
Asset impairment charges - (0.7)
Release of Focus lease-guarantee provision - 0.2
Onerous lease provision release - 0.2
Organisational restructure costs (1.7) -
Net non-recurring expenses (1.7) (0.3)
In the prior year, all non-recurring items arose within the 52 week period to 27 March 2015.

16
In the current year organisational restructuring was undertaken across Autocentres and Retail, mainly in their
support centres, to better align resource to the implementation of the new strategy.
Non-recurring costs in the prior year represented the net effect of: £0.7m charge in relation to the impairment
costs to support the Stores Fit to Shop initiative; £0.2m income from the release of the final balance held in
relation to the Focus lease guarantee provision; and £0.2m income from the release of an excess onerous lease
provision following the finalisation of the exit agreement for the Wembley store. The provisions had all been
previously charged as non-recurring items.
Finance Expense The net finance expense for the year was £3.0m (FY15: £3.5m). Lower average debt and favourable interest
rates following the amendment and extension agreed in November 2014 contributed to the reduced charge.
Taxation
The taxation charge on profit for the financial year was £16.3m (FY15: £18.0m), including a £0.3m credit (FY15:
£0.1m charge) in respect of non-recurring items. The effective tax rate on profit before tax and non-recurring
items of 20.5% (FY15: 21.5%) was higher than the UK corporation tax rate (20.0%) principally due to the effect
of non-deductible depreciation charged on capital expenditure.
Earnings Per Share (“EPS”)
Basic EPS before non-recurring items was 33.2 pence and after non-recurring items 32.5 pence (FY15: 32.7
pence before non-recurring, 32.5 pence after non-recurring), a 1.5% increase on the prior year. Basic weighted-
average shares in issue during the year were 195.2m (FY15: 194.1m).
Dividend (“DPS”)
The Board has recommended a final dividend of 11.3 pence per share (FY15: 11.0 pence), taking the full year
dividend to 17.0 pence per share, an increase of 3.0%. If approved, the final dividend will be paid on 26 August
2016 to shareholders on the register at the close of business on 5 August 2016.
The Board continues to target to grow the dividend every year with an average cover of around 2 times over
time.
Capital Expenditure
Capital investment in the year totalled £40.3m (53 week FY15: £37.5m) comprising £32.1m in Retail and £8.2m
in Autocentres.
Within Retail, £13.4m (53 week FY15: £18.5m) was invested in stores, including 25 store refreshes, 3 of which
were also store relocations or right-sizes, as well as general capital spend relating to training rooms, roofing,
flooring and heating. By the end of FY16, 97 stores were trading in a refreshed format. Retail continued to roll
out the Cycle Republic brand, opening 6 dedicated stores in the year. Additional investments in Retail
infrastructure included a £17.4m investment in IT systems, such as continual development of the online Retail
proposition, refresh of store tills, investment in vehicle recognition software and tablets in store and investment in
the underlying web platform.
The £8.2m (53 week FY15: £6.8m) investment in Autocentres comprised of the opening of 11 centres in the year
(FY15: 9) along with investment in refreshing centres and new equipment.
On a cash basis, total capital expenditure in the year was £38.5m (53 week FY15: £39.6m).
Inventories
Group inventory held as at the year-end was £157.9m (FY15: £149.3m). Retail inventory increased to £156.5m
(FY15: £147.8m) mostly due to the impact of foreign exchange. Autocentres’ inventory was £1.4m (FY15:
£1.5m).

17
Cashflow and Borrowings Cash generated from operating activities during the year was £103.7m (53 and 52 weeks FY15: £142.2m). In
the prior year there was a reduction in working capital of £25.3m partly due to the change in timing of year end,
compared to an increase of £11.2m in FY16. After taxation, capital expenditure and net finance costs, free cash
flow of £45.4m (FY15: £66.4m) was generated in the year.
Group net debt was £47.9m (53 and 52 week FY15: £61.8m), with the non-lease-adjusted 12-month net debt:
EBITDA ratio at 0.4:1.
Financial Guidance In November 2015 we set out our medium term financial target of maintaining Group EBITDA % roughly flat as
we invest to drive sustainable long-term growth. We also stated that we expected FY17 Group Profit Before Tax
to be broadly unchanged on FY16. This guidance was issued on the basis of a US Dollar exchange rate of
$1.50. There is no change to this profit guidance other than the impact of the extent to which the US Dollar rate
varies from our original planning assumption of $1.50. Each year we buy goods worth approximately £200m
denominated in US Dollar and about half of that is hedged in advance. The impact on cost of goods of a 5 cent
move in exchange rate (for example from $1.50 to $1.45) would be around £3m in a full year.
There is no change to our prevailing guidance on capital expenditure requirements in the medium term, which
we continue to expect to average around £40m per annum for the Group over the next three years. In FY17 we
anticipate this to be circa £45m, split as circa £35m in Retail and circa £10m in Autocentres. We anticipate the
Group depreciation and amortisation charge to be circa £34m for FY17.
We anticipate the net finance expense to be circa £3m and an effective tax rate of circa 20% in FY17.
The timing of Easter is different year-on-year and we have estimated the impact on trading to be as follows:
In Q1 FY17 there is no Easter compared to half an Easter period occurring in Q1 FY16. We estimate the
impact of this will be circa 1% of LFL revenue in Q1 itself.
In Q4 FY17 there will be no Easter compared to a full Easter in Q4 FY16. We estimate the impact of this will
be circa 2% of LFL revenue in Q4 itself.
Principal Risks and Uncertainties
The Board considers risk assessment, identification of mitigating actions and internal control to be fundamental
to achieving Halfords’ strategic corporate objectives. In the Annual Report & Accounts the Board sets out what it
considers to be the principal commercial and financial risks to achieving the Group’s objectives. The main areas
of potential risk and uncertainty in the balance of the financial year are described in the Strategic Report on page
32 of the Annual Report and Accounts. These include:
Economic risk
Business strategy risks
Competitive risks
Compliance
Changing customer preferences
Reliance on foreign manufacturers
Product and service quality
Information technology systems and infrastructure
Dependence on key management personnel
Specific risks associated with performance include Christmas trading as well as weather-sensitive sales,
particularly within the Car Maintenance and Cycling categories in the Retail business.
Jonny Mason
Chief Financial Officer, 31 May 2016

18
CONSOLIDATED INCOME STATEMENT
For the period 52 weeks to 1 April 2016 53 weeks to 3 April 2015
Before Non-
recurring Items
Non-recurring
items Total
Before Non-
recurring Items
Non-recurring
items Total
Notes £m £m £m £m £m £m
Revenue 1,021.5 - 1,021.5 1,025.4 - 1,025.4
Cost of sales (478.4) - (478.4) (479.1) - (479.1)
Gross profit 543.1 - 543.1 546.3 - 546.3
Operating expenses 2 (458.6) (1.7) (460.3) (458.7) (0.3) (459.0)
Results from operating activities 3 84.5 (1.7) 82.8 87.6 (0.3) 87.3
Finance costs 5 (3.1) - (3.1) (3.6) - (3.6)
Finance income 5 0.1 - 0.1 0.1 - 0.1
Net finance expense (3.0) - (3.0) (3.5) - (3.5)
Profit before income tax 81.5 (1.7) 79.8 84.1 (0.3) 83.8
Income tax expense 6 (16.6) 0.3 (16.3) (17.9) (0.1) (18.0)
Profit for the financial period attributable to equity shareholders 64.9 (1.4) 63.5 66.2 (0.4) 65.8
Earnings per share
Basic 8 33.2p 32.5p 34.1p 33.8p
Diluted 8 33.0p 32.4p 33.5p 33.3p

19
CONSOLIDATED STATEMENT OF COMPREHENSIVE INCOME
52 weeks to 53 weeks to
1 April 2016
3 April 2015
Notes £m £m
Profit for the period 63.5 65.8
Other comprehensive income
Cash flow hedges:
Fair value changes in the period 4.7 7.9
Transfers to inventory (2.9) (1.4)
Transfers to net profit:
Cost of sales (0.6) (3.4)
Income tax on other comprehensive income 6 0.4 (1.2)
Other comprehensive income for the period, net of income tax 1.6 1.9
Total comprehensive income for the period attributable to equity shareholders 65.1 67.7

20
CONSOLIDATED STATEMENT OF FINANCIAL POSITION
1 April
2016 3 April 2015
£m £m
Assets
Non-current assets
Intangible assets 362.9 356.8
Property, plant and equipment 107.3 103.8
Deferred tax asset - 4.1
Total non-current assets 470.2 464.7
Current assets
Inventories 157.9 149.3
Trade and other receivables 60.7 55.8
Derivative financial instruments 4.2 3.9
Cash and cash equivalents 11.9 22.4
Total current assets 234.7 231.4
Total assets 704.9 696.1
Liabilities
Current liabilities
Borrowings (23.4) (22.9)
Derivative financial instruments - (0.1)
Trade and other payables (182.5) (181.4)
Current tax liabilities (7.5) (12.4)
Provisions (9.5) (10.6)
Total current liabilities (222.9) (227.4)
Net current assets 11.8 4.0
Non-current liabilities
Borrowings (36.4) (61.3)
Accruals and deferred income – lease incentives (32.3) (31.5)
Provisions (7.9) (8.2)
Total non-current liabilities (76.6) (101.0)
Total liabilities (299.5) (328.4)
Net assets 405.4 367.7
Shareholders’ equity
Share capital 2.0 2.0
Share premium 151.0 151.0
Investment in own shares (10.9) (13.6)
Other reserves 3.2 1.6
Retained earnings 260.1 226.7
Total equity attributable to equity holders of the Company 405.4 367.7
21
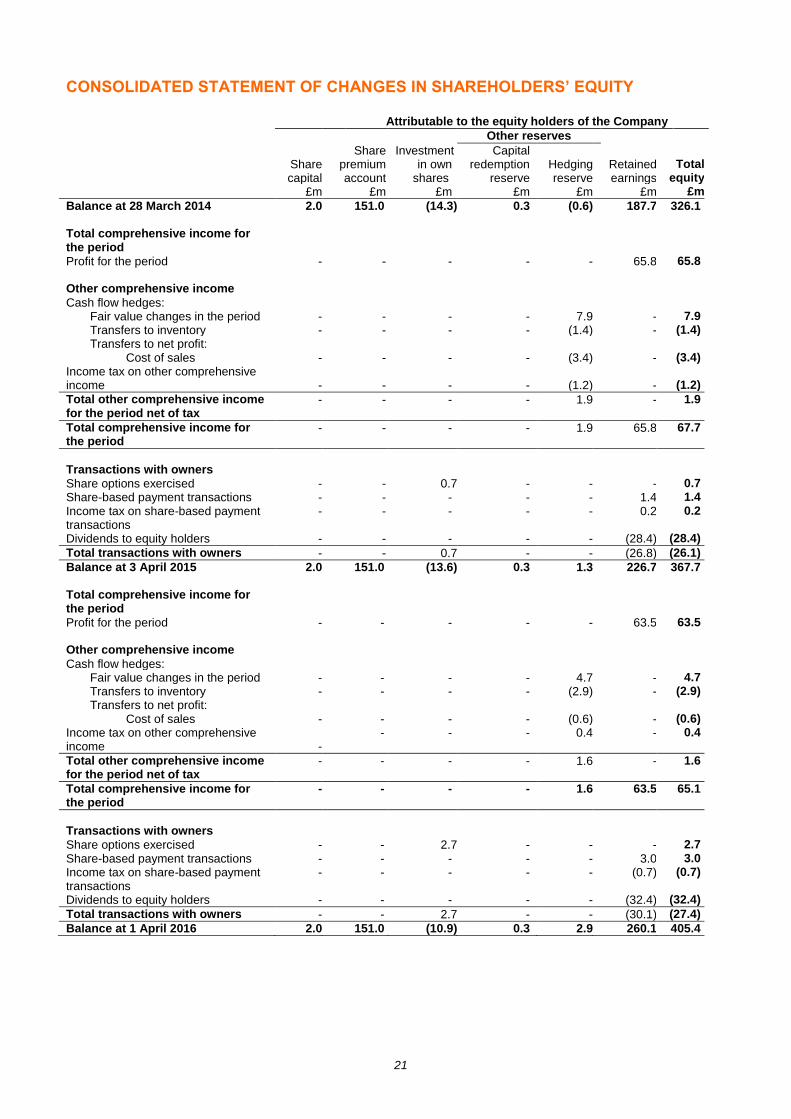
CONSOLIDATED STATEMENT OF CHANGES IN SHAREHOLDERS’ EQUITY
Attributable to the equity holders of the Company
Other reserves
Share Investment Capital
Share
capital premium account
in own shares
redemption reserve
Hedging reserve
Retained earnings
Total equity
£m £m £m £m £m £m £m
Balance at 28 March 2014 2.0 151.0 (14.3) 0.3 (0.6) 187.7 326.1 Total comprehensive income for the period
Profit for the period - - - - - 65.8 65.8 Other comprehensive income
Cash flow hedges:
Fair value changes in the period - - - - 7.9 - 7.9
Transfers to inventory - - - - (1.4) - (1.4)
Transfers to net profit:
Cost of sales - - - - (3.4) - (3.4)
Income tax on other comprehensive income - - - - (1.2) - (1.2)
Total other comprehensive income for the period net of tax
- - - - 1.9 - 1.9
Total comprehensive income for the period
- - - - 1.9 65.8 67.7
Transactions with owners
Share options exercised - - 0.7 - - - 0.7
Share-based payment transactions - - - - - 1.4 1.4
Income tax on share-based payment transactions
- - - - - 0.2 0.2
Dividends to equity holders - - - - - (28.4) (28.4)
Total transactions with owners - - 0.7 - - (26.8) (26.1)
Balance at 3 April 2015 2.0 151.0 (13.6) 0.3 1.3 226.7 367.7 Total comprehensive income for the period
Profit for the period - - - - - 63.5 63.5 Other comprehensive income
Cash flow hedges:
Fair value changes in the period - - - - 4.7 - 4.7
Transfers to inventory - - - - (2.9) - (2.9)
Transfers to net profit:
Cost of sales - - - - (0.6) - (0.6)
Income tax on other comprehensive income
-
- - - 0.4 - 0.4
Total other comprehensive income for the period net of tax
- - - - 1.6 - 1.6
Total comprehensive income for the period
- - - - 1.6 63.5 65.1
Transactions with owners
Share options exercised - - 2.7 - - - 2.7
Share-based payment transactions - - - - - 3.0 3.0
Income tax on share-based payment transactions
- - - - - (0.7)
(0.7)
Dividends to equity holders - - - - - (32.4) (32.4)
Total transactions with owners - - 2.7 - - (30.1) (27.4)
Balance at 1 April 2016 2.0 151.0 (10.9) 0.3 2.9 260.1 405.4

22
CONSOLIDATED STATEMENT OF CASH FLOWS
52 weeks to 53 weeks to
1 April 3 April
2016 2015
Notes £m £m
Cash flows from operating activities
Profit after tax for the period, before non-recurring items 64.9 66.2
Non-recurring items (1.4) (0.4)
Profit after tax for the period 63.5 65.8
Depreciation - property, plant and equipment 23.8 20.2
Impairment charge - 0.7
Amortisation - intangible assets 6.3 5.5
Net finance costs 3.0 3.5
Loss on disposal of property, plant and equipment 0.4 1.7
Equity-settled share based payment transactions 3.0 1.4
Fair value loss on derivative financial instruments (0.4) (2.0)
Income tax expense 16.3 18.0
(Increase)/Decrease in inventories (8.6) 0.9
(Increase)/Decrease in trade and other receivables (4.9) (3.0)
Increase in trade and other payables 2.3 27.2
(Decrease)/Increase in provisions (1.4) 0.5
Finance income received 0.1 0.1
Finance costs paid (2.3) (3.2)
Income tax paid (17.2) (17.1)
Net cash from operating activities 83.9 120.2
Cash flows from investing activities
Acquisition of subsidiary, net of cash acquired - (14.0)
Purchase of intangible assets (12.5) (7.5)
Purchase of property, plant and equipment (26.0) (32.1)
Net cash used in investing activities (38.5) (53.6)
Cash flows from financing activities
Net proceeds from exercise of share options 2.7 0.7
Purchase of own shares - -
Proceeds from loans, net of transaction costs 219.0 220.2
Repayment of borrowings (245.0) (254.0)
Payment of finance lease liabilities (0.6) (0.3)
Dividends paid (32.4) (28.4)
Net cash used in financing activities (56.3) (61.8)
Net (decrease)/increase in cash and bank overdrafts 9 (10.9) 4.8
Cash and cash equivalents at the beginning of the period 0.1 (4.7)
Cash and cash equivalents at the end of the period 9 (10.8) 0.1
23
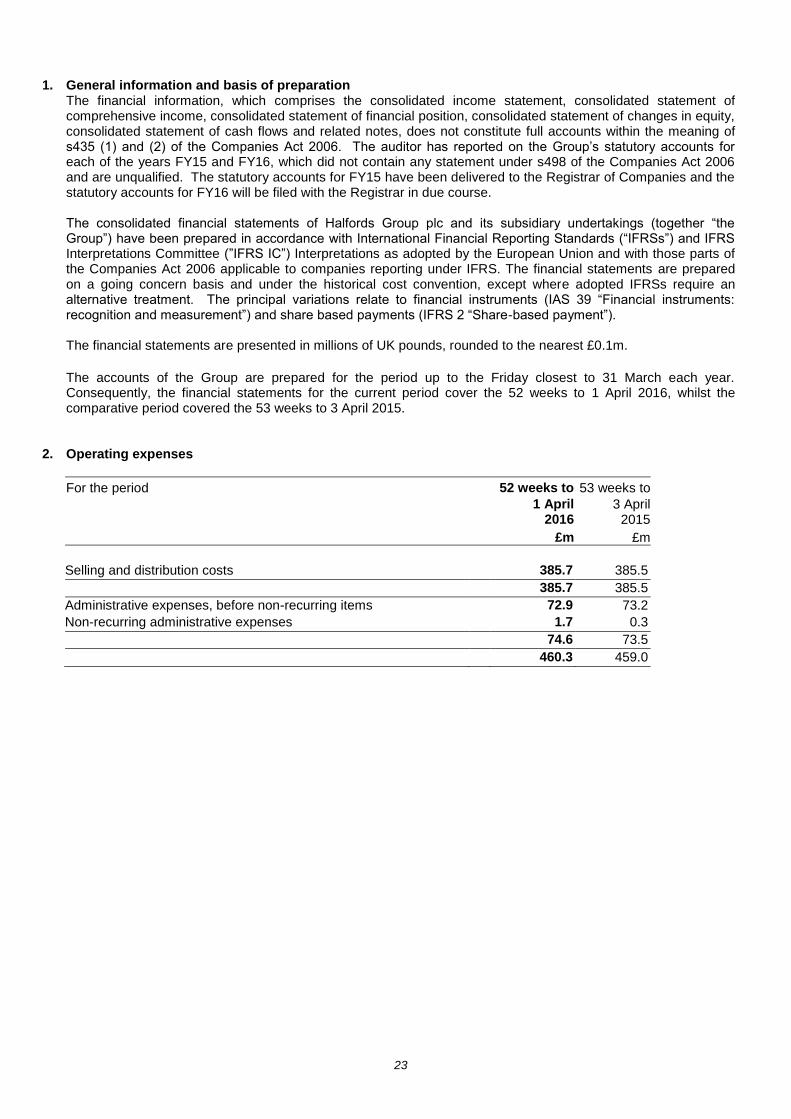
1. General information and basis of preparation The financial information, which comprises the consolidated income statement, consolidated statement of comprehensive income, consolidated statement of financial position, consolidated statement of changes in equity, consolidated statement of cash flows and related notes, does not constitute full accounts within the meaning of s435 (1) and (2) of the Companies Act 2006. The auditor has reported on the Group’s statutory accounts for each of the years FY15 and FY16, which did not contain any statement under s498 of the Companies Act 2006 and are unqualified. The statutory accounts for FY15 have been delivered to the Registrar of Companies and the statutory accounts for FY16 will be filed with the Registrar in due course. The consolidated financial statements of Halfords Group plc and its subsidiary undertakings (together “the Group”) have been prepared in accordance with International Financial Reporting Standards (“IFRSs”) and IFRS Interpretations Committee (”IFRS IC”) Interpretations as adopted by the European Union and with those parts of the Companies Act 2006 applicable to companies reporting under IFRS. The financial statements are prepared on a going concern basis and under the historical cost convention, except where adopted IFRSs require an alternative treatment. The principal variations relate to financial instruments (IAS 39 “Financial instruments: recognition and measurement”) and share based payments (IFRS 2 “Share-based payment”).
The financial statements are presented in millions of UK pounds, rounded to the nearest £0.1m.
The accounts of the Group are prepared for the period up to the Friday closest to 31 March each year. Consequently, the financial statements for the current period cover the 52 weeks to 1 April 2016, whilst the comparative period covered the 53 weeks to 3 April 2015.
2. Operating expenses
For the period 52 weeks to 53 weeks to
1 April
2016 3 April 2015
£m £m
Selling and distribution costs 385.7 385.5
385.7 385.5
Administrative expenses, before non-recurring items 72.9 73.2
Non-recurring administrative expenses 1.7 0.3
74.6 73.5
460.3 459.0
24
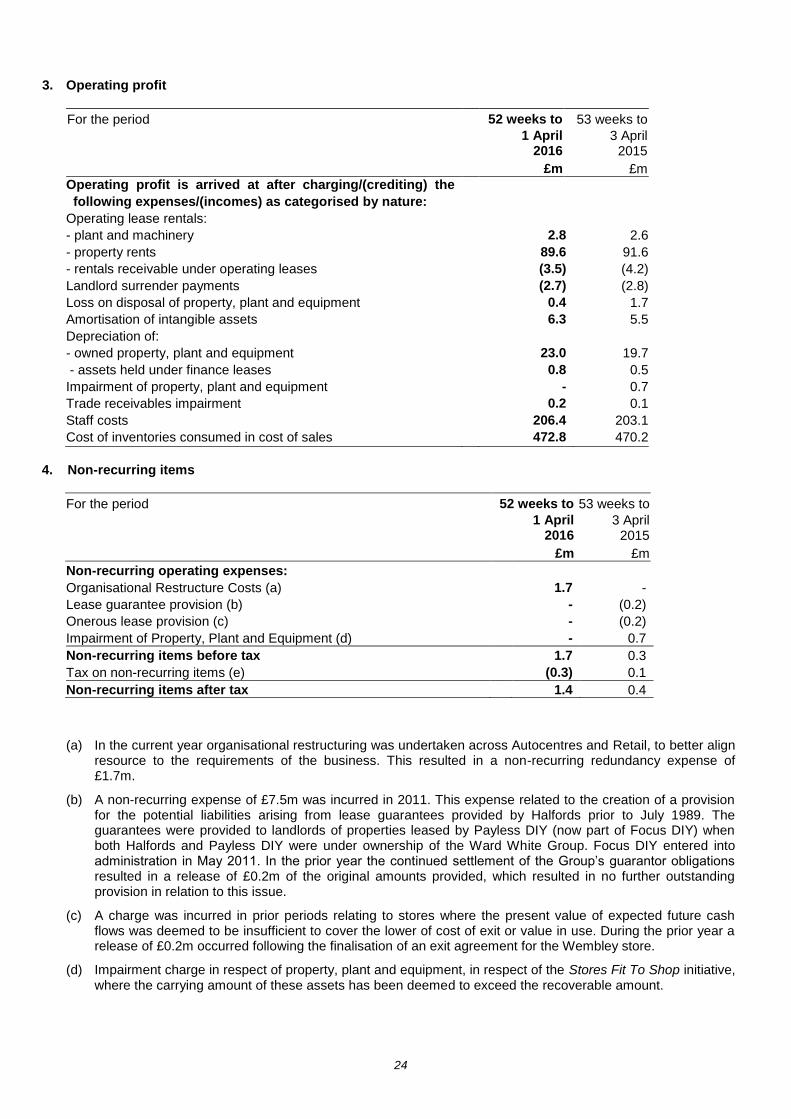
3. Operating profit
For the period 52 weeks to 53 weeks to
1 April
2016 3 April 2015
£m £m
Operating profit is arrived at after charging/(crediting) the
following expenses/(incomes) as categorised by nature:
Operating lease rentals:
- plant and machinery 2.8 2.6
- property rents 89.6 91.6
- rentals receivable under operating leases (3.5) (4.2)
Landlord surrender payments (2.7) (2.8)
Loss on disposal of property, plant and equipment 0.4 1.7
Amortisation of intangible assets 6.3 5.5
Depreciation of:
- owned property, plant and equipment 23.0 19.7
- assets held under finance leases 0.8 0.5
Impairment of property, plant and equipment - 0.7
Trade receivables impairment 0.2 0.1
Staff costs 206.4 203.1
Cost of inventories consumed in cost of sales 472.8 470.2
4. Non-recurring items
For the period 52 weeks to 53 weeks to
1 April
2016 3 April 2015
£m £m
Non-recurring operating expenses:
Organisational Restructure Costs (a) 1.7 -
Lease guarantee provision (b) - (0.2)
Onerous lease provision (c) - (0.2)
Impairment of Property, Plant and Equipment (d) - 0.7
Non-recurring items before tax 1.7 0.3
Tax on non-recurring items (e) (0.3) 0.1
Non-recurring items after tax 1.4 0.4
(a) In the current year organisational restructuring was undertaken across Autocentres and Retail, to better align resource to the requirements of the business. This resulted in a non-recurring redundancy expense of £1.7m.
(b) A non-recurring expense of £7.5m was incurred in 2011. This expense related to the creation of a provision for the potential liabilities arising from lease guarantees provided by Halfords prior to July 1989. The guarantees were provided to landlords of properties leased by Payless DIY (now part of Focus DIY) when both Halfords and Payless DIY were under ownership of the Ward White Group. Focus DIY entered into administration in May 2011. In the prior year the continued settlement of the Group’s guarantor obligations resulted in a release of £0.2m of the original amounts provided, which resulted in no further outstanding provision in relation to this issue.
(c) A charge was incurred in prior periods relating to stores where the present value of expected future cash flows was deemed to be insufficient to cover the lower of cost of exit or value in use. During the prior year a release of £0.2m occurred following the finalisation of an exit agreement for the Wembley store.
(d) Impairment charge in respect of property, plant and equipment, in respect of the Stores Fit To Shop initiative, where the carrying amount of these assets has been deemed to exceed the recoverable amount.

25
(e) The tax credit of £0.3m represents a tax rate of 20% applied to non-recurring items. The prior period represents a tax charge at 21% applied to non-recurring items after adjusting for the non-deductibility of the asset impairment charge and settlements to release Halfords from its guarantor obligations under the leases.
5. Finance income and costs
Recognised in profit or loss for the period 52 weeks to 53 weeks to
1 April
2016 3 April 2015
£m £m
Finance costs:
Bank borrowings (0.9) (1.3)
Amortisation of issue costs on loans (0.7) (0.6)
Commitment and guarantee fees (0.6) (0.8)
Costs of forward foreign exchange contracts (0.1) (0.2)
Interest payable on finance leases (0.8) (0.7)
Finance costs (3.1) (3.6)
Finance income:
Bank and similar interest 0.1 0.1
Finance income 0.1 0.1
Net finance costs (3.0) (3.5)
6. Taxation
For the period 52 weeks to 53 weeks to
1 April
2016 3 April
2015
£m £m
Current taxation
UK corporation tax charge for the period 13.1 20.9
Adjustment in respect of prior periods - (1.8)
13.1 19.1
Deferred taxation
Origination and reversal of temporary differences 3.1 (1.5)
Adjustment in respect of prior periods 0.1 0.4
3.2 (1.1)
Total tax charge for the period 16.3 18.0

26
The tax charge is reconciled with the standard rate of UK corporation tax as follows:
For the period 52 weeks to 53 weeks to
1 April
2016 3 April
2015
£m £m
Profit before tax 79.8 83.8
UK corporation tax at standard rate of 20% (2015: 21%) 16.0 17.6
Factors affecting the charge for the period: Depreciation on expenditure not eligible for tax relief 1.1 1.3 Employee share options (0.4) 0.4 Other disallowable expenses (0.3) 0.4 Adjustment in respect of prior periods 0.1 (1.4) Impact of overseas tax rates (0.4) (0.4) Impact of change in tax rate on deferred tax balance 0.2 0.1
Total tax charge for the period 16.3 18.0
The UK corporation tax rate reduced from 21% to 20% (effective 1 April 2015) and will be further reduced to 19% (effective from 1 April 2017) and 18% (effective from 1 April 2020) following changes substantively enacted on 26 October 2015. This will reduce the Company’s future current tax charge accordingly. The deferred tax asset at 1 April 2016 has been calculated based on the rate of 18% substantively enacted at the balance sheet date. In the Chancellors March 2016 budget he announced plans to further reduce the corporation tax rate to 17% from 1 April 2020, however this was yet to be substantively enacted at the balance sheet date. In this financial period, the UK corporation tax rate was 20% (2015: 21%).
The effective tax rate of 20.5% (2015:21.5%) is higher than the UK corporation tax rate principally due to the non-deductibility of depreciation charged on capital expenditure.
The tax charge for the period was £16.3m (2015: £18.0m), including a £0.3m credit (2015: £0.1m charge) in respect of tax on non-recurring items. An income tax credit of £0.4m (2015: £1.2m charge) on other comprehensive income relates to the movement in fair valuing forward currency contracts outstanding at the year end. No other items within other comprehensive income have a tax impact. In addition to the above a £0.7m (2015: £nil) current tax credit and a £1.4m deferred tax debit (2015: £0.3m credit) is recognised in reserves in relation to employee share options.
The Group engages openly and proactively with tax authorities both in the UK and internationally, where it trades and sources products, and is considered low risk by HM Revenue and Customs (“HMRC”). The Company is fully committed to complying with all of its tax payment and reporting obligations.
In this period, the Group’s contribution to the UK Exchequer from both taxes paid and collected exceeded £150m (2015: £149.0m) with the main taxes including corporation tax £17.2m (2015: £16.1m), net VAT £50.2m (2015: £53.1m), Employment taxes of £45.3m (2015: £42.8m) and business rates £36.9m (2015: £37.0m).

27
7. Dividends
For the period 52 weeks to 53 weeks to
1 April
2016 3 April
2015
£m £m
Equity – ordinary shares
Final for the 53 weeks to 3 April 2015 – paid 11.00p per share (2015: 9.10p)
21.4 17.7
Interim for the 52 weeks to1 April 2016– paid 5.66p per share (2015: 5.50p)
11.0 10.7
32.4 28.4
In addition, the directors are proposing a final dividend in respect of the financial period ended 1 April 2016 of 11.30p per share (2015: 11.00p per share), which will absorb an estimated £22.0m (2015: £21.4m) of shareholders’ funds. It will be paid on 28 August 2016 to shareholders who are on the register of members on 7 August 2016.
8. Earnings per share Basic earnings per share are calculated by dividing the profit attributable to ordinary shareholders by the weighted average number of ordinary shares in issue during the period. The weighted average number of shares excludes shares held by an Employee Benefit Trust and has been adjusted for the issue/purchase of shares during the period. For diluted earnings per share, the weighted average number of ordinary shares in issue is adjusted to assume conversion of all dilutive potential ordinary shares. These represent share options granted to employees where the exercise price is less than the average market price of the Company’s ordinary shares during the 52 weeks to 1 April 2016. The Group has also chosen to present an alternative earnings per share measure, with profit adjusted for non-recurring items because it better reflects the Group’s underlying performance.
For the period 52 weeks to 53 weeks to
1 April
2016 3 April 2015
Number of
shares Number of
shares
m m
Weighted average number of shares in issue 199.1 199.1
Less: shares held by the Employee Benefit Trust (weighted average) (3.9) (4.9)
Weighted average number of shares for calculating basic earnings per share
195.2
194.2
Weighted average number of dilutive shares 1.1 3.2
Total number of shares for calculating diluted earnings per share 196.3 197.4
For the period 52 weeks to 53 weeks to
1 April
2016 3 April 2015
£m £m
Basic earnings attributable to equity shareholders 63.5 65.8
Non-recurring items:
Operating expenses 1.7 0.3
Tax on non-recurring items (0.3) 0.1
Underlying earnings before non-recurring items 64.9 66.2

28
Earnings per share is calculated as follows:
For the period 52 weeks to 53 weeks to
1 April
2016 3 April 2015
Basic earnings per ordinary share 32.5p 33.8p
Diluted earnings per ordinary share 32.4p 33.3p
Basic earnings per ordinary share before non-recurring items
33.2p 34.1p
Diluted earnings per ordinary share before non-recurring items
33.0p 33.5p
9. Analysis of movements in the Group’s net debt in the period
At 3 April
2015 Cash flow Other non-cash
changes At 1 April
2016
£m £m £m £m
Cash and cash equivalents at bank and in hand 0.1 (10.9) - (10.8)
Debt due after one year (50.7) 26.0 (0.7) (25.4)
Total net debt excluding finance leases (50.6) 15.1 (0.7) (36.2)
Finance leases due within one year (0.6) 0.6 (0.7) (0.7)
Finance lease due after one year (10.6) - (0.4) (11.0)
Total finance leases (11.2) 0.6 (1.1) (11.7)
Total net debt (61.8) 15.7 (1.8) (47.9)
Non-cash changes include finance costs in relation to the amortisation of capitalised debt issue costs of £0.7m (2015: £0.6m), new finance leases and changes in classification between amounts due within and after one year. Cash and cash equivalents at the period end consist of £11.9m (2015:£22.4m) of liquid assets and £22.7m (2015: £22.3m) of bank overdrafts.
10. Post Balance Sheet Events On 24 May 2016, after the year end, the Group acquired 100% of the issued share capital of Tredz Limited and Wheelies Direct Limited, for a total capped consideration of £31.6m which includes £12.5m contingent consideration. Tredz Limited is an online and shop based cycling retailer and Wheelies Direct Limited is a cycling insurance replacement company. The contingent consideration payable for the acquisition is dependent on an EBITDA multiple, calculated over a 12 month period ending 28 February 2017. Given the timing of the acquisition we are not able to disclose information regarding the assets and liabilities acquired, the fair values of these and any associated goodwill as these are subject to fair value assessments.