FEX-50-Web-Final.pdf - ENN
122
August 2015 Issue 50 50 th edition
-
Upload
khangminh22 -
Category
Documents
-
view
0 -
download
0
Transcript of FEX-50-Web-Final.pdf - ENN

August 2015 Issue 50
50th
edition

Contents...............................................................
1 Editorial2 Guest Editorial by Lola Gostelow and
Helen Young
3 Field Exchange: Fifty issues young by Lawrence Haddad
4 What became of......Killian Forde?
5 What became of......Fiona O’Reilly?
Field Articles6 Malnutrition peaks during malaria
epidemic in Northwest Nigeria
9 Follow-up on status of children with SAM treated with RUTF in peri-urban and rural Northern Bangladesh
68 Management of hypertension and diabetes for the Syrian refugees and host community in selected health facilities in Lebanon
73 Nutrition surveillance in emergency contexts: South Sudan case study
79 Experiences of the Sustainable Nutrition and Agriculture Promotion (SNAP) programme in the Ebola response in Sierra Leone
96 Contributing to the Infant and Young Child Feeding in Emergencies (IYCF-E) response in the Philippines: a local NGO perspective
102 Timely expansion of nutrition development activities in repose to anacute flooding emergency in Malawi
105 Nutrition programme coverage: implementation strategy and lessons learnt from the Sahel trip in Chad
108 Simplifying the response to childhood malnutrition: MSF’s experience with MUAC-based (and oedema) programming
Research11 Rapid Assessment Method for Older
People (RAM-OP): Progress Report
12 Developing regional weight-for-age growth references to optimise age-based dosing of anti-malarials
13 Follow-up of post-discharge growth and mortality after treatment for SAM in Malawi
15 Who’s Listening? Accountability to affected people in the Haiyan Response
17 Risk sharing and social hierarchy in disaster aid
18 Improving the assessment and attribution of effects of development assistance for health
20 Interactions between nutrition and immune function: using inflammation biomarkers to interpret micronutrient status
21 Effect of Asian population-specific BMIcut-off values on malnutrition double burden estimates
23 Determinants of household vulnerability to food insecurity in Malawi
24 Mothers Understand And Can do it (MUAC)
26 Health-seeking behaviour and community perceptions of childhood undernutrition and a community management of acute malnutrition (CMAM) programme in rural Bihar, India
29 Developing food supplements for moderately malnourished children: lessons learned from RUTF
31 New implications for controversial kwashiorkor treatment discussed in Paediatrics and International Child Health
32 MUAC outperforms weight-based measures of nutritional status in children with diarrhoea
34 The relationship between wasting andstunting: policy, programming and research implications
35 Development and pilot testing of the Maternal Opportunities for Making Change (MOM-C) screening tool
News54 Launch of Situation and Response
Analysis Framework
54 World Humanitarian Summit 2016
55 Core Humanitarian Standard on Quality and Accountability
56 En-net update
56 New global centre for chronic disease in India
57 CMAM Report: development of a global online reporting system for CMAM programming
60 Adolescent Nutrition: Policy and programming in SUN+ countries
62 Practical pointers for prevention of konzo in tropical Africa
63 National and local actor’s share of global humanitarian funding
66 Linking agriculture with nutrition within SDG2: making a case for a dietary diversity indicator
Views82 Challenges in addressing
undernutrition in India
87 Strength in Numbers
88 Nutrition, resilience and the genesis ofAGIR
92 From Kigali to Istanbul the long way round personal reflections on 20-yearsof humanitarian accountability
94 Letters
Agency Profile111 Start Network
ENN updates114 Summary of Field Exchange user
survey findings
116 Summary of en-net user survey findings
117 Summary of Nutrition Exchange user survey findings
117 ENN knowledge management supportto the SUN Movement
118 Field Exchange 51: Nutrition sensitive programmes – call for content
118 How to write an article for Field Exchange
36 EditorialField Articles
38 How many lives do our CMAM programmes save? A sampling-based approach to estimating the number of deaths averted by the Nigerian CMAM programme
46 Postscript – Promoting community based management of severe acute malnutritionas a child survival intervention
47 Postscript – How many lives do our CMAM programmes save? Statistical commentary
48 The Coverage Project: a national partnership for evaluating CMAM services in Nigeria
Research51 Costs, cost-effectiveness, and financial
sustainability of CMAM in Northern Nigeria
Special focus on Nigeria

. . . . . . . . . . . . . . . . . . . . . . . . . . . . . . . . . . . . . . . . . . . . . . . . . . . . . . . . . . . . . . . . . . . . . . . . . . . . . . . . . . . . . . . . . . . . . . . . . . . . . . . . . . . . . . . . . . . . . . . . . . . . . . . . . . . . . . .
1
Dear readersAs this half centenary issue of Field Exchangecontains a number of guest editorials by indi-viduals who were involved in Field Exchangefrom the start, we are going to keep this oneshort. It is pretty much 20 years since the idea ofa Field Exchange and the ENN was mooted atan inter-agency conference in Addis Ababa. Athrow away comment by Helen Young at themeeting planted the seed of an idea; Helen re-marked that the Addis meeting was unusuallyproductive as it brought together field practi-tioners, academics and donors who could alllearn from each-other and wouldn’t it be great ifwe could find a forum to enable this kind of ‘ex-change’ to take place more regularly. e acorntree that is now Field Exchange and the ENNgrew from this one comment.
For the editors of Field Exchange, there hasalways been one core principle that has heldsway. It is that the written word has uniquevalue. Emerging from the ashes of the GreatLakes emergency in 1994/5 where mistakes andlearning from previous decades appear not tohave been heeded, Field Exchange was predicatedon the realisation that institutional memory isfragile and that the written word can uniquelypreserve learning. ere is nothing wrong withthe ‘oral tradition’ but memories are fallible in away that the written word is not.
Over the 20 years of editing Field Exchange,we have also come to see how the process ofwriting up field experiences adds value. osewho put pen to paper are compelled to organizetheir thoughts and learning logically, to self-ex-amine and to make only claims or recommen-dations that can be supported by written evidencewhich in turn can be scrutinised by others. Ele-ments of learning that take place through thewriting process would almost certainly not occurif simply recounted orally. e written wordpromotes accountability for what is said. Fur-thermore, it enables dissemination of learningat scale. e ENN has also learnt that even insituations where dra articles are withdrawnfrom publication (very oen for reasons of sen-sitivity and risk to programmers), the very processof writing has enabled the authors(s) and theirorganisation(s) to learn from the programmeexperience even though this learning may notbe disseminated more widely.
Whether the written word appears in printor digitally is perhaps less important but is stillrelevant. Many of our readers only have limitedor expensive online access. Furthermore, it isnotable (if not a little surprising) to find in FieldExchange evaluations that our readers still havea strong attachment to the hard copy even whenthey have online access. Flicking through thepages of Field Exchange in a life that is dominatedby ‘screen time’ for many may well be a welcomerelief and a better reading (and learning) expe-
rience. We, of course, now produce Field Exchange(and its sister publication Nutrition Exchange)both in print, e-copy and online: we also plan toembrace multi-media developments, which mayallow for wider and cheaper dissemination toour readership
Over the years, the ENN has expanded into arange of activities including technical reviews,operational research, technical meeting facilitation,and development of guidance and training ma-terial. Our activities are largely informed byfrom the privileged overview of the sector weobtain through pulling together Field Exchange.is expanded scope of work is thus a productof your work in contributing to the publication.Field Exchange has therefore been, and remains,the cornerstone of what ENN does.
On to the edition in hand; as ever, we have awide range of articles covering innovations andchallenges in programming. A special sectionlooks at lessons and plans for delivering treatmentof severe acute malnutrition (SAM) at scale inNorthern Nigeria, with three articles byUNICEF/ACF/Mark Myatt; ACF; and Resultsfor Development (R4D) on the topics of coverage,costs, cost-effectiveness and financial sustainabilityof CMAM. is includes a proposed sampling-based approach to estimate the number of deathsaverted by the Nigerian CMAM programmewhich is accompanied by two ‘peer review’ post-scripts. An editorial by CIFF, a lead investor inthe Northern Nigerian CMAM programming,introduces the section. Also on the theme ofCMAM in Nigeria, an article by MSF documentsmalnutrition peaks associated with malaria peaksand highlights the fact that medical care typicallydoes not come under CMAM funding, is imple-mented by different ministries and agencies andis oen under resourced.
e logistical challenges of nutrition pro-gramming are reflected in an article from SouthSudan by ACF, UNICEF and CDC, which de-scribes the technical innovations that enablednutrition surveillance in a vulnerable but quiteinaccessible population. e response to floodingin Malawi in early 2015 is the topic of anotherarticle around CMAM by Concern. Whilst pro-viding immediate support, they found lack ofsurge capacity and sub-standard existing SAMtreatment services, despite longstanding externalinvestment in the recent past. How to sustainlong term CMAM programming once the NGOs‘go home’, remains the 'million dollar question'.At the other end of the spectrum, an article byHelp Age International describes the burden ofcare and experiences of non-communicable dis-ease (NCD) programming in Lebanon amongstolder Syrian refugees and vulnerable Lebanese.It reflects there is progress but a lot yet to bedone to meet NCD and associated nutritionneeds in humanitarian programming. e re-
maining articles cover a range of topics – infantfeeding support in the Philippines from the per-spective of a local NGO responding to TyphoonHaiyan in 2013; experiences of the SustainableNutrition and Agriculture Promotion (SNAP)programme in the Ebola response in SierraLeone authored by IMC and ACDI-VOCA; andUNICEF experiences of a combined SMART-SQUEAC survey in Chad that saved on timeand costs.
We have a run on views pieces in this edition,as well as a rich mixture of research summaries.An article by Ajay Kumar Sinha, Dolon Bhat-tacharyya and Raj Bhandari on the challengesof undernutrition in India provides a fascinatinginsight into the complexities of national andsub-national programming and highlights theneed for coordinated actions. India also featuresin a research summary from MSF that sharesgreat insights into community perceptions andbehaviour around SAM treatment in Bihar. Re-silience and nutrition is the topic of an article byJan Eijkenaar which provides insights into theECHO funded Global Alliance for ResilienceInitiative in the Sahel. ere are also some mustread articles on accountability to affected popu-lations, a topic that hasn’t featured strongly inField Exchange in the past and to which we alltoo easily pay ‘lip service’. One piece describesground breaking work in the Philippines by MargieBuchanan-Smith et al and the other is a very per-sonal but experience based viewpoint by AndyFeatherstone on progress and pitfalls around ac-countability over the last 20 years or so.
As a final word, we would like to thank allthose authors who have written material forField Exchange in the past and encourage thosewho are thinking about writing in the future toget in touch with us to discuss potential topics.We are here to support you in many differentways, from a ‘brainstorming’ conversation to re-view of a fledgling idea to editing. In this issue,we’ve included a guide to the process to help.Over the years, our content has become more‘technical’ but we welcome more informal con-tributions too; it is great to see a few letters inthis edition and we would love to receive more.We would also like to thank our many readersfor taking an interest in the publication and sin-cerely hope that the hard won experiences andlearning that appear in Field Exchange quicklyand positively continue to inform your personalpractice and agency programming for the benefitof those with whom you work. So here is FieldExchange 50 – Enjoy!
Jeremy Shoham & Marie McGrathField Exchange Co-editors
Send article ideas for future editions of Field Exchange to Marie McGrath, [email protected]
Editorial .................................................................

菀
. . . . . . . . . . . . . . . . . . . . . . . . . . . . . . . . . . . . . . . . . . . . . . . . . . . . . . . . . . . . . . . . . . . . . . . . . . . . . . . . . . . . . . . . . . . . . . . . . . . . . . . . . . . . . . . . . . . . . . . . . . . . . . . . . . . . . . .
. . . . . . . . . . . . . . . . . . . . . . . . . . . . . . . . . . . . . . . . . . . . . . . . . . . . . . . . . . . . . . . . . . . . . . . . . . . . . . . . . . . . . . . . . . . . . . . . . . . . . . . . . . . . . . . . . . . . . . . . . . . . . . . . . . . . . . .
In 1997 we were honoured to write the firstField Exchange (FEX) editorial. Now, fiyeditions and nearly 20 years later, we havebeen given the privilege once more, to mark
this ‘golden’ edition.
Our vision of FEX in 1997 embodied threethings: joint learning; shared investment; and mul-ti-disciplinary relevance. We’d like to explore thedegree to which each of these has been realised.
FEX was launched as a result of wanting toshare and learn from the growing experience ofaddressing nutrition in emergencies. As the dis-tribution figures below show, the sharing is cer-tainly taking place. In terms of learning, it seemsthat FEX’s greatest impacts have been in personaland institutional learning; results from a recenton-line evaluation of FEX (summarised in thisedition) reveal that 80% of the 130 or so respondentsfelt that FEX benefits them most for personallearning and nearly 50% indicated that FEX hasinfluenced organisational strategy.
FEX was also launched on the premise that itcould only be kept alive and relevant if we investedin it. Field Exchange has privileged the publishingof field articles, recognising the intrinsic value ofsharing actual on the ground experience. Im-portantly, FEX has kept the barriers to entry lowand worked closely in support of authors, so asto encourage a wide range of contributions. isreality check by practitioners is unique and is avital reflection on the sector – in terms of thenew trends and innovations that are happeningand the realities that field workers have to face.is is perhaps its greatest value and unique con-tribution to the sector over its 18-year history.Yet, the evaluation indicates that only a smallproportion of the FEX community (15%) providearticles. Perhaps this signals a reminder for usall to become more active contributors so thatwe can sustain this valued resource. Reflectingon the findings of the evaluation, the editorialteam also recognise there is more they can do to‘advertise’ the article development process andthe support they can give (43% who did not con-tribute were unsure of the process). Today’s FEXcommunity is largely new – only 34% of respon-dents have been reading FEX for more than 5years. So, it would appear that the FEX formulacreated by the nineties’ nutrition community isjust as relevant in the 2010s as well.
e need for greater connectivity across sectors,disciplines and levels is as relevant today as itwas in 1997. We envisioned FEX supporting “atriangle of cross-fertilising communication andexchange” between field, head office and research
communities. ree years later, in another editorial,Lola wrote:
“e compound of research and practicemakes for a powerful concoction, and it is exactlythis synergy that Field Exchange has catalysedso powerfully: providing a forum for field practiceto be exchanged and explored while also sharingresearch and academic insights that could influencefuture programming and priority-setting.”
Perhaps the strongest connectivity has emergedin bridging research and practice, and bridgingHQ to field. For example, the evaluation revealsthat nearly 60% of respondents see FEX’s impactin the application of evidence to field practice.More difficult, however, is to judge the degree towhich FEX has helped to span sectors. And yet,the orchestrated efforts of multiple sectors is pre-cisely what is needed to scale-up impact on un-dernutrition. is might be a useful signpost forthe future evolution of FEX and the ENN; indeed,already significant steps are being taken in thatdirection with a special issue of FEX on nutri-tion-sensitive programming planned for the endof the year and a new programme of knowledgemanagement support by the ENN to the ScalingUp Nutrition (SUN) Movement in development.
FEX has charted the major technical devel-opments and revolutions in the field of nutritionin emergencies, including for example: • e management of severe malnutrition,
with the introduction of a community basedcare model, combined with evidence based treatment protocols and therapeutic foods.
• Developments in infant and young child feeding, showing how collective efforts can produce global results.
• e programmatic changes with improved registration, targeting and food distribution.
• e standardisation of nutrition survey procedures (SMART), and further develop-ment of nutrition and food security moni-toring and phase classification (the Inte-grated Phase Classification System).
• e burgeoning interest in and application of livelihoods and food security responses, especially in designing cash transfers to improve nutritional outcomes.
The role FEX and ENN have played in the evolutionof thinking and practice around IYCF deservesspecial mention. e very first edition featuredguidelines on feeding infants under 6 months inemergencies (IFE), as well as a discussion on thechallenges of meeting the needs of breastfed andnon-breastfed infants as experienced in programmesin Former Yugoslavia. is proved a sign of thingsto come, with IFE a recurring theme over theyears, including a special featured edition (Issue34) and one of the notable experiences emergingfrom the Syria response (Issue 48). Whilst therehas been huge progress, this 50th edition reflectscontinuing challenges; ebola being the new topic,infant formula 'troubles' the ‘old’ one.
Beyond the technical, FEX has also reportedon institutional developments, including the de-velopment of the Sphere Minimum Standards(that started in 1997, just aer the launch of FEX);the introduction of the Global Nutrition Cluster
in 2006; the emergence of the the SUN Movementfrom 2010; and growth in training programmesand courses from field to Masters level.
Today, FEX reaches over 4,000 people by postin 124 countries, with additional online accessamounting to around 11,500 views of articlesmonthly. Its younger sibling, Nutrition Exchange(NEX), was born in 2009. It has a print run of17,500, goes to 87 countries, with an additional4,817 so copies emailed out. ese figures reflectthe strength of demand for what FEX (and NEX)offers.
Looking forward, perhaps the time has comefor more reflection on how the world out there isaffecting humanitarian response to (mal)nutritionin emergencies. For example, in many contextsthe risks facing humanitarian actors have increasedto unacceptable levels, leading to the securitisationof aid, and distancing between fieldworkers andaffected communities. How has this affected thelives of fieldworkers and their relationship with,and impact on, the people they are trying tohelp? ere is also an increasing number of actorsengaged in supporting nutrition in emergencies –ranging from local community based organisations,which are oen operating alone on the frontline, to the massive food trucking operationsand commercial enterprises that provide nutri-tional products. e discourse around resilienceis yet another influence on humanitarian response,challenging (once more) the disservice that theemergency/development silos have on effectiveprogramming. FEX has a role to play in reflectingthese new and very different realities.
Nutrition has truly come of age. e unprece-dented international, political and domestic mo-bilisation to address undernutrition in all itsforms is an exciting, and ambitious, wave to beriding. We have, for the first time ever, globaltargets for stunting and wasting. We have a con-stantly changing landscape of institutions andactors, and a plethora of nutrition initiatives toimprove practice, standardise procedures andachieve better results. Since FEX was first estab-lished, it has diligently captured the breadth anddepth of this experience for all to learn from.For the future, practitioners will need to continueto play a vital role in critiquing, and influencing,the latest developments.
FEX is a pretty unique forum – the fact thatFEX has continued for so long, and largely un-changed in its format, is a resounding affirmationthat it met, and continues to meet, a felt need.FEX is golden not just in age but also in value.
Lola Gostelow and Helen Young
Lola Gostelow is an independent humanitarianconsultant with over 20 years of experience in theaid sector. Originally trained and working as anutritionist and food security analyst, the lasttwelve years of her work have focused on human-itarian policy, coordination and partnerships.
Helen Young has been a Research Director withthe Feinstein International Centre since 1998, anda Professor with Tus University for more than 10years. She has been active in humanitarian responseand development since 1985.
Editorial
By Lola Gostelowand Helen Young

菀
. . . . . . . . . . . . . . . . . . . . . . . . . . . . . . . . . . . . . . . . . . . . . . . . . . . . . . . . . . . . . . . . . . . . . . . . . . . . . . . . . . . . . . . . . . . . . . . . . . . . . . . . . . . . . . . . . . . . . . . . . . . . . . . . . . . . . . .
. . . . . . . . . . . . . . . . . . . . . . . . . . . . . . . . . . . . . . . . . . . . . . . . . . . . . . . . . . . . . . . . . . . . . . . . . . . . . . . . . . . . . . . . . . . . . . . . . . . . . . . . . . . . . . . . . . . . . . . . . . . . . . . . . . . . . . .
Someone recently asked me: is the nutritioncommunity more fragmented than otherdevelopment “sectors”? My answer wasa firm no. At the Institute of Development
Studies (IDS) where I previously worked, I wasexposed to communities in climate, health, gov-ernance, participation and globalisation. All ofthem have fault lines and they tend to be verysimilar across sectors. Some examples? osewho like to plan and manage development process-es versus those who prefer organic, emergentprocesses. ose who favour rights based argu-ments against those who prefer economics basedarguments. ose who like to measure with num-bers and those who like to describe with narratives.ose who look to the state first and those whobelieve market orientated solutions are the realthing. ose who favour genetic modification ifproven safe and those who think it is the devil’swork. All of these are found in nutrition, ofcourse, but they are just mirroring more widespreadworld views, oen formed at very early ages andvery resistant to new evidence. We are prettymuch like every group of people trying to con-tribute to a better world.
Unfortunately we are also like other devel-opment areas when it comes to learning fromthe field. at is, we say it is vital and then westeadfastly refuse to do it. Why should we doso? My own limited experience in the programmeworld tells me that real problems have to be re-solved by health workers, agricultural extensionagents, programme staff, farmers, mothers andaid workers. ey have no option, they have toinnovate on the fly, extemporise, roll with thepunches and innovate, innovate, innovate. etragedy is that no one is around to documentthe dilemmas and capture the innovations thatthey spur. e frontline workers are too busyhelping people and communities. eir super-visors are too busy managing and raising re-sources and reporting to their donors. Consultantshave no strong incentives to share innovationsbeyond their immediate funders. And re-searchers? Well, they usually find out about theinnovations too late. And even if they were inthe right place at the right time, well, it’s notpublishable, is it?
Big implementing agencies do some of thisdocumentation and sharing, but they shoulddo more. And even here, the pressure to maketheir organisations look good can give us onlyone particular view on an issue. So there is aspace for a knowledge exchange that links therelative chaos and improvisation of the frontlineswith the more measured but less timely analysisfrom the backline. Enter Field Exchange (FEx).FEX has provided those who don’t work at the
cutting edge of action a glimpseof the problems, paradoxes, in-novations and successes that gohand in hand with an intensityof action driven by the very tan-gible costs of inaction. We learnabout the impracticalities of, say,targeting, of measuring, of work-ing without information, of tryingto coordinate, consult and reportwhen communications are diffi-cult, trust is low, roads are de-stroyed and funds arrive aertheir peak need. For those work-ing in this context, I would imag-ine FEX helps them to share theirexperiences, learn from each oth-er, not reinvent the wheel and beheard. And they need to be heard.e development and humani-tarian communities are like shipspassing in the night.
I would hope that FEX canhelp bridge the development-hu-manitarian divide by bridging the frontline-backline divide. Development practitioners needto understand the role that shocks and crisescan play in creating a context in which theirmodels simply don’t work or their assumptionssimply don’t hold. Likewise, humanitarian prac-titioners need to understand that some of theactions they take can set the course of develop-ment for many years, sometimes in very un-knowing ways.
Many of us in our 40s and 50s were taughtabout development with a mental model of arural, fairly stable context. Well, the world ischanging. Poverty (and I would guess undernu-trition) is increasingly becoming concentratedin fragile contexts and, to a lesser extent, inurban ones. Research in fragile contexts is reallydifficult. FEX should increasingly inform thedevelopment community and the wider nutritioncommunity about scaling up nutrition in fragilecontexts. In fact, that would be a great topic fora special issue1. Scaling Up Nutrition (SUN)countries tend to be better governed and lessfragile than non-SUN countries at similar incomelevels. What does scaling up mean in Afghanistanor Syria or in northern Nigeria? What do peopleworking in those contexts have to say aboutscaling up? ey may simply be trying to avoidscaling down. How can the avoidance of scalingdown help us to think about scaling up in thosecontexts and in less fragile places?
Once when sitting next to Hilary Benn, thethen UK Secretary of State for International
Development, I pitched the idea of somethinglike YouTube for development. Innovations fromthe field, captured in 1-2 minute videos, storiestold by practitioners, organised and curated bya network of non-governmental organisations(NGOs). It never went anywhere (which is prob-ably just as well) but I think the spirit of this re-mains important. We talk a lot about amplifyingthe voices of those in poverty or experiencinghunger or malnutrition, but surely hearing fromthose working closely with them is also important.is is why I will continue to glance at the listof articles in FEX, why I think it should broadenits reach into the nutrition “development sector”and why it should consider going beyond theprinted word to the spoken word. Life begins at50 (believe me). Viva FEX!
Lawrence Haddad
Lawrence Haddad is Senior Research Fellow atInternational Food Policy Research Institute. Heis the former Director at the Institute of Develop-ment Studies (IDS) (2004-2014). An economist,his main research interests are at the intersectionof poverty, food insecurity and malnutrition.
Follow Lawrence Hadaad’s blog – unguardedreflection, thoughts and ideas on internationaldevelopment –http://www.developmenthorizons.com/
Field Exchange:Fifty issues youngby Lawrence Haddad
Editorial
1 For new developments in this regard, see news piece on ENN support to knowledge management of the SUN Movement, p117.

菀
. . . . . . . . . . . . . . . . . . . . . . . . . . . . . . . . . . . . . . . . . . . . . . . . . . . . . . . . . . . . . . . . . . . . . . . . . . . . . . . . . . . . . . . . . . . . . . . . . . . . . . . . . . . . . . . . . . . . . . . . . . . . . . . . . . . . . . .
. . . . . . . . . . . . . . . . . . . . . . . . . . . . . . . . . . . . . . . . . . . . . . . . . . . . . . . . . . . . . . . . . . . . . . . . . . . . . . . . . . . . . . . . . . . . . . . . . . . . . . . . . . . . . . . . . . . . . . . . . . . . . . . . . . . . . . .
Like a crazy bag lady rummagingin the skips, she was on her handsand knees on the floor searchingcarefully.
In her hand, a red pen and on the floor,the first issue of Field Exchange, all sell-otaped together so it made one massivesheet that covered the entire office floor.
You see Fiona O’Reilly, for some reasonthat neither of us could recall, decided todo the layout and publishing herself. Besidethe fact that she had zero experience ofthe soware and the same amount of ex-perience in design, she threw herself intolearning it within two weeks.
And in those two weeks, Fiona, myboss had become slightly obsessed, bor-derline demonic, working 14 hours a day
to get the first issue out on her own selfimposed deadline. And out on time itwent.
My own contribution to the design ofField Exchange was my insistence it neededto look different, look attractive to readfor those in the sector. Fiona and Jeremytook my views on board and we started apractice of looking for stunning picturesfrom the aid sector that wrapped aroundthe whole front and back page.
Other than that, I proof read dozens ofarticles about a subject I knew little aboutbut in my time working there could tellmy MUACs from my JFNAMs.
It was in ENN that I got my taste to bean Aid Worker and it was from there thatI got my first post, as a programme manager
for an Irish NGO based in Bosnia. I lovedthe place, staying in the region for fiveyears and ending my time there workingwith an amazing small team of people inMontenegro with WFP.
A dabble in and subsequent retirementfrom electoral politics followed, a few yearsrunning a policy think tank and then suffer-ing from a mid life ponder, I went out toSierra Leone during the Ebola emergency.
Being away from aid work for so long,I forgot how intense the work is but themain difference to me is the extraordinaryamounts of internal paperwork requiredto implement programmes. EmergencyNGOs were established partly in responseto the slow and bureaucratic internationalorganisations’ response.
Certainly transparency and good gov-ernance are essential to our work but thecost is both efficiency and speed of response.
e aid sector has also become moreprofessional with aid agencies looking tonurture and care for their staff – that wasn’tthe experience of many 15 years previously.And organisations such as the ENN wereperfectly placed at a time when the Internetwas just beginning its stellar rise in use.e web means, that now, based in a ruralpart of Sierra Leone, I can log on and readthe latest Field Exchange and share mylearning with others.
I’d like to thank Fiona and Jeremy forthe break they gave me and wish theirlittle baby a happy grown up 50th edition.
Killian Forde
Killian Forde was the first employee of theENN in 1997 working on administrationand sub-editing of Field Exchange.
He le in 1998 and spent five years in theBalkans, before returning to Ireland andbecoming involved in Irish Politics. He spentseven years on Dublin City Council followingwhich he was CEO of the influential policythink tank, e Integration Centre. He iscurrently in Sierra Leone working on thepost Ebola response.
Editorial
What became of......
Killian Forde?
Ebola Team
Killi
an F
orde

菀
. . . . . . . . . . . . . . . . . . . . . . . . . . . . . . . . . . . . . . . . . . . . . . . . . . . . . . . . . . . . . . . . . . . . . . . . . . . . . . . . . . . . . . . . . . . . . . . . . . . . . . . . . . . . . . . . . . . . . . . . . . . . . . . . . . . . . .
. . . . . . . . . . . . . . . . . . . . . . . . . . . . . . . . . . . . . . . . . . . . . . . . . . . . . . . . . . . . . . . . . . . . . . . . . . . . . . . . . . . . . . . . . . . . . . . . . . . . . . . . . . . . . . . . . . . . . . . . . . . . . . . . . . . . . . .
Dear ENN,Congratulations on your 50th issue of FieldExchange!
It seems like yesterday when Jeremy and Iwere putting together the very first issue ofField Exchange. Killian Forde, who ‘helped out’long enough to make himself invaluable andguilt us into paying him a pittance, remindedme of how I manically upskilled myself toproduce the inaugural issue. ankfully, mydabble in production design ended when thebrilliant Kornelius Elstner joined the team (Issue6); he took on this role and greatly improvedthe design. Unfortunately Killian’s ‘What becameof …’ column, which dug up old has-beens suchas Michael Buerk (Issue 2, page 22) and had medoor stepping Bob Geldof (slightly embarrassingas he declined an interview) didn’t survive thetest of time! I’m not sure how I feel about ap-pearing now as an ‘old has-been’ myself!
How Field Exchange looked was very im-portant to me as I would argue “no one willpick it up if it doesn’t look good”. I’m delightedto see that the design, under the creative handof Orna O’Reilly, has been enhanced over timeto reflect in visual terms the ENN’s vision forprofessionalism, quality and accessibility. ewebsite too has continued the attractive styleand developed into one of the best examples ofa web based portal and repository for learningand exchange. It’s clear, simple, easy to navigateand attractive.
Initially and understandably when the pub-lication was not well established, we had to putmuch work into ‘stimulating’ the production ofarticles. In practice, this meant hounding peopleto write about what they were doing and travellingto places where there were significant humani-tarian food and nutrition interventions. Onesuch place was Lokichogio, on the border ofKenya and South Sudan. e year was 1999 andmy son Kern was 5 years old. I flew to the thenhumanitarian hotspot with him in tow to generatematerial for Field Exchange. Again, with mybelief the photos were every bit as important astext, I asked a Turkana woman (from the localarea) if she would pose for a photo that I coulduse in the publication. To my surprise, sherefused. I was curious. She told me about herbelief that my camera, if pointed at her, wouldtake her soul. I reassured her by suggesting thatmy son would pose beside her. I would hardlysteal my son’s soul so she was safe, I reasoned.is worked and the result can be seen in Issue
6, page 10. However, my clever negotiation back-fired on me in the years to come when, to defendhimself from my reprimands or disapproval, myson would say, “What do you expect? You tookmy soul with your camera in Lokichogio.”
Not only in aesthetics and accessibility, butevery aspect of the ENN and Field Exchangeappears to have developed. I recall that for awhile before I le (Issue 20 was my last issue), Iwas mildly concerned that the increasing standardof the publication might follow other high-browed academic publications and risk excludingthe less experienced/specialised; those like myselfas a field worker, who did not have a nutritiondegree and who wouldn’t recognise a Z score ifit hit them in the face. Getting the balance be-tween accessibility and specialisation can bedifficult. However, it’s a balance that Field Ex-change together with Nutrition Exchange achievesbeautifully.
In my view, the ENN and Field Exchangehave gone far beyond the original aim to strength-en institutional memory in the area of food andnutrition in emergencies. e ENN has alsobroken new ground in the area, through researchand development and thus improved practice.
I can still recall the years pre-ENN, whenbest practice guides and research was either inshort supply or hard to find from the field. Irecall in the early nineties working in the Somalirefugee camp in Hartisheik, Ethiopia and laterin war torn Mogadishu. I, like others workingin humanitarian crisis, was at a loss to knowwhat to do with infants who didn’t have breast-feeding as an option. e ENN provided an op-portunity to tackle infant feeding in a practicaland nutritionally sound way, which hithertohad not been done amidst a politically chargedenvironment where infant formula could notbe mentioned for fear it would underminebreastfeeding, yet homemade recipes were simplyinadequate. e infant feeding group, withcritical involvement from the WHO, IBFAN,UNICEF & Linkages, was established and thereal and difficult problems that emergenciesthrew up began to be tackled. I’m delighted tosee the huge developments in this area continueunder the coordination of the ENN. is is justone of many areas in which developments werefacilitated by the ENN.
While my career has taken me on a differentpath, I occasionally travel to Africa to undertake
research or evaluations and immediately reachfor Field Exchange and ENN online if my workin anyway touches on the theme of food or nu-trition. I always have a peep at ‘People in Aid’on the back page to see who’s still around andcheck out the witty Panda cartoon still contributedby Jon Berkeley each month.
Looking back, I fondly and proudly rememberthe early days of establishing the ENN and pro-ducing Field Exchange with Jeremy, Killian andKornelius. Deirdre Handy, the beady eyed proofreader since the early issues, remains on the ed-itorial team scrutinising every word. Howeverwe (the ENN formal team) could not have doneit and it would not have worked if it had not de-veloped as a collaborative effort. As it said inthe first editorial, “it’s yours and ours”. In theearly days of the ENN, a number of committedindividuals got involved, keen to make a differenceand share learning through experience; theyhelped to make it happen and deserve a mention.ose who spring to mind are Lola Gostelow,Anna Taylor, Saskia van der Kam, Rita Bhatia,Helen Young, Marion Kelly, Annalies Borel, MikeGolden and Yvonne Grellety (sorry to those notmentioned.. the aging brain and all that). Ofcourse, Prof John Kevany was invaluable in pro-viding an institutional base at Trinity College inDublin and general wisdom. e foresight ofIrish Aid, our first institutional funder, has to benoted too, with their strategy to make us getmatched funding for their contribution fromother organisations and donors. is strategymeant a broad base of ownership and involvement.
I congratulate Marie who I handed over to,Jeremy who has been the back bone since thebeginning and the rest of the team in improvingand developing the ENN and Field Exchange.Now I have broken an editorial rule of mine –to be brief!
Happy 50th Field Exchange and I wish you 50more at least!
Fiona O’Reilly
Fiona was was the first Field Exchange Co-Editorand Co-Director of ENN from 1997-2004.
Dr Fiona O’Reilly is a Social Scientist currentlyworking as a Senior Research Fellow for the Part-nership for Health Equity based at UniversityLimerick and the North Dublin City GP TrainingProgramme in Dublin, Ireland. She is also theDirector of Kernena Consulting.
Editorial
What became of......
Fiona O’Reilly?Kern, Fiona & Ena

. . . . . . . . . . . . . . . . . . . . . . . . . . . . . . . . . . . . . . . . . . . . . . . . . . . . . . . . . . . . . . . . . . . . . . . . . . . . . . . . . . . . . . . . . . . . . . . . . . . . . . . . . . . . . . . . . . . . . . . . . . . . . . . . . . . . . . .
6
Field Articles ..................................................
Location: NigeriaWhat we know: GAM is prevalent in Northern Nigeria. Seasonal peaks in acutemalnutrition are often assumed to be linked to food insecurity.
What this article adds: MSF supported SAM treatment services in Goronyo LGAexperienced alarming peaks in admissions in August 2012 which was not expected (no foodsecurity/nutrition issues in surveillance). A rapid increase in malaria admissions to theGoronyo health centre in August corresponded with this unusual SAM peak; 70% of SAMadmissions were confirmed malaria cases. Support to CMAM scale up tends to focus onRUTF delivery and associated training; medical aspects of protocols are often under-resourced and managed by different ministries/agencies. Integration of funding and servicesto treat both childhood diseases and malnutrition is needed.
By Chloë Wurr, Joke Zeydner and Saskia van der Kam
Chloë Wurr is a medicaldoctor in Alaska and workedas medical coordinator withMSF-OCA Nigeria
Joke Zeydner is a medicaldoctor in The Netherlandsand worked as medicalcoordinator with MSF-OCANigeria
Saskia van der Kam is anutrition specialist with MSF-OCA based in Amsterdam
Malnutrition peaks during malariaepidemic in Northwest Nigeria
Médecins Sans Frontières-OperationalCentre Amsterdam (MSF-OCA)has provided humanitarian assis-tance in Northwest Nigeria since
2008, delivering medical support to Sokoto StateHospital Goronyo. Activities include outpatient(OPD) and hospital based medical care for childrenless than five years of age, including a erapeuticFeeding Programme (TFP) with both intensiveinpatient services (ITFC) and outpatient ambu-latory phases (ATFP). Goronyo Local GovernmentAuthority (LGA, administrative level comparablewith a district) is located in Sokoto State and hada population in 2011 of 205,247 with an estimatedpopulation of 34,892 children aged less than 5years. In the absence of other functioning medicalservices, MSF-OCA’s catchment area is muchwider, including many families from surroundingLGAs.
is region of Nigeria is rural and primarily dependenton agriculture and animal husbandry for its livelihood,with some income derived from trade and small-scalemanufacturing. e Goronyo LGA livelihood zone ischaracterised by a decades-old irrigation scheme. Avariety of crops is grown in dry lands, as well as the ir-rigated areas, such as millet, sorghum, rice, groundnutsand cowpeas, while vegetables such as okra, onions,spinach and tomatoes are important products of the ir-rigated soils. e irrigated areas also favour substantialsecondary cropping of maize, sweet potatoes, andcassava.
Despite the strength of its agricultural sector, northernregions of Nigeria experience higher rates of malnutritionthan expected. Nutrition surveys in Goronyo LGA inMarch 2009 and March 2010 showed a global acutemalnutrition rate (GAM) of 14.8% and 11.5% respectivelyand a severe acute malnutrition rate (SAM) of 4.9%
MSF, Nigeria, 2012

. . . . . . . . . . . . . . . . . . . . . . . . . . . . . . . . . . . . . . . . . . . . . . . . . . . . . . . . . . . . . . . . . . . . . . . . . . . . . . . . . . . . . . . . . . . . . . . . . . . . . . . . . . . . . . . . . . . . . . . . . . . . . . . . . . . . . . .
. . . . . . . . . . . . . . . . . . . . . . . . . . . . . . . . . . . . . . . . . . . . . . . . . . . . . . . . . . . . . . . . . . . . . . . . . . . . . . . . . . . . . . . . . . . . . . . . . . . . . . . . . . . . . . . . . . . . . . . . . . . . . . . . . . . . . . .
7
Field Article
Figure 1 MSF-OCA Goronyo TFP admissions, 2009-2012 Figure 2 Malaria admissions amongst U5s, OPD and outreachclinics, Goronyo, 2009-2012
and 2.6% respectively. UNICEF’s SMART nu-trition cluster studies carried out in Sokoto andother northern states since 2010 have foundGAM rates between 11.3-12.6% and SAM preva-lence of 1.3-2.9% during the last three years.MSF-OCA’s experience in Goronyo concurswith these findings, with high participation inthe TFPs among the population of children whouse our health services.
is region of Nigeria borders the Niger Re-public, along the southern reaches of the Sahelbelt, which is prone to food crises and epidemics.During 2012, in response to international con-cerns of an impending food crisis in the Sahelregion, the MSF-OCA Nigeria Mission undertook
1800
1600
1400
1200
1000
800
600
400
200
0
2009
2010
2011
2012
Jan Feb Mar Apr May Jun Jul Aug Sep Oct Nov Dec
Num
ber o
f adm
issi
ons
7000
6000
5000
4000
3000
2000
1000
0
Num
ber o
f mal
aria
trea
ted
nutrition and food security surveillance alongthe borders with the Niger Republic, to provideearly warning of regional population movementsand increasing malnutrition rates. Ultimately,our monitoring did not identify any particularfood security concerns or population movementsfrom the north in search of food. e TFP ex-perienced its usual rates of participation untilAugust 2012 when TFP admissions suddenlyincreased to more than double the average forthe same month in the two previous years (seeFigure 1). e increase in children with SAMwas seen in both the ITFC and ATFP. e rapidincrease in numbers overwhelmed the pro-gramme so that in September, MSF was forced
to refer patients from other LGAs, who neededadmission to the ATFP, to services near theirhome. is reduced overall activity in Goronyoand resulted in a sharp decrease in admissions(see Figure 1).
ese high rates of TFP admissions in 2012are particularly notable because MSF-OCA op-erated fewer ambulatory feeding programmesites in 2012 (4 sites) than in 2011 (7 sites),having closed three of seven sites at the end of2011. A UNICEF SMART cluster survey carriedout in August-October 2012 in Sokoto State alsodetected alarming increases in rates of GAMand SAM when compared to rates found in thesame state earlier in the year (see Table 1).
2009
2010
2011
2012
Jan Feb Mar Apr May Jun Jul Aug Sep Oct Nov Dec

8
. . . . . . . . . . . . . . . . . . . . . . . . . . . . . . . . . . . . . . . . . . . . . . . . . . . . . . . . . . . . . . . . . . . . . . . . . . . . . . . . . . . . . . . . . . . . . . . . . . . . . . . . . . . . . . . . . . . . . . . . . . . . . . . . . . . . . . .
. . . . . . . . . . . . . . . . . . . . . . . . . . . . . . . . . . . . . . . . . . . . . . . . . . . . . . . . . . . . . . . . . . . . . . . . . . . . . . . . . . . . . . . . . . . . . . . . . . . . . . . . . . . . . . . . . . . . . . . . . . . . . . . . . . . . . . .
Field Article
In August 2012, while our TFP was admittingrecord numbers of patients with SAM, theGoronyo Outpatient Clinics (OPD) experienceda huge influx of children less than five yearswith confirmed malaria, surging from under100 cases in the second week of July to 833cases in the fourth week of July. e number ofcases of malaria, all confirmed by rapid diagnostictest (RDT), remained high through the end ofOctober, with almost 18,000 children less thanfive years of age treated from August to October.is seasonal peak is seen in our malaria ratesfor 2012 as a whole, during which time MSFtreated 29,183 children for malaria in four out-patient clinics. During the same year, 1,874 chil-dren under five years were admitted to the hos-pital for severe malaria. From September, over70% of children with SAM admitted to the ITFCand over 50% of those admitted to the ATFChad malaria as shown by systematic screeningupon admission with a rapid malaria test. iscompares to rates of less than 10% during thelow season.
Discussione rapid increase in rates of malaria in Augustcorresponded to the unusual peak in admissionsto the TFP during the same period, underscoringthe relationship between disease and malnutrition.While presentation to the OPD for treatment ofmalaria may have increased our detection ofSAM in the population, it is likely that bouts ofmalaria contributed to malnutrition in vulnerablechildren. Conversely, children with malnutritionare at greater risk of complications from malariaand other childhood diseases, requiring hospi-talisation and increasing mortality.
is vivid connection between malaria andmalnutrition informs our understanding ofmalnutrition in a region not suffering fromfood insecurity and explains why delivery offood aid alone is not sufficient to reduce ratesof malnutrition in such areas. In the catchmentarea of the Goronyo TFP, primary health careclinics are scarce and those that do operatelack consistent access to drugs and vaccines.As a result, children in this region go untreatedfor common childhood illnesses contributingto the unexpectedly high rates of malnutritionwe see.
Similarly malnutrition can only be cured ifunderlying disease is addressed. e CommunityManagement of Acute Malnutrition programme(CMAM) established by the Nigerian governmentwith the support of UNICEF addresses primarilythe malnutrition component by providing Ready
To Use erapeutic Food (RUTF) and training.While standard antibiotics and testing for malaria(and treatment when positive) are recommendedin the CMAM protocol, they are not alwaysprovided as nutrition programmes frequentlylack medical capacity, diagnostic tools and drugsto treat illness.
A complicating factor is that in Nigeria, theCMAM programme is administered by the StatePrimary Health Care Development Agency(SPHCDA) while primary health care, includingdiagnosis and treatment of malaria and childhoodillnesses, is the responsibility of the State Ministryof LGA Affairs with few resources to providethis essential medical care.
e separation between nutrition and primaryhealth care is not unique to Nigeria. GenerallyCMAM programmes are successful in supportingprimary health structures with training andproviding therapeutic foods, focusing on earlycase finding and decentralisation of nutritioncare. But the medical component is under re-sourced, partly because medical care is underresourced in general, but also because medicalcare is the responsibility of another agent andnot included in CMAM funding. As long asfunding for treatment of malnutrition is separatedfrom primary health care funding, comprehensivetreatment of malnutrition and effective preventionof malnutrition are not possible. With thisneglect of primary care services, children aremore likely to become malnourished fromdisease, and yet, once malnourished, treatmentwill only be successful when the underlyingdiseases are addressed. Effective strategy for theprevention and treatment of malnutrition requiresintegration of services to treat both childhooddiseases and malnutrition concurrently.
For more information, contact: Saskia van derKam, email: [email protected]
Survey period GAM SAM
Feb-Mar 2012 11.9 % 2.9 %
Aug-Oct 2012 16.2 % 4.4 %
Table 1 UNICEF cluster surveys, 2012
MSF
, Nig
eria
, 201
2
MSF
, Nig
eria
, 201
2

. . . . . . . . . . . . . . . . . . . . . . . . . . . . . . . . . . . . . . . . . . . . . . . . . . . . . . . . . . . . . . . . . . . . . . . . . . . . . . . . . . . . . . . . . . . . . . . . . . . . . . . . . . . . . . . . . . . . . . . . . . . . . . . . . . . . . . .
. . . . . . . . . . . . . . . . . . . . . . . . . . . . . . . . . . . . . . . . . . . . . . . . . . . . . . . . . . . . . . . . . . . . . . . . . . . . . . . . . . . . . . . . . . . . . . . . . . . . . . . . . . . . . . . . . . . . . . . . . . . . . . . . . . . . . . .
9
Field Article
By Dr. Charulatha Banerjee, Monsurul Hoqand Dr. Ehsanul Matin
Charulatha Banerjee isRegional Advisor on Maternaland Child Health & Nutrition,South Asia with the Terre deshommes Foundation (Tdh).
Follow-up onstatus ofchildren withSAM treatedwith RUTF inperi-urban andrural NorthernBangladesh
Location: BangladeshWhat we know: Acute malnutrition in Bangladesh is highly prevalent.Treatment rollout is underway but is not yet at scale. Evidence from theAsia context of treatment outcomes in children, including post discharge,is limited.
What this article adds: An opportunistic study of outcomes of ‘cured’children, 3 and 6 months from discharge, was conducted in an NGOsupported CMAM programme in peri-urban and rural Bangladesh. Curerate was 68%. Approximately one-third of children were lost to follow upat 3 and 6 months. At three months follow up (147 children), 9% hadrelapsed, 69% were moderately malnourished and the remainder hadMUAC > 125mm. At 6 months follow up (112 children), only two hadrelapsed, 58% were moderately malnourished and 39% had MUAC > 125mm. Referral to SFP on discharge had been delayed for the first fivemonths of the programme. Infant and young child feeding practices wereconsidered a significant contributing factor to acute malnutrition; a highproportion of admissions were aged 6 to 23 months.
Bangladesh is home to a large pro-portion of children sufferingfrom acute malnutrition. e2011 Demographic and Health
Survey showed that 16% of children under5 years of age were wasted, with 4% severelywasted. e Government of Bangladeshin 2011 developed Community based Man-agement of Acute Malnutrition (CMAM)guidelines based on World Health Organ-isation (WHO) guidance. However, CMAMuptake has been slow, although first stepshave been taken by the Government inrolling it out nationally. ere is limitedevidence from Asia and Bangladesh onthe experience and effectiveness of CMAMand in particular, on follow-up of childrenwho have been treated with Ready to Useerapeutic Food (RUTF) for severe acutemalnutrition (SAM) in the community.
Terre des hommes Foundation (Tdh)has been operating in the northern Districtof Kurigram since 1974 and currentlyoffers comprehensive health services forwomen, infants and young children livingin Kurigram through Government runcommunity clinics, two maternal and childhealth centres and two community-basedstatic clinics, in line with the National Nu-trition Service Operational Plan and Com-munity Clinic Project. A focus of the workhas also been on Facility Based Managementof SAM from a Special Nutrition Unit,based on the WHO Protocol, which wasadapted for use in Bangladesh in 2008. In2011, with support from UNICEF and theWorld Food Programme (WFP), Tdh rolledout a CMAM intervention in Kurigram.e programme was piloted in three Unionsof the District- Ghogadaha, anahat andKurigram Municipality. Twelve outpatienttherapeutic programme (OTP) centrescovered the three unions. e centres wereindependent of the state system but im-plemented with the necessary permissions.With the Government subsequently moving
to scale up CMAM rollout within the statehealth system, Tdh has a Memorandum ofUnderstanding with the Ministry of Health& Family Welfare & Institute of PublicHealth Nutrition (IPHN) to coordinatethe rollout in Kurigram district. At thetime of writing, Tdh had coordinated afirst round of CMAM training of all MedicalOfficers in the district of Kurigram as partof this rollout. e Medical Officers areheads of Primary Health care facilities inthe district that will be involved in imple-menting CMAM.
Study overviewIn order to increase our understanding ofCMAM in the Asia context, a study wasundertaken by Tdh in 2012 on childrendischarged from the programme. e ret-rospective cohort study took place in peri-urban and rural areas of Kurigram Districtof Northern Bangladesh. e objective ofthis opportunistic study was to report onthe nutritional status of SAM children dis-charged as cured from a community basedtreatment programme. All twelve OTPcentres in three unions of Kurigram Districtwere included in the study. Children werefollowed up aer 3 and/or 6 months, de-pending on the timing for the study relativeto their discharge1.
Admission to the CMAM programmewas based on Mid Upper Arm Circumfer-ence (MUAC) <115mm for children agedbetween 6 to 59 months together with asuccessful appetite test. e programmedefinition of cure is MUAC≥115mm and15% weight gain, as per the NationalCMAM guideline of Bangladesh.
Monsurul Hoq was anEpidemiologist & Statisticianwith Tdh at the time of thisstudy.
Dr. Ehsanul Matin was Directorof Health & Nutrition with theBangladesh Delegation of Tdhat the time of this study.
The project was funded by UNICEF, Swiss Solidarity,Swiss Development Corporation and the WorldFood Programme. This intervention benefited fromthe technical guidance of Dr. Jean Pierre Papart, TdhHealth Advisor, and the support of John Brogan,Country Delegate, Tdh Bangladesh. The project wasimplemented by Tdh, Bangladesh Delegation.
1 Three month follow up was assessed in all children for whom there were available data, and in a subset of 112 children from whom there were six month data. The study examined the very small number of children who were present in both datasets; this added no additional information and so is not presented here.
C Ba
nerje
e/Td
h, B
angl
ades
h

10
Field Article. . . . . . . . . . . . . . . . . . . . . . . . . . . . . . . . . . . . . . . . . . . . . . . . . . . . . . . . . . . . . . . . . . . . . . . . . . . . . . . . . . . . . . . . . . . . . . . . . . . . . . . . . . . . . . . . . . . . . . . . . . . . . . . . . . . . . . .
. . . . . . . . . . . . . . . . . . . . . . . . . . . . . . . . . . . . . . . . . . . . . . . . . . . . . . . . . . . . . . . . . . . . . . . . . . . . . . . . . . . . . . . . . . . . . . . . . . . . . . . . . . . . . . . . . . . . . . . . . . . . . . . . . . . . . . .
A total of 255 children,185 girls and 70 boys,with an average age of 14.96 months (standarddeviation of ± 9.26 months) were admitted tothe CMAM programme based on MUAC <115mm, of whom 90 also had a weight-for-height z-score (WHZ) <-3. WHZ was measuredfor information purposes only and not used asa criterion for admission. Treatment outcomeswere: 68% cured (n=174), 15% defaulted (n=38)and 17% non-responders (n=42). Children wereclassified as non-responders when they did notachieve discharge criteria (MUAC and 15%weight gain) within three months of startingtreatment with RUTF.
e follow up status of 174 children dischargedas cured from the CMAM programme betweenJanuary and December 2012 was assessed usingservice data of community based growth moni-toring run by Tdh during the same period.Among 174 cured, 147 children who were dis-charged July – September 2012 were consideredfor follow up at three months, while 112 childrenwho were discharged before July 2012 were con-sidered for follow up at 6 months. As part of thegrowth monitoring service, MUAC and weightof children below five years was measured monthly.e service data was initially recorded in registersand later entered in IBM SPSS Statistics (SPSSInc, version 19¸USA) for analysis. Data qualitywas ensured by a trained monitoring team whochecked the measurement in the field and alsovalidated electronic records against hard copies.
ResultsA total of 147 children discharged as curedwere eligible for follow up at three months, ofwhom 98 (66.7%) children were identified fromthe growth monitoring database. us one thirdof discharged children (33.3%) were lost tofollow up. Of those 98 children identified, 90children were between the ages of 6-23 monthsat admission to the CMAM programme. emajority of children (69%, 95% CI 60.1% -78.7%), comprising 21 boys and 47 girls, had acurrent MUAC status ≥115 and <125 mm. Onlynine children (9%, 95% CI 3.4% - 15.0%) hadrelapsed into SAM with a MUAC < 115 mm.Twenty-one children (21.4%) were no longeracutely malnourished with a MUAC ≥ 125 mm(95% CI 13.1% - 29.7%).
Among 112 potential follow up children whohad recovered and been discharged from theprogramme six months earlier, a total of 71(63.4%) children were successfully identifiedfrom the growth monitoring database; thus36.6% were lost to follow up. Sixty-five of thechildren were in the age group of 6-23 monthsat admission to the CMAM programme. us,36.6% were lost to follow up. Only two femalechildren had relapsed to SAM with a MUAC<115mms, 41 children (58%) had a MUAC status≥115 and <125 mms and 28 children (39%) hada MUAC status ≥125mms. All SAM cases werere-referred to the OTP.
Discussionis analysis looks at nutritional status of childrendischarged from a CMAM programme basedon their MUAC status. Although in this sample,
relapse to SAM was low at both 3 and 6 months,follow up mechanisms for those dischargedfrom such programmes should be implementedas part of project design; Tdh now recommendthree monthly follow up for the first 6 monthsand then at 12 months. Furthermore, the im-plementation of a Supplementary Feeding Pro-gramme (SFP) or any other initiative that willcontribute to household food security in tandemwith the therapeutic feeding programme, shouldalso be made available. In the project area, theSFP was introduced nearly five months aerthe therapeutic feeding programme startedwhich meant that children initially admitteddid not get any extra nutritional support onOTP discharge. In such a situation, emphasison appropriate complementary feeding practicebased on the family pot, assuming it is adequate,becomes critical to sustain recovery.
In this study, about one third of the childrenwere lost to follow up. Aer discharge from theCMAM programme, mothers were expected tobring their children for monthly growth moni-toring sessions where monthly weighing andMUAC measurements were made. An importantreason for not attending these sessions was mi-gration. Families with children moved out ofthe intervention area for various reasons – entirefamily migrating looking for better working op-portunities or to look for better accommodation.Mothers visiting relatives or a pregnant mothermoving to her parental home for delivery werealso reasons for not attending. Women who hadno support at home to look aer other children,or women who were daily wage earners themselveswere unable to continue attending the programme.On exploring this further with mothers, it wasdetermined that the mother did not feel routinemeasurement was important and was only con-cerned if the child fell ill again. A few womenwith extended family support also could notattend due to the family, oen elderly familymembers, prohibiting them from attending.
In this pilot programme, non-response2 anddefaulting3 rates did not meet Sphere standards.Default and non-responder rates were higher inthe 24-59 months age group compared to the 6-23 month group (p < 0.05). ere was no genderdifference in defaulter or non-responder rates.An important reason for defaulting was migrationfor the same reasons as children who were lost tofollow up (see above). Most of these missed visitsoccurred once the child showed some recoveryin the mother’s eyes; she did not then see the im-portance of completing the treatment. Domesticdisputes and elderly family members not allowingthe mother to attend the OTP were also given asreasons. An important reason for non-responseto treatment was poor complementary feeding,including breastfeeding. Where children did notgain weight in households which could afford anutritious meal for the child, seemed to relyentirely on RUTF to feed the child for the durationof treatment. A small number of cases of sharingwere also reported, while a few households had areal shortage of food for the entire family. Notseeking treatment for illnesses and repeated ill-nesses also contributed to non-response.
In the Tdh programme’s experience, lack ofknowledge regarding infant and young childfeeding (IYCF) practices was an important con-tributing factor to child malnutrition in KurigramDistrict, e.g. delayed introduction of high qualityprotein foods such as fish, even where therewas adequate household access and daily con-sumption amongst older household members.Tdh are of the view that CMAM interventionsoen underemphasise the importance of IYCF.e immediate need aer recovery from acutemalnutrition is to ensure the quickest returnfor a child to consumption of normal householdmeal composition and frequency as per IYCFguidelines. is is the only sustainable solutionto preserve the child’s recovered status and givemothers the confidence that they have the re-sources to nourish and nurture their children.However, this principle only works where thereis no food insecurity.
Tdh, as part of its comprehensive approachto prevention and treatment of acute malnutrition,has since introduced follow up of all childrendischarged from the therapeutic feeding pro-gramme for a period of six months, throughhome visits by field workers. e organisationhas also stepped up its behaviour change com-munication programme on IYCF. During month-ly growth monitoring days in the community,Tdh holds cooking sessions using locally availableand affordable foods to demonstrate to motherswhat can be achieved with their own resources.Additionally, an intensive homestead gardeningprogramme was started in the area and motherswith children under 5 years are especially en-couraged to get involved. As it has been rolledout, it has developed to include specifically fam-ilies with MAM or SAM children.
Including follow up of discharged childrenthrough community groups and house to housevisits, as currently takes place for post-natalvisits, would be valuable. We suggest that routineMUAC measurement at quarterly intervals be-come a mandatory part of the CMAM pro-gramme extension work; this is now being im-plemented in Kurigam District.
Bangladesh has now rolled out the NationalNutrition Service and through this, it is expectedthat CMAM roll out will be implemented in aphased manner and incorporated into the ac-tivities of the Community Clinic, with the CHCP(Community Health Clinic Promoter) beingthe frontline worker. In this context, the usefulnessof MUAC for detection of acute malnutritionand follow up is clearly critical. Follow up willalso be useful to detect any seasonal fluctuations,which may be particularly significant in areasprone to extreme climatic events such as floods,cyclones and severe cold winter periods.
For more information, contact: Dr CharulathaBanerjee, email: [email protected]
2 As per the national guidelines, a non-responder is one who does not attain the discharge criteria within three months ofadmission into the CMAM programme.
3 As per the national guidelines, a defaulter is a case who before attaining discharge criteria is absent from the programme for three consecutive weeks.

. . . . . . . . . . . . . . . . . . . . . . . . . . . . . . . . . . . . . . . . . . . . . . . . . . . . . . . . . . . . . . . . . . . . . . . . . . . . . . . . . . . . . . . . . . . . . . . . . . . . . . . . . . . . . . . . . . . . . . . . . . . . . . . . . . . . . . .
11
By Pascale Fritsch (HelpAge International),Katja Siling (Valid International), Ernest Guevarra (Valid International) andMark Myatt (Brixton Health)
Research .............................................................
Summary of online field article1
This article presents a summary of an online Field Exchange article that detailsfield testing and other ongoing development work on the Rapid AssessmentMethod for Older People (RAM-OP).
e first field trial of the RAM-OP method was undertaken in Addis Ababa (Ethiopia)in early 2014. is trial was reported in a previous Field Exchange article2. Testinginvolved performing two surveys using the SMART method and a prototype of theRAM-OP method simultaneously in the same population and comparing the twosurveys in terms of resource requirements, estimates of indicator levels, and the precisionof estimates. e results of this trial informed the design of a second trial.
e second trial was undertaken in a coastal district of Tanzania in August andSeptember 2014. is trial also compared RAM-OP and SMART simultaneously in thesame population. e SMART survey method followed published guidelines. e firststage sample size for RAM-OP was reduced from twenty to twelve clusters and a withincommunity sample of sixteen older people was taken using systematic sampling ofdwellings in the villages (or parts of villages) organised as ribbons of dwellings, and arandom walk (EPI3) sampling strategy in villages (or parts of the villages) organised asclusters of dwellings. e EPI3 method selects the first household to be sampled using theEPI strategy (as with SMART) with subsequent households selected by choosing a randomdirection and selecting the third nearest house in that direction. is sampling method hasbeen shown to give results as good as simple random samples and to be better than the un-modified EPI strategy when a wide range of indicators is being assessed.
Both trials found that SMART and RAM-OP are functionally similar methods (i.e.the two methods return similar results) and that the RAM-OP method was considerablycheaper than the SMART method. Precision of RAM-OP in the second trial remaineduseful but was a little worse than that achieved by the SMART survey in the samepopulation. is could be remedied by increasing the size of the first-stage sample (i.e.to sixteen clusters) whilst decreasing the size of the second-stage sample (i.e. to twelveolder people) without increasing survey costs for RAM-OP much above about 50% of anequivalent SMART survey.
e online article3 describes key elements of the RAM-OP method, presents theresults of the second trial, compares the results of the two field trials, and describes otherongoing RAM-OP development work.
1 See the full article at: http://bit.ly/1WEKcQt2 Pascale Fritsch, Katja Siling and Mark Myatt (2015). RAM-OP: A rapid assessment method for assessing the
nutritional status, vulnerabilities, and needs of older people in emergency and development settings. Field Exchange 49, March 2015. p67. www.ennonline.net/fex/49/ramop
3 See footnote 1.
Rapid AssessmentMethod for OlderPeople (RAM-OP):
Progress Report
Hel
p Ag
e In
tern
atio
nal,
Ethi
opia
Hel
p Ag
e In
tern
atio
nal,
Ethi
opia

. . . . . . . . . . . . . . . . . . . . . . . . . . . . . . . . . . . . . . . . . . . . . . . . . . . . . . . . . . . . . . . . . . . . . . . . . . . . . . . . . . . . . . . . . . . . . . . . . . . . . . . . . . . . . . . . . . . . . . . . . . . . . . . . . . . . . . .
1菀
. . . . . . . . . . . . . . . . . . . . . . . . . . . . . . . . . . . . . . . . . . . . . . . . . . . . . . . . . . . . . . . . . . . . . . . . . . . . . . . . . . . . . . . . . . . . . . . . . . . . . . . . . . . . . . . . . . . . . . . . . . . . . . . . . . . . . . .Research
Developing regional weight-for-age growth references tooptimise age-based dosing ofanti-malarials
Location: GlobalWhat we know already: Age is often used as a proxy for weight in anti-malarialdrug dosing. Accurate knowledge of the weight-for-age distribution of a given at riskpopulation could help optimise treatment regimens but country/regional specificreference data are lacking; the WHO Child Growth Standards describe optimalgrowth, rather than actual growth in a given place/time.
What this article adds: A recent study derived regional weight-for-age growthreferences to help optimise age-based dosing of anti-malarials in Africa, theAmericas, South-East Asia and the Western Pacific. A model was used to combinedata with varying distributions from a range of sources (largely DHS). Growthcurves were modelled for adolescents and adult males for whom data were mostlacking. Countries were weighted by their population at risk of malaria. The authorsrecommend that age-based anti-malarial dosing should shift from global to region-based regimens.
Summary of research 1
Manufacturers of anti-malarials rec-ommend that dosing should bebased on body weight. However,in many low and middle income
countries, the dose is frequently based on age,which is used as a proxy for body weight becausethese drugs are oen sold over the counter orprescribed in settings without weighing facilities.e use of inadequate age-based dosing regimensis responsible for a considerable proportion oftreatment failures. Substantial improvementscould be made by optimising age-based dosingregimens but this idea has received little attentionfrom manufacturers or policy-makers. Accurateknowledge of the weight-for-age distribution ofthe population at risk of malaria is vital for es-tablishing the optimal dosing regimen. Previously,the optimal age-based dosing regimen and drugratio of a fixed-dose combination of artesunateand amodiaquine anti-malarials, for use in sub-Saharan Africa, were predicted using weight-for-age data from 88,054 individuals in severalAfrican countries. A recent analysis of theefficacy of artesunate and amodiaquine usingpooled data on 5,410 patients from 24 studiesshowed that administered doses of the fixedcombination were significantly better with bothweight-and age-based regimens than when non-fixed combinations were used.
Currently weight-for–age reference data arelacking for most middle and low income coun-tries. Existing global growth standards are theWHO Child Growth Standards for childrenaged 0-59 months – based on the Multi CentreGrowth Reference Study and the 2007 WHOgrowth reference for school-aged children and
adolescents aged 5-19 years. Optimal growthcan be assessed against these standards but theyare inadequate for establishing optimal dosingof anti-malarials as they do not describe howchildren actually grow at a particular time andplace. Since growth varies between regions, re-gional or country-specific reference data wouldenable dosing regimens to be tailored to thepopulation affected.
Over the past two decades, a wealth of pop-ulation-representative anthropometric data havebecome publicly available from low and middleincome countries. A recent study has set out toderive regional weight-for-age growth referencesto help optimise age-based dosing of anti-malar-ials in Africa, the Americas, South-East Asiaand the Western Pacific. is was done by com-piling individual level weight-for-age populationrepresentative data sources in countries wheremalaria is endemic, principally in three areas:the WHO African Region; the WHO Region ofthe Americas; and the WHO South-East Asiaand Western Pacific regions combined. Malariaendemic areas in WHO Eastern MediterraneanRegion were initially considered but insufficientdata were available.
e method involved constructing a weight-for-age database from pre-existing population-based anthropometric data obtained from house-hold surveys and research groups. It containeddata collected between 1995 and 2012 on1,263,119 individuals older than 14 days andyounger than 50 years in 64 malaria-endemiccountries. Regional growth references were gen-erated using a generalised additive model for
location, scale and shape by combining datawith varying distributions from a range ofsources. Countries were weighted by their pop-ulation at risk of malaria to enable references tobe used in optimising the dosing of anti-malarials.
e authors of this work found that largedifferences in weight-for-age distributions existedbetween the three regions and between theseregions and optimal growth curves developedby WHO, which indicates that age-based dosingshould shi from global to region-based regimens.In all three regions, the models achieved goodfits with the original data, which confirmed thatthe generalised additive model for location,scale and shape extension method is a robustway of establishing growth references usingmixed-source data in situations where multicentregrowth reference studies are not feasible. erelative homogeneity of countries within theregions justifies modelling pooled country datasets in each region.
e large majority of the data came fromDemographic Health Surveys (DHS), which arerepresentative of national or subnational popu-lations and have well-established designs andquality assurance methods. Extensive data wereavailable for most of the age range of interestwhich helped in modelling the age range forwhich fewer data were available (i.e. 5-14 years).Data for adolescents and adult males were missingfor many countries, however, they were availableacross the full age spectrum for at least onecountry in each region. Since the two step mod-elling approach was designed to use data fromadjacent countries and age groups, where theseshowed similar growth distributions, the re-searchers were able to model the growth curvesfor adolescents and adult males for all three re-gions. In order to increase the representativenessof the curves, data sets from before 1995 werenot used. Even so, growth curves should be up-dated periodically (e.g. every 5-10 years) usingthe latest data from representative surveys.
e authors conclude that the growth chartsgenerated for individual countries as part of themodelling process could serve as powerful publichealth tools to support decision-making at na-tional level. e logical next step would be tofurther validate these charts for countries wheredata were limited. Country-specific growth ref-erences could be improved further by extrapo-lating female data to derive male growth curves.
e method provides a way of deriving re-gional growth references by collating weight-for-age data available for populations. Further-more, the method facilitates the transition fromgeneric, universal, age-based dosing practicesto more data-driven optimised, regional regimensfor anti-malarials. e method could also helpmonitor nutrition and optimise age-based dosingof other drugs.
1 Hayes D et al (2015). Developing regional weight-for-age growth references for malaria-endemic countries to optimise age-based dosing of antimalarials. Bulletin of the World Health Organisation, vol 93, pp 74-83. Doi: http://dx.doi.org/10.2471/BLT.14.139113

. . . . . . . . . . . . . . . . . . . . . . . . . . . . . . . . . . . . . . . . . . . . . . . . . . . . . . . . . . . . . . . . . . . . . . . . . . . . . . . . . . . . . . . . . . . . . . . . . . . . . . . . . . . . . . . . . . . . . . . . . . . . . . . . . . . . . . .
. . . . . . . . . . . . . . . . . . . . . . . . . . . . . . . . . . . . . . . . . . . . . . . . . . . . . . . . . . . . . . . . . . . . . . . . . . . . . . . . . . . . . . . . . . . . . . . . . . . . . . . . . . . . . . . . . . . . . . . . . . . . . . . . . . . . . . .
1菀
ResearchFollow-up ofpost-dischargegrowth andmortality aftertreatment forSAM in Malawi
Location: MalawiWhat we know already: There are limited data on long term outcomes followingdischarge from SAM treatment; what exists is largely pre-HIV. Current CMAMprogrammes rely on simple and short-term follow up programme indicators tomeasure treatment success.
What this article adds: A prospective cohort study in Malawi followed up mortalityand growth outcomes in 1,024 patients over one year after their treatment for SAMin an inpatient (pre-CMAM) setting. Overall mortality was found to be high in boththe short and medium term. Forty two per cent of admitted children died; 25% ofthese deaths occurred more than 90 days post admission. Of successful discharges,77% were alive 1 year later. Excess mortality was associated with HIV infection;underlying disability (6%) also contributed. Long term survivors showed goodweight-for height catch-up growth, some weight-for-age catch-up but minimalheight-for-age catch-up, compared to sibling controls. The findings endorse theCMAM model of care. Further investigation of longer term, non-mortality outcomesof SAM and the impact of early SAM treatment on stunting are needed.
Summary of research 1
There are limited data on long term out-comes following discharge from severeacute malnutrition (SAM) treatment.e few studies that have looked at
this are mostly old, pre- HIV and even pre-current definitions of SAM. is represents animportant knowledge gap. e primary aim in arecently published study was to follow up patientsover a year aer their treatment for SAM to de-scribe the longer term mortality and growth out-comes. A secondary aim was to identify key riskfactors for good/poor long term outcomes, par-ticularly those which might be amenable tochange or which would help identify high riskindividuals for more targeted future support.
is was a prospective cohort study, arisingfrom a randomised controlled trial – the ‘ProNutstudy’ – which had enrolled malnourished childrenin a trial examining the efficacy of a prebiotic/pro-biotic mixture added to ready-to-use therapeuticfood (RUTF) during SAM treatment.
Methode study setting was the MOYO nutrition ward,Queen Elizabeth Hospital, Malawi. is serves acatchment population of both urban and ruralBlantyre district. At the time, there were no com-munity programmes for SAM active in the district;this meant no community mobilisation, no proac-tive identification of SAM cases and no sub-clas-
sification into ‘complicated’ and ‘uncomplicated’SAM. Children diagnosed with SAM (either atlocal health centres or in the paediatric admissionsarea of Queen’s hospital) were all referred for in-patient care. while anti-retroviral treatment(ARVs) were always available at Queen Elizabeth'sHospital since 2004, guidance at the time was forchildren newly diagnosed with HIV to start ARVsif meeting stage 3 or 4 (WHO classification)which included failure to respond to nutritionaltherapy. As a result, many would not have beenconsidered for ARVs until 1–2 months aer pre-senting with SAM, and those with good nutritionalrecovery were not eligible unless another stagingcriterion was met. From October 2006, theresearch team were able to obtain CD4 countswhich also informed the decision to start ARVs.Co-trimoxazole prophylaxis was provided fromadmission and advised to be continued indefi-nitely.
Cohort subjects were children admitted toMOYO nutrition ward for inpatient care from the12th July 2006 to 9th March 2007 (ProNut re-cruitment period), which included both dry (Julyto November) and rainy seasons (December toMarch). Whilst not every carer consented to theirchild’s enrolment into ProNUT, almost all answereda detailed baseline questionnaire. Admission criteriato MOYO followed Malawi 2007 national guidelines,
which defined SAM as weight-for-height <70%median (NCHS growth references) and/or midupper arm circumference (MUAC) <110 mmand/or oedematous malnutrition. Because of theinpatient-only set-up with children self-presentingto care, it is likely that most would have beentowards the ‘complicated’ end of the SAM spectrum.However, since the patient assessment at the timedid not include an appetite test, an unknown (butlikely small) proportion would have had ‘uncom-plicated’ SAM - which in today’s treatment pro-grammes would be treated at home.
Children who were successfully cured (definedas two consecutive visits at above 80% weight-for-height, no oedema, clinically stable) in MOYO’scombined inpatient/outpatient programme wereasked to return for a ward-based review on the 1year anniversary of their cure date. Non-curesand those failing to return for assessment werefollowed-up at their home by a mobile team whowere usually able to determine outcome infor-mation at first field visit.
e main study outcome was to describe longerterm post-treatment survival. is was definedas the child being seen or reliably reported to bealive at least 1 year aer the original dischargedate from MOYO. Deaths were subdivided intoshort term (whilst still an inpatient on MOYO);medium term (within the first 90 days of admissionbut aer inpatient care); and longer term (definedas death >90 days following programme admission).Ninety days was chosen to be consistent with theupper limits of time normally spent in therapeuticfeeding; three weeks of inpatient care and 10weeks in the ‘outpatient therapeutic programme’(OTP). We also assessed long term growth as asecondary outcome. Weight-for-height z score(WHZ), weight-for-age z score (WAZ), and height-for-age z-score (HAZ) were all assessed and com-pared with sibling controls. Sibling controls wereidentified at home visit and were defined as anychild born to the same mother and living in thesame household. We measured all siblings presentat the time of follow-up visit but due to limitedresources, were not able to return for a secondvisit if any live siblings were away from the house-hold at the original visit. Additional variableswere assessed at original admission to MOYOand are available with complete data collectionsheets. ey were clinical history, clinical signsassessed by a doctor or study clinical officer,family and socioeconomic status, HIV status (pos-itive/negative/unknown) and HIV clinical stagingaccording to WHO criteria.
ResultsOver the eight month study period, a total of 1,024children contributed to 1,187 malnutrition admissionepisodes. Final outcome information was foundon 889/1024 (87%). Of the 135 (13%) with no 1-year outcome, 45/135 (33%) could not be traced atthe address given; 42 (31%) did not give an address;31 (23%) had missing notes; 7 (5%) lived too faraway for the outreach team to visit and 10 (7%)had an outcome but at less than a year.
1 Kerac. M et al (2014). Follow-Up of Post-Discharge Growth and Mortality after Treatment for Severe Acute Malnutrition (FuSAM Study): A Prospective Cohort Study PLOS ONE | www.plosone.org 1 June 2014 | Volume 9 | Issue 6 | e96030
Children enrolled in theMoyo nutrition ward
M K
erac
, Mal
awi,
2004

. . . . . . . . . . . . . . . . . . . . . . . . . . . . . . . . . . . . . . . . . . . . . . . . . . . . . . . . . . . . . . . . . . . . . . . . . . . . . . . . . . . . . . . . . . . . . . . . . . . . . . . . . . . . . . . . . . . . . . . . . . . . . . . . . . . . . . .
1菀
. . . . . . . . . . . . . . . . . . . . . . . . . . . . . . . . . . . . . . . . . . . . . . . . . . . . . . . . . . . . . . . . . . . . . . . . . . . . . . . . . . . . . . . . . . . . . . . . . . . . . . . . . . . . . . . . . . . . . . . . . . . . . . . . . . . . . . .Research
A total of 462/1024 (45%) children wereknown to be still alive at a year or more aer dis-charge from treatment. Long term survival wasgreatest amongst those who had been successfullycured following initial treatment. Of 471 dischargedfrom the OTP as nutritionally cured, 365 (77%)were still alive at a year or more aer their firstadmission. Of the 427/1024 (42%) who died,most did so early on in programme; 238/427(56%) of deaths were during initial inpatienttreatment. Most deaths, 274/427 (64%), wereamong children with underlying HIV infection.Differently expressed, 274/445 (62%) of knownseropositive children died while a total of 77/459(17%) of known seronegative children died.
Because admissions at the time were basedon NCHS growth references, NCHS z-scoreswere used for subsequent calculations. To enablefuture researchers to compare their data, thestudy authors also present admission anthro-pometry calculated using WHO growth standards.Key observations are that: children who diedwere younger than those still alive at 1 year;kwashiorkor (oedematous malnutrition) was thedominant type of SAM but risk of death waslower than in non-oedematous SAM; childrenwho were more malnourished (lower z-scores)at baseline were more likely to die; HIV wasprevalent and HIV-associated mortality was high,especially with advanced disease (as indicatedby low CD4 count); disability – mostly neurodis-ability such as cerebral palsy – was common anddeaths among disabled children were high.Another observation was the large number ofchildren who, according to their personal healthrecord (health ‘‘passport’’) or carer, were seen inan outpatient clinic in the six months prior toSAM admission. In addition, many of these wereseen for symptoms potentially consistent withSAM (e.g. ‘‘swelling’’; ‘‘severely thin’’ or similarnoted in health passport).
Risk factors for mortality were further ex-plored using multivariable Cox Regression. Ad-justing for age, oedema and HIV, low baselineMUAC, WHZ and WAZ are all strongly associatedwith death. Low HAZ is of borderline significance.Children with oedematous malnutrition weresignificantly less likely to die than those without.ough the youngest children below 12 monthsof age were significantly more likely to die, therewas no clear age-related risk gradient amongolder children. HIV stands out as having thegreatest adverse impact, an adjusted hazard ratioof 4.03(95% CI 3.08 to 5.25). Deaths among chil-dren whose HIV sero-status was unknown wereespecially high. Analysis also looked at clinicaland social factors which might plausibly explainmortality. What is notable here is that aer ad-justing for baseline anthropometry, very fewfactors remain as independent predictors of death.Disability stands out as strongly and significantlyassociated with death in HIV negative patients,and only just outside the p< 0.05 threshold forHIV positive patients. Severe anaemia (PCV<10) was also associated with increased risk ofdeath, but in HIV positive patients only.
Finally, the research looked at the final an-thropometry of the children who had received
treatment on the MOYO ward, compared to siblingcontrols. Median birth order of the MOYO childrenwas second born. Over 90% of siblings werereported as never having had SAM themselves.Several points are of note. First is the completecatch-up of WHZ. From an initial programmedischarge mean WHZ of -1.96 (SD 1.5), there wasa 1.92 (95% CI 1.76 to 2.08) z-score catch-up,bringing the surviving group to a WHZ of 0.04(SD1.0), comparable to sibling controls. WAZ alsoimproved by 1.66 (95% CI 1.50 to 1.82) z-scoresto a ‘long-term’ final value of -1.77 (SD1.1). iswas, however, significantly below that of siblingcontrols; mean difference in z-scores was 0.55(95% CI -0.71 to -0.38, p<0.01). HAZ also improved,albeit by only 0.37 (95% CI 0.21 to 0.53, p<0.01)z-scores, to a ‘long-term’ final value of -2.97(SD1.3). is was again significantly lower thanthat of the sibling controls: mean difference -1.13(95% CI -1.34 to -0.93, p<0.01). Median age of allthe siblings who were measured was 61 monthsand median age of the ex-MOYO children whohad a sibling measured was 41 months.
DiscussionIn this SAM treatment programme, overall mor-tality was high in both the short and mediumterm, markedly above SPHERE targets of <10%.Long term survivors showed good weight-forheight catch-up growth, some weight-for-age catch-up but minimal height-for-age catch-up, comparedto sibling controls. ese observations are rare inthe SAM literature and therefore offer key lessonsfor policy makers and programme managers.
First is the need for more information onlonger term outcomes so as to assess the trueimpact of SAM on child mortality. In this particularsetting, routine reporting would have given afalsely optimistic impression of post-SAM mor-tality. Overall 427/1024 (42%) children died, but105 (25%) of these deaths occurred >90 daysaer their original admission. ey would havebeen missed by most nutrition programmeswhich only follow-up patients up to dischargefrom outpatient care. Other factors which canmislead routine reporting systems but which thestudy described, include defaulter follow-up soas to ascribe correct survival status and correctcapture of readmissions (of the 52 readmissions,17 (33%) died) – if not done, denominator pop-ulation is overestimated and % mortality thusunderestimated.
e second key lesson is that patient clinicalprofile needs to be better accounted for, bothwhen managing individual patients and whenjudging programme performance. Simple targets,such as SPHERE, cannot distinguish betweenpoorly performing programmes and those caringfor a clinically complex patient population whereunderlying factors are more significant than foodinsecurity. HIV infection was associated withmuch of the excess mortality and likely underes-timated; even higher mortality was noted amongchildren whose serostatus was unknown (too sickto test) but who were likely seropositive. Notablein FuSAM is the importance of underlying dis-ability. Underlying disability affected 6% of chil-dren and accounted for significant excess mor-tality – a likely underestimate given that the
study had no formal screening tool and thereforeidentified only the most obvious problems. Atpresent, few programmes actively look for dis-ability so this is a key area for future work.
e third message relates to stunting. Currenttreatments for SAM may not be sufficient to ad-dress stunting on their own. ere was limitedimprovement in survivors’ height-for-age whowere significantly stunted compared to siblingcontrols. is is even more notable given the sib-lings’ older median age: population prevalenceof stunting increases over the first two years oflife so that older cohorts might be expected to bemore rather than less stunted. Whilst weight-for-age had improved, it also remained low, sig-nificantly below siblings’. e marked improvementof weight-for-height z-scores though in one sensewelcome, likely reflects rapid weight gain combinedwith poor linear growth, a pattern which may beassociated with later obesity and chronic disease.is needs further study.
FuSAM compares favourably to the few otherstudies looking at longer term SAM outcomes.Most of these other studies, however, took placepre-HIV. FuSAM thus fills a key gap regardingHIV-era outcomes, especially in sub SaharanAfrica where the problem is greatest.
e authors acknowledge a number of po-tential limitations of the study. For example,FuSAM was conducted when CMAM was not aswidespread as it is today and was not available inBlantyre district where the work took place(though it did start shortly aer, in mid-2008).Even though some risk factors for mortality (e.g.HIV, disability) are likely to be found in both in-patient and community settings, care is neededbefore generalising these findings to CMAM pro-grammes. However, the results are consistentwith CMAM’s key principle that earlier treatmentis better to maximise survival.
Resource limitations meant that it was notpossible to follow-up regularly at fixed time-points aer programme discharge, but insteadrelied on a single long term FuSAM visit. It ispossible that some variables such as socioeconomicstatus or orphaning may have changed over timeand hence have been missed.
Much more awareness of longer term outcomesof SAM is needed, with attention on importantnon-mortality outcomes such as growth, devel-opment, co-morbidities and pre-determinants foreventual adult non-communicable disease. Pro-grammes should work more holistically, in closercollaboration with other child health services andform part of a seamless ‘continuum of care’. Urgentfuture work is needed to elaborate exactly whichinterventions are most effective and most cost-effective for children with disability (and likelyother) chronic underlying disease. Finally, theresults support calls for, and revitalisation of, earlyidentification and treatment of SAM in CMAMprogramming. Whilst other confirmatory researchis urgently needed, it is very plausible that earliertreatment of SAM would favourably affect stuntingand longer term post-SAM chronic disease –both key areas in current international malnutritionpolicy and programming.

. . . . . . . . . . . . . . . . . . . . . . . . . . . . . . . . . . . . . . . . . . . . . . . . . . . . . . . . . . . . . . . . . . . . . . . . . . . . . . . . . . . . . . . . . . . . . . . . . . . . . . . . . . . . . . . . . . . . . . . . . . . . . . . . . . . . . . .
. . . . . . . . . . . . . . . . . . . . . . . . . . . . . . . . . . . . . . . . . . . . . . . . . . . . . . . . . . . . . . . . . . . . . . . . . . . . . . . . . . . . . . . . . . . . . . . . . . . . . . . . . . . . . . . . . . . . . . . . . . . . . . . . . . . . . . .
1菀
Research
Who’s Listening?
Accountability to affected peoplein the Haiyan Response
Location: PhilippinesWhat we know already: Humanitarian agencies are investing more effort into accountability to affected people. Manychannels of communication are used. International and national agencies employ different approaches.
What this article adds: Qualitative research following the Typhoon Haiyan response explored affected peoples andagencies respective perspectives and experiences around accountability efforts. Substantive collective efforts were madeby agencies on AAP though there was limited engagement of government. Community consultations were commonbut tended to be ‘one way’ communication on programmes. Local people preferred face to face communication ratherthan technological approaches, e.g. hotlines or SMS, a reminder that dialogue and building relationships are at theheart of AAP. Beneficiary selection and providing critical feedback were both contrary to Filipino culture. Feedbackrarely changed agency strategic or programme direction, but instead triggered minor adjustments to programming.Most agencies had no dedicated funding for AAP; WVI was an exception and example of excellence.
Summary of case study report1
International humanitarian agencies investedmore effort and energy into being “ac-countable to affected people” (AAP) inthe Typhoon Haiyan response than ever
before. A recently published case study exploreshow affected people experienced these account-ability efforts, comparing their perspectives withthe perspectives of the agencies themselves, andinvestigates the organisational and systemic fac-tors that enabled some agencies to place AAPcentre stage in their programming, and that in-hibited others from doing so. e research wascarried out between November 2014 and February2015 using a range of predominantly qualitativeresearch methods. It is part of the Pamati Kitaproject, designed to promote a more collaborativeand collective approach to AAP in the Haiyanresponse.
As a middle-income country with one of thefastest-growing economies in Asia and a well-defined legal structure, the Philippines is a con-ducive context for promoting accountability andtransparency. One of the most disaster-pronecountries in the world, the government of thePhilippines has disaster risk reduction and re-sponse policies and structures in place, althoughthese were quickly overwhelmed by the scale ofthe Haiyan crisis. e United Nations (UN) de-clared it a Level 3 humanitarian response.
Most international agencies used a suite ofmechanisms as channels of communication withaffected people, including visits by agency staff,community consultations, suggestions and com-plaints boxes, help desks and hotlines. Technology
played an important role, especially for largeragencies, including the use of smart phones forsurveys for assessments, baselines and monitoring;computerised databases to record and analysefeedback; and technological links between hotlinesand databases. Most agencies developed theirown systems for categorising feedback (althoughthis lack of consistency hampered collectiveanalysis of feedback data), and recorded whetheraction was taken. For the larger agencies, thiswas a somewhat formalised system of AAP inwhich they struggled to capture and accommo-date less formalised forms of feedback fromface-to-face interactions - for example, dailycontact between staff and affected people - andfrom community consultations.
National non-governmental organisations(NGOs) had a different approach. ose thatwere local to the area and/or with local staff,with a community-development orientation, feltmore naturally in touch with the perspectivesof local people and therefore did not see theneed to set up dedicated AAP mechanisms, nordid they have the resources. But not all nationalNGOs fell into this category, and some spent somuch time on project delivery they had lesstime for community consultation. e more ac-tivist national NGOs tended to engage with theconcept of “accountability” as holding governmentto account.
ere were substantial efforts to promotecollective AAP in the Haiyan response. OCHAdeployed AAP and Communications with Com-munities (CWC) coordinators from the outset,
separate AAP and CWC Technical WorkingGroups were established (eventually merging)in five hubs, and a consortium of agencies –Plan International, International Organisationofr Migration (IOM), and World Vision Inter-national (WVI) – came together to establish acommon services project, Pamati Kita, fromJuly 2014.
Collaborative practices and common servicesestablished included community consultationscarried out by OCHA in the early responsephase, which provided feedback on the overallresponse, the introduction of Community Feed-back Forms to consolidate feedback from indi-vidual agencies, and multi-actor communityconsultations facilitated by the Pamati Kitaproject during the recovery phase.
Although WVI’s database shows that feedbackboxes, SMS hotlines, and help desks were themost widely used channels for affected peopleto feed back to the agency, consultations withlocal people show that they overwhelminglypreferred face-to-face communication, becauseof the human interaction and the opportunityfor dialogue. Community consultations couldbe effective ways to air concerns, but local peoplereported that they tended to be “one-way” asagencies used them to communicate programmedetails, such as beneficiary selection. Hotlineswere treated with scepticism because of the im-
1 Margie Buchanan-Smith, Jonathan Corpus Ong and Sarah Routley (2015). Who's listening – Accountability to affected people in the Haiyan Response. May 2015. Report publishedby Plan International, World Vision, IOM and UKAID.
anks to Margie Buchanan-Smith and Sarah Routley, researchers and co-authors (with JonathanCorpus Ong) of the original report, for sharing this work with ENN and reviewing this summary.

16
. . . . . . . . . . . . . . . . . . . . . . . . . . . . . . . . . . . . . . . . . . . . . . . . . . . . . . . . . . . . . . . . . . . . . . . . . . . . . . . . . . . . . . . . . . . . . . . . . . . . . . . . . . . . . . . . . . . . . . . . . . . . . . . . . . . . . . .
. . . . . . . . . . . . . . . . . . . . . . . . . . . . . . . . . . . . . . . . . . . . . . . . . . . . . . . . . . . . . . . . . . . . . . . . . . . . . . . . . . . . . . . . . . . . . . . . . . . . . . . . . . . . . . . . . . . . . . . . . . . . . . . . . . . . . . .
Researchpression that they did not generate meaningfulresponses and local people did not know whowas at the end of the hotline. Better use wasmade of SMS if the community already had arelationship with the agency.
Agencies had surprisingly little disaggregateddata on who was using which AAP mechanisms.According to the research, users of SMS channelswere mostly under 40 or 50 years old and female.Older people preferred direct contact. Despitesome AAP initiatives targeted at young people,this group generally participated little. Overall,the perspective of affected people is that agencieswere not as accessible as they may have believedthemselves to be. In terms of closing the feedbackloop, agencies gave greatest attention to individualredress, particularly through hotlines and SMS.Although this was generally a weak part of theAAP chain, there were some good practice ex-amples of agencies feeding back at communitylevel, for example to validate the findings ofcommunity consultations.
e major concern raised by affected peoplethrough these feedback mechanisms was bene-ficiary selection. ere was deep-rooted uneasewith the conventional humanitarian practice oftargeting according to need, which cut acrossFilipino culture where neighbours are regardedas extended family. Selective targeting triggeredsocial divisiveness within communities and adeep sense of shame amongst the excluded. Al-though agencies discussed these concerns earlyin the response, they did not change their tar-geting practices, apart from making minor ad-justments to beneficiary lists. As a result, somebarangay officials chose not to receive aid at all.
ere are a number of examples of how feed-back triggered minor changes in programming,but very few examples of substantial changes toprogramming or to strategic decision-making.ere are also cases of agencies not respondingto issues raised and not communicating withthose excluded from relief programming. Utangna loob, or debt of gratitude, is the key moralprinciple underpinning social relations in Filipinoculture, especially to those who provide helpbeyond normal expectations. Assistance frominternational agencies falls into this category,creating an immediate disincentive for localpeople to express criticism. is is compoundedby the patron-client culture in which humanitarianagencies are regarded as the patron in a highlyunequal power relationship. ere was also anunderlying fear that support might decrease ifcommunities complained. Overall, the relationshipbetween international humanitarian agenciesand affected communities was quite distant,characterised by a sense of ambivalence on thepart of the latter. While agency branding (espe-cially by international agencies) contributed tohigh levels of agency recognition by local people,they made a distinction between internationalagencies, which were seen as service providers,and some national agencies, which were seen asaccompanying communities on their journey.
How agencies engaged at the barangay levelwas a key determinant of how residents engaged
with their AAP efforts. Where agencies had aweak relationship with the community, the in-fluence of the barangay captain as “gatekeeper”was strongest; this could hinder feedback wherebarangay officials discouraged residents fromraising concerns, partly to “maintain face” tothe outsiders. Where agencies had a strong re-lationship with the community, they were morelikely to receive honest feedback. e barangaysthat expressed the most positive experiences ofthe relief process each had an internationalNGO embedded in the community, and thereforehad the deepest relationship. ese relationshipswere mostly created during the humanitarianresponse, not before, and positively impactedcontentious practices such as beneficiary selection,as well as accountability.
e international humanitarian response isbelieved to have “reactivated” barangay assem-blies. But the record of how international or-ganisations worked through national NGOs andtheir channels of communication with affectedcommunities is less impressive. While nationalNGOs were overwhelmed with the scale of theresponse, international agencies prioritised de-livery over partnership. ere was little govern-ment participation in agencies’ collective AAPefforts; ongoing agency collaboration was tooresource-intensive for limited government ca-pacity and there is little evidence that agenciestried to build on existing government channels.
Most agencies had little or no dedicatedfunding for AAP, which was usually locatedwithin their M&E (monitoring and evaluation)departments. WVI provided a model of excellencein the way it mainstreamed AAP organisationallyin its response to Typhoon Haiyan. ere werefive key inter-related factors. First, through earlydeployment (in the first week of the response)of an experienced and assertive accountabilityofficer, the mindset of AAP was established inthe programme from the outset and did nothave to compete for attention later on. Staff hadalso been trained in advance. Second, seniorprogramme managers were strongly committedto AAP, regarding it as a fundamental part ofhumanitarian programming. Under their lead-ership, AAP was built into management systemsand they modelled decision-making based oninformation and feedback from communities.ird, AAP was passionately championedthroughout the response, particularly by a seriesof dedicated AAP managers. Fourth, organisa-tional structures and processes to support AAPwere put in place, including a separate unit anddedicated staff for AAP. Fih, there were rein-forcing factors as WVI was recognised for thework it was doing in being accountable toaffected people and as staff connected with thisessence of humanitarian work. But this did not
Alex Jacobs, of Plan International, has been invited to be the 'focal point for accountabilityto affected populations and community engagement' for the secretariat of the WorldHumanitarian Summit. He will help shape analysis and recommendations in this area forthe summit. Working documents are also available at http://www.plan-international.org/aap. Please feel free to contact him [email protected] with any suggestions.
mean that WVI got it right on its own. Periodi-cally checking in with communities was essentialto get their perspective, to find out if the agencies’communication channels were working for themand to make adjustments accordingly. Otheragencies’ experience is a reminder that a rhetoricalcommitment to AAP, even at the most seniorlevels, means little if responsibility for AAP isnot clearly assigned and located in managementstructures. Ultimately, mainstreaming AAP re-quires will, resources and capacity to succeed.
In the Haiyan response, there is evidencethat upwards accountability to donors squeezedout downwards accountability to affected people,for example in the allocation of staff and resourcesto donor reporting as opposed to listening toaffected people. Although few interviewees feltthat donor requirements prevented them frommaking programme changes in response to feed-back from affected communities, the time ittook to secure such donor approval was itself adisincentive.
While AAP was given much greater attentionas an organisational and sector-wide priority inthe Haiyan response, there were limitations inthe way it was done. First, feedback tended tofocus on existing agency programmes: “are wedoing things right?”, rather than on bigger strate-gic issues: “are we doing the right things?”Second, local people’s preference for face-to-face communication highlights that dialogueand building relationships are at the heart ofAAP. is may require spending substantialtime at community level - a challenge for agencieswith large programmes early in the response -but actions like setting up help desks in earlydistributions can be a stepping stone in providingmuch-valued face-to-face contact. While tech-nology should be used to support interactionbetween local people and agency staff, it shouldnot become an end in itself. ird, while hu-manitarian agencies tend to see the aid transactionas between themselves as service providers andindividual vulnerable households, the Haiyanexperience demonstrates the relevance of thewider cultural and societal context. Fourth, thiscase study highlights the importance of workingthrough local government structures in an in-formed and nuanced way, alert to power dynamicsat local level.
e three main reports from this work are: Who’s Listening: A case study of accountabilityto affected people in the Haiyan responseWho’s Listening Briefing Paper: A short sum-mary of the full report, above.Obliged to be Grateful: How local communitiesexperienced humanitarian actors in theHaiyan response All are available at:http://www.plan-international.org/aap

17
. . . . . . . . . . . . . . . . . . . . . . . . . . . . . . . . . . . . . . . . . . . . . . . . . . . . . . . . . . . . . . . . . . . . . . . . . . . . . . . . . . . . . . . . . . . . . . . . . . . . . . . . . . . . . . . . . . . . . . . . . . . . . . . . . . . . . . .
. . . . . . . . . . . . . . . . . . . . . . . . . . . . . . . . . . . . . . . . . . . . . . . . . . . . . . . . . . . . . . . . . . . . . . . . . . . . . . . . . . . . . . . . . . . . . . . . . . . . . . . . . . . . . . . . . . . . . . . . . . . . . . . . . . . . . . .
ResearchRisk sharing and socialhierarchy in disaster aid
Location: FijiWhat we know already: To design effective participatory/decentralised disaster management,it is crucial to understand better community decision-making mechanisms. The process ofbenefit allocation within communities is poorly observed, particularly post-disaster. Socialhierarchy can shape political economy; dominant elite can drive aid allocation.
What this article adds: The role and interaction of informal risk-sharing institutions andsocial hierarchies were explored using post-disaster surveys in rural Fiji. Analysis foundevidence for weak targeting and elite domination for given damage. Patterns of targetingand elite domination varied over post-disaster phases, at different levels of allocation andacross different shocks. Implications for local disaster management in similar developingcountry contexts include: private risk-sharing mechanisms should be strengthened pre-disaster; collection of social status data adds value; and a better understanding of local aidallocation (e.g. through kinship) is crucial to ensure external accountability mechanismsdo not weaken local safety nets.
Summary of research1
Acommon notion is that communitiescan play an active role in identifyingvulnerabilities to natural disasters, mit-igating them and responding to them
in proactive ways, and thus communities need tobe given decision-making power. In order to designeffective participatory/decentralised disaster man-agement, it is crucial to understand better com-munity decision-making mechanisms. A recentlypublished paper explores a critical question aboutdisaster aid: once aid is allocated to a community,how are provisions allocated among householdswithin the community? is question has not beensufficiently answered, especially in developingcountries because of the paucity of household-level data on disaster damage and aid, with richvariations within communities. With such data,the extent to which targeting within the communityis effective can be directly measured by aid responseto damage in a regression model controlling forthe community-level aid supply.
e author’s original post-disaster surveys inrural Fiji collected such micro-level data2. Fiji’sdisaster management is strongly centralised; inparticular, communities do not participate in de-cisions about aid allocation across communities.Under the status quo, however, each communitycan influence how aid is allocated among its mem-bers, because local governments and aid agencies,with limited capacity for assessing household-leveldamage and implementing intra-community allo-cations, rely on community resources in practiceand they are linked with those who have powerwithin the communities.
e paper explores two community mechanisms:informal risk-sharing institutions and social hier-archies. First, extensive economic studies showthat with a lack of formal insurance, informal risksharing – reciprocal help based on implicit contracts– plays a central role as a safety net in poor popu-lations. Second, a social hierarchy can stronglyshape a community’s political economy, whichdetermines local benefit allocation as highlightedin community-based development. en, elitedomination can be a secondary driving force ofaid allocation. For given damage, elites are more
likely to be recipients or to receive a greater amountthan non-elites. is elite domination for givendamage determines the equity of aid allocation.e limited observability of the process of benefitallocation within communities, however, is a commonproblem in community-based programmes and isespecially serious in post-disaster contexts. epaper overcomes this challenge by exploiting directmeasures of social status. As the author’s surveystratified households in each village by their kingroup and elite status, direct measures of elite statusat the household and kin group levels with richvariations are available. With the author’s micro-level data of social status, elite domination for givendamage can be measured by aid response to socialstatus in a regression model controlling for house-hold-level damage and unobserved village hetero-geneity, such as the process of aid allocation.
Treating risk sharing and social hierarchy inde-pendently, the paper shows evidence for both seem-ingly weak targeting and elite domination for givendamage. Building on kinship, these two communitymechanisms are not independent of each other; inparticular, kin groups are a major village subgroupin both. e paper reveals that the interaction ofthe two mechanisms can lead to elite dominationin targeting on damage; aid allocation more stronglyresponds to elite’s damage than non-elites. eanalysis compares emergency food aid in the reliefand early recovery phases and housing aid in therecovery/reconstruction phase. It also comparestheir allocations within the kin group and acrosskin groups, as well as allocations of food aid onhousing and crop damage. As such, the paperdemonstrates how patterns of targeting and elitedomination vary over post-disaster phases, atdifferent levels of allocation and across differentshocks. Specifically, disaster victims are allocatedless food aid in the early post-disaster phase, mainlybecause they receive greater labour help for housingrehabilitation, especially within kin groups; in con-trast, the allocation of housing aid in the late phaseis strongly targeted on housing damage. ere wasalso evidence for potential elite capture; for givendamage, local elites dominate the allocation ofhousing aid but not food aid.
e paper’s framework and findings can applyto contexts where a natural disaster with moderateseverity does not undermine social systems (hier-archy) and the community’s risk sharing worksbetween disaster victims and non-victims. Suchnatural disasters are common across developingareas and effective management to cope with themin a self-reliant manner, e.g. through a communi-ty-based approach, is of great importance. Ifinstead, all or most community members sufferan unusual catastrophic hazard, such as the 2004Indian Ocean Tsunami, not only does the risk-sharing institution not work, thus making theissue of seemingly weak targeting irrelevant, butalso social systems per se can be damaged throughmassive casualties, evacuations and migrations.
ese results lead to the following implicationsfor local disaster management in developing coun-tries:i) For better allocation of disaster aid within
communities, private risk-sharing institu-tions should be maintained and strengthenedas a self-targeting mechanism. Participatory community-based disaster management needs to be integrated with broad, community- based development programmes (e.g. poverty alleviation).
ii) Although targeting aid on damage is criticallyimportant, the performance of overall risk sharing needs to be given direct attention. is is especially so in the early post-disaster phase when private risk sharing potentially makes up limited aid; however, information about it is lacking the most at that time. at is why strengthening local institutions beforethe event in a self-reliant manner is strongly demanded.
iii) In hierarchical developing societies, elites and/or elite groups can dominate intra-communityaid allocation not only for given damage, but also for targeting on damage throughout the post-disaster phases. More attention should be given to the political economy of local disaster management. Although its limited observability is a serious constraint, micro-level data of social status can help overcome this challenge.
iv) e coexistence of risk sharing and social hierarchy as allocation mechanisms poses a great challenge for policy makers, because theformer is oen built on the latter, especially through kinship. On one hand, interventions to neutralise elite capture (external accounta-bility mechanisms) may weaken local safety nets instead of strengthening them; on the other hand, when such interventions are weakor lacking, equity can be significantly under-mined. To balance this trade off, a better un-derstanding of the process of local aid alloca-tion under the status quo is crucial, as in localbenefit allocation of community-based pro-grammes in general.
1 Takasaki. Y (2014). How is disaster aid allocated within poor communities? Risk sharing and social hierarchy. Journal of International Development, vol 26, pp 1097-1114 (2014). DOI: 10.1002/jid.2985
2 On the 13th January 2003, Cyclone Ami swept over the northern and eastern regions of the Fiji islands. The author conducted two rounds of surveys; between August and November 2003 among 374 households in nine villages andbetween July and September 2005 among 906 households in 43 villages.

18
. . . . . . . . . . . . . . . . . . . . . . . . . . . . . . . . . . . . . . . . . . . . . . . . . . . . . . . . . . . . . . . . . . . . . . . . . . . . . . . . . . . . . . . . . . . . . . . . . . . . . . . . . . . . . . . . . . . . . . . . . . . . . . . . . . . . . . .
Research
Improving the assessmentand attribution of effectsof developmentassistance for health
Location: GlobalWhat we know already: It is difficult to relate Overseas Development Assistance forhealth (DAH) and health outcomes; there are multiple funding resources, thecontribution of health systems is typically underestimated and assumptions regardingthe impact of external donor investment are overgenerous. Channelling fundsthrough national delivery systems makes attribution to a specific funder difficult.
What this article adds: A set of agreements between donors on the principlesunderpinning assessment and reporting of the effect of DAH is suggested by theauthors of a recent review. There are a number of promising initiatives on impactassessment (NOINE, 3ie, UN interagency groups, HIAs IHP+) to draw upon.Approaches should respond to country needs with appraisal of potential biasedreporting; identify contextual factors affecting observed results; take into accountconfounding factors, such as economic growth or shocks; and adapt to differentsettings and needs. Lack of definition on what constitutes health systemsstrengthening activities and expenditures and methodological challenges reinforcesthe large knowledge gap in assessment of DAH effect.
Summary of research1
The authors of a recent paper in theLancet suggest a set of agreementsbetween donors on the principles un-derpinning assessment and reporting
of the effect of Overseas Development Assistancefor health (DAH). eir suggestion stems fromthe methodological challenges in establishing arelation between Overseas Development Assis-tance for health (DAH) and health outcomes.e validity of the results presented by majorfunding agencies has been questioned becauseof weaknesses in models used to estimate out-comes, inappropriate counterfactuals and over-generous assumptions of investment effects. At-tribution of health outcomes to external invest-ments by specific agencies has also proved to bechallenging because of the multiplicity of fundingsources. Furthermore, methods that attributehealth effects to single interventions or specificfunds do not reflect the vital contribution ofhealth systems to health outcomes.
Most donors have committed to aid effec-tiveness principles underpinned by the ParisDeclaration (2005) and the Accra Agenda forAction (2008), which stress national ownershipand leadership, as well as harmonisation andalignment by donor agencies to national systems.Increasingly DAH is channelled through nationaldelivery systems, making it difficult to attribute
results to a specific funder. Yet most donoragencies continue to report their results.
e most commonly used approaches toassess and report the effect of DAH on healthoutcomes are tracking of trends in mortality,morbidity and coverage indicators; and estimationof lives saved and deaths averted. Methodologicalchallenges include insufficient reliable data andpoor disaggregation by age, sex, socioeconomicgroups and geographical location. Assessmentof the health effect of health systems strengthening(HSS) interventions with use of these measuresis particularly challenging, because of the complexcausal pathways through which these interven-tions are likely to have an effect. Furthermore,gaps in tracking input (e.g. HSS expenditures)and output indicators (e.g. measures of serviceavailability, accessibility, and quality) limit theability of studies to fully describe the sequenceof inputs, activities, outputs and outcomesleading to an effect.
Donor agencies also use lives saved or deathsaverted metrics to quantify the effect of DAHtargeting disease-specific interventions, by com-parison of health outcomes aer the implemen-tation of an intervention with the outcomes insimilar geographical areas that did not receivethe intervention during the same period; with
outcomes in the same area(s) before the inter-vention was implemented; and with a hypotheticalcounterfactual scenario for the same area duringthe same period. Peer-reviewed models are usedto estimate outcomes with these measures onthe basis of estimated population coverage of in-terventions with well documented health outcomes.For example, the Global Fund has estimated livessaved by disease-specific interventions such asanti-retroviral therapy (ART) for AIDS and byinsecticide-treated nets that reduce mortality.
Six points of interaction of DAH with nationalhealth systems have been identified: governance,finance, health workforce, health informationsystems, supply management systems and deliveryof health services. However, there is no singleframework to classify these interactions and re-search has identified several challenges, e.g. in-sufficient data, including for contextual factorsthat might have affected health effects and boththe complexity of health system interventionsand of the causal pathways leading to health ef-fects.
Two main approaches used by donor agencieswhen attributing health effects to their fundingare determination of plausible counterfactualsand establishment of exclusive attribution. Whendetermining plausible counterfactuals, no inter-vention has frequently been used to attribute ahealth effect that could be linked to a specificsource of funding, but determination of counter-factuals has been challenging, especially since anideal control group was difficult to identify. eresult attributed to a funder is sometimes assumedto be a proportion commensurate with the donoragency’s contribution to the overall investmentfor the intervention or country in question,although funding is oen pooled at country level.
Promising initiatives on impact assessment ere is as yet no consensus between key stake-holders on the strategies to improve and har-monise measurement approaches, but they couldbenefit from refinement and wider applicationof several promising approaches used by donorsoutlined below.1 Ataya. N et al (2014). Improving the assessment andattribution of effects of development assistance for health.www.thelancet.com, vol 384, pp 2256-2259, Dec 20/27, 2014
. . . . . . . . . . . . . . . . . . . . . . . . . . . . . . . . . . . . . . . . . . . . . . . . . . . . . . . . . . . . . . . . . . . . . . . . . . . . . . . .

19
. . . . . . . . . . . . . . . . . . . . . . . . . . . . . . . . . . . . . . . . . . . . . . . . . . . . . . . . . . . . . . . . . . . . . . . . . . . . . . . . . . . . . . . . . . . . . . . . . . . . . . . . . . . . . . . . . . . . . . . . . . . . . . . . . . . . . . .
. . . . . . . . . . . . . . . . . . . . . . . . . . . . . . . . . . . . . . . . . . . . . . . . . . . . .
ResearchBeyond health, the Network of Networks for
Impact Evaluation (NONIE) and the InternationalInitiative for Impact Evaluation (3ie) supportthe use of study designs that enable analysis ofinterventions across the whole causal chain,from input to effects, and advocate the use ofmixed methods for impact assessment to providea more complete picture of effect.
In an attempt to strengthen country moni-toring and evaluation platforms, the UN inter-agency groups (e.g. UN Evaluation Group, In-ter-agency Group for Child Mortality Estimation,and Maternal Mortality Estimate Inter-agencyGroup) aim to develop new indicators, enhancecapacity at country level to improve monitoringsystems and strengthen data use, and harmonisework across partners on assessment and reportingof progress towards the Millennium DevelopmentGoals (MDGs).
Additionally, the Development Impact Eval-uation Initiative by the World Bank providestechnical assistance to projects and partnersthroughout the project cycle to ensure high-quality monitoring and effect evaluation.
One proposed approach, Health Impact Ac-counts (HIAs), aims to identify crucial valuechains (such as infrastructure, transportation,procurement systems, etc) required for effectiveimplementation of interventions (whether dis-ease-specific or HSS interventions ) at country-level, and then apportions credit for effect to allinvestors, according to their relative contributionto different components of the value chain.
Recent efforts, including those by InternationalHealth Partnership Plus (IHP+), have tried toimprove and harmonise approaches used bydonor agencies and partner countries to assessthe effectiveness of DAH to reduce demands onweak health systems for donor-specific infor-mation; strengthen transparency and enhancecomparability across different donor agencies;show the contribution of health systems to im-provement of health; increase the efficiency ofresource use; and provide reliable estimates ofbenefits of DAH. IHP+ encourages the docu-mentation of results and of health aid effectivenessthrough in-depth individual country case studies.It also advocates joint annual reviews of countryhealth strategies, including monitoring, evalua-
tion, and review mechanisms, based on countrymonitoring platforms. However, the extent towhich the IHP+ support to improved monitoringof national health strategies produces improvedoutput information that could serve as a basisfor further health impact assessment remainsto be established. Joint annual reviews by severaldonors would improve harmonisation and mutualaccountability by aligning donor assessmentand reporting with national assessment and re-porting mechanisms, thereby avoiding paralleldonor-specific systems.
Proposed agreements betweendonors A set of agreements between donors on theprinciples underpinning assessment and reportingof the effect of DAH are suggested:
First, approaches to assessment and reportingshould mainly respond to country needs (in-cluding national governments and end benefi-ciaries) and emphasise mutual accountability.Country-owned monitoring and evaluation plat-forms need to be strengthened by external anddomestic investments, and include robust addi-tional studies. For example, a national evaluationplatform that uses the district as the unit ofdesign for natural, quasi-experimental or ex-perimental studies and is based on continuousmonitoring of core indicators can provide a rig-orous comparison of effectiveness of interventionsand different scale-up approaches.
Strengthening of monitoring and evaluationplatforms should include a careful appraisal ofpotential incentives towards biased reporting,which exist in the relationship between partnercountries and donors, especially in performanceoriented initiatives such as GAVI’s (vaccine al-liance) immunisation services support. Suchperverse incentives might affect the accuracy ofthe data used to assess the effect of DAH, whichin turn misinforms donors and their constituen-cies about their progress and might counteractefforts to strengthen country monitoring andevaluation platforms. Validated and standardisedinstruments and sampling frames, establishingsystems for quality control and periodic surveyson a range of health topics that benchmarkcountry-reported data, could help to addressbiases arising from perverse incentives.
Second, approaches to assess and report thehealth effects of DAH should identify the con-textual factors both within and outside the healthsystem that contribute to the observed resultsand might affect their wider applicability.
ird, there should be greater consistencyand transparency in the selection of counterfactualscenarios, taking into account potential con-founding by factors such as economic growthor conversely, economic shocks that can affectthe determinants of health.
Fourth, approaches to assess and report thehealth effects of DAH should be adapted todifferent settings and needs. ey should drawon a range of methods and designs dependenton what inference is likely to be made fromthem. ey should be tested in both stable andfragile states, with coordinated approaches tomonitoring sector performance that foster coun-try ownership and reduce uncoordinated multipledonor programmes.
Substantial knowledge gaps in assessment ofthe effect of DAH exist, especially for investmentsin health systems. ese knowledge gaps areaccentuated by the absence of consensus aboutthe definition of what constitutes HSS activitiesand expenditures. Methodological challengesinclude double counting, underestimation ofthe contribution of health systems to healtheffect, and overlooking of system-wide effectsof DAH. ese challenges could underminepublic confidence in the fidelity of the figurespresented on the effectiveness of DAH. Exclusivelyattributing effect to disease-specific interventionssupported by donor agencies could lead to chan-nelling of greater financial support to disease-focused interventions than to HSS interventions,which could be particularly damaging in viewof the plateauing in DAH since 2010. Somestudies have suggested that disease-specific in-terventions have potential adverse effects onthe health system, e.g. distorting national healthpriorities and diverting health workers fromother responsibilities. However, there is paucityof empirical evidence to conclude convincinglywhether the effects of disease-specific interven-tions on health systems have been negative orpositive. Rigorous methods are needed to assesswhether negative system-wide effects of DAH,including the potential skewing of expenditure(fungibility) are a substantial problem. Donoragencies need to develop their own skills andcompetencies and work with the research com-munity further to address the methodologicalchallenges inherent in assessment approaches.
Improved measurement, enhanced compa-rability across different agencies and strengthenedtransparency in assessment of the effect of DAHshould give credence to the results reported byfunding agencies. To advance this agenda andappraise these new approaches in more depth iscrucial, in view of the large amounts of fundsspent, the growing recognition of the importanceof HSS interventions to achieve global healthgoals and the political pressures on aid budgetsat a time of economic austerity.
Justine Greening (UK InternationalDevelopment Secretary at the time)and The UK Prince of Wales at a WFPsupermarket in the Zaatari refugeecamp, Jordan. This visit marked the
announcement of a further £100million of assistance by the UK
government for the Syrian crisis.
WFP
/Joe
lle E
id

菀0
. . . . . . . . . . . . . . . . . . . . . . . . . . . . . . . . . . . . . . . . . . . . . . . . . . . . . . . . . . . . . . . . . . . . . . . . . . . . . . . . . . . . . . . . . . . . . . . . . . . . . . . . . . . . . . . . . . . . . . . . . . . . . . . . . . . . . . .
. . . . . . . . . . . . . . . . . . . . . . . . . . . . . . . . . . . . . . . . . . . . . . . . . . . . . . . . . . . . . . . . . . . . . . . . . . . . . . . . . . . . . . . . . . . . . . . . . . . . . . . . . . . . . . . . . . . . . . . . . . . . . . . . . . . . . . .
Research
Interactions between nutrition andimmune function:
using inflammation biomarkers tointerpret micronutrient status
Location: GlobalWhat we know already: Both clinical and sub-clinical inflammation affects theplasma concentration of many nutrients. This complicates assessment of nutritionalstatus and interpretation of nutrition intervention impact, particularly in those whoare apparently well but at risk of or recovering from infection.
What this article adds: A review used two acute phase proteins (CRP and AGP) todetermine the presence of inflammation and assist interpretation of plasma retinol,ferritin and zinc concentrations in healthy HIV+ Kenyan adults. Iron deficiencywas significantly under-estimated in uncorrected data; serum zinc concentrationsonly increased in response to supplementation in people without inflammation.The authors recommend that CRP and AGP measurement should accompanymicronutrient status measurement in apparently healthy subjects and thatcorrection factors should be applied in interpreting their data.
Summary of research1
The immune response promotes acomplex series of reactions by thehost in an effort to prevent ongoingtissue damage, isolate and destroy
the infective organism and activate the repairprocesses that are necessary for restoring normalfunction. e process is known as inflammationand the early set of reactions that are inducedare known as the acute phase response (APR).e APR has marked effects on the circulation,liver metabolism and the plasma concentrationof many nutrients. e changes in nutrientconcentrations follow a cyclic pattern; theyoccur before any clinical evidence of disease,being at their most pronounced during thedisease, and remain in convalescence when allevidence of disease or trauma has disappeared.erefore, where susceptibility to disease ishigh as in people who are HIV + but still ap-parently healthy, obtaining an accurate meas-urement of nutritional status may not bepossible.
Accurate measurements of nutritional statusare important for national statistics to plan forthe proper utilisation of government resourcesand they are especially important to evaluatethe effectiveness of nutritional interventions.Many acute phase proteins (APP) are synthesised
during inflammation and they are used tomonitor the progress of disease and recoverybut individually, none of their lifecycles comparewell with those of the nutritional biomarkers.Nevertheless, recognising the presence of in-flammation can help interpret data. A recentreview paper illustrates methods developedusing two APPs to assist interpretation ofplasma retinol, ferritin and zinc concentrationsin apparently healthy, HIV + Kenyan adults.
In essence, the review found that the use oftwo APPs, C-reactive protein (CRP) and al-pha(1)-acid glycoprotein (AGP), to identifysubjects with inflammation enabled the re-searchers to show that iron deficiency was sig-nificantly under-estimated in uncorrected dataand that the presence or absence of inflammationdetermined whether absorbed iron was storedas ferritin or utilised for haemoglobin (Hb)synthesis, respectively. In the case of zinc sup-plementation, serum zinc concentrations onlyincreased in response to the supplement inpeople without inflammation. In the case ofplasma retinol (used to measure vitamin Astatus), there was a large fall (up to 40% inwomen who had undergone uncomplicatedorthopaedic surgery). Inflammation can bepresent in many apparently healthy infants and
children in developing countries which canlead to an overestimate of vitamin A deficiency.All the results illustrate that where sub-clinicalinflammation is present, it should be identifiedto evaluate correctly nutritional status and in-terpret the effects of intervention.
In conclusion, the authors suggest that allworkers measuring micronutrient status in ap-parently healthy subjects should measure thetwo proteins CRP and AGP and apply correctionfactors in interpreting their data. Even if thecorrection factors cannot be calculated, e.g. ifthere were insufficient people in the referencegroup, or the corrections fail to influence theirdata because of small sample sizes, examiningsubjects with inflammation separately fromthose without can reveal some interestingdifferences in the way micronutrient statussometimes responds in people with and withoutinflammation.
1 Thurnham. D (2014). Interactions between nutrition and immune function: using inflammation biomarkers to interpretmicronutrient status. Proceedings of the Nutrition Society (2014), vol 73, pp1-8. Doi:10.1017/S0029665113003662

菀1
. . . . . . . . . . . . . . . . . . . . . . . . . . . . . . . . . . . . . . . . . . . . . . . . . . . . . . . . . . . . . . . . . . . . . . . . . . . . . . . . . . . . . . . . . . . . . . . . . . . . . . . . . . . . . . . . . . . . . . . . . . . . . . . . . . . . . . .
. . . . . . . . . . . . . . . . . . . . . . . . . . . . . . . . . . . . . . . . . . . . . . . . . . . . . . . . . . . . . . . . . . . . . . . . . . . . . . . . . . . . . . . . . . . . . . . . . . . . . . . . . . . . . . . . . . . . . . . . . . . . . . . . . . . . . . .
Research
Effect of Asianpopulation-specificBMI cut-off valueson malnutritiondouble burdenestimates
Location: IndiaWhat we know already: India is a rapidly developing economy with huge socio-economic anddemographic heterogeneity and co-existence of under- and over-nutrition is one of theconsequences. Asians have higher body fat at lower BMI than Caucasians. South Asians inparticular have increased risk of morbidities associated with overweight and obesity areapparently well but at risk of or recovering from infection.
What this article adds: A recent analysis assesses the gravity of the double burden ofmalnutrition across 21 states of India, through a comparative analysis of traditional and Asianpopulation-specific BMI categorisations for overweight and obesity. Analysis was based on dataon ever-married women (15–49 years) from the NFHS-2 and NFHS-3. This found that Indianwomen err toward high BMI resulting in a co-existence of under- and overweight populations,which portrays a regional pattern. With Asian population-specific cut-offs, 11 states can beclassified as “double burden states”; following traditional categorisation, only four states facesuch dual pressure. Inequality plays a crucial role in determining the paradoxical existence ofunder- and over-nutrition in India.
Summary of research1
India, a rapidly developing economy, ischaracterised by huge socioeconomic anddemographic heterogeneity across its states.ese states may, therefore, face different
policy challenges in understanding the anthro-pometric status of its population. A recentlypublished article aims to understand the mag-nitude of the double burden of malnutritionacross major states in India, in terms of BodyMass Index (BMI)2. However, studies comparingbody fat and BMI have documented that Asianshave higher body fat at lower BMI comparedto Caucasians and that this difference can partlybe attributed to body stature and composition.Researchers have suggested lower BMI cut-offpoints would be appropriate for Asians, sincerisks of cardiovascular diseases and diabeteshave been found to be higher among Asiansthan other ethnic groups at a BMI value whichis lower than the conventional overweight cut-off point3. Also, compared to other Asian eth-nicities, South Asians have showed an increased
risk of morbidities associated with overweightand obesity regardless of the BMI standardused. According to the recommendations madeby WHO in 2004, additional BMI trigger pointsof 23 and 27.5 have been identified for publichealth action, to identify the increased risk andhigher risk respectively for overweight and obe-sity, particularly for an Asian continuum startingfrom 16 up to the BMI category of 40, whiletraditional BMI cut-off points should be retainedas the international classification.
Data for a recently published study weredrawn from the National Family Health Survey– NFHS-2 and NFHS-3, conducted 1998-1999and 2005-6, respectively. Both surveys covereda sample representative of 99% of the Indianpopulation. NFHS-2 collected information from91,196 households and interviewed 89,199 ever-married women aged 15-49 years from 25 outof 26 states. NFHS-3 included 124,385 womenaged 15-49 years (including never-married
women) and 74,369 men aged 15-54 years from29 states. A total of 515,507 individuals whostayed in the household the night before the in-terview were enumerated from the NFHS-3sample households. As NFHS-2 collected in-formation from ever-married women aged 15-49 years, whereas NFHS-3 incorporated allwomen aged 15-49 years in the survey, onlyever-married women were considered in thisstudy.
Random sampling techniques were adoptedin both rounds for the NFHS. e urban and
1 Sengupta. A et al (2014). State-wise dynamics of the double burden of malnutrition among 15-49 year-old women in India: how much does the scenario change considering Asian population-specific BMI cut-off values? Ecology of Food and Nutrition, vol 53, pp 618-638. DOI 10.1080/03670244.2014.891994
2 BMI for a person is defined as their body mass divided by thesquare of their height, with the value universally being given in units of kg/m2
3 Coventional BMI cut-offs are BMI 25-29.9 categorised asoverweight, and BMI 30 or higher considered obese.
M K
erac
, Mal
awi

菀菀
. . . . . . . . . . . . . . . . . . . . . . . . . . . . . . . . . . . . . . . . . . . . . . . . . . . . . . . . . . . . . . . . . . . . . . . . . . . . . . . . . . . . . . . . . . . . . . . . . . . . . . . . . . . . . . . . . . . . . . . . . . . . . . . . . . . . . . .
. . . . . . . . . . . . . . . . . . . . . . . . . . . . . . . . . . . . . . . . . . . . . . . . . . . . . . . . . . . . . . . . . . . . . . . . . . . . . . . . . . . . . . . . . . . . . . . . . . . . . . . . . . . . . . . . . . . . . . . . . . . . . . . . . . . . . . .
Researchrural samples within each state were drawn sep-arately and were allocated proportionally to thesize of the state’s urban and rural populations.In each state, the rural sample was selected intwo stages, with the selection of villages at thefirst stage, followed by the random selection ofhouseholds. In urban areas, a three-stage proce-dure was followed. In the first stage, wards wereselected with probability proportion to size (PPS)sampling, followed by random selection of censusenumeration block and households.
NFHS provides information on various de-mographic and health indicators along withthe nutritional profile. e nutritional status ofadults is measured using BMI. In order to un-derstand the dual burden of malnutritionin India, in addition to the traditionalcut-off points, the study also followedthe WHO 2004 expert committee forthe new BMI classification for the Asianpopulation; where a BMI of between 23and 27.4 is classified as overweight anda BMI of more than or equal to 27.5 isconsidered as obese. e focus of the ar-ticle is only upon the major states ofIndia, so the manifestation of dual burdenof malnutrition has been depicted for 18states from NFHS-2 and 21 states fromNFHS-3 through a comparative analysisbetween the traditional and Asian pop-ulation-specific cut-off points. e au-thors defined a state as a ‘double burdenof malnutrition state’ when it had at leasta 20% prevalence of both underweightand overweight in adult women.
With Asian population-specific cut-offs, 11 states can be classified as “doubleburden states”; following traditional cat-egorisation, only four states are classifiedas such. According to surveys by the Na-tional Nutrition Monitoring Board(NNMB) conducted in rural areas ofnine Indian states, the proportion ofboth men and women with a BMI below18.5 has come down by 41% and 31%respectively over the period of 1975-2005. Even with this reduction, one-thirdof men and 36% of women in India stillsuffered from chronic energy deficiencyin 2005. is study analysing data fromNFHS-3 shows that still almost one out of threeever-married Indian women aged 15-49 yearsis underweight. In 16 out of 21 major states,still at least 25% of women are found to be un-derweight during the survey; the figures havegone up in three states.
e prevalence rates of overweight andobesity found in NFHS-3 using the conventionaldefinition does not seem to be as significant asunderweight. Although two data points are notenough to make a solid projection, assumingthe established rate of changes in the nutritionaldynamics during 1999-2006 will prevail overthe coming years, there should be 29% of ever-married women aged 15-49 years underweight,while the prevalence of overweight and obesity
(BMI <25), still had abdominal obesity. Amongthe Northern Indian population, the conventionalcut-off level of the BMI underestimates over-weight and obesity when percentage of bodyfat is used as the standard to define overweight.e cardiovascular risk was also found to beconsiderably higher among the Asian Indianswith BMI values less than 25; for them, over-weight cut-off points should follow WHO rec-ommendations. e study findings using therevised cut-off points show that a massivegrowth rate for higher BMI values juxtapose arapidly increasing threat of chronic diseases,while diseases associated with chronic energydeficiency are still highly prevalent in India.is dual burden of diseases is already evident
in South Asia while India hosts thelargest number of diabetic patients.
Macro-economic data show that thestates which are having a high prevalenceof overweight demonstrate much lowerpoverty levels and higher Gender De-velopment Index ranks. In contrast, cen-tral and eastern Indian states, whereproportions of chronic energy deficiencyare very high among adult women, arecharacterised with high prevalence ofpoverty and weak socioeconomic statusof women. e states that are in socio-economic transition show a tendencyfor double burden of malnutrition. In-equality plays a crucial role in determiningthe paradoxical existence of under- andover-nutrition in India. India is currentlyexperiencing the second phase of nutri-tion transition. Globalisation and foreigndirect investment into food processing,services and retail has played an importantrole in developing demand for highlyprocessed foods. e need for India tofocus attention (both research and policy)on both the problems of under- andover-nutrition simultaneously, to avoidserious public health concerns, has clearlybeen manifested through the results ofthis analysis.
ere are a number of limitations ofthis study. Use of BMI to measure over-weight and obesity among Asians hasremained under question. It fails to
differentiate between fat and fat-free mass andhence is unsuitable to gauge coronary risk. Ithas been found that the prevalence of obesity-associated morbidities is higher among indi-viduals with short stature, and in that case,lowering BMI threshold points for overweightand obesity may not resolve the problem.
Secondly, this study only analyses informationon ever-married women in their reproductiveages and therefore doesn’t provide a compre-hensive picture of the nutrition pattern amongIndian women. Moreover, as the study depictsthat urban women and women aged 30-49 yearsare at risk for both under- and over-weightproblems, more in-depth analyses are requiredon both these fronts.
Following Asian population-specific classi-fication, there are now eight states where theproportion of overweight exceeds the proportionof underweight people. In fact in 2005-6, inDelhi, Punjab, and Kerala, the prevalence ofoverweight among adult women has been nearlyfive times higher than their underweight coun-terpart, with almost half of the ever-marriedwomen aged 15-49 years being overweight. eresults suggest that more Indian states are aboutto go through this transition very soon.
Studies on Indians showed that even at mod-erately increased BMI levels, they are exposedto higher risk of abnormalities related to over-weight or obesity, i.e. one study found that 20%of Indians who were not overweight or obese
will be 21.1% and 10.5% respectively using theAsian population specific cut-off in the year2013. is means that 61% of the referencegroup suffers some form of malnutrition andthe proportion of overweight exceeds that ofunderweight among women. Again, using theAsian population-specific cut-off point valuesfor overweight and obesity, a geographicalpattern emerges. Except Punjab, Delhi andKerala where overweight is the main concern,the entire northern, western and southern beltof India is facing the simultaneous risk fromunder- and over-nutrition. At the same time,all the Central and Eastern states, which arevery poor, are still struggling with very highrates of underweight amongst women.
WFP
/Rei
n Sk
ulle
rud,
Indi
a, 2
004

菀菀
. . . . . . . . . . . . . . . . . . . . . . . . . . . . . . . . . . . . . . . . . . . . . . . . . . . . . . . . . . . . . . . . . . . . . . . . . . . . . . . . . . . . . . . . . . . . . . . . . . . . . . . . . . . . . . . . . . . . . . . . . . . . . . . . . . . . . . .
Research
Determinants of household vulnerabilityto food insecurity in Malawi
Location: MalawiWhat we know already: Subsistence farming households are vulnerable tofood insecurity.
What this article adds: A household level study examined food insecurityand largely agricultural determinants in two semi-arid districts in Malawi.Maize was used as a proxy for measuring household vulnerability. The maindeterminants of household vulnerability to food insecurity were income,household size, land size, access to on-farm employment, climate informationand modern agricultural technologies. Female-headed households were morevulnerable. Household income plays a major role in food security. Policyinterventions are needed regarding women’s access to and control of land;diversification of livelihoods; communication on climate change andproduction technologies; and adaptive support to low income households.
Summary of research1
Arecent study examined householdvulnerability to food insecurity andits determinants in two semi-ariddistricts in Malawi. e study was
conducted in two Extension Planning Areas(EPAs), Mitole and Manjawira, located inChikhwawa and Ntcheu districts respectively.e districts are semi-arid, characterised byvariable and erratic rainfall patterns, dry spells,floods and droughts. e main food crop grownin the areas is maize; however, other crops suchas millet, sorghum, rice, sweet potatoes, Irishpotatoes and beans are also grown. e popula-tion in the two areas is composed of smallholdersubsistence farmers who mainly depend onrain-fed agriculture for their livelihoods.
A multistage sampling technique was em-ployed to select 100 households from each EPA,making a total of 200 households. Householdinterviews were conducted to collect cross-sec-tional data from February to March 2010, usinga pretested structured questionnaire. Data col-lected included maize harvests and purchases,land size, household size and composition, in-come, access to resources and the characteristicsof the household head.
Maize was used as a proxy for measuringhousehold vulnerability to food insecurity becauseover 90% of the rural population depends on it.It was measured in terms of total maize available(own harvest plus purchases) per adult equivalent.e study considered adults as persons olderthan the age of 16 years. Children aged 16 yearsand under were weighted as half an adult. Esti-mates show that adults require 270 kg of maize
per year and children about 135 kg. Maize con-tributes roughly 55% of total caloric intake.erefore, per capita consumption requirementis estimated at 126 kg of maize per adult peryear. All children in a household were convertedto adult equivalents and this factor was used incalculating household vulnerability to food in-security. e household vulnerability to foodinsecurity measure was calculated by dividingtotal maize available (maize harvested plus maizepurchased) by the number of adult equivalentsmultiplied by 126 kg.
A simultaneous equation model was used toassess the determinants of household vulnerabilityto food insecurity. Most of the explanatory vari-ables are agriculture related. Household vul-nerability to food insecurity was conceptualisedas the relationship between the amount of maizeavailable (from own farm production and pur-chases) and household and farm characteristics,income, and on-farm and off-farm employment.Land size cultivated and education were presumedendogenous because they are influenced byother factors such as income and householdsize, which are also explanatory variables in themodel.
e analysis of the study data found that themain determinants of household vulnerability tofood insecurity were income, household size,land size, access to on-farm employment, climateinformation and modern agricultural technologies.e results are consistent with previous findingsand the direct relationship between land size andfood security is consistent with previous studies.Furthermore, female-headed households were
found more likely to be vulnerable to food inse-curity because of poor access or control over re-sources such as land, climate information, tech-nologies and income, which are the main deter-minants of household vulnerability in the studyarea. ese findings may result from cultural be-liefs, whereby access to resources for food pro-duction such as land and inputs is low amongwomen in developing countries. erefore, policyinterventions that enable women to gain controland access over land and those that promoteaccess to climate information and technologieson improving production are likely to have morecommunity benefits than those that focus onmen.
e findings also show that household incomeplays a major role in food availability at thehousehold level. Households that do not producefood because of climate factors can still achievefood security through purchases. e resultsimply that agricultural policy should considerfactors related to food production and householdincome to achieve household food security. Incase of crop failure because of climate and otherfactors, households can still achieve food securitythrough purchases if they have sustainable sourcesof income. Hence, policy intervention shouldpromote diversification of livelihoods. Alternativesources of livelihood, such as small and mediumscale businesses, may assist households to becomefood secure. Furthermore, agricultural policiesthat support low income households to adaptthrough the provision of farm inputs and creditfacilities are crucial in achieving household foodsecurity. Moreover, policy interventions are re-quired to promote the adoption of modern agri-cultural technologies and to improve the dis-semination of climate information among therural households, especially those that are affectedby climate variability. Interventions should alsofocus on localising the collection and recordingof climate factors in rural areas. is can becarried out through capacity building in collectingand recording climate factors using locally availablematerials to ensure that data on climate areavailable at local level to improve future predictionof climate and weather forecasts. In line withthis, strong social networks among communitiesmay provide a platform for introducing inter-ventions and new policies.
1 Kakota T et al (2015). Determinants of household vulnerability to food insecurity: A case study of semi-arid districts in Malawi. Journal of International Development. vol 27, pp 73-84. DOI: 10.1002/jid.2958
A food market in Malawi
M K
erac
, Mal
awi

菀菀
. . . . . . . . . . . . . . . . . . . . . . . . . . . . . . . . . . . . . . . . . . . . . . . . . . . . . . . . . . . . . . . . . . . . . . . . . . . . . . . . . . . . . . . . . . . . . . . . . . . . . . . . . . . . . . . . . . . . . . . . . . . . . . . . . . . . . . .
. . . . . . . . . . . . . . . . . . . . . . . . . . . . . . . . . . . . . . . . . . . . . . . . . . . . . . . . . . . . . . . . . . . . . . . . . . . . . . . . . . . . . . . . . . . . . . . . . . . . . . . . . . . . . . . . . . . . . . . . . . . . . . . . . . . . . . .
Research
MothersUnderstandAnd Can do it(MUAC)
Location: NigerWhat we know already: Community based management of SAM often relies on anthropometricscreening by Community Health Workers. Training includes measurement of mid-point of theupper, left (non-dominant) arm.
What this article adds: In a rural setting in Niger familiar with MUAC screening, mothers givenminimal training adequately performed and interpreted MUAC on their own young children.Results were comparable with Community Health Workers' results. Further findings suggest that thechoice of arm and exact location of the tape on the upper arm are not important for screeningchildren; it is likely the choice of arm remains relevant when measuring adolescents and adults.Frequent screening by mothers would allow early diagnosis and treatment of SAM in their children.
Summary of research1
Community based management of se-vere acute malnutrition (SAM) oenrelies on Community Health Workers(CHW), who may be unpaid volun-
teers, to conduct the anthropometric measure-ments of children being screened and treatedfor SAM. Currently this requires training, stan-dardisation testing, and follow-up; motivationand retention of these staff may also be prob-lematic. In training to perform a mid upperarm circumference (MUAC) measurement, aCHW must learn to use the le arm and tomeasure and mark the mid-point of the upperarm, between shoulder tip and elbow.
e hypothesis of a recently published studyis that mothers with minimal training can measureMUAC to classify the nutritional state of theirchildren. e study hypothesis was tested in twovillages in rural Niger. e rationale for teachingmothers to perform MUAC is to achieve an earlydiagnosis of SAM, which if acted upon in a timelymanner, would decrease mortality and morbidityrelated to malnutrition, reduce programme costsdue to shorter treatment times and lower theproportion of children requiring expensive in-patient care for SAM with complications. Ifmothers are able to screen their own children formalnutrition using MUAC, this may have impli-cations for scaling up community based manage-ment of acute malnutrition (CMAM).
e study was performed between September2011 and April 2012 in the community meeting
places in two villages in Mirriah, a rural districtin the Zinder region in southern Niger. erewere 54 mothers, each with one of their childrenin the first village (Magema) and 49 mothers,each with one of their children in the secondvillage (Berberkia). It was conducted by the Al-liance of International Medical Action (ALIMA)and its local non-governmental organisation(NGO) partner BEFEN (Bien Etre de la Femmeet de l’Enfant). UNICEF colour-coded and num-bered MUAC tapes, calibrated in 1 mm grada-tions, were used for all phases of the study.
e manager of the CHW employed by BE-FEN, who is well known in both villages, explainedthe purpose of the study to the village chiefs,elders and leaders. In each case, an independentscribe was used, recording the consent and thecolour class determined by the mother, and alsonoting the MUAC value in millimetres.
e planned study method had involvedgoing from home to home, and performing afive minute training session for each mother.However, this proved impossible. In both villages,once the objective of showing mothers how toperform MUAC classifications had been explainedto the village chief and other leaders, it wasconsidered to be so important that they insistedon calling an immediate meeting of the villagers.Mothers and children formed a seated grouparound the investigators, circled by the oldergirls who stood to obtain a good view, with themen and boys standing behind. Each mother
did one MUAC measurement on the le arm,followed directly by one MUAC measurementon the right arm of their child. e mothercalled out the colour classification (e.g. “Red”)and this was noted down by the investigator.is was then repeated by an experienced CHWtesting the right and then the le arm of eachchild, having measured the midpoint accordingto current recommendations. All the mothersin both villages wished to participate, howeveronly one child from each mother was acceptedinto the study. Any child identified with SAMwas referred to the local CMAM programme(which was run by BEFEN).
In the statistical analysis, cross-tabulationswere used to investigate the agreement betweenmothers’ results and the CHW reference measure.e Weighted Kappa was used as a numericsummary of inter-rater agreement between tworaters or methods, beyond that which would beexpected by chance. Kappa is a measure ofagreement, standardised along a -1 to 1 scale,where positive numbers indicate agreement,with 1 being perfect agreement; negative numbersindicate disagreement, with minus one beingtotal disagreement; and zero indicating agreementexpected by chance.
1 Blackwell N et al (2015). Mothers understand and can do it: a comparison of mothers and community health workers determining mid-upper arm circumference in 102 children aged from 6 months to 5 years. Archives of Public Health. http://www.archpublichealth.com/content/73/1/26
A mother measures MUAC of her child
EU/E
CHO
/Ano
uk D
elaf
ortr
ie, N
iger
, 201
4
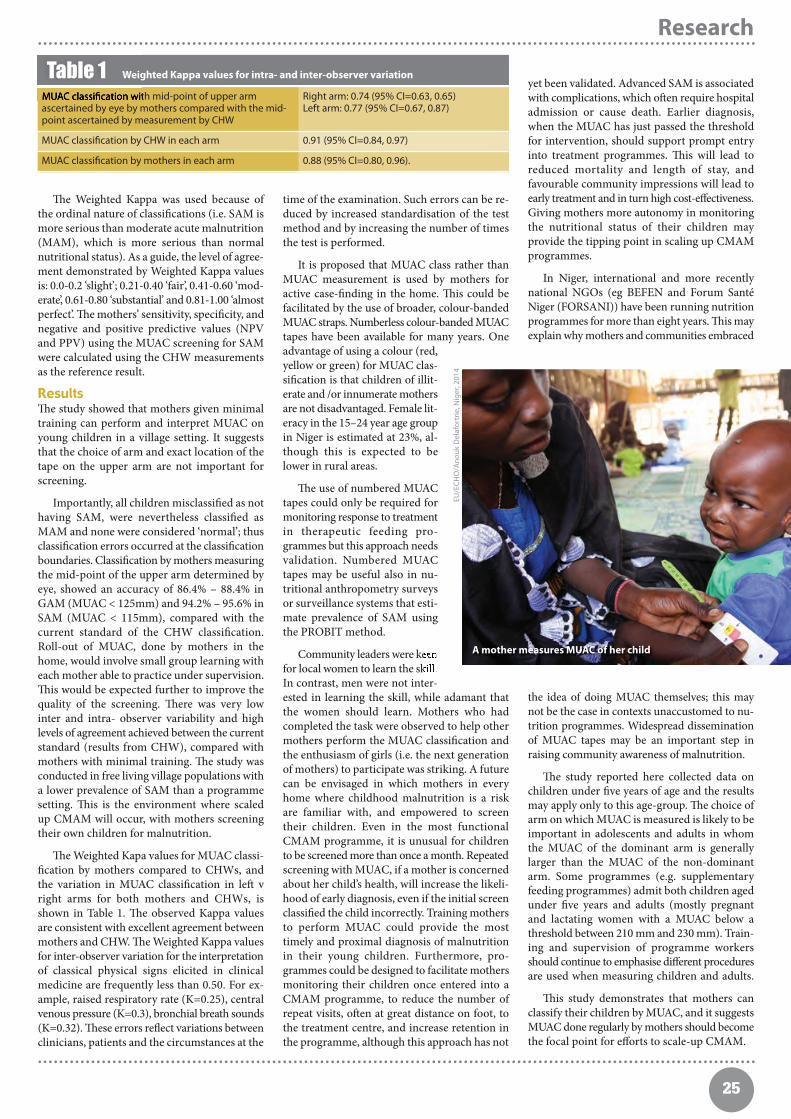
菀菀
. . . . . . . . . . . . . . . . . . . . . . . . . . . . . . . . . . . . . . . . . . . . . . . . . . . . . . . . . . . . . . . . . . . . . . . . . . . . . . . . . . . . . . . . . . . . . . . . . . . . . . . . . . . . . . . . . . . . . . . . . . . . . . . . . . . . . . .
. . . . . . . . . . . . . . . . . . . . . . . . . . . . . . . . . . . . . . . . . . . . . . . . . . . . . . . . . . . . . . . . . . . . . . . . . . . . . . . . . . . . . . . . . . . . . . . . . . . . . . . . . . . . . . . . . . . . . . . . . . . . . . . . . . . . . . .
Research
MUAC classification with mid-point of upper armascertained by eye by mothers compared with the mid-point ascertained by measurement by CHW
Right arm: 0.74 (95% CI=0.63, 0.65)Left arm: 0.77 (95% CI=0.67, 0.87)
MUAC classification by CHW in each arm 0.91 (95% CI=0.84, 0.97)
MUAC classification by mothers in each arm 0.88 (95% CI=0.80, 0.96).
Table 1 Weighted Kappa values for intra- and inter-observer variation
e Weighted Kappa was used because ofthe ordinal nature of classifications (i.e. SAM ismore serious than moderate acute malnutrition(MAM), which is more serious than normalnutritional status). As a guide, the level of agree-ment demonstrated by Weighted Kappa valuesis: 0.0-0.2 ‘slight’; 0.21-0.40 ‘fair’, 0.41-0.60 ‘mod-erate’, 0.61-0.80 ‘substantial’ and 0.81-1.00 ‘almostperfect’. e mothers’ sensitivity, specificity, andnegative and positive predictive values (NPVand PPV) using the MUAC screening for SAMwere calculated using the CHW measurementsas the reference result.
Results
e study showed that mothers given minimaltraining can perform and interpret MUAC onyoung children in a village setting. It suggeststhat the choice of arm and exact location of thetape on the upper arm are not important forscreening.
Importantly, all children misclassified as nothaving SAM, were nevertheless classified asMAM and none were considered ‘normal’; thusclassification errors occurred at the classificationboundaries. Classification by mothers measuringthe mid-point of the upper arm determined byeye, showed an accuracy of 86.4% – 88.4% inGAM (MUAC < 125mm) and 94.2% – 95.6% inSAM (MUAC < 115mm), compared with thecurrent standard of the CHW classification.Roll-out of MUAC, done by mothers in thehome, would involve small group learning witheach mother able to practice under supervision.is would be expected further to improve thequality of the screening. ere was very lowinter and intra- observer variability and highlevels of agreement achieved between the currentstandard (results from CHW), compared withmothers with minimal training. e study wasconducted in free living village populations witha lower prevalence of SAM than a programmesetting. is is the environment where scaledup CMAM will occur, with mothers screeningtheir own children for malnutrition.
e Weighted Kapa values for MUAC classi-fication by mothers compared to CHWs, andthe variation in MUAC classification in le vright arms for both mothers and CHWs, isshown in Table 1. e observed Kappa valuesare consistent with excellent agreement betweenmothers and CHW. e Weighted Kappa valuesfor inter-observer variation for the interpretationof classical physical signs elicited in clinicalmedicine are frequently less than 0.50. For ex-ample, raised respiratory rate (K=0.25), centralvenous pressure (K=0.3), bronchial breath sounds(K=0.32). ese errors reflect variations betweenclinicians, patients and the circumstances at the
time of the examination. Such errors can be re-duced by increased standardisation of the testmethod and by increasing the number of timesthe test is performed.
It is proposed that MUAC class rather thanMUAC measurement is used by mothers foractive case-finding in the home. is could befacilitated by the use of broader, colour-bandedMUAC straps. Numberless colour-banded MUACtapes have been available for many years. Oneadvantage of using a colour (red,yellow or green) for MUAC clas-sification is that children of illit-erate and /or innumerate mothersare not disadvantaged. Female lit-eracy in the 15–24 year age groupin Niger is estimated at 23%, al-though this is expected to belower in rural areas.
e use of numbered MUACtapes could only be required formonitoring response to treatmentin therapeutic feeding pro-grammes but this approach needsvalidation. Numbered MUACtapes may be useful also in nu-tritional anthropometry surveysor surveillance systems that esti-mate prevalence of SAM usingthe PROBIT method.
Community leaders were keenfor local women to learn the skill.In contrast, men were not inter-ested in learning the skill, while adamant thatthe women should learn. Mothers who hadcompleted the task were observed to help othermothers perform the MUAC classification andthe enthusiasm of girls (i.e. the next generationof mothers) to participate was striking. A futurecan be envisaged in which mothers in everyhome where childhood malnutrition is a riskare familiar with, and empowered to screentheir children. Even in the most functionalCMAM programme, it is unusual for childrento be screened more than once a month. Repeatedscreening with MUAC, if a mother is concernedabout her child’s health, will increase the likeli-hood of early diagnosis, even if the initial screenclassified the child incorrectly. Training mothersto perform MUAC could provide the mosttimely and proximal diagnosis of malnutritionin their young children. Furthermore, pro-grammes could be designed to facilitate mothersmonitoring their children once entered into aCMAM programme, to reduce the number ofrepeat visits, oen at great distance on foot, tothe treatment centre, and increase retention inthe programme, although this approach has not
yet been validated. Advanced SAM is associatedwith complications, which oen require hospitaladmission or cause death. Earlier diagnosis,when the MUAC has just passed the thresholdfor intervention, should support prompt entryinto treatment programmes. is will lead toreduced mortality and length of stay, andfavourable community impressions will lead toearly treatment and in turn high cost-effectiveness.Giving mothers more autonomy in monitoringthe nutritional status of their children mayprovide the tipping point in scaling up CMAMprogrammes.
In Niger, international and more recentlynational NGOs (eg BEFEN and Forum SantéNiger (FORSANI)) have been running nutritionprogrammes for more than eight years. is mayexplain why mothers and communities embraced
the idea of doing MUAC themselves; this maynot be the case in contexts unaccustomed to nu-trition programmes. Widespread disseminationof MUAC tapes may be an important step inraising community awareness of malnutrition.
e study reported here collected data onchildren under five years of age and the resultsmay apply only to this age-group. e choice ofarm on which MUAC is measured is likely to beimportant in adolescents and adults in whomthe MUAC of the dominant arm is generallylarger than the MUAC of the non-dominantarm. Some programmes (e.g. supplementaryfeeding programmes) admit both children agedunder five years and adults (mostly pregnantand lactating women with a MUAC below athreshold between 210 mm and 230 mm). Train-ing and supervision of programme workersshould continue to emphasise different proceduresare used when measuring children and adults.
is study demonstrates that mothers canclassify their children by MUAC, and it suggestsMUAC done regularly by mothers should becomethe focal point for efforts to scale-up CMAM.
A mother measures MUAC of her child
EU/E
CHO
/Ano
uk D
elaf
ortr
ie, N
iger
, 201
4

菀6
. . . . . . . . . . . . . . . . . . . . . . . . . . . . . . . . . . . . . . . . . . . . . . . . . . . . . . . . . . . . . . . . . . . . . . . . . . . . . . . . . . . . . . . . . . . . . . . . . . . . . . . . . . . . . . . . . . . . . . . . . . . . . . . . . . . . . . .
. . . . . . . . . . . . . . . . . . . . . . . . . . . . . . . . . . . . . . . . . . . . . . . . . . . . . . . . . . . . . . . . . . . . . . . . . . . . . . . . . . . . . . . . . . . . . . . . . . . . . . . . . . . . . . . . . . . . . . . . . . . . . . . . . . . . . . .
Research
Health-seeking behaviour and communityperceptions of childhood undernutrition and acommunity management of acute malnutrition(CMAM) programme in rural Bihar, India
Location: IndiaWhat we know already: The caseload of severe acute malnutrition in India is significant. Accessto treatment is challenging in rural settings; default rates to inpatient and community basedtreatment options are often high. Community perceptions of undernutrition and treatment canimpact on health seeking behaviour.
What this article adds: In 2010, MSF undertook a qualitative study in rural India to understandthe community perceptions of undernutrition and an existing CMAM programme and howthese affected health-seeking behaviour. Health-seeking behaviour was influenced by social andcultural, logistical and economic factors. The findings did not differ between households withor without malnourished children and did not appear to be age specific. Undernutrition wasattributed to a number of local disease concepts, such as ‘mamarcha’ (moderate acutemalnutrition), ‘jallachatu’ (severe acute malnutrition), and the ‘evil eye’. Families favour boysover girls, especially when resources are limited. Mothers lacked decision-making power.Interventions should raise understanding and awareness of undernutrition and treatment in away that empowers mothers; respond to and respect traditions, religion and customs; engagewith the broader community; and consider language skills and dialect in communication.
Summary of research1
In 2006, the National Family Health Sur-vey-3 estimated that in India, eight millionchildren younger than 5 years suffer fromsevere acute malnutrition (SAM). As in
many resource-poor settings, the provision ofhealth care in rural India is oen challenged bya shortage of health centres and health workers.
Aer a nutritional survey demonstrated a4.8% prevalence of SAM in Darbhanga districtin 2008, under a Memorandum of Understandingwith the district authorities, Médecins SansFrontières (MSF) established a communitybased management of severe malnutrition pro-gramme in Biraul block. Biraul block has apopulation of 300,000 and is one of eighteenadministrative areas within Darbhanga district.Although widely practised outside India, com-munity based management of acute malnutrition(CMAM) is a relatively new concept in India,where management of SAM is mostly in-patientbased. In the MSF supported programme, SAMcases (6m -5 years) are identified using midupper arm circumference (MUAC). Treatmentinvolves maternal counselling on the conditionand treatment; initial standardised systemictreatment for infection and vitamin deficiency;and weight-based weekly provision of an Indi-
an-produced, pre-packaged, WHO standardF100-equivalent oil-based paste with health re-view. e average length of treatment is sevenweeks.
e CMAM programme in Biraul block in-volves five therapeutic feeding centres treatingambulatory ‘uncomplicated’ SAM children andone in-patient stabilisation centre treating themore unwell ‘complicated’ SAM children whorequire in-patient care. In four years, the pro-gramme has admitted over 10,000 children,with just over half the children travelling fortreatment from outside the block. However, re-peated semi-quantitative evaluation of accessand coverage (SQUEAC) surveys suggested thatthere were many more children with SAMwithin the block not accessing treatment. Ad-ditionally, the programme struggled with defaultrates as high as 38%, particularly in those care-givers who were commuting from outside theblock. Data from other facility-based nutritionalprogrammes across India suggest that defaultingis an issue in other states, reaching 47·2 % inin-patient only nutritional rehabilitation centresin Uttar Pradesh.
In order to help identify the underlyingcauses of poor coverage and default, in 2010,
MSF undertook a qualitative study in Biraulblock to understand the community perceptionsof undernutrition and the CMAM programmeand how these affected health-seeking behaviour.e objective was to develop evidence thatwould be used to adapt the CMAM programmein order to improve outcomes and develop amore appropriate health promotion strategyfor the community.
MethodOver a five week period, qualitative semi-struc-tured interviews using a topic guide andnarrative interviews were conducted with families(mothers, fathers and mothers-in-law) of childrentreated for severe malnutrition (approximatelytwo-thirds of family interviewees), families con-taining children without severe malnutrition(one-third of family interviewees) and healthcareworkers (traditional healers, Hindu and Muslimpriests, traditional health practitioners, midwives,hospital nurses, health educators and doctors).Approximately 150 people participated in the
1 Burtscher.D and Burza. S (2015). Health-seeking behaviour and community perceptions of childhood undernutrition anda community management of acute malnutrition (CMAM)programme in rural Bihar, India: a qualitative study. Public Health and Nutrition. doi:10.1017/S1368980015000440
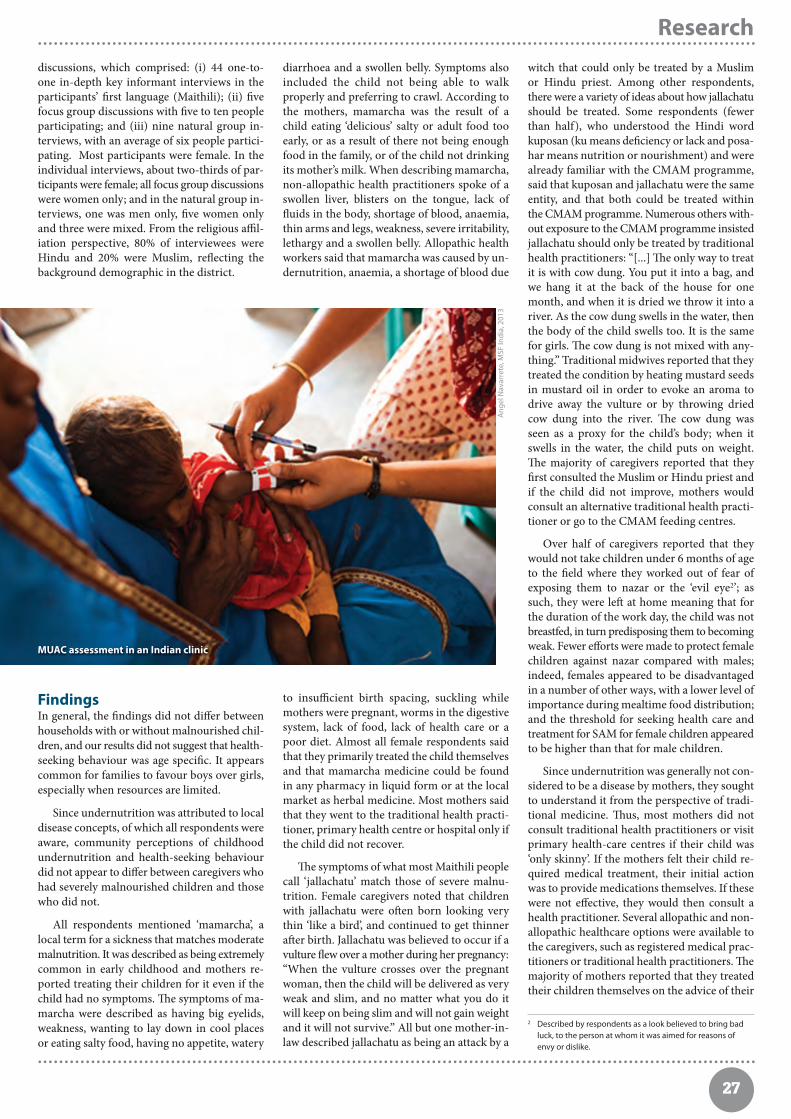
菀7
. . . . . . . . . . . . . . . . . . . . . . . . . . . . . . . . . . . . . . . . . . . . . . . . . . . . . . . . . . . . . . . . . . . . . . . . . . . . . . . . . . . . . . . . . . . . . . . . . . . . . . . . . . . . . . . . . . . . . . . . . . . . . . . . . . . . . . .
. . . . . . . . . . . . . . . . . . . . . . . . . . . . . . . . . . . . . . . . . . . . . . . . . . . . . . . . . . . . . . . . . . . . . . . . . . . . . . . . . . . . . . . . . . . . . . . . . . . . . . . . . . . . . . . . . . . . . . . . . . . . . . . . . . . . . . .
Researchdiscussions, which comprised: (i) 44 one-to-one in-depth key informant interviews in theparticipants’ first language (Maithili); (ii) fivefocus group discussions with five to ten peopleparticipating; and (iii) nine natural group in-terviews, with an average of six people partici-pating. Most participants were female. In theindividual interviews, about two-thirds of par-ticipants were female; all focus group discussionswere women only; and in the natural group in-terviews, one was men only, five women onlyand three were mixed. From the religious affil-iation perspective, 80% of interviewees wereHindu and 20% were Muslim, reflecting thebackground demographic in the district.
diarrhoea and a swollen belly. Symptoms alsoincluded the child not being able to walkproperly and preferring to crawl. According tothe mothers, mamarcha was the result of achild eating ‘delicious’ salty or adult food tooearly, or as a result of there not being enoughfood in the family, or of the child not drinkingits mother’s milk. When describing mamarcha,non-allopathic health practitioners spoke of aswollen liver, blisters on the tongue, lack offluids in the body, shortage of blood, anaemia,thin arms and legs, weakness, severe irritability,lethargy and a swollen belly. Allopathic healthworkers said that mamarcha was caused by un-dernutrition, anaemia, a shortage of blood due
witch that could only be treated by a Muslimor Hindu priest. Among other respondents,there were a variety of ideas about how jallachatushould be treated. Some respondents (fewerthan half), who understood the Hindi wordkuposan (ku means deficiency or lack and posa-har means nutrition or nourishment) and werealready familiar with the CMAM programme,said that kuposan and jallachatu were the sameentity, and that both could be treated withinthe CMAM programme. Numerous others with-out exposure to the CMAM programme insistedjallachatu should only be treated by traditionalhealth practitioners: “[...] e only way to treatit is with cow dung. You put it into a bag, andwe hang it at the back of the house for onemonth, and when it is dried we throw it into ariver. As the cow dung swells in the water, thenthe body of the child swells too. It is the samefor girls. e cow dung is not mixed with any-thing.” Traditional midwives reported that theytreated the condition by heating mustard seedsin mustard oil in order to evoke an aroma todrive away the vulture or by throwing driedcow dung into the river. e cow dung wasseen as a proxy for the child’s body; when itswells in the water, the child puts on weight.e majority of caregivers reported that theyfirst consulted the Muslim or Hindu priest andif the child did not improve, mothers wouldconsult an alternative traditional health practi-tioner or go to the CMAM feeding centres.
Over half of caregivers reported that theywould not take children under 6 months of ageto the field where they worked out of fear ofexposing them to nazar or the ‘evil eye2’; assuch, they were le at home meaning that forthe duration of the work day, the child was notbreastfed, in turn predisposing them to becomingweak. Fewer efforts were made to protect femalechildren against nazar compared with males;indeed, females appeared to be disadvantagedin a number of other ways, with a lower level ofimportance during mealtime food distribution;and the threshold for seeking health care andtreatment for SAM for female children appearedto be higher than that for male children.
Since undernutrition was generally not con-sidered to be a disease by mothers, they soughtto understand it from the perspective of tradi-tional medicine. us, most mothers did notconsult traditional health practitioners or visitprimary health-care centres if their child was‘only skinny’. If the mothers felt their child re-quired medical treatment, their initial actionwas to provide medications themselves. If thesewere not effective, they would then consult ahealth practitioner. Several allopathic and non-allopathic healthcare options were available tothe caregivers, such as registered medical prac-titioners or traditional health practitioners. emajority of mothers reported that they treatedtheir children themselves on the advice of their
2 Described by respondents as a look believed to bring bad luck, to the person at whom it was aimed for reasons of envy or dislike.
FindingsIn general, the findings did not differ betweenhouseholds with or without malnourished chil-dren, and our results did not suggest that health-seeking behaviour was age specific. It appearscommon for families to favour boys over girls,especially when resources are limited.
Since undernutrition was attributed to localdisease concepts, of which all respondents wereaware, community perceptions of childhoodundernutrition and health-seeking behaviourdid not appear to differ between caregivers whohad severely malnourished children and thosewho did not.
All respondents mentioned ‘mamarcha’, alocal term for a sickness that matches moderatemalnutrition. It was described as being extremelycommon in early childhood and mothers re-ported treating their children for it even if thechild had no symptoms. e symptoms of ma-marcha were described as having big eyelids,weakness, wanting to lay down in cool placesor eating salty food, having no appetite, watery
to insufficient birth spacing, suckling whilemothers were pregnant, worms in the digestivesystem, lack of food, lack of health care or apoor diet. Almost all female respondents saidthat they primarily treated the child themselvesand that mamarcha medicine could be foundin any pharmacy in liquid form or at the localmarket as herbal medicine. Most mothers saidthat they went to the traditional health practi-tioner, primary health centre or hospital only ifthe child did not recover.
e symptoms of what most Maithili peoplecall ‘jallachatu’ match those of severe malnu-trition. Female caregivers noted that childrenwith jallachatu were oen born looking verythin ‘like a bird’, and continued to get thinneraer birth. Jallachatu was believed to occur if avulture flew over a mother during her pregnancy:“When the vulture crosses over the pregnantwoman, then the child will be delivered as veryweak and slim, and no matter what you do itwill keep on being slim and will not gain weightand it will not survive.” All but one mother-in-law described jallachatu as being an attack by a
MUAC assessment in an Indian clinic
Ang
el N
avar
rete
, MSF
Indi
a, 2
013

菀8
. . . . . . . . . . . . . . . . . . . . . . . . . . . . . . . . . . . . . . . . . . . . . . . . . . . . . . . . . . . . . . . . . . . . . . . . . . . . . . . . . . . . . . . . . . . . . . . . . . . . . . . . . . . . . . . . . . . . . . . . . . . . . . . . . . . . . . .
. . . . . . . . . . . . . . . . . . . . . . . . . . . . . . . . . . . . . . . . . . . . . . . . . . . . . . . . . . . . . . . . . . . . . . . . . . . . . . . . . . . . . . . . . . . . . . . . . . . . . . . . . . . . . . . . . . . . . . . . . . . . . . . . . . . . . . .
Researchin-laws or other elders before consulting ahealthcare provider, or through purchasingmedicine recommended by local shopkeepers,whose opinion was generally accepted.
Most respondents considered the CMAMprogramme to be functioning within the gov-ernment allopathic healthcare system. Allopathichealth care included certified doctors and nursesand most respondents held them in high esteem,but reported that they were also expensive andthe quality of care not always consistent. Gov-ernment primary health centres were most oenlocated in bigger communities and oen at adistance from villages. Most respondents stressedthat even though drugs were supposed to befree of charge at primary health centres, theywere generally of poor quality and sometimesunavailable. If drugs were unavailable, respon-dents said the doctor would then prescribe med-ication privately, for which they had to pay.
Respondents described a wide spectrum oftraditional birth attendants (dais), priests, witchdoctors, tent doctors, local drug mixers (vaidhs),healers and Godmen as traditional health prac-titioners. ey lived within the community andwere usually the first to be consulted. ere ap-peared to be a strong feeling of trust towardstraditional healers and respondents reportedtaking their advice seriously. A common themewas that these individuals shared the same cul-tural values and were able to communicatemore freely with them than allopathic health-care providers. In particular, respondents fromlower castes and with low literacy stated thatthese practitioners were their first port of callwhen their children were ill. According to themajority of the respondents, the advantage ofthese healers was their low cost compared with‘private doctors’ or primary health centres.
Several factors significantly affected thehealth-seeking behaviour of the community inBiraul with regard to their utilisation of theCMAM programme. ese factors can be cate-gorised as: (i) social and cultural (perceptionof the problem by the patient and others aroundher/him); (ii) logistical (existing transport, avail-ability and proximity of medical care); and (iii)economic (transport costs, wage loss, affordabilityof health care and acceptance of costs). Otherimportant factors included the previous expe-riences of the caregivers and their perceptionand understanding of how prescribed medicineswork on the body.
e majority of women interviewed appearedto lack decision-making autonomy and reportedthat it was necessary for them to ask theirmothers-in-law or other senior, female familymembers for advice on what to do with a sickchild. Figures of lay authority, such as villageelders, appeared to play a major role in the di-agnosis and treatment of illness. An additionalfactor mentioned by the majority of respondentsinfluencing health-seeking behaviour was tem-porary migration. ey explained that roughlytwice per year, women took their children to
their home villages to stay for a month at atime. During these periods, they were unableto attend their local health centres, leading todifficulty in completing longer treatments suchas CMAM. Finally, the cultural practice ofmothers remaining strictly within the housefollowing the birth of a child was widely men-tioned as a reason for difficulty in attendingthe CMAM programme if another child wasenrolled.
e availability of medical care played animportant role in the caregivers’ decision-making process. Modern healthcare facilities,such as the block-level primary health centres,were considered to be located only in morepopulous areas and respondents emphasisedthat no appropriate health facility was availableat the village level. Caregivers living furtheraway from CMAM facilities reported that itwas difficult for them to reach the therapeuticfeeding centres, especially during heavy rainswhen transport is challenging due to frequentflooding. In contrast, every village was reportedto have a traditional health practitioner and/ora Muslim or Hindu priest. Even if most of therespondents did not necessarily consider thesehealth-care providers to be ideal, they felt thatthey were sometimes their only option.
Mothers stressed the fact that in addition tocaring for their sick child, they had to take careof housework, work in the fields (especiallyaround planting or harvest times) and lookaer their other children. For caregivers com-muting from outside the block in particular,visits oen took an entire day since travellingcould entail a 4 hour round trip in addition tothe 2–3 h waiting time at the therapeutic feedingcentre. Hence other family members had toshoulder an extra burden of work and thuswould not always encourage mothers to visitthe CMAM programme.
e choice of whether to access care waslinked more to the perception of the diseaseand hence the importance of how much moneyand time should be spent on the treatment andwithin which sector. Most of the caregiverscomplained that they could not afford the trans-port costs to come each week for treatment inthe CMAM programme.
Based on the responses of mothers whosechildren had been treated within the programme,the overall perception of CMAM was positive.Weight gain was seen as a measure of successand the positive perception of the service wasexpressed by mothers, family members andcommunity participants who were aware of theprogramme. e concept of baby ‘strength’rather than size was important; a healthy childwas a ‘strong ‘ one, However, a significantnumber of caregivers said that they did notconsider the peanut oil-based treatment offeredto their children as effective enough and con-sequently would frequently think about stoppingthe treatment. e caregivers wanted to seeimmediate results when their child started any
treatment, so many were discouraged when thechild did not rapidly gain weight.
RecommendationsAs a result of this study MSF provide a numberof suggestions to target undernutrition and thebeliefs surrounding undernutrition that shouldbe incorporated into CMAM programming.
Primary interventions should focus on thedissemination of basic information about un-dernutrition and on clarification of miscon-ceptions. e aim should be to raise under-standing and awareness of severe malnutritionas a disease, while empowering mothers todecide whether they want to seek treatment fortheir child or not. Longer term, secondary in-terventions should address behaviour change,taking into account the socio-economic, religious,cultural and political consequences of changesin the perception of undernutrition and theadaptation of health seeking behaviour of care-givers. Above all, active engagement and col-laboration with communities is essential inorder to address the barriers to enable changein such societies.
e success or failure of health programmesultimately rests on how well they adapt to thelocal population. A fundamental focus of thetraining of health personnel should be the im-portance of being responsive and respectful tothe traditions, religion and customs in the en-vironment they are or will work in. Languageis also important in the delivery of messages tothe community. In countries with many dialects,it is important that local language skills areconsidered in communication strategies. Forexample, the staff within the CMAM programmeroutinely used the Hindi word kuposan toexplain undernutrition. Yet, many of the re-spondents did not understand this; it is an eliteHindi word that is rarely used in these com-munities. Hindi is widely spoken in northernIndia, however, the standard of Hindi used maysometimes not be appropriate for the local con-text. In addition to using local language, diseasecan be understood through the use of localconcepts. Expressions such as mamarcha andjallachatu can be used by health workers in theBiraul area to explain undernutrition to com-munities who would normally not think interms of allopathic medicine.
Caregivers oen do not make decisionsalone; frequently, family elders decide whethera mother may seek and receive treatment forher child. erefore, it seems imperative thatinformation, education and communicationprogrammes target communities broadly, in-cluding educators, youth and decision-makinggroups, and in particular those whose opinionsare respected and considered most importantin the social structure. Crucially, communityengagement programmes must include bothpriests and healers, who could assist in encour-aging appropriate referrals into the CMAMprogramme.

菀9
. . . . . . . . . . . . . . . . . . . . . . . . . . . . . . . . . . . . . . . . . . . . . . . . . . . . . . . . . . . . . . . . . . . . . . . . . . . . . . . . . . . . . . . . . . . . . . . . . . . . . . . . . . . . . . . . . . . . . . . . . . . . . . . . . . . . . . .Research
. . . . . . . . . . . . . . . . . . . . . . . . . . . . . . . . . . . . . . . . . . . . . . . . . . . . . . . . . . . . . . . . . . . . . . . . . . . . . . . . . . . . . . . . . . . . . . . . . . . . . . . . . . . . . . . . . . . . . . . . . . . . . . . . . . . . . . .
Location: GlobalWhat we know already: RUTF is as effective as F100 in treating SAM, whereweight gain is the recovery outcome. Food supplements for moderatemalnutrition treatment, including adapting standard RUTF, are being explored.The prevalent number of children with MAM is (under) estimated at 32.8million, nearly double that of SAM; this has significant cost implications fortheir treatment.
What this article adds: Standard RUTF formulation has limitations with regardto vitamin and mineral levels and bioavailability, protein quality, amino acidprofiles, phytate levels, anti-nutrients and cost. Different RUTF formulationsmight benefit vitamin and mineral status; functional and growth outcomes; andimpact stunting in treated children but have not been explored. Cheaperingredients may compromise RUTF effectiveness. To optimise RUTFformulation for both SAM and MAM treatment, priority research includesprecise assessment of ‘normal’ food consumption during rehabilitation,investigation of processing options to improve product nutritional quality, andassessment of vitamin and mineral status of children post treatment.
The physiology of weight gain is not fun-damentally different in children withmoderate acute malnutrition (MAM);standard RUTF could be used in theory
and has been used to treat successfully largenumbers of children with MAM. Standard RUTF,however, was designed to be given as the only foodthat a child consumes while being treated for SAM.is approach may not be appropriate and in prac-tice, in children with MAM, unless the householdis severely food insecure. When special nutritiousfoods are required for treating children with MAM,cost considerations usually prohibit the use of stan-dard RUTF; globally there are about 32.8 millionchildren with MAM, compared with about 18.7million with SAM2. So there is a need to adapt theRUTF formulation to lower its cost by using lessexpensive ingredients. Using locally available in-gredients is another important factor to consider;they are not always less expensive but may havepolitical and other local benefits.
When trying to adapt the current RUTF for-mulation further for children with MAM, twoimportant aspects of RUTF development shouldbe taken into account. First, the current RUTF
formulation has not been fully optimised andmay need improvement. Second, cost reductionby using less expensive ingredients may lead toless effective formulations, for reasons that arenot fully understood. e goal of a recently pub-lished paper is to highlight the questions remainingin RUTF development and research, which mayalso be relevant for development of effectivefoods for children with MAM.
RUTF developmente first RUTF (Plumpy’Nut®) was formulatedby replacing about half of the dried skimmedmilk in F-100 formula with peanut paste. e re-sulting food paste did not require the addition ofwater, eliminating bacterial proliferation risk.Whey powder was included to achieve an equiv-alent level of lactose to F-100; similarly mal-todextrins (used to reduce osmolarity) were alsoadded. is approach had aimed to closely re-produce the existing reference diet, to minimisethe risk of not obtaining similar programmeresults. is proved successful, as clinical trialsshowed that this RUTF formula was at least aseffective in promoting weight gain as the existingF-100 diet. However, this approach has its limi-
tations. First, weight gain is not the best criterionto assess recovery. Evaluation of the efficacy ofRUTF according to other criteria, including func-tional outcomes, is needed. Second, it assumesthat F-100 is a gold standard. F-100, however,was formally tested in only a small number ofchildren in one setting, and it is possible that itscontent of some nutrients is not optimal to reversestunting, which is oen associated with wasting.
F-100 was designed to be consumed as theonly food during the nutrition rehabilitation phase;therefore, its mineral and vitamin contents wereadjusted to take into account pre-existing defi-ciencies, rapid growth requirements, and to coverrequirements of a child consuming 150 to 200kcal/kg/day of this diet and having a weight gainof up to 15 to 20 g/kg/day. Most RUTF protocols,that recommend 175 to 200 kcal/kg/day, assumeimplicitly that RUTF is the only food consumedduring treatment. However average weight gainin the community (4 to 6 g/kg/day or less) versusin clinical trials (0 to 15 g/kg/day) suggests this israre; in reality, RUTF may be shared or childrenalso consume local, less nutrient dense food. elevel of consumption of local foods along withRUTF has never been precisely estimated so thatsubstantial and consistent increased RUTF forti-fication may be needed to compensate.
e most common RUTF contains about 25%peanut paste; this contains 1% to 2% phytatesthat may potentially inhibit the absorption of di-valent ions, such as iron, zinc, or calcium. elipid matrix in RUTF, has unknown effects ontheir absorption, in particular of iron3 and alsoof phosphorus, which is likely in phytate formand less well absorbed than dairy sources. e2007 World Health Organisation (WHO)/UNICEF/World Food Programme/United NationsStanding Committee on Nutrition Joint Statementrequires a minimum of 300 mg of non-phytatephosphorus per 100g of RUTF (520 mg minimumfor 1,000 kcal), substantially less than the 850 mgof phosphorus derived from milk in 1,000 kcal ofF-100 and the 850 to 1,400 mg/1,000 kcal recom-mended by the 2012 WHO technical note onfoods for moderately malnourished children.
Studies comparing the effect of different RUTFmineral fortification levels, in particular zinc,phosphorus, iron and calcium, used in real-lifeconditions are needed to optimise RUTF. Forsome nutrients that have stable isotopes, such aszinc, absorption could be measured and comparedwith their levels of absorption in F-100 and/orwith calculated requirements for lean tissue syn-thesis. For nutrients that do not have stable iso-topes, such as phosphorus, comparison of leantissue synthesis and linear growth with differentformulations is needed.
No study has ever assessed the vitamin statusof children aer treatment with RUTF. Ideally,
lessons learned from RUTF
Developing foodsupplements for moderatelymalnourished children:
Summary of research1
1 Briend A et al (2015. Developing food supplements for moderately malnourished children: Lessons learned from ready-to-use therapeutic foods. Food and Nutrition Bulletin, vol 36, no 1, ppS53-S58, 2015 Supplement.
2 Estimates based on prevalence data which underestimate the number of children suffering from MAM or SAM in a year.
3 Absorption of iron takes place in the upper part of the gut, where iron in RUTF may well still be within the fat matrix.
Appetite testwith RUTF
Nic
ky D
ent

菀0
. . . . . . . . . . . . . . . . . . . . . . . . . . . . . . . . . . . . . . . . . . . . . . . . . . . . . . . . . . . . . . . . . . . . . . . . . . . . . . . . . . . . . . . . . . . . . . . . . . . . . . . . . . . . . . . . . . . . . . . . . . . . . . . . . . . . . . .
. . . . . . . . . . . . . . . . . . . . . . . . . . . . . . . . . . . . . . . . . . . . . . . . . . . . . . . . . . . . . . . . . . . . . . . . . . . . . . . . . . . . . . . . . . . . . . . . . . . . . . . . . . . . . . . . . . . . . . . . . . . . . . . . . . . . . . .
Research
this should be done in different contexts withchildren having different pre-existing nutritionaldeficiencies.
e vitamin A content of RUTF is a particularconcern. Currently, it is added within narrowlimits (between 0.8 and 1.1 mg/100 g) and to themaximal level given its instability and potentialloss during storage. Pre-consumption levels ofRUTF vitamin A and the vitamin A status oftreated children have never been checked, althoughthe current recommendation is to rely only onRUTF and no longer to provide a high-dose vi-tamin A capsule as part of SAM treatment.Despite uncertainties regarding iron absorptionand the fortification levels of vitamins neededfor haemoglobin synthesis, a proper evaluationof the haematological status of children aertreatment is also lacking and overdue.
Following initial success with RUTF, attemptswere made to simplify its formulation to make iteasier to produce locally. A first successful stepwas to replace imported maltodextrin with locallyavailable sucrose. Attempts to remove or to de-crease the proportion of dried skimmed milk,the most expensive ingredient in RUTF, havebeen less successful (see Box 1).
Replacing milk proteins with proteins derivedfrom other sources is likely to impact proteinquality but this effect is not clearly quantified. Acomparison of the protein digestibility-correctedamino acid score (PDCAAS) between RUTFs con-taining 25% and 10% milk suggested that PDCAASdecreases from 1.11 to 1.00. For SMS-RUTF, PD-CAAS was estimated at 0.86, clearly inferior tothat for the reference RUTF. ese estimates ofRUTF protein quality are based, however, on amethod that is no longer recommended by the
Food and Agriculture Organisation (FAO) andWHO. e recently proposed method is based ontrue ileal protein digestibility (digestible indis-pensable amino acid score (DIAAS)), and not onfaecal crude digestibility, which may give differentresults. e impact of this change on assessmentof RUTF protein quality is unknown. Currentefforts to measure DIAAS on different RUTF for-mulations may shed light on potential differences.
ere is also an uncertainty regarding theamino acid profile that should be used to assessprotein quality in RUTF. e amino acid require-ments of children depend on those amino acidsneeded for body maintenance and those neededfor new tissue deposition. Aer the age of 6 to 12months, in a child growing at normal rates (notsustaining catch-up weight gain), new tissue syn-thesis is reduced and the amino acids needed aremainly those involved in body maintenance. Ar-guably, this profile may not be applicable to re-covering malnourished children of the same age.During the catch-up growth phase, these childrenmay use a much larger proportion of proteinsconsumed for new tissue synthesis than do well-nourished children. e availability of sulphuramino acids (cysteine and methionine) may alsohave an indirect effect on growth, since sulphuris needed for cartilage synthesis during catch-upgrowth in length. Peanut paste has a lower sulphuramino acid content than dried skimmed milk;the effect on linear growth is unknown.
Milk proteins seem to have a specific hormonaleffect and to promote the production of insulin-like growth factor 1 (IGF-1), with a possible effecton linear growth likely due to the casein fractionof milk. is effect has never been tested in mal-nourished children. Dairy products have highcalcium and phosphorus contents, which mayalso explain their specific effect on growth. Phos-phorus is needed for muscle growth and phos-phorus deficiency is associated with bone growthretardation in animals, in contrast with calcium,which is associated with decreased bone mineraldensity, without a clear effect on linear growth.An insufficient intake of phosphorus could possiblybe corrected by adding phosphorus salts to thefortification formula of reduced dairy foods or todigest phytates using phytase during food pro-duction, which would make the phosphorus moreavailable. Both approaches are used successfullyin animal nutrition to promote growth with min-imal amounts of dairy products. ey have notbeen tested in foods for malnourished children.ere is potential for adding acid resistant phytaseto water free RUTF to improve the absorption ofiron but this has never been tested.
In contrast to dairy products, plant-based foodsoen contain high levels of anti-nutrients, whichmay decrease protein digestibility and mineralabsorption. A higher content of anti-nutrientsmay also explain why attempts to replace dairyproducts with plant-based sources of protein havegiven mixed results. Roasting and extrusioncooking4 are the most commonly used techniquesto destroy anti-nutrients. However, excessive heatcan lead to undesirable chemical reactions withproteins, which limit its application. Lysine, the
main limiting amino acid of cereals and groundnuts,has two amino groups and is particularly reactive,which leads to a decrease of protein quality incase of excessive heating5.
Mature dry legumes may contain up to 30different soluble carbohydrates. Among those,the raffinose family of oligosaccharides are notdigested by the small intestine but by the intestinalflora in the colon, hence large quantities may in-duce flatulence and abdominal discomfort andmay explain the poor tolerance of early milk-free, legume-based RUTFs and limitations oflegume-based alternative RUTFs. Flatulencefactors can be reduced by as much as 47% to60% by extrusion cooking or by 70% to 80% bygermination, and most efficiently through use ofenzymes. ese techniques6 are not currentlyused when preparing foods for malnourishedchildren – either lipid-based nutrient supplementsor more traditional blended flours.
Conclusionse authors conclude that although millions ofchildren are treated every year with RUTF, therehasn’t been a single evaluation of the vitamin andmineral status of children at the end of treatment.Furthermore, clinical trials are needed to comparedifferent levels of fortification and their effect ongrowth and other functional outcomes. Very littleis known currently about the effect of RUTF oncorrection of stunting, which is frequently presentin children with SAM. e possibility should beexplored of better correcting stunting by treatingchildren with SAM with improved RUTFs con-taining higher levels of sulphur amino acids, phos-phorus, or zinc. is can also provide clues onhow to improve the diet to prevent stunting fromoccurring in the first place, with relevance for im-provement of the diets of children between 6 and23 months of age.
RUTF has not been optimised, and research toimprove it should continue. is research is relevantfor the development of foods for moderately mal-nourished children, as it can provide clues onhow to optimise these foods as well. e followingaspects should be especially investigated:• Determine the amounts of RUTF and of
local foods children are typically consumingduring treatment and adjust nutrient densityaccordingly.
• Assess the feasibility of different processing steps to improve nutritional quality of the food, especially by the use of appropriate enzymes.
• Measure non-phytate phosphorus in proposed foods and compare the efficacy of different formulations with different levels of non-phytate phosphorus.
• Determine the vitamin and mineral status of children with MAM aer treatment and revise the formulation if needed.
A first attempt in Malawi to replace milkpowder by a mixture of roasted chickpeaand sesame led to a product that was wellaccepted by young children in tastingsessions but gave them abdominal painswhen given several days in a row,apparently as a result of inadequate starchgelatinisation. Two other products in whichstarch gelatinisation was obtained byextrusion cooking were better tolerated.
A first study with RUTF in Malawi comparedRUTF containing 10% dried skim milk withRUTF containing 25% dried skim milk in thestandard formulation. The RUTF withreduced milk content, however, was lesssuccessful in treating children with SAM,achieving 57% recovery after four weeks,compared with 64% for RUTF with 25% milk.Weight gain, height gain and increases inmid-upper arm circumference (MUAC) werealso higher for the RUTF with 25% milk.
A second RUTF made without milk,containing soy, maize, and sorghum (SMS-RUTF), was tested in Zambia and alsoproved less successful than the milk-basedoriginal formula, at least in children under 2years of age, achieving a 53.3% recoveryrate versus 60.8% for the standard RUTF.
Box 1 Attempts to replace dried skimmedmilk in RUTF formulation
4 Extrusion cooking associates mechanical shearing with heating above 100°C for a few minutes in a humid environment and is the most effective method of removing antinutrients.
5 The Maillard reaction involves the reaction of an amino group of a protein with carbohydrates.
6 They require an aqueous environment during the production process,

菀1
. . . . . . . . . . . . . . . . . . . . . . . . . . . . . . . . . . . . . . . . . . . . . . . . . . . . . . . . . . . . . . . . . . . . . . . . . . . . . . . . . . . . . . . . . . . . . . . . . . . . . . . . . . . . . . . . . . . . . . . . . . . . . . . . . . . . . . .
. . . . . . . . . . . . . . . . . . . . . . . . . . . . . . . . . . . . . . . . . . . . . . . . . . . . . . . . . . . . . . . . . . . . . . . . . . . . . . . . . . . . . . . . . . . . . . . . . . . . . . . . . . . . . . . . . . . . . . . . . . . . . . . . . . . . . . .
Research
New implications for controversialkwashiorkor treatment discussed in
Paediatrics and International Child Health
Summary of research1
The latest issue of Paediatrics andInternational Child Health seesleading experts in the field ofmalnutrition address the ongoing
controversy surrounding the use of albuminfor treatment of oedema in children withkwashiorkor in shock.
For many years, the essential cause ofoedema in kwashiorkor was considered tobe low oncotic pressure owing to lowplasma albumin concentration (Starlingforces2). However, in 1980, this under-standing was challenged by Mike Golden(University of Aberdeen), Alan Jackson(University of Southampton) and co-work-ers, and there has been controversy sur-rounding treatment of kwashiorkor eversince.
Now, in a new article3, MalcolmCoulthard (University of Newcastle, UK),re-analyses Golden et al’s data and demon-strates that there is a significant associationbetween low plasma albumin concentrationand oedema in kwashiorkor, and that loss
of oedema is associated with a rise in al-bumin concentration. On the back of hisfindings, and based on his experience ofmanaging crises in children with congenitalnephrotic syndrome, he proposes a trial ofIV albumin for children with kwashiorkorwho are in shock.
Michael Golden has responded with anexhaustive review4 of the literature on oede-ma and a re-evaluation of a wide variety ofconditions manifesting with oedema inchildren and adults, concluding that in lightof present knowledge, each condition hasenough anomalous characteristics such thatStarling forces alone no longer explain thecause of oedema. In summary, he concludesthat the child with kwashiorkor is physio-logically different from the child withnephrotic syndrome and that the proposedtreatment is “fraught with danger”.
e third paper in the series, a com-mentary5 by Alan Jackson, reviews bothof these articles and traces the developmentof the management of kwashiorkor since
the 1980s, particularly in relation to therole of dietary protein and systematic trialsof volume and/or albumin replacementtherapy. Both Golden and Jackson cautionagainst the use of IV albumin in the man-agement of kwashiorkor in general.Coulthard, in a Letter to the Editor6, ac-knowledges the lack of evidence of thevalue of IV albumin and the potential dan-gers of its use, but argues that, given thelack of appropriate guidelines, a carefullycontrolled randomised trial of IV albuminis justified.
Together, these three papers address thecontroversy around the treatment of kwa-shiorkor and stimulate further discussionand research in the area. Brian Coulter,the journal’s Editor-in-Chief, comments:“ese articles provide an excellent updateon the pathophysiology and managementof oedematous malnutrition. Despite a WHOreview of the management of severe malnu-trition in children in 2013, treatment ofthose with intravascular depletion, particu-larly patients with kwashiorkor in shock,remains unsolved.”
All three articles, published in Paediatrics& International Child Health, are free toaccess atwww.maneyonline.com/toc/pch/35/2.
1 http://www.maneyonline.com/toc/pch/35/22 The low oncotic pressure caused by
hypoalbuminaemia induces hypovolaemia, which triggers salt and water retention.
3 Malcolm Coulthard (2015). Oedema in kwashiorkor is caused by hypoalbuminaemia. Paediatrics and International Child Health 2015 Volume 35, Issue 2 (May 2015), pp83-89
4 Michael H Golden (2015). Nutritional and other types of oedema, albumin, complex carbohydrates and the interstitium – a response to Malcolm Coulthard's hypothesis: Oedema in kwashiorkor is caused by hypo-albuminaemia. Paediatrics and International Child Health. Volume 35, Issue 2 (May 2015), pp. 90-109
5 Alan A Jackson (2015). Albumin in nephrotic syndrome and oedematous malnutrition. Paediatrics and International Child Health. Volume 35, Issue 2 (May 2015), pp. 77-80
6 Malcolm Coulthard (2015). Letter to the editor. Paediatrics and International Child Health. Volume 35, Issue 2 (May 2015), pp. 164-164
Bilateral oedema with pressureulcer on a young child
Nic
ky D
ent

菀菀
. . . . . . . . . . . . . . . . . . . . . . . . . . . . . . . . . . . . . . . . . . . . . . . . . . . . . . . . . . . . . . . . . . . . . . . . . . . . . . . . . . . . . . . . . . . . . . . . . . . . . . . . . . . . . . . . . . . . . . . . . . . . . . . . . . . . . . .
. . . . . . . . . . . . . . . . . . . . . . . . . . . . . . . . . . . . . . . . . . . . . . . . . . . . . . . . . . . . . . . . . . . . . . . . . . . . . . . . . . . . . . . . . . . . . . . . . . . . . . . . . . . . . . . . . . . . . . . . . . . . . . . . . . . . . . .
Location: BangladeshWhat we know already: Undernutrition and diarrhoea often presentconcurrently in children. Weight is affected by hydration status; there is limitedevidence on how this impacts on assessment of acute malnutrition in practice.
What this article adds: Between February and June 2014, a prospective cohortstudy assessed the validity of four different measures of undernutrition inchildren <5 years of age presenting with diarrhoea at the rehydration unit atICDDR’B. Comparing measures pre- and post-hydration saw greatermisclassification of nutritional status using weight-based measures compared toMUAC. Each 1% increase in dehydration was associated with a significantchange in weight for age and weight for length z scores but no significantchange in MUAC measures. The mean % weight change with rehydration was4%. This study confirms previous research; it may partially explain why MUACand weight for length z score often identify different populations of children.
MUAC outperforms weight-basedmeasures of nutritional status inchildren with diarrhoeaSummary of research1
Undernutrition and diarrhoea fre-quently present concurrently inchildren. In a recent study fromMalawi, half of children presenting
with severe acute malnutrition (SAM) in theoutpatient setting reported having diarrhoeain the previous two weeks. Prior research hasfound that children with diarrhoea have de-creased weight gain, children with undernu-trition have a higher incidence of diarrhoeaand the relation between malnutrition anddiarrhoea is bidirectional. However, few studieshave addressed the impact of hydration statuson the assessment of malnutrition in children.Because dehydration alone will lower theweight of a child, weight-based nutritionalassessments such as weight-for-length orweight-for-age in children presenting withdiarrhoea may be misleading. A recently pub-lished study aimed to assess the validity offour different measures of undernutrition inchildren <5 years of age with diarrhoea, bycomparing performance of these measuresduring acute diarrhoeal illness and aer re-hydration to a stable, pre-illness weight.
e study used data collected as part ofthe ‘Dehydration: Assessing Kids Accurately’study. is was a prospective cohort studythat included a random sample of childrenpresenting to the rehydration unit (short-stayunit) at the Dhaka Hospital of the International
Centre for Diarrhoeal Disease, Bangladesh(ICDDR’B). e study was conducted betweenFebruary and June 2014. e hospital providestreatment for ~144,000 patients yearly, overone-half of whom are children.
MethodAll children <60 months of age presenting tothe rehydration unit were eligible for enrol-ment. Acute diarrhoea was defined as thepassage of loose or watery stools at least threetimes/d and lasting <14 d total. Research staffidentified children presenting to the rehy-dration unit (24 h/d, 7 d/week) and randomlyselected children for screening. Research staffscreened the selected patient to determine ifthey met any of the predefined exclusion cri-teria (children with <3 loose stools/d, diarrhoealasting >14 d, a clear alternative diagnosis togastroenteritis on arrival, and children pre-viously enrolled in the study).
Research nurses received seven days oftraining in all study procedures2. Aer consentwas obtained, study nurses obtained basichistoric and demographic data for each childincluding location, age, gender, days of diar-rhoea, stool frequency in the past 24 h, andtype of diarrhoea (bloody, watery, or rice wa-ter). Children were completely undressed andbaseline weight to the nearest 100g was ob-tained on arrival.
If a child received intravenous fluid beforebaseline weight was obtained, study staffrecorded the amount of fluid received beforemeasurements but did not alter the initialweight measurement. Mid upper arm cir-cumference (MUAC) was measured in mil-limetres using a standard measuring tape.Hospital physicians determined rehydrationmethods independent of enrolment in thestudy; a majority received oral rehydrationsolution (ORS) alone and a minority receivedadditional intravenous fluid. Nutritional meas-urements of dehydration status were performedin 721 patients <60 months of age before andaer achieving stable weight through an in-dependent hydration method. Aer initialenrolment, patients were weighed every eighthours to determine their post-hydration stableweight, which was used as a proxy for thepre-illness weight to determine the percentdehydration on arrival. e stable weight wasdefined as the average of the highest two con-secutive weights that differed by <2%. A repeatMUAC assessment was performed on childrenachieving a stable weight before discharge.
1 Modi. P et al, 2015. Mid upper Arm Circumference Outperforms Weight-Based Measures of Nutritional Status in Children with Diarrhoea. The Journal of Nutrition. First published ahead of print May 13, 2015 as doi: 10.3945/jn.114.209718.
2 Training consisted of 3 days of theoretical knowledge and 4 days of clinical experience practicing informed consent, weighing children, and measuring MUAC and length.
Research

菀菀
. . . . . . . . . . . . . . . . . . . . . . . . . . . . . . . . . . . . . . . . . . . . . . . . . . . . . . . . . . . . . . . . . . . . . . . . . . . . . . . . . . . . . . . . . . . . . . . . . . . . . . . . . . . . . . . . . . . . . . . . . . . . . . . . . . . . . . .
. . . . . . . . . . . . . . . . . . . . . . . . . . . . . . . . . . . . . . . . . . . . . . . . . . . . . . . . . . . . . . . . . . . . . . . . . . . . . . . . . . . . . . . . . . . . . . . . . . . . . . . . . . . . . . . . . . . . . . . . . . . . . . . . . . . . . . .
Malnutrition was classified as none, mod-erate, or severe based on MUAC cut-offs>125, 115–124, or <115 mm, respectively,and by weight for length z score (WLZ) andweight for age z score (WAZ) by cut-offs of >-2, -2 to -3, or < -3, respectively. Of note,MUAC was measured for children 6– 60months of age and MUAC z score (MUACZ)was calculated for children 3–60 months ofage, based on available growth standard data.
Patients were classified into three dehy-dration categories based on their percent de-hydration: no dehydration (<3%), some de-hydration (3–9%) and severe dehydration(>9%); literature standards were used. Childrenwho lost >3% of their body weight duringtheir time in the rehydration unit were con-sidered to have received inadequate rehydrationdespite persistent diarrhoea and were excludedfrom analysis.
ResultsBetween February and June 2014, 1,196 chil-dren <5 y of age were randomly selected forscreening. Of these, 171 met exclusion criteria,175 did not consent to participate, and 850were enrolled. By discharge, 735 (86%) of allenrolled patients achieved a stable weight,allowing for calculation of their percent de-hydration on arrival. Fourteen (2%) of thesechildren lost weight during their stay in therehydration unit, suggesting inadequate hy-dration in the setting of continued volumelosses from diarrhoea and were therefore ex-cluded from the analysis.
e mean percent weight change with re-hydration was 4%. Eighty (11%) childrenwere classified as having severe dehydration,319 (44%) as having some dehydration, and322 (45%) as having no dehydration. Medianlength of stay in the rehydration unit was 22h (IQR: 16–38) and the median time to achiev-ing stable weight was 14 h (IQR: 11–19).
Twenty-eight percent of children receivedintravenous fluids before their initial admissionweight. However, for these children, themedian amount of fluid received before theirinitial weight check was 1.5 ml/kg (IQR: 1.0–2.6), which is unlikely to be clinically significantin this context.
Comparing the pre-hydration and post-hydration malnutrition category assigned byeach of the four indices of malnutrition inchildren, MUAC and MUACZ had a 92%and 94% agreement, respectively, with k-scores of 0.78. WAZ and WLZ had 68% and76% agreement, respectively, with k-scoresof 0.49 and 0.62. Based on a linear regressionmodel analysing the impact of percent dehy-dration on the changes in anthropometricindicators with rehydration while controllingfor age and sex, each 1% increase in dehydra-tion was associated with a change in WAZ of0.0895 (95% CI: 0.0892, 0.0905), and a changein WLZ of 0.1304 (95% CI: 0.1297, 0.1312).ere was no significant change in MUAC orMUACZ with each 1% change in dehydrationstatus. e change in each indicator with re-hydration was analysed based on baseline de-hydration category (none, some, or severe).Dehydration category had no significant effecton the change in MUAC (P = 0.32) or MUACZ(P = 0.07) with rehydration. However, dehy-dration category had a significant effect onthe change in WAZ (P < 0.001) and WLZ (P< 0.001) with rehydration.
Finally, the study evaluated the impact ofeach of the four measures on the diagnosis ofSAM in children with complete data available.Overall, 88 (12%) children were misclassifiedas severe underweight on arrival using WAZand 104 (14%) children were misclassified asSAM using WLZ. Comparatively, only 10(1%) children were misclassified as SAM onarrival using MUAC and 16 (2%) childrenwere misclassified as SAM using MUACZ.
DiscussionCurrent WHO guidelines endorse usingMUAC in community-based settings andWLZ in health facilities to diagnose childrenwith SAM. In this study, a large proportionof children with diarrhoea were misclassifiedwith SAM when using WAZ and WLZ whereasMUAC and MUACZ were far less likely tomisclassify. Furthermore, dehydration statuswas found to have a significant impact on theaccuracy of WLZ and WAZ, but not so forMUAC or MUACZ. is difference may par-tially explain previous research, which hasshown that MUAC and WLZ oen identifydifferent populations of children with mal-nutrition3 and that WLZ can vary based onthe severity of dehydration in the child4. isstudy also confirms the findings of the oneprevious Kenyan study of malnutrition specifi-cally in children with diarrhoea, which foundthat WLZ was a poor indicator of undernu-trition in children with diarrhoea and thatMUAC and MUACZ were not significantlyaffected by dehydration status.
Rapidly identifying vulnerable populationssuffering from both diarrhoea and undernu-trition has important clinical implications.is high-risk population can receive targetedtherapy for their severe malnutrition, whilealso receiving specialised ORS (Resomal) fortheir dehydration. If providers are concernedthat measures of undernutrition may not beaccurate in children with diarrhoea, they maydelay treatment for undernutrition until aerrehydration in some children who truly needit, with an attendant risk that they may neverreceive it. MUAC overcomes this issue andhas many advantages (easy to implement,simple measure and cheap). In community-based settings, it may not be possible toreassess the nutritional status of a child withdiarrhoea aer rehydration, because they areonly evaluated at a single point in time beforebeing sent home with sachets of ORS. Inthese cases, MUAC or MUACZ can be usedto assess nutritional status confidently assessnutritional status, enabling prompt diagnosisand initiation of community-based nutritionalsupplementation, without requiring the childto return for repeat assessment.
Limitations to the study include the factthat children with bipedal oedema and thosewith WAZ <-4 were not included in thisstudy, because they are managed in a separatemalnutrition unit at ICDDR’B. Furthermore,the study was conducted at a single urbanhospital in Bangladesh, so the results maynot be generalisable to more rural populationsor those in other settings.
3 UNICEF, WHO. WHO child growth standards and the identification of severe acute malnutrition in infants and children. Geneva (Switzerland):
4 Berkley J, Mwangi I, Griffths K, Ahmed I, Mithwani S, English M, Newton C, Maitland K. Assessment of severe malnutritionamong hospitalized children in rural Kenya: comparison of weight for height and mid upper arm circumference. JAMA 2005;294:591–7.
Research
MUAC assessment
Sheh
zad
Noo
ran/
WFP
, Ban
glad
esh,
200
4

菀菀
. . . . . . . . . . . . . . . . . . . . . . . . . . . . . . . . . . . . . . . . . . . . . . . . . . . . . . . . . . . . . . . . . . . . . . . . . . . . . . . . . . . . . . . . . . . . . . . . . . . . . . . . . . . . . . . . . . . . . . . . . . . . . . . . . . . . . . .
This summary was prepared by Tanya Khara, an independent consultant engaged by the ENN on this review. The review was madepossible by the generous support of the American people through the United States Agency for International Development (USAID).
The relationship between wasting and stunting: policy, programming and research implications
Summary of review1
BackgroundIn 2014, ENN published a technical briefing paper‘the relationship between wasting and stunting:policy, programming and research implications’.e paper is a narrative review of available literatureon the relationship between wasting and stunting,conducted in consultation with a specifically formedtechnical interest group (TIG) of key experts inchild growth and nutrition. e review was triggeredby previous ENN work illustrating the divide in fi-nancing between wasting and stunting2 and a con-cern that this divide may have negative implicationsfor children and nutrition targets. e wasting-stunting review aimed also to fill a gap identifiedby the American Society for Nutrition in 2012:“Little is known about how children progress fromone manifestation of undernutrition to another asthey grow older, nor how intervention strategiesneed to consider the potential overlap of thesemanifestations of undernutrition3.”
MethodsJournal articles found via PUBMED searches andreference lists, and resources contributed by TIGmembers were reviewed. Evidence of causes andeffects, geographical and seasonal patterns, phys-iological mechanisms, and for direct relationshipswas included.
FindingsBurden• Wasting and stunting occur together in many
country contexts and may coexist in the same child, though the extent to which this happensis largely unreported. Being concurrently wasted and stunted may have particularcausal pathways and effects which are not yet fully understood.
• Seasonality has a marked impact on both wasting and stunting prevalence. Rates of gainin weight and height oen take place at different times of year and seem to be related over time in a consistent way, with height faltering peaking 2-3 months aer weight loss/wasting levels have peaked.
Shared risk factors• Wasting and stunting share mainly common
risk factors (dietary inadequacy, infectious disease in childhood, diarrhoea, maternal stature). Only Environmental Enteric Dys-function and zinc inadequacy were identifiedin the literature as risk factors only for stunting.
• ere is good evidence that in-utero conditionsand foetal growth contribute significantly to stunting at birth and during infancy; and there isemerging evidence of contributions to wasting.
Shared effects• Both wasting and stunting are associated
with increased mortality. Where they coexist in the individual child there is evidence to
suggest that the risk multiplies to a similar risk as the severely wasted child.
• Low muscle mass in both wasting and stuntingand the link between muscle mass and survivalduring infection, suggest the risk of death associated with both conditions may be medi-ated through decreased muscle mass. However studies measuring body composition during both conditions are required to further investi-gate this hypothesis.
• Stunting is associated with child mental (cognitive) and psychomotor development. Evidence for wasting being associated with mental (cognitive) and psychomotor devel-opment is less strong.
Direct relationships• Evidence suggests that linear growth slows at
some point during wasting and that episodes of wasting in the previous three months (approximately) have an impact on attained length-for-age. erefore, early identificationand treatment of wasting may play a role in preventing stunting in particular contexts.
• Evidence that wasting treatment promotes linear growth of individual children is mixed.ere are indications that optimising ready to use therapeutic food (RUTF) to include specificnutrients required for linear growth and devel-opment could have positive effects. However, preventing stunting relies on a range of nutri-tion specific interventions and nutrition sensi-tive approaches.
Programmatic approaches• ere is some encouraging operational research
suggesting that both wasting and stunting (to alesser extent) may be reduced with similar preventative food based approaches.
Implications and actionse review elaborates implications of these findingsand recommends a number of key actions:
1. Longitudinal data tracking nutritional status.A number of limitations to available data werefound during the review. Most importantly, meas-uring the association between wasting and stuntingis challenged by the common use of cross sectionalprevalence data. is does not allow for thecapture of incident wasting cases occurring overtime, nor how the causal pathways for wastingand stunting develop over time separately and incombination. Collection and analysis of longitu-dinal data tracking children’s status over time isrequired to better inform the design of servicesaiming to intervene in these causal pathways.
2. Concurrent wasting and stuntingWe do not know the burden of concurrent wastingand stunting, the full implications for a child ex-periencing both deficits, nor whether these childrenare being already reached by services. Data is
available that could be analysed as a priority toquantify national, regional and global burdens ofconcurrent wasting and stunting. Furtherresearch/analysis of mortality and morbidity im-plications of concurrent wasting and stunting isalso required. At the same time the extent towhich these children are being reached by currentnutrition programmes needs to be investigated(particularly those using mid upper arm circum-ference (MUAC) and weight for age (WFA)).
3. Common prevention approaches and researchAs wasting and stunting share mainly commonrisk factors the literature does not support a needfor different preventive intervention packages.Common prevention approaches are required andpolicies which separate the two re-examined. Inaddition research could more routinely measureimpacts on incidence of both forms of undernutritionin order to more appropriately inform programmingfor both conditions.
As wasting can adversely affect linear growththe timely identification and treatment of wastingmay be an important component of stunting pre-vention in some contexts. e question of whetherprotocols for the treatment of wasting could alsobe optimised (i.e. through reformulation of RUTF)to promote linear growth requires further inves-tigation, however.
4. Maternal nutritionEvidence included in the review that both wastingand stunting have origins in foetal growth high-lights the importance of attention to maternaland adolescent girl health and nutrition as partof wasting and stunting prevention approaches.It also suggests that further investigation isrequired to differentiate ponderal and lineargrowth in utero and at birth.
5. Seasonal approachese evidence of seasonal and related patterns inwasting and stunting does not infer causality asother seasonal factors may be involved. Furtherresearch is needed to better understand theseseasonal relationships and to build on existingexperience of what works to mitigate seasonalpeaks in both deficits.
For more information, contact: Tanya Khara,email: [email protected]
1 Khara, T., & Dolan, C. (2014). Technical Briefing Paper: The Relationship between Wasting and Stunting, policy, programming and research implications. Emergency Nutrition Network (ENN) June 2014.http://www.ennonline.net/ourwork/reviews/wastingstunting
2 Shoham J, Dolan C, Gostelow L, ENN (2013). The Management of Acute Malnutrition at Scale: A Review of Donor and Government Financing Arrangements. Main Report. March 2013. http://www.ennonline.net/enncmamfinancingreport2013
3 Menon, P. and R. J. Stoltzfus (2012). Building convergence in science, programmes, and policy actions on child undernutrition: symposium rationale and overview. Adv Nutr 3(2): 224-226.
Research

菀菀
. . . . . . . . . . . . . . . . . . . . . . . . . . . . . . . . . . . . . . . . . . . . . . . . . . . . . . . . . . . . . . . . . . . . . . . . . . . . . . . . . . . . . . . . . . . . . . . . . . . . . . . . . . . . . . . . . . . . . . . . . . . . . . . . . . . . . . .
By Scott Ickes and Alex Lea
Scott Ickes is Assistant Professor at the College ofWilliam and Mary Department of Kinesiology andHealth Sciences, Williamsburg, VA, USA
Alex Lea is a Medical Student at the Medical Collegeof South Carolina at Greenville, 607 Grove RoadGreenville, SC, USA
We wish to thank Sarah Martin for assistance with thisarticle, and to the translators and mothers in theByokulia Bisemeye mu Bantu (BBB) programme fortheir time and willingness to participate in this study.
Background and purposeScaling up essential nutrition interventions,like ready-to-use foods (RUFs) and com-plementary feeding education in the contextof moderate acute malnutrition, holds greatpotential for reducing child undernutrition.Discourse about how to effectively increasecoverage of such interventions is oen fo-cused on strengthening delivery systemsand dissemination through communityhealth workers. However, successful im-plementation of these interventions requiresconsiderable action by caregivers, almostalways mothers. Programmes oen lackimportant information about maternal fac-tors, which can be important for informingeducational approaches.
e purpose of the Maternal Oppor-tunities for Making Change (MOM-C)screening tool is to provide communityhealth workers and programme designerswith brief information about mothers en-rolled in the programme. is tool seeksto understand underlying factors that mayaffect women's abilities to respond to nu-trition interventions.
Tool development and pilote MOM-C tool was developed and basedon a larger survey that was used for researchpurposes in 2014 (results not yet published).is abbreviated screening tool (see Box1 has been tested at the Nyahuka HealthCentre, Bundibugyo, Uganda in June andJuly 2015 within the context of a commu-nity-based nutrition programme calledByokulia Bisemeye mu Bantu, or BBB. eprogramme, which operates under WorldHarvest Mission, aims to provide nutritionaland agricultural education, as well as RUFsupplements, to families with underweightchildren aged 6 to 59 months. e resultsare being used to help the nutritional ed-ucation approach of the work.
e tool covers five domains: experiencewith the BBB supplemental feeding pro-gramme, infant and young child feedingeducation, social support, psychologicalwellbeing and decision-making. e firstobjective was to assess whether or notmothers have difficulty feeding the BBBfood to the child enrolled in the programmeand if so, what the reasons for these diffi-culties were. Participants were then askedabout whether the programme educationwas helpful for them to make changes inhow they feed their child or if makingthese changes remained difficult. If therespondent replied that it was difficult tomake these changes, possible reasons forthese difficulties were proposed in orderto assess the source of difficulty, rangingfrom lack of money to purchase foods towhether or not the child likes the foodthat is prepared by the mother. To assesssocial support, the participant was asked
questions about who supports them intheir day-to-day life as they care for theirchildren and how satisfied the mother waswith the support that was provided. Psy-chological well-being was assessed throughdetermining a mother’s satisfaction withtheir life, access to food and their feelingsof safety in the community in which theylived. e final section of the survey wasused in an attempt to understand whatinfluences might affect a mother’s decisionmaking and to what extent a mother hascontrol over her own decision- makingprocess regarding her child’s health andnutrition.
Pilot Testing From June to July 2015, the MOM-C toolwas pilot tested among 34 mothers whowere currently or recently enrolled in theBBB programme. Survey results were tab-ulated across three domains (Social support,6 questions, 15 possible points; PsychologicalWellness, 3 questions, 12 possible points;and Decision-making 6 questions, 24 pos-sible points) for a highest total possiblescore of 51, and lowest possible score of12. Scores ranged from 21 to 38, with amean (standard deviation) of 31.65 (3.31).We developed three risk categories: lowrisk (total score 12-29), medium risk (totalscore 30 to 32), and high risk (above 33 to51), displayed in Figure 1. Table 1 presentsthe summary statistics for each sub-domainand the overall MOM-C screening tool.
Next steps for programmeimplementationFollowing further refining of this tool, theprogramme will regularly adopt this screen-ing questionnaire to assess maternal op-portunities for making change at the timeof programme enrolment to better under-stand the challenges mother face in eachcohort of the programme, and to screenfor mothers who are particularly vulnerableto a context of low agency, as assessedthrough the measured variables in thistool. Future educational messages, includingprogramme dramas will emphasise deci-sion-making capabilities and ways thatwomen can advocate for and receive greatersupport. e programme will also encouragemale partner attendance at education ses-sions, which will be designed to engageboth partners in dialogue about issues re-lated to women’s decision-making. Futureresearch directions will examine the asso-ciations between levels of risk, identifiedin the MOM-C tool, with baseline nutri-tional status, biologic (e.g. growth) andbehavioural (feeding practices) responsesto nutrition programmes.
For more information or if you wouldlike to pilot this tool in a different con-text, contact: Scott Ickes, email: [email protected]
Research
16
14
12
10
8
6
4
2
0Low risk Medium risk High risk
Figure 1 Frequency of mothers by riskcategory in the MOM-Cassessment tool
Mean (SD) Median (95% CI) Range
Social Support 8.8 (2.3) 8.5 (7.8, 10.0) 4 to 15
PsychologicalWellness
6.4 (1.3) 34 (6.0,7.0) 4 to 9
Decision-making
16.5 (2.6) 17 (16.0, 17.0) 9 to 20
TOTAL 31.6 (3.3) 32 (31.0, 33.0) 21 to 38
Table 1 Summary statistics for the MOM-CScreening Tool
. . . . . . . . . . . . . . . . . . . . . . . . . . . . . . . . . . . . . . . . . . . . . . . . . . . . . . . . . . . . . . . . . . . . . . . . . . . . . . . . . . . . . .
Developmentand pilot testingof the MaternalOpportunitiesfor MakingChange (MOM-C)screening tool

. . . . . . . . . . . . . . . . . . . . . . . . . . . . . . . . . . . . . . . . . . . . . . . . . . . . . . . . . . . . . . . . . . . . . . . . . . . . . . . . . . . . . . . . . . . . . . . . . . . . . . . . . . . . . . . . . . . . . . . . . . . . . . . . . . . . . . .Nigeria
菀菀
Editorial ..........................
The story of Community Manage-ment of Acute Malnutrition(CMAM) in Nigeria is one ofsuccess and learning; documented
in the three following articles byUNICEF/ACF/Mark Myatt; ACF; and Re-sults for Development (R4D). What beganin 2009 as a small emergency response in30 outpatient treatment (OTP) sites, hasgrown into one of the largest non-emergencyCMAM programmes globally. With tech-nical support from UNICEF and fundingfrom the Children’s Investment Fund Foun-dation (CIFF), ECHO, EU, USAID, JICA,the Bill & Melinda Gates Foundation, CERFand DFID, there are 642 government-run
CMAM sites delivering life-saving treatmentacross 11 states1 in Northern Nigeria today.From 2009 to May 2015, 1,085,498 childrenhave been admitted for treatment – resultingin an estimated 831,686 children cured2
and 207,805 lives saved.
Demonstrating delivery atscaleDespite fluctuating instability in the country,the programme continues to demonstratethat high-quality CMAM services can be
By Amy Mayberry, Claire Harbron, Arjan De Wagt andDr. Chris Osa Isokpunwu
Amy Mayberry ison the Children’sInvestment FundFoundation’s (CIFF)Evidence,Measurement andEvaluation Team,
providing technical expertise on thegeneration and use of data and evidenceacross CIFF’s nutrition portfolio.
Claire Harbronis a Manager inthe NutritionTeam at theCIFF. Sheoversees CIFF’sprogramme
portfolio focused on treatment ofsevere acute malnutrition.
Arjan de Wagt isChief of Nutritionat UNICEF Nigeria.During the last 20years, he hasworked for UNICEF(15 years), NGOs
and the Zambian and NetherlandsGovernments in supporting thedevelopment and management ofnutrition and HIV programming.
The authors acknowledge the input of the following reviewers in producing thisarticle: Augustin Flory, Executive Director at CIFF; Georgina Fekete, Director ofNutrition at CIFF; Christine Kaligirwa, Nutrition Specialist at UNICEF Nigeria; andAssaye Bulti at UNICEF Nigeria.
The authors recognise and thank all partners that have supported the workhighlighted in this article, including the Nigeria Federal Ministry of Health andUNICEF for technical support for programme implementation. Additionalrecognition goes to ACF, Valid International, Save the Children, Results forDevelopment (R4D) and their Nigerian partners Centre for CommunicationProgrammes Nigeria (CCPN), Binomial Optimus Limited (BOL), and HealthSystems Consult Ltd (HSCL). Financial support for the programme was providedby the Children’s Investment Fund Foundation (CIFF), DFID, ECHO, EU, USAID, Billand Melinda Gates Foundation, CERF and JICA over the years. Most importantly,the authors would like to recognise the Local Government Authority (LGA) andState governments in Northern Nigeria and the people delivering these vitalservices.
Dr. Chris OsaIsokpunwu isthe Head ofNutrition in theFederalMinistry ofHealth and the
Scaling Up Nutrition (SUN) focalpoint to Nigeria.
1 Adamawa, Bauchi, Borno, Gombe, Jigawa, Kano, Katsina, Kebbi, Sokoto, Yobe, and Zamfara. As of May 2015.
2 75.2% average cure rate from 2009-2014
Diego Macías/AC
F, Nigeria
Nig
eri
a
Specialfocas on

. . . . . . . . . . . . . . . . . . . . . . . . . . . . . . . . . . . . . . . . . . . . . . . . . . . . . . . . . . . . . . . . . . . . . . . . . . . . . . . . . . . . . . . . . . . . . . . . . . . . . . . . . . . . . . . . . . . . . . . . . . . . . . . . . . . . . . .
菀7
successfully delivered at large scale through agovernment health system. e programme hasgrown exponentially over the last five years,with more than 320,000 children admitted fortreatment in 2014 alone. Overall performancehas significantly improved and the majority ofstates (nine out of 11) now consistently meetSPHERE treatment standards. e 11 statesachieved an average 84.5% cure rate as of March20153. To support further programmatic im-provement, a series of SLEAC4 and SQUEAC5
coverage surveys found an average coverage of36.6% across the 11 states. e leading causesof reduced access to treatment and default rateswere lack of awareness of malnutrition and theCMAM programme. is was true across all 11states. is information is critical for under-standing how to improve the programme andensure high-quality services are available andreaching children in need.
Delivering a cost-effectiveservicee data from Nigeria confirms that the deliveryof CMAM services is a highly cost-effective andaffordable treatment. A comprehensive costinganalysis shared in the article by R4D6 found anaverage cost of $219 per child cured, of which$160 are financial costs attributable to the gov-ernment and UNICEF and $59 are economiccosts to beneficiaries and community volunteers.Taking the government and UNICEF costs of$160 per child cured, this translates into $1,117per life saved and $30 per DALY gained7. isis considered highly cost-effective based onWHO-CHOICE cost-effectiveness thresholds.e Ready to Use erapeutic Food (RUTF)
product is the single largest cost, at roughly $76per child cured8 (close to 50% of governmentand UNICEF costs). Efforts are underway tobegin producing RUTF locally in Nigeria but itwill take time before production can meet demandand it is not clear if this would lower costs sig-nificantly in the short-term. CIFF is currentlyfunding Washington University in St. Louis todevelop a tool and alternative formulations forRUTF using local ingredients with the aim toreduce cost. Further cost-efficiencies can beachieved at scale as the programme performancecontinues to improve and existing infrastructureis used to reach more children. In the end,funding for the product is likely to remain themain limiting factor for treating children inNigeria; the health system is available and ableto deliver treatment to many more children butwithout supplies, this cannot be done.
More children are in need oftreatmentRates of malnutrition remain high in Nigeriaand this is an issue that cannot be ignored. In2015, there will be an estimated 1.8 million9
children with severe acute malnutrition (SAM)in need of treatment. Despite the impressivescale-up seen in recent years, two out of everythree children still do not receive the treatmentthey need in the 11 states where the programmecurrently operates. As we look forward to thefuture of CMAM in Nigeria, it is clear thatavailability of treatment must continue to increase.
This requires increasedinvestmentBased on the above analyses, scaling up the
programme will cost up to $160 per child cured.For an average OTP site, with over 500 admissionsand 360 children cured per year10, estimatedannual costs are $58,157. With an average offive sites per LGA, this translates into a totalannual cost per LGA of $290,783 to admit over2,500 children and cure over 1,800 children.While these costs are not insignificant, they areaffordable and scale-up to reach more childrenwith effective, life-saving treatment is essentialfor a country like Nigeria where the burden ishigh. Funding support to date has primarilycome from international donors but domesticbudget allocation of this affordable service isessential for sustainability of the programme toensure continued treatment of children withSAM. e current domestic budget for nutritionas a percentage of overall government expenditureis low, though exact data are not currently avail-able. In recent years, a number of state govern-ments in Nigeria have specifically includedCMAM services in their budgets, with a total ofover $2 million committed in 2014. One ofthese states included significant funding forRUTF procurement but this needs to increase.CIFF will be incentivising this through a matched-funding approach over the next three years.
A success story with lessons forNigeria and beyonde incredible success of this programme, withhundreds of thousands of children cured eachyear, offers an unparalleled opportunity to reachsome of the most vulnerable mothers andchildren in Nigeria. e OTP sites of the CMAMprogramme offer an exciting opportunity to in-tegrate additional preventative nutrition servicessuch as Infant and Young Child Feeding (IYCF)and health services in the community and delivercritical interventions to reduce the overall burdenof children with SAM in Nigeria.
is programme is also a lesson – for othercountries and for Nigeria itself. e programmeshows that it is possible to move from a smallemergency operation to a national programmedelivered through the existing health systemand that high quality treatment can be providedto hundreds of thousands of children in regionswith chronically high rates of undernutrition.As a highly cost-effective and life-saving service,CMAM and procurement of RUTF for treatmentmust be a priority for governments to includein their budgets and as part of their routinehealth services.
Editorial. . . . . . . . . . . . . . . . . . . . . . . . . . . . . . . . . . . . . . . . . . . . . . . . . . . . . . . . . . . . . . . . . . . . . . . . . . . . . . . . . . . . . . . . . . . . . . . . . . . . . . . . . . . . . . . . . . . . . . . . . . . . . . . . . . . . . . .
3 UNICEF routine monitoring data (May 2015)4 Simplified LQAS Evaluation of Access and Coverage; LQAS:
Lot Quality Assurance Sampling5 Semi-Quantitative Evaluation of Access and Coverage6 Including cost to beneficiaries as well as government costs
and UNICEF costs7 As seen in Mark Myatt’s article, this number is much lower
when looking only at the UNICEF costs.8 Of total children admitted, only a proportion will be cured
so the cost of RUTF per child cured ($76) is higher than the cost of RUTF per child admitted ($54).
9 NNHS 201410 This assumes a 72% cure rate found in the sites included in
the costing study. This is slightly lower than the current national average of 84.5% cured.D
iego
Mac
ías/
ACF,
Nig
eria
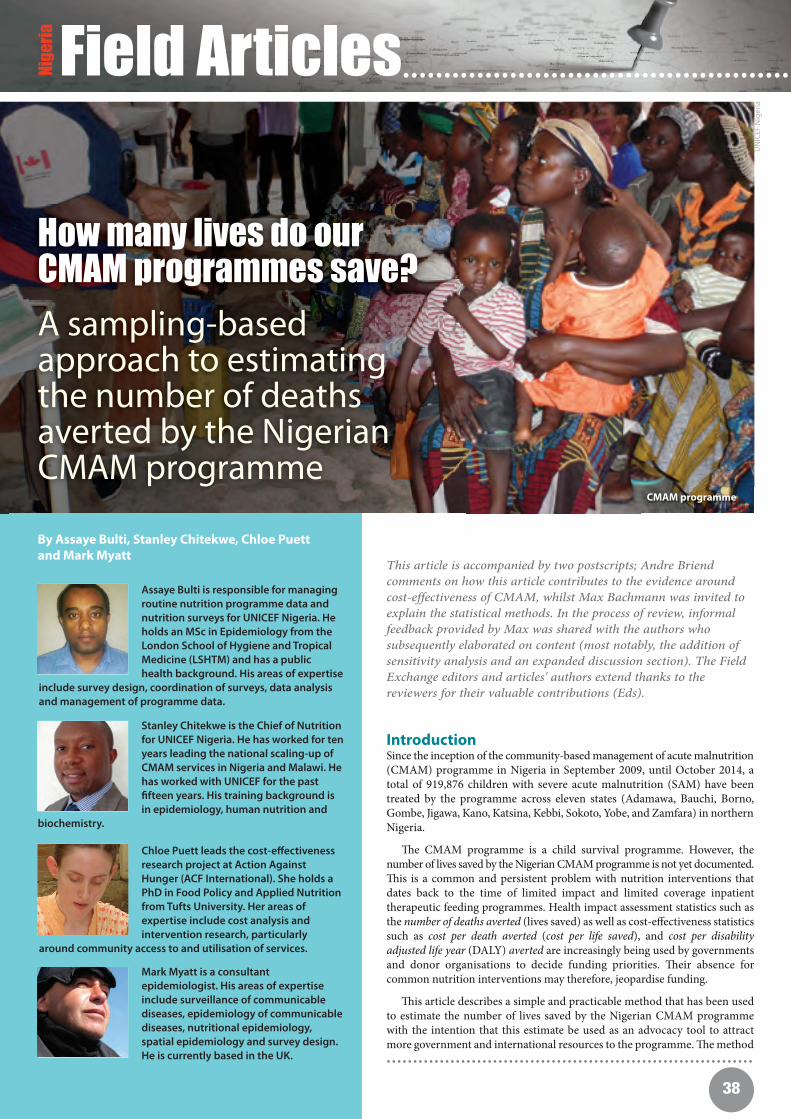
菀8
Field Articles................................................
This article is accompanied by two postscripts; Andre Briendcomments on how this article contributes to the evidence aroundcost-effectiveness of CMAM, whilst Max Bachmann was invited toexplain the statistical methods. In the process of review, informalfeedback provided by Max was shared with the authors whosubsequently elaborated on content (most notably, the addition ofsensitivity analysis and an expanded discussion section). The FieldExchange editors and articles' authors extend thanks to thereviewers for their valuable contributions (Eds).
By Assaye Bulti, Stanley Chitekwe, Chloe Puettand Mark Myatt
Assaye Bulti is responsible for managingroutine nutrition programme data andnutrition surveys for UNICEF Nigeria. Heholds an MSc in Epidemiology from theLondon School of Hygiene and TropicalMedicine (LSHTM) and has a publichealth background. His areas of expertise
include survey design, coordination of surveys, data analysisand management of programme data.
Stanley Chitekwe is the Chief of Nutritionfor UNICEF Nigeria. He has worked for tenyears leading the national scaling-up ofCMAM services in Nigeria and Malawi. Hehas worked with UNICEF for the pastfifteen years. His training background isin epidemiology, human nutrition and
biochemistry.
Chloe Puett leads the cost-effectivenessresearch project at Action AgainstHunger (ACF International). She holds aPhD in Food Policy and Applied Nutritionfrom Tufts University. Her areas ofexpertise include cost analysis andintervention research, particularly
around community access to and utilisation of services.
Mark Myatt is a consultantepidemiologist. His areas of expertiseinclude surveillance of communicablediseases, epidemiology of communicablediseases, nutritional epidemiology,spatial epidemiology and survey design.He is currently based in the UK.
How many lives do ourCMAM programmes save?
A sampling-basedapproach to estimatingthe number of deathsaverted by the NigerianCMAM programme
. . . . . . . . . . . . . . . . . . . . . . . . . . . . . . . . . . . . . . . . . . . . . . . . . . . . . . . . . . . . . . . . . . . . .
IntroductionSince the inception of the community-based management of acute malnutrition(CMAM) programme in Nigeria in September 2009, until October 2014, atotal of 919,876 children with severe acute malnutrition (SAM) have beentreated by the programme across eleven states (Adamawa, Bauchi, Borno,Gombe, Jigawa, Kano, Katsina, Kebbi, Sokoto, Yobe, and Zamfara) in northernNigeria.
e CMAM programme is a child survival programme. However, thenumber of lives saved by the Nigerian CMAM programme is not yet documented.is is a common and persistent problem with nutrition interventions thatdates back to the time of limited impact and limited coverage inpatienttherapeutic feeding programmes. Health impact assessment statistics such asthe number of deaths averted (lives saved) as well as cost-effectiveness statisticssuch as cost per death averted (cost per life saved), and cost per disabilityadjusted life year (DALY) averted are increasingly being used by governmentsand donor organisations to decide funding priorities. eir absence forcommon nutrition interventions may therefore, jeopardise funding.
is article describes a simple and practicable method that has been usedto estimate the number of lives saved by the Nigerian CMAM programmewith the intention that this estimate be used as an advocacy tool to attractmore government and international resources to the programme. e method
CMAM programme
UN
ICEF
Nig
eria
Nig
eri
a

. . . . . . . . . . . . . . . . . . . . . . . . . . . . . . . . . . . . . . . . . . . . . . . . . . . . . . . . . . . . . . . . . . . . . . . . . . . . . . . . . . . . . . . . . . . . . . . . . . . . . . . . . . . . . . . . . . . . . . . . . . . . . . . . . . . . . . .
菀9
Field Article. . . . . . . . . . . . . . . . . . . . . . . . . . . . . . . . . . . . . . . . . . . . . . . . . . . . . . . . . . . . . . . . . . . . . . . . . . . . . . . . . . . . . . . . . . . . . . . . . . . . . . . . . . . . . . . . . . . . . . . . . . . . . . . . . . . . . . .
described in this article was developed by UNICEF Nigeria and BrixtonHealth from previous work undertaken by Tus University, the WorldBank, the International Food Policy Research Institute and BrixtonHealth investigating the cost-effectiveness of different types of therapeuticfeeding programmes[1].
e method described in this article can be performed using readilyavailable data (i.e. routine programme monitoring data, data such as midupper arm circumference (MUAC) at admission that is commonlycollected in SQUEAC coverage assessments, and programme accountingsummaries). is means that the described method provides everyCMAM programme with the ability to produce key health impactassessment statistics.
A counterfactual for estimating the number ofdeaths averted by a CMAM programmeEstimating the number of deaths averted by an intervention requires theconstruction of a counterfactual (i.e. an informed guess at what may havehappened if the intervention had not happened). In the case of thenumber of deaths averted by a CMAM programme, the counterfactual isinformed by the number of SAM cases treated by the programme (NT),the proportion of treated SAM cases cured by the programme (PC), andthe expected excess mortality (EM) in untreated SAM cases with similarseverity of wasting as those treated by the programme. If these are knownor can be estimated, then the number of deaths averted can be calculated:
We know that 919,876 SAM cases were treated by the Nigerian CMAMprogramme between September 2009 and October 2014:
We estimated the proportion cured (PC) using data from:
1. A recently completed retrospective cohort study investigating out-comes in the 102,245 SAM cases admitted to the CMAM pro-gramme in Katsina and Jigawa states between January 2010 and December 2013. e proportion of programme beneficiaries discharged as cured in this study was 70.9%. We used this data to represent programme performance for the entire programme over the fiy-two months from September 2009 to December 2013.
2. Routine programme monitoring statistics for the entire programme for January 2014 to the end of October 2014 for 229,520 programme exits. e proportion of programme beneficiaries discharged as cured in this data was 83.3%. We used this data to represent programme performance over the ten months from January 2014 to October 2014.
A weighted (i.e. by time in months) average of these data is:
is figure is, however, likely to underestimate the true proportion ofbeneficiaries that benefited substantially from the programme. is isbecause it is likely that a significant proportion of defaulting cases willhave “defaulted” because the child had recovered and was clinically well.Such cases might be considered as self-discharged as cured.
e proportion of programme beneficiaries who defaulted in the retro-spective cohort study was 19.7%. e proportion of programme beneficiarieswho defaulted in the routine programme monitoring data for the firstten months of 2014 was 13.3%. A weighted (i.e. by time in months)average of these data is:
Many of the cases that defaulted in the cohort study did so early in thetreatment episode (i.e. more than 50% of cases defaulted aer a single
visit). It is unlikely, therefore that more than about 20% of defaulterscould reasonably be considered to have been self-discharged as cured. It isalso unlikely that none of the defaulters received a substantial benefitfrom attending the programme. It is likely, therefore, that the proportionself-discharged as cured lies somewhere between about 5% and 20% ofall defaulters. ere was no compelling reason to believe that any valuebetween 5% and 20% is more likely than any other so the average of 5%and 20% (i.e. 12.5%) was used.
We estimated the proportion cured (PC) accounting for those self-discharged as cured to be about:
e expected excess mortality (EM) can be estimated from backgroundmortality and expected mortality (i.e. the case fatality rate) in untreatedSAM cases:
We used the under-five years mortality rate (U5MR) for 2009 to 2013 forNigeria from an international database and took the average to estimatebackground mortality as 24.8 deaths per one thousand children per year(see Box 1).
Mortality (i.e. the case fatality rate) in both treated and untreated SAMcases varies with the severity of wasting. Mortality risk increases with in-creasing severity of wasting. Data on mortality risk in untreated SAMcases is available only from historical cohort studies. Since the advent oftherapeutic feeding programmes capable of simultaneously deliveringeffective treatment (i.e. the current therapeutic feeding protocols andproducts) to large numbers of SAM cases (i.e. CTC1/CMAM programmes)earlier this century, leaving SAM cases untreated and waiting for them torecover or die is no longer an ethically defensible option. is means thatwe are restricted to working with historical data.
e Nigerian CMAM programme uses only MUAC and oedema fordeciding admission. About 95.1% of admissions in the retrospective
We used the under-five years mortality rate (U5MR) for 2009 to 2013 forNigeria from an international database and took the average to estimatebackground mortality.
The World Bank (http://data.worldbank.org/indicator/SH.DYN.MORT)reports U5MR for Nigeria for 2009 to 2013 to have been:
The U5MR is the probability that a newborn child will die beforereaching age five and is expressed as deaths per one thousand livebirths. The U5MR data can be expressed as an annual individual risk bydividing by five (to give an annual mortality risk per thousand children)and then dividing by one thousand (to give an individual annualmortality risk). This is also an estimate of the proportion of childrenaged under five years that die each year:
The mean of these estimates is 2.48% (i.e. 24.8 deaths per one thousandchildren per year or 0.68 deaths per ten thousand children per day).
Box 1
Year 2009 2010 2011 2012 2013 2014*
U5MR 136 131 126 122 117 112
Estimating background mortality from summary statistics
* U5MR for 2014 was estimated by linear extrapolation.
Year 2009 2010 2011 2012 2013 2014*
U5MR 2.72% 2.62% 2.52% 2.44% 2.34% 2.24%
* U5MR for 2014 was estimated by linear extrapolation.
1 Community Therapeutic Care
Deaths averted ≈ EM × PC × NT
NT =919,876
PC ≈ 0.729 + (proportion defaulted × 0.125)≈ 0.729 + (0.187 × 0.125)≈ 0.752 (75.2%)
excess mortality (EM) = case fatality rateuntreated SAM cases − background mortality
Proportion cured = = 0.729 (72.9%)0.709 × 52 + 0.833 ×10 52 + 10
Proportion defaulted = = 0.187 (18.7%)0.197 × 52+ 0.133 ×10 52+10

. . . . . . . . . . . . . . . . . . . . . . . . . . . . . . . . . . . . . . . . . . . . . . . . . . . . . . . . . . . . . . . . . . . . . . . . . . . . . . . . . . . . . . . . . . . . . . . . . . . . . . . . . . . . . . . . . . . . . . . . . . . . . . . . . . . . . . .
菀0
Field Article. . . . . . . . . . . . . . . . . . . . . . . . . . . . . . . . . . . . . . . . . . . . . . . . . . . . . . . . . . . . . . . . . . . . . . . . . . . . . . . . . . . . . . . . . . . . . . . . . . . . . . . . . . . . . . . . . . . . . . . . . . . . . . . . . . . . . . .
cohort study were admitted using MUAC with the remainder admittedusing MUAC and oedema (1.4%), oedema alone (0.2%), or discretionarycriteria such as visible severe wasting (3.3%). e very high proportion ofadmissions made using MUAC means that we were able to use mortalityestimates for MUAC cases to estimate expected mortality in untreatedSAM cases.
Figure 1 shows the relationship between MUAC and mortality, expressedin deaths per one thousand child-years, reported by four separate historicalcohort studies [2,3,4,5]. Mortality increases exponentially with decliningMUAC. ere is little between-study variation in the observed relationshipsbetween MUAC and mortality despite the fact that these studies wereundertaken by different teams in different locations at different timeswith varying lengths of follow-up and inconsistent censoring of accidentaland violent deaths. is suggests that each study is estimating the sameunderlying rate and that the observed differences were due to varyinglengths of follow-up, inconsistent censoring of accidental and violentdeaths, measurement error and sampling error.
e estimate of mortality associated with MUAC used in the analysis re-ported here was calculated using the published data on mortality associatedwith MUAC in untreated SAM cases summarised in Figure 1 [2,3,4,5].Linear interpolation was used to estimate expected excess mortality atthe mean admission MUAC (106.1 mm) observed in the cohort study(this data is also collected in SQUEAC coverage assessments). ereported mortality rates were corrected to allow for a backgroundmortality rate of 24.8 deaths per one thousand children per year (see Box1). e correction is made by subtracting background mortality from theestimated case fatality rate:
e linear interpolation and correction process is illustrated in Table 1.
It was assumed that the four mortality estimates in Table 1 were estimatingthe same underlying rate and that the observed differences were due tovarying lengths of follow-up time, inconsistent censoring of accidentaland violent deaths, measurement error, sampling error, errors introducedby our use of simple linear interpolation and propagation of roundingerrors. Under this assumption, an average of the four estimates is likelyto be more accurate than any single estimate.
A useful way of finding an average when you have very few data points is:
e resulting estimated excess mortality rate from the mortality datapresented in Table 1 is:
is is the equivalent of 24.986% (i.e. about one quarter) of untreatedSAM cases with the same mean MUAC (i.e. 106.1 mm) as cases admittedto the programme dying each year.
An objection that is occasionally raised against the use of historicalcohorts of untreated SAM cases to estimate excess mortality in this wayis that there is considerable evidence of significant drops in childhoodmortality over the years since the cohort studies were done [6]. Suchdrops can be seen in Box 1 where the U5MR drops by almost 20% overfive years. e objection is mistaken because the drops in childhoodmortality are, in very large part, due to a combination of reductions inthe incidence of the causes of childhood mortality, improvements in
treatment coverage and improvements in treatment efficacy. In our coun-terfactual, we use the SAM cases admitted to the Nigerian CMAM pro-gramme and model what would happen to these cases if the programmehad not existed. ese cases already have the disease so reductions in in-cidence are not relevant. ese cases are, in the counterfactual, untreatedso improvements in treatment coverage and treatment efficacy are alsonot relevant. e SAM cases in the counterfactual have the same diseaseand the same absence of treatment as the SAM cases in the historicalcohorts. In the absence of additional and contradictory evidence on thecase-fatality rates for untreated SAM at different levels of severity (whichwould now be unethical to collect), there is no good reason to believethat the SAM cases in the counterfactual will not experience similarcase-fatality rates to the SAM cases in the historical cohorts.
Having found/estimated the number treated (NT), the proportion cured(PC), and the expected excess mortality (EM) we estimated the numberof deaths averted by the CMAM programme:
It is important to note that EM and PC are expressed in the same way(i.e. as proportions).
e problem with the estimate of deaths averted calculated above is thatit is only a point estimate. A credible range of values that accounts for theuncertainty in estimates of programme cure-rates (PC) and the expectedexcess mortality rate (EM) would be more useful and more credible.
Accounting for uncertainty – A sampling-basedapproachUncertainty can be incorporated into the calculation of deaths avertedby the CMAM programme using fuzzy numbers. A fuzzy number is ageneralization of a “regular” real number in the sense that it does notrefer to a single value but rather to a connected set of possible values
excess mortality (EM)= case fatality rateuntreated SAM cases − background mortality= case fatality rateuntreated SAM cases − 24.8
Deaths averted ≈ EM × PC × NT≈ 0.24986 × 0.752 × 919,876≈ 172,840
E ( x )≈ min ( x )+max ( x )−min ( x )
2
EM ≈ 171.85 + =327.86 − 171.85
2
Figure 1 The relationship between MUAC and mortality(untreated cases) in four cohort studies [2,3,4,5]
Bangladesh (Briend & Zimicki, 1986)Bangladesh (Briend et al, 1987)Malawi (Pelletier et al, 1983)Uganda (Vella et al, 1994)
100 110 120 130 140 150 160
MUAC (mm)
600
500
400
300
200
100
0
Dea
ths/
1000
/yea
r
249.86 deaths per 1,000 children per year

. . . . . . . . . . . . . . . . . . . . . . . . . . . . . . . . . . . . . . . . . . . . . . . . . . . . . . . . . . . . . . . . . . . . . . . . . . . . . . . . . . . . . . . . . . . . . . . . . . . . . . . . . . . . . . . . . . . . . . . . . . . . . . . . . . . . . . .
菀1
where each possible value has its own weight (or membership function).e membership function typically ranges between zero and one. isrange of weights has been found to be useful in many applications andwhen membership is defined on a semi-quantitative basis. Much of thedata used in the calculation of deaths averted is taken from samples. isallows us to use sampling distributions (probability distributions) to definefuzzy numbers.
For example, the proportion discharged as cured (i.e. 72.9%) was estimatedfrom a retrospective cohort study with a sample of size n = 102,245 androutine programme monitoring data for 229,520 programme exits. etotal sample size for this estimate is:
e proportion discharged as cured is a binomial proportion and can bemodelled using the binomial distribution:
is particular distribution is shown in Figure 2. is is the theoreticalsampling distribution of the proportion discharged as cured. e shape ofthe plot in Figure 2 reflects the level of belief about the true value of theproportion cured (i.e. we have most belief that it is close to the pointestimate and little belief that it could be very far from the point estimate).In this case degrees of belief are determined by the statistical properties(i.e. the point estimate and sample size) of a sample.
In other cases the probability distribution used reflects informedguesses or reasoned belief alone. is is the case (e.g) with the proportionself-discharged as cured (i.e. defaulters who were cured before theydefaulted). In such cases a probability distribution is chosen on a semi-quantitative basis. Given the distribution of lengths of stay in theprogramme for different outcomes we decided that it is likely that theproportion self-discharged as cured lay somewhere between 5% and 20%of defaulters. ere was no compelling reason to believe that any valuebetween 5% and 20% is more likely than any other so the continuousuniform distribution U(0.05, 0.20) was used. If we multiply the proportiondefaulting by this distribution we get a second uniform distribution:
is approach neglects uncertainty in the proportion defaulting. We canmodel this using the binomial distribution:
e fuzzy number for the proportion self-discharged as cured thatcaptures both sources of uncertainty is:
e fuzzy number for the proportion cured (PC) that captures all sourcesof uncertainty is:
is is shown graphically in Figure 3.
e approach of using sampling or probability distributions to definefuzzy numbers using a network of probability distributions is known assampling-based uncertainty analysis [1].
A fuzzy counterfactualTable 2 shows the probability distributions that we used to estimate thenumber of deaths averted by the CMAM programme.
is network of probability distributions is shown graphically in Figure 4.
Field Article. . . . . . . . . . . . . . . . . . . . . . . . . . . . . . . . . . . . . . . . . . . . . . . . . . . . . . . . . . . . . . . . . . . . . . . . . . . . . . . . . . . . . . . . . . . . . . . . . . . . . . . . . . . . . . . . . . . . . . . . . . . . . . . . . . . . . . .
Linear Interpolation
Source Reported mortality attwo MUAC thresholds indeaths/1,000/year
Slope (β) Expected excess mortality in deaths/1,000/per year at MUAC = 106.1 mm (EM)*
MUAC threshold Mortality
Briend & Zimicki (1986) 100 mm 304 304−12.6×6.1−24.8**=202.34
110 mm 178
Briend el al (1987) 100 mm 593 593−39.4×6.1−24.8**=327.86
110 mm 199
Vella et al (1994) 105 mm 366 366−31.1×1.1−24.8**=306.99
115 mm 55
Pelletier et al (1993) 100 mm 340 340−23.5×6.1−24.8**=171.85
110 mm 105
Table 1 The linear interpolation process used to estimate expected excess mortality associated with untreated SAM at the mean admissionMUAC (106.1 mm) in the Nigerian CMAM programme
178–304110−100
β= =−12.6
199−593110−100
β= =−39.4
55−366115−105
β= =−39.4
105−340110−100
β= =−23.5
* The calculation here is excess mortality (EM) = case fatality rateuntreated SAM casess−background mortality ** This is the background mortality (i.e. 24.8 deaths per 1,000 children per year).
Histogram shows one million random numbers drawn from the B (n = 331, 765 p = 0.729)distribution
n = 102,245 + 229,520 = 331,765
B (n = 331,765, p = 0.187)
U (0.05, 0.20) × B (n = 331,765, p = 0.187)
B (n = 331,765, p = 0.729) + [U (0.05, 0.20) × B (n = 331,765, p = 0.187)]
B (n = 331,765, p = 0.729)
U (0.05, 0.20) × 0.187 = U (0.05 × 0.187,0.20 × 0.187) = U (0.0094,0.0374)
Figure 2 Binomial Distribution B(n = 331,765, p = 0.729) used tomodel the proportion discharged as cured
0.726 0.728 0.730 0.732Proportion discharged as cured
50000
40000
30000
20000
10000
0
Freq
uenc
y

. . . . . . . . . . . . . . . . . . . . . . . . . . . . . . . . . . . . . . . . . . . . . . . . . . . . . . . . . . . . . . . . . . . . . . . . . . . . . . . . . . . . . . . . . . . . . . . . . . . . . . . . . . . . . . . . . . . . . . . . . . . . . . . . . . . . . . .
菀菀
Field Article. . . . . . . . . . . . . . . . . . . . . . . . . . . . . . . . . . . . . . . . . . . . . . . . . . . . . . . . . . . . . . . . . . . . . . . . . . . . . . . . . . . . . . . . . . . . . . . . . . . . . . . . . . . . . . . . . . . . . . . . . . . . . . . . . . . . . . .
Figure 3 Determining the fuzzy number for the proportion cured
0.05 0.10 0.15 0.20 0.74 0.75 0.76 0.770.726 0.728 0.730 0.732 0.184 0.185 0.186 0.187 0.188 0.189 0.190
Proportion of defaulters curedProportion discharged as cured Proportion cured (PC)Proportion defaulting
Input Source Distribution* Notes Estimates ...
Number treated UNICEF Nigeria 919,876 A fixed number NT
Proportion discharged as cured Cohort study Routine data B(n = 331,765, p = 0.729) See the Accounting for uncertainty – A sampling-basedapproach section, Figure 2 and Figure 3.
PC
Proportion defaulting Cohort study Routine data B(n = 331,765, p = 0.187)
Proportion of defaulters cured Cohort study U(min = 0.05, max = 0.20)
Background mortality World Bank N(μ = 0.0248, σ = 0.0008) EM
Mortality in untreated cases Historical cohort studies[1,2,3,4]
N(μ = 0.2747, σ = 0.0260)
Deaths averted All of the above data DA*** = EM × PC × NT Final result Deaths averted
Table 2 Probability distributions used to estimate the number of deaths averted by the CMAM programme
max(CFR***)−min(CFR***)2
μ=min(CFR***)+
μ=mean(U5MR)max(U5MR)−min(U5MR)
6σ**=
max(CFR***)−min(CFR***)6
σ**=
* B (n, p) for binomial, U (min, max) for continuous uniform, and N (μ, σ) for normal (one millionobservations were generated from each distribution).** The method for estimating variability (σ) about a mean used here is a statistical rules of thumbcommonly used in PERT/CPM projectmanagement applications and is useful when there are
only a few data points.*** CFR = Case Fatality Rate (the proportion of untreated cases dead after one year).**** DA is the joint or conjugate distribution of EM, PC, and NT.
Figure 4 Network of probability distributions used to estimate the number of deaths averted by the Nigerian CMAM programme
0.15 0.20 0.25 0.30 0.35 0.40 0.15 0.20 0.25 0.30 0.35 100000 150000 200000 2500000.022 0.024 0.026 0.028
Case fatality rate Background mortality Excess mortality Deaths averted
0.05 0.10 0.15 0.20 0.74 0.75 0.76 0.770.726 0.728 0.730 0.732 0.184 0.185 0.186 0.187 0.188 0.189 0.190
Proportion of defaulters cured Proportion defaulting Proportion cured (PC)Proportion discharged as cured

. . . . . . . . . . . . . . . . . . . . . . . . . . . . . . . . . . . . . . . . . . . . . . . . . . . . . . . . . . . . . . . . . . . . . . . . . . . . . . . . . . . . . . . . . . . . . . . . . . . . . . . . . . . . . . . . . . . . . . . . . . . . . . . . . . . . . . .
菀菀
Field Article
. . . . . . . . . . . . . . . . . . . . . . . . . . . . . . . . . . . . . . . . . . . . . . . . . . . . . . . . . . . . . . . . . . . . . . . . . . . . . . . . . . .
250000
200000
150000
100000
Dea
ths
Aver
ted
250000
200000
150000
100000
Dea
ths
Aver
ted
250000
200000
150000
100000
Dea
ths
Aver
ted
0.184 0.186 0.188 0.190
0.726 0.728 0.730 0.732
r = 0.0087
Proportion Cured
0.022 0.024 0.026 0.028
r = -0.0311
r = 0.9941
Sensitivity Analysis
Output (i.e. deaths averted) is slightly sensitive tothe proportion of defaulters cured and verysensitive to the expected case fatality rate in SAMcases not receiving the CMAM intervention.
Background Mortality
0.15 0.20 0.25 0.30 0.35 0.40
Case Fatality Rate
Proportion Defaulting
0.05 0.10 0.15 0.20Proportion of Defaulters cured
r = 0.0022
r = 0.1013
Figure 5 Sensitivity analysis by scatter-plotEach of the distributions in the network was generated using appropriate pseudo-randomnumber generators. In the analysis presented here, each distribution consisted of one millionpseudo-random numbers. All calculations were performed using the R Language for DataAnalysis and Graphics. e R language script for the sampling-based uncertainty analysis usedto estimate the number of deaths averted by the Nigerian CMAM programme is shown in Box1.
Since the output of the network of probability distributions is also a probability distribution,we can produce a point estimate (i.e. the 50% percentile of the output distribution) and a95% credible interval (i.e. the 2.5th and 97.5th percentiles of the output distribution). In theanalysis presented here, the estimate of the number of deaths averted by the NigerianCMAM programme is estimated to be 172,898 (95% CI = 137,526; 208,434).
is type of analysis is usually accompanied by a sensitivity analysis. A sensitivity analysisexplores how sensitive an output variable is to each of the input variables that are used toderive the output. A simple but useful way of performing a sensitivity analysis for a sam-pling-based uncertainty analysis is to produce scatter-plots of the output variable againsteach of the input variables. Each scatter-plot gives a direct visual indication of the sensitivityof the output variable to a single input variable. A strong pattern in the scatter-plot indicatessensitivity to a given input variable. Quantitative measures (e.g. correlation coefficients) mayalso be calculated. A large absolute value of a correlation coefficient indicates sensitivity to agiven input variable. e R language script in Box 1 also performs this type of sensitivityanalysis. In this study, the output (i.e. deaths averted) is slightly sensitive to the proportion ofdefaulters cured and very sensitive to the expected case fatality rate in SAM cases notreceiving the CMAM intervention (see Figure 5).
################################################################################# Input variables for the sampling based uncertainty analysis :## rep Number of sampling replicates (a large number)# NT Number of SAM cases treated by the CMAM programme# sampleN Sample size for the proportion of exits cured and defaulting# curedP Proportion of exits discharged as cured# defaultP Proportion of exits defaulting# U5MR Under five years mortality (proportion dead at one year) for# each year of programme operation#rep <- 1000000NT <- 919876sampleN <- 331765curedP <- 0.729defaultP <- 0.187U5MR <- c(136, 131, 126, 122, 117, 112) / 5 / 1000
## Sampling distributions for the proportions discharged and defaulting#pDisCured <- rbinom(n = rep, size = sampleN, p = curedP) / sampleNpDefault <- rbinom(n = rep, size = sampleN, p = defaultP) / sampleN
## Sampling distribution for the proportion cured in DEFAULTING CASES#pDefCured <- runif(n = rep, min = 0.05, max = 0.20)
## Sampling distribution for the proportion Cured (PC) accounting for# ”self-discharged as cured”.#PC <- pDisCured + (pDefCured * pDefault)
## Background mortality (proportions dead at one year) from U5MR#bgm <- rnorm(n = rep, mean = mean(U5MR), sd = (max(U5MR) - min(U5MR)) / 6)
## Case fatality rate from historical cohort data (proportions dead at one year)#oldData <- c(0.22714, 0.35266, 0.33179, 0.19665)cfr <- rnorm(n = rep,
mean = min(oldData) + (max(oldData) - min(oldData)) / 2,sd = (max(oldData) - min(oldData)) / 6)
## Excess mortality (EM) as case fatality rate – background mortality#EM <- cfr - bgm
## Estimate number of deaths averted (lives saved)#DA <- EM * PC * NTround(quantile(DA, probs = c(0.025, 0.5, 0.975)))
## Sensitivity analysis by scatter-plots#par(mfrow = c(3, 2))par(pty = "s")plot(pDisCured, DA, pch = ".", col = "grey", main = paste("r =", round(cor(pDisCured, DA), 4)))plot(pDefault, DA, pch = ".", col = "grey", main = paste("r =", round(cor(pDefault, DA), 4)))plot(pDefCured, DA, pch = ".", col = "grey", main = paste("r =", round(cor(pDefCured, DA), 4)))plot(bgm, DA, pch = ".", col = "grey", main = paste("r =", round(cor(bgm, DA), 4)))plot(cfr, DA, pch = ".", col = "grey", main = paste("r =", round(cor(cfr, DA), 4)))
Box 1 R language script for estimating deaths averted in the Nigerian CMAM programme
Near-zero correlation coefficient
Near-zero correlation coefficient
Large (r ≈ 1) correlationcoefficient
250000
200000
150000
100000
Dea
ths
Aver
ted
250000
200000
150000
100000
Dea
ths
Aver
ted
Near-zero correlation coefficient
Near-zero correlation coefficient

菀菀
. . . . . . . . . . . . . . . . . . . . . . . . . . . . . . . . . . . . . . . . . . . . . . . . . . . . . . . . . . . . . . . . . . . . . . . . . . . . . . . . . . . . . . . . . . . . . . . . . . . . . . . . . . . . . . . . . . . . . . . . . . . . . . . . . . . . . . .
. . . . . . . . . . . . . . . . . . . . . . . . . . . . . . . . . . . . . . . . . . . . . . . . . . . . . . . . . . . . . . . . . . . . . . . . . . . . . . . . . . . . . . . . . . . . . . . . . . . . . . . . . . . . . . . . . . . . . . . . . . . . . . . . . . . . . . .
Field Article
For comparison, Table 3 shows the cost per death averted, reported for avariety of child survival interventions.
With a little extra data (e.g. the duration of an untreated episode of SAM,average age of SAM cases, sex-ratio of SAM cases, sex-specific life-expectancies at birth, disability weighting for SAM, and a reasonable andwidely accepted discounting/age-weighting function), it is also possible toestimate the number of disability adjusted life years (DALYs) averted andcost per DALY averted [1].
Intervention Context(s) Cost per deathaverted*
CMAM delivered by community healthworkers**
Bangladesh US$869.00[1]
Standard EPI package*** Africa/South Asia
US$313.00[7]
Intermittent Preventive Treatment inInfants (IPTi) for malaria****
Mozambique /Tanzania
US$232.00[8]
Breastfeeding support (range ofprogramming models)
Sub-SaharanAfrica
US$114.00 -US$342.00[7]
Universal vitamin A distribution**** Philippines US$76.30[9]
Mass chemoprophylaxis for malaria*** Gambia US$163.00[9]
Social marketing of insecticide treated nets(ITN)***
Tanzania US$1780.00[9]
Table 3 Cost per death averted for a range of child survivalinterventions
Cost per death averted
=Cost of Programme
Number of deaths averted
= 95% CI = ;
= US $274.25 (95% CI = US $227.49 ; US $344.78)
US $47,416,818172,898
US $47,416,818208,434
US $47,416,818137,526( )
* All dollars values have been standardised to 2012 (i.e. the approximate mid-point of theNigerian CMAM programme) values by multiplying the reported cost by the percentageincrease in the United States Bureau of Labour Statistics' consumer prices index for all urbanconsumers (CPI-U).** The quoted cost is for all staff salaries and allowances, site rental, all logistics costs, allcommunity mobilisation costs, training, supervision, monitoring and evaluation includingSQUEAC coverage assessments, case-finding and “watch-list” follow-up in the community,curative care, and costs to households [1]. Note that this is a much broader range of coststhan is used in the analysis for the Nigerian CMAM programme (see 'A note of caution').*** The quoted cost is for implementing the programme as a semi-vertical addition toexisting healthcare package.**** The quoted cost is for delivering the intervention within an existing EPI programme.
A note of cautionIt is important with any calculation to consider the term garbage in -garbage out. If the data we use to inform our calculations are wrong orof poor quality (i.e. garbage in), then the resulting estimates will alsobe wrong or of poor quality (i.e. garbage out). It is important, therefore,to consider the quality, completeness, and trustworthiness of the inputdata that we use:
Routine programme monitoring data: Monitoring data are oen notwell recorded. A common problem is that the proportion cured isoverestimated. In the work reported here, we used data from beneficiaryrecord cards and applied data cleaning and decision rules to the data.is corrected a tendency for defaulters to be recorded as dischargedas cured at some CMAM sites. We did use routine programmemonitoring data to cover the ten months programme operation notcovered by the retrospective cohort study. e proportion cured in theroutine programme data was higher than that observed in the retro-spective cohort study but this was consistent with an upward trendobserved on the retrospective cohort data and with recent reforms toprogramme activities and siting aimed at reducing default rates. If youuse routine programme monitoring data, then you should check thequality of (at least) a subset of data (e.g. using SQUEAC tools) andcorrect estimates of the proportion cured and the proportion defaultedaccordingly. Checking may be difficult to do in settings of remotemanagement or conflict. If checking cannot be done, then you coulduse the SPHERE minimum standard (e.g. 75%) for the proportioncured.
Data related to programme costs: Costing data oen does not includeall costs that contribute to programme outcomes. Important programmeinputs such as Ready to Use erapeutic Food (RUTF) may be receivedas in-kind donations and thus will not be included in the programme'saccounting records. Costs for (e.g.) security, transport, storage andstaff may be allocated to (or seconded from) other programmes andnot included in accounting records for the programme being assessed.In, for example, an integrated programme delivering CMAM servicesat government health facilities, you may only have the cost of addingCMAM to an existing primary healthcare programme, which providesresources essential to delivering CMAM that are also not included inthe programme's accounting records. Data relating to direct and indirectcosts to beneficiary households (e.g. travel costs, lost labour, &c.) arenever included in budgetary data. ese costs may be consideredduring programme design and in programme coverage assessmentsbut almost never in budget documents, which concentrate on institutionalcosts. Inclusion of this data will usually require a dedicated survey tocollect it [1]. When you use budgetary data, it is important to assessand report on any and all gaps in the budgetary data that you use. Inthe analysis reported here, the cost estimate used covers:• Purchase of RUTF from abroad.• Port handling and warehousing fees for RUTF.• Transport costs for RUTF from ports to state capitals only (states
were responsible for storage and transport to districts, districts were responsible for storage and transport to health facilities).
• Training of staff to deliver the CMAM protocol.• Monitoring and evaluation activities related to the CMAM programme
(excluding coverage assessments).• Administrative costs at the national level.
e cost estimate used does not cover:• Purchase and supply of drugs (e.g. antimicrobials) needed to deliver
the CMAM protocol.• Storage and transport of RUTF and other CMAM-related supplies
from states capitals to districts and from districts to health facilities.
• Salaries, wages, allowances, and recruitment costs for staff in primary healthcare facilities. e Nigerian CMAM programme is implemented as part of an existing primary healthcare system with-out employing new staff or raising staff salaries. e incremental value of health workers' time spent implementing the CMAM programme was also not measured for the analysis reported here.
Additional analysisHaving estimated the number of deaths averted it is possible, with littleextra data, to estimate the cost per death averted (or cost per life saved). etotal cost of the programme over the five years it had been running (whichis also our assessment period) was US$47,416,818. e estimate of the costper death averted is:
UN
ICEF
Nig
eria
CMAM programme

菀菀
. . . . . . . . . . . . . . . . . . . . . . . . . . . . . . . . . . . . . . . . . . . . . . . . . . . . . . . . . . . . . . . . . . . . . . . . . . . . . . . . . . . . . . . . . . . . . . . . . . . . . . . . . . . . . . . . . . . . . . . . . . . . . . . . . . . . . . .
. . . . . . . . . . . . . . . . . . . . . . . . . . . . . . . . . . . . . . . . . . . . . . . . . . . . . . . . . . . . . . . . . . . . . . . . . . . . . . . . . . . . . . . . . . . . . . . . . . . . . . . . . . . . . . . . . . . . . . . . . . . . . . . . . . . . . . .
It should be noted that salaries, wages, allowances, and recruitment costs usually account for about 50% of the cost of an NGO-delivered CMAM programme.
• Allowances, incentives, and “shadow” labour costs for community-based volunteers.
• Costs of maintaining infrastructure including clinic buildings and equipment.
• Direct and indirect costs to beneficiary house- holds.• SQUEAC and SLEAC coverage assessments.
e cost estimate used in the analysis reported here covers the costsneeded to initiate and deliver CMAM services (excluding salary costsand local transportation costs) within an existing primary healthcaresystem in eleven states in northern Nigeria.
It is also important to realise that there may be a temptation for serviceproviders seeking funding for continuation or expansion of programmesto underestimate programme costs in order to make the programmelook more cost-effective than it really is.
Any counterfactual is based on assumptions, guesses, make believe andsome difficult to define and measure data. A counterfactual is a type offiction. It is important that is it not too much of a fiction. is requirescare in selecting and using data and in carrying out calculations. Users ofthe fiction need to be made aware of the limitations of the data used.
Conclusionse analysis presented here is simple to do and can be done with readilyavailable (or easily collected) data. It is simple enough to allow currentestimates to be produced using updated inputs from routine programmemonitoring statistics and budgetary data for inclusion in, for example,monthly or quarterly programme reports and in advocacy material.
It is important to realise that the simple method used here is subject tolimitations arising from the data sources used. e main limitation is theuse of incomplete cost data. e cost data available to us was the cost to adonor organisation of initiating and implementing a large-scale CMAMprogramme within an existing primary healthcare programme. Ourestimate of the cost per death averted reflects only this cost.
Different sets of programme costs will be of interest to different stakeholders.Whilst estimates such as those produced and reported here are relevantto donor organisations and some policy makers, they provide a limitedunderstanding of the full extent of resources required/used by a programme.Capturing a more complete set of costs yields data that can inform pro-gramme design (e.g. to estimate and minimise costs to beneficiary house-holds) and programme implementation (e.g. to estimate staff time
allocation to new services added to existing workloads and avoid “knock-on” quality of care issues). is information can aid our understandingof how much (and what kind of) resources are needed to enable effectiveimplementation. It may prove particularly useful when scaling-up pro-grammes. ese methods require additional data to be collected, andusing this information will require, for example, judgement on staff costcontributions to CMAM (or other new services).
e simple costing method that we used will always produce lower costestimates than methods that capture and use a more complete set ofcosts. Care should always be taken when making comparisons betweenstudies using different methods.
e Nigerian CMAM programme, despite failing to meet SPHERE min-imum standards for proportions cured and defaulting in the initial yearsof operation, has saved a considerable number of lives at a reasonablecost per life saved. is information can be used to advocate forcontinuation and expansion of the existing CMAM programme.
For more information, contact: Mark Myatt, email: mark[at]brixtonhealth.com
References[1] Puett C, Sadler K, Alderman H, Coates J, Fiedler JL, Myatt M, Cost-effectiveness of the
community-based management of severe acute malnutrition by community health workers in southern Bangladesh, Health Policy Plan., 2013;28(4):386-399
[2] Briend A, Zimicki S, Validation of arm circumference as an indicator of risk of death in one to four year old children, Nutr Res, 1986;6:249-261
[3] Briend A, Wojtyniak B, Rowland MGM, Arm circumference and other factors in children at high risk of death in rural Bangladesh, Lancet, 1987;26:725-727
[4] Vella V, Tomkins A, Ndiku J, Marshal T, Cortinovis I, Anthropometry as a predictor for mortality among Ugandan children allowing for socio-economic status, Eur J Clin Nutr, 1994;48:189–197
[5] Pelletier DL, Frongillo EA, Habicht JP, Epidemiologic evidence for a potentiating effect of malnutrition on child mortality, American Journal of Public Health, 1993;83:1130-1133
[6] World Health Organisation, World Health Statistics 2014, WHO, Geneva, 2014 (A full set of World Health Statistics reports are available from http://www.who.int/gho/publications/ world_health_statistics/en/)
[7] Laxminarayan R, Chow J, Shahid-Salles SA, Intervention Cost-Effectiveness: Overview of Main Messages, in Jamison DT, Breman JG, Measham AR, Alleyne G, Claeson M, Evans DB, Jha P, Mills A, Musgrove P (editors), Disease Control Priorities in Developing Countries (2nd ed.), Washington (DC), World Bank, 2006
[8] Hutton G, Schellenberg D, Tediosi F, Macete E, Kahigwa K, Sigauque B, Mas X, Trapero M, Tanner M, Trilla A, Alonso P, Menendez, Cost-effectiveness of malaria intermittent preventive treatment in infants (IPTi) in Mozambique and the United Republic of Tanzania, Bulletin of the World Health Organization 2009;87:123-129
[9] Bishai D, Adam T, Economics of public health interventions for children in developing countries, inJones AM (editor), The Elgar Companion to Health Economics, Edward Elgar Publishing, Cheltenham, UK, 2006
Field Article
UN
ICEF
Nig
eria
A mother attends with her enrolledinfant in a CMAM programme

菀6
. . . . . . . . . . . . . . . . . . . . . . . . . . . . . . . . . . . . . . . . . . . . . . . . . . . . . . . . . . . . . . . . . . . . . . . . . . . . . . . . . . . . . . . . . . . . . . . . . . . . . . . . . . . . . . . . . . . . . . . . . . . . . . . . . . . . . . .
. . . . . . . . . . . . . . . . . . . . . . . . . . . . . . . . . . . . . . . . . . . . . . . . . . . . . . . . . . . . . . . . . . . . . . . . . . . . . . . . . . . . . . . . . . . . . . . . . . . . . . . . . . . . . . . . . . . . . . . . . . . . . . . . . . . . . . .
Promoting community based management of severeacute malnutrition as a child survival interventionBy Andre Briend
Andre Briend is Adjunct Professor at the Department for International Health, University of Tampere School ofMedicine, FIN-33014, Tampere, Finland and Department of Nutrition, Exercise and Sports, Faculty of Science,University of Copenhagen, Rolighedsvej 30, DK-1958 Frederiksberg, Denmark
Striking the balance between pre-vention and treatment is one ofthe most difficult tasks for publichealth nutritionists working in
poor countries. A key element to makedecisions is to consider the potentialimpact of different interventions and alsotheir cost-effectiveness. In this regard,management of severe acute malnutrition(SAM) stands out as it saves lives, whereasthe effect of other interventions is oenmarginally to increase weight or heightgain, with small or immeasurable effectson mortality. is was highlighted by anarticle of the Lancet series which suggestedthat SAM management is one of the mostcost-effective nutrition interventions toprevent malnutrition related deaths1. eseresults are important, but should receiveconfirmation, as the evidence base to sup-port this claim is indirect and arguablyweak compared to standards used to eval-uate other health interventions. SAM treat-ment is typically one of these interventionsfor which a solid evidence base relying ona meta-analysis of a series of randomisedcontrolled trials will never be available.is is a rather common situation in nu-trition where waiting for this type of strongevidence is impossible or even unethical2,3.Estimates of the number of deaths pre-vented by SAM treatment given by theLancet series are based on observation ofmortality reduction in hospital settingswith the progressive improvement of treat-ment protocols and then transfer of thesetreatment protocols to the community. ADelphi process to obtain consensus onthese mortality estimates with and withoutadequate treatment from key experts wasalso used in the process4. ese figuresare then applied to current estimates ofsevere wasting prevalence in different partsof the world to calculate the number ofdeaths which could be averted. Prevalencedata, however, are notoriously inadequate
to estimate the burden of acute conditions:children who are acutely ill or malnour-ished can have died or recovered at thetime of a cross sectional survey, and willnot be counted, a point which was alreadynoted by Cicely Williams more than 40years ago5.
e paper published in this issue ofENN’s Field Exchange trying to estimate“how many lives do our CMAM pro-grammes save” is an interesting contribu-tion to get evidence of effectiveness ofSAM treatment. is paper is based onan approach relying as far as possible onlocally obtained data which has been usedpreviously to estimate the cost effectivenessof community based management of severeacute malnutrition (CMAM) programsin Bangladesh6. To estimate the mortalityof SAM children in absence of treatment,it relies on historical data of untreatedchildren with a low mid-upper arm cir-cumference (MUAC) adjusted for the levelobserved on admission in the programme.is approach is preferable, as MUAC ismore closely related to mortality thanweight-for-height. Also, programme ad-missions are used to estimate the numberof deaths prevented. In the presence ofactive case finding, this gives a morereliable estimate of the SAM burden thanprevalence data used in the Lancet article.Also, the authors used data on backgroundmortality in the country to estimate theexcess of deaths which would happen inthe absence of treatment, which seems areasonable approach. Costs of mortalityreduction are also based on locally collecteddata. is is welcome, as these costs, whichinclude staff cost, transport costs, and areinfluenced by the type of health system,is highly context specific.
e result of this study suggests thatCMAM saves lives at a cost of US $ 274.25per life (95% CI = US $ 227.49; US $344.78). ere are two ways to use these
results. ey can be compared directlywith other child survival interventions asdone by the authors and this shows thatCMAM is a cost effective strategy toprevent deaths. is figure can also becompared in pure economic terms withthe annual Gross National Product (GDP)of the country, as recommended byWHO7. With this approach, cost of adeath averted by CMAM is less than theregional GDP and can be regarded as“highly cost-effective”.
e methodology described in thisstudy has clear limitations as it is basedon assumptions on mortality which cannotbe validated. However, these estimates arethe best we can have with currently availabledata. It is a transparent approach whichcan be applied to other settings. Replicationof this study in other contexts will help tocollect more solid evidence on the cost-effectiveness of CMAM treatment. esestudies may prove a more powerful advo-cacy tool at the national level than currentglobal estimates, which are always difficultto apply to the local context.
1 Bhutta ZA, Das JK, Rizvi A, et al. Evidence-based interventions for improvement of maternal and child nutrition: what can be done and at what cost? Lancet 2013; 382: 452–77.
2 Blumberg J, Heaney RP, Huncharek M, et al. Evidence-based criteria in the nutritional context. Nutr Rev 2010; 68: 478–84.
3 Mann JI. Evidence-based nutrition: Does it differ from evidence-based medicine? Ann Med 2010; 42: 475–86.
4 Lenters LM, Wazny K, Webb P, Ahmed T, Bhutta ZA. Treatment of severe and moderate acute malnutrition
in low- and middle-income settings: a systematic review, meta-analysis and Delphi process. BMC Public Health 2013; 13 Suppl 3: S23.
5 Williams CD. Protein-calorie malnutrition. Lancet 1972; 1: 1333.
6 Puett C, Sadler K, Alderman H, Coates J, Fiedler JL, Myatt M. Cost-effectiveness of the community-based management of severe acute malnutrition by community health workers in southern Bangladesh. Health Policy Plan 2013; 28: 386–99.
7 WHO | Cost-effectiveness thresholds. WHO. http://www.who.int/choice/costs/CER_thresholds/en/ (accessed April 10, 2015).
Postscript
Postscript

菀7
. . . . . . . . . . . . . . . . . . . . . . . . . . . . . . . . . . . . . . . . . . . . . . . . . . . . . . . . . . . . . . . . . . . . . . . . . . . . . . . . . . . . . . . . . . . . . . . . . . . . . . . . . . . . . . . . . . . . . . . . . . . . . . . . . . . . . . .
. . . . . . . . . . . . . . . . . . . . . . . . . . . . . . . . . . . . . . . . . . . . . . . . . . . . . . . . . . . . . . . . . . . . . . . . . . . . . . . . . . . . . . . . . . . . . . . . . . . . . . . . . . . . . . . . . . . . . . . . . . . . . . . . . . . . . . .
How many lives do our CMAM programmes save?Statistical commentary By Max O Bachmann
Max Bachmann is Professor of Health Services Research at Norwich Medical School, University of East Anglia, UK
The authors of this study aimedto answer this question by esti-mating how many children whoreceived CMAM in Nigeria died,
then estimating how many of them wouldhave died if they had not received CMAM,then subtracting the first estimate fromthe second. ey then go on to estimatehow much CMAM cost for every deathaverted.
Some readers may be put off by theequations and graphs in the article, butthe basic principles are quite simple. ecalculations are all based on just sevensets of numbers (called “inputs” or “para-meters” in this type of modelling study).e six parameters used to estimate deathsaverted are listed in the first column ofTable 2. e seventh parameter is the totalcost of the CMAM programme.
e results of such a study are uncertain,partly because of uncertainty about thetrue values of the parameters. Much of
the paper – in the section headed “Ac-counting for uncertainty – A sampling-based approach” – is about how the authorsdealt with this “parameter uncertainty”.is method is what health economistscall a “probabilistic sensitivity analysis”.In other words, if we don’t know the truevalue of some parameters, we change theirvalues many times, each time repeatingthe calculations, then seeing how muchthe final results vary with repeated sam-pling. We get a computer to do this, eachtime sampling from a frequency distribu-tion which we have assumed for each pa-rameter. We can then report the uncer-tainty about each estimate, conventionallyusing the 5th and 95th percentiles.
e third column of Table 2, and Figures2-4, describe the frequency distributionsused in this study. As the figures illustrate,the computer will mostly sample numbersnear the middle of the distribution, whichis where the average or mostly likely valueof the parameter lies. Values further away
from the middle are sampled less oen,because there is reason to believe they areless likely to be true. e only exceptionis for the proportion of defaulters cured,which for some reason the authors assumehas an equal probability of being anywherebetween 5% and 20%, but zero probabilityof being less than 5% or more than 20%.ere is no statistical uncertainty aboutthe number treated. e statistical uncer-tainty about the proportions dischargedas cured or defaulting are tiny because ofthe enormous sample size (almost a millionchildren). I don’t understand the reasoningbehind the uncertainties for backgroundmortality and mortality in untreated cases(called σ in Table 2), which does not seemto be based on any statistical principlethat I am aware of1. In any case, althoughthere is little or no uncertainty about sixof the seven parameters used to estimatethe numbers of deaths averted, when theyare all combined through the various cal-culations in the model, the confidence in-terval around the number of deaths avertedis quite large, that is, plus or minus 20%of the central estimate.
Commercially available soware pro-grammes commonly used by health econ-omists, such as TreeAge, make it easy todo probabilistic sensitivity analyses likethis, with the assistance of graphics andmenus. However they can be expensiveand are more than is really needed for ananalysis such as this. e advantages ofusing open access soware such as R arethat is free2 and, as Box 1 shows, quitesimple and transparent to anyone who isnot put off by simple programming language.
1 In response to this commentary, a footnote marked ** was subsequently added to Table 2 of the article by theauthors to explain the basis of their reasoning.
2 R is a programming language and softwareenvironment for statistical computing and graphics. Ris a GNU project (a free software, mass collaboration project). http://en.wikipedia.org/wiki/GNU_Project
Postscript
Children attending a CMAM programme
UN
ICEF
Nig
eria
Postscript

. . . . . . . . . . . . . . . . . . . . . . . . . . . . . . . . . . . . . . . . . . . . . . . . . . . . . . . . . . . . . . . . . . . . . . . . . . . . . . . . . . . . . . . . . . . . . . . . . . . . . . . . . . . . . . . . . . . . . . . . . . . . . . . . . . . . . . .
菀8
Field Article
By Maureen Gallagher, Saúl Guerrero,Ifeanyi Maduanusi and Diego Macías
Maureen Gallagher is theSenior Nutrition & HealthAdvisor Action AgainstHunger US based in New York.She is a public healthspecialist with an MSc inSocial Policy and Planning
specialising in health policy. She has been workingin nutrition programming for the last 15 years inNiger, East Timor, Uganda, Chad, DRC, Burma,Sudan and Nigeria.
Saul Guerrero is Director ofOperations at Action AgainstHunger (ACFUK). Prior tojoining ACF, he worked forValid International Ltd. in theresearch, development androll-out of CTC/CMAM. He has
worked in over 20 countries in Africa and Asia.
Ifeanyi Maduanusi is aProgramme Quality andAccountability TechnicalAdvisor for Action AgainstHunger in Nigeria. He led theimplementation of most theSQUEACs while he worked as
CMAM Deputy Programme Manager for theCoverage Project.
Diego Macías is a LearningOfficer for ACF, working onlearning outcomes fromcoverage programmes,including data analysis andqualitative assessments.
The authors would like to thank the participatingFederal and States’ authorities, health workers andcommunities for their commitment to CMAM,support and active participation throughout theCoverage Project. Thanks also to the CoverageMonitoring Network for their technical support.Thank you to UNICEF, Save the Children, ValidInternational and Centre for CommunicationsProgramme in Nigeria for their collaboration aspartners of the consortium. The authors would liketo acknowledge the contribution of the Children’sInvestment Fund Foundation (CIFF) for their supportto the Coverage Project and CMAM in Nigeria.
The Coverage Project:a national partnershipfor evaluating CMAMservices in Nigeria
Figure 1 Maps highlighting States and LGAs offering CMAM services
LegendState boundariesLGAs without CMAMLGAs with CMAMState with CMAM
The Severe Acute Malnutrition (SAM) burden in Nigeria is known to be amongstthe highest in the world, with over 10% of the global burden, resulting in an es-timated 2 million children affected. Since 2009, the Government of Nigeria,with the support of UNICEF, started tackling the problem by piloting Commu-
nity-based Management of Acute Malnutrition (CMAM) in two Local Government Areas(LGAs), one in Kebbi State and the other in Gombe State. Since then, Nigeria has proventheir strong commitment to the fight against SAM, with geographical coverage extendingto 91 LGAs in 11 states of the country, including 642 health facilities, as presented inFigure 1. is has also been possible as partners and donors have supported federal andstate Ministries of Health (MoH) to institutionalise SAM management as part of regularroutine health services. More than 1,000,000 children received treatment between 2009and mid-2015.1
A large component of this scale up has been possible due to a strong partnershiplaunched between the Children’s Investment Fund Foundation (CIFF), UNICEF and theGovernment of Nigeria (GoN) in 2013 (see article in this 50th issue of Field Exchange).is also generated the opportunity for comprehensive evaluation and learning aboutprogressively scaling up CMAM services. As a result, another partnership – for assessmentand learning of coverage – was formed. ACF, Save the Children and Valid Internationalworked together with UNICEF and MoH to design the Coverage Project, a collaborationin support of evaluation of SAM services funded by CIFF. e project included two keycomponents: 1) Assessment of coverage and 2) Community Mobilisation Pilot Project.e findings, recommendations and lessons learned from the project were broughttogether in a Learning Review document2. Both project components were undertaken inclose consultation and collaboration with the MoH and UNICEF.
1 ACF (2015). SAM Management in Nigeria: Challenges, Lessons & the Road ahead2 Learning Review. SAM Management in Nigeria: Challenges, Lessons & the Road Ahead.ACF International, ACF
Nigeria. March 2015. Available at: http://www.coverage-monitoring.org/resources-library/
Carers and children attending a CMAM programme
Die
go M
acía
s/AC
F, N
iger
ia

菀9
. . . . . . . . . . . . . . . . . . . . . . . . . . . . . . . . . . . . . . . . . . . . . . . . . . . . . . . . . . . . . . . . . . . . . . . . . . . . . . . . . . . . . . . . . . . . . . . . . . . . . . . . . . . . . . . . . . . . . . . . . . . . . . . . . . . . . . .
. . . . . . . . . . . . . . . . . . . . . . . . . . . . . . . . . . . . . . . . . . . . . . . . . . . . . . . . . . . . . . . . . . . . . . . . . . . . . . . . . . . . . . . . . . . . . . . . . . . . . . . . . . . . . . . . . . . . . . . . . . . . . . . . . . . . . . .
The Coverage Project in Nigeriae Assessment of Coverage component was im-plemented in two phases. First, a SLEAC3 wasconducted by Valid International to classify cov-erage of 71 of the 91 LGAs implementing CMAMprogramming between October 2013 and March2014, providing an overall picture of the coveragelevels of CMAM throughout a high proportionof LGAs. e SLEAC offered a clear view onboth the geographical and the direct coverage ofCMAM in the region, identifying regions, espe-cially in the northwest, where efforts were neededmost. e results are presented in Figure 2.
A national workshop was held with key stake-holders to review findings and identify locationsfor the second phase of this component. Morein depth information on coverage was obtainedthrough 12 Semi Quantitative Evaluation andAccess of Coverage (SQUEAC) surveys whichwere implemented by ACF and Save the Children,with support of the Coverage Monitoring Net-work (CMN) and Valid International. A practicaltraining was conducted in March 2014, whenthe first survey was jointly done. en, Save theChildren conducted five surveys in the northwestand ACF conducted six surveys in the northeast.All surveys were completed by December 2015.Key findings of the more in depth analysis pro-vided by the SQUEACs on barriers to accessare presented in Figure 3.
Based on SLEAC and SQUEAC findings,which clearly revealed the lack of awarenessabout SAM and of services available as commonbarriers to access across states, the CommunityMobilisation Pilot Project was developed inpartnership with the Centre for CommunicationProgrammes Nigeria (CCPN) in June 2014. epilot approach for a sensitisation campaign wasdeveloped and tested in two LGAs in SokotoState – Goronyo and Sokoto South LGAs (bothhad SLEACs conducted in November 2013 andone SQUEAC was conducted in Goronyo inMarch 2014). e choice of State and LGAs wasdiscussed and agreed between ACF, Save theChildren and UNICEF based on common criteria.
UNICEF then supported the visit and intro-duction of CCPN to Sokoto State. Workshopswere held with key stakeholders in the State toexplain the goals of the initiative and engageparticipants in the design of the awarenessstrategy and tools. e campaign was imple-mented by Hikima Community Mobilisationand Development Initiative (HCOMDI), a localgrassroots organisation. During the four monthsof the campaign (October 2014 - Jan 2015),over 110 community dialogues, 300 householdvisits and active case-finding activities were de-livered with the support of community volunteersand involvement of key stakeholders of the out-reach area; about 32,000 people are estimatedto have been reached during the campaign. Inorder to measure the impact of the approachand compare it between LGAs, end lineSQUEACs were conducted in both LGAs inFebruary 2015. e results of the pilot projectare presented in Box 1.
A final workshop was held mid-March 2015in order to present the SQUEAC and pilotproject results, as well as to engage key stake-holders on next steps and recommendations inorder to strengthen key findings. Directors ofPrimary Health Care (PHC), State NutritionOfficers (SNO) from the 11 states and FMOHNutrition Department members attended theworkshop and shaped key recommended actions.A summary of actions proposed by the Directors,SNOs, and other partners to tackle the key chal-lenges revealed by the coverage assessments ispresented in Box 2.
Lessons learned for SAM scaleup in Nigeriae Learning Review – SAM Management inNigeria: Challenges, Lessons & the Road Ahead5–outlines the current state of SAM in Nigeria,provides the detailed in depth analysis andresults of the coverage assessment, the outcomesof the pilot project and the recommendationsfor improving SAM in Nigeria. It was revisedand agreed on by all partners of the project.Some of the key lessons learned from the Cov-erage project, pulled together from multiplestreams – including the comprehensive SAMcontext analysis, coverage assessments, pilotproject and workshop inputs – and reflected inthe learning review are outlined below.
1. Two out of every three SAM cases in NorthNigeria are not accessing treatment.Recent surveys carried out by the SLEAC of2013-14 suggest that CMAM services across the 11 northern states are reaching an estimated 36.6 per cent of SAM cases.
2. SAM management services are located in states with the greatest need, but the spreadof services within those states remains limited. Most states only offer SAM treat-
Figure 2 SLEAC’s map of the 11 CMAM States showing coverage classification by LGA
Figure 3 Most common barriers to CMAM services as identified by the regional SLEAC(number of respondents, % of total)
LegendModerateLowHigh
6.0%5.0%
37.7%Lack of knowledge about malnutritionLack of knowledge about the programmeLack of awareness on how CMAM worksConstraints faced by mothers/care giversProblems with service deliveryGeographical issues (mainly access)Other (mostly the child dislikes RUTF)
1.3%69264
317
496
861
1,280
1,987
9.4%
16.3%
24.3%
3 Simplified LQAS (Lot Quality Assurance Sampling) Evaluation of Access and Coverage
Field Article

菀0
. . . . . . . . . . . . . . . . . . . . . . . . . . . . . . . . . . . . . . . . . . . . . . . . . . . . . . . . . . . . . . . . . . . . . . . . . . . . . . . . . . . . . . . . . . . . . . . . . . . . . . . . . . . . . . . . . . . . . . . . . . . . . . . . . . . . . . .
. . . . . . . . . . . . . . . . . . . . . . . . . . . . . . . . . . . . . . . . . . . . . . . . . . . . . . . . . . . . . . . . . . . . . . . . . . . . . . . . . . . . . . . . . . . . . . . . . . . . . . . . . . . . . . . . . . . . . . . . . . . . . . . . . . . . . . .
ment services in less than half their local government areas, which considerably reduces the capacity to deliver services to the targeted population.
3. e expansion of CMAM services has not been matched by an increase in trained and available staff.Training and follow up of an increased number of health workers and CVs has the potential to increase the quality of services delivered both through the avail-ability of adequate numbers of personnel and the improvements in treatment, screening, referral and follow-up activities. For instance, evidence from SQUEAC assessments show that some inconsistencies exist with regards to CMAM protocols at times of cured discharges. Revising modes of delivery and extending staff training can also improve quality of care.
4. Making CMAM services available does not make them accessible. e data shows that the coverage in areas with a higher number of facilities, or smaller geographical or demographic catchment areas, is not necessarily higher. Efforts to improve infrastructural and logistic obstacles, such as stock outs of ready-to-use therapeutic food (RUTF), are necessary. Stock outs were especially problematic in Goronyo with SLEAC and SQUEAC surveys showing these lasting more thantwo months in late 2013/early 2014. Examples of approaches to address stock outs could include an increase in LGA and health facility based stocks of RUTF. Furthermore, a doubling or tripling of rations could be considered as a way of reducing the numbers of visits and time spent traveling for caregivers.
5. Awareness about SAM, the existence of CMAM and the way it functions can and must be improved. A community mobilisation strategy should be designed to sustain wider sensitisation campaigns involving local populations and empowering local and state authorities. Recent evidence suggests that increased awareness helps to increase admissions to CMAM. Moreover, in the long term it might help improve service delivery itself.
6. ere is room for improving the quality of SAM management information and data. e scale up of CMAM services requires strong information systems that can provide reliable and timely information to decision makers at LGA, state and federal levels. Improving the quality of available information must beprioritised and the expansion of existing pilot models (including Rapid SMS) considered. Strong commitmentsto capacity building, training and resource allocations are necessary to improve the performance of CMAM service delivery; this can only happen via a coordinatedmechanism between key nutrition stakeholders in country.
e Coverage project and a key output in the form alearning review has been a positive joint partner initiativeto work in support of the GoN to further advance andsucceed in their fight against SAM. Key next steps willinvolve close follow-up of application of recommendationsand monitoring of coverage for further strengtheningCMAM in Nigeria.
For more information, contact: Maureen Gallagher, email: [email protected]
1) Innovative awareness-raising method• Diversify groups and locations for meetings: community dialogues, social, town
hall, compound and household meetings• Diversify key stakeholders involved : include community & religious leaders,
traditional birth attendants (TBAs), school teachers and students• Use of community based organisations (CBOs) and existing support groups • Use of media, mobile phones/SMS, IEC (information, education &
communication) materials to sensitise the public • Community action-oriented activities such as: local dramas, local songs, food
demonstrations, community nutrition champions2) Resource learning to institutionalise CMAM and scale up
• Evidence-based advocacy and sensitisation to engage philanthropists, policy makers, and first ladies to support CMAM, at all levels
• Include nutrition and CMAM into state budget / Costed Nutrition Plans and timely release of funds
• Engage in public-private partnership to support nutrition and CMAM• Collaborate with other projects such as Millennium Development Goals Fund
projects and Maternal Child Health initiatives• Reactivate and strengthen committees for food and nutrition for resource
mobilisation 3) Strengthen adherence to national protocol
• Increasing number of health workers trained and refresher training on national protocol and its application
• Continuous training of community volunteers on detection and referral• Routine and supportive supervision by the State MoH teams• Engage trained and skilled community health extension workers for
management of SAM 4) Improve data quality
• Strengthen capacity of service providers on data collection, management and analysis and M&E systems
• Timely supportive supervision, on-site monitoring, dissemination and feedback at all levels (consider the use real time monitoring through smart phones)
• Verification and validation of data, including data quality assessments• Provision of a central databank for nutrition programmes
5) Strengthen community volunteer (CV) network• Training and retraining of CVs with regular meetings and experience sharing
with health workers • Strengthen CVs to support outpatient activities in the communities (screening,
tracing of defaulters, referral and home visits) • Performance awards for motivated and engaged CVs • Motivation and incentives schemes should be considered for CVs
Box 2 Key actions proposed by stakeholder to tackle main barriersto increasing coverage of CMAM in Northern Nigeria
• Admissions. In both LGAs, the admissions between September and December 2014 were higher in proportion to total yearly admissions compared to the earlier part of the year (41% in Goronyo and 40.6% in Sokoto South). Seasonality did not affectadmission rates in this case, as the lean season is between May and August, which would have led to higher admissions during that part of the year rather than Sept-Dec and/or Jan-April.
• Barriers to access. The study demonstrated that barriers can be positively tackled. In Goronyo, awareness related barriers (about malnutrition, the ongoing programme and/or how the programme works) accounted for 71% of the reasons provided by all non-covered cases for not accessing services prior to the campaign.This proportion reduced to 48% after the campaign. Whilst this is based on a small sample, it does suggest that targeted campaigns can have a measurable impact on awareness related barriers. As a result of the decrease in awareness related barriersreported, two other key barriers were more widely reported – quality of service delivery (including stock outs) and constraints faced by the mother (opportunity costs, money for transport). This suggests that addressing awareness is effective yet not sufficient to increase coverage alone as other barriers become more prominent.
• Coverage. Estimated coverage levels did not significantly change between baseline and endline. Sokoto South’s level indicated slight improvement in comparison to the SLEAC (below 20%), whereas Goronyo (14.7%) did not reflect meaningful changes4. This is likely to have been due to a combination of wide confidence intervals but also because other barriers became more prominent, indicating that all barriers need to be addressed at the same time to result in increased coverage.
Box 1 Community mobilisation pilot project results
4 The first programme SQUEAC took place precisely in Goronyo and its coverage estimate was 14.3%. In the SLEAC in late 2013, the LGA had an estimated coverage of 0.5%.
5 See footnote 2
Field Article

菀1
. . . . . . . . . . . . . . . . . . . . . . . . . . . . . . . . . . . . . . . . . . . . . . . . . . . . . . . . . . . . . . . . . . . . . . . . . . . . . . . . . . . . . . . . . . . . . . . . . . . . . . . . . . . . . . . . . . . . . . . . . . . . . . . . . . . . . . .
Research...........................................................Nig
eri
a
By Sasha Frankel, Mark Roland and Marty Makinen
Sasha Frankel worked for the Resultsfor Development Institute as a SeniorProgramme Associate focusing onhealth financing and costing work inGhana and Nigeria. She is currentlypursuing a Master in Public Affairs atPrinceton’s Woodrow Wilson School of
Public and International Affairs.
Mark Roland is a Senior ProgrammeOfficer at the Results for DevelopmentInstitute. His work, which spans theeducation and health sectors, focuseson programme evaluation and analysesof cost and financial sustainability.
Marty Makinen is a Managing Directorat the Results for DevelopmentInstitute. He is a health economist withmore than 30 years of experience andhas worked extensively in the areas ofhealth financing and the economics ofnutrition.
Results for Development Institute (R4D) was supported byconsultants Joel Lehmann – who provided technical supportto the study and instrument design, as well as training andfield supervision – and Bryan Plummer, who assisted in datacleaning and analysis. For on-the-ground data collection,R4D worked with Binomial Optimus Limited (BOL), anevaluation firm based in Abuja, Nigeria. BOL co-managed thedata collection effort, including recruitment, training, andsupervision of enumerators. Initial instrument developmentwas supported by Health Systems Consult, Ltd. This analysiswas made possible thanks to the support of the Children’sInvestment Fund Foundation (CIFF). The report benefitedfrom strong technical guidance from a number ofcounterparts at CIFF, in particular Amy Mayberry.
Costs, cost-effectiveness, and financialsustainability of CMAM in Northern Nigeria
BackgroundTo date, the evidence on the efficacy and cost-effectiveness of CMAM has beenencouraging. Previous studies suggest that CMAM can reduce the cost andbarriers to access associated with inpatient care, and in certain contexts, reducemortality. is study1 provides an estimate of the cost, cost-effectiveness, andfinancial sustainability of the CMAM programme in northern Nigeria based ondata collected in four states.
is information is intended to equip government, external financers, andprogramme implementers with data to inform decisions around programmaticexpansion. Cost and financial sustainability data will allow the Nigeriangovernment, at both the federal and state levels, to understand what financialactions must be taken to ensure that sufficient resources are directed toward theCMAM programme. Cost-effectiveness data can help policymakers understandthe value of their investments in CMAM relative to alternatives and provideevidence to help make the argument for appropriate budgetary commitments.
Methodologye categorisation of costs varies across similar studies conducted to date2, as dothe methods used to collect cost information. is study uses a “bottom-up”methodology, in which data about cost line items were gathered through facility-level interviews rather than relying upon existing budgets/programmatic reporting.As a result, this study appears to have assembled a more robust and comprehensiveestimate of costs associated with obtaining CMAM treatment (through inclusionof items not found in official CMAM budgets, such as proportion of facilityoverhead costs).
Economic vs. financial costsTotal cost per child cured includes several cost components that can be categorisedas either financial or economic. Financial costs or cash outlays are those thatsupport the functioning of the CMAM programme and economic costs are costs
1 Frankel S, Roland M, Makinen M (2015). Costs, Cost-Effectiveness, and Financial Sustainability of Community-based Management of Acute Malnutrition in Northern Nigeria. Results 4 Development Institute, June 2015
2 Cost per child cured in other examined studies are as follows: Ethiopia: $135 (Tekeste et al), Malawi: $169(Wilford et al), Bangladesh: $180 (Puett et al), Zambia: $203 (Bachmann), Indonesia: $332 (Purwesti), Ghana:$805 (Abdul-Latif)
Diego Macías/ACF, Nigeria

菀菀
. . . . . . . . . . . . . . . . . . . . . . . . . . . . . . . . . . . . . . . . . . . . . . . . . . . . . . . . . . . . . . . . . . . . . . . . . . . . . . . . . . . . . . . . . . . . . . . . . . . . . . . . . . . . . . . . . . . . . . . . . . . . . . . . . . . . . . .
. . . . . . . . . . . . . . . . . . . . . . . . . . . . . . . . . . . . . . . . . . . . . . . . . . . . . . . . . . . . . . . . . . . . . . . . . . . . . . . . . . . . . . . . . . . . . . . . . . . . . . . . . . . . . . . . . . . . . . . . . . . . . . . . . . . . . . .
borne by the economy as a whole (includingopportunity cost). Examples of both types ofcosts can be found in Table 1. Inclusion of bothfinancial and economic costs in costing analysesis crucial to understand the full cost of the pro-gramme. Financial costs only are used for thecost-effectiveness and fiscal space analysis torepresent the estimated cost to government andUNICEF in this scenario.
Study design and settingsCosts were observed at eight organisationallevels and specific survey instruments were thendeveloped for each level to elicit relevant costinformation. Table 2 lists each of them, alongwith the cost elements collected.
Sampling Four of the eleven CMAM states in northernNigeria were selected for the study: Bauchi,Jigawa, Sokoto and Kano, with security being aprimary criterion for selection. Data were col-lected in four waves, conducted quarterly from2013-2014 to take into account seasonal variations(see Table 3). Within each state, three of theLGAs where CMAM services are delivered wererandomly sampled to participate in the survey3.Within each LGA there are multiple OTPs, oneof which was selected at random to participatein the study. A total of 25 different LGAs, 25SCs, and 40 OTPs participated in the studyacross the four waves.
Data collectors used the survey instrumentto interview a focal person in each state, LGA,OTP, and SC, so for each wave there were atotal of four respondents at the state level, and12 at each LGA, OTP, and SC level. At the statelevel, the focal person was typically the StateNutrition Officer (SNO), although in a fewcases, when the SNO was unavailable, the As-sistant SNO or the Community Health Officerwas interviewed. At the LGA level, the NutritionFocal Person or their deputy were interviewed.At the OTP, data collectors identified the healthworkers most directly involved with provisionof CMAM services. If that person was unavailable,the next most senior person at the OTP was in-terviewed. At the SC, the CMAM focal personwas interviewed.
ResultsCostsCost per child cured. e cost per child curedestimate includes all costs collected from or-ganisational levels, both economic and financialcosts, as well as costs associated with SAMpatients who either died or defaulted, meaningthey did not complete treatment. Our findingsshow that for every 1,000 children who completetreatment, 17 children die and 254 default onaverage across the four states.
e comprehensive average cost per childcured4 is $219, of which $160 (73%) are financialcosts borne by the government and UNICEFand $59 (27%) are economic costs. is costwas predominantly driven by RUTF, staff, andout-of-pocket costs, which together comprisemore than 85% of total costs (see Table 4).RUTF constitutes the single largest share oftotal costs: for every child cured, $76 worth ofRUTF was needed. Of nearly identical magnitudewere staff costs, which comprise 34% ($74 dollarsper child cured). Staff costs were drawn fromsalaried and non-salaried actors, with non-salaried CVs accounting for almost a third ofstaff costs through stipend, transportation andopportunity costs. e remaining 15% of costsare comprised of opportunity costs, supply chain,drugs, monitoring, overhead, and training costs.
Staff costs by type. Staff costs, which are thesecond largest driver of costs, were drawn fromsalaried and non-salaried actors. Non-salariedcommunity volunteers account for nearly a thirdof staff costs, which includes opportunity cost,stipend and transportation for the CVs (seeFigure 1).
Cost per child by state. It is important to high-light that costs per child cured varied acrossstates, from $175 in Jigawa and Kano to $273in Sokoto, reflecting a range of contexts inwhich the programme is operating6 (see Figure 2).Although Sokoto’s annual costs are the second-lowest among all states, the number of childrenreported to be cured in those OTPs is less thanhalf as many as in the other OTPs. e numberof RUTF issued per patients cured is also highestin Sokoto (133 sachets in Sokoto compared to115 on average across the other states). ismeans that more patients default and die perpatient cured in Sokoto than in other states, sofor every one patient cured, the OTPs give outrelatively more RUTF – including to patientswho are not getting cured – which may contributeto Sokoto’s higher costs. Sokoto had similarcure rates to the other states and did not havethe highest rate of defaulters. However, it hadthe highest rate of deaths per 1,000 admissionsat 25 compared to 8, 17, and 19 in Bauchi,Kano, and Jigawa respectively. However, RUTF
Economic costs Financial costs
Staff time not paid for by CMAM,caregiver time, user fees, use ofhealth facilities, communityvolunteer time and costs
Cash outlays for drugs, materials for CMAM programme administration,resources for trainings and monitoring visits, supply chain activitiesinvolved in managing the CMAM drugs and materials, transportation,RUTF, stipends for the CV, salaries of CMAM-specific health workers
Economic and financial costs collectedTable 1
Organisational level Cost elements collected
UNICEF Staff time, monitoring, RUTF, supply chain, training, start-up equipment
State Nutrition Officer Staff time, monitoring, supply chain, CMAM drugs, MIS tools,miscellaneous CMAM costs
Local Government Authority(LGA) Nutrition Officer
Staff time, monitoring, supply chain, CMAM drugs, MIS tools,miscellaneous CMAM costs
Stabilisation Centre (SC) HealthWorker
Staff time, drugs, overhead
Caregiver at SC Transportation, opportunity cost, out-of-pocket expenditures
Outpatient TherapeuticProgramme (OTP) Health Worker
Staff time, drugs, number of RUTF used, overhead
Caregiver at OTP Transportation, opportunity cost, out-of-pocket expenditures
Community Volunteer (CV) Transportation, opportunity cost, stipend
Organisational level and associated cost elements elicited from survey instrumentTable 2
Cost type Cost per child curedStaff time $74.28
RUTF $76.06
Out-of-pocket costs $33.98
Opportunity cost5 $7.08
CMAM drugs $9.24
Monitoring $1.34
Supply chain $11.17
Other CMAM $0.47
Management InformationSystem (MIS) tools
$0.48
Overhead $4.27
Training $0.80
CMAM costs by type of costTable 4
Wave 1 Wave 2 Wave 3 Wave 4 TotalAcross all
WavesTotal Perfacility
Total Perfacility
Total Perfacility
Total Perfacility
Caregiver at OTP 89 7.4 102 8.5 101 8.4 104 8.7 396
Caregiver at SC 37 3.1 48 4.0 50 4.2 45 3.8 180
Communityvolunteer
186 15.5 146 12.2 206 17.2 181 15.1 719
Number of surveys completed and average surveys per facility by cost centre andcost collection waveTable 3
3 In Bauchi, there were only three intervention LGAs which were automatically selected for all four waves.
4 This assumes a 72% cure rate found in the sites where data was collected.
5 Opportunity cost was calculated through self-reported proportion of time spent on CMAM activities and self-reported income by caregivers.
6 Cost per child cured by state is as follows: Bauchi $188, Jigawa $175, Kano $175, and Sokoto $273.
Research

菀菀
. . . . . . . . . . . . . . . . . . . . . . . . . . . . . . . . . . . . . . . . . . . . . . . . . . . . . . . . . . . . . . . . . . . . . . . . . . . . . . . . . . . . . . . . . . . . . . . . . . . . . . . . . . . . . . . . . . . . . . . . . . . . . . . . . . . . . . .
. . . . . . . . . . . . . . . . . . . . . . . . . . . . . . . . . . . . . . . . . . . . . . . . . . . . . . . . . . . . . . . . . . . . . . . . . . . . . . . . . . . . . . . . . . . . . . . . . . . . . . . . . . . . . . . . . . . . . . . . . . . . . . . . . . . . . . .
as a percentage of total cost did not vary greatlyacross states, ranging from 36% of total costs inKano to 42.6% of total costs in Jigawa.
Cost effectivenesse financial costs described above were usedfor the cost-effectiveness analysis to estimatethe cost to government and donors to delivertreatment. CMAM treatment in the four statesincluded in this study was estimated to cost$1,117 per death averted7 and $30 per Disabili-ty-Adjusted Life Year (DALY) gained8, whichsituates it favourably among existing literaturethat calculates CMAM cost per death averted.In calculating cost per death averted, a 15.7%mortality reduction for those cured is estimated,based on Bachmann 20099, but adjusting forNigeria's implied untreated death rate (18.5%)and background mortality rate (2.9%). Cost perdeath averted ($219) is considerably higher thancost per death cured since not every child curedwould have died; SAM may incapacitate or oth-erwise disable those who do not die.
e WHO deems interventions where costper death averted is below GDP per capita ashighly cost-effective; cost-effective if betweenone and three times GDP per capita, and notcost-effective if more than three times GDP percapita10. In 2014, average GDP per capita inNigeria was approximately $3,000, suggestingthat the CMAM intervention is highly cost-effective11. Perhaps more importantly, GDP percapita in the four states where the study wasconducted ranged from $983 in Bauchi to $1,274in Sokoto12, further suggesting CMAM is cost-effective in Northern Nigeria.
Financial sustainability analysise average total financial cost of CMAM toscale up will be up to $160 per child cured. Foran average OTP site, with over 500 admissionsand 360 children cured per year13, estimatedcost is $58,157 per year. From this, we can esti-
mate that the total financing needed to supportan average LGA with five OTPs would be ap-proximately $290,783. While these costs are notinsignificant, they are affordable. As of March2015, CMAM is functioning in 633 OTPS in 97LGAs, yielding a total cost of $36,813,175, whichrepresents 2.3% of the 2014 national healthbudget14 and $0.20 per capita. As Nigeria looksforward to the future of the CMAM programmeand potential scale-up to meet the unmet burden,it is important to understand the financial im-plications. Scale-up scenarios to cover up tonearly half a million children per year aredetailed in Table 5.
Financial sustainability thresholds developedby R4D suggest that, while the costs are by nomeans crippling relative to available domesticresources (especially in light of the potentialnumber of lives saved), concerted effort shouldnevertheless be paid to the financial sustainabilityof the CMAM programme.
DiscussionAt $219, the cost per child cured in the CMAMprogramme is comparable to cost estimates inother studies. Other studies do not necessarilyinclude the costs of community volunteers andmost rely upon programme budgets, which havethe effect of producing lower cost estimates,making the estimate for this study even moreencouraging.
RUTF is the major cost driver for the CMAMprogramme, comprising approximately 35% oftotal costs and close to 50% of financial costs.As such, some investment in strategies to reduceRUTF costs could prove worthwhile. Sensitivityanalysis is illustrative insofar as it reveals howreductions in the cost of RUTF can providemoderate savings. For example, a 25% reductionin the cost of RUTF would provide a savings of$16, or 7%, of the total cost per child treated.Additionally, efforts to increase the effectivenessand maximise efficiencies in the programmecould also reduce total costs.
Costs associated with community volunteersare responsible for approximately 10% of totalcosts, and 30% of all staff time costs. e costsof community volunteers relate to their oppor-tunity cost, i.e. the economic value of their timeand their implicit lost wages. While CVs con-tribute significantly to the economic costs, notall of these costs are actually compensated. As aresult, care should be taken to ensure that anadequate supply of quality CVs continue, giventhat compensation does not match the true eco-nomic value of their contributions. Qualitativedata from the evaluation support the idea thatsome diminution of interest over time on thepart of CVs is present.
While the financial sustainability numberssuggest that fiscal space constraints should beconsidered, the low programmatic costs andencouraging cost-effectiveness estimates indicatehigh value for money, especially relative to otherpotential health investments. As such, the casefor further investment in the programme is acompelling one.
For more information, contact: Mark Roland,email: [email protected]
Staff costs by typeFigure 1 Cost per child cured by stateFigure 2
UNICEF
State
LGA
Health worker at SC
Health worker at OTP
Costs associated withcommunity volunteers
$300.00
$250.00
$200.00
$150.00
$100.00
$50.00
$State 1 –Bauchi
State 2 –Kano
State 3 –Sokoto
State 4 –Jigawa
$70 $65 $114 $75
LGA
State
SC Facility
Caregiver at SC
Caregiver at OTPCommunityvolunteer OTP Facility
RUTF
7 Cost per death averted is calculated using total programme costs over 10 years. Costs include all financial outlays, including human resources, monitoring, training, worker compensation, RUTF, medicine, and inpatient costs. Total deaths averted is calculated as follows: (Estimated caseload x mortality reduction for those cured x weighted cure rates for outpatient and inpatient services).
8 This study estimates 37 DALYs gained per death averted. Total DALYs gained is calculated by multiplying DALY gained per death averted by the estimate of deaths averted. Cost per DALYgained is calculated by dividing total projected programme
costs over 10 years by total DALYs gained. 9 Bachmann MO. Cost effectiveness of community-based
therapeutic care for children with severe acute malnutrition
in Zambia: decision tree model. Cost Effectiveness and Resource Allocation 2009;7:2.
10 WHO Cost-effectiveness thresholds http://www.who.int/choice/costs/CER_thresholds/en/
11 World Bank 2013 current dollars http://data.worldbank.org/indicator/NY.GDP.PCAP.CD, accessed 4/23/15
12 All figures in 2010 USD, http://services.gov.ng/states accessed 4/23/15
13 This assumes a 72% cure rate found in the sites where data was collected.
14 This calculation uses the 2014 Appropriations Bill which establishes a FMOH Budget of 262,742,351,874 Naira. We use an exchange rate of 167 Naira per dollar.
OTP sites Caseload Total cost % national health budget
Base scenario 633 320,247 $36,813,175 2.3%
25% increase 791 400,309 $46,016,469 2.9%
50% increase 949 480,371 $55,219,763 3.5%
Financial implications of base and scale-up scenariosTable 5
30%21%
4%
11%
11%23%
Research

菀菀
. . . . . . . . . . . . . . . . . . . . . . . . . . . . . . . . . . . . . . . . . . . . . . . . . . . . . . . . . . . . . . . . . . . . . . . . . . . . . . . . . . . . . . . . . . . . . . . . . . . . . . . . . . . . . . . . . . . . . . . . . . . . . . . . . . . . . . .
News...........................................................................
Launch ofSituation andResponseAnalysisFramework
World HumanitarianSummit 2016
Oxfam GB, Save the Children UK andConcern Worldwide have recentlylaunched a Situation and Response Analy-
sis Framework (SRAF) with component tools.e SRAF was developed as part of an ECHO-ERC (Enhanced Response Capacity) project1 toimprove timely, relevant response to slow-onsetor predictable crises at scale.
e SRAF framework uses livelihood and mar-ket analysis and relevant forecast information topredict the impact of a crisis on affected popula-tions, before a crisis happens. e SRAF usescontingency planning as a vehicle for improvedresponse analysis, using scenarios and modellingto develop a needs-based rationale for early prepa-ration and response. is can help communities,governments, non-governmental organisations(NGOs) and donors ensure that both fundingand programmes are in place when they areneeded. Using the SRAF approach can allow moretimely and appropriate responses in slow-onset
food security crises, broaden response optionsand support the design of programmes that protectlivelihoods and build food security and resiliencein vulnerable populations.
e SRAF website provides guidance andtools for the SRAF and works through the responseanalysis process. e website also houses resourceson the tools used for conducting baseline analysis –the Household Economy Approach (HEA) andPre-Crisis Market Mapping and Analysis (PCM-
MA) – as well as case studies, news and eventsrelevant to the project.
Access the SRAF at: www.sraf-guidelines.org.If you have any questions, comments or wouldlike any further information, please contactCarol Brady, email: [email protected], orChiara Trincia, email: [email protected] ‘Reinforcing Institutional Capacity For Timely Food Security
Emergency Response To Slow Onset Crises At Scale’
An initiative of UN Secretary-General BanKi-moon, managed by UN OCHA, the firstWorld Humanitarian Summit (WHS) will
be held in Istanbul on 23 and 24 May 2016. e lastglobal discussion on humanitarian action took placealmost 25 years ago; since then, the humanitarianlandscape has changed tremendously. e Summitis expected to propose a new agenda for humanitarianaction. It will bring together people affected by hu-manitarian crises; governments; established hu-manitarian and development organisations; andother humanitarian actors such as civil society or-ganisations, businesses, militaries, academic insti-tutions, and faith-based organisations.
In the two years leading up to the summit, ex-tensive regional (eight) and online consultationsare well underway to gather the perspectives, pri-orities and recommendations of all stakeholderson what must be done to make humanitarianaction fit for the future. Participants of the regionaland online consultations prioritise the relevantissues in their respective regions. Four major
themes serve as broad categories to guide theconversations and ensuing recommendations –humanitarian effectiveness; reducing vulnerabilityand managing risk; transformation through in-novation; and serving the needs of people inconflict. Over-arching issues and cross-cuttingthemes are also identified.
roughout the consultation phase, teams ofthematic experts are working to bring the resultsof the regional consultations together withfindings from global research and policy work,to identify areas of consensus and points of di-vergence and to translate them into clear rec-ommendations. ese experts come from a diverserange of regions, areas of expertise and organi-sations. Around the common thread of buildingresilience to the changing nature of shocks andstresses, the WHS will also build clear linkageswith concurrent global development, disasterrisk reduction and climate change processes.
Towards the end of 2015 (Geneva, 14-16 Oc-tober 2015 ), a thematic consultation and a
global consultation meeting will be held to bringtogether the results of the thematic work, theonline consultations and the regional consulta-tions, into a set of concrete recommendationsfor the future. ese recommendations will bepresented in a final report of the Secretary-General and will set the agenda for the summit.
e UN Office for the Coordination of Hu-manitarian Affairs (OCHA) is tasked with man-aging the WHS, working closely with partnersand key stakeholders, including governments,NGOs, UN agencies, the Red Cross/Red Crescentmovement, civil society organizations, communitygroups, businesses and academic institutions.
ere are various ways for organisations andindividuals to make contributions to the Summit. For more information, visit:https://www.worldhumanitariansummit.org/whs_get_involved
1 https://www.worldhumanitariansummit.org/whs_global
ERC Situation and Response Analysis Framework
BaselineAssessment
Early Analysis
UpdateScenarios &
ContingencyPlan
Background review; historical data
Livelihood Assessment
Reducing vulnerability and contributing to resilience building in themedium-long term
Cont
inge
ncy
fund
s
Mon
itorin
g of
haz
ard,
live
lihoo
d an
d m
arke
t par
amet
ers
Market Assessment
Market Assessment
Identify response options, start uptimes and key milestones
Timely and appropriate humanitarianassistance in the short-medium term
Engagement with communities,government, donors, UN, NGOs and
private sector
Analysing the impact of different shocks;quantify needs & geographic focus
EarlyPlanning
Early Action
Shock
The SRAF
Forecastsof hazard
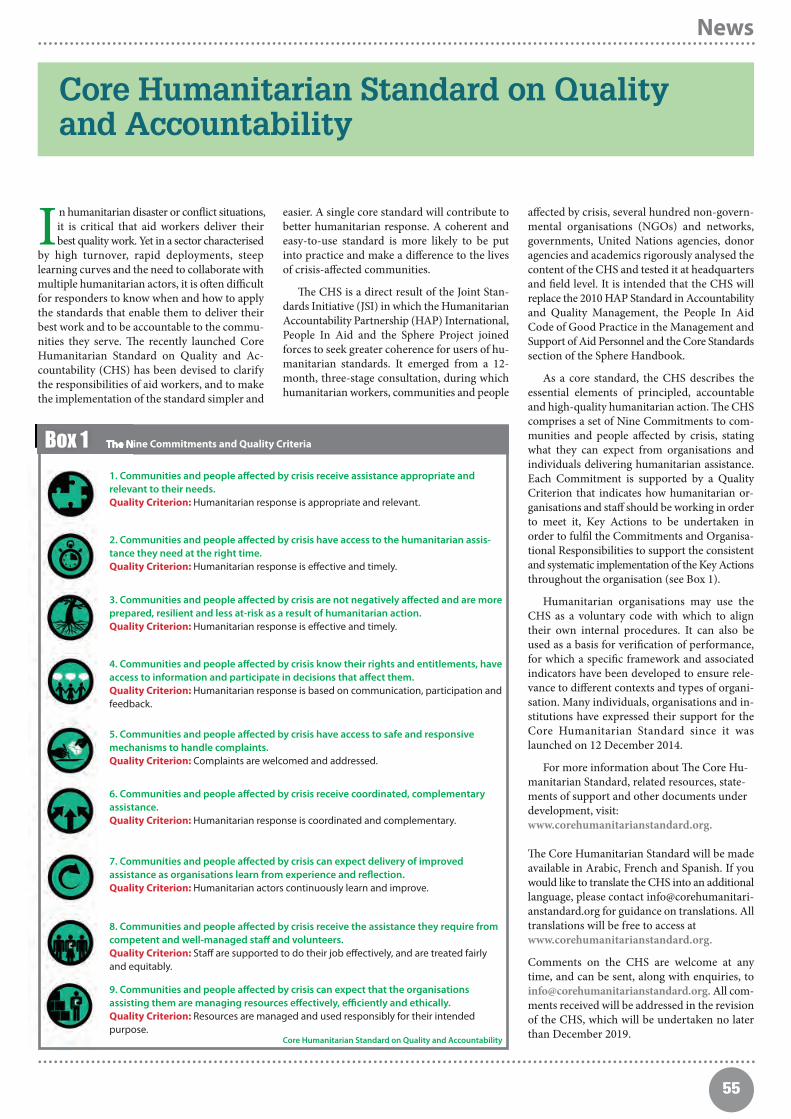
News
菀菀
. . . . . . . . . . . . . . . . . . . . . . . . . . . . . . . . . . . . . . . . . . . . . . . . . . . . . . . . . . . . . . . . . . . . . . . . . . . . . . . . . . . . . . . . . . . . . . . . . . . . . . . . . . . . . . . . . . . . . . . . . . . . . . . . . . . . . . .
. . . . . . . . . . . . . . . . . . . . . . . . . . . . . . . . . . . . . . . . . . . . . . . . . . . . . . . . . . . . . . . . . . . . . . . . . . . . . . . . . . . . . . . . . . . . . . . . . . . . . . . . . . . . . . . . . . . . . . . . . . . . . . . . . . . . . . .
Core Humanitarian Standard on Qualityand Accountability
In humanitarian disaster or conflict situations,it is critical that aid workers deliver theirbest quality work. Yet in a sector characterised
by high turnover, rapid deployments, steeplearning curves and the need to collaborate withmultiple humanitarian actors, it is oen difficultfor responders to know when and how to applythe standards that enable them to deliver theirbest work and to be accountable to the commu-nities they serve. e recently launched CoreHumanitarian Standard on Quality and Ac-countability (CHS) has been devised to clarifythe responsibilities of aid workers, and to makethe implementation of the standard simpler and
easier. A single core standard will contribute tobetter humanitarian response. A coherent andeasy-to-use standard is more likely to be putinto practice and make a difference to the livesof crisis-affected communities.
e CHS is a direct result of the Joint Stan-dards Initiative (JSI) in which the HumanitarianAccountability Partnership (HAP) International,People In Aid and the Sphere Project joinedforces to seek greater coherence for users of hu-manitarian standards. It emerged from a 12-month, three-stage consultation, during whichhumanitarian workers, communities and people
affected by crisis, several hundred non-govern-mental organisations (NGOs) and networks,governments, United Nations agencies, donoragencies and academics rigorously analysed thecontent of the CHS and tested it at headquartersand field level. It is intended that the CHS willreplace the 2010 HAP Standard in Accountabilityand Quality Management, the People In AidCode of Good Practice in the Management andSupport of Aid Personnel and the Core Standardssection of the Sphere Handbook.
As a core standard, the CHS describes theessential elements of principled, accountableand high-quality humanitarian action. e CHScomprises a set of Nine Commitments to com-munities and people affected by crisis, statingwhat they can expect from organisations andindividuals delivering humanitarian assistance.Each Commitment is supported by a QualityCriterion that indicates how humanitarian or-ganisations and staff should be working in orderto meet it, Key Actions to be undertaken inorder to fulfil the Commitments and Organisa-tional Responsibilities to support the consistentand systematic implementation of the Key Actionsthroughout the organisation (see Box 1).
Humanitarian organisations may use theCHS as a voluntary code with which to aligntheir own internal procedures. It can also beused as a basis for verification of performance,for which a specific framework and associatedindicators have been developed to ensure rele-vance to different contexts and types of organi-sation. Many individuals, organisations and in-stitutions have expressed their support for theCore Humanitarian Standard since it waslaunched on 12 December 2014.
For more information about e Core Hu-manitarian Standard, related resources, state-ments of support and other documents underdevelopment, visit: www.corehumanitarianstandard.org.
e Core Humanitarian Standard will be madeavailable in Arabic, French and Spanish. If youwould like to translate the CHS into an additionallanguage, please contact [email protected] for guidance on translations. Alltranslations will be free to access at www.corehumanitarianstandard.org.
Comments on the CHS are welcome at anytime, and can be sent, along with enquiries, [email protected]. All com-ments received will be addressed in the revisionof the CHS, which will be undertaken no laterthan December 2019.
1. Communities and people affected by crisis receive assistance appropriate andrelevant to their needs.Quality Criterion: Humanitarian response is appropriate and relevant.
2. Communities and people affected by crisis have access to the humanitarian assis-tance they need at the right time.Quality Criterion: Humanitarian response is effective and timely.
3. Communities and people affected by crisis are not negatively affected and are moreprepared, resilient and less at-risk as a result of humanitarian action.Quality Criterion: Humanitarian response is effective and timely.
4. Communities and people affected by crisis know their rights and entitlements, haveaccess to information and participate in decisions that affect them.Quality Criterion: Humanitarian response is based on communication, participation andfeedback.
5. Communities and people affected by crisis have access to safe and responsivemechanisms to handle complaints.Quality Criterion: Complaints are welcomed and addressed.
6. Communities and people affected by crisis receive coordinated, complementaryassistance.Quality Criterion: Humanitarian response is coordinated and complementary.
7. Communities and people affected by crisis can expect delivery of improvedassistance as organisations learn from experience and reflection.Quality Criterion: Humanitarian actors continuously learn and improve.
8. Communities and people affected by crisis receive the assistance they require fromcompetent and well-managed staff and volunteers.Quality Criterion: Staff are supported to do their job effectively, and are treated fairlyand equitably.
9. Communities and people affected by crisis can expect that the organisationsassisting them are managing resources effectively, efficiently and ethically.Quality Criterion: Resources are managed and used responsibly for their intendedpurpose.
Core Humanitarian Standard on Quality and Accountability
The Nine Commitments and Quality CriteriaBox 1

菀6
. . . . . . . . . . . . . . . . . . . . . . . . . . . . . . . . . . . . . . . . . . . . . . . . . . . . . . . . . . . . . . . . . . . . . . . . . . . . . . . . . . . . . . . . . . . . . . . . . . . . . . . . . . . . . . . . . . . . . . . . . . . . . . . . . . . . . . .
En-net updateBy Tamsin Walters, en-net moderator
. . . . . . . . . . . . . . . . . . . . . . . . . . . . . . . . . . . . . . . . . . . . . . . . . . . . . . . . . . . . . . . . . . . . . . . . . . . . . . . . . . . . . . . . . . . . . . . . . . . . . . . . . . . . . . . . . . . . . . .. . . . . . . .
Over the past four months, 57 questionshave been posted on en-net1, generating200 responses. Seventy vacancy an-
nouncements have been posted, which have ac-cumulated over 9,000 views.
ere has been an increase in the number ofquestions around stunting, including discussionson the relationship between wasting and stunting,potential interventions to reverse stunting inchildren under 2 years and the timeframe withinwhich both individual and population levelstunting might be reduced.
A question asking whether the WHO GrowthStandards are appropriate for assessing stuntingin populations of South East Asia generatedsignificant debate:
A response from WHO outlined the processof construction of the WHO Growth Standardsand the evidence-base behind their application:e WHO Standards are based on data collectedin six countries (Brazil, Ghana, India, Norway,Oman, USA) following a prescriptive approachthat excluded children with growth constraintsdue to environmental factors (as opposed to se-lecting elite segments of the population)…. Lineargrowth among children in the six sites wasstrikingly similar confirming previous evidencefrom Martorell, Habicht and other researchersshowing that, on average, children from differentworld regions have similar growth potential whenraised in environments that minimised constraintsto growth such as poor diets and infection. Aerthe standards were released, countries like China
or India conducted thorough evaluations of themprior to their adoption.
More than 10 years aer the WHO GrowthStandards were developed, the INTERGROWTH-21st consortium conducted a study on foetalgrowth and newborn size in urban areas ofeight countries2 using a methodology similar tothat used to construct the WHO standards. eresults of this study are in strong agreementwith the WHO results3.
Further input from the INTERGROWTH-21st Consortium confirmed that… Internationalstandards based on the WHO MGRS and IN-TERGROWTH-21st studies compare the longi-tudinal skeletal growth in diverse populationsaround the world free from overtly adverse influ-ences. is allows us to determine how much ofthe variation in human size is due to differencesbetween countries. e answer has been shownconsistently to be only around 3%; hence the vastmajority of the differences in human size andearly growth observed around the world are dueto factors independent of ethnicity….and raisedthe concern that the use of growth referencesspecific to the local population risks normalisingabnormal growth, perpetuating a cycle of lowgrowth expectations in many parts of the world.
Despite these helpful clarifications, severalparticipants remain concerned that, althoughthere is agreement that the majority of thegrowth variation is environmentally mediated(by the social, economic and natural environ-ment), why should we aim to have every child
growing the same way? Given that environmentalconditions in which children live are not similar,growth patterns can be expected to differ: Certaingrowth patterns are likely to confer short andlong-term advantages in certain environmentsas well as penalties. ese advantages and penaltiesare likely to be different in different environmentalsettings.
While this debate remains unresolved, par-ticipants unanimously agreed on the value ofhaving a common yardstick to facilitate under-standing of how much growth varies across theworld and the reasons behind this variability,and further note the value of the WHO GrowthStandards in giving shape to growth curves andproviding information on timing and velocityof child growth.
Advocacy for researching the causes of de-viance from the standards where it exists wasproposed in order to institute appropriate highimpact measures where necessary.
Follow the discussion at http://www.en-net.org/question/1755.aspx
To join any discussion on en-net, share yourexperience or post a question, visit www.en-net.org
Contributions from Aisling, Melaku Begashaw,Blessing, Carlos Grijalva-Eternod, Jane Hirst,Mark Myatt, Mercedes de Onis, Rosemary, BradWoodruff.
1 From 1st April 2015 to the reporting date of 17th July 20152 The cities of Pelotas (Brazil), Turin (Italy), Muscat (Oman),
Oxford (UK), and Seattle (USA); Shunyi County, Beijing (China); the central area of Nagpur (India); and the Parklandssuburb of Nairobi (Kenya).
3 Villar J, et al. The likeness of fetal growth and newborn size across non-isolated populations in the INTERGROWTH-21st Project. Lancet Diabetes Endocrinol 2014,https://intergrowth21.tghn.org/site_media/media/articles/Villar_published_LancetDE_article.pdf
News
Anew international health research part-nership based in India plans to tacklechronic diseases ranging from diabetes
to dementia in an integrated way. Chronic con-ditions are the leading cause of death in India,accounting for more than 5 million deaths eachyear. ey are also a leading cause of disability.e Centre for Control of Chronic Conditions(CCCC), launched in New Delhi, India, on April7, brings together experts from four leading in-stitutes in Europe, America, and Asia – EmoryUniversity, London School of Hygiene & TropicalMedicine (LSHTM), the All India Institute of
Medical Sciences (AIIMS), and the Public HealthFoundation of India (PHFI) – to increase col-laboration in research into non-communicablediseases (NCDs).
e CCCC, which will have its secretariat atPHFI, will act as a research platform for clinicians,public health experts, geneticists, biochemistsand social scientists from these institutes. egoal of the partnership is to generate evidence-based knowledge and solutions to address chronicconditions in India and globally from a policyand clinical perspective.
One CCCC project aims to study the feasibilityof training health workers in the managementof chronic conditions so that specialists can beengaged in other crucial tasks. Another is in-vestigating mental and neurological disordersand cardiovascular diseases to develop inter-ventions for people to deal with multiple mor-bidities, and developing a mobile app for com-munity health workers to integrate managementof diabetes, hypertension, alcohol misuse, anddepression.
A large community-based cohort of 100,000adults will be the main research resource availableto the new centre. It includes people in twolarge cities (New Delhi and Chennai), two mid-sized cities (Visakhapatnam and Sonipat), anda set of villages in Himachal Pradesh. e ideais to follow-up this cohort to study risk factors,evaluate dietary and environmental factors, andevaluate causes of diseases, including cancersover a period of time.
New global centre for chronicdisease in India

菀7
. . . . . . . . . . . . . . . . . . . . . . . . . . . . . . . . . . . . . . . . . . . . . . . . . . . . . . . . . . . . . . . . . . . . . . . . . . . . . . . . . . . . . . . . . . . . . . . . . . . . . . . . . . . . . . . . . . . . . . . . . . . . . . . . . . . . . . .
. . . . . . . . . . . . . . . . . . . . . . . . . . . . . . . . . . . . . . . . . . . . . . . . . . . . . . . . . . . . . . . . . . . . . . . . . . . . . . . . . . . . . . . . . . . . . . . . . . . . . . . . . . . . . . . . . . . . . . . . . . . . . . . . . . . . . . .
CMAM Report: development of aglobal online reporting systemfor CMAM programming
Since the publication of the HumanitarianPractice Network (HPN) Network PaperMeasuring the effectiveness of Supplementary
Feeding Programmes (SFPs) in emergencies in20081 highlighted inconsistencies, inadequaciesand bias associated with reporting on Supple-mentary Feeding Programmes (SFP), the ideaof standardising community based managementof acute malnutrition (CMAM) reporting cate-gories and indicators across implementing agen-cies and countries has gained traction. is hasculminated in the development of a compre-hensive reporting system for all aspects of
CMAM, which features a web-based centraldatabase called the ‘CMAM Report’. is articledescribes certain experiences and lessons learntfrom the development process of this reportingsystem and its use as a management tool inCMAM programming.
Backgrounde CMAM Report started out in 2008 as theMinimum Reporting Package (MRP), with theformulation of standardised reporting categoriesand indicators for SFPs coordinated by a steeringcommittee of twelve international agencies, led
by the ENN and Save the Children. ese werepiloted in four countries. In 2011/12 and in re-sponse to the feedback from the pilot, Outpatienterapeutic Programme (OTP) and StabilisationCentre (SC) reporting categories and indicatorswere added through a similar consultative processand a Microso AccessTM based reportingsoware was developed. Both reporting standardsand soware were subsequently rolled out byseven non-governmental organisations (NGOs)in 15 countries; Save the Children, ConcernWorldwide, International Medical Corps (IMC)and GOAL were the main users.
A number of challenges were identified fol-lowing this first phase in relation to the indicatorsand the soware. Despite guidance on stan-dardised indicators, these were still not fullyadopted, even by agencies committed to theMRP principles. e soware appeared not tobe user friendly enough. Evaluations and feedbackon the soware also emphasised the focus onNGO implementation, the lack of capacity forcoordination and the potential for parallel sys-tems. For example, there were concerns thatthe MRP added another layer of reporting ontop of government reporting systems (this wasnot the intention but rather to be a comple-mentary initiative, whereby the standardisedreporting categories and indicators of the MRPcould positively influence government systemsin the long run and where systems neededstrengthening).
With these issues in mind, a new phase ofsoware development and reorientation took
1 http://www.ennonline.net/sfpeffectiveness
Main menu of the CMAM Report softwarePicture 1
By Rachel Evans, Christoph Andert and Susan Fuller
The authors would like to express their gratitude to all individuals who have contributed to the development ofthe CMAM Report since 2008: Carlos Navarro-Colorado, Jeremy Shoham, Vicky Sibson, Mark Yarmoshuk, JenniferMartin, Lourdes Vazquez, Shafat Sharif, Emily Mates, Emily Keane, Geraldine Le Cuziat, Andrew Crossman, JaimeHargreaves, Terry Reed, Vasantha Mountford, Stewart Gordon, Elena Pullara, the MSM software developer’s teamaround Graham Douglass and Simon Gibbs and all consultants. Further acknowledgements go the steeringcommittee of agencies that contributed to the development of the standardised reporting categories andindicators used in CMAM Report - CDC, Concern Worldwide, FANTA2, IRC, Nutrition Information in CrisisSituations (NICS), Save the Children UK, UNHCR, UNICEF, Valid International, WFP, WHO and World Vision – and allagencies that improved the software by giving continuous feedback to the development team – ConcernWorldwide, GOAL, International Medical Corps (IMC), ACF-USA, Eastern Deanery Aids Relief Programme (EDARP)and Save the Children.
The MRP/CMAM Report was funded by OFDA 2008-11, ECHO 2011-12 and HIF 2013-15. The CMAM Report onlinesoftware was developed by Management Systems Modelling (MSM) Ltd, UK
News

菀8
. . . . . . . . . . . . . . . . . . . . . . . . . . . . . . . . . . . . . . . . . . . . . . . . . . . . . . . . . . . . . . . . . . . . . . . . . . . . . . . . . . . . . . . . . . . . . . . . . . . . . . . . . . . . . . . . . . . . . . . . . . . . . . . . . . . . . . .
. . . . . . . . . . . . . . . . . . . . . . . . . . . . . . . . . . . . . . . . . . . . . . . . . . . . . . . . . . . . . . . . . . . . . . . . . . . . . . . . . . . . . . . . . . . . . . . . . . . . . . . . . . . . . . . . . . . . . . . . . . . . . . . . . . . . . . .
place in 2013-15. e soware was redesignedinto a global web-based database with a specificfunction for United Nations (UN) agencies andthe Ministry of Health (MoH). Mid upper armcircumference (MUAC) screening and blanketsupplementary feeding programme (BSFP) com-ponents were added. e system was finally re-named as CMAM Report.
Developing an online softwareIn order to address all the challenges identifiedwith the initial soware, Save the Children de-cided to modify the soware to a web-basedtool with offline capability. e aim was todevelop a system that would not require instal-lation and that gave access to data from severallevels via synchronisation with a central server.e actual development of the soware wasgiven to a soware developer but additionalfunding was needed to meet the cost of devel-opment, which proved several times higher thanexpected. When development started, it wasthrough an iterative process between the devel-oper, the Save the Children IT team (who re-viewed system structure and general functionality)and the Save the Children Nutrition team (whoreviewed content and usability). For each iterationdelivered by the soware developer, testing tookplace by Save the Children IT and nutrition ex-perts and was reported back to the developer.e main phase of soware development wascompleted in June 2014.
In parallel with the soware development,the team at Save the Children facilitated con-
sultations with partners and users, which resultedin a number of changes to the soware and theaddition of some new components:• e structure of the soware was changed
from being focused around programmes funded through specific grants to the unit of focus being sites, i.e. programme feeding sites, health centres or hospitals are the main level for data entry and analysis. Grants and contextual information can be attached to this to support 1-click reportingif desired.
• INS2 has been renamed within the sowareto ‘OTP discharges in TSFP3’.
• A ‘Country Administrator’ user access levelwas added. is is a view-only function thatallows the MoH and UN agencies to view and analyse data from all agencies in a given country.
• Stock tracking, MUAC screening and BSFP components have been added.
• e soware and all supportive material arenow available in English and French.
With the wider launch to the nutrition commu-nity mid-2015, CMAM Report can now be usedon computers, laptops and tablets with a commonbrowser4 and is freely available to all agencies/countries that wish to use it. e sowaresupports secure data collection through controlledaccess from the field via country to headquarterslevels (five adaptable user access levels). It enablesthe use of standardised reporting categories andindicators (enables comparable data and unbiasedreporting) and gender and age disaggregated
reporting through all reporting categories. Userscan analyse data for trends and create summarytables and graphs by feeding site, group offeeding sites and geographical location up tocountry and global levels for any required timeperiod, in one month steps. e system featuresexport of tables and graphs to PDF, Excel andWord. Raw data can be selectively exported toExcel and in turn to statistical soware. Dataentry mistakes are reduced by real-time validationchecks.
Lessons learned in softwaredevelopment e main challenges in establishing this systemhave been due to the lengthy time taken todevelop complex new soware, the unexpectedcosts of this process and lack of a frameworkfor defining what constitutes a change to theoriginal specification for the new soware.
e following lessons can be taken away fromthe development process: • Soware development projects require
flexibility in delivery time and financial resources in order to meet needs which evolve over time.
• Clear definition on what constitutes changein specification should be defined with the soware developer early on.
• Wider learning is essential as use of Infor-mation & Communication Technology (ICT) increases in our programmes. is kind of development requires specific skill sets and level of shared understanding and common language between both IT and nutrition experts to build a soware that is fit for purpose for the end users in the field.
• e potential for parallel systems and duplication of efforts remains; there are a number of ongoing related initiatives (e.g.
High number of defaulters revealed by CMAM Report’s performance indicatorsgraph outputFigure 1
70
60
50
40
30
20
10
0
Exits
Feeding sites*
OTP – 6-59 months - Outcomes by site (one programme), Sept 2013 - Jan 2014
TRANSF_SC
TRANSF_MED
NON _RESP
DEFAULT
DEAD
RECOVERED
TRANSF-SC: Transferred to Stabilisation Centre; TRANSF_MED: transfer to medical facility outside ofthe CMAM programme area; NON_RESP: non-responder; DEFAULT: defaulter; DEAD: death; RECOV-ERED: recovered*The names of the feeding sites have been removed to preserve confidentiality. This graph includes the fullprogramme period, but they can be redrawn by month.
Figure 1 is based on the principle that the only desirable outcome in a CMAM programme is ‘Recovered’.By sorting the graph on the variable ‘Recovered’ and stacking the other outcomes above it, one caneasily identify sites that may present:• An excess of outcomes other than ‘recovered’, since these will ‘stick out’ of the downward trend, as
if they were out of order,• Identify if a particular problem (e.g. defaulting) happens across all sites or is concentrated in some of
them only,• Identify the relative size of sites in the programme; are some sites taking most cases while other sites
are barely admitting any cases?Source: Figure 1 and accompanying text contributed by Carlos Navarro-Colorado (CDC)
Box 1
The CMAM Report software replaced Excelsheet reporting; this was prone to errors andhad limited use. The Yemen team cited thefollowing as ways in which the CMAM Reporthas added value to reporting:
“With the CMAM Report, we can see indicatorsdirectly when entering data – a major ad-vantage over the old system. We can take ac-tions if indicators do not reach Sphere stan-dards in single feeding sites. Data in theCMAM Report format is shared with the Min-istry of Public Health and UNICEF. The CMAMReport helps to improve the quality of theprogramme. Before starting the CMAM Report,the defaulter rate of the programme wasvery high. With the CMAM Report it has beeneasier to monitor the data and to take cor-rective actions.”
Yemen experience
2 Individual Nutrition Support: A term used for beneficiaries that move from OTP to TSFP and that are kept separate fromMAM cases that enter TFSP. This allows unbiased calculation of TSFP performance.
3 Targeted supplementary feeding programme (TSFP)4 Not running on Apple devices
News
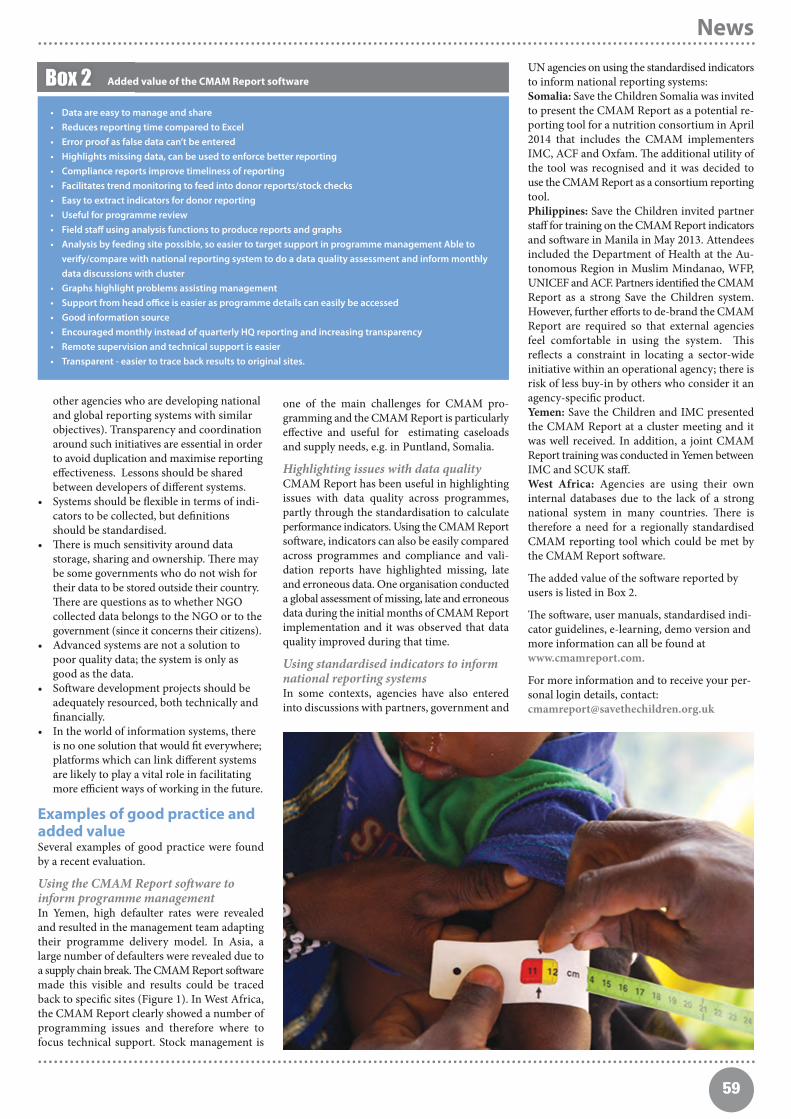
菀菀
. . . . . . . . . . . . . . . . . . . . . . . . . . . . . . . . . . . . . . . . . . . . . . . . . . . . . . . . . . . . . . . . . . . . . . . . . . . . . . . . . . . . . . . . . . . . . . . . . . . . . . . . . . . . . . . . . . . . . . . . . . . . . . . . . . . . . . .
. . . . . . . . . . . . . . . . . . . . . . . . . . . . . . . . . . . . . . . . . . . . . . . . . . . . . . . . . . . . . . . . . . . . . . . . . . . . . . . . . . . . . . . . . . . . . . . . . . . . . . . . . . . . . . . . . . . . . . . . . . . . . . . . . . . . . . .
other agencies who are developing national and global reporting systems with similar objectives). Transparency and coordinationaround such initiatives are essential in orderto avoid duplication and maximise reportingeffectiveness. Lessons should be shared between developers of different systems.
• Systems should be flexible in terms of indi-cators to be collected, but definitions should be standardised.
• ere is much sensitivity around data storage, sharing and ownership. ere may be some governments who do not wish for their data to be stored outside their country.ere are questions as to whether NGO collected data belongs to the NGO or to thegovernment (since it concerns their citizens).
• Advanced systems are not a solution to poor quality data; the system is only as good as the data.
• Soware development projects should be adequately resourced, both technically and financially.
• In the world of information systems, there is no one solution that would fit everywhere;platforms which can link different systems are likely to play a vital role in facilitating more efficient ways of working in the future.
Examples of good practice andadded value Several examples of good practice were foundby a recent evaluation.
Using the CMAM Report soware toinform programme management In Yemen, high defaulter rates were revealedand resulted in the management team adaptingtheir programme delivery model. In Asia, alarge number of defaulters were revealed due toa supply chain break. e CMAM Report sowaremade this visible and results could be tracedback to specific sites (Figure 1). In West Africa,the CMAM Report clearly showed a number ofprogramming issues and therefore where tofocus technical support. Stock management is
one of the main challenges for CMAM pro-gramming and the CMAM Report is particularlyeffective and useful for estimating caseloadsand supply needs, e.g. in Puntland, Somalia.
Highlighting issues with data qualityCMAM Report has been useful in highlightingissues with data quality across programmes,partly through the standardisation to calculateperformance indicators. Using the CMAM Reportsoware, indicators can also be easily comparedacross programmes and compliance and vali-dation reports have highlighted missing, lateand erroneous data. One organisation conducteda global assessment of missing, late and erroneousdata during the initial months of CMAM Reportimplementation and it was observed that dataquality improved during that time.
Using standardised indicators to informnational reporting systems In some contexts, agencies have also enteredinto discussions with partners, government and
UN agencies on using the standardised indicatorsto inform national reporting systems:Somalia: Save the Children Somalia was invitedto present the CMAM Report as a potential re-porting tool for a nutrition consortium in April2014 that includes the CMAM implementersIMC, ACF and Oxfam. e additional utility ofthe tool was recognised and it was decided touse the CMAM Report as a consortium reportingtool. Philippines: Save the Children invited partnerstaff for training on the CMAM Report indicatorsand soware in Manila in May 2013. Attendeesincluded the Department of Health at the Au-tonomous Region in Muslim Mindanao, WFP,UNICEF and ACF. Partners identified the CMAMReport as a strong Save the Children system.However, further efforts to de-brand the CMAMReport are required so that external agenciesfeel comfortable in using the system. isreflects a constraint in locating a sector-wideinitiative within an operational agency; there isrisk of less buy-in by others who consider it anagency-specific product. Yemen: Save the Children and IMC presentedthe CMAM Report at a cluster meeting and itwas well received. In addition, a joint CMAMReport training was conducted in Yemen betweenIMC and SCUK staff. West Africa: Agencies are using their owninternal databases due to the lack of a strongnational system in many countries. ere istherefore a need for a regionally standardisedCMAM reporting tool which could be met bythe CMAM Report soware.
e added value of the soware reported byusers is listed in Box 2.
e soware, user manuals, standardised indi-cator guidelines, e-learning, demo version andmore information can all be found atwww.cmamreport.com.
For more information and to receive your per-sonal login details, contact:[email protected]
Box 2
• Data are easy to manage and share • Reduces reporting time compared to Excel• Error proof as false data can’t be entered• Highlights missing data, can be used to enforce better reporting• Compliance reports improve timeliness of reporting• Facilitates trend monitoring to feed into donor reports/stock checks• Easy to extract indicators for donor reporting• Useful for programme review• Field staff using analysis functions to produce reports and graphs• Analysis by feeding site possible, so easier to target support in programme management Able to
verify/compare with national reporting system to do a data quality assessment and inform monthly data discussions with cluster
• Graphs highlight problems assisting management• Support from head office is easier as programme details can easily be accessed • Good information source • Encouraged monthly instead of quarterly HQ reporting and increasing transparency• Remote supervision and technical support is easier• Transparent - easier to trace back results to original sites.
Added value of the CMAM Report software
News

60
. . . . . . . . . . . . . . . . . . . . . . . . . . . . . . . . . . . . . . . . . . . . . . . . . . . . . . . . . . . . . . . . . . . . . . . . . . . . . . . . . . . . . . . . . . . . . . . . . . . . . . . . . . . . . . . . . . . . . . . . . . . . . . . . . . . . . . .
. . . . . . . . . . . . . . . . . . . . . . . . . . . . . . . . . . . . . . . . . . . . . . . . . . . . . . . . . . . . . . . . . . . . . . . . . . . . . . . . . . . . . . . . . . . . . . . . . . . . . . . . . . . . . . . . . . . . . . . . . . . . . . . . . . . . . . .
Location: BangladeshWhat we know already: Ninety per cent of 1.2 billion adolescents in the world live in low ormiddle income countries where up to half may be stunted. Sixteen million adolescent girlsgive birth every year, which heightens maternal and infant risk.
What this article adds: A recent review found that programmes to support adolescentnutrition in SUN countries and India are lagging behind international attention. ‘Promising’interventions (Lancet 2013) are not yet widely implemented or planned. Gap areas includeneeds assessment, policy provision, access to services, the evidence base and adolescentconsultation. Identified actions include reaching clarity on UN mandates and leadership onadolescent nutrition, acknowledging adolescents as a distinct category, developing links toreproductive health programmes and stronger inter-sectoral collaboration. The SUNMovement could play an important role in bringing adolescent nutrition to the fore.
This summary was prepared by Emily Mates (ENN) who undertook the review asan independent consultant together with Tanya Khara (independent), with thesupport of Frances Mason, Save the Children.
Adolescent Nutrition: Policy and
programming in SUN+ countriesSummary of report1
Save the Children recently undertook a reviewof what is being done in Scaling Up Nutrition(SUN) countries and in India, to address
adolescent nutrition through policy and practice.e report is targeted at ministers in SUN countrieswho are responsible for the welfare of adolescentgirls; senior officials in the United Nations, inter-national agency programme implementers andpolicy-makers in SUN countries; and officials indonor governments and agencies. e main pointsof the report are outlined below.
Adolescents – a neglected group“Adolescents are in many contexts a marginalisedand disempowered group. ey lack a voice onthe social stage, have constrained access to re-sources, are likely to drop out of education andare vulnerable to exploitation and violence.”2
and has been the focus of the nutrition communityover recent years. But with 16 million adolescentgirls giving birth each year, tackling undernutritionin women once they are pregnant is oen toolate to break the intergenerational cycle of mal-nutrition. ese 16 million adolescent girls givingbirth each year are more likely to die themselvesduring childbirth, or be le nutritionally depleted.eir babies are also more likely to die or beborn with nutritional deficits. e infants whosurvive have a greater risk of continued nutritionaldeficits during childhood and grow up to bestunted mothers or fathers themselves. In orderto prevent malnutrition being passed on to thenext generation, adolescent girls and communitiesmust be supported both for improved nutritionand to delay marriage and pregnancy. e eco-nomic benefits of this could amount to up to30% of a country’s Gross Domestic Product(GDP)3.
What is being done?Programmes to support adolescent nutrition arelagging behind the international call for focuson this area and the general increase in attentionon nutrition nationally and internationally. epromising interventions for adolescent nutritionidentified by the Lancet 2013 series are not yetbeing widely implemented and are reflected inonly a minority of the country plans written bythose countries that have signed up to the SUNMovement. In the SUN countries where planswere available (22), just less than half (10) includedany detail on adolescent nutrition. Only sevenincluded support for adolescent nutrition or im-
provement of adolescent nutrition status as partof a strategic objective or result (Bangladesh,Benin, Ethiopia, Guatemala, Mozambique, Nepal).Just two of these countries (Mozambique andNepal) reported assessing the status of adolescentnutrition in country and none had plans toinclude adolescents in their monitoring and eval-uation. It was noted that only Nepal7 was con-ducting a national assessment of the situation ofadolescents in country as part of their plans.India, the only country not part of the SUNMovement included in this review, where 55% ofadolescents are anaemic, provides the largest
1 Adolescent nutrition. Policy and programming in SUN+ countries. Save the Children. 2015. Available in English and French at: http://www.savethechildren.org.uk/resources/ online-library/adolescent-nutrition
2 Burman, ME and McKay, S (2007). ‘Marginalisation of girl mothers during reintegration from armed groups in Sierra Leone’, International Nursing Review 54, 4, pp 316–23. doi: 10.1111/j.1466-7657.2007.00546.x.
3 Chaaban, J and Cunningham, W (2011). Measuring the Economic Gain of Investing in Girls: the Girl Effect Dividend, World Bank Policy Research Working Paper 5753, The World Bank.
4 Cappa, C, Wardlaw, T, Langevin-Falcon, C and Diers, J (2012). ‘Progress for children: a report card on adolescents’, The Lancet 379, 9834, pp 2323–5. doi: 10.1016/S0140-6736(12)60531-5.
5 Black, RE, Victora, CG, Walker, SP, Bhutta, ZA, Christian, P, de Onis, M, Ezzati, M, Grantham McGregor, S, Katz, J, Martorell, R,Uauy, R, and Maternal and Child Nutrition Study Group (2013). ‘Maternal and child undernutrition and overweight in low-income and middle-income countries’, The Lancet 382, 9890, pp 427–51. doi: 10.1016/S01406736(13)60937-x.
6 UNICEF (2011) ‘Adolescence an age of opportunity’, Executive summary, in The State of the World’s Children 2011, UNICEF. Sawyer et al, 2012
7 This report was produced prior to the earthquakes in Nepal.8 See footnote 3.
There are 1.2 billion
adolescents (aged 10–19
years) in the world4.
90% live in low and middle
income countries (LMICs),
where they make up 19% of
the population5.
Sub Saharan Africa is
expected to have more
adolescents than any other
region by 20506.
The lifetime opportunity cost of adolescent
pregnancy in Uganda, for example, amounts to
an estimated 30% of the countries annual GDP8.
In 2012, there were 1.2 billion adolescents inthe world – with adolescents defined as thosebetween the ages of 10 and 19 years. Ninety percent live in low or middle-income countries. Insome countries, as many as half of all adolescentsare stunted, meaning that their physical and cog-nitive development has been restricted becauseof inadequate nutritional status. e first 1000days of life – from the start of the mother’s preg-nancy to the child’s second birthday – is critical
News

61
. . . . . . . . . . . . . . . . . . . . . . . . . . . . . . . . . . . . . . . . . . . . . . . . . . . . . . . . . . . . . . . . . . . . . . . . . . . . . . . . . . . . . . . . . . . . . . . . . . . . . . . . . . . . . . . . . . . . . . . . . . . . . . . . . . . . . . .
. . . . . . . . . . . . . . . . . . . . . . . . . . . . . . . . . . . . . . . . . . . . . . . . . . . . . . . . . . . . . . . . . . . . . . . . . . . . . . . . . . . . . . . . . . . . . . . . . . . . . . . . . . . . . . . . . . . . . . . . . . . . . . . . . . . . . . .
scale example of direct nutrition interventionsbeing targeted to adolescents.
Adequate assessment of adolescents is thereforemissing in the majority of countries. Progress ondirect interventions has been more substantial,but even in these cases, the extent to which ado-lescents are really being covered and the effec-tiveness of interventions in addressing nutritionoutcomes is mostly unknown. Participation ofadolescents in the design and implementation ofprogrammes, despite being a strong recommen-dation from those working with adolescents,does not seem to have been adopted by nutritionprogrammers.
within existing services and specific targetedinterventions/promotion is a major challenge.ere is a common, but flawed assumption that adolescents will be automatically in-cluded in any maternal health programmes.
• Adolescents are not being consulted about the extent to which nutrition services are currentlyserving them, or how they can be better de-signed in order to meet their particular needs.
What actions need to be taken?• International actors should give greater
attention to meeting adolescents’ nutritionalneeds. To do this, there needs to be more research (including age- and sex-disaggre-gated data) to generate empirical evidence about what works in reaching adolescents with nutrition interventions. As such, there is an urgent need for clarity on UN mandatesand leadership in addressing adolescentnutrition so that the issue gets the leverage itneeds. In the meantime, a multiagency groupshould be created to find a way forward for policy and programming. is group shouldprioritise a research agenda and review strategies for the scale up of promising interventions.
• SUN country governments should considerthe long term economic and health benefitsthat can be gained from strengthening adolescent nutrition and prioritise it in their policies and practice. Interventions should find ways to reach adolescents and include them in the programme design phase.Adolescents should be acknowledged as a distinct category, with their own needs and capacities, rather than be subsumed within the broader mother and child care pro-grammes. Systems and structures should be put in place to monitor and evaluate out-comes for adolescents.
• A multi-sectoral approach in policy and practice is critical. Links with policies and programmes aiming to delay marriage and first pregnancy are a priority alongside otherreproductive health programmes (contracep-tion promotion, HPV vaccination). ere is also a need for more research to assess the
extent to which health, education, WASH, social protection and agriculture interven-tions could be made more nutrition-sensitive for adolescents. Strategies need to consider the context-specific burdens of malnutrition including undernutrition, obesity and eatingdisorders. Coordination must be undertakenat the ministerial level, with guidance from the relevant UN organisations particularly the WHO, UNICEF and UNFPA.
Box 1
Maternal nutrition interventions targeted topregnant adolescents – including multiplemicronutrient (MMN) supplementation,calcium supplementation, balanced energyprotein supplementation, malaria prevention,maternal deworming, obesity prevention.
Preconception care via reproductive health andfamily planning interventions for adolescentsaimed at reducing unwanted pregnancies andoptimising age at first pregnancy and birthintervals.
Antenatal care – ensuring access, given thatadolescents are particularly at risk ofcomplications
Nutrition promotion – via schools
‘Promising’ interventions foradolescent nutrition
Source: Bhutta et al (2013)13.
9 Sawyer, SM, Afifi, RA, Bearinger, LH, Blakemore, SJ, Dick, B, Ezeh, AC and Patton, GC (2012). Adolescence: a foundation for future health. The Lancet 379, 9826, pp 1630–40. doi: 10.1016/S01406736(12)60072-5.
10 UNICEF (2012). Progress for Children: A report card on adolescents, UNICEF, www.unicef.org/publications/ index_62280.html (accessed 12 February 2015).
11 UNFPA (2012). Marrying too Young: End child marriage, United Nations Population Fund, www.unfpa.org/ sites/default/files/pub-pdf/MarryingTooYoung.pdf (accessed 12 February 2015).
12 WHO (2014a). ‘Adolescent pregnancy’, WHO factsheet no 364, www.who.int/mediacentre/ factsheets/fs364/en/ (accessed 11 February 2015).
13 Bhutta ZA, Das, JK, Rizvi, A, Gaffey, MF, Walker, N, Horton, S, Webb, P, Lartey, A, Black, RE, Lancet Nutrition Interventions Review Group, and Maternal and Child Nutrition Study Group (2013) ‘Evidence based interventions for improvement of maternal and child nutrition: what can be done and at what cost?’ The Lancet 382, 9890, pp 452–77. doi: 10.1016/S01406736(13)60996-4.
Iron deficiency anaemia is the third most
important cause of lost Disability Adjusted
Life Years (DALYs) in adolescents worldwide
at 3%, behind alcohol and unsafe sex9.
In India, 55·8% of adolescents aged 15–19
years are reported to be anaemic10.
1 in 3 girls in developing countries are
married before the age of 18 and a startling
1 in 9 before the age of 1511.
About 16 million adolescent girls give birth
each year, roughly 11% of all births
worldwide, with almost 95% of these births
occurring in LMICs12.
It is clear that a range of programmes mayhave important impacts on adolescent nutritionacross health and other sectors such as education,family planning, social protection and water,sanitation and hygiene (WASH). Multi-sectoralapproaches, as well as those taking account ofthe particular experiences and social position ofadolescents, are therefore urgently required.Ethiopia, Mozambique and Nepal, in particular,stand out for making inroads into integrated ap-proaches for adolescent nutrition across thesectors. Further investigations into the effectivenessof approaches in these countries to inform thewider community would be useful.
e nature of adolescent nutrition means thatthe responsibilities for supporting it need to spana wide range of ministries and actors at countrylevel. e SUN Movement could play an importantrole in promoting such inter-sectoral collaborationfor nutrition, particularly in bringing adolescentnutrition issues to the fore and encouraging allactors to adopt the sort of holistic approach re-quired to tackle them.
What are the challenges?A number of important challenges, research gapsand missed opportunities were identified in thisreview, including: • Insufficient policy attention on adolescent
nutrition, perhaps as a result of the successfulfocus within the nutrition community on the first 1,000 days.
• A lack of empirical evidence and documentedpractical experience on what should be done to support adolescent nutrition and a large number of continued research gaps related tooperational issues. As a result, evidence of how to assess adolescents and programme effectiveness is lacking and evidence of cost effectiveness even more so.
• Finding ways to reach adolescents both
• Given the challenges involved in reaching this neglected demographic group, it is nec-essary to capitalise on the mechanisms that multi-sectoral programmes use to reach adolescents. Nutrition and health practition-ers need to use social media to provide inno-vative opportunities for engaging adolescents,including particularly hard-to-reach adoles-cents who are not receptive to the more traditional health and nutrition education approaches or platforms.
• Finally, while the inclusion of adolescents in the proposed post 2015 Sustainable Development Goals (SGDs) is welcome, it is critical that this focus is translated into practice. A first step is to scale up the existing‘promising interventions’ as listed by the Lancet 2013 (see Box 1) and ensure that theseinterventions reach adolescents. If so, they should provide essential stepping stones to achieve the SDGs by 2030. In the same vein, the role that adolescents themselves can play in helping to reach the WHA nutrition targetsfor 2025 (WHO 2015) – through inclusive consultation, must be kept at the forefront ofthe minds of those aiming to achieve them. Future Global Nutrition Reports should in-clude an analysis of adolescent nutrition intervention coverage and impacts.
News

6菀
. . . . . . . . . . . . . . . . . . . . . . . . . . . . . . . . . . . . . . . . . . . . . . . . . . . . . . . . . . . . . . . . . . . . . . . . . . . . . . . . . . . . . . . . . . . . . . . . . . . . . . . . . . . . . . . . . . . . . . . . . . . . . . . . . . . . . . .Practical pointers for preventionof konzo in tropical AfricaBy J.H Bradbury, J.P.Banea, C. Mandombi, D, Nahimana, I.C. Denton and N. Kuwa
Dr J Howard Bradbury, Emeritus Fellow, AustralianNational University, developed the cassava cyanideand urinary thiocyanate kits and the wetting methodthat removes cyanogens from cassava flour.
Professor Jean Pierre Banea is Director of theNational Institute for Nutrition (PRONANUT) inKinshasa, DRC and directed all the field work.
Sister (Dr) Chretienne Mandombi of Caritasexamined patients for konzo and led the smallteam that visited the villages monthly.
Konzo is an upper motor neuron disease ofsudden onset that causes irreversible paral-ysis of the legs mainly in children and
young women, due to high cyanide intake andmalnutrition from consumption of a monotonousdiet of bitter cassava1. Konzo occurs in the Demo-cratic Republic of Congo (DRC), Mozambique,Tanzania, Cameroon, Central African Republicand Angola and is spreading into new areas withincreasing cassava production needed to feedrapidly increasing populations. In the DRC, konzooccurs in at least four provinces and in 2002, therewere an estimated 100,000 cases. e disease wasfirst reported in Bandundu Province, DRC in 1938and it was first prevented there in 2011, by thedaily use by village women of a new simple wettingmethod, that removes nearly all residual cyanogenspresent in cassava flour produced by traditionalmethods. We wish to share our experiences of thepractical aspects of the prevention of konzo usingthe wetting method in similar contexts.
1. Choice of villages for intervention. e re-gional and local health authorities are consultedand they usually know the extent of konzo in theirarea; if this is not known, a survey for konzo casesmay be needed2. e choice of villages in whichinterventions are to be made depends on the konzoprevalence in the village, the presence of capablevillage leaders, their willingness to be involved inthe project and the accessibility of the village to a 4
wheel drive vehicle. A first visit is necessary tochoose suitable villages for an intervention.
2. Intervention team. e team must include (a)a medical doctor familiar with the diagnosis ofkonzo3 and rehabilitation of those with konzo, (b)a teacher to explain in the local language the causeof konzo and to teach the women how to use thewetting method, (c) a person trained to make acensus of the village and conduct a food consumptionsurvey used to assess the extent of malnutritionand (d) a technician trained to collect and analyseurine samples from school children for thiocyanate,and cassava flour samples for cyanide4.
3. Second visit to konzo villages. About onemonth later, baseline data are obtained on popula-tion, numbers of konzo cases, urinary thiocyanateanalyses made on site from 50 school children.Approximately 30 cassava flour samples analysedfor cyanide and food consumption data are thenobtained from konzo and non-konzo households.e senior women are subsequently taught aboutthe poisonous cyanide present in cassava flour andthe means to remove it using the wetting method.is is shown to them by the teacher as follows:
“Cassava flour is placed in a bowl and the level ismarked on the inside of the bowl.Water is mixedin and the level of the flour at first decreases andthen increases up to the mark. e flour is spreadin a thin layer about 1 cm deep on a mat in thesun for two hours or the shade for five hours to
allow hydrogen cyanide gas to escape. e treatedflour is mixed with boiling water to make the
traditional thick porridge called fufu.”
Each senior woman then trains 15-20 villagewomen to use the wetting method until all thewomen in the village are trained (see Figure 1). Acommittee of the leading women is formed to
ensure that all the women are trained in thewetting method and that it is used on a regulardaily basis to remove cyanogens. Each householdis given a plastic bowl, knife, mat and an illustratedposter which explains the wetting method in theirown local language.
4. Subsequent visits to konzo villages. Aerthe second visit, a small team visits each month tocheck on konzo cases and that the wetting methodis still being used daily. Four months aer thesecond visit, there is another visit of the full teamto check urinary thiocyanate and flour cyanidelevels. is is followed by three monthly visits ofthe small team and a final visit by the full team toconclude the nine month intervention.
5. Targets: Village women are very satisfied withthe wetting method and at least 60-70% need touse it daily for it to be effective5. Recently in Mozam-bique, only about 40% used the method, becausethere were very few new konzo cases in the villagesand hence there is less incentive for the women touse the wetting method than where there are recentkonzo cases, as in DRC. However, it is expectedthat this attitude would change under drought con-ditions when the cyanide content of flour increasesgreatly6 and konzo outbreaks occur.
During the intervention there are no newkonzo cases. At the end of the intervention, meancassava flour cyanide levels are less than 10 ppmand no children have high urinary thiocyanatelevels of >350µmole/L.
Years aer completion of the intervention,there are no new konzo cases in the villages, thewetting method is still being used and it’s use hasspread by word of mouth to nearby villages7.
6. Cost of intervention. Our first interventiontook 18 months8 but now takes 9 months9. Wehave undertaken interventions in 13 villages reach-ing nearly 10,000 people. e cost per person hasbeen reduced to $1610, but could be reduced furtherby scaling up the operation.
7. Comparison of preventing konzo by reducingmalnutrition or reducing cyanide intake. Across-sectoral approach has been used to reducemalnutrition and prevent konzo in Kwango District11
but this approach is less direct and much moreexpensive than our methodology, which greatlyreduces uptake of poisonous cyanide from cassava.
Funding is needed to continue work to preventkonzo amongst poor village children and youngwomen.
For more information, contact: Dr J HowardBradbury, email: [email protected] Professor Jean Pierre Banea, Director PRONANUT, email: [email protected]
1 Banea JP, Bradbury JH, Mandombi C, Nahimana D, Denton IC, Foster MP, Kuwa N and Tshala Katumbay D, Konzo prevention in six villages in the DRC and the dependence of konzo prevalence on cyanide intake and malnutrition. Toxicology Reports, 2, 609-615 (2015).
2 Banea JP, Bradbury JH, Nahimana D, Denton IC, Mashukano N and Kuwa N, Survey of the konzo prevalence of village peopleand their nutrition in Kwilu District, Bandundu Province, DRC. African J. Food Sci., 9: 45-50, (2015).
3 World Health Organisation, Konzo: a distinct type of upper motor neuron disease. Weekly Epidemiol. Rec. 71: 225-232 (1996).
4 See http://biology.anu.edu.au/hosted_sites/CCDN/5 See footnote 1.6 Cardoso AP, Mirione E, Ernesto M, Massaza F, Cliff J, Haque
MR and Bradbury JH, Processing of cassava roots to remove
Mr Damien Nahimana directs the full team andoversees training in the wetting method andcollection and analysis of samples of flour andurine.
Mr Ian C Denton assists in preparation anddespatch of cyanide and urinary thiocyanate kitsat ANU.
Mrs N'landa Kuwa is involved with food surveysto check on malnutrition and training of womenin use of wetting method.
Figure 1 Teaching the wettingmethod to village womenin Kay Kalenge, DRC.
cyanogens. J. Food Comp. Anal. 18: 451-460 (2005).7 Banea JP, Bradbury JH, Mandombi C, Nahimana D, Denton IC,
Kuwa N and Tshala Katumbay D, Effectiveness of wetting method for control of konzo and reduction of cyanide poisoning by removal of cyanogens from cassava flour. Food Nutr. Bull. 35: 28-32 (2014).
8 Banea JP, Nahimana D, Mandombi C, Bradbury JH, Denton IC and Kuwa N, Control of konzo in DRC using the wetting method on cassava flour. Food Chem. Toxicol. 50: 1517-23 (2012).
9 See footnote 1.10 See footnote 1.11 Delhourne M, Mayans J, Calo M, Guyot-Bender C. Impact of
cross-sectoral approach to addressing konzo in DRC. Field Exchange, No. 44, 50-54 (2012).
. . . . . . . . . . . . . . . . . . . . . . . . . . . . . . . . . . . . . . . . . . . . . . . . . . . . . . . . . . . . . . . . . . . . . . . . . . . . . . . . . . . . . . . . .
News
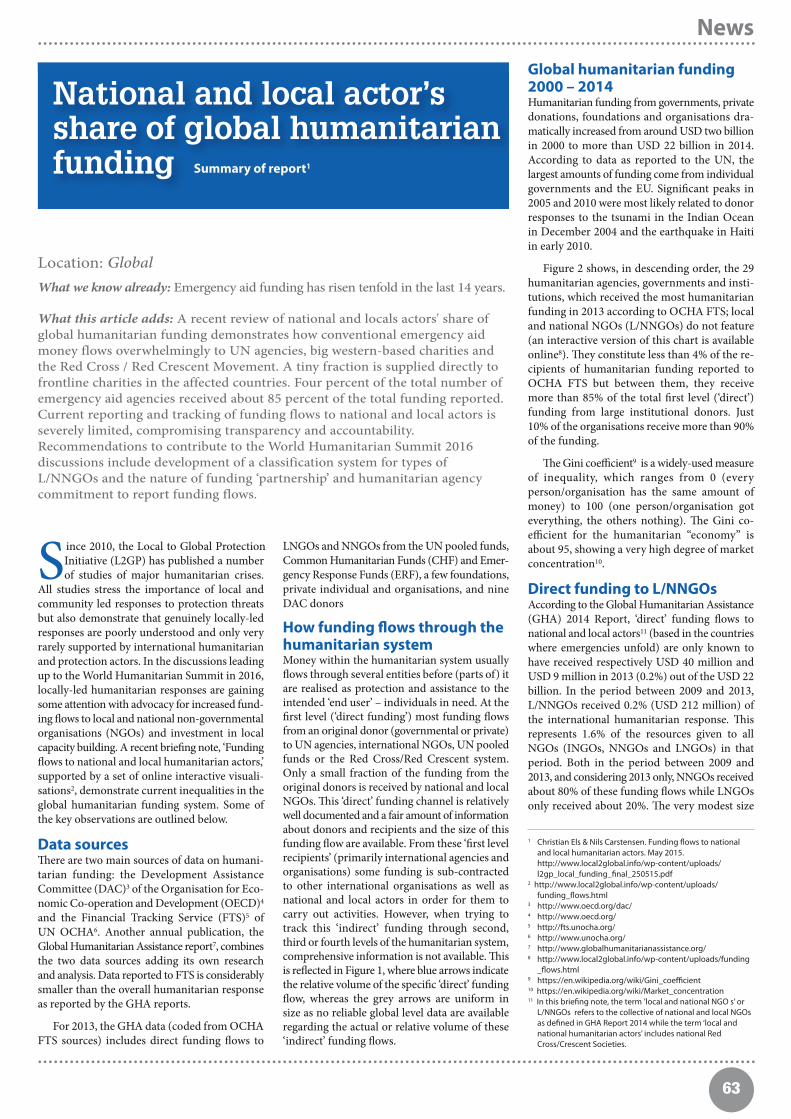
6菀
. . . . . . . . . . . . . . . . . . . . . . . . . . . . . . . . . . . . . . . . . . . . . . . . . . . . . . . . . . . . . . . . . . . . . . . . . . . . . . . . . . . . . . . . . . . . . . . . . . . . . . . . . . . . . . . . . . . . . . . . . . . . . . . . . . . . . . .
. . . . . . . . . . . . . . . . . . . . . . . . . . . . . . . . . . . . . . . . . . . . . . . . . . . . . . . . . . . . . . . . . . . . . . . . . . . . . . . . . . . . . . . . . . . . . . . . . . . . . . . . . . . . . . . . . . . . . . . . . . . . . . . . . . . . . . .
Location: GlobalWhat we know already: Emergency aid funding has risen tenfold in the last 14 years.
What this article adds: A recent review of national and locals actors' share ofglobal humanitarian funding demonstrates how conventional emergency aidmoney flows overwhelmingly to UN agencies, big western-based charities andthe Red Cross / Red Crescent Movement. A tiny fraction is supplied directly tofrontline charities in the affected countries. Four percent of the total number ofemergency aid agencies received about 85 percent of the total funding reported.Current reporting and tracking of funding flows to national and local actors isseverely limited, compromising transparency and accountability.Recommendations to contribute to the World Humanitarian Summit 2016discussions include development of a classification system for types ofL/NNGOs and the nature of funding ‘partnership’ and humanitarian agencycommitment to report funding flows.
National and local actor’sshare of global humanitarianfunding Summary of report1
Since 2010, the Local to Global ProtectionInitiative (L2GP) has published a numberof studies of major humanitarian crises.
All studies stress the importance of local andcommunity led responses to protection threatsbut also demonstrate that genuinely locally-ledresponses are poorly understood and only veryrarely supported by international humanitarianand protection actors. In the discussions leadingup to the World Humanitarian Summit in 2016,locally-led humanitarian responses are gainingsome attention with advocacy for increased fund-ing flows to local and national non-governmentalorganisations (NGOs) and investment in localcapacity building. A recent briefing note, ‘Fundingflows to national and local humanitarian actors,’supported by a set of online interactive visuali-sations2, demonstrate current inequalities in theglobal humanitarian funding system. Some ofthe key observations are outlined below.
Data sourcesere are two main sources of data on humani-tarian funding: the Development AssistanceCommittee (DAC)3 of the Organisation for Eco-nomic Co-operation and Development (OECD)4
and the Financial Tracking Service (FTS)5 ofUN OCHA6. Another annual publication, theGlobal Humanitarian Assistance report7, combinesthe two data sources adding its own researchand analysis. Data reported to FTS is considerablysmaller than the overall humanitarian responseas reported by the GHA reports.
For 2013, the GHA data (coded from OCHAFTS sources) includes direct funding flows to
LNGOs and NNGOs from the UN pooled funds,Common Humanitarian Funds (CHF) and Emer-gency Response Funds (ERF), a few foundations,private individual and organisations, and nineDAC donors
How funding flows through thehumanitarian system Money within the humanitarian system usuallyflows through several entities before (parts of) itare realised as protection and assistance to theintended ‘end user’ – individuals in need. At thefirst level (‘direct funding’) most funding flowsfrom an original donor (governmental or private)to UN agencies, international NGOs, UN pooledfunds or the Red Cross/Red Crescent system.Only a small fraction of the funding from theoriginal donors is received by national and localNGOs. is ‘direct’ funding channel is relativelywell documented and a fair amount of informationabout donors and recipients and the size of thisfunding flow are available. From these ‘first levelrecipients’ (primarily international agencies andorganisations) some funding is sub-contractedto other international organisations as well asnational and local actors in order for them tocarry out activities. However, when trying totrack this ‘indirect’ funding through second,third or fourth levels of the humanitarian system,comprehensive information is not available. isis reflected in Figure 1, where blue arrows indicatethe relative volume of the specific ‘direct’ fundingflow, whereas the grey arrows are uniform insize as no reliable global level data are availableregarding the actual or relative volume of these‘indirect’ funding flows.
Global humanitarian funding2000 – 2014 Humanitarian funding from governments, privatedonations, foundations and organisations dra-matically increased from around USD two billionin 2000 to more than USD 22 billion in 2014.According to data as reported to the UN, thelargest amounts of funding come from individualgovernments and the EU. Significant peaks in2005 and 2010 were most likely related to donorresponses to the tsunami in the Indian Oceanin December 2004 and the earthquake in Haitiin early 2010.
Figure 2 shows, in descending order, the 29humanitarian agencies, governments and insti-tutions, which received the most humanitarianfunding in 2013 according to OCHA FTS; localand national NGOs (L/NNGOs) do not feature(an interactive version of this chart is availableonline8). ey constitute less than 4% of the re-cipients of humanitarian funding reported toOCHA FTS but between them, they receivemore than 85% of the total first level (‘direct’)funding from large institutional donors. Just10% of the organisations receive more than 90%of the funding.
e Gini coefficient9 is a widely-used measureof inequality, which ranges from 0 (everyperson/organisation has the same amount ofmoney) to 100 (one person/organisation goteverything, the others nothing). e Gini co-efficient for the humanitarian “economy” isabout 95, showing a very high degree of marketconcentration10.
Direct funding to L/NNGOsAccording to the Global Humanitarian Assistance(GHA) 2014 Report, ‘direct’ funding flows tonational and local actors11 (based in the countrieswhere emergencies unfold) are only known tohave received respectively USD 40 million andUSD 9 million in 2013 (0.2%) out of the USD 22billion. In the period between 2009 and 2013,L/NNGOs received 0.2% (USD 212 million) ofthe international humanitarian response. isrepresents 1.6% of the resources given to allNGOs (INGOs, NNGOs and LNGOs) in thatperiod. Both in the period between 2009 and2013, and considering 2013 only, NNGOs receivedabout 80% of these funding flows while LNGOsonly received about 20%. e very modest size
1 Christian Els & Nils Carstensen. Funding flows to national and local humanitarian actors. May 2015. http://www.local2global.info/wp-content/uploads/ l2gp_local_funding_final_250515.pdf
2 http://www.local2global.info/wp-content/uploads/ funding_flows.html
3 http://www.oecd.org/dac/4 http://www.oecd.org/5 http://fts.unocha.org/6 http://www.unocha.org/7 http://www.globalhumanitarianassistance.org/8 http://www.local2global.info/wp-content/uploads/funding
_flows.html9 https://en.wikipedia.org/wiki/Gini_coefficient10 https://en.wikipedia.org/wiki/Market_concentration11 In this briefing note, the term ’local and national NGO s’ or
L/NNGOs refers to the collective of national and local NGOs as defined in GHA Report 2014 while the term ‘local and national humanitarian actors’ includes national Red Cross/Crescent Societies.
News

6菀
. . . . . . . . . . . . . . . . . . . . . . . . . . . . . . . . . . . . . . . . . . . . . . . . . . . . . . . . . . . . . . . . . . . . . . . . . . . . . . . . . . . . . . . . . . . . . . . . . . . . . . . . . . . . . . . . . . . . . . . . . . . . . . . . . . . . . . .
. . . . . . . . . . . . . . . . . . . . . . . . . . . . . . . . . . . . . . . . . . . . . . . . . . . . . . . . . . . . . . . . . . . . . . . . . . . . . . . . . . . . . . . . . . . . . . . . . . . . . . . . . . . . . . . . . . . . . . . . . . . . . . . . . . . . . . .
of local and national funding is a persistentfeature of global humanitarian funding flows.
In 2013, almost 70% of the total knowndirect L/NNGO funding came from the OCHAmanaged pooled funds ERFs and CHFs. Basedon the data submitted to OCHA FTS by ERFsand CHFs, GHA’s data of funding flows to localand national NGOs differs starkly from the datapresented in the annual reports of these pooledfunds. e magnitude of differences is approxi-mately 100% and is due to different definitionsof local/national NGOs.
In 2013 international donors and pooledfunds channelled USD 1.2 billion directly tothe Red Cross/Crescent System. Out of thisfunding, 72.5% were received by the ICRC,16.0% by national societies, which are DACmembers (‘northern’ national societies (N)),7.1% by the IFRC, and 4.3% by national societies,which are not DAC members (”southern” nationalsocieties). ese southern members worked ina similar way to international NGOs by imple-menting projects abroad (3.4%), or workedwithin the country in which they are based(0.9%).
Indirect funding to L/NNGOsUN agenciese largest multilateral first-level recipient ofhumanitarian funding is WFP, who workedwith 1162 national NGOs and community basedorganisations in 2013, who in turn distributedapproximately one third of the 3.2 million metrictons of food commodities in that year. WFP hasno data available on how much of its annualhumanitarian budget is made available for na-
Figure 1 Funding flows in the humanitarian system
Donors (Government, Private, Foundations)
Figure 2 First level recipients of international humanitarian funding
UNPooledFunds
UNAgencies
NationalNGOs
LocalNGOs
Data
No data
available on global level
ICRC
IFRCINGOs
NationalRed Cross
Red CresentSocieties
WFP
UNHCR
UNHCR
UNRWA
IOMOCHA
FAQ WHO
BCHF ERF
UNFPA
UNDP
UNMAS
ICRC
SC
NRC DRC OX ACT CARE ACF MSFMCIFRCIRC
CRS WV CG
100%
90%
80%
70%
60%
50%
40%
30%
20%
10%
0%0.5% 1% 1.5% 2% 2.5% 3% 3.5% 4%
Cumulative %
of Received Funding (as reported to O
CHA
-FTS)
Cumulative % of Humanitarian Actors (as reported to OCHA-FTS)
SC = Save the ChildrenNRC = Norwegian Refugee CouncilDRC = Danish Refugee CouncilOX = Oxfam/CommunityAidAbroad/
Intermon/NovibACT = ACT AllianceCARE = CARE International ACF = Action Contre la FaimMSF = Médecins sans FrontièresIRC = International Rescue CommitteeMC = Mercy CorpsCRS = Catholic Relief ServicesWV = World Vision InternationalCG = Caritas Germany (DCV)
WFP = World Food ProgrammeUNHCR = United Nations High Commissioner for Refugees UNICEF = United Nations Children’s FundUNRWA= United Nations Relief and Works Agency for
Palestine Refugees in the NearEastIOM = International Organization for MigrationOCHA = Office for the Coordination of Humanitarian AffairsFAO = Food &Agriculture Organization of the United NationsWHO = World Health OrganizationB = Bilateral (affected governments)CHF = Common Humanitarian FundERF = Emergency Response Fund (OCHA)UNFPA = United Nations Population FundUNDP = United Nations Development ProgrammeUNMAS = United Nations Mine Action ServiceICRC = International Committee of the Red CrossIFRC = International Federation of Red Cross and Red Crescent Societies
International NGOs
Multilaterals, Bilateral RedCross/Crescent
News

6菀
. . . . . . . . . . . . . . . . . . . . . . . . . . . . . . . . . . . . . . . . . . . . . . . . . . . . . . . . . . . . . . . . . . . . . . . . . . . . . . . . . . . . . . . . . . . . . . . . . . . . . . . . . . . . . . . . . . . . . . . . . . . . . . . . . . . . . . .
. . . . . . . . . . . . . . . . . . . . . . . . . . . . . . . . . . . . . . . . . . . . . . . . . . . . . . . . . . . . . . . . . . . . . . . . . . . . . . . . . . . . . . . . . . . . . . . . . . . . . . . . . . . . . . . . . . . . . . . . . . . . . . . . . . . . . . .
tional and local NGOs but suggests that suchdata could be available aer activating its newfinancial tracking systems later in 2015.
UNHCR publishes figures on funding flowsto local and national humanitarian actors. In2013, USD 389 million (18.7 %) were allocatedto 567 local and national humanitarian actors.
While UNICEF does not officially publishfunding flow data, data was made available: in2012, USD 63.5 million (or 7.6% of its annualbudget) went towards funding 595 national andlocal humanitarian actors, which have a part-nership agreement with UNICEF. Out of thisamount, USD 3.4 million went to national RedCross/Crescent Societies. UNICEF also providesfunding to L/NNGOs which work under serviceproviders contracts (no data available on thesedisbursements).
INGOsTen of the largest international NGOs wereasked to report on their funding flows to nationaland local NGOs. Only three of the INGOs/al-liances provided any data on the amount offunding they channelled to local and nationalNGOs: e Danish and Norwegian RefugeeCouncil (DRC and NRC) and the ACT Alliance.In 2013, DRC spent USD 17.3 million on 150different local and national NGOs which amountsto 5.6% of its annual humanitarian budget. eNRC spent USD 8.6 million on L/NNGOs whichamounts to 2.66% of its annual humanitarianbudget. e ACT Alliance could provide partialdata for 34.8% of a 100 million USD budget. Ofthis, USD 6.7 million (19.3%) was channelledto 24 local and national NGOs.
ICRC/IFRCICRC and IFRC could not provide data on in-ternal funding flows/flows to national societies.
ConclusionsFunding flows to national and local organisationsappear very modest compared to the crucialimportance of local responses. e current re-porting and tracking of funding flows to nationaland local actors is so limited and so lacking interms of quality, consistency and depth of detail,that it is hardly possible to establish a singleoverall actual figure or percentage with a rea-sonable degree of certainty. Furthermore, thereis little information on the nature and qualityof the partnerships and collaboration with L/NN-GOs. Given the importance of local actors inhumanitarian crises throughout the world, thisfinding in itself could indicate a failure in trans-parency and accountability for the global hu-manitarian system as a whole.
Suggestions currently under discussion inglobal fora include that a minimum of 15% ofdonors, UN agencies and INGOs’ humanitarianfunding should be directed to NNGOs; or 20%of all global funding to go to local organisationsby 2020; or country level pooled funds (CHF/ERF) should allocate 50% of their funds to na-tional NGOs. Based on the findings of thisreport, the authors make a number of furtherrecommendations for consideration during thedialogue leading to, and at, the World Humani-tarian Summit 2016:• All humanitarian actors (donors, interna-
tional and national/local agencies and NGOs) should make detailed data about
funding flows available in a form, which is transparent and universally recognizable.
• A sufficiently nuanced and universally agreed classification system for types of L/NNGOs and the nature of the funding collaboration (‘partnership’) is required in order to improve the ability to analyse morequalitative aspects of future trends.
• Relevant data collecting and processing entities such as DAC, OCHA FTS, GHA andthe International Aid Transparency Initiative(IATI) may, in cooperation with relevant local and national authorities and NGO coordination fora, lead in developing and agreeing universally replicable reporting cri-teria, classifications and tracking modalities.
For more information, contact: NilsCarstensen, L2GP project manager, email:[email protected]
A series of interactive graphs and figures byChristian Els (who worked on the visualisationgraphics) and Nils Carstensen are jointly pub-lished with IRIN as a companion to the L2GPProtection study on humanitarian financing.Graphics are available at:http://www.local2global.info/wp-content/up-loads/funding_flows.html
For further work by IRIN on the humanitarianeconomy, visit: http://newirin.irinnews.org/the-humanitarian-economy, including a new reporton reforming the humanitarian financing system,http://www.irinnews.org/report/101694/it-s-all-about-the-money
Figure 3 Available data on funding flows to local and national humanitarian actors
NOT INVESTIGATEDNO DATA ON FUNDING FLOWS TO L/NNGOS PROVID-ED
INTERNATIONAL HUMANITARIAN ACTORSLOCAL AND NATIONAL HUMANITARIAN ACTORS
Abbreviations: I = southern national red cross/crescent organisations, II = direct funding to local and national lNGOs by DAC donors and privateorganisations. NRSC = National Red Cross and Red Crescent Societies, GAA = German Agro Action/Welthungerhilfe.Source: OCHA FTS, GHA2014 report, UNICEF, DRC, NRC, ACT Alliance and UNHCR annual report
12 http://www.aidtransparency.net/
News

66
. . . . . . . . . . . . . . . . . . . . . . . . . . . . . . . . . . . . . . . . . . . . . . . . . . . . . . . . . . . . . . . . . . . . . . . . . . . . . . . . . . . . . . . . . . . . . . . . . . . . . . . . . . . . . . . . . . . . . . . . . . . . . . . . . . . . . . .
. . . . . . . . . . . . . . . . . . . . . . . . . . . . . . . . . . . . . . . . . . . . . . . . . . . . . . . . . . . . . . . . . . . . . . . . . . . . . . . . . . . . . . . . . . . . . . . . . . . . . . . . . . . . . . . . . . . . . . . . . . . . . . . . . . . . . . .
Linking agriculture withnutrition within SDG2:making a case for a dietarydiversity indicator By Anna Lartey
What does malnutrition looklike in 2015?While most of the world’s hungry people arestill in South Asia, followed by East Asia andsub-Saharan Africa, Asia’s share in terms of ab-solute numbers has decreased markedly, whilethat of Sub Saharan Africa’s has considerablyincreased. Overall, the prevalence of under-nourishment in developing countries has declinedsince 1990; however the rate of decline hasslowed in recent years.
In line with undernourishment or hunger2
trends, undernutrition (stunting and wasting) isalso declining, albeit too slowly. Stunting andunderweight remain high in many countries, es-pecially in Africa, as do micronutrient deficiencies,most notably in iodine, iron and vitamin A.3,4
At the same time that these trends in under-nutrition persist, overweight and obesity arerising so much so that in many countries, un-dernutrition, micronutrient deficiencies andoverweight and obesity now co-exist and present
within the same populations and in some coun-tries, in the same households.
Nutrition transition and globalshifts in diet qualityWhat is driving this “double burden of malnu-trition”? Oen referred to as the “nutrition tran-sition”, the causes are complex and linked torapid socioeconomic, demographic and tech-nological changes, most of which are, themselves,linked to globalisation. ese include changesin technology regarding how food is processed,marketed and prepared and changes in mealpatterns. e end result is major shis in dietpatterns, characterised by increased total energyintake. While the latter includes increased intakeof animal source foods and vegetable oils, aswell as a small increase in global fruit and veg-etable intake, most of the foods that people areeating more of are cereal-based.
Indeed between 1965 and 1999 in developingcountries, growth in cereal production was over100%, outpacing population growth; gains in
pulse production during this same period re-mained relatively low, averaging well below 50%.e low production of pulses can be considereda rough indicator for all kinds of non-staplefoods including fruits and vegetables, none ofwhich have increased at anywhere near the rateof cereals, namely because agricultural researchand other types of investment during this periodwas strongly biased towards cereal production.5,6
Consequent declines in cereal prices havebeen followed by dramatic increases in the priceof non-staple foods, effectively raising the “price”of diet quality and contributing to the afore-mentioned persistence of vitamin and mineraldeficiencies. For example, in Bangladesh, pricesfor cereals, non-cereal plant foods and animalsource foods were roughly equal in 1975. By1996, cereal prices had decreased substantiallywhile prices for non-staple foods had increased.e end result, especially for poorer families,was an increase in the percentage share of house-hold food expenditures on non-staple foods,with a concomitant decrease in actual intake ofthose foods. e implication is that householdswill spend more of the food budget on non-staple foods, but these foods comprise only amodicum of total energy intake7.
Until the year 2000, cereal prices were in de-cline, assuring that at very least, the world’spoor were assured in terms of total energyintake. However in the last decade, cereal priceshave themselves begun to rise, increasing foodbudget expenditures on staples at the expenseof whatever small amounts of higher nutrientfoods were being consumed. e end result isthat in recent years, the “cost” of diet quality ishigher than ever.
Revising conventional foodsecurity paradigms As previously mentioned, today’s global foodsystems have been shaped by trends in agriculturalresearch and investment over the past thirtyyears. ese trends are in line with conventionalfood security paradigms which put the focussquarely on physical food availability at a nationalor sub-national level, usually assessed in terms
e essence of this article featured as a key note presentation in the 5th annual researchconference of the Leverhulme Centre for Integrative Research on Agriculture andHealth (LCIRAH), at the London School of Hygiene and Tropical Medicine, London,on the 3rd and 4th of June, 20151.
• Undernourishment and undernutrition, including micronutrient deficiencies, have decreased in the last 20 years, but are still major challenges.
• Over-weight and obesity are increasing and are now prevalent in most countries, even those where undernutrition persists.
• Trends in the global food supply – namely heavy investment in cereals and underinvestment in non-staples – have created a situation where the cost of a healthy diet can be very high and the incentives to eat highly processed foods of minimal nutritional value are strong.
• These trends have contributed to the “perfect storm” for the double burden of malnutrition which is now common-place.
• Tackling these issues requires strengthening the links between agriculture, a healthy and affordable food supply, diet quality, and nutrition.
• A new focus on diet quality in high level political discourse is key to strengthening these links.• Indicators of diet diversity are essential for assessing diet quality; as such they should be included in
the SDG on food security and nutrition.
1 http://www.lcirah.ac.uk/5th-annual-conference2 Undernourishment means that a person is not able to
acquire enough food to meet the daily minimum dietary energy requirements, over a period of one year. FAO defineshunger as being synonymous with chronic
undernourishment. For more information on trends, see http://www.fao.org/hunger/en/
3 Levels and Trends in Child Malnutrition: UNICEF, WHO, World Bank Joint Estimates 2014. Available online as of June24, 2015 at: http://www.data.unicef.org/corecode/uploads/document6/uploaded_pdfs/corecode/LevelsandTrendsMal Nutrition_Summary_2014_132.pdf
4 International Food Policy Research Institute (2014). Global Nutrition Report 2014: Actions and Accountability to Accelerate the World’s Progress on Nutrition. Washington, DC.
5 Pingali, P. (2015). Agricultural policy and nutrition outcomes - getting beyond the preoccupation with staple grains. FoodSecurity 7:583-591.
6 Bouis, H., Eozenou, P., Rahman, A. (2011). Food prices, household income, and resource allocation: Socioeconomic perspectives on their effects on dietary quality and nutritional status. Food and Nutrition Bulletin, vol. 32, no. 1 (supplement). The United Nations University.
7 See footnote 5.
Main Messages
News
Anna Lartey is Director of FAO’s Nutrition Division within theEconomic and Social Development Department at FAO in Rome.She was a Professor of Nutrition at the University of Ghana for 29years. Her research focused on maternal child nutrition. She was arecipient of the International Development Research Centre (IDRC,Canada) Research Chair in Nutrition for Health and SocioeconomicDevelopment in sub-Saharan Africa. She is also the recipient of the
Sight and Life Nutrition Leadership Award for 2014. Dr Lartey is also the President of theInternational Union of Nutritional Sciences (IUNS, 2013-2017).

67
. . . . . . . . . . . . . . . . . . . . . . . . . . . . . . . . . . . . . . . . . . . . . . . . . . . . . . . . . . . . . . . . . . . . . . . . . . . . . . . . . . . . . . . . . . . . . . . . . . . . . . . . . . . . . . . . . . . . . . . . . . . . . . . . . . . . . . .
. . . . . . . . . . . . . . . . . . . . . . . . . . . . . . . . . . . . . . . . . . . . . . . . . . . . . . . . . . . . . . . . . . . . . . . . . . . . . . . . . . . . . . . . . . . . . . . . . . . . . . . . . . . . . . . . . . . . . . . . . . . . . . . . . . . . . . .
of net food production and cereal stock levels.While national food availability is an obviouspre-requisite for total food security, it is not thewhole story, as it does not necessarily reflectwhat foods households are growing and able toafford, let alone what individuals are actuallyeating. ese dimensions of food security aretypically referred to as “household food access”and “individual utilisation”.
Tackling malnutrition in all its forms requiresrevision of conventional food security paradigmsto better include these dimensions. Doing sorequires revisiting the cereal-centric supportpolicies that have characterised the last threedecades of agricultural policy in favour of an in-vestment agenda that promotes production di-versity. Figure 1 shows just how far we have togo in terms of achieving this goal. To date, thereare over 250,000 globally identified, edible plantspecies; historically, 7,000 of these have beenused for food by humans. Currently, three crops– rice, maize and wheat – provide over 50% ofthe world’s energy intake, and 12 (including fiveanimal species) provide 75%8. No wonder thereis so little diversity in today’s diets.
Prioritising diet diversity: a keyindicator for improving dietqualityHow then do we meet the challenge of increasingthe nutrition sensitivity of today’s global foodsystem? How can we lower the “price” of dietquality in the hopes of increasing nutrient ade-quacy and decreasing excessive energy intake?
A stronger, more explicit focus on dietdiversity is now increasingly recognised as animportant strategy in achieving these goals. In-dicators of diet diversity are typically constructedfrom scores for individual food consumptionwhich are computed based on information onthe number of different food groups from whichthe individual consumed over a recent shortperiod of time. Diet diversity scores have beenrepeatedly validated as having a robust and con-sistent positive statistical association with ade-
quacy in individual micronutrient consumption.In other words, the higher the diet diversityscore for an individual, the more likely that in-dividual has a diet which meets his or hervitamin and mineral requirements.9
Associations have also been reported betweendiet diversity and other outcomes, includingcognitive function, all-cause mortality in theelderly10,11 and wasting in children.12 Dietdiversity is relative simple to measure and rele-vant across a variety of cultures. Moreover, allnational food-based dietary guidelines includethis dimension.
In July 2013, FAO and partners announceda new development in diet diversity scores: con-sensus on a threshold metric to classify womenas having high or low diet diversity. Referred toas the MDD-W or Minimum Dietary Diversityfor Women, this indicator measures the percentof women, 15-49 years of age, who consume atleast 5 out of 10 defined food groups. e de-velopment of the MDD-W offers a unique op-portunity to systematically survey women’s dietdiversity, thus facilitating assessment of dietquality at population level.
Leveraging currentopportunitiesJointly organised by the FAO and the WHO,the Second International Conference on Nutrition(ICN2) was an inclusive inter-governmental,high-level ministerial conference on nutrition.e primary outcome documents were the RomeDeclaration on Nutrition and an accompanyingFramework for Action13. Both documents placestrong emphasis on the role of food systems inimproving nutrition, in particular through theadoption of policies and legal frameworks, whichenhance the availability and accessibility of safeand nutritious foods and which ensure healthydiets throughout the life course (Commitment7 of the Rome Declaration). Specific recom-mendations from the Framework for Action areas follows:• Integrate nutrition objectives into
8 Food and Agriculture Organisation,1995. Dimensions of need - An atlas of food and agriculture, FAO, 1995. http://www.fao.org/documents/card/en/c/e9a6a212-d7d5-5e06-b104-230a52a56ca9/)
9 Ruel, M., J. Harris, and K. Cunningham. 2013. "Diet Quality in Developing Countries." In Diet Quality: An Evidence-Based Approach, Volume 2. V.R. Preedy, L.-A. Hunter, and V.B. Patel (eds.). 239-261. New York: Springer.
10 Chen, R.C., Chang, Y.H., Lee, M.S., Wahlquist, M. (2011). Dietary quality may enhance survival related to cognitive impairment in Taiwanese elderly. Food Nutrition Research. 2011;55
11 Lo, Y.T., Chang, Y.H., Wahlquist, M., Huang, H.B., Lee, M.S. (2012). Spending on vegetable and fruit consumption could reduce all-cause mortality among older adults. Nutrition Journal 11:113.
12 Amugsi, A., Mittelmark, M.B., Lartey, A. (2014). Dietary Diversity is a Predictor of Acute Malnutrition in Rural but Notin Urban Settings: Evidence from Ghana. British Journal of Medicine & Medical Research 4(25): 4310-4324.
13 http://www.fao.org/about/meetings/icn2/en/
agriculture and food policies • Promote diversification of crops • Improve storage….reduce seasonal food
insecurity, food and nutrient loss and waste • Develop international guidelines on healthy
diets• Gradual reduction of saturated fat, sugars,
salt/sodium and trans-fat from food and beverages
ese messages are reiterated in Goal 2 of theSustainable Development Goals (SDGs): Endhunger, achieve food security and improved nu-trition and promote sustainable agriculture.
ese high level political documents offerunprecedented opportunities to advocate forthe prioritisation of nutrition within agriculture.As such, they also offer an unprecedented op-portunity to advocate for a stronger focus ondiet quality as a way to measure progress inachieving food security that goes beyond theconventional focus on cereal stock levels, toassure increased production diversity with im-plications for the food supply and nutrition.
e proposed indicators for this SDG - pro-portion of the population below the minimumlevel of dietary energy consumption; prevalenceof anaemia in women; and prevalence of wastingand stunting in children under 5 – do notcapture this consideration.
Given this situation, and the subsequent riskof continuing to fall short of our goals for im-proving food security and nutrition for all, forreducing the triple burden of malnutrition, andfor improving the quality of the food supply formillions of people worldwide, it is imperativethat we leverage the precedent set during theICN2 to advocate for inclusion of the MDD-W asan indicator for SDG 2. Simply put, diet diversityunderpins a healthy diet. As such, an indicator ofdiet diversity like the MDD-W should be used topromote agricultural policies that go beyond“business as usual” and look towards a more nu-trition-sensitive paradigm that prioritises pro-duction of diverse, nutrient-rich foods for all.
For more information on the MDD-W, visit:http://www.fantaproject.org/monitoring-and-evaluation/minimum-dietary-diversity-women-indicator-mddw
Figure 1 Very little diversity in current dietary patterns
Source: ‘Dimension of Need: An atlas of food and agriculture’. FAO, 1995
Shrinking Diversity250,000
7,000
3
12
Number of crops usedfor food by humansthroughout history
Globally identified plantspecies
Number of crops thattogether with 5 animal
species provide 75% ofthe world’s food today
Rice, maize and wheatcurrently provide 60%
of the world’s foodenergy intake
News

. . . . . . . . . . . . . . . . . . . . . . . . . . . . . . . . . . . . . . . . . . . . . . . . . . . . . . . . . . . . . . . . . . . . . . . . . . . . . . . . . . . . . . . . . . . . . . . . . . . . . . . . . . . . . . . . . . . . . . . . . . . . . . . . . . . . . . .
68
Field Articles ..................................................
Location: LebanonWhat we know: Non-communicable diseases are a major and growing publichealth problem in low and middle income countries; this is relevant forprotracted crisis situations.
What this article adds: In August 2014, Help Age International and partnersbegan a clinic-based health project (prevention and management) in fourregions of Lebanon targeting Type II Diabetes and hypertension in theSyrian refugee population and the vulnerable Lebanese host communitiesaged over 40 years.From November to May 2015, 1,825 patients wereenrolled (two-thirds were Syrian refugees); 46% with hypertension, 27% withdiabetes, and 27% with both. It has been a successful collaboration amongstpartners; coordination and communication proved critical. Challengesinclude insecurity, transportation costs and workload.
By Maguy Ghanem Kallab
Maguy Ghanem Kallab is thehealth coordinator ofHelpAge International inLebanon. She holds aMaster’s degree in PublicHealth and is currentlypursuing her doctorate in
Health. She has 10 years of professionalexperience in the public health field.
The author is very grateful for the support andinput of Dr Pascale Fritsch, Humanitarian Healthand Nutrition Adviser, Help Age International. Theauthor also extends thanks to Help AgeInternational and to the Disaster EmergencyCommittee for funding the project andsupporting services for Syrian refugees andvulnerable Lebanese. The author gratefullyacknowledges the contribution of all the partnersto the success of the project; Amel AssociationInternational, American University ofBeirut/Centre for Public Health Practice, Medecindu Monde and the Young Men’s ChristianAssociation (YMCA) – Lebanon.
Management ofhypertensionand diabetes forthe Syrianrefugees andhost communityin selectedhealth facilitiesin Lebanon
Non-communicable diseases (NCDs)constitute a major global publichealth problem expected toevolve into a staggering economic
burden over the next two decades1. e up-surge in NCDs is related to the epidemio-logical transition from communicable toNCDs, demographic change related to theincreased longevity, urbanisation and glob-alisation that has resulted in exposure to‘junk’ food, increased consumption of alcohol,less physical activity and an overall unhealthylifestyle.
According to the World Health Organi-sation (WHO), the four common NCDsare cardiovascular diseases (CVD), cancers,diabetes and chronic lung diseases. esediseases share common modifiable risk fac-tors including smoking, unhealthy diet,physical inactivity and alcohol abuse. In2012, cardiovascular disease was the leadingcause of NCD deaths, causing 17.5 milliondeaths worldwide2. Two important CVDrisk factors CVDs are hypertension (HTN)and diabetes mellitus (DM) that are in-creasing in epidemic proportions globally.HTN affects about one billion people world-
wide and is expected to reach 1,561.56billion by 20253. DM affects 366 millionpeople around the world and according tothe International Diabetes Federation, onein 10 people will suffer from DM in 20304.
e burden of NCDs is rapidly yet dis-proportionally increasing, with the highestimpact in low and middle income countries(LMIC). In 2004, NCDs accounted for 60%of the 59 million deaths world-wide5, risingin 2012 to 68% of the 56 million globaldeaths6. Nearly three quarters of NCD deathsoccur in LMICs; about 48% of deaths occurbefore the age of 70 years7. Furthermore, itis estimated that by 2030, NCDs in theLMICs will be responsible for three timesas many disability adjusted life years (DALYs)and nearly five times as many deaths ascommunicable diseases, maternal, perinataland nutritional conditions combined8.
In the Arab countries, data for NCDsand their risk factors are limited but thereis clear evidence that risk factors for thedevelopment of NCDs are on the rise. Ac-cording to WHO, physical activity in theMediterranean region is very limited and
1 Bloom DE, Cafiero ET, Jane-Llopis E, Abrahams-Gessel S, Bloom LR, et al (2011). The global economic burden of non-communicable diseases.Geneva:World Economic Forum. p48
2 World Health Organisation (2011). Global status reporton non-communicable diseases 2010. Geneva
3 P. M. Kearney, M. Whelton, K. Reynolds, P. Muntner, P. K.Whelton, and J. He, “Global burden of hypertension: analysis of worldwide data,” The Lancet, vol. 365, no. 9455, pp. 217–223, 2005
4 N. Unwin, D. Whiting, L. Guariguata, G. Ghyoot, and D. Gan, Eds., Diabetes Atlas, International Diabetes Federation, Brussels, Belgium, 5th edition, 2011
5 Global Burden of Disease 2004 Update (published 2008) http://www.who.int/healthinfo/global_burden _disease/GBD_report_2004update_full.pdf
6 See footnote 27 See footnote 28 See footnote 29 WHO- Global Health Observatory Data Repository,
Prevalence of insufficient physical at http://apps.who. int/gho/data/view.main.2482?lang=en
10 Abdul Rahim, H., Sibai,A., Khader, Y., Hwalla, N., Fadhil, I., Al Siyabi, H., Mataria, A., Mendis, S., Mokdad, A., Husseini, A., 2014, Non-Communicable Diseases in theArab World, Lancet, 383: 356-367
Blood pressure measurement aspart of the Mashaghra campaign
Que
ntin
Bru
no, L
eban
on, 2
015

. . . . . . . . . . . . . . . . . . . . . . . . . . . . . . . . . . . . . . . . . . . . . . . . . . . . . . . . . . . . . . . . . . . . . . . . . . . . . . . . . . . . . . . . . . . . . . . . . . . . . . . . . . . . . . . . . . . . . . . . . . . . . . . . . . . . . . .
. . . . . . . . . . . . . . . . . . . . . . . . . . . . . . . . . . . . . . . . . . . . . . . . . . . . . . . . . . . . . . . . . . . . . . . . . . . . . . . . . . . . . . . . . . . . . . . . . . . . . . . . . . . . . . . . . . . . . . . . . . . . . . . . . . . . . . .
69
Field Article
the region ranks the highest for sedentary lifestyleamong school-going adolescents (87.5%) andsecond highest for adults 18y plus (31.1%)9.Low physical activity in the Arab region hasbeen attributed to the lifestyle changes that ac-companied urbanisation and the cultural con-straints of the conservative communities wherewomen are more likely to stay home10. Exceptfor tobacco smoking, between 1990 and 2010,attributable DALYs of all leading NCD riskfactors increased in the Arab world and obesityreached an alarming stage11. In Syria, WHO es-timates that NCDs accounted for 46% of totaldeaths of which 28% are attributed to CVD12. Asurvey conducted in Aleppo in 2006 involving1168 adults aged 25 years plus showed a HTNprevalence of 45.6% with 15.6% for DM13.
In Lebanon, NCDs are rising rapidly andthe gravity of NCDs relates to the prevalence ofrisk factors as well as the proportion of undiag-nosed patients. According to WHO, NCDs ac-count for 85% of all deaths in Lebanon of which47% relate to CVD and 4% to DM14. A chronicdiseases risk factors surveillance conducted in2008 among a representative population aged25-64 years old showed that 13.8% of the surveyedpopulation were already diagnosed with HTNand 5.9% affected with DM. Disease prevalenceincreases with age; for the 55-64y age group,HTN is estimated at 41.6% and DM at 20.3%.Moreover the relatively high percentage of un-diagnosed cases is alarming with 12.7% of peoplehaving high blood pressure that they did notknow about15. e problem of undiagnosed dis-eases was also reported in a survey conductedin 2012 -2013 among healthy Lebanese aged 40years plus where 15% of the respondents hadelevated blood pressure and around 10% hadelevated random blood sugar16. e Ministry ofPublic Health in Lebanon (MOPH) devotes aconsiderable amount of its budget to subsidisechronic medications that have been distributedfree of charge for the last 18 years. In 2012, theMOPH and WHO initiated an NCDs screeningprogramme at primary health care level forearly detection and management of HTN and
DM cases. Nowadays MOPH/WHO are joiningefforts with various stakeholders for the imple-mentation of a national NCD strategy.
Situation of Syrian refugees inLebanonAer four years of conflict, bombardments,killing and displacement, the Syrian crisis isturning into a complex protracted humanitariancrisis with millions of displaced people livingin poor conditions, facing illnesses and deathon a daily basis. In Lebanon, up until June 10th2015, 1,174,690 Syrian refugees were registeredwith UNHCR and many more are awaiting reg-istration (suspended since May 6th 2015 as perthe Lebanese government directives)17. A vul-nerability assessment survey conducted by UN-HCR, UNICEF and WFP in 2014 among 1,747Syrian refugee households showed that despitethe continuous assistance provided, the situationof Syrian refugees in Lebanon was deterioratingwith half of surveyed respondents below theextreme poverty line for Lebanon (3.84US$/day).Food, rent and health care constitute the mainexpenditures of 77% of the Syrian refugees. Ofsurveyed households, 69% benefited from foodvouchers and for 41%, these vouchers are themain source of food. Nevertheless the mostconsumed food groups had low nutrient valuesand the diversity of food had decreased compared
to the previous year18. Significant variation ofdiet is associated with the financial status,location and type of shelter and household size19.Syrian refugees adopted different coping strategiesincluding reduced number of meals and reducedportions, reduced spending on education andhealth and engaging children in labour20.
For health, more than half of surveyed house-holds articulated a need for greater healthsupport either for chronic diseases or for ma-ternity care. e high cost of health serviceswas noted as the main barrier for managementof health problems21. A study conducted in 2013by Caritas Lebanon Migrant Centre and JohnsHopkins Bloomberg School of Public Health,among 210 older refugees in Lebanon showedthat 79% of them did not seek health carebecause of its high cost and 87% complained ofthe very high cost of medication22. Many refugeesused to cross the border to get their chronicmedication but with the implementation of thelegal measures at the border in 2015, this is be-coming too difficult23. For 66% of older Syrianrefugees, their health conditions deterioratedin Lebanon and more than half of them reportpoor health status24.
Restricted mobility linked to limited legalstatus constitutes a major source of insecurity,fear and anxiety for the Syrian refugees. By theend of 2013, the Norwegian Refugee Councilconducted an assessment among 1,256 Syrianrefugees enquiring about the legal componentof residency in Lebanon. e survey showedthat 89% of respondents exhibited fear of arrestor mistreatment at checkpoints whilst travellingto UNHCR registration sites and trying to accesshealth care services25.
HelpAge project in LebanonA survey conducted by HelpAge International(HelpAge) and Handicap International in 2013among 3,202 Syrian refugees in Jordan andLebanon showed that 15.6% of the total surveyedpopulation and 54% of older people are affectedby at least one chronic disease and that they arefacing barriers for proper disease managementincluding difficult access to health care and lackof medications for chronic conditions. Cost wasa key element26.In August 2014, HelpAge launcheda health project in Lebanon in partnership withMédecins du Monde (MdM), Amel Association
11 See footnote 1012 World Health Organisation-Non Communicable Diseases
(NCD) Country Profiles, 2014 Syrian Arab Republic 713 Radwan Al Ali, R., Rastam, S., Fouad, F., Mzayek, F., Maziak., W,
2011, “Modifiable Cardiovascular Risk Factors Among Adults in Aleppo, Syria” International Journal of Public Health, 56 (1) 8
14 WHO, Non communicable diseases profile Lebanon, 201415 Sibai AM and Hwalla N. WHO STEPS Chronic Disease Risk
Factor Surveillance: Data Book for Lebanon, 2009. American University of Beirut, 2010 (http://www.moph.gov.lb/Publications/Documents/WHO_ Databook_ Lebanon_2010_final.pdf ).
16 Yamout, R., Adib, S., Hamadeh, R., Freidi, A., Ammar, W., 2014, Screening for cardiovascular Risk in Asymptomatic Users of the Primary Health Care Network in Lebanon, 2012-2013, Preventive Chronic Diseases, 11: 140089
17 http://data.unhcr.org/syrianrefugees/country.php?id=122 accessed June 23rd 2015
18 Syrian Refugee Response: Vulnerability Assessment of the
Syrian Refugees in Lebanon 2014 19 Jonathan Strong, Christopher Varady, Najla Chahda,
Shannon Doocy, Gilbert Burnham. 2015. Health status and health needs of older refugees from Syria in Lebanon. Conflict and Health 9:12 doi:10.1186/s13031-014-0029-y 14. See also footnote 18.
20 See footnote 18.21 See footnote 18.22 See footnote 19.23 See footnote 19.24 See footnote 19.25 The Consequences of Limited Legal Status for Syrian
Refugees in Lebanon, NRC Lebanon Field Assessment: North, Bekaa, South, March 2014.
26 Hidden victims of the Syrian crises: disabled, injured and older refugees copyright 2014 HelpAge International and Handicap International& UNHCR 2014. Health access and utilisation survey among non-camp Syrian refugees. Available at http://data.unhcr.org/syrianrefugees/download.php?id=6029
HBA1C testing
Que
ntin
Bru
no, L
eban
on, 2
015

70
. . . . . . . . . . . . . . . . . . . . . . . . . . . . . . . . . . . . . . . . . . . . . . . . . . . . . . . . . . . . . . . . . . . . . . . . . . . . . . . . . . . . . . . . . . . . . . . . . . . . . . . . . . . . . . . . . . . . . . . . . . . . . . . . . . . . . . .
. . . . . . . . . . . . . . . . . . . . . . . . . . . . . . . . . . . . . . . . . . . . . . . . . . . . . . . . . . . . . . . . . . . . . . . . . . . . . . . . . . . . . . . . . . . . . . . . . . . . . . . . . . . . . . . . . . . . . . . . . . . . . . . . . . . . . . .
Field ArticleInternational (AMEL), Young Men’s ChristianAssociation, Lebanon (YMCA) and the AmericanUniversity of Beirut, Centre for Public HealthPractice (AUB/CPHP). e project intends toaddress the major public health issues of TypeII DM27 and HTN in the Syrian refugee popula-tion and the Lebanese host communities, andtargets adults from the age of 40. It aims at im-proving the management of DM and HTN atprimary health care level through three pillars:1) provision of appropriate medical care forHTN and DM, 2) capacity building of localstaff with focus on the needs and vulnerabilityof older adults, and 3) advocacy for specificmeasures to account for the vulnerabilities ofolder people in the humanitarian response.
Provision of servicesFollowing a baseline needs assessment and apilot phase, the project was planned in eighthealth facilities (five health centres and threemobile units) run by AMEL in four regions inLebanon that foster underprivileged refugeeand host community populations (North Bekaa,West Bekaa, Tyr and Beirut). Pre-project, thesefacilities were providing basic NCDs care (mostlyrepeat prescriptions) without active involvementin their proper diagnosis and management.Some of these facilities were dedicated to motherand child care.
At the beginning of the project, the eighthealth facilities were provided with basic equip-ment for NCD management at primary healthcare level (blood pressure machine, stethoscope,weight/height scale, measuring tape, glucometer+lancet +strips), while the health staff receiveda refresher training on diabetes and hypertensionmanagement.
e project offers a comprehensive portfolioof services that cover promotion, preventionand management of DM and HTN. All patientsabove 40 years of age visiting the health facilitiesare screened for DM and HTN according toWHO guidelines; people at risk or diagnosed
with any of these diseases will receive clinicalexamination28, laboratory tests, chronic med-ications and necessary information about diseasemanagement, preventive measures, medicationcompliance and medical follow up. Informationis provided within awareness/informal educationsessions.
e clinical assessment is performed by aGeneral Practitioner (GP) and when needed,patients are referred to a specialist -usually acardiologist. Nominal fees (2000LBP-3000LBP)are paid for this service at the health care centrewhile it is free of charge in the mobile unit.Medications for chronic conditions are providedfree of charge in compliance with the MOPHlist for chronic medications and WHO recom-mendations. Medications are provided eitheron a monthly basis or quarterly for stable patients,those with disabilities and those aged 60 pluswith reduced mobility, in order to minimisetransportation issues.
Selected laboratory tests, recommended byWHO for the diagnosis and management ofDM and HTN, are prescribed at the health fa-cilities (such as HBA1C tests and lipid profiles).To save the patients transportation costs andtrouble (especially for disabled and older people),blood samples are collected on site and sent toa nearby laboratory for analysis. Alternatively,patients are directly referred to a laboratorythat has a contract with AMEL/HelpAge. elaboratories do not charge the patients but arereimbursed by AMEL/HelpAge on submissionof monthly financial reports. At the mobileunits, on-site blood tests for sugar, HBA1C,cholesterol and triglycerides are performed forthose unable to reach the clinics.
Patient education is offered in the healthcentres under three modalities; 1) one-on-one,during the brief time of patient enrolment, 2)brief informal awareness sessions given in thewaiting areas, 3) formal sessions scheduled everytwo weeks (usually 30-45 minutes long), followed
by a questions/answers session. In the mobileunits, nurses and social workers carry out informaleducational and awareness raising sessions forpeople who gather around the mobile unit when-ever the time and workload permits. Patient ed-ucation and awareness sessions include infor-mation about HTN or DM or both. Items dis-cussed include lifestyle modifications (generalinformation on tackling common modifiablefactors noted by WHO, such as smoking, alcohol,exercise and diet), and the importance of com-pliance to medications and follow-up. One toone specific dietary counselling is not provided.
Capacity building A series of training was conducted throughoutthe project on different topics as per identifiedneeds. AMEL staff involved in the direct imple-mentation of project services received trainingon the management of HTN and DM by theLebanese Cardiology Society and the LebaneseDiabetes Society respectively. e training wasfollowed by one to one training at centres levelby the AMEL medical coordinator to foster theimplementation of WHO guidelines and ensurequality of care.
Training on drugs use and management wasconducted by YMCA for all twenty AMELcentres with on-site follow up and monitoringfor the centres included in the project. A trainingworkshop on data collection methods and toolswas conducted by the American University ofBeirut (AUB/ Centre for Public Health Practice(CPHP) to AMEL staff highlighting the basicprinciples of evaluative research and data col-lection with much emphasis on the ethical aspectof data collection, including the concepts of re-spect, beneficence, social justice and informedconsent.Training on accountability was providedby HelpAge to all partners with a focus on thepractical application of accountability commit-ments: participation, transparency, complainthandling and feedback, staff competency, M&Eand programme quality. Moreover, AMEL staffwere consulted on and involved with the designand planning of activities and the developmentof monitoring tools and an evaluation plan. Atnational level, training on the specific needsand vulnerabilities of older adults with a focuson HTN and DM was conducted by YMCA for285 health staff and social workers practicing atprimary health care level. Besides the nutritionalinformation and messages about specific dietarymeasures recommended for diabetic and/or hy-pertensive patients, training on a mini-nutritionalassessment for older people29 was given withinthe comprehensive geriatric assessment (due tocapacity limitations and workload, the mini-nutrition assessment was not implemented inthe NCD project).
27 Insulin dependent (Type I) diabetes is not managed within this project.
28 This included Body Mass Index (BMI) and waist circumference to assess risk of disease.
29 This involved a screening tool that captures anthropometry (BMI, MUAC), weight loss history, social factors, mobility andpsychosocial and dietary characteristics to generate a
malnutrition risk score.Receiving medications
Que
ntin
Bru
no, L
eban
on, 2
015

. . . . . . . . . . . . . . . . . . . . . . . . . . . . . . . . . . . . . . . . . . . . . . . . . . . . . . . . . . . . . . . . . . . . . . . . . . . . . . . . . . . . . . . . . . . . . . . . . . . . . . . . . . . . . . . . . . . . . . . . . . . . . . . . . . . . . . .
. . . . . . . . . . . . . . . . . . . . . . . . . . . . . . . . . . . . . . . . . . . . . . . . . . . . . . . . . . . . . . . . . . . . . . . . . . . . . . . . . . . . . . . . . . . . . . . . . . . . . . . . . . . . . . . . . . . . . . . . . . . . . . . . . . . . . . .
71
Field Article
A specific session on nutritional needs ofolder people was also conducted in the training.e topics tackled included nutritional assessmentat old age, malnutrition at old age and associatedrisk factors, symptoms and diseases related tomalnutrition at old age, food pyramid for olderpeople, nutritional needs at old age and sometips about nutritional rehabilitation and com-munity support programmes.
OutcomesInclusion of older peopleis project has proactively supported the un-derstanding and capacity of humanitarian actorsto implement older person and disability inclusivehumanitarian programming. Older people needswere highlighted on many occasions among hu-manitarian actors, governmental bodies, UnitedNations (UN) agencies, international non-gov-ernmental organisations (INGOs) and localNGOs.
EnrolmentAn average of 300 new patients is enrolled everymonth in the project and 350 patients arefollowed up every month for the managementof their HTN or DM. A total of 2,447 adultsaged 40 and above were screened for HTN andDM within a period of seven months, 67% ofwhom were females and 33% males (see Figures1 and 2). From November until the end of May2015, 1,825 patients were enrolled in the pro-gramme; 66% were Syrian refugees and 34%vulnerable Lebanese. HTN accounted for 46%of the cases, DM accounted for 27% of the casesand the remaining 27% were affected by bothdiseases.
Source: AMEL monthly reportsIn accordance with the disease managementschedule, patients receive a medical follow upvisit every six months. Between November 2014and May 2015, 22% of the recruited patientshave had two visits, 10% three medical visitsand a small number of uncontrolled cases hadadditional medical follow up. More than 90awareness sessions about HTN and DM wereconducted from December 2014 to May 2015promoting healthy lifestyle and compliance tothe medical treatment. However, only a few pa-tients reported weight reduction and initiation
of physical activity following the awareness ses-sions. Furthermore, both staff and patients hadmany concerns about the recommended dietsince most beneficiaries consumed large amountsof bread (high in salt) and sugar; the main issuewas that both the Syrian refugee and vulnerablehost community consumed the cheapest typeof food rather than the most nutritious ordiverse. Diet diversity seemed associated withregion, type of shelter and economic situation.Syrian refugees staying at the informal tentedsettlements in the Bekaa Valley reported highconsumption of potato, rice, sugar and tea.ose residing in rented houses in West Bekaawere more likely to eat meat and cereals. Veg-etables, fruits and fish were reported to be highcost hence not affordable even for the host com-munities. ere was no communication betweenthe NCD programme and the WFP voucherscheme.
Exit interviews conducted among 59 benefi-ciaries during the month of March showed anoverall high patient satisfaction with the pro-gramme, especially the opportunity to obtainmedications for free, for being given the chanceto identify disease through screening, and to beable to access lab tests free of charge. Focusgroup discussions with the health facilities per-sonnel revealed the overall appreciation of thestaff for the project, especially in that it providedthe underserved population with a diseasescreening opportunity and management.
Information about the project was spread inthe catchment areas of the involved health fa-cilities including informal tented settlementsthrough flyers and direct contact with key peoplesuch as “shawish”, “moukhtar” and municipalities.
Strengths of the programme e HelpAge project addressed two main prob-lems: lack of access to NCD services and lack ofproper management of NCDs. In Syria, refugeeswere used to benefiting from free health servicesand regular free drug supply for their NCDs. InLebanon, only poor people and older adultsbenefit from free drugs for NCDs, and only inselected facilities supported by the YMCA.Within the response to the Syria crisis, the In-strument for Stability Project funded by the Eu-
ropean Union enabled distribution of chronicmedication to 150,000 patients in 435 primaryhealth facilities; however, shortage in chronicmedication was still noted.30
e HelpAge project allowed more vulnerableolder adults to benefit from free services. eprogramme was tailored according to the needsof the target population; for example bloodsampling was done on site since transportationis problematic (in terms of security, availabilityand affordability). High levels of satisfactionand a sense of ownership was reported by AMELstaff who appreciated the positive work dynamicsamong all members and the efforts to make thebest out of delivering the service.
e programme was very effective from apartnership perspective. It embraced five partnersthat interacted and cooperate to attain the projectobjectives. From the early stage of the projectdesign, all partners were consulted on how todesign the intervention in a way that ensurecomplementarity, quality and sustainability ofservices; each partner brought its expertise andspeciality into the project and efforts were gearedto support and complement each other. Fur-thermore the training on older adults’ specificneeds and vulnerabilities is a pioneer initiativeacknowledged by all participants.
For the Lebanese population, the governmentprovides medication for chronic conditions butonly within the MOPH network that includesalmost one-quarter of the primary health carefacilities31. For the Syrian population, there is aproject that enables them to access such med-ications in the MOPH network when certainconditions are met. HelpAge is planning to con-tinue this programme for the next 30 monthswhile building the capacity of AMEL centres tojoin the MOPH network to ensure access to pa-tients and sustainability of services.
Challengese major constraint has been insecurity. einitial design of the project included an AMEL
Distribution by age category of adults screened in eighthealth facilities from November 2014 to May 2015Figure 1
70%
60%
50%
40%
30%
20%
10%
0%Patients At risk Healthy
63%
14%
23%
Distribution of the screened population by healthstatus Figure 2
40%
35%
30%
25%
20%
15%
10%
5%
0%40y 40-50y 50-60y 60-70y 70-80y+
1.10%
34.5% 34.9%
20.6%
8.9%
30 Reducing conflict by improving healthcare services to vulnerable Lebanese and Syrian Refugees.Lebanon Update.3 July 2015.
31 National Health Statistics Report in Lebanon, 2012 edition

72
Field Article. . . . . . . . . . . . . . . . . . . . . . . . . . . . . . . . . . . . . . . . . . . . . . . . . . . . . . . . . . . . . . . . . . . . . . . . . . . . . . . . . . . . . . . . . . . . . . . . . . . . . . . . . . . . . . . . . . . . . . . . . . . . . . . . . . . . . . .
. . . . . . . . . . . . . . . . . . . . . . . . . . . . . . . . . . . . . . . . . . . . . . . . . . . . . . . . . . . . . . . . . . . . . . . . . . . . . . . . . . . . . . . . . . . . . . . . . . . . . . . . . . . . . . . . . . . . . . . . . . . . . . . . . . . . . . .
health facility in Ersal. However, followingsecurity incidents occurring in the early phaseof the project, generating temporary suspensionof humanitarian operations, the decision wasmade to provide in kind support (equipmentand medication) rather than implementing thefull package of services. e kidnapping ofLebanese soldiers in North Bekaa in September2014 resulted in road blockades for 17 days andan overall period of no security clearance for 6-7 weeks, which delayed the health facilities as-sessment and the refresher training on WHOguidelines. Other security events affected themobility of the refugees, i.e. the one day mobil-isation campaign in Mashghara coincided witha military incident, leading to checkpoints beingspread all over the region, preventing even thehost community from going out. Consequentlydespite a well disseminated message about thecampaign and thorough organisation of theevent, the number of beneficiaries was relativelylow and only three Syrian refugees were able toattend. Furthermore, the fluid movement of therefugee population according to the level of se-curity made it difficult to assess accurately andmeet the needs of this population, e.g. followingrefugee influxes, there might be greater demandfor medications than planned.
It was important and challenging to alignthe approaches, have clear communication chan-nels and consensus on roles and responsibilitiesof the five agencies involved in the programme.
Resistance to changes in practice was evidentamongst some service delivery staff so a key el-ement was to highlight the importance of theproject and to trigger a sense of ownershipthrough active involvement in the project ac-tivities. At the same time, close monitoring wascritical to allow intervention as necessary.
From a beneficiary perspective, the mainobstacle to visiting a health facility is trans-
portation; transportation fees may add up to15,000LBP (=10US$) which is considered ex-pensive by both Syrian refugees and vulnerablehost communities. Consequently, the servicesprovided by the mobile units are considered “asa gi from heavens”. Waiting time at the healthfacility is another problem for beneficiaries, es-pecially for the frail and older patients. Waitingtimes become a major obstacle at mobile unitsduring harsh weather conditions as it is difficultfor the patients to stand outside in cold or ex-cessively hot weather waiting to be screened ormanaged. Opening hours of the centres is anotherissue, with most closing at 2 pm, making itdifficult for people among the local host com-munities and a small number of refugees, whowork during the day. is might explain thehigh percentage of women attendees comparedto men.Shortage of medication is a major concernfor patients who may not get all prescribedmedication on the same visit. is relates to thehigh consumption of drugs associated with theincreased number of beneficiaries. A contingencystock was established at AMEL headquarter toaddress this issue but delayed reporting of needand insufficient means of transportation createddelay in the delivery of medication.
Health care providers state that the length oftime it takes to perform all the required tasks asper the guidelines and the increased workload,make services provision difficult and challenging.e screening process is viewed by the healthstaff as successful but highly stressful becauseof the high volume of patients and the require-ment of a 10 – 15 minutes consultation to collectdata and indicators as per WHO guidelines.e consequences are longer waiting times forother patients to be screened and more congestionin the centres.
e increased workload is affected by a num-ber of determinants such as 1) the security sit-uation,e.g. when Syrian refugees fled from North
to West Bekaa following military actions, theinflux of patients necessitated the recruitmentof additional staff to cover the additional work,2) the shortfall in international humanitarianresponse funding resulted in closure of services;in February 2015, International Organisationfor Migration (IOM) had to shut down servicesin two clinics in the Bekaa area resulting in aninflux of patients to AMEL centre in Kamed ElLoz; 3) the deteriorating economic situation forboth Syrian refugees and host communities re-sulting in an increase in the number of vulnerablepeople requiring health services.
Key lessons learnedEssential basic equipment for the managementof DM and HTN at primary health care levelcan be modest and affordable, however the ca-pacity of the health staff and their skills in themanagement of HTN and DM are critical forthe proper management of the diseases. Educa-tional background, training and capacity buildingof staff are essential elements for the success ofsimilar projects.
Flexibility in the implementation of guidelinesand tailoring of activities as per resources andneeds of the beneficiaries is vital; the guidelinesneed to be adapted to the context and notadopted as they are. For example, laboratorytests implemented in the primary health carecentres could not be implemented at the mobileclinics because of transportation constraints.
Resistance to change, especially among olderexperienced staff, might be problematic and itis challenging to trigger the interest of suchstaff and generate a sense of commitment to theproject.
Time is a key factor; in an emergency contextespecially, there may be major delays in activitiesdue to insecure situations. Contingency planningis important in such contexts.
e success of partnership requires soundcoordination and a number of key elements suchas involvement of all partners in all stages of theproject development and implementation, to en-sure that decisions and activities receive wide-spread support and recognition; clear commu-nication of responsibilities and perceived rolesto avoid misunderstandings, frustration and lossof commitment; and sharing of information con-tinuously and in a timely manner. Trust takestime to build between partners but it is the basisof a strong and sustainable partnership.
ConclusionsNCDs management should be seen as a funda-mental pillar of the long-term policy responseto the crisis in Syria. e HelpAge health projectis a successful example of a comprehensive pack-age of services and collaboration among differentpartners. Similar projects should be encouragedand scaled up to meet the increasing healthneeds of Syrian refugee and host communities.
For more information, contact: MaguyGhanem, email: [email protected]
Measuring waist circumference withinscreening process at Kamed el Loz Centre
Que
ntin
Bru
no, L
eban
on, 2
015

. . . . . . . . . . . . . . . . . . . . . . . . . . . . . . . . . . . . . . . . . . . . . . . . . . . . . . . . . . . . . . .
. . . . . . . . . . . . . . . . . . . . . . . . . . . . . . . . . . . . . . . . . . . . . . . . . . . . . . . . . . .
73
By Alina Michalska, Eva Leidman, Suzanne Fuhrman,Louise Mwirigi, Oleg Bilukha, and Cecile Basquin
Alina Michalska is the SMART Programme Manager atAction Contre la Faim (ACF)-Canada. She develops andsupports the SMART Methodology, a global metric ofassessment of malnutrition, assuring compliance to globalstandards including accuracy and reliability of data. Alinaalso conducts trainings worldwide and provides support toregional and national implementation of the methodology.
Nutrition surveillance inemergency contexts:South Sudan case study
Transport in Fashoda
ACF,
Sout
h Su
dan,
201
5
Eva Leidman is an Epidemiologist with the EmergencyResponse and Recovery Branch of the Centers for DiseaseControl and Prevention. Her experience includesinternational nutrition and assessment methodologies(including surveys and surveillance) affecting refugeesand displaced populations worldwide.
Suzanne Fuhrman is the Health and Nutrition Head ofDepartment with ACF in Sierra Leone. She was theCoordinator for the ACF Surveillance and EvaluationTeam (SET) project in South Sudan. She has five years ofexperience in the field of nutrition, previously workingfor Concern Worldwide in Ethiopia, Uganda, and SouthSudan, with a strong background in surveys.
Louse Mwirigi-Masese is currently the NutritionInformation Officer with UNICEF Kenya where she supportsthe national nutrition information systems in collaborationwith the MoH and also provides surge support in the EastAfrica region, including South Sudan (2014) and Malawi(2015). Prior to this, Louise was a Nutrition Analyst withthe FAO/ FSNAU for six years in Somalia.
Oleg Bilukha is Associate Director of Science with theEmergency Response and Recovery Branch of the Centersfor Disease Control and Prevention where Oleg hasworked since 2000. He obtained his MD from Lviv StateMedical Institute, Ukraine, and his PhD in Nutrition (withminors in Epidemiology and Consumer Economics) fromCornell University, USA. Oleg has served as a consultant
and temporary advisor to the WHO, UNHCR, WFP, and UNICEF on multipleassignments worldwide. His extensive experience includes internationalnutrition, statistics, epidemiology, surveys and surveillance, war-related injuryand reproductive health.
Cécile Basquin is a Nutrition & Health Technical Advisor atACF-USA headquarters. Cécile joined ACF in early 2010,has managed CMAM, integrated surveillance andcommunity-based prevention of undernutritionprogrammes in the field, and now provides technicalguidance notably to the ACF-South Sudan team.
We thank all of our colleagues involved in collecting the datapresented here for their ongoing commitments to collecting rigorousdata. In particular we thank the ACF logistics team members fortheir valuable support and creative thinking, notably with trans-portation of teams to remote locations during the surveys. We thankthe South Sudan Ministry of Health (MoH), particularly Victoria Eluzai,previous Director of Department of Nutrition, and the county officialsand county health department teams of Fashoda, Mayendit andLeer counties. For all their support in driving the surveillance agendain South Sudan, we thank the UNICEF team and members of boththe Nutrition Cluster and the Nutrition Information Working Group,particularly co-chair Ismail Kassim (Nutrition Information Manager,UNICEF South Sudan). We thank several key partners who supportedACF teams in the field (World Vision International, MSF, UNIDO,Samaritan's Purse, and The Comboni Missionaries), and the communitiesof South Sudan for their cooperation. We also thank Victoria Sauveplane(Senior Programme Manager, ACF-Canada) and Maureen Gallagher(Senior Nutrition and Health Technical Advisor, ACF-USA) for reviewingthe article. We thank Grainne M. Moloney (Kenya Nutrition Chief,UNICEF) who initiated the nutrition surveillance initiative in SouthSudan and provided input and reviewed this article.
This programme was undertaken with the financial assistance ofUNICEF. The findings and conclusions in this article are those of theauthors and do not necessarily represent the official position of theCenters for Disease Control and Prevention (CDC), Action AgainstHunger | Action Contre la Faim (ACF), or the United Nations Children'sFund (UNICEF).
Location: South SudanWhat we know: Reliable nutrition data are critical toassess and respond to a crisis but are often lacking dueto resource and population access constraints;monitoring change over time is particularlychallenging.
What this article adds: Nutrition surveillance activitieswere launched in South Sudan mid-2014 due to adeteriorating crisis situation. In ten of the most foodinsecure counties, ACF launched the Surveillance andEvaluation Team (SET), funded by UNICEF and withtechnical support from CDC, to monitor the nutritionstatus, provide the foundations of a nutritionmonitoring system, and provide technical support tonutrition partners. Rapid SMART was the surveymethod used. In practice, surveys (eight in total) werelimited to three (high priority) of the 10 counties dueto lack of implementing partners. High qualityanthropometric data were gathered. Challengesincluded accurate population data, access and logistics,and lack of in-agency survey technical capacity. Thisexperience reflects one feasible option of obtainingperiodic, representative prevalence data in aparticularly challenging setting.
Why nutrition surveillance in emergencies?Reliable data are critical, to assess the severity of a crisis andrespond appropriately. In crises affecting the food security of apopulation, nutrition indicators inform decisions on types of in-terventions, geographic prioritisation, and levels of funding1.Unfortunately, recent experiences have demonstrated that rigorousand representative nutrition data and robust nutrition surveillance
1 Bilukha O, Prudhon C, Moloney G, Hailey P, Doledec D (2012). Measuring anthrop- ometric indicators through nutrition surveillance in humanitarian settings: Options, issues and ways forward. Food and Nutrition Bulletin, vol. 33, no.2, pp169-176.
Field Article

. . . . . . . . . . . . . . . . . . . . . . . . . . . . . . . . . . . . . . . . . . . . . . . . . . . . . . . . . . . . . . . . . . . . . . . . . . . . . . . . . . . . . . . . . . . . . . . . . . . . . . . . . . . . . . . . . . . . . . . . . . . . . . . . . . . . . . .
74
. . . . . . . . . . . . . . . . . . . . . . . . . . . . . . . . . . . . . . . . . . . . . . . . . . . . . . . . . . . . . . . . . . . . . . . . . . . . . . . . . . . . . . . . . . . . . . . . . . . . . . . . . . . . . . . . . . . . . . . . . . . . . . . . . . . . . . .
systems are oen lacking in humanitarian criseswith few exceptions, e.g. nutrition surveillanceimplemented by the Food Security and NutritionAnalysis Unit (FSNAU) in Somalia2,3,4, is isparticularly true in the most severe crises whenoverwhelming needs restrict available resourcesand limited access constrains the ability to collectdata. is challenging paradox – the need fordata when they are least available – is commonin sudden onset disasters, as well as duringsevere deterioration of a protracted crisis.
Continuous monitoring of nutrition statusover time, oen required in a crisis, poses evengreater challenges compared to individual as-sessments. is type of analysis requires ongoing,systematic collection of data, i.e. surveillance5.Practitioners use many methods of data collectionto help monitor changes in the nutritional statusof a population and, where possible, respond ina timely manner. ere are at least five recognizedapproaches to nutrition surveillance6. Nearly allof these methods, however, have key limitations.For instance, health facility-based surveillancesystems only include individuals who visit healthcentres; they are oen not representative, po-tentially over-sampling younger children (whocome for immunisations) and those who aresick. Mass screenings include all children,
however do not produce ongoing data, and thequality of anthropometry data obtained frommass screenings can be difficult to control. In-terpreting data from therapeutic feeding pro-grammes can be challenging, as changes in nu-tritional status may be attributed to many factorsincluding stock-outs of commodities or changesin access7,8. In emergency contexts, using thesemethods can be even more challenging andcostly than in non-emergency settings givenaccess constraints and other factors that maydisrupt existing systems.
Currently there is no gold standard for mon-itoring trends in prevalence of acute malnutrition.However, these data are essential in crisis settings.ey are used by responders and more broadlyto inform analyses, such as the Integrated PhaseClassification (IPC) for Acute Food Securityused to declare famine9. We present an exampleof South Sudan to illustrate one feasible optionof obtaining periodic, representative prevalencedata in a particularly challenging setting.
Case of South Sudanemergency, 2014Since independence in July 2011, South Sudanhas suffered ongoing internal conflict. However,violence escalated in mid-December 2013 and
as a consequence, the humanitarian situationmarkedly deteriorated10. An estimated 740,000persons were displaced and heavy fighting wasreported in the capital, Juba, as well as in thegreater Upper Nile region11. In February 2014,the United Nations Emergency Relief Coordinatordeclared South Sudan in a Level 3 (L3) emergency,the highest level on the scale12.
e challenges of this context cannot beoverstated. During this period, there was massdisplacement of people who oen were displacedrepeatedly as the conflict moved. ere waslimited capacity in country to respond, partic-ularly as staff were sheltered or evacuated withescalating conflict. ese challenges exacerbatedthe vulnerability of a newly formed state withlimited infrastructure and few formal institutionsto provide assistance to the population. As theconflict persisted, people lost livelihoods, incomesand assets. Access to food was threatened, aswas access to functional health centres and otherbasic services. Beginning in May 2014, the rainyseason began limiting both access to these pop-ulations and food availability.
In May 2014, the IPC analysis projected that3.9 million people (34% of the total population)would be in crisis (IPC Phase 3) or facing emer-gency (IPC Phase 4) acute food insecurity levelsfrom June through August 201413. Jonglei, Unityand Upper Nile States were the three most con-flict-affected areas and accounted for about 56%of the total population classified as food insecureat IPC Phase 3 or 4 levels. Based on the experiencefrom the FSNAU and the monitoring of thefamine in two regions of Somalia during 2011drought crisis in the Horn of Africa, NutritionTechnical Experts who contributed to that IPCanalysis (including representatives from ACF,UNICEF, and the United States Centers for Dis-ease Control and Prevention [CDC]) highlightedthat there was a dire need for data to describeand track the evolving nutrition situation andto inform the acute food security IPC analysis.At this time, fears of a deterioration of the foodsecurity situation and potentially a famine (IPCPhase 5) in certain locations mounted as thelean season approached in July/August.
Within this context, nutrition surveillanceactivities were launched. Nutrition Cluster part-ners in South Sudan jointly developed a list often priority counties in Jonglei, Unity and UpperNile States (from the 28 counties most affectedby the conflict). Counties with no recent nutritionassessment were included and prioritised based
Field Article
2 For more information, see the FSNAU web site: http://www.fsnau.org/
3 Salama, P. et al (2012). Famine in Somalia: Evidence for a declaration. Global Food Security (2012), http://dx.doi.org/ 10.1016/j.gfs.2012.08.002
4 Note that ACF also has an ongoing approach in the Democratic Republic of Congo that allows identification of nutrition crises, and ACF led integrated surveillance systems notably in certain parts of Kenya and Uganda with high recurrent levels of malnutrition.
5 National Institute for Occupational Safety and Health (NIOSH) 2012, Surveillance. Available from: http://www.cdc.gov/niosh/programs/surv/
6 There are five major methodological approaches to nutrition surveillance design: repeated surveys, community-
based sentinel sites, periodic exhaustive screenings, admission data from feeding programmes for moderately and severely malnourished children, and anthropometric data from health clinics (Bilukha, et al, 2012).
7 Nnyepi M, Kesitegile SM Gobotswang, Codjia P, 2011. Comparison of estimates of malnutrition in children aged 0-5 years between clinic-based nutrition surveillance and national surveys. Journal of Public Health Policy, vol. 32, no. 3, pp 281-292.
8 Grellety E, Luquero F, Mambula C, Adamu H, Elder G, Porten K, 2013. Observational Bias during Nutrition Surveillance: Results ofa Mixed Longitudinal and Cross-Sectional Data Collection Systemin Northern Nigeria. PLoS ONE, vol. 8, no. 5, pp 1-11.
9 Integrated Food Security Phase Classification (IPC) 2012. IPC and Famine. Available from: http://www.ipcinfo.org/ipcinfo-
detail-forms/ipcinfo-resource-detail0/en/c/178965/10 UNICEF 2014, South Sudan Situation Report, 11 February
2014. Available from: http://www.unicef.org/appeals/files/ UNICEF_South_Sudan_SitRep9_11FEB2014.pdf
11 OCHA 2014, South Sudan Crisis: Humanitarian Snapshot as of 31 January 2014. Available from: http://reliefweb.int/ report/south-sudan/south-sudan-crisis-humanitarian-snapshot-31-january-2014
12 UNICEF 2014, South Sudan Situation Report, 11 February 2014. Available from: http://www.unicef.org/appeals/ files/UNICEF_South_Sudan_SitRep9_11FEB2014.pdf
13 Integrated Food Security Phase Classification (IPC) 2014. Current Acute Food Insecurity Overview in South Sudan May 2014. Available from: http://www.ipcinfo.org/ipcinfo-detail-forms/ipcinfo-map-detail/en/c/234337/
Transport in Fashoda
ACF,
Sout
h Su
dan,
201
5

. . . . . . . . . . . . . . . . . . . . . . . . . . . . . . . . . . . . . . . . . . . . . . . . . . . . . . . . . . . . . . . . . . . . . . . . . . . . . . . . . . . . . . . . . . . . . . . . . . . . . . . . . . . . . . . . . . . . . . . . . . . . . . . . . . . . . . .
75
. . . . . . . . . . . . . . . . . . . . . . . . . . . . . . . . . . . . . . . . . . . . . . . . . . . . . . . . . . . . . . . . . . . . . . . . . . . . . . . . . . . . . . . . . . . . . . . . . . . . . . . . . . . . . . . . . . . . . . . . . . . . . . . . . . . . . . .
on levels of insecurity, road access and flooding14.To gather information in these priority counties,ACF launched the Surveillance and EvaluationTeam (SET), funded by UNICEF and with tech-nical support from CDC. e overall goal ofthis project was to monitor the nutrition statusin the most food insecure areas to inform thenational response, while setting up the founda-tions of a stronger and broader nutrition moni-toring system country-wide. A secondary ob-jective was to provide technical support, led byACF, to all nutrition partners in country toensure all data collection efforts produced highquality results.
To achieve the first goal, SET established anutrition surveillance system in South Sudanthrough repeated rounds of Rapid StandardisedMonitoring and Assessment of Relief and Tran-sition (SMART) surveys15.
What is Rapid SMART and howwas it used in SET surveillancein South Sudan? South Sudan Nutrition Cluster survey recom-mendations were amended to allow for a morestreamlined questionnaire and sampling strategyto be used in South Sudan per Rapid SMARTguidelines. Rapid SMART is essentially a “normal”SMART survey following all the provisions ofSMART guidelines with two key caveats:1. To minimise time required to collect data
in the field (to adapt to extremely insecure or difficult to access settings and to focus on the quality of the key indicators – anthropometric measurements), the questionnaireis substantially shortened to include only anthropometry measurements (including both weight for height and mid-upper arm circumference [MUAC]) and a few addi-tional indicators, e.g. child morbidity. All the other sectoral modules of indicators (water, sanitation and hygiene [WASH], foodsecurity, infant and young child feeding[IYCF], etc.) are excluded.
2. To simplify sample size determination and minimise sample size requirements (to decrease time spent in the field while still achieving minimum precision for meaningfulinterpretation of results), Rapid SMART calls for a two-stage cluster design (25 clusterswith 8-12 households per cluster, dependingon percentage of children aged under-5 years in the population). is design pro-duces a sample of 250 or more children agedunder-5 years, which is sufficient in almost all situations (except where prevalence or design effect are very high) to achieve pre-cision of +/-5% or less around the global acute malnutrition (GAM) estimate. When the mortality indicator is added to the survey,the sample size is increased to 30 clusters and about 420 households to achieve mean-ingful precision for mortality. In this par-ticular case of South Sudan, mortality re-sults were absolutely critical to assess the severity of the crisis and to inform the much-needed IPC analysis, since mortality is a required indicator for famine declaration.
Again, the indicators (a very limited numberwith few additional variables) and the “fixed”minimised sample size are the only key featuresthat differentiate Rapid SMART from the tradi-tional SMART methodology16.
ACF SET implemented repeated rounds ofRapid SMART surveys in three high prioritycounties: Leer County, Mayendit County (inUnity State) and Fashoda County (in UpperNile State), which were outside of ACF operationalareas17. For the purpose of monitoring nutritionaltrends in these high risk counties, three roundsof surveys were planned: round 1 to inform thesituation immediately (June, pre-harvest or leanseason), and rounds 2 and 3 to take placethroughout the rainy, harvest and post-harvestseasons at 2-month intervals. is relativelyhigh frequency of survey rounds was based onthe key lesson learned from the Somalia famine,i.e. the vulnerability of populations in criticalsituations can deteriorate extraordinarily quickly18.
Recognising early on that technical capacityin South Sudan would be a limiting factor, theSET included a secondary objective with twocomponents to complement data collection andto contribute to strengthening of the SouthSudan Nutrition Information Working Group(NIWG), a technical sub-group of the SouthSudan Nutrition Cluster:1) Capacity Building – ACF worked with the
NIWG to help build capacity of all imple-menting partners in the SMART methodol-ogy to enable them to design and implementnutrition surveys.
2) Validation process – CDC worked with the NIWG to establish a process of data review
(validation) to ensure partners in country had the skills to review and validate survey protocols critically and review and approve the quality of collected data before results were released.
Initial plans called for identifying partners toimplement the nutrition surveillance system(Rapid SMART surveys) in all 10 priority counties.However, no additional partners could be iden-tified. Partners reported that their ability to un-dertake the surveys outside their usual areas ofoperation was limited due to lack of funding,technical capacity, and concerns about insecurityand access. Assessments in the other seven prioritycounties were therefore never implemented.
What results were obtained bySET?Execution of surveysA total of eight surveys were completed as partof the SET project over six months: three inLeer, three in Mayendit, and two in Fashoda.Data collection in Fashoda was interruptedduring the second round (in October) aer oneday due to a security incident, resulting in evac-uation of the team from the field. e samplesizes obtained for each survey are presented inTable 1. In all eight surveys, assessment teamssuccessfully measured at least 350 children 6-59 months of age, well above the 250 minimumrequired. In most surveys, nearly twice thatnumber of children was surveyed, likely due tolack of up-to-date demographic data and alsoto increases in household size related to recentlarge population movements due to insecurityand flooding. ese sample sizes allowed for a
Field Article
14 The 10 counties that are high priority change semi-regularly as response progresses. South Sudan Nutrition Cluster 2014, South Sudan Updated Nutrition Cluster Response Plan – August 2014. Available from: https://www.humanitarian response.info/en/operations/south-sudan/document/ssudan- updated-nutrition-cluster-response-plan-final-draft-1-sep
15 SMART Methodology 2014, Rapid SMART Guidelines. Availablefrom: http://smartmethodology.org/survey-planning-tools/ smart-methodology/rapid-smart-methodology/
16 SMART Methodology 2006, SMART Methodology Manual.
Available from: http://smartmethodology.org/survey-planning-tools/smart-methodology/
17 ACF chose these three countries out of the list of 10 priority counties for feasibility reasons, after careful assessment of security, access, road network, and availability of transport- ation means, among other parameters set by the ACF logistics staff.
18 Hillbruner,C.,Moloney,G.. When early warning is not enough –Lessons learned from the 2011 Somalia Famine. GlobalFood-Security (2012), http://dx.doi.org/10.1016/j.gfs. 2012.08.001
Improvised boat for an enumerator
ACF,
Sout
h Su
dan,
201
5

. . . . . . . . . . . . . . . . . . . . . . . . . . . . . . . . . . . . . . . . . . . . . . . . . . . . . . . . . . . . . . . . . . . . . . . . . . . . . . . . . . . . . . . . . . . . . . . . . . . . . . . . . . . . . . . . . . . . . . . . . . . . . . . . . . . . . . .
76
. . . . . . . . . . . . . . . . . . . . . . . . . . . . . . . . . . . . . . . . . . . . . . . . . . . . . . . . . . . . . . . . . . . . . . . . . . . . . . . . . . . . . . . . . . . . . . . . . . . . . . . . . . . . . . . . . . . . . . . . . . . . . . . . . . . . . . .
precision of between ±3.1% (Mayendit Round2) and ±6.3% (Leer, Round 1), in all cases ac-ceptable precision to interpret the results (Table2). e design effect for all surveys was relativelylow19 indicating that the population in a givencounty was fairly homogeneous with regard toacute malnutrition.
In all three settings, point estimates for preva-lence of GAM remained in serious (10%-14%)or critical (>15%) categories throughout the as-sessment period (GAM in Leer in June was>30%, Table 3). It was observed in all countiessurveyed that the prevalence of GAM declinedthroughout the year (Table 3). e most notable(and statistically significant) decline was in Leer,where prevalence of GAM declined from 34.1%(95% CI 28.0-40.6) at the end of June to 16.2%(95% CI 12.5-20.9) in September to 11.0% (95%CI 7.7-15.6) at the end of November. e markedreduction in GAM between the first and secondrounds in Leer could be attributed to severalfactors including: i) seasonality, as people beganto harvest in September; ii) increased availablyof food in the markets, as major roads openeddue to improved security; iii) food aid air drops;and iv) introduction of health, nutrition, WASH,and food security interventions by severalpartners in the area. Mortality was assessedonce in each of the three counties. Crude DeathRate (CDR) ranged from 0.8/10,000/day (inLeer) to 1.2/10,000/day (in Mayendit), signifi-cantly below the emergency threshold,2/10,000/day (Table 3).
Assessment methods were designed suchthat one team could complete two clusters perday. However, security and logistics (lack ofroad access to clusters by car) made this overallinfeasible, and data collection required an averageof 6.1 days of field work per survey (range 5 to 9days, Table 2). e technical team at ACF sup-porting the SET surveys consisted of six SMARTsurvey specialists and one SMART capacitybuilding specialist (all international staff), aswell as a logistician. Training of enumeratorswas undertaken over the course of 1-2 days.Field work was completed by between eight and18 enumerators per survey working in teams of
two to three enumerators (Table 2), each led byone SMART specialist. e SET had between 1to 3 weeks between each round to finish thesurvey report, rest and prepare for the nextsurvey. Preliminary results were shared withlocal authorities and partners the day aer datacollection at field level.
In terms of data quality, despite the majorlogistic and security challenges, the assessmentswere rigorous. Two key parameters used toassess nutrition survey data are the percent ofextreme outliers (biologically implausible values)and standard deviation of z-scores20. Across allsurveys, less than 3.0% of children were excludedas extreme outliers applying the SMART rec-ommended thresholds, <-3 or > 3 z-scores fromthe surveyed population21. In five of the eightsurveys, there were no outliers. Standard deviationof the weight-for-height z-scores (WHZ) is ex-pected to be close to 1.0. Classified using theSMART thresholds, seven of the surveys hadan excellent standard deviation (0.89-1.00), andone survey (Leer County, Round 1) had an ac-ceptable standard deviation (1.15)22. Togetherthese tests indicate that the quality of anthro-pometric measurement was high.
e sex ratio and age distribution (not pre-sented) were analysed to assess whether the se-lected sample was representative of the generalpopulation. For all 8 surveys, age and sex dis-tributions were as expected, indicating no se-lection bias. e overall composite SMARTplausibility check quality score, which also takesinto account several additional tests, indicatedhigh quality data in all completed surveys23.
Use of the Rapid SMART method enabledSET to use the standard SMART soware24 toassess the data quality and produce a preliminaryreport, a key advantage over other rapid methods.is enabled timely dissemination of results. Forall rounds, a summary of key results was sharedwith the NIWG of the Nutrition Cluster, whichreviews surveys in South Sudan, within 1 or 2days of completing data collection; survey reportsand datasets were shared within seven days.
Building SMART methodology capacitiesand strengthening survey validationprocessAs part of the SET, to build the capacity of part-ners in country including the Ministry of Health(MoH), one ACF SMART methodology expertwas dedicated on a full-time basis to support allpartners organizing nutrition surveys in theirprogramme areas. is was prompted by a learn-ing needs assessment, which demonstrated thatthe majority of agencies that had previous ex-perience conducting surveys (11 of 15 agencies)used external human resources to carry outsurveys. In most cases, external consultantswere hired, which is both costly and introducesdelays as the process of bidding and negotiatingwith consultants can oen take weeks or months.Of the individuals who had received trainingon managing surveys, most reported that theywere trained several years ago or that they wereno longer in a position where carrying outsurveys is their main work task. Among thisgroup, many reported they did not have recentenough experience to feel confident in supervisinga survey or critically reviewing surveys presentedby their consultants or to the NIWG. Based onthe results of the assessment, ACF organisedand facilitated several SMART methodologytrainings and subsequently trained 19 surveymanagers, enabling them to design surveys andcritically review data quality25. An additional35 field supervisors were trained to be able toensure rigor in the selection of households andmeasurement of children.
In addition, support was provided directlyto the NIWG to enable its members to play ameaningful role in prioritising survey areas,critically reviewing survey protocols, and tech-nically assessing the validity and accuracy ofsurvey data. is validation process was developedjointly with the MoH, UNICEF, CDC, and theACF SMART expert. e process was modelledon the Kenya NIWG, which has been operatingsince 2008. Building the capacity of these partnersincluded multiple intensive, 1 to 2-day technicalinformation sessions for partners on reviewingthe plausibility of survey results and interpretingdata. NIWG members were also mentored forseveral months, during which time every survey
Field Article
19 Design effect ranged from 1.00 in Mayendit round 1 to 1.81 in Fashoda round 2.
20 WHO 1995. Physical Status: The Use and Interpretation of Anthropometry. Available from: http://www.who.int/ childgrowth/ publications/physical_status/en/
21 SMART Methodology 2006, SMART Methodology Manual. Available from: http://smartmethodology.org/survey-planning-tools/smart-methodology/
22 Acceptable range of standard deviation is 0.80-1.20. SMART Methodology Manual, 2006. Available from: http://smart- methodology.org/survey-planning-tools/smart-methodology/
23 SMART plausibility check data quality score is a composite score based on ten standardized statistical tests of data quality.
24 ENA for SMART 2015. Available from: http://smartmethod- ology.org/survey-planning-tools/smart-emergency-nutrition-assessment/
25 Of the individuals (from MoH, UN agencies, NGOs, etc.) trained as survey managers, four participated as active members of the NIWG and several additional individuals organised surveys for their NGOs within and after the SET project period. Two of the participants trained as survey managers were part of the SET.
Anthony, a SET officer, on his way to a sampled village
ACF,
Sout
h Su
dan,
201
5

. . . . . . . . . . . . . . . . . . . . . . . . . . . . . . . . . . . . . . . . . . . . . . . . . . . . . . . . . . . . . . . . . . . . . . . . . . . . . . . . . . . . . . . . . . . . . . . . . . . . . . . . . . . . . . . . . . . . . . . . . . . . . . . . . . . . . . .
. . . . . . . . . . . . . . . . . . . . . . . . . . . . . . . . . . . . . . . . . . . . . . . . . . . . . . . . . . . . . . . . . . . . . . . . . . . . . . . . . . . . . . . . . . . . . . . . . . . . . . . . . . . . . . . . . . . . . . . . . . . . . . . . . . . . . . .
77
completed in South Sudan was reviewed by theNIWG, CDC, and the ACF SMART expert who to-gether discussed its quality. is ongoing workhelped build the ability of NIWG to review thesurvey data. A secondary outcome was that datasetsand preliminary reports were quickly validated anddisseminated. is allowed for up-to-date informationto be used by the NIWG for accurate programmaticdecision making. Validated surveys were publishedon a regular basis on the South Sudan HumanitarianResponse website26. e results from the 8 roundsof the nutrition surveillance were among the highestquality of all the surveys reviewed by the NIWG to-gether with the CDC and SMART expert.
e NIWG is recognised now as the establishedcoordination body playing a key role in providingtechnical support to all partners, reviewing surveyprotocols, validating survey results, and interpretingdata utilised by the Nutrition Cluster and otherpartners for both programme planning and situationanalysis, e.g., IPC.
In view of the challenges facedand lessons learned, is thisnutrition surveillance system areplicable model? e implementation of the SET model in SouthSudan convincingly demonstrated that high qualityanthropometry data can be obtained even in themidst of an ongoing conflict using the Rapid SMARTmethod. e survey data presented here are of ex-cellent quality, as assessed by all standard parameters.e data have been validated by the NIWG incountry, as well as by technical experts at the CDCand ACF. is is an important proof of concept,and a counterpoint to those suggesting that onlyMUAC assessments are feasible in these contexts.
e model also helped minimise risk to the as-sessment teams. e streamlined approach enabledteams to spend less than 10 days collecting data forall assessments. By comparison, data collectionduring SMART surveys carried out in South Sudan
Field Article
Leer, Unity State Mayendit, Unity State Fashoda, UpperNile State±
Round 1 Round 2* Round 3 Round 1 Round 2* Round 3 Round 1* Round 3
Month of datacollection
Jun (week 4)
Sept (week 2)
Nov (week 4)
Jul (week 3)
Sept (week 3)
Dec (week 2)
Aug (week 3)
Nov(week 2)
Design (# ofcluster x HHs)
25 x 10 30 x 14 25 x 10 25 x 10 30 x 14 25 x 10 30 x 14 25 x 10
Sample size(HHs)
224 391 206 223 422 212 326 193
Sample size(Children 6-59months of age)
425 540 375 410 643 364 556 351
Sample design nutrition assessments in Leer, Mayendit and Fashodacounties of South Sudan, 2014Table 1
*Indicates survey included both anthropometry and mortality components.± Data collection in Fashoda County was stopped during the second round (in October) after one day due to a securityincident. Therefore complete data are available for only 2 (of the 3 planned) assessments in this county.HHs= households
Leer, Unity State Mayendit, Unity State Fashoda, UpperNile State±
Round 1 Round 2* Round 3 Round 1 Round 2* Round 3 Round 1* Round 3
Logistic Requirements
Number ofteams (staff)involved incollecting data
4 (8) 5 (15) 5 (15) 4 (12) 4 (12) 6 (18) 4 (12) 6 (18)
Days required fordata collection
5 7 5 8 8 4 9 6
Quality for Acute Malnutrition (weight-for-height Z-score [WHZ]) Data&
StandardDeviation
1.15 0.96 0.98 1.00 0.99 0.95 0.97 0.89
Z-score valuesout of range(SMART flags) (%)
2.6% 0.7% 0.8% 0.2% 0.5% 0.5% 1.1% 0.9%
Design EffectWHZ <-2
1.73 1.64 1.36 1.00 1.18 1.38 1.30 1.69
Precision forGAM
±6.3 ±4.2 ±3.9 ±3.8 ±3.1 ±4.3 ±3.6 ±5.0
Overallcomposite dataquality score(SMART)+
Good(16%)
Excellent(3%)
Excellent(0%)
Excellent(5%)
Excellent(0%)
Excellent(4%)
Excellent(0%)
Excellent (5%)
Data quality and logistic requirements of the nutrition assessments inFashoda, Leer and Mayendit counties of South Sudan, 2014Table 2
Leer, Unity State Mayendit, Unity State Fashoda, Upper Nile State±
Round 1 Round 2 Round 3 Round 1 Round 2 Round 3 Round 1 Round 3
Acute malnutrition, children aged 6–59 months (%) (95% CI)&
GAM (WHZ <-2 and/orbilateral pitting oedema)
34.1%(28.0-40.6)
16.2%(12.5-20.9)
11.0%(7.7 - 15.6)
16.9%(13.4-21.0)
14.1%(11.3 - 17.5)
12.7%(9.0 - 17.6)
16.0%(12.7 - 20.0)
14.1%(9.8 – 19.9)
SAM (WHZ <-3 and/orbilateral pitting oedema)
10.9%(7.8- 15.0)
2.8%(1.8-4.2)
2.2%(1.0 - 4.4)
1.2%(0.4-3.5)
2.2 %(1.1 - 4.2)
2.2%(1.1 - 4.6)
3.1%(2.0 - 4.8)
2.6 %(1.4 - 4.8)
Mortality (deaths/10,000/day)&
Crude Death Rate (CDR) — 0.81(0.46 - 1.41)
— — 1.18(0.75-1.87)
— 0.92(0.51 - 1.68)
—
Under-5 DR (U5DR) — 0.74(0.26 - 2.04)
— — 1.22(0.57-2.61)
— 1.50(0.77 - 2.89)
—
Summary of nutrition assessment results in Leer, Mayendit and Fashoda counties of South Sudan, 2014 Table 3
*Indicates survey included both anthropometry and mortality components.± Data collection in Fashoda County was stopped during the second round (in October) after one day due to a securityincident. Therefore complete data is available for only 2 (of the 3 planned) assessments in this county.&ENA for SMART software version 2011, April 21st 2015 update was used to obtain data and results presented in this article.+ SMART plausibility check data quality score is a composite score based on ten standardised statistical tests of data quality. HHs= households
Abbreviations: CI = confidence interval; GAM = Global Acute Malnutrition; SAM = Severe Acute Malnutrition; WHZ = weight-for height z-score.± Data collection in Fashoda County was stopped during the second round (in October) after one day due to a security incident. Therefore complete data is available for only 2 (of the 3 planned)assessments in this county.&ENA for SMART software version 2011, April 21st 2015 update was used to obtain data and results presented in this article.
26 Nutrition Information Working Group 2015, South Sudan SMART Survey Summary Matrix. Available from: http://www.humanitarianresponse.info/en/operations/south-sudan/document/final2701- 2015ssd-smart-survey-summary-matrix.

78
. . . . . . . . . . . . . . . . . . . . . . . . . . . . . . . . . . . . . . . . . . . . . . . . . . . . . . . . . . . . . . . . . . . . . . . . . . . . . . . . . . . . . . . . . . . . . . . . . . . . . . . . . . . . . . . . . . . . . . . . . . . . . . . . . . . . . . .
. . . . . . . . . . . . . . . . . . . . . . . . . . . . . . . . . . . . . . . . . . . . . . . . . . . . . . . . . . . . . . . . . . . . . . . . . . . . . . . . . . . . . . . . . . . . . . . . . . . . . . . . . . . . . . . . . . . . . . . . . . . . . . . . . . . . . . .
Field Articlein 2013-14 took up to 32 days (average 11.6days)27. e time required for training of enu-merators was also reduced, as the same ACFSET field supervisors assisted by locally recruitedenumerators took anthropometric measurementsin each round, so that there was no need for thestandard 5-day training and standardisation testprior to each round. For this standing team ofhighly trained individuals, enumerator trainingwas reduced to 1 or 2 days. Conversely, data col-lection was far from being rapid, even thoughfrom round 2 onwards the number of surveyteams was increased from 4 to 5 to sometimes 6teams (Table 2). is was mainly because ofaccess and terrain challenges; survey teams couldnot complete two clusters per day per team aswas originally planned.
However, in evaluating the replicability ofthe model, there are several other factors toconsider – first of which is technical capacity.e major barrier to implementing this modelwas the lack of agencies with in-house capacityfor designing surveys and reviewing data quality.As mentioned, the surveillance system was de-signed to produce estimates of prevalence ofacute malnutrition for the 10 priority countiesidentified during the May 2014 IPC assessment.e plan presumed two to three agencies wouldcollect the data that could inform national de-cision making; 10 counties exceeded the capacityof ACF SET operating alone. However, despitethe simplifications made, e.g. fixed sample size,and the external technical support (from ACF,UNICEF, and CDC), no other partners wereidentified to support this activity. Replicationof this model, or any other cross-sectional surveymodel, to obtain nutrition surveillance data de-pends on building the capacity of partners work-ing in these challenging settings.
e other major challenge was related to lo-gistics and access. e rainy season lasts inSouth Sudan anywhere from May to October,and significant flooding and poor road networksimpacted access to certain parts of the selectedcounties, especially during the first two roundsof surveys. Many roads were washed out. Teamshad to walk up to three hours each way toaccess certain villages. Time spent travelling toeach cluster was oen longer than the timespent in a village undertaking data collection.In Mayendit, the lack of road networks due toflooding meant that only the northern payamsof this county accessible from a road in thenorth in neighbouring Leer County, could bevisited by the survey teams during the first tworounds. e southern payams were accessed bya chartered flight only in the third round. InFashoda, teams reached certain clusters using achartered speed boat. However, in other areas,survey teams relied on make-shi ras thatthey constructed to facilitate their movementsbetween selected clusters. A helicopter was alsoused to move teams during round 2 in Fashodain order to increase the number of accessiblevillages. Fuel shortages further challenged datacollection. For surveys in Leer County, fuel forcars was sent to the teams by plane from Juba.Limited fuel supply was only sufficient for 1 car,
requiring all four teams to share a vehicle. Whilevarious means of transportation were used tomaximize access to villages, fighting that eruptedin Fashoda prevented the teams from completingthe second survey round in that county (October2014). Access was further restricted due to in-security resulting from the ongoing conflict.For the surveys, the SET was sometimes deployedto opposition-controlled areas. Several roundsof negotiations with local authorities were re-quired to obtain approval for undertaking surveysin these areas. Given these conditions, any othermethods of surveillance data collection wouldhave likely broken down completely. Facility-based surveillance would not be feasible; inmost of the areas visited, there were no functionalhealth centres and those that existed were unableto communicate information regularly for na-tional aggregation. Very few areas had ongoingnutrition treatment programmes, limiting theutility of their data for monitoring the situation.erefore, we suggest that while logistics andaccess were major barriers in all three countiesthat delayed the assessments and affected theircost, this model is the only one that was able tobe used to gather actionable information inthese conditions.
e SET had to address other challenges.First, accurate population data at the village levelduring an ongoing crisis were limited. e SouthSudanese population at that time was experiencingmass migration. Some clusters were significantlylarger than expected as they were hosting displacedpersons, while others had countless empty homes.In certain cases, only women and children fledvillages. However, the SET was able to work withlocal authorities to update sampling frames fornearly all villages, though this sometimes requiredseveral days of work with local leaders to ensurevillage lists and population figures were up todate28. Underestimating the target populationwhere there was uncertainty in population datahelped ensure enough children were measuredin each cluster. Second, recruitment of skilledsurvey teams was more challenging in SouthSudan than in other settings, and threatened toaffect the implementation of the SET model. Re-cruitment was cited by several agencies as a chal-lenge that precluded them from participating inthe assessments. ACF had success in recruitingyoung professionals to build the SET. ese pro-fessionals, some of whom had never been exposedto an international or emergency context, wereextremely motivated and under a strong leadershipand close technical support.
is nutrition surveillance system, thoughlimited to three counties, was successful for avariety of reasons. In the initial stages, therewas adequate planning, funding, and, importantly,collaboration with all relevant stakeholders. Inthe implementation stages, the surveillance wassuccessful due to teams working closely withlocal authorities for access to population dataand facilitation of movements, timely recruitmentof qualified staff, rigorous training of field enu-merators, and dedicated logistical support.Finally, close supervision of data collection, andcapacity building for data analysis and inter-
pretation of results were the basis for a long-term in-country survey validation system.
Limitations of these repeated rounds of RapidSMART surveys were akin to those undertakenin any emergency situation: fluctuating popula-tions (in- and out-migrations) leading to inac-curate population figures, and fluctuating accessto areas within each county. However, the SETdemonstrated that high quality, representativeanthropometric and mortality assessments arefeasible in areas with significant access and se-curity constraints. e budgets of these RapidSMART surveys were in most rounds comparableto any other SMART surveys, with survey costsranging from around USD 5,000 to USD 20,00029
(on the higher end when mortality data wereincluded). However, in two rounds, the surveycost was around USD 100,000 due to use ofcharter planes, helicopter, speed boats, and pur-chase of electronic devices for digital data col-lection. ese costs could have been avoided orminimised if stronger nutrition survey capacities(both for execution and coordination/validationof surveys) existed before the start of the conflict.It is possible that if partners were more willingand prepared to engage in surveillance, the firstround of surveys could have begun slightlyearlier prior to rainy season and costs wouldhave been reduced.
e results obtained in Leer County betweenJune and September 2014, showed how importantit is to have a surveillance system that detectsrapid changes, especially given the dynamicfluctuation one may observe with the prevalenceof GAM. e data generated by this surveillancesystem were key in providing an accurate pictureof the situation. SET survey results were largelyused in the subsequent IPC analysis, and alsoallowed humanitarian actors to get a sense ofthe impact of their interventions.
e importance of nutrition information inareas of high insecurity cannot be overempha-sised. If nutrition survey capacity issues are ad-dressed (for both execution and coordination/val-idation of surveys), the SET process describedhere could be used as a model for nutrition sur-veillance in other emergency contexts. However,in order for this type of nutrition surveillancesystem to be replicated, either inside South Sudanor elsewhere in an emergency situation, morepartners need to be capable and willing to scale-up assessments in volatile emergency areas.
For more information, contact: CécileBasquin, Nutrition & Health Technical Advi-sor, Action Against Hunger, ACF-USA, 247West 37th Street, 10th Floor New York, NY10018 USA Phone: + 1-212-967-7800 x110;email: [email protected].
27 Nutrition Information Working Group 2015, South Sudan SMART Survey Summary Matrix. Available from: http://www.humanitarianresponse.info/en/operations/south-sudan/document/final27012015ssd-smart-survey-summary-matrix.
28 Sampling frames were updated before every survey due to frequent population movements.
29 Includes survey staff (enumerators), training, data collection kit (materials) and transport costs.

79
. . . . . . . . . . . . . . . . . . . . . . . . . . . . . . . . . . . . . . . . . . . . . . . . . . . . . . . . . . . . . . . . . . . . . . . . . . . . . . . . . . . . . . . . . . . . . . . . . . . . . . . . . . . . . . . . . . . . . . . . . . . . . . . . . . . . . . .
Experiences of theSustainable Nutritionand AgriculturePromotion (SNAP)programme in the Ebolaresponse in Sierra Leone
Location: Sierra LeoneWhat we know already: Disease outbreaks have nutritional consequences for the individual affected anddepending on the disease, for the wider community.
What this article adds: An outbreak of ebola disease in West Africa in 2014 proved a public healthemergency of international concern. Existing capacity and typical programme approaches to access thoseaffected were severely challenged. The 5 year Sustainable Nutrition and Agriculture Promotion (SNAP)programme adapted to respond to the crisis in its affected rural areas of operation. Redirected food aid toquarantined patients, self-screening by MUAC of children by lead mothers, and focus of mother childgroups on essential hygiene actions were some of the adaptations. Transition to more routineprogramming is underway.
Sibida George is Team Leader,International Medical Corps/ SNAP
Georgia Beans is Chief Of Party, ACDI-VOCA/SNAP
The authors would like to acknowledge USAID/Food For Peace; Jennifer Burns,Senior Development Nutritionist, International Medical Corps; Caroline Abla,Director, Nutrition and Food Security, International Medical Corps.
Backgrounde Ebola virus disease (EVD) in West Africabroke out in Sierra Leone in May 2014. As theEVD spread, it was declared a public healthemergency of international concern by the WorldHealth Organisation (WHO) (8 August 2014).In Sierra Leone, a state of emergency (SOE)was declared on 31st July 2014 and was charac-terised by movement restrictions, closure ofschools and learning institutions, banning pe-riodic markets, public gatherings and avoidingbody contact including handshakes. Sierra Leonehas recorded 8,603 confirmed cases of EVDand 3,540 deaths including a significant numberof health care professionals.
e fear of EVD disease, coupled with therestrictions under the SOE within the countryand the timing during the peak agriculturalseason, impacted negatively on the country’seconomy, disrupting farming activities and mar-kets, particularly in rural areas. Furthermore,
the EVD devastated the health care system. Atthe Peripheral Health Units (PHUs) that provideda basic package of essential health and nutritionservices, fear of EVD infection by both healthcare professionals and community membersrendered many PHUs non-functioning duringthe peak of the crisis. e loss of a significantnumber of health care professionals contributedto a reduced confidence in the health caresystem. Traditional practices, including burialrites, were banned as a means of preventingEbola transmission.
e Sustainable Nutrition and AgriculturePromotion (SNAP) programme is a multi-yearassistance programme (MYAP) supported byUSAID and has been implemented in four dis-tricts (Kailahun, Koinadugu, Bombali and Tonko-lili) of Sierra Leone since June 2010. e goal isto reduce food insecurity and increase resilienceamong vulnerable rural populations in targetdistricts. e SNAP programme has two strategic
objectives: (i) reduce chronic malnutrition amongchildren under-fives and (ii) enhance livelihoodsfor vulnerable people, especially women andyouth. SNAP intervention areas are outlined inFigure 1 (see map).
e SNAP programme is implemented by aconsortium of three partners:• ACDI/VOCA (www.acdivoca.org) is the
primary partner engaged in agricultural livelihoods, village savings & loans associa-tions, direct distribution activities and monetization, and gender mainstreaming.
• International Medical Corps (IMC) pro-vides health, nutrition and WASH services including integrated management of acute malnutrition (IMAM); hygiene promotion at peripheral health units (PHUs) and com-munities; training and capacity building of health and nutrition service providers; and implementation of social and behavior change activities.
Handwashing in a Mother Child Group session
. . . . . . . . . . . . . . . . . . . . . . . . . . . . . . . . . . . . . . . . . . . . . . . . . . . . . . . . . . . . . . . . . . . . . . . . . . . . . . . . . . . . . . . . . . . . . . . . . . . . . . . . . . . . . . . . . . . . . . . . . . . . . . . . . . . . . . .Field Article
By Sibida George and Georgia Beans

80
. . . . . . . . . . . . . . . . . . . . . . . . . . . . . . . . . . . . . . . . . . . . . . . . . . . . . . . . . . . . . . . . . . . . . . . . . . . . . . . . . . . . . . . . . . . . . . . . . . . . . . . . . . . . . . . . . . . . . . . . . . . . . . . . . . . . . . .
. . . . . . . . . . . . . . . . . . . . . . . . . . . . . . . . . . . . . . . . . . . . . . . . . . . . . . . . . . . . . . . . . . . . . . . . . . . . . . . . . . . . . . . . . . . . . . . . . . . . . . . . . . . . . . . . . . . . . . . . . . . . . . . . . . . . . . .
Field Article• Opportunities Industrialisation Centres
International1 is engaged in youth liveli-hoods, literacy, numeracy and vocational trainings.
e Government of Sierra Leone (GoSL) Min-istries involved in SNAP include Agriculture,Forestry & Food Security; Health & Sanitation;Finance & Economic Development; Social Wel-fare, Gender & Children’s Affairs and YouthEmployment & Sports. e District Health Man-agement Team (DHMT) is the focal point forSNAP at district level.
e EVD outbreak affected rural areas wherethe SNAP programme was being implemented.is article describes the SNAP programmeprior to the outbreak, the changes that tookplace in response, and how the programme istransitioning back during recovery.
Programme approach andbeneficiary targets prior to EVDoutbreak (June 2010-May 2014)In order to reduce chronic malnutrition (stunting)among children under-five, SNAP targeted 50,064mother-child units through the ‘preventing mal-nutrition in children under two (PM2A)’ ap-proach, specifically through the mother caregroup (MCG) model. A total of 350,448 house-hold members were reached with health andnutrition messages/services in 18 chiefdoms inBombali, Koinadugu, Tonkolili and Kailahundistricts. e entry criterion for the programmeis pregnancy, with graduation when the childreaches 24 months.
e MCG sessions were animated by LeadMothers (LMs) with the SNAP programme sup-porting about 2000 LMs. Four modules wererolled out during the MCG sessions including:early initiation of, and exclusive breast feeding,appropriate complementary feeding, essentialhygiene actions, and family planning. In con-junction with the LMs, a total of 615 men have
been voluntarily promoting standard health seek-ing behaviours in their communities. A formalisedapproach for engaging men as partners, especiallyin promoting improved reproductive health andhygiene practices, has been initiated.
In order to enhance livelihoods for vulnerablepeople, especially women and youth, 45,377 in-dividuals directly benefited from farm and non-farm training opportunities and Farmer FieldSchools formed into clusters with links to valuechains. Adult literacy/numeracy, vocationaltraining, village savings and loans associations(VSLAs) were also part of the initiative tosupport livelihoods.
e nutrition component of the SNAP pro-gramme was carried out through the MCGwhich promoted optimal IYCF practices, essentialhygiene and family planning. ere was activescreening and referrals of children with severeacute malnutrition (SAM) to the nearest outpa-tient therapeutic feeding programme run bythe Ministry of Health/UNICEF. Training wasconducted for DHMT staff on nutrition, health,and community integrated management of bothneonatal and childhood illnesses (IMNCI) ap-proaches. In addition, food aid distributionstargeted pregnant and lactating women to preventchronic malnutrition in children under 2 years.e monthly food distribution comprised amother/child ration of vegetable oil, bulgurwheat, and lentils in the hunger/lean season,and corn soya blend (CSB), vegetable oil andlentils at other times.
Health activities involved promoting antenatalcare (ANC), support to delivery at the healthfacility, prenatal care (PNC), information onsexual reproductive health rights (SRHR), andfamily planning. Construction of WASH facilitiesincluded installing hand washing stations, latrines,and incinerators for proper disposal of medicalwaste. Basic hand washing stations – tippy taps –were provided at household level. Agriculture/
livelihoods involved support to farmer fieldschools, seed inputs and training in improvedagronomic practices as well as access to creditthrough establishment of village savings andloan groups. Vocational skills support focusedon literacy, numeracy and life skills formothers/caregivers in the PM2A.
Revised programming due toEVD outbreake EVD outbreak started in Kailahun district,one of the SNAP operational districts and spreadrapidly through the rest of the country. All ofthe SNAP intervention districts were badly hitby Ebola, including one operational chiefdomin Koinadugu, which was the last district thatwas affected. During the EVD outbreak (June –December 2014), new activities were implementedand existing activities adapted to support theemergency response and help SNAP beneficiariesrecover from the shock of the EVD outbreak.Existing structures and staff, volunteers andcommunity health workers, as well as villageand WASH health committees, all worked toimplement activities.
Due to the state of emergency and the banon public gatherings, food distributions underthe PM2A programme were stopped at the endof July 2014. Food aid commodities were redi-rected to provide food aid to quarantined house-holds, an important component of stemmingthe spread of the virus.
One important development related to theintegrated management of acute malnutrition(IMAM). A self-screening approach using midupper arm circumference (MUAC) and EVDstandard operating procedures were developed.e MUAC self-screening is done by each moth-er/caregiver for children 6 -59 months. SNAPsupported training of LMs and cascaded theself-screening training to other mothers on theuse of the MUAC tool. e LMs collectedmonthly nutritional data on children screened
Kabala
Kailahun
Makeni
Freetown
ChiefdomTargeted ChiefdomKoinadugu1- Neya2 - Mongo3 - Follosaba Dembalia
(Dembalia Musala)4 - Wara Wara Bafodia5 - Kassunko6 - Diang7 - Neini
Tonkolili8 - Kalansogia9 - Kafe Simira10 - Yoni
Bombali11 - Sella Limba12 - Sanda Loko13 - Gbanti-Kamaranka
Kailahun14 - Yawei15 - Penguia16 - PejeWest17 - Mandu18 - Kissi Tongi
KeyDistrict CapitalSNAP Head OfficeSNAP Field Office
Figure 1 SNAP intervention areas
1 http://www.oici.org

81
. . . . . . . . . . . . . . . . . . . . . . . . . . . . . . . . . . . . . . . . . . . . . . . . . . . . . . . . . . . . . . . . . . . . . . . . . . . . . . . . . . . . . . . . . . . . . . . . . . . . . . . . . . . . . . . . . . . . . . . . . . . . . . . . . . . . . . .
. . . . . . . . . . . . . . . . . . . . . . . . . . . . . . . . . . . . . . . . . . . . . . . . . . . . . . . . . . . . . . . . . . . . . . . . . . . . . . . . . . . . . . . . . . . . . . . . . . . . . . . . . . . . . . . . . . . . . . . . . . . . . . . . . . . . . . .
Field Articlefor reporting. Children identified as MAM orSAM were referred to the peripheral healthunits (PHUs) for verification and receipt of nu-trition care/support. A balanced ration of foodaid commodities was used to provide appropriatefoods to address MAM.
Additional new/adapted activities included:• Social Mobilisation: Community sensitisa-
tion was carried out using mobile teams andcommunity radio. EVD WASH committees disseminated EVD prevention messages and actions to take if a suspected EVD case was found in a community.
• Provision of basic protective supplies to PHUs: chlorine, detergents, soap, buckets, hand sanitisers, disposable gloves etc. were provided.
• EVD contact tracing and active follow up. Training and support was provided to the DHMT for contact tracing, data managementand reporting.
• Psychological first aid training of staff and partners.
• Training of DHMT in nutrition, health, c- IMNCI approaches adapted in the Ebola context.
• Rehabilitation of WASH facilities at PHUs: hand washing, latrines, incinerators. is was rolled out before the EVD outbreak butwas utilised greatly in preventing EVD infection.
• Food Aid to EVD quarantine homes (see above).
• MCG sessions focused on Module 3 ‘essential hygiene actions’, especially proper hand washing.
Post EVD outbreak Since January 2015, with the EVD outbreakunder control and the number of new cases de-clining, the SNAP programme has entered intoa recovery phase (see Figure 2). Activities toJune 2016 have involved:• A return to the spectrum of MCG activities,
promoting IYCF, essential hygiene and family planning.
• Promoting the resumption and utilisation of PHU services (including antenatal and postnatal care) with support from lead mothers and men as partners.
• Nutrition self-screening (by mothers) of children (6-59 months) has continued usingthe MUAC tool and EVD standard operatingprocedures (SOPs). Referrals of MAM and SAM to PHUs for nutrition care services.
• Building capacity of WASH and village health committees to ensure that WASH facilities are functional at health facility andcommunity levels.
• Village savings and loans maintained and proceeds shared (no new groups formed) toenable beneficiaries to buy food on local market.
• Development of culinary recipes for use in MCGs cooking demonstrations. e recipe
book includes important complementary feed-ing and weaning foods recipes. e culinaryrecipe book will be used for MCG cookingdemonstrations and cooking at household levels.
Discussion e SNAP ‘development’ programme successfullyadapted and harnessed capacity to respond to achallenging emergency context.
Extreme infection control measures gave riseto the ‘no touch’ policy in nutrition screening.Use of MUAC for nutrition self-screening andcase identification of children 6-59 months bymothers/careers and supervised by LMs wasinstrumental in continuing community-basedscreening of children for MAM and SAM. Feed-back from mothers and caregivers on using theMUAC tapes has been positive. Mothers/carerscontribute to the measurement of nutritionstatus of their children and feel part of thedecision making process surrounding their chil-dren’s health. e process developed is userfriendly: illiterate mothers can effectively usethe MUAC tapes and feel confident about trans-lating the colours (green-normal, yellow- MAM,red – SAM) into their local language. LMs caneffectively complete self-screening data collectiontools, which makes monitoring of the entireprocess easier and can provide effective follow-up to ensure that children are getting propernutrition and their health status is improvingover time. Given the advantages, this innovationin self-screening will continue in the SNAP pro-gramme post-EVD outbreak.
Because of the EVD response, there is nowincreased awareness about hand washing andhygiene practices, especially using tippy taps athouseholds and community levels. Tippy tapsand or hand washing stations (veronica buckets)are readily available in public places and house-holds for hand washing.
For more information, contact: Sibida George,email: [email protected]
Figure 2 Total suspected, probable, and confirmed cases and deaths of Ebola virusdisease in Sierra Leone, March 25, 2014 – May 24, 2015, by date of WHOSituation Report, n=12706
14000
12000
10000
8000
6000
4000
2000
0
Total cases, Sierra Leone Total deaths, Sierra Leone
Mar
14
Apr 1
4
May
14
Jun
14
Jul 1
4
Aug
14
Sep
14
Oct 1
4
Nov 1
4
Dec 1
4
Jan
15
Feb
15
Mar
15
Apr 1
5
May
15
Mother Child Group training session
Source: www.cdc.gov

. . . . . . . . . . . . . . . . . . . . . . . . . . . . . . . . . . . . . . . . . . . . . . . . . . . . . . . . . . . . . . . . . . . . . . . . . . . . . . . . . . . . . . . . . . . . . . . . . . . . . . . . . . . . . . . . . . . . . . . . . . . . . . . . . . . . . . .
82
By Ajay Kumar Sinha, DolonBhattacharyya and Raj Bhandari
Views ........................................................................
Ajay Kumar Sinha is theFounder Secretary andExecutive Director of FLAIR.He is an expert on publicpolicy and public finance.
Dolon Bhattacharyya is anexpert on budget analysisand is the Director ofPolicy, Research andDocumentation at FLAIR.
Dr Raj Bhandari is a seniorpaediatrician and technicaladvisor to variouscommittees on health andnutrition. He has activelycollaborated with UNICEFand Government for more
than a decade to scale up nutrition programmesin various States of India. He is the chief mentorof FLAIR.
FLAIR (Forum for Learning and Action withInnovation and Rigour) is a forum of expertindividual researchers and practitioners, as wellas organisations, which was formally registeredas a Society in June 2013. It draws from theexperience and expertise of the foundingindividuals and organisations. FLAIR creates,nurtures and operates the spaces for learning byorganising and/or facilitating consultativeprocesses, seminars, lectures, etc. It worksthrough (a) participation in the processes ofpolicy and programme formulation via researchand development of protocols and standardisedoperating procedures (SOPs) based on acombination of learning from grassroots andinputs from sector and subject experts, (b)programmes in the social development sectorthat interface with Information andCommunications Technology (ICT).
The contexte Global Hunger Index1 (a compositeof under-five mortality rate, prevalence ofunderweight in children and proportionof undernourished) for South Asia, Eastand Southeast Asia remains “serious” andwarrants continued concern (see Figure1). Although India’s 2014 GHI score fellto 17.8, it remains in the ‘serious’ category.e progress in reducing child malnutrition(underweight2) in India has been com-mendable, decreasing from 43.5% in 2005-6 to 30.7% in 2013-14. However, India isstill ranked 120th among 128 countrieswith data on child undernutrition from2009 to 2013; much work is needed at na-tional and state levels so that a greatershare of the population can enjoy nutritionsecurity. India ranks highest out of allcountries with respect to annual incidence
of deaths of children below 5 years; in2012, there were 1.4 million deaths amongstchildren under the age of five years3.
e prevalence of severe acute malnu-trition (SAM) (weight for height <-3 z-scores) is estimated to be 7.9% in India(as per the National Family Health Survey
Challenges in addressingundernutrition in India
1 The Global Hunger Index (GHI) is designed to comprehensively measure and track hunger globallyand by country and region. It is calculated each year
by the International Food Policy Research Institute (IFPRI). The GHI ranks countries on a 100-point scale. Zero is the best score (no hunger), and 100 is the worst, although neither of these extremes is reachedin practice. Visit http://www.ifpri.org/
2 Weight for age <-2 SD. This data is for children under5 years of age and is provisional as reported by the Global Hunger Index (GHI), see: http://www.ifpri.org/sites/default/files/publications/ghi14factsasia.pdf
3 Levels and trends in Child Mortality, Report 2013, by UNICEF
Global Hunger Index – performance of various regions over the yearsFigure 1
35
30
25
20
15
10
5
0
20.6
18.9
17.5
15.9
12.5
25.4
25.5
24.4
21.8
18.2
30.6
27.3
25.0
23.4
18.1
16.4
13.9
11.9
10.0
7.6
8.1
7.8
6.8
5.9
4.9
9.3
8.3
6.8
5.7
4.4 5.3
5.1
3.2
2.6
DevelopingWorld
‘90 ‘95 ‘00 ‘05 ‘14 ‘90 ‘95 ‘00 ‘05 ‘14 ‘90 ‘95 ‘00 ‘05 ‘14 ‘90 ‘95 ‘00 ‘05 ‘14 ‘90 ‘95 ‘00 ‘05 ‘14‘90 ‘95 ‘00 ‘05 ‘14 ‘90 ‘95 ‘00 ‘05 ‘14
Africa South ofthe Sahara
South Asia East & south-east Asia
Near East & North Africa
latin America & the Caribbean
Under-five mortality ratePrevalence of underweight in childrenProportion of undernourished
Eastern Europe &commonwealth ofIndependent States
A SQUEAC survey
ACF,
Nig
eria
, 201
5

83
. . . . . . . . . . . . . . . . . . . . . . . . . . . . . . . . . . . . . . . . . . . . . . . . . . . . . . . . . . . . . . . . . . . . . . . . . . . . . . . . . . . . . . . . . . . . . . . . . . . . . . . . . . . . . . . . . . . . . . . . . . . . . . . . . . . . . . .
. . . . . . . . . . . . . . . . . . . . . . . . . . . . . . . . . . . . . . . . . . . . . . . . . . . . . . . . . . . . . . . . . . . . . . . . . . . . . . . . . . . . . . . . . . . . . . . . . . . . . . . . . . . . . . . . . . . . . . . . . . . . . . . . . . . . . . .
Views(NFHS) 3, 2005-06), translating to approximatelyseven million children under 3 years of agewith SAM (see Table 1). At the present rate ofprogress, the country is unlikely to meet theMillennium Development Goals related to erad-icating hunger and malnutrition and improvingmaternal and child health4.Whilst more recentdata on malnutrition prevalence is available,these data are challenging to interpret. Variationsin target age-group and survey timing, differentreferences/standards5, lack of qualitative infor-mation to aid interpretation of prevalence figuresand lack of serially consistent data to track
change all hamper analysis and conclusions.With these limitations in mind, the latest mal-nutrition prevalence data comes from the DistrictLevel Household Survey – 4 (DLHS 4), conductedin 2012-13. However, as not all the data havebeen analysed, in this article we only compareSAM prevalence (WHZ < -3) between DLHS 4and NFHS 3 in the three best performing andthree worst performing Indian States (see Table2). It is important to note that while NFHS -1and NFHS -2 assessed children under 3 years,both NFHS 3 and DLHS 4 assessed childrenunder 5 years.
Severe wasting is considerably higher inDLHS 4 and indicates prevalence at a phenomenal‘emergency’ level of 20% (34% global acute mal-nutrition) in the state of Maharashtra, forexample. ere is a lack of contextual data tohelp explain this extreme prevalence; in fact, anumber of smaller surveys have not indicatedany increase in prevalence of SAM for childrenless than 3 or 2 years of age and in some caseshave shown a decline, such as the ComprehensiveNutrition Survey in Maharashtra (CNSM) in20117. Our field experience is that whereverGovernments have worked with an integratedand comprehensive approach that combines ad-dressing care and feeding practices with foodbased initiatives, there have been positive resultsfor nutrition. But, without an intensive Gov-ernment programme, nutrition insecurity takesits toll, especially on poor and marginalisedfamilies. Positive results seen in the CNSMcould be attributed to good programming prac-tices for pregnant women and lactating mothersand good infant and young child feeding (IYCF)practices. Although the CNSM does not shownutrition improvement compared with NFHS3, this may be related partly to differences inthe target age group surveyed.
During our field experience of working inMaharashtra and other States of India, we haveobserved that Governments of late have beenworking on multiple fronts to address under-nutrition. e Government of Maharashtra hastaken a number of steps to reduce malnutritionwith interventions focusing on pregnant mothersand the -9 to 24 months age group. Examples ofstate initiatives are included in Box 1. e resultsof this can be seen in a substantial reduction inmeasures of malnutrition including stuntingand wasting prevalence between 2006 and 2012,as per the 2012 CNSM. Overall, it appears thatthere has been progress in programming forimprovement of nutritional status of young chil-dren under 2 years of age. Less may have beenachieved for the 2-5 years age group; however,strong conclusions cannot be drawn due to lackof data – in particular, a data subset for childrenbelow 2 years or 3 years from DLHS 4.
Factors to improve nutritionalstatus of children in IndiaIt is commonly accepted that the factors toaddress which will lead to improvements in nu-tritional status of children in India are a) nutri-tional status of women preconception and duringpregnancy; b) infant and young child feeding(IYCF) practices; c) dietary intake of childrenand lactating mothers; and d) availability ofsafe, clean drinking water, sanitation and hygiene
4 GHI, The challenge of Hidden Hunger, 20145 NFHS-3 uses NCHS references, while DLHS 4 and
CNSM (cited later) use WHO Growth Standards.6 District Level Household and Facility Survey (DLHS), round
IV, 2012-2013 7 For example, Comprehensive Nutrition Survey in
Maharashtra, CNSM 2012, http://www.iipsindia.org/pdf/ CNSMFACTSHEET%20-%202012.pdf
8 Annual Project Implementation Plan, 2012-2013, ICDS, Dept of Women and Child Development, Government of Maharashtra
Stunting(Height-for age < -3)
Wasting(Weight-for-height<-3)
Underweight(Weight-for-age <-3)
% Number % Number % Number
India 22 19.601 million 7.9 7.04 million 15.8 14.077 million
Prevalence of malnutrition amongst children under 3 years in IndiaTable 1
NFHS 3 (2005-06) DLHS 4 (2012)6
Children < 5 years Children < 5 years
Severe stunting(height for age <-3)
Severe wasting(WHZ<-3)
Severe stunting(height for age <-3)
Severe wasting(WHZ<-3)
Maharashtra 19.1 5.2 14.7 20
Haryana 19.4 5 15.4 18.6
West Bengal 17.8 4.5 19.8 15.2
Tamil Nadu 10.9 6.4 11.8 13.9
Kerala 6.5 4.1 9.4 10.8
Himachal Pradesh 16 5.5 18.1 10.0
Performance of the best and worst States of India in terms of severe stuntingand severe wastingTable 2
State initiatives to address malnutrition in MaharashtraBox 1
Source: NFHS 3 (2005-06) and Census of India 2011
Note: NFHS 3 uses NCHS references, DHLS 4 uses WHO Growth Standards
Source: Annual Project Implementation Plan, 2012-2013, ICDS, Dept of Women and Child Development, Government of Maharashtra
• Addressing malnutrition issues in Mission Mode though Rajmata Jijau Health and Nutrition Mission (The Mission).
• IYCF and infant and young child nutrition (IYCN) as an integrated package through the Breast- feeding Promotion Network of India (BPNI), addressing anaemia among adolescents and linking with the Health and Education Department.
• Micronutrient drives through National Rural HealthMission (NRHM), such as biannual de-worming (12- 59 months) and vitamin A supplementation (9-59 months) rounds which have ensured a coverage of >75% among children under 5 since 2007.
• Take Home Rations introduced which makes it con-venient for working mothers and adolescent girls.
• Janani & Shishu Suraksha Karyakram, free deliveryservices, free transport and food, free antenatal care (ANC) check- ups during pregnancy, weekly visits of gynaecologists to primary health centres (PHCs) for check-up of pregnant women, free iron and folic acid (IFA) tablets for pregnant women – all geared towards improvement in maternal health.
• The Supplementary Nutrition Programme (SNP) guidelines have been revised so that expenditure per child and the calories allocated have increased.Severely underweight children between 6 monthsto 3 years old are provided with 950 kcals and 23-28g of protein. The revised cost is Rs 9.00 per day per beneficiaries8.
• Models of Village Child Development Centres (VCDCs) have been developed with funding support from the NRHM to allow identification of SAM and moderate acute malnutrition (MAM) by measuring weight-for-height in addition to weight-for-age.
• Home based VCDC for home based management of SAM and MAM children, the ‘anganwadi' model and the 'muthhi bhar dhanya' model; the latter invokes donation of food grains by the village community to the households that have malnourished children.
• Regular training programmes on child care, nutrition, care during illness etc. involving Integrated Management of Neonatal and Childhood Illnesses (IMNCI), IYCN, Home Based Newborn Care (HBNC), breastfeeding etc. funded by the NRHM.
• Raising awareness about the importance of 10 essential interventions, e.g. breastfeeding, complementary feeding, etc and about ICDS services including the television series ‘Deshache Dhan’ on the ICDC services and the monthly newsletter ‘Aamchi Aanganwadi’ on the latest schemes, anecdotes and stories from the field.
• Other innovations, such as the malnutrition free village campaign implemented by The Mission, the crèche scheme operational in six tribal districts through Gram Panchayat and the mobile Anganwadi project for migrated population.

84
. . . . . . . . . . . . . . . . . . . . . . . . . . . . . . . . . . . . . . . . . . . . . . . . . . . . . . . . . . . . . . . . . . . . . . . . . . . . . . . . . . . . . . . . . . . . . . . . . . . . . . . . . . . . . . . . . . . . . . . . . . . . . . . . . . . . . . .
. . . . . . . . . . . . . . . . . . . . . . . . . . . . . . . . . . . . . . . . . . . . . . . . . . . . . . . . . . . . . . . . . . . . . . . . . . . . . . . . . . . . . . . . . . . . . . . . . . . . . . . . . . . . . . . . . . . . . . . . . . . . . . . . . . . . . . .
Viewsfacilities. All these factors are associated withsocial grouping and the income categories ofthe households to which the children belong.
(a) Nutritional status of womenChildren born to short, thin women are morelikely themselves to be stunted and underweight(low weight for age). Data shows 21.5% ofchildren in India are born with low birth weight(LBW), i.e. below 2.5 kg. Anaemia remains acritical public health problem affecting 51.2%of women9 and 49.4% of children aged 6-35months10 in India. Anaemia begins in childhood,worsens during adolescence in girls and is ag-gravated during pregnancy. e prevalence ofanaemia is high because of low dietary intakeof iron (<20 mg/day) and folic acid; poor bio-availability of iron (3-4% only) in the phytateand fibre-rich Indian diet; and chronic bloodloss due to infectious diseases (faecal iron lossin the context of parasitic infections)11 or con-secutive child births12. Data shows that only46.6% of mothers in India have consumed 100IFA tablets as prescribed during pregnancy13.
(b) IYCF practicese risk of increased morbidity and mortalitydue to pneumonia and diarrhoea is higher forinfants who are not exclusively breastfed14. Ac-cording to NFHS 3 (2005-06), while breastfeedingis nearly universal in India, very few childrenare put to the breast immediately aer birth.Only one-quarter of last-born children whowere ever breastfed started breastfeeding withinthe recommended half an hour of birth, and al-most half (45%) did not start breastfeedingwithin one day of birth. Fiy-seven per cent ofmothers gave their last-born child somethingto drink other than breastmilk in the three daysaer delivery. Only 69% children below twomonths of age are exclusively breastfed. Exclusivebreastfeeding drops to 51% at 2-3 months ofage and 28% at 4-5 months of age. Overall,slightly less than half of children under sixmonths of age are exclusively breastfed15.
NFHS – 3 (2005-06) also shows shortcomingsin complementary feeding practices amongstboth breastfed and non-breastfed 6-23m children.Only 21% of breastfed and non-breastfed childrenare fed appropriately according to all three rec-ommended IYCF practices16, which varies widelyamong the states. Appropriate feeding practicesare followed most oen in Kerala and Sikkim,but even in these two states a large percentageof children are not fed appropriately according
to all three IYCF practices. Other states withmuch better than average feeding practices areGoa, Manipur, Himachal Pradesh, and Delhi.Compliance with all recommended feeding prac-tices is lowest in Andhra Pradesh and Maha-rashtra, where only 1 in 10 children are fed ac-cording to all three IYCF practices17.
c) Food intakeIn spite of India's rapid economic growth, therehas been a sustained decline in per capita calorieand protein consumption during the past 25years18. Deficiencies in micronutrients such asvitamin A, beta-carotene, folic acid, vitaminB12, vitamin C, riboflavin, iron, zinc, and seleniuminfluence the vulnerability of a host to infectiousdiseases and the course and outcome of suchdiseases.
(d) Issues of safe drinking water,sanitation and hygiene
Research suggests that an unhygienic environ-ment, combined with high population density,creates a perfect storm for diseases to thriveand malnutrition to flourish in India. Residentsof nearly 59.4% of the country’s rural homesdefecate in the open19, exposing children to in-fectious diseases such as typhoid and diarrhoea,which reduces nutrient absorbtion. MadhyaPradesh, Bihar and Jharkhand have both thehighest percentage of homes having no toiletfacilities20 and highest child malnutrition preva-lence. Conversely, states like Kerala, Manipur,Mizoram and Sikkim, where 80% or more ofthe rural population have access to toilets, havethe lowest levels of child malnutrition.
e effects of child undernutrition amongthe different social groups are reflected in higherneonatal mortality, child mortality, U5 moralityrate (U5MR), LBW, etc. amongst the scheduledpopulation (both Scheduled Caste (SC) andScheduled Tribes (ST)21) compared to childrenof higher castes. e calorie intake of the poorestquartile continues to be 30 to 50% less than thecalorie intake of the top quartile of the populationin India22.
Existing nutrition interventionsin Indiae Indian government has rolled out and ex-panded several programmes that target a mixof direct and indirect causes of undernutritionamongst mothers and children. Direct nutri-tion-specific interventions include food supple-mentation programmes under the IntegratedChild Development Services (ICDS)23 and Mid-day Meals (MDM)24. e National Rural HealthMission (NRHM) aims to address micronutrientdeficiencies through immunisation, IYCF, IFAdistribution, communicable and non-commu-nicable disease control programmes, etc. andpursues convergence between water, sanitation,education, nutrition and health programmesthough implementing comprehensive pro-grammes. Indirect causes of undernutrition areaddressed through initiatives such as the NationalRural Employment Guarantee Scheme (a ruraljobs programme) and reforms, in several states,to the Public Distribution System for improvinghousehold food security among the poor. Recentsanitation and hygiene initiatives by the Indian
9 DLHS III 2007-0810 NFHS III11 Two common parasitic infections are Giardia Lamblia and
Hookworm infection.12 Toteja GS, Singh P. Micronutrient profile of Indian population
New Delhi: Indian Council of Medical Research; 200413 DLHS III14 Black, Robert E., and others, ‘Maternal and Child Under-
nutrition: Global and Regional Exposures and Health Consequences’, The Lancet, vol. 371, no. 9608, 19 January 2008, pp. 243–260.
15 NFHS 3 (2005-06), Vol. I September 207, (http://www.rchiips.org/nfhs/NFHS-3%20Data/VOL1/India_ volume_I_corrected_17oct08.pdf
16 WHO recommended IYCF practices are: Breastfed children of 6-23 months to be fed three or more food groups daily and a
minimum number of times according to age (twice a day for 6-8 months and at least 3-times a day for 9-23 months); Non-breastfed children aged 6-23 months to be fed milk or milk products, at least four or more food groups, and four or more times a day.
17 Ibid18 Hunger, Under-Nutrition and Food Security in India, N C Saxena,
IIPA, New Delhi, 201119 69th round NSSO survey report on drinking water, sanitation,
hygiene and housing condition in India20 https://sanitationupdates.wordpress.com/2012/03/16/india-
census-more-people-have-a-mobile-phone-than-a-household-toilet/
21 The Scheduled Castes (SCs) and Scheduled Tribes (STs) are officialdesignations given to various groups of historicallydisadvantaged people. The terms are recognised in the
Public Health expenditure, OECD countries and India (% of GDP, 2013)Figure 212
10
8
6
4
2
0
10.3
9.1
9 8.7
8.5
8.5
8.4
8.2
8.1
8.1
7.9
7.6
7.6
7.6
7.3
7.1
7.1
6.8
6.6
6.3
6.3
6 6 6 5.9
5.8
5.1
4.6
4.5
4.3
4.3
3.8
3.7
3.2
Constitution of India and the various groups are designated in one or other of the categories. During the period of British rule in the Indian subcontinent, they were known as the Depressed Classes. In modern literature, the Scheduled Castes and Scheduled tribes are referred to as Dalits and Adivasis respectively. SCs and STs have been among the most disadvantaged sections of our society due to their socio-economic exploitation and isolation over a long period of time.
22 National Sample Survey Organisation. Nutrition Intake in India 2011-12, Report No. 560, NSS 68th Round (July 2011 - June 2012)
23 ICDS is the programme initiated with increased emphasis on the provision of supplementary feeding and preschool education to children of 3-6 years.
24 initiated to provide a cooked meal with 300 calories and 8-12 grams of protein to the school children
Neth
erla
nds
Denm
ark
Fran
ceGe
rman
yBe
lgiu
mJa
pan
AUST
RIA
Norw
ayNe
w Ze
alan
dUn
ited S
tate
sSw
eden
Cana
daSw
itzer
land
Unite
d Kin
gdom
Icela
ndFin
land
Italy
Gree
ceSlo
veni
aPo
rtuga
lSp
ain
Austr
alia
Czec
h Rep
ublic
Irela
ndLu
xem
bour
gSlo
vak R
epub
licHu
ngar
yPo
land
Esto
nia
Israe
lTu
rkey
Kore
a, R
ep.
Chile
Mex
icoIn
dia
1.3
Source: Compiled from country-wise statistics on WHO estimates of expenditure on health as % of GDP (2013),http://www.who.int/countries/en/
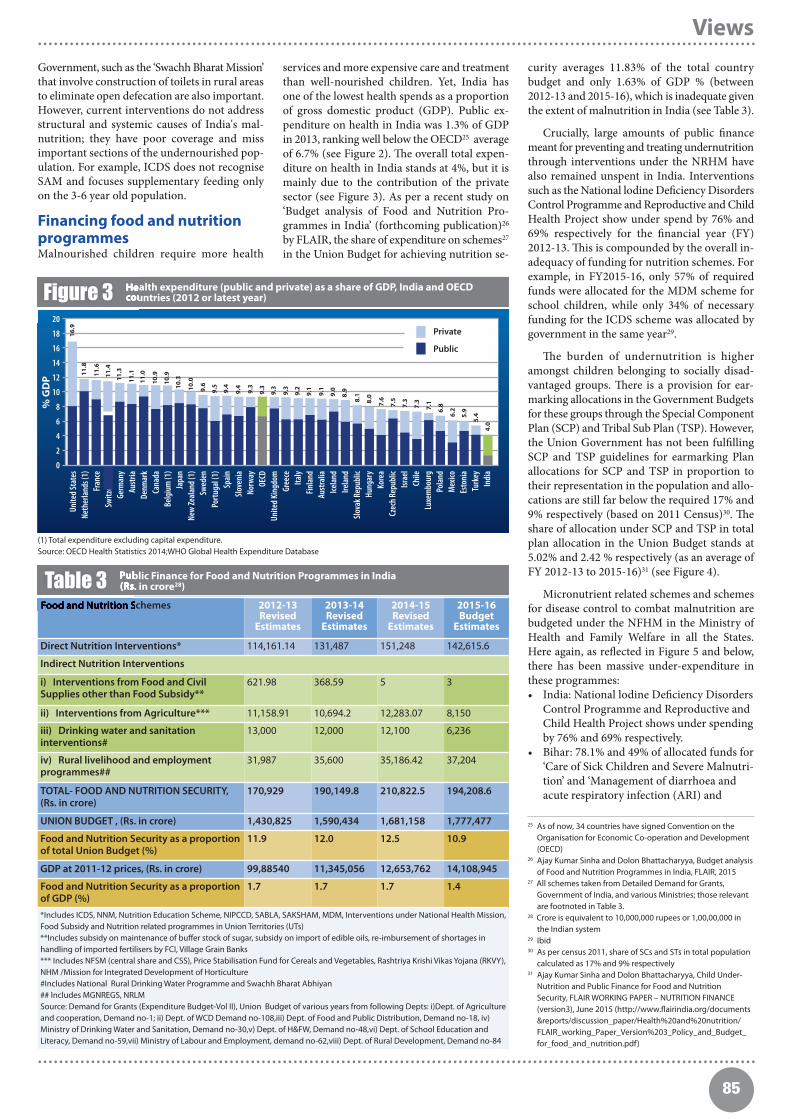
85
. . . . . . . . . . . . . . . . . . . . . . . . . . . . . . . . . . . . . . . . . . . . . . . . . . . . . . . . . . . . . . . . . . . . . . . . . . . . . . . . . . . . . . . . . . . . . . . . . . . . . . . . . . . . . . . . . . . . . . . . . . . . . . . . . . . . . . .
. . . . . . . . . . . . . . . . . . . . . . . . . . . . . . . . . . . . . . . . . . . . . . . . . . . . . . . . . . . . . . . . . . . . . . . . . . . . . . . . . . . . . . . . . . . . . . . . . . . . . . . . . . . . . . . . . . . . . . . . . . . . . . . . . . . . . . .
Viewscurity averages 11.83% of the total countrybudget and only 1.63% of GDP % (between2012-13 and 2015-16), which is inadequate giventhe extent of malnutrition in India (see Table 3).
Crucially, large amounts of public financemeant for preventing and treating undernutritionthrough interventions under the NRHM havealso remained unspent in India. Interventionssuch as the National lodine Deficiency DisordersControl Programme and Reproductive and ChildHealth Project show under spend by 76% and69% respectively for the financial year (FY)2012-13. is is compounded by the overall in-adequacy of funding for nutrition schemes. Forexample, in FY2015-16, only 57% of requiredfunds were allocated for the MDM scheme forschool children, while only 34% of necessaryfunding for the ICDS scheme was allocated bygovernment in the same year29.
e burden of undernutrition is higheramongst children belonging to socially disad-vantaged groups. ere is a provision for ear-marking allocations in the Government Budgetsfor these groups through the Special ComponentPlan (SCP) and Tribal Sub Plan (TSP). However,the Union Government has not been fulfillingSCP and TSP guidelines for earmarking Planallocations for SCP and TSP in proportion totheir representation in the population and allo-cations are still far below the required 17% and9% respectively (based on 2011 Census)30. eshare of allocation under SCP and TSP in totalplan allocation in the Union Budget stands at5.02% and 2.42 % respectively (as an average ofFY 2012-13 to 2015-16)31 (see Figure 4).
Micronutrient related schemes and schemesfor disease control to combat malnutrition arebudgeted under the NFHM in the Ministry ofHealth and Family Welfare in all the States.Here again, as reflected in Figure 5 and below,there has been massive under-expenditure inthese programmes: • India: National lodine Deficiency Disorders
Control Programme and Reproductive and Child Health Project shows under spendingby 76% and 69% respectively.
• Bihar: 78.1% and 49% of allocated funds for‘Care of Sick Children and Severe Malnutri-tion’ and ‘Management of diarrhoea and acute respiratory infection (ARI) and
Health expenditure (public and private) as a share of GDP, India and OECDcountries (2012 or latest year)Figure 3
20
18
16
14
12
10
8
6
4
2
0
16.9
% G
DP
11.8
11.6
11.4
11.3
11.1
11.0
10.9
10.9
10.3
10.0
9.6
9.5
9.4
9.4
9.3
9.3
9.3
9.3
9.2
9.1
9.1
9.0
8.9
8.1
8.0
7.6
7.5
7.3
7.3
7.1
6.8
5.9
6.2
5.4
Unite
d Sta
tes
Neth
erla
nds (
1)Fr
ance
Switz
erla
ndGe
rman
yAu
stria
Denm
ark
Cana
daBe
lgiu
m (1
)Ja
pan
New
Zeal
and (
1)Sw
eden
Portu
gal (
1)Sp
ain
Slove
nia
Norw
ayOE
CDUn
ited K
ingd
omGr
eece
Italy
Finla
ndAu
stral
iaIce
land
Irela
ndSlo
vak R
epub
licHu
ngar
yKo
rea
Czec
h Rep
ublic
Israe
lCh
ileLu
xem
bour
gPo
land
Mex
icoEs
toni
aTu
rkey
Indi
a4.
0
25 As of now, 34 countries have signed Convention on the Organisation for Economic Co-operation and Development (OECD)
26 Ajay Kumar Sinha and Dolon Bhattacharyya, Budget analysisof Food and Nutrition Programmes in India, FLAIR, 2015
27 All schemes taken from Detailed Demand for Grants, Government of India, and various Ministries; those relevant are footnoted in Table 3.
28 Crore is equivalent to 10,000,000 rupees or 1,00,00,000 in the Indian system
29 Ibid30 As per census 2011, share of SCs and STs in total population
calculated as 17% and 9% respectively31 Ajay Kumar Sinha and Dolon Bhattacharyya, Child Under-
Nutrition and Public Finance for Food and Nutrition Security, FLAIR WORKING PAPER – NUTRITION FINANCE (version3), June 2015 (http://www.flairindia.org/documents &reports/discussion_paper/Health%20and%20nutrition/ FLAIR_working_Paper_Version%203_Policy_and_Budget_ for_food_and_nutrition.pdf)
(1) Total expenditure excluding capital expenditure.Source: OECD Health Statistics 2014;WHO Global Health Expenditure Database
Food and Nutrition Schemes 2012-13Revised
Estimates
2013-14Revised
Estimates
2014-15 Revised
Estimates
2015-16Budget
Estimates
Direct Nutrition Interventions* 114,161.14 131,487 151,248 142,615.6
Indirect Nutrition Interventions
i) Interventions from Food and CivilSupplies other than Food Subsidy**
621.98 368.59 5 3
ii) Interventions from Agriculture*** 11,158.91 10,694.2 12,283.07 8,150
iii) Drinking water and sanitationinterventions#
13,000 12,000 12,100 6,236
iv) Rural livelihood and employmentprogrammes##
31,987 35,600 35,186.42 37,204
TOTAL- FOOD AND NUTRITION SECURITY,(Rs. in crore)
170,929 190,149.8 210,822.5 194,208.6
UNION BUDGET , (Rs. in crore) 1,430,825 1,590,434 1,681,158 1,777,477
Food and Nutrition Security as a proportionof total Union Budget (%)
11.9 12.0 12.5 10.9
GDP at 2011-12 prices, (Rs. in crore) 99,88540 11,345,056 12,653,762 14,108,945
Food and Nutrition Security as a proportionof GDP (%)
1.7 1.7 1.7 1.4
*Includes ICDS, NNM, Nutrition Education Scheme, NIPCCD, SABLA, SAKSHAM, MDM, Interventions under National Health Mission,Food Subsidy and Nutrition related programmes in Union Territories (UTs) **Includes subsidy on maintenance of buffer stock of sugar, subsidy on import of edible oils, re-imbursement of shortages inhandling of imported fertilisers by FCI, Village Grain Banks*** Includes NFSM (central share and CSS), Price Stabilisation Fund for Cereals and Vegetables, Rashtriya Krishi Vikas Yojana (RKVY),NHM /Mission for Integrated Development of Horticulture#Includes National Rural Drinking Water Programme and Swachh Bharat Abhiyan## Includes MGNREGS, NRLMSource: Demand for Grants (Expenditure Budget-Vol II), Union Budget of various years from following Depts: i)Dept. of Agricultureand cooperation, Demand no-1; ii) Dept. of WCD Demand no-108,iii) Dept. of Food and Public Distribution, Demand no-18, iv)Ministry of Drinking Water and Sanitation, Demand no-30,v) Dept. of H&FW, Demand no-48,vi) Dept. of School Education andLiteracy, Demand no-59,vii) Ministry of Labour and Employment, demand no-62,viii) Dept. of Rural Development, Demand no-84
Public Finance for Food and Nutrition Programmes in India(Rs. in crore28)Table 3
Government, such as the ‘Swachh Bharat Mission’that involve construction of toilets in rural areasto eliminate open defecation are also important.However, current interventions do not addressstructural and systemic causes of India's mal-nutrition; they have poor coverage and missimportant sections of the undernourished pop-ulation. For example, ICDS does not recogniseSAM and focuses supplementary feeding onlyon the 3-6 year old population.
Financing food and nutritionprogrammesMalnourished children require more health
services and more expensive care and treatmentthan well-nourished children. Yet, India hasone of the lowest health spends as a proportionof gross domestic product (GDP). Public ex-penditure on health in India was 1.3% of GDPin 2013, ranking well below the OECD25 averageof 6.7% (see Figure 2). e overall total expen-diture on health in India stands at 4%, but it ismainly due to the contribution of the privatesector (see Figure 3). As per a recent study on‘Budget analysis of Food and Nutrition Pro-grammes in India’ (forthcoming publication)26
by FLAIR, the share of expenditure on schemes27
in the Union Budget for achieving nutrition se-
Private
Public

86
. . . . . . . . . . . . . . . . . . . . . . . . . . . . . . . . . . . . . . . . . . . . . . . . . . . . . . . . . . . . . . . . . . . . . . . . . . . . . . . . . . . . . . . . . . . . . . . . . . . . . . . . . . . . . . . . . . . . . . . . . . . . . . . . . . . . . . .
. . . . . . . . . . . . . . . . . . . . . . . . . . . . . . . . . . . . . . . . . . . . . . . . . . . . . . . . . . . . . . . . . . . . . . . . . . . . . . . . . . . . . . . . . . . . . . . . . . . . . . . . . . . . . . . . . . . . . . . . . . . . . . . . . . . . . . .
Views
Micronutrient Malnutrition’ were unspent in 2012-13.
• Madhya Pradesh: Programmes such as the National lodine Deficiency Disorders ControlProgramme, IYCF Programme, and the Micronutrient Supplementation Programmeshows underspend by 33%, 27% and 73% respectively.
us we see that the crucial public financemeant for preventing and treating undernutritionas part of NFHM interventions are not only in-adequately financed but that a substantial pro-portion of funds that are allocated remain un-spent. e main reasons are inadequacy of in-frastructure (so certain services cannot be de-livered or scaled up), vacancy of staff and workerpositions (thus activities are not implemented),delay in submission of utilisation certificates33
and delay in release of funds.
Priority areasA major gap in India’s capacity to address un-dernutrition in India is the absence of pro-grammes to both prevent and treat cases ofchildhood SAM. Energy dense food that is soor crushable, palatable and easy for children toeat through community based management ofacute malnutrition (CMAM) need rapid scalingup in India. Operations research using energydense food fortified with Type 2 micronutrients
(magnesium, phosphorus, sulphur, lysine) isneeded. Reductions in stunting are better achievedthrough interventions such as IYCF micronutrientsupplementation for vulnerable children; accessto high quality food; health care; safe watersources and basic sanitation. IYCF and CMAMshould be conceptualised and planned as twointegral parts of a single programme to preventand treat undernutrition in its range of forms.
Quantifying need and determining impact ofinterventions is critical. However, in India, trackingprogramme performance over time is compro-mised by surveys that gather data on differentchild age groups. For example, CNSM (2012-13) collects data for children under 2 years ofage, whilst NFHS 3 (2005-06) and DLHS 4 (2012-13) collected data for under-fives. DLHS 3 wasconducted in almost the same reference period(2007-08) as that of NFHS 3 (2005-06), butDLHS-3 did not give information on any of thethree indicators of malnutrition. DLHS 4 andCNSM are also of the same time reference period(2012-13), but the age group of children coveredis different. As a result tracking change (im-provement or decline) is hugely challenging.
Early identification and treatment of wastingmay play a role in prevention of stunting inparticular contexts. Programmes could be de-signed and directed to reduce wasting and stunt-ing with preventive food based approaches.Policy, programme and finance should addressthe issue of wasting and stunting in an integratedway and attempt to bridge the divide betweenthe two categories; it is unfortunate that neitherthe Ministry of Women and Child Development(WCD) nor the Health Department recordslength/height of children during growth moni-toring promotion (GMP). e continuum ofcare has to be established and encompass pre-conception, during conception, natal and post-natal management of small for gestational age(SGA) babies, IYCF, complementary feeding,early detection of severe undernutrition bygrowth monitoring, disease prevention and treat-ment and care practices. Improvement in Ma-ternal Health is also a priority action. Mid upperarm circumference (MUAC) standards appro-
priate for Indian children, should be used incommunity screening. Considering the highrate of small for gestational age (SGA) andpreterm babies, there is an increased risk ofchildren growing with Metabolic Syndrome,which is likely to triple the burden of malnutritionin future generations.
Finding solutions to malnutrition requirestraversing many pathways and integrating in-terventions in multiple sectors including agri-culture, food distributions, feeding and carepractices, disease control, hygiene and sanitationand public health programmes for disease control.In India, these interventions and pathways fallunder the portfolios of at least seven differentministries, e.g. Ministry of Agriculture, Ministryof Food and Public Distribution, Ministry ofWCD, Ministry of Health and Family Welfare,Ministry of Water and Sanitation, Ministry ofRural Development, Ministry of Urban Devel-opment and Poverty Alleviation. Specific attentionto socially marginalised groups comes withinthe remit of three more separate ministries, i.e.Ministry of Social Justice and Empowerment,Ministry of Tribal Affairs and Ministry of Mi-nority Affairs. is requires a tremendous effortat coordination. Achieving positive nutritionoutcomes is therefore contingent upon effectivecoordination between these ministries.
In order for nutrition problems to be addressedeffectively, India may well need a Nutrition Mis-sion that has the authority and system to coor-dinate an integrated approach between themyriad of actors implementing nutrition-specificand nutrition-sensitive programming and holdsvarious stakeholders, including government, toaccount for actions and inaction.
For more information, contact: Ajay KumarSinha, email: [email protected] C-102, J.M. Orchid, Sector 76, Noida – 201301, U.P.,India. Website: www.flairindia.orgEmail: [email protected]
32 Ibid33 Utilisation Certificates are sent by State Governments to the
Union Government for the release of funds for the next quarter. These are essentially financial reports showing usage of funds.
Figure 4 Trend in percentages of Food and Nutrition Programmesfor Scheduled Caste (SC) and Scheduled Tribes (STs)under the Special Component Plan (SCP) and Tribal SubPlan (TSP) in total Food and Nutrition Budgets
8.00
7.00
6.00
5.00
4.00
3.00
2.00
1.00
0.00RE 2012-13 RE 2013-14 RE 2014-15 RE 2015-16
Food and Nutrition Security for SCs as a proportion of total Food and NutritionSecurity Budget in India
Bihar MP All IndiaFood and Nutrition Security for STs as a proportion of total Food and NutritionSecurity Budget in India
RE: Revised Estimates; BE: Budget EstimatesData source: Demand for Grants (2012-13, to 2015-16), Various Ministries, Government of India.
Figure 5 Trend percentage of underutilisation of allocated fundfor NRHM interventions32
100.0
80.0
60.0
40.0
20.0
0.0% unspent in 2011-12 %unspent in 2012-13 %unspent in 2013-14
Data source: Demand for Grants (2012-13, to 2015-16), Various Ministries, Government of India,Government of Madhya Pradesh, Government of Bihar.
7.32
3.55
2.572.05
1.50
5.37
4.31
4.31
100.0
18.0
96.2
16.823.8
43.5
0.0 0.0
3.05
National CMAMconsultation organisedby FLAIR and Save theChildren, New Delhi
FLA
IR, I
ndia
, 201
4

87
. . . . . . . . . . . . . . . . . . . . . . . . . . . . . . . . . . . . . . . . . . . . . . . . . . . . . . . . . . . . . . . . . . . . . . . . . . . . . . . . . . . . . . . . . . . . . . . . . . . . . . . . . . . . . . . . . . . . . . . . . . . . . . . . . . . . . . .
. . . . . . . . . . . . . . . . . . . . . . . . . . . . . . . . . . . . . . . . . . . . . . . . . . . . . . . . . . . . . . . . . . . . . . . . . . . . . . . . . . . . . . . . . . . . . . . . . . . . . . . . . . . . . . . . . . . . . . . . . . . . . . . . . . . . . . .
Views
Strength in Numbers By Saul Guerrero
Saul Guerrero is the Director of Operations at Action Against HungerUK. He has been working in acute malnutrition policy and practicesince 2003. Prior to joining Action Against Hunger, he worked forValid International in the research and development of CMAM,supporting the pilot and roll out in over 15 countries in Africa andAsia. He is a co-founder of the Coverage Monitoring Network (CMN)and currently oversees the implementation of multiple information
and knowledge management initiatives in nutrition and the wider humanitarian sector.
What is the real burden of acutemalnutrition worldwide? Howmuch funding currently goes toacute malnutrition? How much
would it cost to treat acute malnutrition at scale?How many children die from acute malnutritionevery year? Which countries have made thegreatest progress in providing treatment to chil-dren suffering from acute malnutrition in thelast decade?
ese questions are essential to launch, co-ordinate and monitor any large-scale effort totackle acute malnutrition. Yet, these questionsare difficult or impossible to answer at present.
ere are many questions about acutemalnutrition and not enough answers.
Our efforts to scale-up nutrition and to influenceglobal debates require that we are able to addressthese questions with confidence. But it also re-quires that we are in a position to address newand emerging strategic and tactical questionsabout how we tackle the problem of acute mal-nutrition at scale.
At present, some of the answers can be foundin the myriad of initiatives that exist; UNICEF,WFP, GAIN and the Global Nutrition Reporthave all contributed a wealth of data and infor-mation on acute malnutrition. eir initiativesand those of others are providing crucial insightsand analysis that take us far beyond where wewere a mere decade ago.
Global nutrition information initiativesdealing with acute malnutrition are nottaking us far enough.
However, current initiatives are not takingus far enough because they provide answers butdo not empower us to ask our own questions.Without access to the data behind these reportsand initiatives, gaps remain unclear and we areunable to aggregate data to deliver the kind ofcomparative analysis (let alone the data mining)that we can and should be doing. ere arethree commonly cited, but oen misunderstoodreasons.
e first is ownership. Who owns nutrition in-formation? National Governments? United Na-tions (UN) agencies? e agencies that generatethe data? Many international donors explicitlystate that data generated with tax-payers money
belongs to the public. And yet it is not, in partbecause we – the people – do not demand thatdata are released. Today it is virtually impossibleto access the existing datasets that stipulate theburden of acute malnutrition or the performanceof services treating it at national level withoutentering into (oen complicated) agreementsabout its use. ese agreements act as a barrierto critical and participatory analysis and thereis little empirical evidence to suggest that theyare needed. We have a lot more power to decidehow data are used than we realise and we needto exercise that power.
e second is risk aversion. How can the misuseof nutrition information be avoided? Acute mal-nutrition is a political issue and data tells itsown story about the success of public healthpolicy and practice. National governments andother nutrition stakeholders are understandablyconcerned about the risks involved in full datadisclosure. But are we working with them toadopt a more open and transparent stance,driven by constructive efforts to improve pro-gramming? Our own experience in collectingand sharing national level data (including thecoverage data from Mali used in our latest articlepublished in issue 49 of Field Exchange1) showsthat national authorities may be more open tosharing (potentially sensitive) data than we aresupporting them to be.
e third is leadership. Who should leadglobal efforts to aggregate and facilitate accessto information on acute malnutrition? e UNagencies (UNICEF, WHO, WFP, UNHCR) havea delegated responsibility. But are we - the part-ners, advisors and donors - supporting and en-couraging them to do so? e emphasis onmandates and responsibilities has not been usedto empower them, but instead has, more oenthan not, been used to justify inaction on thepart of those of us who can play a more definingrole. We can all do a lot more to lead this processthan we have done to date.
All of these elements have shaped accessto information on acute malnutrition inthe past, but they should not define howthis information is managed and used inthe future.
Over the past few years, Action AgainstHunger has collaborated with a wide range ofnutrition stakeholders worldwide to implement
nutrition information initiatives that have openlybut responsibly shared data on acute malnutrition.Our experience has demonstrated that nutritionstakeholders – from governments, to UN agenciesto non-governmental organisations (NGOs) –are ready to share and work in a collaborativemanner. e inter-agency collaboration to esti-mate the burden of kwashiorkor (Putting Kwa-shiorkor on the Map2) has shown that this kindof collaboration and data-sharing can be achievedacross multiple agencies if the objective is clearlydefined and shared. Similarly, the collaborationbetween Action Against Hunger, UNICEF, Min-istry of Health (MoH), Children’s InvestmentFund Foundation (CIFF) and other partners inNigeria (described in this issue) proves thatgreater openness, far from proving detrimental,has actually catalysed discussions (and increasedfunding) for a new generation of nutrition ini-tiatives designed to improve performance andscale-up efforts.
e time has come to set acute malnu-trition data free.
Freeing data on acute malnutrition requiresa series of changes, but above all, it requires aspace that frees what is already there. We needan inter-agency initiative to aggregate acutemalnutrition data on a scale never before seen;an openly available, non-proprietary space whereinformation on acute malnutrition can be ac-cessed and used by all. A platform founded onfundamental commitments to improve:1. Our understanding of the magnitude and
scale of the problem of acute malnutrition;2. e quality and standardisation of informa-
tion on acute malnutrition, and; 3. Access and utilisation of information on
acute malnutrition.
We need to deliver something that carefullycomplements existing initiatives and platformsrather than undermine them. We can turn thisambitious vision into a reality, right here, rightnow. But to do so we need to recognise that ourstrength will be in numbers, that our successwill depend on our ability to join3 with othersand rally the nutrition community to this cause.We are willing to take a first step and transferall acute malnutrition information currentlymanaged by Action Against Hunger UK to thisinitiative effective immediately.
Who’s next?
If you are interested, contact: Saul Guerrero,email: [email protected]
1 Sophie Woodhead, Jose Luis Alvarez Moran, Anne Leavens, Modibo Traore, Anna Horner, Saul Guerrero. Measuring coverage at the national level in Mali. Field Exchange 49.March 2015. p85- 89 online edition.
2 http://www.cmamforum.org/Pool/Resources/Putting-kwashiorkor-on-the-map-CMAM-Forum-2013.pdfhttp://www.cmamforum.org/Pool/Resources/Putting-Kwashiorkor-on-the-Map-Phase-Two-Information-Sheet-Nov-2014.pdf
3 MSF has recently introduced a new policy of sharing humanitarian medical data. For more information about their policy see: http://journals.plos.org/plosmedicine/ article?id=10.1371/journal.pmed.1001562

. . . . . . . . . . . . . . . . . . . . . . . . . . . . . . . . . . . . . . . . . . . . . . . . . . . . . . . . . . . . . . . . . . . . . . . . . . . . . . . . . . . . . . . . . . . . . . . . . . . . . . . . . . . . . . . . . . . . . . . . . . . . . . . . . . . . . . .
菀菀
Views
By Jan Eijkenaar
Jan Eijkenaar has beenECHO’s TechnicalAssistant in support ofa resilience approachand the roll out of theAGIR Alliance fromSeptember 2012 to
April 2015, based in Dakar. This followed asix-year assignment for the establishmentand coordination of ECHO’s Sahel Plan inresponse to food and nutritional insecurityin the West Africa Sahel region. An engineerby training, he has worked in humanitarianemergency aid from the late 1980’s and asan independent evaluator, mainly on theAfrican continent. His expertise and interestcovers project and programme design andM&E, strategy and policy work on earlyresponse planning, nutrition security andresilience as well as promoting synergiesbetween humanitarian aid, developmentwork and governance.
Sincere thanks and gratitude to all the greatpersons and professionals who continue tocontribute so much to nutrition care,innovation and equitable access toadequate basic services - fundamental tothe notion of resilience and the success ofAGIR - in the communities and generouslyacross the sectors at all levels in the WestAfrica Sahel region. The insight and supportof so many ECHO colleagues, partners andcounterparts have been invaluable. Thisarticle reflects the professional experienceand opinion of the author and notnecessarily that of the EuropeanCommission.
The 2012 Sahel crisis andAGIR’s early beginnings e Global Alliance for Resilience Initiative(AGIR) is still in its relative infancy; launchedin Ouagadougou in 2012, it is expected torun over 20 years until 2032. Yet it has alreadyachieved much. It marks the first commonunderstanding of the persistent and profoundcauses of vulnerability in the Sahel and WestAfrica region. It is a political recognition bythe region and the world that fundamentaland long lasting measures must be put inplace to benefit this highly at risk populationaffected by food and nutrition insecurity.AGIR is framed in terms of ‘resilience building’and sets an ambitious political target of ‘zerohunger’.
In a region facing enormous challenges,including the probable doubling of the WestAfrica Sahel population over the next 20 to25 years from the current 370 million, andstaggering malnutrition prevalence that maypermanently affect up to half of the futuregeneration, AGIR is an essential undertaking.Every year in the Sahel, since at least 2012,some 20 million people face serious to extremefood and nutrition insecurity and around 1.5million children1 under the age of five yearsare expected to be admitted to severe acutemalnutrition (SAM) treatment programmes.
Heightened interest in the concept of ‘re-silience’ for the Sahel region of West Africareally began following a field mission to Nigerand Chad that ECHO2 organised for the EUCommissioner for Humanitarian Aid, Kristali-na Georgieva, in January 2012. e severefood and nutrition crisis in the Horn of Africathroughout 2011 was beginning to abate.African leaders at the September 2011 NairobiSummit were calling for a fundamental changein the approach to responding to these severerecurring crises. Key international actors, in-cluding the European Union (EU), USAID,the World Bank and the United Nations (UN),had started to build a high-level initiative.Eventually named SHARE – Supporting Hornof Africa Resilience – it aimed to “close thegap” between relief and development, enhanceresilience and promote long-term solutions.
By late 2011, the food and nutrition securityoutlook for the Sahel and West Africa regionlooked bleak. Even though there was somedisagreement about the likely scale and severityof a 2012 food and nutrition crisis in theSahel, a joint mobilisation plan by ECHOand DG DEVCO3 at the end of 2011 allowedfor the early mobilisation of planning, prepa-rations, pipelines and resources of imple-menting partners and other donors. It led toan unprecedented Sahel regional emergencyresponse of 1.13 billion USD by the end of2012.
With both the shadow of the 2011 crisisand the Nairobi call for building resilience -rather than investing in costly repeated relief- still fresh in her mind, the EU Commissionerfocussed on an early large crisis response andon generating political interest in a resiliencebuilding approach for the West African Sahelregion. By that time, ECHO had enteredinto its 6th annual regional Sahel Plan tocombat malnutrition aimed at saving lives atscale and lobbying for a durable reductionand prevention of malnutrition.
ECHO’s approach, activities, partner-net-work and expertise that it had built up andestablished since the Niger nutrition emergencyof 2005 provided a platform and opportunityto explore the resilience concept for the Sahelregion. Meanwhile DEVCO, who were alreadyinvolved in a resilience approach in the Horn,extended its interest in applying a ‘resiliencelens’ to the West Africa Sahel region. Mean-while, the first signs of preparation for the11th European Development Funds4 (EDF)were on the horizon. e timing was thereforeright for ECHO’s continued efforts to lobbyfor a Linking Relief to Rehabilitation andDevelopment (LRRD) approach so that pre-vention and treatment of malnutrition atscale would be funded by development co-operation and national government budgets.is is similar to the ‘resilience’ approachwith its inherent goal of eventual phase-outand exit from fluctuating humanitarian fundingthat had done little to address structuralchronic crisis needs.
In effect, the energy and interest behindthe regional food and nutrition Sahel responseconverged, resulting in preparations for theset-up of a resilience initiative in West Africa.However, the particularly strong regionallinks, interdependencies and economic inte-gration in West Africa compared to EastAfrica were very clear from the outset. epresence and role of three West African re-gional organisations (ROs) - CILSS (PermanentInterstate Committee for Drought Controlin the Sahel), ECOWAS (Economic Commu-nity Of West African States) and WAEMU(West African Economic and Monetary Union)- was a significant factor in facilitating a re-silience approach in the region.
Nutrition,resilienceand thegenesis of AGIR
1 This is a planning figure that is regularly compiled by theUNICEF WCARO Dakar Regional Office using data provided by its regional network of national nutritionists,government services and international agencies. The figure is based on a combination of prevalence figures, population estimates, incidence estimates and coverage realities/ assumptions.
2 European Commission's Directorate-General for Humanitarian Aid and Civil Protection
3 European Commission's Directorate-General for International Cooperation and Development
4 The EDF is the EU's main instrument for providing development aid to African, Caribbean and Pacific (ACP) countries and to overseas countries and territories (OCTs).
Women attend a SAM treatmentcentre in Jigawa State, N-Nigeria
FLA
IR, I
ndia
, 201
4
. . . . . . . . . . . . . . . . . . . . . . . . . . . . . . . . . . . . . . . . . . . . . . . . . . . . . . . . . . . . . . . . . . . . . . . . . . . . . . . . . . . .

89
. . . . . . . . . . . . . . . . . . . . . . . . . . . . . . . . . . . . . . . . . . . . . . . . . . . . . . . . . . . . . . . . . . . . . . . . . . . . . . . . . . . . . . . . . . . . . . . . . . . . . . . . . . . . . . . . . . . . . . . . . . . . . . . . . . . . . . .
. . . . . . . . . . . . . . . . . . . . . . . . . . . . . . . . . . . . . . . . . . . . . . . . . . . . . . . . . . . . . . . . . . . . . . . . . . . . . . . . . . . . . . . . . . . . . . . . . . . . . . . . . . . . . . . . . . . . . . . . . . . . . . . . . . . . . . .
Views
With the 2012 crisis in full swing, the hunger-gap approaching and public and political interesthigh, swi guidance was needed to establish afeasible, robust, politically supported AGIR inthe region. e aspiration was also to avoid an-other short-lived, external, donor-driven and ul-timately unsustainable ‘big plan’. e Sahel andWest Africa Club (SWAC/OECD), part of theOrganisation for Economic Co-Operation andDevelopment (OECD) in Paris and created in1976 as an international solidarity group for theWest Africa Sahel, was willing and able to brokerpolitical acceptance and commitment by theregion in a short time. e three RO’s thereforeagreed to take the lead as the concept graduallytook shape in the form of an Alliance - the‘Alliance Globale pour l'Initiative Résilience’ -AGIR. At that point, important questions remainedabout the nature of AGIR and how to set it up.
The making of AGIRAGIR was formally presented at a high levelmeeting organised by the EU Commissioner inBrussels on 18 June 2012. At that event, anagreement was reached to launch a multi-stake-holder platform led by CILSS, ECOWAS andWAEMU for the West Africa Sahel region calledAGIR. e principle aim of AGIR was to pushresilience higher up the political agenda and to“encourage greater donor support for sustainableaction to strengthen the resilience of the mostvulnerable populations”. A series of meetingsand outputs were to be achieved before the endof that year, in particular the formulation of a Regional Road Map for AGIR.
e first AGIR meeting of the three RO’stook place in Abidjan on 10 September 2012.e meeting resulted in an official joint positionpaper on how to approach resilience as part ofthe regional process of formulating the directionand content of AGIR. e initial vision was toprioritise agricultural production and the de-velopment of regional and national agriculturalpolicies. is single-sector focus was a logical
continuation of regional food-security prioritiesthat preceded AGIR emanating from the Regionaland National Agriculture Investment Plans thatare rooted in NEPAD’s5 Comprehensive AfricaAgriculture Development Programme (CAADP,2003) and the regions own subsequent agriculturalpolicy ECOWAP (2005).
Although not really changing the RO’s ownstrong preference for a dominant agriculturefocused orientation of AGIR, the series of extensiveconsultations with all actors – including civilsociety organisations, the private sector and in-ternational non-governmental organisations(INGO’s) - that followed in October and Novemberthat year proved that the process and group ofstakeholders as a whole was strong enough toresist the imposition of a single viewpoint.
e first really decisive meeting involvedAGIR’s Senior Expert Group (SEG) that tookplace on 7 and 8 November 2012 in Paris atSWAC/OECD. e EU’s delegation, which isthe lead donor for the international communityin support of AGIR, emphasised the need for apolitical vision and approach to address thestructural drivers of food and nutrition crisesfocussing on very poor households. With con-siderable support from other donors (USAID),the UN (notably UNICEF), civil society organ-isations and INGO’s, the meeting managed toget social transfers, livelihood support and socialprotection (Pillar 1) as well as nutrition andhealthcare (Pillar 2) adopted as two of the fourstrategic objectives of AGIR for building resilience.Equally important was consensus about the pri-ority target groups of AGIR. ese were identifiedas groups who lacked the most basic resourcesfor the protection of their lives and livelihoodsand those most at risk of impaired personal de-velopment and capacity to be resilient to futurethreats of malnutrition and associated morbidity.AGIR’s targeting of the latter category, all childrenunder the age of 5 years and in particular theunder 2’s and all pregnant and breastfeeding
women, was recognition of the view that aperson’s health and capacity to learn, developand be resilient starts from conception. It alsoreinforced a formal link with the 1,000-Day Ini-tiative and Scaling Up Nutrition (SUN) Movement.
Resilience priorities andbenchmarks A first dra Regional Road Map was quicklywritten-up by SWAC/OECD and circulated inorder to inform the core principles of the politicalJoint Statement of AGIR. At this point therewas little time le before the official launch ofthe AGIR scheduled to take place in Oua-gadougou at the 28th RPCA (Food Crisis Pre-vention Network) meeting in early December.is high level meeting was to be attended byrepresentatives from the West Africa region,several African and Western countries, the EU,the USA, the UN and other international andregional organisations.
e next decisive moment occurred on theevening of the draing of the final text beforethe launch of AGIR on 6 December 2012, whena small team including the EU, USAID, France,UNICEF, WFP and UN OCHA, as well as thethree RO’s and SWAC/OECD, finalised AGIR’sformal Joint Statement of principles. is politicaldeclaration by the region still lacked quantitativetargets for measuring AGIR’s success. Pressedfor an answer and just having signed a commit-ment to start working towards achieving ‘ZeroHunger’ in the West Africa region, ECOWASproposed ‘Zero Hunger in 20 Years’ as the target.Appropriately ambitious and matching the levelof urgency in the Sahel, this was adopted asAGIR’s main stated political purpose. islaunched the Alliance, which in the words ofSWAC/OECD, “is neither an initiative nor apolicy. It is a policy tool aimed at channellingefforts of regional and international stakeholderstowards a common results framework”.
The bulk of the problem is where the very poor, under fives and pregnant andbreastfeeding women overlap
Richest
TREATMENTPregnant womenand under fives
PREVENTION
Socio-economictargeting of thepoorest / most
vulnerable groups
Poorest
‘Resilience’ in the Sahel first concerns the very young and unborn and their mothers, those inhouseholds and communities with very poor livelihoods and in particular where there isoverlap of these groups.
CILSS: Permanent Interstate Committee for Drought Control in the Sahel;CEDEAO or ECOWAS: Economic Community Of West African States;UEMOA or WAEMU: West African Economic and Monetary Union;SWAC/OECD: Sahel and West Africa Club, part of the Organisation forEconomic Cooperation and Development; RPCA: Food Crisis PreventionNetwork (organised and facilitated by SWAC twice a year and since 2013permanently hosting the official AGIR meetings); JRC: Joint Research Centre(an EU service involved in scientific and analysis work as well as mapping,including Food Security and livelihoods analysis in developing countries).
5 New Partnership for Africa's Development, see http://www.nepad.org

90
. . . . . . . . . . . . . . . . . . . . . . . . . . . . . . . . . . . . . . . . . . . . . . . . . . . . . . . . . . . . . . . . . . . . . . . . . . . . . . . . . . . . . . . . . . . . . . . . . . . . . . . . . . . . . . . . . . . . . . . . . . . . . . . . . . . . . . .
. . . . . . . . . . . . . . . . . . . . . . . . . . . . . . . . . . . . . . . . . . . . . . . . . . . . . . . . . . . . . . . . . . . . . . . . . . . . . . . . . . . . . . . . . . . . . . . . . . . . . . . . . . . . . . . . . . . . . . . . . . . . . . . . . . . . . . .
Views
e last vital element to finalise the AGIRRegional Roadmap was identifying and definingindicators for its overall aim and the four un-derpinning pillars as an example of a measure-ment framework and as a reference for all sub-sequent national AGIR roadmaps (now calledNational Resilience Priorities (NRP-AGIR, orPRP-AGIR in the French acronym).
Held in Lomé in March 2013, just someweeks before the 2013 RPCA in Paris and adop-tion of the AGIR Regional Roadmap, bothECHO and DEVCO were part of a small draingteam led by the three RO’s and SWAC. Withinput from the UNICEF expert, vital nutritionindicators and benchmarks were included asmain success criteria (Result-Impact Indicators)notably for the Overall Objective and for the1st and 2nd Pillars, in the document (see Tables1, 2 and 3).
e 20% chronic malnutrition prevalenceceiling is a critical benchmark (overall and Pillar2) as is the 5% global acute malnutrition (GAM)rate ceiling throughout the year (Pillar 2). An-other key impact indicator is the one describinga significant increase in the proportion of vul-nerable populations with a balanced diet, espe-cially during the lean periods and periods ofprice volatility (see Pillar 1, Table 2).
At this point, AGIR had become equippedwith a workable toolbox, a balanced set of fourstrategic objectives and a clear target population.
It had ambitious political aims over a realistictimeframe that matched the immense food andnutrition security challenges faced by the region.It also had a reference and measurement frame-work. All of this had been accomplished in lessthan 10 months. It represented a major shifrom the previous dominant view and prioritygiven to food production and availability, addingvital dimensions of household economy, mal-nutrition prevention and the priority targetgroups for building resilience and reducing
chronic and acute crisis needs. e AGIR Alliancerepresents an unprecedented opportunity forthe Sahel and West Africa region. e proposedprocess, principles and parameters to get AGIRimplemented and eventually obtain results andachieve impact is a major innovation for the re-gion. It now remains of paramount importancethat all 4 AGIR Pillars receive equal and well-coordinated support.
Challenges aheadAt the AGIR Regional Roadmap’s adoption cer-emony at SWAC/OECD in Paris early April2013, DEVCO announced an allocation of atleast 1.5 billion Euro of 11th EDF Funds for re-silience building by way of a “Food and NutritionSecurity and Durable Agriculture” sector focusthat will be applied to all West Africa Sahelcountries. Even though the modality of EU de-velopment cooperation is currently changingtowards one of broader ‘state building contracts‘ rather than more precise sector support, theway that these funds are used for the benefit ofthe NRP-AGIR will be a measure of the nationalownership of AGIR.
is demonstrates how it was hoped AGIRwould prove useful, i.e. by ensuring the utilisationof existing funds and programmes in such away as to orient them to specific objectives andtarget groups. AGIR is effectively an Alliancethat aims to focus the work of actors, policies,programmes and initiatives towards buildingresilience in order to achieve impact. AGIRtherefore is not another fund or initiative, it’s afederating principle.
is ambitious undertaking therefore putsan enormous responsibility for coordination onthe shoulders on certain actors, notably AGIR’sinternational donor support group - the Platformof Technical and Financial Partners (PTFP-AGIR) led by the EU - the ROs and the (16 ofthe 17 CILSS/ECOWAS countries’) nationalgovernments that are engaging in AGIR whoare in the process of draing their own budgetedNational Resilience Priorities.
AGIR objectives and performance and impact indicators Table 1
Pillar 1Table 2
Pillar 2Table 3
AGIR has identified four priorities to reach ‘Zero Hunger’. Success depends oncommon analysis for joint action and sffective targeting to eventual adequate scale

91
. . . . . . . . . . . . . . . . . . . . . . . . . . . . . . . . . . . . . . . . . . . . . . . . . . . . . . . . . . . . . . . . . . . . . . . . . . . . . . . . . . . . . . . . . . . . . . . . . . . . . . . . . . . . . . . . . . . . . . . . . . . . . . . . . . . . . . .Views
. . . . . . . . . . . . . . . . . . . . . . . . . . . . . . . . . . . . . . . . . . . . . . . . . . . . . . . . . . .
is is where a main challenge for the success of this stillyoung and fragile Alliance is situated; at the level of national co-ordination. An inclusive process of national dialogue to design,implement, monitor and steer National Resilience Priorities forthe benefit of those persons most at risk and affected by food andnutrition insecurity needs to be driven pro-actively and on a per-manent structural basis. Widely different sectors and ministrieswill need to engage, coordinate, design, plan and implement jointapproaches on all relevant (community, district, province, national,regional, etc.) levels. is is a huge task.
Aware of these immense challenges, the PTFP-AGIR supportgroup confirmed a sterling commitment to AGIR at the occasionof the RPCA meeting of Abidjan in November 2013, in particularto support the crucial national coordination of AGIR. Unfortunately,progress is slow. Few donors have mobilised dedicated expertise‘on the ground’ to support national processes to engage successfullywith a resilience focus.
International political interest in resilience and AGIR seems tobe waning too. For several important international actors, AGIRmay have become just another in a sequence of initiatives withoutan overarching political significance and ambition. Other policypriorities, such as security, terrorism and migration, are gainingmore traction and attention as well. Fortunately, this may notaffect AGIR too greatly as it has been politically anchored in theregion from the outset.
Also unclear is the extent to which development partnersembrace the pro-active culture of a rights-based aid. Such an ap-proach requires a high level of mutual accountability, as declaredin Paris in 2005, and a need to address the deep inequalities thatunderpin a lack of resilience. ere is also a question over donors’internal coherence with regard to their own inter-sector coordinationand the thrust of their wider development policies that should atthe very least ‘do no harm’ to AGIR’s target groups. One new foodand nutrition security programme supported by several PTFP-AGIR members is raising concerns over the increasing privatesector control of food and agricultural systems that may negativelyimpact on poor rural agriculture communities .
All information on AGIR is regularly updated on its official web-site hosted and managed by SWAC/OECD athttp://www.oecd.org/site/rpca/agir/
More details on the progress of National Resilience Priorities,on-going in almost all countries of the West Africa Sahel region,is posted at http://www.oecd.org/site/rpca/agir/nrp-agir.htm
It is still very early to find examples that demonstrate the impact of activitiesincluded in the PRP-AGIR process. Niger’s PRP-AGIR, formally adopted in March2015 as the first National Resilience Priorities document in the region, is integratedinto Niger’s national 3N initiative “Nigériens feed Nigeriens" to further strengthen3N’s resilience dimension. There is a perfect match between the AGIR roadmapand 3N Initiative particularly in terms of the fundamentals: vision, aim andobjectives, pillars, targets and modes of implementation approaches. The 3NInitiative is therefore an appropriate framework for the implementation of Niger’sNRP-AGIR ambitions.
With this perspective in mind, the "Communes de Convergence" (‘comingtogether in local municipalities’) approach was initiated in early 2014 under the3N Initiative. Designed and launched by 3N’s High Commissioner, with thesupport of international Technical and Financial Partners (PTF in French) andnotably several UN agencies, it is considered a to be a first comprehensivepractical application of Niger’s NRP-AGIR. The approach aims to embody 3N’scardinal principle that the municipality must be the entry-point for action, fromidentification, planning and implementation to monitoring, completion andevaluation of interventions. The Communes de Convergence approach thus alsoreinforces the process of decentralisation of governance, given that decisionsmade closer to where people live are more in tune with their realities andconcerns.
Communes de Convergence involves communities, actively and voluntarily fromthe outset, ensuring that local development priorities contribute to the strength-ening of the resilience of vulnerable groups by design and that the MunicipalDevelopment Plan (PDC in French) will be aligned to that effect. Priorities includeimproving agro, forestry, pastoral and fisheries productivity and increasing accessto basic social services, nutrition, essential foods, etc.
Thirty-five municipalities have been identified so far for progressive deploymentof an initial pilot phase of three years. The goal is to eventually cover all 255 mu-nicipalities of Niger. Studies and baseline surveys, as well as a mapping of thepresence and capacity of a variety of potential stakeholders everywhere in Niger,were among the criteria for selecting the first batch of municipalities. This jointanalysis process involved a series of workshops with the participation of all keystakeholders, including government services at all levels and those involved inimplementing projects and programmes in the area.
Out of the 14 key indicators that inform the baseline survey, at least eightdirectly relate to nutrition and nutrition security. The ambition is to achieve fullmulti-sector coverage by the collective of actors in the area, as this is considereda prerequisite for the construction of feasible and successful alternatives torecurrent crises, food shortages, cyclical indebtedness of many households, mal-nutrition and dependencies on short-term aid.
The main working principles include (i) a full effective ownership by themunicipality and a budget and capacity available to perform these tasks, (ii) theproper identification of gaps at local governance and technical service levelsand the initiative to propose and find solutions, (iii) effective coordination,monitoring and evaluation of actions, of planned investments in the communityand their articulation to cover all sectors in synergy, (iv) the inclusion of cross-cutting issues - including gender, population and social cohesion – by all stake-holders, as well as (v) the promotion of a practice of effective multisector imple-mentation by and for all actors.
The Communes de Convergence approach is as much a consultation framework,offering space for dialogue and information and experience exchange in themunicipality, as it is a framework for mobilising the necessary funding for theimplementation of the selected activities. Backed by strong contributions fromthe municipal budget, the other part of the funding is sought from PTF’s and im-plementing organisations and their programmes underway in the area. Chairedby the mayor, the framework includes state and non-state actors, project andprogramme representatives and the municipal councillors.
With thanks to Mamoudou Hassane, HC3N and AGIR, Niger.
AGIR in practice: the Communes de Convergence approach in Niger
A man showering his plot ofonions on the Dogon Plateau
Jan
Eijk
enaa
r, M
ali,
2008

92
. . . . . . . . . . . . . . . . . . . . . . . . . . . . . . . . . . . . . . . . . . . . . . . . . . . . . . . . . . . . . . . . . . . . . . . . . . . . . . . . . . . . . . . . . . . . . . . . . . . . . . . . . . . . . . . . . . . . . . . . . . . . . . . . . . . . . . .
. . . . . . . . . . . . . . . . . . . . . . . . . . . . . . . . . . . . . . . . . . . . . . . . . . . . . . . . . . . . . . . . . . . . . . . . . . . . . . . . . . . . . . . . . . . . . . . . . . . . . . . . . . . . . . . . . . . . . . . . . . . . . . . . . . . . . . .
Views
By Andy Featherstone
Andy Featherstone is an independent consultant withover 20-years of experience in strategic andoperational management of internationalprogramme, policy and research work at country,regional and headquarters level. Having spent 15years working for NGOs, including a decade with
From Kigali to Istanbul the long way round:personal reflections on 20 years ofhumanitarian accountability
In less than a year, humanitarian leaders from across the world will meet in Istanbul todiscuss the state of the system during the World Humanitarian Summit. Vying for space on apacked agenda will be the vexed issue of how agencies can better account for their actions tothe people they work with. While it took one of the greatest crises in living memory to placehumanitarian accountability on the collective agenda, the journey since then has been farfrom easy. The account below offers some personal reflections on the progress and pitfallsthat have been encountered along the way.
Accountability to affected peoplehas come a long way since itgrabbed the headlines as a con-sequence of the criticisms made
in the Joint Evaluation of Emergency Assis-tance to Rwanda (JEEAR); while the un-precedented nature of the catastrophe justifieda similarly unprecedented scale of response,the mix of UN agencies, NGO’s faith-basedorganisations and do-gooders offered a com-plex mosaic of assistance, the effectivenessof which was patchy. As one of many peoplethat worked in the region, I witnessed someextraordinary efforts to save lives and provideassistance to those affected by the violence,but I also recognise that the diversity in theresponse presented challenges and the lackof collective standards for the provision ofassistance meant that some of those in needfaced a lottery.
e years that followed witnessed con-siderable reflection from within the sector
which resulted in some important milestonessuch as the launching of the Sphere projectand several years later, the creation of theHumanitarian Accountability Project (HAP),mandated to bring a voice to people receivingassistance. As the team leader for the 2002HAP field trial in Afghanistan, I was givena broad mandate to spend three-months inHerat to work with agencies based there topilot a range of accountability initiatives.e trial was met with a lot of enthusiasmalthough when it documented negative feed-back from displaced people who had beenprovided with little information and unevenassistance, some of the enthusiasm was re-placed by concern about HAP’s legitimacyand authority; “who are these people speakingwith our project participants and raisingconcerns? How dare they interfere with ourprogramme!” A range of different approachesto strengthen accountability were tested andthe findings from the field trial contributedto the decision taken in Copenhagen in
2003 to formally launch the HumanitarianAccountability Partnership International.
Two-years later in 2005, the package ofmeasures designed to strengthen the effec-tiveness of humanitarian response by ensuringgreater predictability, accountability andpartnership was launched; the ‘clusters’ thatwere rolled out as part of the reforms andwhich quickly became a part of the human-itarian landscape placed renewed emphasison the coordination of humanitarian assis-tance, but humanitarian reform was silenton issues of accountability to affected peoplewhich remained a niche issue, albeit onethat was gaining support from a growingcoalition of NGOs.
Despite humanitarian accountability beingreliant on the passion and commitment of afew individuals and a handful of agencies,there was a rapid growth in approaches,tools and resources used to strengthen theprovision of information and the participation
Oxfam, Andy has spent the last seven years working withpartners across the humanitarian sector to assist them tolearn from their work and improve their practice. Andy hasa passion for strengthening the accountability of thehumanitarian system to those it seeks to assist.
Fooding in the Khyberprovince in 2010
Am
jad
Jam
al/W
FP, P
akis
tan,
201
0

93
. . . . . . . . . . . . . . . . . . . . . . . . . . . . . . . . . . . . . . . . . . . . . . . . . . . . . . . . . . . . . . . . . . . . . . . . . . . . . . . . . . . . . . . . . . . . . . . . . . . . . . . . . . . . . . . . . . . . . . . . . . . . . . . . . . . . . . .
. . . . . . . . . . . . . . . . . . . . . . . . . . . . . . . . . . . . . . . . . . . . . . . . . . . . . . . . . . . . . . . . . . . . . . . . . . . . . . . . . . . . . . . . . . . . . . . . . . . . . . . . . . . . . . . . . . . . . . . . . . . . . . . . . . . . . . .
Views
of affected communities and to elicit andrespond to their feedback. Undertaking anevaluation of an NGO response to CycloneNargis which swept across Myanmar’s Ir-rawaddy Delta in 2008 killing in excess of130,000 people, I was struck by the zealwhich existed within the implementingagency for us to engage with affected people;accountability was made a central pillar ofthe evaluation, significant investment wasmade in facilitating community discussionswith men, women and children, and at theend of the process, a comic strip was producedand disseminated across the Delta to feedbackon the findings.
However, broader uptake across the sectorcontinued to be inconsistent and complexcrises in fragile states highlighted the limitedcapacity that existed to replicate accountabilitypractices in contexts where remote man-agement was necessary such as in the dis-placement crisis in the Khyber PakhtunkhwaProvince of Pakistan in 2009 where thedeficit in the quality of assistance was height-ened by the anonymity of those that providedit. Humanitarian aid had been stripped ofits face, its voice and its ears as agenciesstruggled to balance the depth of the needwith the threat of violence. Rather thanviewing disaster-affected communities aspartners in the humanitarian endeavourthey were oen treated as passive recipients.For humanitarian assistance to be acceptedand understood there was a need to strength-en community engagement in the designand delivery of projects, rather than merelyhanding out packages from the back oftrucks. Humanitarian accountability shouldhave been seen as a means of strengtheningthe response rather than a complicated en-cumbrance.
e challenge of meeting accountabilitycommitments to communities was furthertested during the 2011-12 response to theHorn of Africa food crisis. Despite the im-
plementation complexities agencies faced,it did prompt concerted efforts to explorehow humanitarian accountability commit-ments could be achieved in remotely managedprogrammes which resulted in some inno-vative practice. One agency I evaluated hadestablished a web of complementary ap-proaches to communicate with and listen tothose receiving assistance which included atelephone hotline, third party monitoring, arigorous partner reporting regime and sitevisits when security and access permitted.ere were doubtless gaps in coverage andmissing voices, but it was encouraging toobserve the steps that had been taken to re-move some of the distance between thoseproviding assistance and those receiving it.
While there was an acknowledgementthat humanitarian accountability was the‘right thing to do’, as well as being a moralobligation, there was a concern that toolittle was known about its contribution tothe success of projects. ere was a feelingthat there must be a link between the two,but the evidence was weak. With a smallbudget for the development of a methodology
and two pilot studies with communities inKenya and Myanmar in 2013, I spent severalmonths seeking to fill this gap by assessingthe contribution that agency engagementwith communities made to the relevance,effectiveness, efficiency and sustainabilityof their projects. e results were compelling;a modest investment by agencies in sharinginformation, involving project participantsin the design and delivery of programmesand ensuring a means to listen to and acton their feedback brought a significantreturn, not only in terms of participant sat-isfaction and engagement in the project, butalso in far more tangible ways linked moreclosely to the effectiveness of developmentand humanitarian projects. Accountabilityto affected people wasn’t just an obligation,it also improved project performance.
So when the Transformative Agenda wasunveiled, the inclusion of accountability toaffected people or AAP was met with muchenthusiasm. e emphasis placed on ac-countability has brought more resourcesand a more ‘corporate’ face to efforts tocommunicate with communities and to ac-count to affected people, but has it strength-ened community engagement? e recentlypublished inter-agency study of AAP in thePhilippines Typhoon Haiyan response sug-gests that there is still room for improvement;by focusing on agency agendas rather thaneliciting broader community concerns andby an over-reliance on a mechanistic approachto ‘being accountable’ rather than engagingwith communities, agency efforts might begetting in the way of their ability to hearpeople’s most important concerns. With theWorld Humanitarian Summit less than ayear away, there is an important opportunityfor the sector to reflect on these and otherlessons in order to offer a compelling visionof what needs to change to fully and finallyachieve the ambitions outlined in the JEEAR20 years ago.
Dolo Ado camp, Ethiopia, during the2011/12 Horn of Africa crisis
Jiro
Ose
/WFP
, Eth
iopi
a, 2
012
Cyclone Nargis impact inMyanmar in 2012
Paul
Wya
tt/W
FP, M
yanm
ar, 2
012

94
. . . . . . . . . . . . . . . . . . . . . . . . . . . . . . . . . . . . . . . . . . . . . . . . . . . . . . . . . . . . . . . . . . . . . . . . . . . . . . . . . . . . . . . . . . . . . . . . . . . . . . . . . . . . . . . . . . . . . . . . . . . . . . . . . . . . . . .
Dear ENN,
If there is one thing that we have learntfrom the current Ebola virus disease (EVD)outbreak it is that regardless of infectionstatus, Ebola comes bringing bad times formothers and infants. More than a year intothe EVD emergency that has affected mainlyGuinea, Liberia and Sierra Leone, I thoughtit would be of interest to review some of theexperiences and issues related to work withinEbola Treatment Centres (ETCs) and the im-pact of the disease at a wider communitylevel.
Since the beginning of the crisis, manycolleagues in the nutrition sector have triedto answer difficult questions on en-net1: Isthe virus transmitted via breastmilk? Whenit became apparent that it was, the next ques-tion was for how long was the virus trans-mittable aer recovery? Evidence was con-tinuously being generated and shared in acontext that was changing continually itself.Recommendations were oen obsolete shortlyaer becoming official guidelines. In No-vember 2014, the National Viral HaemorrhagicFever (VHF) pocket guidelines, developedby WHO, took on the recommendationsfrom the Infant Feeding and Ebola InterimGuidance produced by several expert agencies2
a month earlier, recommending the contin-uation of breastfeeding when both motherand infant were confirmed EVD cases. Breast-feeding “outweighs any possible benefits ofreplacement feeding. It is therefore recom-mended the infant remains with the motherand is breastfed…”
However, some non-governmental organ-isations (NGOs) argued that these recom-mendations were wrong and that the repeatre-infection risk was too high. ese organi-sations ensured that in their clinics, allneonates born to Ebola positive mothers, ormothers and infants that tested positive atthe centre, were separated. In these cases, allthe infants were given breast milk substitutes(BMS). Recent email exchanges highlightedthat reports UNICEF received have indicatedthat in a couple of instances, infants andchildren who were not separated from theirmothers had worse outcomes. is has notbeen demonstrated to date with sufficientevidence. If a mother has EVD and theneonate also tests positive, the fear amongstfield workers is that breastfeeding (whichwould likely result in cross-infection) willhave a high probability of aggravating theinfant’s condition, further compounding theproblem. If this is the case, then discontinu-ation of breastfeeding in maternal/infant pos-itive cases may be a sensible approach, despitethe outcome being ultimately the same; thedeath of the neonate.
It has been several months since the pocketguidelines were issued in November 2014.With the epidemic slowing but still dangerous,an updated version of these guidelines willbe published shortly. It is likely finally to in-clude the recommendation to avoid all breast-feeding from the onset of symptoms and touse artificial feeding. ey will also note thata specific period for the virus to disappearfrom breastmilk or semen cannot be calculatedsafely, as demonstrated with the last case inLiberia that was sexually transmitted sixmonths aer the infection source has survivedEbola. e only way to be sure of the safetywindow is to periodically test survivors, al-though this will probably exacerbate the cli-mate of fear and stigmatisation in affectedcommunities.
Few cases of 2 and 3 year old childrensurviving have been recorded, and there havebeen no cases of survival of infants under 6months (I consulted with GOAL, MSF Spain,IMC, and Save the Children in Sierra Leonewho drew upon their regional experiencesin their feedback; I thank for the time andinformation shared). erefore it is currentlyimpossible to obtain any significant baselinedata.
e psychological implications of sepa-rating mother and baby have been discussed,as have the challenges of negotiating withmothers who refused to allow their baby goto another ward and preferred to stay withthem. A partial spontaneous solution hasbeen to engage survivors to care for these in-fants with minimal Personal Protective Equip-ment (PPE), as they were local, eager andcould not be infected with Ebola again. esesurvivors have been a great asset for the careof infants and children in the ETC, and manydecided to stay or returned to help aerfinding reintegration in their own communitiesa challenge due to stigma. ese dilemmasultimately fall within a child protection dis-course and have been tackled differently de-pending on the area. Engaging survivors inchildcare can help the mother to feel moreconfident – her infant is being fed and caredfor by a woman from her community whocan go back and forth in the ward so themother can see her infant; whether mothersin this situation hold and are concerned re-garding misbeliefs and taboos regarding sur-vivors, as witnessed in the general community,is unknown. Further support approachesmust be developed and shared. We are facingmoral/ethical issues every bit as importantas medical ones and there are no easy answers,just hard questions.
e efficacy of alternative infant feedingmethods3 in relation to risk of mother/baby
contamination has been discussed endlesslyby nutrition partners, with the realisationthat there is no safe option for both healthworkers in the ETC and the patients. Feedingutensils and human contact both carry highrisks of contamination. GOAL opted for asyringe with a feeding tube attached to it asthe first choice, considering this to be thesafest way of feeding an infant in these cir-cumstances.
Risks and impact at household and com-munity level are also considerable and perhapsnot given the attention they deserve. Returningsurvivors can infect those in their householdsand communities and the fear of this is long-lasting. Ebola has impacted the way peoplerelate to each other and in turn, behave. Itswider impact on breastfeeding practices willbe felt long aer the outbreak is over, in partdue to the rapidly changing advice that wasdisseminated among the population and alsothe misinformation and taboos that surroundsuch an aggressive disease, which have had anegative impact across the entire populationso that EBF rates have declined.
As one expert shared on en-net4: “Currentunderstanding is that the virus can be trans-mitted by breastfeeding, and in the case ofconfirmed maternal infection, breastfeedingis contraindicated (PAHO, WHO). However,this does not capture the whole problem.Many infections present the same way andthere will be lots of suspected cases that turnout to be something else. ere is a fear thatanxious mothers with these early symptomswill stop breastfeeding and not restart whenthey are confirmed Ebola negative, "in case"it turns out to be Ebola”. Also, pregnancyseems to have an impact on the way thedisease presents itself, with confusing symp-toms or none at all. An asymptomatic motherwould die aer delivering a healthy baby thattests negative but dies of the infection a fewdays later (or even weeks - one infant bornin an MSF centre, whose mother passed away,survived the infection for 19 days). ere isstill much that we do not know about Ebolaand the transmission reservoir for this virus.
Whilst waiting for a vaccine to use atscale, we must acknowledge there is an urgentneed for research to answer key questions
1 http://www.en-net.org/question/1445.aspx2 Guidance produced through informal consultation
involving UNICEF technical advisors at HQ, regional & country levels; WHO Infant and Young Child Feeding and Ebola specialists; CDC Atlanta; Ministry of Health and Social Welfare Liberia; in-country staff working as part of the Ebola response; en-net technical forum respondents and the ENN.
3 Bottle feeding, finger feeding, glove feeding, syringe feeding, etc.
4 http://www.en-net.org/question/1445.aspx
Letters.........................................................................

95
. . . . . . . . . . . . . . . . . . . . . . . . . . . . . . . . . . . . . . . . . . . . . . . . . . . . . . . . . . . . . . . . . . . . . . . . . . . . . . . . . . . . . . . . . . . . . . . . . . . . . . . . . . . . . . . . . . . . . . . . . . . . . . . . . . . . . . .
. . . . . . . . . . . . . . . . . . . . . . . . . . . . . . . . . . . . . . . . . . . . . . . . . . . . . . . . . . . . . . . . . . . . . . . . . . . . . . . . . . . . . . . . . . . . . . . . . . . . . . . . . . . . . . . . . . . . . . . . . . . . . . . . . . . . . . .
Letters
more than one year into the biggest haemor-rhagic fever outbreak in history: • How long do survivors take to become
free of any trace of the virus? How different is it for the various body fluids (sperm, milk, blood…. etc.)?
• How long aer interrupting breastfeedingis it recommended to wait before resum-ing? Is the safest recommendation to terminate breastfeeding permanently?
• Is there an impact on subsequent preg-nancies for survivors? When will it be safe to become pregnant again?
• Does separating the mother and infant when they are both infected make any difference in survival outcomes?
• Does the cross contamination risk out-weigh deprivation from maternal immunisation?
• What support can be provided to a mother who refuses to be separated fromher baby in an ETC? How can separationbe made more bearable for both of them?
• Does the use of infant formula have any impact (positive or negative) on the chances of survival of infants infected with EVD? How does this compare with breastfeeding?
• How different will breastfeeding practicesin the general population be aer the outbreak compared to the pre-outbreak baseline?
• In those with altered breastfeeding prac-tices, what kind of behaviour change approach will be necessary to help the communities, and especially pregnant and breastfeeding women, to overcome the fear and taboos that have arisen fromthis outbreak and how this fear was managed at the time?
I also have to ask myself and colleagues themost ethically challenging question of all;how important is it to dedicate funding toinfected subjects that have no chances ofsurvival? Would it be a better use of resources
to focus on providing assets and psychosocialsupport to the survivors and the rest of theuninfected community who have had to bearincreasing poverty as a result of the outbreak?
is is surely a key question and one thatmerits consideration. A significant criticismof the Ebola response has been that it largelyignored the health and other needs of the re-mainder of the population. is lack of supportcontributed to intra-community tension andconflicts and exacerbated stigma for survivors.e effects of the quarantine are expected tocreate a harsher than usual hunger gap forthose communities that missed the cultivationwindow, whilst the subsequent rise in marketprices of these foods will in turn affect thewider population of the affected countries.
Yours sincerely,Óscar Serrano Oria
Roving Nutrition AdvisorGOAL Ireland
Dear Editors,
I’d like to highlight an issue regarding ex-pired infant formula, prompted by a newsreport in Lebanon . Twenty tons of expiredinfant formula was found near a plantationin Karm Saddeh in the north Lebanon districtof Zghorta. Authorities launched an investi-gation into its source, involving both healthministry officials and the police.
In studying the regulation of infant for-mula, I have consistently failed to discoverwhat happens with outdated formula. Whatis supposed to happen? What actually doeshappen?
ese questions came clear to me yearsago when I was with a group of nutrition ex-perts in Nepal, wandering the streets aer aconference. We went into a little kiosk whereone of our group picked up a box of powderedformula. He peeled back an innocent-lookingsticky label and pointed out that it coveredthe printed “use by” date.
What do stores, wholesalers, and manu-facturers do with their outdated formula?Do stores send it back to the wholesalers,and from there does it go to the manufactur-ers? We can make guesses about this, butwhat do we actually know? We might assumethat somewhere along the way, outdated for-mula is discarded, but we don’t really knowthat. Apparently some of it is used in feedfor livestock, but what proportion of it isused that way? Where does the rest of it go?Shouldn’t that use be tracked and regulated?Is there any national law against selling out-dated formula anywhere? What are thoselaws, and what is the history of their en-forcement?
In the U.S., infant formula is the onlyfood product that is required to have a printed“use-by” date on the package. According tothe U.S. Food and Drug Administration,aer this date, it should not be fed to infants.However, the FDA does not say what is to bedone with the product aer that date. ereare no rules, and thus no enforcement.
Some foods are still safe to use aer theiruse-by dates, but of course they all deteriorate,and the risk of contamination increases overtime. For infants, all of whom are highlyvulnerable, the risks are high. e harm dueto the use and misuse of infant formula arewell documented. It is not only safety thatmatters. Infant formula’s nutritional adequacy,already compromised when the product is
new, deteriorates steadily over time. As foodsafety experts know, a key factor in ensuringfood safety is trackability, so any questionableproduct can be traced to its source. ereshould be a systematic way to track the dis-position of outdated formula, especially if itis exported.
It might be useful if more people were todocument the expired formula problem indifferent countries more thoroughly.
Regards,George Kent
Department of Political Science, Universityof Hawai'i
Dumped infant formulain Lebanon

Romelei Camiling-Alfonso has worked for theDepartment of Health, Philippines as ruralhealth physician prior to involvement in publichealth initiatives on maternal and child health.She participated in IYCF-E efforts post-Bophaand was a representative to the Nutrition ClusterIYCF technical working group (TWG) through
Kalusugan ng Mag-Ina (Health of Mother and Child), Inc (KMI).
Donna Isabel S. Capili is a consultant onMaternal and Newborn Health, KMI. She is aneonatologist, working in public health andactively involved in the Essential Intrapartumand Newborn Care Programme. She acted asmanager and a breastfeeding counsellor of theWICS - Nanay Bayanihan tent in Villamor Airbase
for arriving Haiyan survivors, and was part of the KMI teamrepresented at the National Nutrition Cluster TWG.
Katherine Ann V. Reyes, MD, MPP is a publichealth practitioner with background in healthpolicy, health service development, andresearch, particularly regarding maternal andchild health issues. She is Executive Director andfounding member of the Alliance for ImprovingHealth Outcomes, Inc, an NGO that supports
health sector partners. She has previously worked with DOH,PhilHealth, WHO, Kalusugan ng Mag-Ina, Inc, USAID and MeTA amongothers.
A.M. Francesca Tatad is a neonatologist, memberand co-convenor of KMI, and founding memberand medical advisor of LATCH, Inc (Lactation,Training, Attachment, Counselling and Help), anNGO that promotes and supports breastfeedingthrough training, counselling and advocacy.
Maria Asuncion Silvestre is a neonatal andperinatal medicine specialist. She is a consultantfor Early Essential Newborn Care andBreastfeeding, WHO Western Pacific RegionalOffice. The Founder and President of Kalusuganng Mag-Ina (Health of Mother and Child), Inc.,(KMI), she actively participated in delivering on
KMI IYCF-E efforts in the Post-Haiyan response.
96
. . . . . . . . . . . . . . . . . . . . . . . . . . . . . . . . . . . . . . . . . . . . . . . . . . . . . . . . . . . . . . . . . . . . . . . . . . . . . . . . . . . . . . . . . . . . . . . . . . . . . . . . . . . . . . . . . . . . . . . . . . . . . . . . . . . . . . .
By Romelei Camiling-Alfonso, Donna Isabel S. Capili,Katherine Ann V. Reyes, A.M. Francesca Tatad andMaria Asuncion Silvestre
The authors wish to extend thanks to many individuals that are toonumerous to mention here but include: Nanay Bayanihan co-convenorsAtty. Jenny Ong and others involved in LATCH and the Bangko Sentralng Pilipinas; mother support groups in the cities of Cagayan de Oro,Davao and Cebu; Breastfeeding Pinays and Arugaan; the AlagangKapatid Foundation in Metro Manila; doctors who spearheaded theBusuanga Mission; and Dr Paul Zambrano for engaging with KMI inCompostela Valley. Thanks also to Dr Anthony Calibo of the FamilyHealth Office, DOH, for facilitating networks within the sector; Ms FlorPanlilio of the Health Emergency Management Bureau, DOH; theNational Nutrition Council; the Regional Health Office National CapitalRegion for engaging LGU-trained breastfeeding groups for counselling;Dr Cristina Cornelio and the Breastfeeding Committee of the PhilippinePediatric Society; and individual PPS volunteers. We also thank thePhilippine Air Force Officers' Ladies Club for giving us the space; thenumerous individual volunteers for their time and resources; RMDKwikform for providing the tent at Villamor Airbase; the human milkbanks; and hospitals that enabled breastmilk donations. Mostimportantly, we thank the many breastfeeding mothers and theirbabies for their selfless “gifts of human kindness”, whether bestowedthrough wet nursing or through human milk banks.
Field Articles ...................................................
Contributing to theInfant and Young ChildFeeding in Emergencies(IYCF-E) response in thePhilippines: a localNGO perspective
The Philippine archipelago is prone to natural disasters; hy-drological events alone average to 25 tropical cyclones a year.A quarter of our population lives below the poverty line, anda recent series of both natural and man-made emergencies
has amplified weaknesses in our disaster response. With climate change,mega-disaster scenarios similar to Typhoon Haiyan (local name Yolanda,2013) should be anticipated here and in other countries.
With lessons learned from volunteer work during typhoonsKetsana/Ondoy (2009) and Bopha/Pablo (2012), our non-governmentalorganisation (NGO) Kalusugan ng Mag-Ina (Health of Mother andChild), Inc. participated in post-Haiyan nutrition responses. KMI is anon-stock, not-for-profit NGO working to promote and protect thehealth of the mother-child dyad through research, policy development,
Location: PhilippinesWhat we know: The Philippines is prone to naturaldisasters. Recent emergencies have challenged meeting theneeds of both breastfed and non-breastfed infants. Nationalcapacity and reactivity is critical to early frontline supportin acute onset emergencies.
What this article adds: In response to Typhoon Haiyan(2013), an existing national NGO (Health of Mother andChild) mobilised an informal but wide network ofexperienced volunteers to support national IYCF-E efforts.Primary activity was frontline support to breastfeedingmothers in reception centres, development of Women andInfant Child Friendly Spaces (WICS) and advocacy andaction regarding donations of breastmilk substitutes. Socialmedia was heavily used. Pasteurised breastmilk wascoordinated and successfully delivered via cold chain totargeted infants. Limited capacity and resources meanimpact data is lacking; however insightful models of actionthrough case studies are provided. The authors flag thatsupport to non-breastfed infants (20% of under 1’s in oneassessment) was a significant gap in both the national andinternational led response.

. . . . . . . . . . . . . . . . . . . . . . . . . . . . . . . . . . . . . . . . . . . . . . . . . .
97
. . . . . . . . . . . . . . . . . . . . . . . . . . . . . . . . . . . . . . . . . . . . . . . . . . . . . . . . . . . . . . . . . . . . . . . . . . . . . . . . . . . . . . . . . . . . . . . . . . . . . . . . . . . . . . . . . . . . . . . . . . . . . . . . . . . . . . .
1 Adhisivam B, et.al. Feeding of infants and children in tsunami affected villages in Pondicherry. Indian Pediatr. 2006 Aug;43(8):724-7.
2 Hipgrave DB, et.al. Donated breast milk substitutes and incidence of diarrhoea among infants and children after the May 2006 earthquake in Yogyakarta and Central Java. PublicHealth Nutrition. 2012 Feb;15(2):307-15.
3 The State of the World’s Children, UNICEF, 2014. 4 Overview of devolution of health services in the Philippines.
Rural Remote Health. 2003 Jul-Sep; 3(2):220.5 https://www.facebook.com/bayanihanIFE
At about seven days post-landfall, we received a distress call from volunteers at theVillamor Airbase, the transit area for typhoon survivors who had been airlifted fromEastern Visayas to Metro Manila. “Mothers with small infants are being handed bottleswith milk powder as they deplane! What should we do?” We contacted the relieforganisers and briefed them on the importance of a Woman, Infant and Child (WIC)friendly space where mothers could support, protect and promote IYCF-E. Campmanagement then designated a WIC space, which was prepared, operated andpromoted through word of mouth and social media. Volunteers from both privateand public sectors converged and became known as Nanay Bayanihan (NB or “MothersHelping Out Mothers”). What started out as woven mats laid out over cardboardsheets under a tree evolved into a modular steel framed shelter generously built by aprivate donor. The area served as a haven to weary and hungry mothers and children.
Over November 15-21, 98 children aged 0 to 5 years were referred to us. In the first 48hours or so of our operations, marshals were not yet systematically directing allmothers with young infants and children to our tent yet. As such, this total of 98reflects only those that arrived at our NB tent. Among those 0-6 months of age, 83.3%were breastfeeding (42.9% were exclusively breastfeeding, 40.4% were supplementingwith infant formula). Among all infants 0-1 year of age, 79.9% were breastfeeding.
The NB WIC space was staffed by volunteers including lay personnel, breastfeedingmothers, peer counsellors, and health professionals, 24 hours a day. NB tent managersconducted daily orientation with materials made available via the group’s Facebookaccount5. Each incoming flight was met by camp marshals who screened the arrivalsfor families with infants and young children. Families were registered at the socialwelfare desk then invited to the NB WIC space, with knowledge of their case worker.Mothers and their children were encouraged to rest and given warm food and water,hygiene materials and clothing. Oral vitamin A was administered. Trained counsellorsand health professionals inquired about the mothers’ feeding practices from beforeand after Haiyan, and provided support, counselling and affirmation to those alreadybreastfeeding. Counselling tools on infant and complementary feeding developed bythe DOH-National Nutrition Council (NNC) were utilised for non-breastfed infantswho were predominately fed infant formula. Volunteer wet nurses shared personalinsights with fellow mothers, particularly those struggling with breastfeeding. Wheneverfeasible, mothers were referred to an IYCF counsellor at their final destination. Givenour limited capacity, it was not possible to systematically gather quantitative data.
IYCF interventions in local or grassroots disasterresponses: anecdotes
Nanay Bayanihan: A Woman, Infant and Child (WIC)or Mother-Baby Friendly Space
Figure 1 Call for volunteers for the Nanay Bayanihan (NB or “MothersHelping Out Mothers”)
Nan
ay B
ayan
ihan
. Phi
lippi
nes,
2013
and programme implementation. We convened a networkof volunteers, acted as an implementing partner for in-ternational NGOs (INGOs), and later contributed technicalsupport to the national nutrition response through par-ticipation in the National Nutrition Cluster TechnicalWorking Group (TWG). is article focuses on inter-ventions for infants and young children in emergenciesand learning and recommendations are highlighted.
Infant and young child feeding: thePhilippine contextIn 1986, the Philippine Milk Code (Executive Order51) was legislated. Among other things, it prohibits do-nations of infant formula, breastmilk substitutes, feedingbottles, artificial nipples and teats during emergencies.e law bans indiscriminate distribution of these productsas they put infants at greater risk of illness and death.1,2
Implementation of the law is poor at best. Local gov-ernments lack applicable operational guidelines for im-plementation of IYCF in emergencies. Messaging isoen limited to promoting breastfeeding and limitingformula milk donations; poor understanding by thegeneral public leads to the perception that the law isharsh and irrelevant. Post-Haiyan, this created a barrierto service delivery such that there was palpable pressurefrom multiple sectors to allow formula donations.
Toddler formula is widely marketed in the Philippines,being incorrectly perceived as exempt from Milk Coderestrictions and a necessity both by health care providersand the general public. Well-meaning souls donate toddlermilk assuming that it will be fed only to toddlers, not re-alising that mothers in low-resource settings will giveany available milk to their young infants whether toddlermilk or even coffee creamer. Diluted preparation of milkpowder is common to make the powder last longer, con-tributing to both acute and chronic malnutrition. isputs infants at even greater danger post-disaster whenclean water is not available, bottles cannot be cleaned,and congestion and lack of toilet facilities in evacuationcentres make for extremely harsh environments.
In the Philippines, only 34% of infants under 6months are exclusively breastfed. Also, only 34% continueto breastfeed until two years of age3.
The Philippine health systemTo understand the challenges of implementing aneffective emergency IYCF response, it is important tounderstand the structure of the Philippine health system.In 1992, the Philippines devolved the management anddelivery of primary health services from the centralDepartment of Health (DOH) to locally elected provincial,city and municipal governments in order to allow mid-level managers greater autonomy in decision-making,facilitate resource allocation based on local prioritiesand improve the management of local health services4.
e DOH maintains its leadership through healthpolicies, technical assistance and regulation, with its re-gional health offices providing guidance to local gov-
Field Article

. . . . . . . . . . . . . . . . . . . . . . . . . . . . . . . . . . . . . . . . . . . . . . . . . . . . . . . . . . . . . . . . . . . . . . . . . . . . . . . . . . . . . . . . . . . . . . . . . . . . . . . . . . . . . . . . . . . . . . . . . . . . . . . . . . . . . . .
98
. . . . . . . . . . . . . . . . . . . . . . . . . . . . . . . . . . . . . . . . . . . . . . . . . . . . . . . . . . . . . . . . . . . . . . . . . . . . . . . . . . . . . . . . . . . . . . . . . . . . . . . . . . . . . . . . . . . . . . . . . . . . . . . . . . . . . . .
ernment units. However, the implementation of DOH policies across theislands is variable, depending on each local government unit’s independentcommitment to health. At the city/municipal level, primary health careservices, such as breastfeeding and nutrition interventions, are deliveredthrough Health Offices’ midwives that supervise barangay (village) healthstations. Not unusually, one midwife may be in charge of several villages.ere is also a designated Nutrition Officer per locality, which may or maynot be part of the Health Office. Midwives heavily rely on barangay healthworkers (BHW), community volunteers oen chosen for their leadershippotential or/and political affiliations. Volunteers who assist specifically withnutrition services are called barangay nutrition scholars (BNS).
e integrity of the health care delivery system is vulnerable to largescale catastrophic events where even local health workers become victims.Rescue workers are oen unfamiliar with local policies so NGOs like oursaddress this by providing technical assistance to meet immediate needs andassist in capacity rebuilding thereaer. Much of KMI’s work post-typhoonHaiyan focused on IYCF interventions at local or grassroots levels.
The Cold Chain ProjectAlthough not a primary strategy, the provision of pasteurised donorbreastmilk proved helpful in the absence of mechanisms to address non-breastfed babies’ needs. Donor breastmilk on standby weakened this loopholein our promotion of IYCF-E practices. Volunteers attended to motherswhose breastfeeding had been disrupted. NB reinvigorated a campaign fordonor human milk. e response from donors and from milk banks at theDr. Jose Fabella Memorial Hospital, Philippine General Hospital, andPhilippine Children’s Medical Centre was overwhelming. When volunteerwet nurses were not available, the pasteurised donor milk was cup-fed topriority recipients, e.g. orphans, sick infants, or hungry infants whosemothers needed relactation support. Due to limited capacity with staffstretched to their limits in the response, it was not feasible to gather datasystematically.
Donor breastmilk was also airlied on military planes for 40 infants,some preterm babies in the Neonatal Intensive Care Unit (NICU) but mostlyolder diarrhoeic infants at the Eastern Visayas Medical Centre (EVRMC) inTacloban which had made an urgent call for donor milk. rough thenetwork of individuals and organisations, a generator was procured andsent to EVRMC. e need for donor breastmilk was addressed throughmultiple agencies (Armed Forces of the Philippines, DOH, NGOs, hospitals).It was feasible to collect, transport and store pasteurised breastmilk in a coldchain meeting the requirements of survivors without needing to solicitformula donations. In the transit areas, where mother-infant dyads’ stay wasshort term, the pasteurised donor milk was used for any young infant thatneeded to be fed acutely (whether exclusively breastfeeding, exclusivelyformula feeding or mixed feeding), aer consent, via cup feeding. It was alsoused for the mothers who needed to be relactated using drip drop and crossnursing techniques. In the recipient hospital in Tacloban (EVRMC), thepasteurised donor milk (requested by the hospital chief) was fed via tube orcup feeding to mostly older formula feeding infants being treated for gas-troenteritis in their paediatric wards. We also highlighted the shortage ofbreastmilk in referral hospitals, and the existence of mother support groups.
Monitoring of ‘Milk Code’ violationse NB tent became known as the babies’ and children’s tent, and as suchthe default recipient for food and clothing donations but also unsolicitedpowdered milk and feeding bottle donations. Donors who brought in breastmilk substitutes (BMS) and feeding implements were diplomatically informedon why these were not helpful and that the items would be turned over tothe DOH NCR office for inspection and disposition. NB convenors grantedinterviews to trimedia journalists and reporters who flocked to the NB tent,always emphasising breastfeeding protection and the dangers of BMS.
Nutrition interventions in the National DisasterResponsee National Nutrition Cluster led by the DOH-NNC and UNICEF, isactivated during times of emergencies. ere are four technical workinggroups: Assessment and Monitoring, Advocacy and Communications, Com-munity Management of Acute Malnutrition (CMAM), and IYCF-E. Post-
Figure 3Mother support groups helped raise awareness on IYCF-E. Here,mother employees of the Bangko Sentral ng Pilipinas (CentralBank) carefully pack pooled breastmilk donations beforepasteurisation at the PGH and sending to EVRMC.
Figure 4Prior to the NB tent, BMS, etcwere included in the generaldistribution of provisions forinfants and young children.Volunteers, including doctors,convinced those who packedthese provisions of thedangers of BMS. Most BMSdonations were eventually“centralised” through the NBtent, hidden from sight, andthen turned over to the DOH.Well-meaning donors wereinformed that BMS areunnecessary, assuring themthat there were qualifiedpeople helping NB babies.
Claire
Mog
ol, B
angk
o Se
ntra
l Aud
io Visua
l Division, Philip
pine
s, 20
13Dr R
omelei A
lfons
o, KM
I, Ph
ilipp
ines
, 201
3Dr R
omelei A
lfons
o, KM
I, Ph
ilipp
ines
, 201
3Dr M
aria A
sunc
ion Silves
tre, KM
I, Ph
ilipp
ines
, 201
3
Figure 2is 3-day old newborn, unfortunately separated from her mother,was brought to the NB tent where she was nourished by wet nurses.Whenever there were no wet nurses, she was cup fed withpasteurised breastmilk.
Field Article

. . . . . . . . . . . . . . . . . . . . . . . . . . . . . . . . . . . . . . . . . . . . . . . . . . . . . . . . . . . . . . . . . . . . . . . . . . . . . . . . . . . . . . . . . . . . . . . . . . . . . . . . . . . . . . . . . . . . . . . . . . . . . . . . . . . . . . .
Field Article
99
Haiyan, nutrition cluster counterparts were activated simultaneously inthree regions. Sub-regional coordination hubs were further activated. Aswas the general experience among different clusters, coordinating thesebodies proved challenging due to the unprecedented magnitude of destruction,as well as human resource limitations.
e government released its strategic plan, Reconstruction Assistance onYolanda (RAY), to provide overall guidance for implementation of recoveryand reconstruction programmes in Post-Haiyan areas. ere was no rec-ommendation specific to nutrition6 until Day 41, when the final reportindicated under-five malnutrition prevalence as a health outcome to bemonitored7. Among 126 teams deployed by the DOH Health EmergencyManagement Bureau (HEMB) within the month following landfall, onlyone had a specific nutrition function8. Because local health workers werevictims themselves, few could return to work quickly. Nutrition interventions(e.g. Rapid Nutrition Assessment, IYCF and breastfeeding support) wereperformed mainly by dedicated staff of NNC and partners deployed by theNutrition Cluster.
During the rehabilitation phase, health care providers from barangay tomunicipal levels underwent various training activities from the differentclusters. Implementing partners had to complete all activities before fundsexpire, oen resulting in simultaneous trainings and competition for partic-ipants. In our experience as implementing project partners, local healthofficers expressed appreciation for trainings but also, their difficulty toabsorb everything and compromises they had to make in order to attend. Atsome point, local executives requested minimisation of out-of-office days oflocal health staff, as service delivery was compromised in their absence9.
Rethinking intervention strategiesAs an active partner of the NNC, we emphasised the following:
• Operationalising IYCF-E in WIC Spaces as Mother-Baby Friendly SpacesWith an unprecedented 13 million people displaced, the capacity of localand national support systems to provide food, water and shelter was over-whelmed post-Haiyan. e need for WIC spaces was sorely felt in heavilycongested evacuation centres. We recommend the early delineation ofwomen and child-friendly spaces following the initial census taking. Specificsteps towards integrating services for women and children can then beoutlined to allow for their expedited and efficient delivery, and for monitoringindicators. Mothers of young children should not have to queue up for foodand water supplies. While Department of Social Welfare and Development’sCamp Management Guidelines call for a WIC space, services are yet to be har-monized with IYCF-E strategies. e capacity of international coordinatingstaff on IYCF-E is also variable. e implementation of mother-baby friendlyspaces, if any, still lacks functionality standards. For example, during Haiyan,one of the tents put up by an implementing partner was nicely constructed bututilisation was poor. One frontline responder observed it was too hot inside.
As such, we recommend standardisation of recommendations betweenthe Health and Social Services Departments.
Health and nutrition services for pregnant women and their newbornsare part of a continuum. A survey conducted in affected areas aer thetyphoon reveals that an alarming 14% of infants aged 0-23 months werenever breastfed10. e design of the survey captured infants born before,during and aer typhoon Haiyan. is reflects a gap in basic maternal andnewborn care. Furthermore, essential birthing services were unavailableuntil much later when tents and mobile vans were set up to provide obstetricservices. Safe births and breastfeeding initiation rates could have beenincreased by creating WIC spaces with basic birthing supplies shouldtransport to a health facility not be feasible just yet.
Figure 5Travelling via motorised outrigger boats meant we had to scheduleour departure times with the tides, so our IYCF-E sessions had tobe brief and efficient.
Figure 6We worked with the local nutritionist (far right) and villagenutrition scholar (far le). is mother delivered 3 days beforeHaiyan and came to us asking for formula thinking she did nothave breastmilk for her 11-day old. Upon exam, her breasts wereengorged and her baby poorly attached. Aer assisting on properpositioning, she experienced her baby feed calmly for the first time.We taught her hand expression. Now convinced of her adequatemilk supply, she committed to tandem breastfeeding her recentlyweaned 2 year old and newborn, with tears of relief (this is acommon reaction we get from mothers when they first visualizetheir breastmilk through hand expression. Hand expression is anempowering skill for mothers). Individualised breastfeedingsupport should be timely and delivered skilfully.
6 National Economic and Development Authority (NEDA), 2013. Reconstruction Assistance on Yolanda (RAY): Build Back Better. Manila. (http://www.gov.ph/downloads/2013/12dec/20131216-RAY.pdf)
7 NEDA, 2013. Reconstruction Assistance on Yolanda (RAY): Implementation for Results. Manila. (http://www.neda.gov.ph/wp-content/uploads/2014/10/ray_ver2_final.pdf)
8 DOH-HEMS Health Situation Update No. 7 as of December 6, 2013.9 Minutes of the Region 8 Nutrition Cluster Meeting, January 24, 2014.10 Source: Nutrition Survey Using the SMART Method in Typhoon Haiyan-affected Areas of Region VI,
VII and VIII. The Philippines: 03 February – 14 March 2014. (http://www.humanitarianresponse.info/operations/philippines/document/nutrition-survey-using-smart-method-final-report)
The Busuanga experience
While most relief and media attention was focused on the Visayas,nine days post-first landfall, we participated in a “medical mission”to Busuanga, a site of Yolanda’s sixth and last landfall, where nomedical groups had been deployed before. With 2 surgeons, 1obstetrician and 3 other doctors, 2 nurses and a pharmacist, weconducted the IYCF-E efforts, bringing cups, syringes and pas-teurised donor milk along with medical supplies. We first networkedwith their municipal health officer and his wife, a nutritionist. Be-cause we were to travel by small boats between islands, wearranged to leave most of our back-up donor milk in the healthunit’s vaccine freezer and transport aliquots of milk with us incoolers. At our base island, we bought out all the available veg-etables for distribution to families with older children. Weworked with the nutritionist and the “barangay nutrition scholars”to ensure sustainability, doing individualised feeding assessmentsand demonstrating methods to support relactation, i.e. the drip-drop method, tandem nursing, cup and syringe feeding, handexpression and proper storage of breastmilk. We counselled themon appropriate complementary feeding, handed out vegetables,and advised them to plant the seeds.
. . . . . . . . . . . . . . . . . . . . . . . . . . . . . . . . . . . . . . . . . . . . . . . . . . . . . . . . . . . . . . . . . . . . . . . . . . . . . . . . . . . . . . . . . . . . . . . . . . . . . . . . . . . . . . . . . . . . . . . . . . . . . . . . . . . . . . .
Dr R
omel
ei A
lfons
o, K
MI,
Phili
ppin
es, 2
013
Dr R
omel
ei A
lfons
o, K
MI,
Phili
ppin
es, 2
013

. . . . . . . . . . . . . . . . . . . . . . . . . . . . . . . . . . . . . . . . . . . . . . . . . . . . . . . . . . . . . . . . . . . . . . . . . . . . . . . . . . . . . . . . . . . . . . . . . . . . . . . . . . . . . . . . . . . . . . . . . . . . . . . . . . . . . . .
100
Field Article. . . . . . . . . . . . . . . . . . . . . . . . . . . . . . . . . . . . . . . . . . . . . . . . . . . . . . . . . . . . . . . . . . . . . . . . . . . . . . . . . . . . . . . . . . . . . . . . . . . . . . . . . . . . . . . . . . . . . . . . . . . . . . . . . . . . . . .
Figure 9ese 7-month old twins were referred for nutrition counselling.e infant is learning to cup feed expressed breastmilk. oughexclusively breastfeeding, the mother thought her breastmilk wasonly good until 6 months. Before Haiyan, the mother started bottlefeeding with full cream powder milk (not infant formula), forwhich the father spent 500 pesos (~11 USD) weekly. Uponcounselling and examination, the mother still had breastmilk anddecided to continue breastfeeding. ey were also helped tounderstand complementary feeding practices.
In implementing WICs, frontline staff should be careful in communicatingabout their target groups. Bottle-feeding mothers may be inadvertentlyexcluded because “calls” are addressed to “Pregnant and Lactating Mothers”.Aiming to report official numbers of this high-risk group is criticalnevertheless, formula-fed children can be “systematically” excluded fromcounting, especially when families have already le evacuation centres,effectively marginalising this high-risk group even more.
• Reengineering capacity buildingEssential competencies to IYCF-E implementers include skills in hand ex-pression of breastmilk, alternative feeding methods such as cup feeding,relactation, and knowledge on the sourcing and preparation of appropriatecomplementary foods. Successful IYCF-E cannot be limited to counsellingon exclusive breastfeeding and complementary feeding as the needs of non-breastfed and mixed-fed infants demand attention. e ideal IYCF-E responseshould be widespread and coordinated rather than dependent on a few localexperts working reactively.
IYCF practices should be robust so that exclusive breastfeeding and ap-propriate complementary feeding are “pre-positioned” proactively. KMIpromoted integration of IYCF-E in “normal” programming through thestandard Essential Intrapartum and Newborn Care (EINC) or First Embrace11
workshops. is notably included, training for 42 priority municipalities inthe Haiyan corridor and in major medical, midwifery and nursing schools,and end-referral hospitals nationwide.
• Responding with sensitivity to local context and culturesWhile regulation of BMS is important post-disaster, this is easier said thandone. It is difficult for health managers and the general public to fullyappreciate the risks of formula feeding and to discourage or not distributeuntargeted BMS supplies, if safeguards and systems of support are not inplace for babies who do not breastfeed. In the absence of clear frameworksand safeguards, as was the case in this humanitarian response, “regulating”people oen works only to burn bridges.
Social media and strong leadership from existing mother support groupse.g. LATCH and Breastfeeding Pinays, facilitated the convergence of volunteermother support groups, a valuable resource for the government duringtimes of disaster. ere must be a mechanism for nurturing, sustaining andrecognising their contributions to augment local health workers andgovernment responders.
Reflections of a national organisatione efforts reflected in this article were exerted by a lean organisationcomprised of a network of committed volunteers, coordinated by at mostsix people – again volunteers - at a given time. Much of the activities we un-dertook were to fill locally unrecognised gaps in support of the nationalefforts and human resources spread out really thinly at that time. Ourattempts to secure funding for relief efforts (related to WIC and “breastfeedingmissions”) at the height of response were unsuccessful due to many constraints,including the manpower needed to develop proposals and solicit support.We subsequently secured funding from UNICEF in the rehabilitation phaseto strengthen and capacitate birthing facilities in 42 municipalities. In thelatter capacitation project, we incorporated an IYCF-E module targetinghealth officers and midwives.
Although we tried, we have little data to support our experiences in termsof numbers, coverage, and impact of the interventions. Our working in avery limited setting with capacity constraints, permitted showing models foraction but not data on impact. We have worked in transit areas and there wasno feasible way to track the outcomes. Our visits to communities were brief.
rough our work, we observed systems gaps that we feel are importantto mention. In the Haiyan response, there were no specific actions for non-breastfed babies. eir needs must be met acutely to reduce “tension” but inways that comply with the Milk Code by exhausting safer viable options likerelactation, wet nursing and provision of donor milk as mainstream inter-ventions. Otherwise, in the absence of official channels of support, familieswill source out BMS donations elsewhere, as observed in this crisis.
Figure 8Mothers and caregivers are taught how to cup feed young childrenusing pasteurised breastmilk. Mothers are also taught how to handexpress breastmilk if they need to be away from their children.
Figure 7Cross nursing and “drip and drop” method for relactation. emother in blue was formula feeding her 3-month old (not in thepicture). e mother in pink allowed her own newborn to suckleonto the breast of the mother in blue while dripping some of herown milk in order to stimulate milk production. Wet nursing is aculturally acceptable practice locally.
11 https://www.facebook.com/UnangYakaphttp://www.wpro.who.int/topics/reproductive_health/maternal_child_health_brochure.pdf?ua=1
Dr R
omel
ei A
lfons
o, K
MI,
Phili
ppin
es, 2
013
Dr R
omel
ei A
lfons
o, K
MI,
Phili
ppin
es, 2
013
Dr R
omel
ei A
lfons
o, K
MI,
Phili
ppin
es, 2
013

101
Field Article. . . . . . . . . . . . . . . . . . . . . . . . . . . . . . . . . . . . . . . . . . . . . . . . . . . . . . . . . . . . . . . . . . . .
Conclusionough perceived as the most vulnerable, the exclusively breastfed infant isthe most food-secure post-disaster. While IYCF-E and nutrition initiativesmention breastfeeding in policy and strategy frameworks, there is lack ofdirect interventions and capacity building for practical skills for its protection,promotion and support. Robust IYCF practices should be “pre-positioned”so that impact of post-disaster IYCF-E responses can be maximised. Ourpost-Haiyan experiences at the grassroots level supplied proof of conceptactivities that can be models for programming and implementation ofnational emergency responses.
For more information, contact Lei Alfonso, email:[email protected]
An important gap: IYCF-E operationalguidelines
Frontline health workers asked, “now that BMS donations areprohibited, what will I do with infants already formula feedingbefore the disaster?” This provoked heated discussions amongdonors, health workers and lay volunteers, many of whom lackedpractical skills in breastfeeding counselling and support for com-plementary feeding. Hence, drafting of the national IYCF-E oper-ational guidelines became one of the priorities of the NationalNutrition Cluster. At the time of writing this article, the draft op-erational guidelines await review approval from the DOH.
The draft outlines ways of managing formula donations: returnto donor, reusing ‘suitable’ milk (e.g. by pre-mixing with fortifiedblended food for blanket supplementary feeding, institutionalsupport for other vulnerable groups, animal feeds, as ingredientfor other foods that can be distributed), and destruction of ‘un-suitable’ products.
It was recommended that only qualified health/nutrition workerstrained in breastfeeding counselling and infant feeding dispenseformula to caregivers, after safer alternatives have been exploredand formula feeding risks have been discussed with carers. Pro-curement and distribution of formula should only be a last resort,through responsible Regional Health Offices, and regulated ac-cording to set standards.
Figure 11Positive and diplomatic interpersonal communication, with clearmessages backed up by evidence, is an effective approach to raisingawareness for IYCF-E. Our collective initiatives attracted severalmainstream media features to promote IYCF-E to the general public.
Figure 12Mother volunteers put up a space for weary survivors in a transitarea in Cebu, though without special enclosures or structures, itfocused on delivering peer-to-peer IYCF support. eir efforts wererecognised upon patch-up with the Regional Nutrition Cluster.
Cebu experience
We received an appeal for breastmilk on social media from a pae-diatrician in Cebu City, the largest transit area post-Haiyan. Wethus airlifted pasteurised donor milk from Manila to the militaryhospital there. Donor milk was stored in BPA-free cups so it couldbe fed to recipients after thawing. The milk was directed to priorityrecipients at the Cebu hospitals and at the EVRMC in Tacloban. Wedelivered a donated freezer to the Cebu Provincial Hospital, thereferral hospital for hardest hit municipalities in Northern Cebu.Being an MBFHI (Mother and Baby Friendly Hospital Initiative)hospital with high exclusive breastfeeding rates, the staff declinedthe donor milk. They had also confiscated and surrendered formuladonations from a foreign medical group. We also visited a CebuCity orphanage and evacuation centre, and at the latter, met withsocial worker camp managers, educated them on IYCF-E and moth-er-baby friendly spaces.
Figure 10Compostela Valley, Typhoon Bopha response. During the WIC launch,there were no formula-feeding mothers present. Was it because the callspecified “pregnant and lactating women”?
. . . . . . . . . . . . . . . . . . . . . . . . . . . . . . . . . . . . . . . . . . . . . . . . . . . . . . . . . . . . . . . . . . . .
Dr R
omel
ei A
lfons
o, K
MI,
Phili
ppin
es, 2
012
Nan
ay B
ayan
ihan
, Phi
lippi
nes
2013
Myl
ene
Sant
ana,
Ceb
u M
othe
r Sup
port
Gro
ups,
Phili
ppin
es, 2
013

. . . . . . . . . . . . . . . . . . . . . . . . . . . . . . . . . . . . . . . . . . . . . . . . . . . . . . . . . . . . . . . . . . . . . . . . . . . . . . . . . . . . . . . . . . . . . . . . . . . . . . . . . . . . . . . . . . . . . . . . . . . . . . . . . . . . . . .
102
Field Article. . . . . . . . . . . . . . . . . . . . . . . . . . . . . . . . . . . . . . . . . . . . . . . . . . . . . . . . . . . . . . . . . . . . . . . . . . . . . . . . . . . . . . . . . . . . . . . . . . . . . . . . . . . . . . . . . . . . . . . . . . . . . . . . . . . . . . .
By Natasha Lelijveld, Elizabeth Molloy,Jennifer Weiss, Gwyneth Hogley Cotes
Natasha Lelijveld hasrecently completed anutrition researchproject in Blantyre,Malawi and isundertaking a PhD atUCL. She volunteered
to assist Concern Worldwide during theirnutrition response to the flooding in NsanjeDistrict.
Elizabeth Molloy is aneducation and genderspecialist withexperience in TheGambia, Nepal andEthiopia. She wasConcern Worldwide’s
Education Programme Coordinator, based inNsanje district (2013-2015), and managedConcern’s emergency nutrition andprotection responses post Jan 2015 floods.
Jennifer Weiss, MPH isthe Health andNutrition Coordinatorat Concern Worldwidein Malawi. Jenn hasover ten years ofexperience in the
design, implementation, and evaluation ofcommunity-based maternal and child health,nutrition, and HIV/AIDS programmes.
Gwyneth Hogley Cotes,MPH is ProgrammesDirector for ConcernWorldwide, leadingConcern’sprogramming,development, and
advocacy work in Malawi. She has spent thepast 12 years working as a manager andtechnical advisor in a range of nutrition andhealth issues.
Timely expansion of nutritiondevelopment activities in repose to anacute flooding emergency in Malawi
In early January 2015 heavy rains, fourtimes the monthly average, caused themost severe flooding seen in Malawifor over two decades. e floods affected
15 districts and an estimated 638,000 peoplecountrywide. At least 174,000 people weredisplaced in the three most affected districts:Nsanje, Chikwawa, and Phalombe. NsanjeDistrict, already amongst the poorest districtsin the country, was the worst affected, withan estimated 170 deaths as of January 17th2015, and a joint district assessment identified15,274 households (approximately 84,000 in-dividuals) who had been displaced or sufferedsevere damage.
In the days and weeks following the flood-ing, internally displaced persons (IDPs) gath-ered in makeshi camps, looking for shelterand support. Floods had washed away houses,crops and livestock, leaving families with lim-ited access to food or income.
By February 2015, 19 camps had formedin Nsanje district, housing around 400-500
households each. Management of the campswas complicated with no one organisationtaking full management responsibility. Ad-ditionally Malawi does not have a standingcluster system, and instead activated clusters(including shelter, logistics, food security,WASH, protection, education, and nutrition)soon aer the emergency under the coordi-nation of the Malawi Government and Hu-manitarian Country Team with support fromUNDAC (UN Disaster Assessment and Co-ordination). e donor response was rapidand adequate; in this instance, funds tendedto be channelled through NGOs and UNagencies rather than the Malawi government.
e destruction of bridges and roads byfloodwaters meant that much of Nsanje districtwas cut off and difficult to access. IDPs whosehomelands were located on seasonal flood-plains were prevented from returning homeand the process of their relocation to lessrisky land remains uncertain due to tensionswith host communities and confusion overland ownership.
Location: MalawiWhat we know: Scale up of CMAM services at country level relies heavily onhealth system capacity that may be already overburdened. Surge response inemergencies and to seasonal peaks in malnutrition is necessary in manycontexts but an added challenge.
What this article adds: Malawi was affected by severe flooding in early 2015prompting cluster activation, including nutrition. Concern and UNICEFquickly responded in Nsjane district to support existing CMAM services tomeet increased need but exposing weaknesses in doing so. Despitelongstanding investment, services were not up to standard, not truly integratedand unable to surge to respond; volunteers were successfully used in the short-term to help compensate for already overburdened staff. Integration was alsolacking in INGO led activities. Better preparedness, support for ‘true’integration and stronger inter-sectoral (including cluster) coordination andcommunication would have strengthened the response.
Flooding
Ale
xia
Web
ster
/Con
cern
Mal
awi,
Mal
awi,
2015

. . . . . . . . . . . . . . . . . . . . . . . . . . . . . . . . . . . . . . . . . . . . . . . . . . . . . . . . . . . . . . . . . . . . . . . . . . . . . . . . . . . . . . . . . . . . . . . . . . . . . . . . . . . . . . . . . . . . . . . . . . . . . . . . . . . . . . .
103
Field Article. . . . . . . . . . . . . . . . . . . . . . . . . . . . . . . . . . . . . . . . . . . . . . . . . . . . . . . . . . . . . . . . . . . . . . . . . . . . . . . . . . . . . . . . . . . . . . . . . . . . . . . . . . . . . . . . . . . . . . . . . . . . . . . . . . . . . . .
Aer the initial response, which focused onshelter, food and clean water, Concern Worldwide,with financial and technical support fromUNICEF and in collaboration with the NsanjeDistrict Health Office, provided emergency tech-nical support, training, logistical support andsupervision for nutrition services aimed at pre-venting and treating acute malnutrition amongchildren under five years and pregnant and lac-tating women. ese activities began in Nsanjedistrict on 26 January 2015, 12 days aer theworst of the flooding occurred.
Prior to the flooding, Concern Worldwidealready had existing livelihoods and educationprogrammes within Nsanje, with staff based inthe district full-time, including education, foodsecurity, finance, administration and transportpersonnel. From 2005 to 2010, Concern World-wide supported the scale up of CMAM servicesin the district, aer which support for nutritionactivities was handed over to the District HealthOffice. Due to their existing presence in thecommunity, Concern Worldwide were closelyinvolved in coordination efforts both in NsanjeDistrict and at the national cluster level, andwere in a strong position to lead on a timelynutrition intervention.
ActivitiesSupporting government health facilitiesere are 14 health centres in Nsanje districtand one district hospital. Community basedManagement of Acute Malnutrition (CMAM)is provided within all health facilities throughthe primary health care system in Malawi. Man-agement of CMAM activities is delivered throughthe government health system, with financial,technical and logistical support from UNICEF.Concern Worldwide assessed all health facilitiesusing the Nutrition Cluster data collection tool.Assessments found that there was a lack of IEC(information, education and communication)materials and job aids in most centres and in-adequate documentation on screening by HealthSurveillance Assistants (HSAs). At the time theflooding hit, CMAM activities were focusedprimarily on provision of outpatient and inpatienttherapeutic care at health facilities. Communityor facility-based screening did not happen reg-ularly and supplementary feeding services weresporadic or inactive due to lack of food supplies.e assessment found that facilities had a reliableReady to Use erapeutic Food (RUTF) supplychain in place and staff had received appropriatetraining. Concern Worldwide’s initial responseto this was to distribute job aids, such as RUTFration charts, to health facilities and to beginsupportive supervision of Outpatient erapeuticProgrammes (OTP) and Supplementary FeedingProgrammes (SFP) across the health facilitiesin cooperation with the District Health Office.
Extending nutrition services to IDP campsAt their peak, the IDP camps varied in populationsize from over 9,000 people in the largest, to600 people in the smallest. rough assessmentof the 19 camps, Concern Worldwide foundthat they all reported availability of cookingand eating utensils and water was supplied either
through a borehole or by water bowser visits.WFP was responsible for monthly deliveries offood rations, consisting of maize flour, beansand oil, to all camps. Despite these rations, thediets of most camp residents were poor, consistingof one meal per day of maize flour and legumes.Cooking was taking place in family groups usingopen fires and firewood collected locally.
In order to extend CMAM services to theIDP camps, Concern Worldwide recruited andtrained 10 Nutrition Volunteers from each camp.ese volunteers were identified by the campmanagement committee and were required tobe literate, willing to help and reside full-timein the camp. At each camp, Concern Worldwideprovided a half-day orientation to the volunteerson how to screen for acute malnutrition usingMUAC and assess for nutritional oedema. Eachvolunteer was equipped with one MUAC tapeand a screening tally sheet (see Figure 1). SomeHSAs working in the camps also participatedin the training. Volunteers were instructed thatcamp-wide screening would take place eachweek, for at least three months. Each child under5 years and pregnant and lactating women werescreened; any cases of moderate or severe mal-nutrition were referred to the HSA or health fa-cility for further assessment and appropriatemanagement. Most camps were within the catch-ment area of their allotted health centre. However,due to flooding and inaccessibility, some healthcentres had to support camps several kms away,increasing their catchment population consid-erably and stretching resources, particularlystaff, supplies and fuel.
e use of tally sheets allowed the screeningexercise to also function as a monitoring system,with numbers of children screened and referredcollected weekly and then analysed through anational nutrition information dashboard servicemanaged by the Clinton Health Access Initiative.Initial screening reported a slightly elevatedprevalence of global acute malnutrition (GAM)in the camps (9%), but a low prevalence of
severe acute malnutrition (SAM) (1%). GAMrates in Malawi are usually between 4-6% (MalawiDHS, 2010). Both SAM and MAM cases identi-fied by volunteers were referred to the nearesthealth centre for treatment. It is hoped thatcontinuation of this intervention will result inprevention of further SAM cases though activecase-finding and therefore early intervention.
Support to Infant and Young ChildFeeding (IYCF)In addition to MUAC screening, Nutrition Vol-unteers also conducted outreach education onIYCF messages following a 2-day training course,using simplified versions of government nutritioneducation booklets, translated into the locallanguage. irty HSAs also joined this training.e integration of hygiene messages provedparticularly important as the risk of cholerawas high in the area, following an outbreakoriginating in the neighbouring Jamila provincein Mozambique. However, mothers found itchallenging to implement the IYCF guidancethey were given due to the lack of diverse sourcesof food available to them. ere was some an-ecdotal evidence that households were supple-menting their diets with purchased foods fromthe surrounding community but camp diet as-sessments did not find that to be adequate.Given the acute nature of the emergency, andthe fact that most households were expected toremain in camps for only a short time beforereturning to their homes, Concern Worldwidefocused on advocating through the food securityand agriculture clusters for appropriate and di-verse materials for the winter planting season.A number of donors responded to this need,providing seeds and cuttings for maize, beansand orange-fleshed sweet potato.
Key challenges and learningpointsAccessibility proved to be a great challenge forall nutrition activities, especially orienting andsupporting the camp-based volunteers. With
MUAC tally sheetFigure 1

. . . . . . . . . . . . . . . . . . . . . . . . . . . . . . . . . . . . . . . . . . . . . . . . . . . . . . . . . . . . . . . . . . . . . . . . . . . . . . . . . . . . . . . . . . . . . . . . . . . . . . . . . . . . . . . . . . . . . . . . . . . . . . . . . . . . . . .
104
Field Article
. . . . . . . . . . . . . . . . . . . . . . . . . . . . . . . . . . . . . . . . . . . . . . . . . . . . . . . . . . . . . . . . . . . . . . . . . . . . . . . . . . . . . . . . . . . . . . . . . . . . . . . . . . . . . . . . . . . . . . . . . . . . . . . . . . . . . . .
knowledge in delivering emergency health andnutrition activities. is emergency responsehighlighted the many responsibilities delegatedto HSAs and their large workload meant thatsome tasks were not prioritised, as was the casewith CMAM surveillance. It quickly becameclear as nutrition activities began to be imple-mented that the HSAs would not be able to playas large a role as imagined due to their alreadyhigh workload and volunteers were recruited tosupport with screening and referral.ere aremany opportunities for better integrating nu-trition activities into routine health services inMalawi, such as twice-yearly Child Health Days,outpatient clinic visits and iCCM (IntegratedCommunity Case Management. A Health FacilityAssessment conducted by Concern in 2014found that nutrition actions such as screeningand counselling are rarely carried out as a partof sick child visits or other routine maternaland child health contact points. If CMAMservices and nutrition actions were better inte-grated into routine child health services, thiscould ease the burden on health personnel, par-ticularly HSAs.
ere is a need to work with the healthsystem to better plan for increased resource re-quirements during both emergencies and alsoduring routine spikes in malnutrition duringthe lean season. e CMAM Surge model,piloted by Concern Worldwide in Kenya, is anapproach to strengthening the capacity of healthservice providers to identify and respond tosurges in caseloads; it could be applied in othersettings to improve routine CMAM activitiesand better prepare the health service for emer-gency response. e CMAM surge model employscapacity-based response thresholds that triggersupport based on existing health system capacity.e model aims over time to improve healthsystem capacity to manage spikes in cases ofacute malnutrition. e support componentsalign with the WHO’s health system buildingblocks, including elements for health workers,information and leadership.1
As a result of the heavy workload of HSAs,the camp-based nutrition volunteers took on amore prominent role in this intervention. emotivation of the volunteers was higher thanexpected and the nutrition programme not onlyaimed to prevent and treat malnutrition, butgave other members of the camp a meaningful
role in their new camp society. IDP camps canbe boring and demoralising places and thesevolunteers were grateful for the activity andstatus that came with MUAC screening andIYCF messaging. Although this method wassuccessful, it could have been improved had thevolunteers been integrated with other services.ere were missed opportunities to combineMUAC screening and IYCF messaging witheither the vitamin A campaign or the camphealth clinics run by Médecins Sans Frontières(MSF). Despite the merging of the health andnutrition clusters, due to low numbers of agenciesparticipating in the nutrition cluster, opportunitiesfor coordination were unexploited, with healthclinics seeing many women and children withoutscreening for malnutrition.
Coordination and communication could havebeen improved throughout the emergency. Co-ordination with both government officials andother organisations was initially strong imme-diately following the flooding however it quicklytapered off as the weeks passed, with informationbeing shared in an ad-hoc manner rather thanthrough formal structures. Although the jointhealth-nutrition cluster continued to be active,meetings became less frequent and more poorlyattended. Additionally, communication to andfrom the national level clusters was inconsistent.Access to accurate and relevant data was alsoan issue both before and during the nutritionresponse; however the simple tally sheet usedby nutritional volunteers proved an invaluablesource of data and was an adequate stand-in fora costly nutrition survey.
ConclusionMany children in Nsanje District in Malawi areexperiencing their first 1000 days during anemergency flood crisis. e risk of malnutritiondue to loss of resources and threat of infectionsis high; therefore the importance of preventingheightened levels of malnutrition throughoutthe 1st 1000 days is urgent. Concern Worldwide,with support from UNICEF, responded to thisneed by setting up support for health centres,CMAM screening and referral and IYCF outreachmessages within 12 days of the emergency.Better integration of nutrition services intoroutine services could result in a more sustainableCMAM programme. In addition, better inter-sectoral coordination and communication wouldhave strengthened the response and improvedefficiency of activities, with opportunities for‘piggy-backing’ interventions maximised. Ex-ploring a model for strengthening surge capacityin health facilities, as used by Concern Worldwidein Kenya, could strengthen both data manage-ment and the health facilities in their capacityto respond to sudden increases in caseloads,such as this flood emergency.
For more information, contact: Jennifer Weiss,email: [email protected]
flood water levels fluctuating greatly day by dayfollowing rain or periods of sunshine, it proveddifficult to access the six camps in the easternpart of the district, which had been cut off byflood waters and hosted the greatest populationof IDPs. WFP operated a passenger helicopterfrom mid-January until March 23rd. Followingthe end of helicopter operations, the WFP-ledlogistics cluster developed innovative ways toaccess Nsanje’s eastern bank camps, such as theuse of an airboat to navigate the fluctuatingwater levels of the River Shire. Malawi, being aland-locked and resource-limited country, doesnot have necessary transportation equipment,such as boats and helicopters, needed to respondto major flooding. is limitation needs to beconsidered and better planned for in similarsituations in the future.
Secondly, the existing health infrastructurein Nsanje district, which this nutrition pro-gramme supported, suffered from a number ofchallenges. Malawi was one of the first countriesto embrace and roll out CMAM programmesnationally and provides CMAM services in morethan 80% of facilities. However, as the CMAMactivities are delivered as a separate clinic oneday per week, it appeared to be seen as an ‘add-on’ to routine health services rather than an in-tegral component of routine child health servicesand was oen deprioritised by health staff. Rou-tine screening and community outreach, whichis intended to be done by HSAs, was rarelydone. is made the nutrition response to theflood more difficult, with the need to recruitand train additional volunteers to handle com-munity screening. From the period 2010 to2013, several specific initiatives that aimed tosupport the scale-up of CMAM came to an end,such as NGO-supported nutrition programmesand the CMAM Advisory Service. ere seemsto have been a general erosion of the programmeaffecting training, supervision and resourcesfollowing the reduction of these support services.For example, replacing broken weighing scaleswith functioning ones in health centres wasslow to happen and there were reports that fuelfor supervisors to make visits to rural healthcentres was lacking.
e HSAs, a fundamental part of the CMAMprogramme and overall health system, were ac-tively involved in responding to needs of theflood-affected population, but lacked skills and
1 For more detail on the CMAM Surge model, see Field Exchange issue 47: Regine Kopplow, Yacob Yishak, Gabrielle Appleford and Wendy Erasmus (2014). Meeting demand peaks for CMAM in government health services in Kenya.
Nutrition volunteers participating in training on MUAC assessment
Ale
xia
Web
ster
/Con
cern
Mal
awi,
Mal
awi,
2015

105
. . . . . . . . . . . . . . . . . . . . . . . . . . . . . . . . . . . . . . . . . . . . . . . . . . . . . . . . . . . . . . . . . . . . . . . . . . . . . . . . . . . . . . . . . . . . . . . . . . . . . . . . . . . . . . . . . . . . . . . . . . . . . . . . . . . . . . .
By Hermann Ouedraogo, Ismael Ngnie-Teta,Mahamat Bechir, Esaie Diongoto Domaya,Adama N’Diaye, Paola Valenti
Hermann Ouedraogo, MPH,PhD, is Nutrition ClusterCoordinator with UNICEFChad. Previously he workedas a SMART ProgrammeSpecialist with ACF Canadaand managed national
surveys in different countries.
Ismael Ngnie-Teta holds aPhD from the University ofMontreal. He is currentlyChief of Nutrition for UNICEFGuinea and AdjunctProfessor at the University ofOttawa’s School of Nutrition.
Mahamat Bechir, PhD, is theResponsible of the NationalCentre of Nutrition and FoodTechnology, MoH, Chad; thiscentre led the investigationdescribed in this article withthe support of UNICEF.
Esaie Diongoto Domaya hasbeen working with UNICEFfor more than ten years,implementing andmonitoring malnutritionmanagement programmes inChadian emergencies areas.
Adama N’Diaye is a NutritionSpecialist who worked asNutrition data manager withUNICEF Chad for three yearsbefore joining Niger asresponsible for nutritionsurveillance.
Paola Valenti is NutritionManger at UNICEF Chad,with a long and successfulinternational experience innutrition programmemanagement in Nigeria,Cameroon and Madagascar.
Nutrition programmecoverage: implementationstrategy and lessonslearnt from Chad
Location: ChadWhat we know: In general, programmes undertake distinct nutritionsurveys and coverage assessments to ascertain programme performance.
What this article adds: An integrated SMART-SQUEAC single survey wasimplemented in Chad with the aim of economising on time and costs butbearing in mind one sampling constraint (the SMART PPT approach risksunderrepresentation of small villages in the coverage assessment).Malnutrition prevalence and coverage data proved of high quality, smallvillages were represented in this instance, and there were substantial costsavings (103,916 US$). It will be necessary to work out and reconcileappropriate samples, identify eligible children (age versus height cut-offs),consistently define SAM (coverage assessment based on MUAC/oedema;SMART survey based on WHZ/MUAC/oedema) and consider logistics(increased field workers and supervision).
The authors are grateful to ECHO/EU that financially supported the investigation.Thanks also to the National Centre of Nutrition and Food Technology and the Ministryof Public Health at large, as well as UNICEF Chad for the logistical organisation andtechnical input. We also express gratitude to coordinators, team leaders, interviewersand all survey participants.
This article expresses authors’ personal views and opinions and does not necessarilyrepresent UNICEF’s position.
This article was developed through contacts made by the ENN’s Nutrition Exchangeeditorial team.
. . . . . . . . . . . . . . . . . . . . . . . . . . . . . . . . . . . . . . . . . . . . . . . . . . . . . . . . . . . . . . . . . . . . . . . . . . . . . . . . . . . . . . . . . . . . . . . . . . . . . . . . . . . . . . . . . . . . . . . . . . . . . . . . . . . . . . .
IntroductionThe SMART1 methodology was developedto improve the quality and timeliness ofnutrition survey results. Similarly, theSQUEAC2 methodology has emerged asthe tool for assessing coverage of pro-grammes that implement community-based management of acute malnutrition.Needs assessments, monitoring and eval-uation typically require both a nutritionsurvey to determine needs and a pro-gramme coverage survey for assessing per-formance and refining strategies.Integrating both methodologies in a singlesurvey, while keeping high level data qual-ity, appears highly desirable from a re-sources-saving perspective. This articledescribes implementation strategies andlessons learnt from running an innovative
integrated SMART-SQUEAC single sur-vey in crisis-affected regions of Chad.
ContextMalnutrition is endemic in Chad. Between2000 and 2010, the prevalence of chronicmalnutrition (stunting) among under five-children increased from 28% to 39% andthe prevalence of global acute malnutrition(GAM) increased from 14.6% to 16 %(MICS 2000 and 2010 data). The Sahelianpart of the country is the most affected.This critical nutritional situation has ledthe Ministry of Public Health in Chad toestablish an integrated programme of man-
1 Standardised Monitoring and Assessment of Relief and Transition
2 Semi Quantitative Evaluation of Access and Coverage
Field Article
Households census with numbering,Sila RegionFlooding
Her
man
n O
uedr
aogo
, Cha
d, 2
013

106
. . . . . . . . . . . . . . . . . . . . . . . . . . . . . . . . . . . . . . . . . . . . . . . . . . . . . . . . . . . . . . . . . . . . . . . . . . . . . . . . . . . . . . . . . . . . . . . . . . . . . . . . . . . . . . . . . . . . . . . . . . . . . . . . . . . . . . .Field Article
agement of acute malnutrition in the 11 Sahel re-gions, and a twice-yearly nutrition survey to re-inforce the nutrition surveillance system.
In 2013, the programme was running 463outpatient treatment centres, of which 95% wereintegrated into the national health system, and32 inpatient treatment units at district hospitallevel. Admissions are based on three independentcriteria: presence of bilateral pitting oedema,mid-upper arm circumference (MUAC) below115 mm, and weight-for-height z-score (WHZ)below -3. More than 350,000 children underfive years of age have been admitted and treatedin these centres since 2010. Outpatient dietarytreatment is based on the provision of ready-to-use therapeutic food (RUTF) for home con-sumption.
Following three years of implementation, aprogramme coverage survey was warranted.This timing coincided with the second of thetwice-yearly nutrition surveys due (covering thelean season). We arrived at the decision to com-bine the two surveys after weighing up advan-tages with possible inconveniences. We con-cluded that as long as the survey sample was
Enumeration of households andidentification of SAM cases for thecoverage assessment
Selection of households andnutrition /mortality survey
Data and equipment checkup and wrap-up meeting assessment
Time 0900 - 1200 1300 - 1600 1600 - 1700
Time allowance 3 hours 3 hours 1 hour
2 x Measurers →Tools calibration.→MUAC measurement and oedemadiagnosis on all eligible children.
→Weight, height and MUACmeasurement and oedemadiagnosis on children aged 6-59months in selected households.
→Help with anthropometric data entry.→Discussion on data quality.→Repetition of measurement where requested by the supervisor.
1 x Interviewerfor coverageassessment
→Help with MUAC measurement andoedema diagnosis.→Identification of SAM cases.
→Interview of the mothers ofSAM cases.
→Focus group discussion.
1 x Interviewerfor mortality
→Numbering households. →Interview in the 18 selectedhouseholds.
→Review of mortality questionnaires.
1 x Supervisor →Presentation of survey team andobjective, request of consent.→Households enumeration.
→Selection of households.→Supervision of anthropometricmeasurements, interviews andgroup discussion
→ Anthropometric data entry.→Discussions with the team and recommendations for improvements.→Data compilation and archiving.→Anthropometric data entry.→Discussions with the team and recommendations for improvements.→Data compilation and archiving.
Travel time 1 hour travel from base to village, 1 hour travel from village to base1 hour travel from base to village, 1 hour travel from village to base
Description of a typical working day of a team in selected clustersTable 1
Regions Number of households N
<50(%)
50-99(%)
100-149(%)
150+(%)
Barh El Ghazal 83.5 11.2 1.8 3.6 224
Batha 60.2 24.7 4.3 10.8 93
Guéra 52.2 27.5 4.3 15.9 69
Hadjer Lamis 77.2 11.7 1.2 9.9 172
Kanem 86.6 8.4 4.2 0.8 262
Lac 88.2 7.7 2.0 2.0 246
Ouaddai 51.2 23.8 10.0 15.0 80
Salamat 47.9 14.9 13.8 23.4 100
Sila 47.3 25.7 5.4 21.6 74
Wadi Fira 70.9 21.6 4.0 3.5 199
N’Djamena 0.0 0.0 5.0 95.0 60
Distribution of villagesaccording to number ofhouseholds per region
Table 2Criteria for anthropometric data quality and SAM prevalence (MUAC <115mmand/or oedema) per regionTable 3
Regions Age-ratio1
Sex-ratio2
SMARTflags(%)3
SD4 Globalqualityscore5
SAM prevalence,nutrition survey
SAM prevalence, coverage assessment
% 95% CI % 95% CI
Barh El Ghazal 0.93 1.01 0.4 0.96 2 0.4 0.1- 1.5 2 1.3 – 3.2
Batha 0.94 0.97 0.2 0.97 0 2.1 1.2- 3.5 1.2 0.8 – 1.9
Guera 0.92 0.97 1.1 0.98 0 0.9 0.3- 2.3 0.6 0.4 – 1.0
Hadjer Lamis 0.94 1.02 0.4 0.96 1 0.7 0.2- 2.3 2.1 1.5 – 2.9
Kanem 0.89 1.02 0.4 0.97 0 0.9 0.4- 1.9 1.3 1.0 – 1.8
Lac 0.9 1.01 0.6 0.99 2 1.1 0.4- 3.1 1.5 1.0 – 2.2
Ouaddai 0.91 0.91 0.2 0.93 1 1.5 0.8- 3.0 1.6 0.9 – 2.7
Salamat 0.93 0.98 0.7 0.93 0 1.5 0.9- 2.6 1.7 1.2 – 2.4
Sila 0.8 1.15 1 0.98 1 1.3 0.6- 2.9 1.6 1.0 – 2.8
Wadi Fira 0.93 1.02 0.4 0.98 3 0.7 0.3- 1.8 1.8 1.2 – 2.6
N’Djamena 0.93 1.03 1.6 1.03 2 1.1 0.6- 2.2 1.4 1.0 – 1.9
representative demographically and that thesurvey was cost-effective and saved time, thiswould largely outweigh the only possible incon-venience, i.e. the first stage selection of villages,with probability proportional to size, did not fitthe coverage survey method (see further expla-nation later).
MethodThe integrated survey was conducted using theSMART methodology for assessing nutritionalstatus while for the coverage assessment, anadapted (SQUEAC) methodology was used. Itinvolved a cross-sectional survey with a two-stage cluster sampling, including anthropomet-ric data collection to determine the prevalenceof acute malnutrition (nutrition survey) andidentification of cases of severe acute malnutri-tion (SAM) for coverage-related interviews(coverage assessment).
Planning: Sample size calculation and selectionwas made separately for each region. For the an-thropometric and mortality survey, the ENA(Emergency Nutrition Assessment) softwareJune 2013 version was used. The equations de-scribed in the SQUEAC manual were used to
calculate the minimum number of SAM casesto include in the coverage assessment. The over-all sampling frame consisted of the list of 4739enumeration areas (EAs) established in 2009 bythe national statistics bureau (INSEED), withthe number of households per EA. For each ofthe 11 regions surveyed, the sample was selectedusing two-stage cluster sampling. First, the clus-ters were drawn by probability proportionate-to-size (PPT) cluster sampling. In each selectedcluster, all children with height below 110 cm inall households were included in the coverage as-sessment. In practice, during the households’enumeration in the selected clusters, MUAC andoedema measurements on these children al-lowed the identification of all SAM cases. Sec-ondly, a systematic random selection of 18households per cluster was conducted to serveas a sample for the nutrition and mortality sur-vey. MUAC, oedema, weight and height meas-urements were performed on children aged 6 to59 months from these selected households.
Data collection and analysis: Data collectionwas carried out from July 8th to August 31st,2013, by 10 teams, each consisting of two meas-urers, one interviewer for mortality, one inter-
1 Ratio 6-29/30-59 months; should be close to 0.85; 2 Ratio boys/girls; should be close to 1.00; 3 Should be below 2.5% (SMARTpenalises from 2.5%).; 4 Standard deviation, should be close to 1.00; 5 0-5, Excellent; 6-10, Good; 11-15, Acceptable; >15, Problematic.
. . . . . . . . . . . . . . . . . . . . . . . . . . . . . . . . . . . . . . . . . . . . . . . . . . . . . . . . . . . . . . . . . . . . . . . . . . . . . . . . . . . . . . . . . . . . . . . . . . . . . . . . . . . . . . . . . . . . . . . . . . . . . . . . . . . . . . .

107
. . . . . . . . . . . . . . . . . . . . . . . . . . . . . . . . . . . . . . . . . . . . . . . . . . . . . . . . . . . . . . . . . . . . . . . . . . . . . . . . . . . . . . . . . . . . . . . . . . . . . . . . . . . . . . . . . . . . . . . . . . . . . . . . . . . . . . .
. . . . . . . . . . . . . . . . . . . . . . . . . . . . . . . . . . . . . . . . . . . . . . . . . . . . . . . . . . . . . . . . . . . . . . . . . . . . . . . . . . . . . . . . . . . . . . . . . . . . . . . . . . . . . . . . . . . . . . . . . . . . . . . . . . . . . . .
viewer for coverage assessment and one super-visor. Table 1 describes a typical work day forthe team. Data were collected using a question-naire comprising a mortality section, a sectionon health and anthropometry, and a coverageassessment section. Nutritional indices were cal-culated using the WHO 2006 reference popula-tion with ENA software (version September2013); data quality was assessed using the plau-sibility report produced by this software. Cov-erage rates were calculated using the BayesSQUEAC calculator (version 3.01).
Challenges and lessons learntTechnical Sampling: To select clusters for coverage assess-ments, SQUEAC recommends the Centric Sys-tematic Area Sampling (CSAS)-based techniqueor the use of a list of EAs. If a list is used, simpleor systematic random selection should be usedrather than the PPT technique that might leadto an under-representation of small villages.Under-representation of small villages is likelyto skew coverage rate towards overestimation,since small villages are assumed inaccessible andremote from large cities where health centres aregenerally established. However, in the surveyedregions, EAs are generally composed of severalvillages of different sizes, up to 19 villages for aselected cluster in Lac. In all regions, there werevillages made up of only one household. Thisshows that even small villages were well repre-sented in this survey. More than half of the vil-lages had less than 50 households, as shown inTable 2.
Eligibility criteria: To determine the prevalenceof acute malnutrition, the inclusion criterionwas age 6-59 months. Age determination is verytricky in this context where birthdate is knownaccurately for less than 10% of children. Eventscalendar provides valuable assistance for age de-termination, but it takes time and is impracticalto apply to a large number of children. For thecoverage assessment, a simple proxy criterion ofheight below 110 cm was preferred (no mini-mum cut-off). However, as a proxy of child’s agethis can lead to inclusion bias, particularly in re-gions with high prevalence of stunting, wherechildren older than 59 months may be included.However, SAM is very rare among childrenwhose age is close to 59 months, hence there isa low risk of inclusion. Furthermore, this heightcriterion is also used by the programme, whichincludes children with ages of 59 months orbelow or those with heights below 110 cm.
Definition of SAM for coverage assessment: Theprogramme admissions are based on three inde-pendent criteria, in this case, presence of bilateraloedema, MUAC < 115 mm, and WHZ < –3.Complementary analysis of data from previoussurveys showed that 76% of children aged 6-59months with WHZ<-3 had MUAC ranging from115 to 168 mm and were therefore not detectedas SAM by MUAC measurement alone. Ideally,a second weight and height measurement wouldhave been used in children with MUAC 115-168mm in order to detect all SAM cases as per theprogramme definition. However, such weightand height measurements proved too time-con-suming to be performed on such a large numberof children. For the coverage assessment, theonly criteria used were presence of bilateraloedema and MUAC < 115 mm. In these circum-stances, the sample size becomes more difficultto achieve, leading to a risk of bias affecting cov-erage rates – probably over-estimation. Indeed,it is likely that MUAC-based SAM coverage ishigher than that of WH-based SAM, because ofthe prioritisation of MUAC measurement bycommunity volunteers, leading to greater detec-tion and referral of MUAC-based SAM cases.
Data reliability and validity: Data in Table 3 indi-cate excellent quality sample selection and an-thropometric measurements. Furthermore, theprevalence of SAM (defined as MUAC < 115 mmand/or oedema) resulting from measurements inselected households in the nutrition survey, wereclose (with overlapping 95% confidence inter-vals) to those from the coverage assessment. Withrespect to external validity, the prevalence andtrend of acute malnutrition were as expectedgiven the prevailing context, i.e. agricultural pro-duction and food security. Similarly, coveragerates were within the expected limits, taking intoaccount the results of recent assessments in someregions, as well as field observations.
OperationalFieldworkers’ selection, training, and team com-position: In preparation for the deployment of10 teams of five people (one more than is usualfor a SMART team), a total of 50 to 60 peoplerequired training. Since potential fieldworkersdid not require interview and focus group dis-cussion experience, some training sessions werelonger that planned, i.e. role-playing interviews.Piloting separate training sessions for staff in-volved in mortality interviews and in coverageinterviews could provide more insight into theideal training strategy.
Logistics and supervision: SQUEAC integrationwith SMART involved an additional person ineach field team, as well as additional forms forSAM enumeration, interviews and discussions.Therefore, more suitable training and morepractice on anthropometric measurements wereneeded. The standardisation test was more dif-ficult for children and their caretakers becauseof the higher number of measurements to beperformed on each child. Vehicles adapted forthe transportation of 5-member teams were alsorequired. The need for supervision level was in-creased, justifying the permanent presence ofthe supervisor with the team. This form of ‘in-tegrated supervision’ allowed for follow up ofhouseholds and SAM enumeration in phase 1.This meant that workload could be more easilyshared by moving back-and-forth between mor-tality and coverage interviewers (see Table 3 onorganisation on a typical day).
Duration: The average duration of data collec-tion was estimated at 51 days per team for a sim-ple SMART survey, rising to 53 days withintegration of SQUEAC. Additional timeneeded was due to reassessment of the numberof households to investigate per day, which de-creased from 20 to 18 per day per team; in turn,this resulted in an increase in the number of vil-lages from 404 (i.e. 41 per team) to 430 (i.e. 43per team). Also, one rest day per week was al-lowed for each team.
CostThe cost for data collection, excluding logistics(vehicles and fuel), was 137,796 US$ for the sim-ple SMART survey whereas the integrated sur-vey cost 163,107 US$ — a difference of 25,311US$. This added cost was due to the 10 addi-tional people admitted to training, the extra per-son in each of the 10 teams, the second villageguide to accompany the coverage interviewer,the two additional days for data collection andfive additional days for data entry. A simpleSQUEAC survey conducted in similar condi-tions would have cost 78,363 US$, i.e. there wasan overall savings of 53,052 US$ for doing bothsurveys. If logistic costs are included, the totalcosts were 243,666 US$ and 268,977 US$ for thesimple SMART survey and the integrated sur-vey, respectively. A simple SQUEAC survey con-ducted in similar conditions would have cost129,227 US$. Conducting an integrated survey,rather than two distinct surveys, has thereforeallowed a total saving of 103,916 US$.
ConclusionsSMART and SQUEAC survey methodologiescan be combined in a single survey while main-taining a high quality for prevalence and cover-age data, as well as substantially savingprogramme resources. It will be necessary towork out and reconcile appropriate samples,identify eligible children and to define SAM.Similarly, logistic arrangements need to be care-fully considered in order to accommodate theincreased number of fieldworkers and supervi-sion workload.
For more information, contact: HermannOuedraogo, email: [email protected]
Field Article
A field team with the village guide beforehouseholds census, Barh El Gazal region
Her
man
n O
uedr
aogo
, Cha
d, 2
013

菀菀菀
By Kevin P.Q. Phelan, Candelaria Lanusse,Saskia van der Kam, Pascale Delchevalerie,Nathalie Avril and Kerstin Hanson
Kevin P.Q. Phelan was theNutrition Working Group Leaderfor MSF International Officefrom October 2013-April 2015).
Candelaria Lanusse has beenthe Nutrition Referent for MSFOperational Centre Barcelonasince January 2015.
Pascale Delchevalerie is apaediatric nurse with a Master’sdegree in epidemiology who hasbeen working with MSF since1991. She has been the NutritionReferent for MSF OperationalCentre Brussels since 2004.
Nathalie Avril is NutritionAdvisor for MSF OperationalCentre Geneva
Kerstin Hanson, MD is aPaediatric/Nutrition Advisor forMSF Operational Centre Paris
Saskia van der Kam is a nutritionspecialist at MSF OperationalCentre Amsterdam
MSF’sexperience withMUAC-based(and oedema)programming
Location: GlobalWhat we know: MUAC and WHZ are commonly used anthropometriccriteria for admission to CMAM programmes. WHO recommends that thespecific anthropometric indicator used to confirm SAM should also beused to assess nutritional recovery. MUAC is a simpler, faster and moreimmediate measure that identifies malnourished children at higher risk ofdeath. There is limited evidence on outcomes of untreated children withlow WHZ (but acceptable MUAC).
What this article adds: From 2007 to the present, MSF has operatedMUAC (and oedema) only based CMAM programming in a number ofchallenging emergency contexts. MUAC thresholds for admission variedfrom <115 mm to <125mm with differing prescribed lengths of stayaccording to contextual factors, e.g. prevailing mortality, presence of othercredible nutrition actors, access constraints, and available resources.Outcomes for recovery, mortality, and defaulters surpassed SPHEREMinimum Standards in most programmes. Consequently, MSFrecommends MUAC-based (and oedema) programming for most of itsemergency responses, with ongoing review. Further research is needed onappropriate MUAC thresholds and how to ensure low WHZ only childrenreceive appropriate nutrition support.
Globally, undernutrition is oneof the single greatest threats tochild survival, associated with3.1 million child deaths each
year – a half million from wasting – or 45percent of all worldwide child deaths.1
Among those fleeing war and violence,both internally displaced persons (IDPs)and conflict-affected populations havehighest rates of mortality and malnutri-tion, higher than among refugees.2
Since the successful introduction ofoutpatient nutritional rehabilitation in2005, MSF has treated more than two mil-lion children for severe acute malnutritionin both acute emergency and chronic set-tings. More recently teams have increas-ingly explored strategies that are effectiveand yet simple to deploy, especially in sit-uations with access constraints and limitedhealth personnel. It was with this objectivethat teams in Upper Nile adopted MUAC(Mid upper arm circumference)-basedprogramming in response to a dramaticsituation unfolding in April 2014 in SouthSudan’s Upper Nile State. Conflict sparkedthousands of families to flee their homes.Illness and dramatic food insecurity com-bined to cause an expected spike in child-hood malnutrition. Ongoing insecurityand severe logistic constraints drasticallylimited access – for aid workers and dis-placed alike.
To address acute malnutrition, emer-gency teams from Médecins Sans Frontières(MSF) adopted a simplified protocol inwhich Mid-Upper Arm Circumference(MUAC) was the only anthropometricmeasure used by therapeutic feeding pro-grammes for admission, monitoring and
discharge of malnourished children. (Bi-lateral pitting oedema is an independentcriterion for malnutrition treatment re-gardless of anthropometry.) e usual ad-mission criteria of MUAC <115 mm wasexpanded to admit all children with MUAC<125 mm, and children were dischargedas cured when achieving MUAC >125 ontwo consecutive measurements (in additionto a minimum three-week stay in the pro-gramme.) Over the course of 22 weeks,more than 4,600 children were admittedfor treatment, of which 1,395 were admittedin the initial five weeks of the intervention.All children with severe complicationswere hospitalised.
To date, MSF has also run such MUAC-based programmes in Titao and Yako(2007-2011), Burkina Faso; Bihar (2009-present) and Chattisgarrh (2013-present),India; Gedaref, Sudan (2010), Yida (2012),Agok (2012-2013), and Upper Nile (2014-present), South Sudan; northern Mali(2012); Bokoro (2014) and Masakory (2011-2012), Chad; Bangui and Bossangoa (2014-present), Central African Republic (CAR);and Bolomba-Equateur (2014-2015) andBili-Bas Huele (2015-present), DemocraticRepublic of Congo (DRC). is articleshares experiences and lessons learnedfrom this programming.
. . . . . . . . . . . . . . . . . . . . . . . . . . . . . . . . . . . . . . . . . . . . . . . . . . . . . . . . . . . . . . . . . . . . . . . . . . . . . . . . . . . .
1 Bhutta ZA, Das JK, Rizvi A, Gaffey MF, Walker N, Horton S, Webb P, Lartey A, Black RE. Evidence-based interventions for improvement of maternal and child nutrition: what can be done and at what cost?The Lancet. 6 June 2013. DOI: 10.1016/S0140-6736(13)60996-4
2 Centre for Research on the Epidemiology of Disasters(CRED). People affected by conflict: Humanitarian needs in numbers. 2013. http://cred.be/sites/default/files/PAC2013.pdf.
Field Article. . . . . . . . . . . . . . . . . . . . . . . . . . . . . . . . . . . . . . . . . . . . . . . . . . . . . . . . . . . . . . . . . . . . . . . . . . . . . . . . . . . . . . . . . . . . . . . . . . . . . . . . . . . . . . . . . . . . . . . . . . . . . . . . . . . . . . .
Simplifying theresponse tochildhoodmalnutrition:

. . . . . . . . . . . . . . . . . . . . . . . . . . . . . . . . . . . . . . . . . . . . . . . . . . . . . . . . . . . . . . . . . . . . . . . . . . . . . . . . . . . . . . . . . . . . . . . . . . . . . . . . . . . . . . . . . . . . . . . . . . . . . . . . . . . . . . .
109
Use of MUAC as the soleanthropometric measure foradmission, management anddischargeWhile further research is needed, there is agrowing body of evidence that MUAC is safeand effective as the sole anthropometric crite-rion (along with oedema) used to identify, man-age and discharge children requiring severeacute malnutrition (SAM) treatment.3 MUAChas been shown to be an as good as or a betterpredictor of mortality than weight-for-height z-scores (WHZ) <-3 or WHZ <-3 combined withMUAC, with an inherent age bias that targetsyounger children who are at highest risk ofdeath.4,5,6,7,8
Data analysis from MSF programmes inBurkina Faso and India showed that MUACgains closely paralleled weight gain, suggestingthat MUAC would work well for monitoringand discharge.9,10 A recent study from Malawialso showed that children with MUAC≥125 mmon two consecutive visits were safe for discharge,with acceptable negative outcomes at threemonths post-discharge.11 e World Health Or-ganisation (WHO) recommends that “[T]he an-thropometric indicator that is used to confirmsevere acute malnutrition should also be usedto assess whether a child has reached nutritionalrecovery.”12
In an MSF programme in Gedaref, Sudan,using MUAC for discharge resulted in childrenwith lower MUAC at admission having a longerduration of treatment and a higher percent ofweight gain than children with higher MUAC.13
In the Burkina Faso programme, switching to>124 mm MUAC instead of 10% weight gainfor discharge resulted in a 36% increase in lengthof stay for the most malnourished and a 38% re-duction in length-of-stay for the least malnour-
ished.14 In other words, the most malnourishedreceived the most treatment in both programmes.(Even though the WHO no longer recommendsusing 10% weight gain for discharge, this sharpreduction in the length of stay for the largestgroup of less malnourished children carried sub-stantial operational and financial benefits).
One of the major concerns related to MUAC-only programming is the potential exclusion ofchildren with MUAC >115 mm, but WHZ <-3.15 MSF has addressed this concern in someinstances by increasing the MUAC thresholdfor admission. e threshold was, for example,increased to 120 mm in northern Burkina Fasoand Bokoro, Chad and to 125 mm in UpperNile, South Sudan (described above). is in-creases the number of children who benefitfrom therapeutic feeding while reducing thepotential exclusion of children who are MUACand WHZ discordant. In Dhaka, Bangladesh,MSF monitored children with MUAC > 115mm but WHZ <-3 and found almost all of thechildren (93%) either improved in nutritionalevolution or maintained a status-quo aer threemonths’ follow up, without receiving any nutri-tional treatment16. Few needed admission to anutritional programme, although several hadmedical conditions that required hospitalisationirrespective of nutritional status, and only onedeath (from TB) occurred. More evidence onMUAC and WHZ discordant children is needed,especially for contexts in Africa.
Outcomes and practical lessonsfrom MSF’s MUAC-basedprogrammingOutcomes for recovery, mortality, and defaultersexceeded the Minimum Standards set bySPHERE in most of the MSF MUAC-based pro-grammes reported here (see Table 1). High re-covery rates (88 – 90%) were achieved in the
programmes in northern Burkina Faso, north-ern Mali, and Yida, South Sudan with lengths ofstay in the order of 30-45 days. Of the childrenwho died in the Burkina Faso programme from2009-2011, nearly half had MUAC ≤110 on ad-mission, stressing the importance of early iden-tification. Many programmes were confrontedwith high default rates. In Bihar, India, however,most of the children who defaulted did so afterobtaining six weeks’ worth of benefits from theprogramme.17 Teams there also identified riskfactors for default (including more severe wast-ing on admission, commuting from outside ofthe programme location, and not having beenreferred by an Accredited Social Health Activist,among others) to help improve delivery of serv-ices. High default rates in Upper Nile, SouthSudan and Bangui, CAR were attributed to con-tinued population movements due to ongoinginsecurity, and would have likely been high nomatter the anthropometric measure used. De-faulting occurred more often among children inthe moderate acute malnutrition (MAM) cate-gory, suggesting that adherence is perceived asless important once caretakers see their childrennoticeably improve.
Using MUAC as the sole anthropometricmeasure carried with it several practical advan-tages. Because MUAC is simpler and faster thanWHZ (which requires two measurements and acalculation) it can facilitate better coverage,better management and earlier case detectionat community level, as has been shown inBangladesh when using active MUAC-basedcase detection.18,19 Agencies like Alima and Befenare even showing that mothers can successfullyuse MUAC for screening at the householdlevel.20,21 With WHZ there are also questionsover having different tables for girls and boys,whereas MUAC is gender neutral.22
3 Roberfroid D, Hammami N, Lachat C, Prinzo ZW, Sibson V, Guesdon B, Goosens S, Kolsteren P. Utilisation of mid-upper arm circumference versus weight-for-height in nutritional rehabilitation programmes: a systematic review of evidence. WHO. 2013.
4 Myatt M, Khara T, Collins S. A review of methods to detect cases of severely malnourished children in the community for their admission into community-based therapeutic care programmes. Food and Nutrition Bulletin. 2006 Sep; 27 (3 Suppl): S7-23).
5 Briend A, Maire B, Fontaine O, Garenne M. Mid-upper arm circumference and weight-for-height to identify high-risk malnourished under-five children. Matern Child Nutr. 2012 Jan;8(1):130-3. doi: 10.1111/j.1740-8709.2011.00340.x.
6 Briend A. Use of MUAC for Severe Acute Malnutrition. CMAM Forum. 2012. http://www.cmamforum.org/Pool/Resources/ FAQ-1-Use-of-MUAC-Briend-Eng-June-2012%281%29.pdf
7 Mwangome MK, G Fegan, T Fulford, AM Prentice, JA Berkley. Mid-upper arm circumference at age of routine infant vaccination to identify infants at elevated risk of death: a retrospective cohort study in the Gambia. Bull World Health Organ 2012;90:887–894 | doi:10.2471/BLT.12.109009
8 Briend A, Khara T, and Dolan C. Wasting and stunting –similarities and differences: Policy and programmematic implications. Food and Nutrition Bulletin, vol. 36, no. 1. 2015 (supplement).
9 Goossens S, Bekele Y, Yun O, Harczi G, Ouannes M, Shepherd S. et al. Mid-Upper Arm Circumference Based Nutrition Programming: Evidence for a New Approach in Regions with High Burden of Acute Malnutrition. PLoS ONE 2012; 7(11): e49320. doi:10.1371/journal.pone.0049320.
10 Burza S, Mahajan R, Marino E, Sunyoto T, Shandilya C, Tabrez M, Kumari K, Mathew P, Jha A, Salse N, and Mishra KN.
Community-based management of severe acute malnutrition in India: new evidence from Bihar. Am J Clin Nutr First published February 25, 2015, doi: 10.3945/ajcn.114.093294
11 Binns, Paul et al.. Safety of Using Mid-Upper Arm Circumference as a Discharge Criterion in Community-Based Management of Severe Acute Malnutrition in Children Aged 6–59 Months. Oxford, England: Valid International 2014.
12 World Health Organization. Guideline: Updates on the management of severe acute malnutrition in infants and children. Geneva: WHO; 2013. www.who.int/nutrition/ publications/guidelines/updates_management_SAM_ infantandchildren/en/index.html
13 Dale NM, Myatt M, Prudhon C, Briend A. Using mid-upper armcircumference to end treatment of severe acute malnutrition leads to higher weight gains in the most malnourished children. PLoS One. 2013;8(2):e55404.
14 Cohuet S, Goosens S, Koudika MH, Shepherd S, Martinez D, Munger A, Porten K. Comparison of MUAC and percent weight gain as discharge criterion in a large TFP programme in Burkina Faso 2007-2011. Poster session presented at: International Congress of Pediatrics – ICP 2013. 27th International Pediatric Association Congress of Pediatrics - IPA2013; 2013 Aug 24-29; Melbourne, Australia.
15 Grellety E, Krause LK, Shams Eldin M, Porten K, Isanaka S. Comparison of weight-for-height and mid-upper arm circumference (MUAC) in a therapeutic feeding programmes in South Sudan: is MUAC alone a sufficient criterion for admission of children at high risk of mortality? Public Health Nutr. 2015 Mar 25:1-7. [Epub ahead of print] doi: 10.1017/S1368980015000737 PMID:25805273
16 Ali E, Zacharia R, Shams Z et al. Is Mid Upper Arm Circumference sufficient for case-finding and admission of children with severe acute malnutrition into nutritional support
programmes in an urban slum in Dhaka, Bangladesh? Trans R Soc Trop Med Hyg, 6 February 2013.
17 Burza S, Mahajan R, Marino E, Sunyoto T, Shandilya C, Tabrez M, Kumari K, Mathew P, Jha A, Salse N, and Mishra KN. Community-based management of severe acute malnutrition in India: new evidence from Bihar. Am J Clin Nutr First published February 25, 2015, doi: 10.3945/ajcn.114.093294.
18 Sadler K, Puett C, Mothabbir G, and Myatt M. Community CaseManagement of Severe Acute Malnutrition in Southern Bangladesh. Save the Children and Feinstein International Center. June 2011. Available online at: http://fic.tufts.edu/ publication- item/community-case-management-of-severe-acute-malnutrition-in-southern-bangladesh/. Accessed 8 April 2015.
19 Puett C, Coates J, Alderman H, Sadler K. Quality of care for severe acute malnutrition delivered by community health workers in southern Bangladesh. Matern Child Nutr. 2013; 9:130-42
20 Blackwell N, Myatt M , Allafort-Duverger T , Balogoun A , Ibrahim A , Briend A. Mothers understand and can do it: a comparison of mothers and community health workers determining mid-upper arm circumference in 102 children aged from 6 5 months to 5 years. Archives of Public Health, 2015 May 18;73(1):26. doi: 10.1186/s13690-015-0074-z. eCollection 2015.
21 Equipe BEFEN ALIMA. Final Report: Evaluation du recrutementen programmeme nutritionnel therapeutique a travers deux strategies de depistage communautaire en milieu rural au suddu Niger. September 2014. Personal correspondence
22 Moestue H, de Pee S, Hall A, Hye A, Sultana N, Ishtiaque MZ, Huq N, Bloem MW. Conclusions about differences in linear growth between Bangladeshi boys and girls depend on the growth reference used. Eur J Clin Nutr 2004;58:725–31.
. . . . . . . . . . . . . . . . . . . . . . . . . . . . . . . . . . . . . . . . . . . . . . . . . . . . . . . . . . . . . . . . . . . . . . . . . . . . . . . . . . . . . . . . . . . . . . . . . . . . . . . . . . . . . . . . . . . . . . . . . . . . . . . . . . . . . . .Field Article

110
. . . . . . . . . . . . . . . . . . . . . . . . . . . . . . . . . . . . . . . . . . . . . . . . . . . . . . . . . . . . . . . . . . . . . . . . . . . . . . . . . . . . . . . . . . . . . . . . . . . . . . . . . . . . . . . . . . . . . . . . . . . . . . . . . . . . . . .
. . . . . . . . . . . . . . . . . . . . . . . . . . . . . . . . . . . . . . . . . . . . . . . . . . . . . . . . . . . . . . . . . . . . . . . . . . . . . . . . . . . . . . . . . . . . . . . . . . . . . . . . . . . . . . . . . . . . . . . . . . . . . . . . . . . . . . .
Field Article
It was easier to implement and to train com-munity health workers in the use of MUAC, re-lieving limited health structures and personnelof additional pressures. However, the reluctanceof more experienced staff to only use MUACproved to be a particular challenge because theywere unsure of what would happen to childrenwith low WHZ who may not be admitted. In along-term programme in Masakory, Chad, trainingcommunity health workers to manage treatmentby MUAC (and oedema) helped improve coverageamong families who live prohibitively far fromhealth centres. And using the same criteria forscreening as well as admission can help reduce“rejected” cases (i.e. children screened and referredbased on MUAC but not admitted for treatmentbased on WHZ). is characteristic of MUAC-based programming may have even greater im-portance in settings of chronic malnutrition be-cause of the negative perceptions such inconsis-tencies can create in a community.23
MUAC is also more adapted to community-based care, particularly in situations with severeaccess constraints for aid workers and caretakersalike, high food insecurity, or limited qualifiedstaff dealing with multiple health priorities.Reaching children earlier on the spectrum ofacute malnutrition prevents a slide into themost life-threatening form of SAM, potentiallyreducing the need for hosptialised care. Such afocus on preventive efforts has been reported torelieve pressure on overwhelmed doctors andnurses working in areas with limited medicalcapacity and many causes of illness24.
In the context of emergencies or populationdisplacement, using MUAC as the sole anthro-pometric criterion facilitated a better flow ofpatients at the health structure level, reducingthe time needed per child to identify the mal-nourished. e additional materials for measuringWHZ, like height boards and weight-for-heighttables, insert extra, onerous steps in the screening
and management that can introduce error. Ofcourse accuracy questions arise with both typesof anthropometric measurements. For MUAC,the strips can be pulled too tightly, le tooloose, or misplaced on the child’s arm, whereaswith WHZ, dehydration can affect the accuracyof weight or height measures25,26 (as can wrigglingchildren), scales may not be properly calibrated,and errors can occur in calculation. us con-tinued training and supervision is required forboth. Supervision is simpler with MUAC, though,which is especially important during early stagesof an intervention when staff are limited andless trained.
Notably, it is relatively easy to shi MUACthresholds for admission or discharge accordingto context. Where there were high levels of un-der-5 mortality or severe food insecurity withfew other actors present, using expanded criteriato treat SAM and MAM enabled teams to coverthe most vulnerable children in both groupswithout needing to set up two different projectswith separate products, criteria, and statistics,reducing the burden on the teams and staffingneeds.
Moving forwardBased on the growing body of evidence andthese experiences, MSF currently recommendsthat its teams use MUAC-based (and oedema)programming for most of its emergency re-sponses. Although it requires continued discus-sion about benefits, risks, and costs, MUAC can
be safe and effective as the only anthropometricmeasure for admission, management, and dis-charge. Further research is called for, especiallyon the question of appropriate MUAC thresholdsand how to ensure those with low WHZ but noteligible by MUAC receive appropriate nutritionsupport.27 For the moment, MSF will continue toadjust MUAC thresholds for admission accord-ing to contextual factors like prevailing mortal-ity, presence of other credible nutrition actors,access constraints and available resources.
Building on these experiences and gatheringmore evidence about how to safely simplify themanagement of acute malnutrition will be im-portant in the coming years, especially with sit-uations like the one encountered in Upper Nile– conflict, displacement, difficult access, andlimited personnel dealing with various healthneeds – becoming more common in contextslike CAR, DRC, South Sudan, northern Nigeria,Somalia, and elsewhere. While the benefits of asimpler, more decentralised approach is partic-ularly relevant for improving coverage to preventmalnutrition-associated mortality or further de-terioration into SAM in conflict settings, it alsohas clear implications for an improved responsein areas of Africa (like the Sahel) and SouthAsia where recurrent emergencies result inhigh burdens of acute malnutrition.
For more information, contact: Saskia van derKam, email:[email protected]
23 Guerrero S, Myatt M, Collins S. Determinants of coverage in Community-based Therapeutic Care programmemes: Towards a joint quantitative and qualitative analysis. Disasters2009; 34(2):571-585
24 War, Drought, Malnutrition, Measles — A Report fromSomalia. Jean-Clement Cabrol, M.D.N Engl J Med 2011; 365: 1856-1858November 17, 2011DOI: 10.1056/NEJMp1111238
25 Mwangome MK, Fegan G, Prentice AM, Berkley JA. Are diagnostic criteria for acute malnutrition affected byhydration status in hospitalized children? A repeated measures study. Nutr J. 2011 Sep 13;10:92. doi:10.1186/1475- 2891-10-92.
Programme (Year)
NorthernBurkina Faso(2009-2011)
Bihar, In-dia (2010-2011)13
Gedaref, Sudan(2010)
Yida, South Sudan(2012)
NorthernMali (2012)
Upper Nile, SouthSudan (2014)
Bangui, CAR(2014)
Bosangoa, CAR(2014)
Bokoro,ChadΩ
(2014)
Bolomba,DRC (2014-2015)α
MUAC admis-sions criteria*
< 120 mm < 115 mm < 115 mm < 125 mm (WHZ -3if MUAC 125-135 mmand height >85 cm)
< 125 mm < 125 mm < 125 mm < 115 mm < 120 mm < 120 mm
MUAC discharge criteria
≥ 124 mmand min 3-week stay
≥120 mm > 125 mm for 2consecutive measurements andmin 4 week stay
≥ 125 mm and min 4follow-up visits
≥ 125 mmand min 4 week stay
>125 mm for 2 con-secutive measures,and min 3 week stay
>125 mm for 2consecutivemeasures, andmin 3 week stay
> 115 mm trans-ferred to Supple-mental FeedingProgramme
≥ 125 mm ≥ 125 mm
Admitted TFP(ATFCβ only)
26,049 4,401 2,030(939)
2,566(2,029)
1,664(1,571)
4,650(4,352)
1,059 1852 2,375(2,275)
940
Recovery TFP(ATFC only)
91.60%(NA)
57.40%(NA)
NA(82.0%)
89%(NA)
88.3%(89.2%)
61.2% Malakal66.1% Melut(59% Malakal65% Melut)
NA (45.7%)
66.4% 76.2%(71.1%)
81% (+9.8% discharged < 125mmwith 2 weeks ration atclosure of programme)
Default TFP(ATFC only)
4.8%(NA)
36.2%(NA)
NA(15%)
5.4%(NA)
10.3%(NA)
35.8 Malakal32.6 Melut(33% Malakal 5% Melut)
NA (51.9%)
10.5% 13.4%(11.9%)
8.10%
Death TFP(ATFC only
1.1%(NA)
0.8%(NA)
3.6%(1%)
1.4%(NA)
1.3%(NA)
1%(0% Malakal 1% Melut)
NA (0%)
0.2% 1.6%(0.5%)
0.3%
Programme outcomes for MSF MUAC-based interventionsTable 1
26 Modi P, Nasrin S, Hawes M, Glavis-Bloom J, Alam NH, Hossain MI, Levine AC.Midupper Arm Circumference Outperforms Weight-Based Measures of Nutritional Status in Children with Diarrhea. J Nutr. 2015 May 13. pii: jn209718. [Epub ahead of print]
27 Grellety E, Krause LK, Shams Eldin M, Porten K, Isanaka S. Comparison of weight-for-height and mid-upper arm circumference (MUAC) in a therapeutic feeding programme in South Sudan: is MUAC alone a sufficient criterion for admission of children at high risk of mortality? Public Health Nutr. 2015 Mar 25:1-7. [Epub ahead of print] doi: 10.1017/S1368980015000737 PMID:25805273

111
. . . . . . . . . . . . . . . . . . . . . . . . . . . . . . . . . . . . . . . . . . . . . . . . . . . . . . . . . . . . . . . . . . . . . . . . . . . . . . . . . . . . . . . . . . . . . . . . . . . . . . . . . . . . . . . . . . . . . . . . . . . . . . . . . . . . . . .
Agency profile......................................................
Name: Start Network
Address: Start Network, c/o Save the Children,
1 St John’s Lane, London EC1M 4AR, UK
Email: [email protected]
Website: http://www.start-network.org/
Year founded: 2013
Director: Sean Lowrie
No. of HQ staff: 12
No of staff worldwide: 12
Jeremy Shoham interviewed TanujaPandit from the Start network for thisissue’s agency profile slot
More and more people are af-fected by humanitarian crisesaround the world and theseare increasing in complexity
and frequency. is trend is expected to es-calate as increased population density, climatechange and globalisation collide in a turbulentsecond decade of the 21st century. Peoplein humanitarian crises need more appropriateassistance than they currently receive. Facedwith an inevitable escalation in demand forits services, the international humanitarianaid sector must confront a ‘perfect storm’:increasing and changing humanitarian need,complex systemic bureaucracy, decreasinghumanitarian space, and a reactive businessmodel that prevents evolution.
What is the Start Network?e Start Network is a collaboration of 24humanitarian non-governmental organisations(NGOs) set up to connect people in crisis tothe best possible solutions. Research estimatesthat a majority of human losses occur in
small scale humanitarian crises. In larger scale‘intensive risk’ crises, the international systemis usually triggered, although the appropri-ateness of the assistance provided is oen inquestion. ese questions revolve around: • the extent to which the affected popula-
tion can influence assistance being provided to them;
• the degree to which humanitarian aid can adapt to any specific crisis context;
• the extent to which humanitarian aid organisations can take advantage of new innovations to improve their response;
• whether international organisations un-dermine local crisis responders; and,
• whether, and to what extent, incumbentaid organisations can work with others to increase the scale of assistance being provided.
1 http://www.start-network.org/why2 Please see more information in The Start Fund Report,
available here: http://www.start-network.org/wp-content/uploads/2015/05/Start-Fund-Annual-Report-2015.pdf
Within 72 hours after the Start Fund is alerted to acrisis, projects start implementation
Muslim Aid, Somalia response
Star
t Fun
d
Start Fund mechanismFigure 1
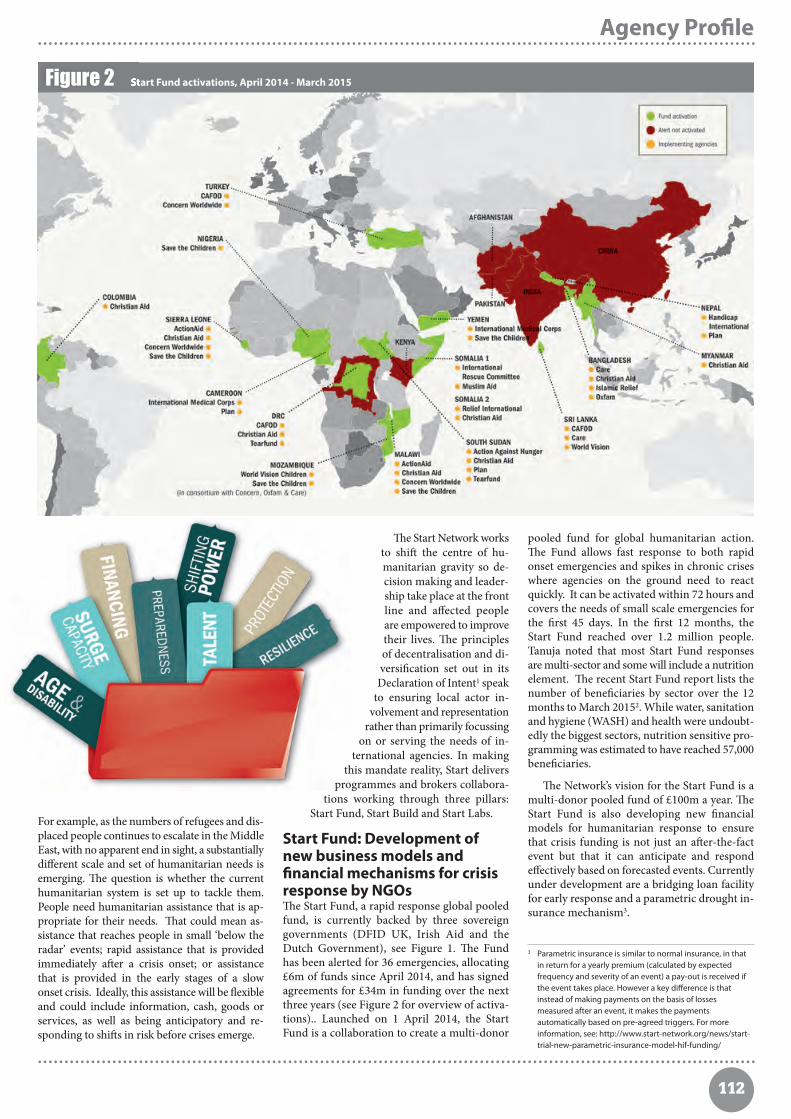
112
e Start Network worksto shi the centre of hu-manitarian gravity so de-cision making and leader-ship take place at the frontline and affected peopleare empowered to improvetheir lives. e principlesof decentralisation and di-versification set out in itsDeclaration of Intent1 speak
to ensuring local actor in-volvement and representation
rather than primarily focussingon or serving the needs of in-
ternational agencies. In makingthis mandate reality, Start delivers
programmes and brokers collabora-tions working through three pillars:
Start Fund, Start Build and Start Labs.
Start Fund: Development ofnew business models andfinancial mechanisms for crisisresponse by NGOse Start Fund, a rapid response global pooledfund, is currently backed by three sovereigngovernments (DFID UK, Irish Aid and theDutch Government), see Figure 1. e Fundhas been alerted for 36 emergencies, allocating£6m of funds since April 2014, and has signedagreements for £34m in funding over the nextthree years (see Figure 2 for overview of activa-tions).. Launched on 1 April 2014, the StartFund is a collaboration to create a multi-donor
pooled fund for global humanitarian action.e Fund allows fast response to both rapidonset emergencies and spikes in chronic criseswhere agencies on the ground need to reactquickly. It can be activated within 72 hours andcovers the needs of small scale emergencies forthe first 45 days. In the first 12 months, theStart Fund reached over 1.2 million people.Tanuja noted that most Start Fund responsesare multi-sector and some will include a nutritionelement. e recent Start Fund report lists thenumber of beneficiaries by sector over the 12months to March 20152. While water, sanitationand hygiene (WASH) and health were undoubt-edly the biggest sectors, nutrition sensitive pro-gramming was estimated to have reached 57,000beneficiaries.
e Network’s vision for the Start Fund is amulti-donor pooled fund of £100m a year. eStart Fund is also developing new financialmodels for humanitarian response to ensurethat crisis funding is not just an aer-the-factevent but that it can anticipate and respondeffectively based on forecasted events. Currentlyunder development are a bridging loan facilityfor early response and a parametric drought in-surance mechanism3.
Agency Profile. . . . . . . . . . . . . . . . . . . . . . . . . . . . . . . . . . . . . . . . . . . . . . . . . . . . . . . . . . . . . . . . . . . . . . . . . . . . . . . . . . . . . . . . . . . . . . . . . . . . . . . . . . . . . . . . . . . . . . . . . . . . . . . . . . . . . . .
3 Parametric insurance is similar to normal insurance, in that in return for a yearly premium (calculated by expected frequency and severity of an event) a pay-out is received if the event takes place. However a key difference is that instead of making payments on the basis of losses measured after an event, it makes the payments automatically based on pre-agreed triggers. For more information, see: http://www.start-network.org/news/start-trial-new-parametric-insurance-model-hif-funding/
. . . . . . . . . . . . . . . . . . . . . . . . . . . . . . . . . . . . . . . . . . . . . . . . . . . . . . . . . . . . . . . . . . . . . . . . . . . . . . . . . . . . . . . . . . . . . . . . . . . . . . . . . . . . . . . . . . . . . . . . . . . . . . . . . . . . . . .
Start Fund activations, April 2014 - March 2015Figure 2
For example, as the numbers of refugees and dis-placed people continues to escalate in the MiddleEast, with no apparent end in sight, a substantiallydifferent scale and set of humanitarian needs isemerging. e question is whether the currenthumanitarian system is set up to tackle them.People need humanitarian assistance that is ap-propriate for their needs. at could mean as-sistance that reaches people in small ‘below theradar’ events; rapid assistance that is providedimmediately aer a crisis onset; or assistancethat is provided in the early stages of a slowonset crisis. Ideally, this assistance will be flexibleand could include information, cash, goods orservices, as well as being anticipatory and re-sponding to shis in risk before crises emerge.

113
. . . . . . . . . . . . . . . . . . . . . . . . . . . . . . . . . . . . . . . . . . . . . . . . . . . . . . . . . . . . . . . . . . . . . . . . . . . . . . . . . . . . . . . . . . . . . . . . . . . . . . . . . . . . . . . . . . . . . . . . . . . . . . . . . . . . . . .
. . . . . . . . . . . . . . . . . . . . . . . . . . . . . . . . . . . . . . . . . . . . . . . . . . . . . . . . . . . . . . . . . . . . . . . . . . . . . . . . . . . . . . . . . . . . . . . . . . . . . . . . . . . . . . . . . . . . . . . . . . . . . . . . . . . . . . .
Start Build: Strengthening civilsociety capacity throughdecentralised, modern andeffective capacity buildinginitiativese humanitarian capacity gap (i.e. the gap be-tween the capacity that currently exists in thehumanitarian system and the capacity that isrequired) is ever widening and requires new in-vestment, new relationships, new actors andnew partnerships, as well as new capacities,skills and behaviours to help connect people incrisis with the best possible solutions. e StartBuild stream is concerned with this endeavourand embraces a philosophy of subsidiarity wherehumanitarian action is as local as possible andas international as necessary. is stream hasapproval for £26m of investments from DFID,in a portfolio of 13 collaborative capacity buildingprogrammes, each one a mini consortium con-sisting of members and non-members anddealing with common capacity challenges.
Start Build has developed a portfolio of ca-pacity strengthening projects where local capacityis prioritised and decision making takes placeas close to the front line as possible. Focus onmitigation, preparedness and response capacitywill help ensure that outcomes are more sus-tainable. is portfolio of work aims to supportinternational NGOs evolve from the delivery ofmaterial assistance towards a role that is asmuch about response as it is about brokering,facilitating and supporting local organisations.
ese collaboratively designed and managedprojects are part of the DFID initiated capacitybuilding project (DEPP) which is a ground-breaking three year programme that will invest£40 m in disaster and emergency preparedness.It is intended to significantly improve the qualityand speed of humanitarian response in countriesat risk of natural disaster or conflict related hu-manitarian emergencies. It will do this by in-creasing and strengthening the capacity of thehumanitarian system at all levels, although sup-port will be weighted towards training and de-velopment for local humanitarian workers atnational level. National preparedness systems,particularly around communication, will alsobe strengthened.
Start Labs: Evidence, enquiry,learning and experimentation,creating platforms forpartnerships and learningStart Labs activities strive to be a catalyst for in-novation, i.e. impact investing. e premise isthat the funding environment created by existingdonor mechanisms acts as a buffer against com-petition and provides obstacles to collaborationand to change within the humanitarian com-munity. e financing mechanisms being de-veloped and prototyped by Start are only partof the story. Start will also seek to seed frontlineinnovations around the world through the StartBeta stream that sits in this space. Beta is aboutidentifying, funding and promoting the small
scale innovators who can make a difference tohumanitarian response. Funding for this workwill come from non-traditional donors, eitherprivate philanthropists or foundations interestedin promoting innovation.
Funding, membership &governancee Start Network is currently funded by threebilateral donors (DFID UK, Irish Aid and theDutch Government), annual membership feesand occasional project grants from foundations.e plan is to scale up Fund, Build and Labssubstantially over the next three years. e Net-work, which is currently located in the Save theChildren UK’s London offices, will soon spinoff as an independent legal entity and furtherinternationalise. is May, five new western andnon-western NGOs joined the Network. eStart Network is planning to further expand,with a new membership window opening inAutumn each year. Criteria for new memberacceptance include commitment to the CoreHumanitarian Standards, financial sustainabilityand good governance.
Members’ participation in the Network is inaddition to their ‘day jobs’. Even so,they devotesignificant time to the development and scalingup of the Network by participating on the Board,in the Members’ Assembly and on various gov-ernance committees for Start Fund. e StartNetwork is governed by a Board of Trusteesmade up of member and independent repre-sentatives and an Assembly principally madeup of Humanitarian Directors. e Board isscheduled to meet six times a year, is responsiblefor the governance and strategic direction ofthe Network, and makes recommendations to
the Assembly for ratification. e Assemblycurrently meets quarterly to discuss Network-wide matters.
e Start Network aims to create structuresand agreements that enable the Network to fulfilits commitment of connecting people in crisisto the best possible solutions. Start Fund re-sponses are underpinned by a ConsortiumAgreement and a Start Fund agreement so thatthe Fund can respond within 72 hours of beingalerted to a crisis. ere are light governancestructures for the Committees that handle theseresponses and these are continuously streamlinedand improved to reduce transaction costs.
The Start Teame Start Team is a lean secretariat of around12 staff with an ambitious vision and a desire towork entrepreneurially to effect change and toestablish and grow the Network. is team ofindependent brokers is moving on multiplefronts and is helping the Network members tonavigate opportunities, work collaboratively anddeliver insights to the sector. e Start Networkbelieves this way of working with its memberswill change a humanitarian system that is cur-rently not fit for purpose. ere are also anumber of specialist advisors who support thiswork on the development and prototyping offinancing solutions and advocacy work.
e Start Network’s vision for the future is fora diverse and collaborative humanitarian sectorin which international and local agencies worktogether in managing crises, continually seekingways to fully engage beneficiaries in the response.e ENN fully concur with the Start Network’svision and wish them well in their endeavours.
Agency Profile
Star
t Fun
d
Handicap International, Nepal response

114
. . . . . . . . . . . . . . . . . . . . . . . . . . . . . . . . . . . . . . . . . . . . . . . . . . . . . . . . . . . . . . . . . . . . . . . . . . . . . . . . . . . . . . . . . . . . . . . . . . . . . . . . . . . . . . . . . . . . . . . . . . . . . . . . . . . . . . .
ENN updates.............................................................
e ENN extends thanks to Alex Bycro Masters student, at OxfordBrookes University, UK who undertook a Field Exchange citationsreview, included in this summary, on a voluntary basis.
An online user survey of Field Ex-change (FEX) was carried out be-tween March and May 2015. A re-quest to participate in the survey
was sent to FEX readers by email and on theENN website, with a link to the survey online.ere were a total of 138 respondents to thesurvey. Overall, 91% of respondents were satisfiedor very satisfied with FEX. More detailed findingsof the survey are as follows.
Nearly half of respondents were based inAfrica, just over a quarter in North Americaand Europe and 20% in Asia (see Figure 1).Most respondents worked in nutrition (66%),emergency nutrition (33%), infant and youngchild feeding (38%) and health (30%) sectors1.A minority worked in water, sanitation and hy-giene (WASH) (3.6%), agriculture (3.6%) andcash (2%) programming. Of 119 respondents,38% were working with international non-gov-ernmental organisations (NGOs), 15% govern-ment, 13% academic institutions and 6% localNGOs. Others were independent consultants/self-employed (12%), students (5%) or were workingwith civil society (1.7%) or private sector (6.7%).
FEX was read for personal learning and up-dating knowledge by 82% of respondents andto keep up to date with research by 50%. e re-
spondents reflected an established readership,with 60% having read FEX for three or moreyears (see Figure 2). Topics that respondentsreported learning most about (113 answers)were infant and young child feeding (28%),community based management of acute mal-nutrition (CMAM) (26%), emergency nutrition(20%), survey/coverage methodology (10%) andcash programming (9%).
Most respondents (73%) said that there areno topics, programmes or contexts missing fromFEX. Of those that said that there were areasmissing (27%), there were a wide range of sug-gestions including nutrition and HIV, transitionfrom emergency to development programming,nutrition sensitive agriculture, stunting preventionand nutrition and advocacy.
In terms of the usefulness of each of thedifferent types of articles in FEX, respondentsrated field articles as the most useful, followedby research, evaluations, news, views and edi-torials; agency profiles were rated as the leastuseful. Seventy-four percent of respondents (of110 answers) felt that the length of FEX is ‘justright’ while 83% were happy with the currentfrequency (three times per year). In terms ofthe level of technical detail of FEX editions,most respondents (78%) said it was just right,
whilst 15% said it was too detailed and 7% notdetailed enough. FEX editions can have eithermixed content or be thematic. When asked whichthey prefer (of 110 answers), 47% reported thatthey prefer mixed editions, 46% found both equallyvaluable and 7% preferred thematic editions.
An important question related to print oronline content; 65% (of 110 respondents) weresatisfied with the online facility and 25% werevery satisfied with it. Respondents were askedwithin which formats they read FEX; 78% re-ported reading FEX in print; 28% read individualarticles online and 23% read the whole issueonline. Of those that did not read articles online,70% said it was because they prefer print copiesand 22% said they had limited/too costly/noonline access. It is interesting to see that, in this
Summary of Field Exchange user survey findings
Where survey respondents were based (109 answers)Figure 1
Africa
28%
20%
46%
2%
4%
Asia
North Americaand Europe
South Americaand the Carribean
Middle East
How long respondents have been reading FEX (138 answers) Figure 2
More than 5years
30%
26%
34%
10%
3-5 years
1-3 years
Less than 1 year
“rough FEX I learn from otheragencies’ experience in dealing withfield level challenges in similarcontexts and adopt a similar approachfor successful programming.” Employee of an international NGO
1 More than one response possible.

115
. . . . . . . . . . . . . . . . . . . . . . . . . . . . . . . . . . . . . . . . . . . . . . . . . . . . . . . . . . . . . . . . . . . . . . . . . . . . . . . . . . . . . . . . . . . . . . . . . . . . . . . . . . . . . . . . . . . . . . . . . . . . . . . . . . . . . . .
digital age, print copies of FEX remain valuableand useful to our audience. It is also importantto note that this online survey will be biased to-wards those with accessible internet access.
Respondents reported that FEX has had a‘good’ or ‘large’ impact on their organisation orwork in a number of ways: information knowl-edge (82%), information awareness (76%), trans-fer of knowledge/strengthened intellectual ca-pacity (65%), networking with others (51%),and collaboration with others (45%). Further-more, 67% reported that they had applied FEXsourced evidence in field practice, while 46%reported that content had influenced strategyand policy. An additional average of 29% re-spondents reported ‘some’ impact.
Of 110 respondents, 15% reported havingever contributed an article for FEX. Of these,the majority (89%) said that they received ade-quate support from the editorial team. Sixty-three percent of respondents said that they have
recommended others to share their work throughFEX. When asked the reason for not writing anarticle (91 respondents), 43% were unsure ofthe process and nearly one quarter of respondentswere unsure regarding the value of their experi-ence to others (see Figure 4).
Most respondents valued the “public good”nature of FEX; 55% of respondents (of 109 an-swers) felt that FEX should be free to all, while39% felt it should be free to those working inlower income countries and only 6% of respon-dents said it should be paid for by subscription.
Most (90%) of respondents reported thatthey are satisfied with the way in which theENN communicates with them about FEX.When asked in which format they would like toreceive information from the ENN, 80% of re-
spondents said they would like to receive infor-mation by email, 60% via FEX, 34% via theENN website, 14% via Face book and 6% viaTwitter
Citations review To complement the user survey, from April toJune 2015 the ENN undertook a review toexplore how the ENN produced resources arecited and used in the development of a range ofexternal publications. e review was conductedon a voluntary basis by a Masters student.
is study found that, between Jan 2010 andJune 2015, 62 works (articles, publications orreviews) produced by the ENN were cited 128times in 93 journals, reports and theses. ENNpeer-reviewed articles were the most frequentlycited (10 articles cited 55 times), followed byfield articles (34 articles cited 44 times), write-ups of ENN research and reviews (nine writeups cited 17 times) and FEX news and viewspieces (three articles cited four times).
ENN authored works have been cited mostcommonly in peer-reviewed journals, as well asin organisational reports and academic theses.e peer-reviewed journals within which theENN works were cited, were wide-ranging andinfluential publications (including e Lancetmedical journal) and mostly focused on nutrition,food and health topics.
e topics/themes of the ENN works mostfrequently cited (in order of the most frequent)were malnutrition in infants less than six months;the double burden of malnutrition; CMAM;supplementary feeding; aid effectiveness; infantand young child feeding; cash programming;and wasting and stunting.
is small review indicates that the ENNpublications are both well-read and well regardedby academics and peers, and have been used tocontribute to the evidence base of effective nu-trition and food security research, policy andprogramming.
ENN responsee number of field articles per edition hasmore than doubled in recent years meaning the
edition has inevitably grown in size; we havequestioned amongst ourselves whether it maybe too big for our readers to digest but thisseems not to be case.
We will continue to publish a variety of in-novative programme experiences and researchon the key topics that are important to people(e.g. IYCF, CMAM, coverage and cash) and willconsider the suggestions made by respondentsfor new topics. Some of these suggested topicsare already planned for inclusion in upcomingissues; FEX 51 will be a thematic issue on nutri-tion-sensitive programming. Stunting (and link-ages with wasting) is a key area of ENN researchinterest; we will be opening a stunting thematicdiscussion area on ENNs online forum, en-net,in the near future.
Other actions that we will take stemmingfrom this feedback include;• Developing a guide on how to write an
article that will include an outline of the support the editorial team can offer. is is included in FEX 50 and is also available online at www.ennonline.net/fex.
• Our recent online versions of FEX have been produced in A4 format to facilitate easier home printing and online viewing; this will continue.
• We have included agency profiles in FEX since the publication began, but perhaps this survey shows that they are less relevant for our current audience with field articles and research more valued by readers. We will review the agency profile slot.
Overall we are delighted that our readers appearto be satisfied with FEX. We will strive tocontinue to publish articles that are interestingand useful to our audience and that will ultimatelyhave a positive impact on their work and thesector as a whole. We will continue to fundraise to ensure that we sustain our model offree access to print and online content for all.We sincerely thank all those who took part inthe survey.
Feedback on FEX is welcome at any time. Sendyour observations and suggestions to: MarieMcGrath, Co-editor, [email protected]
What proportion of FEX do respondents read(111 answers)Figure 3
The whole edition
15%
19%
17%
21%28% Three quarters of
an edition
Half of an edition
Quarter of anedition
A couple ofarticles
Reasons for not contributing an article to FEX(91 answers)Figure 4
Unsure ofprocess
17%
24%
43%
16%
Unsure ifexperiences are ofinterest to others
Don't haveexperiences toshare
No time to spendwriting
“FEX provides evidence-basedpractice that we would otherwisemiss.” Employee of an African-based academic institution
. . . . . . . . . . . . . . . . . . . . . . . . . . . . . . . . . . . . . . . . . . . . . . . . . . . . . . . . . . . . . . . . . . . . . . . . . . . . . . . . . . . . . . . . . . . . . . . . . . . . . . . . . . . . . . . . . . . . . . . . . . . . . . . . . . . . . . .ENN updates

116
. . . . . . . . . . . . . . . . . . . . . . . . . . . . . . . . . . . . . . . . . . . . . . . . . . . . . . . . . . . . . . . . . . . . . . . . . . . . . . . . . . . . . . . . . . . . . . . . . . . . . . . . . . . . . . . . .. . . . . . . . . . . . . .
. . . . . . . . . . . . . . . . . . . . . . . . . . . . . . . . . . . . . . . . . . . . . . . . . . . . . . . . . . . . . . . . . . . . . . . . . . . . . . . . . . . . . . . . . . . . . . . . . . . . . . . . . . . . . . . . . . . . . . . . . . . . . . . . . . . . . . .
Summary of en-net user survey findings
In April and May 2015, the ENN undertook auser survey of en-net. An online survey wasdistributed to ENN’s mailing list and an inviteto participate posted on the en-net and ENN
websites. ere were in total 289 responses. efollowing is a summary of the main findings andENN’s reflections on them.
Awareness and use of en-netOver half of the respondents (57%) who use en-nethave registered and set up a profile. Of those whoare not registered users, but view en-net discussions,their main purpose in using en-net is “to learnabout the field experiences of others” (70% of 45responses). Seventy-nine per cent of 107 respondentssaid they had recommended en-net to others.
Among registered users, 81% had signed up tokeep up with the latest debates and issues innutrition in emergencies; 65% to keep aware ofthe latest guidance on technical topics (peoplecould tick more than 1 option); while 16% signedup purely to ask a specific question aer whichthey have not used en-net much at all.
In terms of obstacles to the use of en-net, 70%of 46 non-registered respondents stated that nothingprevented them from using en-net. Where some-thing did, lack of or poor internet access was themost common reason cited, followed by not havingenough time.
For registered respondents a similar 70% (of101 respondents) said nothing put them off usingen-net. However, lack of time, followed by the con-sideration that questions seem to be adequately re-sponded to by others were the primary reasonsthat put some people off contributing.
A very small number of comments criticisedthe occasional response from users with inadequateexpertise to advise others, and en-net technicalexperts providing inaccurate advice or dominatingresponses and raised the need to encourage differingopinions by academics.
e purpose of en-net is to provide an openplatform to encourage sharing of experience, aswell as providing best practice advice. ENN is con-tinually seeking to engage more people and thesharing of more experiences through en-net. Wewill continue to promote the site widely and en-courage greater participation of experienced nu-tritionists to respond to questions, calling in ourTechnical Moderators as necessary when conflictingadvice is provided or there has been a lack of re-sponse to a particular question.
En-net content: its relevanceand value to those working innutrition in emergencies Seventy per cent of 141 respondents (non-registeredand registered) stated that en-net had providedsignificant added value to their work; with a further28% noting a small added value. It is clear fromthe varied responses that people value both the
shared experiences of people working in the fieldas well as inputs by experts in technical areas.Knowledge, experience and guidance from en-netare being used in programming and training aswell as research and policy development.
Users who had posted a question were askedwhether the response directly influenced their workor study: 68% of 40 respondents replied positively.
Forty-one percent of 44 non-registered usersresponded that there were additional topics thatthey would like to see on en-net. A smaller per-centage (28%) of registered users said there wereadditional topic areas they would like to see. esuggestions by both groups were very varied andit is difficult to pick out common themes.
ere were requests for more discussion onlivelihoods and agriculture/nutrition links. ereis an existing forum area for livelihoods, which iscurrently poorly used. ere may be an opportunityto direct this more towards nutrition/agriculturelinks as there is increasing global interest in this.
Several requests for discussion of cross-sectoralor integrated programming were raised, includingDRR/nutrition, WASH/nutrition, cash, nutrition andhealth, multisector programming and coordination.
In the light of these comments and the evolvingglobal interest, ENN will close down the forumarea on livelihoods and set up a new area for nu-trition sensitive programming where a variety ofissues can be discussed. If there proves to be sub-stantial interest in specific sectors, such as WASHor food security, further forum areas can be set upto focus more exclusively on such topics.
Reference materials and research papers weresought alongside many requests for training oppor-tunities, links to online training courses and capacitydevelopment materials, e.g. “sharing video lecturesand tutorials from field findings”. We will furtherexamine how we can develop the “Upcoming trainingsarea” and host links to online courses/opportunities.
Another area of request was around communitymobilisation, community awareness-raising and howto conduct programming in the community. Currently,if these types of questions are not specific to particularprogrammes, they can be raised in the cross-cuttingissues forum area. We will promote this area furtherto ensure users are aware of this option.
A few comments also highlighted the need tokeep adapting en-net in the light of the changingglobal policy dialogue and challenged the specificemergency focus: “Topics should better reflect thechange in the environment in recent years”; “Recognisethat management of acute malnutrition is not onlyan issue during periods of acute emergency withsignificant external resources available” “ I thinkthe word "emergency" should be kept out to talkabout nutrition in and out of emergencies”.
ENN is seeking to address these issues morebroadly. However, en-net aims to adapt to the
needs of its users and accommodate the mostpressing areas of discussion and debate. ereforewe hope to encourage a more inclusive dialoguethrough new forum areas to include nutrition sen-sitive programming, stunting prevention and nu-trition contextual analysis.
Mechanism and user-friendliness of en-netNearly one – third (29%, 108) of respondents visiten-net weekly to view discussions; a further 15%report visiting the site on a daily basis. One fih(21%) rarely visit the website as they read the dis-cussions in their inbox, whilst 18.5% infrequentlyvisit the site.
Most (94%) of 105 respondents find en-net tobe user-friendly and 77% of 107 respondents findthe amount of emails they receive to be just right;17% find them too many. Some of the latter did notappear to be aware that there is an option to selectnotification of questions only. To address this, wewill prepare a notification with a reminder of theavailable functions of en-net.
Again, most (94%) of 31 people who had askeda question said it was posted to the forum in goodtime; 84% said their question was answered ingood time; 81% said they received a useful and ad-equate response. Of those who did not, the issueswere non-response to a question, being providedwith links to an old document, and receiving anopinion from the technical moderator but nothingmore. e en-net moderators endeavour to ensurethat questions are responded to by peers or by atechnical moderator. However, we will seek totighten up our mechanisms to ensure all questionsreceive a useful response.
Ninety-three percent of 41 respondents saidthey would use en-net again to post a question.
Forty-two per cent (of 110 respondents) saidthey had been alerted to a training opportunity orjob vacancy of interest through en-net. Of the 15respondents who provided further detail, seven de-scribed training opportunities and eight job vacancies.
Overall summaryIn conclusion the survey was extremely positiveand reflects that en-net continues to be relevant toits users and provide a useful service, encouragingdebate and sharing information that can be prac-tically applied in programming, as well as policydevelopment, training and research.
However, there is room for improvement insome areas and the respondents to this survey haveprovided the en-net team with very helpful guidanceand suggestions to move forward and continue tomaintain a forum that responds to its users’ needsand keeps pace with the global agenda.
We welcome feedback and suggestions on en-net at any time. Contact: Tamsin Walters,en-net moderator, email:[email protected]
By Tamsin Walters, en-net moderator
ENN updates

117
. . . . . . . . . . . . . . . . . . . . . . . . . . . . . . . . . . . . . . . . . . . . . . . . . . . . . . . . . . . . . . . . . . . . . . . . . . . . . . . . . . . . . . . . . . . . . . . . . . . . . . . . . . . . . . . . . . . . . . . . . . . . . . . . . . . . . . .
. . . . . . . . . . . . . . . . . . . . . . . . . . . . . . . . . . . . . . . . . . . . . . . . . . . . . . . . . . . . . . . . . . . . . . . . . . . . . . . . . . . . . . . . . . . . . . . . . . . . . . . . . . . . . . . . . . . . . . . . . . . . . . . . . . . . . . .
Summary of Nutrition Exchangeuser survey findings
ENN knowledgemanagement supportto the SUN Movement
In April - May 2015, an evaluation of theENN’s publication, Nutrition Exchange, wasconducted through an online survey. NutritionExchange is an annual publication produced
in three languages (English, French and Arabic)in print and e-copy. It targets those working inthe nutrition and related sectors at national leveland features both original content and summarisedField Exchange and other material. Key findingsare presented here.
Where are our readers located?A total of 159 respondents completed the survey.Of the 136 respondents who indicated whichcountry they were working in, most were in Africa(65%) while others were working in North Amer-ica/Europe (14%), Asia (13%), Middle East (5%)and South America/Caribbean (1%). In responseto what type of organisation they work for, 32%(of 138 respondents) were working with internationalnon-governmental organisations (NGOs), 15%government, 12% United Nations (UN) agencies,11% academic institutions and 8% local NGOs.Others were independent consultants/self-employed(7%), students (5%) or were working with civil so-ciety/private sector (4%).
Use of Nutrition ExchangeRespondents primarily use Nutrition Exchange forpersonal learning (68% of 140 respondents); to keepup to date with news (54%) and research (46%);and to understand how other agencies are dealingwith challenges or programming in specific contexts(32%). Nutrition Exchange is also shared and usedto build capacity of staff and local partners.
Interest of readersAll types of Nutrition Exchange content (pro-gramming experiences, research and news/events)were identified as valuable (140 respondents).Respondents suggested that additional informationon the following topics would be useful: infantand young child feeding (IYCF) including com-plementary feeding; stunting prevention; nutritionprogrammes for adolescents, adults and theelderly; and experiences from governments onmainstreaming nutrition at policy level.
Contributing to NutritionExchangeSixteen per cent of 140 respondents have con-tributed to an article published in Nutrition Ex-change. Respondents reported the followingbenefits from writing up their experiences forpublication: sharing their experiences morewidely through the publication; improving theirwriting skills; and increased visibility of theirorganisation and its work. For respondents whohave not contributed to Nutrition Exchange, themain reasons (reported by 112 respondents)why they have not were that they were unsureof the process; had no time; were unsure if theirexperiences are valuable to others; and lack ofconfidence in their own writing skills.
Access and readingpreferencesHalf of the respondents received print copiesand half received only electronic copies of thepublication. Many receiving only an electroniccopy did not know it was possible to receive aprint copy. Regarding preferred frequency ofthe publication, more than half of survey re-spondents (54% of 129 respondents) were happywith an annual publication while 45% requestedmore frequent publication, the majority suggestingtwice a year or quarterly publications. Regardinghow respondents would like to receive informationfrom the ENN in the future, 76% (of 123 re-
“I have adopted a number of researchideas from other countries (shared inNutrition Exchange) and contextualisedthem to my own current programming”Local NGO worker
“We use Nutrition Exchange toinform our practices and theprogrammes we implement.”INGO worker
The ENN has recently secured fund-ing from DFID to support knowl-edge management (KM) for theSUN Movement during the next
phase (SUN 2). is programme will rununtil 2020 and the work will focus on lessonlearning related to scaling up nutrition pro-grammes in fragile and conflict affected states.In order to carry out the work, the ENN teamwill expand to include a global KM coordinatorand two regional KM staff (one in Africa andone in Asia). is team, supported by ENNtechnical directors, will prepare an ENN KM
action plan for 2016-2020 in consultationwith the SUN Movement Secretariat (SMS)and DFID. We anticipate that learning fromthis project will appear in both Field Exchangeand Nutrition Exchange regular issues (contentis already in development for issue 51), inaddition to one special Field Exchange issueand one additional Nutrition Exchange editioneach year devoted to SUN experiences. en-net will also develop thematic areas specificallyrelated to this project.
Updates on this work will feature on ourwebsite, www.ennonline,net
spondents) requested regular news updates viaemail from ENN, 54% were interested in keepingup to date via the ENN website while 12% ex-pressed interest in receiving news via Facebook.
Overall a majority of respondents (95% of129 respondents) were satisfied with the publi-cation. Suggestions for improving the publicationincluded increasing contributions from govern-ment staff and more information on nutrition indevelopment contexts.
A word from the NutritionExchange editorial teamNutrition Exchange aims to be a publicationwritten by national actors for national actors sowe are pleased to see this re-emphasised in thissurvey. Please encourage those working in gov-ernment and in civil society organisations to getin touch with us about writing up their experiencesof nutrition programming.
e editors have developed a short guide onhow to publish a short article in Nutrition Ex-change, available at http://www.ennonline.net/subscribe/Nutrition Exchange or contact the ed-itorial team who will support you to write anarticle via [email protected].
Summaries of published research and pro-grammes on the topics identified in the evaluationwill be prioritised for the Nutrition Exchangeissue. Additionally, a call for readers’ experiencesand learning around these topics will be issuedlater this year.
Currently, ENN funding is for an annual pub-lication of Nutrition Exchange. However, in 2016,ENN is likely to be producing Nutrition Exchangetwice per year. We will also explore other waysto capture and disseminate learning and willnotify our readers of new developments. Pleaseview ENN’s newsroom for continual updates inthe sector http://www.ennonline.net/ newsroom
To receive a free print copy of the NutritionExchange issue, please register at http://www.ennonline.net/subscribe/Nutrition Exchange
ENN updates

118
. . . . . . . . . . . . . . . . . . . . . . . . . . . . . . . . . . . . . . . . . . . . . . . . . . . . . . . . . . . . . . . . . . . . . . . . . . . . . . . . . . . . . . . . . . . . . . . . . . . . . . . . . . . . . . . . . . . . . . . . . . . . . . . . . . . . . . .
. . . . . . . . . . . . . . . . . . . . . . . . . . . . . . . . . . . . . . . . . . . . . . . . . . . . . . . . . . . . . . . . . . . . . . . . . . . . . . . . . . . . . . . . . . . . . . . . . . . . . . . . . . . . . . . . . . . . . . . . . . . . . . . . . . . . . . .
. . . . . . . . . . . . . . . . . . . . . . . . . . . . . . . . . . . . . . . . . . . . . . . . . . .
Field Exchange 51: Nutrition sensitive programmes – call for content
The ENN is planning a special edition of FieldExchange that will be devoted to nutritionsensitive programming and related policy and
research (NSP). While Field Exchange has routinelyincluded field articles on NSPs in the past, the aimof this special issue is to bring together a fuller bodyof work that allows lesson learning and identificationof where there are knowledge gaps, both in what todo in NSP and how to do it in the field.
A guest editorial panel (Jody Harris, IFPRI (In-ternational Food Policy Research Institute)1 andAaron Buchsbaum, consultant for the SecureNutrition2
platform) will support the regular editorial team.
Issue 51 will be published in December 2015.We are currently seeking articles to feature in theedition.
Article requirementsAll articles should fall within the definition of NSPsoutlined in Box 1 involving single or multi-sectoralprogramming. Our populations of concern are notlimited to pregnant and lactating women and youngchildren but include other population groups, e.g.older people. We are also interested in programmingexperiences where nutrition sensitive componentshave evolved (e.g. nutrition objectives have beenadded to a programme rather than planned fromthe outset).
Suggested themes include but are not limited to:1. Formulating nutrition objectives for different
sectors2. Creation, adaptation, and/or use of relevant
frameworks and theory of change3. Monitoring and evaluation, either for impact
or for process/intermediate outcomes4. Successes and challenges in working across
sectors from an institutional perspective5. Challenges and successes in field-level
implementation6. Intersection of programme learning or
knowledge management and nutrition sensitive programming
7. Implementer reflections on pros/cons/concernswith NSP overall. is might include learning around programme design.
8. Funding challenges around NSPs
None of these themes are mutually exclusive andfield articles could cover a number of areas andother themes, if the author believes they representimportant learning. Our suggestions for themesare not exhaustive and if an article doesn’t seem tofit thematically with ours, please still considerwriting something. ere may well be themes thatwe have not considered. If unsure, pick up a phoneor email us (contacts below).
It is important that authors document the detailsof programme experience which have informedthe learning. All articles should therefore describethe country context for the programme and a briefchronology of the programme itself. We are interestedto hear not only success stories but where pro-gramming did not achieve intended objectives; thisis powerful learning.
Process of article development1. Original articles (field articles, research,
views)Submit a short (up to 400 words) abstract on youridea for an article. Include information on:a) e context (country, programmatic)b) Type of nutrition-sensitive programming
single or multi-sectoral, and which sectors. c) Which theme this article will speak to (listed
above or additional theme)d) Highlight 3-4 key lessons learned
Based on your abstract, we may ask for more infor-mation or have a phone call with you to explorethe details. Based on our review, the ENN mayinvite you to write an article for the edition ofaround 2500 words.
e ENN editorial team can support the write-up process, e.g. providing feedback on early dras.If you would like to discuss an idea you have beforedeveloping an abstract, send us an email and wecan explore this with you. (See below more detailson how we can support you to write an article).
2. Research, evaluation and newsIf you wish to feature a research or evaluation sum-mary, share any original report with us. e ENNcan prepare summaries for review by the contributingauthor, or the author can prepare a summary andsubmit to the editorial team. For news items, sendus relevant online links or relevant content (newspieces may be up to 400 words). Letters should besent to the contact below.
ContactsAll submissions should be sent to Marie McGrath,Field Exchange Co-editor, [email protected] UK: +44 (0)1865 249745.
In the 2013 Lancet series, NSPs are defined as in-terventions or programmes that address the un-derlying determinants of foetal and child nutritionand development, which include food security;adequate caregiving resources at the maternal,household and community levels; access tohealth services; and a safe and hygienic environ-ment. Most importantly, these NSPs must incor-porate specific nutrition goals and actions. Fur-thermore, NSPs can serve as delivery platformsfor nutrition-specific interventions, potentially in-creasing their scale, coverage, and effectiveness.
Examples of potential NSP sectors include; agri-culture and food security; social protection; water,hygiene, and sanitation; early child development;maternal mental health; women’s empowerment.Interventions themselves may be single sectorin nature, with explicitly stated nutrition objectives,or may be multi-sector interventions aiming toconverge on affected populations. A key elementof any such programming is that nutrition ob-jectives are clearly stated and that there is somearticulation of a conceptual basis for assumingimpact on nutrition, e.g. formulation of causalpathways or theories of change.
Deadlines for submissionAll content must be finalised by early November.Closing date for abstracts is 15 October 2015.
We welcome submissions of – or ideas for –field articles, research, evaluations, news, viewsand letters at any time. Field articles are detailedaccounts of programming experiences, challengesand lessons learned. Research may be originalfield research or summaries of relevant research.Relevant evaluations may be original or summarycontent. News pieces are short articles high-lighting or summarising initiatives or resourcesrelated to nutrition, e.g. key meetings, training,guidelines, assessment tools, etc. Views articleshare a particular individual or agency’s per-spectives. Letters responding to previous articlesor raising new issues are always welcome.
1 www.ifpri.org2 www.securenutritionplatform.org
How to write an article for Field Exchange
There are different ways of developing anarticle for Field Exchange, depending onwhat suits you.
e editorial team (Jeremy & Marie) can have acall with you to discuss an idea you might have. Onthe basis of this, we can help you flesh out theframework for an article. We can then support youto write it, for example providing feedback on drasor editing content.
You can submit a short abstract (e.g. 400 words)outlining a proposed article. is should includewhat you think the key lessons are for others in asimilar situation. We will make suggestions – inwriting or on a call – and again can support you todevelop the full article if you wish.
You may have an existing internal report that de-scribes a programme experience but don’t have thetime to turn it into a field article or research piece.We can help. Send us the original report and we willreview its potential. We can develop an article andthen share it with you for review and additions (e.g.elaborating on lessons learned and discussion).
Sometimes we receive fully written articles forconsideration. We will review and seek any clarifi-cations and sometimes make suggestions for extrainformation.
Where an article specifically challenges a standardapproach to programming or refers to anotheragency (for example), we may seek a postscriptfrom an external reviewer or the agency in questionthat will accompany the article. We feel it is importantto share all relevant experiences but ensure there isfair balance.
When you submit an article for Field Exchange,you will complete a simple author form that includesyour biographical details and any acknowledgments.
We also request headshots of the authors andprogramme pictures to accompany the article (wecan also find pictures from other sources if this isdifficult for you).
e length of a field article varies from 2000-4000 words; our ideal is around 2500 words. Wecan help to edit down longer articles so submissions
of up to 4000 words are acceptable. Other types ofarticle (e.g. research summaries, views pieces, etc)are expected to be shorter. Please submit abstracts/ar-ticles in a word document.
If you have an idea for an article, or anabstract/full article to share, please contact MarieMcGrath, [email protected]
How do we define nutritionsensitive programming?Box 1

119
. . . . . . . . . . . . . . . . . . . . . . . . . . . . . . . . . . . . . . . . . . . . . . . . . . . . . . . . . . . . . . . . . . . . . . . . . . . . . . . . . . . . . . . . . . . . . . . . . . . . . . . . . . . . . . . . . . . . . . . . . . . . . . . . . . . . . . .
. . . . . . . . . . . . . . . . . . . . . . . . . . . . . . . . . . . . . . . . . . . . . . . . . . . . . . . . . . . . . . . . . . . . . . . . . . . . . . . . . . . . . . . . . . . . . . . . . . . . . . . . . . . . . . . . . . . . . . . . . . . . . . . . . . . . . . .
People in aid
Participants in the Transforming Nutrition Summer School at IDS, July 14-18th, UK)

菀菀菀
Editorial teamJeremy Shoham, MarieMcGrath, Deirdre Handy.
Office SupportThom Banks, Charlotte Roberts,Clara Ramsay, Peter Tevret, Judith Fitzgerald
The Emergency Nutrition Network (ENN) is a registered charity in the UK (charity registration no:1115156) and a company limited by guarantee and not having a share capital in the UK (companyregistration no: 4889844). Registered address: 32, Leopold Street, Oxford, OX4 1TW, UK. ENN Directors/Trustees: Marie McGrath, Jeremy Shoham, Bruce Laurence, Nigel Milway, Victoria Lack, Arabella Duffield.
Carmel Dolan and EmilyMates are TechnicalDirectors.
Jeremy Shoham andMarie McGrath areField Exchange Co-Editors andTechnical Directors.
Orna O’ Reilly designsand produces all ofENN’s publications.
Phil Wilks (www.fruitysolutions.com) manages ENN’s website.
Chloe Angood is a nutritionist working part-time with ENN on a numberof projects and supporting Human Resources.
Thom Banks isthe ENN’s Project Operations Manager basedin Oxford.
The ENN team would like to say a big thank you to Charlotte Roberts, who has moved on topastures new in a new full time position in Oxford. A wonderful organiser, she played a key rolein sorting ENN meetings, resource mailings and travel, patiently accommodating our everchanging requests. We wish her every success and look forward to guest appearances at ENNChristmas parties.
Departure of Arabella Duffield from Trustee BoardThe ENN would like to heartily thank Arabella Duffield, who stepped down from the Trustee Boardin July 2015, for her longstanding support of the ENN. Arabella joined the Board on ENNs firstregistration in the UK as a charity in 2005 and has been with us since through ‘thick and thin’. Wewish her the very best.
Anna Taylor joins the ENN Board of TrusteesThe ENN are delighted to welcome Anna Taylor to the Board of Trustees. Anna joined the FoodFoundation as its first Executive Director at the beginning of June 2015, after five years at theDepartment for International Development (DFID). At DFID, Anna led the policy team on nutritionand supported the delivery of the UK’s global commitments to tackle undernutrition. Before
joining DFID, Anna worked for a number of international organisations, including Save the Children and UNICEF,working on international nutrition policy and supporting programmes in a wide range of contexts in Africa andSouth Asia. In 2014, she was awarded an OBE for her work to address the global burden of undernutrition. She dida MSc in Human Nutrition at the London School of Hygiene and Tropical Medicine in 1994.
Clara Ramsay isthe ENN’s Finance Assistant, based inOxford.
Peter Tervet isENN’s Senior Finance Manager,based in Oxford.
The opinions reflected in Field Exchange articles arethose of the authors and do not necessarily reflectthose of their agency (where applicable).
The Emergency Nutrition Network (ENN)grew out of a series of interagency meetings focusing on food and nutritional aspects of emergencies. The meetingswere hosted by UNHCR and attended by a number of UN agencies, NGOs, donors and academics. The Network is theresult of a shared commitment to improve knowledge, stimulate learning and provide vital support andencouragement to food and nutrition workers involved in emergencies. The ENN officially began operations inNovember 1996 and has widespread support from UN agencies, NGOs, and donor governments. The ENN enablesnutrition networking and learning to build the evidence base for nutrition programming. Our focus is communities incrisis and where undernutrition is a chronic problem. Our work is guided by what practitioners need to work effectively.• We capture and exchange experiences of practitioners through our publications and online forum• We undertake research and reviews where evidence is weak• We broker technical discussion where agreement is lacking• We support global level leadership and stewardship in nutrition
Field Exchange is one of the ENN's core projects. It is produced in print and online three times a year. It is devotedprimarily to publishing field level articles and current research and evaluation findings relevant to the emergencyfood and nutrition sector.
The main target audience of the publication are food and nutrition workers involved in emergencies and thoseresearching this area. The reporting and exchange of field level experiences is central to ENN activities. The ENN’supdated strategy (following mid-term review in 2013) is available at www.ennonline.net
Contributors for this issue:
CoverJan Eijkenaar, Mali, 2008
The ENN welcome Judith Fitzgerald,our newest recruit, who has replacedCharlotte Roberts as the Operationsand Mailing Assistant at the ENN.
Thanks for the pictures to:
The Team
. . . . . . . . . . . . . . . . . . . . . . . . . . . . . . . . . . . . . . . . . . . . . . . . . . . . . . . . . . . . . . . . . . . . . . . . . . . . . . . . . . . . . . . . . . .
Chris Osa IsokpunwuAmy MayberryArjan De WagtClaire HarbronEva LeidmanCecile BasquinLouise Mwirigi-MaseseOleg BilukhaSuzanne FuhrmanAlina MichalskaElizabeth MolloyNatasha LelijveldJennifer WeissGwyneth CotesAdama NdiayeEsaie Diongoto DomayaHermann Zose OuedraogoIsmael Ngnie-TetaMahamat BechirPaola ValentiMark RolandSasha FrankelMarty MakinenJan Eijkenaar Charulatha BanerjeeMonsurul HoqDr. Ehsanul Matin Maguy KhanumDonna Isabel S. CapiliA.M. Francesca Tatad Katherine Ann V. ReyesMaria Asuncion SilvestreRomelei Camiling-AlfonsoDiego MacíasIfeanyi MaduanusiMaureen GallagherSaúl GuerreroAjay Kumar SinhaDolon Bhattacharyya Raj BhandariChloe PuettAssaye BultiMark MyattStanley ChitekweKillian FordeFiona O’Reilly Lawrence Hadaad
Lola GostelowMax O BachmannAndre BriendJ.H BradburyJ.P.BaneaC. MandombiD, NahimanaI.C. DentonN. KuwaTamsin WaltersRachel EvansChristoph AndertSusan FullerEmily MatesAnna LarteyChristian Els and NilsCarstensen Carlos Navarro ColoradoLola GostelowHelen YoungAnna Taylor Chloë WurrJoke Zeydner Saskia van der KamGeorgia BeansSibida GeorgeKevin P.Q. PhelanCandelaria LanussePascale DelchevalerieNathalie AvrilKerstin HansonPascale Fritsch Katja Siling Ernest Guevarra Scott IckesAlex LeaTanya KharaCarmel DolanMargie Buchanan-Smithand Sarah RoutleyAndy FeatherstoneAjay Kumar SinhaDolon Bhattacharyya Raj BhandariSaul GuerreroÓscar Serrano OriaGeorge Kent
Nikki BlackwellMarko KeracNicky DentAlexia Webster/ConcernMalawiACFHermann OuedraogoScott IckeJan EijkenaarCharulatha Banerjee/TdhQuentin BrunoNanay BayanihanRomelei Alfonso/KMIMylene Santana
Field Exchange supported by:
Diego Macías/ACFFLAIR IndiaMaria Asuncion SilvestreUNICEFMarko KeracClaire Mogol, Bangko Sentral Audio Visual DivisionThe Global Fund / Andrew EsieboWFP/Joelle EidAngel Navarrete, MSF IndiaRamatoulaye Moussa MazouRein SkullerudJames GiambroneWFP Photo Library
DesignOrna O’Reilly/Big Cheese Design.com
WebsitePhil Wilks