Annual Report - Carlsberg Group
139
ANNUAL REPORT 2021
-
Upload
khangminh22 -
Category
Documents
-
view
0 -
download
0
Transcript of Annual Report - Carlsberg Group

ANNUALREPORT2021

CARLSBERG GROUP ANNUAL REPORT 2021 TO OUR SHAREHOLDERS 2
TO OUR SHAREHOLDERS Letter from the Chair & the CEO ......... 3
2021 HIGHLIGHTS Strategic priorities ...................................... 5 Financial results .......................................... 7
OUR BUSINESS Our regions ................................................... 9 Our brands ................................................. 10
2021 REVIEW AND 2022 EXPECTATIONS Group ........................................................... 12 Western Europe ....................................... 16 Asia ............................................................... 18 Central & Eastern Europe .................... 20 Capital allocation .................................... 22 2022 earnings expectations ................ 23
OUR STRATEGY Our purpose ............................................... 24 Business model ........................................ 25 Delivering on SAIL’22 ............................ 26 Our new strategy – SAIL’27 ................ 31 Addressing climate risks ....................... 33 Managing risks ......................................... 34
GOVERNANCE Corporate governance ........................... 37 Supervisory Board................................... 43 Executive Committee ............................. 46 Share information ................................... 48 Forward-looking statements and ESEF ............................................................. 49
CONSOLIDATED FINANCIAL STATEMENTS Statements ...........................................51 Notes ......................................................55
PARENT COMPANY FINANCIAL STATEMENTS Statements ........................................ 124 Notes ................................................... 127
REPORTS Management statement ................ 134 Auditor’s reports .............................. 135
MANAGEMENT REVIEW
FINANCIAL STATEMENTS
OUR ANNUAL REPORTING Our annual reporting suite comprises our Annual Report, our Environment, Social & Governance Report and our Remuneration Report. Each includes content tailored to its specific audience, and cross-references to the other reports where relevant. The Environment, Social & Governance Report serves as our annual Communication on Progress to the United Nations Global Compact and is, as such, our disclosure in accordance with sections 99a, 99b and 99d of the Danish Financial Statements Act. It can be downloaded at this link: https://www.carlsberggroup.com/reports-downloads/carlsberg-group-2021-esg-report/ Front page: The DraughtMaster system enables our on-trade customers to serve a wide selection of core and premium beers and alcohol-free brews.
ENVIRONMENT, SOCIAL & GOVERNANCE REPORT
Our Environment, Social & Governance Report provides
detailed information and data on sustainability and our
responsible business behaviour.
ANNUAL REPORT Our Annual Report is our detailed annual dislosure relating to company performance, strategy, corporate governance and financial results.
REMUNERATION REPORT Our Remuneration Report includes full disclosure of Supervisory Board and Executive Management remuneration.

CARLSBERG GROUP ANNUAL REPORT 2021 TO OUR SHAREHOLDERS 3
The Carlsberg Group delivered a strong set of results despite the continued challenges posed by COVID-19.
Once again in 2021, our people, businesses, customers and societies at large were, to different degrees and at different times, affected by the pandemic. As was the case in 2020, our main focus remained the health and wellbeing of our people and at the same time ensuring the health of our business. It was encouraging to see that many beer markets, particularly in Western Europe, recovered during the summer months, with consumers eager to socialise and return to the on-trade. This gives us confidence in the resilience of the beer markets. We do recognise, though, that many markets are still suffering and continue to face significant adversity.
Despite the ongoing challenges of the pandemic, we are pleased to report good financial, strategic and organisational health for the Carlsberg Group. FINANCIAL HEALTH Our financial results saw strong progress in 2021, albeit supported by favourable comparables. Revenue grew organically by 10.0%, the result of 7.4% volume growth and 3% higher revenue/hl. Operating profit was DKK 10.9bn, with organic growth 12.5%. These results brought our 2021 figures well ahead of 2019. Free cash flow was DKK 8.9bn, and ROIC improved by 140bp to 10.3%. Read more about our Group results on pages 12-15. These results were achieved thanks to the strength of our brand portfolio and geographic footprint, and the embedding of our Funding the Journey culture across the business. Combined, these factors safeguard
both the short- and long-term health of the Carlsberg Group. Uncertainty and volatility continued during 2021. However, thanks to better-than-expected results across the Group, we were able to upgrade our earnings expectations twice – in August and October. During the year, we made significant cash returns to our shareholders. In March, we paid a dividend of DKK 3.2bn. In addition, we carried out quarterly share buy-back programmes amounting in total to DKK 3.6bn in fiscal 2021. On 4 February 2022, we initiated a new quarterly share buy-back programme of DKK 1bn. More information on the share buy-back programmes can be found on page 22. STRATEGIC HEALTH The choices made in SAIL’22 and the execution of our strategic priorities have been key for our financial
LETTER FROM THE CHAIR & THE CEO
A COMPANY IN GOOD HEALTH
To our shareholders
Cees ’t Hart
Cees ’t Hart
Flemming Besenbacher
Flemming Besenbacher has been a highly committed and dedicated Chair. He has reinforced the unique legacy of Carlsberg, while supporting long-term value creation for all stakeholders. Cees ’t Hart CEO

CARLSBERG GROUP ANNUAL REPORT 2021 TO OUR SHAREHOLDERS 4
performance since 2016 – and for our ability to navigate through the rough seas of COVID-19. Priorities such as craft & speciality and alcohol-free brews delivered strong progress during 2021. Our core beer business also saw good recovery from the severe headwind in 2020. And we are well on track to achieve our 2022 sustainability targets. Read about the progress on our strategic priorities on pages 26-30. More specifically, our Environment, Social & Governance Report, available online on www.carlsberggroup.com, contains a wealth of information and data on our Together Towards ZERO sustainability programme and targets. A NEW HORIZON Since 2016, SAIL’22 has guided us well on our journey to become a successful, professional and attractive company in our markets. As its name suggests, SAIL’22 is now coming to an end, and 2022 will be a year of transition. During the second half of 2021 and early 2022, we went through the process of defining our next strategy. In doing so, we engaged a large number of colleagues from various markets and functions across our regions, bringing
in diverse thinking and input to ensure relevance and viability. As we are confident that there is still more on tap for many of the SAIL’22 priorities, the new strategy is an evolution rather than a revolution. We have therefore named it SAIL’27. SAIL’27 will define our business agenda and support continued value growth in the years to come. SAIL’27 is presented on pages 31-32. ORGANISATIONAL HEALTH Considering the immense challenges for all employees – on a personal and professional level – in both 2020 and 2021, we were very pleased with the results of our 2021 employee survey. The results were largely on a par with the latest survey conducted in 2019, indicating that our many initiatives during the challenging times of COVID-19 to support and take care of our employees, to empower them and to ensure good communication have resonated well. We are proud of our strong purpose and raison d’être (see page 24). We are confident that this has been an important contributing factor for the motivation of our people and our ability to navigate the uncharted waters of COVID-19.
In 2021, we intensified our focus and commitment in relation to diversity and inclusion (D&I). Our D&I Council will play a pivotal role in driving our D&I agenda across our business and shaping our future D&I journey. CHANGING REGIONAL STRUCTURE AND EXCOM In 2021, we changed our regional structure to optimise the regional management and ensure a better balance between our European regions. During the year, we welcomed three new members to the Executive Committee: Leo Evers took over the responsibility for Asia from Graham Fewkes, who went to Western Europe; Victor Shevtsov became head of Supply Chain; and Joris Huijsmans joined as CHRO. Meet the ExCom on pages 46-47. SUPERVISORY BOARD CHANGES AND NEW CHAIR At the Annual General Meeting (AGM) on 14 March 2022, the Carlsberg Foundation will reduce its representation on the Supervisory Board from five to three members. Lars Fruergaard Jørgensen and Lars Stemmerik have notified the Board that they are not standing for re-election. Both have been valued members of the Board and we would like to extend our gratitude to them.
The Board will propose Punita Lal and Mikael Aro as new members. See page 45. THANK YOU Once again this past year, we were impressed by the high level of engagement and commitment from Carlsberg’s employees and would like to say thank you to each and every one. We greatly appreciate the continued support and trust shown to us by our shareholders. We also extend our thanks to all suppliers and customers – not least our on-trade customers, many of whom have been through another very difficult year – for their cooperation during 2021. We are well prepared for 2022 which will bring headwind in the form of cost inflation and possibly further COVID-19 obstacles. We remain hopeful that the continued roll-out of vaccines across the world will be successful in curtailing the pandemic.
Flemming Besenbacher, Chair Cees ’t Hart, CEO PASSING ON THE BATON The upcoming AGM will mark the end of my ten-year Chairship of the Supervisory Board. As the end of SAIL’22 approaches, I have decided that the time is right to pass on the responsibility to Henrik Poulsen,
whom the Supervisory Board will propose as new Chair. The Board will propose the Chair of the Board of Directors of the Carlsberg Foundation, Majken Schultz, as new Deputy Chair. I am proud to hand over a company that has seen some really impressive development since Cees ‘t Hart took the helm in 2015, and that today is stronger than ever. Since June 2015, Carlsberg’s share price has increased by around 90%, dividend per share has increased two-and-a-half times and share buy-backs totalling DKK 10.6bn have been carried out. The changing of the guards also involves an historic change with the reduced representation of the Carlsberg Foundation on the Board. In 2023, the Foundation will further reduce its representation on the Board to only two members. This change is in line with good corporate governance and to the benefit of Carlsberg. The Foundation will remain a committed, value-oriented shareholder, safeguarding the long-term health of the Carlsberg Group. I would like to personally thank the employees and management team for the excellent cooperation during the past years, and the Carlsberg shareholders for trusting me with the Chairship of this great company.
Flemming Besenbacher, Chair

RESILIENCE AND DELIVERY
5CARLSBERG GROUP ANNUAL REPORT 2021 2021 HIGHLIGHTS
STRATEGIC PRIORITIES
GROWTH IN ALCOHOL-FREE BREWS
GROWTH IN CRAFT & SPECIALITY
REVENUE/HL+3%VOLUME GROWTH+15%
CHINA
+17% >50%+15%
POSITION FOR GROWTH
POSITION FOR GROWTH
POSITION FOR GROWTH
Our Chinese business delivered strong volume and value growth, driven by our attractive portfolio of local and international premium brands. Read more on page 19.
Our craft & speciality portfolio had another year of strong volume growth, supported in particular by the global speciality brands 1664 Blanc and Somersby. Read more on page 28.
Baltika 0 continued to lead the alcohol-free brew (AFB) category in Eastern Europe, including Russia and Ukraine. Local brands have been key for our AFB growth. Read more on page 28.
Working with third-party retailers and using our own Carl’s Shop, our e-commerce business is rapidly expanding. Supported by strong volume growth, revenue was up by more than 50%.
E-COMMERCE REVENUE GROWTH
STRENGTHEN THE CORE
The resilience of our SAIL’22 strategy was confirmed again in 2021. We saw strong progress on our strategic priorities despite the continued challenges posed by COVID-19 in many of our markets.
Our Funding the Journey culture, with its continuous focus on efficiencies and costs, remained an important driver of our financial performance. Read more on pages 12-15.
FUNDING THE JOURNEY
STRENGTHEN THE CORE

TOGETHERTOWARDS ZERO
-2%ZERO CARBONFOOTPRINT
In 2021, we reduced our water use by 4%, averaging 2.7 hl of water to produce 1 hl of beer. In total, we have achieved a 21% improvement since 2015. We also achieved an A rating from CDP for transparency and action on water.
-4%ZERO WATERWASTE
ZERO IRRESPONSIBLEDRINKING
ZERO ACCIDENTSCULTURE
STRATEGIC PRIORITIES
In 2021, we reduced CO2 emissions per hl of beer produced by 2% to 4.2 kg CO2/hl. Since 2015, the reduction has been 40%. We were again included in the CDP A List, which recognises corporate leaders for transparency and action on climate risks and opportunities.
6CARLSBERG GROUP ANNUAL REPORT 2021 2021 HIGHLIGHTS
We believe sustainability and profitability can work together in harmony. Our aim is to create sustainablevalue growth by optimising the balance between ourfinancial performance and sustainability progress.
3283In 2021, 32 of our breweries achieved the safety milestone of 1,000 days without a lost-time accident. However, our overall employee accident rate rose by 44% to 4.3, mainly due to the breweries that recently joined our business. We are working hard to embed our ZERO accidents culture across every site.
We are proud of our great beer brands, which for many people are at the heart of social occasions, and we want everyone to enjoy our products responsibly. In 2021, we ran 83 responsible drinking campaigns, reaching more than 33 million people across our markets.
Read more about our Together Towards ZERO achievements in the Environment, Social & Governance Report, available online onwww.carlsberggroup.com

TOP- AND BOTTOM-LINE GROWTH, STRONG CASH FLOW AND INCREASING RETURNS
Revenue (DKKbn)
Organic growth (%, rhs)
20182016 2017 2019 20212020
REVENUE AND ORGANIC GROWTH¹
10
20
30
40
50
60
70
-12%
-8%
-4%
0%
4%
8%
12%
NIBD (DKKbn)
NIBD/EBITDA (rhs)
20182016 2017 2019 20212020
NET INTEREST-BEARING DEBT (NIBD) AND LEVERAGE
0
5
10
15
20
25
30
35
0.0x
0.5x
1.0x
1.5x
2.0x
2.5x
3.0x
3.5x
OPERATING PROFIT AND MARGIN¹
Operating profit (DKKbn)
Operating margin (%, rhs)
20182016 2017 2019 202120200
2
4
6
8
10
12
6%
8%
10%
12%
14%
16%
18%
RETURN ON INVESTED CAPITAL (ROIC)
ROIC (%) ROIC excl. goodwill (%)
20182016 2017 2019 202120200%
4%
8%
12%
16%
20%
24%
28%
Free operating cash flow (DKKbn)
Free cash flow (DKKbn)
20182016 2017 2019 20212020
CASH FLOW
0
2
4
6
8
10
12
CASH RETURNS TO SHAREHOLDERS
Adj. payout ratio (%, rhs)
Dividends (DKKbn)
Share buy-back (DKKbn)
20182016 2017 2019 202120200
1
2
3
4
5
6
7
0%
10%
20%
30%
40%
50%
60%
70%
1 Comparative figures for 2016-2018 and 2016 have not been restated to include IFRS 16 and IFRS 15 respectively.
7CARLSBERG GROUP ANNUAL REPORT 2021 2021 HIGHLIGHTS
FINANCIAL RESULTS
Balancing our Golden Triangle has been and will remain an important performance management KPI at Group, regional and market level.
The Golden Triangle aims to optimise the balance between market share/ volumes, gross profit after logistics (GPaL) margin, operating profit and cash generation, thereby creating sustainable value growth.
The strong results in 2021 were supported by our Funding the Journey culture and achieved despite continued impact from COVID-19 across many of our markets, albeit to different degrees and at different times. Read about Group and regional results on pages 12-22 and in the consolidated financial statements.
We significantly increased the cash returns to our shareholders while maintaining the leverage ratio well below our target of below 2x. For 2021, total cash returns in the form of dividends and share buy-backs amounted to DKK 6.8bn. Read more on page 22.
BALANCING OURGOLDEN TRIANGLE

CARLSBERG GROUP ANNUAL REPORT 2021 2021 HIGHLIGHTS 8
5-year key figures
2021 2020 2019 2018¹ 2017¹ Volumes (million hl) Beer 119.6 110.1 113.0 112.3 107.1
Other beverages 22.6 20.0 21.9 20.8 19.2
DKK million
Income statement
Revenue 66,634 58,541 65,902 62,503 60,655
Gross profit 31,327 28,361 32,638 31,220 30,208
EBITDA 15,474 14,085 15,007 13,420 13,583
Operating profit before special items 10,862 9,699 10,465 9,329 8,876
Special items, net -253 -247 501 -88 -4,565
Financial items, net -381 -411 -738 -722 -788
Profit before tax 10,228 9,041 10,228 8,519 3,523
Income tax -2,219 -2,233 -2,751 -2,386 -1,458
Consolidated profit 8,009 6,808 7,477 6,133 2,065
Attributable to
Non-controlling interests 1,163 778 908 824 806
Shareholders in Carlsberg A/S (net profit) 6,846 6,030 6,569 5,309 1,259
Shareholders in Carlsberg A/S, adjusted² 6,943 6,363 6,160 5,359 4,925
Statement of financial position
Total assets 126,383 118,816 123,063 117,700 114,251
Invested capital 83,636 81,541 86,162 82,721 84,488
Invested capital excl. goodwill 31,152 31,049 33,032 31,792 33,991
Net interest-bearing debt (NIBD) 19,162 21,263 18,776 17,313 19,638
Equity, shareholders in Carlsberg A/S 43,941 39,308 43,449 45,302 46,930
Statement of cash flows
Cash flow from operating activities 13,259 10,928 12,239 12,047 11,834
Cash flow from investing activities -4,383 -5,871 -2,277 -5,891 -3,154
Free cash flow 8,876 5,057 9,962 6,156 8,680
¹ Comparative figures for 2017-2018 have not been restated to include IFRS 16. ² Adjusted for special items after tax. ³ Proposed dividend on number of shares at year-end as a percentage of net profit adjusted for special items after tax.
2021 2020 2019 2018¹ 2017¹
Investments
Acquisition of property, plant and equipment and intangible assets, net -4,223 -4,396 -4,592 -4,027 -4,053
Acquisition and disposal of subsidiaries, net -635 -2,409 - -974 268
Financial ratios Gross margin % 47.0 48.4 49.5 50.0 49.8
EBITDA margin % 23.2 24.1 22.8 21.5 22.4
Operating margin % 16.3 16.6 15.9 14.9 14.6
Effective tax rate % 21.7 24.7 26.9 28.0 41.4
Return on invested capital (ROIC) % 10.3 8.9 8.8 8.1 6.9
ROIC excl. goodwill % 27.5 23.2 22.4 20.9 15.7
Equity ratio % 34.8 33.1 35.3 38.5 41.1
NIBD/equity ratio x 0.39 0.49 0.41 0.36 0.40
NIBD/EBITDA x 1.24 1.51 1.25 1.29 1.45
Interest cover x 28.52 23.59 14.17 12.92 11.26
Stock market ratios Earnings per share (EPS) DKK 47.6 41.3 43.7 34.8 8.3
Earnings per share, adjusted (EPS-A)² DKK 48.3 43.6 41.0 35.2 32.3
Free cash flow per share (FCFPS) DKK 61.5 34.5 65.9 40.2 56.9
Dividend per share (proposed) DKK 24.0 22.0 21.0 18.0 16.0
Payout ratio % 51 55 49 52 194
Payout ratio, adjusted³ % 49 50 50 51 50
Share price (B shares) DKK 1,129.5 975.2 993.8 692.6 745.0
Market capitalisation DKKm 163,149 142,676 145,805 104,830 112,116
Number of issued shares at year-end 1,000 145,257 148,157 152,557 152,557 152,557
Number of shares at year-end, excl. treasury shares 1,000 141,892 145,102 147,996 152,457 152,390
Weighted average number of shares, excl. treasury shares 1,000 143,848 146,104 150,411 152,428 152,496
Please refer to section 9.2 General accounting policies in the consolidated financial statements for a definition and calculation of key figures and financial ratios.

See pages 16-22 for the 2021 regional results.
OUR REGIONS
30% 31% 39%46% 29% 25%36% 40% 24%
WESTERN EUROPE ASIA CENTRAL & EASTERN EUROPE
9CARLSBERG GROUP ANNUAL REPORT 2021 OUR BUSINESS
SHARE OF VOLUMESHARE OF VOLUMESHARE OF VOLUME
Other CIS markets
Balkan marketsUK, Poland & Germany
Laos, Vietnam & Cambodia
India & Nepal
Export & LicenseMalaysia & SingaporeFrance & Switzerland China & Hong Kong SARNordics Russia
Baltics, Italy & Greece
A WELL-BALANCEDMARKET PORTFOLIO
SHARE OF GROUP RESULTS SHARE OF GROUP RESULTS SHARE OF GROUP RESULTS
VOLUME
REVENUE
OPERATING PROFIT
VOLUME
REVENUE
OPERATING PROFIT
VOLUME
REVENUE
OPERATING PROFIT
Our regions provide an attractive exposure to mature and emerging markets. We have a number 1 or 2 position in 22 markets, and around 70% of our volumes are sold in these markets.

AN ATTRACTIVE BEER PORTFOLIO...
OUR BRANDS
CORE BEER
ALCOHOL-FREE BREWS
CRAFT & SPECIALITY
10CARLSBERG GROUP ANNUAL REPORT 2021 OUR BUSINESS
+24%volume growth
INT
ERN
ATIO
NA
L B
RA
ND
S
LOC
AL
POW
ER B
RA
ND
S
Our beer portfolio spans our core beer brands, including local power brands and international premium brands, craft & speciality brands and alcohol-free brews. This combination of brands has been an important driver of results in recent years.
4%
6% 90%
Alcohol-free brews
Craft & speciality1 Core beer
SHARE OF OWN BEER VOLUMES
5%
14% 81%
Alcohol-free brews
Craft & speciality1 Core beer
SHARE OF OWN BEER REVENUE
1 Including Somersby.
+5%volume growth
+17%volume growth

21%Other alcoholic and non-alcoholic beverages
79%Total beer2
16%Other alcoholic and non-alcoholic beverages
84%Total beer2
... AND APPEALING OTHER BEVERAGES
OUR BRANDS11CARLSBERG GROUP ANNUAL REPORT 2021 OUR BUSINESS
OTHER BEVERAGES WITH ALCOHOL
+10%volume growth1
OTHER BEVERAGES WITHOUT ALCOHOL
Our other beverages encompass both alcoholic and non-alcoholic beverages and account for 16% of total Group volumes. These categories are expected to deliver attractive growth potential in the coming years. As part of SAIL’27, we will therefore increase our focus on other beverages.
SHARE OF TOTAL GROUP
VOLUMES
SHARE OF TOTAL GROUP
BEVERAGE REVENUE
2 Core beer, craft & speciality and alcohol-free brews.1 Somersby is included in the craft & speciality category in SAIL'22.

CARLSBERG GROUP ANNUAL REPORT 2021 2021 REVIEW AND 2022 EXPECTATIONS 12
2021 performance was well ahead of pre-COVID 2019, delivering strong top-line growth and operating cash flow, and increasing returns to shareholders.
As a result of the continued high level of uncertainty in 2021, we issued a broad guidance for organic operating profit growth at the beginning of the year. Due to strong performance, we were able to upgrade our earnings expectations twice. See table to the right. VOLUMES Total Group volumes were 142.2m hl, increasing organically by 7.4% and by 9.3% including acquisitions. Beer volumes grew organically by 6.4%, driven by solid growth in Asia and Central & Eastern Europe, and supported by easy comparables. Other beverage volumes grew organically by 12.9%, supported by double-digit growth in all three regions.
INCOME STATEMENT Revenue was DKK 66.6bn. Organic revenue growth was 10.0%, while reported revenue growth was 13.8%, mainly impacted by the acquisition of Marston’s brewing activities in the UK in October 2020. The small negative currency impact was due to adverse currency movements across Central & Eastern Europe and certain markets in Asia, partly offset by a strengthening of primarily the Chinese, Norwegian, British and Swedish currencies. Revenue/hl grew organically by 3% as a result of recovery of the on-trade in some markets due to fewer restrictions in 2021 compared with 2020 and solid growth of premium products across the regions. Gross profit increased organically by 8.7% and by 10.5% in reported terms, positively impacted by acquisitions and negatively by currencies. The gross profit margin declined due to acquisitions that came in with a lower gross margin than the Group, the higher cost of goods sold
(COGS), particularly in Central & Eastern Europe, and a negative country mix. Operating expenses, including marketing investments, grew organically by 8%, mainly driven
by higher marketing investments and higher administrative expenses. Marketing investments grew organically by 11%. The higher administrative expenses were the result of higher accruals related to variable pay due to the strong
financial performance for the year, the impact of acquisitions, currencies and certain one-off provisions. Despite this, total SG&A (excluding marketing) to revenue declined by approximately 60bp to 14.0% (-40bp organically).
GROUP
2021 review and 2022 expectations
A STRONG SET OF RESULTS
Earnings expectations 2021
Date Expectation for operating profit
5 February 2021 Organic growth in operating profit within the range of 3-10%
28 April 2021 Organic growth in operating profit within the range of 5-10%
18 August 2021 Organic growth in operating profit within the range of 8-11%
27 October 2021 Organic growth in operating profit within the range of 10-12%
4 February 2022 Organic growth in operating profit of 12.5% (reported)
Group
Change Change
2020 Organic Acq., net FX 2021 Reported Volumes (million hl)
Beer 110.1 6.4% 2.2% - 119.6 8.6%
Other beverages 20.0 12.9% 0.0% - 22.6 12.9%
Total volume 130.1 7.4% 1.9% - 142.2 9.3%
DKK million
Revenue 58,541 10.0% 4.6% -0.8% 66,634 13.8%
Operating profit 9,699 12.5% 0.3% -0.8% 10,862 12.0%
Operating margin (%) 16.6 16.3 -30bp

CARLSBERG GROUP ANNUAL REPORT 2021 2021 REVIEW AND 2022 EXPECTATIONS 13
Operating profit before depreciation, amortisation and impairment losses (EBITDA) grew organically and in reported terms by 9.9%. The EBITDA margin declined by 90bp to 23.2% due to acquisitions. Group operating profit grew organically by 12.5%, supported by growth in all three regions. Reported operating profit grew by 12.0%. Excluding the impact from acquisitions, the operating profit margin increased by 30bp to 16.9%. The reported operating margin declined by 30bp to 16.3% due to the margin-dilutive impact of Marston’s brewing activities. Section 1 in the consolidated financial statements contains more details on operating activities. Net special items (pre-tax) amounted to DKK -253m (2020: DKK -247m). Special items were positively impacted by reversal of provisions made in purchase price allocations in prior years in China and Cambodia of DKK 1,238m, mainly related to indirect taxes and certain employee obligations that were either settled during the year or are no longer expected to be realised. This was partly offset by impairment and write-downs of the Baltika brand in Russia and our investment in Tibet Lhasa Brewery.
Special items were also impacted by one-off costs related to COVID-19, including safety measures and donations. Read more about net special items in section 3.1 in the consolidated financial statements. Financial items, net, amounted to DKK -381m (2020: DKK -411m). Excluding currency gains and losses, financial items, net, amounted to DKK -319m (2020: DKK -550m), positively impacted by the reversal of the previous write-down of the loan to our partner in Carlsberg South Asia Pte Ltd. This was partly offset by higher provisions related to interest on tax cases in certain markets. Net currency losses and fair value adjustments amounted to DKK -62m, mainly related to USD/EUR deposits and hedging of packaging materials in Eastern Europe and USD-related currency losses in Asia. Read more about net financial items in section 4.1 in the consolidated financial statements. Tax totalled DKK -2,219m (2020: DKK -2,233m). The effective reported tax rate declined by 300bp to 21.7%, impacted by non-taxable gains in special items and lower net tax provisions. Excluding special items, the effective tax rate was 23.5%. The Carlsberg Group’s share of consolidated profit (net profit) was DKK 6,846m (2020: DKK 6,030m).
The increase was primarily driven by the higher operating profit, lower net financials and the lower tax rate. Adjusted net profit (adjusted for special items after tax) grew by 9% to DKK 6,943m, and adjusted earnings per share (excluding treasury shares) grew by 11% to DKK 48.3. In addition to the higher operating profit, lower net financials and lower tax rate, earnings per share were supported by the share buy-backs.
STONEWALL INN IPA Brooklyn Brewery has been a proud partner of the Stonewall Inn since 2017, when the brewery was asked to create a beer to help raise awareness, generate funds and make real change for the LGBTQ+ community and its non-profit The Stonewall Inn Gives Back Initiative (SIGBI). SIGBI exists to support LGBTQ+ communities in their fight by funding grassroots activists and their work. Read more in our Environment, Social & Governance Report. In 2021, Carlsberg launched the unapologetically refreshing Stonewall Inn IPA in markets in Western Europe and Asia. Our total Brooklyn brand portfolio grew volumes by 16%.
GROW CRAFT & SPECIALITY

CARLSBERG GROUP ANNUAL REPORT 2021 2021 REVIEW AND 2022 EXPECTATIONS 14
Non-controlling interests were
DKK 1,163m (2020: DKK 778m),
positively impacted by strong growth
for Carlsberg Chongqing Breweries
Group in China, the reversal of
provisions made in purchase price
allocations in China (DKK 189m
impact on non-controlling interests)
and the inclusion of Carlsberg
Marston’s Brewing Company in the
UK. Excluding the impact from
special items, non-controlling
interests were DKK 1,082m.
STATEMENT OF FINANCIAL
POSITION ASSETS
Total assets amounted to DKK
126,383m at 31 December 2021 (31
December 2020: DKK 118,816m).
The increase was mainly due to
higher intangible assets, inventories,
trade and other receivables.
Total non-current assets amounted
to DKK 103,292m (31 December
2020: DKK 99,820m). Intangible
assets totalled DKK 68,475m (31
December 2020: DKK 66,061m).
The increase was mainly due to the
acquisition of Marston’s brewing
activities and Wernesgrüner Brewery
as well as currency appreciation,
primarily of the Russian and
Chinese currencies, partly offset by
impairment of brands and other
intangible assets. Property, plant and
equipment totalled DKK 26,648m
(31 December 2020: DKK 26,299m),
impacted by currency movements
and capital expenditure offset by
disposals and depreciation. Financial
assets totalled DKK 8,169m (31
December 2020: DKK 7,460m). The
increase was due to recognition of
the business in Nepal as an
associate.
Total current assets amounted to
DKK 22,900m (31 December 2020:
DKK 18,996m). Inventories increased
by DKK 778m to DKK 5,391m,
impacted in Asia by stocking prior to
the Chinese New Year and currency
appreciation. Trade receivables
increased by DKK 1,985m due to
higher sales than in 2020. The
increase in other receivables was
mainly due to fair value adjustments
linked to higher aluminium prices and
the reversal of the write-down of the
loan to our partner in Carlsberg
South Asia Pte Ltd. Cash and cash
equivalents amounted to DKK
8,344m (31 December 2020: DKK
8,093m).
Section 2 in the consolidated
financial statements contains more
details on assets.
EQUITY AND LIABILITIES
Equity
Equity amounted to DKK 48,756m
at 31 December 2021 (31 December
2020: DKK 43,362m), DKK 43,941m
of which was attributed to share-
holders in Carlsberg A/S and DKK
4,815m to non-controlling interests.
The net change in equity of DKK
+5,394m was explained by the
consolidated profit of DKK 8,009m,
non-controlling interests of DKK
+941m and foreign exchange
adjustment in other comprehensive
income of DKK +3,307m, offset by
the dividend payout of DKK -3,686m
and the share buy-backs of
DKK -3,600m.
Liabilities
Total liabilities were DKK 77,627m
(31 December 2020: DKK 75,454m).
At 31 December 2021, non-current-
and current borrowings amounted
to DKK 28,922m. Non-current
borrowings declined by DKK
6,536m, while current borrowings
increased by DKK 5,208m due to the
reclassification of a EUR 750m bond,
which matures in November 2022.
Non-current tax liabilities, retirement
benefit obligations etc. were DKK
11,590m (31 December 2020:
DKK 17,714m). The decline was
mainly due to the revaluation and
reclassification to current liabilities of
the put option held by our partner in
Carlsberg South Asia Pte Ltd and
the reversal of provisions made in
purchase price allocations in previous
years in China and Cambodia.
Current liabilities excluding current
borrowings increased to DKK
37,115m (31 December 2020: DKK
27,490m). Trade payables increased
by DKK 4,044m, impacted by
currencies and a higher activity level.
Other current liabilities, excluding
deposits on returnable packaging,
increased by DKK 5,353m,
impacted by the above-mentioned
reclassification of the put option held
by our partner in Carlsberg South
Asia Pte Ltd and higher bonus
accruals. Read more about the
put option held by our partner in
Carlsberg South Asia Pte Ltd in
section 5.4 in the consolidated
financial statements.
CASH FLOW
Free operating cash flow was DKK
9,460m, an increase of DKK 2,367m.
Free cash flow amounted to DKK
8,876m (2020: DKK 5,057m). The
increase was mainly impacted by
the higher EBITDA, a higher net
contribution from the change in
working capital and lower financial
investments than in 2020.
Net cash flow amounted to
DKK -72m (2020: DKK +3,247m),
impacted by higher cash returns to
shareholders in the form of dividends
and share buy-backs, in total
amounting to DKK 6,787m, and
net cash flow in 2020 being
positively impacted by two bond
placings of EUR 500m each.
CASH FLOW FROM OPERATING
ACTIVITIES
Cash flow from operating activities
amounted to DKK 13,259m (2020:
DKK 10,928m).
EBITDA was DKK 15,474m (2020:
DKK 14,085m).
The change in trade working
capital was DKK +802m (2020: DKK
+1,321m), mainly due to strong cash
management discipline and higher
trade payables. Average trade
working capital to revenue for the
year was -18.4%, on par with 2020
(-18.6%).
The change in other working
capital was DKK +617m (2020:
DKK -1,033m), mainly impacted by
VAT, bonus accruals and provisions.
Section 6 in the consolidated
financial statements contains more
details on assets.
Restructuring costs paid amounted
to DKK -372m (2020: DKK -531m).
Net interest etc. paid amounted to
DKK -920m (2020: DKK -424m).
The increase was mainly due to the
settlement of financial instruments
and provisions. Corporation tax paid
was DKK -1,977m (2020:
DKK -1,958m).

CARLSBERG GROUP ANNUAL REPORT 2021 2021 REVIEW AND 2022 EXPECTATIONS 15
CASH FLOW FROM INVESTING ACTIVITIES Cash flow from investing activities was DKK -4,383m (2020: DKK -5,871m).
Operational investments totalled DKK -3,799m (2020: DKK -3,835m). Acquisition of property, plant and equipment and intangible assets (CapEx) amounted to DKK -4,221m (2020: DKK 4,396m). Excluding the
purchase of the Brooklyn brand rights in 2020, operational investments increased by DKK 625m. Total financial investments amounted to DKK -582m (2020: DKK -2,036m), impacted by deferred considerations related to the acquisition of Marston’s brewing activities and the deconsolidation of the business in Nepal. RETURN ON INVESTED CAPITAL Return on invested capital (12-month average) increased by 140bp to 10.3%, driven by higher profits and the lower tax rate. ROIC excluding goodwill improved by 430bp to 27.5%.
FINANCING At 31 December 2021, gross financial debt amounted to DKK 28,922m and net interest-bearing debt to DKK 19,162m (2020: DKK 21,263m). The strong free cash flow more than offset the cash out-flow from the share buy-back programme (DKK 3.6bn) and dividends to shareholders and non-controlling interests (DKK 3.7bn). The difference of DKK 9,760m between gross financial debt and net interest-bearing debt mainly comprised cash and cash equivalents of DKK 8,344m. At 31 December 2021, the average debt duration was 4.8 years (2020: 5.6 years). Of the gross financial debt, 79% (DKK 22,755m) was long
term, i.e. with maturity of more than one year from 31 December 2021. Net interest-bearing debt/EBITDA was 1.24x (2020: 1.51x). The financial leverage was kept slightly more conservative than in past years to ensure financial flexibility to potentially purchase the 33% shareholding in Carlsberg South Asia Pte Ltd. SHARE BUY-BACKS 2021 PROGRAMME In 2021, the buy-back was carried out in quarterly tranches due to the uncertainty related to the development of COVID-19 across our markets. The total buy-back programme was DKK 4bn, with shares worth DKK 3.6bn bought back in 2021 and the remaining DKK 400m in January 2022. A total of 3.7m shares were bought at an average price of DKK 1,076. 2022 PROGRAMME In 2022, the Group intends to execute the 2022 share buy-back as quarterly programmes. During the first programme, launched on 4 February, the Group intends to buy back Carlsberg B shares amounting to DKK 1bn. Read more about the share buy-back programmes, including the 2021 programme, on page 22.
+10% SOMERSBY VOLUME GROWTH
Developed in 2008, the Somersby brand was originally launched in Denmark. Today, Somersby is available in more than 70 markets world-wide. Somersby is associated with optimism and playfulness, and the brand portfolio, which includes several fruity variants, was recently extended with alcohol-free variants. The Somersby portfolio and its repeatable model are powerful drivers for the brand’s strong global growth, and in 2021 Somersby volumes grew by 10%. In SAIL’27, we will further strengthen our focus on categories beyond beer, including Somersby.
GROW CRAFT & SPECIALITY AND WIN IN ALCOHOL-FREE BREWS

CARLSBERG GROUP ANNUAL REPORT 2021 2021 REVIEW AND 2022 EXPECTATIONS 16
Western Europe saw mixed performance across markets, as COVID-19-related restrictions impacted markets differently due to different channel structures.
The Western Europe region encompasses mature beer markets and accounts for roughly one third of Group volumes, revenue and operating profit. We have particularly strong market positions and business models that include both beer and other beverages in the Nordic markets and Switzerland. In the Nordic markets, we are mainly competing against local or regional players. Elsewhere, we are predominantly in competition with global players. REGIONAL RESULTS The Western Europe region had a very volatile year. H1 especially was impacted by COVID-19-related on-trade restrictions in most markets. In
H2, we benefited from abandonment of restrictions in Q3 and easy comparables in Q4, as restrictions were more severe in 2020. Beer volumes grew organically by 1.3% and total volumes by 4.2%. Other beverage volumes grew by 11.2% thanks to strong growth of the soft drinks and energy drinks businesses in the Nordics. The positive acquisition impact of approximately 2.5m hl primarily related to Marston’s brewing activities. In most markets, the year ended on a soft note due to renewed restrictions. Revenue/hl improved organically by 2%, impacted in all markets by a positive channel mix. In H2, revenue/hl improved considerably thanks to the recovery of the on-trade. For the year, our on-trade volumes grew by 12%, although for the full year they remained at index 65 compared with the pre-pandemic level in 2019. In Q4, on-trade volumes were at about index 80 compared with 2019.
WESTERN EUROPE
MIXED PERFORMANCE ACROSS MARKETS
Western Europe
Change Change
2020 Organic Acq., net FX 2021 Reported Volumes (million hl)
Beer 26.8 1.3% 9.2% - 29.7 10.5%
Other beverages 11.2 11.2% 0.0% - 12.4 11.2%
Total volume 38.0 4.2% 6.5% - 42.1 10.7%
DKK million
Revenue 25,875 6.4% 10.3% 1.2% 30,501 17.9%
Operating profit 3,926 8.9% 1.3% 1.9% 4,401 12.1%
Operating margin (%) 15.2 14.4 -80bp
Our markets in Western Europe
Consumption characteristics Our position Our
operations
Markets
Per capita beer
consumption (litres)
On-trade share of market,
approx. (%) Market
position (no.) Market
share¹ (%) Breweries²
Denmark 63 14 1 53 1
Sweden 50 14 1 26 1
Norway 50 10 1 50 1
Finland 77 12 1 30 1
France 30 8 2 25 1
Switzerland 55 33 1 37 1
Poland 102 7 3 20 3
UK 68 24 4 12 4
Germany 90 18 3³ 10³ 3
Portugal 46 44 1 47 1
¹ Sept. 2021 MAT. ² Breweries with capacity above 100,000 hl. ³ North-eastern Germany.
Source: GlobalData, Carlsberg estimates.

CARLSBERG GROUP ANNUAL REPORT 2021 2021 REVIEW AND 2022 EXPECTATIONS 17
Organic revenue growth was 6.4%, with reported revenue growth of 17.9% due to positive acquisition and currency impacts. Organic operating profit in Western Europe grew well ahead of revenue. Important drivers of the 8.9% growth were the positive channel mix and tight cost control and cost savings during 2020 and 2021. The reported operating margin declined by 80bp to 14.4% due to acquisitions, with Marston’s brewing activities having a significantly lower operating margin than the rest of the region because of the impact on the business of its high on-trade exposure. THE NORDICS In the Nordics, volumes grew by high-single-digit percentages, with double-digit growth in Denmark and Norway.
In Denmark, our business benefited from the removal of restrictions in Q2, which very positively benefited all channels – on-trade, off-trade and border trade. We saw good progress for all beverage categories, including core beer, craft & speciality and soft drinks. Our Norwegian business delivered another very good year. The double-digit volume growth was supported by COVID-19 border restrictions and successful innovations for key brands. Our local power brand Frydenlund, Tuborg and craft & speciality, including Somersby, performed particularly well. Our Swedish business had a difficult H1 but rebounded in H2. We saw particularly strong results for our alcohol-free brews and soft drinks. During the year, the business was
negatively impacted by the closed border with Norway. In Finland, our volumes were slightly down. We saw a solid price/mix development due to fewer promotional beer volumes and improved category and channel mix. FRANCE AND SWITZERLAND In a slightly growing French market, our volumes declined slightly, while revenue grew due to a positive channel and brand mix. Our craft & speciality portfolio and alcohol-free brands, especially Tourtel, delivered solid growth, while the mainstream brand Kronenbourg declined. Our business in Switzerland had another challenging year due to its high on-trade exposure and the continued COVID-19 restrictions. As a result, our volumes declined
slightly. Our alcohol-free and craft & speciality brands grew, while mainstream brands declined. From January 2022, we have entered into a strategic partnership with PepsiCo, becoming its bottler in Switzerland. POLAND AND GERMANY In a declining Polish market, we kept volumes flat. We saw good performance for our alcohol-free brews, for the core beer brands Carlsberg, Tuborg and Zatecky, and for Garage in the flavoured beverage category. Q4 performance was strong due to extra sell-in because of announced price increases and an excise tax increase on 1 January 2022. The German market suffered due to extended lockdowns and restrictions. Nevertheless, our German business delivered solid organic volume
growth. Our local power brands Lübzer and Astra as well as Carlsberg, Somersby and our alcohol-free brews performed well. The Wernesgrüner acquisition was fully integrated very early in the year and is delivering supply chain benefits. THE UK A key focus for our UK business in 2021 was to execute the integration of Marston’s brewing activities. The integration was successful, delivering very well against expectations and achieving synergies. Due to its high on-trade exposure, the business was severely impacted by COVID-19-related restrictions, particularly in H1, whereas it improved considerably in H2 when restrictions were lifted. We saw very good performance for Carlsberg, Poretti and some of our licence brands.
TOTAL VOLUME (m hl)
REVENUE (DKKbn)
OPERATING PROFIT (DKKbn)
OPERATING MARGIN
25
29
33
37
41
45
2019 2020 202115
19
23
27
31
35
2019 2020 20211
2
3
4
5
6
2019 2020 202110%
12%
14%
16%
18%
20%
2019 2020 2021

CARLSBERG GROUP ANNUAL REPORT 2021 2021 REVIEW AND 2022 EXPECTATIONS 18
While China saw a strong development in 2021, most other beer markets in our Asia region remained severely impacted by COVID-19.
The importance of Asia for the Group has increased significantly over the past decade, during which we have expanded our presence in the region organically and through acquisitions. Today, we have an attractive overall position, with no. 1 and 2 positions in six markets. China is the Group’s largest market in terms of volume, revenue and operating profit. The competitive landscape varies significantly between markets, with global players and local brewers both present. Both SAIL’22 and SAIL’27 specifically target Asia as an important growth driver, supported by both volume growth and premiumisation.
REGIONAL RESULTS During the year, the development in Asia varied significantly between markets. Most markets were impacted by restrictions and lockdowns, although these varied in timing and severity. Organic beer volumes grew by 12.3%, mainly driven by China and India. Volumes in most other markets also grew, albeit at a slower pace and helped by easy comparables. Our other beverage volumes grew by 10.6% due to good performance of soft drinks and energy drinks in Cambodia and Laos. Organic revenue growth was strong at 15.6%. Revenue/hl grew organically by 3%, supported by a positive brand mix and, in some markets, a positive channel mix, partly offset by country mix.
ASIA
STRONG PERFORMANCE SUPPORTED BY CHINA AND INDIA
Our markets in Asia
Consumption characteristics Our position Our
operations
Markets
Per capita beer
consumption (litres)
On-trade share
of market, approx. (%)
Market position (no.)
Market share¹ (%) Breweries²
China 33 47 5/1³ 8/66³ 26
Laos 44 33 1 94 2
India 2 11 3/24 15 7
Vietnam 41 23 4 6 1
Cambodia 53 10 4 6 1
Malaysia 9 38 2 42 1
Nepal 2 65 1 51 1
Myanmar 6 32 3 9 1
Singapore 21 46 2 23 -
Hong Kong SAR 24 36 2 29 -
¹ Sept. 2021 MAT. ² Breweries with capacity above 100,000 hl. ³ Total China/western China. 4 In states with own brewery.
Source: GlobalData, Carlsberg estimates.
Asia
Change Change
2020 Organic Acq., net FX 2021 Reported Volumes (million hl)
Beer 34.8 12.3% 0.0% - 39.1 12.3%
Other beverages 4.8 10.6% 0.0% - 5.3 10.6%
Total volume 39.6 12.1% 0.0% - 44.4 12.1%
DKK million
Revenue 16,959 15.6% 0.0% -0.9% 19,459 14.7%
Operating profit 3,991 23.9% -0.4% -1.8% 4,855 21.7%
Operating margin (%) 23.5 24.9 140bp

CARLSBERG GROUP ANNUAL REPORT 2021 2021 REVIEW AND 2022 EXPECTATIONS 19
Operating profit increased organically by 23.9%. The operating margin was up by 140bp to 24.9%, driven by higher revenue/hl and ongoing tight cost control. CHINA The Chinese beer market grew by an estimated 5% (-3% compared with 2019), and our volumes grew by 15% (+19% compared with 2019). Local COVID-19-related restrictions and lockdowns disrupted the beer market during the year. We saw a modest volume decline in Q4 due to tough comparables, as volumes rebounded in Q4 2020, growing by 15%, following a lockdown in western China in Q3 2020.
The full-year growth was driven by our international and local premium brands, continued big-city growth and expansion in growing channels, such as the modern off-trade channel and e-commerce. As a result, revenue/hl grew by 3%. INDIA Our Indian business recovered strongly following the very difficult 2020, despite the second wave of COVID-19 impacting India in Q2 2021. Volumes grew by more than 30%. Revenue/hl was up mid-single-digit, benefiting from strong growth of the premium Carlsberg brand, price increases and packaging mix. Tuborg also grew strongly. At the end of the year, new restrictions were again
imposed in light of rising COVID-19 infection rates. VIETNAM In Vietnam, our volumes grew by high-single-digit percentages, with a strong acceleration of volumes at year-end due to sell-in to Tet celebrations. Our local power brands, Huda and Halida, continued to perform well and were the main volume drivers. 1664 Blanc grew strongly, although from a very small base. In addition, we strengthened our route-to-market and expanded the coverage and number of outlets selling our products.
LAOS In Laos, our total volumes declined due to severe lockdowns and alcohol bans, especially in H2. Despite the prolonged on-trade closures, our premium portfolio achieved high-single-digit growth. We saw very strong growth for our local economy brand Lanexang, with demand surging in the wake of increasing unemployment and poverty caused by COVID-19. CAMBODIA Our business in Cambodia delivered very strong volume performance, driven by the energy brand Sting, as the beer market was heavily impacted by restrictions, including alcohol bans. When all restrictions were lifted towards the end of the
year, we saw improved performance for our beer volumes. MALAYSIA AND SINGAPORE Our Malaysian business was heavily impacted by restrictions, including a complete suspension of brewery operations for 2.5 months in Q2 and Q3. Consequently, volumes declined significantly. Revenue/hl grew considerably due to strong premium growth and price increases. Our business in Singapore performed well due to strong growth in the off-trade, while the on-trade was severely impacted by prolonged restrictions..
TOTAL VOLUME (m hl)
REVENUE (DKKbn)
OPERATING PROFIT (DKKbn)
OPERATING MARGIN
20
26
32
38
44
50
2019 2020 20212
6
10
14
18
22
2019 2020 20210
1
2
3
4
5
2019 2020 202117%
19%
21%
23%
25%
27%
2019 2020 2021
CARLSBERG GROUP ANNUAL REPORT 2021 2021 REVIEW AND 2022 EXPECTATIONS 20
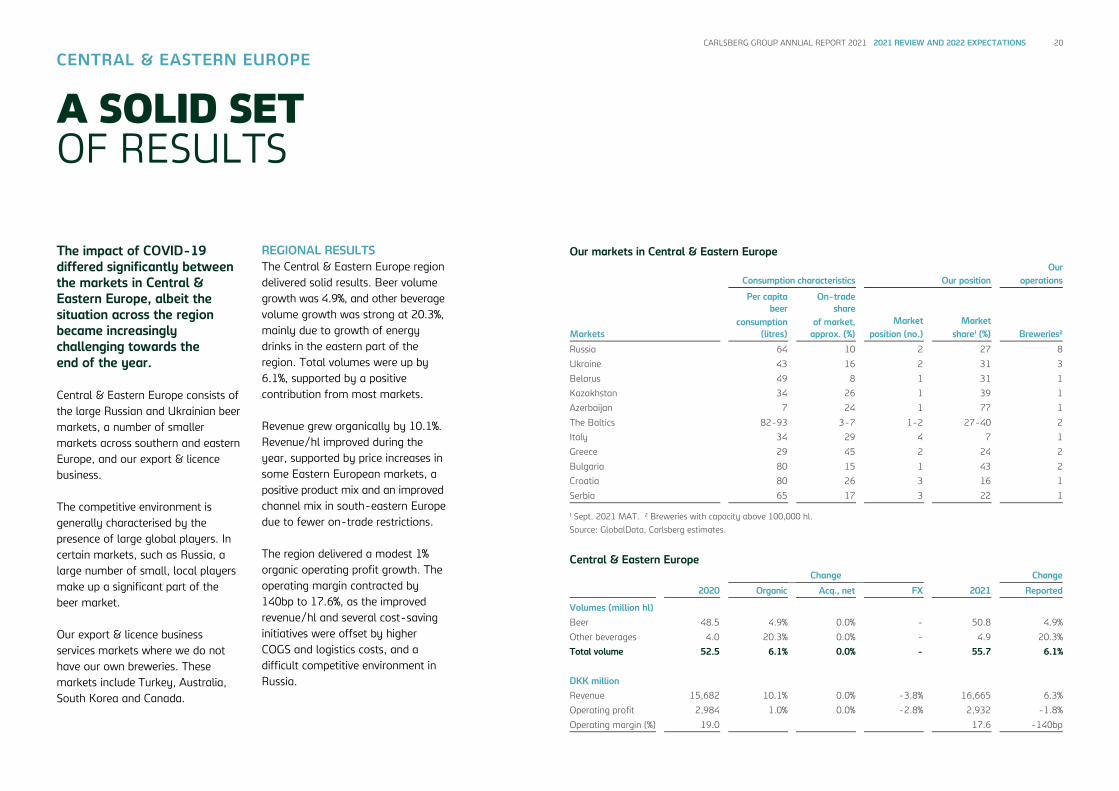
The impact of COVID-19 differed significantly between the markets in Central & Eastern Europe, albeit the situation across the region became increasingly challenging towards the end of the year.
Central & Eastern Europe consists of the large Russian and Ukrainian beer markets, a number of smaller markets across southern and eastern Europe, and our export & licence business. The competitive environment is generally characterised by the presence of large global players. In certain markets, such as Russia, a large number of small, local players make up a significant part of the beer market. Our export & licence business services markets where we do not have our own breweries. These markets include Turkey, Australia, South Korea and Canada.
REGIONAL RESULTS The Central & Eastern Europe region delivered solid results. Beer volume growth was 4.9%, and other beverage volume growth was strong at 20.3%, mainly due to growth of energy drinks in the eastern part of the region. Total volumes were up by 6.1%, supported by a positive contribution from most markets. Revenue grew organically by 10.1%. Revenue/hl improved during the year, supported by price increases in some Eastern European markets, a positive product mix and an improved channel mix in south-eastern Europe due to fewer on-trade restrictions. The region delivered a modest 1% organic operating profit growth. The operating margin contracted by 140bp to 17.6%, as the improved revenue/hl and several cost-saving initiatives were offset by higher COGS and logistics costs, and a difficult competitive environment in Russia.
CENTRAL & EASTERN EUROPE
A SOLID SET OF RESULTS
Central & Eastern Europe
Change Change
2020 Organic Acq., net FX 2021 Reported Volumes (million hl)
Beer 48.5 4.9% 0.0% - 50.8 4.9%
Other beverages 4.0 20.3% 0.0% - 4.9 20.3%
Total volume 52.5 6.1% 0.0% - 55.7 6.1%
DKK million
Revenue 15,682 10.1% 0.0% -3.8% 16,665 6.3%
Operating profit 2,984 1.0% 0.0% -2.8% 2,932 -1.8%
Operating margin (%) 19.0 17.6 -140bp
Our markets in Central & Eastern Europe
Consumption characteristics Our position Our
operations
Markets
Per capita beer
consumption (litres)
On-trade share
of market, approx. (%)
Market position (no.)
Market share¹ (%) Breweries²
Russia 64 10 2 27 8
Ukraine 43 16 2 31 3
Belarus 49 8 1 31 1
Kazakhstan 34 26 1 39 1
Azerbaijan 7 24 1 77 1
The Baltics 82-93 3-7 1-2 27-40 2
Italy 34 29 4 7 1
Greece 29 45 2 24 2
Bulgaria 80 15 1 43 2
Croatia 80 26 3 16 1
Serbia 65 17 3 22 1
¹ Sept. 2021 MAT. ² Breweries with capacity above 100,000 hl.
Source: GlobalData, Carlsberg estimates.

CARLSBERG GROUP ANNUAL REPORT 2021 2021 REVIEW AND 2022 EXPECTATIONS 21
RUSSIA In a slightly growing Russian market, we delivered 5% organic volume growth. Revenue/hl grew by mid-single-digit percentages, improving during the year because of price increases and a positive product mix. We saw strong growth of brands such as 1664 Blanc, Somersby, Tuborg, Baltika and the energy drink Flash Up. Craft & speciality and alcohol-free brews grew strongly. UKRAINE The Ukrainian beer market declined slightly due to adverse weather during the year and declining consumer confidence following a significant increase in inflation. Our volumes grew slightly. Revenue/hl increased because of price increases and an improved product mix. Craft & speciality, alcohol-free brews, Baltika, Carlsberg and Tuborg saw solid growth.
SOUTH-EASTERN EUROPE Our markets in south-eastern Europe grew by double-digit percentages, mainly because there were fewer COVID-19 restrictions than in 2020. Markets such as Italy and Greece did particularly well, further supported by a recovering tourist industry. Revenue/hl improved in all markets due to the positive channel mix from an improved on-trade channel and positive brand mix. EXPORT & LICENSE Volumes in the Export & License business grew by double-digit percentages. Tuborg and Carlsberg grew well in the European markets, and 1664 continued its solid performance in the Asian markets. Somersby grew strongly in Asia Pacific and Canada, and our alcohol-free brands did particularly well in the Middle East.
TOTAL VOLUME (m hl)
REVENUE (DKKbn)
OPERATING PROFIT (DKKbn)
OPERATING MARGIN
35
40
45
50
55
60
2019 2020 20210
4
8
12
16
20
2019 2020 20210
1
2
3
4
5
2019 2020 202112%
14%
16%
18%
20%
22%
2019 2020 2021
+21% FLASH UP VOLUME GROWTH IN 2021 The Flash Up energy drink originated in Russia and has been around for more than 20 years. In recent years, Flash Up has become increasingly popular among young adults across Russia. From 2018 to 2020, annual growth was more than 20% (CAGR), making Flash Up the market leader in the energy drinks segment in Russia. Flash Up has also become popular in neighbouring markets.
GROW BEYOND BEER

CARLSBERG GROUP ANNUAL REPORT 2021 2021 REVIEW AND 2022 EXPECTATIONS 22
SAIL’22 has clear priorities for delivering shareholder value: organic growth in operating profit, improved return on invested capital and optimal capital allocation.
Our capital allocation principles are well defined: 1. Investing in our business to drive
long-term sustainable growth. 2. Targeting NIBD/EBITDA of
below 2.0x. 3. Targeting an adjusted payout
ratio of around 50% (adjusted for special items after tax).
4. Distributing excess cash to shareholders through share buy-backs and/or extraordinary dividends.
5. Deviating from the above if value-enhancing acquisition opportunities arise.
Our capital allocation principles will remain unchanged in SAIL’27. DRIVING LONG-TERM GROWTH Notwithstanding the continued challenges posed by COVID-19 in
2021, we scaled up our marketing investments during the year. As in 2020, we adjusted the investment level during the year to the local market conditions, including the extent of lockdowns and various restrictions. For the year, marketing investments grew organically by 11%. Reported marketing investments amounted to 7.5% of revenue. The strong progress on our growth priorities (see page 28) and the rebound of organic volumes to above 2019 levels serve as proof points for the quality and sufficiency of our investments. Excluding the acquisition of the Brooklyn brand rights in 2020, CapEx in 2021 increased by DKK 625m, bringing the CapEx/revenue ratio to 6.3%. LEVERAGE Despite significant cash returns to shareholders, net interest-bearing debt to EBITDA at the end of the year was 1.24x, well below our target of below 2.0x.
DIVIDEND PAYOUT In March, we paid out a dividend of DKK 22 per share, equal to an increase of 5% on the previous year. In line with our dividend policy, the dividend amounted to DKK 3.2bn, corresponding to an adjusted payout ratio of approximately 50%. At the Annual General Meeting on 14 March 2022, the Supervisory Board will propose an increase in the dividend of 9% to DKK 24 per share. This corresponds to an adjusted payout ratio of 49%. SHARE BUY-BACK In 2019, the Supervisory Board decided, for the time being, to return excess cash to shareholders by means of share buy-back. Consequently, up to 28 January 2022 the Group had bought back 11,525,300 shares – equal to 7.6% of the number of shares at the end of 2018 – in total amounting to DKK 11.0bn.
2021 In 2021, the Group executed its share buy-back programmes on a quarterly basis due to the continued business uncertainty related to the COVID-19 pandemic. Accordingly, the Group announced four share buy-back programmes, in total amounting to DKK 4.0bn. The last quarterly programme was initiated on 28 October and ran until 28 January 2022. In fiscal 2021, 3,355,625 B shares were repurchased at a total purchase price of DKK 3.6bn. At the Annual General Meeting on 14 March 2022, the Supervisory Board will recommend that 3,400,000 treasury shares not used for hedging of incentive programmes be cancelled. 2022 Due to the continuing business uncertainty related to the COVID-19 pandemic in some of our markets, the Group intends to execute the
2022 share buy-back as quarterly programmes. Consequently, up until 22 April, the Group intends to buy back Carlsberg B shares amounting to DKK 1bn. The size of subsequent share buy-backs will be determined on a quarterly basis, with information on the next quarterly share buy-back programme being announced in connection with the Q1 trading statement on 28 April. More information regarding the share buy-back can be found in the 2021 financial statement announcement of 4 February 2022. VALUE-ENHANCING M&A The Group remains committed to value-enhancing M&A and will continue to explore relevant opportunities. In 2021, we completed the acquisition of Wernesgrüner Brewery in Germany and a few other minor acquisitions.
CAPITAL ALLOCATIONL
DELIVERING ON CAPITAL ALLOCATION PRINCIPLES

CARLSBERG GROUP ANNUAL REPORT 2021 2021 REVIEW AND 2022 EXPECTATIONS 23
2022 will be another challenging year, impacted by COVID-19 and substantial increases in input costs.
COVID-19 is expected to continue to impact our markets to various degrees. At the same time, our business will be impacted by substantial increases in input costs, which we aim to offset in absolute terms through higher revenue/hl and continued tight focus on costs. The higher revenue/hl may have a negative impact on beer consumption. As a result, 2022 guidance is: • Organic operating profit growth of
0-7%. In the second half of 2021, we began seeing significant price increases for commodities, packaging materials and energy, albeit with large variations between categories and between markets and regions. As a result, we are assuming an increase in cost of goods sold per hl (COGS/hl) of 10-12%. However, volatility remains high for many
categories, and the COGS development for the year may be impacted by changes in spot prices on unhedged input costs. Moreover, the earnings outlook is based on the following regional assumptions: • In Western Europe, we assume that
the on-trade channel will be less impacted by COVID-19 than in 2021, although we are expecting some on-trade disruption at the beginning of the year due to restrictions.
• In Asia, we expect another volatile year. While the vaccination rate is increasing in many markets in the region, COVID-19 outbreaks still pose a risk of national or regional lockdowns.
• In the southern part of the Central & Eastern Europe region we assume a lower impact on the on-trade from COVID-19 than in 2021. In the eastern part of the region, we expect consumer sentiment to be increasingly impacted by accelerating inflation,
which may impact beer market dynamics negatively.
Based on the spot rates at 3 February, we assume a translation impact of around DKK +250m for 2022. Other relevant assumptions are: • Financial expenses, excluding
currency losses or gains, are expected to be around DKK 550m.
• The reported effective tax rate is expected to be around 22-23%.
• Capital expenditure at constant currencies is expected to be around DKK 5.0bn.
Forward-looking statements Forward-looking statements are subject to risks and uncertainties that could cause the Group’s actual results to differ materially from those expressed in the forward-looking statements. This is particularly relevant in 2022 due to the very high uncertainty related to the continuing development and impact of COVID-19 and the substantial increases in input costs. Accordingly, forward-looking statements should not be relied on as a prediction of actual results. Please see page 49 for the full forward-looking statements notice.
2022 EARNINGS EXPECTATIONS
EARNINGS EXPECTATIONS

CARLSBERG GROUP ANNUAL REPORT 2021 OUR STRATEGY 24
We pursue perfection every day. We strive to brew better beers. Beers that stand at the heart of moments that bring people together. We do not settle for immediate gain when we can create a better tomorrow for all of us.
Our purpose is rooted in our heritage and in the mentality of our founders, who left a rich legacy that still greatly influences how we run our business today. Their pioneering spirit, passion for brewing and proactive contribution to society are what make us who we are. We live our purpose every day by focusing on our brands and the art of brewing, exciting our consumers with quality brews that strengthen our identity and pride as brewers, and by continuously aiming to do better. The embedding of our purpose has been further strengthened during the past two years. Our people have tirelessly demonstrated a high level of engagement and an innovative
mindset at all levels of the organisation, helping local communities, supporting our customers and minimising the impact of the pandemic on our business, while at the same time finding flexible and safe ways of working. We will continue to live our purpose, as it is key for the successful execution of our strategy and achieving our ambition of being successful, professional and attractive in our markets: Successful in achieving a sustainable balance of our Golden Triangle (see page 7). Professional in being the preferred supplier for our customers. Attractive in creating value for our shareholders, facilitating a great working environment and high-performance culture for our employees, and being a responsible and sustainable corporate citizen for society at large.
OUR PURPOSE
Our strategy
BREWING FOR A BETTER TODAY AND TOMORROW
25CARLSBERG GROUP ANNUAL REPORT 2021 OUR STRATEGY
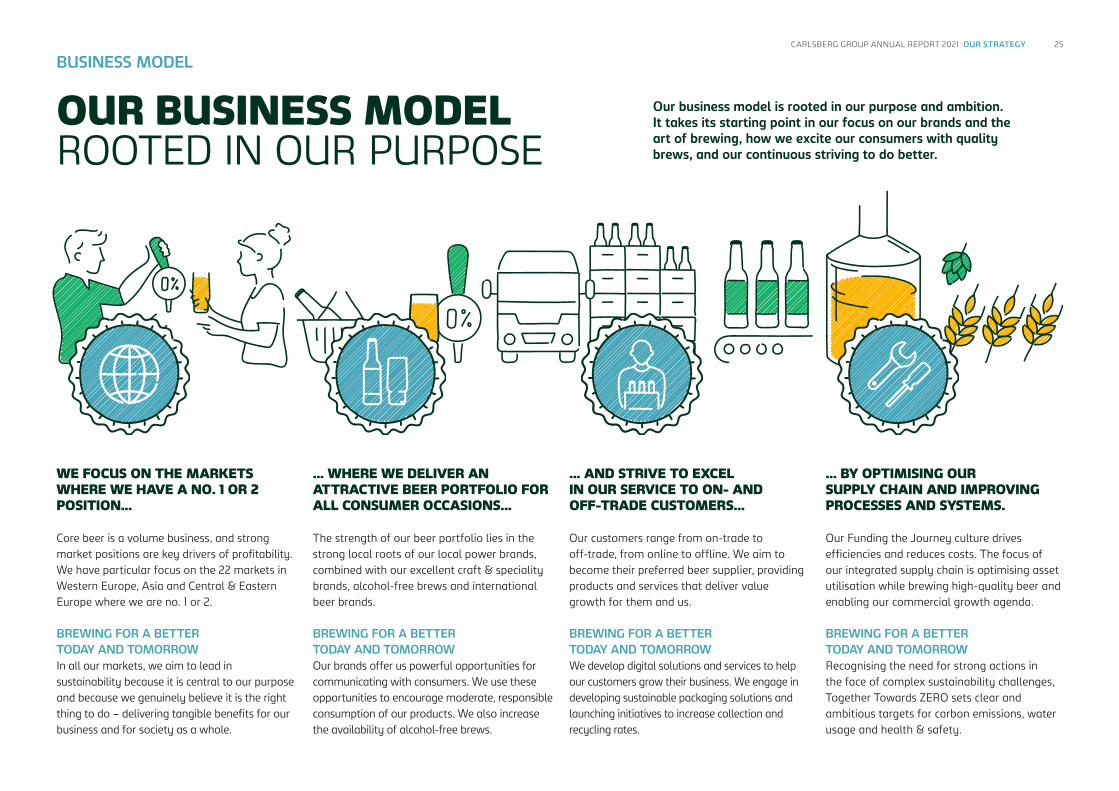
BUSINESS MODEL
Core beer is a volume business, and strong market positions are key drivers of profitability. We have particular focus on the 22 markets in Western Europe, Asia and Central & Eastern Europe where we are no. 1 or 2.
BREWING FOR A BETTER TODAY AND TOMORROW In all our markets, we aim to lead in sustainability because it is central to our purpose and because we genuinely believe it is the right thing to do – delivering tangible benefits for our business and for society as a whole.
The strength of our beer portfolio lies in the strong local roots of our local power brands, combined with our excellent craft & speciality brands, alcohol-free brews and international beer brands.
BREWING FOR A BETTER TODAY AND TOMORROW Our brands offer us powerful opportunities for communicating with consumers. We use these opportunities to encourage moderate, responsible consumption of our products. We also increase the availability of alcohol-free brews.
Our customers range from on-trade to off-trade, from online to offline. We aim to become their preferred beer supplier, providing products and services that deliver value growth for them and us.
BREWING FOR A BETTER TODAY AND TOMORROW We develop digital solutions and services to help our customers grow their business. We engage in developing sustainable packaging solutions and launching initiatives to increase collection and recycling rates.
Our Funding the Journey culture drives efficiencies and reduces costs. The focus of our integrated supply chain is optimising asset utilisation while brewing high-quality beer and enabling our commercial growth agenda.
BREWING FOR A BETTER TODAY AND TOMORROW Recognising the need for strong actions in the face of complex sustainability challenges, Together Towards ZERO sets clear and ambitious targets for carbon emissions, water usage and health & safety.
… AND STRIVE TO EXCEL IN OUR SERVICE TO ON- AND OFF-TRADE CUSTOMERS...
… WHERE WE DELIVER AN ATTRACTIVE BEER PORTFOLIO FOR ALL CONSUMER OCCASIONS...
WE FOCUS ON THE MARKETS WHERE WE HAVE A NO. 1 OR 2 POSITION...
... BY OPTIMISING OUR SUPPLY CHAIN AND IMPROVING PROCESSES AND SYSTEMS.
OUR BUSINESS MODELROOTED IN OUR PURPOSE
Our business model is rooted in our purpose and ambition. It takes its starting point in our focus on our brands and the art of brewing, how we excite our consumers with quality brews, and our continuous striving to do better.

CARLSBERG GROUP ANNUAL REPORT 2021 OUR STRATEGY 26
Our SAIL’22 strategy has served us well since its launch in 2016, resulting in a strong and resilient company.
SAIL’22 has focused on improving our business organically. Since 2016, it has guided our actions, setting clear priorities for how we brew for a better today and tomorrow. While providing a clear overall direction for our business, SAIL’22 has been a “living” strategy.
Since its launch in March 2016, we have continuously adjusted the application of the strategy to reflect learnings and also the market environment, which has significantly changed, especially with COVID-19. Coupled with a significantly strengthened performance management culture and a good organisational balance between markets, regions and central functions, we have been able to leverage scale while remaining close to local consumers and customers.
EXECUTING SAIL’22 2016-2017 Our headline for 2016-2017 was Funding the Journey. Our main focus was on delivering the benefits of this efficiency and savings programme, thereby allowing us to invest in the SAIL’22 priorities for driving long-term value growth and to improve operating profit. 2018-2019 In 2018, we shifted focus to organic top-line growth by means of delivering on the SAIL’22 priorities.
Our investments and execution paid off and the average annual organic growth from 2017 to 2019 was 3% for volumes and 4% for revenue. 2020-2021 The resilience of our strategic priorities was stress-tested and proven during the significant challenges posed by COVID-19 across our markets. Despite the setback and volatility caused by the pandemic in 2020-2021, the resilience of the Carlsberg Group was strong, and our financial results in 2021 were well above the pre-
pandemic levels of 2019: volumes +5% compared with 2019, revenue +1% and operating profit +4%. EVALUATING PROGRESS SAIL’22 is now coming to an end, and 2022 will be a year of transition to SAIL’27. 2023 will therefore be the first year of SAIL’27 (see pages 31-32). On the following pages, we present the results for selected SAIL’22 initiatives and priorities achieved since 2016.
DELIVERING ON SAIL’22
CONTINUED EXECUTION
Our SAIL’22 choices and priorities have strengthened the Group and we’re satisfied with the top- and bottom-line delivery. Cees ’t Hart CEO

17.2% 16.7%14.6% 14.0%
STRENGTHEN THE CORE
CORE BEER GBC
+5%Core beer remains an important part of our business, and revitalising core beer has been an important part of SAIL’22. We have measured our success by our ability to grow the gross brand contribution (GBC) from core beer. In 2021, GBC was up by 5%. Excluding the years impacted by COVID-19, GBC grew organically by an average of 4% per year from 2017 to 2019.
27CARLSBERG GROUP ANNUAL REPORT 2021 OUR STRATEGY
SAIL’22 sharpened our focus on our core beer business, our execution capabilities and efficiency, and our cost culture. The strategy has delivered well, and the strength of our core business has been evident in results during the past two challenging years of COVID-19.
DELIVERING ON
LEVERAGE OUR STRONGHOLDS
REVENUE/HL GROWTH ON CARL’S SHOP
+4%Carl’s Shop – our online business-to-business platform serving our on-trade customers – was first launched in 2018 in Western Europe. The platform is now available in ten markets across our three regions, serving more than 40,000 customers. Supporting our premiumisation efforts, revenue/hl on Carl’s Shop grew by 4% in 2021 and revenue was up by around 60%.
EXCEL IN EXECUTION
SG&A/REVENUE 2016-2021Funding the Journey, our three-year efficiency and cost reduction programme, was launched in late 2015. By the end of 2018, the programme had delivered savings of more than DKK 3bn, well ahead of initial expectations. More than DKK 1bn was reinvested in the company to support our SAIL’22 growth priorities. The mindset of Funding the Journey has become part of our corporate culture, resulting in a continual reduction in sales, general and administrative expenses (SG&A, excluding marketing).
-320bp
FUNDING THE JOURNEY CULTURE
SG&A EXCLUDING MARKETING/REVENUE
2016 202120202018
CORE BEER GBC, ORGANIC GROWTH
+3%2017
+6%2018
+3%2019
-7%2020
+5%2021
POSITION FOR GROWTH
28CARLSBERG GROUP ANNUAL REPORT 2021 OUR STRATEGY
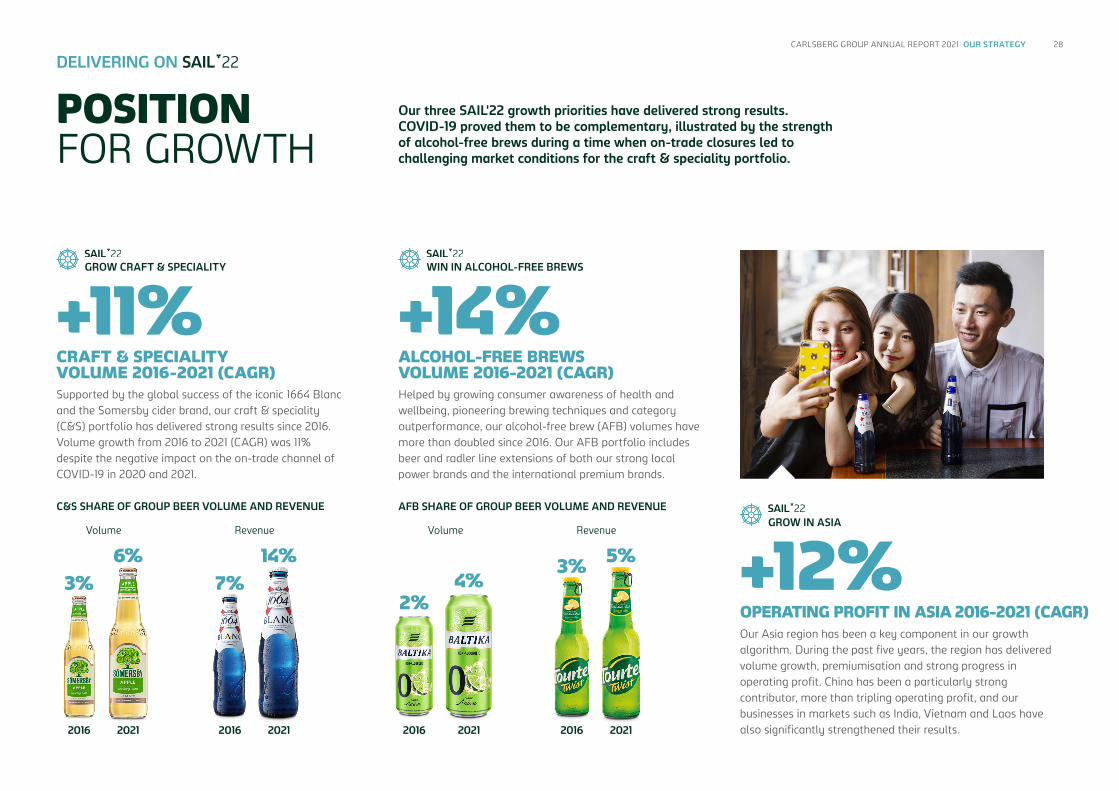
Our three SAIL'22 growth priorities have delivered strong results. COVID-19 proved them to be complementary, illustrated by the strength of alcohol-free brews during a time when on-trade closures led to challenging market conditions for the craft & speciality portfolio.
DELIVERING ON
CRAFT & SPECIALITY VOLUME 2016-2021 (CAGR)
ALCOHOL-FREE BREWS VOLUME 2016-2021 (CAGR)
+11%Supported by the global success of the iconic 1664 Blanc and the Somersby cider brand, our craft & speciality (C&S) portfolio has delivered strong results since 2016. Volume growth from 2016 to 2021 (CAGR) was 11% despite the negative impact on the on-trade channel of COVID-19 in 2020 and 2021.
Helped by growing consumer awareness of health and wellbeing, pioneering brewing techniques and category outperformance, our alcohol-free brew (AFB) volumes have more than doubled since 2016. Our AFB portfolio includes beer and radler line extensions of both our strong local power brands and the international premium brands.
+14%
GROW CRAFT & SPECIALITY
WIN IN ALCOHOL-FREE BREWS
C&S SHARE OF GROUP BEER VOLUME AND REVENUE
Volume VolumeRevenue Revenue
AFB SHARE OF GROUP BEER VOLUME AND REVENUE
OPERATING PROFIT IN ASIA 2016-2021 (CAGR)
+12%Our Asia region has been a key component in our growth algorithm. During the past five years, the region has delivered volume growth, premiumisation and strong progress in operating profit. China has been a particularly strong contributor, more than tripling operating profit, and our businesses in markets such as India, Vietnam and Laos have also significantly strengthened their results.
GROW IN ASIA
2021
6%
2016
3%
2021
4%
2016
2%
2021
14%
2016
7%
2021
5%
2016
3%

CREATING A WINNING CULTURE
29CARLSBERG GROUP ANNUAL REPORT 2021 OUR STRATEGY
Our winning culture continues to define what we want to be: team-based and performance-driven, governed by high ethical standards, and committed to responsibility and sustainability. We have stepped up within all of these areas as part of SAIL'22, and we are on track to deliver on our Together Towards ZERO targets.
DELIVERING ON
REDUCTION IN RELATIVE CARBON EMISSIONS 2015-2021
IMPROVEMENT IN WATER EFFICIENCY 2015-2021
40%
21%
Our new Code of Ethics & Conduct is designed to help everyone across the Group to live by our Compass every day. It is available in 29 languages and accompanied by updated e-learning, which includes real-life scenarios and examples of non-compliance red flags and how to mitigate them. It also encourages people to speak up about any instances where the code may have been violated. Read more about how we live by our Compass, including our new Code of Ethics & Conduct, and find more details on our Speak Up system in the ESG Report.
LIVE BY OUR COMPASS
TOGETHER TOWARDS ZERO
Our Group-wide employee survey – MyVoice – is carried out every other year. On the back of the very challenging working conditions in the past two years, we were pleased that 92% of our workforce participated in the 2021 survey and that results were stable compared with 2019. The overall engagement score was 82%, while 89% of employees are satisfied with our company as a place to work.
ENGAGEMENT SCORE
82%
TEAM-BASED PERFORMANCE
Our ambitious carbon targets are approved by the Science-Based Targets Initiative and in line with the latest climate science to limit global warming to 1.5°C. In 2021, we reduced relative brewery carbon emissions by 2%. Since 2015, our relative brewery carbon emissions are down by 40%, while our relative value chain (beer-in-hand) emissions in were reduced by 7% from 2015-2019.
Water is an essential ingredient in our products, and other key ingredients like grains and hops need it to grow. At 2.7 hl/hl in 2021, we have made a 21% improvement in water efficiency from our 2015 baseline. Our 2030 target is to halve the amount of water we use per hl of beer, from the 2015 baseline, and we are on track to reach the halfway mark of a 25% reduction in 2022.
UPDATED CODE OF ETHICS & CONDUCT
Read more about our winning culture in the ESG Report, available online onwww.carlsberggroup.com

DELIVER VALUE FOR SHAREHOLDERS
Since the launch in 2016, SAIL'22 has significantly improved the strategic health of the Group. Successful achievements for our strategic priorities have led to consistent progress on our KPIs for delivering value for shareholders, albeit results in 2020 and 2021 were impacted by COVID-19.
DELIVERING ON
6.8bn+440bp 1.24x+7% ORGANIC GROWTH IN OPERATING PROFIT
OPTIMAL CAPITAL ALLOCATION
ROIC IMPROVEMENT
Our capital allocation principles are well defined (see page 23). We have been successful in keeping our leverage below the target of net interest-bearing debt/EBITDA below 2x and maintaining our dividend policy: a payout ratio of around 50% of adjusted net profit. We have engaged in value-accretive acquisitions and returned excess cash to shareholders by means of share buy-backs.
Except in 2020, the Group has consistently grown operating profit organically through top-line growth and continuous focus on efficiencies and costs as part of our Funding the Journey culture.
We have consistently improved return on invested capital (ROIC) by strengthening earnings and reducing invested capital.
30CARLSBERG GROUP ANNUAL REPORT 2021 OUR STRATEGY
CASH RETURNS (DKK) TO SHAREHOLDERS 2021
2016-2021 NIBD/EBITDA 20212016-2021 (AVERAGE)
0%
-4%
4%
8%
12%
16%
2016 2017 2018 2019 2020 2021
0%
3%
6%
9%
12%
2016 2017 2018 2019 2020 20210x
0,5x
1,0x
1,5x
2,0x
2016 2017 2018 2019 2020 20210
2
4
6
8
Dividends (DKKbn)
Share buy-back (DKKbn)
2016 2017 2018 2019 2020 2021

CARLSBERG GROUP ANNUAL REPORT 2021 OUR STRATEGY 31
An evolution of SAIL’22, SAIL’27 is built around our purpose and our ambition of being the most successful, professional and attractive brewer in our markets.
SAIL’27 was developed as a collaborative, company-wide effort, co-created by over 200 Carlsberg
employees from more than 30 different markets to ensure that we incorporated the learnings from SAIL’22 and that SAIL’27 will be strongly embedded in our local markets and central functions from the very beginning. In developing SAIL’27, we aimed at keeping and sharpening our strong
strategic, organisational and financial dynamics while ensuring that our direction-setting was refreshed and that our new strategy reflects expected consumer, customer, societal, regulatory, economic and geopolitical trends and their likely impact on the beer category in terms of both volume and value. As such, SAIL’27 reflects the learnings from
the past and assumptions for the future blended together. SAIL’27 PRIORITIES SAIL’27 focuses on five strategic levers – portfolio, geographies, execution, culture and funding the journey – for which we have made distinct strategic choices, defining the focus of our efforts and resource
allocation. Our strategic levers and choices should be viewed as an integrated set of activities that together will drive shareholder value. INCREASING OUR AMBITIONS With SAIL'27, we will continue our successful journey. We believe we can successfully capture long-term growth opportunities, and we are therefore increasing our financial and sustainability ambitions for the SAIL'27 period: • Organic revenue growth of 3-5%
CAGR • Organic operating profit growth
above revenue growth. • Continued ROIC focus • Disciplined capital allocation
(unchanged from SAIL'22, see page 22)
• Ambitious sustainability targets. SAIL’27 is presented in detail in the stock exchange announcement of 3 February, available on www.carlsberggroup.com.
OUR NEW STRATEGY – SAIL’27
CONTINUING THE SUCCESS OF SAIL’22

CARLSBERG GROUP ANNUAL REPORT 2021 OUR STRATEGY 32
We worked with 138 co-strategists to build SAIL’27. They provided valuable insights and fantastic views, helping us frame and develop our strategic priorities and ensuring that they fit the needs of all our markets and functions. Marcela Wiwe Director and leader of the co-strategist programme
138 SAIL’27 CO-CREATORS
SAIL’27 was co-created with talents from across the Carlsberg Group. In addition to our Extended Leadership Team, 138 co-strategists from our markets, regions and Group functions participated in reviews as well as the development of 34 different workstreams with the ambition to capture even more diverse thinking in the considerations and choices for the next strategy period. Our co-strategists brought valuable experience, local market insights, learnings and ideas to the strategy process and were an important contributor to the strategic choices and priorities of SAIL’27.
OUR WINNING CULTURE

CARLSBERG GROUP ANNUAL REPORT 2021 OUR STRATEGY 33
Climate change is already affecting our operations and markets. Across our regions, we see its impact through land degradation, more hot and dry weather, and intense rainfall.
We are working to understand the related risks and opportunities, and to mitigate impact on our business. Our annual Environment, Social & Governance Report details our Together Towards ZERO approach, progress on our ambitious ZERO carbon targets, and the action we are taking to support the Paris Agreement on Climate Change to limit the increase in global average temperature to a maximum of 1.5°C. The report also addresses our exposure to climate change risk and the impact on our value chain. In the table, we outline the relevant sections for TCFD reporting in this Annual Report and in our Sustainability and Remuneration Reports.
ADDRESSING CLIMATE RISKS
CLIMATE- RELATED RISKS
Task Force on Climate-related Financial Disclosures (TCFD) reporting recommendations
Recommendation Our disclosure in brief Learn more
Governance
Disclose the organisation's governance around climate-related risks and opportunities.
The Supervisory Board has ultimate responsibility for risk management, including climate-related risks. As part of the ongoing review of SAIL'22, the Supervisory Board reviews Together Towards ZERO, including progress towards our targets on ZERO carbon and ZERO water waste. The Executive Committee (ExCom) is responsible for sustainability, including climate change, with the CEO assuming ultimate responsibility. ExCom approves policies and targets for the entire organisation and monitors performance on a quarterly basis. Sustainability measures, including the reduction of carbon and water use, are included in the short-term incentive scheme for the CEO, CFO and other ExCom members.
• Risk management framework, page 34.
• Overview of Supervisory Board and Audit Committee work and responsibilities, pages 39-41.
• Environment, Social & Governance Report, description of governance, pages 55-58.
• Remuneration Report, pages 6-7.
Strategy Disclose the actual and potential impacts of climate-related risks and opportunities on the organisation’s businesses, strategy and financial planning, where such information is material.
Together Towards ZERO is an integrated part of our SAIL’22 strategy. It was developed in partnership with global experts and includes science-based targets to reduce emissions in line with the goal of the Paris Agreement to limit global warming to a maximum of 1.5°C. Together Towards ZERO’s focus areas and targets are based on a sustainability materiality assessment, updated in 2020, to ensure we focus on the sustainability risks and opportunities that are most relevant to our stakeholders, including those related to climate change and water. Our new strategy, SAIL’27, incorporates an even more ambitious approach to sustainability issues, including carbon, water. More details on the expanded Together Towards ZERO and Beyond will be provided in April 2022.
• SAIL’22, Together Towards ZERO, pages 6 and 30.
• Environment, Social & Governance Report, carbon and water sections, pages 10-20 and 21-27.
• Environment, Social & Governance Report, materiality assessment, page 61.
Risks Disclose how the organisation identifies, assesses and manages climate-related risks.
Mid- and long-term risks, including climate-related risks and opportunities, are reviewed annually at Group level. We use a materiality assessment to identify the most important sustainability management topics, risks and impacts. The latest assessment in 2020 confirmed that climate change was among the highest-ranking issues for us to address. We updated our analysis of our beer-in-hand value chain footprint (Scope 1, 2 and 3 emissions) in 2020 to measure our progress from the 2015 baseline and identify where to focus our efforts to reduce emissions and mitigate risk. We used WWF’s Water Risk Filter to identify which of our breweries are in areas of high water risk. We were also the first multinational to test WWF’s ground-breaking scenario analysis tool to examine the potential impacts of climatic and socioeconomic changes on water and subsequent implications for our business by 2030 and 2050, and to help us identify priority sites for investments and community partnerships. In addition, we conducted a water risk assessment of two key commodities, rice and barley.
• Risk management framework, page 34.
• Environment, Social & Governance Report, carbon and water sections, pages 10-20 and 21-27.
• Environment, Social & Governance Report, materiality assessment, page 61.
Metrics and targets Disclose the metrics and targets used to assess and manage relevant climate-related risks and opportunities, where such information is material.
Our annual Environment, Social & Governance Report discloses our approach, progress against our Together Towards ZERO targets for 2022 and 2030, key performance indicators and actions to support the UN Sustainable Development Goals and the UN Global Compact. We disclose a comprehensive set of seven-year comparable quantitative data for energy, carbon (including Scope 1, 2 and 3 emissions, with a full Scope 3 analysis every three years) and water. We have also disclosed detailed information to CDP on our greenhouse gas emissions and approach to climate change management annually since 2007.
• Environment, Social & Governance Report, data summary table, pages 72-78.
• Environment, Social & Governance Report, SDG actions, pages 64-69.

CARLSBERG GROUP ANNUAL REPORT 2021 OUR STRATEGY 34
In conducting our business and executing our strategy, we seek to manage risks in such a way as to minimise their threats while making the best use of their opportunities.
Our business is subject to a number of risks and uncertainties that could have both short-term and long-term implications for the Group. The purpose of our risk management approach is to address these risks and uncertainties in due time. GOVERNANCE STRUCTURE The Supervisory Board is ultimately responsible for risk management and has appointed the Audit Committee to act on its behalf in monitoring the effectiveness of the Group’s risk management. The Audit Committee monitors developments and ensures that plans are in place for managing individual risks, including strategic, operational, financial and compliance risks.
The Executive Committee (ExCom) is responsible for reviewing the overall risk exposure associated with the Group’s activities and ensuring that appropriate actions are taken. SHORT-TERM RISK ASSESSMENT Risks are assessed according to a two-dimensional heat map that estimates the impact of the risk on operating profit or brand/image and the likelihood of the risk materialising. Based on this assessment, ExCom identifies the high-risk issues for the coming year. ExCom assigns risk owners, who are responsible for mitigating the risks through a programme of risk management activities. Local and functional risk assessment follows the same principles and methodology as Group-level risk assessment. Risk reporting is incorporated in regular business reviews, and Group Risk Management is responsible for the framework and Group Finance for facilitating and following up on
risk action plans for the most significant risks in connection with regular business reviews. MID- AND LONG-TERM RISK ASSESSMENT A review of mid- and long-term risks is conducted annually at Group level. Based on input from various central functions, including finance, legal, sustainability, human resources and investor relations, and regional teams, the Group strategy team identifies risks within the areas of commercial & competition, governance, consumer, macro-economic and geopolitical environment, reputation, supply chain and climate. For climate-related risks, see our TCFD reporting on page 33. Based on this risk identification, ExCom will evaluate and assess the Group’s risk exposure, applying our two-dimensional heat map methodology, and determine appropriate actions.
RISKS IDENTIFIED FOR 2022 The identified risks for 2022 are shown in the box on the right. Based on the heat map assessment, the six highest ranked risks are elaborated on in the following, including in each case a description of the risk and associated mitigation efforts. Our mitigating actions and opportunities for three out of six risks are closely related and benefit from the well-established SAIL’22 execution capabilities. The risk movement paragraph indicates whether the likelihood of risk has increased, decreased or remained unchanged versus last year. IMPACT FROM COVID-19 Risk movement Decrease versus last year. Description COVID-19 continues to affect our people and business across our regions. While government interventions vary by geography, lockdowns and other restrictive
MANAGING RISKS
MANAGING BUSINESS RISKS
IDENTIFIED RISKS FOR 2022 RISKS WITH HIGHEST POTENTIAL IMPACT AND LIKELIHOOD • Impact from COVID-19 • Ability to mitigate input
cost inflation • Economic instability • Partnerships • Legal and regulatory
compliance • Cyber and IT security OTHER IDENTIFIED RISKS • Regulatory changes, incl.
duties • Financial flexibility • Business interruption • Consumer action in the
event of non-performance on ESG matters
• Talent and workforce shortage

CARLSBERG GROUP ANNUAL REPORT 2021 OUR STRATEGY 35
measures across all three regions affect consumer off-take in both the on-trade and off-trade channels. Further, supply chains may be impacted by raw material shortages and the ability to brew and distribute our products. Depending on geography and go-to-market models, our markets may therefore be impacted in terms of volume, mix, margin and cash flow performance. We anticipate continuous impact from COVID-19 in 2022 in accordance with how the pandemic develops and with the distribution and efficacy of vaccines. Mitigation Our first priority will remain the health and safety of our employees. Operationally, we will continue to apply the ways of working from 2020 and 2021. These include frequent planning cycles, utilising our sales and operation planning (S&OP) practices to enable fast adaptation and response to changing market demand and supply chain circumstances. In addition, we also leverage our Funding the Journey culture, including the Operating Cost Management (OCM) toolkit. Our actions and activities will continue to be tailored to local markets to ensure an appropriate
response to country-specific challenges and situations. INPUT COST INFLATION Risk movement New. Description Many of our input costs, including, but not limited to, barley and malt and various packaging materials, saw significant price increases during 2021. Further, in some markets adverse foreign exchange movements are exacerbating the inflationary pressure. Competition in most markets is generally fierce, and in many markets across our regions this is leading to a challenging pricing environment. In addition, increasing inflation may negatively impact consumer sentiment and purchasing power. Mitigation Being well hedged for our major commodities, we have a high degree of transparency on the input cost headwind, which enabled us to begin preparing for the challenging situation from mid-2021 onwards at market, regional and Group level. Per market, we are determining the right balance of mitigating actions, including value management, channel
and category mix, pricing and Funding the Journey initiatives. Commodity risks and hedging of raw materials are described in more detail in section 1.2 and foreign exchange risk in section 1.3 in the notes to the consolidated financial statements. ECONOMIC INSTABILITY Risk movement Increase versus last year. Description In continuation of the COVID-19 risk, the pandemic has led to high macroeconomic uncertainty. Growing inflation, interest rate increases in key economies, adverse currency movements and geopolitical tensions are further exacerbating the macroeconomic risk. Exchange rate fluctuations can have a significant impact on the Group’s financial results. The high economic uncertainty also poses a downside risk to disposable incomes, possibly impacting beer markets negatively. Mitigation During the past two years, our planning has become more short-term and highly flexible to allow appropriate actions within a short time horizon.
Our strategic priorities are well founded in the business, enabling us to leverage our value management capabilities, continue our portfolio optimisation efforts, including premiumisation, focus on alcohol-free brews and increasingly also on other beverage categories, and leverage our Funding the Journey culture. Our exposure to exchange rate fluctuations and our related actions, including the impact on the income statement and borrowings and our hedging arrangements, are described in sections 1 and 4 in the consolidated financial statements. PARTNERSHIPS Risk movement Unchanged versus last year. Description We cooperate with partners in some markets in Western Europe and Asia, and we also have local joint venture partners in some Asian and European markets. Disagreements with partners on the operational management and strategic direction of partnerships may limit our ability to manage the growth and risk profile of our business. Cooperation with most of our partners is positive. However, over a period of
time, we have had serious disagree-ments with our partner in Carlsberg South Asia Pte Ltd (CSAPL), in which the Group has 67% ownership and our partner has 33% ownership. CSAPL owns 100% of our business in India and 90% of our business in Nepal. Several of the disagreements pertaining to the Shareholders’ Agreement between Carlsberg and our partner have been referred to arbitration in Singapore. We expect the arbitration award in H1 2022. Carlsberg called in a loan made to the partner that had become due and payable in full. This issue had been subject to separate court proceedings in Singapore for some time. In January 2022, the Singapore court of appeal finally confirmed that the loan with interest is repayable by the partner to Carlsberg in full. In Nepal, the local shareholder owning the remaining 10% of the shares in the business is a related party to the Group’s partner in CSAPL. The above-mentioned disagreements include a dispute with the local 10% shareholder. Contrary to its legal and contractual rights, the Group’s influence on the business operations in Nepal is currently being restricted through actions that hamper its right of decision-making and insight into the business.
CARLSBERG GROUP ANNUAL REPORT 2021 OUR STRATEGY 36
We are contesting these actions in Nepal through the local courts and anticipate that the operations and management of the Nepalese business will eventually be normalised in line with the Group’s legal and contractual rights. However, consolidation of the Nepalese business was ceased at the end of 2021 until such time as our rights as majority shareholder are re-established. Disputes always carry some inherent risk. The outcome of the above-mentioned disputes could limit the Carlsberg Group’s freedom to operate in India and Nepal, and affect our operational and financial performance. The arbitration could have various outcomes, including either party being awarded a call option to buy out the other shareholder. If the tribunal were to find that Carlsberg has materially breached the Shareholders’ Agreement, although this is not expected, the partner could become entitled to a call option to acquire the Group’s 67% shareholding in CSAPL. From the time that such a call option were to become exercisable, the Group would, for accounting purposes, be required to cease consolidation of CSAPL, including Carlsberg India, and derecognise the investment in Gorkha Brewery, Nepal. If such a call
option were to be awarded but not exercised, the Group would resume consolidation when the option lapses. Conversely, if the award is in favour of the Group, it could result in the acquisition of the 33% shareholding in CSAPL held by the partner. A party being awarded a call option that is subsequently exercised could lead to that party taking possession of 100% of the shares in CSAPL, resulting in the other party no longer being involved in the business of CSAPL. See sections 3.4 and 5.4 in the consolidated financial statements for further details of the partnership. Mitigation The Group continuously seeks to promote a fair and mutually beneficial development of its partnerships in order to safeguard their success. We seek to have an ongoing dialogue with our partners to identify issues at an early stage. The relevant members of ExCom are actively involved in partner relationships, participating in the ongoing dialogues to ensure constructive negotiations and fast and effective resolution of potential issues. LEGAL AND REGULATORY COMPLIANCE Risk movement Unchanged versus last year.
Description Legal and regulatory compliance risks include competition law and data protection compliance (GDPR), as well as non-compliance with anti-bribery & corruption regulations and trade sanctions. Failure to comply with regulations and Group policies may lead to fines, claims, and brand and reputation damage. In recent years, the Group has experienced competition-law dawn raids in a few jurisdictions. Non-compliance with competition law is a real and growing risk, and the Group is party to certain lawsuits and disputes. These and their significance are described in section 3.4 of the consolidated financial statements. Mitigation We continuously strengthen the Group-wide control framework covering legal compliance areas, including, but not limited to, compe-tition law, anti-bribery & corruption, trade sanctions and data protection. In 2021, we also further enhanced the compliance control framework to reflect insight and learning from Speak Up cases, regulatory guidance and enforcement action. We regularly review and, where necessary, update relevant Group legal and compliance policies, and conduct compulsory training of all relevant employees.
We actively set a strong tone from the top and have developed toolkits to help managers in all markets better understand their role in shaping ethical behaviour every day. We have enhanced our compliance training programme and updated our e-learning modules, including in 2021 updated training on the Code of Ethics & Conduct. Relevant new and existing employees are required to complete compliance e-learning modules on an ongoing basis in order to maintain awareness of relevant risks and how to mitigate them. In 2021, we reviewed, simplified and rationalised the suite of compliance policies, manuals, guidance etc. to facilitate greater understanding and awareness by the wider business of the behaviour expected of all employees to reduce compliance risk. This included the launch of and Group-wide training in our updated Code of Ethics & Conduct in the third quarter (see page 30). Read more about our compliance efforts in the Responsible business section of the Environment, Social & Governance Report. CYBER AND IT SECURITY Risk movement Decrease versus last year.
Description Like all other businesses, the Carlsberg Group relies heavily on technology and IT infrastructure for its day-to-day business. A cyber attack or non-availability of IT systems could have severe financial, regulatory and reputational consequences for our business. The decrease of the risk versus 2021 is due to the introduction of new incident monitoring and response capabilities as well as advanced defensive technologies. Mitigation Our IT security organisation has regular dialogue with ExCom and the Supervisory Board to agree on risk mitigation plans and activities. Our Chief Information Security Officer leads an independent cyber security function within our IT organisation. As the cyber security threat assessment has intensified in recent years, we have strengthened our protective work to counter the risk. Furthermore, we deploy a wide array of advanced defensive technologies, as well as continuing to embed our risk management framework at all layers of the organisation. We undertake regular testing of our security controls via an ongoing series of technological audits and breach simulations.
CARLSBERG GROUP ANNUAL REPORT 2021 GOVERNANCE 37
Our governance framework aims to ensure value creation, safeguard active and transparent stewardship across the Group and reduce risk.
The governing bodies of the Carlsberg Group are the Supervisory Board and the Executive Board. None of the members of the Supervisory Board are or have been involved in the executive management of the Group. The Supervisory Board hires and supervises the Executive Board, which consists of the CEO and the CFO, who are not members of the Supervisory Board. The division of responsibilities is described in the Rules of Procedure. The Group also has an Executive Committee (ExCom), which, in addition to the CEO and the CFO, consists of a wider group of Executive Vice Presidents, portrayed on pages 46-47. While the Executive Board members are formally registered as executive directors of
the Company, the Executive Committee collectively prepares and implements the Company’s strategic plans. RECOMMENDATIONS ON CORPORATE GOVERNANCE The Supervisory Board is responsible for the Company’s corporate governance framework and compliance with the corporate governance recommendations and statutory requirements. The Supervisory Board applies the Recommendations on Corporate Governance issued by the Danish Committee on Corporate Governance. The Company complies with all but four of the current recommendations: • With respect to the recommendation
to publish quarterly reports, the Group has chosen to only publish full- and half-year reports.
• With respect to the recommendation that a majority of the members of a board committee should be independent, in 2021 two of the four members of the Nomination
Committee and of the Remuneration Committee were independent.
• With respect to the recommendation that at least half of the members of the Supervisory Board elected by the general meeting should be independent, four out of ten members were considered independent in 2021. After the Annual General Meeting in March 2022, the Company expects to be compliant with the recommendation.
• With respect to the recommendation to include external assistance in the board evaluation at least every third year, the Supervisory Board evaluation in 2021 was not facilitated by an external advisor.
The Company’s statutory report on corporate governance includes the full list of recommendations, with
comments on the Group’s position on each recommendation. The report also includes the reporting on internal controls and risk management systems applied as a basis for the financial reporting process. OUR COMPASS The Supervisory Board is responsible for overseeing that the Executive Committee has an adequate system and resources in place to ensure compliance with the Company’s codes and policies in relation to its business activities. The Group’s core values are integrity, responsibility, honesty and ethical business conduct. Living by these values – our Compass – supports our strategy, mitigates risks and protects our reputation as a responsible brewer. Our Compass consists of a Code of Ethics and Conduct and our Group policies, which guide everyone in the Group on how to act every day, setting out the ethical standards for our behaviour both within the
company and towards external business partners such as customers and suppliers. Group policies include, but are not limited to, anti-bribery & corruption, labour & human rights, diversity & inclusion, competition law, trade sanctions, data protection, risk management, finance, marketing, corporate communication, responsible drinking and public & government affairs. In 2021, we drew up a policy on data ethics. The Environment, Social & Governance Report includes a thorough description of how we implement and live by our Compass in our day-to-day actions, including areas such as anti-bribery & corruption, compliance and our Speak Up system, as well as how we work with and seek to ensure high standards for data ethics as dscribed in our Data Ethics Policy.
CORPORATE GOVERNANCE
Governance
FOCUS ON CORPORATE GOVERNANCE
Download our statutory report on corporate governance
www.carlsberggroup.com/who-we-are/ corporate-governance/#statutoryreports
Download our policies
www.carlsberggroup.com/sustainability/ download/download-our-policies
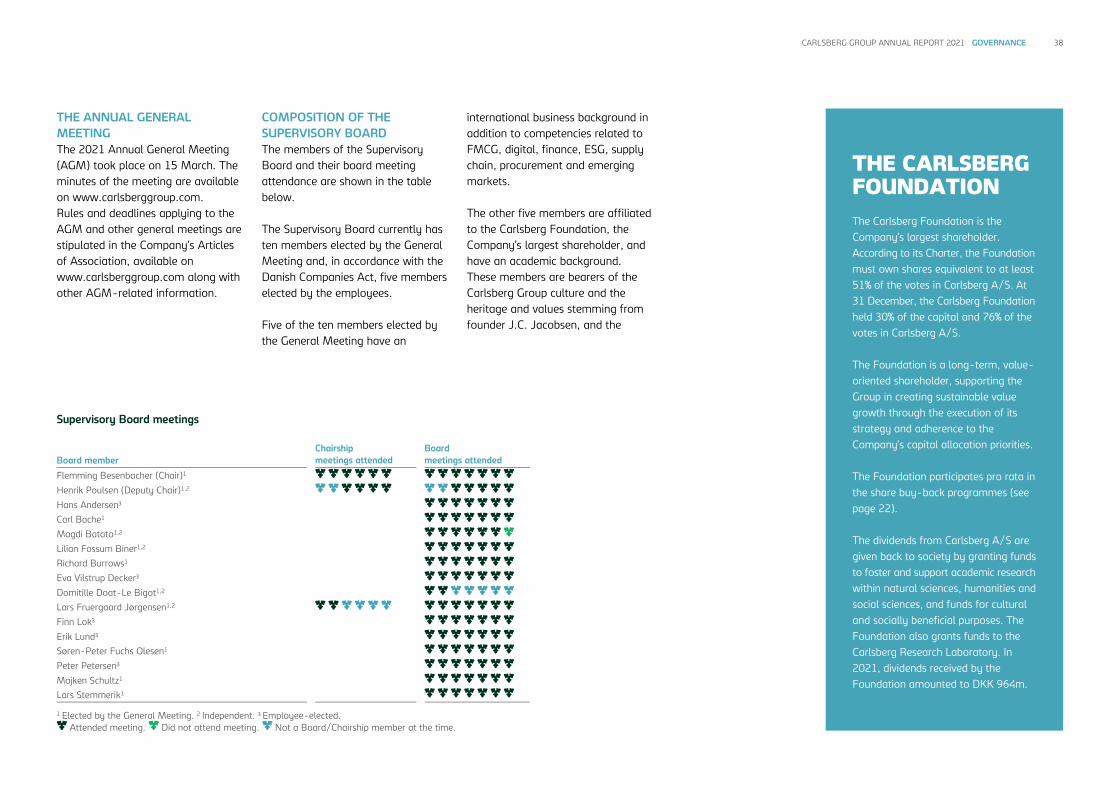
CARLSBERG GROUP ANNUAL REPORT 2021 GOVERNANCE 38
THE ANNUAL GENERAL MEETING The 2021 Annual General Meeting (AGM) took place on 15 March. The minutes of the meeting are available on www.carlsberggroup.com. Rules and deadlines applying to the AGM and other general meetings are stipulated in the Company’s Articles of Association, available on www.carlsberggroup.com along with other AGM-related information.
COMPOSITION OF THE SUPERVISORY BOARD The members of the Supervisory Board and their board meeting attendance are shown in the table below. The Supervisory Board currently has ten members elected by the General Meeting and, in accordance with the Danish Companies Act, five members elected by the employees. Five of the ten members elected by the General Meeting have an
international business background in addition to competencies related to FMCG, digital, finance, ESG, supply chain, procurement and emerging markets. The other five members are affiliated to the Carlsberg Foundation, the Company’s largest shareholder, and have an academic background. These members are bearers of the Carlsberg Group culture and the heritage and values stemming from founder J.C. Jacobsen, and the
Supervisory Board meetings
Board member Chairship meetings attended
Board meetings attended
Flemming Besenbacher (Chair)1
Henrik Poulsen (Deputy Chair)1,2
Hans Andersen3
Carl Bache1
Magdi Batato1,2
Lilian Fossum Biner1,2
Richard Burrows1
Eva Vilstrup Decker3
Domitille Doat-Le Bigot1,2
Lars Fruergaard Jørgensen1,2
Finn Lok3
Erik Lund3
Søren-Peter Fuchs Olesen1
Peter Petersen3
Majken Schultz1
Lars Stemmerik1 1 Elected by the General Meeting. 2 Independent. 3 Employee-elected.
Attended meeting. Did not attend meeting. Not a Board/Chairship member at the time.
THE CARLSBERG FOUNDATION The Carlsberg Foundation is the Company’s largest shareholder. According to its Charter, the Foundation must own shares equivalent to at least 51% of the votes in Carlsberg A/S. At 31 December, the Carlsberg Foundation held 30% of the capital and 76% of the votes in Carlsberg A/S. The Foundation is a long-term, value-oriented shareholder, supporting the Group in creating sustainable value growth through the execution of its strategy and adherence to the Company’s capital allocation priorities. The Foundation participates pro rata in the share buy-back programmes (see page 22). The dividends from Carlsberg A/S are given back to society by granting funds to foster and support academic research within natural sciences, humanities and social sciences, and funds for cultural and socially beneficial purposes. The Foundation also grants funds to the Carlsberg Research Laboratory. In 2021, dividends received by the Foundation amounted to DKK 964m.

CARLSBERG GROUP ANNUAL REPORT 2021 GOVERNANCE 39
Supervisory Board sees these members as patrons of the same. The employee representatives are elected for a term of four years. They hold the same rights and obligations as the members elected by the General Meeting. The current employee representatives were elected in 2018 and the next election will take place in 2022. Information on the Supervisory Board members is available on pages 43-45. Detailed CVs can be found on www.carlsberggroup.com. DIVERSITY AND COMPETENCIES The Supervisory Board recognises the benefits of diversity in respect of experience, culture, international experience and gender. Diversity is of high priority for the Supervisory Board, and it has laid down the following specific objectives in relation to international experience and gender: • With regard to international
experience, the objective is that 50% or more of the Supervisory Board members elected by the General Meeting should have substantial international experience from managing large corporations or institutions.
• The proportion of the under-represented gender (currently women) on the Supervisory Board
should reach at least 40% of the members elected by the General Meeting no later than 2021. The gender target applies to the boards of all Danish Carlsberg Group companies that are required to set such objectives.
The Supervisory Board fulfils the objective regarding international experience. In 2021, the Supervisory Board did not meet the objective with regard to gender diversity, as only two Supervisory Board members elected by the General Meeting were women, i.e. 20%. At the Annual General Meeting in March 2022, the Supervisory Board will propose three female candidates, bringing the ratio of women on the Supervisory Board to 33%. The objective with regard to gender diversity is therefore not expected to be met in 2022. However, the Company expects to meet the gender diversity target at the Annual General Meeting in 2023. At Carlsberg Breweries A/S, the four Supervisory Board members elected by the General Meeting are men, being the members of the Chairship and of the Executive Board of Carlsberg A/S. After the Annual General Meeting in 2022, it is expected that one of four members
will be a woman, being the Deputy Chair of Carlsberg A/S. At Carlsberg Danmark A/S and Carlsberg Supply Company Danmark A/S, one of three Supervisory Board members is a woman. At Carlsberg Integrated Information Technology A/S, one of four Supervisory Board members is a woman. The 2021 Environment, Social & Governance Report contains information on our work with diversity and inclusion in the Carlsberg Group. The Supervisory Board continuously assesses, including as part of its annual board evaluation, whether the board members possess the required skills and competencies to best support the Carlsberg Group and its strategy, and whether the composition can be further optimised for this purpose. The skills and competencies that should be represented on the Supervisory Board are described in the Specification of Competencies, available on www.carlsberggroup.com. On the basis of a recommendation from the Nomination Committee, the Supervisory Board reviews the Specification of Competencies annually.
The Supervisory Board believes that the current composition of the Board ensures an appropriate level of skills, breadth and diversity in the members’ approach to their duties, thereby helping to ensure that decisions are well considered and that both short- and long-term perspectives are taken into account. SUPERVISORY BOARD EVALUATION PROCESS Each year, the Chair of the Supervisory Board heads a structured evaluation of the Board’s work, accomplishments and competencies. In 2021, the evaluation process was headed by the Chair and Deputy Chair and led to a short catalogue of ideas for the Supervisory Board work. Together with management, the ideas will be considered and, where relevant, implemented. During the evaluation process in 2021, the Supervisory Board members generally expressed that meeting material is of a high quality, that agendas cover relevant topics, that meetings are well planned, and that the time and discussions are well prioritised. The members also appreciated the discussions with the Executive Board and other management members, and the mutual trust and
cooperation with the Executive Board. THE WORK OF THE SUPERVISORY BOARD The main topics of discussion at the Supervisory Board meetings in 2021 are presented in the box on page 40. The Executive Board always attends the Supervisory Board meetings and, in order to improve transparency, the members of ExCom are also invited and attend when relevant. This gives the Supervisory Board better insight into the business. In connection with most Supervisory Board meetings, key people from the Group present a market, a function or other relevant topics. In 2021, these covered updates on Carlsberg’s COVID-19 plans, including the impact on employees and the business, internal audit, research, IT security, quality, the people agenda, including diversity & inclusion, the businesses in Germany and France, commercial priorities and three-year plans. BOARD COMMITTEES The Supervisory Board has established three board committees: the Audit, Nomination and Remuneration Committees. Each year, the Supervisory Board considers whether the number and

CARLSBERG GROUP ANNUAL REPORT 2021 GOVERNANCE 40
Nomination Committee meetings
Committee member Committee meetings attended
Flemming Besenbacher (Chair)
Carl Bache
Lars Fruergaard Jørgensen1
Richard Burrows
Henrik Poulsen1 1 Independent.
Attended meeting. Not a Committee member at the time.
Remuneration Committee meetings Committee member Committee meetings attended
Richard Burrows (Chair)
Magdi Batato1
Domitille Doat-Le Bigot1
Søren-Peter Fuchs Olesen
Henrik Poulsen1
Flemming Besenbacher2 1 Independent. 2 Not a member of the Committee; attends meetings in his capacity as Chair of the Supervisory Board.
Attended meeting. Not a Committee member at the time.
Audit Committee meetings
Committee member Committee meetings attended
Lilian Fossum Biner1 (Chair)
Magdi Batato1
Richard Burrows
Lars Fruergaard Jørgensen1
Henrik Poulsen1
Flemming Besenbacher2 1 Independent. 2 Not a member of the Committee; attends meetings in his capacity as Chair of the Supervisory Board.
Attended meeting. Did not attend meeting. Not a Committee member at the time.
crisis and beyond, including global guidelines on flexible workplaces.
• Review and endorsement of the Group’s people agenda.
• Review and endorsement of the Group’s strategic diversity & inclusion agenda.
• Discussion and approval of the bonus structures in the Group’s incentive programme, ensuring support of and alignment with SAIL’22.
Compliance • Review of Carlsberg’s compliance risks
and set-up, including discussion of compliance-enhancing efforts.
Governance and risk management • Review of the outcome of the
Supervisory Board evaluation process, including follow-up on all suggestions.
• Review and discussion of the internal audit & control reports, working processes and continued improvement.
• Review and discussion of the Group’s IT & cyber security strategy.
• Discussion of relevant issues and ways of working with the external auditor.
• Approval of the external auditor for election at the 2021 AGM.
SUPERVISORY BOARD 2021 MAIN TOPICS OF DISCUSSION Strategy • Review and discussion of the Group's
COVID-19 strategy and plans. • Follow up on SAIL'22, including potential
impact of COVID-19 on strategic priorities. • Continuous review and discussion of and
feedback on the development of SAIL’27. • Review of the progress of Together
Towards ZERO, including as part of SAIL’27.
• Review of and debate on R&D, innovation, branding, quality and other strategic initiatives.
• Monitoring of the Funding the Journey culture in the Group's ways of working, including application of the Operating Cost Management toolkit.
• Review and approval of the Group's capital structure, funding, dividend and share buy-backs.
• Review and discussion of organic opportunities.
• Review of various markets and functions, and discussions with the heads of the same.
Organisation, people, succession planning and talent management • Review of the Supervisory Board
composition. • Succession planning for the executive
management. • Review of the Group's approach to taking
care of employees during the COVID-19

CARLSBERG GROUP ANNUAL REPORT 2021 GOVERNANCE 41
scope of the committees are appropriate. Committee members are appointed for one year at a time. The members of the respective committees and their meeting attendance are shown in the tables on page 40. THE NOMINATION COMMITTEE The Terms of Reference for the Nomination Committee are available on www.carlsberggroup.com. In 2021, the Committee had particular focus on: • Planning the Board's evaluation
process. • Reviewing the Specification of
Competencies for Board members to ensure that they reflect the skills and experiences needed to best support the execution of SAIL'22.
• Succession planning at management and Supervisory Board level, including nomination of a new Deputy Chair.
• Evaluating the composition of ExCom and the composition, structure and size of the Supervisory Board.
THE REMUNERATION COMMITTEE The Terms of Reference for the Remuneration Committee are available on www.carlsberggroup.com.
In 2021, the main activities of the Remuneration Committee were: • Preparing the 2020 Remuneration
Report in line with new reporting standards under the EU Shareholder Rights Directive.
• Increasing the weighting of ESG in the short-term incentive plan from 2021 onwards as well as considering inclusion in the long-term incentive.
• Amending the peer group for total shareholder return to better align with our most direct industry peers.
• Reviewing the approach to target-setting for, and ongoing performance against, STI and LTI plans in light of the uncertain business environment.
• Considering the incentive arrangements in light of the developing future business strategy.
The work of the Committee is described in more detail in the Remuneration Report, available on www.carlsberggroup.com. THE AUDIT COMMITTEE The Terms of Reference for the Audit Committee are available on www.carlsberggroup.com. The Committee members have the relevant financial expertise and necessary experience of the Company’s sector.
The Audit Committee works according to the Terms of Reference and a detailed annual meeting plan. In 2021, the Audit Committee had particular focus on a number of areas, including: • Monitoring the effectiveness of the
control environment and overseeing the progress on improving and further developing the effectiveness of the controls over financial reporting.
• Monitoring the external financial reporting and the work of the external auditors.
• Reviewing the progress of the work of the Group Internal Audit function.
• Reviewing the external financial reporting, including the annual reporting.
• Reviewing the work regarding Speak Up matters.
• Managing financial risk. • Reviewing the risk management
process. • Reviewing Global Shared Services. • Receiving updates on Group tax. • Reviewing succession planning for
financial personnel. • Reviewing the Company’s
preparation for compliance with the EU Green Taxonomy.
INTERNAL CONTROL AND RISK MANAGEMENT RELATED TO THE FINANCIAL REPORTING PROCESS OVERALL CONTROL ENVIRONMENT The Supervisory Board and ExCom have overall responsibility for the Carlsberg Group’s internal control environment. The Audit Committee is responsible for monitoring the effectiveness of the overall internal control environment and risk management systems, in particular related to the financial reporting process. The Group has a number of policies and procedures in key areas of financial reporting, including the Finance Policy, the Accounting Manual, the Controller Manual, the Use of Auditors Policy, the Chart of Authority, the Risk Management Policy, the Financial Risk Management Policy, the Corporate Governance Policy, the Information Security & Acceptable Use Policy, the Records Management & Personal Data Protection Policy, the Stock Exchange Compliance Policy, the Tax Policy, and the Code of Ethics & Conduct. The policies and procedures apply to all subsidiaries, and similar requirements are set out in
collaboration with the partners in joint ventures. The Group’s internal control framework for financial reporting is designed to reduce and mitigate financial risks identified and ensure reliable internal and external financial reporting. It defines who is responsible and provides assurance that key risks are covered by internal control activities. As a consequence of the Group’s growth due to acquisitions, systems and processes are not standardised across entities. The Group will continue to strengthen the internal control environment through further standardisation, increased automation, strong analytics and transparent governance. The financial reporting control framework is monitored through entities’ self-assessment of the effectiveness of the implemented controls and continuous testing of performance by the Group’s Risk & Internal Control function. The monitoring of the performance of the controls focuses on the adequacy of the controls, their effectiveness and the efficiency of the overall controlling processes.

CARLSBERG GROUP ANNUAL REPORT 2021 GOVERNANCE 42
RISK ASSESSMENT With the implementation of the internal control framework for financial reporting, the Group has identified the risks that could have a direct or indirect material impact on the financial statements. Group entities are required to document and report transaction processes and the controls in place to cover the key risks identified. Group entities are required to reassess their controls biannually and must update changes to the control framework for financial reporting, including new risks and controls. CONTROL ACTIVITIES The Group has implemented a formalised financial reporting process, budget process, estimates and monthly reporting on actual performance. The accounting information reported by all Group companies is reviewed by controllers with regional or functional in-depth knowledge of the individual companies/functions and by technical accounting specialists. Controllers are continuously updated on best practice relating to internal financial controls, and trained in new accounting and reporting requirements.
The entities in the Group are dependent on IT systems. Any weaknesses in the system controls or IT environment are compensated for by manual controls in order to mitigate any significant risk relating to the financial reporting. In 2021, the Group completed a project on standardising finance and accounting processes in Western Europe. The Group has established a global process function in order to continue the work with standardisation and simplification throughout the Group for all areas. The quality of processes and associated internal controls are subject to continuous monitoring and testing by the Group’s Risk & Internal Control function as well as to regular internal audits. INFORMATION AND COMMUNICATION The Group has established information and communication systems to ensure accounting and internal control compliance. During the risk assessment process, Group entities are required to report on missing or inadequate controls. Each entity assesses any need for compensating controls, or for design and implementation of new controls. Furthermore, Group entities are required to maintain mapping of
risks related to the segregation of duties and implement necessary compensating controls, thereby continuously strengthening the internal control environment and enforcing optimal segregation of duties in the ERP systems. MONITORING The Audit Committee’s monitoring covers both the internal control environment and business risk. Monitoring of the internal control environment is covered by the Group’s control framework for financial reporting. The financial risks are assessed and reviewed at multiple levels in the Group, including monthly performance review meetings at ExCom level, periodic review of control documentation, and audits performed by Group Internal Audit. GROUP INTERNAL AUDIT Group Internal Audit provides objective and independent assessment of the adequacy, effectiveness and quality of the Group’s internal controls. Group Internal Audit works in accordance with a charter, which is reviewed periodically and approved by the Audit Committee. Taking into account the annual review of business risks (see pages 34-36), an internal audit plan is
drawn up for the year. The plan is reviewed and approved by the Audit Committee. In 2021, Group Internal Audit conducted audits mainly in the areas of financial reporting controls, compliance (internal and external regulation), information technology and third-party risk management. In addition, Group Internal Audit continuously assesses the adequacy of actions implemented by management to address previously raised risks and control issues. SPEAK UP The Carlsberg Group has a Speak Up system that enables employees to report misconduct. Reports typically relate to suspected violations of the Carlsberg Code of Ethics & Conduct. The Speak Up system is operated by an external provider and allows concerns to be brought to the attention of the Group Speak Up Review team anonymously, confidentially and via multiple channels. The Speak Up Review team is responsible for reviewing and overseeing all reported Speak Up matters. Furthermore, an Integrity Committee, chaired by the CFO, oversees the follow-up of major Speak Up investigations and provides a report to ExCom and the Audit Committee at least quarterly.
The Speak Up Summary report contains an overview of all open and closed investigations during the quarter and the time taken to resolve cases. The Misconduct Investigation Handbook was updated in 2020 to clarify how investigations should be undertaken. In 2021, there was a relaunch of a communication campaign to raise awareness of the various Speak Up channels available and the importance of speaking up. These communication efforts will continue in 2022. Since the establishment of the Speak Up system, some reports and their subsequent investigation have led to disciplinary sanctions, including dismissal on the basis of violation of the Code of Ethics & Conduct and/ or Group policies. The incidents have not had any material impact on the financial results of the Group except for those items recognised in the statement of financial position. More information regarding the Speak Up system, including reported concerns and disciplinary actions, can be found in the Environment, Social & Governance Report.

CARLSBERG GROUP ANNUAL REPORT 2021 GOVERNANCE 43
SUPERVISORY BOARD
SUPERVISORY BOARD

CARLSBERG GROUP ANNUAL REPORT 2021 GOVERNANCE 44
SUPERVISORY BOARD MEMBERS
FLEMMING BESENBACHER CHAIR (SINCE 2012) Nationality: Danish Year of birth: 1952 Appointed (until): 2005 (2022)
BOARD FUNCTION Non-executive, non-independent director. BOARD COMMITTEES Nomination Committee (Chair). PROFESSION Professor, D.Sc., h.c. mult, FRSC. OTHER BOARD POSITIONS Board Chair Aarhus Vand, UNLEASH, ONE\THIRD, DANIAS. Board Member Unisense, SulfiLogger. Flemming Besenbacher has notified the Supervisory Board that he is not standing for re-election at the Annual General Meeting.
HENRIK POULSEN DEPUTY CHAIR (SINCE 2021) Nationality: Danish Year of birth: 1967 Appointed (until): 2021 (2022)
BOARD FUNCTION Non-executive, independent director. BOARD COMMITTEES Audit Committee, Nomination Committee, Remuneration Committee. PROFESSION Non-executive board director. OTHER BOARD POSITIONS Board Chair Faerch Group. Board Deputy Chair ISS. Board Member Ørsted, Novo Nordisk, Novo Holdings, Bertelsmann SE & Co. The Supervisory Board will propose Henrik Poulsen as the new Chair of the Supervisory Board.
HANS ANDERSEN Nationality: Danish Year of birth: 1955 Appointed (until): 1998 (2022)
BOARD FUNCTION Employee representative. BOARD COMMITTEES None. PROFESSION Brewery worker, Carlsberg Supply Company Danmark. OTHER BOARD POSITIONS None. CARL BACHE Nationality: Danish Year of birth: 1953 Appointed (until): 2014 (2022)
BOARD FUNCTION Non-executive, non-independent director. BOARD COMMITTEES Nomination Committee. PROFESSION Professor, Ph.D., Dr.Phil. Head of the Doctoral School of the Humanities at the University of Southern Denmark. Member of the Board of Directors of the Carlsberg Foundation. OTHER BOARD POSITIONS None.
MAGDI BATATO Nationality: Swiss Year of birth: 1959 Appointed (until): 2018 (2022)
BOARD FUNCTION Non-executive, independent director. BOARD COMMITTEES Audit Committee, Remuneration Committee. PROFESSION Executive Vice President and Head of Operations, Nestlé. OTHER BOARD POSITIONS None.
LILIAN FOSSUM BINER Nationality: Swedish Year of birth: 1962 Appointed (until): 2019 (2022)
BOARD FUNCTION Non-executive, independent director. BOARD COMMITTEES Audit Committee (Chair). PROFESSION Non-executive board director. OTHER BOARD POSITIONS Board Member Givaudan, Scania, L.E. Lundbergföretagen, Alfa Laval, a-connect.
RICHARD BURROWS Nationality: Irish Year of birth: 1946 Appointed (until): 2009 (2022)
BOARD FUNCTION Non-executive, independent director. BOARD COMMITTEES Remuneration Committee (Chair), Audit Committee, Nomination Committee. PROFESSION Non-executive board director. OTHER BOARD POSITIONS Board Chair Pepco Group. EVA VILSTRUP DECKER Nationality: Danish Year of birth: 1964 Appointed (until): 2014 (2022)
BOARD FUNCTION Employee representative. BOARD COMMITTEES None. PROFESSION Senior Director, Carlsberg Breweries. OTHER BOARD POSITIONS None.

CARLSBERG GROUP ANNUAL REPORT 2021 GOVERNANCE 45
LARS FRUERGAARD JØRGENSEN Nationality: Danish Year of birth: 1966 Appointed (until): 2019 (2022)
BOARD FUNCTION Non-executive, independent director. BOARD COMMITTEES Nomination Committee. PROFESSION President & CEO, Novo Nordisk. OTHER BOARD POSITIONS None. Lars Fruergaard Jørgensen has notified the Supervisory Board that he is not standing for re-election at the Annual General Meeting.
FINN LOK Nationality: Danish Year of birth: 1958 Appointed (until): 2014 (2022)
BOARD FUNCTION Employee representative. BOARD COMMITTEES None. PROFESSION Ph.D. and Brew Master, Principal Scientist, Carlsberg. OTHER BOARD POSITIONS None.
ERIK LUND Nationality: Danish Year of birth: 1964 Appointed (until): 2015 (2022)
BOARD FUNCTION Employee representative. BOARD COMMITTEES None. PROFESSION Head Brewer, Carlsberg. OTHER BOARD POSITIONS None. SØREN-PETER FUCHS OLESEN Nationality: Danish Year of birth: 1955 Appointed (until): 2012 (2022)
BOARD FUNCTION Non-executive, non-independent director. BOARD COMMITTEES Remuneration Committee. PROFESSION Professor, D.M.Sc. CEO of the Danish National Research Foundation. Member of the Board of Directors of the Carlsberg Foundation. OTHER BOARD POSITIONS None.
PETER PETERSEN Nationality: Danish Year of birth: 1969 Appointed (until): 2010 (2022)
BOARD FUNCTION Employee representative. BOARD COMMITTEES None. PROFESSION President of the Staff Association. Process Lead, Carlsberg Supply Company Danmark. OTHER BOARD POSITIONS None. MAJKEN SCHULTZ Nationality: Danish Year of birth: 1958 Appointed (until): 2019 (2022)
BOARD FUNCTION Non-executive, non-independent director. BOARD COMMITTEES None. PROFESSION Chair of the Board of Directors of the Carlsberg Foundation. Professor, Ph.D., Copenhagen Business School. International Research Fellow, Saïd Business School, Oxford University. OTHER BOARD POSITIONS Board Member Realdania. The Supervisory Board will propose Maiken Schultz as the new Deputy Chair of the Supervisory Board.
LARS STEMMERIK Nationality: Danish Year of birth: 1956 Appointed (until): 2010 (2022)
BOARD FUNCTION Non-executive, non-independent director. BOARD COMMITTEES None. PROFESSION Professor, D.Sc., University of Copenhagen. Member of the Board of Directors of the Carlsberg Foundation. OTHER BOARD POSITIONS None. Lars Stemmerik has notified the Supervisory Board that he is not standing for re-election at the Annual General Meeting.
The Supervisory Board members’ full CVs, including their skills and competencies, are available online at
www.carlsberggroup.com/who-we-are/about-the-carlsberg-group/ supervisory-board/
NEW BOARD MEMBERS The Supervisory Board will propose Mikael Aro and Punita Lal as new members to be elected at the Annual General Meeting on 14 March 2022 MIKAEL ARO Nationality: Finnish Year of birth: 1965
BOARD FUNCTION Non-executive, independent director. PROFESSION Senior Industry Advisor, Triton. OTHER BOARD POSITIONS Board Chair Kojamo, Glamox, Geia Foods, Flokk. Board Member Avarn security. PUNITA LAL Nationality: Indian Year of birth: 1962
BOARD FUNCTION Non-executive, independent director. PROFESSION Non-executive board director. OTHER BOARD POSITIONS Board Member DBS Group Bank, Cipla.

CARLSBERG GROUP ANNUAL REPORT 2021 GOVERNANCE 46
EXECUTIVE COMMITTEE
OUR SENIOR MANAGEMENT TEAM

CARLSBERG GROUP ANNUAL REPORT 2021 GOVERNANCE 47
EXECUTIVE COMMITTEE MEMBERS CEES ’T HART CEO Nationality: Dutch Year of birth: 1958 Appointed: 2015 Prior to joining the Carlsberg Group, Cees was CEO of the Dutch dairy company Royal FrieslandCampina, a position he had held since 2008. Prior to FrieslandCampina, Cees spent 25 years with Unilever, holding management positions across Eastern Europe, Western Europe and Asia and with the last position being member of the Europe Executive Board. Cees is Chair of the Supervisory Board of KLM and a member of the Board of AFKLM. HEINE DALSGAARD CFO Nationality: Danish Year of birth: 1971 Appointed: 2016 Heine joined the Carlsberg Group from ISS, one of the world’s largest facility services companies. He went to ISS in 2013, prior to the company’s IPO in 2014. Before ISS, he was Group CFO at Grundfos. Heine’s previous experience includes various senior management and
financial positions at Carpetland, Hewlett Packard and Arthur Andersen. Heine is a member of the Board of Directors and Chair of the Audit Committee of Novozymes and a member of the Board of Directors and Chair of the Audit Committee of Pandora. JOÃO ABECASIS CHIEF COMMERCIAL OFFICER Nationality: Portuguese Year of birth: 1972 Appointed: 2019 João joined the Carlsberg Group in 2011 as CCO and later Managing Director of Super Bock, our associate in Portugal. In 2016, he became Vice President for smaller markets in the Western Europe region. He also served as interim Managing Director of Carlsberg Danmark. In 2017, he became Managing Director of our French business, Kronenbourg. Earlier in his career, João held a range of sales and marketing roles at Unilever. SØREN BRINCK EXECUTIVE VICE PRESIDENT STRATEGY AND DIGITAL Nationality: Danish Year of birth: 1974 Appointed: 2021 Søren joined Carlsberg’s commercial team in 2005. During his career at Carlsberg, he has held various
management positions at Group, regional and market level. From 2009 to 2019, he was Managing Director in Denmark, Norway and Greece, while most recently he was SVP, Asia. LEO EVERS EXECUTIVE VICE PRESIDENT ASIA Nationality: Dutch Year of birth: 1964 Appointed: 2021 Leo Evers joined Carlsberg from Heineken, where since 1990 he had held several managerial positions, most recently Managing Director of Heineken Vietnam and Regional Managing Director APAC. As the latter, he was responsible for Singapore, Malaysia, Papua New Guinea, Australia, New Zealand, Laos, Sri Lanka, Philippines, New Caledonia and Solomon Islands. GRAHAM FEWKES EXECUTIVE VICE PRESIDENT WESTERN EUROPE Nationality: British Year of birth: 1968 Appointed: 2014 Graham joined the Carlsberg Group as Vice President Commercial, Asia, in 2008, before becoming SVP of Group Sales, Marketing & Innovation, in 2014. Prior to his current role, he served as EVP, Asia,
from 2015 to 2021. Graham has strong experience in the global drinks business, having served in a wide range of international sales and marketing roles for Grand Metropolitan plc, Foster’s Brewing Group and S&N plc. JORIS HUIJSMANS CHIEF HUMAN RESOURCES OFFICER Nationality: Dutch Year of birth: 1975 Appointed: 1 January 2022 Joris joined Carlsberg in 2016. Prior to becoming CHRO in 2021, he headed up Carlsberg Export & License. Before that, he was VP, Urban Development and New Business, and VP, Group Strategy. Joris joined Carlsberg with over 20 years of FMCG industry and emerging markets experience, including various roles at Heineken. LARS LEHMANN EXECUTIVE VICE PRESIDENT CENTRAL & EASTERN EUROPE Nationality: Danish Year of birth: 1966 Appointed: 2019 Lars joined the Carlsberg Group in 2003 as Commercial Development Director. Since then, he has held several management positions, including VP, Commercial, for Eastern Europe & BBH and head of Export, License & Duty Free. In
2016, he became Managing Director of Carlsberg Malaysia. Prior to joining Carlsberg, Lars was with Action Nordic and Unilever Denmark. VICTOR SHEVTSOV EXECUTIVE VICE PRESIDENT SUPPLY CHAIN Nationality: Russian Year of birth: 1970 Appointed: 2021 Victor joined Carlsberg from PepsiCo in 2015 as Vice President for our supply chain in Asia. Victor has solid end-to-end supply chain expertise accrued through a variety of roles during his career.

CARLSBERG GROUP ANNUAL REPORT 2021 GOVERNANCE 48
Carlsberg A/S is listed on Nasdaq Copenhagen. The Company has around 56,000 registered shareholders.
The Company has two share classes: Carlsberg A and Carlsberg B. An A share carries 20 votes, while a B share carries two votes and is entitled to a preferential dividend. The B share is included in the Nasdaq OMX Nordic Large Cap and OMXC20 blue-chip indices.
As a supplement to its Copenhagen listing, the Company has established a sponsored level 1 ADR (American Depository Receipt) programme with J.P. Morgan. The ADRs trade over-the-counter in the USA under the symbol CABGY. More information on the ADR programme is available on our investor website. MAJOR SHAREHOLDERS At 31 December 2021, the Company’s largest shareholder was
the Carlsberg Foundation with 30% of the capital and 76% of the votes. In accordance with section 29 of the Danish Securities Trading Act, Massachusetts Financial Services Company (Boston, USA) has notified Carlsberg that it too owns more than 5% of the share capital. SHAREHOLDER RETURN The Carlsberg Group’s dividend policy stipulates an adjusted payout ratio of around 50%. In addition, the Company conducted four share buy-back programmes in 2021. For more information, see page 22.
INVESTOR RELATIONS The Carlsberg Group aims to give shareholders and the market the best possible insight into factors considered relevant for ensuring market-efficient and fair pricing of the Company’s shares. This is achieved through the quality, consistency and continuity of the information provided to the market, which is handled by the Group’s Investor Relations department. We observe a four-week silent period prior to the publication of the annual and half-year reports, and a two-week silent period prior to the Q1 and Q3 trading statements.
GROUP WEBSITE www.carlsberggroup.com provides comprehensive information about the Group and its shares and bonds, including Company announcements, annual and quarterly reports, share prices and financial data, investor presentations, webcasts and transcripts, and a financial and event calendar. At the end of 2021, a total of 30 brokers had coverage of the Company. The analysts’ names and consensus estimates can be found on the website.
SHARE INFORMATION
INFORMATION FOR SHAREHOLDERS
CARLSBERG B SHARE 2021 (DKK)
SHAREHOLDER GEOGRAPHIC SPLIT (excluding the Carlsberg Foundation and treasury shares)
Share information
Share class A B Total Number of issued shares¹ 33,699,252 111,557,554 145,256,806
Number of issued shares, excl. treasury shares¹ 33,699,252 108,193,036 141,892.288
Carlsberg Foundation 33,065,996 9,811,629 42,877,625
Votes per share 20 2
Par value DKK 20 DKK 20
Share price, year-end DKK 1,215.0 DKK 1,129.5
Proposed dividend per share DKK 24.0 DKK 24.0 ¹ At 31 December 2021.
Financial calendar 2022
Event Date Annual General Meeting 14 March
Q1 trading statement 28 April
H1 interim financial statement 17 August
Capital Markets Day 28 September
Q3 trading statement 27 October
700
800
900
1,000
1,100
1,200
1,300
Jan
Feb
Mar
Apr
May Jun
Jul
Aug Sep
Oct
Nov
Dec
US42%
UK17%
DK16%
Other 25%

CARLSBERG GROUP ANNUAL REPORT 2021 FORWARD-LOOKING STATEMENTS AND ESEF 49
This Annual Report contains forward-looking statements, including statements about the Group’s sales, revenues, earnings, spending, margins, cash flow, inventory, products, actions, plans, strategies, objectives and guidance with respect to the Group's future operating results. Forward-looking statements include, without limitation, any statement that may predict, forecast, indicate or imply future results, performance or achievements, and may contain the words “believe, anticipate, expect, estimate, intend, plan, project, will be, will continue, will result, could, may, might”, or any variations of such words or other words with similar meanings. Any such statements are subject to risks and uncertainties that could cause the Group’s actual results to differ materially from the results discussed in such forward-looking statements.
Prospective information is based on management’s then current expectations or forecasts. Such information is subject to the risk that such expectations or forecasts, or the assumptions underlying such expectations or forecasts, may change. The Group assumes no obligation to update any such forward-looking statements to reflect actual results, changes in assumptions or changes in other factors affecting such forward-looking statements. Some important risk factors that could cause the Group’s actual results to differ materially from those expressed in its forward-looking statements include, but are not limited to: economic and geopolitical uncertainty (including interest rates and exchange rates), financial and regulatory developments, demand for the Group’s products, increasing industry consolidation, competition from other breweries, the availability and pricing of raw materials and packaging materials, cost of energy,
production- and distribution-related issues, information technology failures, breach or unexpected termination of contracts, market-driven price reductions, market acceptance of new products, changes in consumer preferences, launches of rival products, stipulation of fair value in the opening balance sheet of acquired entities, litigation, environmental issues and other unforeseen factors. New risk factors can arise, and it may not be possible for management to predict all such risk factors, nor to assess the impact of all such risk factors on the Group’s business or the extent to which any individual risk factor, or combination of factors, may cause results to differ materially from those contained in any forward-looking statement. Accordingly, forward-looking statements should not be relied on as a prediction of actual results.
Forward-looking statements and ESEF
FORWARD-LOOKING STATEMENTS AND ESEF
ESEF data
Domicile of entity Denmark
Description of nature of entity’s operations and principal activities
Brewing company
Country of incorporation Denmark
Principal place of business Global
Legal form of entity A/S
Name of reporting entity or other means of identification Carlsberg A/S
Address of entity's registered office 1 J. C. Jacobsens Gade 1799 Copenhagen V

CARLSBERG GROUP ANNUAL REPORT 2021 CONSOLIDATED FINANCIAL STATEMENTS 50
CONSOLIDATED FINANCIAL STATEMENTS
Income statement ................................... 51
Statement of comprehensive income ......................................................... 51
Statement of financial position ......... 52
Statement of changes in equity ........ 53
Statement of cash flows ...................... 54
Notes ............................................................ 55
PARENT COMPANY FINANCIAL STATEMENTS
Statements .............................................. 124
Notes ......................................................... 127
REPORTS
Management statement ................... 134
Auditor’s reports ................................... 135
SECTION 1 OPERATING ACTIVITIES 1.1 Segmentation of operations ..................57 1.2 Operating expenses, inventories
and deposit liabilities ................................60 1.3 Foreign exchange risk related to
earnings ........................................................62 1.4 Cash flow from operating
activities ........................................................63 1.5 Trade receivables and on-trade
loans ..............................................................64
SECTION 2 ASSET BASE AND RETURNS 2.1 Segmentation of assets and
returns ...........................................................68 2.2 Impairment ..................................................69 2.3 Intangible assets and property,
plant and equipment ................................76
SECTION 3 SPECIAL ITEMS, PROVISIONS AND OTHER LIABILITIES 3.1 Special items ...............................................80 3.2 Provisions .....................................................82 3.3 Other liabilities ...........................................82 3.4 Contingent liabilities .................................83
SECTION 4 FINANCING COSTS, CAPITAL STRUCTURE AND EQUITY 4.1 Financial income and expenses ............85 4.2 Net interest-bearing debt .......................86 4.3 Capital structure ........................................86 4.4 Borrowings and cash................................89 4.5 Interest rate risk .........................................90 4.6 Foreign exchange risk related to
net investments and financing activities ........................................................91
4.7 Funding and liquidity risk ........................93 4.8 Derivative financial instruments............95
SECTION 5 ACQUISITIONS, DISPOSALS, ASSOCIATES AND JOINT VENTURES 5.1 Investment model and risks ...................97 5.2 Acquisitions and disposals ......................98 5.3 Non-controlling interests .................... 101 5.4 Contingent considerations ................... 102 5.5 Associates and joint ventures ............. 103
SECTION 6 TAX 6.1 Income tax ................................................ 104 6.2 Tax assets and liabilities ...................... 105
SECTION 7 STAFF COSTS AND REMUNERATION 7.1 Staff costs ................................................. 107 7.2 Remuneration .......................................... 108 7.3 Share-based payments ........................ 108 7.4 Retirement benefit obligations
and similar obligations ......................... 110
SECTION 8 OTHER DISCLOSURE REQUIREMENTS 8.1 Earnings per share ................................. 113 8.2 Fees to auditors ...................................... 114 8.3 Related parties ........................................ 114 8.4 Events after the reporting period ...... 114
SECTION 9 BASIS FOR PREPARATION 9.1 Significant accounting estimates
and judgements ...................................... 115 9.2 General accounting policies ................ 115 9.3 Changes in accounting policies .......... 119 9.4 New legislation ....................................... 119
SECTION 10 GROUP COMPANIES 10 Group companies.................................... 120
CONSOLIDATED FINANCIAL STATEMENTS
Consolidated financial statements
.

CARLSBERG GROUP ANNUAL REPORT 2021 CONSOLIDATED FINANCIAL STATEMENTS 51
DKK million Section 2021 2020
Revenue 1.1 66,634 58,541
Cost of sales 1.2.1 -35,307 -30,180
Gross profit 31,327 28,361
Sales and distribution expenses 1.2.3 -16,729 -15,373
Administrative expenses -4,165 -3,453
Other operating activities, net 1.2.4 93 -151
Share of profit after tax of associates and joint ventures 5.5 336 315
Operating profit before special items 10,862 9,699
Special items, net 3.1 -253 -247
Financial income 4.1 582 373
Financial expenses 4.1 -963 -784
Profit before tax 10,228 9,041
Income tax 6.1 -2,219 -2,233
Consolidated profit 8,009 6,808
Attributable to
Non-controlling interests 1.1 1,163 778
Shareholders in Carlsberg A/S (net profit) 6,846 6,030
DKK
Earnings per share 8.1
Earnings per share of DKK 20 47.6 41.3
Diluted earnings per share of DKK 20 47.4 41.1
DKK million Section 2021 2020
Consolidated profit 8,009 6,808
Other comprehensive income
Retirement benefit obligations 7.4 578 1
Share of other comprehensive income in associates and joint ventures 5.5 10 -4
Income tax 6.1 20 -42
Items that will not be reclassified to the income statement 608 -45
Foreign exchange adjustments of foreign entities 4.1 3,307 -7,640
Fair value adjustments of hedging instruments 4.1 -323 198
Income tax 6.1 83 -22
Items that will be reclassified to the income statement 3,067 -7,464
Other comprehensive income 3,675 -7,509
Total comprehensive income 11,684 -701
Attributable to
Non-controlling interests 1,246 456
Shareholders in Carlsberg A/S 10,438 -1,157
INCOME STATEMENT STATEMENT OF COMPREHENSIVE INCOME

CARLSBERG GROUP ANNUAL REPORT 2021 CONSOLIDATED FINANCIAL STATEMENTS 52
DKK million Section 31 Dec. 2021 31 Dec. 2020
ASSETS
Non-current assets
Intangible assets 2.2, 2.3 68,475 66,061
Property, plant and equipment 2.2, 2.3 26,648 26,299
Investments in associates and joint ventures 5.5 5,172 4,188
Receivables 1.5 1,075 1,505
Tax assets 6.2 1,922 1,767
Total non-current assets 103,292 99,820
Current assets
Inventories 1.2.1 5,391 4,613
Trade receivables 1.5 5,710 3,725
Tax receivables 171 211
Other receivables 1.5 2,355 1,585
Prepayments 929 769
Cash and cash equivalents 4.4.2 8,344 8,093
Total current assets 22,900 18,996
Assets held for sale 191 -
Total assets 126,383 118,816
DKK million Section 31 Dec. 2021 31 Dec. 2020
EQUITY AND LIABILITIES
Equity
Share capital 4.3.2 2,905 2,963
Reserves -37,817 -40,824
Retained earnings 78,853 77,169
Equity, shareholders in Carlsberg A/S 43,941 39,308
Non-controlling interests 4,815 4,054
Total equity 48,756 43,362
Non-current liabilities
Borrowings 4.2, 4.4.1 22,755 29,291
Retirement benefit obligations 7.4 2,345 2,934
Tax liabilities 6.2 6,350 6,265
Provisions 3.2 2,446 3,319
Other liabilities 3.3 449 5,196
Total non-current liabilities 34,345 47,005
Current liabilities
Borrowings 4.2, 4.4.1 6,167 959
Trade payables 20,642 16,598
Deposits on returnable packaging materials 1.2.2 1,504 1,276
Provisions 3.2 942 1,277
Tax payables 1,350 925
Other liabilities 3.3 12,677 7,414
Total current liabilities 43,282 28,449
Total liabilities 77,627 75,454
Total equity and liabilities 126,383 118,816
STATEMENT OF FINANCIAL POSITION
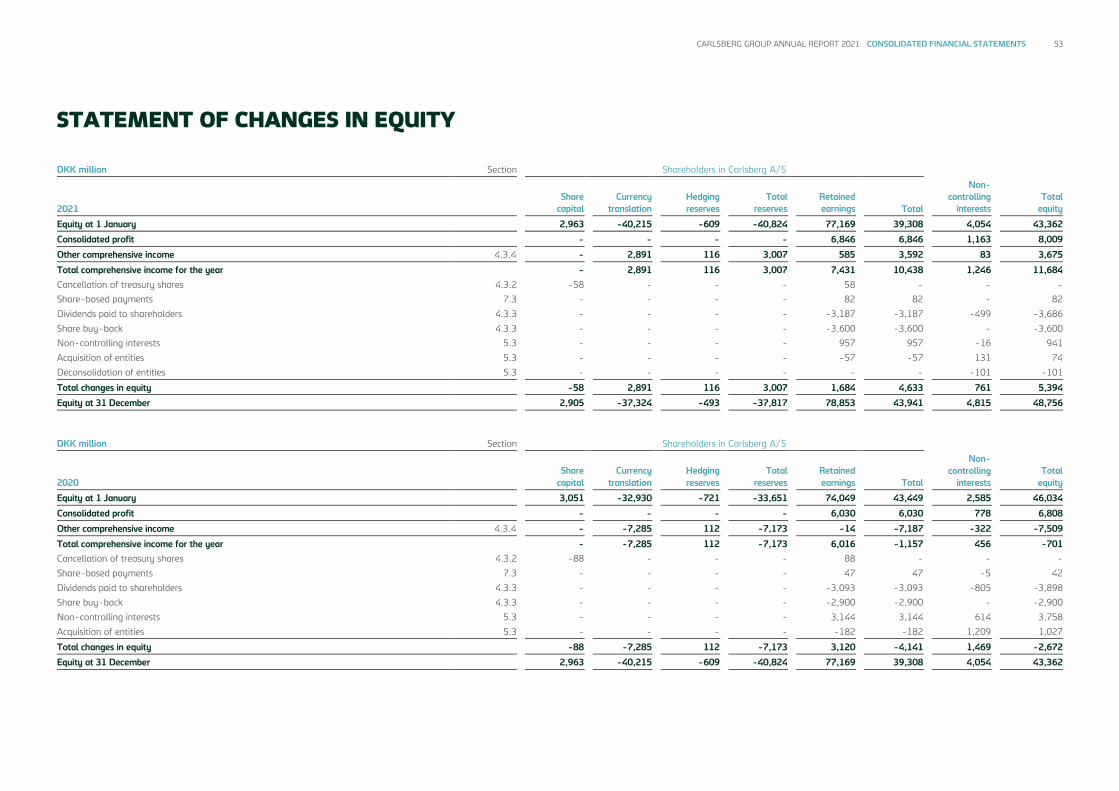
CARLSBERG GROUP ANNUAL REPORT 2021 CONSOLIDATED FINANCIAL STATEMENTS 53
STATEMENT OF CHANGES IN EQUITY
DKK million Section Shareholders in Carlsberg A/S
2021 Share
capital Currency
translation Hedging reserves
Total reserves
Retained earnings Total
Non- controlling
interests Total
equity
Equity at 1 January 2,963 -40,215 -609 -40,824 77,169 39,308 4,054 43,362
Consolidated profit - - - - 6,846 6,846 1,163 8,009
Other comprehensive income 4.3.4 - 2,891 116 3,007 585 3,592 83 3,675
Total comprehensive income for the year - 2,891 116 3,007 7,431 10,438 1,246 11,684
Cancellation of treasury shares 4.3.2 -58 - - - 58 - - -
Share-based payments 7.3 - - - - 82 82 - 82
Dividends paid to shareholders 4.3.3 - - - - -3,187 -3,187 -499 -3,686
Share buy-back 4.3.3 - - - - -3,600 -3,600 - -3,600
Non-controlling interests 5.3 - - - - 957 957 -16 941
Acquisition of entities 5.3 - - - - -57 -57 131 74
Deconsolidation of entities 5.3 - - - - - - -101 -101
Total changes in equity -58 2,891 116 3,007 1,684 4,633 761 5,394
Equity at 31 December 2,905 -37,324 -493 -37,817 78,853 43,941 4,815 48,756
DKK million Section Shareholders in Carlsberg A/S
2020 Share
capital Currency
translation Hedging reserves
Total reserves
Retained earnings Total
Non- controlling
interests Total
equity
Equity at 1 January 3,051 -32,930 -721 -33,651 74,049 43,449 2,585 46,034
Consolidated profit - - - - 6,030 6,030 778 6,808
Other comprehensive income 4.3.4 - -7,285 112 -7,173 -14 -7,187 -322 -7,509
Total comprehensive income for the year - -7,285 112 -7,173 6,016 -1,157 456 -701
Cancellation of treasury shares 4.3.2 -88 - - - 88 - - -
Share-based payments 7.3 - - - - 47 47 -5 42
Dividends paid to shareholders 4.3.3 - - - - -3,093 -3,093 -805 -3,898
Share buy-back 4.3.3 - - - - -2,900 -2,900 - -2,900
Non-controlling interests 5.3 - - - - 3,144 3,144 614 3,758
Acquisition of entities 5.3 - - - - -182 -182 1,209 1,027
Total changes in equity -88 -7,285 112 -7,173 3,120 -4,141 1,469 -2,672
Equity at 31 December 2,963 -40,215 -609 -40,824 77,169 39,308 4,054 43,362

CARLSBERG GROUP ANNUAL REPORT 2021 CONSOLIDATED FINANCIAL STATEMENTS 54
DKK million Section 2021 2020
Operating profit before special items 10,862 9,699
Depreciation, amortisation and impairment losses 2.3 4,612 4,386
Operating profit before depreciation, amortisation and impairment losses 15,474 14,085
Other non-cash items -365 -532
Change in trade working capital 802 1,321
Change in other working capital 617 -1,033
Restructuring costs paid -372 -531
Interest etc. received 117 97
Interest etc. paid -1,037 -521
Income tax paid -1,977 -1,958
Cash flow from operating activities 1.4 13,259 10,928
Acquisition of property, plant and equipment and intangible assets -4,221 -4,396
Disposal of property, plant and equipment and intangible assets 274 222
Change in on-trade loans 1.4 148 339
Total operational investments -3,799 -3,835
Free operating cash flow 9,460 7,093
Acquisition and disposal of subsidiaries, net 5.2 -635 -2,409
Acquisition and disposal of associates and joint ventures, net 5.2 -52 8
Acquisition and disposal of financial investments, net 1 6
Change in financial receivables -187 42
Dividends received 291 317
Total financial investments -582 -2,036
Other investments in real estate -2 -
Total other activities -2 -
Cash flow from investing activities -4,383 -5,871
Free cash flow 8,876 5,057
Shareholders in Carlsberg A/S 4.3.3 -3,187 -3,093
Share buy-back 4.3.3 -3,600 -2,900
Non-controlling interests 4.3.3 -550 -877
External financing 4.4.1 -1,611 5,060
Cash flow from financing activities -8,948 -1,810
Net cash flow -72 3,247
Cash and cash equivalents at 1 January 7,958 5,149
Foreign exchange adjustment of cash and cash equivalents 458 -438
Cash and cash equivalents at 31 December 4.4.2 8,344 7,958
STATEMENT OF CASH FLOWS
Cash and cash equivalents are reported less bank overdrafts.

CARLSBERG GROUP ANNUAL REPORT 2021 CONSOLIDATED FINANCIAL STATEMENTS 55
66.6bn REVENUE (DKK) Revenue increased by 13.8% to DKK 66,634m (2020: DKK 58,541m). Revenue was positively impacted by the recovery of the on-trade in some markets due to fewer restrictions in 2021 than in 2020 and solid growth of premium products. The acquisition impact related mainly to the acquisition of Marston’s brewing activities in the UK in October 2020. The small negative currency impact was due to adverse
currency movements across Central & Eastern Europe and certain markets in Asia, partly offset by a strengthening of primarily the Chinese, Norwegian, British and Swedish currencies.
47.0% GROSS MARGIN The gross margin declined by 140bp to 47.0% due to acquisitions, higher cost of goods sold, particularly in Central & Eastern Europe, and a negative country mix.
10.9bn OPERATING PROFIT (DKK) Operating expenses increased by 11%, mainly impacted by higher marketing and administrative expenses. The latter was the result of higher accruals related to variable pay, and the impact of acquisitions, currencies and certain one-off provisions. Operating expenses as a percentage of revenue declined by 80bp.
Operating profit before depreciation, amortisation and impairment losses (EBITDA) increased by 9.9% to DKK 15,474m. The EBITDA margin declined by 90bp to 23.2% due to acquisitions. Group operating profit grew by 12.0% to DKK 10,862m, driven by strong growth in Asia and Western Europe, while operating profit declined in Central & Eastern Europe due to a negative currency impact. The operating margin declined by 30bp to 16.3% due to the margin-dilutive impact of Marston’s brewing activities.
6.8bn NET PROFIT (DKK) Special items, net, amounted to DKK -253m (2020: DKK -247m), impacted by reversal of provisions made in purchase price allocations in prior years, offset by impairment and write-downs. Special items are detailed in section 3.1. Financial items, net, amounted to DKK -381m (2020: DKK -411m). Excluding currency gains and losses, financial items, net, amounted to DKK -319m (2020: DKK -550m), positively impacted by the reversal of the previous write-down of the loan to our partner in Carlsberg South Asia Pte Ltd ("CSAPL"). Financial items are detailed in section 4.1. Tax totalled DKK -2,219m (2020: DKK -2,233m). The effective tax rate declined by 300bp to 21.7%, impacted by non-taxable gains in special items and lower net tax provisions. Tax is detailed in section 6.1. Consolidated profit was DKK 8,009m (2020: DKK 6,808m). The Carlsberg Group’s share of the consolidated profit was DKK 6,846m (2020: DKK 6,030m).
SECTION 1
OPERATING ACTIVITIES
REVENUE DEVELOPMENT (%)
OPERATING PROFIT DEVELOPMENT (DKKbn)
10.0%
4.6% -0.8%
56
58
60
62
64
66
68
0.0
2.0
4.0
6.0
8.0
10.0

CARLSBERG GROUP ANNUAL REPORT 2021 CONSOLIDATED FINANCIAL STATEMENTS 56
Non-controlling interests were DKK 1,163m (2020: DKK 778m), positively impacted by strong growth for Carlsberg Chongqing Breweries Group in China, the reversal of provisions made in purchase price allocations in Asia and the inclusion of Carlsberg Marston’s Brewing Company in the UK.
47.6 EARNINGS PER SHARE (DKK) Earnings per share increased by 15% to DKK 47.6 (2020: DKK 41.3). Adjusted for special items after tax, earnings per share increased by 11% to DKK 48.3 (2020: DKK 43.6).
13.3bn OPERATING CASH FLOW (DKK) Cash flow from operating activities amounted to DKK 13,259m (2020: DKK 10,928m). The change in trade working capital was DKK +802m (2020: DKK +1,321m), mainly due to strong cash management discipline and higher trade payables. Average trade working capital to revenue for the year was -18.4%, on par with 2020 (-18.6%). The change in other working capital was DKK +617m (2020: DKK -1,033m), mainly impacted by VAT, bonus accruals and provisions. Restructuring costs paid amounted to DKK -372m (2020: DKK -531m). Net interest etc. paid amounted to DKK -920m (2020: DKK -424m). The increase was mainly due to the settlement of financial instruments and provisions. Corporation tax paid was DKK -1,977m (2020: DKK -1,958m).
8.9bn FREE CASH FLOW (DKK) Free cash flow amounted to DKK 8,876m (2020: DKK 5,057m), while free operating cash flow amounted to DKK 9,460m (2020: DKK 7,093m). Operational investments totalled DKK -3,799m (2020: DKK -3,835m). Acquisition of property,
plant and equipment and intangible assets (CapEx) amounted to DKK -4,221m (2020: DKK -4,396m). Excluding the purchase of the Brooklyn brand rights in 2020, operational investments increased by DKK 625m. Total financial investments amounted to DKK -582m (2020: DKK -2,036m), impacted by deferred considerations related to the acquisition of Marston’s brewing activities and the deconsolidation of the business in Nepal (see section 5.2).
EARNINGS PER SHARE (DKK)
FREE CASH FLOW (DKKbn)
0
10
20
30
40
50
EPS
EPS-A
0
2
4
6
8
10
Free operating cash flowFree cash flow

CARLSBERG GROUP ANNUAL REPORT 2021 CONSOLIDATED FINANCIAL STATEMENTS 57
SECTION 1.1
SEGMENTATION OF OPERATIONS CHANGES TO SEGMENTATION The Group’s regional structure was changed effective 1 January 2021, in order to optimise regional management and ensure a better balance between the European regions. Entities in the Baltic and Balkan countries, Greece and Italy as well as Carlsberg Export & License moved from the Western Europe region to Eastern Europe, now renamed Central & Eastern Europe. The disclosure in the Annual Report follows the new regional segmentation as was used in the internal reporting to the Executive Committee throughout 2021. REVENUE The Group’s revenue arises primarily from the sale of beverages to its customers. In 2021, total revenue was positively impacted by volume growth, revenue/hl growth and the acquisitions of Marston’s brewing activities in the UK and Wernesgrüner Brewery in Germany. Other revenue by category is sales of products other than beverages that do not drive any volume, such as merchandise, services, by-products etc. In aggregate, other revenue accounts for around 1% of Group total revenue and is therefore not considered material.
Revenue by category
DKK million 2021 2020
Beer revenue 52,240 46,230
Other beverages 13,554 11,494
Other revenue 840 817
Total revenue 66,634 58,541
Revenue and excise duties
DKK million 2021 2020
Revenue, including excise duties 93,235 83,182
Excise duties -26,601 -24,641
Revenue 66,634 58,541
Not allocated revenue, DKK 9m (2020: DKK 25m), consisted of DKK 894m (2020: DKK 1,112m) in revenue and DKK -885m (2020: DKK -1,087m) from eliminations of sales between the geographical segments.
Segmentation of income statement
DKK million
2021 Western
Europe Asia
Central & Eastern Europe
Not allocated
Beverages, total
Non- beverage
Carlsberg Group, total
Revenue 30,501 19,459 16,665 9 66,634 - 66,634
Total cost -26,295 -14,653 -13,747 -1,328 -56,023 -85 -56,108
Share of profit after tax of associates and joint ventures 195 49 14 1 259 77 336
Operating profit before special items 4,401 4,855 2,932 -1,318 10,870 -8 10,862
Special items, net -333 80 -253
Financial items, net -379 -2 -381
Profit before tax 10,158 70 10,228
Income tax -2,182 -37 -2,219
Consolidated profit 7,976 33 8,009
Operating margin 14.4% 24.9% 17.6% 16.3% 16.3%
2020*
Revenue 25,875 16,959 15,682 25 58,541 - 58,541
Total cost -22,143 -13,057 -12,713 -1,208 -49,121 -36 -49,157
Share of profit after tax of associates and joint ventures 194 89 15 - 298 17 315
Operating profit before special items 3,926 3,991 2,984 -1,183 9,718 -19 9,699
Special items, net -244 -3 -247
Financial items, net -403 -8 -411
Profit before tax 9,071 -30 9,041
Income tax -2,240 7 -2,233
Consolidated profit 6,831 -23 6,808
Operating margin 15.2% 23.5% 19.0% 16.6% 16.6%
* 2020 figures have been restated to reflect the new regional segmentation.

CARLSBERG GROUP ANNUAL REPORT 2021 CONSOLIDATED FINANCIAL STATEMENTS 58
SECTION 1.1 (CONTINUED)
SEGMENTATION OF OPERATIONS Geographical allocation of revenue
DKK million 2021 2020
Denmark (Carlsberg A/S’ domicile) 3,897 3,512
China 11,946 9,858
Russia 6,537 6,405
Other countries 44,254 38,766
Total 66,634 58,541
OPERATING PROFIT BEFORE SPECIAL ITEMS Not allocated operating profit before special items, DKK -1,318m (2020: DKK -1,183m), related to central costs not managed by the regions, including costs of developing branding activities to support the strategic initiatives and general costs of centralised functions as well as various eliminations of DKK 82m (2020: DKK 62m).
Group operating profit grew by 12.0%, supported by growth in all three regions. Organically operating profit grew by 12.5%. VOLUMES The organic growth in total volumes was a result of growth in all three regions. Reported volume growth was positively impacted by Western Europe, with the acquisitions of Marston’s brewery activities in the UK and Wernesgrüner Brewery in Germany having a full-year impact in 2021. NON-CONTROLLING INTERESTS The Group’s non-controlling interests consist of Lao Brewery, Carlsberg Chongqing Breweries Group, Carlsberg Malaysia Group and Carlsberg Marston's Brewing Group. Furthermore it consist of other minor interests, primarily in the Asia region. Non-controlling interests are not individually material to the Group’s total profit. OPERATING MARGIN The operating margin declined to 16.3% compared to 16.6% in 2020. The decline was due to the margin-dilutive impact of Marston’s
brewing activities, which were severely impacted by extensive on-trade restrictions. Excluding the acquisition impact, the operating margin increased to 16.9%.
ACCOUNTING ESTIMATES AND JUDGEMENTS
The Group considers all terms and activities in contracts with customers in order to determine the performance obligation, the transaction price and the allocation of the transaction price. If the consideration in a contract includes a variable amount, the Group estimates the consideration to which it will be entitled in exchange for transferring goods to the customer. The variable consideration is estimated at contract inception based on expected sales volumes using historical and year-to-date sales data and other information about trading with the individual customer or with a group of customers. The Group estimates discounts using either the expected value method or the most likely amount method, depending on which method better predicts the amount of consideration to which it will be entitled.
The most likely amount method is used for contracts with a single contract sum, while the expected value method is used for contracts with more than one threshold due to the complexity and the activities agreed with the individual customer. Certain contracts related to specific major events that are held within such a short time period that it is not possible to sell all the goods during the event (e.g. football matches) give the customer the right to return the goods within a specified period. The Group uses the expected value method to estimate the goods that will not be returned, as this method best predicts the amount of variable consideration to which the Group will be entitled. For goods that are expected to be returned, the Group recognises a refund liability instead of revenue.
Management makes judgements when deciding whether supporting activities with a customer should be classified as a discount or a marketing expense. Generally, activities with the individual customer are accounted for as a discount, whereas costs related to broader marketing activities are classified as marketing expenses. Whether the Group is acting as a principal or an agent is evaluated by management on a country-by-country basis. The Group has concluded that it is the principal in its revenue arrangements because it controls the goods before transferring them to the customer. Excise duties, taxes and fees The classification of duties, taxes and fees paid to local authorities or brewery organisations etc. requires judgements on the classification to be made by management. Locally imposed duties, taxes and fees are typically based on product type, alcohol content, consumption of certain raw materials, such as glue, plastic or metal in caps, and energy consumption. These are classified as either sales- or production-related. Excise duties are generally imposed by the tax authorities as taxes on consumption and are collected by the Group on behalf of the authorities when the goods are transferred to the customers and thereby ready for consumption. Taxes and fees related to the input/use of goods in production, distribution etc. are recognised as part of the cost of the goods or services purchased. The type of authority or organisation imposing the duty, tax or fee and the objective of these are key factors when determining the classification.
Group financial performance Change Change
Volumes (million hl) 2020 Organic Acq., net FX 2021 Reported
Beer 110.1 6.4% 2.2% - 119.6 8.6%
Other beverages 20.0 12.9% 0.0% - 22.6 12.9%
Total volume 130.1 7.4% 1.9% - 142.2 9.3%
DKK million Revenue 58,541 10.0% 4.6% -0.8% 66,634 13.8%
Operating profit before special items 9,699 12.5% 0.3% -0.8% 10,862 12.0%
Operating margin (%) 16.6 16.3 -30bp

CARLSBERG GROUP ANNUAL REPORT 2021 CONSOLIDATED FINANCIAL STATEMENTS 59
SECTION 1.1 (CONTINUED)
SEGMENTATION OF OPERATIONS
ACCOUNTING POLICIES
Revenue Recognition and measurement Revenue from contracts with customers comprises sales of goods, royalty income, rental income from non-stationary equipment, service fees and sales of by-products. Revenue from the sale of own-produced finished goods, goods for resale (third-party products) and by-products is recognised at the point in time when the control of goods and products is transferred to the customer, which is generally upon delivery. For contracts providing the customer with a right of return within a specified period, the Group considers the timing of recognition. Revenue from sales- or usage-based royalties is recognised when (a) the customer subsequently sells or uses the goods, or (b) the performance obligation to which some or all of the sale- or usage-based royalty has been allocated is satisfied (or partially satisfied), whichever is later. Revenue from contracts with customers is measured at an amount that reflects the expected consideration for those goods. Amounts disclosed as revenue exclude discounts, VAT and excise duties collected on behalf of authorities.
The Group considers whether contracts include separate performance obligations to which a portion of the transaction price needs to be allocated. In determining the transaction price, the Group considers the effects of variable consideration. No element of financing is deemed present, as payment is generally made on the basis of cash on delivery or up to 30 days of credit. Variable consideration The Group offers various discounts depending on the nature of the customer and business. Discounts comprise off-invoice discounts, volume- and activity-related discounts, including specific promotion prices offered, and other discounts. Furthermore, discounts include the difference between the present value and the nominal amount of on-trade loans to customers, cf. section 1.5. Off-invoice discounts arise from sales transactions where the customer immediately receives a reduction in the sales price. This also includes cash discounts and incentives for early payments. Volume- and activity-related discounts is a broad term covering incentives for customers to sustain business with the Group over a longer time and may be related to a current campaign or a sales target measured in volumes or total value. Examples include discounts paid as a lump sum, discounts for meeting certain sales targets or progressive discounts offered in step with increasing sales to a customer. Other discounts include listing fees, i.e. fees for certain listings on shelves, in coolers or in favourable store locations, as specific promotions of this nature are closely related to the volumes sold.
Segment information The Group’s beverage activities are segmented according to the three geographical regions where sales take place. These regions make up the Group’s reportable segments. The segmentation reflects the geographical and strategic management, decision and reporting structure applied by the Executive Committee for monitoring the Group’s strategic and financial targets. Segments are managed based on business performance measured as operating profit before special items. Not allocated comprises income and expenses incurred for ongoing support of the Group’s overall operations and strategic development. The expenses include costs of running central functions and marketing, such as global sponsorships. The non-beverage segment, comprising research and real estate activities, is managed separately and therefore shown separately instead of geographically segmented. The geographical allocation of revenue and non-current assets is based on the selling entities’ domicile and comprises countries individually accounting for more than 10% of the Group’s consolidated revenue as well as the domicile country. Decisions on restructuring, acquisition and divestment of entities included in special items as well as on financing (financial income and expenses) and tax planning (income tax) are made based on information for the Group as a whole and therefore not segmented. The segmentation of the Group’s assets and returns is disclosed in section 2.1.
Reported figures Reported figures are analysed by looking at the impact of organic growth, net acquisitions and foreign exchange effects. The net acquisition effect is calculated as the effect of acquisitions and divestments, including any share obtained from an increase/decrease in ownership of associates and joint ventures, for a 12-month period from the acquisition/divestment date. The foreign exchange effect is calculated as the difference between the figures for the current reporting period translated at the current exchange rates and at the exchange rates applied in the previous reporting period. Organic growth is the remaining growth that is not related to acquisitions, divestments or foreign exchange effects.

CARLSBERG GROUP ANNUAL REPORT 2021 CONSOLIDATED FINANCIAL STATEMENTS 60
SECTION 1.2
OPERATING EXPENSES, INVENTORIES AND DEPOSIT LIABILITIES
1.2.1 COST OF SALES AND INVENTORIES Cost of sales increased by 17% compared with 2020 and was affected by the organic increase in volumes across all regions and higher input costs. Cost of sales per hl increased by approximately 7% compared with 2020. Cost of sales
DKK million 2021 2020
Cost of materials 20,328 17,830
Direct staff costs 1,386 1,297
Amortisation and depreciation 2,948 2,704
Indirect production overheads 4,288 4,062
Purchased finished goods and other costs 6,357 4,287
Total 35,307 30,180
Inventories increased by 17% compared with 2020, mainly impacted by an increase in raw materials and finished goods, primarily in Asia because of stocking prior to the Chinese New Year and currency appreciation. Inventories
DKK million 2021 2020
Raw materials 2,311 2,072
Work in progress 333 295
Finished goods 2,747 2,246
Total 5,391 4,613 Commodity price risks are, in particular, associated with externally sourced input materials, such as malt (barley), cans (aluminium), paper, sugar and plastic (PET) bottles. The management of commodity price risks is coordinated centrally and aimed at achieving stable and predictable prices in the medium term. As the underlying markets for the specified categories vary, so does the way in which they are hedged against price increases.
The most common form of hedging is fixed-price purchase agreements with suppliers in local currencies. For malt (barley) and aluminium, the two most significant commodity exposures, Group policy is to have a minimum of 70% hedged for a given year no later than at the end of the third quarter of the previous year, with a target hedge ratio of 90% at the beginning of the year in question. A significant part of the Group’s malt (barley) exposure for 2021 had therefore been hedged through fixed-price purchase agreements established in 2020. Likewise, the majority of the exposure for 2022 was hedged in 2021. In the Group’s long-term purchase agreements for cans, the aluminium price is variable and based on the global market price of aluminium (London Metal Exchange, LME). In 2021, the aluminium price risk was hedged using derivative financial instruments or fixed prices via the suppliers to the Group applying the same hedge percentages as are applied for malt (barley) purchases. The same has been done for 2022. The fair values of the derivative financial instruments are specified in section 4.8. For sugar, rolling forward hedges are used, with suppliers fixing prices linked to official indices, for example NY11. As for malt (barley) and aluminium, the majority of the 2021 sugar exposure had been hedged in 2020. Likewise, the majority of the exposure for 2022 was hedged in 2021.
Other main commodities, such as PET (plastic) and paper, are not hedged financially nor via suppliers fixing prices. For electricity and natural gas, used in production of the Group’s own products, most markets in Central & Eastern Europe and Asia are regulated with no possibility to hedge prices. In Western Europe, where most markets allow forward hedging, the majority of the Group’s exposure is hedged on a rolling basis.
ACCOUNTING ESTIMATES AND JUDGEMENTS
At least once a year, management assesses whether the standard cost of inventories approximates the actual cost. During the year, the standard cost is revised if it deviates by more than 5% from the actual cost. Indirect production overheads are calculated on the basis of relevant assumptions as to capacity utilisation, production time and other factors. The calculation of the net realisable value of inventories is relevant to packaging materials, point-of-sale materials and spare parts. The net realisable value is normally not calculated for beer and soft drinks due to their limited shelf-life, which means that slow-moving goods must be scrapped instead.
ACCOUNTING POLICIES
Cost of sales comprises cost of materials used in own-produced finished goods, including malt (barley), hops, glass, cans, other packaging materials, direct labour, indirect production overheads and standard cost variations. Further, it comprises purchased finished goods that include cost of point-of-sale materials and third-party products sold to customers. Indirect production overheads comprise indirect supplies, wages and salaries, amortisation of brands and software, as well as maintenance and depreciation of machinery, plant and equipment used for production.
Hedging of raw material price risk DKK million
Sensitivity assuming
100% efficiency Time of
maturity
2021 Change Effect
on OCI Tonnes
purchased Average
price (DKK) 2022
Aluminium +20% 313 85,440 15,741 85,440
2020 Change Effect
on OCI Tonnes
purchased Average
price (DKK) 2021
Aluminium +10% 80 66,323 11,132 66,323

CARLSBERG GROUP ANNUAL REPORT 2021 CONSOLIDATED FINANCIAL STATEMENTS 61
SECTION 1.2 (CONTINUED)
OPERATING EXPENSES, INVENTORIES AND DEPOSIT LIABILITIES The cost of purchased finished goods, raw and packaging materials and point-of-sale materials includes the purchase cost and costs directly related to bringing inventories to the relevant place of sale and getting them ready for sale, for example insurance, freight and duties. Inventories are measured at the lower of standard cost (own-produced finished goods) and weighted average cost (other inventories), or net realisable value. The net realisable value is the estimated selling price less costs of completion and costs necessary to make the sale, also taking into account marketability, obsolescence and developments in expected selling price. The cost of scrapped/impaired goods is expensed in the function (line item) responsible for the loss, i.e. losses during distribution are included in distribution expenses, while scrapping of products due to sales not meeting forecasts is included in sales expenses.
1.2.2 DEPOSITS ON RETURNABLE PACKAGING MATERIALS Deposits on returnable packaging materials amounted to DKK 1,504m (2020: DKK 1,276m). The capitalised value of returnable packaging materials was DKK 1,867m (2020: DKK 1,791m). The capitalised value of returnable packaging materials exceeds the deposits because each of the returnable packaging items circulates a number of times in the market and some markets have regulations that require the
deposit value to be set lower than the cost of the returnable packaging materials.
ACCOUNTING ESTIMATES AND JUDGEMENTS
Management assesses the local business model to determine whether the Group has a legal or constructive obligation to accept returns of packaging materials from the market and the level of control. This entails the Group considering, among other things, the return rate and the annual circulation in the individual markets. These factors are assessed annually. Returnable packaging materials controlled by the Group are capitalised as property, plant and equipment and depreciated over the expected useful life. The deposit on returnable packaging materials is estimated based on movements during the year in recognised liabilities, loss of returnable packaging materials in the market, planned changes in packaging types and historical information about return rates.
ACCOUNTING POLICIES
Returnable packaging materials that the Group controls through a legal or constructive obligation are capitalised as property, plant and equipment. Returnable packaging materials are depreciated over 3-10 years. The accounting policies for property, plant and equipment are further described in section 2.3. The obligation to refund deposits on returnable packaging materials is measured on the basis of deposit price, an estimate of the number of bottles, kegs, cans and crates in circulation, and expected return rates.
1.2.3 SALES AND DISTRIBUTION EXPENSES Marketing expenses increased as a result of higher marketing investments. Distribution expenses per hl were flat but increased overall due to acquisitions. Total marketing, sales and distribution expenses increased by 9%. Sales and distribution expenses
DKK million 2021 2020
Marketing expenses 4,980 4,390
Sales expenses 5,162 5,101
Distribution expenses 6,587 5,882
Total 16,729 15,373
ACCOUNTING POLICIES
Marketing expenses consist of expenses for brand marketing and trade marketing. Brand marketing is an investment in the Group’s brands and consists of brand-specific investments in the development of communication vehicles, the use of these to drive the sale of branded products, sales campaigns and sponsorships. Trade marketing is promotional activities directed towards customers, such as the supply of point-of-sale materials, promotional materials and trade offers. Sales expenses comprise costs relating to general sales activities, write-downs for bad debt losses, wages and salaries as well as depreciation and impairment of sales equipment. Distribution expenses comprise costs incurred in distributing goods, wages and salaries, and depreciation and impairment of distribution equipment.
1.2.4 OTHER OPERATING ACTIVITIES, NET Other operating activities are secondary to the principal activities of the Group and include income and expenses relating to rental properties, restaurants, on-trade loans, research activities, and gains and losses on disposal of intangible assets and property, plant and equipment. Other operating activities, net
DKK million 2021 2020
Gains and losses on disposal of property, plant and equipment and intangible assets, net 93 53
On-trade loans, net 58 -204
Real estate, net 9 38
Research centres, net -95 -123
Other, net 28 85
Total 93 -151
ACCOUNTING POLICIES
Gains and losses on disposal of intangible assets and property, plant and equipment are determined as the sales price less selling costs and the carrying amount at the disposal date. On-trade loans, net, comprise the effective interest on the loans measured at amortised cost less impairment. Expenses relating to research activities comprise research in Denmark and France less funding received from the Carlsberg Foundation for the operation of the Carlsberg Research Laboratory and grants received to fund research. The funding and grants are recognised in the income statement in the same period as the activities to which they relate. Product development costs are included in cost of sales.

CARLSBERG GROUP ANNUAL REPORT 2021 CONSOLIDATED FINANCIAL STATEMENTS 62
SECTION 1.3
FOREIGN EXCHANGE RISK RELATED TO EARNINGS
The majority of the Group’s activities take place outside Denmark and in currencies other than DKK. Foreign exchange risk is therefore a principal financial risk for the Group, and exchange rate fluctuations can have a significant impact on the income statement. The risk from exposure to fluctuations in EUR/DKK is considered to be limited due to Denmark’s fixed exchange rate policy towards EUR and is consequently not hedged.
TRANSACTION RISKS ON PURCHASES AND SALES The Group is exposed to transaction risks on purchases and sales in currencies other than the local functional currencies. The Group aims to hedge 70-90% of future cash flows in currencies other than the local functional currency on a four-quarter rolling basis. Western Europe For the entities in Western Europe, a major part of the purchases in foreign currencies is in EUR. This also applies for markets with a functional currency other than EUR. Hedging of EUR against the local currencies will effectively eliminate a significant part of the currency risk in the entities’ operating profit in local currency. At Group level, these hedges are effectively a hedge of (parts of) the revenue in the relevant currency and are accounted for as cash flow hedges, cf. section 4.8. The hedged amounts and the sensitivity analysis regarding these hedges are shown in section 4.6.4. Asia The transaction risk is considered to be less significant due to lower sales and purchases in currencies other than the local functional currencies as well as the high correlation between USD and most of the Asian currencies. Furthermore, the currencies are expensive to hedge and, in some cases, not possible to hedge at all. As a consequence, the risk is not hedged. Central & Eastern Europe Baltika Breweries and some of the other markets in the region have expenses in both
USD and EUR, and appreciation of RUB and other currencies vis-à-vis EUR and USD has a positive impact on operating profit, while depreciation has a negative effect. The Group has chosen not to systematically hedge the transaction risk in the region due to the significant cost of hedging these currencies over a longer period of time. For 2021 and 2022, the Group has chosen to hedge a portion of Baltika Breweries’ and Carlsberg Ukraine’s expenses in USD and EUR. The volatility of the currencies will continue to affect operating profit measured in both DKK and local currencies. Furthermore, some of the entities in Central & Eastern Europe hold intercompany deposits in EUR and USD. The revaluation of these is recognised in financial items and not designated as cash flow hedges. TRANSLATION RISK The Group is exposed to risk from translation of foreign entities into the Group’s presentation currency, DKK. The single largest translation impact in respect of operating profit in 2021 was LAK due to the 10.6% depreciation of the currency compared with 2020. Looking into 2022, the largest exposure in terms of operating profit and currency volatility is CNY, while RUB remains the single largest exposure on translation of net investments in foreign entities. The Group has chosen not to hedge the exposure arising from translation of revenue or earnings in foreign currencies. To reduce the risk, the Group has raised debt denominated in the currencies in which the Group generates
significant earnings and cash flow as further described in section 4.6. Impact on operating profit Developments in exchange rates between DKK and the functional currencies had a negative impact of 0.75% on operating profit measured in DKK.
Entities in Functional
currency Change in average FX
rate 2020 to 2021
The eurozone EUR -0.23%
China CNY 2.60%
Russia RUB -6.50%
Norway NOK 5.30%
United Kingdom GBP 3.60%
Switzerland CHF -1.30%
Sweden SEK 2.90%
Laos LAK -10.60%
REVENUE BY CURRENCY (%)
CNY 18% (17%) EUR 17% (18%)
RUB 10% (11%) GBP 9% (5%)
DKK 8% (8%) NOK 6% (6%)
CHF 5% (5%) SEK 4% (4%)
LAK 3% (4%) Other 20% (22%)
2021 (2020)

CARLSBERG GROUP ANNUAL REPORT 2021 CONSOLIDATED FINANCIAL STATEMENTS 63
SECTION 1.4
CASH FLOW FROM OPERATING ACTIVITIES
The change in trade working capital amounted to DKK 802m (2020: DKK 1,321m), mainly due to strong cash management discipline and higher trade payables. Average trade working capital to revenue for the year was -18.4% (2020: -18.6%).
from the change in other working capital increased by DKK 617m (2020: decrease of DKK 1,033m), impacted by VAT, accruals for variable pay and provisions. The change in on-trade loans amounted to DKK 148m (2020: DKK 339m). Restructuring costs paid amounted to DKK -372m (2020: DKK -577m), a large part of which relates to termination benefits to employees made redundant due to optimisations and reorganisations across the Group. Net interest etc. paid amounted to DKK -920m (2020: DKK -424m). The increase was largely due to settlement of derivative financial instruments. Income tax paid amounted to DKK -1,977m (2020: DKK -1,958m). Cash flow from disposal of property, plant and equipment and intangible assets was DKK 274m (2020: DKK 222m). Supplier finance arrangements A number of the Group’s suppliers participate in supplier finance arrangements, with a supply chain finance provider and related financial institutions acting as a funding partner. When suppliers participate in these programmes, they have the option of receiving early payment from the funding partner of invoices sent to Carlsberg. The arrangement is exclusively between the supplier and the supply chain finance provider
and separate to Carlsberg’s relationship with its suppliers. Carlsberg’s liability to pay invoices is unaffected by the supplier finance arrangement, and whether or not the suppliers opt for early payment, and the liability is recognised in trade payables until the due date of the invoice, which is in no case more than 180 days from the invoice date. Cessation of the supplier finance arrangement would not constitute a significant risk in terms of liquidity because of the amounts involved and the number of supply chain finance providers. Sale of receivables Carlsberg has chosen to sell some of its trade receivables in selected Western European markets in non-recourse factoring agreements to expedite cash collection from groups of customers. Carlsberg does not carry any credit risk on these customers and has no continuing involvement in these trade receivables, which have therefore been derecognised. The impact on average trade working capital from the use of supplier finance arrangements and factoring is limited, as the utilisation is similar to previous years.
ACCOUNTING POLICIES
Trade payables are recognised initially at fair value and subsequently measured at cost. Trade payables comprise purchase of goods and services, including payables to supplier finance vendors, and retrospective rebates to customers and are part of the normal working capital cycle. The cash flow arising from all trade payables is part of cash flow from operating activities.
Other specifications of cash flow from operating activities DKK million Section 2021 2020
Other non-cash items
Share of profit after tax of associates and joint ventures 5.5 -336 -315
Gain on disposal of property, plant and equipment and intangible assets, net 2.3 -93 -53
Share-based payments 82 42
Transfer of long-term medical insurance obligation - -199
Other items -18 -7
Total -365 -532
Trade working capital
Inventories -648 -1
Trade receivables -1,866 1,484
Trade payables, duties payable and deposits on returnable packaging materials 3,316 -162
Total 802 1,321
Other working capital
Other receivables -282 111
Other payables 1,107 -403
Retirement benefit obligations and other liabilities related to operating profit before special items -204 -601
Unrealised foreign exchange gains/losses -4 -140
Total 617 -1,033
On-trade loans
Loans provided -356 -464
Repayments 340 353
Amortisation of on-trade loans 164 450
Total 148 339

CARLSBERG GROUP ANNUAL REPORT 2021 CONSOLIDATED FINANCIAL STATEMENTS 64
SECTION 1.5
TRADE RECEIVABLES AND ON-TRADE LOANS
The Group’s non-current receivables consist mainly of on-trade loans that fall due more than one year from the reporting date. Of the total non-current receivables, DKK 160m (2020: DKK 258m) falls due more than five years from the reporting date.
The carrying amount of receivables approximates their fair value. For on-trade loans, the fair value is calculated as discounted cash flows using the interest rate at the reporting date.
ON-TRADE LOANS Under certain circumstances, the Group grants loans to on-trade customers in France, the UK, Switzerland, Germany and Sweden. On-trade loans are spread across a large number of customers/debtors and consist of several types of loan, including loans repaid in cash or through reduced discounts and guarantees for loans provided by third parties, cf. section 3.4. The operating entities monitor and control these loans in accordance with Group guidelines.
The average effective interest rate on loans to the on-trade was 3.2% (2020: 3.2%). The interest income is recognised in other operating activities.
On-trade loans recognised in other operating activities, net
DKK million 2021 2020
Interest and amortisation of on-trade loans 49 50
Losses and write-downs on on-trade loans 9 -254
On-trade loans, net 58 -204
OTHER RECEIVABLES Other receivables primarily comprise VAT and similar government receivables, interest receivables and other financial receivables, which are associated with low risk.
The distribution of receivables broken down by country is affected by market-specific changes in payment patterns. For receivables from sale of goods and services, the distribution is furthermore impacted by the amounts of receivables sold. The overall level of receivables sold in non-recourse factoring schemes was similar to the level in 2020.
The relative share of receivables in the UK has increased following the acquisition of Marston’s brewing activities.
RECEIVABLES FROM SALES OF GOODS AND SERVICES (BROKEN DOWN BY COUNTRY)
ON-TRADE LOANS (BROKEN DOWN BY COUNTRY)
UK 21% (10%) Russia 13% (14%)
Finland 7% (0%) Sweden 6% (10%)
France 5% (6%) Poland 5% (5%)
Ukraine 4% (4%) Other 39% (44%)
2021 (2020)
Germany 26% France 24%
Switzerland 23% UK 17%
Sweden 10%
2021 (2020)
(24%)
(8%)
(18%)
(27%)
Receivables included in the statement of financial position
DKK million Non-
current Current Total
2021 Receivables Trade
receivables Other
receivables
Receivables from sales of goods and services - 5,458 - 5,458
On-trade loans 776 252 - 1,028
Other receivables 299 - 2,355 2,654
Total receivables 1,075 5,710 2,355 9,140
2020
Receivables from sales of goods and services - 3,412 - 3,412
On-trade loans 826 313 - 1,139
Other receivables 178 - 1,585 1,763
Operating receivables 1,004 3,725 1,585 6,314
Prepayment for acquisition 501 - - 501
Total receivables 1,505 3,725 1,585 6,815
(23%)

CARLSBERG GROUP ANNUAL REPORT 2021 CONSOLIDATED FINANCIAL STATEMENTS 65
SECTION 1.5 (CONTINUED)
TRADE RECEIVABLES AND ON-TRADE LOANS
1.5.1 CREDIT RISK In 2021, receivables not past due amounted to 81% (2020: 74%) of total gross receivables. The past-due share of gross loans to on-trade customers was 31% (2020: 51%).
Total accumulated allowances for impairment losses on trade loans were DKK 464m (2020: DKK 499m). The share of trade receivables that is past-due decreased from 23% to 15%. The credit risk is being closely managed in the markets and assessed in light of the changing restrictions. The COVID-19 impact on the global risk pattern is evaluated at both local and Group level.
Throughout the year and continuing into 2022, the COVID-19 pandemic continued to impact many of our markets, and market volatility and uncertainty remained high. In many markets our customers were impacted by lockdowns, full or partial closure of on-trade businesses, restrictions on cultural and sporting activities, social distancing and other government restrictions in response to the COVID-19 pandemic.
The estimated impairment losses consider the expected impact both from the continuing restrictions and when government financial support schemes and extended payment terms come to an end with the reopening of markets. The increased credit risk on both trade receivables and on-trade loans seen across markets is expected to continue into 2022.
Credit risk on receivables DKK million
2021 Gross
receivables Loss
allowance Receivables,
net
Weighted average loss rate
Receivables from sales of goods and services
Not past due 5,155 -143 5,012 3%
Overdue 1-30 days 479 -88 391 18%
Overdue 31-90 days 70 -49 21 70%
Overdue > 90 days 371 -337 34 91%
Receivables from sales of goods and services 6,075 -617 5,458
On-trade loans
Not past due 1,035 -139 896 13%
Overdue 1-30 days 13 - 13 -
Overdue 31-90 days 55 -22 33 40%
Overdue > 90 days 389 -303 86 78%
On-trade loans 1,492 -464 1,028
Other receivables
Not past due 2,073 -3 2,070 0%
Overdue 1-30 days 110 - 110 -
Overdue 31-90 days 98 -5 93 5%
Overdue > 90 days 398 -17 381 4%
Other receivables 2,679 -25 2,654
Total 10,246 -1,106 9,140
DKK million
2020 Gross
receivables Loss
allowance Receivables,
net
Weighted average loss rate
Receivables from sales of goods and services
Not past due 3,178 -182 2,996 6%
Overdue 1-30 days 349 -87 262 25%
Overdue 31-90 days 178 -75 103 42%
Overdue > 90 days 406 -355 51 87%
Receivables from sales of goods and services 4,111 -699 3,412
On-trade loans
Not past due 797 -101 696 13%
Overdue 1-30 days 14 - 14 -
Overdue 31-90 days 31 -3 28 10%
Overdue > 90 days 796 -395 401 50%
On-trade loans 1,638 -499 1,139
Other receivables
Not past due 1,595 -3 1,592 0%
Overdue 1-30 days 12 - 12 -
Overdue 31-90 days 53 - 53 -
Overdue > 90 days 419 -313 106 -75%
Other receivables 2,079 -316 1,763
Total 7,828 -1,514 6,314

CARLSBERG GROUP ANNUAL REPORT 2021 CONSOLIDATED FINANCIAL STATEMENTS 66
SECTION 1.5 (CONTINUED)
TRADE RECEIVABLES AND ON-TRADE LOANS
ACCOUNTING ESTIMATES AND JUDGEMENTS
On-trade loan agreements are complex, cover several aspects of the customer relationship and may vary from agreement to agreement. Management assesses the recognition and classification of income and expenses for each agreement, including the allocation of payments from the customer between revenue, discounts, interest (other operating activities) and repayment of the loan. Management also assesses both individually and on a portfolio basis whether developments in local conditions for on-trade customers could impact the expected credit losses. Exposure to credit risk on receivables is managed locally, and credit limits are set as considered appropriate for the customer, taking into account the current local market conditions.
The local entities assess the credit risk and adhere to Group guidelines, which include setting credit limits, encouraging cash payment, purchasing credit insurance and holding collateral.
In assessing credit risk, management analyses the need for impairment of trade receivables and on-trade loans due to customers’ inability to pay. Many customers are currently dependent on government subsidies and support in the form of extended payment terms. The increased credit risk is expected to continue into 2022. At year-end 2021, management continued to assess the lifetime expected credit losses for both trade receivables and on-trade loans in line with 2020. Expected credit losses are assessed for portfolios of receivables based on customer segments, historical information on payment patterns, terms of payment, concentration maturity, the impact of continuing COVID-19 restrictions and the expected impact of government schemes coming to an end when markets reopen. The expected impact includes the risk of insolvencies due to lack of liquidity when extended government payment terms cease. The portfolios are based on on-trade and off-trade customers, and on-trade receivables and loans. On-trade loans carry a higher risk than trade receivables and are concentrated in a few markets.
The local entities manage and control these loans in accordance with Group guidelines. The credit risk on on-trade loans can be reduced by means of collateral and pledges of on-trade movables (equipment in bars, cafés etc.). The fair value of the pledged on-trade movables cannot be estimated reliably but is assessed to be insignificant, as they cannot readily be reused.
ACCOUNTING POLICIES
Receivables are recognised initially at fair value and subsequently measured at amortised cost less loss allowance or impairment losses. Trade receivables comprise sale of goods and services as well as short-term on-trade loans to customers. Other receivables comprise VAT receivables, loans to partners, associates and joint ventures, interest receivables and other financial receivables.
For on-trade loans, any difference between the present value and the nominal amount at inception is treated as a prepaid discount to the customer, and the discount is recognised in the income statement in accordance with the terms of the agreement. The market interest rate is used as the discount rate, corresponding to the money market rate based on the maturity of the loan with the addition of a risk premium. The effective interest on these loans is recognised in other operating activities, net. The amortisation of the difference between the discount rate and the effective interest rate is included as a discount in revenue. The Group applies the simplified approach to measure expected credit losses. This entails recognising a lifetime expected loss allowance for all trade receivables. Loss rates are determined based on grouping of trade receivables sharing the same credit risk characteristics and past-due days. Regarding on-trade loans and loans to associates, a loss allowance is recognised based on 12-month or lifetime expected credit losses, depending on whether a significant increase in credit risk has arisen since initial recognition.
In certain markets, the Group enters into factoring agreements on a non-recourse basis, which involves selling trade receivables to a factor. Trade receivables subject to factoring agreements are derecognised once the criteria for derecognition have been met and all substantial risk and rewards transferred. The Group does not have any continuing involvement once the receivables have been derecognised.
Development in impairment losses on receivables
DKK million 2020
2021
Receivables from sales of
goods and services
On-trade loans
Other receivables Total Total
Impairment at 1 January -699 -499 -316 -1,514 -1,011
Impairment losses recognised -145 -127 -24 -296 -663
Realised impairment losses 63 29 1 93 13
Reversed impairment losses 174 136 328 638 154
Acquisition of entities, net 7 6 - 13 -91
Foreign exchange adjustments -17 -9 -14 -40 84
Impairment at 31 December -617 -464 -25 -1,106 -1,514

CARLSBERG GROUP ANNUAL REPORT 2021 CONSOLIDATED FINANCIAL STATEMENTS 67
126.4bn TOTAL ASSETS (DKK) Total assets increased by DKK 7.6bn due to higher intangible assets, inventories, and trade and other receivables. Intangible assets amounted to DKK 68.5bn at 31 December 2021 (2020: DKK 66.1bn), mainly due to the acquisition of Marston’s brewing activities and Wernesgrüner as well as the appreciation of the Russian and Chinese currencies, partly offset by the impairment of brands in Russia.
Property, plant and equipment totalled DKK 26.6bn (2020: DKK 26.3bn), impacted by currency movements and capital expenditure offset by disposals and depreciation. Current assets increased by DKK 3.9bn to DKK 22.9bn, mainly due to increases in receivables and inventories of DKK 2.7bn, which primarily related to higher sales and stocking in Asia prior to the Chinese New Year. Other receivables mainly increased due to fair value adjustment linked to higher aluminium prices and the reversal of the write-down of the loan to our partner in Carlsberg South Asia Pte Ltd ("CSAPL"). Cash and cash equivalents amounted to DKK 8.3bn (2020: DKK 8.1bn).
4.2bn CAPEX (DKK) CapEx increased by DKK 625m (excluding the Brooklyn brand rights in 2020). Asia and Central & Eastern Europe were the main contributors, with higher investments in sales CapEx, returnable glass and can production capacity. CapEx to amortisation and depreciation, excluding right-of-use assets, increased to 100% (2020: 90%).
10.3% ROIC Return on invested capital (ROIC) increased by 140bp to 10.3%, positively impacted by higher profits and a lower effective tax rate. ROIC excluding goodwill improved by 430bp to 27.5%.
SECTION 2
ASSET BASE AND RETURNS
* Excluding the purchase of the Brooklyn brand rights in 2020.
RETURN ON INVESTED CAPITAL (% 12-MONTH AVERAGE)
CAPEX* AND AMORTISATION/ DEPRECIATION (DKKbn)
ASSET BASE (DKKbn)
6
9
12
15
18
21
24
27
ROIC
ROIC excl. goodwill
5.0%
6.0%
7.0%
8.0%
2.0
3.0
4.0
5.0
CapEx
Amortisation and depreciation
CapEx/revenue
92.4
95.1
4.4 3.8 - 4.4
- 1.1

CARLSBERG GROUP ANNUAL REPORT 2021 CONSOLIDATED FINANCIAL STATEMENTS 68
SECTION 2.1
SEGMENTATION OF ASSETS AND RETURNS
At year-end, invested capital was up by DKK 2.1bn, primarily due to the appreciation of the Russian rouble and the Chinese renminbi. The acquisitions of Marston’s brewing activities and the Brooklyn brand rights had a full-year impact on average invested capital, whereas in 2020 they had only been included for two months and six months respectively. The acquisition of Wernesgrüner, completed at
1 January 2021, also had a full-year impact on average invested capital. The impact on total assets from fluctuations in the Russian rouble was an increase of DKK 2.1bn (2020: decrease of DKK 7.5bn). Non-current assets comprise intangible assets and property, plant and equipment owned by the segment/country, even if the income is earned outside the segment/country that owns the asset. Furthermore, they include non-current financial assets other than financial instruments and tax assets.
Not allocated comprises supporting companies without brewing activities and eliminations of investments in subsidiaries, receivables and loans. Geographical allocation of non-current assets
DKK million 2021 2020
Denmark (Carlsberg A/S' domicile) 4,122 4,260
Russia 19,185 18,509
China 15,876 14,320
Other countries 61,112 59,459
Total 100,295 96,548
ACCOUNTING ESTIMATES AND JUDGEMENTS
The calculation of return on invested capital (ROIC) uses operating profit before special items adjusted for tax based on the effective tax rate, and invested capital including assets held for sale and trade receivables sold, and excludes contingent considerations and income tax.
ACCOUNTING POLICIES
The Group’s assets and returns are segmented on the basis of geographical regions in accordance with the management reporting for the current year, cf. section 1.1.
DKK million
2021
Western
Europe Asia
Central & Eastern Europe
Not allocated
Beverages, total
Non- beverage
Carlsberg Group,
total
Invested capital 35,582 20,244 27,246 -604 82,468 1,168 83,636
Invested capital excl. goodwill 15,317 4,281 10,990 -604 29,984 1,168 31,152
Investments in associates 2,271 2,363 32 5 4,671 501 5,172
Acquisition of property, plant and equipment and intangible assets 1,340 1,800 884 191 4,215 8 4,223
Amortisation and depreciation 1,796 1,488 993 102 4,379 17 4,396
Impairment losses, net 17 460 947 - 1,424 -86 1,338
Return on invested capital (ROIC) 9.2% 20.3% 8.6% - 10.4% - 10.3%
ROIC excl. goodwill 20.1% 153.4% 20.7% - 28.1% - 27.5%
2020* Invested capital 35,746 18,045 26,964 6 80,761 780 81,541
Invested capital excl. goodwill 16,142 2,682 11,439 6 30,269 780 31,049
Investments in associates 2,273 1,462 26 3 3,764 424 4,188
Acquisition of property, plant and equipment and intangible assets 1,258 1,395 768 965 4,386 10 4,396
Amortisation and depreciation 1,712 1,499 1,037 78 4,326 10 4,336
Impairment losses, net 44 292 16 5 357 - 357
Return on invested capital (ROIC) 8.7% 15.8% 8.5% - 9.0% - 8.9%
ROIC excl. goodwill 18.8% 88.8% 19.8% - 24.4% - 23.2%
* 2020 figures have been restated to reflect the new regional segmentation.
Invested capital
DKK million 2021 2020
Total assets 126,383 118,816
Less
Tax assets -1,922 -1,767
Financial receivables, hedging instruments and receivables sold 1,247 1,904
Cash and cash equivalents -8,344 -8,093
Assets included 117,364 110,860
Trade payables -20,642 -16,598
Deposits on returnable packaging materials -1,504 -1,276
Provisions, excl. restructurings -3,210 -4,322
Other liabilities, excl. hedging instruments -8,372 -7,123
Liabilities offset -33,728 -29,319
Invested capital 83,636 81,541
Goodwill -52,484 -50,492
Invested capital excl. goodwill 31,152 31,049
Invested capital, average 82,685 82,227

CARLSBERG GROUP ANNUAL REPORT 2021 CONSOLIDATED FINANCIAL STATEMENTS 69
SECTION 2.2
IMPAIRMENT
2.2.1 RECOGNISED IMPAIRMENTS In 2021 and 2020, the impairment tests of goodwill and brands with indefinite useful life were prepared at the reporting date. In 2021, recognised impairment losses related to the Baltika brand and other brands in Russia of DKK 950m, land use rights in China of DKK 107m, returnable packaging in certain markets in Asia of DKK 130m, other items of property, plant and equipment of DKK 21m and investments in associates in China of DKK 244m. In 2021, the Group recognised reversal of impairment losses of DKK 114m (2020: DKK 2m) in Denmark, China and Russia relating to
assets that had been brought back into production or reclassified as held for sale. In 2020, impairment losses of DKK 231m relating to brands and DKK 124m relating to property, plant and equipment were recognised. The impairment loss on brands was mainly related to the Angkor brand and was due to a significant decline in volumes caused by COVID-19 restrictions in the market. Impairment of brands in Russia Russia experienced a significant increase in interest rates in the second half of 2021, as well as in inflation, which negatively impacted the costs of raw and packaging materials. These increases are expected to continue in 2022. Russia is a highly price-competitive market, which has a negative impact on profit margins. The effect of these trends has been incorporated into the impairment test, resulting
in the recoverable amount of the Baltika brand and other Russian brands being lower than their carrying amount. The brands were therefore written down by a total of DKK 950m, DKK 900m of which was allocated to the Baltika brand. The Baltika brand has been written down on two previous occasions, in total by DKK 8,800m. The previous write-downs followed detailed reviews of expected future growth after prolonged challenging macroeconomic conditions, changes in the market environment such as PET downsizing and various changes in consumer trends. These factors were also incorporated into the recent impairment test. Other impairments In certain markets in Asia, the return systems are not legally required but have been developed as a result of market practice in the beverage industry. The collection rates for returnable packaging declined significantly in 2021 compared with previous years as a result of COVID-19 restrictions, leading to the recognition of impairment losses of DKK 130m for lost returnable packaging. In China, disputes relating to the management of Tibet Lhasa Brewery resulted in significant disturbances to the operation of the company, which negatively impacted financial performance. The investment was therefore written down to its recoverable amount, resulting in the recognition of an impairment loss of DKK 244m. The disputes further meant that the Group lost its significant influence in the company, and the residual investment was therefore reclassified to financial investments.
Impact of COVID-19 The COVID-19 pandemic and its impact on volumes, earnings and cash flows indicate possible impairment of non-current assets. The Group has carefully assessed the expected recovery from the pandemic in terms of both volumes and earnings. The beverage industry has proven resilient to the pandemic. To some extent, volumes initially shifted from the on-trade to the off-trade, then back to the on-trade again in 2021 when restrictions were eased, and earnings returned to approximately the same level as before the pandemic. At the end of the second year of the pandemic, we again experienced an increase in restrictions as the weather got colder and infection levels rose. This will have a negative impact on, in particular, the on-trade channel, which has been included in the forecasts used for impairment testing. We expect volumes and earnings to recover to pre-pandemic levels again. The expected timing and speed of the recovery differ from market to market depending on the extent of government restrictions and on consumer behaviour. In the assessment of impairment of non-current assets, no additional indications of impairment as a result of the COVID-19 pandemic, have been identified. Significant amounts of goodwill and brands Goodwill and brands with indefinite useful life relating to the acquisitions of Baltika Breweries, Kronenbourg, Chongqing Brewery
Impairment of brands and other non-current assets
DKK million 2021 2020
Intangible assets
Brands 950 231
Other intangible assets 107 4
Total 1,057 235
Property, plant and equipment
Plant, machinery and equipment 151 124
Reversal of impairment losses -114 -2
Total 37 122
Investments in associates
Impairment of investment in associates 244 -
Total impairment losses, net 1,338 357
Of which recognised in special items, cf. section 3.1 1,122 307

CARLSBERG GROUP ANNUAL REPORT 2021 CONSOLIDATED FINANCIAL STATEMENTS 70
SECTION 2.2 (CONTINUED)
IMPAIRMENT
Group and the 40% non-controlling interest in Carlsberg Breweries A/S each accounted for 10% or more of the total carrying amount of goodwill and brands with an indefinite useful life at the reporting date. Goodwill from these acquisitions has been allocated to CGUs based on the geographical segmentation. The international brands acquired with the 40% non-controlling interest in Carlsberg Breweries A/S and the Baltika brand are individually material and specified in section 2.2.3.
ACCOUNTING ESTIMATES AND JUDGEMENTS
Identification of cash-generating units The Group’s management structure reflects the geographical segments, cf. section 1.1, and decisions are made by the regional managements responsible for performance, operating investments and growth initiatives in their respective regions. There is significant vertical integration of the production, logistics and sales functions, supporting and promoting optimisations across the Group or within regions. Assets, other than goodwill and brands with regional and global presence, are allocated to individual cash-generating units (CGUs), being the level at which the assets generate largely independent cash inflows. As the Group operates with local sales and production organisations, the cash inflows are generated mostly locally, and the CGUs are therefore usually identified at country level. Within 12 months from the date of acquisition, the determination of CGU allocation is made, and cash inflows are assessed in connection with the purchase price allocation.
Goodwill Goodwill does not generate largely independent cash inflows on its own and is therefore allocated to the Group’s geographical segments, which is the level at which it is monitored for internal management purposes. At the time of acquisition of entities, goodwill is allocated to a CGU, cf. section 5.2. The structure and groups of CGUs are reassessed every year. The Group gained control of Wernesgrüner Brewery in 2021 and of Marston’s brewing activities in 2020. The goodwill recognised on these acquisitions was allocated to the Western Europe CGU. Brands Cash flows for brands are separately identifiable and brands are therefore tested individually for impairment. This test is performed in addition to the test for impairment of goodwill. The following brands are considered significant when comparing their carrying amount with the total carrying amount of brands with indefinite useful life: • Baltika brand • International brands International brands is a group of brands recognised in connection with the acquisition of the 40% non-controlling interest in Carlsberg Breweries A/S and allocated to Western Europe. The amount is not allocated to individual brands.
Corporate assets The Group has identified capitalised software relating to the Group’s ERP systems as corporate assets, and as such these are peripheral to the generation of cash inflow. The Group’s ERP landscape is closely linked to the internal management structure, and the identified assets are therefore tested for impairment at the CGU level to which goodwill is allocated.
Other non-current assets Other non-current assets are tested for impairment when indications of impairment exist. For property, plant and equipment, management performs an annual assessment of the assets’ future application, for example in relation to changes in production structure, restructurings or brewery closures. Since 2020, the assessment has also included the impact of the COVID-19 pandemic. For investments in associates and joint ventures, examples of indications of impairment are loss-making activities or significant changes in the business environment.
ACCOUNTING POLICIES
Goodwill and brands with indefinite useful life are subject to an annual impairment test, performed initially before the end of the year of acquisition. The test is performed at the level where cash flows are considered to be generated: either at CGU level or at the level of a group of CGUs. All assets are tested if an event or circumstance indicates that the carrying amount may not be recoverable. If an asset’s carrying amount exceeds its recoverable amount, an impairment loss is recognised. The recoverable amount is the higher of the asset’s fair value less costs of disposal and its value in use. For all assets, the value in use is assessed based on budget and target plan with reference to the expected future net cash flows. The assessment is based on the lowest CGU affected by the changes that indicate impairment. The cash flow is discounted by a rate adjusted for any risk specific to the asset, if relevant to the applied calculation method.
Impairment losses on goodwill and brands, significant losses on property, plant and equipment, investments in associates and joint ventures, and losses arising on significant restructurings of processes and structural adjustments are recognised as special items. Minor losses are recognised in the income statement in the relevant line item. Impairment of goodwill is not reversed. Impairment of other assets is reversed only to the extent of changes in the assumptions and estimates underlying the impairment calculation. Impairment is only reversed to the extent that the asset’s new carrying amount does not exceed the carrying amount of the asset after amortisation/depreciation had the asset not been impaired.
2.2.2 IMPAIRMENT TEST OF GOODWILL The carrying amount of goodwill allocated to groups of CGUs
DKK million 2021 2020
Western Europe 20,265 19,604
Asia 15,963 15,363
Central & Eastern Europe 16,256 15,525
Total 52,484 50,492
Estimating expected cash flow involves developing multiple probability-weighted scenarios to reflect different outcomes in terms of timing and amount. Measurement of the forecast period growth rates reflects risk adjustments made to calculate the expected cash flows.
Key considerations in impairment tests Goodwill Brands
CGU-level of test Geographical segment Individual brand
Method to estimate recoverable amount Value in use Value in use
Method to estimate present value of future cash flows
Expected value approach: multiple probability-weighted cash flows
Traditional approach: single most likely future cash flows
Discount rate Risk-free rate Risk-adjusted rate

CARLSBERG GROUP ANNUAL REPORT 2021 CONSOLIDATED FINANCIAL STATEMENTS 71
SECTION 2.2 (CONTINUED)
IMPAIRMENT
Key assumptions
2021
Forecast cash flow
growth
Terminal period
growth
Pre-tax discount
rate
Western Europe 1% 0.0% 1.7%
Asia -10% 1.0% 4.5%
Central & Eastern Europe -24% 3.5% 6.3%
The average cash flow growth in the forecast period reflects the significant risk adjustments included in the forecast specifically for the impairment test. The risk adjustments consider alternative scenarios to account for the particular uncertainty related to the continued impact on earnings and cash flow from the COVID-19 pandemic, the time and speed of the recovery, and the volatile macroeconomic and competitive situation in Central & Eastern Europe. Potential upsides are not identified and adjusted in the cash flows used for impairment testing. Growth is projected in nominal terms and therefore does not translate into cash flow at the same growth rate in the Group’s presentation currency, DKK. NEW SEGMENTATION FOR 2021 The Group’s segmentation and regional split of entities changed as of 1 January 2021, and the allocation of CGUs changed accordingly, with goodwill amounting to DKK 3,039m reallocated from Western Europe to Central &
Eastern Europe. This change did not have any impact on the conclusion of the impairment test of goodwill. WESTERN EUROPE The region primarily comprises mature beer markets, and market volumes tend to be flat. In recent years, the region has seen improving beer category dynamics through innovations, increased interest in craft & speciality beers and alcohol-free brews, and an overall improved category perception. The region is generally characterised by well-established retail structures and a strong tradition of beer consumption. Consumption is generally resilient, although the on-trade channel tends to be impacted by a weak macroeconomic environment. In the past two years, the on-trade suffered as a result of restrictions and lockdowns across markets due to COVID-19. The COVID-19 situation in 2022 remains uncertain, but it is not expected to have a significant long-term effect. In 2022, the focus will be on mitigating the significant cost inflation, in particular for raw materials and packaging, but also other costs, such as logistics and wages. Mitigating actions include value management, channel and product mix, price increases and continuous cost focus as part of the Group’s Funding the Journey culture. ASIA The importance of Asia for the Group has increased significantly over the past decade, during which the Group has strengthened its
presence in the region, both organically and through acquisitions. The Asian markets are very diverse but offer prospects for volume and value growth, underpinned by young populations, urbanisation, rising disposable income levels, growing economies and, in some markets, relatively low per capita beer consumption. However, as many Asian markets are emerging markets, development is subject to volatility. Both the on-trade and off-trade channels are generally characterised by a strong traditional outlet segment, but with the modern outlet segment growing in most markets. In 2020 and 2021, all markets in the region were impacted by COVID-19 at different times and to different extents. The impact from COVID-19 in China was most profound in the first quarter of 2020, since which the market has seen only temporary and limited restrictions, enabling our business to deliver strong performance. The focus in the region remains profitable revenue growth, driven by premiumisation and volume growth. Activities include continued investment in and expansion of our international premium brands, in particular Tuborg, 1664 Blanc, Carlsberg and Somersby, and the strengthening and premiumisation of our local power brands. CENTRAL & EASTERN EUROPE Central & Eastern Europe consists of the large Russian and Ukrainian beer markets, a number of smaller markets across southern and eastern Europe and our export & licence business.
The competitive environment is generally characterised by the presence of large global players. In certain markets, such as Russia, a large number of small, local players take up a significant part of the beer market. Due to the larger on-trade exposure, the southern part of the region was more exposed to COVID-19 in 2020 and 2021 than the eastern part of the region, including Russia, where the on-trade exposure is limited. The competitive environment has been challenging in recent years, particularly in Russia, which has seen an increased focus on volume. This has led to Carlsberg increasing its promotional activities to drive volumes, leading to a downward pressure on margins. Management expects the current macroeconomic situation and developments to continue in the short term, with inflation increasing compared with the levels in 2021, driven by significant increases in cost of sales and logistics. In the medium to long term, interest rates are expected to decline and stabilise at a level lower than currently observed in the market, although still with some volatility.
ACCOUNTING ESTIMATES AND JUDGEMENTS
Goodwill The value in use is the discounted value of the expected future risk-adjusted cash flows. This involves developing multiple probability-weighted scenarios to reflect different outcomes in terms of timing and amount.

CARLSBERG GROUP ANNUAL REPORT 2021 CONSOLIDATED FINANCIAL STATEMENTS 72
SECTION 2.2 (CONTINUED)
IMPAIRMENT Key assumptions The cash flow is based on the budget and target plans for the next three years. Cash flows beyond the three-year period are extrapolated using the terminal period growth rate. The budget and plans for 2022-2024 represents management’s best estimate of the impact from the COVID-19 pandemic. The probability weighting applied is based on past experience and the uncertainty of the prepared budget and target plans. Potential upsides and downsides identified during the budget process and in the daily business are reflected in the future cash flow scenarios for each CGU. The risk-adjusted cash flows are discounted using a rate that reflects the risk-free interest rate for each CGU. The interest rates used in the impairment tests are based on observable market data. Please refer to the description of discount rates in section 2.2.3. The key assumptions on which management bases its cash flow projections are: • Volumes • Sales prices • Input costs • Operating investments • Terminal period growth The assumptions are determined at CGU level and are based on past experience, external sources of information and industry-relevant observations for each CGU. Local conditions, such as expected developments in macroeconomic and market conditions specific to the individual CGUs, are considered. The assumptions are challenged and verified by management at CGU and Group level. The budget and target plan processes consider events or circumstances that are relevant to reliably project the short-term performance of each CGU. Examples include significant campaign activities, changes in excise duties etc., which may have a short-term impact but are non-recurring. Given their short-term
nature, they are not taken into consideration when estimating the terminal period growth rate. Impact of COVID-19 The development in 2021 showed that the beverage industry is generally resilient and confirmed the expectation from 2020 when volumes and earnings returned to levels close to pre-pandemic levels after the introduction of vaccines and the lifting of government restrictions. The decline in earnings experienced in 2020 due to COVID-19 is therefore not expected to continue in the long term. However, to avoid overlooking any long-term impact, additional risk adjustments have been made for the development in the cost of raw and packaging materials and operating investments. Volumes Projections are based on past experience, external market data, planned commercial initiatives, such as marketing campaigns and sponsorships, and the expected impact on consumer demand and the level of premiumisation. If relevant, the projections are adjusted for the expected changes in the level of premiumisation. No changes in market share are assumed in the medium or long term.
Demographic expectations general to the industry, such as the development in population, consumption levels, generation-shift patterns, rate of urbanisation and macroeconomic trends, are also considered in medium- and long-term projections. Events and circumstances can impact the timing of volumes entering the market. These include excessive stocking related to an increase in excise duties, campaign activities, and the timing of national holidays and festivals. Such short-term effects are not material to volume projections and do not impact the long-term projections. Sales prices The level of market premiumisation and the locally available portfolio are key drivers in identifying price points. When planning pricing structures, factors including price elasticity, local competition and inflation expectations can also impact the projection.
Increases in excise duties are typically passed on to the customers immediately or with a delay of no more than a few months. Since the increase is a pass-through cost and thereby compensated for by price increases at the time of implementation, it does not impact the long-term sales price growth and is therefore not taken into consideration in the projections unless circumstances specifically indicate otherwise. No changes to duties in the short or medium term are taken into consideration unless there is a firm plan to introduce changes. Input costs Input costs in the budget and target plans are based on past experience and on: • Contracted raw and packaging materials • Contracted services within sales, marketing,
production and logistics • Planned commercial investments • Cost optimisations not related to restructurings • Expected inflation In the long term, projections follow the level of inflation unless long-term contracts are in place. Operating investments Projections are based on past experience of the level of necessary maintenance of existing production capacity, including replacement of parts. This also includes scheduled production line overhauls and improvements to existing equipment. Non-contracted capacity increases and new equipment are not included.
Terminal period growth Growth rates are projected to be equal to or below the expected rate of general inflation and assume no nominal economic growth. The projected growth rates and the applied discount rates are compared to ensure a sensible correlation between the two.
2.2.3 IMPAIRMENT TEST OF BRANDS Brands with indefinite useful life
DKK million 2021 2020
Baltika brand 4,410 4,876
International brands 3,000 3,000
Significant brands 7,410 7,876 In 2021, significant brands represented 50% (2020: 55%) of the total carrying amount of brands with indefinite useful life. The decrease in the carrying amount of the Baltika brand compared with 2020 is mainly due to the impairment loss recognised in 2021, partly offset by the appreciation of RUB. Other brands comprise a total of 21 brands (2020: 19 brands) that individually are not material compared with the total carrying amount.
ACCOUNTING ESTIMATES AND JUDGEMENTS
Brands The test for impairment of brands is performed using the relief from royalty method and is based on the expected future cash flows generated from the royalty payments avoided for the individual brand for the next 20 years and projections for subsequent years. The risk-free cash flows are discounted using a rate reflecting the risk-free interest rate with the addition
Key assumptions
2021
Average revenue growth
Terminal period growth
Pre-tax discount rate
Post-tax discount rate
Baltika brand 4.8% 4.0% 12.5% 10.9%
International brands 1.5% 1.7% 4.9% 4.8%

CARLSBERG GROUP ANNUAL REPORT 2021 CONSOLIDATED FINANCIAL STATEMENTS 73
SECTION 2.2 (CONTINUED)
IMPAIRMENT of the risk premium associated with the individual brand. Key assumptions The key assumptions on which management bases its cash flow projection include the expected useful life, revenue growth, a theoretical tax amortisation benefit, the royalty rate and the discount rate. Expected useful life Management has assessed that the value of brands with indefinite useful life can be maintained for an indefinite period, as these are well-established brands in their markets, having existed for decades or even centuries. The beer industry is characterised as being very stable with consistent consumer demand and a predictable competitive environment, and is expected to be profitable for the foreseeable future. Control of the brands is legally established and enforceable indefinitely. In management’s opinion, the risk of the useful life of these brands becoming finite is minimal because of their individual market positions and because current and planned marketing initiatives are expected to sustain their useful life.
Revenue growth At the time of acquisition of any individual brand, a revenue growth curve is forecast based on a long-term strategic view of the risk and opportunities relevant to the brand. The curve is forecast for a 20-year horizon. This horizon reliably reflects the lengthy process of implementing brand strategies to support a brand occupying its intended place in the Group’s portfolio. The forecast period applied is comparable with the common term of the majority of licence agreements to which the Group is party. In the local markets, the product portfolio usually consists of local power brands and international premium brands. When projecting revenue growth for local brands, in addition to their commercial strength – such as market share and segment position – the forecast takes into consideration the demographics of
the primary markets, including expected developments in population, consumption levels, generation-shift patterns, rate of urbanisation, beer market maturity, level of premiumisation, circumstances generally limiting the growth opportunities for alcoholic beverages etc. For brands with global or regional presence, enhanced investments in product development and marketing are expected. The expected growth rate for these brands is generally higher than for more localised brands and is usually highest early in the 20-year period. Depending on the nominal growth expectations for the individual brand, the revenue growth in individual years may be above, equal to or below the forecast inflation level in the markets where the brand is present. When preparing budgets, consideration is given to events or circumstances that are relevant to reliably project the short-term performance of each brand. Examples include significant campaign activities, changes in excise duties etc., which may have a short-term impact but are non-recurring and quickly absorbed by the business. Since the impact is not material to the long-term projections, it is not taken into consideration when estimating the long-term and terminal period growth rates. Please refer to the description of the impact of increases in excise duties in the description of sales prices in section 2.2.2. In 2021, the drop in revenue experienced in 2020 due to the COVID-19 pandemic was, as expected, largely regained in most markets, following the introduction of vaccines and the lifting of governmental restrictions. The risk of future revenue decline from infection levels potentially increasing again has been carefully considered. The beverage industry has generally proved to be resilient, and the decline in revenue experienced in 2020 is not expected to have a long-term impact. Revenue is expected to recover to pre-pandemic levels in the medium and long term. The timing of the recovery has been carefully considered, particularly
for brands with lower headroom to the carrying amount. Tax benefit The theoretical tax benefit applied in the test uses tax rates and amortisation periods based on current legislation. The impairment test applies tax rates in the range of 15-31% and amortisation periods of 5-15 years. Royalty rate Royalties generated by a brand are based on the Group’s total income from the brand and are earned globally, i.e., the income is also earned outside the CGU that owns the brand. If external licence agreements for the brand already exist, the market terms of such agreements are taken into consideration when assessing the royalty rate that the brand is expected to generate in a transaction with independent parties. The royalty rate is based on the actual market position of the individual brand in the global, regional and local markets, and assumes a 20-year horizon. This term is common to the beverage industry when licensing brands. For some brands, the share of the total beer market profit exceeds the volume share to an extent that creates significant market entry barriers for competing brands and justifies a higher royalty rate. In 2021, the royalty rate for one of the brands was adjusted downwards from 13% to 11% due to increased competition in the market and declining margins.
Royalty rates
International, premium and speciality beers 3.5-11.0%
Strong regional and national brands 3.0-5.0%
Local and mainstream brands 2.0-3.5% Discount rates The discount rate is a weighted average cost of capital (WACC) that reflects the risk-free interest rate with the addition of a risk premium relevant to each brand.
The risk-free interest rates used in the impairment tests are based on observed market data. For countries where long-term risk-free interest rates are not observable or valid due to specific national or macroeconomic conditions, the interest rate is estimated based on observations from other markets and/or long-term expectations expressed by international financial institutions considered reliable by the Group. The added credit risk premium (spread) for the risk-free interest rate is fixed at market price or slightly higher, reflecting the expected long-term market price. The aggregate interest rate, including spread, thereby reflects the long-term interest rate applicable to the Group’s investments in the individual markets. Interest rates applied in Central & Eastern Europe In recent years, the macroeconomic situation has deteriorated significantly in Eastern Europe, resulting in interest rates and inflation increasing to a level significantly higher than the Group’s long-term expectations. The Group continues to monitor market developments and compare these with the expectations of key international financial institutions to determine if the observable data can be applied. The use of expected future interest rates in previous years in lieu of appropriate observable interest rates did not impact the conclusion of the impairment test because the relationship between discount rates and growth rates (the real interest rate) was expected to be constant. Expectations for the long-term real interest rate remain a key assumption for the impairment testing in general, and for CGUs with exposure to the Russian market in particular. The impairment test of the Baltika brand is sensitive to changes in the real interest rate. Since no expected future long-term real interest rate can be directly observed, the estimate of a real interest rate is subjective and associated with risk. In 2021, the observable interest rate and inflation in Russia increased to levels significantly higher than the long-term expectations of key international financial institutions. This high risk-free interest rate has been

CARLSBERG GROUP ANNUAL REPORT 2021 CONSOLIDATED FINANCIAL STATEMENTS 74
SECTION 2.2 (CONTINUED)
IMPAIRMENT applied in the impairment test for 2021 to discount the forecast period cash flows. To avoid applying an incorrect real interest rate in perpetuity, the discount rate used to calculate the net present value of the cash flows in the terminal period has been adjusted to incorporate an interest rate that is equal to the expected rate of inflation with the addition of an expected long-term real interest rate of 2.8%. The expected real interest rate was estimated based on market observations from the preceding five years. Interest rates applied in Western Europe Western Europe is experiencing very low interest rates, in several countries even lower than inflation, resulting in negative real interest rates. The Group generally applies a growth rate in the terminal period that is equal to or slightly lower than expected inflation. Management does not expect assets and CGUs subject to impairment testing to have a negative real interest rate in perpetuity. To avoid applying negative real interest rates in perpetuity, the discount rate used to calculate net present value of the cash flows in the terminal period has been adjusted to incorporate an interest rate that is at least equal to the expected rate of inflation, with the addition of the expected long-term real interest rate.
2.2.4 SENSITIVITY TESTS Sensitivity tests have been performed to determine the lowest forecast and terminal period growth rates and/or highest discount rates that can occur in the groups of CGUs and brands with indefinite useful life without leading to any impairment loss. The risk-free interest rates observable for Western Europe increased but remained low at the end of 2021. The sensitivity tests calculate
the impact of higher interest rates and allow for a double-digit percentage-point increase in risk-free interest rates. Due to a challenging macroeconomic situation in some CGUs and groups of CGUs, the Group performed additional sensitivity tests to ensure that no potential impairment had been overlooked. These additional sensitivity tests did not identify any potential impairment. GOODWILL The test for impairment of goodwill did not identify any CGUs or groups of CGUs to which goodwill is allocated where a reasonably possible negative change in a key assumption would cause the carrying amount to exceed the recoverable amount. The goodwill allocated to Central & Eastern Europe was primarily recognised when the Group completed the step acquisition of the remaining 50% of the Baltic Beverage Holding Group from Scottish & Newcastle in 2008. However, the impairment test includes 100% of the cash flow generated by Central & Eastern Europe, resulting in the recoverable amount significantly exceeding the carrying amount. BRANDS Following the impairment losses recognised in 2021 and 2020, a reasonably possible negative change in a key assumption would cause the carrying amount of the brands that were written down to exceed the recoverable amount. The sensitivity to changes in the assumptions is shown in the table below.
Key assumptions The key assumptions relevant to the assessment of the recoverable amount are: • Volume • Price • Discount rate The assumptions for volume and pricing are closely linked, which, together with the presence of multiple sub-brands in various geographies within each brand, makes individual sensitivity testing on the basis of these two assumptions highly impractical. Instead, sensitivity testing is performed for the overall revenue growth rate, in both the forecast period and the terminal period. The sensitivity test for the maximum decline in growth rate in the forecast period assumes a year-on-year decline in the nominal growth rate, thereby estimating the accumulated effect of a negative change for the full forecast period. The sensitivity tests were completed with all other assumptions unchanged, as it is relevant to assess the sensitivity to, for example, a decline in the growth rate independently of changes in the discount rate. This is because the growth rate in itself might be impacted by
changes in brand strategy and other market factors. The sensitivity calculated also assumes a straight-line impact despite the fact that changes in market dynamics and adjustments to these will in practice have different impacts in the individual years and might not apply in the long term. Interest rates in Western Europe have been low for several years and are currently lower than inflation. An increase in the interest rates without a corresponding change in inflation would result in a lower recoverable amount for brands and could potentially lead to impairment. However, management considers the risk of a significant write-down to be very low. Baltika brand The Baltika brand was written down to its recoverable amount at the end of 2021. As a result, even a small negative change in the key assumptions could lead to further impairment. At 31 December 2021, the carrying amount of the Baltika brand was DKK 4,410m (2020: DKK 4,876m).
Sensitivity test
DKKbn
Average forecast
growth rate
Terminal period
growth rate Risk-free
interest rate
∆ -1 %-point -1 %-point +1 %-point
Baltika brand -0.5 -0.2 -0.6

CARLSBERG GROUP ANNUAL REPORT 2021 CONSOLIDATED FINANCIAL STATEMENTS 75
SECTION 2.2 (CONTINUED)
IMPAIRMENT
Changes in the market dynamics and the challenging competitive environment in Russia could have a significant negative impact on the recoverable amount. Macroeconomic recovery could lead to further premiumisation or localisation, which could drive consumers towards international brands or local/regional brands. An increase in the real interest rate from the current level (2.8%), either because of a higher interest rate or lower inflation, could significantly reduce the recoverable amount. A 1 percentage point increase in the risk-free interest rate would result in a reduction in the recoverable amount of DKK 0.6bn, and a 1 percentage point decrease in the terminal growth rate would result in a reduction in the recoverable amount of DKK 0.2bn. The combined effect of a 1 percentage point negative change in the interest rate, the terminal growth rate and the average growth rate in the forecast period (year on year) would result in a reduction in the recoverable amount of DKK 1.1bn. Other brands in Russia Other brands in Russia were written down to their recoverable amount at the end of 2021. As a result, even a small negative change in the key assumptions could lead to further impairment.
Following the impairment, the carrying amount of the brands amounts to DKK 646m (2020: DKK 639m). Any increase in the risk-free interest rate or decrease in the terminal growth rate would therefore result in a minor additional impairment. Angkor brand As the Angkor brand was written down to the recoverable amount in 2020, a reasonably possible negative change in the key assumptions could lead to further impairment. Following the impairment, the carrying amount of the brand amounts to DKK 93m (2020: DKK 86m). Any increase in the risk-free interest rate or decrease in the terminal growth rate would therefore result in a minor additional impairment.

CARLSBERG GROUP ANNUAL REPORT 2021 CONSOLIDATED FINANCIAL STATEMENTS 76
SECTION 2.3 INTANGIBLE ASSETS AND PROPERTY, PLANT AND EQUIPMENT
DKK million Intangible assets Property, plant and equipment Asset base
2021 Goodwill Brands
Other intangible
assets Total Land and buildings
Plant and machinery
Other equipment, fixtures and
fittings Total Total
Cost
Cost at 1 January 52,064 24,056 4,967 81,087 19,228 28,479 15,614 63,321 144,408
Acquisition of entities 214 654 9 877 42 -51 -182 -191 686
Additions, including right-of-use assets - - 341 341 328 1,970 2,021 4,319 4,660
Disposal and deconsolidation of entities -301 - -20 -321 -102 -209 -379 -690 -1,011
Disposals - -2 -386 -388 -273 -674 -1,975 -2,922 -3,310
Transfers - - - - 65 -483 96 -322 -322
Foreign exchange adjustments etc. 2,250 1,473 143 3,866 551 1,240 534 2,325 6,191
Cost at 31 December 54,227 26,181 5,054 85,462 19,839 30,272 15,729 65,840 151,302
Amortisation, depreciation and impairment losses Amortisation, depreciation and impairment losses at 1 January 1,572 9,427 4,027 15,026 8,165 18,155 10,702 37,022 52,048
Disposal and deconsolidation of entities - - -7 -7 -40 -147 -329 -516 -523
Disposals - -2 -369 -371 -186 -642 -1,846 -2,674 -3,045
Amortisation and depreciation - 19 206 225 673 1,450 2,048 4,171 4,396
Impairment losses - 950 107 1,057 5 22 124 151 1,208
Reversal of impairment losses - - - - -86 -4 -24 -114 -114
Transfers - - - - -145 -29 - -174 -174
Foreign exchange adjustments etc. 171 837 49 1,057 123 848 355 1,326 2,383
Amortisation, depreciation and impairment losses at 31 December 1,743 11,231 4,013 16,987 8,509 19,653 11,030 39,192 56,179
Carrying amount at 31 December 52,484 14,950 1,041 68,475 11,330 10,619 4,699 26,648 95,123
Right-of-use assets included at 31 December
Amortisation and depreciation - - - - 174 6 205 385 385
Carrying amount at 31 December - - - - 887 11 420 1,318 1,318

CARLSBERG GROUP ANNUAL REPORT 2021 CONSOLIDATED FINANCIAL STATEMENTS 77
SECTION 2.3 (CONTINUED)
INTANGIBLE ASSETS AND PROPERTY, PLANT AND EQUIPMENT
DKK million Intangible assets Property, plant and equipment Asset base
2020 Goodwill Brands
Other intangible
assets Total Land and buildings
Plant and machinery
Other equipment, fixtures and
fittings Total Total
Cost
Cost at 1 January 54,748 27,548 4,967 87,263 18,978 30,595 15,760 65,333 152,596
Acquisition of entities 1,812 - - 1,812 634 258 373 1,265 3,077
Additions, including right-of-use assets - 804 245 1,049 224 1,781 1,818 3,823 4,872
Disposals - - -66 -66 -603 -846 -1,392 -2,841 -2,907
Transfers - - -6 -6 1,049 -1,222 195 22 16
Foreign exchange adjustments etc. -4,496 -4,296 -173 -8,965 -1,054 -2,087 -1,140 -4,281 -13,246
Cost at 31 December 52,064 24,056 4,967 81,087 19,228 28,479 15,614 63,321 144,408
Amortisation, depreciation and impairment losses Amortisation, depreciation and impairment losses at 1 January 1,618 11,593 4,025 17,236 8,258 18,827 10,641 37,726 54,962
Disposals - - -42 -42 -464 -815 -1,253 -2,532 -2,574
Amortisation and depreciation - 20 167 187 653 1,448 2,048 4,149 4,336
Impairment losses - 231 4 235 8 84 30 122 357
Transfers - - - - 9 10 1 20 20
Foreign exchange adjustments etc. -46 -2,417 -127 -2,590 -299 -1,399 -765 -2,463 -5,053
Amortisation, depreciation and impairment losses at 31 December 1,572 9,427 4,027 15,026 8,165 18,155 10,702 37,022 52,048
Carrying amount at 31 December 50,492 14,629 940 66,061 11,063 10,324 4,912 26,299 92,360
Right-of-use assets included at 31 December
Amortisation and depreciation - - - - 178 11 207 396 396
Carrying amount at 31 December - - - - 942 25 415 1,382 1,382

CARLSBERG GROUP ANNUAL REPORT 2021 CONSOLIDATED FINANCIAL STATEMENTS 78
SECTION 2.3 (CONTINUED)
INTANGIBLE ASSETS AND PROPERTY, PLANT AND EQUIPMENT
Property, plant and equipment under construction amounted to DKK 1,193m (2020: DKK 1,121m). Property, plant and equipment under construction are recognised in plant and machinery until completion. Other equipment, fixtures and fittings include transport, office and draught beer equipment, coolers and returnable packaging materials. Other intangible assets include software, land use rights and beer delivery rights.
RIGHT-OF-USE ASSETS The Group leases various properties and warehouses, production equipment, cars and trucks. Leases are negotiated on an individual basis and contain a wide range of different terms and conditions. At 31 December 2021, the carrying amount of right-of-use assets was DKK 1,318m. During the year, additions amounted to DKK 437m and depreciation to DKK 385m. Lease expenses recognised in the income statement, relating to short-term leases and leases of low-value assets, amounted to DKK 33m (2020 DKK 44m). Such contracts comprise the lease of copy and printing machines, coffee machines, small IT devices and similar equipment. For disclosures of the interest expenses, cash flow and lease liabilities, please refer to sections 4.1, 4.4.1 and 4.7.
CAPITAL COMMITMENTS The Group has entered into various capital commitments that will not take effect until after the reporting date and have therefore not been recognised in the consolidated financial statements. Capital commitments amounted to DKK 132m (2020: DKK 41m).
ACCOUNTING ESTIMATES AND JUDGEMENTS
Useful life and residual value of intangible assets with finite useful life and property, plant and equipment Useful life and residual value are initially assessed both in acquisitions and in business combinations. Management assesses brands and property, plant and equipment for changes in useful life. If an indication of a reduction in the value or useful life exists, such as changes in production structure, restructuring and brewery closures, the asset is tested for impairment. If necessary, the asset is written down or the amortisation/depreciation period is reassessed and, if necessary, adjusted in line with the asset’s changed useful life. When changing the amortisation or depreciation period due to a change in the useful life, the effect on amortisation/ depreciation is recognised prospectively as a change in accounting estimates.
Lease and service contracts At inception of a contract, management assesses whether the contract is or contains a lease. Management considers the substance of any service being rendered to classify the arrangement as either a lease or a service contract. Particular importance is attached to whether fulfilment of the contract depends on the use of specific assets. The assessment involves judgement of whether the Group obtains substantially all the economic benefits from the use of the specified asset and whether it has the right to direct how and for what purpose the asset is used. If these criteria are satisfied at the commencement date, a right-of-use asset and a lease liability are recognised in the statement of financial position. In determining the lease term, management considers all the facts and circumstances that create an economic incentive to exercise an extension option or not to exercise a termination option. Extension or termination options are only included in the lease term if the lease is reasonably certain to be extended or not terminated. The term is reassessed if a significant change in circumstances occurs. The assessment of purchase options follows the same principles as those applied for extension options. The lease payment for cars and trucks often includes costs of service and insurance. If these costs are not objectively assessable, the Group estimates the costs when separating the service component from the lease.
Amortisation, depreciation and impairment losses Intangible assets Property, plant and equipment
DKK million 2021 2020 2021 2020
Cost of sales 158 38 2,790 2,666
Sales and distribution expenses 64 71 1,242 1,249
Administrative expenses 110 78 248 284
Special items 950 235 -72 72
Total 1,282 422 4,208 4,271
Gain/loss on disposal of assets
DKK million 2021 2020
Gain on disposal of property, plant and equipment and intangible assets 119 76
Loss on disposal of property, plant and equipment and intangible assets -26 -23
Total 93 53

CARLSBERG GROUP ANNUAL REPORT 2021 CONSOLIDATED FINANCIAL STATEMENTS 79
SECTION 2.3 (CONTINUED)
INTANGIBLE ASSETS AND PROPERTY, PLANT AND EQUIPMENT
ACCOUNTING POLICIES
Cost Intangible assets and property, plant and equipment are initially recognised at cost and subsequently measured at cost less accumulated amortisation or depreciation and impairment losses. Cost comprises the purchase price and costs directly attributable to the acquisition until the date when the asset is available for use. The cost of acquired brand rights is accounted for using the accumulated cost approach if the total consideration includes an earn-out dependent on the brands’ future performance. The cost of self-constructed assets comprises direct and indirect costs of materials, components, sub-suppliers, wages and salaries, and capitalised borrowing costs on specific or general borrowings attributable to the construction of the asset, and is included in plant and machinery. Research and development costs are recognised in the income statement as incurred. Development costs of intangible assets, for example software, are recognised as other intangible assets if the costs are expected to generate future economic benefits. For assets acquired in business combinations, including brands and property, plant and equipment, cost at initial recognition is determined by estimating the fair value of the individual assets in the purchase price allocation. Goodwill is only acquired in business combinations and is measured in the purchase price allocation.
Goodwill is not amortised but is subject to an annual impairment test, cf. section 2.2. Where individual components of an item of property, plant and equipment have different useful lives, they are accounted for as separate items. Subsequent costs, for example in connection with replacement of components of property, plant and equipment, are recognised in the carrying amount of the asset if it is probable that the costs will result in future economic benefits for the Group. The replaced components are derecognised from the statement of financial position and recognised as an expense in the income statement. Costs incurred for ordinary repairs and maintenance are recognised in the income statement as incurred. Useful life, amortisation, depreciation and impairment losses Useful life and residual value are determined at the acquisition date and reassessed annually. If the residual value exceeds the carrying amount, depreciation is discontinued. Amortisation and depreciation are recognised on a straight-line basis over the expected useful life of the assets, taking into account any residual value. The expected useful life and residual value are determined based on past experience and expectations of the future use of assets. Depreciation is calculated on the basis of the cost less the residual value and impairment losses. Amortisation and depreciation are recognised as cost of sales, sales and distribution expenses, and administrative expenses depending on the use of the asset.
The expected useful life is as follows:
Brands with finite useful life Normally 20 years Software Normally 3-5 years. Group-wide
systems developed as an integrated part of a major business development programme: 5-7 years
Delivery rights Depending on contract; if no contract term has been agreed, normally not exceeding 5 years
Customer agreements/ relationships
Depending on contract with the customer; if no contract exists, normally not exceeding 20 years
Buildings 20-40 years
Technical installations 15 years
Brewery equipment 15 years
Filling and bottling equipment 8-15 years
Technical installations in warehouses 8 years
On-trade and distribution equipment 5 years
Fixtures and fittings, other plant and equipment 5-8 years
Returnable packaging materials 3-10 years
Hardware 3-5 years
Land Not depreciated
Impairment Impairment losses of a non-recurring nature are recognised under special items. Leases At the commencement date, the Group recognises a lease liability and a corresponding right-of-use asset at the same amount, except for short-term leases of 12 months or less and leases of low-value assets. A right-of-use asset is initially measured at cost, which consists of the initial lease liability and initial direct costs less any lease incentives received. The Group has applied the practical expedient option allowed under IFRS by using a portfolio approach for the recognition of lease contracts related to assets of the same nature and with similar lease terms, i.e. cars and trucks. Subsequently, the right-of-use asset is measured at cost less depreciation and impairment losses and adjusted for remeasurement of the lease liability. The right-of-use asset is depreciated over the earlier of the lease term or the useful life of the asset. The impairment testing of right-of-use assets follows the same principles as those applied for property, plant and equipment, cf. section 2.2. Right-of-use assets are recognised as property, plant and equipment. The Group has elected not to recognise right-of-use assets and liabilities for leases with a term of 12 months or less and leases of low-value assets. Lease payments related to such leases are recognised in the income statement as an expense on a straight-line basis over the lease term. Government grants and other funding Grants and funding received for the acquisition of assets and development projects are recognised in the statement of financial position by deducting the grant from the carrying amount of the asset. The grant is recognised in the income statement over the life of the asset as a reduced depreciation charge.

CARLSBERG GROUP ANNUAL REPORT 2021 CONSOLIDATED FINANCIAL STATEMENTS 80
1,429m SPECIAL ITEMS, INCOME (DKK) Impacted by reversal of provisions made in purchase price allocations in previous years.
-1,682m SPECIAL ITEMS, EXPENSES (DKK) Impacted by write-downs of the Baltika brand and other brands in Russia, and restructuring costs across the Group.
SECTION 3.1
SPECIAL ITEMS SPECIAL ITEMS, INCOME In 2021, the Group recognised reversal of provisions made in purchase price allocations in prior years in Asia (DKK 1,238m), reversal of a restructuring provision in the UK (DKK 52m), reversal of impairment losses in Denmark (DKK 86m) and revaluation gain on retained investment in Gorkha Brewery (DKK 38m).
The provisions recognised in purchase price allocations mainly related to indirect taxes and certain employee obligations, and were either settled during the year or are no longer expected to be realised. In 2020, the Group recognised reversal of provisions made in purchase price allocations in prior years (DKK 586m) and a gain on disposal of the last part of the former brewery site in Hamburg, Germany (DKK 62m). SPECIAL ITEMS, EXPENSES In 2021, write-downs were recognised of the Baltika brand and other brands in Russia, totalling DKK 950m, as a result of reduced profit margins and increased interest rates.
In China, Tibet Lhasa Brewery was negatively impacted by disturbances in the operation and management of the company, resulting in the recognition of an impairment loss of DKK 244m.
Fair value adjustments of the contingent consideration for the acquisition of Marston’s brewing activities, completed in 2020, amounted to DKK 129m (2020: DKK 50m). The consideration was settled in cash in December 2021.
SECTION 3
SPECIAL ITEMS, PROVISIONS AND OTHER LIABILITIES
Special items
DKK million 2021 2020
Special items, income
Reversal of provisions made in purchase price allocations in prior years 1,238 586
Reversal of provisions made in prior years 52 -
Reversal of impairment losses 86 -
Gain on disposal of entities and assets 15 62
Revaluation gain on deconsolidation of Gorkha Brewery, cf. section 5.2 38 -
Disposal of property, plant and equipment previously impaired, including adjustments to gains and reversal of provisions made in prior years - 52
Income 1,429 700
Special items, expenses
Impairment of brands, cf. section 2.2 -950 -231
Impairment of investment of associates -244 -
Impairment of property, plant and equipment - -74
Reset, other restructurings and provisions -270 -419
Adjustment of contingent consideration -129 -29
COVID-19, personal protective equipment and donations -41 -69
Costs related to acquisition of entities, etc. -48 -125
Expenses -1,682 -947
Special items, net -253 -247

CARLSBERG GROUP ANNUAL REPORT 2021 CONSOLIDATED FINANCIAL STATEMENTS 81
SECTION 3.1 (CONTINUED)
SPECIAL ITEMS
During 2021 and 2020, the Group continued to carry out various restructuring projects as part of the ongoing focus on cost and efficiency initiatives. The COVID-19 pandemic did not have as severe a negative impact in 2021 as in 2020 due to reduced government impositions in the form of lockdowns, travel restrictions, limited social gatherings and social distancing. Restructuring costs and costs of personal protective equipment, donations etc. incurred as a result of the response to the COVID-19 impact on the entire business therefore declined in 2021. In 2020 The Group was also impacted by write-downs of a brand and brewing equipment mainly in Cambodia, as a consequence of COVID-19 restrictions in the market.
ACCOUNTING ESTIMATES
AND JUDGEMENTS
The use of special items entails management judgement in the separation from ordinary items. Management carefully considers individual items and projects (including restructurings) in order to ensure the correct distinction and split between operating activities and significant income and expenses of a special nature. Management initially assesses the entire restructuring project and recognises all present costs of the project. The projects are assessed on an ongoing basis, with additional costs possibly being incurred during the lifetime of the project. The estimate includes expenses related to termination of employees, onerous contracts, break fees and other obligations arising in connection with restructurings. Management reassesses the useful life and residual value of non-current assets used in an entity undergoing restructuring.
ACCOUNTING POLICIES
Special items include significant income and expenses of a special nature in terms of the Group’s revenue-generating activities that cannot be attributed directly to the Group’s ordinary operating activities. Special items also include significant non-recurring items, including termination benefits related to retirement of members of the Executive Committee, impairment of goodwill and brands, significant provisions in relation to certain disputes and lawsuits, gains and losses on the disposal of activities and associates, revaluation of the shareholding in an entity held immediately before a step acquisition or cease of consolidation of that entity, and transaction costs in a business combination. Significant restructuring of processes and structural adjustments are included in special items. Special items are shown separately from the Group’s ordinary operations to facilitate a better understanding of the Group’s financial performance.
Impact of special items on operating profit
DKK million 2021 2020
If special items had been recognised in operating profit before special items, they would have been included in the following line items: Cost of sales -1,016 -111
Sales and distribution expenses -46 -305
Administrative expenses -229 -307
Other operating income 1,397 668
Other operating expenses -359 -192
Special items, net -253 -247

CARLSBERG GROUP ANNUAL REPORT 2021 CONSOLIDATED FINANCIAL STATEMENTS 82
SECTION 3.2
PROVISIONS
Restructuring provisions relate to termination benefits to employees made redundant, primarily as a result of a restructuring project accounted for as special items. The restructuring provision in 2021 of DKK 178m primarily relates to Reset for the future, which was initiated in 2020. Other restructurings mainly related to Kronenbourg, Carlsberg Deutschland, Carlsberg Sverige and certain local supply companies. Onerous contracts primarily related to contract brewing in Asia and are expected to be utilised by 2028. Other provisions of DKK 2,754m related to ongoing disputes and lawsuits, profit sharing in France, provisions made in connection with purchase price allocations (PPA provisions) and employee obligations other than retirement benefits. Timing of settlement of ongoing disputes, lawsuits and PPA provisions cannot be determined, whereas the remaining liabilities are expected to be settled in one to two years. Total provisions have been impacted by reversal of provisions made in purchase price allocations in previous years in Asia, as described in section 3.1, and reversal of legal provisions, real estate and other contractual obligations that did not materialise, in total DKK 1,912m.
ACCOUNTING ESTIMATES AND JUDGEMENTS
In connection with restructurings, management assesses the timing of the costs to be incurred, which influences the classification as current or non-current liabilities. Provision for onerous contracts is based on agreed terms with the other party and expected fulfilment of the contract, based on the current estimate of volumes, use of raw materials etc. Management assesses provisions, contingent assets and liabilities, and the likely outcome of pending or probable lawsuits etc. on an ongoing basis. The outcome depends on future events, which are by nature uncertain. In assessing the likely outcome of lawsuits and tax disputes etc., management relies on external legal advice and established precedents.
ACCOUNTING POLICIES
Provisions, including profit-sharing provisions, are recognised when, as a result of events arising before or at the reporting date, the Group has a legal or a constructive obligation and it is probable that there may be an outflow of economic benefits to settle the obligation. Provisions are discounted if the effect is material to the measurement of the liability. The risk-free interest rate is used as the discount rate. Restructuring costs are recognised when a detailed, formal restructuring plan has been announced to those affected no later than at the reporting date. On acquisition of entities, restructuring provisions in the acquiree are only included in the opening balance when the acquiree has a restructuring liability at the acquisition date. A provision for onerous contracts is recognised when the benefits expected to be derived by the Group from a contract are lower than the unavoidable costs of meeting its obligations under the contract.
SECTION 3.3
OTHER LIABILITIES DKK million 2021 2020
Classified as
Non-current liabilities 449 5,196
Current liabilities 12,677 7,414
Total 13,126 12,610
Other liabilities by origin
Staff costs payable 3,118 1,938
Excise duties and VAT payable 2,933 2,641
Other payables 2,200 2,041
Deferred income 621 700
Contingent consideration 4,254 5,290
Total 13,126 12,610
For further description of contingent consideration cf. section 5.4.
ACCOUNTING POLICIES
Other liabilities include excise duties (specific taxes imposed on sales of beer and soft drinks), VAT, withholding tax, accrued interest, payroll, e.g. salaries, overtime, vacation and bonus. Other liabilities (current) are initially recognised at fair value and subsequently at amortised cost.
DKK million Restructurings Onerous
contracts Other Total
Provisions at 1 January 2021 274 476 3,846 4,596
Acquisition of entities - - 22 22
Additional provisions recognised 151 1 793 945
Used during the year -188 -35 -371 -594
Reversal of unused provisions -67 - -1,749 -1,816
Transfers - -24 -8 -32
Discounting - 4 16 20
Foreign exchange adjustments etc. 8 34 205 247
Provisions at 31 December 2021 178 456 2,754 3,388
Classified as
Non-current provisions 28 428 1,990 2,446
Current provisions 150 28 764 942
Total 178 456 2,754 3,388

CARLSBERG GROUP ANNUAL REPORT 2021 CONSOLIDATED FINANCIAL STATEMENTS 83
SECTION 3.4
CONTINGENT LIABILITIES The Group operates in very competitive markets where consolidation is taking place within the industry and among its customers and suppliers, all of which in different ways influences its business. In the ordinary course of business, the Group is party to certain lawsuits, disputes etc. of varying content and scope, some of which are referred to below. The resolution of these lawsuits, disputes etc. is associated with uncertainty, as they depend on relevant applicable proceedings, such as negotiations between the parties affected, government actions and court rulings. In 2020, the German Supreme Court overruled the Higher Regional Court of Düsseldorf, which in 2019 had ruled in favour of Carlsberg Deutschland in relation to the competition case from 2014, in which the Federal Cartel Office in Germany issued a decision and imposed a fine of EUR 62m for alleged infringement of the competition rules in 2007. The German Supreme Court referred the competition case back to a new Senate for full new proceedings, which are currently ongoing. In October 2021, the French competition authority issued a Statement of Objection against a large number of FMCG companies, including three entities in the Group – Kronenbourg SAS, Carlsberg Breweries A/S and Carlsberg A/S – for alleged participation in an anti-competitive agreement not to advertise the non-use of bisphenol A (BPA), Carlsberg
does not agree with the French competition authority and is currently preparing its defence in the case, which is to be submitted in the first quarter of 2022. In October and November 2021, the Group's associate Super Bock in Portugal received decisions on the alleged anticompetitive practice in two ongoing cases. In the first case the Portuguese court of appeal confirmed the fine of EUR 24m issued by the competition authority and in the second case the Portuguese competition authority imposed a fine of EUR 33m on Super Bock. Both decisions have been appealed to the Supreme Court by Super Bock. Since the formal notification by the court in March 2021 about a private enforcement claim of EUR 400m, filed by a consumer protection association against Super Bock Group, for compensation for Portuguese consumers for alleged harm on account of Super Bock’s alleged anticompetitive practices, there has been no significant development in the case. In September 2021, Carlsberg India received the final decision from the Competition Commission of India in the case relating to the dawn raid conducted in 2018. The decision stated that Carlsberg India had engaged in price coordination (partly facilitated through a trade association), supply restrictions and market sharing, in breach of India's competition law. As a result of the infringement, the Competition Commission of India imposed a fine of approx. INR 1.21bn (approx. DKK 96m) on Carlsberg India. It was decided not to appeal the decision and the fine was paid in December. For some time, the Group has had serious disagreements with its partner in Carlsberg
South Asia Pte Ltd ("CSAPL"), the parent company holding 100% and 90% of the shares in the businesses in India and Nepal respectively. Several of the disagreements pertaining to the Shareholders’ Agreement between Carlsberg and its partner, including the partner’s right to exercise the put option, have been referred to arbitration in Singapore. The arbitration award is expected in H1 2022. Disputes always carry some inherent risk. The arbitration could have various outcomes, including either party being awarded a call option to buy out the other shareholder. If the tribunal were to find that Carlsberg has materially breached the Shareholders’ Agreement, although this is not expected, the partner could become entitled to a call option to acquire the Group’s 67% shareholding in CSAPL. From the time that such a call option were to become exercisable, the Group would, for accounting purposes, be required to cease consolidation of CSAPL, including Carlsberg India, and derecognise the investment in Gorkha Brewery, Nepal. If such a call option were to be awarded but not exercised, the Group would resume consolidation when the option lapsed. Conversely, if the award is in favour of the Group, it could result in the acquisition of the 33% shareholding in CSAPL held by the partner. A party being awarded a call option that is subsequently exercised could lead to that party taking possession of 100% of the shares in CSAPL, resulting in the other party no longer being involved in the business of CSAPL. In addition to the ongoing disputes with our partner in CSAPL regarding India and Nepal, there is also a dispute with the local 10% shareholder in Gorkha Brewery, a related party
to the Group’s 33% partner in CSAPL. Please refer to section 5.2. Although no final rulings have been made in the ongoing cases, there is still significant risk associated with these cases due to the inherent uncertainty. Management and the general counsel continuously assess these risks and their likely outcome. It is the opinion of management and the general counsel that, apart from items recognised in the statement of financial position, the outcome of these lawsuits, disputes etc. cannot be reliably estimated in terms of amount or timing. The Group does not expect the ongoing lawsuits and disputes to have a material impact on the Group’s financial position, net profit or cash flow, in excess of items recognised in the statement of financial position. GUARANTEES AND COMMITMENTS The Group has issued guarantees for loans etc. raised by third parties (non-consolidated entities) of DKK 224m (2020: DKK 304m). No guarantees have been issued for loans raised by associates and joint ventures. Certain guarantees etc. are issued in connection with disposal of entities and activities, and in connection with on-trade loans. Apart from items recognised in the statement of financial position or disclosed in the consolidated financial statements, these guarantees etc. will not have a material effect on the Group’s financial position. Capital commitments, lease liabilities and service agreements are described in section 2.3.

CARLSBERG GROUP ANNUAL REPORT 2021 CONSOLIDATED FINANCIAL STATEMENTS 84
19.2bn NET INTEREST-BEARING DEBT (DKK) At 31 December 2021, gross financial debt amounted to DKK 28.9bn (2020: DKK 30.3bn). Net interest-bearing debt was DKK 19.2bn, a decrease of DKK 2.1bn versus year-end 2020.
The liquidity position remained strong due to the free cash flow of DKK 8.9bn and access to a EUR 2bn credit facility, which was unutilised at 31 December 2021. The leverage ratio, measured as net interest-bearing debt to EBITDA, was 1.24x at year-end (2020: 1.51x).
3.6bn SHARE BUY-BACK (DKK) During 2021, the Company repurchased shares worth DKK 3.6bn under the quarterly share buy-back programmes initiated in 2021.
48.8bn EQUITY (DKK) Equity amounted to DKK 48.8bn at 31 December 2021 (2020: DKK 43.4bn), DKK 43.9bn of which was attributable to shareholders in Carlsberg A/S and DKK 4.8bn to non-controlling interests. The change in equity of DKK 5.4bn was mainly the result of consolidated profit of DKK 8.0bn, foreign exchange gains on translation of DKK 3.3bn, the dividend payout of DKK 3.7bn and the share buy-back of DKK 3.6bn. The non-controlling interests were impacted by the acquisition of 60% of Marston’s brewing activities in the UK, the simultaneous disposal of 40% of the Group's subsidiaries in the UK, and the deconsolidation of the Group’s Nepalese business cf. section 5.3.
-381m NET FINANCIAL ITEMS (DKK) Financial items, net, amounted to DKK -381m against DKK -411m in 2020. Excluding currency gains and fair value adjustments, financial items, net, amounted to DKK -319m (2020: DKK -550m), positively impacted by reversal of impairments of financial assets in previous years, partly offset by interests on tax cases in certain markets.
SECTION 4
FINANCING COSTS, CAPITAL STRUCTURE AND EQUITY
CHANGES IN NET INTEREST-BEARING DEBT (DKKbn)
LEVERAGE RATIO (NIBD/EBITDA)
21.319.2
-13.3
3.7 0.7
3.7
3.6 0.3 -0.8
1.0
1.2
1.4
1.6
2017 2018 2019 2020 2021

CARLSBERG GROUP ANNUAL REPORT 2021 CONSOLIDATED FINANCIAL STATEMENTS 85
SECTION 4.1
FINANCIAL INCOME AND EXPENSES
Interest income primarily relates to interest on cash and cash equivalents measured at amortised cost.
Foreign exchange gains, net, include fair value adjustments of hedges and foreign exchange losses. The fair value adjustment of hedges not designated as hedging instruments amounted to DKK -23m (2020: DKK -49m), cf. section 4.8.
Foreign exchange losses amounted to DKK -39m (2020: DKK 188m).
Of the net change in fair value of cash flow hedges transferred to the income statement, DKK 216m (2020: DKK -30m) has been included in revenue and cost of sales and DKK 4m (2020: DKK -2m) in other financial items.
Reversal of impairment of financial assets includes DKK 328m relating to a loan made to the partner in CSAPL. Please refer to section 5.4 for a more detailed description.
FINANCIAL ITEMS, NET (DKKm)
-1,000
-800
-600
-400
-200
0
Financial items, netFinancial items, net, excl. fair value and FX.
Financial items recognised in other comprehensive income
DKK million 2021 2020
Foreign exchange adjustments of foreign entities
Foreign currency translation of foreign entities 3,124 -7,640
Recycling of cumulative translation differences of entities disposed of, deconsolidated or discontinued from use of equity-method 183 -
Total 3,307 -7,640
Fair value adjustments of hedging instruments
Change in fair value of effective portion of cash flow hedges 361 103
Change in fair value of cash flow hedges transferred to the income statement -220 32
Change in fair value of net investment hedges -464 63
Total -323 198
Financial items, net, recognised in other comprehensive income 2,984 -7,442
Financial items recognised in the income statement
DKK million 2021 2020
Financial income
Interest income 101 81
Foreign exchange gains, net - 139
Interest on plan assets, defined benefit plans 99 114
Reversal of impairments of financial assets 363 5
Other 19 34
Total 582 373
Financial expenses
Interest expenses -500 -484
Capitalised financial expenses 4 1
Foreign exchange losses, net -62 -
Interest cost on obligations, defined benefit plans -138 -160
Interest expenses, lease liabilities -13 -12
Other -254 -129
Total -963 -784
Financial items, net, recognised in the income statement -381 -411
Financial items excluding foreign exchange, net -319 -550

CARLSBERG GROUP ANNUAL REPORT 2021 CONSOLIDATED FINANCIAL STATEMENTS 86
SECTION 4.2
NET INTEREST- BEARING DEBT
Of the gross financial debt at year-end, 79% (2020: 97%) was non-current, i.e. with maturity of more than one year.
Gross financial debt amounted to DKK 28.9bn at 31 December 2021 (2020: DKK 30.3bn). Non-current borrowings totalled DKK 22.7bn (2020: DKK 29.3bn) and current borrowings totalled DKK 6.2bn (2020: DKK 1.0bn). The decrease in non-current borrowings is mainly due to a EUR 750m EMTN bond, which matures in November 2022 and is thus classified as current borrowings. The Group continuously assesses the maturity of its debt.
The difference of DKK 9.8bn between gross financial debt and net interest-bearing debt mainly comprised cash and cash equivalents and on-trade loans.
SECTION 4.3
CAPITAL STRUCTURE
4.3.1 CAPITAL STRUCTURE Management regularly assesses whether the Group’s capital structure is in the interests of the Group and its shareholders.
The overall objective is to ensure a continued development and strengthening of the Group’s capital structure that supports long-term profitable growth and a solid increase in key earnings and ratios. This includes assessment of and decisions on the split of financing between share capital and borrowings, which is a long-term strategic decision to be made in connection with significant investments and other transactions.
Carlsberg A/S’ share capital is divided into two classes (A shares and B shares). Combined with the Carlsberg Foundation’s position as majority shareholder (in terms of control), management considers that this structure will remain advantageous for all of the shareholders, enabling and supporting the long-term development of the Group.
The Group targets a leverage ratio below 2.0x. At the end of 2021, the leverage ratio was 1.24x (2020: 1.51x). The Group currently uses share buy-back programmes to return excess cash to shareholders.
The share buy-back programmes are initiated based on a cautious evaluation of the Group’s funding flexibility and credit resources available. The size and duration of each programme depend on the expected organic and inorganic investments needed to grow the business and the Group’s intention to maintain a leverage ratio below 2.0x.
The Group generally intends to cancel treasury shares that are not used for hedging of incentive programmes.
The Group is rated by Moody’s Investors Service and Fitch Ratings. Management assesses the risk of changes in the Group’s investment-grade rating as an element in strategic decisions on capital structure. Identification and monitoring of risks that could change the rating were carried out on an ongoing basis throughout the year.
4.3.2 SHARE CAPITAL At the Annual General Meeting on 15 March 2021, it was decided to reduce the share capital of Carlsberg A/S by a nominal amount of DKK 58,000,000 to a nominal amount of DKK 2,905,136,120 by cancelling 2,900,000 of the B shares held by the Company, each with a nominal value of DKK 20. The cancellation was completed on 13 April 2021. These shares had been repurchased as part of the Company’s share buy-back programme.
At the Annual General Meeting on 14 March 2022, the Supervisory Board will recommend that 3.4m treasury shares not used for the hedging of the incentive programme be cancelled.
Net interest-bearing debt
DKK million 2021 2020
Non-current borrowings 22,755 29,291
Current borrowings 6,167 959
Gross financial debt 28,922 30,250
Cash and cash equivalents -8,344 -8,093
Net financial debt 20,578 22,157
Loans to associates, interest-bearing portion -238 -209
On-trade loans, net -578 -618
Other receivables, net -600 -67
Net interest-bearing debt 19,162 21,263
Share capital Class A shares Class B shares Total share capital
Shares of DKK 20
Nominal value,
DKK ’000 Shares of
DKK 20
Nominal value,
DKK ’000 Shares of
DKK 20
Nominal value,
DKK ’000
1 January 2020 33,699,252 673,985 118,857,554 2,377,151 152,556,806 3,051,136
Cancellation of treasury shares in 2020 - - -4,400,000 -88,000 -4,400,000 -88,000
31 December 2020 33,699,252 673,985 114,457,554 2,289,151 148,156,806 2,963,136
Cancellation of treasury shares - - -2,900,000 -58,000 -2,900,000 -58,000
31 December 2021 33,699,252 673,985 111,557,554 2,231,151 145,256,806 2,905,136
A shares carry 20 votes per DKK 20 share. B shares carry two votes per DKK 20 share. A preferential right to an 8% non-cumulative dividend is attached to B shares. Apart from votes and dividends, all shares rank equally.

CARLSBERG GROUP ANNUAL REPORT 2021 CONSOLIDATED FINANCIAL STATEMENTS 87
SECTION 4.3 (CONTINUED)
CAPITAL STRUCTURE 4.3.3 EQUITY DIVIDENDS The Group proposes a dividend of DKK 24.00 per share (2020: DKK 22.00 per share), amounting to DKK 3,486m (2020: DKK 3,259m). The proposed dividend has been included in retained earnings at 31 December 2021. Dividends to be paid out in 2022 for 2021, net of dividends on treasury shares held at 31 December 2021, will amount to DKK 3,405m (paid out in 2021 for 2020: DKK 3,192m). Dividends to non-controlling interests of DKK 51m were declared and reported as payable at 31 December 2020 and paid, in addition to dividends of DKK 499m declared in 2021.
SHARE BUY-BACK AND TREASURY SHARES On 5 February 2021, the Company announced its intention to continue the share buy-back programme. The 2021 programme has been executed as quarterly programmes, and 3,355,625 B shares worth DKK 3.6bn have been repurchased in 2021. Ending with the fourth quarterly programme, which was finalised on 28 January 2022, the Company has repurchased a total of 3,715,779 B shares at a total purchase price of DKK 4.0bn over a 12-month period. According to the authorisation of the Annual General Meeting, the Supervisory Board may, in the period until 13 March 2023, allow the Company to acquire treasury shares up to a total holding of 10% of the nominal share
capital at a price quoted on Nasdaq Copenhagen at the time of acquisition with a deviation of up to 10%. The permitted holding of treasury shares covers those acquired in share buy-back programmes. The Company holds no class A shares. Transactions with shareholders in Carlsberg A/S
DKK million 2021 2020
Dividends paid to shareholders -3,187 -3,093
Share buy-back -3,600 -2,900
Total -6,787 -5,993
Transactions with non-controlling interests
DKK million 2021 2020
Dividends paid to NCI -550 -796
Consideration paid for acquisition of NCI - -81
Total -550 -877
ACCOUNTING POLICIES
Proposed dividends The proposed dividend is recognised as a liability at the date when it is adopted at the Annual General Meeting (declaration date). Treasury shares Cost of acquisition, consideration received and treasury share dividends received are recognised directly in equity as retained earnings. Capital reductions from the cancellation of treasury shares are deducted from the share capital at an amount corresponding to the nominal value of the shares and added to retained earnings. Proceeds from the sale of treasury shares in connection with the settlement of share-based payments are recognised directly in equity.
EQUITY (DKKbn)
43.4
48.8
8.0 0.6
3.3 - 3.7
- 3.6
0.9 - 0.1 Treasury shares
Fair value,
DKKm Shares of
DKK 20 Nominal
value, DKKm Percentage of share capital
1 January 2020 4,532 4,560,395 91.2 3.0%
Acquisition of treasury shares 3,290,522 65.8 2.4%
Cancellation of treasury shares -4,400,000 -88.0 -3.0%
Used to settle share-based payments -395,742 -7.9 -0.3%
31 December 2020 2,979 3,055,175 61.1 2.1%
Acquisition of treasury shares 3,355,625 67.1 2.3%
Cancellation of treasury shares -2,900,000 -58.0 -2.0%
Used to settle share-based payments -146,282 -2.9 -0.1%
31 December 2021 3,800 3,364,518 67.3 2.3%
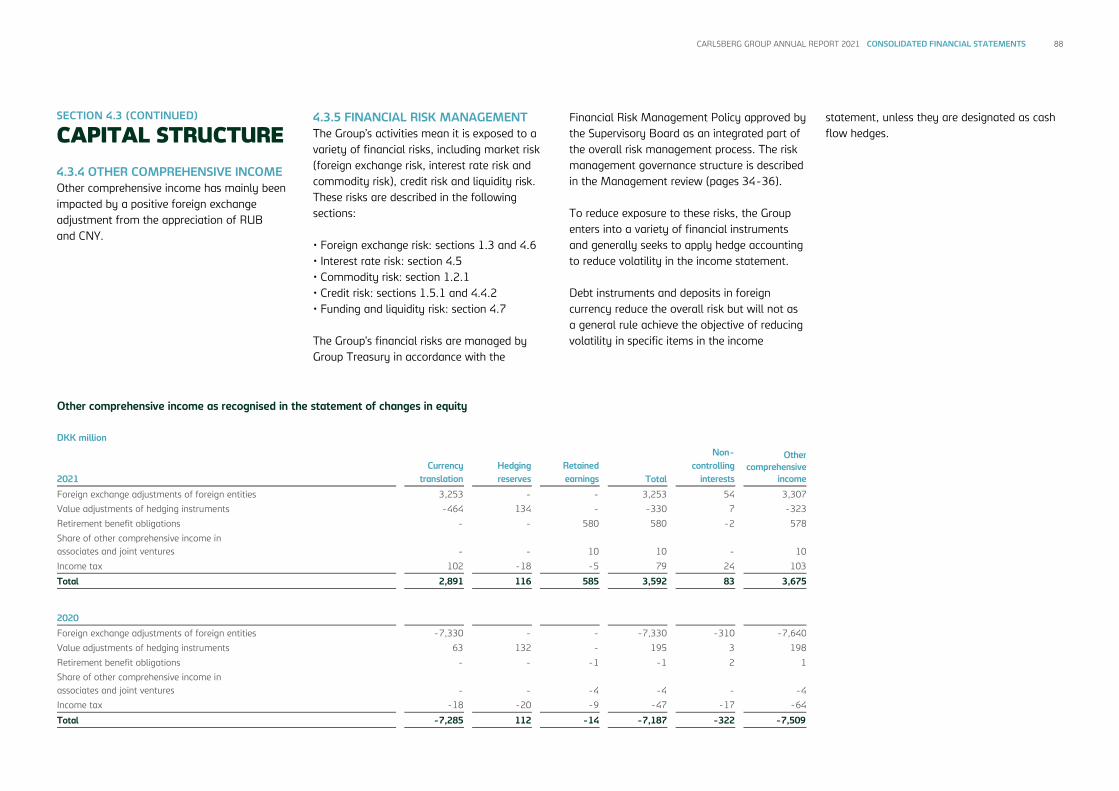
CARLSBERG GROUP ANNUAL REPORT 2021 CONSOLIDATED FINANCIAL STATEMENTS 88
SECTION 4.3 (CONTINUED)
CAPITAL STRUCTURE
4.3.4 OTHER COMPREHENSIVE INCOME Other comprehensive income has mainly been impacted by a positive foreign exchange adjustment from the appreciation of RUB and CNY.
4.3.5 FINANCIAL RISK MANAGEMENT The Group’s activities mean it is exposed to a variety of financial risks, including market risk (foreign exchange risk, interest rate risk and commodity risk), credit risk and liquidity risk. These risks are described in the following sections: • Foreign exchange risk: sections 1.3 and 4.6 • Interest rate risk: section 4.5 • Commodity risk: section 1.2.1 • Credit risk: sections 1.5.1 and 4.4.2 • Funding and liquidity risk: section 4.7 The Group’s financial risks are managed by Group Treasury in accordance with the
Financial Risk Management Policy approved by the Supervisory Board as an integrated part of the overall risk management process. The risk management governance structure is described in the Management review (pages 34-36). To reduce exposure to these risks, the Group enters into a variety of financial instruments and generally seeks to apply hedge accounting to reduce volatility in the income statement. Debt instruments and deposits in foreign currency reduce the overall risk but will not as a general rule achieve the objective of reducing volatility in specific items in the income
statement, unless they are designated as cash flow hedges.
Other comprehensive income as recognised in the statement of changes in equity DKK million
2021 Currency
translation Hedging reserves
Retained earnings Total
Non- controlling
interests
Other comprehensive
income
Foreign exchange adjustments of foreign entities 3,253 - - 3,253 54 3,307
Value adjustments of hedging instruments -464 134 - -330 7 -323
Retirement benefit obligations - - 580 580 -2 578
Share of other comprehensive income in associates and joint ventures - - 10 10 - 10
Income tax 102 -18 -5 79 24 103
Total 2,891 116 585 3,592 83 3,675
2020
Foreign exchange adjustments of foreign entities -7,330 - - -7,330 -310 -7,640
Value adjustments of hedging instruments 63 132 - 195 3 198
Retirement benefit obligations - - -1 -1 2 1
Share of other comprehensive income in associates and joint ventures - - -4 -4 - -4
Income tax -18 -20 -9 -47 -17 -64
Total -7,285 112 -14 -7,187 -322 -7,509

CARLSBERG GROUP ANNUAL REPORT 2021 CONSOLIDATED FINANCIAL STATEMENTS 89
SECTION 4.4
BORROWINGS AND CASH
4.4.1 BORROWINGS Non-current funding decreased by DKK 6.5bn, primarily due to a EUR 750m EMTN bond, which matures in November 2022 and is thus classified as current (2020: non-current) and repayment of non-current bank borrowing. Gross financial debt
DKK million 2021 2020
Non-current
Issued bonds 21,452 27,002
Bank borrowings 78 922
Lease liabilities 1,012 1,080
Other borrowings 213 287
Total 22,755 29,291
Current
Issued bonds 5,573 -
Bank borrowings 116 472
Lease liabilities 375 398
Other borrowings 103 89
Total 6,167 959
Total borrowings 28,922 30,250
Fair value 29,575 31,732
An overview of issued bonds is provided in section 4.5.
ACCOUNTING POLICIES
Borrowings Borrowings are initially recognised at fair value less transaction costs and subsequently measured at amortised cost using the effective interest method. Accordingly, the difference between the fair value less transaction costs and the nominal value is recognised under financial expenses over the term of the loan. Lease liability The lease liability is measured at the present value of the remaining lease payments at the reporting date, discounted using the incremental borrowing rate for similar assets, taking into account the terms of the leases. A remeasurement of the lease liability, for example a change in the assessment of an option to purchase, results in a corresponding adjustment of the related right-of-use assets, cf. section 2.3. Extension or termination options are included in the lease term if the lease is reasonably certain to be extended or not terminated. Consequently, all cash outflows that are reasonably certain to impact the future cash balances are recognised as lease liabilities at initial recognition of lease contracts. The Group reassesses the circumstances leading to it not recognising extension or termination options on an ongoing basis.
4.4.2 CASH Cash and cash equivalents include short-term marketable securities with a term of three months or less at the acquisition date that are subject to an insignificant risk of changes in value. Short-term bank deposits amounted to DKK 735m at 31 December 2021 (2020: DKK 353m). The average interest rate on these deposits was 3.3% (2020: 2.7%). Total cash at bank amounted to DKK 8,344m in 2021 (2020: DKK 8,093m). Cash and cash equivalents
DKK million 2021 2020
Cash and cash equivalents 8,344 8,093
Bank overdrafts - -135
Cash and cash equivalents, net 8,344 7,958
ASSESSMENT OF CREDIT RISK The Group is exposed to credit risk on cash and cash equivalents (including fixed deposits), investments and derivative financial instruments with a positive fair value due to uncertainty as to whether the counterparty will be able to meet its contractual obligations as they fall due. The Group has established a credit policy under which financial transactions may be entered into only with financial institutions with a solid credit rating, defined as BBB. Carlsberg only enters into derivatives with relationship banks, and the associated credit risk is mitigated to some extent by entering into ISDA agreements, partly because it is the same group of banks extending loans to the Group. Group Treasury manages and monitors the Group’s gross credit exposure to banks and operates with individual limits on banks, based on rating and access to netting of assets and liabilities. For some of the markets in which the Group operates and holds cash, the financial institutions do not have a BBB rating, in which case an exemption is approved by Group Treasury. EXPOSURE TO CREDIT RISK The carrying amount of DKK 8,344m (2020: DKK 8,093m) represents the maximum credit exposure related to cash and cash equivalents. The credit risk on receivables is described in section 1.5.1.
Changes in gross financial debt
DKK million 2021 2020
Gross financial debt at 1 January 30,250 24,991
Proceeds from issue of bonds - 7,402
Instalments on and proceeds from borrowings, non-current -1,001 1,155
Instalments on and proceeds from borrowings, current -216 -3,264
Instalments on lease liabilities -405 -414
Other 11 181
External financing -1,611 5,060
Change in bank overdrafts -135 62
Increase in lease liabilities, net 275 190
Other, including foreign exchange adjustments and amortisation 143 -53
Gross financial debt at 31 December 28,922 30,250

CARLSBERG GROUP ANNUAL REPORT 2021 CONSOLIDATED FINANCIAL STATEMENTS 90
SECTION 4.5
INTEREST RATE RISK
The Group’s exposure to interest rate risk is considered limited. At the reporting date, 106% of the net financial debt consisted of fixed-rate borrowings with interest rates fixed for more than one year (2020: 127%), and on a gross basis 75% was at fixed interest rates (2020: 93%). As 123% of the Group’s net debt is in EUR, and EUR accounts for the predominant part of the fixed-rate borrowing, the interest rate exposure primarily relates to the development in the interest rates for EUR. The interest rate risk is measured by the duration of the net financial debt. The target is
to have a duration between three and eight years. At 31 December 2021, the duration was 4.8 years (2020: 5.6 years). Interest rate risk is mainly managed using fixed-rate bonds. SENSITIVITY ANALYSIS It is estimated that a 1 percentage-point interest rate increase would lead to a decrease in interest expenses of DKK 11m (2020: DKK 60m). The impact relates to a relatively high percentage of the gross debt being at fixed interest rates and the high portion of cash. The analysis assumes a parallel shift in the relevant yield curves. If the market interest rate had been 1 percentage point higher at the reporting date, it would have led to a financial gain of DKK
997m (2020: DKK 1,242m), and a similar loss had the interest rate been 1 percentage point lower. However, since all fixed-rate borrowings are measured at amortised cost, there is no impact on other comprehensive income or the income statement. The sensitivity analysis is based on the financial instruments recognised at the reporting date. The sensitivity analysis assumes a parallel shift in interest rates and that all other variables remain constant, in particular foreign exchange rates and interest rate differentials between the different currencies. The analysis was
performed on the same basis as for 2020. The Group did not enter into any new interest rate swaps in 2021 or 2020.
Net financial debt by currency
DKK million
2021 Gross
financial debt Net
financial debt Fixed
Gross financial debt,
fixed % Net financial
debt, fixed %1
EUR 27,598 25,227 21,515 78% 85%
CNY 35 -2,777 - 0% 0%
USD 413 42 194 47% 462%
Other 876 -1,914 9 1% 0%
Total 28,922 20,578 21,718 75% 106%
2020
EUR 27,731 24,298 27,084 98% 111%
CNY 864 -1,058 826 96% -78%
USD 495 119 268 54% 225%
Other 1,160 -1,202 - 0% -
Total 30,250 22,157 28,178 93% 127%
¹The percentage of net debt at fixed interests are above 100% in some currencies, as the total cash exceeds the current debt. In some currencies the percentage of net debt at fixed interests is negative, as the total cash exceeds the total debt.
Interest rate risk
DKK million
2021 Interest
rate
Average effective interest
rate Fixed for Carrying amount
Interest rate risk
Issued bonds
EUR 750m maturing 15 November 2022 Fixed 2.7% < 1 year 5,573 Fair value
EUR 500m maturing 6 September 2023 Fixed 0.7% 1-2 years 3,708 Fair value
EUR 1,000m maturing 28 May 2024 Fixed 2.6% 2-3 years 7,411 Fair value
EUR 500m maturing 30 June 2027 Fixed 0.5% > 5 years 3,694 Fair value
EUR 400m maturing 1 July 2029 Fixed 1.0% > 5 years 2,945 Fair value
EUR 500m maturing 11 March 2030 Fixed 0.7% > 5 years 3,694 Fair value
Total issued bonds 1.6% 27,025
Total issued bonds 2020 1.6% 27,002
Bank borrowings and other borrowings
Floating-rate Floating 1.1% < 1 year 1,628 Cash flow
Fixed-rate Fixed 0.9% > 1 year 269 Fair value
Total bank borrowings and other borrowings 1,897
Total bank borrowings and other borrowings 2020 3,248

CARLSBERG GROUP ANNUAL REPORT 2021 CONSOLIDATED FINANCIAL STATEMENTS 91
SECTION 4.6
FOREIGN EXCHANGE RISK RELATED TO NET INVESTMENTS AND FINANCING ACTIVITIES
4.6.1 CURRENCY PROFILE OF BORROWINGS The Group is exposed to foreign exchange risk on borrowings denominated in a currency other than the functional currency of the local entities reporting the debt, as well as the risk that arises when net cash inflow is generated in one currency and loans are denominated and have to be repaid in another currency.
4.6.2 HEDGING OF NET INVESTMENTS IN FOREIGN SUBSIDIARIES The Group holds a number of investments in foreign subsidiaries where the translation of net assets to DKK is exposed to foreign exchange risks. The Group hedges part of this foreign exchange exposure by entering into forward exchange contracts (FX forwards and NDF) and designates these as net investment hedges. This mainly applies to net investments in CHF, CNY, MYR and NOK. The basis for hedging is reviewed at least once a year, and the two parameters, risk reduction and cost, are balanced. In economic terms, having debt in foreign currency or creating synthetic debt via forward exchange contracts constitutes hedging of the DKK value of future cash flows arising from operating activities or specific transactions. The most significant net risk relates to foreign exchange adjustment of net investments in RUB. This is because of the size of the net investments in RUB combined with the currency’s high volatility.
Where the fair value adjustments of forward exchange contracts do not exceed the fair value adjustments of the investment, the adjustments of the financial instruments are recognised in other comprehensive income. All forward exchange contracts mature during 2022. At 31 December 2021, all adjustments of financial instruments have been recognised in other comprehensive income. Fair value adjustments of loans designated as strategic intra-group loans have also been recognised in other comprehensive income. The fair value of derivatives used as net investment hedges recognised at 31 December 2021 amounted to DKK -232m (2020: DKK 84m). The closing balance in the equity reserve for currency translation of hedges of net investments amounted to DKK -1,885m (2020: DKK -1,611m). Positive fair values of derivatives are recognised as other receivables and negative values as other liabilities.
4.6.3 EXCHANGE RATE RISK ON CASH AND BORROWINGS The main principle for funding of subsidiaries is that cash and borrowings should be denominated in local currency or hedged to local currency to avoid foreign exchange risk. However, in some Group entities, net debt is denominated in a currency other than the functional currency of the local entity without the foreign exchange risk being hedged. This applies primarily to a few entities in Central & Eastern Europe that hold cash and loans in EUR and USD and in this way obtain proxy hedging of the foreign exchange risk associated with the purchase of goods in foreign currency in these markets.
Currency profile of borrowings
Before and after derivative financial instruments
DKK million
2021 Original principal
Effect of swap
After swap
CHF 116 1,347 1,463
NOK 181 589 770
EUR 27,598 -6,285 21,313
USD 413 1,541 1,954
CNY 35 1,921 1,956
Other 579 887 1,466
Total 28,922 - 28,922
Total 2020 30,250 - 30,250
Net investment hedges 2021 2020
Hedging of investment,
amount in local currency Intra-group loans,
amount in local currency Other comprehensive
income (DKK) Average hedged rate Fair value of derivatives Fair value of derivatives
DKK million 2021 2020 2021 2020 2021 2020 2021 2020 Asset Liability Asset Liability
CNY -2,407 -2,407 - - -323 -29 0.9611 0.9176 - -109 56 -
MYR -292 -292 - - -28 24 1.5022 1.5145 - -15 8 -
HKD - - -1,079 -1,077 -64 53 - - - - - -
CHF -263 -305 - - -80 6 6.8305 6.9925 - -93 40 -
NOK -1,300 -1,300 3,000 3,000 62 -105 0.7269 0.6874 - -19 - -19
SEK - - 2,717 3,773 -42 86 - - - - - -
Other -175 -135 67 47 11 28 - - 4 - - -1
Total -464 63 4 -236 104 -20

CARLSBERG GROUP ANNUAL REPORT 2021 CONSOLIDATED FINANCIAL STATEMENTS 92
SECTION 4.6 (CONTINUED)
FOREIGN EXCHANGE RISK RELATED TO NET INVESTMENTS AND FINANCING ACTIVITIES
4.6.4 IMPACT ON FINANCIAL STATEMENTS AND SENSITIVITY ANALYSIS IMPACT ON INCOME STATEMENT For the impact of currency on operating profit and financial items, please refer to sections 1.3 and 4.1 respectively. IMPACT ON STATEMENT OF FINANCIAL POSITION Fluctuations in foreign exchange rates will affect the level of debt, as funding is obtained in a number of currencies. In 2021, net interest-bearing debt decreased by DKK 368m (2020: increased by DKK 297m) due to changes in foreign exchange rates. SENSITIVITY ANALYSIS An adverse development in the exchange rates would, all other things being unchanged, have had the hypothetical impact on the income statement and other comprehensive income (OCI) for 2021 illustrated in the tables. The calculations have been made based on items in the statement of financial position at 31 December 2021.
Income statement The hypothetical impact ignores the fact that the subsidiaries’ initial recognition of revenue, cost and debt would be similarly exposed to the exchange rate developments. Other comprehensive income Other comprehensive income is affected by changes in the fair value of currency derivatives designated as cash flow hedges of future purchases.
Exchange rate sensitivity - other comprehensive income 2021 2020
DKK million Average
hedged rate Notional amount Change
Effect on OCI
Average hedged rate
Effect on OCI
NOK/DKK 0.7189 -773 5% -39 0.6913 -33
SEK/DKK 0.7284 -603 5% -30 0.7078 -33
PLN/DKK 1.6039 -521 5% -26 1.6649 -25
CHF/DKK 6.9171 -449 5% -22 6.9217 -23
RUB/DKK 0.0822 -1,278 10% -128 0.0854 -14
USD/DKK 6.3627 661 5% 33 5.9934 2
Other N/A -240 5% -12 N/A -15
Total -224 -141
Exchange rate sensitivity - income statement
2021 2020
DKK million EUR
receivable EUR
payable EUR cash
Gross exposure
Exposure, net of hedging Change
Effect on P/L
Effect on P/L
EUR/GBP 550 -485 -934 -870 -870 5% -43 -14
EUR/NOK 172 -769 318 -278 -278 5% -14 -8
EUR/RUB 9 -106 68 -28 -28 10% -3 21
EUR/CHF 140 -222 232 150 150 5% 7 10
EUR/UAH - -88 218 131 131 10% 13 7
Total -40 16
2020
2021 USD
receivable USD
payable USD cash
Gross exposure
Exposure, net of hedging Change
Effect on P/L
Effect on P/L
USD/LAK 13 -98 150 65 65 10% 6 5
USD/KZT - -3 101 98 98 10% 10 14
USD/UAH - -1 89 89 89 10% 9 9
Total 25 28

CARLSBERG GROUP ANNUAL REPORT 2021 CONSOLIDATED FINANCIAL STATEMENTS 93
SECTION 4.6 (CONTINUED)
FOREIGN EXCHANGE RISK RELATED TO NET INVESTMENTS AND FINANCING ACTIVITIES APPLIED EXCHANGE RATES The average exchange rate was calculated using the monthly exchange rates weighted according to the phasing of the revenue per currency throughout the year.
SECTION 4.7
FUNDING AND LIQUIDITY RISK
Liquidity risk results from the Group’s potential inability to meet the obligations associated with its financial liabilities, for example settlement of financial debt and paying suppliers. The Group's overall objective is to ensure continuous access, at the right price, to the financial resources needed for operations and growth. The aim is to ensure effective liquidity management, which involves obtaining sufficient committed credit facilities to ensure adequate financial resources and, to some extent, tapping a range of funding sources.
DIVERSIFIED FUNDING SOURCES The Group is diversifying its access to funding to avoid relying on one single source of funding. The Group still has access to a committed EUR 2bn revolving credit facility (RCF) maturing in 2026 that is currently not being utilised. In addition, the Group has committed cash pool bank overdraft facilities to cover the day-to-day liquidity needs and uncommitted access to the Euro Commercial Paper (ECP) market, which provides short-term funding. At 31 December 2021, bonds accounted for 93% of the gross funding.
FUNDING STRATEGY AND REACTION TO COVID-19 Since March 2020 and the first COVID-19 lockdowns in Western Europe, the Group has maintained an increased focus on liquidity and a special effort has been made to improve cash flow forecasting, including introducing frequent short-term cash flow updates. CREDIT RESOURCES AVAILABLE The Group uses the term “credit resources available” to determine the adequacy of access to credit facilities. The credit resources available include cash and unutilised credit facilities with more than 12
Applied exchange rates
Closing rate Average rate
DKK 2021 2020 2021 2020
Swiss franc (CHF) 7.1760 6.8521 6.8777 6.9656
Chinese yuan (CNY) 1.0296 0.9284 0.9700 0.9452
Euro (EUR) 7.4365 7.4393 7.4369 7.4539
Pound sterling (GBP) 8.8604 8.2378 8.6837 8.3838
Laotian kip (LAK) 0.0006 0.0007 0.0006 0.0007
Norwegian krone (NOK) 0.7459 0.7053 0.7323 0.6958
Polish zloty (PLN) 1.6180 1.6327 1.6310 1.6770
Russian rouble (RUB) 0.0894 0.0820 0.0855 0.0915
Swedish krona (SEK) 0.7260 0.7397 0.7330 0.7120
Ukrainian hryvnia (UAH) 0.2416 0.2142 0.2311 0.2438
Committed credit facilities and credit resources available
DKK million
2021
Total committed loans and
credit facilities
Utilised portion of
credit facilities
Unutilised credit
facilities
2020 Unutilised
credit facilities
Current
< 1 year 7,316 6,167 1,149 1,186
Total current committed loans and credit facilities 7,316 6,167 1,149 1,186
Non-current
1-2 years 4,198 4,198 - -
2-3 years 7,599 7,599 - -
3-4 years 82 82 - -
4-5 years 14,936 62 14,874 14,879
> 5 years 10,814 10,814 - -
Total non-current committed loans and credit facilities 37,629 22,755 14,874 14,879
Cash and cash equivalents 8,344 8,093
Current portion of utilised credit facilities - - -6,167 -959
Credit resources available (total non-current committed loans and credit facilities less net debt) 17,051 22,013

CARLSBERG GROUP ANNUAL REPORT 2021 CONSOLIDATED FINANCIAL STATEMENTS 94
SECTION 4.7 (CONTINUED)
FUNDING AND LIQUIDITY RISK
months to maturity less utilised credit facilities with less than 12 months to maturity and uncommitted working capital facilities.
Net financial debt is used internally to monitor the Group’s credit resources available. Net financial debt is the Group’s net interest-bearing debt, excluding interest-bearing assets other than cash, as these assets are not actively managed in relation to liquidity risk. Net financial debt is shown in section 4.2.
At 31 December 2021, the Group had total credit resources available of DKK 17,051m, consisting of cash and cash equivalents of DKK 8,344m plus committed unutilised non-current credit facilities of DKK 14,874m less utilisation of current facilities of DKK 6,167m. Including current credit facilities of DKK 1,149m, total committed unutilised credit facilities amounted to DKK 16,023m.
Credit resources available decreased by DKK 5.0bn compared with 2020, primarily due to the EUR 750m EMTN bond maturing in November 2022.
The credit resources available and the access to unused committed credit facilities are considered reasonable in light of the Group’s current needs in terms of financial flexibility.
The Group uses cash pools for day-to-day liquidity management in most of its entities in Western Europe, as well as intra-group loans to subsidiaries. Central & Eastern Europe and Asia are less integrated in terms of cash pools, and liquidity is managed via intra-group loans. For some markets in Asia, intra-group loans are not possible, and surplus liquidity will be paid out in the form of dividends, which results in a time lag between when the cash flow is generated and when it becomes available for repayment of Group debts. The most significant cash balances related to this delay are in China.
The table lists the contractual maturities of financial liabilities, including estimated interest
payments and excluding the impact of netting agreements, and thus summarises the gross liquidity risk.
The risk implied by the values reflects the one-sided scenario of cash outflows only. Trade payables and other financial liabilities originate from the financing of assets in ongoing operations, such as property, plant and equipment, and investments in working capital, for example inventories and trade receivables.
The nominal amount/contractual cash flow of gross financial debt totalled DKK 29,098m (2020: DKK 30,426m), whereas the total carrying amount was DKK 28,922m (2020: DKK 30,250m). The difference between these amounts arises at initial recognition and is treated as a cost that is capitalised and amortised over the duration of the borrowings.
The interest expense is the contractual cash flows expected on the gross financial debt existing at 31 December 2021.
The cash flow is estimated based on the notional amount of the above-mentioned borrowings and expected interest rates at year-end 2021 and 2020. Interest on debt recognised at year-end 2021 and 2020 for which no contractual obligation exists (current borrowing and cash pools) has been included for a two-year period. The synthetic interest on lease liabilities has also been included for a two-year period. The interest applied to the part of the debt where no contractual obligation exists is 1.5% (2020: 2.5%). The decrease is due to the lower CNY-denominated borrowings at the end of the year and the interest on these borrowings being higher than the borrowings at the end of 2021.
Time to maturity for non-current borrowings
DKK million
2021 1-2 years 2-3 years 3-4 years 4-5 years > 5 years Total
Issued bonds 3,708 7,411 - - 10,333 21,452
Bank borrowings 68 4 5 1 - 78
Lease liabilities 322 87 76 60 467 1,012
Other non-current borrowings 100 97 1 1 14 213
Total 4,198 7,599 82 62 10,814 22,755
Total 2020 6,730 3,959 7,701 75 10,826 29,291
Maturity of financial liabilities
DKK million
2021 Contractual cash flows
Maturity < 1 year
Maturity > 1 year
< 5 years Maturity > 5 years
Carrying amount
Derivative financial instruments
Derivative financial instruments, payables 428 428 - - 315
Non-derivative financial instruments
Gross financial debt 29,098 6,182 12,013 10,903 28,922
Interest expenses 1,134 424 562 148 N/A
Trade payables and other liabilities 22,146 22,146 - - 22,146
Contingent liabilities 224 224 - - 224
Contingent considerations 4,254 3,818 436 - 4,254
Non-derivative financial instruments 56,856 32,794 13,011 11,051 -
Financial liabilities 57,284 33,222 13,011 11,051 -
Financial liabilities 2020 55,690 19,881 24,682 11,127 -

CARLSBERG GROUP ANNUAL REPORT 2021 CONSOLIDATED FINANCIAL STATEMENTS 95
SECTION 4.8
DERIVATIVE FINANCIAL INSTRUMENTS
The Group enters into various derivative financial instruments to hedge foreign exchange and commodity risks, cf. sections 1.2 and 1.3, and seeks to apply hedge accounting when this is possible. Hedging of future, highly probable forecast transactions is designated as cash flow hedges. The Group monitors the cash flow hedge relationships twice a year to assess whether the hedge is still effective.
Positive fair values of derivatives are recognised as other receivables and negative values as other payables. The impact on other comprehensive income and the fair value of derivatives classified as cash flow hedges is presented in the cash flow hedge table. The impact on other comprehensive income from other instruments relates to hedges of Group entities’ exposure to changes in aluminium prices. The impact on other comprehensive income from exchange rate instruments relates to hedges of Group entities’ purchases and sales in currencies other than their functional currencies.
As of 31 December 2021, the hedging reserve within equity included DKK 843m in relation to cash flow hedges for which hedge accounting is no longer applied. Fair value adjustments of derivative financial instruments that are not designated either as net investment hedges or as cash flow hedges are recognised in financial income and expenses.
ACCOUNTING ESTIMATES AND JUDGEMENTS
When entering into financial instruments, management assesses whether the instrument is an effective hedge of recognised assets and liabilities, expected future cash flows or financial investments. The effectiveness of recognised hedging instruments is assessed at least twice a year. Fair values of derivative financial instruments are calculated on the basis of level 2 input consisting of current market data and generally accepted valuation methods. Internally calculated values are used, and these are compared with external market quotes on a quarterly basis. For currency and aluminium derivatives, the calculation is as follows: a) The forward market rate is compared with the
agreed rate on the derivatives, and the difference in cash flow at the future point in time is calculated.
b) The amounts are discounted to present value. When entering into a contract, management assesses whether the contract contains embedded derivatives and whether they meet the criteria for separate classification and recognition. The Group currently does not have any embedded derivatives that meet the criteria for separate classification and recognition.
Financial derivatives not designated as hedging instruments (economic hedges)
DKK million
2021 Income
statement Fair value
receivables Fair value payables
Fair value, net
Exchange rate instruments -27 86 -32 54
Ineffectiveness 4 - - -
Total -23 86 -32 54
2020 Exchange rate instruments -47 - -78 -78
Ineffectiveness -2 - - -
Total -49 - -78 -78
Cash flow hedges
DKK million Expected
recognition
2021
Other comprehensive income
Fair value receivables
Fair value payables
Fair value, net 2022
Exchange rate instruments -20 13 -47 -34 -34
Other instruments 161 240 - 240 240
Total 141 253 -47 206 206
2020
Other comprehensive income
Fair value receivables
Fair value payables
Fair value, net 2021
Exchange rate instruments 51 13 -21 -8 -8
Other instruments 84 60 - 60 60
Total 135 73 -21 52 52

CARLSBERG GROUP ANNUAL REPORT 2021 CONSOLIDATED FINANCIAL STATEMENTS 96
SECTION 4.8 (CONTINUED)
DERIVATIVE FINANCIAL INSTRUMENTS
ACCOUNTING POLICIES
Derivative financial instruments are initially recognised at fair value on the trade date and subsequently remeasured at their fair value at the reporting date. The accounting for subsequent changes in fair value depends on whether the derivative is designated as one of: • Fair value hedges of the fair value of recognised
assets or liabilities • Cash flow hedges of particular risks associated with
the cash flow from forecast transactions • Net investment hedges of currency fluctuations in
subsidiaries, associates or joint ventures. The fair values of derivative financial instruments are presented in other receivables or payables, and positive and negative values are offset only when the Group has the right and the intention to settle several financial instruments net. Changes in the fair value of a fair value hedge and of derivative financial instruments not designated in a hedge relationship are recognised in financial income or expenses in the income statement. Changes in the effective portion of the fair value of derivative financial instruments that are designated and qualify as a cash flow hedge are recognised in the hedging reserve within equity. When the hedged transaction materialises, amounts previously recognised in other comprehensive income are transferred to the same item as the hedged item.
Derivatives designated as and qualifying for recognition as a cash flow hedge of financial investments are recognised in other comprehensive income. On complete or partial disposal of the financial investment, the portion of the hedging instrument that is recognised in other comprehensive income and relates to that financial investment is recognised in the income statement when the gain or loss on disposal is recognised. Hedges of net investments in foreign subsidiaries, associates and joint ventures are accounted for in the same way as cash flow hedges.

CARLSBERG GROUP ANNUAL REPORT 2021 CONSOLIDATED FINANCIAL STATEMENTS 97
Wernes-grüner Acquired the German brewer Wernesgrüner and expanded the production network needed for the German business.
Marston’s brewing activities Successfully integrated Carlsberg UK and Marston’s brewing activities.
Gorkha Brewery Ceased consolidation in connection with dispute with local partner, which is currently unlawfully blocking the Group’s exercise of its rights in Nepal.
SECTION 5.1
INVESTMENT MODEL AND RISKS MARKET ACCESS In the beer industry, access to local markets is highly dependent on establishing good relationships with customers in the on- and off-trade channels, national distributors, local suppliers and relevant authorities governing the beverage industry. Often, the most efficient way of establishing such relations is by acquiring a local brewer or engaging with a local partner that already has the relevant relationships. When the Group expands its business to new geographies, it often therefore does so in collaboration with a local partner. Such a partnership can take different legal forms and impacts the consolidated financial statements accordingly. In addition to its activities in the beer industry, the Group operates in the soft drinks industry, an industry dominated by large global brand owners. The Group is engaged in long-term contractual partnerships to produce, distribute and sell third-party soft drink brands. In addition to granting the right to produce, the
brand owners usually provide recipes and/or raw materials, while the Group has the necessary production capabilities and distribution platform. INVESTMENT MODEL Entering into a partnership can reduce the financial exposure and mitigate the business risks associated with entering new markets or expanding the activities in an existing market. The financial exposure, however, varies depending on the structure of the partnership. Business and financial success, and the related risks, depend on the ability of the Group and the local partner to forge a strong and aligned cooperation. In some markets, the Group enters as a non-controlling shareholder, providing a degree of financing and contributing knowledge of the beer industry. The Group thus leaves control with the partner and recognises the investment as an associate. Other investments are structured as joint ventures, where the Group and the local partner jointly make the operational decisions and share strategic and tactical responsibility. More commonly, the Group structures its partnerships such that it exercises management
control, usually by way of majority of the voting rights. These investments are fully consolidated subsidiaries, which are just as important as other types of partnership for success in the local markets, but mean that the Group has increased financial exposure. Investments in businesses in which the Group exercises management control often involve put and/or call options or a similar structure. IMPACT ON FINANCIAL STATEMENTS Investments in associates and joint ventures are consolidated in the financial statements using the equity method. The accounting risks associated with these entities are limited to the investment made, the proportionate share of the net profit and any specific additional commitments to banks or other parties, as well as specific guarantees or loans the Group provides to the partnership. In businesses where the Group exercises management control, the consolidated financials are impacted by full exposure to the earnings and other financial risks. From an accounting point of view, the Group treats any put options held by partners in such entities as if they had already been exercised by the partner, i.e. anticipating that the acquisition will occur. The accounting impact is that the non-controlling interests are not recognised, and no
SECTION 5
ACQUISITIONS, DISPOSALS, ASSOCIATES AND JOINT VENTURES

CARLSBERG GROUP ANNUAL REPORT 2021 CONSOLIDATED FINANCIAL STATEMENTS 98
SECTION 5.1 (CONTINUED)
INVESTMENT MODEL AND RISKS
part of net profits or equity is attributed to them. Instead, the dividends received by the partner from the business are classified as financial expenses for the purpose of accounting. Common to all partnerships is the risk of disagreement and, ultimately, dissolution. Disagreements with partners on the operational management and strategic directions of partnerships may limit our ability to manage the growth and risk profile of our business. The Group continuously seeks to promote a fair and mutually beneficial development of the partnerships, which is crucial to be successful. However, in certain partnerships the partners’ pursuit of goals and priorities that are different from those of the Group might result in disagreements, affecting operational and financial performance. Different goals and priorities of this kind can become more pronounced in the period when a partner has the right to exit the partnership. A dissolution will initially impact the accounting treatment of an investment. The accounting treatment will depend on whether the Group or its partner is exiting the business. In the long term, however, the impact can be significant to the operation of the local entity and the collaboration with customers, distributors, authorities etc. if the partner was instrumental in managing these relationships. The risk of a partnership dissolution may therefore have a
negative impact on the underlying business and the financial performance recognised in the consolidated financial statements. The Group is involved in many partnerships, one being the 67% shareholding in Carlsberg South Asia Pte Ltd. ("CSAPL"), Singapore, which is the parent company of the Group’s activities in India (100%) and Nepal (90%). The company is jointly owned with a partner (33%). According to the Shareholders’ Agreement, the partner has a put option to sell its shares to Carlsberg, in the put option window, which is open until late 2023, although the Group disputes the partners’ right to exercise the put option. For the purpose of the consolidated financial statements, the put option is accounted for as if it had already been exercised. CSAPL and its investments in India and Nepal are therefore included in the consolidated financial statements, with no profits or equity attributed to the non-controlling shareholder. Please refer to section 5.4 for a further description of the dispute with the partner in CSAPL. Partnerships in the soft drinks industry are based on long-term contractual agreements, and they come to an end when the contract terminates. The termination of a significant partnership with a global soft drink brand owner would have a negative impact on the Group’s financial performance.
SECTION 5.2
ACQUISITIONS AND DISPOSALS ACQUISITION OF ENTITIES Wernesgrüner Brewery In January 2021, Carlsberg acquired 100% of the German Wernesgrüner Brewery for a cash consideration of DKK 511m. The purpose of the acquisition was to strengthen the Group’s presence in the beer market in eastern Germany and to provide
additional brewing capacity for the existing Carlsberg business in northern Germany. The calculated goodwill represents staff competences and synergies from expected optimisations of supply chain and procurement, the increase in market share and access to new customers. The purchase price allocation of the fair value of identified assets, liabilities and contingent liabilities was completed in 2021, resulting in recognition of goodwill of DKK 267m.
DKK million Wernesgrüner
Brewery Marston's
brewing activities
Consideration paid 511 1,868
Fair value of contingent consideration - 61
Fair value of non-controlling shareholding in Carlsberg UK transferred to the seller - 588
Foreign exchange translation difference - 12
Total cost of acquisition 511 2,529
Acquired assets and liabilities
Goodwill 267 1,760
Brands and other intangibles assets 123 514
Property, plant and equipment 193 881
Inventories 21 228
Trade and other receivables 16 478
Assets held for sale - 96
Cash and cash equivalents 14 -
Borrowings and lease liabilities -1 -212
Provisions and retirement benefit obligations -17 -17
Deferred tax liabilities -61 -111
Trade payables -15 -302
Other payables -29 -273
Acquired assets and liabilities 511 3,042
Non-controlling interests - -513
Acquired assets and liabilities attributable to shareholders in Carlsberg A/S 511 2,529

CARLSBERG GROUP ANNUAL REPORT 2021 CONSOLIDATED FINANCIAL STATEMENTS 99
SECTION 5.2 (CONTINUED)
ACQUISITIONS AND DISPOSALS Marston’s brewing activities In October 2020, Carlsberg UK and Marston’s PLC injected their respective brewing activities into a jointly owned company, Carlsberg Marston’s Brewing Company Limited, with Carlsberg as the controlling shareholder with a 60% shareholding. The jointly owned company was formed to strengthen the Group’s presence in the important UK market through a stronger beer portfolio. The calculated goodwill represents staff competences and synergies from expected optimisations of sales and distribution, supply chain and procurement, possible product innovations, the increase in market share and access to new customers. The total cost of the acquisition comprised the cash consideration paid, a contingent consideration and the fair value of the 40% of Carlsberg UK businesses that were effectively transferred to Marston’s PLC when the Carlsberg entities were injected into the jointly owned company. In 2021, net payments of contingent consideration and settlement of purchase price adjustments amounted to DKK 204m. The purchase price allocation of the fair value of identified assets, liabilities and contingent liabilities was completed in 2021, resulting in recognition of goodwill of DKK 1,760m. The comparative figures have not been restated.
Other In 2021, the Group completed a minor acquisition of DKK 14m. ACQUISITION OF BRAND RIGHTS In 2020, the Group acquired the Brooklyn brand rights in its markets for a purchase price of DKK 804m. The brand rights are recognised as an intangible asset. DECONSOLIDATION OF ENTITIES The local shareholder owning 10% of the shares in Gorkha Brewery, Nepal, is a related party to the Group’s 33% partner in CSAPL. In addition to the ongoing disputes with our partner in CSAPL regarding India and Nepal, there is also a dispute with the local 10% shareholder in Gorkha Brewery. Contrary to the Group’s legal and contractual rights, the Group’s influence on the business operations in Nepal is currently being restricted through actions that hamper its right of decision-making and insight into the business. We are contesting these actions in Nepal through the local courts and anticipate that the operations and management of the Nepalese business will eventually be normalised in line with the Group’s legal and contractual rights, cf. Section 3.4. However, until its rights as majority shareholder are re-established, the Group has decided to cease full consolidation of the Nepalese business. The assets, liabilities and non-controlling interests of the company were derecognised with effect from the end of 2021. The investment was remeasured at fair value and recognised as the cost of an investment in an associate. The remeasurement to fair value less cumulative foreign exchange differences
reclassified from equity to the income statement amounted to DKK 38m and was recognised in special items. The derecognition did not have a material impact on the consolidated statement of financial position. CASH FLOW Cash flow to acquire or dispose of shareholdings in associates and when gaining control of subsidiaries is included in financial investments, while the cash flow on acquisition of an additional shareholding in a subsidiary, i.e. acquiring non-controlling interests, is presented in financing activities. Elements of cash consideration paid and received
DKK million 2021 2020
Consideration paid for acquisition of entities -228 -1,908
Prepayment for acquisition of entities not completed at the reporting date - -501
Consideration received for disposal of entities 21 -
Cash and cash equivalents acquired/disposed of -428 -
Acquisition and disposal of entities, net -635 -2,409
Consideration paid for acquisition of associates -52 -
Consideration received for disposal of associates - 8
Acquisition and disposal of associates, net -52 8
Consideration paid for acquisition of non-controlling interests - -81
Cash flow from acquisition of shareholdings, total -687 -2,482
ACCOUNTING ESTIMATES AND JUDGEMENTS
Assessment of control The classification of entities where Carlsberg controls less than 100% of the voting rights is based on an assessment of the contractual and operational relationship between the parties. This includes assessing the conditions in shareholder agreements, contracts etc. Consideration is also given to the extent to which each party can govern the financial and operating policies of the entity, how the operation of the entity is designed, and which party possesses the relevant knowledge and competences to operate the entity. Another factor relevant to this assessment is the extent to which each of the parties can direct the activities and affect the returns, for example by means of rights, reserved matters or casting votes. Purchase price allocation procedures For acquisitions of entities, the assets, liabilities and contingent liabilities of the acquiree are recognised using the acquisition method. The most significant assets acquired generally comprise goodwill, brands, property, plant and equipment, receivables and inventories. No active market exists for the majority of the acquired assets and liabilities, in particular in respect of acquired intangible assets. Accordingly, management makes estimates of the fair value of acquired assets, liabilities and contingent liabilities. Depending on the nature of the item, the determined fair value of an item may be associated with uncertainty and possibly adjusted subsequently. The unallocated purchase price (positive amount) is recognised in the statement of financial position as goodwill and allocated to the Group’s cash-generating units. Brands The value of the brands acquired and their expected useful life are assessed based on the individual brand’s market position, expected long-term developments in the relevant markets and profitability.
CARLSBERG GROUP ANNUAL REPORT 2021 CONSOLIDATED FINANCIAL STATEMENTS 100
SECTION 5.2 (CONTINUED)
ACQUISITIONS AND DISPOSALS The estimated value includes all future cash flows associated with the brand, including the related value of customer relations etc. Management determines the useful life based on the brand’s relative local, regional and global market strength, market share, and the current and planned marketing efforts that are helping to maintain and increase its value. When the value of a well-established brand is expected to be maintained for an indefinite period in the relevant markets, and these markets are expected to be profitable for a long period, the useful life of the brand is determined to be indefinite. Brands are measured using the relief from royalty method, under which the expected future cash flows are based on key assumptions about expected useful life, royalty rate, growth rate and the theoretical tax effect. A post-tax discount rate is used that reflects the risk-free interest rate with the addition of a risk premium associated with the particular brand. The model and assumptions applied are consistent with those used in impairment testing, and are described in further detail in section 2.2.3. Customer agreements and portfolios The value of acquired customer agreements and customer portfolios is assessed based on the local market and trading conditions. For most entities, there is a close relationship between brands and sales. Consumer demand for beer and other beverages drives sales, and therefore the value of a brand is closely linked to consumer demand, while there is no separate value attached to customers (shops, bars etc.), as their choice of products is driven by consumer demand. The relationship between brands and customers is carefully considered so that brands and customer agreements are not both recognised on the basis of the same underlying cash flows.
Property, plant and equipment The fair value of land and buildings, and standard production and office equipment is based, as far as possible, on the fair value of assets of similar type and condition that may be bought and sold in the open market. Property, plant and equipment for which there is no reliable evidence of the fair value in the market (in particular breweries, including production equipment) are valued using the depreciated replacement method. This method is based on the replacement cost of a similar asset with similar functionality and capacity. The calculated replacement cost is then reduced to reflect functional and physical obsolescence. The expected synergies and the user-specific intentions for the expected use of assets are not included in the determination of the fair value. Completed purchase price allocations Management believes that the purchase prices for Wernesgrüner Brewery and Marston’s brewing activities, which are accounted for in the consolidated financial statements, reflect the best estimate of the total fair value of these businesses and the proportionate value of identified assets, liabilities and contingent liabilities of the non-controlling interests, and accordingly the allocation of goodwill to controlling interests, but not to non-controlling interests. The purchase price allocations of the identified assets, liabilities and contingent liabilities were completed within 12 months of the acquisitions. The main revaluation adjustments related to the value of brands, property, plant and equipment, and deferred tax liabilities, which mainly related to brands. Goodwill Goodwill was allocated to the Western Europe CGU in line with the allocation of the Group’s existing German and UK business. The goodwill is not deductible for tax purposes.
Wernesgrüner Brewery Brands The value of brands was estimated using the Group’s principles described above. A brand with a fair value of DKK 113m was recognised and classified as an intangible asset with an indefinite useful life. Property, plant and equipment The fair value and expected useful life of the brewery equipment and related buildings of the acquired brewery were determined with assistance from external engineering experts in the brewery industry and resulted in a positive revaluation adjustment of DKK 53m. Financial impact of acquisition Revenue and net profit included in the consolidated financial statements since the acquisition at 1 January 2021 were DKK 156m and DKK 7m respectively. Marston’s brewing activities Brands The value of the brands was estimated using the Group’s principles described above. Brands with a fair value of DKK 514m were recognised and classified as intangible assets with an indefinite useful life. Property, plant and equipment The fair value and expected useful life of the brewery equipment and related buildings of the six acquired breweries were determined with assistance from external engineering experts in the brewery industry and resulted in a negative revaluation adjustment of DKK 209m. Draught equipment located with the on-trade customers was as per contractual agreement to be resold to a third-party service provider after the acquisition, and the equipment was therefore transferred to assets held for sale at the expected sales price, resulting in a negative revaluation adjustment of DKK 128m. Trade loans and receivables The fair value of the trade loans and receivables was estimated in line with the Group’s principles for assessment of credit risk and recognition of impairment losses to reflect the amount that is expected to be collected. The valuation took into
consideration losses in the on-trade segment due to the restrictions and lockdowns during the pandemic. Financial impact of acquisition The impact on revenue and net profit for 2020 from the acquisition in late October 2020 was not material. The impact on the financials had it been consolidated on 1 January 2020 is impracticable to obtain as the acquired activities were not previously a separate reporting entity.
ACCOUNTING POLICIES
Acquisitions The acquisition date is the date when the Group effectively obtains control of an acquired subsidiary or significant influence over an associate or a joint venture. The cost of a business combination comprises the fair value of the consideration agreed upon, including the fair value of any consideration contingent on future events. Goodwill and fair value adjustments in connection with the acquisition of an entity are treated as assets and liabilities belonging to the foreign entity and translated into the foreign entity’s functional currency at the exchange rate at the transaction date. The acquired entities’ identifiable assets, liabilities and contingent liabilities are measured at fair value at the acquisition date. Identifiable intangible assets are recognised if they are separable or arise from a contractual right. Deferred tax on revaluations is recognised. The identifiable assets, liabilities and contingent liabilities on initial recognition at the acquisition date are subsequently adjusted up until 12 months after the acquisition. The effect of the adjustments is recognised in the opening balance of equity, and the comparative figures are restated accordingly if the amount is material.

CARLSBERG GROUP ANNUAL REPORT 2021 CONSOLIDATED FINANCIAL STATEMENTS 101
SECTION 5.2 (CONTINUED)
ACQUISITIONS AND DISPOSALS Changes in estimates of contingent purchase considerations are recognised in the income statement under special items, unless they qualify for recognition directly in equity.
Disposals and loss of control Gains or losses on the disposal or liquidation of subsidiaries, associates and joint ventures are recognised as the difference between any sales price and the carrying amount of net assets (including goodwill) at the date of disposal or liquidation, foreign exchange adjustments recognised in other comprehensive income, and costs to sell or liquidation expenses.
The shareholding retained after the loss of control of subsidiaries is remeasured at fair value and accounted for as the fair value on initial recognition of a financial asset or the cost of an investment in an associate or joint venture. Gains or losses on the loss of control of subsidiaries are recognised as the difference between the fair value of the retained shareholding and the carrying amount of the derecognised net assets (including goodwill) at the date of loss of control and foreign exchange adjustments recognised in other comprehensive income.
SECTION 5.3
NON-CONTROLLING INTERESTS DECONSOLIDATION OF GORKHA BREWERY In 2021, the Group decided to cease full consolidation of Gorkha Brewery, Nepal. The assets, liabilities and non-controlling interests of the company were derecognised with effect from the end of 2021. The non-controlling interests’ share of the net assets amounted to DKK -101m.
MATERIAL ASSET RESTRUCTURING IN CHINA In December 2020, Carlsberg and Chongqing Brewery Co. completed an asset restructuring and contributed their respective controlled Chinese assets to Carlsberg Chongqing Breweries Company.
Carlsberg Chongqing Breweries Company is jointly owned by Chongqing Brewery Co. (51%) and the Carlsberg Group (49%). The ownership remains unchanged following the completion of the restructuring, and the Group’s ownership of the listed company Chongqing Brewery Co. is also unchanged at 60%. The Group thereby holds 79% of Carlsberg Chongqing Breweries Company.
At completion, the Group’s ownership of the assets it injected (previously 70-100% owned) thereby declined to 56-79%, while the Group’s ownership of the assets injected by Chongqing Brewery Co. increased from 60% to 79%. Effectively, the transactions thereby exchange shareholdings of the injected entities between the Group and the non-controlling shareholders
in Chongqing Brewery Co. The transaction was accounted for as a transaction with non-controlling interests and resulted in a net increase in equity for non-controlling interests and a corresponding decrease for shareholders in Carlsberg A/S of DKK 553m.
MARSTON’S BREWING ACTIVITIES In October 2020, Carlsberg UK and Marston’s PLC injected their respective brewing activities into a jointly owned company named Carlsberg Marston’s Brewing Company Limited. The transaction is further described in section 5.2.
Carlsberg is the controlling shareholder in the joint venture with a shareholding of 60%, having transferred 40% of its businesses in the UK.
The fair value of the transferred shareholding is part of the total consideration paid for the brewing activities injected by Marston’s PLC. At completion, the transferred shareholding impacted the allocation of equity between shareholders in Carlsberg A/S and non-controlling interests by DKK 827m.
Transactions with non-controlling interests
DKK million Changes in equity
2021 Shareholders in Carlsberg A/S
Non-controlling interests Total equity
Change in ownership of non-controlling interests 16 -16 -
Fair value adjustments of contingent consideration 941 - 941
Recognised in equity 957 -16 941
Deconsolidation of Gorkha Brewery Ltd. - -101 -101
Disposal of 40% of Carlsberg UK to Marston's Group -57 97 40
Purchase price allocation adjustments allocated to the non-controlling interest in Marston's brewing activities - 34 34
Acquisition and deconsolidation of entities -57 30 -27
2020
Change in ownership from asset restructuring in China -553 553 -
Transaction cost related to asset restructuring in China -51 -26 -77
Fair value adjustments of contingent consideration and other transactions with non-controlling interests 3,748 87 3,835
Recognised in equity 3,144 614 3,758
Disposal of 40% of Carlsberg UK to Marston's -182 730 548
Non-controlling interest in Marston's brewing activities retained by Marston's - 479 479
Acquisition of entities -182 1,209 1,027

CARLSBERG GROUP ANNUAL REPORT 2021 CONSOLIDATED FINANCIAL STATEMENTS 102
SECTION 5.4
CONTINGENT CONSIDERATIONS
Contingent considerations relate to options held by non-controlling interests in subsidiaries to sell their shares to the Group and to deferred payments in the acquisition of entities contingent on market conditions.
At the end of the reporting period, the contingent considerations primarily related to put options on the shares in CSAPL, the parent company holding 100% and 90% of the shares in the businesses in India and Nepal respectively, in Brewery Alivaria, Belarus, and in minor craft breweries in Western and Central & Eastern Europe.
In accordance with the Group’s accounting policy, shares subject to put options are consolidated as if the shares had already been acquired. The ownership percentage at which these subsidiaries are consolidated therefore differs from the legal ownership interest retained by the Group. Both the legal and the consolidated ownership are stated in section 10.
The carrying amount of contingent considerations is determined in accordance with the terms and conditions agreed with the holders of the options.
Of the contingent considerations, DKK 0.4bn (2020: DKK 5.2bn) is expected to fall due after more than 12 months.
PUT OPTION FOR SHARES IN CARLSBERG SOUTH ASIA PTE LTD (CSAPL) To prepare the Group’s best estimate of the fair value of the put option on the partner-owned 33% shareholding in CSAPL, a discounted cash flow model with a 10-year forecast period is applied with cash flows beyond the 10-year period extrapolated using a terminal period growth rate. The terminal growth rate is equal to the future inflation forecasted by IMF with the addition of a spread allowing for future growth in excess of inflation. The cash flows are estimated as the cash flows available to the shareholders in the parent company after deduction of withholding taxes on dividends and royalties. The forecasted cash flows consider current market conditions and expectations of the future development of the beer markets in India and Nepal, investment requirements etc. The cash flows are discounted by a weighted average cost of
capital obtained from an external provider specialising in business valuations. The recognised liability is measured as the average of two valuations.
Assumptions India Nepal
Discount rate 11.4% 16.0%
Terminal period growth rate 5.0% 6.4%
Compound annual growth rate in earnings after tax 15.2% 12.2%
The fair value of the put option decreased by DKK 1.0bn in 2021 due to the impact of COVID-19 on the Indian and Nepalese businesses, such as declining sales due to lockdowns and other restrictions, the increasing cost of raw and packaging materials, and increasing interest rates. The magnitude of the decline is dependent on the extent of government actions and support, and the expected time to return to pre-pandemic market conditions and earnings.
Although the Group disputes the partner’s right to exercise the put option, it is accounted for in accordance with the Shareholders’ Agreement until an arbitration award potentially results in a change in accounting treatment. The put option is therefore accounted for as if it were exercisable at 31 December 2021 at the discretion of the partner and has been reclassified from non-current to current liabilities. The put option window is open until late 2023. Please refer to section 3.4 for a further description of the dispute with the partner.
The Group previously called in a loan made to the partner in CSAPL, the loan having become due and payable in full. In January 2022, the Singapore court of appeal finally confirmed that the loan with interest is repayable by the partner to Carlsberg in full, totalling DKK 328m.
PAYMENT OF CONTINGENT CONSIDERATIONS In 2021, the deferred contingent consideration for the acquisition of Marston’s brewing activities was settled in cash with Marston’s PLC at DKK 247m. The fair value adjustments since initial recognition were recognised in special items, DKK 129m (2020: DKK 50m).
ACCOUNTING ESTIMATES AND JUDGEMENTS
The fair value of contingent considerations linked to put options is calculated on the basis of level 3 input consisting of non-observable data, such as entity-specific discount rates and industry-specific expectations of price developments, and generally accepted valuation methods, including discounted cash flows and multiples.
Estimates are based on updated information since initial recognition of the contingent consideration, including new budgets and sales forecasts, discount rates etc. The assumptions applied are in line with those used in the impairment tests as described in section 2.2 but reflecting the different models and valuation techniques required. The fair values of other contingent considerations are measured at the expected future price of selected shares. Contingent considerations
DKK million 2021 2020
Contingent considerations at 1 January 5,290 9,023
Additions 16 61
Payments -247 -1
Fair value adjustments -805 -3,793
Contingent considerations at 31 December 4,254 5,290

CARLSBERG GROUP ANNUAL REPORT 2021 CONSOLIDATED FINANCIAL STATEMENTS 103
SECTION 5.4 (CONTINUED
CONTINGENT CONSIDERATIONS
ACCOUNTING POLICIES
On acquisition of non-controlling interests, i.e. subsequent to the Group obtaining control, acquired net assets are not measured at fair value. The difference between the cost and the non-controlling interests’ share of the total carrying amount, including goodwill, is transferred from the non-controlling interests’ share of equity to equity attributable to shareholders in Carlsberg A/S. The amount deducted cannot exceed the non-controlling interests’ share of equity immediately before the transaction.
On disposal of shareholdings to non-controlling interests, the difference between the sales price and the share of the total carrying amount, including goodwill acquired by the non-controlling interests, is transferred from equity attributable to shareholders in Carlsberg A/S to the non-controlling interests’ share of equity.
Fair value adjustments of put options granted to non-controlling interests are recognised directly in the statement of changes in equity.
Other contingent considerations (earn-outs), which are not linked to a future transfer of additional shareholdings, are measured in accordance with the terms of the contract with the seller. The revaluation of such contingent considerations is recognised in special items.
SECTION 5.5
ASSOCIATES AND JOINT VENTURES
Investments in associates and joint ventures include the businesses in Portugal (60%) and Myanmar (58%), Gorkha Brewery (90%), Carlsberg Byen in Denmark (25%) and four associates in China (50%). The total investment in these associates amounted to DKK 3,407m at 31 December 2021 (2020: DKK 2,589m).
The Group’s ownership of Super Bock, Portugal, is 60%. Nevertheless, Super Bock remains an associate of the Group due to the ownership structure. Please refer to section 10 for further details.
In 2021, disputes with the local non-controlling shareholder prevented the Group from exercising its rights as a controlling shareholder in Gorkha Brewery, Nepal. The Group decided to cease full consolidation of the company from 31 December 2021 and it was therefore reclassified as an associate and recognised at fair value, DKK 1,188m, cf. section 5.2.
Despite the legal 58% ownership share in Myanmar Carlsberg, the entity is classified as an associate due to the structure of the agreement with the partner and the environment in the country.
In 2021, disputes with the partner regarding the management of Tibet Lhasa Brewery meant that the Group lost its significant influence in the company. The investment was therefore reclassified from associates to other
financial investments. The disputes resulted in significant disturbances to the operation of the company, which negatively impacted the financial performance. The investment was therefore written down to its recoverable amount, cf. section 2.2.
For associates in which the Group holds an ownership interest of less than 20%, the Group participates in the management of the company and is therefore exercising significant influence.
None of the associates and joint ventures are material to the Group.
Fair value of investment in listed associates
DKK million 2021 2020
The Lion Brewery Ceylon, Sri Lanka 355 382
ACCOUNTING POLICIES
Investments in associates and joint ventures are recognised according to the equity method, which entails measurement at cost and adjustment for the Group’s share of the profit or loss and other comprehensive income of the associate after the date of acquisition. The share of the result must be calculated in accordance with the Group’s accounting policies. The proportionate share of unrealised intra-group profits and losses is eliminated. Investments in associates and joint ventures with negative net asset values are measured at DKK 0.
If the Group has a legal or constructive obligation to cover a deficit in the associate or joint venture, the deficit is recognised under provisions. Any amounts owed by associates and joint ventures are written down to the extent that the amount owed is deemed irrecoverable.
Key figures for associates and joint ventures
DKK million Carlsberg Group share
2021 Profit
after tax
Other comprehensive
income
Total comprehensive
income
Investments in associates and joint ventures
Associates 336 10 346 5,173
Joint ventures - - - -1
Total 336 10 346 5,172
2020
Associates 315 -4 311 4,191
Joint ventures - - - -3
Total 315 -4 311 4,188

CARLSBERG GROUP ANNUAL REPORT 2021 CONSOLIDATED FINANCIAL STATEMENTS 104
21.7% TAX RATE Tax rate is down from 24.7% in 2020, mainly as a result of special items.
SECTION 6.1
INCOME TAX
The nominal weighted tax rate for the Group is calculated as domestic tax rates applicable to profits in the entities as a proportion of each entity’s share of the Group’s profit before tax.
The Group’s total tax cost was DKK 51m (2020: DKK 354m) higher than the Group’s nominal weighted tax expense. The nominal weighted tax expense was negatively impacted by withholding taxes (particularly on dividends), non-deductible expenses (particularly marketing expenses and intercompany charges) and positively impacted by the non-taxable and non-deductible transactions in special items, resulting in an effective tax rate of 21.7% (2020: 24.7%).
The positive impact from special items comprised primarily non-taxable reversal of provisions made in prior years. Excluding special items and tax hereon the effective tax rate would be 23.5% (2020: 25.7%).
It is not possible to deduct all interest and fair value adjustments arising in Denmark due to thin capitalisation rules. Therefore, tax on such adjustments fluctuates from year to year.
ACCOUNTING POLICIES
Income tax comprises current tax and changes in deferred tax for the year, including changes as a result of a change in the tax rate. The tax expense relating to the profit/loss for the year is recognised in the income statement, while the tax expense relating to items recognised in other comprehensive income is recognised in the statement of comprehensive income.
If the Group obtains a tax deduction on computation of the taxable income in Denmark or in foreign jurisdictions as a result of share-based payment programmes, the tax effect of the programmes is recognised in tax on profit/loss for the year. However, if the total tax deduction exceeds the total expense, the tax benefit of the excess deduction is recognised directly in equity.
SECTION 6
TAX
Reconciliation of the effective tax rate for the year
2021 2020
% DKK million % DKK million
Nominal weighted tax rate 21.2 2,168 20.8 1,879
Change in tax rate -0.1 -14 0.1 9
Adjustments to tax for prior years -0.3 -34 0.4 40
Non-capitalised tax assets and liabilities 0.5 55 1.5 138
Non-taxable income -0.7 -75 -0.7 -59
Non-deductible expenses 3.4 344 1.6 148
Tax incentives etc. -0.1 -13 -0.5 -45
Special items -2.4 -239 - -3
Withholding taxes 1.3 132 1.9 167
Other, including tax in associates and joint ventures -1.1 -105 -0.4 -41
Effective tax rate for the year 21.7 2,219 24.7 2,233
Effective tax rate for the year, excluding the effect of non-taxable and non-deductible transactions in special items 23.5 - 25.7 -

CARLSBERG GROUP ANNUAL REPORT 2021 CONSOLIDATED FINANCIAL STATEMENTS 105
SECTION 6.1 (CONTINUED)
INCOME TAX SECTION 6.2
TAX ASSETS AND LIABILITIES
Of the total deferred tax assets recognised, DKK 43m (2020: DKK 201m) related to tax loss carryforwards, the utilisation of which depends on future positive taxable income exceeding the realised deferred tax liabilities.
It is management’s opinion that these tax loss carryforwards can be utilised.
Tax assets not recognised of DKK 1,373m (2020: DKK 936m) primarily relates to tax losses that are not expected to be utilised in the foreseeable future. Of these, tax losses that will not expire amounted to DKK 1,042m (2020: DKK 581m). The remaining tax losses of DKK 331m (2020: DKK 355m) will expire within five years.
Deferred tax of DKK 39m (2020: DKK 41m) was recognised in respect of the tax of 5% payable on planned dividends from certain entities in Central & Eastern Europe.
Planned distribution of reserves for other subsidiaries will not trigger a significant tax liability based on current tax legislation.
Income tax expenses
2021 2020
DKK million Income
statement
Other comprehensive
income
Total comprehensive
income Income
statement
Other comprehensive
income
Total comprehensive
income
Tax for the year can be specified as follows
Current tax 2,418 -83 2,335 2,024 22 2,046
Change in deferred tax and non-current tax payables during the year -151 -20 -171 160 42 202
Change in deferred tax as a result of change in tax rate -14 - -14 9 - 9
Adjustments to tax for prior years -34 - -34 40 - 40
Total 2,219 -103 2,116 2,233 64 2,297
Tax recognised in other comprehensive income
2021 2020
DKK million
Recognised item
before tax
Tax income/ expense After tax
Recognised item
before tax
Tax income/ expense After tax
Foreign exchange adjustments -3,307 - -3,307 7,640 - 7,640
Hedging instruments 323 -83 240 -198 22 -176
Retirement benefit obligations -578 -20 -598 -1 42 41
Share of other comprehensive income in associates and joint ventures -10 - -10 4 - 4
Total -3,572 -103 -3,675 7,445 64 7,509

CARLSBERG GROUP ANNUAL REPORT 2021 CONSOLIDATED FINANCIAL STATEMENTS 106
SECTION 6.2 (CONTINUED)
TAX ASSETS AND LIABILITIES
Changes in deferred tax and non-current tax payables for the year amounted to DKK 151m (2020: DKK 160m).
Non-current tax liabilities recognised in the statement of financial position
DKK million 2021 2020
Deferred tax liabilities 6,350 4,779
Non-current tax payables - 1,486
Non-current tax liabilities at 31 December 6,350 6,265
ACCOUNTING ESTIMATES AND JUDGEMENTS
The Group recognises deferred tax assets, including the expected tax value of tax loss carryforwards, if management assesses they can be offset against positive taxable income in the foreseeable future. This judgement is made annually and based on budgets and business plans for the coming years, including planned commercial initiatives.
Carlsberg operates in a large number of tax jurisdictions where tax legislation is highly complex and subject to interpretation. Management makes judgements on uncertain tax positions to ensure recognition and measurement of tax assets and liabilities.
ACCOUNTING POLICIES
Current tax payable and receivable are recognised in the statement of financial position as tax computed on the taxable income for the year, adjusted for tax on the taxable income of prior years and for tax paid on account respectively.
Deferred tax on all temporary differences between the carrying amount and the tax base of assets and liabilities is measured using the balance sheet liability method. However, deferred tax is not recognised on temporary differences relating to goodwill that is not deductible for tax purposes or on office premises and other items where temporary differences, apart from business combinations, arise at the acquisition date without affecting either profit/loss for the year or taxable income.
Where alternative tax rules can be applied to determine the tax base, deferred tax is measured based on the planned use of the asset or settlement of the liability. Deferred tax is recognised on expected dividend payments from subsidiaries, associates and joint ventures in countries levying withholding tax on distributions.
Deferred tax assets related to tax loss carryforwards are recognised under other non-current assets at the expected value of their utilisation, either as a set-off against tax on future income or as a set-off against
deferred tax liabilities in the same legal tax entity and jurisdiction.
Deferred tax assets and tax liabilities are offset if the entity has a legally enforceable right to offset current tax liabilities and tax assets or intends either to settle current tax liabilities and tax assets or to realise the assets and settle the liabilities simultaneously. Deferred tax assets are recognised only to the extent that it is probable that the assets will be utilised.
Deferred tax is measured according to the tax rules at the reporting date and at the tax rates applicable when the deferred tax is expected to materialise as current tax.
The change in deferred tax as a result of changes in tax rates is recognised in the income statement. Changes to deferred tax on items recognised in other comprehensive income are, however, recognised in other comprehensive income.
Changes to non-current tax assets and liabilities
DKK million 2021 2020
Tax assets and liabilities at 1 January, net 4,498 4,509
Adjustments to prior years -34 107
Acquisition of entities 172 -
Recognised in other comprehensive income -20 42
Recognised in the income statement, net -151 160
Change in tax rate -14 9
Foreign exchange adjustments -23 -329
Tax assets and liabilities at 31 December, net 4,428 4,498
Recognised as follows
Tax liabilities 6,350 6,265
Tax assets -1,922 -1,767
Tax assets and liabilities at 31 December, net 4,428 4,498
Specification of deferred tax
Deferred tax assets Deferred tax liabilities
DKK million 2021 2020 2021 2020
Intangible assets 519 388 3,451 3,280
Property, plant and equipment 220 281 1,635 1,583
Current assets 453 386 19 25
Provisions and retirement benefit obligations 2,395 1,932 2,942 1,337
Fair value adjustments 34 35 45 10
Tax losses 43 201 - -
Total before offset 3,664 3,223 8,092 6,235
Offset -1,742 -1,456 -1,742 -1,456
Deferred tax assets and liabilities at 31 December 1,922 1,767 6,350 4,779
Expected to be used as follows
Within one year 1,097 964 835 1,701
After more than one year 825 803 5,515 3,078
Total 1,922 1,767 6,350 4,779

CARLSBERG GROUP ANNUAL REPORT 2021 CONSOLIDATED FINANCIAL STATEMENTS 107
Pensions Defined benefit obligations were affected by the asset celling in Switzerland and higher discount rates across all markets as a result of the pandemic.
EMPLOYEES BY SEGMENT (%)
EMPLOYEES BY FUNCTION (%)
SECTION 7.1
STAFF COSTS
Staff costs increased in 2021, mainly due to higher performance-related payouts because of the good financial performance in 2021 and cycling of reversal of retirement provisions in China in 2020.
Severance payments were lower due to fewer redundancies than in 2020.
The average number of employees decreased in 2021 as the full-year effects of restructuring projects initiated in 2020 were felt. This was partly offset by the inclusion of Marston’s and Wernesgrüner personnel.
Western Europe 26% (22%)Asia 36% (38%)Central & Eastern Europe 36% (38%)Other 2% (2%)
2021
(2020)
Production 32% (31%)Sales & Distribution 58% (59%)Administration 10% (10%)
2021
(2020)
SECTION 7
STAFF COSTS AND REMUNERATION
Staff costs
DKK million 2021 2020
Salaries and other remuneration 8,531 7,841
Severance payments 81 177
Social security costs 1,287 1,172
Retirement benefit costs – defined contribution plans 335 303
Retirement benefit costs – defined benefit plans 188 -19
Share-based payments 82 66
Other employee benefits 93 91
Total 10,597 9,631
Average number of employees 39,375 40,010
Staff costs are included in the following line items in the income statement
Cost of sales 2,896 2,672
Sales and distribution expenses 5,500 5,087
Administrative expenses 2,020 1,902
Other operating activities, net 118 68
Financial expenses (pensions) 42 -189
Special items (restructurings) 21 91
Total 10,597 9,631
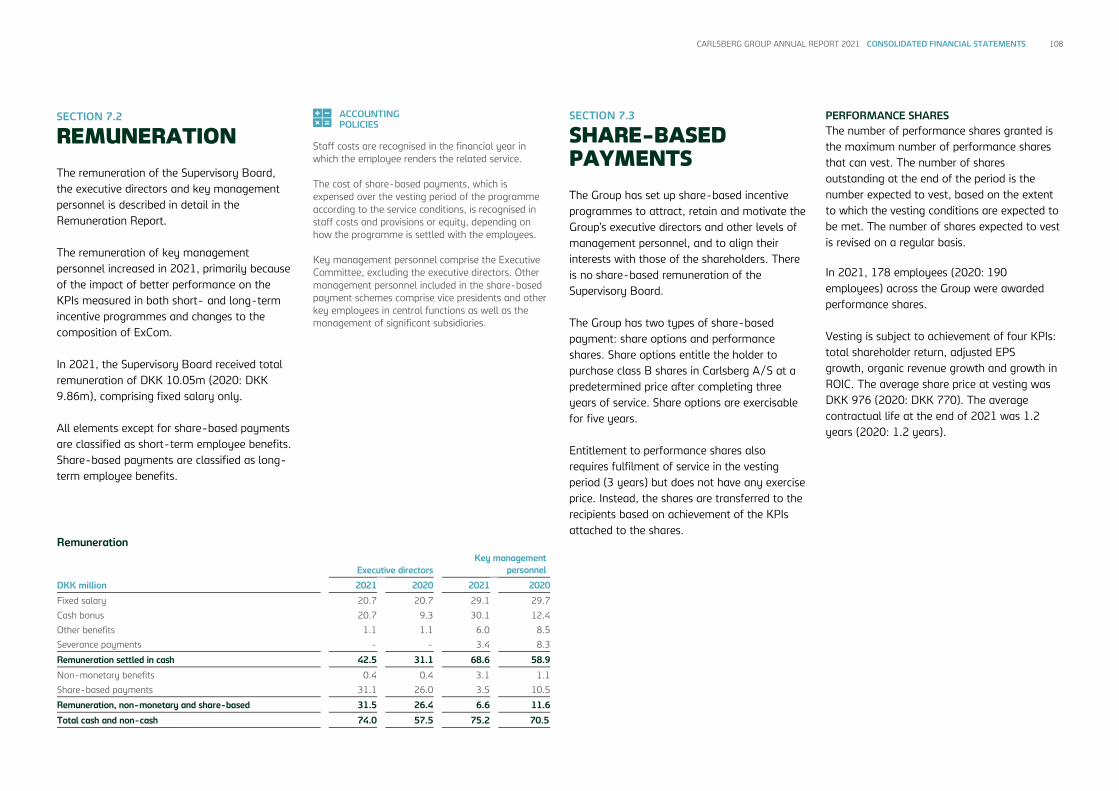
CARLSBERG GROUP ANNUAL REPORT 2021 CONSOLIDATED FINANCIAL STATEMENTS 108
SECTION 7.2
REMUNERATION
The remuneration of the Supervisory Board, the executive directors and key management personnel is described in detail in the Remuneration Report. The remuneration of key management personnel increased in 2021, primarily because of the impact of better performance on the KPIs measured in both short- and long-term incentive programmes and changes to the composition of ExCom. In 2021, the Supervisory Board received total remuneration of DKK 10.05m (2020: DKK 9.86m), comprising fixed salary only. All elements except for share-based payments are classified as short-term employee benefits. Share-based payments are classified as long-term employee benefits.
ACCOUNTING POLICIES
Staff costs are recognised in the financial year in which the employee renders the related service. The cost of share-based payments, which is expensed over the vesting period of the programme according to the service conditions, is recognised in staff costs and provisions or equity, depending on how the programme is settled with the employees. Key management personnel comprise the Executive Committee, excluding the executive directors. Other management personnel included in the share-based payment schemes comprise vice presidents and other key employees in central functions as well as the management of significant subsidiaries.
SECTION 7.3
SHARE-BASED PAYMENTS
The Group has set up share-based incentive programmes to attract, retain and motivate the Group’s executive directors and other levels of management personnel, and to align their interests with those of the shareholders. There is no share-based remuneration of the Supervisory Board. The Group has two types of share-based payment: share options and performance shares. Share options entitle the holder to purchase class B shares in Carlsberg A/S at a predetermined price after completing three years of service. Share options are exercisable for five years. Entitlement to performance shares also requires fulfilment of service in the vesting period (3 years) but does not have any exercise price. Instead, the shares are transferred to the recipients based on achievement of the KPIs attached to the shares.
PERFORMANCE SHARES The number of performance shares granted is the maximum number of performance shares that can vest. The number of shares outstanding at the end of the period is the number expected to vest, based on the extent to which the vesting conditions are expected to be met. The number of shares expected to vest is revised on a regular basis. In 2021, 178 employees (2020: 190 employees) across the Group were awarded performance shares. Vesting is subject to achievement of four KPIs: total shareholder return, adjusted EPS growth, organic revenue growth and growth in ROIC. The average share price at vesting was DKK 976 (2020: DKK 770). The average contractual life at the end of 2021 was 1.2 years (2020: 1.2 years).
Remuneration
Executive directors Key management
personnel
DKK million 2021 2020 2021 2020
Fixed salary 20.7 20.7 29.1 29.7
Cash bonus 20.7 9.3 30.1 12.4
Other benefits 1.1 1.1 6.0 8.5
Severance payments - - 3.4 8.3
Remuneration settled in cash 42.5 31.1 68.6 58.9
Non-monetary benefits 0.4 0.4 3.1 1.1
Share-based payments 31.1 26.0 3.5 10.5
Remuneration, non-monetary and share-based 31.5 26.4 6.6 11.6
Total cash and non-cash 74.0 57.5 75.2 70.5

CARLSBERG GROUP ANNUAL REPORT 2021 CONSOLIDATED FINANCIAL STATEMENTS 109
SECTION 7.3 (CONTINUED)
SHARE-BASED PAYMENTS Share options No share options have been granted since 2016. The outstanding options are all exercisable at the end of the reporting period. The average contractual life was 1.7 years (2020: 2.8 years).
Share option disclosures DKK million 2021 2020
Fair value at 31 December 70 52
ACCOUNTING ESTIMATES AND JUDGEMENTS
The volatility of performance shares is based on the historical volatility of the price of Carlsberg A/S’ class B shares over the previous three years. For share options, the volatility is based on similar data over the previous eight years. The share price and the exercise price of share options are calculated as the average price of Carlsberg A/S’ class B shares on Nasdaq Copenhagen during the first five trading days after publication of Carlsberg A/S’ financial statements. The risk-free interest rate is based on Danish government bonds of the relevant maturity. The expected life is based on exercise at the end of the exercise period.
ACCOUNTING POLICIES
The fair value of granted performance shares is estimated using a stochastic (quasi-Monte Carlo) valuation model of market conditions and a Black-Scholes call option-pricing model of other conditions, taking into account the terms and conditions upon which the performance shares were granted. On initial recognition of performance shares, an estimate is made of the number of awards expected to vest and subsequently revised for any changes. Accordingly, recognition is based on the number of awards that ultimately vest.
Key information Performance shares
2021 2020
Assumptions
Expected volatility 23.3%/23.7% 16.0%/21.0%
Risk-free interest rate 0.0% 0.0%
Expected dividend yield 0.0/2.2% 0.0/3.0%
Expected life, years 3.0 3.0
Fair value at measurement date DKK 512-961 DKK 567-894
Share options Exercise price Number
Fixed, weighted average
Executive directors
Other management
personnel Total
31 December 2019 518 114,984 - 114,984
31 December 2020 518 114,984 - 114,984
31 December 2021 518 114,984 - 114,984
Performance shares
Executive directors
Key management
personnel
Other management
personnel Total
31 December 2019 189,405 98,248 616,987 904,640
Granted 48,991 22,550 130,515 202,056
Forfeited/adjusted -28,919 -16,970 -160,696 -206,585
Exercised/settled -66,865 -49,277 -307,465 -423,607
31 December 2020 142,612 54,551 279,341 476,504
Granted 50,805 15,800 126,068 192,673
Forfeited/adjusted/transferred -13,027 -13,202 -84,575 -110,804
Exercised/settled -44,212 -17,022 -85,048 -146,282
31 December 2021 136,178 40,127 235,786 412,091
Performance share disclosures
Regular Fund &
Grow
DKK million 2021 2020 2020
Fair value at grant date 110 91 -
Cost of shares granted in the year 34 30 -
Total cost of performance shares 82 56 10
Cost not yet recognised 147 132 7
Fair value at 31 December 454 458 -

CARLSBERG GROUP ANNUAL REPORT 2021 CONSOLIDATED FINANCIAL STATEMENTS 110
SECTION 7.4
RETIREMENT BENEFIT OBLIGATIONS AND SIMILAR OBLIGATIONS
A number of employees are covered by retirement benefit plans. The nature of the plans varies depending on labour market conditions in the individual countries. Benefits are generally based on wages and salaries and length of employment. Retirement benefit obligations cover both present and future retirees’ entitlement to retirement benefits. DEFINED CONTRIBUTION PLANS A defined contribution plan is a post-employment benefit plan under which the Group pays contributions to a separate independent company. The Group’s legal or constructive obligation is limited to the contributions. 64% (2020: 61%) of the Group’s retirement benefit costs related to defined contribution plans. In 2021, the expense recognised in relation to these contributions was DKK 335m (2020: DKK 303m). DEFINED BENEFIT PLANS A defined benefit plan guarantees employees a certain level of pension benefits for life. The pension is based on seniority and salary at the time of retirement. The Group assumes the risk
associated with future developments in interest rates, inflation, mortality and disability etc. The most significant plans are in the UK and Switzerland, representing 50% and 38% respectively (2020: 50% and 38%), while the eurozone countries represented 5% (2020: 5%) of the gross obligation at 31 December 2021. The majority of the obligations are funded, with assets placed in independent pension funds, mainly in Switzerland and the UK. The largest part of the plan assets are based on a quoted market price. In some countries, primarily Germany, Sweden and China, the obligation is unfunded. The retirement benefit obligations for these unfunded plans amounted to DKK 1,562m (2020: DKK 1,589m) or 11% (2020: 12%) of the gross obligation. In 2021, the Group’s obligation, net, on defined benefit plans decreased by DKK 589m compared with 2020. The change was primarily driven by the effect of the asset ceiling in Switzerland, DKK 129m, and changes in the acturial assumptions mainly due to increased discount rates across all markets, which decreased the gross obligation.
Obligation, net 2021 2020
DKK million
Present value of
obligation
Fair value of plan assets
Obligation, net
Present value of
obligation
Fair value of plan assets
Obligation, net
Obligation at 1 January 13,588 10,654 2,934 13,771 10,472 3,299
Recognised in the income statement
Current service cost 183 - 183 223 - 223
Past service cost 5 - 5 -242 - -242
Net interest on the net defined benefit obligation (asset) 138 99 39 160 114 46
Total 326 99 227 141 114 27
Remeasurements Gain/loss from changes in demographic assumptions -29 - -29 51 - 51
Gain/loss from changes in financial assumptions -114 564 -678 682 734 -52
Asset ceiling - -129 129 - - -
Total -143 435 -578 733 734 -1
Other changes Contributions to plans - 253 -253 - 182 -182
Benefits paid -685 -596 -89 -608 -504 -104
Acquisition and disposal of entities, net -5 - -5 - - -
Transfers - - - -28 7 -35
Foreign exchange adjustments etc. 770 661 109 -421 -351 -70
Total 80 318 -238 -1,057 -666 -391
Obligation at 31 December 13,851 11,506 2,345 13,588 10,654 2,934
The total return on plan assets for the year amounted to DKK 663m (2020: DKK 848m).

CARLSBERG GROUP ANNUAL REPORT 2021 CONSOLIDATED FINANCIAL STATEMENTS 111
SECTION 7.4 (CONTINUED)
RETIREMENT BENEFIT OBLIGATIONS AND SIMILAR OBLIGATIONS The Group has a triennial valuation process to agree on any future funding arrangements. The most recent one was completed in 2020. The Group expects to contribute DKK 80m (2020: DKK 74m) to the plan assets in 2022, which is in line with the agreed funding arrangement, under which the Group will contribute DKK 496m up to 2026. Plan assets do not include shares in the Group or properties used by Group companies. Amounts recognised in other comprehensive income for 2021 totalled DKK -421m (2020: DKK -429m), comprising a foreign exchange adjustment of DKK -182m and a net actuarial loss of DKK 603m. The accumulated actuarial loss and foreign exchange adjustment recognised at 31 December 2021 was DKK 2,865m (2020: DKK 3,287m), with actuarial net losses of DKK 3,152m (2020: DKK 3,733m).
Assumptions applied In 2021, the discount rate used for the defined benefit plans in Western Europe was determined by reference to market yields on corporate bonds. In the Asian countries, where no deep market in high-quality corporate bonds exists, the discount rate was determined by reference to market yields on government bonds. The mortality tables used in Carlsberg UK are S3PMA/S3PFA tables for post-retirement, while the Swiss entities use BVG 2020 for valuation of their retirement benefit obligations. Sensitivity analysis The sensitivity analysis is based on a change in one of the assumptions, while all other assumptions remain constant. This is highly unlikely, however, as a change in one assumption would probably affect other assumptions as well. When calculating the obligation on the basis of a changed assumption, the same method has been applied as when calculating the defined benefit obligation. Expected maturity and duration Defined benefit obligations are primarily expected to mature after five years. The expected duration of the obligations at year-end 2021 was 17 years. The duration is calculated using a weighted average of the duration divided by the obligation.
Breakdown of plan assets 2021 2020
DKK
million % DKK
million %
Shares 1,345 12 992 9
Bonds and other securities 7,485 65 7,578 71
Real estate 2,088 18 1,914 18
Cash and cash equivalents 588 5 170 2
Total 11,506 100 10,654 100
Assumptions applied
2021 CHF UK EUR Other Weighted
average
Discount rate 0.3% 1.8% 0.3 - 0.9% 2.1% 1.2%
Growth in wages and salaries 1.0% 2.5% 0.2 - 2.8% 2.6% 1.9%
2020
Discount rate 0.2% 1.6% 0.3 - 0.7% 1.8% 0.6%
Growth in wages and salaries 1.0% 2.1% 0.2 - 2.7% 2.0% 1.2%
Sensitivity analysis 2021 2020
DKK million +0.5% -0.5% +0.5% -0.5%
Discount rate -1,097 1,251 -1,514 1,715
Growth in wages and salaries 81 -73 74 -67
+1 year -1 year +1 year -1 year
Mortality 522 -520 452 -378
Maturity of retirement benefit obligations
DKK million < 1 year 1-5 years > 5 years Total
2021 731 2,921 10,199 13,851
2020 611 2,313 10,664 13,588

CARLSBERG GROUP ANNUAL REPORT 2021 CONSOLIDATED FINANCIAL STATEMENTS 112
SECTION 7.4 (CONTINUED)
RETIREMENT BENEFIT OBLIGATIONS AND SIMILAR OBLIGATIONS
ACCOUNTING ESTIMATES AND JUDGEMENTS
The value of the Group’s defined benefit plans is based on valuations from external actuaries. The valuation is based on a number of actuarial assumptions, including discount rates, expected growth in wages and salaries, mortality and retirement benefits. The present value of the net obligation is calculated by using the projected unit credit method and discounting the defined benefit plan by a discount rate for each country. The discount rate is determined by reference to market yields on high-quality corporate bonds. Where high-quality corporate bonds are not available, the market yields on government bonds are used instead. Mortality assumptions are based on the Group entity’s best estimate of the mortality of plan members during and after employment and include expected changes in mortality. Due to the broad range of entities comprising the retirement benefit obligation, several different mortality tables are used to calculate the future retirement benefit obligation.
Contributions paid to a defined contribution plan are recognised in the income statement in the period during which services are rendered by employees. Any contributions outstanding are recognised in the statement of financial position as other liabilities. The Group’s net obligation recognised in the statement of financial position in respect of defined benefit plans is the present value of the defined benefit obligation at the reporting date less the fair value of plan assets calculated by a qualified actuary. The present value is determined separately for each plan by discounting the estimated future benefits that employees have earned in return for their service in the current and prior years. The costs of a defined benefit plan are recognised in the income statement and include service costs, net interest based on actuarial estimates and financial expectations. Service costs comprise current service cost and past service cost. Current service cost is the increase in the present value of the defined benefit obligation resulting from employee services in the current period. Past service cost is the change in the present value of the obligation regarding employee services in prior years that arises from a plan amendment or a curtailment. Past service costs are recognised immediately, provided employees have already earned the changed benefits.
Realised gains and losses on curtailment or settlement are recognised under staff costs. Interest on retirement benefit obligations and the interest on return on plan assets are recognised as financial income or financial expenses. Differences between the development in retirement benefit assets and liabilities and realised amounts at year-end are designated as actuarial gains or losses and recognised in other comprehensive income. As they will never be reclassified to the income statement, they are included in retained earnings. If a retirement benefit plan constitutes a net asset, the asset is recognised only if it offsets future refunds from the plan or will lead to reduced future payments to the plan. Realised gains and losses on the adjustment of retirement benefit obligations as a result of termination of a significant number of positions in connection with restructurings are recognised under special items.
ACCOUNTING POLICIES

CARLSBERG GROUP ANNUAL REPORT 2021 CONSOLIDATED FINANCIAL STATEMENTS 113
6,943m Profit attributable to shareholders in Carlsberg A/S, adjusted for special items after tax (DKK).
48.3 Earnings per share, adjusted for special items after tax (DKK).
SECTION 8.1
EARNINGS PER SHARE
During 2021, the Group repurchased a total of 3.4m B shares under the share buy-back programme. The share buy-back programme decreased the average number of shares by 2.3m. This increased adjusted earnings per share by DKK 0.7. The adjustment for special items after tax increased adjusted earnings per share by DKK 0.7. For all share-based incentive instruments, the average market price of Carlsberg B shares exceeded the exercise price and the fair value at the grant date. As a result, diluted earnings per share included all share-based incentive instruments that could potentially dilute earnings in the future.
SECTION 8
OTHER DISCLOSURE REQUIREMENTS
Earnings per share
DKK 2021 2020
Earnings per share of DKK 20 (EPS) 47.6 41.3
Diluted earnings per share of DKK 20 (EPS-D) 47.4 41.1
Earnings per share, adjusted (EPS-A) 48.3 43.6
Average number of shares
1,000 shares
Average number of issued shares 146,067 149,407
Average number of treasury shares -2,219 -3,303
Average number of shares 143,848 146,104
Average dilutive effect of share-based incentives 451 646
Diluted average number of shares 144,299 146,750
Profit attributable to shareholders
DKK million
Consolidated profit 8,009 6,808
Non-controlling interests -1,163 -778
Profit attributable to shareholders in Carlsberg A/S (net profit) 6,846 6,030
Special items after tax 97 333
Profit attributable to shareholders in Carlsberg A/S, adjusted 6,943 6,363

CARLSBERG GROUP ANNUAL REPORT 2021 CONSOLIDATED FINANCIAL STATEMENTS 114
SECTION 8.2
FEES TO AUDITORS
Fees to auditors appointed by the Annual General Meeting
DKK million 2021 2020
PwC, including network firms
Statutory audit 23 21
Assurance engagements 1 1
Tax advisory 2 2
Other services 2 2
Total 28 26
Fees for services other than the statutory audit of the financial statements provided by PricewaterhouseCoopers Statsautoriseret Revisionspartnerselskab, Denmark, amounted to DKK 1m (2020: DKK 2m), including VAT compliance, other assurance opinions and agreed-upon procedures as well as accounting advice. SECTION 8.3
RELATED PARTIES RELATED PARTIES EXERCISING CONTROL The Carlsberg Foundation, H.C. Andersens Boulevard 35, 1553 Copenhagen V, Denmark, exercises control over Carlsberg A/S. The Foundation holds 29.5% of the shares and 75.9% of the voting power in Carlsberg A/S, excluding treasury shares.
The following transactions took place between the Carlsberg Foundation and the Group in 2021: The Carlsberg Foundation received a dividend of DKK 22.00 per share from Carlsberg A/S, the same as every other shareholder. The dividend received amounted to DKK 964m. Through its pro-rata participation in the share buy-back programme, the Carlsberg Foundation sold B shares to Carlsberg A/S at a fair value of DKK 1,092m. The Foundation thereby reduced its shareholding to 29.5% at 31 December 2021 (2020: 29.6%). The shares were sold at the average weekly share buy-back market prices. FUNDING AND GRANTS Carlsberg A/S received statutory grants and further funding from the Carlsberg Foundation, DKK 56m, for the basic research and development activities at the Carlsberg Research Laboratory (2020: DKK 53m). Of the total grants, DKK 18m (2020: DKK 29m) was deferred to be used for research projects in the future. In 2020, the Carlsberg Foundation contributed a total amount of DKK 53m to support the rebuilding of the Carlsberg Visitor Centre during 2021 and 2022. The purpose of the rebuild is to better showcase Carlsberg’s rich history and value creation. OTHER ACTIVITIES Visit Carlsberg A/S, 100% owned by Carlsberg A/S, hosted and administered events at the Carlsberg Academy, which is owned by the
Carlsberg Foundation, at a value of DKK 1m. Furthermore, Visit Carlsberg A/S was paid DKK 0.4m for work to restore the Carlsberg Academy before its reopening in 2021. The Group’s delivery of beer and soft drinks to the Carlsberg Foundation is charged at ordinary listing price minus a discount. In 2021, the deliveries amounted to DKK 0.2m (total sales of goods) (2020: DKK 0.1m). Carlsberg A/S leases parking spaces from the Carlsberg Foundation to provide parking for employees at the Research Laboratory and Visit Carlsberg. Furthermore, Carlsberg Breweries A/S leases storage facilities in the researcher apartments. These lease agreements are with subsidiaries of the Foundation. The two annual lease payments amount to DKK 0.2m and the leases are on market terms. It is estimated that the benefit for the Carlsberg Group corresponds to the value of the other activities provided to the Carlsberg Foundation, which in turn corresponds to what each party would have had to pay to have the same deliverables provided by external parties. OTHER RELATED PARTIES Related parties also comprise Carlsberg A/S’ Supervisory Board and Executive Board, their close family members and companies in which these persons have significant influence. During the year, there were no transactions between these parties and the Group, except for remuneration as disclosed in section 7 of the consolidated financial statements.
The income statement and the statement of financial position include the following transactions
DKK million 2021 2020
Associates and joint ventures
Revenue 76 78
Cost of sales -817 -756
Sales expenses -11 -14
Interest income 14 15
Loans 242 213
Receivables 226 106
Trade payables and other liabilities -36 -10
SECTION 8.4
EVENTS AFTER THE REPORTING PERIOD
Apart from the events recognised or disclosed in the consolidated financial statements, no events have occurred after the reporting period of importance to the consolidated financial statements.

CARLSBERG GROUP ANNUAL REPORT 2021 CONSOLIDATED FINANCIAL STATEMENTS 115
SECTION 9.1
SIGNIFICANT ACCOUNTING ESTIMATES AND JUDGEMENTS
In preparing the consolidated financial statements, management makes various accounting estimates and judgements that form the basis of presentation, recognition and measurement of the Group’s assets, liabilities, income and expenses. The estimates and judgements made are based on historical experience and other factors that management assesses to be reliable, but that, by nature, are associated with uncertainty and unpredictability and may therefore prove incomplete or incorrect.
SECTION 9.2
GENERAL ACCOUNTING POLICIES
The Group’s 2021 consolidated financial statements have been prepared in accordance with IFRS as adopted by the EU and further requirements in the Danish Financial Statements Act. The consolidated financial statements are presented in Danish kroner (DKK), which is the Parent Company’s functional currency, and all values are rounded to the nearest DKK million, except when otherwise stated. The accounting policies set out below have been used consistently in respect of the financial year and the comparative figures. DEFINING MATERIALITY Significant items are presented individually in the financial statements as required by IAS 1. Other items that are considered relevant to stakeholders and necessary for an understanding of the Group’s business model, including research, real estate and geographical
diversity, are also presented individually in the financial statements. The consolidated financial statements are prepared as a consolidation of the financial statements of the Parent Company, Carlsberg A/S, and its subsidiaries according to the Group’s accounting policies. Subsidiaries are all entities over which the Group has control. The Group controls an entity when the Group is exposed to, or has rights to, variable returns from its involvement with the entity and has the ability to affect those returns through its power to direct the activities of the entity. Entities over which the Group exercises significant influence, but which it does not control, are considered associates. Significant influence is generally obtained by direct or indirect ownership or control of less than 50% of the voting rights or participation in the management of the company. The assessment of whether Carlsberg A/S exercises control or significant influence includes potential voting rights exercisable at the reporting date. Entities that by agreement are managed jointly with one or more other parties are considered joint ventures.
On consolidation, intra-group income and expenses, shareholdings, balances and dividends, and realised and unrealised gains are eliminated. Unrealised gains on transactions with associates and joint ventures are eliminated in proportion to the Group’s ownership share of the entity. Unrealised losses are eliminated in the same way as unrealised gains to the extent that impairment has not taken place. The accounting items of subsidiaries are included in full in the consolidated financial statements. Non-controlling interests’ share of subsidiaries’ profit/loss for the year and of equity are included in the Group’s profit/loss and equity but are disclosed separately. Entities acquired or established in the year are recognised in the consolidated financial statements from the date of acquisition or formation. Entities disposed of or discontinued are recognised in the consolidated income statement until the date of disposal or discontinuation. The comparative figures are not restated.
SECTION 9
BASIS FOR PREPARATION
Areas involving significant estimates and judgements:
Receivables Section 1
Impairment testing, useful life and residual value Section 2
Restructurings, provisions and contingencies Section 3
Acquisitions and disposals, including contingent considerations
Section 5
Tax assets and liabilities Section 6
Defined benefit obligations Section 7

CARLSBERG GROUP ANNUAL REPORT 2021 CONSOLIDATED FINANCIAL STATEMENTS 116
SECTION 9.2 (CONTINUED)
GENERAL ACCOUNTING POLICIES FOREIGN CURRENCY TRANSLATION A functional currency is determined for each of the reporting entities in the Group. The functional currency is the primary currency used for the reporting entity’s operations. Transactions denominated in currencies other than the functional currency are considered transactions denominated in foreign currencies. On initial recognition, transactions denominated in foreign currencies are translated to the functional currency at the exchange rates at the transaction date. Foreign exchange differences arising between the exchange rates at the transaction date and at the date of payment are recognised as financial income or expenses. Receivables, payables and other monetary items denominated in foreign currencies are translated at the exchange rates at the reporting date. The difference between the exchange rates at the reporting date and at the date at which the receivable or payable arose or the exchange rate in the latest consolidated financial statements is recognised as financial income or expenses. On recognition of entities with a functional currency other than the presentation currency,
the income statement and statement of cash flows are translated at the exchange rates at the transaction date, and the statement of financial position items are translated at the exchange rates at the reporting date. Foreign exchange differences arising on translation of the opening balance of equity, and of the income statement on the reporting date, are recognised in other comprehensive income and attributed to a separate translation reserve in equity. Foreign exchange differences arising on the translation of the proportionate share of associates and joint ventures are likewise recognised in other comprehensive income. Foreign exchange adjustment of balances with entities that are considered part of the investment in the entity is recognised in other comprehensive income. Correspondingly, foreign exchange gains and losses on the part of loans and derivative financial instruments that are designated as hedges of investments in foreign entities, and that effectively hedge against corresponding foreign exchange gains and losses on the investment in the entity, are also recognised in other comprehensive income and attributed to a separate translation reserve in equity. When the gain or loss from a complete or partial disposal of an entity is recognised, the share of the cumulative exchange differences recognised in other comprehensive income is recognised in the income statement. The same approach is adopted on repayment of balances that constitute part of the net investment in the entity.
INCOME STATEMENT The presentation of the Group’s income statement is based on the internal reporting structure, as IFRS does not provide a specific disclosure requirement. Special items are not directly attributable to ordinary operating activities and are shown separately in order to facilitate a better understanding of the Group’s financial performance. CASH FLOW Cash flow is calculated using the indirect method and is based on operating profit before special items adjusted for depreciation, amortisation and impairment losses. Cash flow cannot be derived directly from the statement of financial position and income statement. FINANCIAL RATIOS AND NON-IFRS FINANCIAL MEASURES The Group uses certain additional financial measures to provide management, investors and investment analysts with additional measures to evaluate and analyse the Company’s results. These non-IFRS financial measures are defined and calculated by the Group and therefore may not be comparable with other companies’ measures. The non-IFRS financial measures disclosed in the Annual Report are: • Earnings per share, adjusted, and payout
ratio, adjusted • Organic development
The Danish Finance Society does not acknowledge use of special items and states that adjustments of tax should be based on the marginal tax rate. When calculating financial measures, the Group uses operating profit before special items as well as the effective tax rate for measures adjusted for tax. Other financial ratios are calculated in accordance with the Danish Finance Society’s online guidelines on the calculation of financial ratios, “Recommendations and Financial Ratios”, unless specifically stated.

CARLSBERG GROUP ANNUAL REPORT 2021 CONSOLIDATED FINANCIAL STATEMENTS 117
SECTION 9.2 (CONTINUED)
GENERAL ACCOUNTING POLICIES 9.2.1 REPORTING UNDER THE ESEF REGULATION
The Commission Delegated Regulation (EU) 2019/815 on the European Single Electronic Format (ESEF Regulation) has introduced a single electronic reporting format for the annual financial reports of issuers with securities listed on the EU-regulated markets. The combination of XHTML format and iXBRL tags enables the annual financial reports to be read by both humans and machines, thus enhancing accessibility, analysis and comparability of the information included in the annual financial reports. The Group’s iXBRL tags have been prepared in accordance with the ESEF taxonomy, which is included in the ESEF Regulation and has been developed based on the IFRS taxonomy published by the IFRS Foundation. The line items in the consolidated financial statements are tagged to elements in the ESEF taxonomy. For financial line items that are not directly defined in the ESEF taxonomy, an extension to the taxonomy has been created. Extensions are anchored to elements in the ESEF taxonomy, except for extensions that are subtotals.
The annual report submitted to the Danish Financial Supervisory Authority (the Officially Appointed Mechanism) consists of the XHTML document together with the technical files, all of which are included in the ZIP file Carlsberg-2021-12-31.zip. Key definitions XHTML (eXtensible HyperText Markup Language) is a text-based language used to structure and mark up content such as text, images and hyperlinks in documents that are displayed in a web browser. iXBRL tags (or Inline XBRL tags) are hidden metainformation embedded in the source code of an XHTML document that enables the conversion of XHTML-formatted information into a machine-readable XBRL data record using appropriate software. A financial reporting taxonomy is an electronic dictionary of business reporting elements used to report business data. A taxonomy element is an element defined in a taxonomy that is used for the machine-readable labelling of information in an XBRL data record.

CARLSBERG GROUP ANNUAL REPORT 2021 CONSOLIDATED FINANCIAL STATEMENTS 118
SECTION 9.2 (CONTINUED)
GENERAL ACCOUNTING POLICIES Glossary and calculation of key figures and financial ratios disclosed in the Annual Report
FINANCIAL RATIOS
Gross margin Gross profit as a percentage of revenue.
EBITDA margin1 Operating profit before depreciation, amortisation and impairment losses as a percentage of revenue.
Operating margin Operating profit before special items1 as a percentage of revenue.
Return on invested capital (ROIC) Operating profit before special items1 adjusted for tax as a percentage of average invested capital2 calculated as a 12-month rolling average (MAT).
Return on invested capital excluding goodwill (ROIC excl. goodwill)
Operating profit before special items1 adjusted for tax as a percentage of average invested capital2 excluding goodwill calculated as a 12-month rolling average (MAT).
Effective tax rate1 Income tax as a percentage of profit before tax.
Equity ratio Equity attributable to shareholders in Carlsberg A/S at year-end as a percentage of total assets at year-end.
NIBD/equity ratio1 Net interest-bearing debt3 at year-end divided by total equity at year-end.
NIBD/EBITDA1 Net interest-bearing debt3 divided by operating profit before depreciation, amortisation and impairment losses.
Interest cover1 Operating profit before special items divided by interest expenses, net.
STOCK MARKET RATIOS
Earnings per share (EPS) Consolidated profit for the year, excluding non-controlling interests, divided by the average number of shares.
Earnings per share, diluted (EPS-D) Consolidated profit for the year, excluding non-controlling interests, divided by the average number of shares, fully diluted for share options and performance shares in the money.
Earnings per share, adjusted (EPS-A) Consolidated profit for the year adjusted for special items after tax1, excluding non-controlling interests, divided by the average number of shares.
Free cash flow per share (FCFPS)1 Free cash flow4 divided by the average number of shares, fully diluted for share options and performance shares in the money.
STOCK MARKET RATIOS (CONTINUED)
Payout ratio Proposed dividend for the year as a percentage of consolidated profit, excluding non-controlling interests.
Payout ratio, adjusted Proposed dividend for the year on number of shares at year-end as a percentage of consolidated profit, adjusted for special items after tax1, excluding non-controlling interests.
Market capitalisation Number of shares at year-end multiplied by the share price.
Average number of issued shares Number of issued shares as an average for the year.
Average number of shares Number of issued shares, excluding treasury shares, as an average for the year.
Number of shares at year-end Total number of issued shares, excluding treasury shares, at year-end.
GLOSSARY
EBITDA1 Expression used for operating profit before depreciation, amortisation and impairment losses.
Leverage ratio1 Expression used for NIBD/EBITDA.
NCI Abbreviation for non-controlling interests.
OCI Abbreviation for other comprehensive income.
Off-trade Expression used for sale of beverages for consumption off the premises (e.g. retailers).
On-trade Expression used for sale of beverages for consumption on the premises (e.g. restaurants, hotels and bars).
Operating profit Expression used for operating profit before special items1.
Organic development1 Measure of growth excluding the impact of acquisitions, divestments and foreign exchange from year-on-year comparisons.
Volumes1 The Group’s sale of beverages in consolidated entities and sale of the Group’s products under licence agreements.
1 This key figure, ratio or elements thereof are not defined or deviate from the definitions of the Danish Finance Society. 2 The calculation of invested capital is specified in section 2.1. 3 The calculation of net-interest bearing debt is specified in section 4.2. 4 The calculation of free cash flow is specified in the statement of cash flows.

CARLSBERG GROUP ANNUAL REPORT 2021 CONSOLIDATED FINANCIAL STATEMENTS 119
SECTION 9.3
CHANGES IN ACCOUNTING POLICIES CHANGED ACCOUNTING POLICIES AND CLASSIFICATION IN THE ANNUAL REPORT 2021 The Annual Report 2021 has been prepared using the same accounting policies for recognition and measurement as those applied to the consolidated financial statements for 2020, except for the following Amendments that were adopted as of 1 January 2021: • Amendments to IFRS 9, IAS 39, IFRS 7,
IFRS 4 and IFRS 16 “Interest rate benchmark reform – Phase 2”
• Amendments to IFRS 4 “Insurance Contracts – deferral of IFRS 9”
• Amendments to IFRS 16 “Leases”: COVID-19-Related Rent Concessions beyond 30 June 2021
These Amendments had no impact on the Group’s accounting policies, as they cover areas that are not material and/or relevant for the Group or do not change the accounting policies applied in 2021.
SECTION 9.4
NEW LEGISLATION NEW AND AMENDED IFRS STANDARDS The following Amendments to IFRS became effective as of 1 January 2022: • Amendment to IAS 16 “Property, Plant and
Equipment” • Amendment to IAS 37 “Provisions, Contingent
Liabilities and Contingent Assets” • Amendments to IFRS 3 “Business
Combinations” • Annual Improvements to IFRS Standards
2018-2020 (IFRS 1, IFRS 9 and IFRS 16) The implemented Amendments are not expected to have any significant impact on the financials or the Group’s accounting policies, as they cover areas that are not material and/or relevant for the Group or do not change the accounting policies applied in 2021.
NEW AND AMENDED IFRS STANDARDS AND INTERPRETATIONS NOT YET ADOPTED BY THE EU The following Amendments, which will become effective in future years, have been issued but not yet adopted by the EU: • Amendment to IAS 1 “Presentation of
Financial Statements: Classification of Liabilities as Current or Non-current and Classification of Current or Non-current – Deferral of Effective Date”
• Amendment to IAS 1 “Presentation of Financial Statements and IFRS Practice Statement 2: Disclosure of Accounting policies”
• Amendments to IAS 8 “Accounting policies, Changes in Accounting Estimates and Errors: Definition of Accounting Estimates”
• Amendments to IAS 12 “Income Taxes: Deferred Tax related to Assets and Liabilities arising from a Single Transaction”
• IFRS 17 “Insurance Contracts” and amendments to IFRS 17: “Initial Applications of IFRS 17” and IFRS 9: “Comparative Information”
The new Standard is not mandatory for the financial reporting for 2021. The Group expects to adopt the new Standard when it becomes mandatory.
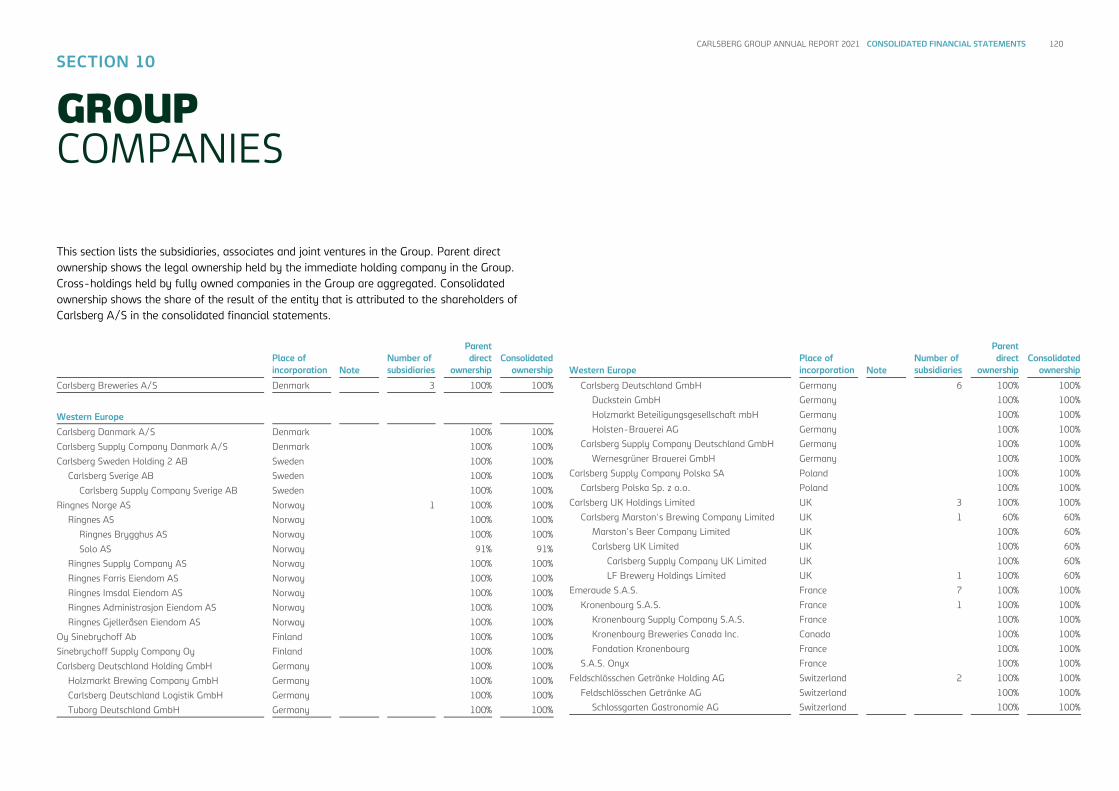
CARLSBERG GROUP ANNUAL REPORT 2021 CONSOLIDATED FINANCIAL STATEMENTS 120
This section lists the subsidiaries, associates and joint ventures in the Group. Parent direct ownership shows the legal ownership held by the immediate holding company in the Group. Cross-holdings held by fully owned companies in the Group are aggregated. Consolidated ownership shows the share of the result of the entity that is attributed to the shareholders of Carlsberg A/S in the consolidated financial statements.
Place of incorporation Note
Number of subsidiaries
Parent direct
ownership Consolidated
ownership
Carlsberg Breweries A/S Denmark 3 100% 100%
Western Europe Carlsberg Danmark A/S Denmark 100% 100%
Carlsberg Supply Company Danmark A/S Denmark 100% 100%
Carlsberg Sweden Holding 2 AB Sweden 100% 100%
Carlsberg Sverige AB Sweden 100% 100%
Carlsberg Supply Company Sverige AB Sweden 100% 100%
Ringnes Norge AS Norway 1 100% 100%
Ringnes AS Norway 100% 100%
Ringnes Brygghus AS Norway 100% 100%
Solo AS Norway 91% 91%
Ringnes Supply Company AS Norway 100% 100%
Ringnes Farris Eiendom AS Norway 100% 100%
Ringnes Imsdal Eiendom AS Norway 100% 100%
Ringnes Administrasjon Eiendom AS Norway 100% 100%
Ringnes Gjelleråsen Eiendom AS Norway 100% 100%
Oy Sinebrychoff Ab Finland 100% 100%
Sinebrychoff Supply Company Oy Finland 100% 100%
Carlsberg Deutschland Holding GmbH Germany 100% 100%
Holzmarkt Brewing Company GmbH Germany 100% 100%
Carlsberg Deutschland Logistik GmbH Germany 100% 100%
Tuborg Deutschland GmbH Germany 100% 100%
Western Europe Place of incorporation Note
Number of subsidiaries
Parent direct
ownership Consolidated
ownership
Carlsberg Deutschland GmbH Germany 6 100% 100%
Duckstein GmbH Germany 100% 100%
Holzmarkt Beteiligungsgesellschaft mbH Germany 100% 100%
Holsten-Brauerei AG Germany 100% 100%
Carlsberg Supply Company Deutschland GmbH Germany 100% 100%
Wernesgrüner Brauerei GmbH Germany 100% 100%
Carlsberg Supply Company Polska SA Poland 100% 100%
Carlsberg Polska Sp. z o.o. Poland 100% 100%
Carlsberg UK Holdings Limited UK 3 100% 100%
Carlsberg Marston's Brewing Company Limited UK 1 60% 60%
Marston's Beer Company Limited UK 100% 60%
Carlsberg UK Limited UK 100% 60%
Carlsberg Supply Company UK Limited UK 100% 60%
LF Brewery Holdings Limited UK 1 100% 60%
Emeraude S.A.S. France 7 100% 100%
Kronenbourg S.A.S. France 1 100% 100%
Kronenbourg Supply Company S.A.S. France 100% 100%
Kronenbourg Breweries Canada Inc. Canada 100% 100%
Fondation Kronenbourg France 100% 100%
S.A.S. Onyx France 100% 100%
Feldschlösschen Getränke Holding AG Switzerland 2 100% 100%
Feldschlösschen Getränke AG Switzerland 100% 100%
Schlossgarten Gastronomie AG Switzerland 100% 100%
SECTION 10
GROUP COMPANIES
Consolidated financial statements
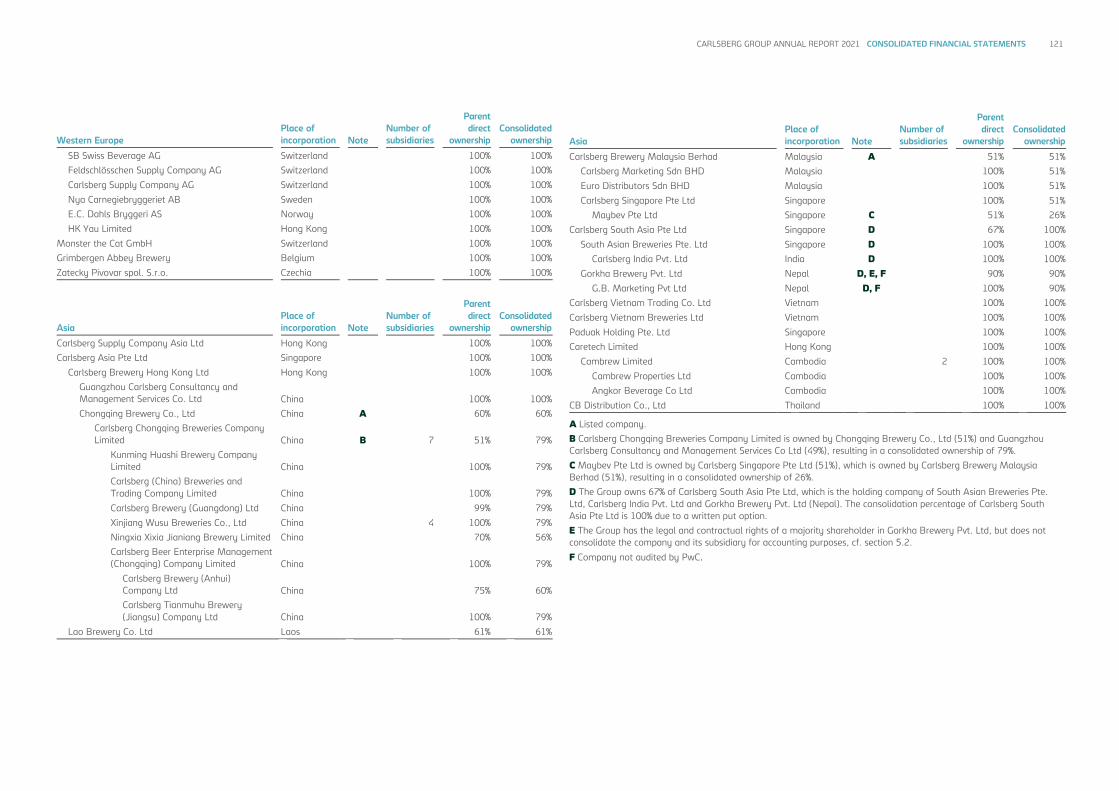
CARLSBERG GROUP ANNUAL REPORT 2021 CONSOLIDATED FINANCIAL STATEMENTS 121
Western Europe Place of incorporation Note
Number of subsidiaries
Parent direct
ownership Consolidated
ownership
SB Swiss Beverage AG Switzerland 100% 100%
Feldschlösschen Supply Company AG Switzerland 100% 100%
Carlsberg Supply Company AG Switzerland 100% 100%
Nya Carnegiebryggeriet AB Sweden 100% 100%
E.C. Dahls Bryggeri AS Norway 100% 100%
HK Yau Limited Hong Kong 100% 100%
Monster the Cat GmbH Switzerland 100% 100%
Grimbergen Abbey Brewery Belgium 100% 100%
Zatecky Pivovar spol. S.r.o. Czechia 100% 100%
Asia Place of incorporation Note
Number of subsidiaries
Parent direct
ownership Consolidated
ownership
Carlsberg Supply Company Asia Ltd Hong Kong 100% 100%
Carlsberg Asia Pte Ltd Singapore 100% 100%
Carlsberg Brewery Hong Kong Ltd Hong Kong 100% 100%
Guangzhou Carlsberg Consultancy and Management Services Co. Ltd China 100% 100%
Chongqing Brewery Co., Ltd China A 60% 60%
Carlsberg Chongqing Breweries Company Limited China B 7 51% 79%
Kunming Huashi Brewery Company Limited China 100% 79%
Carlsberg (China) Breweries and Trading Company Limited China 100% 79%
Carlsberg Brewery (Guangdong) Ltd China 99% 79%
Xinjiang Wusu Breweries Co., Ltd China 4 100% 79%
Ningxia Xixia Jianiang Brewery Limited China 70% 56%
Carlsberg Beer Enterprise Management (Chongqing) Company Limited China 100% 79%
Carlsberg Brewery (Anhui) Company Ltd China 75% 60%
Carlsberg Tianmuhu Brewery (Jiangsu) Company Ltd China 100% 79%
Lao Brewery Co. Ltd Laos 61% 61%
Asia Place of incorporation Note
Number of subsidiaries
Parent direct
ownership Consolidated
ownership
Carlsberg Brewery Malaysia Berhad Malaysia A 51% 51%
Carlsberg Marketing Sdn BHD Malaysia 100% 51%
Euro Distributors Sdn BHD Malaysia 100% 51%
Carlsberg Singapore Pte Ltd Singapore 100% 51%
Maybev Pte Ltd Singapore C 51% 26%
Carlsberg South Asia Pte Ltd Singapore D 67% 100%
South Asian Breweries Pte. Ltd Singapore D 100% 100%
Carlsberg India Pvt. Ltd India D 100% 100%
Gorkha Brewery Pvt. Ltd Nepal D, E, F 90% 90%
G.B. Marketing Pvt Ltd Nepal D, F 100% 90%
Carlsberg Vietnam Trading Co. Ltd Vietnam 100% 100%
Carlsberg Vietnam Breweries Ltd Vietnam 100% 100%
Paduak Holding Pte. Ltd Singapore 100% 100%
Caretech Limited Hong Kong 100% 100%
Cambrew Limited Cambodia 2 100% 100%
Cambrew Properties Ltd Cambodia 100% 100%
Angkor Beverage Co Ltd Cambodia 100% 100%
CB Distribution Co., Ltd Thailand 100% 100% A Listed company.
B Carlsberg Chongqing Breweries Company Limited is owned by Chongqing Brewery Co., Ltd (51%) and Guangzhou Carlsberg Consultancy and Management Services Co Ltd (49%), resulting in a consolidated ownership of 79%.
C Maybev Pte Ltd is owned by Carlsberg Singapore Pte Ltd (51%), which is owned by Carlsberg Brewery Malaysia Berhad (51%), resulting in a consolidated ownership of 26%.
D The Group owns 67% of Carlsberg South Asia Pte Ltd, which is the holding company of South Asian Breweries Pte. Ltd, Carlsberg India Pvt. Ltd and Gorkha Brewery Pvt. Ltd (Nepal). The consolidation percentage of Carlsberg South Asia Pte Ltd is 100% due to a written put option.
E The Group has the legal and contractual rights of a majority shareholder in Gorkha Brewery Pvt. Ltd, but does not consolidate the company and its subsidiary for accounting purposes, cf. section 5.2.
F Company not audited by PwC.

CARLSBERG GROUP ANNUAL REPORT 2021 CONSOLIDATED FINANCIAL STATEMENTS 122
Central & Eastern Europe Place of incorporation Note
Number of subsidiaries
Parent direct
ownership Consolidated
ownership
Baltika Breweries LLC Russia G 3 100% 100%
Carlsberg Azerbaijan LLC Azerbaijan 100% 100%
Baku Piva JSC Azerbaijan 91% 91%
Hoppy Union LLC Russia G 100% 100%
Konix Brewery LLC Russia H 75% 100%
Carlsberg Kazakhstan Ltd Kazakhstan G 100% 100%
Baltic Beverages Invest AB Sweden G 100% 100%
PJSC Carlsberg Ukraine Ukraine 1 100% 100%
Baltic Beverages Holding AB Sweden 100% 100%
Carlsberg Serbia Ltd Serbia 100% 100%
Carlsberg BH d.o.o. Bosnia and Herzegovina 100% 100%
Carlsberg Montenegro d.o.o. Montenegro 100% 100%
Carlsberg Croatia d.o.o. Croatia 100% 100%
Carlsberg Bulgaria AD Bulgaria 100% 100%
OJSC Brewery Alivaria Belarus H 78% 89%
Carlsberg Italia S.p.A. Italy 100% 100%
Carlsberg Horeca Srl Italy 100% 100%
T&C Italia Srl Italy 100% 100%
Olympic Brewery SA Greece 100% 100%
Hellenic Beverage Company SA Greece 100% 100%
Carlsberg Hungary Kft. Hungary 100% 100%
Saku Ölletehase AS Estonia 100% 100%
Aldaris JSC Latvia 100% 100%
Svyturys-Utenos Alus UAB Lithuania G 99% 99%
CTDD Beer Imports Ltd Canada 100% 100%
Carlsberg Canada Inc. Canada 100% 100%
Carlsberg USA Inc. USA 100% 100%
Not allocated Place of incorporation Note
Number of subsidiaries
Parent direct
ownership Consolidated
ownership
Carlsberg Finans A/S Denmark 100% 100%
Carlsberg International A/S Denmark 100% 100%
Visit Carlsberg A/S Denmark 100% 100%
Carlsberg Invest A/S Denmark 100% 100%
Carlsberg Integrated Information Technology A/S Denmark 100% 100%
Carlsberg Insurance A/S Denmark 100% 100%
Carlsberg Central Office A/S Denmark 100% 100%
Carlsberg Shared Services Sp. z o.o. Poland 100% 100%
Non-beverage Place of incorporation Note
Number of subsidiaries
Parent direct
ownership Consolidated
ownership
Ejendomsaktieselskabet Tuborg Nord C Denmark 100% 100%
Carlsberg Ejendomme Holding A/S Denmark 100% 100%
Boliginteressentskabet Tuborg Denmark I 100% 100%
Associates and joint ventures Place of incorporation Note
Number of subsidiaries
Parent direct
ownership Consolidated
ownership
Carlsberg Byen P/S Denmark F 88 25% 25%
Shangri-la Beverages AG Switzerland 35% 35%
Sinergie Proattive Srl Italy 36% 36%
Viacer S.G.P.S., Lda Portugal J 29% 29%
Super Bock Group, S.G.P.S., S.A. Portugal J 13 56% 60%
Serviced Dispense Equipment (Holdings) Limited UK 2 33% 20%
Nuuk Imeq A/S Greenland F 32% 32%
Chongqing Jiawei Beer Co. Ltd China 33% 26%
Lanzhou Huanghe Jianiang Brewery Company Limited China 50% 50%
Qinghai Huanghe Jianiang Brewery Company Ltd China 50% 50%
Jiuquan West Brewery Company Limited China 50% 50%
Tianshui Huanghe Jianiang Brewery Company Ltd China 50% 50%
Capital Brewing Company Ltd Hong Kong 4 49% 49%
Lion Brewery (Ceylon) PLC Sri Lanka A, F, K 25% 13%
Hanoi Beer Alcohol and Beverage Joint Stock Corporation Vietnam F 17% 17%
Carlsberg Distributors Taiwan Limited Taiwan 1 50% 50%
NCC Crowns Private Limited India 33% 33%
Bottlers Nepal Limited Nepal 1 22% 20%
Myanmar Carlsberg Co. Ltd Myanmar F 1 58% 58% G Company owned by Carlsberg Sverige AB.
H Consolidated ownership is higher than the legal ownership due to written put options.
I A separate annual report is not prepared.
J Viacer S.G.P.S (Viacer) is the controlling shareholder of Super Bock Group, S.G.P.S. (Super Bock) with a 56% shareholding, with Carlsberg Breweries A/S owning the remaining 44%. In addition, Carlsberg Breweries A/S has a direct ownership in Viacer of 29% without exercising control. Therefore, both Viacer and Super Bock are considered associates of the Group. The Group's direct and indirect ownership of Super Bock totals 60%.
K Lion Brewery (Ceylon) PLC is owned by Carlsberg Brewery Malaysia Berhad (25%). Carlsberg owns 51% of Carlsberg Brewery Malaysia Berhad, resulting in 13% of the result being attributed to the shareholders in Carlsberg A/S.
CARLSBERG GROUP ANNUAL REPORT 2021 PARENT COMPANY FINANCIAL STATEMENTS 123
PARENT COMPANY FINANCIAL STATEMENTS
Income statement ................................ 124
Statement of comprehensive income ...................................................... 124
Statement of financial position ...... 125
Statement of changes in equity ..... 126
Statement of cash flows ................... 126
Notes ......................................................... 127
SECTION 1 SUBSIDIARIES AND RELATED PARTIES 1.1 Investments in subsidiaries ....................... 127 1.2 Related parties ............................................. 127
SECTION 2 CAPITAL STRUCTURE 2.1 Financial items ............................................. 128 2.2 Net interest-bearing debt ......................... 128 2.3 Share capital ................................................. 129
SECTION 3 STAFF COSTS AND REMUNERATION 3.1 Staff costs and remuneration .................. 130 3.2 Retirement benefit obligations ................ 130
SECTION 4 OTHER DISCLOSURE REQUIREMENTS 4.1 Other operating activities, net ................. 131 4.2 Cash flow ....................................................... 131 4.3 Provisions ....................................................... 131 4.4 Special items ................................................. 131 4.5 Asset base and leases ............................... 131 4.6 Fees to auditors ........................................... 131 4.7 Tax ................................................................... 132 4.8 Contingent liabilities and other
commitments ............................................... 133 4.9 Events after the reporting period ........... 133
SECTION 5 GENERAL ACCOUNTING POLICIES 5 General accounting policies ..................... 133
PARENT COMPANY FINANCIAL STATEMENTS
Parent Company financial statements

CARLSBERG GROUP ANNUAL REPORT 2021 PARENT COMPANY FINANCIAL STATEMENTS 124
INCOME STATEMENT STATEMENT OF COMPREHENSIVE INCOME DKK million Section 2021 2020
Administrative expenses -86 -42
Other operating activities, net 4.1 1 -4
Operating profit before special items -85 -46
Special items 4.4 80 -2
Financial income 2.1 3,264 3,211
Financial expenses 2.1 -6 -14
Profit before tax 3,253 3,149
Income tax 4.7 -30 11
Profit for the year 3,223 3,160
Attributable to
Dividend to shareholders 3,486 3,259
Reserves -263 -99
Profit for the year 3,223 3,160
DKK million Section 2021 2020
Profit for the year 3,223 3,160
Other comprehensive income Retirement benefit obligations 3.2 1 -1
Items that will not be reclassified to the income statement 1 -1
Other comprehensive income 1 -1
Total comprehensive income 3,224 3,159

CARLSBERG GROUP ANNUAL REPORT 2021 PARENT COMPANY FINANCIAL STATEMENTS 125
STATEMENT OF FINANCIAL POSITION
DKK million Section 31 Dec. 2021 31 Dec. 2020
EQUITY AND LIABILITIES
Equity
Share capital 2.3 2,905 2,963
Retained earnings 32,189 35,589
Total equity 35,094 38,552
Non-current liabilities
Retirement benefit obligations 3.2 26 30
Deferred tax liabilities 4.7 21 -
Provisions 4.3 5 13
Total non-current liabilities 52 43
Current liabilities
Borrowings 1.2 407 1,263
Trade payables 34 39
Provisions 4.3 47 39
Other liabilities 120 90
Total current liabilities 608 1,431
Total liabilities 660 1,474
Total equity and liabilities 35,754 40,026
DKK million Section 31 Dec. 2021 31 Dec. 2020
ASSETS
Non-current assets
Intangible assets 4.5 2 3
Property, plant and equipment 4.5 163 218
Investments in subsidiaries 1.1 34,426 38,733
Receivables 324 324
Tax assets 4.7 - 93
Total non-current assets 34,915 39,371
Current assets
Receivables 1.2 55 275
Tax receivables 25 9
Other receivables 1.2 630 371
Total current assets 710 655
Assets held for sale 4.5 129 -
Total assets 35,754 40,026

CARLSBERG GROUP ANNUAL REPORT 2021 PARENT COMPANY FINANCIAL STATEMENTS 126
STATEMENT OF CHANGES IN EQUITY STATEMENT OF CASH FLOWS
DKK million Section 2021 2020
Operating profit before special items -85 -46
Depreciation and amortisation 4.4 18 10
Operating profit before depreciation and amortisation -67 -36
Other non-cash items 15 -
Change in working capital 376 88
Restructuring costs paid - -2
Interest etc. received 1 2
Interest etc. paid -6 -13
Income tax paid 67 28
Cash flow from operating activities 386 67
Acquisition of property, plant and equipment and intangible assets -6 -10
Disposal of property, plant and equipment and intangible assets 3 1
Total operational investments -3 -9
Disposal of securities - 5
Dividends from subsidiaries and joint ventures 1.2 3,260 3,204
Capital reductions in subsidiaries 1.2 4,000 2,500
Total financial investments 7,260 5,709
Other investments in real estate -2 -
Total other activities -2 -
Cash flow from investing activities 7,255 5,700
Free cash flow 7,641 5,767
Shareholders in Carlsberg A/S 2.3 -6,787 -5,993
External financing 2.2 -854 226
Cash flow from financing activities -7,641 -5,767
Net cash flow - -
Cash and cash equivalents at 1 January - -
Cash and cash equivalents at 31 December - -
DKK million Section Shareholders in Carlsberg A/S
2021 Share capital Retained earnings Total equity
Equity at 1 January 2,963 35,589 38,552
Profit for the year 3,223 3,223
Other comprehensive income - 1 1
Total comprehensive income for the year - 3,224 3,224
Cancellation of treasury shares -58 58 -
Share-based payments 3.1 - 14 14
Share-based payments to employees in subsidiaries - 91 91
Share buy-back 2.3 - -3,600 -3,600
Dividends paid to shareholders 2.3 - -3,187 -3,187
Total changes in equity -58 -3,400 -3,458
Equity at 31 December 2,905 32,189 35,094
2020
Equity at 1 January 3,051 37,974 41,025
Profit for the year 3,160 3,160
Other comprehensive income - -1 -1
Total comprehensive income for the year - 3,159 3,159
Cancellation of treasury shares -88 88 -
Share-based payments 3.1 - 8 8
Share-based payments to employees in subsidiaries - 353 353
Share buy-back 2.3 - -2,900 -2,900
Dividends paid to shareholders 2.3 - -3,093 -3,093
Total changes in equity -88 -2,385 -2,473
Equity at 31 December 2,963 35,589 38,552

CARLSBERG GROUP ANNUAL REPORT 2021 PARENT COMPANY FINANCIAL STATEMENTS 127
SECTION 1.1
INVESTMENTS IN SUBSIDIARIES
The carrying amount includes goodwill of DKK 11,206m (2020: DKK 11,206m) on acquisition of subsidiaries. Share-based payments to employees in subsidiaries comprise exercised as well as outstanding share-based incentive instruments. Investments in subsidiaries
DKK million 2021 2020
Cost Cost at 1 January 38,733 40,353
Disposals - -
Capital reduction -4,000 -2,500
Share-based payments to employees, net -307 880
Cost at 31 December 34,426 38,733
Carrying amount at 31 December 34,426 38,733
Please see section 10 in the consolidated financial statements for a list of companies in the Carlsberg Group.
ACCOUNTING ESTIMATES AND JUDGEMENTS
Indications of impairment of investments in subsidiaries are assessed annually by management. Impairment tests are conducted in the same way as for goodwill in the Group, cf. section 2.2 in the consolidated financial statements. It is management’s assessment that no indications of impairment existed at year-end 2021. Impairment tests have therefore not been carried out for subsidiaries.
ACCOUNTING POLICIES
Dividends on investments in subsidiaries are recognised in the income statement of the Parent Company in the financial year in which the dividend is declared. Investments in subsidiaries are measured at the lower of cost and recoverable amount. Share-based payments granted to employees of the Company’s subsidiaries and the recharge of losses to the subsidiaries in connection with the employees’ exercise of share-based awards are recognised as contributions to and reductions of the investment in the subsidiaries respectively.
SECTION 1.2
RELATED PARTIES
The Carlsberg Foundation, H.C. Andersens Boulevard 35, 1553 Copenhagen V, Denmark, exercises control over Carlsberg A/S. The Foundation holds 29.5% of the shares and 75.9% of the voting power in Carlsberg A/S, excluding treasury shares. The following transactions took place between the Carlsberg Foundation and the Carlsberg Group in 2021: • The Carlsberg Foundation received a dividend
from Carlsberg A/S and participated pro rata in the Carlsberg A/S share buy-back.
• Carlsberg A/S received statutory funding and grants for research and development.
• Visit Carlsberg A/S, 100% owned by Carlsberg A/S, hosted and administered events at the Carlsberg Academy, which is owned by the Carlsberg Foundation.
• Carlsberg A/S leased parking spaces from the Carlsberg Foundation.
• Carlsberg Breweries leased storage facilities in the researcher apartments.
The Group delivered beer and soft drinks to the Carlsberg Foundation. These transactions are described in further detail in section 8.3 of the consolidated financial statements. It is estimated that the benefit for the Carlsberg Group corresponds to the value of the services provided to the Carlsberg Foundation, which in turn corresponds to what each party would have had to pay to have the same deliverables provided by external parties. OTHER RELATED PARTIES Related parties also comprise Carlsberg A/S’ Supervisory Board and Executive Board, their close family members and companies in which these persons have significant influence. During the year, there were no transactions between these parties and the Group, except for remuneration as disclosed in section 3.
SECTION 1
SUBSIDIARIES AND RELATED PARTIES
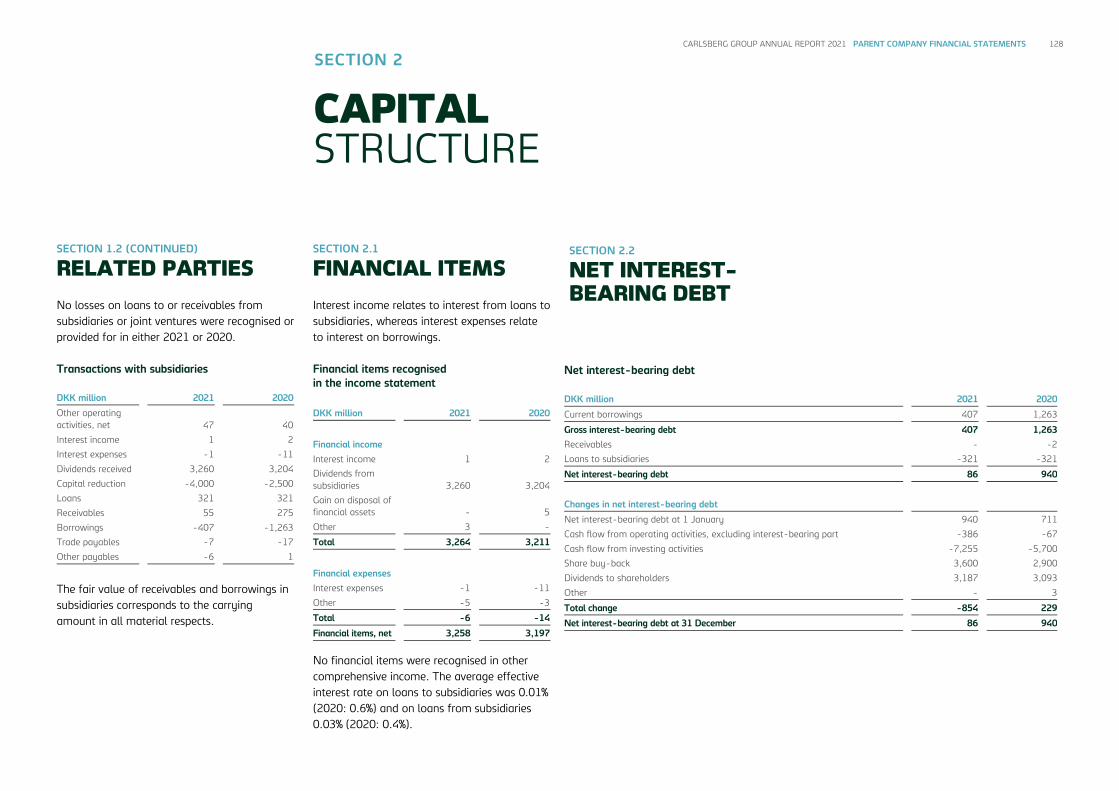
CARLSBERG GROUP ANNUAL REPORT 2021 PARENT COMPANY FINANCIAL STATEMENTS 128
SECTION 1.2 (CONTINUED)
RELATED PARTIES
No losses on loans to or receivables from subsidiaries or joint ventures were recognised or provided for in either 2021 or 2020. Transactions with subsidiaries
DKK million 2021 2020
Other operating activities, net 47 40
Interest income 1 2
Interest expenses -1 -11
Dividends received 3,260 3,204
Capital reduction -4,000 -2,500
Loans 321 321
Receivables 55 275
Borrowings -407 -1,263
Trade payables -7 -17
Other payables -6 1
The fair value of receivables and borrowings in subsidiaries corresponds to the carrying amount in all material respects.
SECTION 2.1
FINANCIAL ITEMS
Interest income relates to interest from loans to subsidiaries, whereas interest expenses relate to interest on borrowings. Financial items recognised in the income statement
DKK million 2021 2020
Financial income Interest income 1 2
Dividends from subsidiaries 3,260 3,204
Gain on disposal of financial assets - 5
Other 3 -
Total 3,264 3,211
Financial expenses Interest expenses -1 -11
Other -5 -3
Total -6 -14
Financial items, net 3,258 3,197
No financial items were recognised in other comprehensive income. The average effective interest rate on loans to subsidiaries was 0.01% (2020: 0.6%) and on loans from subsidiaries 0.03% (2020: 0.4%).
SECTION 2.2
NET INTEREST-BEARING DEBT
SECTION 2
CAPITAL STRUCTURE
Net interest-bearing debt
DKK million 2021 2020
Current borrowings 407 1,263
Gross interest-bearing debt 407 1,263
Receivables - -2
Loans to subsidiaries -321 -321
Net interest-bearing debt 86 940
Changes in net interest-bearing debt
Net interest-bearing debt at 1 January 940 711
Cash flow from operating activities, excluding interest-bearing part -386 -67
Cash flow from investing activities -7,255 -5,700
Share buy-back 3,600 2,900
Dividends to shareholders 3,187 3,093
Other - 3
Total change -854 229
Net interest-bearing debt at 31 December 86 940

CARLSBERG GROUP ANNUAL REPORT 2021 PARENT COMPANY FINANCIAL STATEMENTS 129
SECTION 2.3
SHARE CAPITAL SHARE CAPITAL At the Annual General Meeting on 15 March 2021, it was decided to reduce the share capital of Carlsberg A/S by a nominal amount of DKK 58,000,000 to a nominal amount of DKK 2,905,136,120 by cancelling 2,900,000 of the B shares held by the Company, each with a nominal value of DKK 20. The cancellation was completed on 13 April 2021. These shares had been repurchased as part of the Company’s share buy-back programme. At the Annual General Meeting on 14 March 2022, the Supervisory Board will recommend that 3.4m treasury shares not used for the hedging of the incentive programme will be cancelled.
DIVIDENDS The proposed dividend of DKK 24.00 per share (2020: DKK 22.00 per share), amounting to DKK 3,486m (2020: DKK 3,259m), has been included in retained earnings at 31 December 2021. Dividends to be paid out in 2022 for 2021, net of dividends on treasury shares held at 31 December 2021, will amount to DKK 3,405m. Dividends paid out in 2021 for 2020, net of dividends on treasury shares, amounted to DKK 3,187m (paid out in 2020 for 2019: DKK 3,093m). Dividends paid out to shareholders in Carlsberg A/S do not impact taxable income in Carlsberg A/S.
SHARE BUY-BACK AND TREASURY SHARES On 5 February 2021, the Company announced its intention to continue the share buy-back programme. The 2021 programme has been executed as quarterly programmes, and 3,355,625 B shares worth DKK 3.6bn have been repurchased in 2021. Ending with the fourth quarterly programme, which was finalised on 28 January 2022, the Company has repurchased a total of 3,715,779 B shares at a total purchase price of DKK 4.0bn over a 12-month period. According to the authorisation of the Annual General Meeting, the Supervisory Board may, in the period until 13 March 2023, allow the Company to acquire treasury shares up to a total holding of 10% of the nominal share capital at a price quoted on Nasdaq Copenhagen at the time of acquisition with a deviation of up to 10%. The permitted holding of treasury shares covers those acquired in share buy-back programmes. The Company holds no class A shares.
Transactions with shareholders in Carlsberg A/S
2021 2020
Dividends to shareholders -3,187 -3,093
Acquisition of treasury shares -3,600 -2,900
Total -6,787 -5,993
In the 2021 financial year, the Company acquired class B treasury shares of a nominal amount of DKK 67m (2020: DKK 66m) at an average price of DKK 1,073 (2020: DKK 882). Class B treasury shares are acquired and disposed of as part of the share buy-back programme and to facilitate settlement of the share-based incentive programmes. At 31 December 2021, the fair value of treasury shares amounted to DKK 3,800m (2020: DKK 2,979m). The holdings of treasury shares are specified in section 4.3 in the consolidated financial statements.
Share capital
Class A shares Class B shares Total share capital
Shares of
DKK 20
Nominal value,
DKK ’000 Shares of
DKK 20
Nominal value,
DKK ’000 Shares of
DKK 20
Nominal value,
DKK ’000
1 January 2020 33,699,252 673,985 118,857,554 2,377,151 152,556,806 3,051,136
Cancellation of treasury shares - - -4,400,000 -88,000 -4,400,000 -88,000
31 December 2020 33,699,252 673,985 114,457,554 2,289,151 148,156,806 2,963,136
Cancellation of treasury shares - - -2,900,000 -58,000 -2,900,000 -58,000
31 December 2021 33,699,252 673,985 111,557,554 2,231,151 145,256,806 2,905,136
A shares carry 20 votes per DKK 20 share. B shares carry two votes per DKK 20 share. A preferential right to an 8% non-cumulative dividend is attached to B shares. Apart from votes and dividends, all shares rank equally.
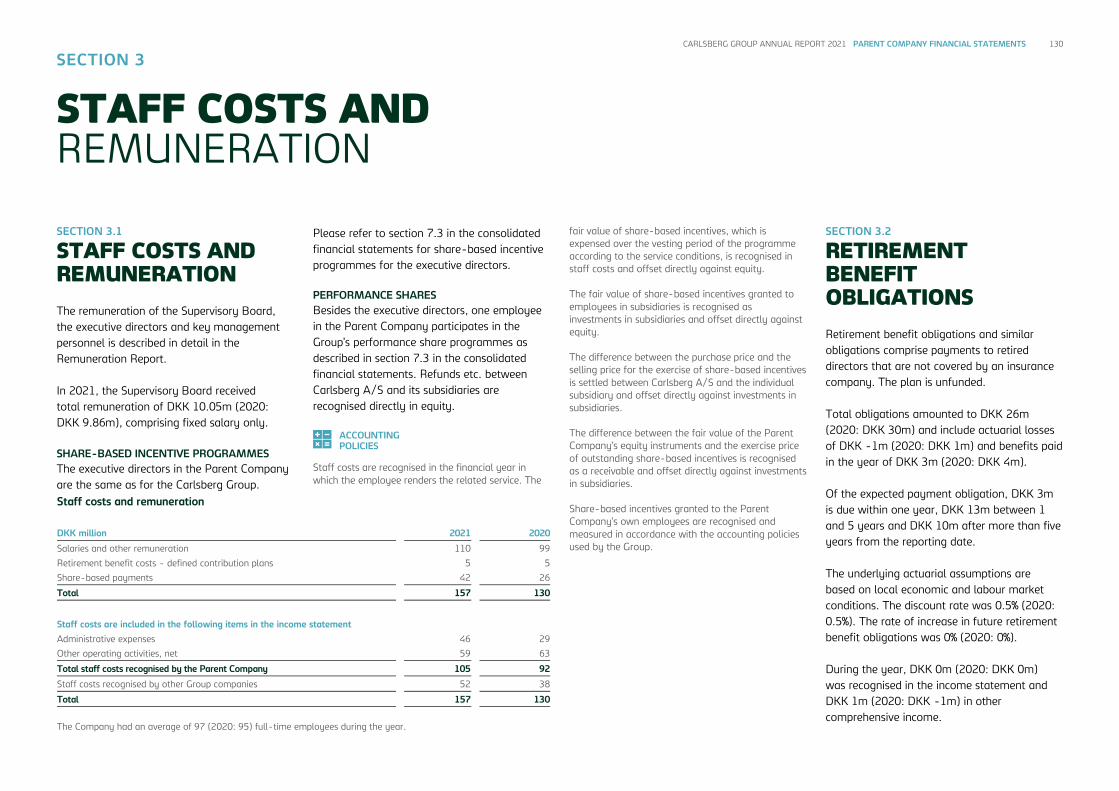
CARLSBERG GROUP ANNUAL REPORT 2021 PARENT COMPANY FINANCIAL STATEMENTS 130
SECTION 3.1
STAFF COSTS AND REMUNERATION
The remuneration of the Supervisory Board, the executive directors and key management personnel is described in detail in the Remuneration Report. In 2021, the Supervisory Board received total remuneration of DKK 10.05m (2020: DKK 9.86m), comprising fixed salary only. SHARE-BASED INCENTIVE PROGRAMMES The executive directors in the Parent Company are the same as for the Carlsberg Group.
Please refer to section 7.3 in the consolidated financial statements for share-based incentive programmes for the executive directors. PERFORMANCE SHARES Besides the executive directors, one employee in the Parent Company participates in the Group’s performance share programmes as described in section 7.3 in the consolidated financial statements. Refunds etc. between Carlsberg A/S and its subsidiaries are recognised directly in equity.
ACCOUNTING POLICIES
Staff costs are recognised in the financial year in which the employee renders the related service. The
fair value of share-based incentives, which is expensed over the vesting period of the programme according to the service conditions, is recognised in staff costs and offset directly against equity. The fair value of share-based incentives granted to employees in subsidiaries is recognised as investments in subsidiaries and offset directly against equity. The difference between the purchase price and the selling price for the exercise of share-based incentives is settled between Carlsberg A/S and the individual subsidiary and offset directly against investments in subsidiaries. The difference between the fair value of the Parent Company’s equity instruments and the exercise price of outstanding share-based incentives is recognised as a receivable and offset directly against investments in subsidiaries. Share-based incentives granted to the Parent Company’s own employees are recognised and measured in accordance with the accounting policies used by the Group.
SECTION 3.2
RETIREMENT BENEFIT OBLIGATIONS
Retirement benefit obligations and similar obligations comprise payments to retired directors that are not covered by an insurance company. The plan is unfunded. Total obligations amounted to DKK 26m (2020: DKK 30m) and include actuarial losses of DKK -1m (2020: DKK 1m) and benefits paid in the year of DKK 3m (2020: DKK 4m). Of the expected payment obligation, DKK 3m is due within one year, DKK 13m between 1 and 5 years and DKK 10m after more than five years from the reporting date. The underlying actuarial assumptions are based on local economic and labour market conditions. The discount rate was 0.5% (2020: 0.5%). The rate of increase in future retirement benefit obligations was 0% (2020: 0%). During the year, DKK 0m (2020: DKK 0m) was recognised in the income statement and DKK 1m (2020: DKK -1m) in other comprehensive income.
SECTION 3
STAFF COSTS AND REMUNERATION
Staff costs and remuneration DKK million 2021 2020
Salaries and other remuneration 110 99
Retirement benefit costs - defined contribution plans 5 5
Share-based payments 42 26
Total 157 130
Staff costs are included in the following items in the income statement Administrative expenses 46 29
Other operating activities, net 59 63
Total staff costs recognised by the Parent Company 105 92
Staff costs recognised by other Group companies 52 38
Total 157 130
The Company had an average of 97 (2020: 95) full-time employees during the year.

CARLSBERG GROUP ANNUAL REPORT 2021 PARENT COMPANY FINANCIAL STATEMENTS 131
SECTION 4.1
OTHER OPERATING ACTIVITIES, NET
Other operating activities are secondary to the principal activities of the Group and include income and expenses relating to rental properties and research activities. Other operating activities, net DKK million 2021 2020
Real estate, net -9 9
Research activities, including the Carlsberg Research Laboratory, net 11 -13
Other, net -1 -
Total 1 -4
Research expenses are partially financed through funding received from the Carlsberg Foundation for the operation of the Carlsberg Research Laboratory and other grants.
ACCOUNTING POLICIES
The funding and grants are recognised in the income statement in the same period as the activities to which they relate.
SECTION 4.2
CASH FLOW
Change in working capital consists of receivables of DKK 0m (2020: DKK 20m), trade payables and other liabilities of DKK 379m (2020: DKK 102m) and retirement benefit obligations and other provisions of DKK -3m (2020: DKK -34m). Other activities cover real estate activities. SECTION 4.3
PROVISIONS
Provisions primarily comprise warranty provisions regarding real estate disposed of and provisions for ongoing disputes. At 31 December 2021, provisions amounted to DKK 52m (2020: DKK 52m). Provisions amounting to DKK 3m (2020: DKK 10m) were utilised during the year. In 2021, unutilised provisions of DKK 1m (2020: DKK 20m) were reversed. Of total provisions, DKK 47m (2020: DKK 39m) falls due within one year, DKK 4m (2020: DKK 13m) between one and five years
and DKK 1m (2020: DKK 0m) falls due after more than five years from the end of the reporting period. SECTION 4.4
SPECIAL ITEMS
Special items of DKK 80m (2020: DKK -2m) mainly comprise reversal of impairment of land and buildings reclassified as assets held for sale at the end of the reporting period, cf. section 4.5 below. SECTION 4.5
ASSET BASE AND LEASES
The carrying amount of intangible assets was DKK 2m (2020: DKK 3m), and the carrying amount of property, plant and equipment was DKK 163m (2020: DKK 218m). Property, plant and equipment comprised land and buildings of DKK 127m (2020: DKK 180m) and plant and machinery of DKK 36m (2020: DKK 38m). After the end of the reporting period (1 February 2022), the company completed the disposal of land and buildings with a carrying
amount of DKK 129m classified as held for sale. Depreciation and amortisation of DKK 18m (2020: DKK 10m) were included in administrative expenses. All lease contracts in Carlsberg A/S were related to short-term leases and leases of low-value assets. The lease expenses recognised in the income statement amounted to DKK 1m (2020: DKK 1m). Such contracts comprise the lease of copy and printing machines, coffee machines, small IT devices and similar equipment. SECTION 4.6
FEES TO AUDITORS
Fees to auditors appointed by the Annual General Meeting DKK million 2021 2020
Statutory audit 0.3 0.3
Assurance engagements - -
Tax advisory - -
Other services - -
Total 0.3 0.3
SECTION 4
OTHER DISCLOSURE REQUIREMENTS

CARLSBERG GROUP ANNUAL REPORT 2021 PARENT COMPANY FINANCIAL STATEMENTS 132
SECTION 4.7
TAX
Deferred tax assets amounted to DKK 13m (2020: DKK 103m) and comprised provisions and retirement benefit obligations of DKK 13m (2020: DKK 13m), and tax losses etc. of DKK 0m (2020: DKK 59m). The utilisation of tax loss carryforwards depends on future positive taxable income exceeding the realised deferred tax liabilities. Unrecognised, non-expiring tax losses amounted to DKK 210m (2020: DKK 0m). Deferred tax liabilities amounted to DKK 34m (2020: DKK 10m) and comprised tax on property, plant and equipment of DKK 34m (2020: DKK -31m), and tax provisions of DKK 0m (2020: DKK 10m). Deferred tax, net amounted to a liability of DKK 21m (2020: asset of DKK 93m).
The net change in deferred tax assets of DKK 114m comprised tax recognised in total comprehensive income of DKK 217m (2020: DKK 11m), change in tax provision of DKK -10m (2020: DKK 0m) and a joint taxation contribution of DKK -93m (2020: DKK -29m). The total tax for the year recognised in the income statement comprised an expense of DKK 30m (2020: income of DKK -11m). Of the deferred tax assets, DKK 13m (2020: DKK 5m) is expected to be used within one year. The administration company, Carlsberg A/S, has unlimited and joint legal responsibility with the other Danish companies under the joint taxation scheme for withholding taxes on dividends, interest and royalties.
Reconciliation of tax for the year
DKK million 2021 2020
Calculated tax on profit 716 693
Adjustments to tax for prior years 5 -1
Non-deductible expenses 27 3
Tax-free dividend and tax-exempt items -718 -706
Tax for the year 30 -11
ACCOUNTING ESTIMATES AND JUDGEMENTS
Carlsberg A/S recognises deferred tax assets, including the tax base of tax loss carryforwards, if management assesses that these tax assets can be offset against positive taxable income in the foreseeable future. This judgement is made annually and based on budgets and business plans for the coming years.
ACCOUNTING POLICIES
Carlsberg A/S is the administration company and subject to the Danish rules on mandatory joint taxation of the Carlsberg Group’s Danish companies. Carlsberg A/S accordingly pays all income taxes to the tax authorities under the joint taxation scheme. Danish subsidiaries are included in the joint taxation from the date when they are included in the consolidated financial statements and up to the date when they are excluded from the consolidation. The jointly taxed Danish companies are taxed under the on-account tax scheme. On payment of joint taxation contributions, the current Danish income tax is allocated between the Danish jointly taxed companies in proportion to their taxable income. Companies with tax losses receive joint taxation contributions from other companies that have used the tax losses to reduce their own taxable profit (full absorption). Tax on profit/loss for the year comprises profit/loss from real estate partnerships (joint ventures), as these are not individually taxed but included in the taxable income of the partners. In addition, tax on profit/loss and deferred tax are calculated and recognised as described in section 6 in the consolidated financial statements.

CARLSBERG GROUP ANNUAL REPORT 2021 PARENT COMPANY FINANCIAL STATEMENTS 133
SECTION 4.8
CONTINGENT LIABILITIES AND OTHER COMMITMENTS
Carlsberg A/S has issued guarantees to subsidiaries for pension obligations of DKK 342m (2020: DKK 350m). Carlsberg A/S is jointly registered for Danish VAT and excise duties with Carlsberg Breweries, Carlsberg Danmark, Carlsberg Supply Company Danmark and various other Danish subsidiaries, and is jointly and severally liable for payment of VAT and excise duties. Carlsberg A/S is party to certain lawsuits, disputes etc. of various scopes. In management’s opinion, apart from items recognised in the statement of financial position or disclosed in the financial statements, the outcome of these lawsuits, disputes etc. will not have a material negative effect on the Company’s financial position.
SECTION 4.9
EVENTS AFTER THE REPORTING PERIOD
Apart from the events recognised or disclosed in the financial statements, no events have occurred after the reporting date of importance to the financial statements.
The 2021 financial statements of Carlsberg A/S have been prepared in accordance with International Financial Reporting Standards (IFRS) as adopted by the EU and further requirements in the Danish Financial Statements Act. The financial statements are presented in Danish kroner (DKK), which is the presentation currency. The accounting policies for the Parent Company are the same as for the Group, cf. section 9 in the consolidated financial statements and the individual sections.
SIGNIFICANT ACCOUNTING ESTIMATES AND JUDGEMENTS In preparing Carlsberg A/S’ financial statements, management makes various accounting estimates and judgements that form the basis of presentation, recognition and measurement of the Company’s assets and liabilities. The estimates and judgements made are based on historical experience and other factors that management assesses to be reliable, but that by their very nature are associated with uncertainty and unpredictability. These estimates and judgements may therefore prove incomplete or incorrect, and unexpected events or circumstances may arise. The significant accounting estimates and judgements made and accounting policies specific to the Parent Company are presented in the explanatory notes.
SECTION 5
GENERAL ACCOUNTING POLICIES

CARLSBERG GROUP ANNUAL REPORT 2021 FINANCIAL STATEMENTS 134
The Supervisory Board and the Executive Board have today discussed and approved the Annual Report of the Carlsberg Group and the Parent Company for 2021. The Annual Report has been prepared in accordance with International Financial Reporting Standards as adopted by the EU and further requirements in the Danish Financial Statements Act. In our opinion, the consolidated financial statements and the Parent Company’s financial statements give a true and fair view of the Carlsberg Group’s and the Parent Company’s assets, liabilities and financial position at 31 December 2021 and of the results of the Carlsberg Group’s and the Parent Company’s operations and cash flows for the financial year 2021.
Further, in our opinion the Management review includes a fair review of the development in the Carlsberg Group’s and the Parent Company’s operations and financial matters, of the result for the year, and of the Carlsberg Group’s and the Parent Company’s financial position, as well as describing the significant risks and uncertainties affecting the Carlsberg Group and the Parent Company. In our opinion, the Annual Report of the Carlsberg Group and the Parent Company for the financial year 1 January to 31 December 2021, identified as Carlsberg-2021-12-31.zip, has been prepared, in all material respects, in compliance with the ESEF Regulation. We recommend that the Annual General Meeting approve the Annual Report. Copenhagen, 4 February 2022
REPORTS
MANAGEMENT STATEMENT
Financial statements
Executive Board of Carlsberg A/S
Cees ’t Hart President & CEO
Heine Dalsgaard CFO
Supervisory Board of Carlsberg A/S
Flemming Besenbacher Chair
Henrik Poulsen Deputy Chair
Hans Andersen Carl Bache
Magdi Batato Lars Fruergaard Jørgensen
Lilian Fossum Biner Richard Burrows
Eva Vilstrup Decker Finn Lok
Erik Lund Søren-Peter Fuchs Olesen
Peter Petersen Majken Schultz
Lars Stemmerik

CARLSBERG GROUP ANNUAL REPORT 2021 FINANCIAL STATEMENTS 135
TO THE SHAREHOLDERS OF CARLSBERG A/S REPORT ON THE AUDIT OF THE FINANCIAL STATEMENTS OUR OPINION In our opinion, the Consolidated Financial Statements and the Parent Company Financial Statements (pp 51 - 134) give a true and fair view of the Group’s and the Parent Company’s financial position at 31 December 2021 and of the results of the Group’s and the Parent Company’s operations and cash flows for the financial year 1 January to 31 December 2021 in accordance with International Financial Reporting Standards as adopted by the EU and further requirements in the Danish Financial Statements Act. Our opinion is consistent with our Auditor’s Long-form Report to the Audit Committee and the Board of Directors.
What we have audited The Consolidated Financial Statements and Parent Company Financial Statements of Carlsberg A/S for the financial year 1 January to 31 December 2021 comprise income statement and statement of comprehensive income, statement of financial position, statement of changes in equity, statement of cash flows and notes, including summary of significant accounting policies for the Group as well as for the Parent Company. Collectively referred to as the “Financial Statements”.
BASIS FOR OPINION We conducted our audit in accordance with International Standards on Auditing (ISAs) and the additional requirements applicable in Denmark. Our responsibilities under those standards and requirements are further described in the Auditor’s responsibilities for the audit of the Financial Statements section of our report. We believe that the audit evidence we have obtained is sufficient and appropriate to provide a basis for our opinion. Independence We are independent of the Group in accordance with the International Ethics Standards Board for Accountants’ International Code of Ethics for Professional Accountants (IESBA Code) and the additional ethical requirements applicable in Denmark. We have also fulfilled our other ethical responsibilities in accordance with these requirements and the IESBA Code. To the best of our knowledge and belief, prohibited non-audit services referred to in Article 5(1) of Regulation (EU) No 537/2014 were not provided.
Appointment We were first appointed auditors of Carlsberg A/S on 30 March 2017 for the financial year 2017. We have been reappointed annually by shareholder resolution for a total period of uninterrupted engagement of five years including the financial year 2021. KEY AUDIT MATTERS Key audit matters are those matters that, in our professional judgement, were of most significance in our audit of the Financial Statements for 2021. These matters were addressed in the context of our audit of the Financial Statements as a whole, and in forming our opinion thereon, and we do not provide a separate opinion on these matters.
REPORTS
INDEPENDENT AUDITOR’S REPORTS

CARLSBERG GROUP ANNUAL REPORT 2021 FINANCIAL STATEMENTS 136
Key audit matter How our audit addressed the key audit matter
Recoverability of the carrying amount of goodwill and brands The principal risks are in relation to Management’s assessment of the future timing and amount of cash flows that are used to project the recoverability of the carrying amount of goodwill and brands. There are specific risks related to macroeconomic conditions and volatile earnings caused by volume decline, intensified competition and changed regulations in key markets – conditions that could also result in Management deciding to change brand strategy to drive business performance. Bearing in mind the generally long-lived nature of the assets, the significant assumptions are Management’s view of prices, volumes, discount rates, growth rates, royalty rates, expected useful life, costs, and future free cash flows as well as the judgement in defining cash-generating units (CGUs). We focused on this, as there is a high level of subjectivity exercised by Management in estimating future cash flows and the models used are complex. The key assumptions and accounting treatment are described in section 2.2 “Impairment” in the Consolidated Financial Statements. .
Our audit procedures included considering the appropriateness of the accounting policies for assessing the recoverability of the carrying amount of goodwill and brands and assessing compliance with the accounting standards. In addressing the risks, we considered the appropriateness of Management’s defined CGUs within the business. We evaluated whether there were factors requiring Management to change their definition. We examined the methodology used by Management to assess the carrying amount of goodwill and brands assigned to CGUs, and the process for identifying CGUs that require impairment testing to determine compliance with IFRS. We walked through and tested relevant controls related to assessing the carrying amount of goodwill and brands. We performed detailed testing for the assets where an impairment review was required or indications of impairment were identified. For those assets, we analysed the reasonableness of significant assumptions in relation to the ongoing operation of the assets. We corroborated estimates of future cash flows and challenged whether they are reasonable and supported by the most recent approved Management budgets, including expected future performance of the CGUs, and challenged whether these are appropriate in light of future macroeconomic expectations in the markets. We evaluated the assumptions used by Management, including assessment of price and volume forecasts, discount rates and long-term growth rates, and tested the mathematical accuracy of the relevant value-in-use models prepared by Management. We made use of our internal valuation specialists in the audit. Further, we assessed the appropriateness of disclosures, including sensitivity analyses prepared for the significant assumptions.
Key audit matter How our audit addressed the key audit matter
Revenue recognition Recognition of revenue is complex due to the variety of different revenue streams, ranging from sales of goods, royalty income and sales of by-products recognised when all significant risks and rewards have been transferred to the customer or in terms of the licence agreement. Furthermore, the various discounts and locally imposed duties and fees in regard to revenue recognition are complex and introduce an inherent risk to the revenue recognition process. We focused on this area, as there is a risk of non-compliance with accounting standards due to complexity originating from different customer behaviours, structures, market conditions and terms in the various countries. Revenue recognition and accounting treatment are described in section 1.1 “Segmentation of operations – Accounting estimates and judgements” in the Consolidated Financial Statements.
Our audit procedures included considering the appropriateness of the revenue recognition accounting policies and assessing compliance with the accounting standards. We tested the relevant controls, including applicable information systems and Management’s monitoring of controls used to ensure the completeness, accuracy and timing of revenue recognised. We discussed the judgements related to the recognition, and classification of revenue with Management. Further, we performed substantive procedures regarding invoicing, significant contracts, significant transaction streams (including discounts), locally imposed duties, fees and cut-off at year-end in order to assess the accounting treatment and principles applied. We applied data analysis in our testing of revenue transactions in order to identify transactions outside the ordinary transaction flow, including journal entry testing. Finally, we assessed the adequacy of disclosures relating to the revenue recognition.

CARLSBERG GROUP ANNUAL REPORT 2021 FINANCIAL STATEMENTS 137
STATEMENT ON THE MANAGEMENT REVIEW Management is responsible for Management’s Review, pages 3-49. Our opinion on the Financial Statements does not cover Management’s Review, and we do not express any form of assurance conclusion thereon. In connection with our audit of the Financial Statements, our responsibility is to read Management’s Review and, in doing so, consider whether Management’s Review is materially inconsistent with the Financial Statements or our knowledge obtained in the audit, or otherwise appears to be materially misstated. Moreover, we considered whether Management’s Review includes the disclosures required by the Danish Financial Statements Act. Based on the work we have performed, in our view, Management’s Review is in accordance with the Consolidated Financial Statements and the Parent Company Financial Statements and has been prepared in accordance with the requirements of the Danish Financial Statements Act. We did not identify any material misstatement in Management’s Review.
MANAGEMENT’S RESPONSIBILITIES FOR THE FINANCIAL STATEMENTS Management is responsible for the preparation of consolidated financial statements and parent company financial statements that give a true and fair view in accordance with International Financial Reporting Standards as adopted by the EU and further requirements in the Danish Financial Statements Act, and for such internal control as Management determines is necessary to enable the preparation of financial statements that are free from material misstatement, whether due to fraud or error. In preparing the Financial Statements, Management is responsible for assessing the Group’s and the Parent Company’s ability to continue as a going concern, disclosing, as applicable, matters related to going concern and using the going concern basis of accounting unless Management either intends to liquidate the Group or the Parent Company or to cease operations, or has no realistic alternative but to do so. AUDITOR’S RESPONSIBILITIES FOR THE AUDIT OF THE FINANCIAL STATEMENTS Our objectives are to obtain reasonable assurance about whether the Financial Statements as a whole are free from material misstatement, whether due to fraud or error, and to issue an auditor’s report that includes our opinion. Reasonable assurance is a high level of assurance, but is not a guarantee that an audit conducted in accordance with ISAs and the additional requirements applicable in Denmark will always detect a material misstatement when it exists. Misstatements can arise from fraud or error and are
considered material if, individually or in the aggregate, they could reasonably be expected to influence the economic decisions of users taken on the basis of these Financial Statements. As part of an audit in accordance with ISAs and the additional requirements applicable in Denmark, we exercise professional judgement and maintain professional scepticism throughout the audit. We also: • Identify and assess the risks of material
misstatement of the Financial Statements, whether due to fraud or error, design and perform audit procedures responsive to those risks, and obtain audit evidence that is sufficient and appropriate to provide a basis for our opinion. The risk of not detecting a material misstatement resulting from fraud is higher than for one resulting from error, as fraud may involve collusion, forgery, intentional omissions, misrepresentations, or the override of internal control.
• Obtain an understanding of internal control relevant to the audit in order to design audit procedures that are appropriate in the circumstances, but not for the purpose of expressing an opinion on the effectiveness of the Group’s and the Parent Company’s internal control.
• Evaluate the appropriateness of accounting policies used and the reasonableness of accounting estimates and related disclosures made by Management.
• Conclude on the appropriateness of Management’s use of the going concern basis of accounting and based on the audit evidence obtained, whether a material uncertainty exists related to events or conditions that may cast significant doubt on the Group’s and the Parent Company’s ability to continue as a going concern. If we conclude that a material uncertainty exists, we are required to draw attention in our auditor’s report to the related disclosures in the Financial Statements or, if such disclosures are inadequate, to modify our opinion. Our conclusions are based on the audit evidence obtained up to the date of our auditor’s report. However, future events or conditions may cause the Group or the Parent Company to cease to continue as a going concern.
• Evaluate the overall presentation, structure
and content of the Financial Statements, including the disclosures, and whether the Financial Statements represent the underlying transactions and events in a manner that gives a true and fair view.
• Obtain sufficient appropriate audit evidence
regarding the financial information of the entities or business activities within the Group to express an opinion on the Consolidated Financial Statements. We are responsible for the direction, supervision and performance of the group audit. We remain solely responsible for our audit opinion.

CARLSBERG GROUP ANNUAL REPORT 2021 FINANCIAL STATEMENTS 138
We communicate with those charged with governance regarding, among other matters, the planned scope and timing of the audit and significant audit findings, including any significant deficiencies in internal control that we identify during our audit. We also provide those charged with governance with a statement that we have complied with relevant ethical requirements regarding independence, and to communicate with them all relationships and other matters that may reasonably be thought to bear on our independence and, where applicable, actions taken to eliminate threats or safeguards applied. From the matters communicated with those charged with governance, we determine those matters that were of most significance in the audit of the Financial Statements of the current period and are therefore the key audit matters. We describe these matters in our auditor’s report unless law or regulation precludes public disclosure about the matter or when, in extremely rare circumstances, we determine that a matter should not be communicated in our report because the adverse consequences of doing so would reasonably be expected to outweigh the public interest benefits of such communication.
REPORT ON COMPLIANCE WITH THE ESEF REGULATION
As part of our audit of the Financial Statements we performed procedures to express an opinion on whether the annual report of Carlsberg A/S for the financial year 1 January to 31 December 2021 with the filename Carlsberg-2021-12-31.zip is prepared, in all material respects, in compliance with the Commission Delegated Regulation (EU) 2019/815 on the European Single Electronic Format (ESEF Regulation) which includes requirements related to the preparation of the annual report in XHTML format and iXBRL tagging of the Consolidated Financial Statements. Management is responsible for preparing an annual report that complies with the ESEF Regulation. This responsibility includes: • The preparing of the annual report in XHTML
format; • The selection and application of appropriate
iXBRL tags, including extensions to the ESEF taxonomy and the anchoring thereof to elements in the taxonomy, for all financial information required to be tagged using judgement where necessary;
• Ensuring consistency between iXBRL-tagged data and the Consolidated Financial Statements presented in human-readable format; and
• For such internal control as Management determines necessary to enable the preparation of an annual report that is compliant with the ESEF Regulation.
Our responsibility is to obtain reasonable assurance on whether the annual report is prepared, in all material respects, in compliance with the ESEF Regulation based on the evidence we have obtained, and to issue a report that includes our opinion. The nature, timing and extent of procedures selected depend on the auditor’s judgement, including the assessment of the risks of material departures from the requirements set out in the ESEF Regulation, whether due to fraud or error. The procedures include: • Testing whether the annual report is prepared
in XHTML format;
• Obtaining an understanding of the company’s iXBRL tagging process and of internal control over the tagging process;
• Evaluating the completeness of the iXBRL tagging of the Consolidated Financial Statements;
• Evaluating the appropriateness of the company’s use of iXBRL elements selected from the ESEF taxonomy and the creation of extension elements where no suitable element in the ESEF taxonomy has been identified;
• Evaluating the use of anchoring of extension elements to elements in the ESEF taxonomy; and
• Reconciling the iXBRL-tagged data with the audited Consolidated Financial Statements.
In our opinion, the annual report of Carlsberg A/S for the financial year 1 January to 31 December 2021 with the file name Carlsberg-2021-12-31.zip is prepared, in all material respects, in compliance with the ESEF Regulation.
Hellerup, 4 February 2022 PricewaterhouseCoopers Statsautoriseret Revisionspartnerselskab CVR No 3377 1231
Mogens Nørgaard Mogensen State Authorised Public Accountant mne21404
Michael Groth Hansen State Authorised Public Accountant mne33228

CARLSBERG GROUP ANNUAL REPORT 2021 FINANCIAL STATEMENTS 139
Carlsberg A/S 1 J. C. Jacobsens Gade 1799 Copenhagen V Denmark Phone +45 3327 3300 www.carlsberggroup.com CVR No. 61056416
Design & layout: Operate & Omnidocs Proofreading: Borella projects