MOL Group Annual Report 2017
274
MOL Group Annual Report 2017
-
Upload
khangminh22 -
Category
Documents
-
view
1 -
download
0
Transcript of MOL Group Annual Report 2017

MOL Group Annual Report 2017
DOWNSTREAM & CONSUMER SERVICES
*as of 31 December 2017
MEMBERS OFMOL GROUP
2013
2014
2015
2016
2017
2013
2014
2015
2016
2017
OPERATING CASH FLOW (USD mn)
GEARING (%)
2,748
16
1,863
20
2,088
21
1,843
25
2,070
Production 2017
17
19Refined product and Petchem Sales
Service stations*
Transactions per day
1,8811,000,000M
tpa
Capitalisation USD bn*
0 1 2 3
0 1 2 3
0 10 20 30
2013
2014
2015
2016
2017
CLEAN CCS EBITDA (USD mn)
2,308
2,183
2,459
2,153
2,447
MOL GROUP AT A GLANCE
across three continents
30countries
2P Reserves*dynamic international workforce
26,000people
107 mboepd
356MMboe
$9.5
UPSTREAM

KEY OPERATING DATA
Key Upstream data* 2016 restated 2017 16/17 (%)
Total gross hydrocarbon reserves, SPE 2P (Mmboe) 459 356 (22)
Total hydrocarbon production (mboepd) 113 107 (5)
Key Downstream data* 2016 2017 16/17 (%)
Total crude oil product sales (kt) 19,056 19,453 2
Total retail fuel sales (m litre) 5,239 5,548 6
Polymer sales (kt) 1,001 1,122 12
Key Gas Midstream data* 2016 2017 16/17 (%)
Hungarian natural gas transmission (m cm) 11,958 14,629 22
Environmental and social performance data** 2016 restated 2017 16/17 (%)
Carbon Dioxide (CO2) emissions (Mt) 5.4 6.5 20
Total Recordable Injury Rate (TRIR) 1.3 1.5 15
Total score in the Dow Jones Sustainability Index assessment 72 69 (4)
* Detailed data analysis are in the Management Discussion and Analysis chapter.** Detailed data analysis are in the Sustainability Information chapter.
SHAREHOLDERS STRUCTURE (%) The Company’s share capital amounts to HUF 102,428,682,578 represented by 819,424,824 pieces registered ordinary shares of the series “A” with a par value of HUF 125, 578 pieces registered ordinary shares of the series “C” with a par value of HUF 1,001 and one piece registered voting preference share of the series “B” with a par value of HUF 1,000 that entitles the holder thereof to preferential rights as specified in the present Articles of Associ-ation. The "B" series share is owned by the Hungarian Govern-ment.
We have presented the ownership structure of MOL Plc., as at31 December 2017.
Please note, that data above do not fully reflect the ownershipstructure in the Share Register. The registration is not mandatory.
The shareholders may exercise their rights towards thecompany if they are registered in the Share Register.
According to the Articles of Association no shareholder or share-holder group may exercise more than 10% of the voting rights.
KEY FINANCIAL DATA - IFRS (HUF BN)*
2016 restated 2017 16/17 (%) 2017 (USD mn)
Net revenue 3,553 4,130 16 15,114
EBITDA 623 673 8 2,444
Clean CCS EBITDA 605 673 11 2,447
EBITDA excluding special items 630 680 8 2,472
o/w Upstream 190 235 24 854
o/w Downstream 348 331 (5) 1,202
o/w Consumer Services 86 97 13 358
o/w Gas Midstream 54 61 12 223
Profit for the year attributable to equity holders of the parent 263 307 17 1,112
Operating cash flow 519 560 8 2,070
Capital expenditures and investments 309 280 (9) 1 037
Return On Average Capital Employed (ROACE) %** 7.0 9.3 33 N. A.
* Detailed data analysis is in the Management Discussion and Analysis chapter.** Based on profit after taxes
Foreign investors (mainly institutional) 35.0%
Domestic private investors 3.4%
Domestic institutional investors 5.5%
OTP Fund Management 1.2%
MUFG 0.6%
OTP Bank Plc. 4.9%
MOL Plc. (treasury shares) 9.9%
UniCredit Bank AG 3.0%
ING Bank N.V. 4.1%
Oman Oil (Budapest) Limited 7.1%
Hungarian State (MNV Zrt., Pension Reform and Debt Reduction Fund 25.2%
KEY FINANCIALAND OPERATING DATA

ABOUT MOL GROUP INTEGRATED REPORTING
MOL Group’s 10th Integrated Annual Report summa-rizes the company’s performance in 2017. In the integrated report we give an account of the group’s economic, social and environmental value creation processes and results. We are committed to transparency, and this integrated overview is the most efficient method of communicating last year’s performance, encompassing our financial year from 1 January to 31 December 2017, to our shareholders and other interested stakeholders.
We follow globally recognized frameworks to ensure that our report meets the highest standards. This includes:
Complying with the International Financial Reporting Standards (IFRS) when reporting on financial results
Complying with the Global Reporting Initia-tive (GRI) Standards framework when providing a comprehensive overview of our sustainability performance
Using sectoral guidance from the GRI (Oil and Gas Sector Disclosures), and the IPIECA Voluntary Guid-ance on Sustainability Reporting
Reporting progress against the 10 principles of the United Nations Global Compact (UNGC)
The present report is also our disclosure in compliance with the Directive 2014/95/EU on disclosure of non-financial and diver-sity information by certain large undertakings and groups.
The report includes historical information where neces-sary to put our annual performance into context. The content of this integrated annual report is also available online at: www.molgroup.info/annualreport2017.
This integrated annual report has been prepared both in English and Hungarian. In the event of any discrepan-cies, the English version should take precedence. Further information and disclosures about MOL Group can be found at: www.molgroup.info.
ABOUT MOL GROUP INTEGRATED REPORTING

OVERVIEWMOL Group integrated reporting 2Letter from the Chairman CEO and the Group CEO 4Materiality Assessments 6Key achievements and outlook 8Our Businesses in Pictures 10
MANAGEMENT DISCUSSION AND ANALYSIS
Overview of the macroeconomic and industry environment 26Integrated Corporate Risk Management 32Financial and operational review of 2017 34
Summary of 2017 results 34Outlook on the strategic horizon 38Upstream Overview 40Downstream Overview 50Innovative Businesses and Services Overview 62Gas Midstream Overview 74
CORPORATE GOVERNANCECorporate Governance 84Board of Directors 100Executive Board 106Supervisory Board 111Report of the Supervisory Board 114Corporate and Shareholder Information 116
FINANCIAL STATEMENTS AND NOTESIndepent Auditors' Report 124Primary statements 130Notes to the Financial Statements – Accounting information, policies and significant estimates 138
SUSTAINABILITY INFORMATIONConsolidated Sustainability Performance Data (GRI ) 202
SUPPLEMENTARY DATAHistorical Financial Information (IFRS) 252
Glossary 266Contact information 272
MOL Group is now on a journey to transform the business. We have
big ambitions and potential for growth,
wich we will achieve by combining scale,
professionalism and know-how, with energy,
innovation, and a willingness to look for
different, better ways of working.
03

LETTER FROM THE CHAIRMAN CEO AND GROUP CEO
We are glad to say that 2017 was another successful year of delivering strong financial results, as we comfortably beat our ambitious targets. Equally importantly, 2017 was also a year of visible progress with important milestones achieved along our transformation journey set out in the MOL 2030 strategy.
The need to develop and explain long-term strategies that take into account the global transition to lower carbon econ-omies has never been greater for oil & gas companies. To respond to the challenges of changing consumer habits, regulatory actions tackling climate change and fast-moving innovation in technology, MOL announced its progres-sive new long-term strategy, MOL 2030, at the end of 2016. The strategy envisages the transformation of MOL for the “beyond the fuel age”, for a world which may see diminishing dominance of fossil fuels. We do not think of these changes from a position of value being at risk, but rather as an oppor-tunity. Our 2030 strategic transformation is the anticipation of our firm in wanting to seize the initiative, while not forget-ting about delivering strong results along the road.
DELIVERY: OUTSTANDING FREE CASH FLOW GENERATION IN 2017
We are very pleased to report that we produced a strong set of results in 2017 and a significant improvement in our earnings and cash generation, comfortably beating even our upgraded targets. Importantly, all our businesses deliv-ered increased profitability. This also allowed us to continue the trend of steadily increasing dividend distribution to our shareholders, while preserving the financials strength and flexibility necessary to fund our corporate transformation. Following the successful efforts over the past two years in adjusting the business to be fit and to prosper in a low oil price environment, we are happy to see Upstream becoming a major contributor to the group results. During 2017 oil prices averaged at similar levels as in 2015, yet our free cash flow generation climbed from USD 1/boe to USD 14/boe, contributing over half a billion USD.
Downstream continued to raise its contribution to group profitability from an already high base and remained the
cash engine of the group. It benefited from a supportive refining macro environment in 2017 as well as from further efficiency improvements delivered by the NxDSP program.
Consumer services earnings continued to increase at a double-digit pace during the year, representing now around 15% of group earnings, a step change achieved in a few years. The continued roll-out of our “Fresh Corner” concept across our retail network supported non-fuel margin growth, consequently non-fuel share of total retail margin reached a new high in the last quarter of 2017.
Overall, while we made good progress against most of our targets, there are some areas where we have to put even more focus and efforts in the future, as our commitment to deliver is stronger than ever. TRANSFORMATION: THE FIRST MILESTONES ALONG THE 2030 JOURNEY
Transformation is never a linear process. In some areas it may be happening fast, whilst in others it takes time to achieve the targets. We are confident that a strong and solid foundation was laid already during the first year of MOL 2030 and we also recognize that there is a lot to do in the years to come. A committed management team is in place to support the transformation of our businesses.
In Consumer Services, we have already taken the first visible steps to be the driver of change in regional transportation, as we launched a fleet management service, we are building the largest EV network across the CEE and we introduced a brand new car sharing service. We will continue to deliver greater value with exciting new retail and mobility prod-ucts and services and our digitalization strategy will lead to a more personalized and convenient customer experience in line with the changing consumer trends.
As has been the case in the past, we never rest in Down-stream. After the successful implementation of two effi-ciency programs spanning six years, new ambitious targets were set in our brand new “DS2022”, a program of transfor-mation, growth and efficiency and the first milestone in the
LETTER FROM THE CHAIRMAN AND THE GROUP CEO

Zsolt HERNÁDI Chairman and CEO,
MOL Group
József MOLNÁRGroup Chief Executive Officer,
MOL Group
MOL 2030 strategy implementation. Several key steps were already taken in 2017 in our transformational journey to become a leading chemical company: all polyol technology license agreements were secured, we teamed up with world-class partners, the European Commission endorsed a regional investment aid for the project and an additional product line was included in the scope providing us with increased optionality and better margin capture.
In Upstream, we are very proud of the resilience and value creation of our operations. Yet we also acknowledge that the key challenge remains how to use the cash we generate from our existing barrels to replace reserves through inor-ganic steps as we transform ourselves from a predomi-nantly CEE-based producer to an international one. We are not in a rush, as our production is expected to be stable around the current levels for a few more years, and existing barrels can comfortably fund inorganic reserve replace-ment, but we are always on the lookout for attractive investment opportunities.
CULTURE AND PEOPLE: NEW CORPORATE VALUES TO SUPPORT THE 2030 STRATEGY
A transformation of the scale we are currently under-taking impacts everyone within the firm, which is why the successful execution of our 2030 strategy rests on our ability to reshape our corporate culture. MOL Group Corpo-rate Values: people, agility, ownership and customers, were developed to meet this aim, as people across the organiza-tion are central to the ongoing transformation. Now more than ever, as technological disruption speeds up, markets move faster and customers rightfully ask for more. Our success relies on our people and their ability to bring some of the best, most innovative products and services to the market in order to continually exceed customer experience. Ownership and agility is required at all levels of the organi-zation if this transformation is to flourish.
SUSTAINABLE FUTURE THROUGH RESPONSIBLE OPERATIONS
Conscious of the fact that our activities affect people’s lives, social expectations towards MOL have never been higher. We fundamentally believe that corporate wealth should be created in a viable, non-exhaustive manner, without causing irreversible damage neither to the corporate itself nor to its stakeholder system. This is also why operational eco-efficiency, environmental impact, and health and safety are at the very core of our decision making. Additionally, increasing investor interest in how environmental, social and governance (ESG) related risks may affect their invest-ments is increasingly at the center and forefront of their investment decisions. These factors alongside our trans-formation have led us to boost our ESG transparency and engagement, resulting in the adoption of the latest reporting standards (this report serves as our communication on progress to the UN Global Compact) and receiving consist-ently strong ESG scores across leading sustainability indices and rating agencies.
As we have said before, we can only be successful in the future if we remain essential to our clients and the society through shared and sustainable value creation, whilst running the business with the long-term interests of our shareholders. This is the reason why we have over the years built strong stakeholder partnerships, as the key to the successful delivery of our transformation rests on our ability to act and invest in a purpose-fulfilling manner, and balance our long-term value creation with a broader set of stakeholders, as we are ultimately tied to the economic and social prosperity of the regions in which we operate in. In this highly successful first year of our transformation, we would like to extend our most sincere thanks to our share-holders, colleagues, host communities, clients and suppliers whose daily contribution is pushing MOL to be the leading force in the CEE’s transition to a low carbon region.
05

MATERIALITY ASSESSMENT
Materiality assessment is an essential exercise and guiding concept for our sustainable develop-ment improvement activities and integrated annual reporting processes. It is also a key procedure that is required for compliance with the GRI sustainability reporting standards (GRI Standards), allowing us to deliver a more comprehensive and focused report. We continuously consult internal and external stake-holders to understand which sustainability topics are relevant to the industry, and most importantly, which are important for promoting successful and responsible operations of MOL Group.Internally, on a group level we involve and seek approval from the executive decision-makers from our Sustainable Development Working Committee and the Sustainable Development Committee of the Board of Directors. We also work closely with trade unions to obtain feedback about the group materiality matrix. Locally, we work closely with our regional subsid-iary companies to adapt to different operating envi-ronments and different stakeholders. In 2017, each regional company defined its own materiality matrix by analyzing and aggregating the materiality considera-tions for each business segment. SD-related audits also play a role in bringing to the surface emerging issues which might become material over time.External stakeholders are continuously engaged via different forums and through our dedicated feedback channels (e.g. [email protected]). We pay special attention to discussing potentially relevant topics with sustain-
ability analysts from rating agencies (MSCI, FTSE-4GOOD, RobecoSAM, CDP, oekom, etc.). During 2017, and coinciding with the first year of our 2030 strategy, investors showed an increasing interest in sustainability-related matters, providing invalu-able direct feedback for both sustainable development and investor relations activities. We are continu-ously benchmarking our peers to gain a better under-standing of what the material topics are for the oil and gas industry.However, we are aware that more effort is needed to identify external stakeholder signals in order to under-stand and mitigate risks, whilst identifying oppor-tunities in the transition to a low carbon world. Our intention is to improve stakeholder management skills and dialogue in the coming years. The applied proce-dure for undertaking materiality assessments is not designed to exclude any of the relevant topics from our reporting. The assessment is drawn up with a view to ensure that the most material topics are high-lighted and described in more detail, thereby providing readers of the report with deeper insight into our sustainability performance.The three topics included in the light grey area of the below illustration are considered less significant compared to material topics, but are nevertheless still monitored, managed and measured closely.For more information about the topics and MOL Group’s related performance, please check the Notes to Sustainability Performance section of this report.
INTERNAL FACTORSSignificance of economic, environmental, and social impacts
EXTE
RNA
L FA
CTO
RSIn
fluen
ce o
n st
akeh
olde
r ass
essm
ents
and
dec
ision
s Ethics, transparency,
and governance
Community relationships
Future product portfolio
Energy efficiency and GHG
Biodiversity Eco-efficiency Spills and leakages Occupational health and safety
Process safety, Crisis management
Human Rights Customers Human resources
Suppliers Labour Practices
NOT MATERIAL MATERIAL
MATERIALITY OF RELEVANT TOPICS
MATERIALITY ASSESSMENT

Safety Culture Award (Given by Faculty of Safety Engineering
at the University of Mining - Technical University of Ostrava)
AICO Grand Prix. Category: Strategic Communication.
(Given by The Association of Internal Communications)
Most Desirable Employer 2017 in Oil & Gas Industry
(Given by Poslodavac Project Online
Supplier Sustainability Rating. (Given by EcoVadis)
Cannes Corporate Media and TV Awards. Category: Marketing
Communication – B2C, MOL Multipont Arnold
(Given by Filmservices International)
Lollipop 2017. Category: Event resolutions - MOL 360 concert
Best SWIFT Solution in the Adam Smith Awards
(Organized by Treasury Today)
Inclusion in the Dow Jones Sustainability Index
(Given by RobecoSAM)
Best Employer of the year (Given by Profesia)
Most Trustworthy Brand (Given by ATOZ Marketing Services)
Grow Full Standard Certificate. For raising awareness in family-
friendly policies and gender equality. (Given by Mamforce Company)
Employer Partner Certificate. Quality in HR systems & processes
(Given by Selectio Ltd. & partners)
Employer of First Choice; INA was placed within the Top 10 most
attractive Employers in Croatia. (Given by MojPosao)
Regional Business partner of the year (Given by Mass Media International)
Highest Creditworthiness Rating Certificate
(Given by Bisnode)
Best People at Service Stations - 2nd & 3rd place
(Given by Petrol summit)
1.
2.
1.
2.
1. 2.
07
AWARDS

FUNDAMENTAL BUILDING BLOCKS IN MOL
2017 TARGETS
2017 RESULTS
2018TARGETS
RESILIENT INTEGRATED
BUSINESS MODEL
FINANCIAL DISCIPLINE
SYSTEMATICSAFETY &
EFFICIENCY
HIGH-QUALITY
LOW-COST ASSET BASE
MOL 2030: BUILD ON EXISTING
STRENGTHS
GROUP CLEAN CCS EBITDA
GROUP CAPEX (ORGANIC)
SIMPLIFIED FCF*
NxDSP
OIL & GAS PRODUCTION**
NET DEBT/EBITDA
HSE – TRIR***
USD 2.3 BN+
USD 1.3 BN+
USD 160 MN
~110 MBOEPD
‹ 2x
‹ 1.7
USD 2.45 BN
USD 1.04 BNUSD 1.0 BN
USD 1.41 BN
USD 100 MN
107 MBOEPD
0.65x
1.5
~USD 2.2 BN
USD 1.1–1.3 BN
USD 0.9–1.1 BN
USD 100 MN(DS 2022)
~ 110 MBOEPD
‹ 2x
‹ 1.5
* Clean CCS EBIDTA less organic capex** Including JVs and associates*** Total Recordable Injury Rate
KEY ACHIEVEMENTS AND OUTLOOK

FINANCIAL HIGHLIGHTS
Clean CCS EBITDA of USD 2.45bn in 2017 (HUF 673bn), exceeding the upgraded target (USD 2.3bn+) for the year. Simplified FCF jumped by 21% to USD 1.41bn, comfortably beating the upgraded full-year target (USD 1.3bn+). Downstream continued to deliver robust results, Clean CCS EBITDA came in at USD 1,178mn (HUF 324bn) in 2017. Consumer Services, a separate business segment from 2017, reached a historic high EBITDA of USD 358mn (HUF 97bn) in 2017. The Upstream segment’s EBITDA, excluding special items, jumped to USD 854mn (HUF 235bn) in 2017. Credit metrics improved as a result of strong cash generation, Net Debt/EBITDA decreased to 0.65 from 0.97 in 2016. S&P upgraded MOL to BBB-, thus MOL is now a fully investment grade issuer.
OPERATIONAL HIGHLIGHTS
Key licence agreements were signed for core technologies of the flagship „Polyol Project”, marking the first milestone along this major petrochemicals transformational journey.
MOL’s most significant E&P development project in the UK North Sea was commissioned on time and well below the original sanctioned budget with outstanding HSE results.
Preparations stated for launching a new car-sharing service, MOL Limo, in Budapest with 300 cars (partly EVs). MOL remained a Dow Jones Sustainability World Index constituent for the second consecutive year.
OUTLOOK
Working assumptions in line with the 2017-21 financial framework: oil price at the higher end of the USD 40-60/bbl range, normalising Downstream margins (MOL Group refinery margin: USD 4-5/bbl with some upside risk; MOL Group petchem margin: EUR 400-500/t, at the lower end of the range).
Around USD 2.2bn Clean CCS EBITDA at the planning assumptions. USD 1.1-1.3bn organic CAPEX in 2017 (including around USD 0.3bn related to the MOL 2030 strategic growth projects). Sustained free cash flow generation; operating cash flows to cover sustain CAPEX, rising dividends and the transformational
projects. Maintain robust balance sheet and financial flexibility. Downstream: first year of DS2022 with important FIDs (polyol, delayed coker), progress on other strategic projects and delivery
of visible efficiency gains. Consumer Services: continued focus on non-fuel and mobility services roll-out. Upstream: material value creation with around 110 mboepd production and the focus on Catcher ramp-up; inorganic reserves
replacement high on the agenda.
09

UPSTREAM

VALUE CREATION
Becoming a significant free cash-flow contributor
11
PROFITABILITYAnother year of outstanding earnings
DOWNSTREAM

PROFITABILITY
13

GROWTHGenerating strong earnings growth in both fuel and non-fuel
INNOVATIVE BUSINESSES AND SERVICES

15

RELIABILITYA stable contributor to MOL Group
GAS MIDSTREAM

RELIABILITY
17

SUSTAINABLE TRANSFORMATION
SUSTAINABILITY

SUSTAINABLE TRANSFORMATION
Adapting to a low carbon, plastics sensitive world
19
HUMAN RESOURCES

EMPLOYEE EXPERIENCE
Attracting the right talent and strengthening corporate culture
21

CARING PARTNERTaking care of local community well-being
CORPORATE SOCIAL RESPONSIBILITY

CARING PARTNER
23


MANAGEMENT DISCUSSION AND ANALYSIS

CONTENTS1. Overview of the macroeconomic and industry environment .................................... 27
2. Integrated corporate risk management ....................................................................... 32
3. Financial and operational overview of 2017 ................................................................. 34 3.1 Summary of 2017 results ............................................................................................... 34 3.2 Outlook on the strategic horizon ................................................................................ 38 3.3 Upstream ........................................................................................................................ 40 3.4 Downstream ................................................................................................................... 50 3.5 Innovative businesses and services ............................................................................ 62 3.6 Gas midstream .............................................................................................................. 74
4. Appendices ........................................................................................................................... 79
OVERVIEW OF THE MACROECONOMIC AND INDUSTRY ENVIRONMENT

WORLD ECONOMY
The cyclical upswing – underway since mid-2016 – has continued to strengthen. Around 2/3 of the countries, accounting for three quarters of world GDP, have seen a stronger growth in 2017 than in the previous year, the broadest synchronized global growth upsurge since 2010. Global growth for 2017 is estimated to have reached 3.7%, a significant accel-eration compared to the growth of 3.2% in 2016 and the highest rate of global growth over the last 6 years.
The recent acceleration in GDP growth stems predominantly from firmer growth in developed economies, although East and South Asia remain the world’s most dynamic regions. Cyclical improvements in Argentina, Brazil, Nigeria and the Russian Federation, as these economies emerge from recession, also explain roughly a third of the rise in the rate of global growth between 2016 and 2017.Growth in China is estimated to have reached 6.9% in 2017, marking the first acceleration in growth since 2010. The stronger than expected growth can be explained by healthy
OVERVIEW OF THE MACROECONOMIC AND INDUSTRY ENVIRONMENT
10% OR MORE
6% - 10%
3%-6%
0% - 3%
LESS THAN 0%
NO DATA
Source: IMF
Real GDP growth (annual percent change, 2017)
27
domestic demand supported by continued fiscal support and the stronger-than expected recovery of exports. Still, credit continues to grow considerably faster than GDP making the Chinese financial sector vulnerable.The estimated 2017 GDP growth of 2.3% in the U.S. marks a significant improvement compared to the 1.5% growth recorded in 2016. Besides the solid private consumption and investment growth, weakness of the dollar and gradually increasing oil prices supported the economy. The 10% loss of the U.S. dollar against the euro last year was the steepest drop in more than a decade despite the three Fed interest rate hikes and a loosening European Central Bank.Growth gained substantial momentum in the Eurozone, reaching an estimated 2.5% in 2017— way higher than previously expected — with broad-based improvements across member countries spurred by policy stimulus, improving labour market conditions, rising confidence and strengthening global demand. In particular, private sector credit continued to respond to the loose monetary policy stance of the European Central Bank, and both domestic demand and import growth were robust.
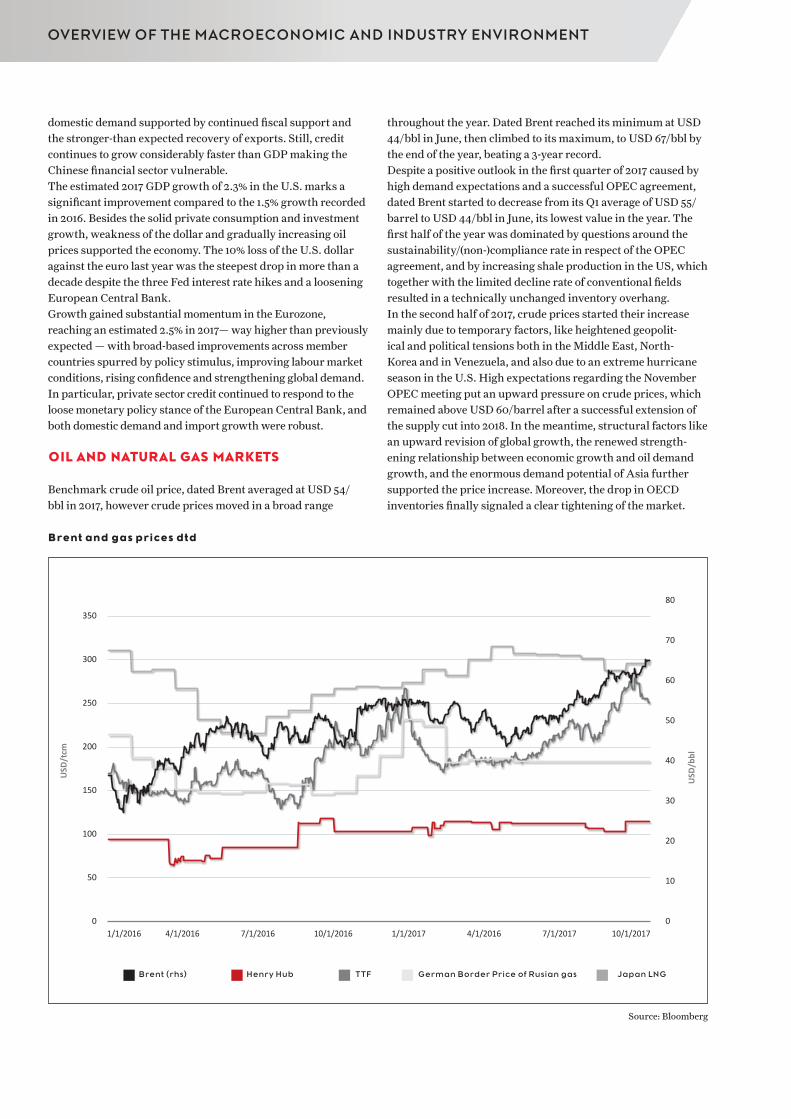
OIL AND NATURAL GAS MARKETS
Benchmark crude oil price, dated Brent averaged at USD 54/bbl in 2017, however crude prices moved in a broad range
Source: Bloomberg
Brent and gas prices dtd
throughout the year. Dated Brent reached its minimum at USD 44/bbl in June, then climbed to its maximum, to USD 67/bbl by the end of the year, beating a 3-year record.Despite a positive outlook in the first quarter of 2017 caused by high demand expectations and a successful OPEC agreement, dated Brent started to decrease from its Q1 average of USD 55/barrel to USD 44/bbl in June, its lowest value in the year. The first half of the year was dominated by questions around the sustainability/(non-)compliance rate in respect of the OPEC agreement, and by increasing shale production in the US, which together with the limited decline rate of conventional fields resulted in a technically unchanged inventory overhang.In the second half of 2017, crude prices started their increase mainly due to temporary factors, like heightened geopolit-ical and political tensions both in the Middle East, North-Korea and in Venezuela, and also due to an extreme hurricane season in the U.S. High expectations regarding the November OPEC meeting put an upward pressure on crude prices, which remained above USD 60/barrel after a successful extension of the supply cut into 2018. In the meantime, structural factors like an upward revision of global growth, the renewed strength-ening relationship between economic growth and oil demand growth, and the enormous demand potential of Asia further supported the price increase. Moreover, the drop in OECD inventories finally signaled a clear tightening of the market.
USD
/tcm
350
300
250
200
150
100
50
01/1/2016 4/1/2016 7/1/2016 10/1/2016 1/1/2017 4/1/2016 7/1/2017 10/1/2017
Brent (rhs) Henry Hub TTF German Border Price of Rusian gas Japan LNG
80
70
60
50
40
30
20
10
0
USD
/bbl
OVERVIEW OF THE MACROECONOMIC AND INDUSTRY ENVIRONMENT
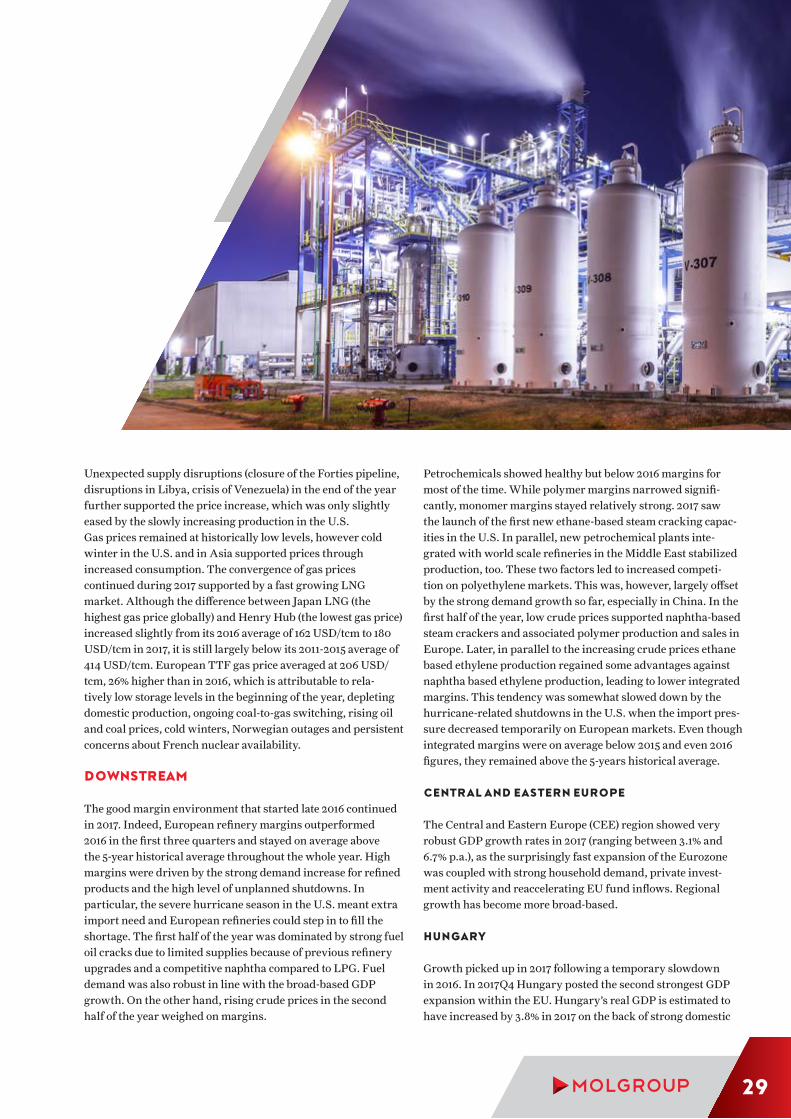
Unexpected supply disruptions (closure of the Forties pipeline, disruptions in Libya, crisis of Venezuela) in the end of the year further supported the price increase, which was only slightly eased by the slowly increasing production in the U.S.Gas prices remained at historically low levels, however cold winter in the U.S. and in Asia supported prices through increased consumption. The convergence of gas prices continued during 2017 supported by a fast growing LNG market. Although the difference between Japan LNG (the highest gas price globally) and Henry Hub (the lowest gas price) increased slightly from its 2016 average of 162 USD/tcm to 180 USD/tcm in 2017, it is still largely below its 2011-2015 average of 414 USD/tcm. European TTF gas price averaged at 206 USD/tcm, 26% higher than in 2016, which is attributable to rela-tively low storage levels in the beginning of the year, depleting domestic production, ongoing coal-to-gas switching, rising oil and coal prices, cold winters, Norwegian outages and persistent concerns about French nuclear availability.
DOWNSTREAM
The good margin environment that started late 2016 continued in 2017. Indeed, European refinery margins outperformed 2016 in the first three quarters and stayed on average above the 5-year historical average throughout the whole year. High margins were driven by the strong demand increase for refined products and the high level of unplanned shutdowns. In particular, the severe hurricane season in the U.S. meant extra import need and European refineries could step in to fill the shortage. The first half of the year was dominated by strong fuel oil cracks due to limited supplies because of previous refinery upgrades and a competitive naphtha compared to LPG. Fuel demand was also robust in line with the broad-based GDP growth. On the other hand, rising crude prices in the second half of the year weighed on margins.
Petrochemicals showed healthy but below 2016 margins for most of the time. While polymer margins narrowed signifi-cantly, monomer margins stayed relatively strong. 2017 saw the launch of the first new ethane-based steam cracking capac-ities in the U.S. In parallel, new petrochemical plants inte-grated with world scale refineries in the Middle East stabilized production, too. These two factors led to increased competi-tion on polyethylene markets. This was, however, largely offset by the strong demand growth so far, especially in China. In the first half of the year, low crude prices supported naphtha-based steam crackers and associated polymer production and sales in Europe. Later, in parallel to the increasing crude prices ethane based ethylene production regained some advantages against naphtha based ethylene production, leading to lower integrated margins. This tendency was somewhat slowed down by the hurricane-related shutdowns in the U.S. when the import pres-sure decreased temporarily on European markets. Even though integrated margins were on average below 2015 and even 2016 figures, they remained above the 5-years historical average.
CENTRAL AND EASTERN EUROPE
The Central and Eastern Europe (CEE) region showed very robust GDP growth rates in 2017 (ranging between 3.1% and 6.7% p.a.), as the surprisingly fast expansion of the Eurozone was coupled with strong household demand, private invest-ment activity and reaccelerating EU fund inflows. Regional growth has become more broad-based.
HUNGARY
Growth picked up in 2017 following a temporary slowdown in 2016. In 2017Q4 Hungary posted the second strongest GDP expansion within the EU. Hungary’s real GDP is estimated to have increased by 3.8% in 2017 on the back of strong domestic
29

demand. Consumer confidence remained high and private consumption was supported by rapid wage increases and continued employment growth. The main driver of the accel-eration of investment growth was the resumption of EU fund absorption under the new multiannual financial framework. Business and household investment also increased dynami-cally as the global economic recovery improved the prospects for businesses and strong demand for new homes spurred resi-dential construction. Fiscal policy measures and favourable financing conditions further supported domestic demand.Gasoline demand increased by 4.1% yoy, supported by the improved real income position of households and the end of deleveraging efforts. Diesel demand growth was 3.4% supported both by passenger and freight traffic.
SLOVAKIA
In 2017, Slovakia's economy maintained the growth of 3.3% matching the figure of the previous year. The growth was driven mainly by accelerating household consumption and to some extent by re-raised investments, while lower net export weighed on growth. The unemployment rate declined further to 8.3% and is set to remain on a falling path, reflecting the continued economic expansion. The general government deficit declined to 1.4% of GDP in 2017, the second lowest deficit of the country.
Both gasoline and diesel demand growth, 1.5% and 3.9% respec-tively, remained below 2016 growth rates (3.2% and 5.8% respectively).
CROATIA
Economic growth kept accelerating in 2017 to an estimated growth rate of 3.2% after expanding by 2.8% in 2016. The growth was driven primarily by domestic factors: while consump-tion – especially household consumption – strengthened, investment growth turned out to be weaker compared to 2016 although above the historical average growth rate. Net export of goods and services, turned negative in 2017 detracting from the growth. Government deficit remained low, similarly to 2016, at -0.9%. Unemployment is still a significant issue even after falling to 11.1% from 13.4% and showing a decreasing trend.Croatian gasoline demand declined by 4.1%, even more than in 2016, while diesel demand rose by 1.8% yoy.
Disclaimer: This chapter is based on information available for the period
ending 28 February, 2018. Crude oil figures are based on EIA. Regional diesel and gasoline figures do not reflect full year in
the case of Croatia; because of data availability the average of January-November YoY figure is presented.
OVERVIEW OF THE MACROECONOMIC AND INDUSTRY ENVIRONMENT

Macro figures (average) FY 2017 FY 2016 Ch %
Brent dated (USD/bbl) 54.3 43.7 24
Ural Blend (USD/bbl)(10) 53.3 42.5 25
Brent Ural spread (USD/bbl)(5) 1.2 2.1 (43)
Premium unleaded gasoline 10 ppm (USD/t)(11) 557 467 19
Gas oil – ULSD 10 ppm (USD/t)(11) 493 397 24
Naphtha (USD/t)(12) 467 367 27
Fuel oil 3.5 (USD/t)(12) 298 206 45
Crack spread – premium unleaded gasoline (USD/t)(11) 147 136 8
Crack spread – gas oil (USD/t)(11) 83 66 26
Crack spread – naphtha (USD/t)(12) 57 36 58
Crack spread – fuel oil 3.5 (USD/t)(12) (106) (125) 15
Crack spread – premium unleaded gasoline (USD/bbl)(11) 12.7 12.4 2
Crack spread – gas oil (USD/bbl)(11) 12.0 9.5 26
Crack spread – naphtha (USD/bbl)(12) (1.8) (2.5) 28
Crack spread – fuel oil 3.5 (USD/bbl)(12) (7.1) (11.3) (37)
MOL Group refinery margin (USD/bbl) 6.5 5.7 14
Complex refinery margin (MOL + Slovnaft) (USD/bbl) 7.1 6.3 13
Ethylene (EUR/t) 1,017 909 12
Butadiene-naphtha spread (EUR/t) 698 313 123
NEW MOL Group petrochemicals margin (EUR/t)(9) 504 543 (7)
OLD Integrated petrochemical margin (EUR/t) 512 613 (16)
HUF/USD average 274.4 281.5 (3)
HUF/EUR average 309.2 311.5 (1)
HUF/HRK average 41.4 41.4 0
HRK/USD average 6.6 6.8 (3)
3m USD LIBOR (%) 1.3 0.7 86
3m EURIBOR (%) (0.3) (0.3) 0
3m BUBOR (%) 0.1 1.0 (90)
Macro figures (closing) FY 2017 FY 2016 Ch %
Brent dated closing (USD/bbl) 66.5 54.9 21
HUF/USD closing 258.8 293.7 (12)
HUF/EUR closing 310.1 311.0 0
HUF/HRK closing 41.6 41.1 1
HRK/USD closing 6.2 7.1 (13)
MOL share price closing (HUF) 3,005 2,579 17
Notes and special items are listed in Appendix I and II.
31

As operators in a high risk industry we stay committed to professionally manage and maintain our risks within accept-able limits as per best industry practice.
The aim of MOL Group Risk Management is to keep the uncer-tainties of the business environment within acceptable levels and support stable and sustainable operations and the future growth of the company. MOL Group has developed the risk management function as an integral part of its corporate governance structure. Assessment and mitigation of the broadest variety of risks is arranged on group level into one comprehensive Enterprise Risk Management (ERM) system. ERM is a risk management framework covering group-level business units and functional units as well as flagship and operating companies, with specific attention to projects as well.The risk management methodology applied by MOL is based on international standards and best practices. It considers the organisation’s exposure to uncertainty in regard to value crea-tion, meaning factors critical to the success and threats related to the achievement of objectives, also occurrence of incidents causing potential threat to people, assets, environment or repu-tation.Risks are managed by risk owners, who are managers respon-sible for supervising the existing control framework and imple-mentation of defined risk mitigation actions in responsible organisations. Monitoring and reporting of risks is performed by the Group Risk Management department to the Finance and Risk Management Committee of the Board of Directors.During 2017, we renewed our risk management processes to ensure special attention is given to our 2030 Strategy: we identi-fied major long-term risks that may impact our strategic objec-tives and detailed analysis is ongoing. At the same time, mid-term risks related to our business plans are assessed and managed over the full lifetime of assets, performed at business segment level and coordinated by the group-level risk management team. As in previous years, the short-term risk profile of the company is regularly reviewed with main focus on the 1-year budget of MOL Group.Regular reporting to top management provides oversight on top risks and assurance that updated responses, controls, and appropriate mitigation actions are set and followed by the Exec-utive Board.
THE MAIN RISK DRIVERS OF THE GROUP
Risks are categorised to ensure effective risk reporting and consistent responses for similar or related risks.
a) Market and financial risks include, but are not limited to:i. Commodity price risk: MOL is exposed to commodity
price risk on both the purchasing side and the sales side. The main commodity risks stem from the inte-grated business model with downstream processing more crude and selling more than our equity crude oil production. We monitor this risk in order to support our strong financial position and capacity to fund oper-ations and investments. When necessary, we consider commodity hedging to eliminate risks other than ‘busi-ness as usual’ risks or general market price volatility.
ii. Foreign exchange (FX) risk: Business operation is economically driven mainly by USD. MOL’s current FX risk management policy is to monitor the FX risk, and to balance the FX exposures of the operating cash flow with the financing cash flow exposures when necessary and optimal.
iii. Credit risk: MOL Group provides products and services to a diversified customer portfolio – both from business segment and geographical point of view – with a large number of customers representing an accept-able credit risk profile. MOL Group’s risk management tracks these risks on a continuous basis, and provides support to the sales processes in accordance with MOL Group’s sales strategy and ability to bear risk.
b) Operational risks include, but are not limited to:i. Physical asset safety and equipment breakdown
risk: High asset concentration in Downstream is a significant risk driver. The potential negative effects are mitigated by comprehensive HSE activities and a group-wide insurance management program.
ii. Crude oil supply risk: Crude supply disruption is a major risk factor for the Downstream business, as it can hamper continuous operations. In order to mitigate this risk, supplies of crude oil via pipelines are currently diversified with regular crude cargo deliveries from the Adriatic Sea.
iii. Cyber risk: Cyber risk needs attention and effective management to ensure the company is able to monitor, detect and respond to cyber threats. MOL has adapted
INTEGRATED CORPORATE RISK MANAGEMENT
INTEGRATED CORPORATE RISK MANAGEMENT
and changed the way it deals with cyber defence and cyber threats (people, process and technology): a clear vision and strategy has been set up to manage cyber incidents with end-to-end ownership and accounta-bility.
c) Strategic risks include, but are not limited to:i. Regulatory risk: MOL has significant exposure to a
wide range of laws, regulations, environmental and government policies that may change significantly over time. Due to the economic, and also in some regions political crisis, the risk of potential government actions increased, as well as potential impact of such decisions.
ii. Country risk: The international portfolio requires proper management of country risk exposures, there-fore possible political violence, compliance with local regulations or sanctions are monitored to enhance the diversification effect in the investment portfolio.
iii. Reputation risk: Reputation of energy industry players has been in the focus of media for the past years due to extreme negative events. MOL, as a major market player in the region, operates under special attention from a considerable number of stakeholders, and we are constantly seeking to meet our responsibilities towards them.
iv. Climate change risk: The effects of climate change have the potential to adversely impact MOL’s current operations. As a response, MOL Group launched its 2030 Strategy based on the expected decrease in demand for fossil fuels, primarily driven by a combina-tion of electrification and digitalization of transporta-tion, energy and fuel efficiency gains, as well as changes in consumer behaviour and advances in technology. MOL Group’s transformational strategy is meant as a response to the fast-developing consequences of global warming and climate change. Several measures have already been taken at group and divisional level in the past, and actions are ongoing. For more details, go to the Notes on Sustainability Performance.
MAIN RISK MANAGEMENT TOOLS
Enterprise Risk Management is a framework covering busi-ness units and functional units, which ensures incorporation of risks faced by the company into risk maps. The risk assessment activity supports stable and efficient operation by identifying key risks that threaten the achievement of company objec-tives and require specific attention by top management through strengthened controls or execution of mitigation actions.
To ensure the profitability and the financial stability of the group, financial risk management is in place to handle short-term, market related risks. Commodity price, FX and interest rate risks are measured regularly by using a complex model based on Monte Carlo simulation, and are managed – if neces-sary – with hedging measures. Transferring of the financial consequences of our operational risks is done by insurance management, which represents an important risk mitigation tool used to cover the most relevant exposures and liabilities arising out of our operations. Insur-ance is managed through a joint program for the whole group to exploit considerable synergy effects. Following best industry practice and focusing on low proba-bility high potential risks that could disrupt our operations, value chain and cash generation, MOL Group has implemented and is currently working to integrate a crisis management and business continuity program in order to reduce recovery times within tolerable limits for processes critical to our business.Besides providing information on the most imperative risks that MOL Group faces, risk management also supports the top management and the Board of Directors to take more educated decisions on capital allocation for major CAPEX projects.
33

SUMMARY OF 2017 RESULTS
MOL delivered Clean CCS EBITDA of HUF 673bn in 2017 (USD 2.45bn), 11% above the 2016 level and exceeding its upgraded target (USD 2.3bn+) for the year. The Downstream segment EBITDA levelled off compared to last year and contrib-uted nearly half of the total group-level EBITDA, while the Upstream, Consumer Services and Gas Midstream segments substantially increased their EBITDA contribution year-on-year. Upstream turned into a material earnings contributor on the back of increasing hydrocarbon prices, while Consumer Services continued its double-digit EBITDA growth. Net operating cash flow increased by 8% year-on-year (to HUF 560bn), while organic CAPEX was at a similar level in 2017 compared to the previous year, hence free cash flow genera-tion further improved in 2017 year-on-year and exceeded USD 1bn. As a result, the balance sheet substantially strengthened during 2017 and Net debt/EBITDA fell to 0.65, while net gearing decreased to 17% by the end of the year.
The Upstream segment’s EBITDA, excluding special items, reached HUF 235bn in 2017, representing a 23% increase compared to 2016 due to higher Brent (+24%) and higher realized gas prices (+10%). A 24% decrease in CAPEX spending meant that the segment doubled its simplified free cash flow (EBITDA less organic CAPEX), thus became a major free cash flow contributor in 2017. Total hydrocarbon production declined by 5% year-on year to 107 mboepd, while group-level average unit OPEX increased slightly to USD 6.1/bbl, but remained at a highly competitive level.
Downstream Clean CCS EBITDA remained broadly unchanged from 2016 level and came in at HUF 324bn in 2017. Profitability was supported by strong refining macro environment (MOL complex refining margin was USD 7.1/bbl, up 13% year-on year) and USD ~100mn contribution from the final year of the Next Downstream Program. These factors were mitigated by normalising petrochemicals margins (MOL Group Petrochemicals margin down by EUR 40/t year-on-year) and higher energy, maintenance and personnel expenses.
Consumer Services, a separate business segment from 2017, increased its EBITDA by 13% year-on-year and reached HUF 97bn in 2017. Earnings were supported by increased volumes and sustained growth in both fuel and non-fuel margins.
Gas Midstream brought in full-year EBITDA of HUF 61bn in 2017, 13% higher year-on-year, as strong trans-mission volumes counterbalanced the impact of adverse tariff changes.
Corporate and other segment delivered an EBITDA loss of HUF 40bn in 2017, widening slightly year-on-year.
Net financial expenses declined significantly to HUF 7bn in 2017 compared to HUF 50bn in the previous year, primarily on the back of large FX gains and substan-tially lower interest expenses year-on-year.
Total CAPEX spending reached HUF 280bn (USD 1.04bn) in 2017, down by 9% year-on-year on declining spending in E&P and the lack of any material M&A activity.
Operating cash flow before working capital changes increased by 18% to HUF 644bn, in line with the increase in underlying EBITDA. Accounting for the HUF 84bn build in net working capital, reflecting the higher oil price environment, net cash provided by operating activ-ities came in at HUF 560bn, 8% higher year-on-year.
Net debt decreased to HUF 435bn in 2017 from HUF 606bn a year ago due to the substantial free cash flow generation during the year. As a result Net Debt/EBITDA decreased to 0.65 from 0.97 in 2016, and net gearing also dropped to 17.5% from 25.2%, thus the balance sheet became even more robust in 2017. In December 2017 MOL signed a EUR 750mn revolving credit facility agreement contributing to a financial headroom of USD 4.4bn at year end. In November 2017 S&P upgraded MOL to BBB-, therefore MOL is now a full investment grade issuer.
FINANCIAL AND OPERATIONAL OVERVIEW OF 2017
FINANCIAL AND OPERATIONAL OVERVIEW OF 2017

HUF billion USD million
Summary of results FY 2017 FY 2016 Ch % FY 2017 FY 2016 Ch %
Net sales revenues 4,130.3 3,553.0 16 15,114 12,624 20
EBITDA 672.6 623.4 8 2,444 2,217 10
EBITDA excl. special items(1) 679.6 630.0 8 2,472 2,240 10
Clean CCS-based EBITDA(1) (2) 672.7 605.4 11 2,447 2,153 14
Profit from operation 354.4 307.9 15 1,278 1,099 16
Profit from operation excl. special items(1) 383.9 330.9 16 1,391 1,179 18
Clean CCS-based operating profit(1) (2) 377.0 306.3 23 1,366 1,092 25
Net financial gain / (expenses) (6.7) (49.8) 87 (25) (176) 86
Net profit attributable to equity holders of the parent
307.0 263.5 17 1,112 941 18
Operating cash flow before ch. in working capital 643.8 547.3 18 2,349 1,948 21
Operating cash flow 559.7 519.4 8 2,070 1,843 12
EARNINGS PER SHARE
Basic EPS, HUF(6) 436.8 359.0 22 1.6 1.3 23
Basic EPS excl. special items, HUF 475.9 375.6 27 1.7 1.3 31
INDEBTEDNESS
Simplified Net debt/EBITDA 0.65 0.97 -
Net gearing(4) 17% 25% -
Notes and special items are listed in Appendix I and II.
35

Key financial data by business segment
HUF billion USD million
Net Sales Revenues(3) (6) FY 2017FY 2016
restatedCh % FY 2017
FY 2016 restated
Ch %
Upstream 411.7 371.6 11 1,501 1,318 14
Downstream 3,643.5 3,056.9 19 13,333 10,863 23
Gas Midstream 98.5 89.4 10 359 317 13
Consumer Services 1,128.0 1,000.2 13 4,132 3,556 16
Corporate and other 215.1 188.6 14 793 668 19
Total Net Sales Revenues 5,496.8 4,706.7 17 20,118 16,722 20
Total External Net Sales Revenues(6) 4,130.3 3,553.0 16 15,114 12,624 20
EBITDA FY 2017FY 2016
restatedCH % FY 2017
FY 2016 restated
CH %
Upstream 232.5 183.7 27 844 652 29
Downstream 326.5 348.0 (6) 1,184 1,238 (4)
Gas Midstream 61.4 54.5 13 223 194 15
Consumer Services 97.3 86.3 13 358 307 17
Corporate and other (40.4) (38.9) (4) (149) (137) (9)
Intersegment transfers(7) (4.7) (10.3) 54 (16) (37) 54
Total EBITDA 672.6 623.4 8 2,444 2,217 10
Depreciation FY 2017FY 2016
restatedCH % FY 2017
FY 2016 restated
CH %
Upstream 158.0 146.6 8 580 520 12
Downstream 99.7 100.5 (1) 364 356 2
Gas Midstream 13.1 13.0 1 48 46 3
Consumer Services 25.2 33.4 (24) 92 117 (21)
Corporate and other 24.0 23.7 2 88 84 5
Intersegment transfers(7) (1.8) (1.7) (8) (6) (5) (12)
Total Depreciation 318.2 315.5 1 1,166 1,118 4
Operating Profit FY 2017FY 2016
restatedCH % FY 2017
FY 2016 restated
CH %
Upstream 74.5 37.1 101 264 132 100
Downstream 226.8 247.6 (8) 820 881 (7)
Gas Midstream 48.2 41.4 16 175 147 19
Consumer Services 72.1 53.0 36 266 190 40
Corporate and other (64.4) (62.5) (3) (238) (221) (7)
Intersegment transfers(7) (2.8) (8.7) 67 (10) (30) 67
Total Operating Profit 354.4 307.9 15 1,278 1,099 16
FINANCIAL AND OPERATIONAL OVERVIEW OF 2017

HUF billion USD million
Operating Profit Excluding Special Items(1) FY 2017FY 2016
restatedCh % FY 2017
FY 2016 restated
Ch %
Upstream 95.2 43.6 118 343 155 121
Downstream 231.6 252.0 (8) 838 897 (7)
Gas Midstream 48.2 41.4 16 175 147 19
Consumer Services 72.1 58.9 22 266 211 26
Corporate and other (60.4) (56.5) (6) (222) (200) (11)
Intersegment transfers(7) (2.8) (8.5) 67 (10) (31) 67
Total Operating Profit Excluding Special Items 383.9 330.9 16 1,391 1,179 18
Capital Expenditures FY 2017FY 2016
RestatedCh % FY 2017
FY 2016 restated
Ch %
Upstream 87.0 114.4 (24) 320 407 (21)
Downstream 128.9 110.3 17 478 390 23
Gas Midstream 4.9 7.5 (36) 18 26 (31)
Consumer Services 39.7 61.8 (36) 148 220 (33)
Corporate and other 21.7 16.3 33 81 57 40
Intersegment transfers(7) (1.9) (1.6) (20) (7) (6) (26)
Total 280.3 308.7 (9) 1,037 1,095 (5)
Notes and special items are listed in Appendix I and II.
HUF billion USD million
EBITDA Excluding Special Items(1) FY 2017FY 2016
restatedCH % FY 2017
FY 2016 restated
CH %
Upstream 234.8 190.3 23 853.9 675 26
Downstream 331.2 348.0 (5) 1,202.4 1,238 (3)
Downstream - clean CCS-based(2) 324.3 323.5 0 1,177.8 1,151 2
Gas Midstream 61.4 54.5 13 223.3 194 15
Consumer Services 97.3 86.3 13 358.3 307 17
Corporate and other (40.4) (38.9) (4) (149.4) (137) (9)
Intersegment transfers(7) (4.7) (10.2) 54 (17.0) (37) 54
Total - clean CCS-based(1) (2) 672.7 605.4 11 2,446.9 2,153 14
Total EBITDA Excluding Special Items 679.6 630.0 8 2,471.5 2,240 10
Notes and special items are listed in Appendix I and II.
37
2017 was another year of MOL Group delivering strong finan-cial results, but equally importantly it was also a year of visible progress along the transformation journey set out in the MOL 2030 strategy. The recovering, albeit still low oil prices, the strong economic growth in the region and the continued strength in downstream margins provided a heathy tailwind during the year. MOL Group managed to comfortably beat the original USD 2bn+ and even the upgraded USD 2.3bn+ EBITDA target in 2017, as all business segments increased their earnings contri-bution (in USD terms), a further testament to the high-quality, low-cost asset base and the resilient, integrated business model. Upstream more than doubled its free cash flow contribution, Downstream clean CCS EBITDA increased further some-what from a high base, while Consumer Services sustained its double-digit earnings growth. Coupled with the strong capex discipline, this meant Simplified Free Cash Flow (EBITDA less organic capex) jumped to over USD 1.4bn in 2017, well ahead of the initial plans. Regarding strategic transformation and the execution of the MOL 2030 long-term strategy, the flagship chemicals (polyol) project made major progress in 2017 with all technology licences secured and substantial, EUR 131mn state-aid endorsed by the European Commission. Consumer Services have also been launching new, innovative mobility-related services, such as fleet management and e-mobility. The financial framework for 2017-21 remains intact, with the impressive 2017 delivery implying some upside to the 5-year cash flow. The primary financial target of MOL Group remains to generate enough operating cash flows to cover the internal investment needs – including the transformational projects –, financial costs, taxes and rising dividends to share-holders, while retaining a safe and strong balance sheet. With unchanged underlying assumptions (oil price in the range of USD 40-60/bbl, normalizing downstream margins), but with some upside risks, MOL shall deliver around 2.2bn EBITDA in 2018, while capex should be in a range of USD 1.1-1.3bn, including up to USD 300m spending on the strategic projects. This implies sustained free cash flow generation in 2018, allowing MOL to fund peak transformational capex in 2019-20 and also to be able to pay rising dividends to its shareholders.
In Downstream, 2018 will be the first year of the recently announced DS2022 program, a program of transformation, growth and efficiency. In 2018, MOL shall see final invest-ment decision on some of the key transformational projects (including the polyol plant), while other strategic projects shall also see progress (including the completion of the synthetic rubber plant). Downstream targets USD 100mn efficiency improvement in 2018 as part of the DS2022 program and plans to make up for some of the shortfall experienced in the final year of the NXDSP delivery. In particular, the LDPE4 plant shall start contributing to the bottom line in 2018. At the same time, Downstream has to ensure the highest possible asset availability so that its high quality, integrated, highly cash generative platform continues to benefit from the still supportive external environment. In Consumer Services, 2018 and the coming years shall again be the years of delivery and transformation. MOL will continue to exploit the remaining fuel market potential in the growing CEE markets and push forward with its massive site recon-struction and non-fuel concept rollout program. The segment is right on track to deliver on its 2021 target of reaching USD 450mn EBITDA. At the same time, the segment is also working on its own long-term transformation. Digitalization will gain momentum and new mobility services will continue to be launched and expanded in the coming years. In Upstream, the focus has been gradually shifting from “fixing the basics” and ensuring a robust existing business towards working on a sustainable long-term future for the business. In 2017, Upstream generated more than USD 500mn (or USD 14/boe) Simplified Free Cash Flow, more than doubling year-on-year. This was the result of two years of rebalancing, rigorous cost control and discipline, which made MOL fit to prosper even in a very low oil price environment. While keeping a relentless focus on efficiency and cash generation, 2018 and the coming years shall see increasing focus on reserves replacement. MOL expects oil and gas production to be around 110 mboepd in 2018-2019, but in case of no addition to reserves, production is likely to decline from 2020 onwards. Organic reserves replacement is not sufficient to stabilize production in the medium term, hence inorganic steps are necessary. Such inorganic steps and options will increasingly be in focus in the coming years.
OUTLOOK ON THE STRATEGIC HORIZON
FINANCIAL AND OPERATIONAL OVERVIEW OF 2017

39

In 2017 Upstream doubled its simpli-fied free cash-flow delivery, exceeding USD 500 mn; ~14 USD/boe unit free cash-flow achieved on portfolio level in a 54 USD/bbl oil price environment; Production decreased by 5% in 2017 on portfolio level driven by lower UK volumes affected by the wax build-up in the Scolty and Crathes pipeline system and lower volumes in the CEE mainly due to natural depletion; Production Optimization Program (PO) continued in the CEE region, and deliv-ered 3.2 mboepd production increment on an annualized basis, which partly offset the lower volumes from mature fields; Within the international portfolio the Floating Production, Storage and Offloading (FPSO) installation on the Catcher field was delivered and first oil was achieved in December 2017, while in Paki-stan in the MOL-operated TAL Block gross production exceeded 85 mboepd as a result
UPSTREAM OVERVIEW
“I am very proud to say that we doubled our free cash flow in 2017 due to the CAPEX/OPEX efficiency and PO initiations of the New Upstream Program launched in 2016. In 2018 we will put strong focus on reserve replacement, while we maintain our highly efficient and cash positive operation.“
Berislav Gašo Dr. – Executive Vice President, Exploration and Production
KEY ACHIEVEMENTS
What have been the most important tasks for MOL Group Upstream recently?
UPSTREAM
UPSTREAM OVERVIEW
and in Pakistan, while in 2018 the first operated offshore well will be drilled in Norway. Development CAPEX will be used to unlock undeveloped 2P reserves in CEE, and continue the Production Optimization Program. International field development activity will focus on the UK, Pakistan, and Kazakhstan and on the Baitugan field in Russia; The free cash-flows generated by the Upstream business shall be sufficient to cover 100% reserve replacement even in an oil price environment of 50 USD/bbl. For efficient organic reserve replace-ment MOL Upstream intends to achieve competitive finding and development unit costs (12-16 USD/boe).
Sustain self-funding and a value-gener-ating operation even in a below 50 USD/bbl oil price environment; Maintain production at ~110 mboepd through PO in the CEE and international field development program, with Catcher having a significant contribution from 2018; MOL Upstream will continuously pursue efficiency to maintain unit direct production cost competitively low, in the single-digit territory (USD/boe) on a portfolio level; Exploration CAPEX will be spent on near-field exploration activities in the CEE
of several tie-ins were completed in 2017; Unit direct production cost stayed at a very competitive level of 6.1 USD/boe on portfolio level; In the frame of the well cost optimiza-tion project ~20% cost reduction was deliv-ered in Hungary through the improvement in well design and activity rationalization; Strong CAPEX discipline remained in place in 2017; total organic CAPEX spending declined to USD ~320 mn from USD ~410 mn.; Exploration portfolio was extended through successful licencing rounds in Hungary and in Norway. MOL Hungary acquired three new hydrocarbon explo-ration licences in the 5th bid round in the areas of Őrség, Somogybükkösd, Somo-gyvámos. MOL Norge has been also offered three new licences with reputable partners in the 2017 APA licencing round, including two operated blocks; 2P oil and gas reserves stood at 356 MMboe at the end of 2017, affected by reclassification in Syria (-36 MMboe) and negative revision in Kazakhstan (-37 MMboe).
OUTLOOK FOR 2018–2020
41

PORTFOLIO ELEMENTS*
UK
*including JVs and Associates.
8%Condensate
SPE 2P reserves (2017) 355.7 MMboe
51%Crude Oil
41%Natural Gas
8.8%Condensate
40.8%Crude Oil
Production (2017) 107.4 mboepd
50.4%Natural Gas
Baitugan
Fedorovsky
TalKarak
Margala North Margala Ghauri
HU
HR Khor Mor
DG Khan
ShaikanChemchemal
Production: 78 mboepdReserves (2P): 237 MMboe
Production: 6.1 mboepdReserves (2P): 11.9 MMboe
Production: 6.2 mboepdReserves (2P): 47.2 MMboe Reserves (2P): 23.5 MMboe
Production: 8.5 mboepdReserves (2P): 9.4 MMboe
Production: 6.2 mboepdReserves (2P): 22.2 MMboe
CEE REGION
PAKISTAN
RUSSIA
KURDISTAN REGION OF IRAQ
KAZAKHSTAN
NORTH SEA
Iraq
Russia
Pakistan
Kazakhstan
RO
UK
Norway
UPSTREAM

MOL GROUP
EXPLORATION
PRODUCTION
ROHR
Russia
Kazakhstan
Pakistan
Oman
Iraq
Syria**
Egypt
Angola
HU
Norway
**INA delivered on 26th February 2012 the force majeure notice to the General Petroleum Company of Syria related to the Production Sharing Agreement for the Hayan Block signed in 1998 and Production Sharing Agreement for the Aphamia Block signed in 2004.
43

KEY ACHIEVEMENTSMOL Group Upstream has 80 years of experience. MOL Group’s portfolio consists of oil and gas exploration and production assets in 13 countries with production activity in 8 countries. MOL Group is committed to the key principles of sustain-able operations, aiming at zero HSE incidents and accidents, protecting the environment by reducing the number of spills and decreasing greenhouse gas emissions from routine flaring including the participation in the World Bank’s Zero Routine Flaring Initiative.
THE CENTRAL EASTERN EUROPEAN REGION
In 2017 CEE production decreased by 3% driven by lower offshore volumes in Croatia, and lower produc-tion in Hungary. The Production Optimization Program continued in both countries and added more than 3.2 mboepd on an annualized basis, which partly offset the negative effects of natural decline. In Hungary three exploration wells were drilled and tested. Kunágota-5 and Tóalmás North-2 wells were proved to be dry, extended well test (EWT) is ongoing on Mezősas-SouthWest-2. MOL was awarded three new hydrocarbon exploration licences in the 5th bid round in the areas of Őrség, Somogybükkösd, Somogyvámos. The licences are within one of MOL’s core areas in western Hungary. One tie-in and one development drilling started in 2017 and implementation of three inert gas projects progressed with well interventions, tests and surface facility preparation.MOL successfully continued its Production Optimization (PO) Program, with an annualized production uplift of 2.1 mboepd. In the frame of PO project 15 fracks, 49 well workovers (including ALS optimization and acid jobs) were completed.MOL continuously pursues higher efficiency. In the frame of the well cost optimization project ~20% cost reduction was delivered through the improvement in well design and activity rationalization. The program will be continued next year. In 2017 installation of Algyő Power Plant was completed, which will bring substantial cost savings from 2018.In 2017 several measures were implemented in Hungary in order to avoid spills and leakages, including pipeline recon-struction, system modernization and technology improvement of equipment. In Croatia exploration program started on Drava-02 explora-tion area with one drilling and preparation works on the second well. Two development wells were drilled and a 3D develop-ment seismic survey was completed in 2017. Production Optimization Program continued in Croatia, contributing to the 2% increase of onshore production (year-on-year). 45 well workovers and 20 well stimulations were performed as part of Full Field Optimization (FFO), WWO and Well Stimulation campaigns which together resulted in a total of 1.1 mboepd additional production on an annualized basis.
Within the EOR Project, injection of CO2 and water continued throughout the year on Ivanić and Žutica North fields. Lower offshore volumes were driven by the natural decline and increasing water cuts.INA achieved significant CO2 emission decrease by the EOR projects at Ivanić and Žutica fields in 2017. The rehabilitation and replacement of critical pipelines’ sections have resulted in a multi-year trend of reduction in total number of environmental pollution incidents. In Romania exploration activity started with preparation and permitting procedures for seismic acquisition on EX-1 while magnetic survey was completed on EX-5.
THE NORTH SEA
The delivery of the FPSO on the Catcher field and reaching first oil in December 2017 were the key achieve-ments in the region. The key challenge remains to find a permanent solution to the wax build-up in Scolty and Crathes pipeline system. In 2017 MOL Norge successfully participated in the APA (Norwegian Awards in Prede-fined Areas) licensing round adding three new licences. MOL Norge’s licence portfolio is currently comprises 17 licences of which 6 are operated.In the UK FPSO construction and installation was completed on Catcher Field, and the first oil was achieved on Catcher in December 2017. The project was delivered with outstanding HSE results. Circa 20 million man hours have been spent on Catcher with industry leading safety performance, utilizing the workforce based on multiple locations including Singapore, Korea, Japan, Indonesia and the UK.Production of Scolty and Crathes was significantly below expec-tations in 2017 due to wax build up in the pipeline system, which was treated with chemical solvents as an interim solution. Effective February 2017, MOL Norge was awarded operatorship of one licence and partnership in three other North Sea licences in the 2016 APA in Norway. MOL Norge submitted four appli-cations for new licences in the 2017 APA licencing round, and has been offered operatorship for two licences and partnership in one licence. In 2017 Hyrokkin (PL 677) well was drilled and completed within planned schedule and significantly below budget but the well proved to be dry. Preparations for Raudasen (PL790) well was completed in 2017, the well will be spudded in Q1 2018. The first MOL operated drilling in Oppdal/ Driva (PL 860) is planned for 2018.
THE MIDDLE EAST
In Pakistan the MOL Group-operated TAL Block production exceeded 85 mboepd (gross) as a result of several tie-ins completed in 2017.In Pakistan, MOL Group has interests in 5 blocks and oper-ates the TAL Block, one of the largest hydrocarbon producing blocks of the country. In 2017 tie-in of the Makori Deep-1 and Maramzai-4 wells were
UPSTREAM

completed. Tolanj Processing Facility was established by relo-cating the Makori Early Production Facility and equipment. Tolanj West-1 and Tolanj X-1 wells were tied in to the new facility. As for field development Makori East-6 development well and Mardankhel-2 & 3 appraisal wells were drilled in 2017. Construction works of Mamikhel Well Head Compres-sion were completed, and Central Front End Compression Facility on Makori East Field progressed. In 2017 explora-tion program continued, drilling of the Tolanj East-1 and Mamikhel Deep wells started. In the Karak Block, Kalabagh well was put into production through a rental Production Facility in 2017. Exploration program continued in the other blocks. MOL continuously pursues improved safety management. In Pakistan road transportation has been carrying the highest risk in terms of safety in recent years, therefore HAZMAT Trans-portation Program was launched in 2017. MOL Pakistan carried on several programs in order to improve community relations including investment in local renewable energy projects, establishment of a local school and provision of technical scholarships. In the Kurdistan Region of Iraq, production was stable on both non-operated blocks developed by Shaikan PSC (Shaikan field) and Pearl Petroleum Company (Khor Mor and Chem-chemal fields). In Oman, geological work continued in the Block 66, and the company decided to enter the second phase of exploration with involving a partner. The commitment includes one exploration drilling within two years.
THE CIS REGION
MOL Group has presence in the region for more than twenty years. Baitugan field’s contribution to the interna-tional portfolio’s production is significant. As a result of the drilling program Baitex delivered 8% (year-on-year) ramp up in production during 2017. In the Fedorovsky Block in Kazakhstan, field development program was started in partnership with KMG and FIOC. In the MOL-operated Baitugan Block in Russia focus has been on production volumes enhancement via the High Density Drilling Campaign and workovers. In the frame of the program, 53 wells were drilled within schedule and budget, and 94 work-overs and one frack job were completed. In 2017 infrastruc-ture development program was carried out, including pipeline integrity project, telemetry program, new oil and water pipe-line, powerline and road construction. The program aims to reduce the number of pipe leakages and the inherent environ-mental impact, strives to prevent the scaling and corrosion problems and pursues utilization of formation water.In Baitugan, HSE programs were extended, and good progress was achieved in spill prevention via pipeline integrity program and associated gas usage in power generation. Several Health and Safety projects were launched, related to production process, road safety and health promotion. In the Fedorovsky Block in Kazakhstan, Trial Production Project (TPP) preparation progressed, Geological Static and Dynamic model building was completed. Licence extension was requested for the Fedorovsky exploration program.
45

FINANCIAL OVERVIEW OF 2017
Segment IFRS results (HUF bn) FY 2017 FY 2016 Ch %
EBITDA 232.5 183.7 27
EBITDA excl. spec. items(1) 234.8 190.3 23
Operating profit/(loss) 74.5 37.0 101
Operating profit/(loss) excl. spec. items(1) 95.2 43.6 118
CAPEX and investments 87.0 114.4 (24)
o/w exploration CAPEX 11.7 15.9 (26)
o/w organic CAPEX 87.0 114.4 (24)
Hydrocarbon Production (mboepd) FY 2017 FY 2016 Restated Ch %
Crude oil production 37.6 40.9 (8)
Hungary 12.8 13.3 (4)
Croatia 12.2 11.9 3
Russia 0.0 1.3 (100)
Kurdistan Region of Iraq 3.7 3.6 3
United Kingdom 5.4 6.6 (18)
Pakistan 1.1 1.1 0
Other International 2.4 3.1 (23)
Natural gas production 54.2 56.0 (3)
Hungary 26.3 26.9 (2)
Croatia 21.3 22.4 (5)
o/w. Croatia offshore 7.7 9.3 (17)
United Kingdom 0.8 1.7 (53)
Pakistan 5.7 5.0 14
Condensate 7.1 7.6 (7)
Hungary 3.7 4.2 (12)
Croatia 1.8 1.9 (5)
Pakistan 1.7 1.5 13
Average hydrocarbon production of fully consolidated companies 98.8 104.5 (5)
Russia (Baitex) 6.2 5.8 7
Kurdistan Region of Iraq (Pearl Petroleum)* 2.4 2.3 4
Average hydrocarbon production of joint ventures and associated companies
8.6 8.1 6
Group level average hydrocarbon production 107.4 112.6 (5)
*excluding gas
Main external macro factors FY 2017 FY 2016 Ch %
Brent dated (USD/bbl) 54.3 43.7 24
HUF/USD average 274.4 281.5 (3)
Average realized hydrocarbon price FY 2017 FY 2016 Restated Ch %
Crude oil and condensate price (USD/bbl) 48.8 38.9 25
Average realized gas price (USD/boe) 30.5 27.7 10
Total hydrocarbon price (USD/boe) 39.1 33.3 17
Production cost FY 2017 FY 2016 Restated Ch %
Average unit OPEX of fully consolidated companies 6.7 6.3 7
Average unit OPEX of joint ventures and associated companies 1.7 1.3 31
Group level average unit OPEX (USD/boe) 6.1 5.7 7
Notes and special items are listed in Appendix I and II.
UPSTREAM

SUMMARY OF 2017 RESULTS
Upstream EBITDA, excluding special items, rose 23% year-on-year in 2017 and amounted to HUF 235bn. The financial perfor-mance was primarily driven by:(+) Average realized hydrocarbon prices increasing by 17% (or by 6 USD/boe) to 39 USD/boe. This was driven by a 25% increase in realized crude prices (as Brent crude price advanced by also 24%) and a 10% rise in realized gas prices. (+) Exploration expenses fell by HUF 3bn in 2017 compared to the previous year on continued strong scrutiny of all projects.(-) Total group production (including JVs and associates) declined by 5% year-on-year to 107 mboepd. (-) Group-level average direct production cost, excluding DD&A, increased slightly, by 7%, to 6.1 USD/boe, primarily reflecting lower production, but remained at very competitive levels.
Reported EBIT reached HUF 75bn in 2017, while EBIT excluding special items amounted to HUF 95bn, both more than doubling year-on-year. A total of HUF 21bn special items affected reported EBIT including year-end impairment of exploration and development assets, the disposal of North Karpovsky in Kazakhstan and the settlement of a legal dispute partly offset by the provision release in Angola.
OIL AND GAS PRODUCTION IN 2017
Total average daily hydrocarbon production (including JVs and associates) reached a 107 mboepd in 2017, representing a 5%, or 5 mboepd decline year-on-year. The lower production was primarily due to the declining contribution of the UK (-2 mboepd), affected by the wax build-up in the pipeline problems at Scolty & Crathes, and CEE (-2.5 mboepd) mainly due to natural decline.
In 2017, Upstream CAPEX amounted to HUF 87bn, declining 24% year-on-year, primarily due to lower development spending in the UK as the 2016 spending was inflated by concluding develop-ment activities in the Scolty & Crathes field . CEE continued to be the biggest user of CAPEX spending with HUF 57bn, nearly two-third of the total mostly driven by production optimisation initia-tives. UK saw CAPEX declining to HUF 25bn in 2017, while other regions had small investments in 2017.
CHANGES IN THE UPSTREAM REGULATORY ENVIRONMENT
Croatia: As of 1 April 2017 there is no regulatory price applied for upstream activities.
Norway: The corporate income tax rate was reduced to 23% (from 24%) with a corresponding increase of the special petroleum tax (ST) rate to 55%. The uplift (an investment-based additional depre-ciation for ST purposes only) reduces from 5.4% to 5.3%. The new regulation is effective from 1 January 2018.Russia: Changes in the Mineral Extraction Tax (MET) calcula-tion were introduced at the end of 2016, having direct implica-tions on royalty payments both in 2017 and in following years. According to the new regulations, the MET was raised by 306 RUB/t for 2017, 357 RUB/t for 2018, 428 RUB/t for 2019. Further-more, in 2017 the parliament approved that the oil MET for 2020 will increase by 428 RUB/t. The increases were put in place in order to compensate the deficit of the state budget.
CAPEX
FY 2017 Hungary Croatia
Kurdistan Region of
Iraq PakistanUnited
Kingdom Norway OtherTotal - FY
2017Total - FY
2016
HUF bn
Exploration 8.3 1.2 0.0 1.5 0.0 0.7 0.0 11.7 15.9
Development 18.8 18.5 0.4 1.3 24.7 0.0 0.9 64.6 88.0
Acquisition 0.0 0.0 0.0 0.0 0.0 0.0 0.0 0.0 0.0
Other 5.2 5.1 0.0 0.0 0.4 0.0 0.0 10.7 10.5
Total - FY 2017 32.3 24.8 0.4 2.8 25.1 0.7 0.9 87.0
Total - FY 2016 27.4 25.3 0.6 3.6 46.1 1.4 10.0 114.4
47

UPSTREAM SUSTAINABILITY HIGHLIGHTS 2017
CLIMATE CHANGE
WATER AND SPILLS
RESERVES AND R&D
2012 2013 2014 2015 2016 2017
Reserve Life Index (years) (SPE 2P) 15 15 16 14 12 9
R&D Expenditures (HUF mn) 730 486 286 1,164 1,627 1,500
Comment:Reserve Life saw a considerable decrease y-o-y caused by a stable level of production of around 40 million barrels for 2017, combined with reserves reconciliation in Kazakhstan, as well as reserves in Syria being re-classified into contingent resources.
STRATEGIC GOAL:Contribute to the overall GHG emission reduction targets of MOL Group.
STRATEGIC GOAL:By 2020 reduce the number of spills by 30% compared to 2015 level.
PERFORMANCE:The GHG emissions have increased in 2017 as compared with 2016 due to several reasons: in crease production in Croatia in one of the field, more drilling activities in Pakistan and a change in the calculation model at the Russian operations. Energy consumption remained stable.
PERFORMANCE:Water withdrawal has remained at a stable level as compared with 2016. The number and volume of spill is still on ascending trend, due to the aging infrastructure in CEE countries.
GHG emission – Exploration & Production
1.00
0.80
0.60
0.40
0.20
0.002013 2014 2015 2016 2017
GHG emissionsmt CO2 equivalent
* Excluding produced water
Total water withdrawal – Exploration & Production
7
6
5
4
3
2
1
02013 2014 2015 2016 2017
Water withdrawal*
mn m3
Energy consumption – total Exploration & Production
10.0
8.0
6.0
4.0
2.0
0.002013 2014 2015 2016 2017
Specific energy consumption
mn GJ
Number of spills – Exploration and ProductionVolume of spills – total Exploration & Production
10
5
0
200
100
02013 2014 2015 2016 2017
Number and volume of spills (›1m3)pieces m3
UPSTREAM
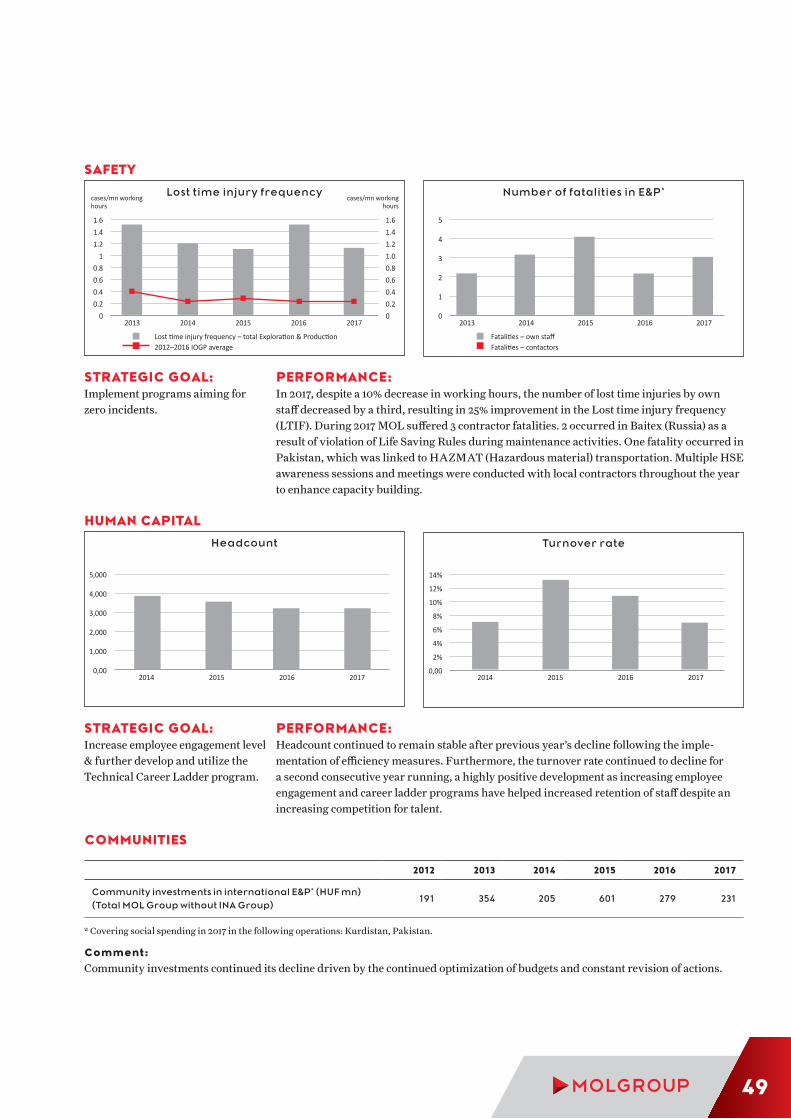
HUMAN CAPITAL
COMMUNITIES
2012 2013 2014 2015 2016 2017
Community investments in international E&P* (HUF mn) (Total MOL Group without INA Group)
191 354 205 601 279 231
* Covering social spending in 2017 in the following operations: Kurdistan, Pakistan.
Comment:Community investments continued its decline driven by the continued optimization of budgets and constant revision of actions.
STRATEGIC GOAL:Implement programs aiming for zero incidents.
STRATEGIC GOAL:Increase employee engagement level & further develop and utilize the Technical Career Ladder program.
PERFORMANCE:In 2017, despite a 10% decrease in working hours, the number of lost time injuries by own staff decreased by a third, resulting in 25% improvement in the Lost time injury frequency (LTIF). During 2017 MOL suffered 3 contractor fatalities. 2 occurred in Baitex (Russia) as a result of violation of Life Saving Rules during maintenance activities. One fatality occurred in Pakistan, which was linked to HAZMAT (Hazardous material) transportation. Multiple HSE awareness sessions and meetings were conducted with local contractors throughout the year to enhance capacity building.
PERFORMANCE:Headcount continued to remain stable after previous year’s decline following the imple-mentation of efficiency measures. Furthermore, the turnover rate continued to decline for a second consecutive year running, a highly positive development as increasing employee engagement and career ladder programs have helped increased retention of staff despite an increasing competition for talent.
5,000
4,000
3,000
2,000
1,000
0,002014 2015 2016 2017
Headcount
SAFETY
5
4
3
2
1
02013 2014 2015 2016 2017
Number of fatalities in E&P*
Fatalities – own staffFatalities – contactors
Lost time injury frequency – total Exploration & Production2012–2016 IOGP average
1.61.41.2
10.80.60.40.2
0
1.61.41.21.00.80.60.40.20
2013 2014 2015 2016 2017
Lost time injury frequencycases/mn working hours
cases/mn working hours
2014 2015 2016 2017
14%
12%
10%
8%
6%
4%
2%
0,00
Turnover rate
49

In 2017 Downstream generated HUF 324bn (USD 1.18bn) Clean CCS EBITDA, slightly above last year’s performance, primary due to the exceptionally strong refining macro (the complex margin aver-aged at USD 7.1 USD/bbl). Organic CAPEX spending came in at USD 478mn as a result the Downstream business delivered a cash-pile of USD 700mn representing 50% of the total group cash-flow. Next Downstream Program, the three-year efficiency program was completed and delivered USD 440mn improvement in the 2015-2017 time horizon. Efficiency actions were executed
according to our expectations in the amount of USD 350mn.
DOWNSTREAM OVERVIEW
“One year ago, we formulated our vision how we imagine the future in 2030, and we created an answer for the challenge in the form of the Enter Tomorrow Strategy. With DS2022 Program we make the first big step toward our Strategy. The successful delivery of New and Next DS Programs provide us a strong basis and credit, however DS2022 is not just another efficiency program. While New and NxDSPs targeted mainly a more efficient and extended operation of our Core activity, DS2022 is a transformational program: both the large investments and the enabler actions (incl. Cultural Development and how to value People) target a new operation of our activities. I firmly believe that all the DS2022 goals are equally important and transforming us into a company, where we are the leaders in employee’s engagement, customer satisfaction as well as operational and financial performance.”
Ferenc Horváth – Executive Vice President, Downstream
2017 HIGHLIGHTS
DOWNSTREAM

position improvement with a USD 180mn EBITDA increment target.
“Strategic projects”: USD 180mn EBITDA is expected to be added from large capex projects.
“Growth”: the polyol project shall deliver a further USD 140mn EBITDA gain.
In DS2022 soft and enabler actions are as important as the ones that bring a meas-urable financial benefit.
DS2022 represents a major milestone towards achieving MOL’s 2030 Strategy. The program aims at enhancing the cash-flow generation ability of the business (‘Cash Engine’) and supports the gradual “fuel to chemicals transformation” (‘Rise of Chem-icals’). DS2022 is aiming to transform not only our business but also the culture and the way we operate to become the best choice of customers, employees and investors. The DS2022 Program aims to add a total of USD 500mn to Downstream EBITDA by 2022, the program rests on three pillars: “Efficiency gains” mainly intend to
improve asset availability and market
The fulfillment of Strategic Projects was somewhat lagging behind initial targets.
In November 2017 DS2022, a five-year transformational program has been announced, which is the first milestone of the long-term “MOL Group 2030 Enter Tomorrow” strategy. Significant milestones were achieved in the Polyol project: key contracts of tech-nology licenses were signed with Evonik and thyssenkrupp during 2017. Addition-ally the European Commission endorsed a EUR 131mn regional investment aid for the project that is to be built adjacent to MOL Petrochemical’s existing facilities in Tiszaújváros. Development of organizational culture started in 2017 as part of the Culture2030 Program Roadmap.
OUTLOOK FOR 2018–2020
51

QUOTES
“We are continuously developing safety culture and HSE leadership engagement, and improving our process safety status. Long-term forecasts for transportation fuels market in Europe show decline and therefore efficiency is prerequisite for being competitive. On top of our costs, main contribution for our competitiveness and high net cash margin will come from developments of our yield structure and flexibility. We put significant efforts and support to decision making process on our strategic growth directions to go deeper to propylene value chain – namely polyols. For this purpose we have as well reshaped our organization and to further strengthen and develop technical capabilities in Downstream we have launched career ladder programs for both engineers and front line employees.“
Miika Eerola – Group Downstream Production SVP
“In 2017 we reorganized ourselves and created the Downstream Commerce & Optimisation organization. We have set up a new operating model where three business units: Fuel, Petrochemicals and Special Products and three service units: Asset, Supply & Trading and Business and subsidiary support were established. Together, our role is to connect customers with DS capabilities in order to maximize MOL Group-level margin. As customer oriented organisation we know that they are the most important people for us therefore we focus to continuously meet and fulfil their needs.”
Zsolt Pethő – Group Downstream Commerce & Optimization SVP
DOWNSTREAM
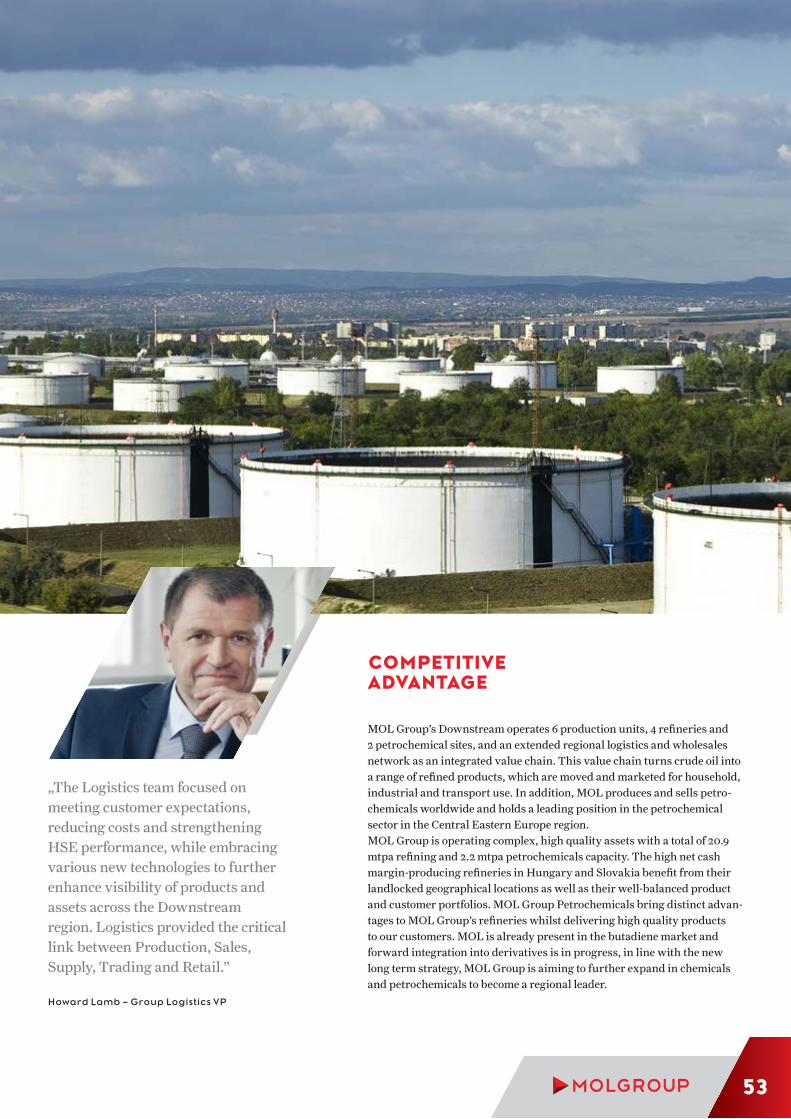
„The Logistics team focused on meeting customer expectations, reducing costs and strengthening HSE performance, while embracing various new technologies to further enhance visibility of products and assets across the Downstream region. Logistics provided the critical link between Production, Sales, Supply, Trading and Retail.”
Howard Lamb – Group Logistics VP
COMPETITIVE ADVANTAGE
MOL Group’s Downstream operates 6 production units, 4 refineries and 2 petrochemical sites, and an extended regional logistics and wholesales network as an integrated value chain. This value chain turns crude oil into a range of refined products, which are moved and marketed for household, industrial and transport use. In addition, MOL produces and sells petro-chemicals worldwide and holds a leading position in the petrochemical sector in the Central Eastern Europe region.MOL Group is operating complex, high quality assets with a total of 20.9 mtpa refining and 2.2 mtpa petrochemicals capacity. The high net cash margin-producing refineries in Hungary and Slovakia benefit from their landlocked geographical locations as well as their well-balanced product and customer portfolios. MOL Group Petrochemicals bring distinct advan-tages to MOL Group’s refineries whilst delivering high quality products to our customers. MOL is already present in the butadiene market and forward integration into derivatives is in progress, in line with the new long term strategy, MOL Group is aiming to further expand in chemicals and petrochemicals to become a regional leader.
53

PORTFOLIO ELEMENTS
Danube Refinery 8.1 10.6Bratislava Refinery 6.1 11.5Rijeka Refinery 4.5 9.1Sisak refinery 2.2 6.1
Friendship (Slovakian part, owned by Transpetrol) 22.0Friendship I. (bidirectional – total 129 km) 6.0Friendship II. 7.9Adria (Hungarian part) 10.0Algyő 2.0Porto Marghera – Mantova 2.6Adria – JANAF (12% owned by INA) 20.0product Depot (pcs) 42Product Pipeline system:MOL – 1,356 km 8.2SN – 484 km 2.5
MPK – Etilén 660MPK – Polimer 765MPC – Butadién 130SPC – Etilén 220SPC – Polimer 475Vezetékek Kapacitás (kilotonna/év)Alapanyag és termék vezetékek 2.700Etilén (Kazincbarcika) 160Etilén (Kalush) 100
MPC - Ethylene 660MPC - Polymer 765MPC - Butadiene 130SPC- Ethylene 220SPC - Polymer 475Pipelines capacity in kt/yFeedstock and product pipelines 2,700Ethylene (Kazincbarcika) 160Ethylene (Kalush) 100
CAPACITY IN MT/Y NCI INDEX
REFINING
CRUDE PIPELINES CAPACITY IN MT/Y
LOGISTICS
PRODUCTION CAPACITY IN KT/Y
PETROCHEMICALS
Italy
DOWNSTREAM

Domestic and core markets
Refinery
Petrochemical Plant
Oil pipeline
Petchem pipelines
Ethylene pipeline
Product depot
Poland
Czech Republic
Slovakia
Romania
Hungary
Croatia
Serbia
Bosnia and Herzegovina
Austria
BRATISLAVA REFINERY
DANUBE REFINERYMPC
RIJEKA REFINERY
Slovenia
SPC
SISAK REFINERY
55

KEY ACHIEVEMENTS
CLOSING OF NEXT DOWNSTREAM PROGRAM
The Next Downstream Program has been an essential part of MOL Group Downstream Strategy for 2015-2017, serving as a measurement framework for the implementation of strategic actions. The focus was on long-term sustainable improvement in order to exploit market opportunities and meet both external and internal challenges. For the Core DS and Retail altogether an ambitious USD 500mn EBITDA improvement target was set in the program on the three year time horizon. Benefits were mostly expected from extended margin capture building on two main pillars of program: Asset and Market Efficiency Improvements Strategic Growth ProjectsIn 2017 the Next Downstream Program added around USD 100mn to the Group result above the USD 340mn already deliv-ered in the initial two years. The NxDSP delivered USD 440mn improvement from internal actions to Group Downstream (together with Retail) over the full lifetime of the program. More than 300 efficiency actions contributed to the successful delivery of the original USD 350mn target, while benefits of stra-tegic projects somewhat lagged behind, mainly because reaching smooth operation in the new LDPE4 unit in Slovakia lasted longer than anticipated. Delivered internal benefit of the program was partially offset by lower inland premium versus 2014 due to higher import pressure and higher operating expenses.
PRODUCTION
Crude oil processing reached 15,6 Mtons in 2017 same level as in 2016. In line with strategic targets the seaborne, alterna-tive crude processing ratio increased significantly, primarily in the Danube Refinery, where it reached 25% of import crude, 1,5 Mtons level.Successful turnarounds were executed in Danube and Brati-slava refineries, together with several technology improvement and revamp projects. Preparation of transformational projects of DS2022 proceeded according to the plans.In order to successfully answer challenges of the labor market as part of a comprehensive strategy ‘Pay for competence’ and ‘Technical Career Ladder’ programs we initiated in the Group.
COMMERCE & OPTIMIZATION
Total refined and petrochemical product sales reached 19.5 Mtons level in 2017, 2% above the base period.In May 2017, building on a strong expert and management base, as well as by responding to market trends, Commerce & Optimi-zation organization has been established with a new operating model and focus on customers need along three business lines: Fuel, Petrochemicals and Special Product.After the ramp-up of the new Butadiene Unit of the Group MOL successfully entered and built its strong presence on the buta-diene market in 2017.
Fuel and Petrochemical segments strategies were updated and expanded in line with MOL2030 "Enter Tomorrow" Program.
LOGISTICS
Volumes handled increased by more than 5% to over 22 Mtons, while overall transportation unit cost dropped by more than 2%.Visibility of our products throughout the downstream region and of our assets in transit are areas of increased focus for improved optimization and efficiency, for which significant investments have been made in IT technology with roll-outs already implemented or underway in 2018. Investment in our people continues to be a key focus area, with successful launch of a technical career ladder and a blue collar career ladder in our key markets.
DS2022 TRANSFORMS DOWNSTREAM TOWARDS 2030 VISION
MOL Group has launched its new Downstream program, DS2022, a major milestone in the implementation of the MOL 2030 strategy. The program is based on the following pillars: strategic transformational projects; efficiency initiatives; increasing customer satisfaction, safety and employee engage-ment in order to become the best choice of employees, customers and investors in line with the vision of MOL Group 2030 strategy. The program once again aims to deliver USD 500mn EBITDA improvement similarly to its predecessors the New Downstream Program (2012-2014) and the Next Downstream Program (2015-2017).DS2022 is not just another efficiency program, it is rather the first milestone on the way towards the 2030 transformation. Both large investments and smaller enabler actions target a new operation of business activities.During the development of the DS2022 program, nearly 450 mid- and long-term actions were designed by hundreds of Downstream colleagues, deployed in 20 subprograms by field of action. Each subprogram targets specific areas of improve-ment and contribute to the 7 ‘Lighhouse targets’. The 7 ‘Light-house’ are all integral part of the Program encompassing Financial, Customer, People, HSE and Strategic Roadmap related targets.With a USD 2.1 bn investment the program targets USD 500mn incremental EBITDA. The DS2022 program includes 12 large CAPEX projects such as the construction of a Delayed Coker unit in the Rijeka Refinery, the revamp of the Danube refinery’s Fluid Catalytic Cracker and the refurbishment of the Hydroc-racker in the Bratislava refinery), which will deliver nearly 65% of targeted EBITDA improvements and consumes nearly 85% of CAPEX.With the DS2022 transformation program Downstream is expected to deliver above USD 1.5bn EBITDA even in mid-cycle environment, which shows the robust growth potential of the division. However, DS2022 is not only about financials, soft and enabler actions are as important as the ones that bring a measur-able financial benefit.
DOWNSTREAM

1. Employee engagement best in the region: Culture devel-opment, capability development and employee experience are in the focus.2. Increase customer satisfaction to 95%: We are proac-tively listening to customers' needs and feedback and then acting accordingly in order to be their first choice. 3. 1st quartile safety: HSE is a top priority for us and we aim to be the leading HSE performer among our peers. 4. Polyol project (USD 140mn): Polyol is the biggest down-stream project in the history of MOL Group, through which we widen our chemical product portfolio entering into a growing market and deliver substantial financial benefit. 5. Efficiency and strategic projects / development (USD 360mn): Through 11 transformational projects and more than hundred efficiency actions we deliver further benefit from our existing high performing assets and in the meantime adjusting our Cash engine to strategic challenges6. USD 1.5bn+ DS EBITDA: Delivering DS2022 will increase the EBITDA to minimum USD 1.5 bn, which shows the robust growth potential of the division even in a normalizing external environment.7. Roadmap 2030: DS2022 is not only about actions till 2022. A detailed strategic, technological and commercial roadmap will be worked out to prepare for the next investment cycle to reach 2030 strategic goals.
CHEMICAL TRANSFORMATION: POLYOL INVESTMENT
2017 HIGHLIGHTS
With a USD 1bn investment by 2021 MOL Group is aiming to establish a new polyol product line, which will move the Company further along the Downstream value chain towards semi-commodity and specialty chemicals products. MOL intends to produce polyols from own produced propylene and enjoy the benefits of forward integration. By completing the project MOL will be able to access the attractive regional polyol market, which faces a regional product shortage. Additionally well-established customer relationship channels in petrochemi-cals would further support the profitability of the project. In July 2017, MOL has secured the main licenses and process design packages for the HPPO (hydrogen peroxide to propylene
oxide) technology of propylene oxide production. The licensor of the hydrogen-peroxide unit for captive use is Evonik IP GmbH, while a consortium formed by Evonik and tyssenkrupp Indus-trial Solutions licenses the propylene oxide unit. Propylene oxide production is a key technology for producing polyether polyols.In October 2017, MOL has signed another contract pertaining to the Polyol Project with tyssenkrupp Industrial Solutions (Thailand) Ltd covering the technological steps following the propylene-oxide production. This contract concerns the purchase of technology licenses, process design packages and front-end engineering design of the production units that convert propylene-oxide into polyether polyols and propylene glycols. In the same month, the European Commission has authorized EUR 131mn of regional investment aid, which the Hungarian authorities intended to grant to MOL for the construction of the Polyol complex in Tiszaújváros. The investment aid would take the form of a corporate tax allowance – to be utilized following the commissioning of the new plant – and to a smaller extent a direct cash grant of EUR 37.7mn (HUF 11.7bn). The cash grant would be provided by the Hungarian Investment Promotion Agency (HIPA), based on the decision of the Ministry of Foreign Affairs and Trade.A dedicated Petrochemical Strategic Project organization was established in 2017, which is in charge of the implementation through the whole lifecycle of the projects. Additionally MOL Group has selected Fluor as Project Management Consultant (PMC) for the front end engineering design and engineering, procurement and construction phases.
OUTLOOK
The front end engineering design of the hydrogen-peroxide, propylene oxide, polyether polyol and propylene glycols units, along with that of the related offsite and utility facilities is expected to be finalized in Q2 2018. Simultaneously, MOL is nego-tiating the EPC (detailed engineering, procurement and construc-tion) contracts for the Project’s implementation phase (final investment decision) which may start after the closure of FEED.
DB EBIDTA
1.5+BN USD
EFFICIENCY & DEVELOPMENT
360MN USD
POLYOL PROJECT
140MN USD
SAFETY
1ST
QUARTILE
EMPLOYEE ENGAGEMENT
BESTIN THE
REGION
INCREASE CUSTOMER
SATISFACTION TO
95%
ROADMAP
2030
VISION: THE BEST CHOICE OF EMPLOYESSS, CUSTOMERS, INVESTORS
CASH ENGINES RISE OF CHEMICALS
MAIN TARGETS – 7 LIGHTHOUSES
57

OPERATING REVIEW OF 2017
Segment IFRS results (HUF bn) FY 2017 FY 2016 Restated Ch %
EBITDA 326.5 348.0 (6)
EBITDA excl. spec. items(1) 331.2 348.0 (5)
Clean CCS-based EBITDA(1) (2) 324.3 323.5 0
o/w Petrochemicals(1) (2) 126.8 144.3 (12)
Operating profit/(loss) reported 226.8 247.6 (8)
Operating profit/(loss) excl. spec. items(1) 231.6 252.0 (8)
Clean CCS-based operating profit/(loss)(1) (2) 224.7 227.5 (1)
CAPEX 128.9 110.3 17
o/w organic 128.9 110.3 17
MOL Group Without INA
EBITDA excl. spec. items(1) 318.7 343.8 (7)
Clean CCS-based EBITDA(1) (2) 319.3 328.3 (3)
o/w Petrochemicals clean CCS-based EBITDA(1) (2)
126.8 144.3 (12)
Operating profit/(loss) excl. spec. items(1) 236.3 264.3 (11)
Clean CCS-based operating profit/(loss)(1) (2) 236.9 248.8 (5)
INA Group
EBITDA excl. spec. items(1) 12.5 4.2 197
Clean CCS-based EBITDA(1) (2) 5.0 (4.8) N.A.
Operating profit/(loss) excl. spec. items(1) (4.7) (12.3) (61)
Clean CCS-based operating profit/(loss)(1) (2) (12.2) (21.3) (43)
Refinery margin FY 2017 FY 2016 Ch %
Total MOL Group refinery margin (USD/bbl) 6.5 5.7 14
Complex refinery margin (MOL+Slovnaft) (USD/bbl) 7.1 6.3 13
NEW MOL Group petrochemicals margin (EUR/t)(9) 504 543 (7)
External refined product and petrochemical sales by country (kt) FY 2017 FY 2016 Ch %
Hungary 4,660 4,532 3
Slovakia 1,756 1,809 (3)
Croatia 1,956 1,923 2
Italy 1,928 1,931 0
Other markets 9,153 8,861 3
Total 19,453 19,056 2
External refined and petrochemical product sales by product (kt) FY 2017 FY 2016 Ch %
Total refined products 18,040 17,811 1
o/w Motor gasoline 3,820 3,816 0
o/w Diesel 10,044 9,724 3
o/w Fuel oil 581 509 14
o/w Bitumen 468 541 (13)
Total petrochemicals products 1,413 1,245 13
o/w Olefin products 210 190 11
o/w Polymer products 1,122 1,001 12
o/w Butadiene products 81 54 50
Total refined and petrochemicals products 19,453 19,056 2
Notes and special items are listed in Appendix I and II.
DOWNSTREAM

ANNUAL PERFORMANCE
MOL Group Downstream results were similarly strong in 2017 as was the case a year before. The clean CCS EBITDA contri-bution increased marginally to HUF 324bn. R&M contrib-uted slightly above 60% of the total clean CCS EBITDA, while Petrochemicals made up the rest. The external Downstream environment remained supportive, both the refining and petro-chemicals margins averaged well above mid-cycle levels so the business continued to generate excess simplified cash-flows of HUF 195bn. The results came on the back of:(+) Exceptionally strong refining macro (complex refinery margin at 7.1 USD/bbl from 6.3 USD/bbl) with the highest annual average margin over the past years;(-) Normalizing petrochemical margins, a decrease of 40 EUR/t to 504 EUR/t.
(-) Rising operating expenses mainly affected by higher energy costs in line with rising oil prices, an increasing maintenance bill and higher personal costs on the back of the regional wage pressure.
REGIONAL DEMAND / MARKET TRENDS AND SALES ANALYSIS
Demand evolution in the CEE countries was heavily influ-enced by strong underlying economic performance as well as the continuation of relatively low end-user prices. Substan-tial increases in demand was recorded in both Slovakia and Hungary with growth rates reaching 4% and 3% respectively, while Croatian demand levelled out compared to the base year.
Change in regional motor fuel demand
Market* MOL Group sales
FY 2017 vs. FY 2016 in % Gasoline Diesel Motor fuels Gasoline Diesel Motor fuels
Hungary 4 3 4 5 3 3
Slovakia 1 4 3 (3) 1 0
Croatia( ) (4) 2 0 (2) 2 1
Other 2 9 7 (19) 4 (2)
CEE 10 countries 2 8 7 (8) 3 0
*Source: Company estimates
CAPEX
CAPEX by type (in HUF bn) FY 2017 FY 2016 Restated Ch %
Total 128.9 110.3 17
Strategic projects 15.0 3.3 353
Normalized CAPEX 113.9 107.0 6
CAPEX (in bn HUF) FY 2017FY 2016
RestatedYoY Ch % Main projects in FY 2017
R&M CAPEX and investments 98.8 77.5 27
MOL: Turnaround, Catalyst, Inline Blending, Compliance with future air pollution regulation and Hydrogen Plant efficiency improvement SN: Turnaround, Catalyst and Desalter replace-ment projectsINA (Rijeka): Preparations for Delayed Coker project, Revitalization of WWTP and Port Bakar modernization
Petrochemicals CAPEX 28.4 30.3 (6)
MOL: Polyol, Steam Cracker and Waste water projects SN: Ethylene Storage Tank, Steam Cracker reconstruction and LDPE4
Power and other 1.7 2.5 (32)
Total 128.9 110.3 17
4 Regional diesel and gasoline figures do not reflect full year in the case of Croatia; because of data availability the average of January-November YoY figure is presented.
Downstream investments grew by 17% versus the 2016 base. The increase was entirely driven by growing refining and marketing capital expenditures and was mainly attributable to more maintenance related activity and the preparations for the Delayed Coker project in INA’s Rijeka refinery. In 2017 polyol project related investments were recorded as the engineering activities commenced.
59

DOWNSTREAM SUSTAINABILITY HIGHLIGHTS 2017
CLIMATE CHANGE
STRATEGIC GOAL:By 2020 decrease direct and indirect GHG emissions by 200 thousand tonnes of CO2 equivalent through energy efficiency initiatives.
PERFORMANCE:Rijeka Refinery energy efficiency gains were not able to offset the increasing usage of fuel gas in Sisak and the fact that this unit operates in an on/off mode. Increasing CO2 likewise occurred due to increasing production in Hungarian petrochemicals operations.
ENERGY
SAFETY
STRATEGIC GOAL:Decrease downstream production energy consumption by min. 5%.
STRATEGIC GOAL:Zero lost-time injury frequency (LTIF) for both MOL employees and contractors by 2020.
PERFORMANCE:Energy consumption per kt continued to decline in petrochemicals, as the growth in processed materials for both sites exceeded energy consumption. The increase in energy consumption per kt at the refineries was mainly driven by a combination of increasing energy usage at the Danube refinery combined with stable production, as well as from both Croatian refineries where the growth in energy consumption exceeded the growth in processed materials, especially Sisak.
PERFORMANCE:2017 saw a decrease in TIER1-2 Process safety events (PSEs) in line with previous years, whilst LTIF recorded a significant increase driven by own staff lost time injury numbers in 2017 compared to last year’s (14 vs. 9), as worked hours decreased by 3 percent.
Energy consumption / production – total Refining
4,000
3,700
3,400
3,100
2,800
2,5002013 2014 2015 2016 2017
Specific energy consumption RefineryGJ/kt
Energy consumption / production – Petrochemicals
13,000
12,000
11,000
10,0002013 2014 2015 2016 2017
Specific energy consumption PetrochemicalsGJ/kt
40
30
20
10
02014 2015 2016 2017
Process Safety Events TIER 1+2GJ/kt
2.0
1.5
1.0
0.5
0.02013 2014 2015 2016 2017
Lost time injury frequency DS Productioncases/mn working hours
Lost time injury frequency – total Refining + Petchem2013–2017 CONCAWE all downstream average
Total CO2 emissions – RefiningCO2 emissions / production – total Refining
5
4
3
2
1
0 1502013 2014 2015 2016 2017
Refining CO2 emissionsmn tonnes
tonnes/kilotonnes
CO2 emissions – Petrochemicals Specific CO2 emissions – Petrochemicals
1.5
1.0
0.5
0 0.902013 2014 2015 2016 2017
Petrochemicals CO2 emissionsmn tonnes t CO2/t HVC
DOWNSTREAM

AIR EMISSIONS
WATER AND SPILLS
STRATEGIC GOAL:By 2020 decrease NOX & SO2 emis-sions by 15%.
STRATEGIC GOAL:Increase employee engagement level and Develop Technical Career Ladder in Downstream.
PERFORMANCE:NOx and SO2 emissions increased for the third consecutive year in 2017. The main factor behind the increase was the acquisition of CMEPS (power plant supplying the Slovnaft refinery). Other contributing reasons were increased flaring due to unplanned shutdowns in the Slovnaft refinery (Slovakia), as well as increased secondary processing combined with different fuel quality in the Sisak refinery (Croatia).
PERFORMANCE:2 spills occurred in Slovakia, whilst one spill, although initiating in late 2016, continued into the first weeks of 2017 in Croatia. The increase in water withdrawal was mainly due to a combination of the acquisition of the CEMPS Plant in Slovakia and overall increase in production.
PERFORMANCE:Headcount continued to remain stable after previous year’s efficiency measures. Further-more, the turnover rate continued to decline for a second consecutive year running, a highly positive development as increasing employee engagement and career ladder programs have helped increase retention of staff despite an increasingly tight labour market in the region.
HUMAN CAPITAL
10%
8%
6%
4%
2%
02014 2015 2016 2017
Turnover rate (R&M / Petchem)
10,300
10,200
10,100
10,000
9,900
9,8002014 2015 2016 2017
Headcount (R&M/Petchem)
NOx – RefiningNOx emissions / production – total Refining
5,000
4,000
3,000
2,000
1,000
0
0.22
0.20
0.18
0.162013 2014 2015 2016 2017
NOx emissionstonnes
tonnes/kilotonnes
Total water withdrawal – RefiningWater withdrawal / production – total Refining
100
80
60
40
20
0
5,000
4,000
3,000
2,000
1,000
02013 2014 2015 2016 2017
Water withdrawalmn m3 m3/kt
Number of spills – Refining Volume of spills – total Refining
15
10
5
0
1,000
500
02013 2014 2015 2016 2017
Number and volume of spills (›1m3)pcs m3
SO2 – RefiningSO2 emissions / production – total Refining
12,000
10,000
8,000
6,000
4,000
2,000
0
0.6
0.4
0.2
02013 2014 2015 2016 2017
SO2 emissionstonnes
tonnes/kilotonnes
61

2017 HIGHLIGHTS
CONSUMER SERVICES
2017 was a strong year overall with all-time high financial performance Consumer Services has delivered record high HUF 97 bn (USD 358 mn) consolidated EBITDA After the successful integration of networks acquired from ENI in Hungary and in Slovenia, 1,881 strategically located service stations in 9 countries can fulfil the needs of customers on the go from Bucha-rest to Adria and from Belgrade to Prague 447 Fresh Corner stations operated by end of the year 41 mn cups of coffee sold at service stations in 2017 All the proposed mobility initiatives – B2B fleet solutions, B2C car sharing plat-
INNOVATIVE BUSINESSES AND SERVICES OVERVIEW
“In 2017 we have developed the new corporate identity of MOL which aims to get closer to the customer and to focus on providing internal and external services. The last year’s activities were characterized by building up the fundamentals to reach our long-term strategic targets and to be a successful profit centre. The benefits of these steps are expected to be visible even in 2018. Our long-term goal is to be the engine of the rapidly developing new world and to play an active role in the business environment on the basis of service orientation.”
Dr. Oszkár Világi – Group Innovative Businesses and Services EVP
INNOVATIVE BUSINESSES AND SERVICES

INNOVATIVE BUSINESSES AND SERVICES OVERVIEW
Enter other markets with MOL Fleet Solution in the neighbouring countries, like Slovakia and Croatia
INDUSTRIAL SERVICES
Further optimize operations, utilize synergies between the service companies, invest in our existing asset base and by that improve service level towards internal customers Increase business development efforts to expand service portfolio and enter into new markets
OUTLOOK
CONSUMER SERVICES
Deliver an average 7% year-on-year EBITDA growth rate over the upcoming years in order to reach the target of USD 450 mn by 2021 Bring closer to our customers the Fresh Corner coffee concept, by doubling the number of stations where premium coffee will be offered as the best coffee experience to our customers Setting up 253 EVCS6’s in CEE in coop-eration with other partners within the framework of NEXT-E program funded by INEA, EC Extend MOL Limo’s service area and increase the fleet number year by year
form and EV-charger deployment – have been launched On the basis of own car pool, MOL Fleet Solutions have successfully entered the external fleet management market, by the end of 2017 By the end of the year, the number of managed cars by MOL Fleet Solution was roughly 1,000
INDUSTRIAL SERVICES5
More than 25% overhead cost reduction was achieved at oilfield service companies Maintenance service companies increased the scope of works they cover at our core businesses, resulting in a more cost efficient and reliable asset operation
5 Internal corporate governance and external reporting structure of Innovative Businesses and Services are different, thus the financial result of the Industrial Services and new Ventures unit of the Innovative Businesses and Services segment is reported within „Corporate and other” segment.
6 EVCS – Electric Vehicle Charging Stations
63

In the MOL Group 2030 Enter Tomorrow Strategy it has been decided that MOL will separate its service type businesses from its core, industrial operations as these two types of segments require different manage-ment approaches. Also, MOL declared its intention to manage any new, non-core business initiative that is not closely linked to its existing businesses within the frame of the new organisation. In line with this direction, as of 1st December, 2016, Innova-tive Businesses and Services (hereinafter IBS) department has been established. The new organisation is founded for those busi-ness activities and initiatives which are
not directly connected to the traditional oil and gas industries but serve the individual consumers (B2C – Consumer Services) and the industrial customers (B2B – Industrial Services) as well. The long-term vision of IBS is driven by customers and their behav-iour and needs. MOL Group would like to become a connected and innovative solu-tion provider building upon its extensive customer and network base. Today’s actions and existing key foundations enable it to start understanding its customers as indi-viduals and be able to provide complex tailor-made solutions in line with their rapidly changing habits.
INNOVATIVE BUSINESSES AND SERVICES

QUOTES
„In 2017 we increased our EBITDA by double digits as both our fuel and non-fuel earnings continued to grow. As a result of the further rollout of “Fresh Corners” the growth of non-fuel margin continued to outpace fuel margin growth. We also made decisive steps in the implementation of our ground-breaking and innovative strategy to drive the revolution of transportation in CEE. As the first building blocks of our mobility services, we have launched our fleet management subsidiary and have started to ramp up our alternative fuel presence and have introduced our new car sharing service, MOL LIMO. In 2018 we will maintain strong financial delivery with further scrutiny on costs, while at the same time we will continue on our transformational journey to become a leading 360° service provider by gearing up our digital capabilities.”
Péter Ratatics – Group Consumer Services EVP
“By the formation of the new Group Industrial Services organization our aim is to improve quality level and to provide competitive services towards internal customers. Besides that we are already on our way, starting with oilfield services, to generate EBITDA from external markets. We are determined to continuously improve and simplify our internal processes.”
Imrich Tomasek – Group Industrial Services VP
65

Hungary 465Croatia 428Slovakia 253Romania 213Bosnia and Herzegovina 103Serbia 60Czech Republic 306Slovenia 52Montenegro 1Total 1881
NUMBER OF SERVICE STATIONS
RETAIL
Czech Republic MOL CZ 13 9 2
Slovakia Slovnaft 11 1 1
Romania MOL RO 14 7 –
Hungary MOL 24 32 3
Croatia Tifon 11 – 1
Slovenia MOL SLO 11 – 1
FAST: 84 db FAST: 43 dbULTRA*: 6 db
FAST: 3 dbULTRA*: 5 db
PARTICIPATING COUNTRY
EV CHARGER IMPLEMENTATION
COMPANY 2018 (PLAN) 2019 (PLAN) 2020 (PLAN)
E-CHARGER IMPLEMENTATION PLANS
REFINERYCORE 5 COUNTRIES
MARKET POSITION 3MARKET SHARE 10%
SLOVENIA
MARKET POSITION 1MARKET SHARE 50%+
CROATIA
* The implementation of the ULTRA chargers will start in 2019.
The number of the yearly EV-charger implementation can be affected by the progress of the public procurement, by the approval-, designing- and execution of the requested capacity increment of the DSO. According to the plan the implementation and commission of all EV-chargers will be finished until 1 July 2020.
INNOVATIVE BUSINESSES AND SERVICES

MARKET POSITION 1MARKET SHARE 44%
HUNGARY
MARKET POSITION 3MARKET SHARE 18%
ROMANIA
MARKET POSITION 5MARKET SHARE 5%
SERBIA
MARKET POSITION 1MARKET SHARE 13%
BIH
MARKET POSITION 1MARKET SHARE 48%
SLOVAKIA
MARKET POSITION 2MARKET SHARE 20%
CZECH REPUBLIC
67

CONSUMER SERVICES
In 2017 Consumer Services delivered all financial targets in line or above the expectations, meaning a +17% EBITDA (USD 358 mn) increase compared to last year’s performance (USD 307 mn). The segment consists of two main business lines: “Retail” includes both fuel and non-fuel retailing, while “Mobility” is comprised of all otherservices provided for people “on-the-go”.
RETAIL
Retail completed more than 400 reconstruction projects, including the installation of the new non-fuel concept, Fresh Corner at the stations. In 2017 the main focus was on rebranding and successful integration of the newly acquired ex-ENI stations in Hungary (100) and Slovenia (11) as well as on the implementation of COCA (Company Owned – Commission Agent) operating model in the Slovakian network. MOL Group maintained a leading position on the Hungarian, Croatian and Slovakian markets, became second largest market player on the Romanian and Czech markets, and third largest market player on the Slovenian market. Productivity Excellence project has been kicked-off across the group with the aim to identify improvement possibilities in our daily working efficiency, first results are expected to come in 2018.One of our most important values is putting our people first, therefore we are continuously working on the organisation capability. Last year we have built up competencies in terms of innovation, negotiation and category management, and filled some strategically important positions within Retail. On service station level we started this journey a few years ago when we started to think about how we can move from the attendant behaviour to a more genuine and host behav-iour. Our unique SMILE program is not only a project or a training programme, but an entire movement, it is a driver of our cultural transformation. During 2017 altogether almost 400 Area and Service Station Managers, more than 2,000 Hosts and over 100 Management colleagues took part in the SMILE training across the group.By the end of 2017 MOL Group completed close to 450 Fresh Corner service stations across the region with zero lost time injuries. Retail has moved to industry tier one in terms of consumer acceptance and becoming the number one brand in our region, while reaching the highest net promoter score ever in Hungary. We managed to increase our active customer base by 15% YoY by optimized loyalty strategy which is based on life cycle management and digitalization. In Slovakia we have opened Pristavna, our first future service station with the latest innovations in digital consumer friendly solutions and fresh food offers. In Hungary we have opened our first pilot drive-through station on Szentendre Street 100, offering a various number of coffee and food for our customers “on the drive”.MOL Group has always been striving for to offer fuels of outstanding quality to its customers, thus from June 2017, we came out with an upgraded offering at our service stations.
As of now, main grade and premium fuels are called MOL EVO / INA Class and our renewed fuel range is proved to clean the engine and thanks to the special additives, they remove existing deposits, prevent deposit formation and provide protection against corrosion. Our new generation of MOL EVO and INA Class products are going to outperform the European standard quality expectations of their categories, with outstanding results in the area of engine cleaning.We believe that we drive the change that shapes our future, therefore in Group Retail we aim to make sure that we are always relevant in all aspects of our business. Within store format development projects we are focusing on connecting the location based consumer potential with right offers and services. As an important milestone Retail digital strategy and roadmap has been aligned and agreed. Over the next years, we will put a great amount of effort to deliver this roadmap and achieve the three goals that we set out: personalize interactions with our customers via leveraging data and artificial intelli-gence, enhance convenience via introducing digital channels and improve internal operations via increased and real-time access to relevant transaction and customer information.MOL Group’s new long-term strategy sees Retail aiming to become the customer’s first choice in fuel and convenience retailing and being a power brand in our core markets. In 2018 we are continuing to deliver our business plan and espe-cially focus on the non-fuel categories relevant strategic direc-tions, while shaping further our group wide operation under the newly established organisational setup within Retail. We expect to deliver an average 7% YoY EBITDA growth over the years in order to reach Retail 2021 target of USD 450 mn, while non-fuel margin expectedly will outpace fuel in 2018 in terms of growth. Our vision is to invest in new initiatives and store formats, we are continuously evaluating new business concepts out of the service station network. In 2018 we aim to bring closer to our customers our Fresh Corner coffee concept, by doubling the number of stations where our premium coffee concept will be offered as the best coffee experience to our customers.In terms of SD&HSE we are continuing with the initiative of collecting used cooking oil at our stations, and reached 232 tons of used oil in Hungary during 2017. We have started a Consumer Safety Awareness campaign and address HSE aspects related to car sharing, charging & other new activities at service stations. Additionally as a proud HSE achievement, thanks to the readiness and prevention of our service station employees, our locations were not endangered due to high number of forest fires in Croatia.
MOBILITY
E-MOBILITY
Group E-Mobility has been established in order to develop and provide the charging infrastructure for Electric Vehicles (EVs or Battery Electric Vehicles - BEVs) in the region. Group E-Mobility will create the possibility of EV owners to freely travel across the
CONSUMER SERVICES KEY ACHIEVEMENTS
INNOVATIVE BUSINESSES AND SERVICES

countries. MOL Group is aiming to become a market leader on the e-mobility market and to differentiate the company itself in the operation of the electric charging network with state of the art service level. In 2017, the team achieved to deploy several EV charging points in order to serve our internal car sharing solu-tion and cover as much area as we can within Budapest.In July 2017, the NEXT-E project was selected by the European Commission for co-financing through the Connecting Europe Facility (CEF). The NEXT-E consortium will be granted 18.84 mn EUR to implement the project, which is the largest CEF grant ever awarded to an EV project. Besides MOL Group, the consor-tium consists of companies of E.ON Group, HEP in Croatia, PETROL (in Slovenia and Croatia), as well as Nissan and BMW. The project includes installation and operation of more than 250 ultra chargers (at least 150 kW) and fast chargers (50 kW) along main highways. The NEXT-E project is another mile-stone in the implementation of MOL Group’s long-term strategy, which is built on the premise that fossil fuel will eventually lose its monopolistic dominance in transportation. MOL Group will implement 55 EVCS across the region till the end of 2018.
MOL FLEET SOLUTION
MOL Fleet Solution has been established as part of MOL Group new mobility strategy at the spring of 2017. The main target was to finance and manage vehicles owned and used by MOL Group, and external clients, like multinational or Hungarian companies, and fleets of small-, medium- or big- size busi-nesses. Providing excellent and flexible services, MOL Fleet Solution would like to become a dominant player in the fleet management market. In 2017, MOL Fleet Solution have successfully entered the external fleet management market and by the end of the year, the number of financed and managed cars by MOL Fleet Solu-tion were roughly 1,000. MOL Fleet Solution have to continue the vehicle fleet building, the target is minimum 2,000 financed and managed cars and the ratio of the external fleet should be over 25%. The main target is to increase the number of electric cars, to be the number one electric car fleet owner and to enter other markets in the neighbouring countries, like in Slovakia and Croatia.
MOL LIMO
Based on the 2030 strategic directions MOL has established a separate legal entity for shared mobility. MOL Limitless Mobility Ltd. is responsible for launching car sharing service in MOL Group countries. In 2017 the preparation for entering the new market segment were completed, including the purchase and equip the fleet for Budapest, which consist of 100 BEV VW eUp! and 200 ICE VW Up! The launch of the service was sched-uled for January 2018 in Budapest with a 60 square kilometre service area in a free-floating model. For 2018 the MOL Limo service will be to 80 square kilometres and the fleet number will be increased by 100 vehicle reaching a total number of 400. The main goals for 2018 are to capture a significant market share and to become the market leader. Prep-aration for international expansions will also begin in 2018. Midterm plans include the launch of the service in all the capi-tals and some major cities in CEE and the expansion of the service in Budapest to 600 only BEV cars and enlarging the service are to 150 square kilometres. In the first month of oper-ation the 2018 target registration number has been already reached and on the daily level more than 1,000 individual customers are already using the MOL Limo service.
69

CONSUMER SERVICES OPERATING REVIEW OF 2017
Consumer Services IFRS results (HUF bn) FY 2017 FY 2016 Ch %
EBITDA 97.3 86.3 13
EBITDA excl. spec. items(1) 97.3 86.3 13
Operating profit/(loss) reported 72.1 53.0 36
Operating profit/(loss) excl. spec. items(1) 72.1 58.9 22
CAPEX 39.7 61.8 (36)
o/w organic 39.7 31.1 28
Notes and special items are listed in Appendix I and II.
ANNUAL PERFORMANCE
2017 Consumer Services EBITDA jumped by 13% and reached HUF 97bn in 2017 representing the best ever performance of the segment. The increase was mainly driven by a combination of strong sales growth on the back of increasing CEE fuel consumption and continued fuel margin expansion. Earnings growth was additionally supported by the continued growth of non-fuel as the roll-out of the Fresh Corner concept accelerated also driving the 28% uplift in organic capital expenditures. The increases of the statu-tory minimum wage in Hungary and Romania on the other hand had a downward effect on earnings for the year, as a result higher salaries affected the performance of around a third of the network.
RETAIL SALES
Total retail sales (kt) FY 2017 FY 2016 Ch %
Hungary 1,199 1,059 13
Croatia 1,068 1,060 1
Slovakia 664 617 8
Romania 717 662 8
Czech Republic 484 468 3
Other(8) 367 380 (3)
Total retail sales 4,499 4,246 6
Notes and special items are listed in Appendix I and II.
Retail sales continued to rise at 6% as CEE fuel consumption continued its ascent. Like-for-like7 sales in the 2017 were up by 4% against last year.
NON-FUEL
Non-fuel indicators FY 2017 FY 2016
Non-fuel margin 24.6% 23.6%
Number of Fresh corner sites 447 248
The implementation of the non-fuel concept accelerated, almost 200 Fresh corners were added across the network taking the average Fresh Corners number to 447. Consequently the non-fuel margin continued to increase at a higher pace than fuel margin, leading to a one percentage point increase within the total margin compared to last year.
7 Correcting for the effect of increasing network size.
INNOVATIVE BUSINESSES AND SERVICES

CONSUMER SERVICES SUSTAINABILITY HIGHLIGHTS 2017
SAFETY
CLIMATE CHANGE
STRATEGIC GOAL:Continuous improvement in the TRIR with the ultimate aim of zero accidents.
PERFORMANCE:The 2017 Consumer Services target was set at 1.0, and the overall number came in at 0.6 in line with previous years’ results. For 2018 MOL targets a TRIR of 0.9 for Consumer Services in line with the strategic goal of continuous improvements.
PERFORMANCE:In 2017 MOL achieve a reduction in CO2 emissions of 868 tons mostly driven by the continuous installation of LED lighting tech-nology of reconstructed service stations.
2.5
2
1.5
1
0.5
0
2013 2014 2015 2016 2017
Total recordable injury rate
(tons)
2,000
1,500
1,000
500
02014 2015 2016 2017
Annual CO2 saving on Reconstructed SeS
STRATEGIC GOAL:In Retail, the focus will be on major competency development to build internal FMCG knowledge supported by different KPIs and target setting reviews.
PERFORMANCE:Consumer Services, as well as IBS organization were established during 2017, including the formation of entirely new organizations and businesses, as well as the transformation of traditional ones. Retail headcount, as part of CS, remained stable on Group Level. The slight increase in terms of Consumer Services is driven by new business areas such as mobility and digital experi-ence. Total HQ retail headcount was reduced following further efficiency measures at HQ level during 2017.Turnover Rate decreased considerably during 2017 following an increasing trend in the period of 2014-16.
HUMAN CAPITAL
30%
25%
20%
15%
10%
5%
02014 2015 2016 2017
Turnover Rate (%)
600
400
200
02014 2015 2016 2017
Retail Headcount*
* Headcount data reflects only to retail head offices (white collar). Headcount of SeS workers is approximately 17.000 on group level, of which 4500 are employed under COCO model.
71

INDUSTRIAL SERVICES AND OPEN INNOVATION HUB
INDUSTRIAL SERVICES
Industrial Services was established with the aim to provide services for MOL Group internal customers covering oil field services and maintenance services with the clear intention to create value by providing these services to other third party companies as well. The strategic aim of Industrial Services is thus twofold: to further increase the quality and level of services provided to internal customers as well as to utilize our vast knowledge and provide our services to third party customers. Non-HC procurement is also part of Industrial Services as a professional commercial function, fully embedded into the business value chain. During 2017 exten-sive cost rationalization and operation optimization programs were launched at oilfield service companies, resulting in a more than 25% overhead cost reduction. In the meantime there was a significant increase in third party engagements. As a result of these efforts, oilfield service companies managed to turn their negative EBITDA into positive, exceeding initial expectations.Maintenance service companies increased the scope of works they cover at our core businesses, resulting in a more cost efficient and reliable asset operation. In 2018 the main focus of Industrial Services will be to further optimize operations, utilize synergies between the service compa-nies, invest in existing asset base and by that improve service level towards internal customers. Business development efforts to expand service portfolio and enter into new markets are to be further increased.
OPEN INNOVATION HUB
Our ambitious, transformational MOL Group 2030 Enter Tomorrow Strategy is built on the premise that advancements in tech-nology, coupled with environmental consciousness and new consumer habits are fundamentally changing the entire oil & gas industry. At MOL, we see embracing an open innovation culture as the right response to these challenges, and reaching out to inno-vation ecosystem is an important step for us. We believe that partnering up with the players of the innovation community such as incubator houses, VC founds, universities and other research institutions as well as startups, SME’s and corporates could support our goals that we would like to achieve. The aim of the new Group level organisation is to have one source of market view of highly innovative and most promising solutions and ideas available today and in the near future. By investigating and connecting these solutions with the goals of the business units, supporting units we can reach our aim faster and in a more efficient way.
INNOVATIVE BUSINESSES AND SERVICES

73

• 5,782 km long pipeline system• 25 entry points, nearly 400 gas exit points• 3 regional centres with 2-2 plants, 6 compressor stations• High technical class control centre in Siófok
GAS MIDSTREAM OVERVIEW
FGSZ Földgázszállító Ltd (hereinafter referred to as: FGSZ) is the largest trans-mission system operator in Hungary. It performs its activity under market conditions regulated by law. Beside the domestic natural gas transmission, FGSZ is also engaged in transit activi-ties to Serbia, Bosnia-Herzegovina, as well as it conducts transmission activi-
ties towards Romania, Croatia, Ukraine and – through the network of MGT Zrt. – towards Slovakia. The security of supply of Hungary is inseparable from the energy security of the CEE region and whole Europe. Therefore, within the frame-work of European gas market cooper-ation based on mutual advantages, we aim to ensure the interoperability of the
HIGHLIGHTS
GAS MIDSTREAM

natural gas networks of the region on the part of Hungary; we also strive to increase the volume of transmission and transit through Hungary. The developments of the pipeline and trade infrastructure imple-mented by FGSZ in the recent years laid down the foundations for the company’s future, the completion of the company’s role in the regional gas distribution. The Regional Booking Platform (RBP) of FGSZ is an IT application developed in accordance with the EU network code governing the capacity allocation mech-anisms used in natural gas transmission networks and with other relevant EU and Hungarian legislation7. The capacity allo-
cation application enables the conduct of capacity allocation procedures not only at the cross-border and domestic pipe-line nodes located on the network of FGSZ, but even at pipeline nodes inde-pendent from the cooperating domestic natural gas transmission network. The customer base of RBP is expanding contin-uously as a result of the previous years’ consistent work; today – beyond FGSZ – seven further transmission system oper-ators use it throughout the EU: Eustream (Slovakia), Transgaz (Romania), Plin-acro (Croatia), MGT (Hungary), Bulgar-transgaz (Bulgaria), DESFA (Greece) and Gas Connect Austria (Austria).
8 Commission Regulation (EU) No 2017/459 on capacity allocation, Commission Regulation (EU) No 2017/460 on tariff, Regulation (EU EB) 2012/490 (contractual congestion management), Regulation (EU) No 1227/2011 (REMIT), Regulation (EU) No 703/2015 (interoperability), Directive 2000/31/EC (electronic commerce), Regula-tion (EU) No 910/2014 (eIDAS)
75

15 Entry points (cubic meter)Annual firm capacity 1.7 billionDaily firm peak capacity 5.3 million
Exit point (cubic meter)Annual firm capacity 4.8 billionDaily firm peak capacity 13.2 million
(cubic meter)Total without strategic withdrawal 186.6 millionof which interruptible 45.3 millionImport 98.4 millionof which interruptible 38.8 millionConnection point (MGT>FGSZ) 12.0 millionTransit 11.3 millionStorage for commercial purpose 59.6 millionof which interruptible 6.5 millionStorage for strategic purpose 20.0 millionDomestic net production 5.3 million
Entry point (cubic meter)Annual firm capacity 4.4 billionDaily firm peak capacity 12 millionExit point Annual interruptible capacity 1.8 billionDaily interruptible peak capacity 4.8 million
Entry point (cubic meter)Annual firm capacity 0 billionDaily firm peak capacity 0 millionAnnual interruptible capacity 7 billionDaily interruptible peak capacity 19.2 millionExit point Annual firm capacity 2.6 billionDaily firm peak capacity 7.2 millionAnnual interruptible capacity 4.4 billionDaily interruptible peak capacity 1.2 million
Entry point (cubic meter)Annual firm capacity 0.1 billionDaily firm peak capacity 0.2 millionAnnual interruptible capacity 1.7 billionDaily interruptible peak capacity 4.6 millionExit point Annual firm capacity 1.8 billionDaily firm peak capacity 4.8 million
Entry point (cubic meter)Annual firm capacity 5.2 billionDaily firm peak capacity 14.4 million
Entry point (cubic meter)Annual firm capacity 20.5 billionDaily firm peak capacity 56.3 millionAnnual interruptible capacity 5.5 billionDaily interruptible peak capacity 15.0 millionExit point Annual interruptible capacity 6.1 billionDaily interruptible peak capacity 16.8 million
(Volume data at 150 C) (cubic meter)Total quantity of natural gas measured at the entry and exit points: 29.5930 billionInjection through cross-border pipelines: 15.6229 billionBeregszász: 11.4527 billionHAG: 4.1435 billionCsanádpalota: 0.0267 billionSystem interconnector Vecsés 4 (MGT>FGSZ) 0.0024 billionDelivery from storage at receipt points: 5.9487 billionInjection: 3.5899 billionWithdrawal: 2.3588 billionAt upstream pipeline connections: 2.2399 billionInjection (domestic net production) : 1.4734 billionInjection circuit withdrawal: 0.7665 billionDelivery through cross-border pipelines: 5.779 billionTransit and export: 5.779 billionSystem interconnector Vecsés 4 (FGSZ>MGT) 0.0001 billion
TOTAL PERFORMANCE IN 2017
UKRAINIAN/HUNGARIAN INTERCONNECTOR(TESTVÉRISÉG, ÖSSZEFOGÁS)
AUSTRIAN/HUNGARIAN INTERCONNECTOR(FROM HAG PIPELINE DIRECTION)
HUNGARIAN/SERBIAN INTERCONNECTOR
HUNGARIAN/ROMANIAN INTERCONNECTOR
HUNGARIAN/CROATIAN INTERCONNECTOR
CONNECTION POINT (MGT>FGSZ)
MAXIMUM AVAILABLE NET PRODUCTION
DAILY ENTRY PEAK CAPACITY OF THE NATURAL GAS TRANSMISSION SYSTEM
PORTFOLIO ELEMENTS
SLOVENIA
NATURAL GAS TRANSMISSION

5 entry points (cubic meter)Annual firm capacity 5.13 billionDaily peak capacity 59.6 millionof which interruptible 6.5 million
(cubic meter) Annual firm capacity 1.2 billionDaily firm peak capacity 20.0 million
PUSZTAEDERICS
SIÓFOK CENTER
K ÁPOLNÁSNYÉK
GELLÉNHÁZA
BABÓCSA
VECSÉS
SZANKK ARDOSKÚT
ALGYŐ
SZŐREGZSAN A
VÁROSFÖLD
KECSKEMÉT
KENDERES
HA JDÚSZOBOSZLÓ
ENDRŐD
NEMESBIKK
MISKOLC
BEREGDARÓC
TISZAVASVÁRIMOSONMAGYARÓVÁOSONMAGYARÓVÁROSONMAGYARÓVÁR
BÁTA
DRÁVASZERDAHELY
BEREKFÜRDŐ
ZSÁMBOK
EDDE
KISKUNDOROZSMA
CSANÁDPALOTA
KARCAG
CAPACITY OF UNDERGROUND STORAGES OF STRATEGIC PURPOSES
CAPACITY OF UNDERGROUND STORAGES OF COMMERCIAL PURPOSES
ROMANIA
SERBIA
CROATIA
SLOVENIA
AUSTRIA
SLOVAKIA
NATURAL GAS TRANSMISSION PLANT
COMPRESSOR STATION
IMPORT/EXPORT POINT
BACKHAUL
PRODUCTION
STORAGE
STORAGE FOR STRATEGIC PURPOSES
CONNECTION POINT (FGSZ-MGT)
GAS TRANSFER STATION
GAS PIPELINE Ø ≥ 1000 MM
GAS PIPELINE Ø ≥ 600 MM
GAS PIPELINE Ø ≥ 300 MM
GAS PIPELINE Ø < 300 MM
77

OPERATING REVIEW OF 2017
Segment IFRS results (HUF bn) FY 2017 FY 2016 Ch %
EBITDA 61.4 54.5 13
EBITDA excl. spec. items(1) 61.4 54.5 13
Operating profit/(loss) reported 48.2 41.4 16
Operating profit/(loss) reported excl. spec. items(1) 48.2 41.4 16
CAPEX and investments 4.9 7.5 (36)
o/w organic 4.9 7.5 (36)
Notes and special items are listed in Appendix I and II
ADVERSE REGULATORY CHANGES OFF-SET BY HIGHER VOLUMES AND FOCUS ON COST
Following a cost and asset review procedure regulated tariffs are significantly lower than those applied so far both for capacity and volumetric fees as of January 2017. The tariff adjustment came on the back of a 25% reduction of the regulated asset base. However colder winter weather conditions, higher level of gas storage activities and export transmission demands had a favour-able effect on operating revenues and resulted in significant additional capacity bookings. Domestic transmission and transmitted volumes to gas storages rose by 22% compared to 2016, while regulated export volumes (to Ukraine and Croatia) increased threefold from a very low base. Transmission volumes to Serbia and Bosnia and Herzegovina were higher by 17% in 2017 compared to prior year.As a result the unfavourable effect of changes in domestic regulatory environment and higher operating expenditures were over-compensated by increased transmission demand and significant additional capacity bookings. Consequently FGSZ’s EBITDA totalled HUF 61bn in 2017, 13% above the prior year’s figure.
OUTLOOK
EUROPEAN DIMENSIONS
FGSZ’s intends to create a more efficient gas market, which rests on several pillars. Therefore, in the 10-year period between 2018 and 2027 it wishes to participate in comprehensive infrastructure developments at both Hungarian and international level to promote the creation of a gas distribution hub and a liquid domestic gas market. The transformation of the gas market makes it possible for the domestic consumers to gain access to competing gas sources.The transformation of the Transdanubian central odourization facility was successfully implemented in 2016, facilitating the increasing of the entry capacity in the Austria-Hungary direction. As a result of this development there is a great increasing in the flexibility of the transmission system in Western-Hungary. The planned 2019-2022 strategic investment phase focuses on the southeast-north transmission route, the implementation of the Romanian-Hungarian-Slovakian transmission corridor and on establishing reverse flow directions of cross-border points. For the purpose of security of supply, FGSZ aims to ensure the inward transmission possibility of natural gas from every possible direction. FGSZ also strives to become an integral part of the surrounding region by making the established cross-border inter-connections reversible. In this regard, the establishment of the possibility for transmitting natural gas from and to Romania was an important step. The initial set-up increased entry capacities to a smaller extent only; however, FGSZ and its Romanian partner (Transgaz) work together to achieve a significant capacity expansion. The business rationale of the investment decision is based by the result of the capacity booking procedure (open season) launched in October 2017. The transmission capacity of both flows from Romania to Hungary and from Hungary to Romania will reach 4.4 billion m3/year, provided the successful bidders do not exercise their exit right by December 2018. The possibility to deliver natural gas from the Black Sea sources could mean actual diversifica-tion for Hungary and countries of the region.
NATURAL GAS TRANSMISSION

APPENDICES
APPENDIX I
Impact of special items on operating profit and EBITDA (in HUF mn)
Special items - operating profit (HUF mn) FY 2017 FY 2016 Ch %
OPERATING PROFIT EXCLUDING SPECIAL ITEMS 383,920 330,873 16
Upstream (20,655) (6,578) 214
Matjushkinskaya Vertical divestment – (3,234) 100
Kalegran inventory impairment – (3,344) 100
North Karpovsky divestment (5,920) – N.A.
Angola provision release 10,528 – N.A.
CEOC arbitration (6,874) – N.A.
Hungarian year-end impairments (18,389) – N.A.
Downstream (4,755) (4,471) 6
HCK (HydroCracker) impairment – (4,471) 100
INA environmental provision (4,755) – N.A.
Consumer services – (5,982) 100
IES Impairment (Asset held for sale IFRS 5) – (5,982) 100
Corporate and other (4,142) (5,937) 30
Impairment in INA Group – (5,937) 100
Labin platform (4,142) – N.A.
TOTAL IMPACT OF SPECIAL ITEMS ON OPERATING PROFIT (29,553) (22,968) (29)
OPERATING PROFIT 354,367 307,905 15
Special items - EBITDA (HUF mn) FY 2017 FY 2016 Ch %
EBITDA EXCLUDING SPECIAL ITEMS 679,605 629,966 8
Upstream (2,266) (6,578) 66
North Karpovsky divestment (5,920) – N.A.
Angola provision release 10,528 – N.A.
CEOC arbitration (6,874) – N.A.
Matjushkinskaya Vertical divestment – (3,234) 100
Kalegran inventory impairment – (3,344) 100
Downstream (4,755) – N.A.
INA environmental provision (4,755) – N.A.
TOTAL IMPACT OF SPECIAL ITEMS ON EBITDA (7,021) (6,578) (7)
EBITDA 672,583 623,388 8
79

Impact of special items on operating profit and EBITDA (in USD mn)
Special items - operating profit (USD mn) FY 2017 FY 2016 Ch %
OPERATING PROFIT EXCLUDING SPECIAL ITEMS 1,391 1,179 18
Upstream (79) (23) (246)
Matjushkinskaya Vertical divestment – (12) 100
Kalegran inventory impairment – (11) 100
North Karpovsky divestment (22) – N.A.
Angola provision release 38 – N.A.
CEOC arbitration (27) – N.A.
Hungarian year-end impairments (69) – N.A.
Downstream (18) (15) (19)
HCK (HydroCracker) impairment (15) 100
INA environmental provision (18) – N.A.
Consumer services – (20) 100
IES Impairment (Asset held for sale IFRS 5) – (20) 100
Corporate and other (16) (21) 27
Impairment in INA Group – (21) 100
Labin platform (16) – N.A.
TOTAL IMPACT OF SPECIAL ITEMS ON OPERATING PROFIT (113) (80) (42)
OPERATING PROFIT 1,278 1,099 16
Special items - EBITDA (USD mn) FY 2017 FY 2016 Ch %
EBITDA EXCLUDING SPECIAL ITEMS 2,472 2,240 10
Upstream (10) (23) 57
North Karpovsky divestment (22) – N.A.
Angola provision release 38 – N.A.
CEOC arbitration (27) – N.A.
Matjushkinskaya Vertical divestment – (12) 100
Kalegran inventory impairment – (11) 100
Downstream (18) – N.A.
INA environmental provision (18) – N.A.
TOTAL IMPACT OF SPECIAL ITEMS ON EBITDA (28) (23) (21)
EBITDA 2,444 2,217 10
APPENDICES

APPENDIX II
NOTES
Number of footnote
(1) Special items that affected operating profit and EBITDA are detailed in Appendix I.
(2)
As of Q2 2013 our applied clean CCS methodology eliminates from EBITDA/operating profit inventory hold-ing gain / loss (i.e.: reflecting actual cost of supply of crude oil and other major raw materials); impairment on inventories; FX gains / losses on debtors and creditors; furthermore adjusts EBITDA/operating profit by capturing the results of underlying commodity derivative transactions. Clean CCS figures of the base peri-ods were modified as well according to the improved methodology.
(3)Both the 2016 and 2017 figures have been calculated by converting the results of each month in the period on its actual monthly average HUF/USD rate.
(4) Net gearing: net debt divided by net debt plus shareholders’ equity including non-controlling interests.
(5) Brent dated price vs. average Ural MED and Ural ROTT prices
(6)
Net external sales revenues and operating profit includes the profit arising both from sales to third parties and transfers to the other business segments. Upstream transfers domestically produced crude oil, conden-sates and LPG to Downstream and natural gas to the Gas Midstream segment. The internal transfer prices used are based on prevailing market prices. The gas transfer price equals the average import price. Divi-sional figures contain the results of the fully consolidated subsidiaries engaged in the respective divisions.
(7)
This line shows the effect on operating profit of the change in the amount of unrealised profit deferred in respect of transfers between segments. Unrealised profits arise where the item transferred is held in inven-tory by the receiving segment and a third party sale takes place only in a subsequent quarter. For segmental reporting purposes the transferor segment records a profit immediately at the point of transfer. However, at the company level profit is only reported when the related third party sale has taken place. Unrealised prof-its arise principally in respect of transfers from Upstream to Downstream and Gas Midstream.
(8) From 2016 Austrian retail operations were reclassified into wholesale.
(9)As of January 2018 an updated formula for calculating the „MOL Group petrochemicals margin” was intro-duced, replacing the previous „Integrated petrochemical margin”. The purpose of the new formula is to better reflect the petchem product slate of the group.
(10) CIF Med parity
(11) FOB Rotterdam parity
(12) FOB Med parity
81

CORPORATE GOVERNANCE


CONTENTS1. Introduction ........................................................................................................................ 85
2. Shareholders (general meeting) ................................................................................... 85 2.1. Exercising the shareholders’ rights, general meeting participation ................ 85 2.2. Relationship with the shareholders .......................................................................... 86
3. Management and operation ........................................................................................... 86 3.1. Board of Directors ....................................................................................................... 86 3.1.1. Operation of the Board of Directors ............................................................ 87 3.1.2. Report of the Board of Directors on its 2017 activities ................................ 88 3.1.3. Committees of the Board of Directors .......................................................... 88 a. Corporate Governance and Remuneration Committee ..................... 88 b. Finance and Risk Management Committee ........................................... 88 c. Sustainable Development Committee ................................................... 89 3.2. Executive Board .......................................................................................................... 89 3.2.1. Relationship with the Board of Directors and MOL Group organisations 89 3.2.2. The Executive Board members in 2017 .......................................................... 90
4. Control ................................................................................................................................. 90 4.1. Supervisory Board ...................................................................................................... 90 4.2. Audit Committee .......................................................................................................... 91 4.3. External auditors ......................................................................................................... 91 4.4. Internal control ............................................................................................................ 91
5. Annual remuneration for MOL Group management .................................................. 92 5.1. Board of Directors ....................................................................................................... 92 5.2. Executive Board and management ......................................................................... 93 5.2.1. Short Term Incentive (bonus) .......................................................................... 93 5.2.2. Long Term Incentive system ............................................................................ 94 5.3. Supervisory Board ...................................................................................................... 96
6. Integrated corporate risk management function ..................................................... 96
7. Prohibition of insider trading ......................................................................................... 98
CORPORATE GOVERNANCE

1. INTRODUCTION
MOL Hungarian Oil and Gas Public Limited Company (here-inafter: “MOL” or “Company”) has always been committed to implementing the highest standards of corporate governance structures and practices. This is not only with regard to national expectations but also with reference to the continually evolving and improving standards of good governance on an international level. As a result MOL is geared towards shareholders’ inter-ests, whilst taking into account the interests of a broader group of stakeholders inevitably necessary to enhance the generation of exceptional value for MOL’s shareholders and people.
Among other things, the voluntary approval of the declara-tion on the Budapest Stock Exchange Corporate Governance Recommendations by the Annual General Meeting in 2006, before the official deadline, served as testament to the Compa-ny’s commitment to corporate governance. In addition, MOL made a declaration concerning the application of the corporate governance recommendations of the Warsaw Stock Exchange prior to the admission of its shares to the Warsaw Stock Exchange in December 2004. The Company submits its decla-ration on this topic to both stock exchanges each year.
MOL’s corporate governance practice meets the requirements of the regulations of the Budapest Stock Exchange and the rele-vant capital market regulations. MOL also subjects its poli-cies to regular review to ensure that they take account of the continually evolving international best practice in this area. MOL's Corporate Governance Code containing the main corpo-rate governance principles of the Company was adopted in 2006 for the first time and its last update was fulfilled in 2015. This Code summarises its approach to shareholders’ rights, main governing bodies, furthermore remuneration and ethical issues. The Corporate Governance Code has been published on the website of the Company.
2. SHAREHOLDERS (GENERAL MEETING)
The general meeting is the supreme body of the Company consisting of the totality of shareholders.
The general meeting, as the main decision-making body, enables shareholders to make decisions on issues that are of a material nature concerning the operations of the Company, to approve actual corporate governance actions and to exercise effective governance and control rights.
2.1. EXERCISING THE SHAREHOLDERS’ RIGHTS, GENERAL MEETING PARTICIPATION
Voting rights on the general meeting can be exercised based on the voting rights attached to shares held by the shareholders. Each “A” Series share entitles its holder to one vote. The actual voting power depends on how many shares are registered by the shareholders participating in the general meeting.
Condition of participation and voting at the general meeting for shareholders is that the holder of the share(s) shall be registered in the Share Register. The depositary shall be responsible for registering the shareholders in the Share Register pursuant to the instructions of such shareholders in line with the conditions set by the general meeting invitation. According to Article 8.6 of the Articles of Association: “Each shareholder – at the share-holder’s identification related to the closing of the share registry prior to the next general meeting –, shall declare whether he, or he and any other shareholder belonging to the same share-holder group as specified in Articles 10.1.1 and 10.1.2 holds at least 2% of the Company’s shares, together with the shares regarding which he asks for registration.” If the conditions described in the previous sentence are met, the shareholder requesting registration is obliged to declare the composition of the shareholder group taking into account the provisions of Articles 10.1.1 and 10.1.2.
Furthermore, the shareholder shall, on the request of the Board of Directors, immediately identify the ultimate bene-ficial owner with respect to the shares owned by such share-holder. In case the shareholder fails to comply with the above request or in case there is a reasonable ground to assume that a shareholder made false representation to the Board of Direc-tors, the shareholder’s voting right shall be suspended and shall be prevented from exercising it until full compliance with the said requirements.
According to Article 10.1.1 of the Articles of Association: “No shareholder or shareholder group (as defined in Article 10.1.2 of Articles of Association) may exercise more than 10% of the voting rights with the exception of the organization(s) acting at the Company’s request as depository or custodian for the Company’s shares or securities representing the Company’s shares (the latter shall be exempted only insofar as the ultimate person or persons exercising the shareholder’s rights repre-sented by the shares and securities deposited with them do not fall within the limitations specified here below).”
CORPORATE GOVERNANCE
85

In accordance with Act V of 2013 on the Civil Code (hereinafter: “Civil Code”) the shareholders have the right to participate, to request information and to make remarks and proposals at the general meeting. Shareholders are entitled to vote, if they hold shares with voting rights. The shareholders having at least one per cent of the voting rights may request the Board of Directors to add an item to the agenda of the general meeting. Where a group of shareholders together controlling at least one per cent of the votes in the Company propose certain additions to the agenda in accordance with the provisions on setting the items of the agenda, or table draft resolutions for items included or to be included on the agenda, the matter proposed shall be construed to have been placed on the agenda if such proposal is deliv-ered to the Board of Directors within eight days following the time of publication of notice for the convocation of the general meeting, and the Board of Directors publishes a notice on the amended agenda, and on the draft resolutions tabled by share-holders upon receipt of the proposal. The conditions to partic-ipate in the general meeting are published in the invitation to the general meeting. Invitations to the general meeting are published on the company website according to the Articles of Association. The ordinary general meeting is usually held in April, in line with the current regulations.
The ordinary general meeting, based on the proposal of Board of Directors approved by the Supervisory Board, shall have the authority to determine profit distribution, i.e. the amount of the profit after taxation to be reinvested into the Company and the amount to be paid out as dividends. Based upon the decision of the general meeting, dividend can be paid in a non-cash form as well.
The starting date for the payment of dividends shall be defined by the Board of Directors in such way as to ensure a period of at least 10 working days between the first publication date of such announcement and the initial date of dividend distribution. Only those shareholders are entitled to receive dividend, who are registered in the share register of the Company on the basis of shareholders identification executed on the date defined by the Board of Directors and published in the announcement on the dividend payment. Such date relevant to the dividend payment determined by the Board of Directors may deviate from the date of the general meeting deciding on the payment of dividend.
2.2. RELATIONSHIP WITH THE SHAREHOLDERS
The Board is aware of its commitment to represent and promote shareholders’ interests, and recognises that it is fully account-able for the performance and activities of the MOL Group. To help ensure that the Company can meet shareholders’ expec-tations in all areas, the Board continually analyses and evalu-ates developments, both in the broader external environment as well as at an operational level.
Formal channels of communication with shareholders include regular announcements, the annual report, the half-year report and quarterly earnings reports, furthermore extraordi-nary announcements. Regular and extraordinary announce-
ments are published on MOL’s website, on the Budapest Stock Exchange (primary exchange), on the Warsaw Stock Exchange and on the Capital Market Information Disclosure System operated by the National Bank of Hungary (Magyar Nemzeti Bank). Moreover we send e-mail announcements to those who subscribed to the distribution list of e-mail announcements of Investor Relations and to the international and domestic media. In addition, presentations on the business, its performance and strategy are given to shareholders at the Annual General Meeting. Regular Roadshow visits are also made to various cities in the UK, the US and Continental Europe where meet-ings are held with representatives of the investment commu-nity, including MOL’s shareholders and holders of MOL’s Depository Receipts (DR). Furthermore, investors are able to raise questions or make proposals at any time during the year, including the Company’s general meeting. Investor feedbacks are regularly reported to the Board of Directors.
MOL has an Investor Relations department which is respon-sible for the organisation of the above activities as well as for the day-to-day management of MOL’s relationship with its shareholders (contact details are provided in the “Shareholder Information” section at the end of the annual report). Exten-sive information is also made available on MOL’s website (https://molgroup.info/en/), which has a dedicated section for shareholders and the financial community. MOL has always paid special attention to provide a considerably wide range of information to the capital markets, in line with interna-tional best practice. Therefore Investor Relations Depart-ment of MOL is continuously renewing its website (direct link at: https://molgroup.info/en/investor-relations). The aim of the development is to make the website even more user-friendly, in line with the intention to continuously improve our services. These enable us to meet the expectations of our shareholders, analysts and other capital market participants more effectively.
In 2017 MOL conducted a total of 15 days of roadshow and participated in 16 conferences in the U.S. and Europe, having around 300 meetings with potential and existing shareholders and bondholders. Investor engagement in November-December 2017 was dedicated to give an update to the investment commu-nity on MOL’s long-term strategy (MOL2030), summarizing the key steps taken and those upcoming in the near future.
3. MANAGEMENT AND OPERATION
3.1. BOARD OF DIRECTORS
MOL’s Board of Directors acts as the highest managing body of the Company and as such has collective responsibility for all corporate operations.
The Board’s key activities are focused on achieving increasing shareholder value with also considerating other stakeholders’ interest; improving efficiency and profitability and ensuring
CORPORATE GOVERNANCE

transparency in corporate activities and sustainable operation. It also aims to ensure appropriate risk management, environ-mental protection and conditions for safety at work.
Given that MOL and its subsidiaries effectively operate as a single economic unit, the Board is also responsible for enforcing its aims and policies and for promoting the MOL culture throughout the entire Group.
The principles, policies and goals take account of the Board’s specific and unique relationship with MOL’s shareholders, the executive management and the Company. The composi-tion of the Board reflects this with the majority (seven of ten members) made up of non-executive directors. At present, 6 members of the Board of Directors qualify as independent on the basis of its own set of criteria (based on NYSE and EU recommendations) and the declaration of the directors.
The members of the Board of Directors and their independence status in 2017 (professional CVs of the members are available on the Company’s website):
Name Status Mandate
Zsolt Hernádi, Chairman-CEO non-independentElected by the Annual General Meeting to be member of the Board of Directors from 24 February, 1999
Dr. Sándor Csányi, Deputy Chairman independentElected by the Annual General Meeting to be member of the Board of Directors from 20 October, 2000
József Molnár non-independentElected by the Annual General Meeting to be member of the Board of Directors from 12 October, 2007
Zsigmond Járai independentElected by the Annual General Meeting to be member of the Board of Directors from 29 April, 2010
Dr. László Parragh independentElected by the Annual General Meeting to be member of the Board of Directors from 29 April, 2010
Dr. Martin Roman independentElected by the Annual General Meeting to be member of the Board of Directors from 29 April, 2010
Dr. Oszkár Világi non-independentElected by the Annual General Meeting to be member of the Board of Directors from 1 May, 2011
Dr. Anthony Radev non-independentElected by the Annual General Meeting to be member of the Board of Directors from 30 April, 2014
Dr. Anwar al-Kharusi independentElected by the Annual General Meeting to be member of the Board of Directors from 30 April, 2014
Dr. János Martonyi independentElected by the Annual General Meeting to be member of the Board of Directors from 1 July, 2014
3.1.1. OPERATION OF THE BOARD OF DIRECTORS
The Board acts and adopts resolutions as a collective body.
The Board adopted a set of rules (Charter) to govern its own activities in 1991, when the Company was founded; these rules were updated in April, 2015 to ensure continued adherence to best practice standards.
The Charter covers: scope of the authority and responsibilities of the Board, scope of the committees operated by the Board, the scope of the information required by the Board and
the frequency of reports, main responsibilities of the Chairman and the Deputy
Chairman, order and preparation of Board meetings and the perma-
nent items of the agenda, and
decision-making mechanism and the manner in which the implementation of resolutions is monitored,
rules on conflict of interest.
Members of the Board of Directors shall sign an Annual Declara-tion on Conflict of Interest in accordance with the form approved by the Board of Directors simultaneously assuming their member-ship, and in every calendar year 30 days prior to the date of the annual general meeting which is to be submitted to the Corpo-rate Governance and Remuneration Committee. If any conflict of interest specified in the Charter of the Board of Directors occurs with respect to the member of the Board of Directors, such member shall report in Ad hoc Declaration on Conflict of Interest to the Corporate Governance and Remuneration Committee.
The Board of Directors prepares a formal evaluation of its own and its committees’ performance on a yearly basis and it contin-uously reviews its own activity.
87

3.1.2. REPORT OF THE BOARD OF DIRECTORS ON ITS 2017 ACTIVITIES
In 2017, the Board of Directors held 6 meetings with an average attendance rate of 93%. Attendance to the Board of Directors meetings during 2017 is set out in the table below:
Number of Meetings
Attendance Ratio
TOTAL 6 93%
Zsolt HERNÁDI 5 83%
Dr. Sándor CSÁNYI 6 100%
József MOLNÁR 6 100%
Zsigmond JÁRAI 5 83%
Dr. László PARRAGH 4 66%*
Dr. Martin ROMAN 6 100%
Dr. Oszkár VILÁGI 6 100%
Dr. Anthony RADEV 6 100%
Dr. Anwar AL-KHARUSI 6 100%
Dr. János MARTONYI 6 100%
* Mr. Parragh did not attend the BoD meeting on the 16 of February, as he had to attend a business meeting with the leaders of Eurochambers, furthermore did not attend he meeting on the 7th of September as he had to attend a busi-ness event at the Hungarian Chamber of Commerce and Industry.
Alongside regular agenda items, such as reports by the commit-tees’ chairmen on the activities pursued since the last Board meeting, the Board of Directors received updates on key stra-tegic issues as well as an overview of capital market develop-ments and individually evaluated the performance of each of the company’s business units.
The Board of Directors respectively paid attention to the follow-up of the industry macro trends, the treatment of the challenges driven by the external environment, the financial, operational and efficiency improvement challenges regarding INA and the strategy update process.
3.1.3. COMMITTEES OF THE BOARD OF DIRECTORS
The Board operates its committees to increase the efficiency of the Board’s operations and to provide the appropriate profes-sional background for decision-making. The committees are preparatory, advisory, opinion-forming and proposal-preparing bodies of the Board of Directors and have prior opinion-forming rights, as set out by MOL Group’s List of Decision-making Authorities, in certain questions belonging to the competency of the Board of Directors and in those which are delegated to the competency of respective executive members of the Board of Directors, as the executive management of the Company.
The responsibilities and the rules of procedure of the commit-tees are determined by the Board of Directors.The Chairman of the Board of Directors may also request the committees to perform certain tasks.
The members and chairmen of the committees are elected by the Board of Directors. The majority of committee members is non-executive and independent.
The Board allocates responsibilities to the various committees as follows:
a. Corporate Governance and Remuneration Committee:Members and dates of appointment to the committee (profes-sional CVs of members are available on the Company’s website):
Dr. Sándor Csányi - chairman, 17 November, 2000 Zsolt Hernádi, 8 September, 2000 Dr. Martin Roman, 4 June, 2010 Dr. Anthony Radev, 30 May, 2014 Dr. János Martonyi, 1 July, 2014
The Chairman of the Board of Directors is a permanent member of the Corporate Governance and Remuneration Committee.
Responsibilities: Analysis and evaluation of the activities of the Board of
Directors, issues related to Board/Supervisory Board membership, promoting the relationship between shareholders and
the Board, procedural, ethical and regulatory issues, reviewing corporate processes, procedures, organisa-
tional solutions and compensation and incentive systems and making recommendations on the implementation of best practices.
Report of the Corporate Governance and Remuner-ation Committee on its 2017 activitiesIn 2017 the Corporate Governance and Remuneration Committee held 5 meetings with a 96% average attendance rate. Attendance to the committee meetings during 2017 is set out in the table below:
Number of Meetings
Attendance Ratio
TOTAL 5 96%
Dr. Sándor CSÁNYI 5 100%
Zsolt HERNÁDI 4 80%
Dr. Martin ROMAN 5 100%
Dr. Anthony RADEV 5 100%
Dr. János MARTONYI 5 100%
In addition to the issues of corporate governance, remuneration and the composition of the management, the Committee discussed a number of key strategic and results-related topics prior to their presentation to the Board of Directors for discussion.
b. Finance and Risk Management Committee:Members and dates of appointment to the committee (profes-sional CVs of members are available on the Company’s website):
CORPORATE GOVERNANCE

Zsigmond Járai – chairman, 4 June, 2010 Dr. László Parragh, 20 February, 2014 Dr. Anthony Radev, 30 May, 2014 Dr. Anwar al-Kharusi, 30 May, 2014
The Chairman of the Board of Directors, the Chairman of the Supervisory Board and the Chairman of the Audit Committee are a permanent invitees to the meetings of the Finance and Risk Management Committee.
Responsibilities: Review of financial and related reports, monitoring the efficiency of the internal audit system, review of the scope and results of the planning and audit, monitoring of the risk management system, monitoring the liquidity position of the Company, the
financial and operational risks and the management thereof, review of the operation of Enterprise Risk Management (ERM) system,
ensuring the independence and objectivity of the external auditor.
Report of the Finance and Risk Management Committee on its 2017 activitiesIn 2017, the Finance and Risk Management Committee held 5 meetings with an 85% average attendance rate. Attendance to the committee meetings during 2017 is set out in the table below:
Number of Meetings
Attendance Ratio
TOTAL 5 85%
Zsigmond JÁRAI 4 80%
Dr. László PARRAGH 5 100%
Dr. Anthony RADEV 3 60%*
Dr. Anwar AL-KHARUSI 5 100%
* Mr. Radev could not attend the FRC meetings on the 16th of March as he had to attend a business trip and on the 3rd of August as he had to attend a private trip.
In addition to the regular items on the agenda, including the audit of all public financial reports, providing assistance to the audi-tor’s work and the regular monitoring of the internal audit, the committee reviewed the major risk factors of the Company, consid-ering the changed international financial situation and the status reports on risk management actions attached to these factors.
c. Sustainable Development Committee:Members and dates of appointment (professional backgrounds of members are available on Company website): Dr. László Parragh – Chairman, 30 May, 2014 József Molnár, 5 September, 2013 (interim Chairman
between 20 February and 30 May, 2014) Dr. Anwar al-Kharusi, 30 May, 2014 Dr. János Martonyi, 1 July, 2014
The Chairman of the Board of Directors, the Chairman and Deputy Chairman of the Supervisory Board are permanent invitees to the meetings of the Sustainable Development Committee.
Responsibilities: To review, evaluate and comment for the Board of Directors
on all proposals related to sustainable development (SD), to monitor the development and implementation of all SD
related policies (e.g. HSE, Code of Ethics, etc.) and discuss ethical issues,
to supervise the progress on the strategic focus areas of SD in MOL Group,
to request and discuss reports from business divisions and subsidiaries about their SD performance,
to review sustainability related data and information of external reports.
Report of the Sustainable Development Committee on its 2017 activitiesIn 2017, the Sustainable Development Committee held 4 meet-ings with a 94% attendance rate. Attendance to the committee meetings during 2017 is set out in the table below:
Number of Meetings
Attendance Ratio
TOTAL 4 94%
József MOLNÁR 4 100%
Dr. László PARRAGH 3 75%
Dr. Anwar AL-KHARUSI 4 100%
Dr. János MARTONYI 4 100%
The Committee evaluated the accomplishment of the sustain-atility related actions taken in 2017 with focus on the ones included in MOL Group’s Sustainability Plan for 2016-2020. The Committee formed opinion on the annual Sustainable Development Report and on thematic reports submitted by selected business units. External evaluations made about MOL Group’s sustainability performance were also reviewed with highlighted attention on the fact that the company remained a component ofthe Dow Jones Sustainability Index.
3.2. EXECUTIVE BOARD
3.2.1. RELATIONSHIP WITH THE BOARD OF DIRECTORS AND MOL GROUP ORGANISATIONS
The governance of the Company is carried out in line with standardised corporate governance principles and practice, and, within its framework, the Board of Directors will meet its liabilities for the integrated corporate governance by defining the responsibilities and accountabilities of the Executive Board (“EB”), established by the Board of Directors and securing the corporate operative activities, operating and organisational procedures, as well as standardised system for target-setting, reporting and audit (performance control system and business control system).
A consistent document prescribes the distribution of deci-sion-making authorities between the Board of Directors and
89
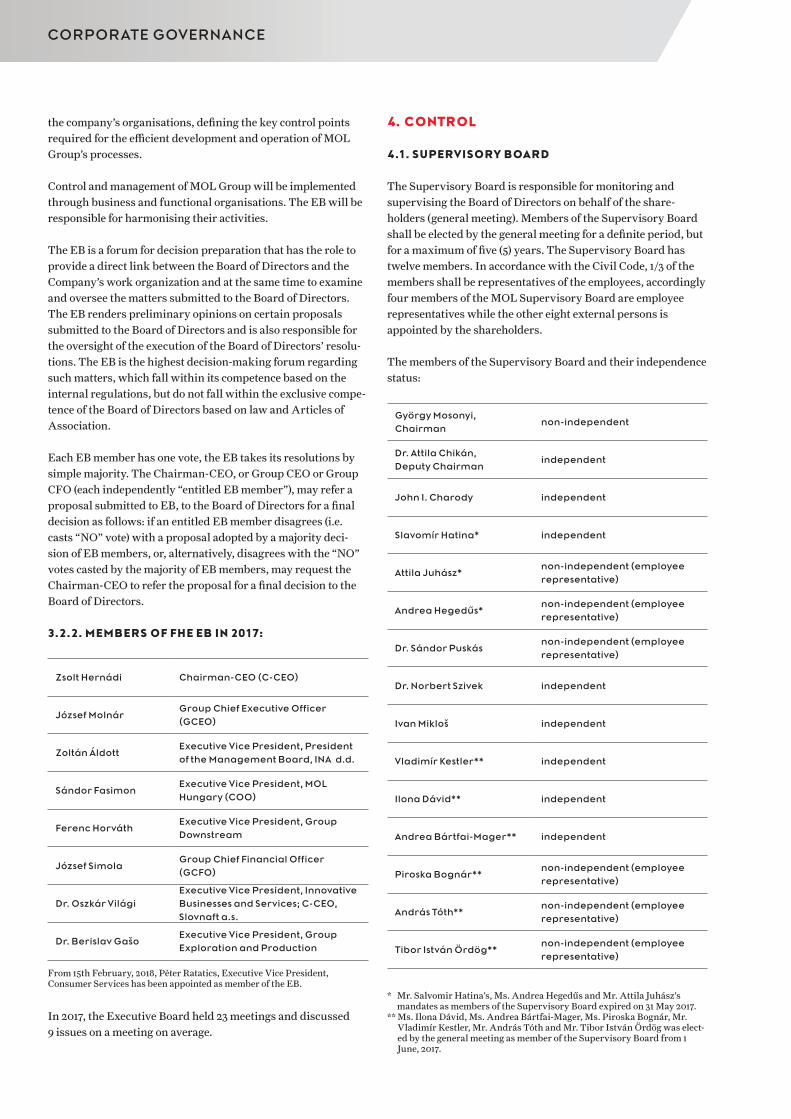
the company’s organisations, defining the key control points required for the efficient development and operation of MOL Group’s processes.
Control and management of MOL Group will be implemented through business and functional organisations. The EB will be responsible for harmonising their activities.
The EB is a forum for decision preparation that has the role to provide a direct link between the Board of Directors and the Company’s work organization and at the same time to examine and oversee the matters submitted to the Board of Directors. The EB renders preliminary opinions on certain proposals submitted to the Board of Directors and is also responsible for the oversight of the execution of the Board of Directors’ resolu-tions. The EB is the highest decision-making forum regarding such matters, which fall within its competence based on the internal regulations, but do not fall within the exclusive compe-tence of the Board of Directors based on law and Articles of Association.
Each EB member has one vote, the EB takes its resolutions by simple majority. The Chairman-CEO, or Group CEO or Group CFO (each independently “entitled EB member”), may refer a proposal submitted to EB, to the Board of Directors for a final decision as follows: if an entitled EB member disagrees (i.e. casts “NO” vote) with a proposal adopted by a majority deci-sion of EB members, or, alternatively, disagrees with the “NO” votes casted by the majority of EB members, may request the Chairman-CEO to refer the proposal for a final decision to the Board of Directors.
3.2.2. MEMBERS OF FHE EB IN 2017:
Zsolt Hernádi Chairman-CEO (C-CEO)
József MolnárGroup Chief Executive Officer (GCEO)
Zoltán ÁldottExecutive Vice President, President of the Management Board, INA d.d.
Sándor FasimonExecutive Vice President, MOL Hungary (COO)
Ferenc HorváthExecutive Vice President, Group Downstream
József SimolaGroup Chief Financial Officer (GCFO)
Dr. Oszkár Világi Executive Vice President, Innovative Businesses and Services; C-CEO, Slovnaft a.s.
Dr. Berislav GašoExecutive Vice President, Group Exploration and Production
From 15th February, 2018, Péter Ratatics, Executive Vice President, Consumer Services has been appointed as member of the EB.
In 2017, the Executive Board held 23 meetings and discussed 9 issues on a meeting on average.
4. CONTROL
4.1. SUPERVISORY BOARD
The Supervisory Board is responsible for monitoring and supervising the Board of Directors on behalf of the share-holders (general meeting). Members of the Supervisory Board shall be elected by the general meeting for a definite period, but for a maximum of five (5) years. The Supervisory Board has twelve members. In accordance with the Civil Code, 1/3 of the members shall be representatives of the employees, accordingly four members of the MOL Supervisory Board are employee representatives while the other eight external persons is appointed by the shareholders.
The members of the Supervisory Board and their independence status:
György Mosonyi, Chairman
non-independent
Dr. Attila Chikán, Deputy Chairman
independent
John I. Charody independent
Slavomír Hatina* independent
Attila Juhász*non-independent (employee representative)
Andrea Hegedűs*non-independent (employee representative)
Dr. Sándor Puskásnon-independent (employee representative)
Dr. Norbert Szivek independent
Ivan Mikloš independent
Vladimír Kestler** independent
Ilona Dávid** independent
Andrea Bártfai-Mager** independent
Piroska Bognár**non-independent (employee representative)
András Tóth**non-independent (employee representative)
Tibor István Ördög**non-independent (employee representative)
* Mr. Salvomir Hatina’s, Ms. Andrea Hegedűs and Mr. Attila Juhász’s mandates as members of the Supervisory Board expired on 31 May 2017.
** Ms. Ilona Dávid, Ms. Andrea Bártfai-Mager, Ms. Piroska Bognár, Mr. Vladimír Kestler, Mr. András Tóth and Mr. Tibor István Ördög was elect-ed by the general meeting as member of the Supervisory Board from 1 June, 2017.
CORPORATE GOVERNANCE

The Chairman of the Supervisory Board is a permanent invitee to the meetings of the Board of Directors, Finance and Risk Management Committee and Sustainable Development Committee meetings.
Regular agenda points of the Supervisory Board include the quarterly report of the Board of Directors on the Company’s operations and the reports of Internal Audit and Corporate Security, furthermore it is informed on other relevant topics. In addition, the Supervisory Board reviews the proposals for the Annual General Meeting. The Supervisory Board reviews its annual activity during the year.
In 2017 the Supervisory Board held 5 meetings with a 92% average attendance rate.
4.2. AUDIT COMMITTEE
In 2006, the general meeting appointed the Audit Committee comprised of independent members of the Supervisory Board. The Audit Committee strengthens the independent control over the financial and accounting policy of the Company.
The independent Audit Committee’s responsibilities include the following activities among others:
providing assistance to the Supervisory Board in super-vising the financial report regime, in selecting an auditor and in working with the auditor, reviewing and moni-toring the independence of the statutory auditor, moni-toring the effectiveness of the Company's internal audit and risk management systems and make recommenda-tions if necessary;
carrying out the tasks of the audit committees of its subsidiaries which are consolidated by the Company, operate as public limited companies or issue securities admitted to trading on regulated market, if the relevant laws allow that and the subsidiary in question does not operate a separate audit committee.
Members of the Audit Committee and dates of their appoint-ment (professional CVs of members are available on the Compa-ny’s website):
Dr. Attila Chikán - chairman, 27 April, 2006 John I. Charody, 27 April, 2006 Dr. Norbert Szivek, 14 April, 2016 Ms. Ilona Dávid, 1 June, 2017* Ms. Andrea Bártfai-Mager, 1 June 2017* Ivan Mikloš, 1 May, 2016**
*Ms. Ilona Dávid, Ms. Andrea Bártfai-Mager was elected by the general meeting as a member of the Audit Committee from 1 June, 2017.** Ivan Mikloš was elected by the general meeting as a permanentmember of the Audit Committee from 1 May 2017.
Report of the Audit Committee on its 2017 activities:In 2017, the Audit Committee held 5 meetings with an 88% average attendance rate. In addition to the regular items on the agenda, including the audit of all public financial reports,
providing assistance to the auditor’s work and the regular monitoring of Internal Audit, the Committee reviewed the major risk factors of the Company, considering the changed international financial situation and the status reports on risk management actions attached to these factors. The Audit Committee continuously monitored the Company’s financial position. The Audit Committee reviewed the materials of the Annual General Meeting (i.e. financial reports, statements of the auditor). The Audit Committee participated in the proce-dure of selecting an auditor and made a recommendation to the Supervisory Board regarding the appointment of the auditor.
4.3. EXTERNAL AUDITORS
MOL Group was audited by Ernst & Young (“EY”) in both 2017 and 2016, excluding FGSZ Zrt. (audited by Pricewaterhouse Coopers) and some other non-significant subsidiaries.
Within the framework of the audit contract, EY performs an audit of consolidated and statutory financial statements, and interim financial statements of MOL Plc. The auditors ensure the continuity of the audit by scheduling regular on-site reviews during the year, participating in the meetings of MOL’s governing bodies and through other forms of consultation.
Other non-audit and tax advisory services has completed cease from 1 January 2017 due to the EU audit reform came into force. Summary of the fees paid to them in 2016 and 2017 are as follows:
Fees paid to the auditors (HUF mn): 2016 2017
Audit fee for MOL (including audit fees for interim balance sheets)
147 140
Audit fee for subsidiaries 557 572
Other audit related services 48 37
Other non-audit services 53 0
Tax advisory services 409 0
Total 1214 749
The increase of the audit fee for subsidiaries is due to the acquired and newly established legal entities in Innova-tive Business Services. Other audit-related services includes primarily the assurance services relating to the Sustainable Development reports and Solvency II report.
The Board of Directors confirms that non-audit services provided by EY complied with the Policy for Services Provided by the External Auditor (FIN_GP19).
4.4. INTERNAL CONTROL
4.4.1 COMPLIANCE & ETHICS
MOL Group is committed to pursue ethical and fair conduct in all activities. In order to achieve the above aim MOL Group
91

started its Compliance Program and established compliance organization responsible for its execution, furthermore, in order to enforce the Code of Ethics and Business Conduct, allo-cated the task of supporting the operation of the Ethics Council in its competence.
Group Compliance and Ethics’ activities include operation of the whistleblowing system (’SpeakUp!’), conducting internal inspections, preparation of risk analysis and training of employees. Whilst taking the specific nature of business into consideration, Group Compliance and Ethics reviews internal processes and risk factors and makes recommendations in order to ensure compliance, furthermore provides assistance for their execution.
Group Compliance and Ethics carries out its task in accord-ance with the laws of each country, taking EU and interna-tional expectations as minimum standards. The organization’s competence covers the whole MOL Group through local compli-ance officers and local ethics officers.
Group Compliance and Ethics annually reports to the Supervi-sory Board and the Board of Directors on its activities.
4.4.2 INTERNAL AUDIT
Internal Audit provides an independent and objective evaluation of financial, operational and control activities executed within the whole MOL Group and report on the adequacy of internal controls, the level of compliance with internal and external regu-lations directly to the Finance and Risk Management Committee, Audit Committee and Supervisory Board following the Execu-tive Board’s acknowledgement of the audit reports.
There are no restrictions placed upon the focus and scope of internal audit’s work, the scope of the Internal Audit function within MOL Group covers all operations including any activ-ities and subsidiaries controlled by MOL Group. The Head of Group Internal Audit is responsible for determining the scope of internal audit reports.
The main focus of Internal Audit is to review operational and functional activities executed within the whole MOL Group, and to identify, understand, test and evaluate associated controls to ensure that identified risks are mitigated in the most favourable cost-benefit ratio from a business perspective.
Internal Audit applies standard risk assessment principles when evaluating the residual and inherent risks of control weaknesses. The applied MOL Group internal audit risk assess-ment principles are approved by the Finance and Risk Manage-ment Committee.
Internal Audit operates under an audit plan approved by the Supervisory Board and agreed with the Audit Committee at the end of the year for the next one. If there is a request to modify the approved annual audit plan during the year, the C-CEO
has the authority to approve any mid-year modifications to the annual audit plan.
To provide the independence of the Internal Audit function the Head of Group Internal Audit is accountable to the Finance and Risk Management Committee, Audit Committee and Super-visory Board and has direct access to their chairmen (for daily operational matters the Head of Group Internal Audit reports directly to the C-CEO of MOL Group). The Supervisory Board shall form opinion on the appointment and recall of the Head of Group Internal Audit.
MOL Group Internal Audit department shall be organized and operated according to the professional auditing and internal audit ethical standards of the Institute of Internal Auditors (IIA), the authoritative body for internationally recognized internal audit standards.
5. ANNUAL REMUNERATION FOR MOL GROUP MANAGEMENT
5.1. BOARD OF DIRECTORS
Annual fixed remuneration of the members of the Board of DirectorsAs of 1 January 2009, the members of the Board of Directors have been entitled to the following fixed net remuneration after each Annual General Meeting:
– Members of the Board of Directors 25,000 EUR/year– Chairmen of the Committees 31,250 EUR/year
Members of the Board of Directors who are not Hungarian citi-zens and do not have a permanent address in Hungary are provided with gross 1,500 EUR for each Board or Committee meeting (maximum 15 times a year) when they travel to Hungary.
Incentive based on share allowanceFrom January 1, 2012 the incentive based on share allowance serves as a long-term incentive for the members of the Board of Directors.
The aim of the new share based incentive is to ensure the interest in long-term stock price growth and to maintain moti-vation related to the dividend payment. To ensure these, a 1 year retention obligation (restraint on alienation) has been also determined for 2/3 of the shares (the retention obligation termi-nates at the date of the expiration of the mandate).
The incentive consists of two parts: share allowance and cash allowance related thereto.
• Share allowanceNumber of shares as of 1 January 2015:– in case of the members of the Board of Directors: 150 pieces of
series “A” MOL ordinary shares with a nominal value of HUF 1 000 per month
CORPORATE GOVERNANCE

– in case of the chairman of the Board of Directors: additional 50 pieces of series “A” MOL ordinary shares with a nominal value of HUF 1 000 per month
If the Chairman is not a non-executive director, the deputy chairman (who is non-executive) is entitled to this extra remu-neration (50 pieces/month).
The share allowance is provided once a year, within 30 days after the Annual General Meeting closing the given business year.
In line with MOL’s 8-for-1 share split (26 September 2017) each ordinary share of series “A” with a nominal value of HUF 1,000 was replaced by 8 pieces of series “A” ordinary shares with a nominal value of HUF 125. Accordingly, the share allowance of Board of Directors is subject to change after share split as following: – in case of the members of the Board of Directors: 1,200 pieces
of series “A” MOL ordinary shares with a nominal value of HUF 125 per month
– in case of the chairman of the Board of Directors: additional 400 pieces of series “A” MOL ordinary shares with a nominal value of HUF 125 per month.
• Cash allowanceThe incentive based on share allowance is a net incentive, which means that the Company ensures to pay the taxes, contri-butions and other payables incurred upon acquisition of the shares in line with the relevant and effective laws. Such cash-based coverage of taxes and contributions does not include any further tax(es) or cost(s) incurred in relation to exercising rights attached to the shares or disposal of the shares (e.g. divi-dend tax, income tax); these shall be borne by the respective members of the Board of Directors.
In line with this, there is a further cash allowance part of the incentive system, the rate of which is the gross value of taxes, contributions and other payables incurred upon acquisition of the shares in line with the relevant and effective laws, including also the tax difference and contributions incurring in the country of tax-residence in case of non-Hungarian members of the Board of Directors.
• Other benefitsThe members of the Board of Directors are entitled to receive further non-financial benefits*, including life and accident (79,000 HUF/person/year) and travel (18,000 HUF/person/year) insurance.
Besides, as a non-financial benefit an annual health screening (84,000 HUF/person/year) and an additional healthcare package (350,000 HUF/person/year) is available for the members of the Board of Directors.
* Rounded to 1000 HUF (In case of EUR, calculated based on January 25, 2017 exchange rate; source: www.mnb.hu)
5.2. EXECUTIVE BOARD AND MANAGEMENT
Incentive system for the top management, MOL Group Executive BoardThe aim of MOL’s remuneration system is to provide incentives for the top management to carry out the company’s strategy and reward them for the achievement of strategic goals through a combination of short-term and long-term incentives. The Corporate Governance and Remuneration Committee recog-nizes that remuneration plays an important role in supporting the achievement of these goals. Through the design of its incen-tive schemes, MOL aims to ensure that executive remuneration is aligned with and supports the company’s strategic objectives within a framework that closely aligns the interests of MOL executives to those of our shareholders.
The Executive Board (EB)'s remuneration mix consists of three key pillars:
Annual Base Salary (BS): fixed annual amount paid to the individuals
Short-Term Incentive (STI): annual bonus, based on individual and company performance
Long-Term Incentive (LTI): promotes performance driven culture and enhances the focus on the top management team to be aligned with the interests of shareholders
The remuneration mix of the EB on 31 December 2017:
Annual Base Salary
Target Short-Term
Incentive
Target Long-Term Incentive
Chairman-CEO
28% 28% 44%
Group CEO 30% 30% 40%
Other EB members
35% 30% 35%
The incentive system for the top management included the following elements in 2017:
1. Short Term Incentive systemThe basis of the short term incentive is a target of 85%-100% of the annual base salary. The amount thereof is defined in line with the evaluation of performance of the given manager.
Based on MOL Group’s decision making authorities the C-CEO and G-CEO annual performance is evaluated by the Corporate Governance and Remuneration Committee with final approval of the Board of Directors.
Performance Measures for the STIThe aim of MOL Group STI scheme is to motivate the partic-ipants to achieve operative, business and individual perfor-mance targets which can be reached within a year, and support MOL Group’s long term strategy.
93

In 2017, the Executive Board’s STI framework was designed to include key focus areas in a mix of financial and non-financial KPIs in order to achieve the targets of the Group.
Financial KPIs:In 2017, the key focus of the Executive Board was to deliver the EBITDA and CAPEX targets to achieve the 2030 strategic targets of MOL Group. These performance indicators are repre-sented in the C-CEO and G-CEO annual performance targets:
Business line KPI
C-CEO and Group CEOClean CCS EBITDA
CAPEX utilisation
Furthermore, Executive Board members with divisional responsibilities are assessed on a number of operative and financial measures reflecting annual priorities and the strategic direction of each business division within the framework of the Group’s long-term strategy.
Business line KPI
Group Downstream
Clean CCS EBITDA
CAPEX utilisation
NxDSP EBITDA Impact
Group Exploration & Production
2P Reserves
Clean CCS EBITDA
CAPEX utilisation
Production Unit Cost
General operating costs
Group Innovative Business-es and Services
Clean CCS EBITDA
CAPEX utilisation
Implementation of the strategy of new business lines
Operating costs
Non-financial KPIs:Executive Board members are also accountable for non-finan-cial targets alongside financial ones. Safety is a number one Group priority, which is why the Corporate Governance and Remuneration Committee consistently defines divisional SD&HSE-related performance indicators.
In 2017, MOL Group set the fulfillment of TRIR indicators of the Group and each divisions, as this uniformly shows the commitment of the Group for conducting safe, sustainable and compliant operations at all times.
In line with MOL Group 2030 strategy, a culture development journey started in 2017. This was set as a performance target across the whole management of MOL Group cascaded from the L1 such that they act as a role model in living the corporate values, and accelerate the culture change.
STI resultsThe choice of the aforementioned performance measures
reflects a desire from the Corporate Governance and Remuner-ation Committee to assess the participants based on a broad range of corporate and divisional measures that mirrors the corporate strategy and its related KPIs.
The results of the STI are not driven by a purely formulaic approach, as no specific weight has been assigned to each performance measure in order not to create an overemphasis on one at the expense of others. The Corporate Governance and Remuneration Committee rigorously assesses performance at the end of the period and judges whether the results against the performance measures are a reflection of the underlying perfor-mance of MOL Group.
Changes in 2018 regarding the Short Term Incentive system of the MOL Group Executive BoardThe Board of Directors of the MOL Plc. decided on 6 December 2017 that instead of their short-term incentive the top manage-ment can select a share ownership scheme in each year from 1st January 2018 which in case of Hungary will be operated via a MOL-independent legal entity, called MOL Plc. Employee Share Ownership Program Organization which in compli-ance with the act on the Employee Share Ownership Program (‘MRP’) incentive works in alignment with the provisions of the so-called Employee Share Ownership Program (Munkavál-lalói Résztulajdonosi Program, ’MRP’) legislation. The optional share ownership program works similarly to the short-term incentive, but the basis of the entitlement is a certain number of shares equal to the short-term incentive entitlement, which the managers hold during the performance and evaluation period. The payment is made in MOL shares. The first performance period will be 2018, with payment in 2019.
2. Long Term IncentiveThe purpose of the long-term incentive system is to drive and reward the delivery of sustainable value and to provide full alignment between MOL Group executive team and MOL shareholders.
The long-term incentive was reviewed in the last quarter of 2016 and the MOL Plc. Board of Directors decided to trans-form the current long term incentive programs to real share-based programs according to the provisions for MRP act on 13 October 2016. With this change, the programs can even better serve the further improvement of financial performance and efficiency in accordance with the corporate principles and the long term strategic objectives of MOL Group.
Changes in 2017The long-term incentives were modified according to the MRP legislation from 1st January 2017. The former Stock Option was transformed into the Absolute Share Value Based Remunera-tion and the Performance Share Plan program was modified to the Relative Market Index Based Remuneration. The entitle-ments of the managers were increased according to the interna-tional benchmarks and reward strategy.
CORPORATE GOVERNANCE

Stock Option and Performance Share Plan programs which started before 2017, continue to run and will be paid according to the previous rules.
In line with MOL’s 8-for-1 stock split, which was implemented in September 2017, the share-based long-term entitlements increased eightfold automatically. In the meantime, the strike price of the Stock Option and the new Absolute Share Value Based Remu-neration decreased to one-eighth from September 2017. This it is ensured that the value of the payouts do not change.
The main characteristics of the two new, modified incentive schemes are as follows:
a) Absolute Share Value Based Remuneration (former Stock Option)As of 1st January 2017 the basis of the remuneration is a share entitlement, which can be realized as a difference between a past strike price and a selected spot price. The incentive scheme has the following characteristics:
It starts annually and covers a 4-year period. The incen-tive period can be split into a 1-year performance period, a 1-year vesting period and a 2-year exercising period. The share entitlement lapses if not exercised by 31 December of the last final of the exercising period.
The value of the incentive is the difference between the strike price and a selected spot price for each unit of the entitlement.
The strike price is defined before the performance period begins. The strike price is the average price of MOL Plc. shares weighted with the volume in HUF on the Buda-pest Stock Exchange in the last quarter of the year before the performance year.
The spot price is the average price of MOL shares in HUF on the Budapest Stock Exchange on the day of redemption. The trading day is freely selected by the eligible manager however it is limited by applicable insider trading prohibitions.
The share entitlement is defined based on the position grade, but the final share entitlement is based on the individual performance evaluation during the perfor-mance period. During the individual performance evalu-ation, an individual short-term bonus payout percentage (between 0% and 150%) is set which acts as a multiplier of the share entitlement.
The payment of the entitlement is in shares or their cash equivalent. The value of the remuneration will be converted to shares based on the 30 days average MOL share price preceding the redemption date. In the case of cash-settlement the remuneration will be paid in Huna-grian forints and will be transferred to that bank account number of the participant, to which the regular salary of the is paid by the employer of the Participant.
Dividend equivalent: the final remuneration will be corrected with the value of the dividend per share paid for MOL Plc. shares in the vesting period after the performance period, in alignment with the share entit-
lement. The aim of the correction is to correct the long term incentive with the change of the share price caused by the dividend payment. The dividend equivalent is paid at redemption.
The final share entitlement is influenced also by the individual bonus payout percentage for the performance period:
Individual Bonus Payout %
% of Stock Options
0% > x0%
Between 1% and 149% >Based on individual
bonus payout percentage
150% > x150%
Overview:
Stock Option
Strike Price
Exercise Period
2013 2,247 HUF 1 Jan 2015-31 Dec 2017
2014 1,824 HUF 1 Jan 2016-31 Dec 2018
2015 1,472 HUF 1 Jan 2017-31 Dec 2019
2016 1,669 HUF 1 Jan 2018-31 Dec 2020
Absolute Share Value Based
RemunerationStrike Price Redemption Period
2017 2,352 HUF 1 Jan 2019-31 Dec 2020
b) Relative Market Index Based Remuneration (former Performance Share Plan)The program is a 3-year share-based incentive using the MOL Plc. comparative share price methodology with the following characteristics:
A new program starts in each year on a rolling scheme with a 3-year vesting period. Payments are due after the 3rd year.
The target is the development of MOL’s share price compared to relevant and acknowledged CEE regional and industry specific indexes: the CETOP Index and the Dow Jones Emerging Market Titans Oil & Gas 30 Index.
MOL’s share price performance is compared to the two above mentioned benchmark indices. Basis of the evalu-ation is the average difference in MOL’s year-on-year (12 months) share price performance in comparison to the benchmark indices. Comparisons are made on a USD basis. There are defined payout ratios which are based on the measured difference in MOL’s share price perfor-mance compared to the two indices, noticed in each year. Final payout ratio will be determined by the average of the three noticed payout ratios over the vesting period.
The expected payout amount is additionally linked to individual short-term performance, as the potential payout is based on three years’ individual factors in the
95
annual performance evaluation for each participant. This ensures that constant individual over-performance on a long-term basis is rewarded and the consequences of long term underperformance are managed.
The basis of the remuneration is a share entitlement and will be paid in MOL Plc shares or in a form of cash settle-ment.
The following chart provides an overview about the former Performance Share Plan results for the 3-year programs completed after Long Term Incentive system revision in 2013:
PSP Plan Payout Ratio
2013-2015 98.28%
2014-2016 180.99%
2015-2017 213.22%
Performance measures of the long-term incentive plansThe choice of the long-term incentive plans is linked to the share price and dividend payment reflecting the Board’s stra-tegic priority on reaching continuous and sustainable value creation. Through its long term incentives schemes, MOL prior-itizes to provide its shareholders with a return on their invest-ment through both the appreciation of the share price as well as through the payment of dividends.
The choice of CETOP20 and Dow Jones Emerging Market Titans Oil & Gas 30 Index reflects the fact that MOL competes for investor flows on a regional basis (Central and Eastern Europe) as well as with the global emerging market Oil & Gas sector. By applying these two indices, MOL’s incentive system provides competitive remuneration to executives and future investors on regional and global oil and gas markets taken in broader meaning as well.
Changes in 2018 regarding the Long Term Incentive system of the MOL Group Executive Board As of 1st January 2018 the payment of both remuneration poli-cies – the Absolute Share Value Based Remuneration and the Relative Market Index Based Remuneration – will be made only in MOL shares.The Absolute Share Value Based Remuneration will be paid from 2019, the Relative Market Index Based Remuneration will be paid first in 2020 by the MRP organization.
Other Fringe BenefitsMOL Group is offering standard benefits in-line with market practice for EB members. These include:
Dedicated status car for both business and private purposes;
life and accident insurance; travel insurance; liability insurance; annual health screening and special healthcare services.
5.3. SUPERVISORY BOARD
Remuneration of the members of the Supervisory BoardMembers of the Supervisory Board receive gross 4,000 EUR/month, while the Chairman receives gross 6,000 EUR/month. In addition to this monthly fee, the Chairman of the Supervi-sory Board is entitled to receive gross 1,500 EUR for participa-tion in each Board of Directors or Board Committee meeting, up to fifteen (15) times per annum. The Chairman of the Audit Committee is entitled to receive gross 1,500 EUR for participa-tion in each Board Committee meeting, up to fifteen (15) times per annum.
Besides the monthly remuneration both the Chairman of the Supervisory Board and the members are entitled to receive further 1,500 EUR for each extraordinary meeting that is held in addition to the scheduled annual meetings. This remunera-tion is provided maximum two times a year.
Other benefitsThe members of the Supervisory Board are entitled to receive further non-financial benefits, including life & accident (79,000 HUF/person/year) and travel (18,000 HUF/person/year) insur-ance. Besides, as a non-financial benefit an annual health screening (84,000 HUF/person/year) and an additional health-care package (350,000 HUF/person/year) is available for the members of the Supervisory Board.
* Rounded to 1000 HUF (In case of EUR, calculated based on January 25, 2017 exchange rate; source: www.mnb.hu)
6. INTEGRATED CORPORATE RISK MANAGEMENT FUNCTION
As operators in a high risk industry we, MOL group stay committed to professionally manage and maintain our risks within acceptable limits as per best industry practice.
The aim of MOL Group Risk Management is to keep the uncer-tainties of the business environment within acceptable levels and support stable and sustainable operations and the future growth of the company. MOL Group has developed the risk management function as an integral part of its corporate governance structure.
Assessment and mitigation of the broadest variety of risks is arranged on group level into one comprehensive Enterprise Risk Management (ERM) system. ERM is a risk management framework covering group-level business units and functional units as well as flagship and operating companies, with specific attention to projects as well.
The risk management methodology applied by MOL is based on international standards and best practices. It considers the organ-isation’s exposure to uncertainty in regard to value creation, meaning factors critical to the success and threats related to the
CORPORATE GOVERNANCE

achievement of objectives, also occurrence of incidents causing potential threat to people, assets, environment or reputation.
Risks are managed by risk owners, who are managers respon-sible for supervising the existing control framework and imple-mentation of defined risk mitigation actions in responsible organisations. Monitoring and reporting of risks is performed by the Group Risk Management department to the Finance and Risk Management Committee of the Board of Directors.
During 2017, we renewed our risk management processes to ensure special attention is given to our 2030 Strategy: we identi-fied major long-term risks that may impact our strategic objec-tives and detailed analysis is ongoing.
At the same time, mid-term risks related to our business plans are assessed and managed over the full lifetime of assets, performed at business segment level and coordinated by the group-level risk management team.
As in previous years, the short-term risk profile of the company is regularly reviewed with main focus on the 1-year budget of MOL Group.
Regular reporting to top management provides oversight on top risks and assurance that updated responses, controls, and appropriate mitigation actions are set and followed by the Exec-utive Board.
The main risk drivers of the GroupRisks are categorised to ensure effective risk reporting and consistent responses for similar or related risks.
a) Market and financial risks include, but are not limited to:i. Commodity price risk: MOL is exposed to
commodity price risk on both the purchasing side and the sales side. The main commodity risks stem from the integrated business model with downstream processing more crude and selling more than our equity crude oil production. We monitor this risk in order to support our strong financial position and capacity to fund oper-ations and investments. When necessary, we consider commodity hedging to eliminate risks other than ‘busi-ness as usual’ risks or general market price volatility.
ii. Foreign exchange (FX) risk: Business operation is economically driven mainly by USD. MOL’s current FX risk management policy is to monitor the FX risk, and to balance the FX exposures of the operating cash flow with the financing cash flow exposures when necessary and optimal.
iii. Credit risk: MOL Group provides products and services to a diversified customer portfolio - both from business segment and geographical point of view – with a large number of customers representing an accept-able credit risk profile. MOL Group’s risk management tracks these risks on a continuous basis, and provides
support to the sales processes in accordance with MOL Group’s sales strategy and ability to bear risk.
b) Operational risks include, but are not limited to:i. Physical asset safety and equipment breakdown
risk: High asset concentration in Downstream is a significant risk driver. The potential negative effects are mitigated by comprehensive HSE activities and a group-wide insurance management program.
ii. Crude oil supply risk: Crude supply disruption is a major risk factor for the Downstream business, as it canhamper continuous operations. In order to mitigate this risk, supplies of crude oil via pipelines are currently diversified with regular crude cargo deliveries from the Adriatic Sea.
iii. Cyber risk: Cyber risk needs attention and effective management to ensure the company is able to monitor, detect and respond to cyber threats. MOL has adapted and changed the way it deals with cyber defence and cyber threats (people, process and technology): a clear vision and strategy has been set up to manage cyber inci-dents with end-to-end ownership and accountability.
c) Strategic risks include, but are not limited to:i. Regulatory risk: MOL has significant exposure to a
wide range of laws, regulations, environmental and government policies that may change significantly over time. Due to the economic, and also in some regions political crisis, the risk of potential government actions increased, as well as potential impact of such decisions.
ii. Country risk: The international portfolio requires proper management of country risk exposures, there-fore possible political violence, compliance with local regulations or sanctions are monitored to enhance the diversification effect in the investment portfolio.
iii. Reputation risk: Reputation of energy industry players has been in the focus of media for the past years due to extreme negative events. MOL, as a major market player in the region, operates under special attention from a consid-erable number of stakeholders, and we are constantly seeking to meet our responsibilities towards them.
iv. Climate change risk: The effects of climate change have the potential to adversely impact MOL’s current operations. As a response, MOL Group launched its 2030 Strategy based on the expected decrease in demand for fossil fuels, primarily driven by a combina-tion of electrification and digitalization of transporta-tion, energy and fuel efficiency gains, as well as changes in consumer behaviour and advances in technology. MOL Group’s transformational strategy is meant as a response to the fast-developing consequences of global warming and climate change. Several measures have already been taken at group and divisional level in the past, and actions are ongoing. For more details, go to the Notes on Sustainability Performance.
97

Main risk management toolsEnterprise Risk Management is a framework covering busi-ness units and functional units, which ensures incorporation of risks faced by the company into risk maps. The risk assessment activity supports stable and efficient operation by identifying key risks that threaten the achievement of company objec-tives and require specific attention by top management through strengthened controls or execution of mitigation actions.
To ensure the profitability and the financial stability of the group, financial risk management is in place to handle short-term, market related risks. Commodity price, FX and interest rate risks are measured regularly by using a complex model based on Monte Carlo simulation, and are managed – if neces-sary - with hedging measures.
Transferring of the financial consequences of our operational risks is done by insurance management, which represents an important risk mitigation tool used to cover the most relevant exposures and liabilities arising out of our operations. Insur-ance is managed through a joint program for the whole group to exploit considerable synergy effects.
Following best industry practice and focusing on low proba-bility high potential risks that could disrupt our operations, value chain and cash generation, MOL Group has imple-mented and is currently working to integrate a crisis manage-ment and business continuity program in order to reduce recovery times within tolerable limits for processes critical to our business.
Besides providing information on the most imperative risks that MOL Group faces, risk management also supports the top management and the Board of Directors to take more educated decisions on capital allocation for major CAPEX projects.
7. PROHIBITION OF INSIDER TRADING
MOL Group is committed to the fair trade of securities admitted to public trading.
MOL Group employees are expected: not to acquire or dispose of MOL or other company’s shares
or other financial instruments for their own account or for the account of a third party, directly or indirectly, do not withdraw or modify orders related to the above financial instruments, do not give order or instruction for this, do not induce another person to do so and do not suggest or accept decisions connected to the above financial instruments, if they are in possession of insider information,
not to disclose insider information to persons not belonging to MOL Group except they are empowered in writing to do is,
to be careful when disclosing insider information even within the employees of MOL Group, to hand over infor-mation only in the possession of a permission and to the extent necessary to carry out work,
to protect insider information from accidental disclo-sures to the public.
CORPORATE GOVERNANCE

MOL GROUP GOVERNANCE FRAMEWORK
GENERAL MEETING OF SHAREHOLDERS
Ex
ec
uti
on
of
task
s
Pre
pa
ring
de
cisio
ns
Corporate Governance
and Remuneration
Committee
Sustainable Development
Committee
Board of Directors (7 non-executives , 3 executives)
Executive Board(8 executives)
Finance and Risk
Management Committee
MANAGEMENT& OPERATIONS
CONTROL
Elect Report
Supervise
Report
Elect Report
Decisions supported by internal committees and
forums
Reports/proposals
MOL Group organisations
CONTROL
Supervisory Board(12 members, including
4 employee representatives)
Ex
tern
al a
ud
itors
Audit Committee(6 independent SB members)
Internal Audit Compliance
INTERNALMONITORING & ASSURANCE
99

Member of the Board of Directors since 20 October 2000, and Vice Chairman since 2001
Chairman of the Corporate Governance and Remu-neration Committee
Specialising in finance at university, where he also took a doctorate, he later become a chartered accountant and his first job was at the Ministry of Finance. He also worked for the Ministry of Food & Agriculture and at the Hungarian Credit Bank. From 1989 to 1992, he was Deputy Chief Executive Officer of the Commer-cial & Credit Bank (K&H), and since 1992, he has been the Chairman & Chief Executive Officer of the OTP Bank Plc. On 15 April 2016, the annual shareholders meeting re-elected him for another five-year term as Chairman and Chief Executive Officer of OTP Bank Plc. He is a European Advisory Board member of Master-Card, one of the world's leading payment systems, and co-chairman of the National Association of Entrepre-neurs & Employers (VOSZ). He has been a honorary professor of the University of Western Hungary since 2004. He is a member of the Institut International d' Études Bancaires. Since July 2010, he is the Presi-dent of the Hungarian Football Federation. In January 2012, he was elected the Co-Chairman of the Chinese-Hungarian Business Council. Since March 2015, he has been a member of UEFA’s Executive Committee. Since April 2017 he has been a member of FIFA’s Council.
Chairman of the Board of Directors since 7 July 2000 Chairman & Chief Executive Officer since 11 June
2001 Member of the Board since 24 February 1999 Member of the Corporate Governance and
Remuneration Committee
Between 1989 and 1994 Mr. Hernádi occupied various posts at the Kereskedelmi és Hitelbank Plc. and between 1992 and 1994 he was its Deputy General Manager. Mr. Hernádi was Chief Executive Officer of the Central Bank of Hungarian Savings Cooperatives between 1994 and 2001 and member of its Board of Directors between 1994 and 2002. Between 1995 and 2001, Mr. Hernádi was a Board member of the Hungarian Banking Association. Since 2001, he is member of the European Round Table of Industrialists. Since 2007 he has become honorary citizen of Esztergom, and since September, 2009 he has become the honorary citizen of the Corvinus Univer-sity of Budapest. In 2010 he has been honored with the Hungarian Medal Cross Award. Since March, 2016 he has become honorary citizen of Százhalombatta. In 2017 he has been appointed as a member of the National Competitiveness Council.
MOL Group positions: MOL Group positions:
Dr. Sándor CsányiMr. Zsolt Hernádi
BOARD OF DIRECTORS

Group Chief Executive Officer since 1 May 2011 Member of the Board of Directors since 12 October,
2007 Member of the Sustainable Development Committee
since 5 September 2013 Member of the Supervisory Board of INA d.d. since
April, 2010 Member of the Supervisory Board of FGSZ Zrt. since
May, 2011
From 1978 to 2001, Mr. Molnár held various manage-ment positions at BorsodChem Plc., including Head of the Pricing Department from 1982 to 1987 and Head of the Controlling Department from 1987 to 1991. Between 1991 and 2001, as Chief Financial Officer and first deputy to the Chief Executive Officer, he contributed to the crisis management and reorganisation of the company, and later to creating the Company's vision and fulfilling its subsequent privatisation. He played a key role in the stock exchange listing of BorsodChem shares. He was Chief Executive Officer of TVK between 2001 and 2003, Group Planning & Controlling Director from 2003, and from 2004 until his appointment as Group Chief Exec-utive Officer in May 2011, he was Group Chief Financial Officer of MOL. Within MOL Group, he was a Board member of Slovnaft a. s. between 2004 and 2008, and Board member of TVK between 2001 and 2011.
Member of the Board of Director since 1 May 2011 Chairman of the Board of Directors and CEO of
SLOVNAFT Group Innovative Businesses and Services EVP since 1
December 2016 Member of the Supervisory Board of OT Industries
Vagyonkezelő Zrt. since 31 January 2017
Mr. Világi graduated from the Faculty of Law at the Come-nius University of Bratislava in 1985 and achieved the academic title of D.C.L. During 1990 to 1992, he was a member of the Czechoslovak Parliament in Prague. In 1994, he was one of the founders of the Central European Foun-dation, of which he is the member of the Board of Directors by now. From 1996, he participated in the governing bodies of several Slovak companies. He has been the legal advisor for several foreign investors in big restructuring projects of Slovak industry (U.S. Steel, Orange Sovensko, a.s., OTP, MOL). Since 2002 he has been a member of the strategic part-nership and integration team of Slovnaft and MOL. Before becoming a member of the Board of Directors in Slovnaft a.s. in 2005, he was member of its Supervisory Board. In March 2006, Mr. Világi was appointed as CEO of Slovnaft. In April 2010, he became Member of the Executive Board of MOL. He is the President of the Slovak-Hungarian Chamber of Busi-ness and Industry founded in 2012 and also a member of the Slovak Chamber of Business and Industry. He became a member of the Board of Trustees at the Selye János Univer-sity Komarno in November 2010 and from 2015 he is member of the Board of Trustees at the Comenius University in Brati-slava and Honorary Consul of the Sultanate of Oman in Bratislava.
Mr. József Molnár JUDr. Oszkár Világi
MOL Group positions: MOL Group positions:
101

Member of the Board of Directors from 29 April, 2010 Chairman of the Sustainable Development Committee Member of the Finance and Risk Management
Committee since 20 February 2014
Since 1989, Dr. László Parragh has been the Chairman of Parragh Trade and Holding Ltd. and, since 1993, he has also been a member of the Presidium of the Confederation of Hungarian Employers and Industrialists (MGYOSZ), and was Vice President between 1994 and 2000. He was Member of the Advisory Committee for Economic Affairs of the Prime Minister between 1998 and 2002 and since 2000, Dr. Parragh has also been President of the Hungarian Chamber of Commerce and Industry. Between 2003 and 2010, he was Vice President of GYSEV Plc. and since 2009-2014, he has been Chairman of KAVOSZ Venture Devel-opment Plc. since 2009. Between 2003 and 2011, he was Chairman of the Economic and Social Council and since 2011 he has been Chairman of the National Economic and Social Council. Between 2002-2010 he was a member of the Board of Directors at MEHIB Ltd., at EXIM Bank Plc. and at GYESEV Plc. Between 2010 to 2011 he was a member of the Board of Directors of MALÉV. Since 2003 he has been Chairman of the Supervisory Board of KA-VOSZ Financial Services Trading Close Co. Since 2014 he has been member of the Supervisory Board of MEHIB Ltd. and the EXIM Bank Plc. He has also been member of the State Reform Committee since 2014 and Chairman of the Supervisory Board of MKB since 2015. He is Honorary Professor of the University of West Hungary and the Budapest Business School, where he is also a member of the Economic Council. He is President of the National Economic and Social Coun-cil’s Economic side and Member of the World Chambers Federation General Council.
Member of the Board of Directors from 29 April, 2010
Member of the Finance and Risk Management Committee
Mr. Járai has been working as a financial expert for many years. He has held various managerial positions in a Commercial Banks both in Hungary and abroad. He was serving as Chairman of Budapest Stock Exchange from 1996 to 1998. Between 1998 and 2000, he held the position of the Minister of Finance, and subsequently became the Chairman of the National Bank of Hungary from 2001 until 2007. As the founder of CIG Pannonia Life Insurance Ltd. in 2007, he was the Chairman of the Supervisory Board between 2007 and 2010. He was the Chairman of the Supervisory Board of the National Bank of Hungary between 2010 and 2014.
MOL Group positions: MOL Group positions:
Dr. László Parragh Mr. Zsigmond Járai
BOARD OF DIRECTORS

Member of the Corporate Governance and Remuner-ation Committee
Member of the Board of Directors from 29 April, 2010
Martin Roman started his professional career as a sales director of the Czech branch of Wolf Bergstrasse. In 1994, he became CEO of Janka Radotín, where he was appointed Chairman of the Board after the entry of a strategic partner, the US Company LENNOX. Between 2000 and 2004, he restructured a traditional Czech mechanical engineering company, becoming Chairman and Chief Executive Officer of the new ŠKODA HOLDING. From February 2004 until mid-September 2011, Mr. Roman was the Chairman of the Board and CEO of ČEZ. From mid-September 2011 until October 2013, Mr. Roman was Chairman of the Super-visory Board of ČEZ. Besides his board membership of MOL, he served as a member of the Supervisory Board of the Prague Stock Exchange between 2005 and 2015, as a member of the Supervisory Board of Czech Railways between 2007 and 2009 and as Vice President of the Confederation of Industry and Transport of the Czech Republic from 2007 to 2011. From 2010 until May 2014, he was a member of the Supervisory Board of the Vienna Insurance Group. In addition, Mr. Roman is a member of governing or supervisory bodies in several foundations and academic institutions. He is a Czech citizen.
Member of the Board of Directors since 30 April 2014 Member of the Finance and Risk Management
Committee since 30 May 2014 Member of the Corporate Governance and Remuner-
ation Committee since 30 May 2014
Dr. Anthony Radev was a Director of McKinsey & Company for over 22 years. Joining the Firm in 1991 in Germany, he was one of the founding partners of the Eastern European branch in 1993. He personally opened up the McKinsey offices in Budapest (1995), Zagreb (2003), Sofia (2005) and Bucharest (2008). He also led the Eastern European offices of McKinsey Financial Institutions Practice. With McKinsey, Anthony has completed a vast number of engagements in almost all sectors of the economy and the public sector – from financial institutions through service - to manufacturing industries. He is member of the Board of Hungarian Football Federation. He is a citizen of Hungary, Germany and Bulgaria.
Dr. Martin Roman Dr. Anthony Radev
MOL Group positions: MOL Group positions:
103

Member of the Board of Directors since 1 July 2014 Member of the Corporate Governance and Remuner-
ation Committee and the Sustainable Development Committee
Prof. János Martonyi was Professor and Head of the Insti-tute for Private International Law and International Trade Law at the University of Szeged from 1999 to 2009. He was teaching at the College of Europe in Brugge and Natolin as well as at the Central European University (Budapest) between 1994 and 1998. He was managing partner at the law firm Martonyi & Kajtár Baker & McKenzie, Buda-pest from 1994 to 1998 and from 2002 to 2009. From 1989 to 1990, he was government commissioner in charge of privatization; he served as State Secretary in the Ministry of International Economic Relations between 1990 and 1991; as State Secretary at the Ministry of Foreign Affairs from 1991 to 1994. He was Minister for Foreign Affairs of Hungary between 1998-2002 and 2010-2014. He is a politician, attorney, international arbitrator, member of the Panel of Arbitrators of ICSID (International Centre for Settlement of Investment Disputes). He has been the Chair of the United Nations Commission on International Trade Law (UNCITRAL) since 2017. Author of numerous studies, articles and essays in the field of international trade law, competition policy and law, European integra-tion and law, cooperation in Central-Europe, global regu-lations and international relations.
Member of the Board of Directors since 30 April 2014 Member of the Finance and Risk Management
Committee since 30 May 2014 Member of the Sustainable Development Committee
since 30 May 2014
Dr. Anwar al Kharusi is a citizen of the Sultanate of Oman, and holds a Ph.D. in Petroleum Engineering from the University of London, UK (Imperial College) and a B.Sc in Physics from the University of Bristol (UK). He has over 25 years of oil and gas industry experience ranging from petroleum engineering field management, and oil and gas investments. He has been working at Petroleum Development Oman (1993-2000), Shell Inter-national Exploration and Production in the Netherlands (Team Leader, 2000-2005), Knowledge Reservoir UK Limited (Regional Manager for Middle East, 2007-2009), Oman Oil Company Exploration & Production LLC (Director of Exploration & Development, 2009-2013), Oman Oil Company SAOC (Head International Mergers & Acquisitions – Upstream, 2013-to date), and Ministry of Oil and Gas (Advisor for Petroleum Investments to HE Minister, 2015-2017). Dr. Anwar al Kharusi is pres-ently advising for special projects.
MOL Group positions: MOL Group positions:
Prof. János MartonyiDr. Anwar Al Kharusi
BOARD OF DIRECTORS

105

Group Chief Executive Officer since 1 May 2011 Member of the Board of Directors since 12 October,
2007 Member of the Sustainable Development Committee
since 5 September 2013 Member of the Supervisory Board of INA d.d. since
April, 2010 Member of the Supervisory Board of FGSZ Zrt. since
May, 2011
From 1978 to 2001, Mr. Molnár held various manage-ment positions at BorsodChem Plc., including Head of the Pricing Department from 1982 to 1987 and Head of the Controlling Department from 1987 to 1991. Between 1991 and 2001, as Chief Financial Officer and first deputy to the Chief Executive Officer, he contributed to the crisis management and reorganisation of the company, and later to creating the Company's vision and fulfilling its subsequent privatisation. He played a key role in the stock exchange listing of BorsodChem shares. He was Chief Executive Officer of TVK between 2001 and 2003, Group Planning & Controlling Director from 2003, and from 2004 until his appointment as Group Chief Exec-utive Officer in May 2011, he was Group Chief Financial Officer of MOL. Within MOL Group, he was a Board member of Slovnaft a. s. between 2004 and 2008, and Board member of TVK between 2001 and 2011.
Chairman of the Board of Directors since 7 July 2000 Chairman & Chief Executive Officer since 11 June
2001 Member of the Board since 24 February 1999 Member of the Corporate Governance and Remuner-
ation Committee
Between 1989 and 1994 Mr. Hernádi occupied various posts at the Kereskedelmi és Hitelbank Plc. and between 1992 and 1994 he was its Deputy General Manager. Mr. Hernádi was Chief Executive Officer of the Central Bank of Hungarian Savings Cooperatives between 1994 and 2001 and member of its Board of Directors between 1994 and 2002. Between 1995 and 2001, Mr. Hernádi was a Board member of the Hungarian Banking Association. Since 2001, he is member of the European Round Table of Industrialists. Since 2007 he has become honorary citizen of Esztergom, and since September, 2009 he has become the honorary citizen of the Corvinus Univer-sity of Budapest. In 2010 he has been honored with the Hungarian Medal Cross Award. Since March, 2016 he has become honorary citizen of Százhalombatta. In 2017 he has been appointed as a member of the National Competitiveness Council.
MOL Group positions: MOL Group positions:
Mr. József Molnár Mr. Zsolt Hernádi
EXECUTIVE BOARD

Member of the Board of Director since 1 May 2011 Chairman of the Board of Directors and CEO of SLOVNAFT Group Innovative Businesses and Services EVP since 1
December 2016 Member of the Supervisory Board of OT Industries
Vagyonkezelő Zrt. since 31 January 2017
Mr. Világi graduated from the Faculty of Law at the Comenius University of Bratislava in 1985 and achieved the academic title of D.C.L. During 1990 to 1992, he was a member of the Czecho-slovak Parliament in Prague. In 1994, he was one of the founders of the Central European Foundation, of which he is the member of the Board of Directors by now. From 1996, he participated in the governing bodies of several Slovak companies. He has been the legal advisor for several foreign investors in big restruc-turing projects of Slovak industry (U.S. Steel, Orange Sovensko, a.s., OTP, MOL). Since 2002 he has been a member of the stra-tegic partnership and integration team of Slovnaft and MOL. Before becoming a member of the Board of Directors in Slovnaft a.s. in 2005, he was member of its Supervisory Board. In March 2006, Mr. Világi was appointed as CEO of Slovnaft. In April 2010, he became Member of the Executive Board of MOL. He is the President of the Slovak-Hungarian Chamber of Business and Industry founded in 2012 and also a member of the Slovak Chamber of Business and Industry. He became a member of the Board of Trustees at the Selye János University Komarno in November 2010 and from 2015 he is member of the Board of Trustees at the Comenius University in Bratislava and Honorary Consul of the Sultanate of Oman in Bratislava.
Group Chief Financial Officer since 1 May 2011 Member of the Supervisory Board and Audit
Committee of INA d.d.
From 1991 to 1992 he was employed as an SAP expert at General Electric – Tungsram. He subsequently joined Arthur Andersen as an auditor and consultant. In 1996, he continued his career at Boston Consulting Group, where he held various managerial positions in Hungary, Germany and Australia. Mr. Simola joined MOL Plc. in 2003 and has been a member of the Executive Board since April 2006. He was also appointed as Corporate Centre Executive Vice President of MOL Plc. between 2006 and 2011.
JUDr. Oszkár Világi Mr. József Simola
MOL Group positions: MOL Group positions:
107

Upstream Executive Vice President
Dr. Gašo joined MOL Group in January 2010 when he became Executive Director for Corporate Services at INA. From September 2012 he served as Senior Vice President of Controlling, Accounting and Tax at MOL Group Finance. In April 2015, Dr. Gašo has been promoted to the role of E&P Chief Operating Officer of MOL Group Upstream. Since December 2016 he is the Executive Vice President of E&P and a member of MOL Group’s Executive Board. Before joining MOL Group he spent five years in the Petroleum Practice of McKinsey&Company where he left as a Junior Partner. Dr. Gašo holds degrees in mechanical engineering and business administration.
Executive Vice President of MOL Refining & Marketing Division since November 2003. From 1 May, 2011 Executive Vice President of MOL Down-stream
Chairman of the Board of Directors of IES Mantua since November, 2007
Member of the Board of Directors of SLOVNAFT since 2003
Member of the Supervisory Board of INA d.d. since 2012
From 1984 until 1991, he worked for Mineralimpex, the Hungarian Foreign Trade Company for Oil & Mining Products, in the fields of crude oil and natural gas imports, and crude oil product exports. Between 1991 and 1997, he was Managing Director of Allcom Trading Co., the Hungarian Mineralimpex-Phibro Energy joint-venture, dealing with the European trading of crude oil and crude oil products. He joined MOL Plc. in 1998 as Director of LPG Business Unit, and worked from January 2001 onwards as Sales Director, being respon-sible for the sales of MOL’s entire product range (petrol, diesel, petroleum products, bitumen, LPG, lubricants, and so on). Between 2002 and 2003, he was Commer-cial Director and his activities have broadened with the purchase of crude oil and raw materials necessary for the refining of crude oil. He was member of the Board of Direc-tors of TVK Plc. between 1 May, 2011 and 15 April, 2015.
MOL Group positions: MOL Group positions:
Dr. Berislav Gašo Mr. Ferenc Horváth
EXECUTIVE BOARD

MOL Group Consumer Services EVP
Péter Ratatics currently holds a position of Execu-tive Vice President of Consumer Services of MOL Hungarian Oil and Gas Plc. He graduated from Corvinus University of Budapest, Faculty of Finance specialization in capital markets. Mr. Ratatics started his career as Gas Trading and Business Development expert in MOL Plc, then he was appointed Head of Exec-utive Board Advisory team in 2009. Between 2009 and 2010 he also acted as Head of Organizational Devel-opment and Process Management and in 2010-2011 as Head of Management Services. From May 2011 he has been working as VP of Corporate Centre and he has been responsible for the HR domain. He had been appointed member of the INA Management Board in June 2011, Vice-Chairman of the Supervisory Board of FGSZ (Natural Gas Transmission) in 2012 and CEO of MOL Fleet Holding Kft in May 2017. From 2015 until 30 November 2016 he was responsible for the MOL Group procurement, investment and communication activities as SVP of Corporate Centre (Group Corporate Human Resources, Group Corporate Services and Group Corpo-rate Communication).
Mr. Péter Ratatics
MOL Group positions:
COO Mol Hungary since 1 October, 2012 Member of the Supervisory Board of FGSZ Zrt. since
1 January, 2017 Member of the Supervisory Board of OT Industries
Vagyonkezelő Zrt. since 15 June, 2017
From 1991 Mr. Fasimon held various management posi-tions at the Mineralimpex Hungarian Foreign Trade Company for Oil & Mining Products. Between 1996 and 1997 Counsellor, he served as Head of the Tripoli (Libya) Hungarian Commercial Section. From 1998 to 2003 Mr. Fasimon worked for MOL as Supply Director in the field of crude oil and crude oil products and from 2002 he acted as Managing Director of Moltrade-Mineralimpex Co. Ltd. Between 2003 and 2006, he was the Managing Director of Natural Gas Division of MOL Plc. From 2006 until 2009, he acted as General Director of MOL-Russ LLc. Between 2009 and 2011, he worked as Senior Vice President of Supply & Trading Division and, from 1 June 2011, as Executive Vice President of Exploration and Production. Since June 2011 he has been a member of the Executive Board.Since 1 June, 2011 he is Member of the Board of Directors of the Hungarian Hydrocarbon Stockpiling Association. Since 9 December, 2014 he is President of the Hungarian Petroleum Association.
Mr. Sándor Fasimon
MOL Group positions:
109

President of the Management Board of INA d.d. since 1 April 2010
Between 1990 and 1991, he was an associate at Cred-itum Financial Consulting Ltd. Afterwards, between 1992 and 1995, he held various positions at Eurocorp Financial Consulting Ltd. From 1995 to 1997, he was the Manager of MOL’s Privatisation Department and from 1997 until 1999, he was Director of Capital Markets. In 1999, Mr. Áldott served as Director of Strategy & Busi-ness Development. From November 2000, he acted as Chief Strategy Officer and then, since June 2001, as Group Chief Strategy Officer. Since 2001 he has been a member of the MOL EB. He was the Executive Vice President of MOL Exploration & Production Division between September 2004 and June 2011.
Mr. Zoltán Áldott
MOL Group positions:
EXECUTIVE BOARD

Mr. György Mosonyi MOL Group positions:• Member of MOL Supervisory Board since
1 May, 2011 and Chairman since 8 June, 2011
• Permanent invitee of the Sustainable Development Committee
• Chairman of the Supervisory Board of MOL Petrochemicals Co. Ltd since 1 September, 2015.
• Chairman of the Supervisory Board of SLOVNAFT a. s.
From 1974 onwards, Mr. Mosonyi worked for the Hungarian Agency of Shell Interna-tional Petroleum Co. (Shell) and from 1986 he held the position of commercial director. In 1991 he worked at Shell headquarters in London. Between 1992-1993 he was a managing director of Shell-Interag Ltd. and from 1994-1999 he was Chairman and Chief Executive Officer of Shell Hungary Rt. Also in 1997 he became Chairman of Shell's Central & East European Region and CEO of Shell Czech Republic in 1998. He was Vice President in charge of Interna-tional Affairs of the Hungarian Chamber of Commerce and Industry until 2016 October and member of the Joint Venture Asso-ciation's Presidium until 2016 February. He was President of the World Petroleum Council Hungarian National Committee till 2015 January. Since 2012 April member of the Board of Directors of Hungarian Telekom Plc. He was Group-Chief Exec-utive Officer and a member of the Board of Directors of the Group between 1999 and 2011. Between 2006 and 2011 he was Chairman of the Sustainable Development Committee he was Chairman of the Board of Directors of TVK until 15 April, 2015 and Vice President of the Supervisory Board of INA d.d. until 19 December 2016.
Dr. Attila Chikán MOL Group positions:
• Member of the Supervisory Board since 30 April, 2004
• Deputy Chairman of the Supervisory Board since 5 December, 2005.
• Chairman of the Audit Committee since 8 June, 2011
Since 1968 Professor Chikán has worked for Corvinus University of Budapest and its legal predecessors. Between 1989 and 1998, he was Head of the Business Economics Department. In 1998 and 1999, he held the office of Minister of Economic Affairs in the Hungarian government. Between 2000 and 2002 he was Chairman of the Council of Economic Advisors of the Prime Minister. Between 2000 and 2003, he was Rector of Budapest University of Economic Sciences. Since then, Dr. Chikán has been a Director of the Competitiveness Research Centre of the University. He is a full Member of the Hungarian Academy of Sciences and Foreign Member of the Royal Swedish Academy of Engineering. He is Honorary Doctor of Lappeenranta University of Technology (Finland) and Babes-Bolyai University (Romania) and member of the Board of Trustees of Central European University. He holds several positions in Hungarian and international professional organizations and membership in Edito-rial Boards of international journals. He is also Chairman of the Supervisory Board and Chairman of the Audit Committee of Richter Gedeon Plc.
Mr. John I. Charody MOL Group positions:
• Member of the Supervisory Board since 11 October, 2002
• Member of the Audit CommitteeMr. Charody worked in the Geophysical Institute of the Oil Exploration and Devel-opment Company between 1953 and 1956. Following this, he held leading positions in various companies operating in Australia including Bridge Oil Ltd., Aurora Minerals and Project Mining. He was also Chief Executive Officer of Winton Enterprises Pty. Ltd. and Galina Investment Interna-tional Consulting Company. He has been a fellow of the Institute of Australian Direc-
tors since 1971, the Australian Institute of Management since 1967, and a Justice of the Peace since 1972. In 1973, he was awarded the M.B.E. by H.M. the Queen for his services to Australia. In 1990, he was appointed Minister of Commerce in Budapest by the Federal Government of Australia with regional responsibilities in 12 countries. In 1997, the President of the Republic of Hungary awarded him the Officer Cross of the Republic of Hungary for his services in fostering Australian-Hungarian financial and commercial rela-tionships. He has been Chief Advisor to the Chairman at OTP Bank Plc since 2001. Currently he is a Board Member of Pick Zrt. and Csányi Foundation.
Dr. Norbert SzivekMOL Group positions:
• Member of the Supervisory Board since 29 April, 2015
• Member of the Audit CommitteeDr. Norbert Szivek is a law school graduate who pursued his studies in Germany and then graduated in Hungary. After working in the Hungarian public sector for a while, he continued his career at a company which is well-known for its real estate invest-ments, where he was in charge of the newly established energy division. The next step in his career was the foundation of his own asset management company. Appointed by the Minister of National Development, Dr. Szivek is the general manager and member of the Board of the Hungarian National Asset Management Inc. from 16 February, 2015. He is Member of the Board of Panrusgáz Gas Trading Plc. of the MVM Hungarian Electricity Ltd. of Raba Auto-motive Holding Plc, of the Hungarian Hydrocarbon Stockpiling Association of the Magyar Posta Zrt and also of the Gedeon Richter Plc.
111
SUPERVISORY BOARD

Mr. Ivan MiklošMOL Group positions:
• Member of the Supervisory Board since 1 May, 2016
• Member of the Audit Committee since 1 May, 2017
Ivan Mikloš is former Deputy Prime Minister and Minister of Finance of the Slovak Republic (2002-2006, 2010-2012), Deputy Prime Minister for Economy (1998-2002), and Minister of Privatiza-tion (1991-1992). He co-founded and led an economic think-tank MESA10 (1992-1998). During 2006-2010 and 2012-2016 he was a Member of Parliament. In 2014 he was appointed again as a President of MESA10 and became a member of the International Advisory Board of National Reform Council of Ukraine and plat-form VoxUkraine. Until April 2016 he served as a Chief Advisor to the Minister of Finance of Ukraine and as an Advisor to the Minister of Economic Development and Trade of Ukraine. Since April 2016 he serves as a Chief Economic Advisor to the Prime Minister of Ukraine. He is also Chairman of the Strategic Advisory Group for Support of Ukrainian Reforms and Co-founder of the Ukrainian economic think-thank Centre for Economic Strategy.Ivan Mikloš was one of the leading figures of economic transformation in Slovakia. Ivan Mikloš significantly contributed to the entry of the Slovak Republic into the OECD and started an extensive and effective tax reform. He led the government agenda on economic restructuring and fiscal consoli-dation. The second Dzurinda s government (2002-2006) gained a very reformist repu-tation thanks to severe austerity measures and a comprehensive program of structural reforms (tax, social sector, pension, health-care, public finance, labour market) backed by Ivan Mikloš. Thanks to these reforms Slovakia was able to join Eurozone in 2009. In 2004 he was awarded by Euromoney the best Minister of Finance of the Year and the top business reformer by the World Bank s Doing Business report. Ivan Mikloš is the author of the Book of reforms (2005), Rewriting the Rule (2001) and also of dozens of studies and articles in the expert and popular press.
Mr. Vladimír KestlerMOL Group positions:
• Member of the Supervisory Board since 1 June, 2017
• Member of the Board of Directors of Slovnaft a.s. between 24 April 2010 and 31 May 2017.
Mr. Kestler graduated from the Univer-sity of Economics (Bratislava) in 1986. From 1987, he worked for OMNIA export trading group. From 1997, he was a member of the international “Young Presidents Organization" (YPO). From 2000, he was Managing Director and Chairman of the Board of Directors of OMNIA a.s. In 2007 he became Chairman of the Board of Directors of Omnia Holding SE and a member of Faculty of Management’s Scien-tific Board at University of Economics (Bratislava). In 2010, he was appointed as Honorary Consul-General of Sweden and since April 2010 has been Vice Pres-ident of the Slovakian Industry Associa-tion. In 2011 he was awarded a PhD degree by the Company Management Department of University of Economics (Bratislava). From 2012 he was a member of the Govern-ment Council for exports and investment and Trade Development. In 2013 he became Governing Board member of the University of Economics in Bratislava and Governing Board member of SARIO - Slovak Agency for Investment. In 2014 he was appointed as Chairman of the Supervisory Board of EOSA, Agency for oil reserves and petro-leum products of the SR. He is Vice Pres-ident of the Republic Union of Employers and he is a Member of the Supervi-sory Board of SOPK - Slovak Chamber of Commerce and Industry. From 2017 he was appointed as a Member of the Central Euro-pean Energy Investment Task Force within European Investment Bank and is advisor to Vice-president of the European Invest-ment Bank.
Ms. Andrea Bártfai-MagerMOL Group positions:
• Member of the Supervisory Board since 1 June, 2017
• Member of the Audit Committee since 01 June, 2017
She pursued her studies at the Budapest University of Economics (currently known as Corvinus University of Budapest) and at the Moscow State Institute of International Relations. She started her professional career in Postabank RI. where she worked as a lead risk analyst and as the Chief Exec-utive Officer's professional secretary. From 2001 she continued her career in the Central Bank of Hungary, where she worked as head of department until 2005, then, between 2005 and 2007 she took on the position of deputy-director in the Financial Stability Department. As a representative of the Central Bank of Hungary, she took part in the work of the European Central Bank’s Committee of Banking Supervision and she was also a part of the European Union’s and the European Central Bank’s joint financial crisis management working group. Between 2007 and 2010 she was a member of the Hungarian Competition Authority’s competition council partici-pating in proceedings affecting the finan-cial intermediary system and its members. From 2010 she was the Hungarian Offi-cial Journal Publisher’s executive director, who was tasked with the stabilization of the company’s financial status and the reinstitution of proper financial manage-ment. From the 20 March, 2011, she was a member of the Monetary Council of the Central Bank of Hungary, until her inau-guration as the Government Commissioner for Postal Affairs and National Financial Services. She is the Member of the Board of Pénzjegynyomda Zrt., Magyar Pénzverő Zrt., and Member of the Supervisory Board of GIRO Zrt.
SUPERVISORY BOARD

Ms. Ilona DávidMOL Group positions:
• Member of the Supervisory Board since 1 June, 2017
Earned her diploma in economic sciences at the Budapest College of Finance and Accounting, and then a postgraduate econ-omist degree at the Department of Manage-ment and Organisation of the Western Transdanubian University. She started her professional career at SPAR Retail Chain’s Hungarian company and was later appointed as the Director of Finance and Accounting of Dunaferr Danube Iron-works (steel producing factory). Then she worked as the Financial Director of Lukoil Hungary. From 2005 she was the Head of Accounting of the Hungarian State Rail-ways Co. (MÁV). From 2010 she was working as the Chairman-CEO of Győr-Sopron-Ebenfurt Railways Co. (GYSEV). Since May 2012 she has been the Chairman-CEO of MÁV Co., but she retained her posi-tion at GYSEV as chairman. As recognition of her eminent performance in strength-ening international railway cooperation in 2013 she was awarded with the Golden Chariot Award, which is one of the highest professional awards of the Russian Parlia-ment and the Russian Ministry of Trans-port. In August 2014 she was awarded with the Knight of Cross from the Order of Merit of the Hungarian Republic recog-nising her outstanding and exemplary contribution to the reformation of Hunga-ry’s railway traffic and ensuring its unin-terrupted operations. In 2015 she received the Golden Signum Laudis. Since January 2016 she has been the President of Consis-tory of the University of Dunaújváros, and since July 2016 the President of the HUNGRAIL Hungarian Railway Asso-ciation. She holds the following positions and memberships in various international organisations: member of the Executive Committee of the Community of European Railway Companies and Infrastructure Operators (CER), member of the European Management Board of the International Union of Railways (UIC), and Vice Presi-dent of the Coordination Council of Trans-Siberian Transportation (CCTT) between 2013 and 2015.
Ms. Piroska BognárMOL Group positions:
• Member of the Supervisory Board since 1 June, 2017, delegated by the employees
Ms. Piroska Bognár started to work for MOL Plc.’s predecessor, Duna Refinery. She is appointed officer of the trade union since 1995. She earned a degree from Human Management from the University of Pécs besides work. She was elected as the exec-utive chairman of MOL Trade Union of Chemists, where her main responsibilities were to manage the organizing and finan-cial matters. From 2002 to 2007 she was member of the Supervisory Board of MOL Plc. She was elected as the chairman of MOL Trade Union of Chemists in 2007 and holds this office since.
Mr. András TóthMOL Group positions:
• Member of the Supervisory Board since 1 June, 2017, delegated by the employees
Mr. Toth has been employed by MOL as a Chemist-technician since 1984. During his employment he held various positions at the Danube Refinery, Engine Fuel Produc-tion MOL in Százhalombatta, Hungary. Currently he is an Operator Training Simu-lator trainer. He is member of the MOL Group European Work Council and he is the Vice President of the MOL Hungary Work Council. He is shop steward of the MOL Oil Industry Trade Union.
Dr. Sándor PuskásMOL Group position:
• Member of the Supervisory Board since 28 April, 2011, delegated by the employees
Dr. Puskás has been employed by MOL as a Petroleum Engineer, M.Sc., since 1985. Currently he is a Petroleum Engineer and holds a R&D Senior Engineer posi-tion at the E&P Research and Develop-ment MOL in Algyő, Hungary. He has 31 years of experience as a field production engineer, field production head, research and development engineer, and as an R&D project manager in crude oil produc-tion. Dr. Puskás holds a Dipl. Eng. degree in petroleum engineering from Moscow State Gubkin Oil and Gas University and
a Dr. Univ. degree in colloid chemistry from the József Attila University Szeged, Hungary. He holds a postgraduate degree in Research and Development Manage-ment and Human management from Buda-pest University of Economic Sciences and State Administration, Manage-ment Development Centre. Between 2005 and 2011, Dr. Puskás was a member and the chairman of the Audit Committee of Tempo Health Fund. He is the author and co-author of several domestic and interna-tional technical papers. He is member of the Hungarian Mining and Metallurgical Society and the Energy Management Scien-tific Association. He is member of the MOL Trade Union of Production Workers. He is a member of the Assembly of Delegates of TEMPO Health Fund.
Mr. István Tibor ÖrdögMOL Group positions:• Member of the Supervisory Board since 1
June, 2017, delegated by the employeesHe has been employed as a fresh grad-uate M.Sc. chartered chemist in the quality control laboratory of the Szeged Mining Unit since 1994, and he has got gas processing expert position in the Algyő Gas Processing Plant, while also have completed the chro-matographic engineer degree in the Tech-nical University of Budapest. Then became the manager of Upstream Laboratories for seven and half years to support the entire Upstream value chain. The subsequent four years he worked for various mid-level management positions in Upstream and also supported the work of MOL Group E&P EVP. He was the member of the Board of Directors of Rotary Zrt. and Drilltransz Zrt. Shareholders’ representative until 2011. He was appointed as the manager of New technologies and R&D of E&P from 2011 until 2013, and later he has continued his carrier as a senior expert in the Research and Development organisation of E&P. He was a member of the EU Workers Counsel for 3 years and a member of the Miners Trade Union since 1994. He is the member of the Scociety of Petroleum Engineers Hungarian Branch since 2001. He is author and co-author of several domestic and inter-national scientific papers and presentation.
113

The Supervisory Board and the Audit Committee performed their duties in 2017 in full accordance with their statutory obli-gations. The Supervisory Board and the Audit Committee held 5 meetings in 2017, the common agenda items were discussed on the joint meetings of the Supervisory Board and the Audit Committee. The Board of Directors regularly reported to the Supervisory Board on the management, the financial situation and the business policy of the Company. Regular agenda items of the Supervisory Board meetings included reports of Group Internal Audit and the Audit Committee itself, and reports on the activities of Group Compliance & Ethics and Group Secu-rity. The Supervisory Board was involved in the preparation and the review of different proposals and in the approval of the strategic priorities of the Group and its divisions. Finally, macroeconomic and industrial developments were monitored as well. The Supervisory Board reviewed proposals for the Annual General Meeting. The report of the Supervisory Board was prepared pursuant to the reports of the Board of Directors and the management, the opinions of the auditors, scheduled regular interim reviews and the work of the Audit Committee. The Supervisory Board continuously received information on the decisions of the Board of Directors and issues concerning the Company.
MOL, with a market capitalization of USD 9.5 billion at end of 2017, is one of the leading companies in the CEE region.
The Company’s 2017 financial statements - prepared in compli-ance with International Financial Reporting Standards as adopted by the European Union (“IFRS”) - provide a true and fair view of its economic operations and were audited by Ernst & Young Kft. The accounting methods applied in developing these financial reports are supported by the report of the Audit Committee, comply with the provisions of the Accounting Act and the IFRS rules and are consistent with the accounting policies of the Company. All figures in the balance sheet are supported by analytical book-keeping. Assessment and payment of tax obligations were executed as prescribed by law.
A total of 137 companies were fully consolidated, and a further 13 companies partially consolidated in MOL Group using the equity method. In 2017, there were significant changes in the ownership structure that led to a substantial increase in MOL’s
REPORT OF THE SUPERVISORY BOARD ON THE 2017 FINANCIAL STATEMENTS AND ON THE PROPOSAL FOR THE DISTRIBUTION OF PROFIT AFTER TAXATION, AND ITS OPINION ON THE BOARD OF DIRECTORS’ PROPOSALS TO BE SUBMITTED TO THE GENERAL MEETING
free-float, which now exceeds 45%. A large strategic share-holder, CEZ MH B.V., sold its full MOL stake, representing 7.5% of total shares outstanding, while Crescent Petroleum also fully exited its position. In April 2017 the Board of Directors approved an 8-for-1 split of MOL shares, which was success-fully executed in September. MOL exercised its option rights arising out of different share option agreements, translating into a net increase of treasury shares. As a result, 9.9% of the total outstanding shares were held as treasury shares at the end of 2017. According to requests for the registration of shares received and published shareholder notifications, the Company had 3 shareholders that held more than 5% of the voting rights on 31 December 2017. MOL’s largest shareholder is the Hungarian State, which holds 25.2% of MOL shares. MOL Group again delivered a strong financial performance in 2017 and reported HUF 673 billion EBITDA, exceeding the 2016 result by 8%. In line with that net operating cash flow increased by 8%, while organic CAPEX was at a similar level in 2017 compared to the previous year, amounting to HUF 280bn, hence free cash flow generation further improved in 2017. These results are the reflection of the strength and resilience of MOL’s high quality, low-cost integrated business model.
In Downstream, full year EBITDA reached HUF 327 billion, 6% below the 2016 result, and it was still supported by a strong macro environment. The 3-year Next Downstream Program that was concluded in 2017 brought in significant efficiency gains versus the 2014 base. Subsequently, a new 5-year program (“DS2022”) was announced, a program of strategic transformation, growth and further efficiency improvement, which defines the first Downstream milestones along the MOL 2030 long-term strategy.
The Upstream division’s financial results improved substan-tially, as EBITDA reached HUF 233 billion in 2017, representing a 27% increase from the 2016 level, mainly driven by higher hydrocarbon prices. The strong earnings coupled with some-what lower CAPEX meant that the segment became a material free cash flow contributor, providing more than one third of the Group’s simplified free cash flow in 2017. Although total hydro-carbon production declined slightly (by 5%) compared to the previous year, group-level average unit OPEX stayed at a very competitive level at USD 6.1/bbl.
REPORT OF THE SUPERVISORY BOARD

György MosonyiChairman of the Supervisory Board
Dr. Attila ChikánChairman of the Audit Committee
György MosonyiChairman of the Supervisory Board
Dr. Attila ChikánChairman of the Audit Committee
As part of the MOL 2030 strategy, the company also set the target of becoming the first choice of customers in the CEE region. In order to achieve this, a new business segment, Consumer Services, was set up in December 2016. Apart from continuing the operation of the successful fuel retailing busi-ness, this segment will be increasingly focusing on the non-fuel offerings and mobility services. The segment’s 2017 EBITDA reached HUF 97bn, which is 13% higher than the 2016 result, driven by an increase in regional fuel consumption and supported by the continued growth of the non-fuel margin.
Overall, 2017 was another year of delivering strong financial results and equally importantly it was also a year of visible progress along the transformation journey set out in the MOL 2030 strategy. MOL managed to maintain its strong finan-cial position, as indebtedness decreased further, net debt to EBITDA stood at 0.65x at year end 2017 versus 0.97x in 2016. Moreover, the company reached important milestones regarding its strategic transformation. The company’s flag-ship chemicals project targeting the polyol value chain entry progressed well as all major technological licenses were secured during 2017 and the European Commission also endorsed EUR 131.5 million state aid for the project.
The Supervisory Board proposes that the General Meeting approves the audited financial statements of MOL Plc. for 2017 with total assets of HUF 2,851,428 million and net profit of HUF
185,867 million and the audited consolidated financial state-ments of MOL Group for 2017 with total assets of HUF 4,231,700 million and net profit of HUF 316,410 million.
In line with the Dividend Proposal the Supervisory Board endorses the recommendation of the Board of Directors to pay out a total HUF 94,278,069,345 as dividend – a including a regular dividend of HUF 62,852,046,230 and a special of HUF 31,426,023,115 – in 2018 based on the year ended 31 December 2017.
The Supervisory Board has reviewed and supports all proposals and materials of the Board of Directors to be submitted to the General Meeting and recommends to the General Meeting to approve the proposals.
The Audit Committee provided assistance to the Supervisory Board in supervising the financial report regime and the 2017 financial statements and supported the report of the Supervi-sory Board. The Audit Committee participated in the proce-dure of selecting the auditor and made a recommendation to the Supervisory Board regarding the appointment of the auditor.
Budapest, 19 March 2018
On behalf of the Supervisory Board and the Audit Committee of MOL Plc.:
115

CORPORATE AND SHAREHOLDER INFORMATION
Date of foundation of MOL Plc.: October 1, 1991. Registered by the Budapest Court of Justice acting as Court of Registration on 10 June 1992 with effect as of 1 October 1991, under file number 01-10-041683.
Legal predecessor: Országos Kőolaj- és Gázipari Tröszt (OKGT National Oil and Gas Trust) and its subsidiaries.
The effective Articles of Association were accepted at the Annual General Meeting (AGM) held on 13 April 2017. Access to the Arti-cles of Association can be requested from the Company, or the latest electronic version can be downloaded from Company's web site.
Share split: The Annual General Meeting of MOL Plc. held on 13 April 2017 decided to transform the Company’s 102,428,103 pieces registered series “A” ordinary shares with a par value of HUF 1,000 each to 819,424,824 pieces of registered series “A” ordinary shares with a par value of HUF 125 each by dividing the par value of the shares into one-eighth with effect from 1 September 2017.
Registered share capital as of 31 December 2017: 819,424,824 registered series “A” ordinary shares with a par value of HUF 125 each, 1 registered series “B” preferred share with a par value of HUF 1,000 with special preferential rights attached and 578 registered series “C” ordinary shares with a par value of HUF 1,001 each.
OWNERSHIP STRUCTURE
31.12.2017 31.12.2016
Par value of shares (HUF th)
%Par value of shares
(HUF th)%
Foreign investors 35,871,668 35.02 27,562,313 26.91
Hungarian State 25,857,957 25.24 25,857,957 25.24
CEZ MH B.V. 0 0.00 7,677,285 7.50
OmanOil (Budapest) Limited 7,316,294 7.14 7,316,294 7.14
OTP Bank Plc. 5,010,829 4.89 5,011,887 4.89
OTP Fund Management 1,235,449 1.21 1,103,963 1.08
ING Bank N.V. 4,217,542 4.12 4,863,101 4.75
Crescent Petroleum 0 0.00 1,500,000 1.46
UniCredit Bank AG 3,042,407 2.97 5,380,496 5.25
MUFG 611,773 0.60 0.00 0.00
Domestic institutional investors 5,631,884 5.50 5,422,629 5.29
Domestic private investors 3,470,148 3.39 2,818,599 2.75
MOL Plc & MOL Inv. Kft. (treasury shares) 10,162,729 9.92 7,914,159 7.73
Total 102,428,683 100.00 104,519,064 100.00
Please note, that data above do not fully reflect the ownership structure in the Share Registrar. It is based on the received request for registration of the shares and the published shareholder notifications. The registration is not mandatory. The shareholder may exercise its rights towards the company, if the shareholder is registered in the Share Registrar. According to the Articles of Associa-tion, no shareholder or shareholder group may exercise more than 10% of the voting rights.
CORPORATE AND SHAREHOLDER INFORMATION
SHARE INFORMATION
MOL share prices are published by the majority of Hungarian daily newspapers and are available on the BSE web site (www.bse.hu). Indicative bid and ask prices of MOL’s DRs on IOB can be monitored using the RIC code MOLBq.L on Thomson Reuters or MOLD LI on Bloomberg. MOL shares and DRs are traded on one of the US OTC market, Pink Sheet.
MOL share prices on the Budapest Stock Exchange can be followed on Thomson Reuters using the RIC code MOLB.BU or on Bloomberg using code MOL HB.
The following table shows trading data on MOL shares each quarter of 2017.
Period BSE volume (no. of shares) BSE closing price (HUF/share)
1st quarter 62,991,816 2,475
2nd quarter 76,746,472 2,653
3rd quarter 38,984,849 3,000
4th quarter 40,740,789 3,005
TREASURY SHARES
During 2017 the following treasury share transactions happened:
Reasons for change
Number of old "A" series shares with a par value
of HUF 1,000
Number of new "A" series shares with a par value
of HUF 125
Total Nominal
value HUF th
Number of Treasury shares on 31 December 2016 7,914,159 7,914,159
MOL partially exercised its option rights and purchased treasury shares from Unicredit Bank AG
1,721,416 1,721,416
Share distribution for the members of the Board of Directors (18,600) (18,600)
MOL transferred Treasury shares to MOL Plc ESOP Organization* (105,282) (105,282)
The transformation of “A” series ordinary shares with a par value of HUF 1,000 to “A” series ordinary shares with a par value of HUF 125 by dividing it into 1/8
9,511,693 76,093,544 9,511,693
Share purchase and share option agreement between MOL and MUFG Securities EMEA Plc.
(4,894,187) (611,773)
MOL partially exercised its option rights and purchased treasury shares from Unicredit Bank AG
4,933,378 616,672
MOL partially exercised its option rights and purchased treasury shares from ING Bank N.V.
5,164,470 645,559
Number of Treasury shares on 31 December 2017 81,297,205 10,162,151
* In the financial statements, based on the IFRS 2 Share-based payments standard, the related two new share-based share-settled remuneration programs are presented as an increase in share capital.
In 2017 the number of “C” series shares owned by MOL remained unchanged at 578 pieces
INFORMATION ON THE SERIES “B” SHARE
Series “B” share is a voting preference share with a par value of HUF 1,000 that entitles the holder thereof to preferential rights as specified in the Articles of Association. The series "B" share is owned by MNV Zrt., exercising ownership rights on behalf of the Hungarian State. The series “B” share entitles its holder to one vote in accordance with its nominal value. The supporting vote of the holder of series “B” share is required to adopt decisions in the following matters pursuant to Article 12.4. of the Articles of Associ-ation: decision on amending the articles regarding the series “B” share, the definition of voting rights and shareholder group, list of issues requiring supermajority at the general meeting as well as Article 12.4. itself; further, the “yes” vote of the holder of series “B” share is required to adopt decisions on any proposal not supported by the Board of Directors in the following matters: election and dismissal of the members of the Board of Directors, the Supervisory Board and the auditors, decision of distribution of profit after taxation and amending of certain provisions of the Articles of Association.
117

THE APPOINTMENT AND REMOVAL OF SENIOR OFFICERS; AMENDMENT OF THE ARTICLES OF ASSOCIATION
The general meeting elects members of the Board of Directors for a pre-defined term, the maximum of which is five (5) years. The General Meeting decides on Board Members by simple majority vote, but it shall decide the dismissal of any member of the Board of Directors by three-quarter majority of votes. The “yes” vote of the holder of “B” series of share is required for the election and dismissal of any member of the Board of Directors at the general meeting if not supported by the Board of Directors.
The appointment of a member of the Board of Directors, as provided for by the Articles of Association, can be terminated at any time or may be renewed after the expiry of the five-year term. In the event any shareholder initiates the termination of appointment of one or more members of the Board of Directors, the general meeting may only decide on dismissal of maximum one member of the Board of Directors validly, with the restrictions that during the three months period following the decision on dismissal of the one member of the Board of Directors, no further dismissal of a member of the Board of Directors may take place.
The General Meeting decides on the modification of Articles of Association by two-third majority of votes. The “yes” vote of the holder of “B” series of share is required for the amendment of certain provisions of the articles of association.
RIGHTS OF SENIOR OFFICERS RELATED TO SHARE ISSUANCE AND BUYBACK
Based on the authorization granted in the Articles of Association, the Board of Directors is entitled to increase the share capital until 23 April 2019 in one or more instalments, by not more than HUF 30,000,000,000 (i.e. Thirty billion forints), in any form and method provided by the Civil Code and resolve the amendment of the Articles of Association in connection thereof. The Annual General Meeting held on 13 April 2017 granted authorization valid for 18 months to the Board of Directors of the Company to acquire treasury shares.
CHANGES IN ORGANISATION AND SENIOR MANAGEMENT
The Annual General Meeting on 13 April 2017 made the following resolutions: Elected Mr. József Molnár to be a member of the Board of Directors from 1 June 2017 to 31 May 2022. Elected Dr. Attila Chikán, Mr. John I. Charody, Mr. Vladimír Kestler, Ms. Ilona Dávid and Ms. Andrea Bártfai-Mager as
members of the Supervisory Board from 1 June 2017 to 31 May 2022. Elected Dr. Attila Chikán, Mr. John I. Charody, Ms. Ilona Dávid, Ms. Andrea Bártfai-Mager as independent members of the
Supervisory Board to be members of the Audit Committee from 1 June 2017 to 31 May 2022. Elected Mr. Ivan Mikloš as independent member of the Supervisory Board to be member of the Audit Committee from 1 May
2017 to 30 April 2021. Elected Ms. Piroska Bognár, Mr. András Tóth, Dr. Sándor Puskás and Mr. Tibor István Ördög as employee representatives in
the Supervisory Board of the Company from 1 June 2017 to 31 May 2022.
CORPORATE AND SHAREHOLDER INFORMATION

MOL SECURITIES HELD BY DIRECTORS AND OFFICERS OF THE COMPANY AS OF 31 DECEMBER 2017
Name Current position Number
of MOL shares
Zsolt Hernádi Chairman of the Board of Directors, Chairman-CEO (C-CEO) 1,571,928
Dr. Sándor Csányi* member of the Board of Directors, Vice-Chairman 114,400
József Molnár member of the Board of Directors, Group Chief Executive Officer (GCEO) 137,600
Zsigmond Járai member of the Board of Directors 40,320
Dr. Anwar al-Kharusi member of the Board of Directors 35,272
Dr. János Martonyi member of the Board of Directors 33,640
Dr. László Parragh member of the Board of Directors 58,160
Dr. Anthony Radev member of the Board of Directors 35,272
Dr. Martin Roman member of the Board of Directors 57,600
Dr. Oszkár Világimember of the Board of Directors, Executive Vice President of MOL Group Innovative Businesses and Services, Chairman of the Board of Directors and CEO of Slovnaft a.s.
147,280
György Mosonyi Chairman of the Supervisory Board 316,704
Dr. Attila Chikán Deputy-Chairman of the Supervisory Board 0
John I. Charody member of the Supervisory Board 0
Vladimír Kestler member of the Supervisory Board 0
Ilona Dávid member of the Supervisory Board 0
Andrea Bártfai-Mager member of the Supervisory Board 0
Ivan Mikloš member of the Supervisory Board 0
Dr. Norbert Szivek member of the Supervisory Board 0
Piroska Bognár member of the Supervisory Board, representative of the employees 0
András Tóth member of the Supervisory Board, representative of the employees 0
Dr. Sándor Puskás member of the Supervisory Board, representative of the employees 0
Tibor István Ördög member of the Supervisory Board, representative of the employees 0
Zoltán Áldott Executive Vice President, President of the Management Board, INA d.d. 480,000
Sándor Fasimon Executive Vice President, MOL Hungary 80,000
Dr. Berislav Gašo Executive Vice President, Upstream 0
Ferenc Horváth Executive Vice President, Downstream 233,584
József Simola** Group Chief Financial Officer (GCFO) 130,480
* Dr. Sándor Csányi owns 114,400 share directly, 1,720,000 shares indirectly via Sertorius Global Opportunities Fund Pte. Ltd** Mr József Simola owns 2 pieces of MOL GROUP FINANCE USD bond expiring on 26 September 2019 with nominal value USD 200,000
FURTHER INFORMATION ON CORPORATE GOVERNANCE
MOL Group publishes on its website each year the MOL Plc. Corporate Governance Report in accordance with Budapest Stock Exchange Corporate Governance Recommendations, which also discloses any potential divergence from these recommendations with the necessary reasoning.
119


FINANCIAL STATEMENTS

CONSOLIDATED FINANCIAL STATEMENTSINTRODUCTION
GENERAL INFORMATION
MOL Hungarian Oil and Gas Public Limited Company (hereinafter referred to as MOL Plc., MOL or the parent company) was incorporated on 1 October 1991 on the transformation of its legal predecessor, the Országos Kőolaj- és Gázipari Tröszt (OKGT). In accordance with the law on the transformation of unincorporated state-owned enterprises, the assets and liabilities of OKGT were revalued as at that date. MOL Plc. and its subsidiaries (here-inafter referred to as the Group or MOL Group) are involved in the exploration and production of crude oil, natural gas and other gas products, refining, transportation and storage of crude oil and wholesale and retail marketing of crude oil products, production and sale of polymers, olefins and polyolefins The registered office address of the Company is 1117 – Budapest, Október huszonharmadika u. 18, Hungary. The shares of the Company are listed on the Budapest and the Warsaw Stock Exchange. Depositary Receipts (DRs) are listed on the Luxembourg Stock Exchange and are traded on London’s International Order Book and Over The Counter (OTC) market in the USA.
AUTHORIZATION AND STATEMENT OF COMPLIANCE
These consolidated financial statements have been approved and authorised for issue by the Board of Directors on 12 March 2018.These consolidated financial statements have been prepared in accordance with International Financial Reporting Standards and all applicable IFRSs that have been adopted by the European Union (EU). IFRS comprise standards and interpretations approved by the International Accounting Standards Board (IASB) and the IFRS Interpretations Committee.
CONSOLIDATED FINANCIAL STATEMENTS

CONTENTSIndependent auditor’s report ................................................................................................................. 124
Primary statementsConsolidated Statement of profit or loss ............................................................................................. 130Consolidated statement of comprehensive income ....................................................................... 131Consolidated statement of financial position .................................................................................... 132Consolidated statement of changes in equity ................................................................................... 134Consolidated statement of cash flows .................................................................................................. 136Accounting information, policies and significant estimates1. Accounting information, policies and significant estimates ................................................. 138
Results for the year2. Segmental information ..................................................................................................................... 1403. Total operating income ..................................................................................................................... 1424. Total operating expenses .................................................................................................................. 1445. Finance result ........................................................................................................................................ 1476. Investments in associates and joint ventures .............................................................................. 1487. Income taxes ......................................................................................................................................... 1508. Components of other comprehensive income ......................................................................... 153
Non-financial assets and liabilities9. Property, plants and equipment and intangible assets ......................................................... 15410. Business combinations, transactions with non-controlling interests .................................. 16211. Disposals .................................................................................................................................................. 16312. Material non-controlling interest ................................................................................................... 16413. Other non-current assets .................................................................................................................. 16514. Inventories .............................................................................................................................................. 16515. Other current assets ........................................................................................................................... 16616. Provisions ................................................................................................................................................ 16617. Other non-current liabilities ............................................................................................................ 16918. Other current liabilities ...................................................................................................................... 17019. Assets held for sale ............................................................................................................................... 170
Financial instruments, capital and financial risk management20. Financial risk and capital management ..................................................................................... 17321. Financial instruments ......................................................................................................................... 18022. Fair value measurement ................................................................................................................... 18223. Trade and other receivables ........................................................................................................... 18224. Cash and cash equivalents ............................................................................................................... 183
Other financial information25. Commitments and contingent liabilities ...................................................................................... 18426. Notes to the consolidated statements of cash flows ................................................................. 18727. Earnings per share .............................................................................................................................. 18828. Related party transactions ............................................................................................................... 18929. Events after the reporting period .................................................................................................. 19030. Appendices ............................................................................................................................................ 190
123

THIS IS A TRANSLATION OF THE HUNGARIAN REPORT
INDEPENDENT AUDITOR’S REPORT
TO THE SHAREHOLDERS OF MOL HUNGARIAN OIL AND GAS PLC.
REPORT ON THE AUDIT OF THE CONSOLIDATED FINANCIAL STATEMENTS
OPINION
We have audited the accompanying 2017 consolidated financial statements of MOL Hungarian Oil and Gas Plc. (“the Company”) and its subsidiaries (altogether “the Group”), which comprise the consolidated statement of financial position as at 31 December 2017 – showing a balance sheet total of HUF 4,231,700 million and a net profit for the year of HUF 316,410 million –, the consolidated state-ment of profit or loss, the consolidated statement of comprehensive income, consolidated statement of changes in equity, consolidated statement of cash flows for the year then ended and notes to the consolidated financial statements, including a summary of significant accounting policies.
In our opinion, the consolidated financial statements give a true and fair view of the consolidated financial position of the Group as at 31 December 2017 and of its consolidated financial performance and its consolidated cash flows for the financial year then ended in accordance with International Financial Reporting Standards as adopted by the EU (“EU IFRSs”) and has been prepared, in all materials respects, in accordance with the supplementary requirements of Act C of 2000 on Accounting (“Hungarian Accounting Law”) relevant for consolidated financial statements prepared in accordance with EU IFRSs.
BASIS FOR OPINION
We conducted our audit in accordance with International Standards on Auditing and Hungarian National Auditing Standards and with applicable laws and regulations in Hungary, including also Regulation (EU) No. 537/2014 of the European Parliament and of the Council of 16 April 2014 on specific requirements regarding statutory audit of public-interest entities (“Regulation (EU) No. 537/2014“). Our responsibilities under those standards are further described in the “Auditor’s responsibilities for the audit of the consolidated financial statements” section of our report.
We are independent of the Group in accordance with the applicable ethical requirements according to relevant laws in effect in Hungary and the policy of the Chamber of Hungarian Auditors on the ethical rules and disciplinary proceedings and, concerning matters not regulated by any of these, with the International Ethics Standards Board for Accountants’ Code of Ethics for Profes-sional Accountants (IESBA Code), and we have fulfilled our other ethical responsibilities in accordance with these requirements.
We believe that the audit evidence we have obtained is sufficient and appropriate to provide a basis for our opinion.
KEY AUDIT MATTERS
Key audit matters are those matters that, in our professional judgment, were of most significance in our audit of the consolidated financial statements of the current period. These matters were addressed in the context of our audit of the consolidated financial statements as a whole, and in forming our opinion thereon, and we do not provide a separate opinion on these matters. For each matter below, our description of how our audit addressed the matter is provided in that context.
We have fulfilled the responsibilities described in the “Auditor’s responsibilities for the audit of the consolidated financial state-ments section” of our report, including in relation to these matters. Accordingly, our audit included the performance of procedures designed to respond to our assessment of the risks of material misstatement of the consolidated financial statements. The results of our audit procedures, including the procedures performed to address the matters below, provide the basis for our audit opinion on the accompanying consolidated financial statements.
INDEPENDENT AUDITOR’S REPORT

Oil and natural gas reserve estimation processThe estimation of oil and natural gas reserves is a significant area of judgement due to the technical uncertainty in assessing quantities and complex contractual arrangements dictating the Group’s share of reportable volumes. We considered the oil and natural gas reserve estimation process to be a key audit matter as oil and natural gas reserves are also a fundamental indicator of the future potential of the Group’s performance and these estimates affect significant income statement and balance sheet amounts.
Audit procedures included understanding of the process for determination of the oil and natural gas reserves and testing of the design of internal controls implemented in the process. We assessed the competence and objectivity of technical experts of the Group, to evaluate whether they are qualified to carry out the oil and natural gas reserve volumes estimation. We performed an inquiry of the management of the Group and our procedures were planned and executed to assess that the applied methodology for oil and natural gas reserves estimate is consistent with previous year.
We have performed the test of detail and we have selected the items with significant movements compared to the prior year. For these we tested if the changes were made in the appropriate period, and in compliance with the Group’s internal policies and we validated these volumes against underlying informa-tion such as technical evaluations and Reserve and Resources Committee decision papers. We also performed analytical procedures on movements in oil and natural gas reserves during the year and reviewed whether all significant changes were approved by the Reserves and Resources Committee.We assessed the adequacy of the Group’s disclosures in respect of oil and natural gas reserves.The Group’s disclosures about oil and natural gas reserves esti-mation policies are included in Note 9.g) Depreciation, deple-tion and amortization to the consolidated financial statements.
Wholesale revenue recognitionMOL Group net revenue derives from different activities and we identified wholesale revenue as a significant revenue stream. Revenue is recognized when the risks and rewards of the underlying products have been transferred to the customer.
Revenue is measured taking into account discounts, incen-tives and rebates earned by customers on the Group’s sales. Due to the multitude and variety of contractual terms across the Group’s markets, typically related to the wholesale activity, we consider the estimation of discounts, incentives and rebates recognized based on sales made during the year to be a complex area and therefore we consider revenue recognition related to wholesale activity as a key audit matter.
Our audit procedures included considering the appropriate-ness of the Group’s revenue recognition accounting policies including those relating to discounts, incentives and rebates. We assessed compliance with the policies in terms of appli-cable accounting standards. We tested the design and opera-tional effectiveness of the Group’s controls over calculation of discounts, incentives and rebates and correct timing of revenue recognition. We tested a sample of the sales transactions close to the balance sheet date as well as credit notes issued after the balance sheet date to assess whether that revenue was recog-nized in the correct period. We also performed analytical reviews over revenue accounts and we assessed the adequacy of the Group’s disclosures in respect of revenue.
The Group’s disclosures about revenue and revenue recogni-tion policies are included in Note 3 to the consolidated financial statements.
125

Asset impairmentsMovements in oil and gas prices can have a significant effect on the carrying value of the Group's assets including upstream offshore and onshore, refining, retail and service related long lived assets as well as goodwill. A significant and rapid drop in prices will also quickly impact the Group's operations and cash flows. We assessed the principal risk arising in relation to the consolidated financial statements to be associated with the carrying value of the above listed assets, many of which are supported by an assessment of future cash flows.
As asset impairments are complex and judgmental area with significant potential impact on the valuation of assets, we consider asset impairments a key audit matter.
We examined the methodology used by management to assess the carrying value of respective assets, to determine its compli-ance with accounting standards and consistency of applica-tion. We performed understanding of the process and tested the design of the internal controls operated by the Group relating to the assessment of the carrying value of respective assets. For the assets where impairment indicators were not identified by the Group we assessed the assumptions used by the Group in its determination of whether impairment indicators exist. The assessment took into consideration current industry and Group expectations for the key inputs to impairment models.
In respect of performed impairment tests, we used external data in assessing and corroborating the assumptions used in impair-ment testing, the most significant being future market oil prices, reserves and resources volumes and discount rates. We involved internal experts in the evaluation of discount rates. We also performed audit procedures on the mathematical integrity of the impairment models and sensitivity analysis and procedures to assess the completeness of the impairment charges.
We assessed the adequacy of the Group’s disclosures in respect of valuation of intangible assets and tangible fixed assets.
The disclosures about intangible assets and tangible fixed assets are included in Note 9 to the consolidated financial state-ments.
Trading operationsUnauthorized trading activity (which covers physical and paper trading of products and product related derivatives) gives rise to an inherent risk of fraud in revenue or profit recognition as there is an incentive to mismarking of the Group’s trading posi-tions to minimize trading losses or maximize trading profits or understate profits or move profits to subsequent periods when bonus ceilings have already been reached, to maximize indi-vidual bonuses across financial years. This risk together with the potential significant effect on the revenue or profit of the Group led us to identify the risk of unauthorized trading opera-tion as a key audit matter.
Our audit procedures included testing of the design of internal controls implemented in the process and testing of the design and operating effectiveness of the controls implemented by the Group to avoid unauthorized trading activity. We selected a sample of third parties to whom we sent confirmation letters to confirm the year-end balances of open transactions.
We tested fair value of a sample of derivatives using contract and external market prices with the involvement of valuation experts. We performed test of the completeness of the trading transactions and amounts recorded in the consolidated finan-cial statements through performing procedures to detect unrecorded liabilities as well as procedures related to the recog-nition of sales, purchases, trade receivables and trade payables.We assessed the appropriateness of disclosures made in rela-tion of the result and details of trading transactions as detailed in Note 20 and Note 21 to the consolidated financial statements.
INDEPENDENT AUDITOR’S REPORT

OTHER INFORMATION
Other information consists of the 2017 consolidated business report of the Group and the Overview Chapter, the Management & Discussion & Analysis Chapter, the Corporate Governance Chapter (“Statement on corporate governance”), the Supplementary and Sustainability Chapter and the Report on Payments to Governments of the Annual Report of MOL Hungarian Oil and Gas Plc. Management is responsible for the other information, including preparation of the consolidated business report in accordance with the Hungarian Accounting Law and other relevant legal requirements, if any. Our opinion on the consolidated financial statements does not cover the other information.
In connection with our audit of the consolidated financial statements, our responsibility is to read the other information and, in doing so, consider whether 1) the other information is materially inconsistent with the consolidated financial statements or our knowledge obtained in the audit or otherwise appears to be materially misstated and 2) the consolidated business report has been prepared in accordance with the Hungarian Accounting Law and other relevant legal requirements, if any.
Our opinion on the consolidated business report should include the information required according to Subsection (2) e) and f) of Section 95/B of the Hungarian Accounting Law and we are required to confirm also whether the information prescribed in Subsec-tion (2) a)-d) and g)-h) of Section 95/B of the Hungarian Accounting Law have been made available and whether the consolidated business report includes the non-financial statements as required by Subsection (5) of Section 134 of the Hungarian Accounting Law.
In our opinion, the consolidated business report of the Group, including the information required according to Subsection (2) e) and f) of Section 95/B of the Hungarian Accounting Law for 2017 is consistent, in all material respects, with the 2017 consolidated financial statements of the Group and the relevant requirements of the Hungarian Accounting Law.
Since no other legal regulations prescribe for the Group further requirements with regard to its consolidated business report, we do not express opinion in this regard.
We also confirm that the Group have made available the information required according to Subsection (2) a)-d) and g)-h) of Section 95/B of the Hungarian Accounting Law and that the consolidated business report includes the non-financial statements as required by Subsection (5) of Section 134 of the Hungarian Accounting Law.
Further to the above, based on the knowledge we have obtained about the Group and its environment in the course of the audit we are required to report whether we have identified any material misstatement in the other information, and if so, the nature of the misstatement in question. We have nothing to report in this regard.
RESPONSIBILITIES OF MANAGEMENT AND THOSE CHARGED WITH GOVERNANCE FOR THE CONSOLIDATED FINANCIAL STATEMENTS
Management is responsible for the preparation and fair presentation of the consolidated financial statements in accordance with the EU IFRSs, and for such internal control as management determines is necessary to enable the preparation of the consolidated financial statements that are free from material misstatement, whether due to fraud or error.
In preparing the consolidated financial statements, management is responsible for assessing the Group’s ability to continue as a going concern, disclosing, as applicable, matters related to going concern and using the going concern basis of accounting unless management either intends to liquidate the Group or to cease operations, or has no realistic alternative but to do so. Those charged with governance are responsible for overseeing the Group’s financial reporting process.
AUDITOR’S RESPONSIBILITIES FOR THE AUDIT OF THE CONSOLIDATED FINANCIAL STATEMENTS
Our objectives are to obtain reasonable assurance about whether the consolidated financial statements as a whole are free from material misstatement, whether due to fraud or error, and to issue an auditor’s report that includes our opinion. Reasonable assur-ance is a high level of assurance, but is not a guarantee that an audit conducted in accordance with International Standards on Auditing and Hungarian National Auditing Standards and with applicable laws and regulations in Hungary, including also Regu-lation (EU) No. 537/2014 will always detect a material misstatement when it exists. Misstatements can arise from fraud or error and are considered material if, individually or in the aggregate, they could reasonably be expected to influence the economic decisions of users taken on the basis of these consolidated financial statements.
127

As part of an audit in accordance with International Standards on Auditing and Hungarian National Auditing Standards, and with applicable laws and regulations in Hungary, including also Regulation (EU) No. 537/2014 we exercise professional judgment and main-tain professional scepticism throughout the audit. We also:
Identify and assess the risks of material misstatement of the consolidated financial statements, whether due to fraud or error, design and perform audit procedures responsive to those risks, and obtain audit evidence that is sufficient and appropriate to provide a basis for our opinion. The risk of not detecting a material misstatement resulting from fraud is higher than for one resulting from error, as fraud may involve collusion, forgery, intentional omissions, misrepresentations, or the override of internal control.
Obtain an understanding of internal control relevant to the audit in order to design audit procedures that are appropriate in the circumstances, but not for the purpose of expressing an opinion on the effectiveness of the Group’s internal control.
Evaluate the appropriateness of accounting policies used and the reasonableness of accounting estimates and related disclosures made by management.
Conclude on the appropriateness of management’s use of the going concern basis of accounting and, based on the audit evidence obtained, whether a material uncertainty exists related to events or conditions that may cast significant doubt on the Group’s ability to continue as a going concern. If we conclude that a material uncertainty exists, we are required to draw attention in our auditor’s report to the related disclosures in the consolidated financial statements or, if such disclosures are inadequate, to modify our opinion. Our conclusions are based on the audit evidence obtained up to the date of our auditor’s report. However, future events or conditions may cause the Group to cease to continue as a going concern.
Evaluate the overall presentation, structure and content of the consolidated financial statements, including the disclosures, and whether the consolidated financial statements represent the underlying transactions and events in a manner that achieves fair presentation.
Obtain sufficient appropriate audit evidence regarding the financial information of the entities or business activities within the Group to express an opinion on the consolidated financial statements. We are responsible for the direction, supervision and performance of the group audit. We remain solely responsible for our audit opinion.
We communicate with those charged with governance regarding, among other matters, the planned scope and timing of the audit and significant audit findings, including any significant deficiencies in internal control that we identify during our audit.
We also provide those charged with governance with a statement that we have complied with relevant ethical requirements regarding independence, and to communicate with them all relationships and other matters that may reasonably be thought to bear on our independence, and where applicable, related safeguards.
From the matters communicated with those charged with governance we determine those matters that were of most significance in the audit of the consolidated financial statements of the current period and are therefore the key audit matters.
REPORT ON OTHER LEGAL AND REGULATORY REQUIREMENTS
Reporting requirements on content of auditor’s report in compliance with Regulation (EU) No. 537/2014:
Appointment and Approval of Auditor We were appointed as the statutory auditor of MOL Hungarian Oil and Gas Plc. by the General Assembly of Shareholders of the Company on 13 April 2017. Total uninterrupted engagement period, including previous renewals (extension of the period for which we were originally appointed) and reappointments for the statutory auditor, has lasted for 16 years.
Consistency with Additional Report to Audit CommitteeOur audit opinion on the consolidated financial statements expressed herein is consistent with the additional report to the audit committee of the Company, which we issued in accordance with Article 11 of the Regulation (EU) No. 537/2014 on 1 March 2018.
INDEPENDENT AUDITOR’S REPORT

Szabó GergelyPartnerErnst & Young Kft.1132 Budapest, Váci út 20. Registration No. 001165
Szabó GergelyRegistered auditorChamber membership No.: 005676
Non-audit ServicesWe declare that no prohibited non-audit services referred to in Article 5(1) of Regulation (EU) No. 537/2014 were provided by us to the Company and its controlled undertakings and we remained independent from the Group in conducting the audit.
In addition to statutory audit services and services disclosed in the consolidated business report and in the consolidated financial statements, no other services were provided by us to the Company and its controlled undertakings.
The engagement partner on the audit resulting in this independent auditor’s report is Szabó Gergely.
Budapest, 12 March 2018
129

CONSOLIDATED STATEMENT OF PROFIT OR LOSS
2017 2016Notes HUF million HUF million
Net sales 3 4,130,320 3,553,005
Other operating income 3 25,543 25,316
Total operating income 3 4,155,863 3,578,321
Raw materials and consumables used 3,080,556 2,571,717
Employee benefits expense 255,664 240,260
Depreciation, depletion, amortisation and impairment 318,216 315,483
Other operating expenses 233,549 221,382
Change in inventory of finished goods & work in progress (28,131) (33,771)
Work performed by the enterprise and capitalised (58,358) (44,655)
Total operating expenses 4 3,801,496 3,270,416
Profit from operation 354,367 307,905
Finance income 62,096 49,502
Finance expense 68,769 99,254
Total finance expense, net 5 (6,673) (49,752)
Share of after tax results of associates and joint ventures 6 17,944 14,390
Profit before tax 365,638 272,543
Income tax expense 7 49,228 20,888
Profit for the year 316,410 251,655
Attributable to:
Owners of parent 306,952 263,497
Non-controlling interest 9,458 (11,842)
Basic earnings per share* 27 437 359
Diluted earnings per share* 27 437 359
PRIMARY STATEMENTS

CONSOLIDATED STATEMENT OF COMPREHENSIVE INCOME
2017 2016Notes HUF million HUF million
Profit for the year 316.410 251.655
Other comprehensive income
Other comprehensive income to be reclassified to profit or loss in subsequent periods:
Exchange differences on translating foreign operations, net of tax 8 (13.842) (13.970)
Net investment hedge, net of tax 8 21.364 (5.161)
Changes in fair value of available-for-sale financial assets, net of tax 8 (251) 3.690
Changes in fair value of cash flow hedges, net of tax 8 249 789
Share of other comprehensive income of associates and joint ventures 8 (13.569) 7.849
Net other comprehensive income / (loss) to be reclassified to profit or loss in subsequent periods
(6.049) (6.803)
Other comprehensive income not to be reclassified to profit or loss in subsequent periods:
Remeasurement of post employment benefit obligations 8 (1.205) 839
Net other comprehensive income / (loss) not to be reclassified to profit or loss in subsequent periods
(1.205) 839
Other comprehensive income / (loss) for the year, net of tax (7.254) (5.964)
Total comprehensive income for the year 309.156 245.691
Attributable to:
Owners of parent 300.012 250.466
Non-controlling interest 9.144 (4.775)
131

CONSOLIDATED STATEMENT OF FINANCIAL POSITION
31 Dec 2017 31 Dec 2016Notes HUF million HUF million
NON-CURRENT ASSETS
Property, plant and equipment 9 2,261,166 2,193,419
Intangible assets 9 181,451 183,561
Investments in associates and joint ventures 6 206,374 257,090
Other non-current financial assets 21 78,400 63,652
Deferred tax asset 7 120,633 125,055
Other non-current assets 13 43,555 44,403
Total non-current assets 2,891,579 2,867,180
CURRENT ASSETS
Inventories 14 436,572 385,142
Trade and other receivables 23 538,986 476,531
Securities 21 26,043 53,910
Other current financial assets 21 55,715 26,829
Income tax receivable 7 9,865 7,945
Cash and cash equivalents 24 202,041 216,928
Other current assets 15 69,828 66,239
Assets classified as held for sale 19 1,071 3,082
Total current assets 1,340,121 1,236,606
Total assets 4,231,700 4,103,786
EQUITY 20
Share capital 79,279 79,260
Retained earnings and other reserves 1,354,723 1,149,315
Profit for the year attr. to owners of parent 306,952 263,497
Equity attributable to owners of parent 1,740,954 1,492,072
Non-controlling interest 314,817 309,554
Total equity 2,055,771 1,801,626
NON-CURRENT LIABILITIES
Long-term debt 21 491,701 436,922
Other non-current financial liabilities 21 6,565 6,160
Non-current provisions 16 434,291 405,175
Deferred tax liabilities 7 50,068 47,766
Other non-current liabilities 17 23,522 22,658
Total non-current liabilities 1,006,147 918,681
CURRENT LIABILITIES
Short-term debt 21 171,561 440,372
Trade and other payables 21 516,737 493,389
Other current financial liabilities 21 229,250 202,056
Current provisions 16 40,149 32,423
Income tax payable 1,754 2,615
Other current liabilities 18 210,331 212,624
Total current liabilities 1,169,782 1,383,479
Total liabilities 2,175,929 2,302,160
Total equity and liabilities 4,231,700 4,103,786
PRIMARY STATEMENTS

133
CONSOLIDATED STATEMENT OF CHANGES IN EQUITY
Share capital
Share premium
Fair valuation reserve
Reserve of exchange
differences on translation
Retained earnings with profit for the year attr.
to owners of parentTotal
reserves
Equity attr. to owners of parent
Non–controlling interests
Total equity
HUF million HUF million HUF million HUF million HUF million HUF million HUF million HUF million HUF million
Opening balance 1 Jan 2016 79,241 223,866 1,246 245,772 902,094 1,372,978 1,452,219 364,349 1,816,568
Profit / (loss) for the year – – – – 263,497 263,497 263,497 (11,842) 251,655
Other comprehensive income / (loss) for the year – – 2,761 (17,488) 1,696 (13,031) (13,031) 7,067 (5,964)
Total comprehensive income / (loss) for the year – – 2,761 (17,488) 265,193 250,466 250,466 (4,775) 245,691
Dividends – – – – (47,782) (47,782) (47,782) – (47,782)
Dividends to non–controlling interests – – – – – – – (2,533) (2,533)
Equity recorded for share–based payments 19 – – – 314 314 333 – 333
Treasury share transactions – (4,477) – – 4,477 – – – –
Acquisition / divestment of subsidiaries – – – – – – – (4,834) (4,834)
Acquisition of non–controlling interests – – – – (163,164) (163,164) (163,164) (42,653) (205,817)
Closing balance 31 Dec 2016 79,260 219,389 4,007 228,284 961,132 1,412,812 1,492,072 309,554 1,801,626
Profit / (loss) for the year – – – – 306,952 306,952 306,952 9,458 316,410
Other comprehensive income / (loss) for the year – – (196) (3,489) (3,255) (6,940) (6,940) (314) (7,254)
Total comprehensive income / (loss) for the year – – (196) (3,489) 303,697 300,012 300,012 9,144 309,156
Dividends – – (52,681) (52,681) (52,681) – (52,681)
Dividends to non–controlling interests – – – – – – (3,917) (3,917)
Equity recorded for share–based payments 19 – – – 1,556 1,556 1,575 – 1,575
Treasury share transactions – – – – – – – –
Acquisition / divestment of subsidiaries – – – – – 58 58
Acquisition of non–controlling interests – – – (24) (24) (24) (22) (46)
Closing balance 31 Dec 2017 79,279 219,389 3,811 224,795 1,213,680 1,661,675 1,740,954 314,817 2,055,771
PRIMARY STATEMENTS

Share capital
Share premium
Fair valuation reserve
Reserve of exchange
differences on translation
Retained earnings with profit for the year attr.
to owners of parentTotal
reserves
Equity attr. to owners of parent
Non–controlling interests
Total equity
HUF million HUF million HUF million HUF million HUF million HUF million HUF million HUF million HUF million
Opening balance 1 Jan 2016 79,241 223,866 1,246 245,772 902,094 1,372,978 1,452,219 364,349 1,816,568
Profit / (loss) for the year – – – – 263,497 263,497 263,497 (11,842) 251,655
Other comprehensive income / (loss) for the year – – 2,761 (17,488) 1,696 (13,031) (13,031) 7,067 (5,964)
Total comprehensive income / (loss) for the year – – 2,761 (17,488) 265,193 250,466 250,466 (4,775) 245,691
Dividends – – – – (47,782) (47,782) (47,782) – (47,782)
Dividends to non–controlling interests – – – – – – – (2,533) (2,533)
Equity recorded for share–based payments 19 – – – 314 314 333 – 333
Treasury share transactions – (4,477) – – 4,477 – – – –
Acquisition / divestment of subsidiaries – – – – – – – (4,834) (4,834)
Acquisition of non–controlling interests – – – – (163,164) (163,164) (163,164) (42,653) (205,817)
Closing balance 31 Dec 2016 79,260 219,389 4,007 228,284 961,132 1,412,812 1,492,072 309,554 1,801,626
Profit / (loss) for the year – – – – 306,952 306,952 306,952 9,458 316,410
Other comprehensive income / (loss) for the year – – (196) (3,489) (3,255) (6,940) (6,940) (314) (7,254)
Total comprehensive income / (loss) for the year – – (196) (3,489) 303,697 300,012 300,012 9,144 309,156
Dividends – – (52,681) (52,681) (52,681) – (52,681)
Dividends to non–controlling interests – – – – – – (3,917) (3,917)
Equity recorded for share–based payments 19 – – – 1,556 1,556 1,575 – 1,575
Treasury share transactions – – – – – – – –
Acquisition / divestment of subsidiaries – – – – – 58 58
Acquisition of non–controlling interests – – – (24) (24) (24) (22) (46)
Closing balance 31 Dec 2017 79,279 219,389 3,811 224,795 1,213,680 1,661,675 1,740,954 314,817 2,055,771
135

CONSOLIDATED STATEMENT OF CASH FLOWS
2017 2016Notes HUF million HUF million
Profit before tax 365,638 272,543
Adjustments to reconcile profit before tax to net cash provided by operating activities
Depreciation, depletion, amortisation and impairment 4 318,309 315,483
Increase / (decrease) in provisions 16 (4,149) (27,272)
Net (gain) / loss on asset disposal and divestments 3,764 659
Net interest expense / (income) 5 27,351 40,790
Other finance expense / (income) 5 (20,705) 8,963
Share of after tax results of associates and joint ventures 6 (17,944) (14,390)
Other non-cash item 15,691 13,908
Income taxes paid 7 (44,159) (63,415)
Cash flows from operations before changes in working capital 643,796 547,269
Change in working capital (84,100) (27,884)
(Increase) / decrease in inventories 14 (58,052) (41,706)
(Increase) / decrease in trade and other receivables 23 (126,404) (47,040)
Increase / (decrease) in trade and other payables 89,124 78,389
(Increase)/decrease in other assets and liabilities 15, 18 11,232 (17,527)
Cash flows from operations 559,696 519,385
Capital expenditures 2 (285,532) (289,438)
Proceeds from disposal of fixed assets 7,013 4,623
Acquisition of businesses (net of cash) 10 (2,567) (29,935)
Proceeds from disposal of businesses (net of cash) 11 9,996 (3,562)
Decrease in other financial assets (22,542) (423)
Interest received and other financial income 5 5,935 3,962
Dividends received 5, 26 32,477 7,805
Cash flows used in investing activities (255,220) (306,968)
Proceeds from issue of bonds, notes and debentures – 233,348
Repayments of bonds, notes and debentures (234,840) –
Proceeds from borrowings 933,026 1,056,074
Repayments of borrowings (911,255) (1,088,709)
Interest paid and other finance expense 5 (50,640) (61,255)
Dividends paid to owners of parent 20 (52,666) (47,802)
Dividends paid to non-controlling interest (3,781) (2,550)
Transactions with non-controlling interest (23) (214,987)
Cash flows used in financing activities (320,179) (125,881)
Currency translation differences relating to cash and cash equivalents (5,032) (1,446)
Increase/(decrease) in cash and cash equivalents (20,735) 85,090
Net cash and cash equivalents at the beginning of the year 216,928 131,838
Change in Cash and cash equivalents (14,887) 85,090
Net cash and cash equivalents at the end of the year 202,041 216,928
Overdraft (5,848) –
Cash and cash equivalents 196,193 216,928
PRIMARY STATEMENTS

137
NOTES TO THE FINANCIAL STATEMENTS – ACCOUNTING INFORMATION, POLI-CIES AND SIGNIFICANT ESTIMATES
This section describes the basis of prepa-
ration of the consolidated financial state-
ments and the Group’s applicable ac-
counting policies. Accounting policies,
critical accounting estimates and judge-
ments that are specific to a given area are
set out in detail in the relevant notes. This
section also provides a brief summary of
new accounting standards, amendments
and interpretations that has already been
adopted in the current financial year or will
be adopted as those will be in force in the
forthcoming years.
1. ACCOUNTING INFORMATION, POLICIES AND SIGNIFICANT ESTIMATES
BASIS OF PREPARATION
These consolidated financial statements have been prepared in accordance with International Financial Reporting Standards (IFRS) as issued by the International Accounting Standards Board and interpretations issued by IFRS Interpretations Committee as adopted by the EU and effective on 31 December 2017. The consolidated financial statements are prepared on a going concern basis under the historical cost convention. For the purposes of the application of the Historical Cost Convention, the consolidated financial statements treat the Company as having come into existence as of 1 October 1991, at the carrying values of assets and liabilities determined at that date, subject to the IFRS adjust-ments.
PRINCIPLES OF CONSOLIDATION
The consolidated financial statements as of and for the twelve-month period ended 31 December 2017 comprise the accounts of the MOL Plc. and the subsidiaries that it controls together with the Group’s attributable share of the results of associates and joint ventures. MOL Plc. and its subsidiaries are collectively referred to as the ‘Group’.Control is evidenced when the Group is exposed, or has rights, to variable returns from its involvement with a company, and has the ability to affect those returns through its power over the company. Power over an entity means having existing rights to direct its relevant activities. The relevant activities of a company are those activities which significantly affects its returns. Where the Group has a long-term equity interest in an undertaking and over which it has the power to exercise significant influ-ence, the Group applies the equity method for consolidation.An arrangement is under joint control when the decisions about its relevant activities require the unanimous consent of the parties sharing the control of the arrangements.If the Company has rights to the assets and obligations for the liabilities relating to the arrangement then the arrangement is qual-ified as a joint operation. The Company’s interest in a joint operation are accounted for by recognising its relative share of assets, liabilities, income and expenses of the arrangement, combining with similar items in the consolidated financial statements on a line-by-line basis.If the Company has rights to the net assets of the arrangement then the arrangement is qualified as a joint venture. The Group’s investments in joint ventures are accounted for using the equity method of accounting.
NOTES TO THE FINANCIAL STATEMENTS

NEW AND AMENDED STANDARDS ADOPTED BY THE GROUP
The Group has applied the following standards and amendments for the first time for the annual reporting period commencing 1 January 2017:
Amendments to IAS 7 – Statement of cash flows: disclosure initiative Amendments to IAS 12 – Income taxes: recognition of deferred tax assets for unrealized losses Annual improvements 2014-2016: IFRS 12 – Disclosure of interest in other entities
The adoption of these amendments does not have significant impact on the financial statements of the Group.
ISSUED BUT NOT YET EFFECTIVE INTERNATIONAL FINANCIAL REPORTING STANDARDS
Issued but not yet effective International Financial Reporting Standards are disclosed in the Appendix I.
SUMMARY OF SIGNIFICANT ACCOUNTING POLICIES
Functional and presentation currencyBased on the economic substance of the underlying events and circumstances the functional currency of the parent company and the presentation currency of the Group have been determined to be the Hungarian Forint (HUF).Financial statement data is presented in millions of HUF, rounded to the nearest million HUF.
Foreign Currency TransactionsForeign currency transactions are recorded initially at the rate of exchange at the date of the transaction. Exchange differences arising when monetary items are settled or when monetary items are translated at rates different from those at which they were translated when initially recognised or in previous financial statements are reported in profit or loss in the period. Monetary items, goodwill and fair value adjustments arising on the acquisition of a foreign operation denominated in foreign currencies are retrans-lated at exchange rate ruling at the balance sheet date. Foreign exchange differences on monetary items with a foreign operation are recognised in other comprehensive income if settle-ment of these items is neither planned nor likely to occur in the foreseeable future.Financial statements of foreign entities are translated at year-end exchange rates with respect to the statement of financial posi-tion and at the weighted average exchange rates for the year with respect to the statement of profit or loss. All resulting translation differences are included in the translation reserve in other comprehensive income. Currency translation differences are recycled to profit or loss when disposal or partial disposal of the given foreign operation occurs. When MOL Group loses control of a subsidiary that is or includes a foreign operation, this is a disposal that triggers reclassification of the entire amount of cumulative translation adjustment (CTA) to the statement of profit or loss. The principle of full reclassifica-tion also applies to the loss of joint control or significant influence over a jointly controlled entity or an associate (i.e. when applica-tion of equity method ceases). On a partial disposal that does not involve loss of control of a subsidiary that includes a foreign operation, MOL Group re-attributes the proportionate share of the CTA to the non-controlling interests in that foreign operation. Activity is considered to be abandoned when assets are written-off to zero, there is no intention to continue the activity, it is deter-mined not to spend further CAPEX in the block, the closure of the business is decided and only remaining activity is arranging the necessary administration either in house or with authorities. Gains and losses accumulated in the translation reserve are recycled to the statement of profit or loss when the foreign operation is disposed of except for exchange differences that have previously been attributed to non-controlling interests.
SIGNIFICANT ACCOUNTING ESTIMATES AND JUDGEMENTS
In the process of applying the accounting policies, management has made certain judgements that have significant effect on the amounts recognized in the financial statements which are set out in detail in the respective notes.The preparation of consolidated financial statements in conformity with IFRS requires the use of estimates and assumptions that affect the amounts reported in the financial statements and the Notes thereto. Although these estimates are based on the manage-ment’s best knowledge of current events and actions, actual results may differ from those estimates. These are set out in detail in the respective notes.
139

RESULTS FOR THE YEAR
This section explains the results and per-
formance of the Group for the financial
years ended 31 December 2017 and 31 De-
cember 2016. Disclosures are following the
structure of statement of profit or loss and
provide information on segmental data,
total operating income, total operating
expense, finance result, share of after tax
results of associates and joint ventures.
For taxation, share-based payments, joint
ventures and associates, statement of fi-
nancial position disclosures are also pro-
vided in this section.
2. SEGMENTAL INFORMATION
ACCOUNTING POLICIES
For management purposes the Group is organized into five major operating business units: Upstream, Downstream, Consumer Services, Gas Midstream and Corporate and other segments. The business units are the basis upon which the Group reports its segment information to the management which is responsible for allocating business resources and assessing performance of the operating segments. Consumer Services segment was launched in 2017 consisting of Retail and Mobility (car sharing, fleet management) units.
UpstreamDown-
streamConsumer
ServicesGas
MidstreamCorporate and other
Inter– segment transfers Total
2017 HUF million HUF million HUF million HUF million HUF million HUF million HUF million
Net Revenue
External sales 162,436 2,724,721 1,123,104 94,070 25,989 – 4,130,320
Inter–segment transfers 249,297 918,786 4,911 4,471 189,137 (1,366,602) –
Total revenue 411,733 3,643,507 1,128,015 98,541 215,126 (1,366,602) 4,130,320
Profit / (loss) from operation
74,497 226,832 72,051 48,227 (64,424) (2,816) 354,367
UpstreamDown-
streamConsumer
ServicesGas
MidstreamCorporate and other
Inter– segment transfers Total
2016 restated HUF million HUF million HUF million HUF million HUF million HUF million HUF million
Net Revenue
External sales 156,905 2,298,224 996,703 83,423 17,750 – 3,553,005
Inter–segment transfers 214,670 758,670 3,467 5,986 170,891 (1,153,684) –
Total revenue 371,575 3,056,894 1,000,170 89,409 188,641 (1,153,684) 3,553,005
Profit / (loss) from operation
37,053 247,550 52,950 41,439 (62,545) (8,542) 307,905
NOTES TO THE FINANCIAL STATEMENTS

UpstreamDown-
streamConsumer
ServicesGas
MidstreamCorporate and other
Inter– segment transfers Total
2017 HUF million HUF million HUF million HUF million HUF million HUF million HUF million
Other segment infor-mation
–
Capital expenditure: 147,810 133,416 38,673 5,660 22,217 – 347,776
Property, plant and equipment
137,085 125,486 37,910 4,969 13,685 – 319,135
Intangible assets 10,725 8,438 763 691 8,024 – 28,641
Depreciation, deple-tion, amortisation and impairment
158,030 99,657 25,234 13,127 24,040 (1,872) 318,216
From this: impair-ment losses recog-nized in statement of profit or loss
26,244 2,164 1,175 150 4,171 (555) 33,349
From this: reversal of impairment recog-nized in statement of profit or loss
1,259 1,900 604 – 370 – 4,133
UpstreamDown-
streamConsumer
ServicesGas
MidstreamCorporate and other
Inter– segment transfers Total
2016 restated HUF million HUF million HUF million HUF million HUF million HUF million HUF million
Other segment infor-mation
Capital expenditure: 113,247 124,302 26,950 7,696 18,676 – 290,871
Property, plant and equipment
96,122 121,012 26,209 5,752 11,684 – 260,779
Intangible assets 17,125 3,290 741 1,944 6,992 – 30,092
Depreciation, deple-tion, amortisation and impairment
146,637 100,486 33,363 13,049 23,681 (1,733) 315,483
From this: impair-ment losses recog-nized in statement of profit or loss
14,815 6,841 7,621 84 6,062 (249) 35,174
From this: reversal of impairment recog-nized in statement of profit or loss
833 252 210 – 176 – 1,471
Introduction of Consumer services segment in 2017 does not impact the total revenue and profit figures as the 2016 activities were part of Downstream segment in which is restated in this Financial Statement.The operating profit of the segments includes the profit arising both from external sales and transfers to the other business segments. Corporate and other segment provide maintenance, financing and other services to the business segments. The internal transfer prices used are based on prevailing market prices. Divisional figures contain the results of the fully consolidated subsidi-aries engaged in the respective divisions.The differences between the capital expenditures presented above and the additions in the intangible and tangible movement schedule are due to the additions of emission rights, and non-cash items such as capitalization of field abandonment provisions, and assets received free of charge.
141
A) ASSETS BY GEOGRAPHICAL AREAS
Intangible assets
(Note 9)
Property, plant and equipment
(Note 9)
Investments in associates and joint ventures
(Note 6)2017 HUF million HUF million HUF million
Hungary 79,206 814,896 16,870
Croatia 50,162 610,808 –
Slovakia 6,992 452,225 2,996
Rest of EU 20,668 288,742 18,446
Rest of Europe 11,830 47,223 21,972
Rest of the World 12,593 47,272 146,090
Total 181,451 2,261,166 206,374
Intangible assets (Note 9)
Property, plant and equipment
(Note 9)
Investment in associated companies and joint ventures
(Note 6)2016 HUF million HUF million HUF million
Hungary 78,589 761,431 16,993
Croatia 48,215 660,466 –
Slovakia 6,316 461,874 2,412
Rest of EU 20,754 200,795 40,049
Rest of Europe 11,921 38,933 22,310
Rest of the World 17,766 69,920 175,326
Total 183,561 2,193,419 257,090
3. TOTAL OPERATING INCOME
ACCOUNTING POLICIES
Net salesRevenue is recognised when it is probable that the economic benefits associated with a transaction will flow to the enterprise and the amount of the revenue can be measured reliably. Sales are recognized net of sales taxes and discounts when delivery of goods or rendering of the service has taken place and transfer of risks and rewards has been completed. Having assessed the probability of receiving economic benefits from sales activities in Group’s operations in Kurdistan the management decided to recognise revenue on a cash basis on sales in Kurdistan Region of Iraq.Lease incomeThe recognition of interest revenue from lease transactions is based on a pattern reflecting a constant periodic rate of return on the Group’s net investment in the finance lease.Sales taxesRevenues, expenses and assets are recognised net of the amount of sales tax (e.g. excise duty), except:
when the sales tax incurred on a purchase of assets or services is not recoverable from the taxation authority (e.g. if the entity is not subject of sales tax), in which case, the sales tax is recognised as part of the cost of acquisition of the asset or as part of the expense item, as applicable
receivables and payables that are stated with the amount of sales tax includedThe net amount of sales tax recoverable from, or payable to, the taxation authority is included as part of receivables or payables in the consolidated statement of financial position.Other operating incomeOther operating income is recognized on the same accounting policy basis as the net sales.
NOTES TO THE FINANCIAL STATEMENTS

A) SALES BY PRODUCT LINES
2017 2016HUF million HUF million
Sales of crude oil and oil products 2,868,428 2,435,736
Sales of petrochemical products 679,838 578,109
Sales of natural gas and gas products 251,692 225,811
Sales of services 175,273 157,703
Sales of other products 155,089 155,646
Total 4,130,320 3,553,005
B) SALES BY GEOGRAPHICAL AREA
2017 2016HUF million HUF million
Hungary 1,065,673 960,933
Croatia 450,063 404,814
Slovakia 389,532 343,990
Czech Republic 375,113 320,540
Italy 342,887 281,488
Romania 265,448 226,355
Austria 229,660 213,124
Serbia 165,803 115,849
Poland 140,280 130,735
Germany 124,820 96,442
United Kingdom 117,194 49,222
Bosnia-Herzegovina 95,760 82,808
Switzerland 84,523 82,856
Slovenia 69,779 74,508
Rest of Central-Eastern Europe 30,207 21,212
Rest of Europe 83,716 84,845
Rest of the World 99,862 63,284
Total 4,130,320 3,553,005
The Group has no single major customer the revenue from which would exceed 10% of the total net sales revenues in 2017 (neither in 2016).
C) OTHER OPERATING INCOME
2017 2016HUF million HUF million
Penalties, late payment interest, compensation received 3,867 7,282
Gain on sales of intangibles, property, plant and equipment 2,682 3,387
Allowances and subsidies received 875 868
Other 18,119 13,779
Total 25,543 25,316
143
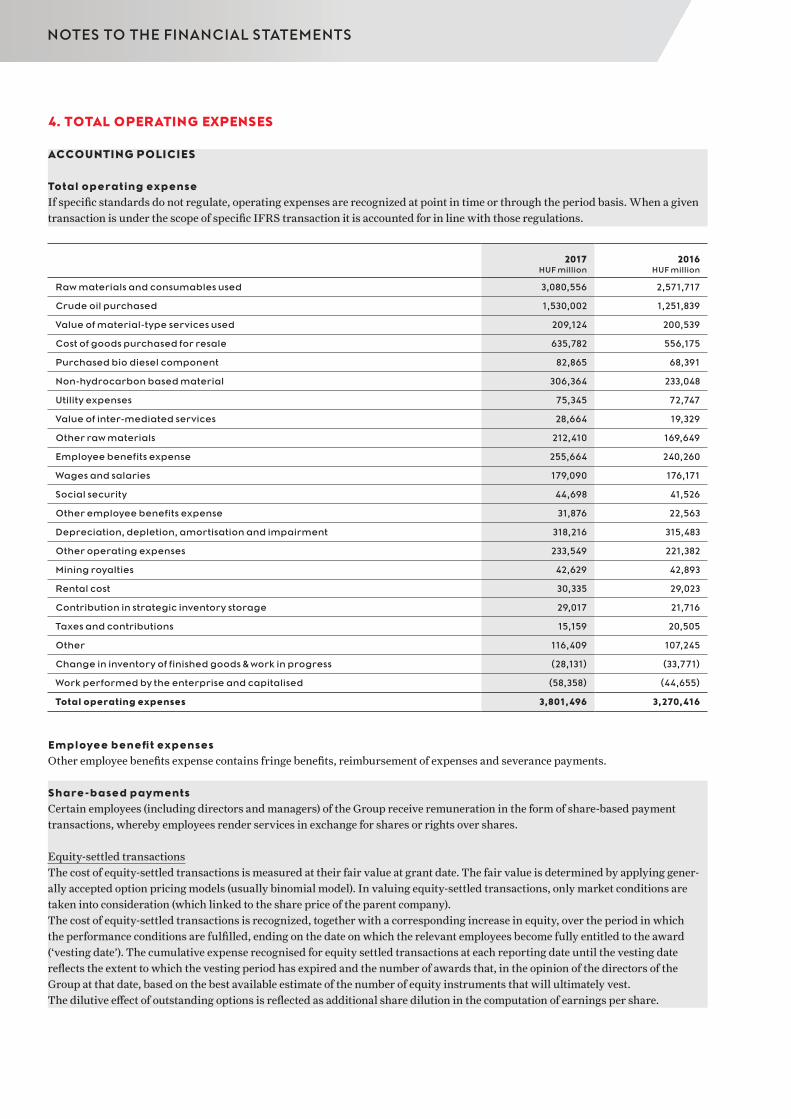
4. TOTAL OPERATING EXPENSES
ACCOUNTING POLICIES
Total operating expenseIf specific standards do not regulate, operating expenses are recognized at point in time or through the period basis. When a given transaction is under the scope of specific IFRS transaction it is accounted for in line with those regulations.
2017 2016HUF million HUF million
Raw materials and consumables used 3,080,556 2,571,717
Crude oil purchased 1,530,002 1,251,839
Value of material-type services used 209,124 200,539
Cost of goods purchased for resale 635,782 556,175
Purchased bio diesel component 82,865 68,391
Non-hydrocarbon based material 306,364 233,048
Utility expenses 75,345 72,747
Value of inter-mediated services 28,664 19,329
Other raw materials 212,410 169,649
Employee benefits expense 255,664 240,260
Wages and salaries 179,090 176,171
Social security 44,698 41,526
Other employee benefits expense 31,876 22,563
Depreciation, depletion, amortisation and impairment 318,216 315,483
Other operating expenses 233,549 221,382
Mining royalties 42,629 42,893
Rental cost 30,335 29,023
Contribution in strategic inventory storage 29,017 21,716
Taxes and contributions 15,159 20,505
Other 116,409 107,245
Change in inventory of finished goods & work in progress (28,131) (33,771)
Work performed by the enterprise and capitalised (58,358) (44,655)
Total operating expenses 3,801,496 3,270,416
Employee benefit expensesOther employee benefits expense contains fringe benefits, reimbursement of expenses and severance payments.
Share-based paymentsCertain employees (including directors and managers) of the Group receive remuneration in the form of share-based payment transactions, whereby employees render services in exchange for shares or rights over shares.
Equity-settled transactionsThe cost of equity-settled transactions is measured at their fair value at grant date. The fair value is determined by applying gener-ally accepted option pricing models (usually binomial model). In valuing equity-settled transactions, only market conditions are taken into consideration (which linked to the share price of the parent company).The cost of equity-settled transactions is recognized, together with a corresponding increase in equity, over the period in which the performance conditions are fulfilled, ending on the date on which the relevant employees become fully entitled to the award (‘vesting date’). The cumulative expense recognised for equity settled transactions at each reporting date until the vesting date reflects the extent to which the vesting period has expired and the number of awards that, in the opinion of the directors of the Group at that date, based on the best available estimate of the number of equity instruments that will ultimately vest.The dilutive effect of outstanding options is reflected as additional share dilution in the computation of earnings per share.
NOTES TO THE FINANCIAL STATEMENTS

Cash-settled transactionsThe cost of cash-settled transactions is measured initially at fair value at the grant date using the binomial model. This fair value is expensed over the vesting period with recognition of a corresponding liability. The liability is re-measured at each balance sheet date up to and including the settlement date to fair value with changes therein recognized in the statement of profit or loss.
2017 2016HUF million HUF million
Cash-settled share-based payment expense 5,172 4,096
Equity-settled share-based payment expense 1,686 460
Total expense of share-based payment transactions 6,858 4,556
The share-based payments serve as the management’s long-term incentives as an important part of their total remuneration package. They ensure the interest of the top and senior management of MOL Group in the long-term increase of MOL share price and so they serve the strategic interest of the shareholders.
CASH-SETTLED SHARE-BASED PAYMENTS
SHARE OPTION INCENTIVE SCHEMES FOR MANAGEMENT
The Share Option Plan is a call option to sell hypothetical MOL shares granted on a past strike price, at a spot price and so realize profit from the difference between these prices. The incentive has the following characteristics:
For incentive plan valid till 31 December 2016 it covers a five-year period starting annually, where periods are split into a two-year vesting period (it is not possible to exercise Share Options) and a three-year redeeming period. If unexercised, the Share Option lapses after 31 December of the redeeming period.
The grants are defined centrally in line with MOL job category. The payout is linked to individual short-term performance.
Share Option is calculated in Hungarian Forints and paid out in cash in local currency.The payment of incentive is upon exercising of option by management. The payout/earning is the difference between the exercise price and Strike Price for one Share Option, multiplied by the number of Share Options the manager is entitled to.As managerial remuneration package, the managers, who are entitled to long-term incentives are eligible for a one-time payout annually, in case the Annual General Meeting of MOL Plc. decides on dividend payment in the given year. Payment of one manager is the value equal to the dividend payment per share multiplied by the Share Option unit numbers the manager is entitled to.
2017 2016*
Number of shares in conversion
option units
Weighted average
exercise price
Number of shares in conversion
option units
Weighted average
exercise price number of share HUF/share number of share HUF/share
Outstanding at the beginning of the year 3,777,800 1,785 4,529,472 1,922
Granted during the year 380,160 2,016 1,302,784 1,643
Forfeited during the year (116,008) 1,799 (442,760) 1,779
Exercised during the year (1,435,976) 2,000 (1,585,712) 2,045
Expired during the year - - (25,984) 2,186
Outstanding at the end of the year 2,605,976 1,700 3,777,800 1,785
Exercisable at the end of the year 1,246,808 1,635 1,613,464 2,074
* Recalculated due to Mol Plc. one to eight share split in 2017 to enable comparability.
As required by IFRS 2 – Share-based payment, this share-based compensation is accounted for as cash-settled payments, expensing the fair value of the benefit as determined at vesting date during the vesting period. In 2017 expenses amount to HUF 2,074 million (2016: HUF 2,509 million). Liabilities in respect of share-based payment plans amount to HUF 4,013 million as at 31 December 2017 (31 December 2016: HUF 2,992 million), recorded in Other non-current liabilities and Other current liabilities.Fair value as of the statement of financial position date has been calculated using the binomial option pricing model.
145

2017 2016*
HUF million HUF million
Weighted average exercise price (HUF / share) 1,700 1,785
Share price as of 31 December (HUF / share) 3,005 2,579
Expected volatility based on historical data 22.05% 22.76%
Expected dividend yield 2.91% 3.03%
Estimated maturity (years) 2.30 2.60
Risk free interest rate 0.37% 0.86%
* Recalculated due to Mol Plc. one to eight share split in 2017 to enable comparability.
PERFORMANCE SHARE PLAN FOR MANAGEMENT
The Performance Share Plan is a three-year cash based programme using the Comparative Share Price methodology with following characteristics:
Programme starts each year on a rolling scheme with a three-year vesting period. Payments are due after the third year. Target is the development of MOL’s share price compared to relevant and acknowledged regional and industry specific indi-
cators (the CETOP and Dow Jones Emerging Market Titans Oil & Gas 30 Index). Basis of the evaluation is the average difference in MOL’s year-on-year (12 months) share price performance in comparison to
the benchmark indices during three years. Payout rates are defined based on the over / underperformance of MOL share price. The rate of incentive is influenced by the individual short-term performance.
Expenses arising from the Performance Share Plan program amount to HUF 3,098 million in 2017 (2016: HUF 1,587 million). Liabil-ities in respect of the Performance Share Plan program amount to HUF 3,174 million as at 31 December 2017 (31 December 2016: HUF 1,808 million) recorded in Other non-current liabilities and Other current liabilities.
EQUITY-SETTLED SHARE-BASED PAYMENTS
From 1 January 2017, the MOL Group established two new equity-settled share-based payment remuneration plans to supersede former cash-settled share-based payment programs in Hungary: Absolute Share Value Based Remuneration Incentive and Rela-tive Market Index Based Remuneration Incentive. MOL Group reserves the right to choose the method of payment either in form of providing of MOL shares or in cash payment and intention of the Group is settlement in shares.
ABSOLUTE SHARE VALUE BASED REMUNERATION INCENTIVE FOR MANAGEMENT
The Absolute Share Value Based Remuneration Plan is a call option to sell hypothetical MOL shares granted on a past strike price, at a spot price and so realize profit from the difference between these prices. The incentive has the following characteristics:
Covers a four-year period starting annually, where periods are split into a two-year vesting period (it is not possible to exer-cise Share Options) and a two-year redeeming period. If unexercised, the Share Option lapses after 31 December of the redeeming period.
The grants are defined centrally in line with MOL job category. The payout is linked to individual short-term performance. Payout is either in form of providing of MOL shares or in cash payment based on MOL Group decision.
Payment is upon exercising of option by management. The value of the incentive is the difference between the strike price and a selected spot price for each unit of the entitlement.In case the Annual General Meeting of MOL Plc. decides on dividend payment after the grant date, the managers, who are entitled to long-term incentives are eligible for a compensation in share equivalent when redeeming the share entitlement. Payment to one manager is the value equal to the dividend payment per share multiplied by the share unit numbers the manager is entitled to. This is paid at redemption.
2017Number of shares in
conversion option unitsWeighted average
exercise price number of share HUF/share
Outstanding at the beginning of the year – –
Granted during the year 2,575,064 2,352
Forfeited during the year (33,664) 2,352
Exercised during the year – –
Expired during the year – –
Outstanding at the end of the year 2,541,400 2,352
Exercisable at the end of the year – –
NOTES TO THE FINANCIAL STATEMENTS

As required by IFRS 2 – Share-based payment, this share-based compensation is accounted for as equity-settled, expensing the fair value of the benefit as determined at grant date during the vesting period. In 2017 expenses amount to HUF 976 million.
RELATIVE MARKET INDEX BASED REMUNERATION INCENTIVE FOR MANAGEMENT
The Relative Market Index Based Remuneration Plan is a three-year programme using the Comparative Share Price methodology with following characteristics:
Programme starts each year on a rolling scheme with a three-year vesting period. Payments are due after the third year. Target is the development of MOL’s share price compared to relevant and acknowledged regional and industry specific indi-
cators (the CETOP and Dow Jones Emerging Market Titans Oil & Gas 30 Index). Basis of the evaluation is the average difference in MOL’s year-on-year (12 months) share price performance in comparison to
the benchmark indices during three years. Payout rates are defined based on the over / underperformance of MOL share price. The rate of incentive is influenced by the individual short-term performance. Payout is either in form of providing of MOL shares or in cash payment based on MOL Group decision.
Expenses arising from the Relative Market Index Based Remuneration Plan amount to HUF 212 million in 2017.
SHARE INCENTIVE SCHEME FOR THE MEMBERS OF THE BOARD OF DIRECTORS
The members of the Board of Directors become entitled to defined annual amount of MOL shares based on the number of days spent in the position. 1200 shares per month are granted to each director, the Chairman of the Board is entitled to an additional amount of 400 shares per month. If an executive director is in charge as a Chairman of the Board then this additional amount of shares should be granted to the non-executive Deputy Chairman. The new incentive system ensures the interest of the Board of Directors in the long-term increase of the MOL share price as 2/3 of the shares vested in the year are under transferring restriction for one year.According to IFRS 2 – Share-based payment, the incentive qualifies as an equity-settled share-based scheme; therefore the fair value of the benefit should be expensed during the one year vesting period with a corresponding increase in the equity. The fair value of the benefit has been determined with reference to the average quoted price of MOL shares at the date of grant, which is the first trading day of the year. In 2017 with respect of the share scheme program, HUF 498 million (2016: HUF 460 million) is recorded as an expense, parallel with the corresponding increase in the equity.
2017 2016*
Number of shares vested 148,800 148,800
Share price at the date of grant (HUF / share) 2,598 1,756
* Recalculated due to Mol Plc. one to eight share split in 2017 to enable comparability.
5. FINANCE RESULT
ACCOUNTING POLICIES
Foreign exchange gains and losses are aggregated separately on a monthly basis for transactions similar in nature. Foreign exchange gains or losses of each transaction groups are aggregated and presented in the statement of profit or loss within finance income and expense. Non-foreign exchange type items are presented based on their balances.
2017 2016Finance result HUF million HUF million
Interest income 4,063 3,440
Dividend income 6,693 6,095
Foreign exchange gains 48,164 38,997
Other finance income 3,176 970
Total finance income 62,096 49,502
Interest expense 24,629 35,530
Unwinding of discount on provisions 6,786 8,699
Foreign exchange losses 31,132 39,369
Other finance expense 6,222 15,656
Total finance expense 68,769 99,254
Net finance expense 6,673 49,752
147

6. INVESTMENTS IN ASSOCIATES AND JOINT VENTURES
ACCOUNTING POLICIES
Statement of financial positionAn associate is an entity over which the Group has significant influence and which is neither a subsidiary nor a joint venture. An arrangement is under joint control when the decisions about its relevant activities require the unanimous consent of the parties sharing the control of the arrangements. Joint arrangements can be joint operation and joint venture. The type of the arrangement should be determined by considering the rights and obligations of the parties arising from the arrangement in the normal course of business. Joint ventures are joint arrangements in which the parties that share control have rights to the net assets of the arrangement.The Group’s investments in its associates and joint ventures are accounted for using the equity method of accounting. Under the equity method, the investment in the associate is carried at cost plus post acquisition changes in the Group’s share of net assets. Goodwill relating to an undertaking is included in the carrying amount of the investment and is not amortised. Investments in associates and joint ventures are assessed to determine whether there is any objective evidence of impairment. If there is evidence of impairment the recoverable amount of the investment is determined to identify any impairment loss to be recog-nised. Where losses were made in previous years, an assessment of the factors is made to determine if any loss may be reversed Statement of profit or lossThe statement of profit or loss reflects the share of the results of operations of the associate and joint ventures. Profits and losses resulting from transactions between the Group and the equity accounted undertakings are eliminated to the extent of the interest in the undertaking.Impairment losses on associates and joint ventures for the period is recognised as a reduction on Share of after tax results of associ-ates and joint ventures line in the Statement of profit or loss.
Owner-ship
Contribution to net income
Net book value of investments
2017 2017 2016 2017 2016Company name Country Range of activity HUF million HUF million HUF million HUF million
Investment in joint ventures
BaiTex Llc / MK Oil and Gas B.V.
Russia / Netherlands
Exploration and production activity / Exploration invest-ment management
51% 1,501 1,727 18,446 30,565
JSR MOL Synthetic Rubber Zrt.
HungaryProduction of synthetic rubber
49% (430) (358) 12,269 12,735
CM European Power International B.V.
NetherlandsPower plant invest-ment management
50% – 9,484 – 9,484
Rossi Biofuel Zrt. HungaryBiofuel component production
25% 478 863 3,162 2,691
Dunai Vízmű Zrt. HungaryWater production, supply
33% – – 1,400 1,400
Investment in associated companies
Pearl Petroleum Ltd.Kurdistan region / Iraq
Exploration of gas 10% 15,270 – 129,720 156,064
MET Holding AG. (MET) Switzerland Natural gas trading 40% 1,618 2,489 21,972 22,310
Ural Group Limited (Expl)
KazakhstanExploration and production activity
28% (698) (190) 16,371 19,262
Meroco a.s. SlovakiaProduction of bio-diesel component (FAME)
25% 262 316 1,083 1,074
Messer Slovnaft s.r.o SlovakiaProduction of technical gases
49% 71 59 731 720
DAC ARENA a.s. SlovakiaFacility management
23% – – 1,181 618
IN-ER Erőmű Kft. HungaryPower plant invest-ment management
30% (128) – 39 167
Total 17,944 14,390 206,374 257,090
NOTES TO THE FINANCIAL STATEMENTS

Joint venturesMK Oil and Gas B.V.Through a 100% owned holding company (MH Oil and Gas B.V.), MOL Group has 51% ownership in MK Oil and Gas B.V. being the sole owner of Baitex Llc., where the activities are carried out through a concession agreement on Baitugan and Yerilkinksy blocks. JSR MOL Synthetic Rubber Zrt.Leodium Investment Kft., a 100% subsidiary of MOL Plc. owns 49% shares of JSR MOL Synthetic Rubber Zrt. The company is governed and treated as a joint venture and is consolidated using the equity method accordingly.CM European Power International B.V.CM European Power International B.V. was governed and treated as a joint venture and was consolidated using the equity method accordingly. In 2016, disposal of investment in CM European Power Slovakia s.r.o was made resulted one-off income from the entity. In 2017, CM European Power International B.V. has been terminated.
BaiTex Llc / MK Oil and Gas B.V. JSR MOL Synthetic Rubber Zrt.
2017 2016 2017 2016 HUF million HUF million HUF million HUF million
The joint venture’s statement of financial position:
Non-current assets 58,020 54,151 60,666 38,431
Current assets 2,485 3,398 27,893 31,892
Non-current liabilities 29,366 5,873 62,027 34,212
Current liabilities 8,030 7,777 1,493 10,121
Net assets 23,109 43,899 25,039 25,990
Proportion of the Group's ownership at year end 51% 51% 49% 49%
Group's share of assets 11,786 22,389 12,269 12,735
Fair value adjustment 6,660 8,176 – –
Borrowing cost capitalization – – – –
Carrying amount of the investment 18,446 30,565 12,269 12,735
The joint venture’s statement of profit or loss:
Net revenue 52,775 39,145 – –
(Loss) / Profit from operations 9,469 8,655 (975) (663)
Net income attributable to equity holders 4,455 7,253 (878) (731)
Group's share of reported profit for the year 2,272 3,699 (430) (358)
Fair value adjustment P&L impact (1,070) (874) – –
Borrowing cost capitalization P&L impact – (328) – –
Inventory consolidation P&L impact 299 (807) – –
Interest difference – 37 – –
Group's share of profit/loss for the year after consolidation
1,501 1,727 (430) (358)
JSR MOL Synthetic Rubber Zrt. current assets contain mainly cash and cash equivalents while non-current liabilities represents long-term loan.
AssociatesPearl Petroleum Company LimitedMOL Group owns 10% stake in Pearl Petroleum Company Limited (Pearl) which holds all of the companies’ legal rights in Khor Mor and Chemchemal gas-condensate fields in the Kurdistan Region of Iraq. Since the agreement between the shareholders grants MOL Group a significant influence on Pearl’s operations, the company is treated as an associated company and is consolidated using the equity method accordingly.MET Holding AG.MOL Group has 40% ownership in MET Holding AG. The group is accounted for as an associated company and is consolidated using the equity method accordingly. MET Group's current set of commodities include natural gas, power, oil and oil products, with commercial activity focused on sales, wholesale, trading and capacity trading. In 2017 dividend received on Group’s 40% interest held in MET is HUF 1,251 million (2016: HUF 622 million).
149

Ural Group LimitedMOL Group has 27.5% of shareholding interest in Ural Group Ltd through MOL (FED) Kazakhstan B.V, a holding company. Ural Group Limited is 100% owner of Ural Oil and Gas LLP having license of exploring Fedorovsky block in Kazakhstan. MOL Group has significant influence over the relevant activities of Ural Group Limited therefore the investment is classified as an associate.
Pearl Petroleum MET Holding AG.Ural Group Limited
(Expl)
2017 2016 2017 2016 2017 2016HUF million HUF million HUF million HUF million HUF million HUF million
The associate’s statement of financial position:
Non-current assets 496,770 193,167 13,144 11,006 66,132 74,725
Current assets 130,516 688,727 339,213 217,326 1,235 1,864
Non-current liabilities 331 310 3,560 3,081 3,461 1,428
Current liabilities 26,806 40,391 293,866 169,476 4,376 5,116
Net assets 600,149 841,193 54,931 55,775 59,530 70,045
Proportion of the Group's ownership at year end 10% 10% 40% 40% 28% 28%
Group's share of assets 60,015 84,119 21,972 22,310 16,371 19,262
Fair value adjustment 73,033 82,873 – – – –
Movements on impairment 8,856 (10,928) – – – –
Dividend received over impairment (12,184) – – – – –
Carrying amount of the investment 129,720 156,064 21,972 22,310 16,371 19,262
The associate’s statement of profit or loss:
Net revenue 76,626 62,749 2,345,689 1,481,481 – –
(Loss) / Profit from operations (25,375) 66,036 8,851 16,626 (1,127) (653)
Net income attributable to equity holders 64,136 109,282 4,045 6,223 (2,537) (690)
Group's share of reported profit for the year 6,414 10,928 1,618 2,489 (698) (190)
Movements on impairment 8,856 (10,928) – – – –
Group's share of consolidated profit for the year 15,270 - 1,618 2,489 (698) (190)
Given the current economic situation impacting the Group’s associate in the Kurdistan Region of Iraq HUF 10,928 million provision has been made in 2016 on Group’s share of profit of Pearl Petroleum which has been reversed in 2017 in line with cash distribution received from the entity. In 2017, further HUF 1,608 million impairment has been recorded.
7. INCOME TAXES
ACCOUNTING POLICIES
Income tax is recognised in the statement of profit or loss, except to the extent that it relates to items recognised in other comprehen-sive income or directly in equity, in which case the related tax is recognised in other comprehensive income or directly in equity.The current income tax is based on taxable profit for the year. Taxable profit differs from accounting profit because of temporary differences between accounting and tax treatments and due to items that are never taxable or deductible or are taxable or deductible in other years. Full provision for deferred tax is made the temporary differences between the carrying value of assets and liabilities for financial reporting purposes and their value for tax purposes using the balance sheet liability method. Deferred tax is calculated using tax rates that have been enacted or substantively enacted by the end of the reporting year and are expected to apply to taxable income in the years in which those temporary differences are expected to be recovered or settled.Deferred tax assets are recognised where it is more likely than not that the assets will be realised in the future. At each balance sheet date, the Company re-assesses unrecognised deferred tax assets and the carrying amount of deferred tax assets. No deferred tax liability is provided in respect of any future remittance of earnings of foreign subsidiaries where the group is able to control the remittance of earnings and it is probable that such earnings will not be remitted in the foreseeable future, or where no liability would arise on the remittance.Deferred tax assets and liabilities are offset when there is a legally enforceable right to set off current tax assets against current tax liabilities which relate to income taxes imposed by the same taxation authority and the Group intends to settle its current tax assets and liabilities on a net basis.
NOTES TO THE FINANCIAL STATEMENTS

SIGNIFICANT ACCOUNTING ESTIMATES AND JUDGEMENTS
Corporate tax is required to be estimated in each tax jurisdiction in which MOL Group operates. The recognition of tax benefits and assessment of provisions against tax benefits requires management judgement. The actual tax liability may differ from the provi-sion and adjustment in subsequent period could have a material effect on the Group’s profit for the year. The evaluation of deferred tax assets recoverability requires judgements regarding the likely timing and the availability of future taxable income.
A) ANALYSIS OF TAXATION CHARGE FOR THE YEAR
Total applicable income taxes reported in the consolidated financial statements for the years ended 31 December 2017 and 2016 include the following components:
2017 2016HUF million HUF million
Current corporate income tax and industry taxes (26,661) (34,931)
Local trade tax and innovation fee (14,894) (13,651)
Deferred taxes (7,673) 27,694
Total income tax (expense) / benefit (49,228) (20,888)
B) CURRENT INCOME TAXES
The Group’s current income taxes are determined on the basis of taxable statutory profit of the individual companies of the Group.Industry taxes include tax on energy supply activities in Hungary with an effective tax rate of 21% on taxable statutory profit of MOL Plc. and oil and gas companies in Norway where tax rates consist of corporate income tax of 24% (2016: 25%) and resource rent tax of 54% (2016: 53%) both payable on net operating profits derived from extractive activities. Upstream companies in Norway are refunded for the tax loss of exploration activities incurred for the year. Local trade tax represents an income based tax for Hungarian entities, payable to local municipalities. Tax base is calculated by deducting material costs, cost of goods sold and remediated services from sales revenue. Tax rates vary between 1-2% dependent on the regulation of local governments where the entities carry on business activities.
Change in tax ratesThe following changes in corporate income tax rates effective from 1 January 2018 are taken into account in deferred tax calculation:
change in corporate income tax and resource rent tax in Norway to 23% and to 55% respectively (2017: 24% and 54% respectively) change in Pakistan to 30% (2017: 31%)
Enacted and substantively enacted changes in tax rates are considered when calculating deferred tax assets and liabilities.
The below listed changes were applicable from 2017: change in Hungary to 9% (2016: 10% below HUF 500 million tax base and 19% above) change in Slovakia to 21% (2016: 22%) change in Croatia to 18% (2016: 20%) change in United Kingdom to 19% (2016: 20%)
C) DEFERRED TAX ASSETS AND LIABILITIES
The deferred tax balances as of 31 December 2017 and 2016 in the consolidated statement of financial position consist of the following items by categories:
31 Dec 2017 31 Dec 2016HUF million HUF million
Provisions 88,330 110,759
Statutory tax losses carried forward 80,848 52,414
Deferred tax impact on IFRS transition 27,341 40,516
Property, plant and equipment and intangible assets (133,285) (77,349)
Elimination of intragroup transactions (40,273) (72,590)
Other temporary differences (1) 47,604 23,540
Net deferred tax asset 70,565 77,289
of which:
Total deferred tax assets 120,633 125,055
Total deferred tax liabilities (50,068) (47,766)
(1) Deferred tax on other temporary differences includes items such as receivables write-off, inventory valuation differences, valuation of financial instruments and foreign exchange differences.
151

As of 31 December 2017 deferred tax assets of HUF 120,633 million consist of deferred tax on tax losses carried forward of HUF 27,144 million and HUF 14,576 million at MOL Plc. and INA Group, respectively. Besides, amount of HUF 20,386 million at MOL Plc. relates to timing differences of provisions net of intragroup transactions. As of 31 December 2017 deferred tax liabilities of HUF 50,068 million include temporary differences on intangible and tangible assets at FGSZ Zrt. (HUF 16,915 million) and Slovnaft a.s. (HUF 35,158 million). In case of Slovnaft a.s. deferred tax assets and liabilities are offset, decreasing the deferred tax liability by HUF 16,648 million arising mainly from differences in provisions.
Analysis of movements during the year in the net deferred tax asset:
2017 2016HUF million HUF million
Net deferred tax asset as at 1 January 77,289 49,048
Recognized in statement of profit or loss (7,673) 27,694
Recognized directly in equity (as other comprehensive income) (1,532) 437
Acquisition of business 474 (293)
Sale of business – (102)
Exchange difference 2,007 505
Net deferred tax asset as at 31 December 70,565 77,289
The amount recognised in statement of profit or loss as an expense is mainly driven by changes related to MOL Plc. (HUF 4,731 million).
D) RECONCILIATION OF TAXATION RATE
A numerical reconciliation between tax expense and the product of accounting profit multiplied by the applicable tax rates is as follows:
2017 2016HUF million HUF million
Profit before tax per consolidated statement of profit or loss 365,638 272,543
Less: share of profit of joint ventures and associates (17,944) (14,390)
Income before taxation and share of profit of joint ventures and associates 347,694 258,153
Tax expense at the applicable tax rate (2017: 9%, 2016: 10%, 19%) (31,292) (49,049)
Deferred tax impact of IFRS transition – 61,471
Effect of change in tax rates on deferred taxes 365 18,048
Non-taxable income 6,693 6,095
Tax allowance available 387 6,026
Permanent differences (tax value – IFRS value) (5,269) (23,943)
Losses not recognized as deferred tax asset (13,744) (21,043)
Other tax expenses (local trade tax, industry tax) (12,667) (9,125)
Differences in tax rates at subsidiaries (8,553) (9,160)
Recognition of prior year tax losses carried forward 14,506 142
Effect of tax audits 346 (350)
Total income tax expense for the year (49,228) (20,888)
Effective tax rate 13% 8%
The table above provides a reconciliation of the Hungarian corporate tax charge to the actual consolidated tax charge. As the group operating in multiple countries, the actual tax rates applicable to profits in those countries are different from the Hungarian tax rate. The impact is shown in the table above as differences in tax rates.
NOTES TO THE FINANCIAL STATEMENTS

E) INCOME TAX RECOGNIZED IN OTHER COMPREHENSIVE INCOME
The amount of income tax relating to each component of other comprehensive income:
2017 2016HUF million HUF million
Net gain on hedge of a net investment and foreign exchange differences of loans given (1,804) 891
Revaluations of available-for-sale financial assets 56 (491)
Revaluations of financial instruments treated as cash flow hedges 227 (8)
Equity recorded for actuarial gain/(loss) on provision for retirement benefit obligation (11) 45
Total income tax recognized in other comprehensive income (1,532) 437
F) UNRECOGNISED DEFERRED TAX ASSETS
HUF 108,078 million deferred tax assets have not been recognized in respect of tax losses out of the total. Further, HUF 54,705 million deferred tax asset also have not been recognized on temporary differences in the Group due to uncertainty of realization. Out of tax losses on which no deferred tax assets recognized, HUF 89,268 million has no expiry, HUF 16,954 million has expiry within five years and HUF 1,856 million will expire after five years.
8. COMPONENTS OF OTHER COMPREHENSIVE INCOME
2017 2016HUF million HUF million
Exchange differences on translating foreign operations, net of tax
Gains / (losses) arising during the year (18,010) (25,580)
Recycling reserves from OCI to profit or loss due to removal of balance sheet items 4,168 11,610
Income tax effect – –
(13,842) (13,970)
Net investment hedge, net of tax
Gains / (losses) arising during the year 23,168 (6,052)
Recycling reserves from OCI to profit or loss due to removal of balance sheet items – –
Income tax effect (1,804) 891
21,364 (5,161)
Changes in fair value of available–for–sale financial assets, net of tax
Gains / (losses) arising during the year (307) 4,181
Recycling reserves from OCI to profit or loss due to removal of balance sheet items – –
Income tax effect 56 (491)
(251) 3,690
Changes in fair value of cash flow hedges, net of tax
Gains / (losses) arising during the year 17 (325)
Recycling reserves from OCI to profit or loss due to removal of balance sheet items – (9,221)
Reclassification adjustments to initial cost of hedged inventories 5 10,343
Income tax effect 227 (8)
249 789
Remeasurement of post employment benefit obligations
Gains / (losses) arising during the year (1,194) 794
Recycling reserves from OCI to profit or loss due to removal of balance sheet items – –
Income tax effect (11) 45
(1,205) 839
Share of other comprehensive income of associates and joint ventures
Gains / (losses) arising during the year (13,228) 7,849
Recycling reserves from OCI to profit or loss due to removal of balance sheet items (341) –
Income tax effect – –
(13,569) 7,849
153

NON-FINANCIAL ASSETS AND LIABILITIES
This section describes those non-financial
assets that are used and liabilities incurred
to generate the Group’s performance.
This section also provides detailed disclo-
sures on the significant exploration and
evaluation related matters as well as the
Group’s recent acquisitions and disposals.
9. PROPERTY, PLANTS AND EQUIPMENT AND INTANGIBLE ASSETS
A) PROPERTY, PLANTS AND EQUIPMENT
ACCOUNTING POLICIES
Property, plant and equipment are stated at cost (or the carrying value of the assets determined as of 1 October 1991) less accumu-lated depreciation, depletion and accumulated impairment loss. The initial cost of property, plant and equipment comprises its purchase price, including import duties and non-refundable purchase taxes and any directly attributable costs of bringing the asset to its working condition and location for its intended use, such as borrowing costs. Estimated field abandonment and site restoration costs are capitalized upon initial recognition or, if deci-sion on field abandonment is made subsequently, at the time of the decision. Expenditures incurred after the property, plant and equipment have been put into operation are charged to statement of profit or loss in the period in which the costs are incurred, except for periodic maintenance costs which are capitalized as a separate component of the related assets.Construction in progress represents plant and properties under construction and is stated at cost without being depreciated. Construction in progress is reviewed for impairment annually.
Land and buildings
Machinery and equipment
Other machinery and
equipmentConstruction in
progress TotalHUF million HUF million HUF million HUF million HUF million
At 1 Jan 2016
Gross book value 3,079,941 2,324,814 169,969 382,334 5,957,058
Accumulated depreciation and impairment
(1,779,341) (1,754,695) (133,610) (85,041) (3,752,687)
Net book value 1,300,600 570,119 36,359 297,293 2,204,371
Year ended 31 Dec 2016
Additions and capitalizations 122,742 173,707 10,669 (45,225) 261,893
Acquisition of subsidiaries 21,968 619 490 203 23,280
Depreciation for the year (151,762) (107,826) (10,119) – (269,707)
Impairment (5,253) (8,900) (188) (6,021) (20,362)
Reversal of impairment 966 323 32 3 1,324
Disposals (2,368) (1,614) (554) (1,033) (5,569)
Disposal of subsidiaries (2,219) (9,068) (23) (1,899) (13,209)
Exchange adjustment (2,366) (3,471) 509 (7,115) (12,443)
Transfers and other movements 25,358 164 (160) (1,521) 23,841
Closing net book value 1,307,666 614,053 37,015 234,685 2,193,419
NOTES TO THE FINANCIAL STATEMENTS

Land and buildings
Machinery and equipment
Other machinery and
equipmentConstruction in
progress TotalHUF million HUF million HUF million HUF million HUF million
At 31 Dec 2016
Gross book value 3,226,680 2,350,377 174,155 314,202 6,065,414
Accumulated depreciation and impairment
(1,919,014) (1,736,324) (137,140) (79,517) (3,871,995)
Net book value 1,307,666 614,053 37,015 234,685 2,193,419
Year ended 31 Dec 2017
Additions and capitalizations 108,115 237,891 21,810 (16,135) 351,681
Acquisition of subsidiaries 3,223 930 460 171 4,784
Depreciation for the year (158,705) (107,193) (11,124) – (277,022)
Impairment (5,628) (5,704) (381) (8,043) (19,756)
Reversal of impairment 1,405 865 1,711 68 4,049
Disposals (3,655) 28 (3,322) (47) (6,996)
Disposal of subsidiaries – – – – –
Exchange adjustment 2,432 (7,864) (33) (206) (5,671)
Transfers and other movements 8,357 11,814 3,029 (6,522) 16,678
Closing net book value 1,263,210 744,820 49,165 203,971 2,261,166
At 31 Dec 2017
Gross book value 3,354,726 2,479,511 199,530 265,511 6,299,278
Accumulated depreciation and impairment
(2,091,516) (1,734,691) (150,365) (61,540) (4,038,112)
Net book value 1,263,210 744,820 49,165 203,971 2,261,166
Asset acquisitionsIn 2017, MOL Group made one significant asset acquisition transaction through terminating the Joint Operation Agreement with Hungarian Horizon Energy Ltd. (HHE). With the termination MOL Group acquired the remaining 50% right to assets from HHE for HUF 5,752 million. The Group has not performed any significant asset acquisitions in 2016.
Leased assetsACCOUNTING POLICES
If fulfilment of an arrangement depends on the use of a specific asset or conveys the right to use the asset, it is deemed to contain a lease element and is recorded accordingly. Finance leases are capitalized at the inception of the lease at the fair value of the leased property or, if lower, at the present value of the minimum lease payments. Initial direct costs incurred are added to or deducted from the fair value. Lease payments are apportioned between the finance charges and reduction of the lease liability. Finance charges are charged directly against finance expense.Operating lease payments are recognized as an expense in the statement of profit or loss on a straight-line basis over the lease term.
Property, plant and equipment include machinery acquired under finance leases:
31 Dec 2017 31 Dec 2016HUF million HUF million
Gross book value 76,543 7,174
Accumulated depreciation (1,032) (3,965)
Net book value 75,511 3,209
Out of the gross book value of leased assets as of 31 December 2017 HUF 63,643 million is related to lease of Floating Production and Offloading vessel that is used at North Sea.
155

Borrowing costsACCOUNTING POLICIES
Borrowing costs (including interest charges and other costs incurred in connection with the borrowing of funds, including exchange differences arising from foreign currency borrowings) directly attributable to the acquisition, construction or produc-tion of qualified assets are capitalized until these assets are substantially ready for their intended use or sale. All other costs of borrowing are expensed in the period in which they are incurred. Property, plant and equipment include borrowing costs incurred in connection with the construction of qualifying assets. Addi-tions to the gross book value of property, plant and equipment include borrowing costs of HUF 433 million in 2017 (2016: HUF 818 million). In 2017 the applicable capitalisation rate (including the impact of foreign exchange differences) has been 0.9% (2016: 1.9%).
Government grantsACCOUNTING POLICIES
Government grants are recognized at their fair value where there is reasonable assurance that the grant will be received and all attaching conditions will be complied with. Where the grant relates to an asset, the fair value is credited to a deferred income account and is released to the statement of profit or loss over the expected useful life of the relevant asset.In 2017 property, plant and equipment includes assets with a value of HUF 10,562 million (2016: HUF 11,182 million) financed from government grants. The total amount reflects mainly the assets of FGSZ Zrt. partly financed via a European Union grant for the construction of the Hungarian-Romanian and the Hungarian-Croatian natural gas interconnector and transformation of nodes, and the assets of Slovnaft a.s. financed by the grant received from Slovakian government in order to serve State Authorities in case of state emergencies.
31 Dec 2017 31 Dec 2016HUF million HUF million
At 1 January 11,182 12,477
Asset related government grants received 497 173
Release of deferred grants (1,105) (1,440)
Foreign exchange differences (12) (28)
At 31 December (see Note 17 and 18) 10,562 11,182
B) INTANGIBLE ASSETS
ACCOUNTING POLICIES
An intangible asset is recognised initially at cost. For intangible assets acquired in a business combination, the cost is the fair value at the acquisition date. Following initial recognition, intangible assets, other than goodwill are stated at the amount initially recognized, less accumulated amortization and accumulated impairment losses.Intangible assets, excluding development costs, created within the business are not capitalized. Development costs are capitalized if the recognition criteria according to IAS 38 are fulfilled. Costs in development stage can be not amortized. The carrying value of development costs is reviewed for impairment annually when the asset is not yet in use or more frequently when an indicator of impairment arises during the reporting year indicating that the carrying value may not be recoverable.Free granted quotas are not recorded in the financial statements, while purchased quotas are initially recognised as intangible assets at cost at the emitting segments subsequently remeasured to fair value through profit or loss.
Rights Software
Exploration and evaluation
assets Goodwill TotalHUF million HUF million HUF million HUF million HUF million
At 1 Jan 2016
Gross book value 147,600 48,592 188,762 89,146 474,100
Accumulated amortization and impairment
(97,432) (37,847) (77,390) (52,059) (264,728)
Net book value 50,168 10,745 111,372 37,087 209,372
Year ended 31 Dec 2016
NOTES TO THE FINANCIAL STATEMENTS

Rights Software
Exploration and evaluation
assets Goodwill TotalHUF million HUF million HUF million HUF million HUF million
Additions 15,531 5,811 16,838 – 38,180
Acquisition of subsidiary 2,432 70 (4) 4,282 6,780
Amortization for the year (8,055) (2,946) (1,072) – (12,073)
Write-offs (3,743) (31) (11,038) – (14,812)
Reversal of impairment – – 147 – 147
Disposals (8,164) (7) – – (8,171)
Revaluation of emission quotas (1,763) – – – (1,763)
Disposal of subsidiaries (179) – (2,580) – (2,759)
Exchange adjustment (1,240) 47 1,435 (77) 165
Transfers and other movements 2,161 (1,309) (32,357) – (31,505)
Closing net book value 47,148 12,380 82,741 41,292 183,561
At 31 Dec 2016
Gross book value 151,222 54,770 179,477 92,713 478,182
Accumulated amortization and impairment
(104,074) (42,390) (96,736) (51,421) (294,621)
Net book value 47,148 12,380 82,741 41,292 183,561
Year ended 31 Dec 2017
Additions 7,748 9,170 10,886 708 28,512
Acquisition of subsidiary 48 285 111 – 444
Amortization for the year (7,114) (3,813) (1,169) – (12,096)
Write-offs (1) (76) (13,414) (75) (13,566)
Reversal of impairment 93 – 82 – 175
Disposals (10,839) – – – (10,839)
Revaluation of emission quotas (3,281) – – – (3,281)
Disposal of subsidiaries – – (2) – (2)
Exchange adjustment (6) 66 (3,358) 404 (2,894)
Transfers and other movements 13,102 (1,172) (1,747) 1,254 11,437
Closing net book value 46,898 16,840 74,130 43,583 181,451
At 31 Dec 2017
Gross book value 146,821 62,162 155,953 95,576 460,512
Accumulated amortization and impairment
(99,923) (45,322) (81,823) (51,993) (279,061)
Net book value 46,898 16,840 74,130 43,583 181,451
In 2017, MOL Group started its so-called Polyol Project with which it intends to become a significant producer of polyether polyols, high-value intermediates for products applied in the automotive, packaging and furniture industry. Under the project a new polyol plant will be constructed .License agreements are already signed with Evonik and thyssenkrupp, which will enable MOL Group to produce propylene oxide, a key component for the production of polyether polyols and licenses are recorded as intangible assets.
GoodwillACCOUNTING POLICIES
Goodwill acquired in a business combination is initially measured at difference between the consideration transferred and the Group’s interest in the net fair value of the acquiree’s identifiable assets, liabilities and contingent liabilities. Following initial recognition, goodwill is measured at cost less any accumulated impairment losses. For the purpose of impairment testing, goodwill acquired in a business combination is, from the acquisition date, allocated to each of the Group’s cash generating units, or groups of cash generating units, that are expected to benefit from the synergies of the combination, irrespective of whether other assets or liabilities of the Group are assigned to those units or groups of units.
157

Goodwill acquired in a business combination is allocated, at acquisition, to the cash generating units (CGUs) that are expected to benefit from that business combination. Before recognition of impairment losses, the carrying amount of goodwill has been allo-cated as follows:
31 Dec 2017 31 Dec 2016Goodwill (net book value) HUF million HUF million
Consumer services 33,164 30,873
Croatian retail network 15,473 15,302
Hungarian retail network 6,165 4,282
Czech retail network 7,155 6,789
Romanian retail network 4,371 4,500
Downstream 8,370 8,392
Austrian wholesale and logistic 7,893 7,915
MOL Petrochemicals 477 477
Corporate 2,049 2,027
Croatian oil field services 2,049 2,027
Total goodwill 43,583 41,292
Oil and natural gas exploration and development expendituresACCOUNTING POLICIES
Oil and natural gas exploration and development expenditure is accounted for using the successful efforts method of accounting. License and property acquisition costs Costs of exploration and property rights are capitalized as intangible assets and amortized on a straight-line basis over the esti-mated period of exploration. Each property is reviewed on an annual basis to confirm that drilling activity is planned and it is not impaired. If no future activity is planned, the remaining balance of the licence and property acquisition costs is written off. Upon recognition of proved reserves (‘proved reserves’ or ‘commercial reserves’) and internal approval for development, the relevant expenditure is transferred to property, plant and equipment.Exploration expenditure Geological and geophysical exploration costs are charged against income as incurred. Costs directly associated with an explora-tion well are capitalized as an intangible asset until the drilling of the well is complete and the results have been evaluated. These costs include employee remuneration, materials and fuel used, rig costs, delay rentals and payments made to contractors. If hydro-carbons are not found, the exploration expenditure is written off as a dry hole. If hydrocarbons are found and, subject to further appraisal activity, which may include the drilling of further wells (exploration or exploratory-type stratigraphic test wells), are likely to be capable of commercial development, the costs continue to be carried as an asset. All such carried costs are subject to technical, commercial and management review at least once a year to confirm the continued intent to develop or otherwise extract value from the discovery. When this is no longer the case, the costs are written off. When proved reserves of oil and natural gas are determined and development is sanctioned, the relevant expenditure is transferred to property, plant and equipment. Development expenditure Expenditure on the construction, installation or completion of infrastructure facilities such as platforms and the drilling of devel-opment wells, including unsuccessful development or delineation wells, is capitalized within property, plant and equipment.
SIGNIFICANT ACCOUNTING ESTIMATES AND JUDGEMENTS
Application of Successful Efforts method of accounting for exploration and evaluation assets Management uses judgement when capitalized exploration and evaluation assets are reviewed to determine capability and contin-uing intent of further development. Exploration and evaluation assetsTransfers from exploration and evaluation assets represent expenditures which, upon determination of proved reserves of oil and natural gas are reclassified to property, plant and equipment.Within exploration and evaluation assets, exploration expenses incurred in 2017 is HUF 4,684 million (2016: HUF 4,202 million), which were not eligible for capitalization. Consistent with the successful effort method of accounting they were charged to various operating cost captions of the consolidated statement of profit or loss as incurred.Other research and development costs are less significant compared to exploration expenses. These research and development costs are HUF 892 million in 2017 (2016: HUF 1,132 million).
NOTES TO THE FINANCIAL STATEMENTS

Write-offs of dry holes
2017 2016Dry-holes HUF million HUF million
Hungary 2,685 4,310
Norway 449 1,311
Oman – 5,149
UK – 162
Croatia – 106
Total 3,134 11,038
G) DEPRECIATION, DEPLETION AND AMORTIZATION
ACCOUNTING POLICIES
Depreciation of assets begin when the relevant asset is available for use. Depreciation of each component of an intangible asset and property, plant and equipment, except for given Upstream assets, is computed on a straight-line basis over their respective useful lives. Usual periods of useful lives for different types of property, plant and equipment are as follows:
Software: 3 – 5 years Buildings: 10 – 50 years Refineries and chemicals manufacturing plants:
4 –12 years Gas and oil storage and transmission equipment:
7 – 50 years Petrol service stations: 5 – 30 years Telecommunication and automatisation equipment: 3 – 10 years
In Upstream segment depletion and depreciation of production installations and transport systems for oil and gas is calculated for each individual field or field-dedicated transport system using the unit of production method, based on proved and developed commercially recoverable reserves. Recoverable reserves are reviewed on an annual basis prospectively. Transport systems used by several fields and other assets are calculated on the basis of the expected useful life, using the straight-line method. Amortisation of leasehold improvements is provided using the straight-line method over the term of the respective lease or the useful life of the asset, whichever period is less. Periodic maintenance costs are depreciated until the next similar maintenance takes place.The useful lives of intangible assets are assessed to be either finite or indefinite. Amortisation is charged on assets with a finite useful life over the best estimate of their useful lives using the straight line method.The useful life and depreciation methods are reviewed at least annually.
SIGNIFICANT ACCOUNTING ESTIMATES AND JUDGEMENTS
The determination of the Group’s estimated oil and natural gas reserves requires significant judgements and estimates to be applied and these are yearly reviewed and updated. Numerous factors have impact on determination of the Group’s estimates of its oil and natural gas reserves (eg. geological and engineering data, reservoir performance, acquisition and divestment activity, drilling of new wells, and commodity prices). MOL Group bases its proved and developed reserves estimates on the requirement of reasonable certainty with rigorous technical and commercial assessments based on conventional industry practice and regulatory require-ments. Oil and natural gas reserve data are used to calculate depreciation, depletion and amortization charges for the Group’s oil and gas properties. The impact of changes in these estimations is handled prospectively by amortizing the remaining carrying value of the asset over the expected future production. Oil and natural gas reserves also have a direct impact on the value in use calculations applied for determination of the recoverability of assets.
159

H) IMPAIRMENT OF ASSETS
ACCOUNTING POLICIES
Property, plant and equipment and intangible assets are reviewed for impairment whenever events or changes in circumstances indicate that the carrying amount of an asset may not be recoverable. Whenever the carrying amount of an asset exceeds its recov-erable amount, an impairment loss is recognized in the statement of profit or loss for items of property, plant and equipment and intangibles carried at cost. The recoverable amount is the higher of an asset's fair value less costs to sell and value in use. The fair value is the amount obtainable from the sale of an asset in an arm's length transaction while value in use is the present value of esti-mated net future cash flows expected to arise from the continuing use of an asset and from its disposal at the end of its useful life. Recoverable amounts are estimated for individual assets or, if this is not practicable, for the cash-generating unit. Intangible assets with indefinite useful life are not depreciated, instead impairment test is performed at each financial year-end.The Group assesses at each reporting date whether there is any indication that previously recognised impairment losses may no longer exist or may have decreased. A previously recognised impairment loss is reversed only if there has been a change in the impairment assumptions considered when the last impairment loss was recognised. The reversal is limited so that the carrying amount of the asset neither exceeds its recoverable amount, nor is higher than its carrying amount net of depreciation, had no impairment loss been recognised in prior years.
SIGNIFICANT ACCOUNTING ESTIMATES AND JUDGEMENTS
Impairment of non-current assets, including goodwillThe impairment calculation requires an estimate of the recoverable amount of the cash generating units. Value in use is usually determined on the basis of discounted estimated future net cash flows. In determination of cash flows the most significant variables are discount rates, terminal values, the period for which cash flow projections are made, as well as the assumptions and estimates used to determine the cash inflows and outflows, including commodity prices, operating expenses, future production profiles and the global and regional supply-demand equilibrium for crude oil, natural gas and refined products. ImpairmentsIn 2017, the following significant impairment losses and impairment reversals were recognised:Impairment test of Upstream assetsThe impairment tests performed by MOL Group were performed using the following assumptions:
Recoverable amount is calculated with the assumption of using the assets in long-term in the future. Discount rates: the value in use calculations take into account the time value of money, the risks specific to the asset and the rate
of return that would be expected by market for an investment with similar risk, cash flow and timing profile. It is estimated from current market transactions for similar assets or from the 'weighted average cost of capital' (WACC) of a listed entity that has a single asset or portfolio of assets that are similar in terms of service potential and risks to the asset under review.
Official 2017-22 Exploration and Production segment pre-tax WACC premise were applied (7.4%) plus Country Risk Premium of the related country. Based on the above, the WACC rates used for the impairment tests in 2017 were in the range from 7.4% to 17.4%.
Oil and gas price assumptions used in the value in use models: approximately 60 USD / barrel for the years between 2018 and 2020 and increasing price curve from 2021 (to 81 USD/bbl. for 2030).
In other segments no judgmental based impairment has been accounted for in 2017 and 2016.
Impairments and write-offs Upstream DownstreamConsumer
servicesCorporate and other Midstream Total
(without dry-holes) – 2017* HUF million HUF million HUF million HUF million HUF million HUF million
Hungary 18,646 1,522 303 13 150 20,634
Croatia 2,441 42 241 4,154 – 6,878
Pakistan 1,417 – – – – 1,417
Slovakia – 380 159 4 – 543
Romania – 219 237 – – 456
Other 52 – 235 – – 287
Total 22,556 2,164 1,175 4,171 150 30,215
*Containing the intersegment impact
NOTES TO THE FINANCIAL STATEMENTS

Impairments and write-offs (without dry-holes) – 2016* Upstream Downstream
Consumer services
Corporate and other Midstream Total
restated HUF million HUF million HUF million HUF million HUF million HUF million
Croatia 1,461 176 361 5,749 84 7,831
Hungary 1,183 5,178 262 – – 6,623
Italy – – 5,982 – – 5,982
Slovakia – 972 56 – – 1,028
Slovenia – – 888 – – 888
Romania 303 – 26 – – 329
UK 239 – – – – 239
Other 316 564 23 313 – 1,216
Total 3,502 6,890 7,598 6,062 84 24,136
*Containing the intersegment impact
In 2017 and 2016 impairment was accounted in: Upstream segment mainly for production fields, damages and for assets under construction. Downstream segment mainly for assets under construction, for damaged assets and for filling stations. Impairment figures
also contains written-off assets. Consumer services mainly for machineries and equipment in filling stations. Corporate and other segment was accounted for mainly oilfield service equipment.
I) IMPAIRMENT OF GOODWILL
ACCOUNTING POLICIES
Goodwill is reviewed for impairment, annually or more frequently if events or changes in circumstances indicate that the carrying value may be impaired. Impairment is determined for goodwill by assessing the recoverable amount of the cash-generating unit (or group of cash-generating units), to which the goodwill relates. Where the recoverable amount of the cash-generating unit (or group of cash-generating units) is less than the carrying amount of the cash-generating unit (or group of cash-generating units) to which goodwill has been allocated, an impairment loss is recognized. Impairment losses relating to goodwill cannot be reversed in future periods. The Group performs its annual impairment test of goodwill as at 31 December.The Group determines the necessity of impairment of goodwill based on the recoverable amount of cash-generating units to which the goodwill is allocated. The recoverable amounts of the CGUs are determined by net present value calculations of estimated future cash flows of the cash-generating units. The key assumptions for the calculation of net present values are the nominal cash flows, the growth rates during the period and the discount rates. Management considers that such pre-tax rates shall be used for discounting purposes which reflect the most to the current market circumstances, the time value of money and the risks specific to the CGUs.Consumer services and DownstreamPre-tax weighted average cost of capital (WACC) rates applied to discount the forecast cash flows reflecting risks specific to the segment and specific to the certain countries vary between 7.6% and 11.6% in Consumer services while 7.8% and 11.8% in Down-stream in current year.The growth rates are based on industry growth forecasts. The Group prepares cash flow forecasts derived from the most recent financial budgets of Consumer services segment approved by management for financial year 2018-2021 and extrapolates cash flows for the following years based on an estimated growth rates varying between 1 and 3.5 %.Corporate and otherIn case of Croatian oil field services related goodwill impairment test the Upstream segment assumptions were applied.
As a result of impairment tests performed at the end of 2017 no impairment is recognised on goodwill and management believes that no reasonably possible change in any of the key assumptions would cause the carrying value of the CGUs subject to goodwill impairment test to materially exceed their recoverable amount.
161

10. BUSINESS COMBINATIONS, TRANSACTIONS WITH NON-CONTROLLING INTERESTS
ACCOUNTING POLICIES
The acquisition method of accounting is used for acquired businesses by measuring assets and liabilities at their fair values upon acquisition, the date of which is determined with reference to the settlement date. For each business combination the Group decides whether non-controlling interest is stated either at fair value or at the non-controlling interests’ proportionate share of the acquiree’s fair values of net assets. The income and expenses of companies acquired or disposed of during the year are included in the consolidated financial statements from the date of acquisition or up to the date of disposal.Intercompany balances and transactions, including intercompany profits and unrealised profits and losses – unless the losses indicate impairment of the related assets – are eliminated. The consolidated financial statements are prepared using uniform accounting policies for like transactions and other events in similar circumstances.Subsequently the carrying amount of non-controlling interests is the initially recognised amount of those interests adjusted with the non-controlling interests’ share of changes in equity after the acquisition. Changes in the Group’s interests in subsidiaries that do not result in a loss of control are accounted for as equity transactions and recorded directly in retained earnings.
A) ACQUISITION OF ENI SLOVENIA D.O.O. AND ENI HUNGARIA ZRT.
Based on new information the value of goodwill recognised has been increased by HUF 1,883 million against the value of acquired assets. The accounting of business combination was completed by 30 September 2017.
B) ACQUISITION OF OT INDUSTRIES
On 31 January 2017 MOL Group has acquired 51% shareholding of OT Industries Vagyonkezelő Zrt. (OVK). OVK has five owned operating subsidiaries.OT Industries is a key market participant of the Central and Eastern European gas, oil and chemistry industry and the energy sector providing engineering, procurement, construction and production services with a main focus on designing facilities for extrapolation, transportation and processing of crude oil and natural gas as well as the implementation of major chemical and energy projects.The acquisition is in line with MOL Group's long-term strategy on significant investments and expansion of consumer and indus-trial service portfolio. The accounting of business combination was completed by 30 September 2017.
C) ACQUISITION OF ISO-SZER
On 31 August 2017 MOL Group has acquired 98% shareholding interest of ISO-SZER Ltd. ISO-SZER Ltd. is dealing with assembly (qualified welding and industrial pipe installation) and construction (construction and installation of concrete elements, steel structures). Regarding the acquisition, the initial accounting of the business combination is provisional as at 31 December 2017, as the valuation has not been finalised.
OT Industries ISO–SZERHUF million HUF million
Non–current assets 5,313 952
Intangible assets 446 656
Property, plant and equipment 3,832 296
Investment 3 –
Other non–current asset 896 –
Deferred tax asset 136 –
Current assets 16,735 226
Inventories 1,221 –
Trade and other receivables 3,088 181
Other current assets 12,426 –
Cash and cash equivalents – 45
Non–current liabilities (396) (76)
Non–current provisions (184) –
Long–term debt (53) (11)
Other non–current liability (155) (8)
NOTES TO THE FINANCIAL STATEMENTS

OT Industries ISO–SZERHUF million HUF million
Deferred tax liability (4) (57)
Current liabilities (21,564) (127)
Current provisions (3,829) –
Short–term debt (14,139) (5)
Trade payables (174) (4)
Taxes and contributions (100) –
Other current liabilities (3,322) (118)
Net assets 88 975
MOL Group's share of net assets 45 975
Goodwill on acquisition
Fair value of consideration transferred 45 825
Contingent consideration – 150
Less: fair value of identifiable net assets acquired (45) (975)
Goodwill on acquisition – –
Net cash outflow on acquisition of subsidiaries
Consideration paid in cash 45 825
Less: cash and cash equivalent balances acquired 1,116 (45)
Net cash outflow 1,161 780
The net revenue and the profit for the period of the acquired entities since the acquisition date included in the consolidated state-ment of comprehensive income for the reporting period are the following:
Net revenueProfit / (loss)
for the periodAcquired subsidiary HUF million HUF million
OT Industries 22,285 (5,464)
ISO-SZER 117 (138)
Acquisition related costs were immaterial.
11. DISPOSALS
In 2017 MOL Group sold its 49% share in North Karpovsky field to Coöperatieve KMG EP U.A for a marginal price.
KS EP Investment B.V. Karpovskiy Severniy LLP
HUF million
Non–current assets 826
Current assets 2,268
Total assets 3,094
Non–current liabilities –
Current liabilities (310)
Total liabilities (310)
Non–controlling interest –
Net assets sold 2,784
163

KS EP Investment B.V. Karpovskiy Severniy LLP
HUF million
Cash consideration received –
Net loss on net assets sold (2,784)
Recycling of cumulative foreign exchange loss (3,136)
Net loss on disposal (5,920)
Analysis of cash outflow on sales
Cash consideration received –
Net cash disposed of during the sale (124)
Net cash outflow (124)
Results of disposals are included in Other operating expenses in the year.
12. MATERIAL NON-CONTROLLING INTEREST
INA-Industrija nafte d.d.MOL Group has 49% shareholding interest in INA-Industrija nafte d.d. (hereinafter INA d.d.), however based on the conditions of the shareholders’ agreement MOL Group has been provided control over INA d.d. resulting in full consolidation method with 51% non-controlling interest.Proportion of equity interest held by non-controlling interests:
Proportion of non-controlling interest
Name 31 Dec 2017 31 Dec 2016
INA-Industrija nafte d.d. 51% 51%
31 Dec 2017 31 Dec 2016HUF million HUF million
Accumulated balances of material non-controlling interest 314,266 306,650
Profit / (Loss) allocated to material non-controlling interest 10,820 (13,508)
The summarised financial information of INA d.d. is provided below. This information is based on amounts before intercompany eliminations.
2017 2016Summarised statement of profit or loss HUF million HUF million
Total operating income 776,535 651,794
Total operating expenses (758,685) (664,369)
Financial expense, net 5,963 (6,687)
Profit / (loss) before income tax 23,813 (19,262)
Income tax (expense) / income (2,167) (7,453)
Profit / (loss) for the year 21,646 (26,715)
Total comprehensive income 21,250 (26,528)
Attributable to non–controlling interests 10,820 (13,508)
Dividends paid to non–controlling interests (3,204) –
2017 2016Summarised statement of financial position HUF million HUF million
Current assets 183,966 186,967
Non-current assets 797,393 866,676
NOTES TO THE FINANCIAL STATEMENTS

2017 2016Summarised statement of financial position HUF million HUF million
Total assets 981,359 1,053,643
Current liabilities (170,982) (238,406)
Non-current liabilities (193,177) (212,994)
Total liabilities (364,159) (451,400)
Total equity 617,200 602,243
Attributable to owners of parent 302,934 295,593
Attributable to non-controlling interest 314,266 306,650
2017 2016Summarised cash flow information HUF million HUF million
Cash flows from (used in) operations 102,123 95,437
Cash flows from (used in) investing activities (57,235) (66,663)
Cash flows from (used in) financing activities (53,021) (23,809)
Increase / (decrease) in cash and cash equivalents (8,133) 4,965
13. OTHER NON-CURRENT ASSETS
31 Dec 2017 31 Dec 2016HUF million HUF million
Obligatory level of inventory required by state legislations 39,015 38,467
Advance payments for assets under construction 1,796 2,879
Prepaid mining royalty 930 1,502
Advance payments for intangible assets 886 912
Prepaid fees of long-term rental fees 550 640
Other 378 3
Total 43,555 44,403
14. INVENTORIES
ACCOUNTING POLICIES
Inventories, including work-in-progress are valued at the lower of cost and net realisable value, after provision for slow-moving and obsolete items. Net realisable value is the selling price in the ordinary course of business, less the costs of making the sale. Cost of purchased goods, including crude oil and purchased gas inventory, is determined primarily on the basis of weighted average cost. The acquisition cost of own produced inventory consists of direct materials, direct wages and the appropriate portion of production overhead expenses including royalty. Inventory with nil net realisable value is fully written off.
31 Dec 2017 31 Dec 2016
At costLower of cost or net
realisable value At costLower of cost or net
realisable valueHUF million HUF million HUF million HUF million
Work in progress and finished goods 254,193 241,757 220,298 212,685
Other raw materials 76,049 50,471 75,219 53,781
Purchased crude oil 105,845 98,077 93,469 86,426
Other goods for resale 48,434 46,267 33,737 32,250
Total 484,521 436,572 422,723 385,142
Impairment of HUF 9,073 million has been recorded in 2017 (2016: HUF 6,027 million), mainly on raw materials and finished goods. In 2016 impairment was accounted for drilling inventory in Kurdistan Region of Iraq (HUF 3,344 million).
165

15. OTHER CURRENT ASSETS
31 Dec 2017 31 Dec 2016HUF million HUF million
Prepaid and recoverable taxes and duties (excluding income taxes) 50,944 40,103
Advance payments 8,983 12,332
Prepaid expenses 9,166 7,554
Other (1) 735 6,250
Total 69,828 66,239
(1) mainly revenue accruals.
16. PROVISIONS
ACCOUNTING POLICIES
Provision is made for the best estimate of the expenditure required to settle the present obligation (legal or constructive) as a result of past event where it is considered to be probable that a liability exists and a reliable estimate can be made of the outcome. Long-term obligation is discounted to the present value. Where discounting is used, the carrying amount of the provisions increases in each period to reflect the unwinding of the discount by the passage of time. This increase is recognized as interest expense. Provi-sions are reviewed at each balance sheet date and adjusted to reflect the current best estimate.Where it is possible that a settlement may be reached or it is not possible to make a reliable estimate of financial impact, appropriate disclosure is made but no provision created.Provision for Environmental expenditures Environmental expenditures that relate to current or future economic benefits are expensed or capitalized as appropriate. Liabili-ties for environmental costs are recognized when environmental assessments or clean-ups are probable and the amount recognized is the best estimate of the expenditure required. In case of long-term liability, the present value of the estimated future expenditure is recognised. Provision for Field abandonmentThe Group records a provision upon initial recognition for the present value of the estimated future cost of abandonment of oil and gas production facilities following the termination of production. At the time the obligation arises, it is provided for in full by recog-nizing the present value of future field abandonment and restoration expenses as a liability. An equivalent amount is capitalized as part of the carrying amount of long-lived assets. The estimate is based upon current legislative requirements, technology and price levels. A corresponding item of property, plant and equipment of an amount equivalent to the provision is also created. This is subsequently depreciated as part of the capital costs of the facility or item of plant (on a straight-line basis in Downstream, and using the unit-of production method in Upstream). Any change in the present value of the estimated expenditure is reflected as an adjustment to the provision and the corresponding property, plant and equipment.Provision for RedundancyThe employees of the Group are eligible, immediately upon termination, for redundancy payment pursuant to the terms of Collec-tive Agreement between the Group and its employees. The amount of such a liability is recorded as a provision in the consolidated statement of financial position when the workforce reduction program is defined, adopted, announced or has started to be imple-mented.Provision for Retirement benefits The cost of providing benefits under the Group’s defined benefit plans is determined separately for each plan using the projected unit credit actuarial valuation method. Actuarial gains and losses are recognized as other comprehensive income immediately. Past service costs, resulting from the introduction of, or changes to the defined benefit scheme are recognized as an expense immediately.Net interest expense is calculated on the basis of the net defined benefit obligation and disclosed as part of the financial result. Differences between the return on plan assets and interest income on plan assets included in the net interest expense is recognized in other comprehensive income.Legal provisionsProvision is made for legal cases if the negative expected outcome of the legal case is more likely than not.Emission rights The Group recognizes provision for the estimated CO2 emissions costs when actual emission exceeds the emission rights granted and still held. When actual emission exceeds the amount of emission rights granted, provision is recognised for the exceeding emis-sion rights based on the purchase price of allowance concluded in forward contracts or market quotations at the reporting date.
NOTES TO THE FINANCIAL STATEMENTS

SIGNIFICANT ACCOUNTING ESTIMATES AND JUDGEMENTS
A judgement is necessary in assessing the likelihood that a claim will succeed, or liability will arise, and to quantify the possible range of any settlement. Due to the inherent uncertainty on this evaluation process, actual losses may be different from the liability originally estimated. Scope, quantification and timing of environmental and field abandonment provisionThe Group holds provisions for the future decommissioning of oil and natural gas production facilities and pipelines at the end of their economic lives. Most of these decommissioning events are many years in the future and the precise requirements that will have to be met when the removal event occurs are uncertain. Decommissioning technologies and costs are constantly changing, as well as political, environmental, safety and public expectations. Management uses its previous experience and its own interpreta-tion of the respective legislation to determine environmental and field abandonment provisions. Actuarial estimates applied for calculation of retirement benefit obligationsThe cost of defined benefit plans is determined using actuarial valuations, which involves making assumptions about discount rates, future salary increases and mortality or fluctuation rates. Due to the long-term nature of these plans, such estimates are subject to significant uncertainty. Outcome of certain litigationsMOL Group entities are parties to a number of litigations, proceedings and civil actions arising in the ordinary course of business. Other provisions and liabilities are recognized in the period when it becomes probable that there will be a future outflow of funds resulting from past events and the amount of cash outflow can be reliably estimated. The timing of recognition and quantification of the liability require the application of judgement to existing facts and circumstances, which can be subject to change. Since the cash outflows can take place many years in the future, the carrying amounts of provisions and liabilities are reviewed regularly and adjusted to take account of changing facts and circumstances.
Environ-mental
Field abandon-
mentRedun-
dancy
Longterm employee
benefitsLegal
claims
Emission rights and
other TotalHUF million HUF million HUF million HUF million HUF million HUF million HUF million
Balance as of 01 Jan 2016 78,691 277,414 16,063 21,666 25,194 47,904 466,932
Acquisition / (sale) of subsidiaries 46 (3,007) – 9 – 222 (2,730)
Additions and revision of previous estimates
2,251 4,902 1,550 397 2,518 (650) 10,968
Unwinding of the discount 1,771 6,484 – 444 – – 8,699
Currency differences 666 (11,157) 29 2 (95) 586 (9,969)
Provision used during the year (4,432) (165) (14,704) (2,571) (2,120) (12,310) (36,302)
Balance as of 31 Dec 2016 78,993 274,471 2,938 19,947 25,497 35,752 437,598
Acquisition / (sale) of subsidiaries – – – 22 111 3,858 3,991
Additions and revision of previous estimates
4,181 35,444 1,176 2,896 1,016 11,185 55,898
Unwinding of the discount 1,753 4,601 – 432 – – 6,786
Currency differences 339 (1,777) (41) 45 25 (2,574) (3,983)
Provision used during the year (3,665) (115) (1,295) (2,264) (3,509) (15,002) (25,850)
Balance as of 31 Dec 2017 81,601 312,624 2,778 21,078 23,140 33,219 474,440
Current portion 31 Dec 2016 4,888 398 1,135 2,720 17,233 6,049 32,423
Non-current portion 31 Dec 2016 74,105 274,073 1,803 17,227 8,264 29,703 405,175
Current portion 31 Dec 2017 5,124 503 1,168 3,363 13,984 16,007 40,149
Non-current portion 31 Dec 2017 76,477 312,121 1,610 17,715 9,156 17,212 434,291
Environmental ProvisionAs of 31 December 2017 provision of HUF 81,601 million has been made for the estimated cost of remediation of past environmental damages, primarily soil and groundwater contamination and disposal of hazardous wastes, such as acid tar, in Hungary, Croatia, Slovakia and Italy. The provision is made on the basis of assessments prepared by MOL’s internal environmental expert team. The amount of the provision has been determined on the basis of existing technology at current prices by calculating risk-weighted cash flows discounted using estimated risk-free real interest rates. The amount reported as at 31 December 2017 also includes a contingent liability of HUF 24,915 million recognized upon acquiring INA Group, representing its present environmental obligations and a further HUF 15,667 million environmental contingent liability regarding the acquisition of IES (see Note 25).
167

Provision for Field abandonmentAs of 31 December 2017 provision of HUF 312,624 million has been made for estimated total costs of plugging and abandoning wells upon termination of production. Approximately 10% of these costs are expected to be incurred between 2018 and 2022 and the remaining 90% between 2023 and 2069. The amount of the provision has been determined on the basis of management’s understanding of the respective legis-lation, calculated at current prices and discounted using estimated risk-free real interest rates. Activities related to field suspension, such as plugging and abandoning wells upon termination of production and remediation of the area are planned to be performed by hiring external resources. Based on the judgement of the management, there will be sufficient capacity available for these activities in the area. As required by IAS 16 – Property, Plant and Equipment, the qualifying portion of the provision has been capitalized as a component of the underlying fields. Provision for Redundancy As part of continuing efficiency improvement projects, MOL Plc., INA d.d., IES S.p.A and other Group members decided to further optimize workforce. As the management is committed to these changes and the restructuring plan was communicated in detail to parties involved, the Group recognised a provision for the net present value of future redundancy payments and related tax and contribution. Relating to the restructuring of activities in Mantova, a provision for redundancy of HUF 9,145 million was recognised at IES in 2013 out of which HUF 568 million remained as of 31 December 2017. In 2015, a provision of HUF 9,804 million was made for redundancy program at INA out of which HUF 720 million still remained as of 31 December 2017. The closing balance of provision for redundancy is HUF 2,778 million as of 31 December 2017 (31 December 2016: HUF 2,938 million).Provision for Long-term employee benefitsAs of 31 December 2017 the Group has recognised a provision of HUF 21,078 million to cover its estimated obligation regarding future retire-ment and jubilee benefits payable to current employees expected to retire from group entities. These entities operate benefit schemes that provide lump sum benefit to all employees at the time of their retirement. MOL employees are entitled to 3 times of their final monthly salary regardless of the period of service, while MOL Petrochemicals and Slovnaft, a.s. provide a maximum of 2 and 7 months of final salary respec-tively, depending on the length of service period. In addition to the above mentioned benefits, in Hungary the retiring employees are entitled to the absence fee for their notice period – which lasts for 1-3 months depending on the length of the past service – which is determined by the Hungarian Labour Code. None of these plans have separately administered funds; therefore there are no plan assets. The amount of the provi-sion has been determined using the projected unit credit method, based on financial and actuarial variables and assumptions that reflect rele-vant official statistical data which are in line with those incorporated in the business plan of the Group.
2017 2016HUF million HUF million
Present value of total long-term employee benefit obligation at the beginning of the year
19,947 21,666
Acquisitions / (disposals) 22 9
Past service cost 727 496
Current service cost 1,196 1,910
Interest costs 432 444
Provision used during the year (2,264) (2,571)
Net actuarial (gain)/loss 973 (2,009)
from which:
Retirement benefit (See Note 8) 1,194 (794)
Jubilee benefit (221) (1,215)
Exchange adjustment 45 2
Present value of total long-term employee benefit obligation at year end 21,078 19,947
The following table summarises the components of net benefit expense recognized in the statement of profit or loss as employee benefit expense regarding provision for long-term employee retirement benefits:
2017 2016HUF million HUF million
Current service cost 1,196 1,910
Net actuarial (gain)/loss (221) (1,215)
Past service cost 727 496
Balance as at year end 1,702 1,191
The following table summarises the main financial and actuarial variables and assumptions based on which the amount of retirement benefits has been determined:
NOTES TO THE FINANCIAL STATEMENTS

2017 2016
Discount rate in % 1.9 - 5.2 1.7 - 3.0
Average wage increase in % 1.4 - 5.2 0.0 - 2.0
Mortality index (male) 0.04 - 3.57 0.05 - 3.57
Mortality index (female) 0.02 - 1.53 0.02 - 1.53
Actuarial (gains) and losses comprises of the following items:
Retirement benefits Jubilee benefits
2017 2016 2017 2016HUF million HUF million HUF million HUF million
Actuarial (gains) / losses arising from changes in demographic assumptions
(646) (867) (152) (605)
Actuarial (gains) / losses arising from changes in financial assumptions
1,097 786 (406) (345)
Actuarial (gains) / losses arising from experience adjustments 743 (713) 337 (265)
Total actuarial (gains) / losses 1,194 (794) (221) (1,215)
Legal provisionsAs of 31 December 2017 provision of HUF 23,140 million (31 December 2016: HUF 25,497 million) has been made for estimated total future losses from litigations. In July 2017 MOL Group entered into the settlement agreement with the Angolan Ministry of Finance regarding the settlement of the Addi-tional tax and Profit Oil in Angolan Blocks for the period 2002–2016. As the result of the agreement MOL Group was obliged to pay USD 6.6 million while the Angolan's Ministry of Finance waived its right to claim any additional tax payment from the Group for the years till 2016 (inclusive). As a result HUF 10,528 million provision and its foreign exchange impact has been released to profit or loss in 2017.Emission right and otherAs of 31 December 2017 the Group has recognized a provision of HUF 5,480 million for the shortage of emission quotas (31 December 2016: 4,329 million). In 2017, MOL Group has been granted 4,353,955 (2016: 4,293,688) emission quotas by the Hungarian, Croatian and Slovakian authorities. The total emissions during 2017 amounted to equivalent of 6,635,778 tons of emission quotas (2016: 6,374,298 tons).
17. OTHER NON-CURRENT LIABILITIES
31 Dec 2017 31 Dec 2016HUF million HUF million
Government grants received (see Note 9) 9,603 10,553
Received and deferred other subsidies 5,085 3,301
Deferred compensation for property, plant and equipment 4,741 4,319
Liabilities to government for sold apartments 1,356 1,592
Deferred income for apartments sold 1,273 1,292
Other 1,464 1,601
Total 23,522 22,658
169
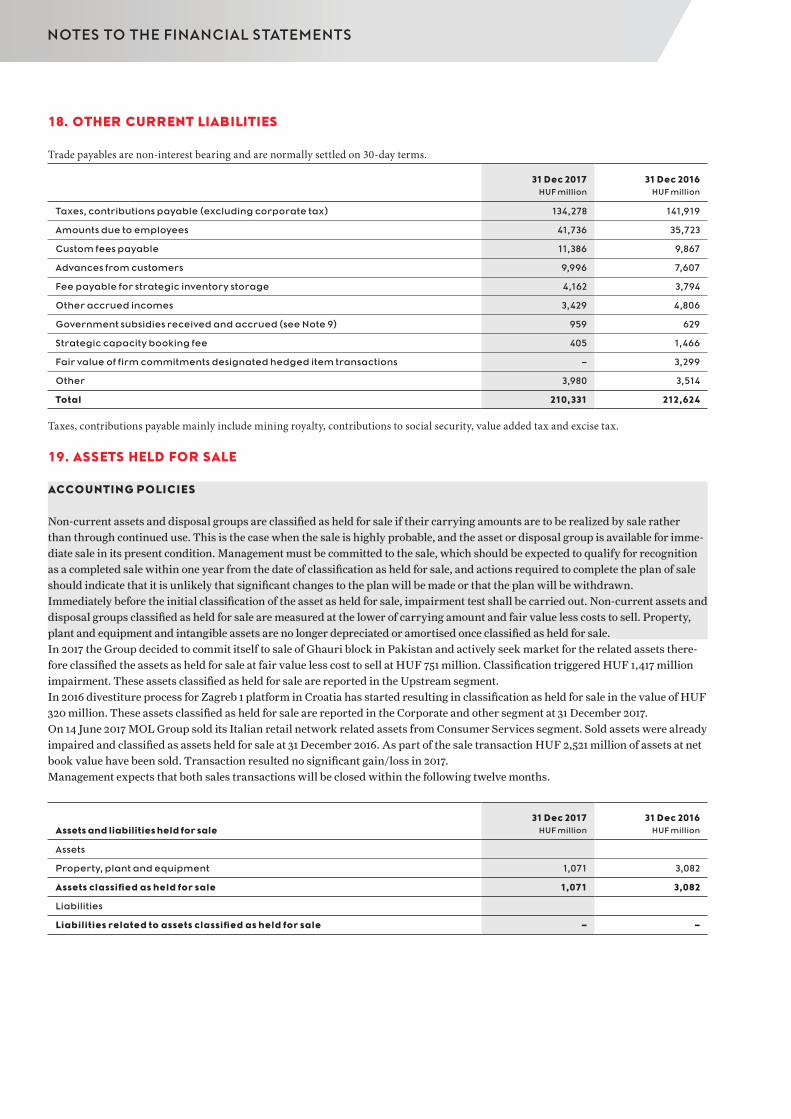
18. OTHER CURRENT LIABILITIES
Trade payables are non-interest bearing and are normally settled on 30-day terms.
31 Dec 2017 31 Dec 2016HUF million HUF million
Taxes, contributions payable (excluding corporate tax) 134,278 141,919
Amounts due to employees 41,736 35,723
Custom fees payable 11,386 9,867
Advances from customers 9,996 7,607
Fee payable for strategic inventory storage 4,162 3,794
Other accrued incomes 3,429 4,806
Government subsidies received and accrued (see Note 9) 959 629
Strategic capacity booking fee 405 1,466
Fair value of firm commitments designated hedged item transactions – 3,299
Other 3,980 3,514
Total 210,331 212,624
Taxes, contributions payable mainly include mining royalty, contributions to social security, value added tax and excise tax.
19. ASSETS HELD FOR SALE
ACCOUNTING POLICIES
Non-current assets and disposal groups are classified as held for sale if their carrying amounts are to be realized by sale rather than through continued use. This is the case when the sale is highly probable, and the asset or disposal group is available for imme-diate sale in its present condition. Management must be committed to the sale, which should be expected to qualify for recognition as a completed sale within one year from the date of classification as held for sale, and actions required to complete the plan of sale should indicate that it is unlikely that significant changes to the plan will be made or that the plan will be withdrawn.Immediately before the initial classification of the asset as held for sale, impairment test shall be carried out. Non-current assets and disposal groups classified as held for sale are measured at the lower of carrying amount and fair value less costs to sell. Property, plant and equipment and intangible assets are no longer depreciated or amortised once classified as held for sale.In 2017 the Group decided to commit itself to sale of Ghauri block in Pakistan and actively seek market for the related assets there-fore classified the assets as held for sale at fair value less cost to sell at HUF 751 million. Classification triggered HUF 1,417 million impairment. These assets classified as held for sale are reported in the Upstream segment.In 2016 divestiture process for Zagreb 1 platform in Croatia has started resulting in classification as held for sale in the value of HUF 320 million. These assets classified as held for sale are reported in the Corporate and other segment at 31 December 2017.On 14 June 2017 MOL Group sold its Italian retail network related assets from Consumer Services segment. Sold assets were already impaired and classified as assets held for sale at 31 December 2016. As part of the sale transaction HUF 2,521 million of assets at net book value have been sold. Transaction resulted no significant gain/loss in 2017.Management expects that both sales transactions will be closed within the following twelve months.
31 Dec 2017 31 Dec 2016Assets and liabilities held for sale HUF million HUF million
Assets
Property, plant and equipment 1,071 3,082
Assets classified as held for sale 1,071 3,082
Liabilities
Liabilities related to assets classified as held for sale – –
NOTES TO THE FINANCIAL STATEMENTS

FINANCIAL INSTRUMENTS, CAPITAL AND FINANCIAL RISK MANAGEMENT
This section explains policies and pro-cedures applied to manage the Group’s capital structure and the financial risks the group is exposed to. This section also describes the financial instruments ap-plied to fulfill these procedures. Hedge accounting related policies and financial instruments disclosures are also provided in this section.
ACCOUNTING POLICIES
Initial recognitionFinancial instruments are recognized initially at fair value (including transaction costs, for assets and liabilities not measured at fair value through profit or loss).Subsequent measurementSubsequent measurement depends on the classification of the given financial instrument. The Group’s financial assets are classified at the time of initial recognition depending on their nature and purpose.Financial assets at fair value through profit or lossFinancial assets at fair value through profit or loss include financial assets held for trading (including derivatives, other than those designated as effective hedging instrument) and financial assets designated upon initial recognition as at fair value through profit or loss. Financial assets at fair value through profit or loss are carried on the balance sheet at fair value with gains or losses recog-nized in the statement of profit or loss. Loans and receivablesLoans and receivables are non-derivative financial assets with fixed or determinable payments that are not quoted in an active market. After initial measurement loans and receivables are subsequently carried at amortised cost using the effective interest method less any allowance for impairment.Available-for-sale financial investmentsAvailable-for-sale financial assets are those non-derivative financial assets that are designated as available-for-sale or are not classi-fied in any of the three preceding categories. After initial measurement, available for sale financial assets are measured at fair value with unrealised gains or losses being recognized as other comprehensive income in the fair valuation reserve. Fair value measurementFair value of instruments is determined by reference to quoted market prices at the close of business on the balance sheet date without any deduction for transaction costs. For investments where there is no quoted market price, fair value is determined by reference to the current market value of another instrument which is substantially the same or is calculated based on the expected cash flows of the underlying net asset base of the investment. Derecognition of Financial InstrumentsDerecognition of a financial asset takes place when the Group no longer controls the contractual rights that comprise the finan-cial asset, which is normally the case when the instrument is sold, or all the cash flows attributable to the instrument are passed through to an independent third party. When the Group neither transfers nor retains all the risks and rewards of the financial asset and continues to control the transferred asset, it recognises its retained interest in the asset and a liability for the amounts it may have to pay.HedgingFor the purpose of hedge accounting, hedges are classified as either:
fair value hedges or cash flow hedges or hedges of a net investment in a foreign operation.
At the inception of a hedge relationship, the Group formally designates and documents the hedge relationship to which the Group wishes to apply hedge accounting together with the risk management objective and strategy for undertaking the hedge. The docu-mentation includes identification of the hedging instrument, the hedged item or transaction, the nature of the risk being hedged
171

and how the entity will assess the hedging instrument’s effectiveness in offsetting the exposure to changes in the hedged item’s fair value or cash flows attributable to the hedged risk. Such hedges are expected to be effective (80-125%) in achieving offsetting changes in fair value or cash flows and are assessed on an ongoing basis to determine that they actually have been highly effective throughout the financial reporting periods for which they were designated.Hedges which meet the strict criteria for hedge accounting are accounted for as follows:Fair value hedgesFair value hedges are hedges of the Group’s exposure to changes in the fair value of a recognized asset or liability or an unrecog-nized firm commitment, or an identified portion of such an asset, liability or firm commitment, that is attributable to a particular risk that could affect the statement of profit or loss. For fair value hedges, the carrying amount of the hedged item is adjusted for gains and losses attributable to the risk being hedged, while the derivative is re-measured at fair value and gains and losses from both are taken to the statement of profit or loss. For fair value hedges relating to items carried at amortised cost, the adjustment to carrying value is amortised through the statement of profit or loss over the remaining term to maturity. Any adjustment to the carrying amount of a hedged financial instrument for which the effective interest method is used is amortised to the statement of profit or loss. The Group discontinues fair value hedge accounting if the hedging instrument expires or is sold, terminated or exercised, the hedge no longer meets the criteria for hedge accounting or the Group revokes the designation. Cash flow hedgesCash flow hedges are hedges of the exposure to variability in cash flows that is attributable to a particular risk associated with a recognized asset or liability or a highly probable forecast transaction that could affect the statement of profit or loss. The effective portion of the gain or loss on the hedging instrument is recognized directly as other comprehensive income, while the ineffective portion is recognized in the statement of profit or loss.Amounts taken to other comprehensive income are transferred to the statement of profit or loss when the hedged transaction affects the statement of profit or loss. Where the hedged item is the cost of a non-financial asset or liability, the amounts previously taken to equity are transferred to the initial carrying amount of the non-financial asset or liability.If the forecast transaction is no longer expected to occur, amounts previously recognized in other comprehensive income are trans-ferred to the statement of profit or loss. If the hedging instrument expires or is sold, terminated or exercised without replacement or rollover, or if its designation as a hedge is revoked, amounts previously recognized in other comprehensive income remain in other comprehensive income until the forecast transaction occurs. If the related transaction is not expected to occur, the amount is taken to the statement of profit or loss.Hedges of a net investmentHedges of a net investment in a foreign operation, including a hedge of a monetary item that is accounted for as part of the net investment, are accounted for in a way similar to cash flow hedges. Gains or losses on the hedging instrument relating to the effec-tive portion of the hedge are recognized as other comprehensive income while any gains or losses relating to the ineffective portion are recognized in the statement of profit or loss. On disposal of the foreign operation, the cumulative value of any such gains or losses recognized as other comprehensive income is transferred to the statement of profit or loss.Impairment of Financial AssetsThe Group assesses at each balance sheet date whether a financial asset or group of financial assets is impaired. Impairment losses on a financial asset or group of financial assets are recognised only if there is an objective evidence of impairment due to a loss event and this loss event significantly impacts the estimated future cash flows of the financial asset or group of financial assets.Assets carried at amortised costAmount of loss is measured as the difference between the asset’s carrying amount and the present value of estimated future cash flows (excluding future expected credit losses) discounted at the financial asset’s effective interest rate at the date of impairment. The amount of the loss is recognized in the statement of profit or loss.If, in a subsequent period, the amount of the impairment loss decreases and the decrease can be related objectively to an event occurring after the impairment was recognized, the previously recognized impairment loss is reversed. Any subsequent reversal of an impairment loss is recognized in the statement of profit or loss, to the extent that the carrying value of the asset does not exceed its amortised cost at the reversal date. Available-for-sale financial investmentsIf an available-for-sale asset is impaired, an amount comprising the difference between its cost (net of any principal payment and amortisation) and its current fair value, less any impairment loss previously recognized in the statement of profit or loss, is trans-ferred from other comprehensive income to the statement of profit or loss. Impairment losses recognized on equity instruments classified as available for sale are not reversed; increases in their fair value after impairment are recognised directly in other comprehensive income. Impairment losses recognized on debt instruments classified as available for sale are reversed through the statement of profit or loss; if the increase in fair value of the instrument can be objectively related to an event occurring after the impairment loss was recognized in the statement of profit or loss.
NOTES TO THE FINANCIAL STATEMENTS

SIGNIFICANT ACCOUNTING ESTIMATES AND JUDGEMENTS
For determination of fair value, management applies estimates of the future trend of key drivers of such values, including, but not limited to yield curves, foreign exchange and risk-free interest rates, and in case of the conversion option volatility of MOL share prices and dividend yield.Management judgements are required in assessing the recoverability of loans and receivables and determining whether a provision against those is required. Factors considered include the credit rating of the counterparty, the amount and timing of anticipated future payments and any possible actions that can be taken to mitigate the risk of non-payment.
20. FINANCIAL RISK AND CAPITAL MANAGEMENT
Financial risk managementAs financial risk management is a centralized function in MOL Group, it is possible to integrate and measure all financial risks in a model using Value at Risk approach. A quarterly Financial Risk Report is submitted to the senior management.As a general approach, risk management considers the business as a well-balanced integrated portfolio. MOL Group actively manages its commodity exposures for the following purposes only:
Group Level Objectives – protection of financial ratios and targeted financial results, and managing commodity price expo-sures at physical transactions etc.,
Business Unit Objectives – To reduce the exposure of a Business Unit’s cash flow to market price fluctuations (e.g.: planned refinery shutdowns)
Capital managementThe primary objective of the Group’s capital management is to ensure that it maintains a strong credit rating and healthy capital ratios in order to support its business and maximize shareholder value.The Group manages its capital structure and makes adjustments to it, in light of changes in economic conditions. To maintain or adjust the capital structure, the Group may adjust the dividend payment to shareholders, return capital to shareholders or issue new shares. Treasury share transactions are also used for such purposes.The Group monitors capital using a gearing ratio, which is net debt divided by total capital plus net debt.The Group is currently in Low Gearing status, the credit metrics further improved in 2017. As of 31 December 2017 the Net Debt / EBITDA is at 0.65 level (FY 2016: 0.97) while the Net Gearing is 17% (FY 2016: 25%).
A) KEY EXPOSURES
Risk Management identifies and measures the key risk drivers and quantifies their impact on the MOL Group’s operating results. MOL Group uses a bottom-up model for monitoring the key exposures. According to the model, the diesel crack spread, the crude oil price and gasoline crack spread have the biggest contribution to the cash-flow volatility. The cash-flow volatility implied by the foreign exchange rates are also significant.
Commodity price riskMOL Group as an integrated oil and gas company is exposed to commodity price risk on demand and supply side as well. The main commodity risks stem from our integrated business model with downstream processing more crude than our own crude oil production. In Upstream MOL Group is long in crude oil and in Downstream MOL Group has a long position in refinery margin. Investors buying oil industry shares are generally willing to take the risk of oil business so commodity price risk should not be fully eliminated from the cash flow. When necessary, commodity hedging is considered to eliminate risks other than ‘business as usual’ risks or general market price volatility.In 2017 MOL Group concluded short and mid-term commodity swap and option transactions. These transactions are mainly conducted for operational hedging purposes, in order to mitigate the effects of the price volatility in our operations and in the same time, when possible, to lock in favorable forward curve structure.
Foreign currency riskMOL Group follows the basic economic currency risk management principle that the currency mix of the debt portfolio should reflect the net operating cash-flow position of MOL Group (‘natural hedge’) however, when necessary our practice allows for flex-ibility when the currency market environment is favorable or challenging. MOL Group also uses foreign exchange derivatives to hedge the foreign exchange exposures.
173

Interest rate riskAs an energy company, MOL Group has limited interest rate exposure. The ratio of fix/floating interest debt is monitored by Risk Management and regularly reported to the Board of Directors.MOL Group, when necessary, uses interest rate swaps to manage the relative level of its exposure to cash-flow interest rate risk associated with floating interest-bearing borrowings.
Credit riskMOL Group sells products and services to a diversified customer portfolio – both from business segment and geographical point of view – with a large number of customers representing acceptable credit risk profile.Policies and procedures are in place to set the framework and principles for customer credit risk management and collection of receivables to minimize credit losses deriving from delayed payment or non-payment of customers, to track these risks on a contin-uous basis and to provide financial support to sales process in accordance with MOL Group’s sales strategy and ability to bear risk.Creditworthiness of customers with deferred payment term is thoroughly assessed, regularly reviewed and appropriate credit risk mitigation tools are applied. Credit insurance, bank guarantee, letter of credit, cash deposit and lien are the most preferred types of security to cover clean customer credit risk, as according to the MOL Group’s policy, customer credit limits should be covered by payment securities where applicable.Individual customer credit limits are calculated taking into account external and/or internal assessment of customers as well as the securities provided. Information on existing and potential customers is gathered from well-known and reliable Credit Agencies and internal data available. Customer credit limits are reviewed at least once a year. Various solutions support the customer credit management procedures, including online monitoring of credit exposures for immediate information on breach and expiry of credit limits or guarantees. When such credit situations occur, deliveries shall be blocked; decisions on the unblocking of deliveries shall be made by authorized persons on both Financial and Business side.
Liquidity riskThe Group aims to manage liquidity risk by covering liquidity needs from bank deposits, other cash equivalents and from adequate amount of committed credit facilities. Besides, on operational level various cash pools throughout the Group help to optimise liquidity surplus and need on a daily basis.The existing bank facilities ensure both sufficient level of liquidity and financial flexibility for the Group.
2017 2016The amount of undrawn major committed credit facilities HUF million HUF million
Long-term loan facilities available (general corporate purpose) 901,753 911,616
Short-term facilities available 82,055 109,146
Total loan facilities available 983,808 1,020,762
Maturity profile of financial liabilities based on contractual undiscounted payments
Due within 1 month
Due between 1 and
12 monthsDue between 1 and 5 years
Due after 5 years Total
2017 HUF million HUF million HUF million HUF million HUF million
Borrowings 67,164 110,489 274,071 261,531 713,255
Transferred "A" shares with put&call options – 202,695 – – 202,695
Trade and other payables 355,686 178,424 2,361 29 536,500
Other financial liabilities 1,100 2,966 7,190 1 11,257
Non–derivative financial instruments 423,950 494,574 283,622 261,561 1,463,707
Total exposure under financial guarantees – 44 – – 44
Derivatives 15,115 257 9,766 – 25,138
Maturity profile of financial liabilities based on contractual undiscounted payments
Due within 1 month
Due between 1 and
12 monthsDue between 1 and 5 years
Due after 5 years Total
2016 HUF million HUF million HUF million HUF million HUF million
Borrowings 92,409 382,751 250,536 248,065 973,761
Transferred "A" shares with put&call options 70,652 91,089 – – 161,741
Trade and other payables 342,968 157,705 255 9 500,937
Other financial liabilities 1,700 3,409 8,095 1,294 14,498
Non-derivative financial instruments 507,729 634,954 258,886 249,368 1,650,937
Total exposure under financial guarantees 60 – – – 60
Derivatives 19,405 16,366 329 3,048 39,148
NOTES TO THE FINANCIAL STATEMENTS

B) SENSITIVITY ANALYSIS
In line with the international benchmark, Group Risk Management prepares sensitivity analysis. According to the Financial Risk Management Model, the key sensitivities are the following:
2017 2016**
Effect on Clean CCS-based* (Current Cost of Supply) profit / (loss) from operation HUF billion HUF billion
Brent crude oil price (change by +/- 10 USD/bbl; with fixed crack spreads and petrochemical margin)
Upstream +37.8 / -37.8 +42.3 / -42.3
Downstream -7.9 / +7.9 -8.5 / +8.5
Gas Midstream*** -0.0 / +0.0 -0.9 / +0.9
Exchange rates (change by +/- 15 HUF/USD; with fixed crack spreads)
Upstream +11.4 / -11.4 +10.0 / -10.0
Downstream +15.9 / -15.9 +15.8 / -15.8
Gas Midstream +0.7 / -0.7 +0.7 / -0.7
Exchange rates (change by +/- 15 HUF/EUR; with fixed crack spreads / petrochemical margin)
Upstream +2.2 / -2.2 +1.4 / -1.4
Downstream +22.0 / -22.0 +26.5 / -26.5
Refinery margin (change by +/- 1 USD/bbl)
Downstream +30.5 / -30.5 +29.1 / -29.1
Integrated petrochemical margin (change by +/- 100 EUR/t)
Downstream +44.1 / -44.1 +40.4 / -40.4
* Clean CCS-based profit / (loss) from operation (EBIT) and its calculation methodology is not regulated by IFRS. Please see the reconciliation of reported profit / (loss) from operation (EBIT) and Clean CCS profit / (loss) from operation (Clean CCS EBIT) with the relevant definitions in the Appendix III.
** The values are restated.*** Brent based contract expired in 2016.
C) BORROWINGS
ACCOUNTING POLICIES
All loans and borrowings are initially recognized at the fair value of the consideration received net of issue costs associated with the borrowing. After initial recognition, interest-bearing loans and borrowings are subsequently measured at amortised cost using the effective interest method.
2017 2016HUF million HUF million
Short-term debt
Eurobond | 5.875% €750 million due 2017 – 242,660
Eurobond | 2.625% €750 million due 2023 4,132 4,362
USD bond | 6.250 % $500 million due 2019 2,125 2,425
Schuldschein | €130 million due between 2020-2027 171 –
Bank loans 148,627 181,172
Financial lease liabilities 10,063 619
Other 6,443 9,134
Total short-term debt 171,561 440,372
Long-term debt
Eurobond | 2.625% €750 million due 2023 230,332 230,632
USD bond | 6.250 % $500 million due 2019 128,747 146,569
Schuldschein | €130 million due between 2020-2027 40,251 –
Bank loans 29,148 57,676
Financial lease liabilities 63,132 1,970
Other 91 75
Total long-term debt 491,701 436,922
175
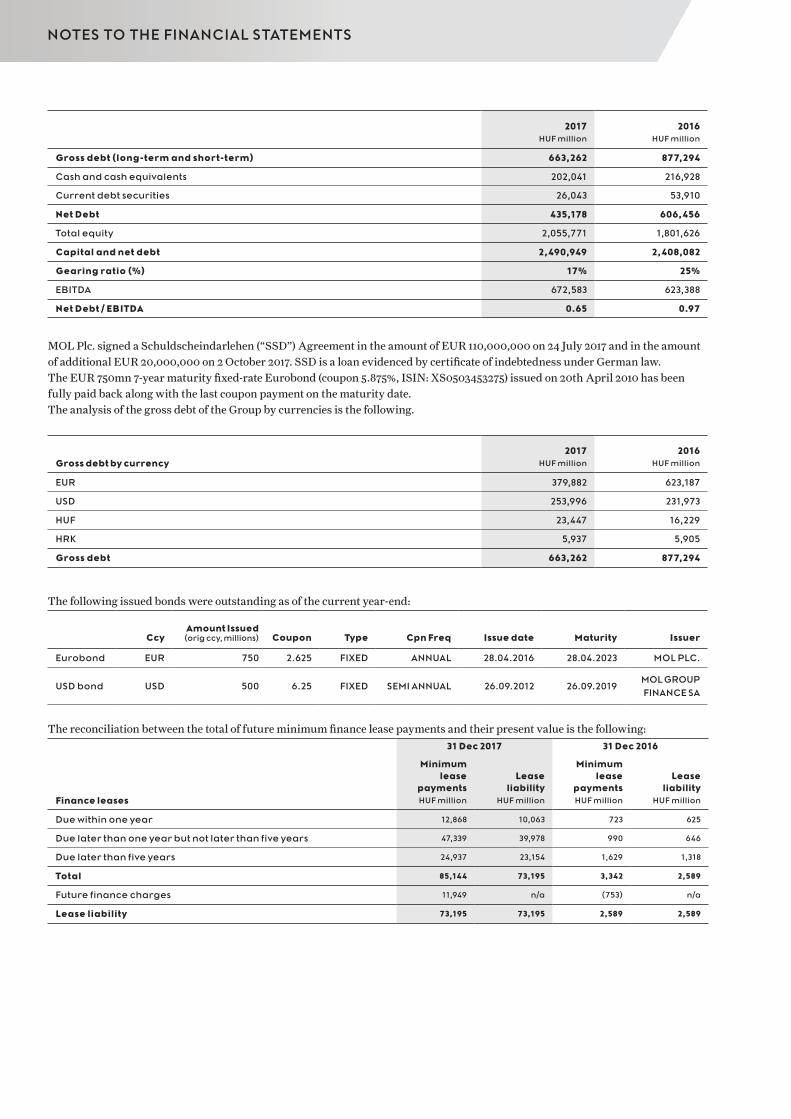
2017 2016HUF million HUF million
Gross debt (long-term and short-term) 663,262 877,294
Cash and cash equivalents 202,041 216,928
Current debt securities 26,043 53,910
Net Debt 435,178 606,456
Total equity 2,055,771 1,801,626
Capital and net debt 2,490,949 2,408,082
Gearing ratio (%) 17% 25%
EBITDA 672,583 623,388
Net Debt / EBITDA 0.65 0.97
MOL Plc. signed a Schuldscheindarlehen (“SSD”) Agreement in the amount of EUR 110,000,000 on 24 July 2017 and in the amount of additional EUR 20,000,000 on 2 October 2017. SSD is a loan evidenced by certificate of indebtedness under German law.The EUR 750mn 7-year maturity fixed-rate Eurobond (coupon 5.875%, ISIN: XS0503453275) issued on 20th April 2010 has been fully paid back along with the last coupon payment on the maturity date.The analysis of the gross debt of the Group by currencies is the following.
2017 2016Gross debt by currency HUF million HUF million
EUR 379,882 623,187
USD 253,996 231,973
HUF 23,447 16,229
HRK 5,937 5,905
Gross debt 663,262 877,294
The following issued bonds were outstanding as of the current year-end:
CcyAmount Issued (orig ccy, millions) Coupon Type Cpn Freq Issue date Maturity Issuer
Eurobond EUR 750 2.625 FIXED ANNUAL 28.04.2016 28.04.2023 MOL PLC.
USD bond USD 500 6.25 FIXED SEMI ANNUAL 26.09.2012 26.09.2019MOL GROUP FINANCE SA
The reconciliation between the total of future minimum finance lease payments and their present value is the following:
31 Dec 2017 31 Dec 2016
Minimum lease
paymentsLease
liability
Minimum lease
paymentsLease
liabilityFinance leases HUF million HUF million HUF million HUF million
Due within one year 12,868 10,063 723 625
Due later than one year but not later than five years 47,339 39,978 990 646
Due later than five years 24,937 23,154 1,629 1,318
Total 85,144 73,195 3,342 2,589
Future finance charges 11,949 n/a (753) n/a
Lease liability 73,195 73,195 2,589 2,589
NOTES TO THE FINANCIAL STATEMENTS

D) EQUITY
ACCOUNTING POLICIES
Retained earnings and other reserves shown in the consolidated financial statements do not represent the distributable reserves for dividend purposes. Reserves for dividend purposes are determined based on the company-only statutory earnings of MOL Plc. Reserves of exchange differences on translationThe reserves of exchange differences on translation represents translation differences arising on consolidation of financial state-ments of foreign entities. Exchange differences arising on such monetary items that, in substance, forms part of the company's net investment in a foreign entity are classified as other comprehensive income in the consolidated financial statements until the disposal of the net investment. Upon disposal of the corresponding assets, the cumulative revaluation or reserves of exchange differences on translation are recognized as income or expenses in the same period in which the gain or loss on disposal is recognized.Fair valuation reservesThe fair valuation reserve includes the cumulative net change in the fair value of effective cash flow hedges and available for sale financial instruments.Equity component of debt and difference in buy-back prices Equity component of compound debt instruments includes the residual amount of the proceeds from the issuance of the instrument above its liability component, which is determined as the present value of future cash payments associated with the instrument. The equity component of compound debt instruments is recognized when the Group becomes party to the instrument.Treasury Shares The nominal value of treasury shares held is deducted from registered share capital. Any difference between the nominal value and the acquisition price of treasury shares is recorded directly to retained earnings. In order to consistently distinguish share premium and retained earnings impact of treasury share transactions, repurchase and resale of treasury transactions affect retained earn-ings instead of having impact on share premium.Share capitalThere was a change in the number of issued shares due to an 8-for-1 share split of the Company’s registered ordinary “A” shares in 2017. As of 31 December 2017, the issued share capital was HUF 102,429 million, consisting of 819,424,824 series “A” shares with par value of HUF 125, one series “B” share with par value of HUF 1,000 and 578 series “C” shares with par value of HUF 1,001. Outstanding share capital as of 31 December 2017 and 2016 is HUF 79,279 million and HUF 79,260 million, respectively. Every “A” class share with a par value of HUF 125 each (i.e. one hundred and twenty-five forint) entitles the holder thereof to have one vote and every “C” class share with a par value of 1,001 each (i.e. one thousand one forint) entitles the holder to have eight and eight thousandth vote, with the following exceptions. Based on the Articles of Association, no shareholder or shareholder group may exercise more than 10% of the voting rights with the exception of organization(s) acting at the Company’s request as depository or custodian for the Company’s shares or securities representing the Company’s shares. Series “B” shares are voting preference shares with a par value of HUF 1,000 that entitles the holder thereof to preferential rights as specified in the Articles of Association. The "B" series share is owned by MNV Zrt., exercising ownership rights on behalf of the Hungarian State. The “B” series share entitles its holder to eight votes in accordance with its nominal value. The supporting vote of the holder of “B” series of share is required to adopt decisions in the following matters pursuant to Article 12.4. of the Articles of Association: decision on amending the articles regarding the B series shares, the definition of voting rights and shareholder group, list of issues requiring supermajority at the general meeting as well as Article 12.4. itself; further, the “yes” vote of the holder of “B” series of shares is required to adopt decisions on any proposal not supported by the Board of Directors in the following matters: election and dismissal of the members of the Board of Directors, the Supervisory Board and the auditors, decision of distribution of profit after taxation and amending of certain provisions of the Articles of Association.Based on the authorization granted in the Article 17.D of the Articles of Association the Board of Directors is entitled to increase the share capital until 23 April 2019 in one or more instalments by not more than HUF 30 billion in any form and method provided by the Civil Code.
177

Changes in the number of ordinary, treasury and authorized shares:
Series “A” and “B” sharesNumber of
shares issued
Number of treasury
shares
Shares under repurchase
obligation
Number of shares out-
standing
Authorised number of
shares
01 Jan 2016 104,518,485 (1,530,080) (23,748,142) 79,240,263 134,518,485
Share repurchase transaction with Magnolia Finance Limited
– (6,006,495) 6,007,479 984 –
Share distribution for the members of the Board of Directors
– 18,600 – 18,600 –
Cancellation of Treasury share (2,090,381) 2,090,381 – – (2,090,381)
Settlement of share option agreement with CA CIB
– (2,129,666) 2,129,666 – –
Settlement of share option agreement with ING Bank N.V.
– (356,899) 356,899 – –
31 Dec 2016 (before share split) 102,428,104 (7,914,159) (15,254,098) 79,259,847 132,428,104
31 Dec 2016 (recalculated due to share split in 2017)
819,424,825 (63,313,272) (122,032,784) 634,078,769 1,059,424,825
Settlement of share option agreement with Unicredit Bank A.G.
– (13,771,328) 13,771,328 – –
Share distribution for the members of the Board of Directors
– 148,800 – 148,800 –
New share purchase agreement with MUFG Securities EMEA Plc.
– 4,894,187 (4,894,187) – –
Settlement of share option agreement with Unicredit Bank A.G.
– (4,933,378) 4,933,378 – –
Settlement of share option agreement with ING Bank N.V.
– (5,164,470) 5,164,470 – –
31 Dec 2017 819,424,825 (82,139,461) (103,057,795) 634,227,569 1,059,424,825
Series “C” shares
31 Dec 2016 578 (578) – – 578
Series “C” shares
31 Dec 2017 578 (578) – – 578
MOL Plc. sold 6,007,479 pieces of series “A” ordinary shares to Magnolia Finance Limited (‘Magnolia’), incorporated in Jersey in 2006. Magnolia issued EUR 610 million of perpetual exchangeable capital securities, exchangeable for Series “A” Ordinary Shares of MOL between 2011 and 2016. Concurrently with the sale of ordinary shares, MOL Plc. entered into a swap agreement with Magnolia that gave MOL Plc. a call option for all or some of the shares. The call option was exercised under the swap agree-ment between MOL Plc. and Magnolia which was announced on 4th February 2016 and was physically settled regarding 6,006,495 pieces of MOL series “A” ordinary shares on the 21st of March 2016. The purchase price was EUR 45.9905 per one share. Simulta-neously Magnolia redeemed the perpetual exchangeable capital securities. Although MOL Plc. did not have any direct or indirect equity interest in or control rights over Magnolia, Magnolia was consolidated for IFRS purposes in line with the requirements of IFRS 10 – Consolidated Financial Statements. The above-mentioned share numbers relating to the transactions with Magnolia are before share split.DividendThe shareholders at the Annual General Meeting in April 2017 approved to pay HUF 58,007 million dividend in respect of 2016, which equals to HUF 78 dividend per share (HUF 625 dividend per share before the share split). The total amount of reserves legally available for distribution based on the statutory company only financial statements of MOL Plc. is HUF 1,305,164 million as of 31 December 2017 (31 December 2016: HUF 1,170,422 million).
NOTES TO THE FINANCIAL STATEMENTS

Treasury share put and call option transactionsMOL Plc. has some option agreements concluded with financial institutions in respect of 62,973,787 pieces of series “A” shares as of 31 December 2017. Under the agreements, MOL Plc. holds American call options and the financial institutions hold European put options in respect of the shares. The expiry of both the put and call options are identical and are one year from the date of the agree-ment.
CounterpartyUnderlying pieces of MOL ordinary shares
Strike price per share Expiry
ING Bank N.V. 33,740,338 EUR 10.46670 26-NOV-2018
MUFG Securities EMEA Plc. 4,894,187 EUR 10.30000 6-NOV-2018
UniCredit Bank AG 24,339,262 EUR 10.27147 14-NOV-2018
MOL has entered into share purchase and a share option agreements with MUFG Securities EMEA Plc („MUFG”) on 6 of November 2017. As a result of this transaction, MUFG owns a total number of 4,894,187 MOL Series “A” Ordinary shares. Simulta-neously MOL and MUFG concluded share option agreements regarding 4,894,187 MOL Series “A” Ordinary shares. The maturity date of the options is 6 November 2018.The options arising out of the share option agreement concluded between MOL Plc. and UniCredit Bank AG on 3 January 2017, regarding 29,272,640 MOL Series “A” Ordinary shares, were physically settled in respect of 4,933,378 options and cash settled in respect of 24,339,262 options on 16 November 2017. Simultaneously MOL Plc. and UniCredit Bank AG concluded new share option agreements regarding 24,339,262 MOL Series “A” Ordinary shares. The maturity date of the options is 14 November 2018.The options arising out of the share option agreement concluded between MOL Plc. and ING Bank N.V. („ING”) on 24 November 2016, were physically settled in respect of 5,164,470 number of options and cash settled in respect of 33,740,338 number of options on 28 November 2017. Simultaneously MOL and ING concluded new share option agreements regarding 33,740,338 MOL Series “A” Ordinary shares. The maturity date of the options is 26 November 2018.Share swap agreement with OTPAfter the lending of 40,084,008 pieces of MOL Plc. shares to OTP Bank Plc. (‘OTP’) has been terminated on 16 April 2009, MOL Plc. (‘MOL’) and OTP entered into a share-exchange and a share swap agreement. Under the agreements, initially MOL transferred 40,084,008 “A” series MOL ordinary shares to OTP in return for 24,000,000 pieces OTP ordinary shares. The agreement contains settlement provisions in case of certain movement of relative share prices of the parties subject to net cash or net share settlement. The original expiration of the share-swap agreements was on 11 July 2012. During 2012 the expiration has been extended to 11 July 2017. Subsequently, in 2017 this share swap agreement, in respect of 40,084,008 “A” series MOL Plc ordinary shares owned by OTP Bank Plc and 24,000,000 OTP Bank Plc ordinary shares owned by MOL Plc, has been further extended until 11 July 2022 which did not trigger any movement in MOL Plc’s treasury shares.Until the expiration date each party can initiate a cash or physical settlement of the deal.
179

21. FINANCIAL INSTRUMENTS
2017 Carrying amount of financial instruments
Fair value through profit or
lossFVTPL*
Deriva-tives
used for hedging
hedge acc.*
Loans and receivables
and liabilities at amort costamortised cost
Available-for-sale FVTOCI*
Total carrying amount
HUF million HUF million HUF million HUF million HUF million
Financial assets
Other non-current financial assets
Equity instruments – – – 31,158 31,158
Loans given – – 42,414 – 42,414
Deposit – – 306 – 306
Financial lease receivables
– – 402 – 402
Other 87 – 209 3,824 4,120
Total non-current financial assets 87 – 43,331 34,982 78,400
Trade and other receivables – – 538,902 – 538,902
Financial lease receivables – – 84 – 84
Cash and cash equivalents – – 202,041 – 202,041
Debt securities 5,141 – – 20,902 26,043
Other current financial assets
Commodity derivatives 4,815 – – – 4,815
Loans given – – 1,451 – 1,451
Deposit – – 46,590 – 46,590
Foreign exchange derivatives
395 – – – 395
Other 523 – 1,941 – 2,464
Total current financial assets 10,874 – 791,009 20,902 822,785
Total financial assets 10,961 – 834,340 55,884 901,185
Financial liabilities
Borrowings (Long-term debt) – – 428,569 – 428,569
Financial lease liabilities – – 63,132 – 63,132
Other non-current financial liabilities
Foreign exchange derivatives
321 2,968 – – 3,289
Other – – 3,276 – 3,276
Total non-current financial liabilities 321 2,968 494,977 N/A. 498,266
Trade and other payables – – 516,737 – 516,737
Borrowings (short-term debt) – – 161,498 – 161,498
Financial lease liabilities – – 10,063 – 10,063
Other current financial liabilities
Transferred "A" shares with put&call options
– – 201,257 – 201,257
Commodity derivatives 15,356 – – – 15,356
Foreign exchange derivatives
16 – – – 16
Other derivatives 6,477 – – – 6,477
Other – – 6,144 – 6,144
Total current financial liabilities 21,849 – 895,699 N/A. 917,548
Total financial liabilities 22,170 2,968 1,390,676 N/A. 1,415,814
* FVTPL: Fair value through profit or loss; hedge acc: under hedge accounting; FVTOCI: Fair value through other comprehensive income
NOTES TO THE FINANCIAL STATEMENTS
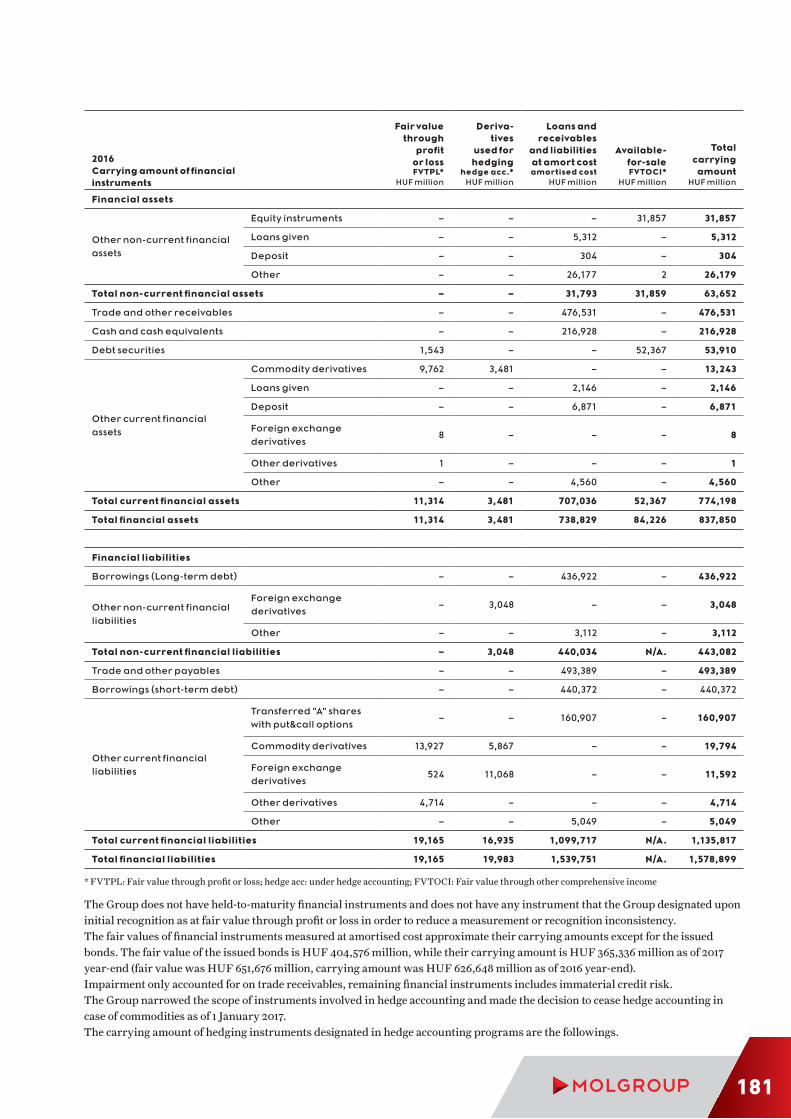
2016Carrying amount of financial instruments
Fair value through
profit or lossFVTPL*
Deriva-tives
used for hedging
hedge acc.*
Loans and receivables
and liabilities at amort costamortised cost
Available-for-sale FVTOCI*
Total carrying amount
HUF million HUF million HUF million HUF million HUF million
Financial assets
Other non-current financial assets
Equity instruments – – – 31,857 31,857
Loans given – – 5,312 – 5,312
Deposit – – 304 – 304
Other – – 26,177 2 26,179
Total non-current financial assets – – 31,793 31,859 63,652
Trade and other receivables – – 476,531 – 476,531
Cash and cash equivalents – – 216,928 – 216,928
Debt securities 1,543 – – 52,367 53,910
Other current financial assets
Commodity derivatives 9,762 3,481 – – 13,243
Loans given – – 2,146 – 2,146
Deposit – – 6,871 – 6,871
Foreign exchange derivatives
8 – – – 8
Other derivatives 1 – – – 1
Other – – 4,560 – 4,560
Total current financial assets 11,314 3,481 707,036 52,367 774,198
Total financial assets 11,314 3,481 738,829 84,226 837,850
Financial liabilities
Borrowings (Long-term debt) – – 436,922 – 436,922
Other non-current financial liabilities
Foreign exchange derivatives
– 3,048 – – 3,048
Other – – 3,112 – 3,112
Total non-current financial liabilities – 3,048 440,034 N/A. 443,082
Trade and other payables – – 493,389 – 493,389
Borrowings (short-term debt) – – 440,372 – 440,372
Other current financial liabilities
Transferred "A" shares with put&call options
– – 160,907 – 160,907
Commodity derivatives 13,927 5,867 – – 19,794
Foreign exchange derivatives
524 11,068 – – 11,592
Other derivatives 4,714 – – – 4,714
Other – – 5,049 – 5,049
Total current financial liabilities 19,165 16,935 1,099,717 N/A. 1,135,817
Total financial liabilities 19,165 19,983 1,539,751 N/A. 1,578,899
* FVTPL: Fair value through profit or loss; hedge acc: under hedge accounting; FVTOCI: Fair value through other comprehensive income
The Group does not have held-to-maturity financial instruments and does not have any instrument that the Group designated upon initial recognition as at fair value through profit or loss in order to reduce a measurement or recognition inconsistency.The fair values of financial instruments measured at amortised cost approximate their carrying amounts except for the issued bonds. The fair value of the issued bonds is HUF 404,576 million, while their carrying amount is HUF 365,336 million as of 2017 year-end (fair value was HUF 651,676 million, carrying amount was HUF 626,648 million as of 2016 year-end).Impairment only accounted for on trade receivables, remaining financial instruments includes immaterial credit risk.The Group narrowed the scope of instruments involved in hedge accounting and made the decision to cease hedge accounting in case of commodities as of 1 January 2017.The carrying amount of hedging instruments designated in hedge accounting programs are the followings.
181

Carrying amounts of hedging 2017 2016instrument HUF million HUF million
Fair value hedge
Assets Commodity derivatives – 3,299
LiabilitiesForeign exchange derivatives – 3
Commodity derivatives – 5,743
Cash flow hedge
Assets Commodity derivatives – 182
LiabilitiesForeign exchange derivatives 2,968 3,048
Commodity derivatives – 124
Net investment hedge LiabilitiesBorrowings 435,154 518,400
Foreign exchange derivatives* – 11,065
*EUR/USD foreign exchange derivatives are also designated in cash flow hedge of one of the issued debt. Please see further details in Note 20 a).
22. FAIR VALUE MEASUREMENT
2017 2016
Level 1Unadjusted
quoted prices in active markets
Level 2Valuation tech-
niques based on observable
market input
Total fair
value
Level 1Unadjusted
quoted prices in active markets
Level 2Valuation tech-
niques based on observable
market input
Total fair
valueFair value hierarchy HUF million HUF million HUF million HUF million HUF million HUF million
Financial assets
Equity instruments 26,228 5,453 31,681 25,909 5,948 31,857
Debt securities 22,867 7,000 29,867 53,910 2 53,912
Commodity derivatives – 4,902 4,902 – 13,243 13,243
Foreign exchange derivatives
– 395 395 – 8 8
Other derivatives – – – – 1 1
Total financial assets 49,095 17,750 66,845 79,819 19,202 99,021
Financial liabilities
Commodity derivatives – 15,356 15,356 – 19,794 19,794
Foreign exchange derivatives
– 3,305 3,305 – 14,640 14,640
Other derivatives – 6,477 6,477 – 4,714 4,714
Total financial liabilities – 25,138 25,138 – 39,148 39,148
This table contains only the financial instruments measured at fair value. Investment in equity instruments that do not have a quoted price in an active market and whose fair value cannot be reliably measured are held at cost and therefore not included in the fair value hierarchy table.
In 2017 (neither in 2016) the Group does not have any instruments with fair value categorized as Level 3 (valuation techniques based on significant unobservable market input).
23. TRADE AND OTHER RECEIVABLES
ACCOUNTING POLICIES
Trade and other receivables are amounts due from customers for goods sold and services performed in the normal course of busi-ness, as well as other receivables such as margining receivables. Trade and other receivables are initially recognised at fair value less transaction costs and subsequently measured at amortised cost less any provision for doubtful debts. A provision for impair-ment is made when there is objective evidence (such as the probability of insolvency or significant financial difficulties of the debtor) that the Group will not be able to collect all of the amounts due under the original terms of the invoice. Impaired receivables are derecognized when they are assessed as uncollectible.If collection of trade receivables is expected within the normal business cycle which is one year or less, they are classified as current assets. In other cases, they are presented as non-current assets.
NOTES TO THE FINANCIAL STATEMENTS

31 Dec 2017 31 Dec 2016HUF million HUF million
Trade receivables 466,479 417,133
Other receivables 72,507 59,398
Total 538,986 476,531
31 Dec 2017 31 Dec 2016HUF million HUF million
Trade receivables 502,244 464,139
Allowance for doubtful receivables (35,765) (47,006)
Total 466,479 417,133
2017 2016Movements in the allowance for doubtful receivables HUF million HUF million
At 1 January 47,006 45,618
Additions 3,001 11,453
Reversal (14,546) (9,999)
Amounts written off (153) (433)
Foreign exchange differences 457 367
At 31 December 35,765 47,006
31 Dec 2017 31 Dec 2016
Gross book value
Net book value
Gross book value
Net book value
Ageing analysis of trade receivables HUF million HUF million HUF million HUF million
Not past due 418,014 417,621 380,729 380,280
Past due 84,230 48,858 83,410 36,853
Within 90 days 40,803 39,931 24,366 23,609
91 - 180 days 5,114 3,119 4,328 1,779
Over 180 days 38,313 5,808 54,716 11,465
Total 502,244 466,479 464,139 417,133
24. CASH AND CASH EQUIVALENTS
ACCOUNTING POLICIES
Cash includes cash on hand and cash at banks. Cash equivalents are short-term, highly liquid investments that are readily convert-ible to known amounts of cash and that are subject to an insignificant risk of change in value. The Group considers the term “insig-nificant risk of change in value” not being limited to three month period.
31 Dec 2017 31 Dec 2016HUF million HUF million
Short-term bank deposits 100,616 111,505
Demand deposit 87,996 98,190
Cash on hand 13,429 7,233
Total 202,041 216,928
183

OTHER FINANCIAL INFORMATION
This section includes additional finan-
cial information that are either required
by the relevant accounting standards or
management considers these to be mate-
rial information for shareholders.
25. COMMITMENTS AND CONTINGENT LIABILITIES
ACCOUNTING POLICIES
Contingent liabilities are not recognized in the consolidated financial statements unless they are acquired in a business combination. They are disclosed in the Notes unless the possibility of an outflow of resources embodying economic benefits is remote. A contingent asset is not recognized in the consolidated financial statements but disclosed when an inflow of economic benefits is probable.
A) GUARANTEES
The total value of guarantees undertaken to parties outside the Group is contractually HUF 221,789 million.
B) CAPITAL AND CONTRACTUAL COMMITMENTS
The total value of capital commitments as of 31 December 2017 is HUF 91,438 million from which HUF 48,411 million relates to asso-ciated company, HUF 25,855 million relates to Hungarian operation and HUF 13,637 million relates to operation in Slovakia. Signif-icant amounts relate to a storage silos capacity extension project in Slovakia and the preparation phase of polyol production in Hungary (HUF 2,793 million and HUF 9,873 million, respectively).
C) OPERATING LEASES
31 Dec 2017 31 Dec 2016Operating lease commitments HUF million HUF million
Due within one year 10,838 6,384
Due later than one year but not later than five years 18,632 84,079
Due later than five years 2,135 752
Total 31,605 91,215
Out of the outstanding operating lease liabilities as of 31 December 2017 HUF 10,417 million relates to operation in Slovakia, HUF 5,738 million relates to operation in Croatia and HUF 14,434 million to operation in Hungary.
D) AUTHORITY PROCEDURES, LITIGATION
GeneralNone of the litigations described below have any impact on the accompanying consolidated financial statements except as explicitly noted. MOL Group entities are parties to a number of civil actions arising in the ordinary course of business. Currently, no further litigation exists that could have a material adverse effect on the financial condition, assets, results or business of the Group. The value of litigation where members of the MOL Group act as defendant is HUF 35,991 million for which HUF 23,140 million provision has been made.
CREDITOR procedures (MOL Plc.)CREDITOR GAMA s.r.o. has submitted a compensation claim against MOL Plc. in connection with the acquisition of Slovnaft a.s. shares by MOL in the amount of cca. SKK 380 million (EUR 12.6 million) plus delay interest 14.75% p.a from 28 November 2007. The claim was dismissed by the court on first instance. The claimant has filed an appeal, which has been rejected by the court of appeal. The court of appeal upheld the judgement of the court of first instance.
NOTES TO THE FINANCIAL STATEMENTS

CREDITOR BETA s.r.o. alleges that the buying offer of MOL in connection with the acquisition of Slovnaft a.s. shares was not approved by the Slovak financial authority (Úrad pre financny trh) and therefore it was not able to receive consideration for its shares for 213 days. It claims for compensation for damages suffered in connection with this delay (cca. EUR 3 million plus delay interest 10.48% p.a from 28 June 2007). The procedure continues with the question of amount, while MOL has filed an appeal against the interim decision on the legal basis with the appellate court. This appeal was dismissed by the court. MOL has filed an extraordinary appeal against the dismissal of its appeal.
ICSID arbitration (MOL Plc. vs. Croatia)The MOL’s request for arbitration was filed with the International Centre for Settlement of Investment Disputes („ICSID”) on 26 November 2013 against the Government of the Republic of Croatia (the “GoC”) mainly due to the huge losses INA-INDUSTRIJA NAFTE, d.d. (“INA”) has suffered in the gas business as a consequence of the breach of the agreements of 2009 by the GoC.
SALBATRING ENERGIJA, Međunarodna trgovina, d.o.o. (INA Group)SALBATRING ENERGIJA, Međunarodna trgovina, d.o.o. (“SALBATRING”) initiated the arbitration procedure. INA received Salbatring’s full Statement of Claim on 20 June 2015 by which Salbatring is claiming the amount of USD 27,950,385 plus the interest and costs. INA and Salbatring have signed the Settlement Agreement on 27.11.2017. by which INA is obliged to pay to Salbatring USD 1.45 million and Salbatring is withdrawing all of its claims in the respective arbitration procedure.
CONCESSIONS (INA Group)On 29 July 2011 the Ministry of Economy, Labour and Entrepreneurship (hereinafter: the Ministry) rendered three Decisions depriving INA of the license to explore hydrocarbons in exploration areas “Sava”, “Drava” and “North-West Croatia”. On 29 August 2011, INA filed three administrative lawsuits against the Ministry’s Decisions. The Administrative Court annulled the Ministry’s Decisions. On 10 November 2014, and on 20 February 2015 the Ministry adopted new Decisions in which it again deprived INA of the license to explore hydrocarbons in exploration areas “Sava” and “North-West Croatia” and “Drava”, with the same explanations. INA filed lawsuits against new Ministry Decisions regarding exploration areas “Sava”, “Drava” and “NW Croatia” and requested the Court to order a temporary measure. During April, 2015, the Administrative Court passed Resolution in which it rejected INA’s request for temporary measure. INA filed its Appeal, but in June 2015, High Administrative court rejected such INA’s Appeal. In November 2016 the Administrative Court reached a decision and rejected INA’s claim in the case regarding exploration area “Drava”. INA has filed an appeal against that decision in December 2016. On 08 September 2017 INA received the judgment brought by the High Administrative Court of the Republic of Croatia, rejecting INA's appeal against the first-instance verdict in the “Drava” case. Thus, the Decision on seizure of hydrocarbon exploration approvals in the "Drava" research area, issued by the competent Ministry, became final. The court still did not reach decisions regarding INA’s lawsuits regarding exploration areas “Sava” and “North-West Croatia”.On 06 October 2017 INA filed a Constitutional lawsuit before the Constitutional Court of the Republic of Croatia against judgments brought by the High Administrative Court and Administrative Court of the Republic of Croatia in “Drava” case, in which INA requires from Constitutional Court to annul all those judgments. INA is waiting for Constitutional Court’s judgment.
BelvedereIn July 2017 INA received a lawsuit from Belvedere d.d. Dubrovnik with a claim amounting HRK 220 million. The root of the case lies in 2005 when INA gave a loan to Belvedere d.d. (hotel “Belvedere” in Dubrovnik city coast was a pledge for the loan). Since Belvedere d.d. has not returned the loan, enforcement procedure was initiated in 2012, and the hotel was sold to a highest bidder on a public auction, for HRK 92 million. Enforcement procedure was executed through a public notary where the value of the hotel was evaluated by three independent court experts. Belvedere d.d. now claims that the hotel was sold below its market value and also claims damage to its reputation and loss of profit.It should be stated that INA already won two separate but similar procedures at the court one for the declaration that the sale and purchase agreement of the hotel Belvedere is null and void, which is final and one for the nullity of the enforceable clause on the Lien agreement which is not final. Although the outcome of this procedure is uncertain it is more likely in favor of INA than not. Notwithstanding the possible outcome, request for the damage is deemed to set too high considering three independent court experts already discussed the market price issue.
Dana Gas and Crescent Petroleum (Pearl shareholders) vs MOL Plc.Pearl Petroleum Company Limited’s ("Pearl") shareholders include, among others, Dana Gas PJSC ("Dana Gas”) and Crescent Petroleum Company International Limited (“Crescent”) and MOL.Dana Gas and Crescent, along with Pearl, entered into an agreement (the “Settlement Agreement”) to settle Pearl’s long-standing dispute with the Kurdistan Regional Government of Iraq (“KRG”) without proper prior consultation with MOL or obtaining requi-site approval, in breach of MOL’s contractual right as set in the Joint Venture Agreement (JVA).
185

MOL accordingly filed a default notice for breach of contract on Dana Gas and Crescent on 11 September 2017 in accordance with the mechanism ensured by the JVA to the shareholders of Pearl. The default notice for breach of contract has severe legal consequences for the defaulting shareholders, their shareholdings in Pearl and their related entitlements.Dana Gas and Crescent initiated arbitration procedure against MOL before the London Court of International Arbitration, disputing the validity of MOL’s default notice for breach of contract. MOL will take all appropriate steps to enforce and protect its rights deriving from the JVA.In addition to the above, the Dana Gas and Crescent also seek a declaration that MOL is in breach of the JVA; and damages in an amount to be quantified in due course. At current stage it is hard to assess the financial implications.
E) ENVIRONMENTAL LIABILITIES
MOL’s operations are subject to the risk of liability arising from environmental damage or pollution and the cost of any associated remedial work. MOL is currently responsible for significant remediation of past environmental damage relating to its operations. Accordingly, MOL has established a provision of HUF 81,601 million for the estimated cost as at 31 December 2017 for probable and quantifiable costs of rectifying past environmental damage (see Note 16). Although the management believes that these provisions are sufficient to satisfy such requirements to the extent that the related costs are reasonably estimable, future regulatory develop-ments or differences between known environmental conditions and actual conditions could cause a revaluation of these estimates.In addition, some of the Group’s premises may be affected by contamination where the cost of rectification is currently not quan-tifiable or legal requirement to do so is not evident. The main case where such contingent liabilities may exist is the Tiszaújváros site, including both the facilities of MOL Petrochemicals and area of MOL’s Tisza refinery, where the Group has identified signif-icant underground water and subsurface soil contamination. In accordance with the resolutions of the regional environmental authorities combined for MOL Petrochemicals and MOL Plc., the Group completed a detailed investigation and submit the results and technical specifications to the authorities in July of 2017. Based on these documents the authorities brought a resolution on 15th of September requiring MOL Petrochemicals and MOL to jointly perform this plan in order to manage the soil and underground water contamination. The total amount of liabilities originating from this plan can be estimated properly and MOL Petrochemicals and MOL set the required amount of environmental provision.In addition, contingent liabilities exist for uncertain remediation tasks; their magnitude cannot be estimated currently, but it is not expected to exceed HUF 4 billion.Furthermore, the technology applied in oil and gas exploration and development activities by the Group’s Hungarian predecessor before 1976 (being the year when the act on environmental protection and hazardous waste has become effective) may give rise to future remediation of drilling mud produced in cases where the wells are deeper than 1,800 m. This waste material has been treated and disposed of in line with environmental regulations ruling at that time, however, subsequent changes in legal defini-tions may result in further re-location and remediation requirements. The existence of such obligation, and consequently the poten-tial expenditure associated with it is dependent on the extent, volume and composition of drilling mud left behind at the numerous production sites, which cannot be estimated currently, but is not expected to exceed HUF 4-6 billion.Further to more detailed site investigations to be conducted in the future and the advancement of national legislation or authority practice, additional contingent liabilities may arise at the industrial park around Mantova refinery and the Croatian refineries depots and retail sites which have been acquired in previous business combinations. As at 31 December 2017, on Group level the aggregate amount of environmental liabilities recorded on the statement of financial position was HUF 40.6 billion (31 December 2016: HUF 40.1 billion).
NOTES TO THE FINANCIAL STATEMENTS

26. NOTES TO THE CONSOLIDATED STATEMENTS OF CASH FLOWS
ACCOUNTING POLICIES
Bank overdrafts repayable on demand are included as component of cash and cash equivalent in case where the use of short-term overdrafts forms an integral part of the entity’s cash management practices.
2017 2016Cash and cash equivalents comprise the following at 31 December HUF million HUF million
Cash and cash equivalents according to Balance Sheet 202,041 216,928
Overdraft as part of cash-flow (5,848) –
Cash and cash equivalents for continuing operation 196,193 216,928
Cash and cash equivalents for discontinued operation – –
Total Cash and cash equivalents 196,193 216,928
Analysis of net cash outflow on acquisition of subsidiaries, 2017 2016joint operations as business combinations HUF million HUF million
Cash consideration (871) (31,057)
Cash at bank or on hand acquired (1,071) 3,835
Net cash outflow on acquisition of subsidiaries, joint operations (1,942) (27,222)
Analysis of net cash flow related to sale of subsidiaries, 2017 2016joint operations as business combinations HUF million HUF million
Cash consideration 10,107 2,152
Cash at bank or on hand disposed (111) (5,715)
Net cash inflow / (outflow) related to sale of subsidiaries, joint operations 9,996 (3,563)
2017 2016Net cash outflow on acquisition of subsidiaries as asset-deals HUF million HUF million
Cash consideration – –
Total – –
2017 2016Analysis of cash flow related to joint ventures and associates HUF million HUF million
Cash consideration of acquisition and capital increase (625) (3,599)
Cash consideration of sale and capital decrease – 887
Dividend from joint ventures and associates 26,243 1,715
Net movements of loans (5,570) (5,069)
Total 20,048 (6,066)
2017 2016Analysis of other non-cash items HUF million HUF million
Write-off of inventories, net 9,073 6,027
Write-off of receivables, net (3,620) 2,587
Release of reserves of exchange differences on translation (520) 46
Other non-highlighted items 10,758 5,249
Total 15,691 13,909
187

Non-cash changes
2016
Cash flows used in
financing activities
Acquisition/ Disposals
Realized and non-realized
FX
FV change on
derivativesAccrued Interest
New lease
liabilities
Non-financing
CF related movements 2017
HUF million
HUF million HUF million HUF million HUF million HUF million HUF million HUF million HUF
million
Long-term debt 436,922 (14,725) (680) (24,215) – 21,315 73,063 21 491,701
Other non-current financial liabilities
6,160 2,854 – (8) – – – (2,441) 6,565
Short-term debt 440,372 (281,129) – (3,562) – 9,906 – 5,974 171,561
Other current financial liabilities
202,056 31,970 (80) (810) (791) – – (3,095) 229,250
Total Cash flows used in financing activities from financial liabilities
(261,030)
Other items impacting Cash flows used in financing activities
(59,149)
Total Cash flows used in financing activities
(320,179)
* From the HUF 59,149 million Other items impacting Cash flows used in financing activities, HUF 56,447 million is the paid dividend to shareholders from retained earnings.
27. EARNINGS PER SHARE
ACCOUNTING POLICIES
Basic earnings per share are calculated by dividing the net profit for the period attributable to ordinary shareholders by the weighted average number of ordinary shares outstanding during the period, after deduction of the average number of treasury shares held over the period.The calculation of diluted earnings per share is consistent with the calculation of basic earnings per share taking into consideration all dilutive potential ordinary shares that were outstanding during the period:
the net profit for the period attributable to ordinary shares is increased by the after-tax amount of dividends and interest recognized in the period in respect of the dilutive potential ordinary shares and adjusted for any other changes in income or expense that would result from the conversion of the dilutive potential ordinary shares.
the weighted average number of ordinary shares outstanding is increased by the weighted average number of additional ordinary shares which would have been outstanding assuming the conversion of all dilutive potential ordinary shares.
Both in 2017 and 2016, the diluted earnings per share equals with the basic earnings per share as there is no dilutive effect on the earnings.
IncomeWeighted average
number of sharesEarnings
per share HUF million HUF million
Basic Earnings Per Share 2016 (recalculated due to share split in 2017) 261,601 728,669,973 359
Diluted Earnings Per Share 2016 (recalculated due to share split in 2017) 261,601 728,669,973 359
Basic Earnings Per Share 2017 306,952 702,321,506 437
Diluted Earnings Per Share 2017 306,952 702,321,506 437
NOTES TO THE FINANCIAL STATEMENTS

2017 2016 HUF million HUF million
Net profit attributable to ordinary shareholders 306,952 263,497
Coupon payment to holders of capital securities of Magnolia (–) – (1,896)
Net profit attributable to ordinary shareholders for basic earnings per share 306,952 261,601
Coupon payment to holders of capital securities of Magnolia (+) – –
Fair value of conversion option – –
Net profit attributable to ordinary shareholders for diluted earnings per share 306,952 261,601
2017 2016*
HUF million HUF million
Weighted average number of ordinary shares for basic earnings per share 702,321,506 728,669,973
Effect of dilution – Weighted average number of conversion of perpetual exchange-able securities
– –
Adjusted weighted average number of ordinary shares for diluted earnings per share
702,321,506 728,669,973
* Recalculated due to Mol Plc. one to eight share split in 2017 to enable comparability.
28. RELATED PARTY TRANSACTIONS
A) TRANSACTIONS WITH ASSOCIATED COMPANIES AND JOINT VENTURES
2017 2016 HUF million HUF million
Trade and other receivables due from related parties 13,852 4,465
Trade and other payables due to related parties 13,658 12,871
Net sales to related parties 27,906 26,144
The Group purchased and sold goods and services with associated companies and joint ventures during the ordinary course of business in 2017 and 2016. All of these transactions were conducted under market prices and conditions.Capital and contractual commitments related to Ural Group Limited (which is associated company related to Fedorovskyfield) is HUF 49,332 million.INA d.d concluded a Gas Purchase Obligation (Take or pay). The obligation refers to a one year natural gas import contract signed with PPD for this terminal year. Through this contract INA will procure the quantities of gas needed to cover the gap in the sales portfolio. The value of future liabilities until the termination of the contract are HRK 589 million without VAT (cca. Net HUF 24,462 million).Trade and other receivables due from related parties also contains leased assets. For further explanations, refer to the “Transac-tions with Management, officers and other related parties” section.
B) REMUNERATION OF THE MEMBERS OF THE BOARD OF DIRECTORS
Directors’ total remuneration approximated HUF 130 million in 2017 (2016: HUF 130 million). In addition, the directors participate in a long-term incentive scheme details of which are given below. Directors are remunerated with the following net amounts in addition to the incentive scheme:
Executive and non-executive directors 25,000 EUR/yearCommittee chairmen 31,250 EUR /year
In case the position of the Chairman is not occupied by a non-executive director, it is the non-executive vice Chairman who is enti-tled to this payment. Directors who are not Hungarian citizens and do not have permanent address in Hungary are provided with EUR 1,500 on each Board meeting (maximum 15 times a year) when travelling to Hungary.
189

C) NUMBER OF SHARES HELD BY THE MEMBERS OF THE BOARD OF DIRECTORS AND EXECUTIVE BOARD AND THE MANAGEMENT
2017 2016 Number of shares Number of shares
Board of Directors 2,231,472 2,082,672
Executive Board (except Board of Directors members) 924,064 924,064
Senior Management (except Board of Directors and Executive Board members) 86,744 86,744
Total 3,242,280 3,093,480
* Recalculated due to Mol Plc. one to eight share split in 2017 to enable comparability.
D) TRANSACTIONS WITH MANAGEMENT, OFFICERS AND OTHER RELATED PARTIES
In 2017 entities controlled by the members of key management personnel purchased fuel from MOL Group in the total value of HUF 1,086 million. MOL Group purchased PR, media and other services from companies controlled by key management personnel in the total value of HUF 106 million. MOL Group provided subsidies through sponsorship for sport organisations controlled by key management personnel in the total value of HUF 334 million. MOL Group entered into a long-term (15 years) lease contract for marketing and advertisement surfaces with an entity controlled by key management personnel with a yearly lease fee of HUF 240 million. Entities controlled by key management personnel hold 1,720,000 shares.
E) KEY MANAGEMENT COMPENSATION
The amounts disclosed contains the compensation of managers who qualify as a key management member of MOL Group.
2017 2016 HUF million HUF million
Salaries and wages 979 853
Other short-term benefits 987 687
Share-based payments 1,522 896
Total 3,488 2,436
F) LOANS TO THE MEMBERS OF THE BOARD OF DIRECTORS AND SUPERVISORY BOARD
No loans have been granted to key management personnel.
29. EVENTS AFTER THE REPORTING PERIOD
No significant post – balance sheet event occurred which would have impact on 2017 figures.
30. APPENDICES
A) APPENDIX I.: ISSUED BUT NOT YET EFFECTIVE INTERNATIONAL FINANCIAL REPORTING STANDARDS AND AMENDMENTS
At the date of authorisation of these financial statements, the following standards and interpretations were in issue but not yet effective: IFRS 2 Share-based Payment – Amendment (effective for annual periods beginning on or after 1 January 2018, this amend-
ment has not been approved by EU yet) IFRS 9 Financial Instruments (effective for annual periods beginning on or after 1 January 2018) IFRS 9 Financial Instruments – Amendment (effective for annual periods beginning on or after 1 January 2019, this amend-
ment has not been approved by EU yet) IFRS 4 Insurance contracts – Amendment (effective for annual periods beginning on or after 1 January 2018)
NOTES TO THE FINANCIAL STATEMENTS

IFRS 15 Revenue from contracts with customers (effective for annual periods beginning on or after 1 January 2018): IFRS 15 establishes a new five-step model that will apply to revenue arising from contracts with customers. Under IFRS 15 revenue is recognised at an amount that reflects the consideration to which an entity expects to be entitled in exchange for transferring goods or services to a customer. IFRS 15 will replace IAS 18 Revenue and IAS 11 Construction contracts.
IFRS 15 Revenue from contracts with customers Amendment (effective for annual periods beginning on or after 1 January 2018) IFRS 16 Leases (effective for annual periods beginning on or after 1 January 2019) IFRS 17 Insurance Contracts (effective for annual periods beginning on or after 1 January 2021, this amendment has not been
approved by EU yet) IAS 40 Investment Property – Amendment (effective for annual periods beginning on or after 1 January 2018, this amend-
ment has not been approved by EU yet) IAS 28 Investment in Associates and Joint Ventures– Amendment (effective for annual periods beginning on or after 1
January 2019, this amendment has not been approved by EU yet) IFRIC 22 Foreign Currency Transactions and Advance Consideration (effective for annual periods beginning on or after 1
January 2018, this amendment has not been approved by EU yet) IFRIC 23 Uncertainty over Income Tax Treatments (effective for annual periods beginning on or after 1 January 2019, this
amendment has not been approved by EU yet) Annual improvements 2014-2016 (IAS 28 Investment in Associates and Joint Ventures; effective for annual periods begin-
ning on or after 1 January 2018, this amendment has not been approved by EU yet)
The above mentioned standards and amendments are not expected to significantly impact the Group’s consolidated results, finan-cial position or disclosures, except for the following standards:
IFRS 9 Financial Instruments: Classification and MeasurementIFRS 9 covers the classification, measurement and derecognition of financial instruments, new impairment methodology and a new hedge accounting model. IFRS 9 is intended to replace IAS 39 Financial instruments: recognition and measurement.No material impact in allowances for doubtful accounts is expected on Group level in relation to transition to IFRS 9.
IFRS 16 LeasesIn the case of the lessee, the new standard provides a single accounting model, and require recognition of assets and liabilities for all leases. Exceptions are leases contracted for less than 1 year, and leases with low value underlying assets. This removes the present
191

classification as either finance or operative leases for lessee. Lessors continue to classify leases as operating or finance similarly to IAS 17 Leases. IFRS 16 Leases replaces IAS 17 Leases, IFRIC 4, SIC-15 and SIC-27.
B) APPENDIX II.: SUBSIDIARIES
Company nameCountry (Incorporation /Branch) Range of activity
Ownership
2017 2016
INA-Industrija nafte d.d. Croatia Integrated oil and gas company 49% 49%
Upstream
Adriagas S.r.l. Italy Pipeline project company 49% 49%
CEGE Közép-európai Geotermi-kus Energia Termelő Zrt.
Hungary Geothermal energy production 100% 100%
CEGE Geothermikus Koncessziós Kft.
Hungary Geothermal energy production 100% 100%
CROPLIN, d.o.o. Croatia Natural gas trading 49% 49%
Csanád Szénhidrogén Koncessziós Kft.
Hungary Exploration and production activity 100% 100%
EMSZ Első Magyar Szén-hidrogén Koncessziós Kft.
Hungary Exploration and production activity 100% 100%
INA Naftaplin Interna tional Explo-ration and Production Ltd.
United Kingdom Exploration and production activity 49% 49%
Kalegran B.V. Netherlands Exploration financing 100% 100%
Kalegran Ltd. Cyprus / Iraq Exploration and production activity 100% 100%
KMSZ Koncessziós Kft. Hungary Exploration and production activity 100% 100%
Ménrót Kft. Hungary Exploration investment management 100% 100%
Karpinvest Kft. Hungary Exploration investment management 100% 100%
MH Oil and Gas BV. Netherlands Exploration investment management 100% 100%
MNS Oil and Gas B.V. Netherlands Exploration financing 100% 100%
MOL ENERGY UK Ltd. United Kingdom Exploration and production activity 100% 100%
MOLGROWEST (I) Ltd. United Kingdom Exploration and production activity 100% 100%
MOLGROWEST (II) Ltd. United Kingdom Exploration and production activity 100% 100%
MOL OPERATIONS UK Ltd. United Kingdom Exploration and production activity 100% 100%
MOL UK FACILITIES Ltd. United Kingdom Exploration and production activity 100% 100%
MOL Bázakerettye Szén-hidrogén Koncessziós Kft.2
Hungary Exploration and production activity 100% –
MOL Bucsa Szénhidrogén Koncessziós Kft.2
Hungary Exploration and production activity 100% –
MOL (FED) Kazakhstan B. V. Netherlands Exploration financing 100% 100%
MOL (FED) Kazakhstan B.V. Rep. Office
Kazakhstan Exploration financing 100% 100%
MOL (FED) Kazakhstan B.V. BO Kazakhstan Exploration investment management 100% 100%
MOL Jászárokszállás Szén-hidrogén Koncessziós Kft.2
Hungary Exploration and production activity 100% –
MOL Mezőtúr Szénhidrogén Koncessziós Kft.2
Hungary Exploration and production activity 100% –
MOL Nordsjön B.V. Netherlands Exploration financing 100% 100%
MOL Norge AS Norway Exploration activity 100% 100%
NOTES TO THE FINANCIAL STATEMENTS
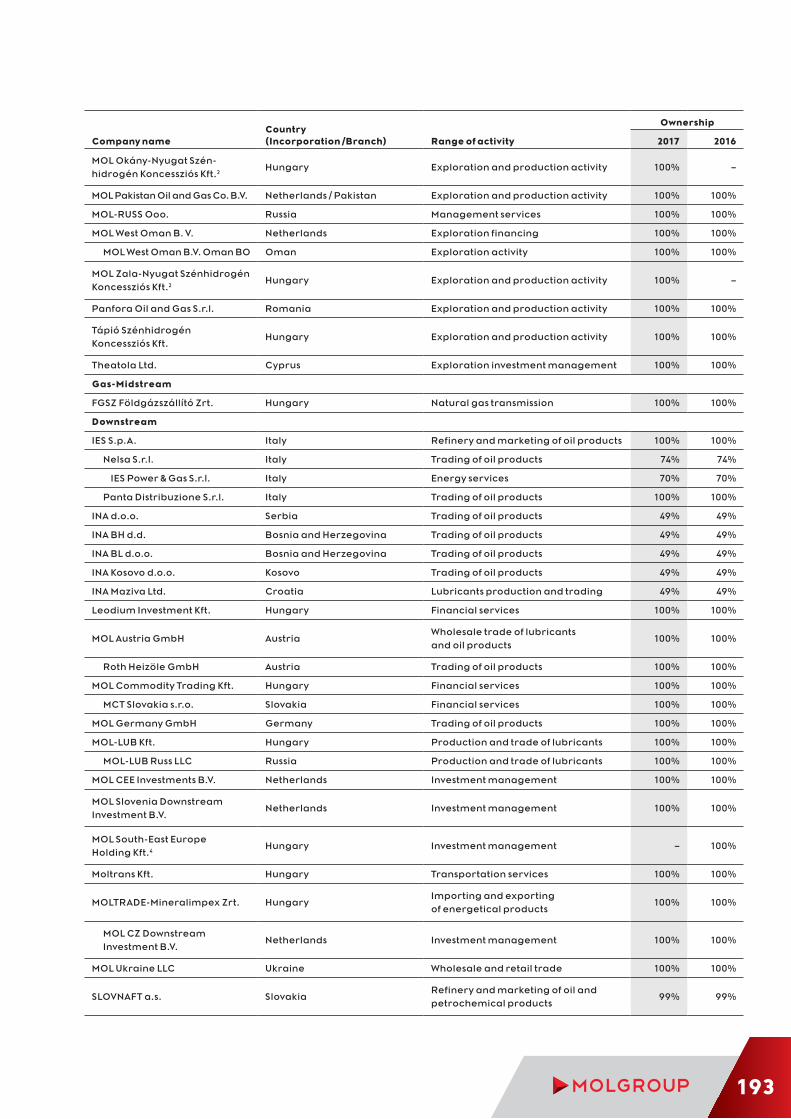
Company nameCountry (Incorporation /Branch) Range of activity
Ownership
2017 2016
MOL Okány-Nyugat Szén-hidrogén Koncessziós Kft.2
Hungary Exploration and production activity 100% –
MOL Pakistan Oil and Gas Co. B.V. Netherlands / Pakistan Exploration and production activity 100% 100%
MOL-RUSS Ooo. Russia Management services 100% 100%
MOL West Oman B. V. Netherlands Exploration financing 100% 100%
MOL West Oman B.V. Oman BO Oman Exploration activity 100% 100%
MOL Zala-Nyugat Szénhidrogén Koncessziós Kft.2
Hungary Exploration and production activity 100% –
Panfora Oil and Gas S.r.l. Romania Exploration and production activity 100% 100%
Tápió Szénhidrogén Koncessziós Kft.
Hungary Exploration and production activity 100% 100%
Theatola Ltd. Cyprus Exploration investment management 100% 100%
Gas-Midstream
FGSZ Földgázszállító Zrt. Hungary Natural gas transmission 100% 100%
Downstream
IES S.p.A. Italy Refinery and marketing of oil products 100% 100%
Nelsa S.r.l. Italy Trading of oil products 74% 74%
IES Power & Gas S.r.l. Italy Energy services 70% 70%
Panta Distribuzione S.r.l. Italy Trading of oil products 100% 100%
INA d.o.o. Serbia Trading of oil products 49% 49%
INA BH d.d. Bosnia and Herzegovina Trading of oil products 49% 49%
INA BL d.o.o. Bosnia and Herzegovina Trading of oil products 49% 49%
INA Kosovo d.o.o. Kosovo Trading of oil products 49% 49%
INA Maziva Ltd. Croatia Lubricants production and trading 49% 49%
Leodium Investment Kft. Hungary Financial services 100% 100%
MOL Austria GmbH AustriaWholesale trade of lubricants and oil products
100% 100%
Roth Heizöle GmbH Austria Trading of oil products 100% 100%
MOL Commodity Trading Kft. Hungary Financial services 100% 100%
MCT Slovakia s.r.o. Slovakia Financial services 100% 100%
MOL Germany GmbH Germany Trading of oil products 100% 100%
MOL-LUB Kft. Hungary Production and trade of lubricants 100% 100%
MOL-LUB Russ LLC Russia Production and trade of lubricants 100% 100%
MOL CEE Investments B.V. Netherlands Investment management 100% 100%
MOL Slovenia Downstream Investment B.V.
Netherlands Investment management 100% 100%
MOL South-East Europe Holding Kft.4
Hungary Investment management – 100%
Moltrans Kft. Hungary Transportation services 100% 100%
MOLTRADE-Mineralimpex Zrt. HungaryImporting and exporting of energetical products
100% 100%
MOL CZ Downstream Investment B.V.
Netherlands Investment management 100% 100%
MOL Ukraine LLC Ukraine Wholesale and retail trade 100% 100%
SLOVNAFT a.s. SlovakiaRefinery and marketing of oil and petrochemical products
99% 99%
193

Company nameCountry (Incorporation /Branch) Range of activity
Ownership
2017 2016
CM European Power Slovakia s.r.o.
Slovakia Operation of thermo-power plant 99% 99%
Slovnaft Polska S.A. Poland Wholesale and retail trade 99% 99%
Slovnaft Trans a.s. Slovakia Transportation services 99% 99%
SWS s.r.o. Slovakia Transport support services 51% 51%
VÚRUP a.s. Slovakia Research and development 99% 99%
Zväz pre skladovanie zásob a.s. Slovakia Wholesale and retail trade, warehousing 99% 99%
Terméktároló Zrt. Hungary Oil product storage 74% 74%
MOL Petrolkémia Zrt. HungaryPetrochemical production and trading
100% 100%
Tisza-WTP Kft.1 Hungary Feed water and raw water supply 0% 0%
TVK-Erőmű Kft. Hungary Electricity production and distribution 100% 100%
Consumer Services
Energopetrol d.d. Bosnia and Herzegovina Retail trade 33% 33%
Holdina d.o.o. Bosnia and Herzegovina Trading of oil products 49% 49%
INA Crna Gora d.o.o. Montenegro Trading of oil products 49% 49%
INA Maloprodajni servisi d.o.o. CroatiaTrade agency in the domestic and foreign market
49% 49%
INA Slovenija d.o.o. (formerly: Interina d.o.o. Ljubljana)
Slovenia Trading of oil products 49% 49%
MOL Česká republika s.r.o. Czech Republic Wholesale and retail trade 100% 100%
MOL E-mobilitás Vagyonkezelő Kft. Hungary Investment management 100% 100%
MOL E-mobilitás Kft. Hungary Electrical traffic solutions 100% 100%
MOL Fleet Holding Kft.2 Hungary Investment management 100% –
MOL Fleet Solution Flottakezelő Kft.2
Hungary Fleet management 100% –
MOL Limitless Mobility Holding Kft.2
Hungary Investment management 100% –
MOL Limitless Mobility Kft.2 Hungary Car sharing 100% –
MOL Naftna Družba, trgovsko podjetje d.o.o.
Slovenia Retail trade 100% 100%
MOL Retail Comert s.r.l.5 Romania Retail trade – 100%
MOL Retail Holding Kft. Hungary Real estate management 100% 100%
MOL Kiskereskedelmi Ingatlan Kft.
Hungary Real estate management 100% 100%
MOL Kiskereskedelem Zrt.3 Hungary Retail and Wholesale – 100%
MOL Romania PP s.r.l. RomaniaRetail and wholesale trade of fuels and lubricants
100% 100%
MOL Serbia d.o.o. Serbia Retail trade of fuels and lubricants 100% 100%
MOL Slovenia d.o.o. Slovenia Retail trade of fuels and lubricants 100% 100%
Petrol d.d. Croatia Trading of oil products 49% 49%
Tifon d.o.o. Croatia Retail trade of fuels and lubricants 100% 100%
Corporate and other
Crosco Naftni Servisi d.o.o. Croatia Oilfield services 49% 49%
Crosco B.V. Netherlands Oilfield services 49% 49%
Nordic Shipping Ltd. Marshall Islands Platform ownership 49% 49%
NOTES TO THE FINANCIAL STATEMENTS

Company nameCountry (Incorporation /Branch) Range of activity
Ownership
2017 2016
Crosco International d.o.o. (Slovenia)
Slovenia Oilfield services 49% 49%
Crosco International d.o.o. (Tuzla)
Bosnia and Herzegovina Oilfield services 49% 49%
Crosco International Ltd. United Kingdom Oilfield services 49% 49%
Crosco S.A. DE C.V Mexico Maintaining services 49% 49%
Crosco Ukraine Llc.2 Ukraine Oilfield services 49% –
Rotary Zrt. Hungary Oilfield services 49% 49%
Sea Horse Shipping Inc. Marshall Islands Platform ownership 49% 49%
Geoinform Kft. Hungary Hydrocarbon exploration 100% 100%
Hostin d.o.o. Croatia Tourism 49% 49%
Magnolia Finance Ltd.1 Jersey Financial services 0% 0%
MOL Aréna Kft. Hungary Investment management 100% 100%
MOL Cyprus Co. Ltd. Cyprus Captive insurance 100% 100%
MOL Group Finance S.A. Luxemburg Financial services 100% 100%
MOL Group International Services BV
Netherlands Financial and accounting services 100% 100%
MOL Ingatlan Holding Kft.2 Hungary Investment management 100% –
MOL Ingatlankezelő Kft.2 Hungary Real estate management 100% –
MOL Investment Kft. Hungary Financial services 100% 100%
MOL Magyarország Szolgáltató Központ
Hungary Business services 100% 100%
MOL Csoportszintű Pénzügyi Szolgáltató Kft.
Hungary Accounting services 100% 100%
MOL Magyarország HR Szolgáltató Kft.
Hungary HR services 100% 100%
MOL Magyarország Informatikai Szolgáltató Kft.
Hungary IT services 100% 100%
MOL Magyarország Pénzügyi Szolgáltató Kft.
Hungary Accounting services 100% 100%
MOL Magyarország Társasági Szolgáltató Kft.
Hungary Company services 100% 100%
MOL Reinsurance Co. DAC Ireland Captive insurance 100% 100%
MOL Vagyonkezelő Kft. Hungary Investment management 100% 100%
MULTIPONT Program Zrt. Hungary Marketing agent activity 100% 100%
OT INDUSTRIES Vagyonkezelő Zrt.2
Hungary Investment management 51% –
OT INDUSTRIES-DKG Gépgyártó Zrt.2
HungaryManufacturing of machinery and equipment
51% –
OT INDUSTRIES Eszközhasznosító Kft.2
Hungary Leasing activity 51% –
OT INDUSTRIES Fővállalkozó Zrt.2
Hungary Technical consultancy 51% –
OT INDUSTRIES-KVV Kivitelező Zrt.2
Hungary Pipeline construction 51% –
OT INDUSTRIES Tervező Zrt.2 Hungary Engineering activity 51% –
195

Company nameCountry (Incorporation /Branch) Range of activity
Ownership
2017 2016
Petrolszolg Kft. Hungary Repairs and maintenance services 100% 100%
PLAVI TIM d.o.o. Croatia IT services 49% 49%
Slovnaft Montáže a opravy a.s. Slovakia Repairs and maintenance services 99% 99%
MOL Solar Investment Kft. Hungary Investment management 100% 100%
MOL Solar Operator Kft. Hungary Power production 100% 100%
ISO-SZER Kft.2 Hungary Construction services 98% –
STSI integrirani tehnički servisi d.o.o.
Croatia Repairs and maintenance services 49% 49%
Ticinum Kft. Hungary Asset management 100% 100%
Top Računovodstvo Servisi d.o.o.
Croatia Accounting services 49% 49%
TVK Ingatlankezelő Kft. Hungary Real estate management 100% 100%
1) Consolidated as required by "IFRS 10 - Consolidated Financial Statements; 2) Fully consolidated from 2017; 3) Merged to MOL Kiskereskedelmi Ingatlan Kft. in 2017; 4) Merged to MOL Retail Holding Kft. in 2017; 5) Merged to MOL Romania PP S.r.l.; 6) Merged to Slovnaft a.s.
C) APPENDIX III.: CLEAN CCS PROFIT / (LOSS) FROM OPERATION (CLEAN CCS EBIT)
Clean CCS-based profit / (loss) from operation and its calculation methodology is not regulated by IFRS. CCS stands for Current cost of supply. Clean CCS EBIT is the most closely watched earnings measure in the oil and gas industry as it best captures the underlying performance of a refining operation as it removes non-recurring special items, inventory holding gains and losses, impairment on raw materials and own-produced inventory and cargo hedge.Inventory holding gain/lossEBIT after excluding the inventory holding gain/loss reflects the actual cost of supplies of the analyzed period therefore it provides better portray on the underlying production and sales results and makes the results comparable to other companies in the industry.Impairment on raw materials and own-produced inventoryInventories must be measured at the lower of cost or net realisable value.The cost of inventories must be reduced - i.e. impairment must be recognized on closing inventory of the period- if the cost is signifi-cantly higher than the expected sales price minus cost to sell.In case of finished products, impairment should be recognized if the closing value of the inventory at the end of period is above the future sales price of the product minus cost to sell. In case of raw materials and semi-finished products that will be used further in production, it has to be examined whether, following their use in production; their value can be recovered in the selling price of the produced finished products. If their value is not fully recoverable impairment must be recognized to the recoverable level.Derivative transactionsCCS methodology is based on switching to period average crude oil prices, but the CCS effect together with the effect of commodity derivative transactions would lead to unnecessary duplication, the P&L effect of all commodity derivatives are eliminated. Non recurring special itemsOne-off items are single, significant (more than EUR 10 million P&L effect), non-recurring economic events which are not consid-ered as part of the core operation of the segment therefore they do not reflect the actual performance of the given period.
2017 2016Clean CCS profit / (loss) from operation reconciliation HUF million HUF million
Profit / (loss) from operation 354,367 307,905
Inventory holding gain/loss (18,124) (26,362)
Impairment on raw materials and own-produced inventory 597 (6,356)
– thereof affects raw materials 6 (633)
– thereof affects own-produced inventory 591 (5,722)
Cargo hedge 1,807 3,217
NOTES TO THE FINANCIAL STATEMENTS

2017 2016Clean CCS profit / (loss) from operation reconciliation HUF million HUF million
CCS profit / (loss) from operation 338,647 278,404
Impact of derivative transactions 8,817 4,957
Special items 29,553 22,968
Clean CCS profit / (loss) from operation 377,017 306,329
2017 2016Special items HUF million HUF million
Profit / (loss) from operation excluding special items 383,920 330,873
Upstream
North Karpovsky divestment (5,920) –
Angola provision release 10,528 –
CEOC arbitration (6,875) –
Hungarian year-end impairments (18,389) –
Matjushkinskaya Vertical divestment – (3,234)
Kalegran inventory impairment – (3,344)
Total special items in Upstream (20,656) (6,578)
Downstream
Environmental provision at INA (4,755) –
IES impairment (Asset Held for Sale IFRS5) – (5,982)
HCK (HydroCracker) impairment – (4,471)
Total special items in Downstream (4,755) (10,453)
Corporate and Other
Impairment in INA Group (4,142) (5,937)
Total special items in Corporate and Other (4,142) (5,937)
Total impact of special items on profit / (loss) from operation (29,553) (22,968)
Profit / (loss) from operation 354,367 307,905
197

SUSTAINABILITY INFORMATION

SUSTAINABILITY INFORMATION

NOTES ON SUSTAINABILITY PERFORMANCEOUR APPROACH TO REPORTING
Since 2008, MOL Group has been reporting its financial, governance, environmental and social performance in one integrated report. Key achievements, challenges, performance data and trends relating to relevant sustainability topics for MOL Group are described throughout the report and are integrated into the descriptions of business operations and performance. A detailed account about 2017 sustainability performance is provided in the dedicated sections Sustainability Performance and Notes on Sustainability Performance.The main target audiences of the Annual Report are shareholders, investors and sustainability analysts. The structure of the relevant chapters is tailored to meet their information needs and reading habits. However, further information about MOL Group’s policies, management approaches and other sustainability-related topics for all audiences is published on the website at www.molgroup.info/en/sustainability. All sustainability performance data published in this report have been reviewed by EY (please find further details in the section on Audits, below). MOL Group started to integrate into reports the new Global Reporting Initiative (GRI) Standards in 2017 and follows this guideline. The Annual Report’s GRI accordance level is ‘comprehensive’, which means that we are reporting on all disclosures listed under material topics that have been identified (see more under Materiality Assessment, below). A GRI content index has been uploaded to the website: www.molgroup.info/en/sustainability/report-and-data/global-reporting-initiative-and-united-nations-global-compact-compliance-table.In addition, we are using the GRI sector supplement for ‘Oil and Gas Sector Disclosures’ guidelines and the IPIECA-API ‘Oil and Gas Industry Guidance on Voluntary Sustainability Reporting’ protocol when defining the content of reports and selecting which indicators to cover. Last, but not least, MOL Group will use this report in fulfilment of the legally binding requirements of Directive 2014/95/EU on the disclosure of non-financial and diversity information. The content index will also serve as a guide to the imple-mentation of all of the above guidelines and the directive.
MATERIALITY
We use materiality assessment as a means of prioritising material topics in reporting, without excluding any other relevant topics. Topics considered to be material are addressed in more detail, whereas the description in case of other topics (which are plotted on the materiality matrix) is less detailed and focuses on explaining why the company’s impacts are limited. We discuss the process of materiality analysis in more detail at the beginning of this report. The most material topics, according to the assessment, are GHG emissions and energy efficiency, process safety and crisis management, ethics and transparency, and also occupational safety management. Less material topics include suppliers, human rights and biodiversity. From a GRI reporting perspective, these topics are consid-ered non-material, thus we only disclose a selection of indicators for them.
NOTES ON SUSTAINABILITY PERFORMANCE

CONTENTS
Consolidated sustainability performance data (GRI) ...................................................................... 202
1. Climate change .................................................................................................................................. 2061.1. Future product portfolio .................................................................................................................... 2061.2. Energy efficiency and GHG emissions ............................................................................................ 208
2. Environment .......................................................................................................................................... 2112.1. Air emissions ............................................................................................................................................ 2112.2. Water management ............................................................................................................................. 2122.3. Waste management, spills and soil and groundwater protection and site restoration ...................................................................................................................................... 2152.4. Biodiversity ............................................................................................................................................. 2182.5. HSE compliance .................................................................................................................................... 219
3. Health and safety ............................................................................................................................... 2193.1. Personal safety ...................................................................................................................................... 2193.2. Health protection and promotion .................................................................................................. 2223.3. Process safety and risk assessment................................................................................................. 223
4. Human capital ..................................................................................................................................... 2244.1. Attracting employees .......................................................................................................................... 2244.2. Retaining and rewarding employees ............................................................................................. 2254.3. Development of human capital ...................................................................................................... 2294.4. Commitment to fair employment ................................................................................................... 230
5. Communities ........................................................................................................................................ 2325.1. Community relations ........................................................................................................................... 2325.2. Social investments ................................................................................................................................ 2335.3. Local suppliers and employment .................................................................................................... 235
6. Ethics and governance .................................................................................................................... 2376.1. Ethics and compliance ....................................................................................................................... 2376.2. Ethical cases ........................................................................................................................................... 2396.3. Human rights ......................................................................................................................................... 2416.4. Transparency ......................................................................................................................................... 2426.5. Customers ............................................................................................................................................... 242
7. About sustainability reporting .................................................................................................... 2457.1. Scope and boundary .......................................................................................................................... 2457.2. Reporting on joint ventures .............................................................................................................. 2457.3. Notes on sustainability data .............................................................................................................. 2467.4. Audits ......................................................................................................................................................... 247
8. Independent Practitioner’s Assurance Report ....................................................................... 247
201

CONSOLIDATED SUSTAINABILITY PERFORMANCE DATA (GRI)Definitions of the indicators used below can be found on our website
Indicator Note Unit 2015 2016 2017GRI
Standard code
SDG linkage(1)
Climate Change
Greenhouse Gas Emissions
Carbon Dioxide (CO2) 1.2 mn t 6.11 5.98 7.05 305-1 SDG 13
Carbon Dioxide based on equity share approach (CO2)
(2)1.2 mn t 5.68 5.97 6.08 305-1 SDG 13
Carbon Dioxide (CO2) under ETS 1.2 mn t 5.61 5.27 6.52 305-1 SDG 13
Methane (CH4) 1.2 t 354 1,471 1,019 305-1 SDG 13
Total Direct GHG (scope-1) 1.2 mn t CO2 eq 6.15 6.07 7.10 305-1 SDG 13
Total Indirect GHG (scope-2) – Location based
1.2 mn t CO2 eq 1.27 1.33 0.95 305-2 SDG 13
Total Indirect GHG (scope-2) – Market based(3)
mn t CO2 eq n.a. 1.38 1.08 305-2 SDG 13
Total GHG emission of Upstream (Scope-1 + Scope-2)(4)
1.2 mn t CO2 eq 0.71 0.68 0.80305-1, 305-2
SDG 13
Total GHG emission of Refining (Scope-1 + Scope-2)(5)
1.2 mn t CO2 eq 4.65 4.52 4.34305-1, 305-2
SDG 13
Total Indirect GHG from product use, business trips and crude oil supply (Scope-3)
1.2 mn t CO2 eq 58.03 59.14 61.03 305-2 SDG 13
CO2 emission from flaring in Upstream activities
1.2 mn t CO2 eq 0.06 0.11 0.10 305-7 SDG 13
Energy Consumption
Total direct energy consumption 1.2 GJ 85,292,279 83,552,569 96,116,908 302-1 SDG 12
o/w Natural Gas 1.2 GJ 17,917,957 22,970,085 22,909,029 302-1 SDG 12
o/w Other hydrocarbon (fuel, gas, etc.)
1.2 GJ 67,374,322 60,582,484 73,207,880 302-1 SDG 12
Total indirect energy consumption 1.2 GJ 17,885,050 18,192,245 12,869,548 302-1 SDG 12
o/w Electricity 1.2 GJ 9,562,509 9,781,690 8,826,150 302-1 SDG 12
o/w Other indirect energy (steam, heat, etc.)
1.2 GJ 8,322,541 8,410,555 4,043,398 302-1 SDG 12
Total energy consumption 1.2 GJ 103,177,328 101,744,814 108,986,456 302-1 SDG 7
o/w Total energy consumption of Upstream (direct + indirect)
1.2 GJ 8,579,143 7,669,124 7,770,477 302-1 SDG 7
o/w Total energy consumption of Refining (direct + indirect)
1.2 GJ 62,246,256 59,815,587 58,509,931 302-1 SDG 7
NOTES ON SUSTAINABILITY PERFORMANCE

Indicator Note Unit 2015 2016 2017GRI
Standard code
SDG linkage(1)
Environment
Air Emissions
Sulphur Dioxide (SO2) 2.1 t 6,146 7,077 8,996 305-7 SDG 13
Nitrogen Oxides (NOX) 2.1 t 5,175 5,718 7,453 305-7 SDG 13
Volatile Organic Compounds (VOC) 2.1 t 7,950 4,695 4,503 305-7 SDG 13
Carbon Monoxide (CO) 2.1 t 2,309 1,559 1,694 305-7 SDG 13
Particulate Matter (PM) 2.1 t 353 274 330 305-7 SDG 13
Water
Total Water Withdrawal 2.2 th m3 84,657 85,176 95,663 303-1 SDG 6
Total Water Discharge 2.2 th m3 94,002 92,234 96,827 306-1 SDG 14
Total Petroleum Hydrocarbons (TPH) 2.2 t 38 61 38 306-1 SDG 14
Chemical Oxygen Demand (COD) 2.2 t 1,514 1,739 1,650 306-1 SDG 14
Biological Oxygen Demand (BOD) 2.2 t 307 344 339 306-1 SDG 14
Solid Substances (TSS) 2.2 t 765 835 740 306-1 SDG 14
Waste
Hazardous Waste 2.3 t 92,720 139,032 122,316 306-2 SDG 12
Non-hazardous Waste 2.3 t 183,686 113,894 102,055 306-2 SDG 12
Waste Disposed / Landfilled 2.3 t 94,197 107,501 100,013 306-2 SDG 12
Waste Reused / Recycled / Recovered 2.3 t 182,461 145,424 124,234 306-2 SDG 12
Reused/recycled ratio 2.3 % 66.0 61.4 55.4 SDG 12
Spills and Discharges(6)
Number of Spills (>1m3) 2.3 6 11 10 306-3 SDG 12
Number of Spills (>1bbl) 48 43 38 306-3 SDG 12
Volume of Spills (>1m3) (HC content) 2.3 m3 17 637.1 129.1 306-3 SDG 12
Volume of Spills (>1bbl) (HC content) bbl 232 4,170.4 882.4 306-3 SDG 12
Other
HSE-related Penalties 2.5 mn HUF 21 12 15 307-1 SDG 12
HSE investments mn HUF 15,518 17,721 17,074 SDG 12
HSE operating costs mn HUF 14,159 20,656 20,747 SDG 12
o/w Spending on waste (operating cost)
mn HUF 2,048 2,193 2,193 SDG 12
o/w Spending on emissions (operating cost)
mn HUF 1,270 1,581 1,653 SDG 12
o/w Spending on remediation (investment + operating cost)
2.3 mn HUF 2,057 1,670 2,261 SDG 12
o/w Spending on environmental management and prevention (operating cost)
2.3 mn HUF 454 311 329 SDG 12
ISO 14001 certifications in proportion to revenue
% 66 67 65 SDG 12
'n.a.' indicates where no data is availableData was calculated according to GRI definitions.(1) The Sustainable Development Goals (SDGs) launched by the United Nations is an important proxy linking MOL Group SD performance to national and
supranational sustainable development aspirations.(2) GHG emissions according to the share of equity in the operation. Upstream Joint Ventures (INA offshore, Egypt, Angola, UK offshore, KRI) are excluded.
Slovnaft Power Plant is included.(3) Market based Total Indirect GHG (scope-2) is for EU operation only(4) Scope 2 GHG emission is calculated based on location based Indirect GHG(5) Scope 2 GHG emission is calculated based on location based Indirect GHG(6) Spills excluding spills from road accidents from 2014 onwards
203

Indicator Note Unit 2015 2016 2017GRI
Standard code
SDG linkage
Health and Safety
Safety Indicators
Lost Time Injury (LTI) – employees 3.1 79 70 86 403-2 SDG 3
Lost Time Injury (LTI) – contractors(2) 3.1 21 21 31 403-2 SDG 3
Lost Time Injury Frequency (LTIF) – All
3.1 1.04 1.00 1.21 403-2 SDG 3
Lost Time Injury Frequency (LTIF) – employees
3.1 1.77 1.67 1.97 403-2 SDG 3
Lost Time Injury Frequency (LTIF) – contractors(1)(2)
3.1 0.41 0.42 0.58 403-2 SDG 3
Total Recordable Injury Rate (TRIR) – All
3.1 1.44 1.34 1.53 403-2 SDG 3
Total Recordable Injury Rate (TRIR) – employees
3.1 2.35 1.98 2.38 403-2 SDG 3
Total Recordable Injury Rate (TRIR) – contractors(2)
3.1 0.66 0.79 0.83 403-2 SDG 3
Total Reportable Occupational Illnesses Frequency (TROIF)
3.2 0.00 0.00 0.00 403-2 SDG 3
Lost day rate (LDR) 3.1 % 0.16 0.09 0.09 403-2 SDG 3
Absentee Rate (AR) 3.1 % 3.17 4.09 4.27 403-2 SDG 3
Number of fatalities – employees 3.1 1 0 0 403-2 SDG 3
Number of fatalities – contractors – on-site
3.1 4 0 2 403-2 SDG 3
Number of fatalities – contractors – off-site
3.1 1 2 2 403-2 SDG 3
Number of fatalities – third parties 3.1 3 21 6 403-2 SDG 3
Process safety events (Tier1 + Tier2) 3.3 41 24 22 SDG 3
Human Capital
Employees by employment type and gender
Total workforce 4.2 no of persons 25,959 24,986 26,046 102-8 SDG 8
o/w part-time employees 4.2 no of persons 380 409 410 102-8 SDG 8
o/w full-time employees 4.2 no of persons 25,579 24,577 25,636 102-8 SDG 8
Leavers 4.2 no of persons 3,229 3,100 2,639 102-8 SDG 8
Number of new hires 4.2 no of persons 3,142 3,009 2,543 401-1 SDG 8
Employee turnover rate 4.2 % 12.4 12.4 10.1 401-1 SDG 8
Employees with potential access to trade union membership
4.4 % 94.9 96.1 93.6 304-1 SDG 8
Employees with potential coverage of collective bargaining agreements
4.4 % 91.5 89.0 87.9 304-1 SDG 8
Proportion of women in total workforce
4.2 % 22.0 24.3 24.1 405-1 SDG 5
Proportion of women in non- managerial positions
4.2 % 21.9 24.3 24.2 405-1 SDG 5
Proportion of women in managerial positions(3)
4.2 % 23.8 24.2 22.6 405-1 SDG 5
NOTES ON SUSTAINABILITY PERFORMANCE

Indicator Note Unit 2015 2016 2017GRI
Standard code
SDG linkage
Trainings
Average hours of training per employee
4.3 hours 34 28 29 404-1 SDG 4
Avg. training cost per employee 4.3 th HUF 114 97 106 404-1 SDG 4
Total training cost 4.3 mn HUF 2,970 2,418 2,583 404-1 SDG 4
Communities
Social Indicators
Donations 5.2 mn HUF 1,898 1,571 1,474 203-1 SDG 1
In-kind giving (products and services)
5.2 mn HUF 34 31 39 203-1 SDG 1
Corporate volunteering 5.2 hours 6,085 7,265 7,519 203-1 SDG 1
'n.a.' indicates where no data is availableData was calculated according to GRI definitions.(1) First reported in 2013. Single service companies of MOL Group are considered in LTIF-employees indicator. In part due to this reason contractor LTIF is significantly lower.(2) Contractors include filling station staff.(3) Including top, and mid-managerial (general and first-line management) levels
Indicator Note Unit 2015 2016 2017GRI
Standard code
SDG linkage
Economic Sustainability
Economic Data(1)
Revenues bn HUF 4,268 3,628 4,218 201-1 SDG 8
Financial assistance received from government
bn HUF 1.5 1.7 1.9 201-4 SDG 8
Operating costs bn HUF 3,195 2,648 3,169 201-1 SDG 8
Company cash bn HUF 1,073 980 1,050 201-1 SDG 8
Employee wages and benefits bn HUF 267 240 256 201-1 SDG 8
Capital investors bn HUF 211 125 112 201-1 SDG 8
Payments to governments bn HUF 107 115 101 201-1 SDG 8
Economic value retained bn HUF 488 499 580 201-1 SDG 8
R&D spendings mn HUF 2,904 3,679 3,126 SDG 9
R&D spending on renewables in downstream
mn HUF 232 329 351 SDG 7
Customer Satisfaction(2)
Wholesale fuel customer satisfaction 6.6 % 89.5 86.4 85.0 102-43
Fuel Card customer satisfaction 6.6 % 88.6 87.0 86.5 102-43
Ethics(3)
Ethical notifications 6.2 cases 90 93 110 102-17 SDG 10
Ethical investigations 6.2 cases 58 63 66 102-17 SDG 10
Ethical misconduct(4) 6.2 cases 27 26 33 102-17 SDG 10
Total investigations performed by Corporate Security
6.2 cases 1,241 1,222 1,358 205-3 SDG 10
Total number of misconduct revealed by Corporate Security
6.2 cases 562 578 632 205-3 SDG 10
'n.a.' indicates where no data is availableData was calculated according to GRI definitions.(1) Data is calculated according to GRI definition, see in details on MOL's website(2) Customer satisfaction measurement varies by business. The figures have changed to percentage as Croatia switched to a 1-6 customer satisfaction range,
from the previous 1-5. The percentages are simple averages drawn from surveys done on Wholesale Fuel customers and Fuel Card customers. 2017 average comprises Romanian and Croatian survey results. Further details can be found in the Customer section of the report and on MOL Group website.
(3) Ethics data excludes retail customer complaints initially registered as ethical issues(4) The investigations which commenced in 2016 and closed in 2017 revealed an additional 2 cases of misconduct, resulting in a total of 26 case of misconduct
for 2016. At the end of 2017 2 investigations were in progress.
205

1. CLIMATE CHANGEACHIEVEMENTS:
MOL Group, as part of the NEXT-E consortium, was selected by the EC for co-financing through the Connecting Europe Facility to place 252 EV chargers along the main transportation routes in six CEE countries where MOL is present through its retail network with the aim to create a continuous and interoperable charging network.
Newly implemented energy efficiency actions resulted in a saving of CO2 emission of 37 thousand tonnes in 2017.
CHALLENGES:
2018 is expected to be heavily focused on sustainable finance and the future of plastics, as the EU High Level Expert Group on Sustainable Finance released its final recommendations to the European Commission whilst the European Strategy for Plastics in a Circular Economy was published.
Increasing share of clean energy transportation, alongside increasing fuel efficiency displacing traditional fossil fuel based transportation.
RISKS
The management of climate change related risks is part of the risk management process of MOL Group. Risks are assessed and miti-gated within the framework of Enterprise Risk Management (ERM) covering business units and functional units, which ensures incorporation of risks faced by the company into risk maps. The risk assessment activity supports stable and efficient operation by identifying key risks that threaten the achievement of company objectives and require specific attention by top management. The Finance and Risk Management Committee of the Board of Directors reviews risks on a regular basis, including responsive measures for managing overall risk to MOL, including climate change related risks.The following areas are considered to represent the most significant climate change related risks to MOL Group for the time horizon leading up to 2030: the new, revised framework of the European Emissions Trading System (ETS), more biofuels with a focus on advanced, waste-based fuels, fuel efficiency, alternative fuels infrastructure, electrification and digitalization of transportation, potential energy efficiency obligation on transport sector, increasing consumer demand for sustainable plastics solutions alongside legislative actions on preventing and reducing plastics use and waste. The financial impact of each of these is estimated to range between HUF 1.4 – 33 bn per year.
OPPORTUNITIES
The Clean Energy along with the Driving Clean Mobility Package – a set of EU regulations – may have a significant impact on the long-term demand for fossil fuels and energy. Besides defining obligations, it also opens up new business opportunities in the area of “clean fuel/energy”. In the long term, customer preferences may shift towards more environmental friendly products, which will impact the industry. The projected increase in the electrification of transportation and the steady increase of electric vehicles will likewise create new business opportunities for companies that offer continuous, cost-effective and interoperable charging network. Furthermore, the projected increase in European plastic recycling rates driven by European Strategy for Plastics in a Circular Economy will create new business opportunities through greater integration of recycling activities. MOL Group’s 2030 Strategy takes into account these scenarios and defines a trajectory for the group which expects to tap into opportunities over the long term.
1.1. FUTURE PRODUCT PORTFOLIO
Related objective: “Maximize the share of low-carbon products and services”
MOL Group continuously assesses the opportunities for new investments with the aim of broadening and diversifying its portfolio of activities. With the 2030 MOL Group Strategy, the development of R&D culture, organization and activities will be increasingly in focus. This chapter focuses on a specific number of developments that may contribute in the short and/or long term to improving the envi-ronmental performance of the Group’s current and future product portfolio.In 2017, MOL Group continued implementing activities related to developing and deploying technologies that can contribute to the reduction of the Group’s GHG footprint. Several downstream projects targeted the smart and value-generating utilization of plastics, automobile interiors, as well as different types of waste. In addition to ongoing activities, new initiatives were launched during 2017. Following a successful biofuel strategy development, a task force was founded with the goal of assessing advanced biofuel produc-
NOTES ON SUSTAINABILITY PERFORMANCE

tion business opportunities. Complementing the renewable fuel initiatives, the assessing of plastic production based on renewable feedstock was also started in 2017.
REFINING DEVELOPMENTS
One of the main product groups that has been the focus of sustainability improvement efforts has been fuels. In 2017, this focus was widened as an investigation into ways for making the MOL Groups petrochemicals operations more sustainable was carried out. During the project, renewable alternatives to currently utilized petrochemical monomers were assessed. This work supports the launch of future projects that will offer customers long term petrochemical solutions with reduced environmental impacts. Addition-ally, the scouting and assessment of different technology routes for the utilization of carbon dioxide as chemical feedstock continued in 2017. Despite its general potential, none of the investigated opportunities was considered for further development under the actu-ally projected technical and commercial frame conditions.
Advanced renewable fuelsAdvanced biofuels are materials that are produced from a select list of materials, defined by the Renewable Energy Directive II. The materials available in the biggest volume from the list are lignocellulosic wastes, such as corn stover or sawmill dust. As all Euro-pean fuel suppliers are to be using advanced biofuels from 2021, MOL Group is continuously working on the development of technol-ogies that could be used to produce these fuels. As one of these technologies was progressing, emphasis was placed on scaling up the project and so the construction of a continuous mode reactor was started. After a successful designing and construction, this reactor is currently being put into operation. The utilization of advanced feedstocks in the long run could not only result in environmentally friendly fuels, but would provide huge added value to currently underutilized agricultural wastes, potentially leading to the devel-opment of new job opportunities.
Renewable diesel productionIntense work was started in 2017 to ensure a smooth implementation of renewable diesel co-production in one of the gasoil hydro-treaters of the Danube Refinery Gasoil through feedstock expansion. Several types of waste fats and oils that could be utilized in the unit were tested in laboratory scale. For three of the tested materials, the investigation was already concluded with positive results, the projects is going to continue in 2018 however, as there are still renewable diesel feedstocks candidates to be tested. Diesel fuels produced from waste fats and oils have largely decreased CO2 emission compared to fossil fuels.
Advanced biofuel production from lignocellulosic biomass in the 4REFINERY projectIn 2017, MOL Group joined forces with an international consortium to work on developing and demonstrating the production of next generation biofuels. Funded by the EU Horizon 2020 program, this work will last until 2021. In the project, the liquefaction of agri-cultural and forestry waste, and the refinery-integrated upgrading of the resulting liquids into high quality fuels will be investigated. The partners in the four year-long cooperation consist of both industrial and academic institutions from several European countries. The investigated approaches for liquefaction are fast pyrolysis and hydrothermal liquefaction, and the introduction of their prod-ucts into refining will be solved through co-processing approaches. The outcome of this project could prove to be an environmentally friendly fuel that may allow European farmers to tap into currently underutilized and renewable resources.
PETROCHEMICAL DEVELOPMENTS
The polyethylene and polypropylene grades manufactured by MOL Group are the raw materials for many different plastic products used in all areas of life. In this respect, MOL Group is dedicated to providing value-added, safe and sustainable polymer solutions, which address the needs of direct customers, as well as those of end-users.
Non-phthalate polypropylene product portfolioIn 2017, MOL Group continued the development of a project which targets replacement of the catalyst systems used for production of its polypropylene (PP) portfolio with non-phthalate catalyst alternatives. The driver for this project was to exclude the possibility that traces of phthalate decomposition by-products (phthalates are part of the traditional catalytic system) may end up in final plastic products. The completion of a series of successful tests led to the full replacement of the traditional catalyst system to a novel non-phthalate catalyst. As a result, all PP grades manufactured by MOL Petrochemicals will be phthalate free as of 2018.
Reduction of volatile organic compounds (VOC)To address increasing customer demand for polypropylene grades with reduced levels of VOC, mainly for automotive interiors, MOL Group entered into a new collaboration with one of its technology providers. Based on the first trials, VOC content can be significantly decreased with the help of the new catalyst systems. Plant trials with the newest developed catalytic system were conducted throughout 2017 and will continue in 2018.
207

Reducing the weight of plastic products to save energy and reduce plastic waste In 2017, MOL Group was working on the development of a new polypropylene grade with a unique combination of mechanical and impact properties, offering high potential for wall-thickness reduction. Initial results from the development are promising, and it is expected that the new product will be launched during 2018.
GEOTHERMAL DEVELOPMENTS
MOL Group is in the process of planning the development of its first deep geothermal project to utilize geothermal energy as a renew-able energy source. There are clear opportunities to leverage on given the knowledge and technological expertise that has been accu-mulated within the company as well as the favourable geological potential of this energy source in Central-Eastern Europe. After winning a concession tender and signing a concession contract for the Jászberény Geothermal Exploration in H1 2014, CEGE Ltd. (fully owned by MOL Plc.) initiated an exploration program. The official two-year exploration period started in March 2015. In 2015-2016 a thermal production well was drilled. The exploration phase was extended by one year in March 2017 and in Q2 2017 a short well test was performed, which satisfied all the pre-determined success criteria. In H2 2017 the planning of one long well test was concluded.
BIOFUEL SOURCING
MOL Group does not produce biofuels, but two of its companies (MOL Plc. and Slovnaft) have minority shares in joint ventures that are involved in the production of biodiesel. These companies operate independently from MOL Group and are considered financial investments.In 2017, MOL Plc. and Slovnaft a.s. purchased 468 million litres of bio-components for the purpose of blending it into petrol and diesel products. MOL Group uses both conventional and waste-based biofuels only from sustainable sources. These are produced from certified renewable sources and from waste feedstock, including used cooking oil which is collected through the service station network of MOL Group.The bio-components purchased in 2017 comply with the requirements of the EU Renewable Energy Directive. MOL Group compa-nies (MOL Plc., Slovnaft a.s. and INA d.d.) comply with the European ISCC (International Sustainability and Carbon Certification System) as distributors. ISCC certifies the entire supply chain of bio-based feedstocks and renewables to ensure the application of strict ecological and social sustainability standards, greenhouse gas emissions savings and traceability throughout the supply chain.
1.2. ENERGY EFFICIENCY AND GHG EMISSIONS
GHG EMISSIONS
Related strategic objectives: “By 2020 decrease direct and indirect GHG emissions by 200 thousand tonnes of CO2 equivalent through energy efficiency
initiatives in Downstream” “By 2020 decrease GHG emission from flaring and venting by 200 thousand tonnes of CO2 equivalent in Upstream”
In 2017, the total direct CO2 emissions of MOL Group amounted to 7.05 million tonnes of CO2 equivalent. This is 15% more than in 2016, when emissions came to 5.98 million tonnes of CO2 equivalent, and 12% more compared to 2013 (6.21 million tonnes). The single largest component of such GHG emissions is carbon-dioxide (CO2), the emissions of which are shown in the chart below on a country basis.
NOTES ON SUSTAINABILITY PERFORMANCE

CO2 emissions by country (t)8,000,000
7,000,000
6,000,000
5,000,000
4,000,000
3,000,000
2,000,000
1,000,000
0
Hungary Slovakia Italy Other Croatia
2013 2014 2015 2016 2017
Several factors influenced emissions trends in 2017, as explained below. The increase in the CO2 emissions was mainly driven by the acquisition of the CM European Power Slovakia (more than 0.7
million tonnes of CO2 emissions) while the remaining 0.3 million tonnes of CO2 emissions are attributed to increased produc-tion in both upstream and downstream business.
Energy efficiency programs and initiatives continue to bring savings (see the separate Energy Efficiency chapter for details). In 2017 the first three projects financed by the MOL Group Green Fund have been finished and three more projects have
been prepared to start. The combined CO2 emissions saving from the already implemented projects is 1227.4 tonnes of CO2 emissions per year. The Green Fund was established in MOL Group in 2016 under the Sustainable Development 2020 Action Plan and is designed to support investment projects with outstanding environmental benefits.
Combustion (heat, steam, electricity) Flaring Venting Physical/chemical processing
Changes in GHG emissions between 2016 and 2017
7,6
7,2
6.8
6.4
6.0
5.6
5.2
4.8
4.4
mill
ion
tonn
es C
O2eq
.
Increasedventing inCroatian
E&P
Otheroperational
changes
EnergyEfficiencyProjects
CMEPSpowerplant
acquisition
2016 2017
Increasedproduction
in HungarianDownstream
Refining and Petrochemical operations are the primary GHG emissions sources of MOL Group. MOL Group has been moni-toring the GHG performance of its refining businesses since 2010 using the CONCAWE – Solomon CO2 intensity indicator (CWT – Complexity Weighted Tonnes). In a similar manner, for the petrochemical business, MOL Group uses an indicator of the production of high value chemicals (HVC). These indicators are production-based and they take into account the complexity of the installations.For upstream business performance is monitored using the IOGP standard indicator – kg CO2/toe.The results presented below indicate a minimal decrease in carbon intensity (–0.44%) for the refining sector compared to 2013, and a 0.4% decrease for the petrochemical sector (these variations in the refining sector are due to increases/decreases of production based on market demand, turnarounds/shutdowns operations carried on in 2017 that determines a higher CWT factor in some of the units).
209

CO2 intensity (production-weighted average) of refineries and petrochemical sites of MOL Group [GRI Standard 305-2]
Year 2013 2014 2014 2016 2017Change
2013-2017 (%)
Refining (t CO2/kt CWT) 35.59 35.54 37.94 33.36 35.42 (0.44)
Petchem (t CO2/t HVC) 1.02 1.02 1.04 1.02 1.02 (0.4)
Change in CO2 intensity by refinery (t CO2/kt CWT) and by petrochemical site (t CO2/t HVC) [GRI Standard 305-2]
Site
Refining Petrochemical
Duna Refinery
(MOL)
Bratislava Refinery
(Slovnaft)
Mantova (IES)
Sisak (INA)
Rijeka (INA)
MOL Slovnaft
Slovnaft Petro-
chemicals
CHANGE (%) 2017/2013
(13.75) 11.62 0 7.38 (8.18) (1.58) (1.99)
SCOPE 3 GHG EMISSIONS
MOL Group accounts under Scope 3 emissions those GHGs emitted from the value chain which are not directly related to company operations. Such emissions are typically the result of the use of refinery products or natural gas by customers, or are generated by suppliers who provide services to MOL Group. MOL Group reports on Scope 3 emissions in order to provide a context for its direct emissions, and to increase the transparency of its total footprint.
Scope 3 GHG emissions by origin (t CO2) [GRI Standard 305-3]
Emitted by Source of emission 2013 2014 2015 2016 2017
Customers Use of purchased refinery products (t CO2) 51,060,438 48,486,612 50,571,763 51,848,469 53,733,712
CustomersUse of purchased natural gas (own production) (t CO2)
6,566,103 6,025,497 6,247,138 5,921,792 5,815,669
MOL Group Business trips (t CO2) 4,414 2,984 2,508 2,335 2,253
SuppliersProduction of crude oil (purchased from external sources) (t CO2)
1,399,445 1,179,981 1,203,727 1,371,241 1,476,611
Total 59,030,400 55,695,074 58,025,136 59,144,406 61,028,245
Scope 3 emissions increased in 2017 compared to 2016, mainly as the result of the increased volume of products sold to customers. Also, supplier-side GHG emissions increased as a result of increased crude processing.Although accounting for a small share of total MOL Group emissions, business trip-related CO2 emissions are also tracked and reported. These business-travel-related emissions decreased in 2017 by 3.5% when compared to 2016 and almost reduced to half as compared to 2013 due to the new communication technologies and newer fleet.
FLARING AND VENTING
Flaring refers to the controlled burning of hydrocarbons for technical or safety reasons. The gas flared in Exploration and Production is typically ‘associated petroleum gas’ (APG), while in Downstream gases generated during the refining process are usually flared for safety reasons. Oil and gas leakages are considered to be losses of valuable material that represent operational inefficiency. Venting of gas refers to release without burning. In E&P, venting occurs when the main component of the associated gas is carbon-dioxide (CO2).Flaring is important from both an environmental point of view and the perspective of operational efficiency. In recognition of the importance of this topic, MOL Group in 2015 decided to join the Zero Routine Flaring Initiative of the World Bank.The amount of gas flared during MOL Group’s activities is shown in the tables below.
Flaring in E&P activities (for which MOL Group is operator) in 2017 [GRI OG6]
Flaring in Upstream activities in 2016
MOL US INA US MOL Pakistan Russia Total
Flared hydrocarbon (tonnes) 18,989 7,081 7,245 616.19 33,931
CO2 (tonnes) 33,350 41,944 21,276 683 97,254
In Exploration and Production the reported volume of flaring increased by 6% as compared to 2016, driven by the well testing activ-ities at the Hungarian sites.
NOTES ON SUSTAINABILITY PERFORMANCE

Flaring in Downstream activities in 2017 [GRI OG6]
Flaring in Downstream activities in 2016
MOL Refining
Slovnaft (Refining +
Petrochemicals)
INA (Rijeka+Sisak
refineries)
MOL Petrochemicals
Total
Flared hydrocarbon volumes (tonnes)
6,071 19,760 21,923 15,031 62,785
CO2 (tonnes) 13,235 40,683 70,075 50,654 174,648
All downstream production is located in the EU, where flaring is used only for shutdowns, start-up operations or in the case of emergencies, as per legal requirements. In MOL Group’s downstream operations, there was an overall decrease of 12% in the amount of gases flared. This result was mainly driven by the changes in the calculation model of one of the Croatian production site and the installation of a flare gas recovery system at one of the Hungarian production site coupled with a better flare monitoring and reporting system put in place.
ENERGY EFFICIENCY
Energy efficiency projects continued during 2017 throughout the group, most notably through the Next Downstream Program (NxDSP). MOL Downstream completed two 3-year efficiency programs during the last 6 years, 2017 being the final year of the NxDSP. During its last year, the NxDSP contributed with 35 thousand tons of CO2 savings during the year, amounting to total savings of around HUF 230 mn. This is a significant reduction from previous years, mostly as a result of a natural slowdown in the number and intensity of energy saving initiatives following five year period. A significant part of the NxDSP savings came from steam consumption optimization alongside a number of smaller actions at MOL Petrochemicals. Additional contributing saving initiatives included the continued installation of LED lighting across services stations through the Group’s green fund, replacement of aging boilers and reduction in steam losses throughout Croatian Upstream operations, as well as reconstruction of the produced water reinjection system in Hungary.
2. ENVIRONMENTGeneral aim: "Reduce environmental footprint"
ACHIEVEMENTS: All exploration and production sites that are considered critical now have in place biodiversity action plans and the list of
critical sites across MOL Group has been revised. Decreased flaring in MOL DS production by 50% due to technological improvements and better models for monitoring and
reporting of the quantities of flared gas. The quantity of water sent to evaporation ponds in Pakistani operation has decreased by 99% due to investments in the rein-
jection technologies in exploration and production facilities.
CHALLENGES: Air and GHG emissions have increased, against the set targets, due to acquisitions and increased production/different
quality of crude. The volume and number of hydrocarbon spills above 1 m3 remains high, despite the set target. Freshwater withdrawal increased due to the acquisition of the CM European Power Slovakia and yearly change in produc-
tion capacity that is based on market demand. The ratio of reused/recycled waste continue to decrease in 2017
2.1. AIR EMISSIONS
Related strategic objective: “By 2020 reduce NOx and SOx emissions by 15% respectively”
MOL Group operates a wide range of oil and gas technologies and equipment, and the industry itself is considered to be a significant source of air pollutants. MOL Group is constantly monitoring these emissions and has programmes in place to reduce its volatile organic compounds (VOC), SO2, NOx, CO and Particulate Matter (PM) emissions.
211

A leak detection and repair programme (LDAR) has been ongoing in MOL Group since 2010, coupled with a programme for improving the monitoring and reporting of such emissions. Every year, the scope of the LDAR programme has been extended to cover more units. This explains the reported increase in VOC emissions between 2012 and 2015 but a decrease starting with 2015. Beside the LDAR programme, the VOC decreased is also due to a number of investment projects that were implemented in the last couple of years for the installation of VRU units in all business segments.
Total air emissions (excl. GHG) by type (tonnes) [GRI Standard 305-7]
Year 2013 2014 2015 2016 2017Change
2013-2017 (%)
SO2 5,776 5,368 6,146 7,077 8,996 56
NOx (Nitrogen Oxides) 6,057 4,715 5,175 5,718 7,453 23
VOC (Volatile Organic Compound) 5,643 5,251 7,950 4,695 4,503 (20)
CO (Carbon Monoxide) 4,248 2,275 2,309 1,560 1,694 (60)
PM (Particulate Matter) 552 367 353 274 330 (40)
The SO2 emissions and NOx emissions continued to rise. The 56% increase in SOx and 23% increase in NOx during the 2013-2017 period is mainly attributable to a combination of an increase in E&P production volumes, increasing refinery production in Croatia alongside the use of lower quality of fuel gas, as well as inorganic expansion through the acquisition of the CM European Power Slovakia (CMEPS) supplying the Bratislava refinery. Compared to 2016, NOx and SO2 emissions increased year on year at a higher pace than previous years. The increase was primarily driven by the acquisition (and integration) of CMEPS in early 2017. Addi-tionally, the overall increase in air emissions was caused by increasing flaring of off-gases containing higher H2S content at the Bratislava Refinery. This increase was triggered by prolonged technological turnarounds and unplanned shutdowns of produc-tion units. Furthermore, higher sulphur content in processed crude oil in both Bratislava and Sisak refineries contributed to the increase. In Rijeka, refinery processing increased, fuel for own consumption rose, and sulphur content in processed crude was higher, whilst Sisak saw the coking plant working longer versus 2016. Finally, higher nitrogen content in fuel oil as well as higher secondary production due to alternative processing contributed to the increase.CO and PM emissions continued to decrease compared to 2013 (with 60% and 40% respectively), but an increase has been registered in the year on year data due to the acquisition of the CM European Power Slovakia.
2.2. WATER MANAGEMENT
Related objective: “Improve water management techniques in water-stressed areas”
The water used for different operational activities at MOL Group comes from various sources: it may be surface or groundwater, the municipal water supply, sea water, harvested rainwater or wastewater from production or other organizations.MOL Group is aware that improving water efficiency not only reduces its environmental footprint but often leads to a reduction in operating costs.In 2017, MOL Group’s total water withdrawals amounted to 95.96 million m3, which represents an increase of 2% compared to 2013 (94.51 million m3) and a 13% increase as compared with 2016 figures. The tendency is attributable to the acquisition of the CM Euro-pean Power Slovakia and yearly change in production capacity that is based on market demand.
Total water withdrawals by source (thousand m3) [GRI Standard 303-1]
Year 2013 2014 2015 2016 2017Change
2013-2017 (%)
Municipal Water Supplies or Other Water Utilities 2,682 2,177 12,295 14,913 16,885 530
Surface Water Withdrawals 50,218 46,929 39,231 38,045 42,583 (15)
Ground Water Withdrawals 11,869 10,755 10,971 9,932 10,836 (9)
Rainwater Collected and Stored – 188 158 41.2 8
Wastewater from Other Organizations – 91 209 929 301
Total fresh water withdrawals 64,769 60,140 62,866 63,860 70,312 9
Non-fresh water withdrawals 29,749 33,990 21,790 21,315 25,351 (15)
Total water withdrawals 94,518 94,130 84,655 85,175 95,663 1
NOTES ON SUSTAINABILITY PERFORMANCE

The variability in the quantities of Municipal Water or Other Water Utilities and Surface Water withdrawals between the period 2013/2017 and last three years is explained by the increase in the use of water from these sources at the Croatian refineries, while at the same time less non-fresh water for cooling was used (down 15%).
Total fresh water withdrawal (million m3) by country [GRI Standard 303-1]
Hungary Slovakia Italy Other Croatia
Total water withdrawal by country (million m3)
120
100
80
60
40
20
02013 2014 2015 2016 2017
In the past years, MOL Group also started to monitor the water efficiency of its main production sites.
Water intensity (million m3) – production site type8.00
7.00
6.00
5.00
4.00
3.00
2.00
1.00
0.002010 2011 2012 2013 2014 2015 2016 2017
Petchem Average Refinery Average with seawater Refinery Average w/o seawater
In 2017, MOL Group continued to implement a variety of initiatives in order to increase the Group water efficiency:
At one of the Hungarian logistic site, a glycol cooling tower was installed replacing an older one that was functioning on water. As result, between 5,000 and 6,000 m3 of water will be saved annually. Also, at the Hungarian gas processing plan, a new water treatment technology was installed. The water treated in this way, will replace the drinking water that was used before for compressors cooling.
Besides making a significant reduction in CO2 emissions, the enhanced oil recovery (EOR) project at Croatian Upstream facilities resulted in water savings. Formation water produced by the EOR project is now used to maintain reservoir pres-sure, and for well workovers, avoiding the use of fresh water. At the same time, a project for the reconstruction of the cooling towers is on-going, expected to bring saving in water usage due to lower evaporation loses.
WATER DISCHARGES
Water discharge figures fluctuated compared with 2013, and also 2016. Compared to previous years, the total amount of water discharged continues to decrease.TPH registered a 41% decrease compared to 2013 due to ongoing improvement projects and a 38% decreased when compared with 2016.
213

This trend is attributable to a better water quality at the Hungarian site as well as to a lower polluted water throughput at the Slovakian site.BOD and COD discharges decreased compared to 2016 by 5% and 2% respectively, and also decreased compared with 2017 data (by 4% and respectively 19%). These trend towards annual decreased can be explained by an important improvement registered at one of the Croatian facilities due to investments, as well as lower water pollutants load due to turnaround at the Slovakian facilities. TSS has increased as compared with 2013 by 21% but has decreased as compared with last year by 11% (the increase was mainly due to an improvement in the sampling/analysing system at one of the Hungarian petrochemical site).
Amount of contaminants (tonnes) [GRI Standard 306-1]
Year 2013 2014 2015 2016 2017Change
2013-2017 (%)
Total Petroleum Hydrocarbons (TPH) 63 95 38 61 38 (41)
Chemical Oxygen Demand (COD) 1,712 1,647 1,514 1,739 1,650 (4)
Biological Oxygen Demand (BOD) 417 471 307 344 339 (19)
Solid Substances (TSS) 609 873 765 835 740 21
Efforts to improve the quality of discharge waters, as well as reporting coverage, will continue in the future. For example, at a Slovak facility, a project to enhance the protection of Little Danube River was implemented. The objective of the project was to increase the protection of the river against industrial contamination. All project activities were aimed towards using technical means for early identification and capture of crude oil substances which could in extraordinary events contaminate cooling water and rainwater. In 2018 the project will continue with the second phase that is focused on increasing the retention capacity in case of accidental leakages of water soluble contaminants.At a Croatian seashore site, the results of sea quality testing were excellent on all beaches belonging to the Municipality of Kostrena given previous year’s spill. The Institute of Public Health Primorsko – Goranska County continuously examines the quality of the sea and marine sediments around the technological area.
PRODUCED WATER
Significant quantities of produced water are managed by the group’s exploration and production facilities. During 2017, over ten million m3 of water was produced (9.72 million m3 in EU countries, and 0.40 million m3 in non-EU countries). In order to minimize MOL Group’s impact, the company aims to re-inject, whenever feasible, the produced water.Compared to 2016, the amount of produced water at EU operations has slightly increased (2%) due to higher activity level, while in non-EU countries it decreased (35%).At all EU operations, produced water is re-injected, and starting with last year, in Pakistan, the water reinjection system became fully operational. As result, the water quantities that are sent to the evaporation ponds has been reduced by 99%.
Quantity of produced water from Exploration & Production activities in 2017 (m3) [GRI OG5]
EU operationsNon-EU
OperationsTotal
MOL Group
Amount of produced water 9,729,739 403,217 10,132,956
Total amount of re-injected produced water 10,870,151 441,476 11,311,618
Water sent to evaporation ponds 0 710 710
The proportion of re-injected water is higher than 100% because it covers the total amount re-injected. Water re-injection takes place at Exploration and Production sites to maintain underground pressure, and additional water is also injected to increase pressure.
WATER-STRESSED AREAS
Water scarcity refers to either a lack of water (quantity), or a lack of access to good quality (safe) water. MOL Group considers water scarcity to be a major issue and as such has been taking measures to decrease the water demand of its operations. Only a minor part of Upstream operations are in potentially water-stressed areas.MOL Group’s exploration and production facilities in Europe are not located in water-scarce areas, but the group is committed to continuously reducing its demand for water (see the water withdrawal reduction data and projects described above) and reducing water pollution as well.Actions have been taken to assess the situation in more depth with international operations which, according to external studies (such as water availability maps from the World Resource Institute), are situated in potentially water-scarce areas in Pakistan.
NOTES ON SUSTAINABILITY PERFORMANCE

As a result, a detailed hydrological study of the Teri water basin (Pakistan) was carried out with the aim of assessing available water resources and the potential impact of the group’s operations. The study concluded that, due to local circumstances, MOL Group’s operations are not disturbing the water balance, and that water resources are satisfying the needs of the surrounding six villages and of MOL Pakistan. MOL Group does not use any water in processing at its production facilities. Water is used only for drinking and domestic purposes. For drinking purposes bottled water is mostly used instead of local tap water. In the case of seismic and drilling activities, water is also used in the drilling process and for drinking and domestic purposes. However, as a precautionary measure steps have been taken to protect water sources. These measures include periodical analysis of the quality of ground water through monitoring wells, ongoing implementation of the Water Conservation Action Plan developed in 2014, and the use of treated effluent water for gardening purposes. In December 2017 a water conservation awareness campaign was carried out at the sites.
UNCONVENTIONAL EXPLORATION AND PRODUCTION
Unconventional exploration techniques such as reservoir fracking have revolutionised the energy industry, but prompted environ-mental and community concerns. One of the main concerns is that fracking uses huge amounts of water that must be transported to the fracking site at significant environmental cost. Another important concern is that potentially carcinogenic chemicals may escape and contaminate groundwater around the fracking site. The third and most important concern is that the fracking process can cause small earth tremors. Although MOL Group is not directly involved in unconventional exploration, realizing the sensitivity of the issue it has defined a set of environmental standards for responsible limited enhanced recovery methods to enhance the production of conventional fields.These requirements encompass stakeholder concerns, water / land-use and protection, well-integrity, the use of chemicals and other risks which are anticipated from specific risk studies. MOL and its subsidiary INA have successfully undertaken enhanced recovery on a few pre-existing wells during which all risks were managed during the entire life-cycle of the activities, from contracting to cessation of production.
2.3. WASTE MANAGEMENT, SPILLS AND SOIL AND GROUNDWATER PROTECTION AND SITE RESTORATION
WASTE MANAGEMENT
MOL Group is continuously seeking to decrease its environmental footprint by reducing the amount of waste generated and devel-oping treatment, recycling and recovery solutions. Due to the complexity of operations, waste streams and types are also very diverse. The company’s operations produce a wide range of solid and liquid wastes (including oily sludge, waste chemicals and spent catalysts, etc.).The total amount of waste generated in 2017 decreased by 9% as compared to 2013. As compared with 2016, the total amount of waste generated has decreased by 11%. This decreased may be explained by the following:
More hazardous waste was produced from operations (10%) and emergency measures (19%) as compared to 2016 (due to increased production levels or due to the fact that at several facilities tank cleaning activities were on-going; two large spills have been registered at the Italian operations). The hazardous waste from remediation and construction/demolition activ-ities has decreased considerably (by 69% and 68% respectively). These reductions were due to the fact that the remediation activities from Iraq have been concluded in 2016 (when 10,000 tonnes of remediation waste have been produced) and less demolition/construction activities were carried out across MOL Group in 2017.
More non-hazardous waste from operations (26%) and from emergency measures (78%) have been generated due to turna-round activities in Hungary and Slovakia and due to a process incident in Italy involving the fire-fighting system.
The waste recovery rate decreased in 2017 compared to 2013 by 10%, while the decreased as compared with 2016 was 5%.
Waste generation and treatment (tonnes) [GRI Standard 306-2]
Year 2013 2014 2015 2016 2017Change
2013-2017 (%)
Hazardous Waste 60,528 80,866 97,720 139,032 122,316 102
Non-hazardous Waste 185,528 170,970 183,686 113,894 102,055 (45)
Total Waste Generated 246,056 251,836 276,406 252,926 224,371 (9)
Waste Disposed/Landfilled 86,574 102,413 94,197 107,501 100,013 15.5
Waste Reused/Recycled 159,482 149,423 182,209 145,424 124,234 (22)
Total Waste Disposed and Recovered 246,056 251,836 276,406 252,926 224,247 (9)
Ratio of reused/recycled Waste 65% 59% 66% 61% 55% (15)
215

Several initiatives have impacted MOL Group’s waste generation and waste recycling figures. These include the following: In 2017, the proportion of the spent catalyst recycled at Slovakian operation reached 94,81%. Also, in retail business,
EcoTanks were installed in 5 service stations. Using these new facilities, the customers can re-fill the windshield washer fluid directly from the fuel dispenser, minimising this way the packaging waste generation. Based on the quantity of the liquid sold, an estimated more than 6000 PET bottles of 5 l each was avoided to be placed on the market.
The campaign for the collection of used household cooking oil continued in five countries (Hungary, Croatia, Romania, Serbia and Slovakia). 592 service stations were involved in the programme in 2017 (as compared with 352 in 2016) and a total amount of 273 tonnes of cooking oil was collected, which represents a 15% increase compared with 2016 (when 238 tonnes of cooking oil was collected).
MOL Group is recollecting used oil as well as oil packages, which are treated at own waste management facilities, producing significant amounts of steam or the flux oil needed for bitumen production. Compared to 2016, 17% more used lubricant was collected in 2017 and 10% more packaging waste of lubricants.
Recollected lubricant and lubricant packaging (tonnes)
2016 2017Change
2016-2017 (%)
Recollected and treated lubricants 9,201 10,725 17
Recollected packaging of lubricants 1,149 1,267 10
Total 10,350 11,992 16
From 2015 MOL Group started to centrally collect and report on the quantities of hazardous wastes that are exported/imported at group operations. As for some waste streams there are no proper treatment facilities at the local level, limited amounts of very specific wastes (e.g. refinery catalysts/tank sludge) are exported for treatment to Germany or Austria. The total amount of hazardous waste exported for treatment in 2017 reached 3,067 tonnes (a 22% decrease compared with the 3,930 tonnes of hazardous waste exported in 2015, and a 45% decrease as compared with the 5625 tonnes of hazardous waste exported in 2016). No hazardous waste has been imported in 2017.The Group’s environmental standards define its policy related to managing drilling mud and include regulations about mud selec-tion, waste minimisation, recycling and responsible disposal. Relevant data about this topic are presented below.
Hazardous and non-hazardous waste from E&P activities in 2017 (tonnes) [GRI OG7]
EU operationsNon-EU
OperationsTotal
MOL Group
Hazardous waste from drilling activities, well completion and workover activities
1,122 7,921 9,043
Non-hazardous waste from drilling activities, well completion and workover activities
14,146 1,875 16,021
Waste disposed and recycled from E&P activities in 2017 (tonnes) [GRI OG7]
EU operationsNon-EU
OperationsTotal
MOL Group
Hazardous waste from drilling activities, well completion and workover activities – disposed
211 6,171 6,382
Hazardous waste from drilling activities, well completion and workover activities – recycled
912 0 912
Non-hazardous waste from drilling activities, well completion and workover activities – disposed
4,104 0 4,104
Non-hazardous waste from drilling activities, well completion and workover activities – recycled
10,042 0 10,042
NOTES ON SUSTAINABILITY PERFORMANCE

SPILLS
Related objective: “Reduced the number of spills over 1 bbl by 30% as compared with 2015 baseline”
MOL Group is committed to meeting regional energy needs while maintaining safe and environmentally sound operations. This requires continuous improvement in every phase of operations in which oil is produced, transported, stored or marketed therefore spill prevention measures are taken into account when designing and operating facilities.Due to the danger that oil spills cause to public health and the environment, every effort is made to prevent oil spills and to clean them up promptly once they occur. Regular maintenance and inspection campaigns are conducted and emergency response plans are in place and are constantly updated for each of the sites.For example, at MOL Group retail sites the storage tanks are double walled and leak detection systems are in place in order to prevent soil and groundwater contamination.At Hungarian operations several measures have been implemented during 2017 such as the replacement of more than 7,700 m of pipeline in the exploration & production business. Synthetic resin covering for loading/unloading areas has been applied at some logistic sites and during pipeline reconstruction works, pipes and valves that were placed underground, have been brought to surface and secondary containment has been built for the connection areas.At Slovakian production site, a project to map potential sources of pollution has been started.In 2016, MOL Group has established a strategic objective of reducing the number of spills of over 1 barrel by 30% by 2020. However, local reporting systems have historical data in m3 so a transition period was established to allow changes to be made in reporting metrics.The performance table and the graphs below reflects both m3 and barrels for the last four years but the descriptions offered below are for the spills to environment with hydrocarbon content bigger than 1 m3.
Spills to environment in bbl
45004000350030002500200015001000
5000
Number of spills HC volume of spills in bbl
2014 2015 2016 2017
43 38231.59
4170.36
882.37
Spills to environment in m3
800
600
400
200
0
Number of spills HC volume of spills in m3
2014 2015 2016 2017
5 6 11 10
193.5
16.9
637.1
129.0897.74
29 48
In 2017, a total of 10 own staff spills to environment (of more than 1 m3 of hydrocarbon content), with a total hydrocarbon volume of 129.08 m3 were recorded across MOL Group. This represents a minor decrease in number but a considerable decrease in volume as compared with 2016, where 11 spills to environment were registered with a total hydrocarbon volume of 637.1 m3.This number does not include third party events registered at Pakistani (road accidents) or Italian (thefts attempts) operation. Compared with 2016, the number of spills from road accidents has increased from 7 to 8 but the volume has slightly decreased, from 202 m3 in 2016 to 174 m3 in 2017. Two theft attempts on the Italian pipeline product have been the cause for two large spills to envi-ronment that have happened in 2017: one of 10 m3 and the other of 30 m3.At MOL Group refineries, three spills to the environment were registered with a total volume of 110.9 m3. Two in Slovakia (of 7.3 and 2.5 m3) and one in Croatia with a total volume of 101.1 m3, which was actually a continuation of the spill that started at the end of 2016 and continued into the month of January 2017 until it was stopped.At logistics sites one spill of 1 m3 was registered in Austria due to equipment failure and one spill to environment with a volume of 1 m3 was registered at a retail site in Hungary as result of not applying the company rules in case of some works.At upstream operations, six spills were registered. Three of them in Croatia (1.9, 3 and 1.2 m3) were due to mechanical failure, and three of them in Hungary out of which 2 were due corrosion (4 and 3 m3) and one of them to mechanical failure (3 m3).MOL Group did not operate any off-shore installations in 2017 (MOL Group only participated in offshore exploration or produc-tion activities through joint ventures as a non-operating member). However, MOL Group still ensures that measures are in place to protect marine ecosystems in the vicinity of operations that are located near the coast (e.g. in Croatia at the Rijeka Refinery or the UK and Norwegian North Sea).
217

SOIL AND SUBSURFACE WATER PROTECTION AND SITE RESTORATION
MOL Group is operating in several countries where the legislative guidance on contaminated land management, regulatory levels and management policies may be less developed or detailed. MOL Group is fully committed to a risk-based approach, which is considered to be best practice. MOL Group reviewed its HSE Management system last year in order to develop good practice, to summarize commonly accepted principles, approaches and methodologies. The risk-based management framework is used to address the actual or potential adverse impact(s) of a contaminant present in the soil and/or groundwater on human health and the environment by evaluating the linkage between release of a chemical from a source; the transport or exposure pathway; and the exposure to, and uptake of, the chemical contaminants by the receptor. The risk assessment methodology follows a staged approach, designed to ensure that key elements are addressed in succession and only as needed. The three main stages are the site Characterisation & Assessment, Corrective Action Feasibility & Design and the Corrective Action Implementation & Aftercare.All remedial work is carried out in accordance with the applicable current standards and regulations, and in co-operation with local authorities and communities. Provision for Environmental Expenditure is made for the estimated cost of the remediation of past environmental damages, primarily soil and groundwater contamination, and the waste disposal elimination in Hungary, Croatia, Slovakia and Italy. In the case of active remediation, the typical remedy is ‘pump & treat’ for contaminated subsurface water, and in-situ, ex-situ extractive and the bioremediation technologies for contaminated soil. The most significant ‘pump & treat’ systems are operating in Slovakia, Hungary and Italy. During 2017, 7169 tonnes of hazardous and non-hazardous waste was generated by remediation activi-ties. 69% of the total amount of waste was recycled last year, mainly in Hungary and Croatia. In 2017 the annual cost of soil and groundwater protection activities was HUF 2261 million (USD 8,3 million), which is 82% of planned expenditure. The most significant remediation activities were implemented in Logistics and Refining business sectors.In Hungary the ‘Necklace project’, the remediation hydraulic system at the Tisza site started its test run in 2017. The second protec-tive line implementation is ongoing. In Croatia INA finished its Contaminated Land Management strategy development. INA continued the preparation for the redevel-opment of closed Mlaka site last year. At the Slovak operational sites in 2017, the construction phase of the “Little Danube” project was started. The goal is to install moni-toring equipment in order to improve leak-detection capabilities. At international upstream operational sites, the supervision of site restoration project in Oman completed last year.
2.4. BIODIVERSITY
Related objective: “Implement Biodiversity Action Plans for all critical operation sites”
The activities of the oil and gas industry have a direct and indirect impact on biodiversity. MOL Group recognizes these impacts and the fact that it must operate safely and responsibly in order to protect the natural environment and local communities. MOL Group applies stringent standards to help reduce any impacts its operations may have, particularly in critical habitats (areas rich in biodiversity or which are under protection). For any new major projects, as well as for significant expansions of existing operations, we conduct biodiversity-related studies as a part of environmental and social impact assessment.In 2014 a group-wide assessment was conducted to identify potentially sensitive areas which should be the focus of future efforts. This study has been updated in 2016 to reflect the past three year’s operational changes. As compared with 2014 when MOL Group had surveyed 162 sites, in 2017 203 sites were identified that are in or adjacent to protected areas. However, the assessment re-confirmed the fact that MOL Group’s exposure to biodiversity risks is not very significant. In total, only eight sites are located in biodiversity-critical areas (six Exploration & Production, and two downstream), while 35 Exploration & Production operations are located close to or within Natura 2000 sites (European nature conservation areas). Two of the exploration and production operations are situated in water-stressed areas (see the chapter on Water), while one can be found in a water-protected landscape. All sites that are in located in biodiversity critical areas are covered by biodiversity action plans that are annually reviewed.In addition to these activities, work with external biodiversity experts and local communities to protect biodiversity was also a focus during 2017:
In Hungary the education and the dissemination of knowledge remained in focus. For each site that is close to protected areas, we have prepared educational materials. At the same time, MOL Group has developed a GIS system as a tool to visu-alise the protected areas together with information about upstream facilities like wells, pipelines, sites etc. The system can provide visual and descriptive information about the proximity and the coverage of facilities and all MOL Group employees can access it using a web browser.
In Croatia, at five service stations that are located in the vicinity of protected areas (Lastovo, Karlobag-grad, Jablanac, Učka and Ston), communication materials with basic information about biodiversity issues were printed and distributed to customers with the aim of raising awareness about the importance of biodiversity. At the same time, for the personnel of Rotary (drilling company), a biodiversity awareness training regarding Natura 2000 protection principles has been organized.
NOTES ON SUSTAINABILITY PERFORMANCE

In Slovakia, the partnership between the NGO SOS Bird Life Slovakia and the refinery has continued. The avifauna in the area of the refinery has now been studied by ornithologists for more than ten years. These efforts have been complemented by the now-regular annual volunteering of Slovakian employees that helps maintain the habitat of Bird Island which is situated in the vicinity of the production site.
2.5. HSE COMPLIANCE
In 2017, MOL Group paid penalties for Health, Safety and Environment-related breaches of rules in 32 cases, resulting in total penalties of HUF 15.4 million (USD 56,370). The single largest penalty (USD 15,330) was awarded to TVK Power Plant for air quality non-compliance from 2016 (Penalties are reported in the month and year when they were paid). Other penalties involved minor costs and are in most cases related to the violation of water of air legislation and/or incorrect site documentation.
3. HEALTH AND SAFETYACHIEVEMENTS:
HSE Leadership Engagement Program continued in 2017 with train-the-trainers courses for 1500+ sessions. Unconscious behaviour program (in cooperation with Institute Bruno Schmaeling) launched to avoid unconscious human
errors while at work (slips & trips and similar type incidents). A new Hand Protection Program was launched in Petrolszolg, SMaO, STSI, Crosco and Rotary, all of which are responsible
for the various maintenance and oilfield services.
CHALLENGES:
Multiple third-party fatalities 2 contractor fatalities as a result of several Life Saving Rules violations related to safe work practices defined for confined
space entry and permit to work Improving HSE culture (as a coherent part of the HSE Strategy) Decrease slips & trips: the primary cause of personal injury
3.1. PERSONAL SAFETY
WORKFORCE SAFETY PERFORMANCE
Related objective: “Implement programs that aim for zero incidents”
MOL Group’s objective continues to be the top quartile of Oil and Gas companies in terms of safety performance. In 2017, MOL Group experienced an increase in Total Recordable Injuries (TRI) recorded among own employees and contractors combined, both in terms of lost-Time Injuries (117 in 2017 vs. 91 in 2016). In case of non-lost-time injuries (the latter excluding first-aid cases) did not change (31 in 2017). The Total Recordable Injury Rate (TRIR), used since 2014 as indicator of personal safety for own and contracted staff that aggregates data about workplace injuries needing medical attention, slightly increased to 1.53 compared to last year’s 1.34 for the entire Group’s own and contracted activities combined. Downstream performed better than the CONCAWE 2016 industry average, whereas Upstream lagged behind the IOGP 2016 industry average.
3.5
3
2.5
2
1.5
1
0.5
0
MOL Group, Upstream & Dowstream TRIR (all) vs. Industry figures*
2012 2013 2014 2015 2016 2017
MOL Group IOGP CON CAWE
2.5
2
1.5
1
0.5
0
Lost-time injury frequency (own staff) vs. industry figures*
2012 2013 2014 2015 2016 2017
MOL Group IOGP CON CAWE
* 2016 Benchmarks CONCAWE and IOGP have been applied for 2017 comparison purposes as 2016 data was not available at the time of publication.
219

The number of all types of personal injuries increased to 285 in 2017 compared to 211 in 2016. Based on preliminary data analysis, the surge was primarily driven by a considerable increase in the number of personal injuries caused by unconscious human behavior, such as slips & trips, cuts, punctures, scrapes; etc.
TOP 5 causes for personal injuries on MOL Group level in the period of 2016-217
Slips and trips
(at same height)
Cut, puncture, scrape
Struck by Struck against Other Total
2016 42 38 23 17 19 139
2017 57 49 47 29 22 204
The successful implementation of MOL Group Unconscious behaviour program during the upcoming years throughout all oper-ations of MOL Group will be crucial to increase safety awareness among staff in order to ensure, not only conscious working, but training them to ensure the identification of all hazards and take all necessary mitigation and prevention measures to avoid human errors while working.Safety is, and always will be MOL Group’s highest priority. Sadly however, during 2017, four contractor employees died. In June, a contractor fatality occurred related to hazardous materials (HAZMAT) transportation at MOL Group’s Pakistani operations as the driver fell asleep whilst driving. In September, two contractor staff lost their lives at BaiTex (Russia) during underground vessel cleaning activity, after violating the Life Saving Rules and safe work practices defined for confined space entry and permit to work. MOL Group will continue to apply a strict and progressive consequence management system against safety rule violators. Finally, in September a minibus driver ran over a contractor motorcyclist driver at a cross intersection inside the Danube Refinery in Hungary, likely as a result of the minibus driver not giving way at the intersection as required (there were no eyewitnesses at the time of the collision). MOL Group deeply regrets these tragic accidents and the loss of lives.
WORKFORCE SAFETY PROGRAMS
In 2017, MOL Group continued to implement numerous programs such as Fall Protection, Lockout/Tagout (LOTO), Stop Card and Job Safety Analysis (JSA) with Last-minute risk assessment (LMRA), ensuring full compliance with MOL Group’s Life Saving Rules (LSR) program, and confirmed managerial dedication to further improving overall performance in occupational health and safety. In 2017, many of the project elements continued through physical implementation of systems in all areas of businesses.MOL Group continued its HSE Leadership Engagement Program in several countries in which MOL Group operates, starting with an anonymous assessment of the safety cultures of both management and shop-floor (blue-collar) workers in 2015. This continued with HSE Leadership Engagement training for the TOP150, and then in 2016 for the TOP600+ leaders of MOL Group with a view to developing and improving HSE culture and leadership. It will continue throughout the next two years, involving employees from the remaining leaders to shift leaders. In 2017, the program was extended to MOL Group Russian operations when TOP600+ leaders of BaITex LLC. and leaders of key contractors received tailor-made and localized training, and continued with the start of the Unconscious Behaviour Program (firstly the Train-the-trainer courses) designed for blue-collar workers. The main goal of these workshops and trainings is to reduce the number of personal injuries caused by unconscious human errors in MOL Group whilst raising awareness of safety, emphasizing the importance of safe behaviour.Important achievements at MOL Group operational sites in 2017 include the following:
By the end of 2017, the Electronic Permit-to-Work (e-PTW) came in to use at all affected entities. Beyond standardization and unification of e-PTW system, INA managed to establish a contractor database supplementary to PTW system, where each contractor undergoes a specific training prior to PTW issuance.
As a promotion of safe behaviour MOL Hungary launched (DS Production) and continued (Logistics) their campaigns: at DS Production the “HSE lottery ticket” campaign and at Logistics the “HSE Forint” campaign. Both programs proved particu-larly successful to increase the HSE commitment and performance of employees.
Slovnaft installed new devices for the monitoring of staff on remote operational workplaces (product pipeline, ethylene pumping and dispatching and APSP). At the same time, Slovnaft completed the bump-test stations network on particular workplaces where personal gas detectors are used. The bump-test stations are an inevitable component of the system for securing persons against gas hazard.
ROAD SAFETY
In 2017, while the number of HAZMAT transport-related road accidents decreased to 41 in 2017 compared to 64 in 2016, MOL Group operations experienced an increase to 63 in the number of non-HAZMAT road accidents compared to last year’s 50 for own and contracted activities combined, even though distance driven increased by more than 3 percent. These figures resulted in a Road Accident Rate (RAR) for HAZMAT of 0.43, which indicates a significant improvement (0.67 in 2016) in this transportation activity
NOTES ON SUSTAINABILITY PERFORMANCE

One contractor and four third party fatalities occurred in connection with road transportation (the shipping of HAZMAT). No MOL Group own staff fatalities occurred. MOL Group's employees and contractors clocked over 187 million kilometres during 2017 due to company interests and were involved in a total of 105 road traffic accidents. Practical solutions are available for MOL Group employees to reduce risks on the road, they can attend several driving courses (defensive, slippery road, off-road, etc.).As part of the Safe Driving Program implemented in 2011 at INA, a total of 490 employees trained during 2017. Aside from the train-ings, the program encompasses various activities and educational campaigns which have an overall effect on INA Group RAR results. INA’s RAR decreased from 0.9 to 0.7 in 2017, showing the best results since INA tracks the RAR indicator.
CONTRACTOR SAFETY
Related objectives: “Introducing Comprehensive HSE development program” “Positive motivation and strict control on HSE performance” “Introducing SCC/VCA Requirement from all “High risk contractor”
RequirementsGiven the nature of the industry, one of the most significant challenges in the supply chain is to manage health, safety and envi-ronmental (HSE)-related risks of the investment and maintenance works performed by contractor companies. Accordingly, MOL Group applies identical standards to contractors as it does for its own operations.MOL Group contractors, based on risk evaluation of their activities must pass an HSE prequalification audit, and accept a detailed HSE Appendix in their contractual agreements with MOL Group. In the case of large complex projects, the main contractors must provide compulsory 24/7 HSE supervision. Contractors HSE performance is a significant part of the post evaluation process. During 2017, a new Supplier Pre-Qualification System (SQS) was developed and operated by Procurement which is designed to handle Contractor data (risk analysis by activities, financial, ethical legal and HSE pre-screening, pre-qualification, post evaluation) from the beginning of the bidding process throughout the entirety of the contracted period. From 2017, MOL Group has required an SCC/VCA certificate (Safety Checklist for Contractors/ Veiligheids Checklist Aannemers) from all contractors who undertake high risk HSE activities in all European, on-shore operations. SCC is a safety framework that focuses on the risks and challenges of contractor work which also includes an employee certification scheme. In 2017, hundreds of suppliers started the certification process and, after a 3 months interim period, 328 Contractors introduced their certification and 38 is on the process.Every on-site contractor is obliged to participate in basic HSE induction training, and pass a yearly test. To share knowledge, HSE newsflashes are distributed and numerous training materials, templates and other documents are made public on the group’s website, simple and applicable safe work practices posted on public areas.
Support and developmentIn 2017 comprehensive Contractor HSE development program has introduced with 12 element in 3 focus areas:
Selection of suppliers Supplier developmentMotivation and
Performance management
SCC/VCA certificate HSE leadership engagement KPI for key suppliers
E-sourcing (SQS) implementation Learning network for suppliers HSE reward for contractors
Analysis/pilot of new certification schemes (SQAS, Rigpass)
Improved training system Label for HSE committed contractors
PPE for contractors Incident reporting and learning
Review of post-evaluation criteria
As a form of learning network, regular supplier forums (28 forums in core countries) are organised for key suppliers to inform them about relevant topics and prepare them for upcoming events, such as refinery turnarounds. To share knowledge, HSE newsflashes are distributed and numerous training materials, templates and other documents are made public on the group’s website.Beyond mandatory general HSE trainings, MOL Group HSE professionals provided direct pre-deployment and regular on-site HSE trainings to contractor’s employee and foremen.In 2017, MOL has continued last year’s achievement of granted accessibility to high standard welfare facilities to its contractors during the turnarounds.
221

Motivation and positive feedback is a key tool for developing Contractors HSE performance. In Hungary and Slovakia several successful program were launched with good success and high appreciation from Contractors. With direct focus on employees, in cases of exceptional HSE performance, they can receive fuel cards, gadgets or canteen coupons. Based on the positive results (increased HSE commitment and performance of employees) MOL Grup will extend this tool to other operations and provide posi-tive motivation on Contractors at company and CAPEX project level as well.
Control and consequence managementContractors are aware their activities are continuously being controlled by MOL Group. Due to the nature of the industry, strict rules apply and ensure full compliance with MOL Group area of responsibility. Therefore MOL Group is running a strong HSE control system with consistent consequence management and zero tolerance.
Number of contractors HSE Control (in numbers)
Pre- qualification
audit
On-site inspections
On-site inspec-tions wit non-compliance
Charged penalties [USD]
Employees banned from site
Written warning sent
2016 392 13 708 1844 104,954 50 378
2017 307 16356 2236 138,005 70 384
(17%) 19% 21% 31% 40% 2%
Due to the obligatory requirement of SCC/VCA certificate (Safety Checklist for Contractors) for all contractors who under-take high risk HSE activities, the number of necessary pre-qualification audits has decreased.
In line with contractor safety program on-Site inspection increased and we became stricter in reporting non compliances and applying consequences.
The most common non-compliance issue (27%) relates to the usage of personal protective equipment (PPE).
Number of HSE supplier pre-qualification audits by significant regions in 2017 [GRI Standard 414-1, GRI Standard 308-1]
Number of HSE supplier pre-qualification audits
Hungary Slovakia CroatiaInter national
E&P (Russia, Pakistan)
Other countries
Total
2017 128 7 38 21 113 307
In 2017, 44 recordable contractor injuries were recorded, where 31 resulted in lost-time, an increase from previous year’s 39 and 41 respectively. During 2017, 4 contractor staff working for MOL Group died.
3.2. HEALTH PROTECTION AND PROMOTION
OCCUPATIONAL HEALTH
Related objective: “Implement programs to ensure a healthy workplace”
In 2017, similarly to previous years, no occupational illnesses were recorded across the entire MOL Group. Having a healthy work-place is critical to MOL Group’s success. We operate a number of local programs to protect health of its employees, ensuring that appropriate medical responses and treatment are given, managing stress and encouraging employees to lead a healthy lifestyle by minding their work-life balance.The protection of employees from occupational health hazards is assured by compliance with national laws and internal MOL Group regulations and practices, combined with high quality operating staff. MOL applies best practices in its local operations which are continuously improved.Since 2013, INA has been leading the Medically Programmed Active Vacation (MPAV), which is aimed to activate employees with dissatisfactory health status with the purpose of rehabilitation and health improvement care. Since 2016, the program has been introduced in the majority of INA Group companies. In addition, a new version in the form of a five-day Health Programmed Active Vacation (HPAV) was introduced and is intended for all active employees with minor health issues in order to introduce physical and mental relaxation and maintaining overall fitness.To improve MOL Plc.’s Occupational Health Management System, a new process to medically check the fitness-for-duty of the new entrants was established. MOL restarted the Heart Rate Variability measurements at Petrochemicals.
NOTES ON SUSTAINABILITY PERFORMANCE

WORKPLACE HEALTH PROMOTION
Health promotion programs are organized locally in order to contribute to both the health and well-being of employees. Some selected best practices include:The INA Health Protection and Promotion Program, established for the 2016/2017 period according to the thematic areas of the EU Agency for Occupational Safety and Health at Work (OSHA) campaign "Healthy workplaces for all ages" that is based on HEALTH+ program contributed to the overall health and wellbeing of employees. In addition to standard medical care, Slovnaft employees are given access to high-quality healthcare programs, including psychological counseling and breast screening. Slovnaft also organized a Health Day in 2017 focused on healthy lifestyle. In 2017, MOL Hungary organized the second wave of the workplace health promotion program called STEP. Overall, 6,786 employees participated in a total of 23,555 times in different workplace health promotion programs during the year, especially in medical screenings, in movement-based activities and vaccinations. Following employee feedback, focus will be given to organizing and participating in mass sport competitions whilst giving special attention to the shift workers (implementing special programs tailored to them) to improve their health condition and lifestyle.
3.3. PROCESS SAFETY AND RISK ASSESSMENT
PROCESS SAFETY MANAGEMENT
Related objectives: “Strengthen facility safety, improve rating in benchmarks”
The main goal of process safety management (PSM) is to establish and operate an efficient management which ensures the preven-tion of technology-related process incidents and protects people, assets and environment against harm. Implementation of a process safety management in MOL Group started back in 2006. PSM-related goal are to continuously decrease the number and severity of process incidents and be within the top quartile of CONCAWE and IOGP benchmarks.In 2017, there were 22 TIER1-2 Process safety events (PSEs) at MOL Group, a decrease compared to 2016 (24). The number of TIER1 events reached 5, which is significantly lower comparing to 2016, where 10 TIER1 events were recorded. The consequences of the development of TIER1 process safety events are showing another positive trend with totalling (direct and indirect) costs reaching USD 8.3 mn, a decrease from USD 8.8 mn in 2016. There was no fatality caused by process safety events, however there was a serious work-related personal injury which caused a burn to a contractor employee.
Number of TIER 1-2 process safety events in MOL Group companies in 2017 by Flagships [GRI Standard 414-1]
2017 Process Safety Events (PSE)
MOL Group MOL SLOVNAFT INA IES INT. UPSTREAM
PSE TIER 1 5 3 0 2 0 0
PSE TIER 2 17 7 1 9 0 0
PSE TIER 1+2 22 10 1 11 0 0
Note: TIER 1 category events are more serious from a consequence viewpoint than TIER 2 category events. Categorization is based on API RP 754 (updated in 2016).
From 2017, MOL Group applied an updated and stricter standard (API RP 754) compared to the previous version with no negative influence on final figures. The internal reporting system was improved to be able to monitor the incidents occurred in MOL Group. During 2017, there were 15 PSM cross audits to evaluate the level of PSM implementation in different businesses and sites. The overall evaluation of PSM implementation showed a continuous improvement in MOL, MOL Petrochemicals and Slovnaft which proves the commitment and high attention of management and employees. In 2017, AON Risk Solutions (an external company) performed three assessments of implemented safety-related processes and tech-nical solutions, where a significant improvement in PSM implementation confirmed. In the MOL PRODUCTION report, AON experts highlighted that the Process Safety and Personal Safety organisations are rated above standard when assessed on an industry wide basis. Further assessments were performed at INAgip and INA Rijeka Refinery, Croatia.In order to improve risk awareness and operational risk management, a new project in DS Production was launched. The main goal is to build a system where all significant operational risks are recorded and managers´ decision related to budget allocation for further improvement is done based on the prioritisation of recognized risks.Some of the most important local level initiatives include a new PSM Road Map and updated process safety KPIs for improved monitoring of PS performance at MOL Hungary, the implementation of the “Incident Command System“for on-site emergency and Emergency Operating Centre for off-site emergency operations at SLOVNAFT, as well as the full implementation of Energy isola-tion (LOTO) procedure at INA.
223

4. HUMAN CAPITALGeneral aim: “Enhancing Employee Experience via further building capability, increased organizational performance and strengthened corporate culture in line with MOL Group 2030 – Enter Tomorrow Strategy"
In line with MOL Group 2030 Strategy, the top priorities of Group Human Resources (HR) Strategy remained in focus area, and 2017 achievements have further built Employee Experience, Digital Transformation, Innovation and Customer-centric culture, Attracting and Recruiting Talent, Change and Culture development as well as centralized HR services.
ACHIEVEMENTS:
Group-level Employee Engagement increased by 5% vs 2015 result. In line with Strategy 2030, Innovative Businesses and Services organization has been set up with four units to drive the
innovation efforts and support successful launch of new businesses within the Group. Technical capability building continued in E&P and in Downstream affecting altogether ~1000 petro-technical professionals;
career ladder concept as alternative to managerial career path was extended to 3 Functional areas: Group Strategy and Busi-ness Development, HR and Group Finance.
CHALLENGES:
Candidate-driven market is posing challenges on employee lifecycle from recruitment to retention. Attraction and retention of blue collar population is increasingly challenging in Central Eastern Europe. Business transformation and accelerated speed of change require tailored and instant solutions along the employee lifecycle.
4.1. ATTRACTING EMPLOYEES
Related objectives: “MOL Group will be the first Choice of Employees” “Extend Human Capital related programs to engage a wider talent pool supporting the business transformation of MOL
Group towards being a service company”
HR is in a transition, globally and in the Oil & Gas industry due to the scarcity of mid-level careers, the high percent of retirees and novel expectations of Generation Y. Employers need to keep engaging a workforce with atypical employment demands, and the transformation of the industry will require the most innovative talents from a shrinking skill pool. In line with the Culture 2030 program, 4 Corporate Values have been created and cascaded from the Executive Board, set out to define the future culture of MOL Group. The four values of People, Customers, Ownership and Agility are an integral part of talent attraction and selection via a Value-Based Interview toolkit. In 2017, MOL Group further extended its TALEO recruitment platform to compa-nies in three countries in order to streamline, speed up and ease recruitment processes for internal and external candidates.During 2017, MOL Group implemented an internal sourcing function for the purposes of identification and recruitment of potential candidates. The intention to implement the new function was to reduce the hitherto used headhunting services, typically conducted by third parties, generating estimated savings of USD 50 thousand during the seven months the new function has been in operation.
STRATEGIC PARTNERSHIP WITH UNIVERSITIES
Under the renewal of the Employer Branding strategy, contracts with universities were renewed for another 3 years in MOL Plc, including six engineering faculties from five Hungarian universities. Two vocational training centers were launched to support firm’s petrochemical operations, as well as an electrician and a chemical technician dual training. INA continued its strategic cooperation with student associations and signed contracts with a number of educational institutions in order to improve talent attraction. Within the framework of “From school to Slovnaft” concept, actions have been implemented to attract potential future employees and engage university students, as well as elementary school pupils through experiment based competitions. Its “best thesis competition” makes Slovnaft one of the most attractive employers at Slovakia. The provision of scholarships and the exten-sion of two vocational schools programs continued in 2017.
TALENT ATTRACTION AND EMPLOYER BRANDING
MOL Group’s talent acquisition strategy is built on two pillars: the secondary school concept and university relations. The secondary school concept covers partnerships with relevant vocational and high schools, promoting natural sciences and opportu-nities in the Oil & Gas industry as well as in new business areas.
NOTES ON SUSTAINABILITY PERFORMANCE

To attract students to the natural sciences at secondary school, raise the bar of natural science subjects and ensure a strong univer-stiy pipeline, Junior Freshhh, the online competition program of MOL Group, continued successfully in all three Flagship compa-nies (INA, MOL and Slovnaft) during 2017. For MOL Flagship, the competition was redesigned in 2017, INA received more than 590 registered teams, while more than 440 teams applied to Slovnaft. MOL organizes science based competition among higher classes in primary schools.MOL Group continued its actions within the University Framework to ensure successful and beneficial partnerships, contin-uing with its award winning Talent Acquisition programs. Junior Freshhh and Freshhh international student competitions as well as the graduate recruitment and development program Growww continued successfully in 2017. Female Engineers MOL PrograMe was launched once again in order to attract female STEM students. Freshhh, MOL Group’s innovative online university student competition provides the most talented students the opportunity to secure direct entry into the Growww graduate selec-tion process. In 2017, 1450 three-member teams from 60 countries applied to enter the competition. In 2017, 188 Growwwers from 13 countries joined MOL Group. The proportion of female Growwwers reached almost 50% for the second year in a row. The overall retention rate of Growwwers since 2007 is 80%.In 2016 the Female Engineers MOL PrograMe, targeting female students in countries of operation was launched to ensure a diverse young professional pipeline and stregthen employer branding. Out of 69 applicants from twenty-six universities in six countries, three students were awarded a 5000 EUR scholarship each, participation opportunity at an international Oil & Gas conference in 2017, as well as an internship or work opportunity at MOL Group after completing their studies. One of the winners already joined MOL Group via Growww program in 2017. To get potential future employees closer to the company, the Employer Branding framework continued in 2017 with the aim to be the first choice of employees in line with the Enter Tomorrow 2030 Strategy. In order to secure the highest reach of students and communicate its Employee Value Proposition, MOL Group is investing heavily into social media strategies and presence.
ATTRACTION OF BLUE COLLAR EMPLOYEES
The blue collar workforce attraction and retention continues to require action to secure the necessary number and quality in an increasingly competitive labour market. In 2017, three key pillars were identified in the Blue Collar 2020 Strategy: competency-based compensation, benefits compensation revision and efficient communication. Action plans have been developed within Flag-ships in order to address the three most critical areas: recruiting, developing and retaining blue collar workforce. 25 relevant actions related to sourcing, attracting and recruiting were included on the project plan, and monthly tracking and monitoring of the status started. During 2017, vocational school cooperations and programs were lauched, training centers were opened, scholarship and vocational internships were provided and a blue collars sourcing strategy was implemented across Hungary, Slovakia and Croatia.
4.2. RETAINING AND REWARDING EMPLOYEES
Related objectives: “Boost pay for performance culture of MOL Group by providing a competitive and motivational reward scheme that encour-
ages outstanding business results” “Integrated annual People Cycle incorporates performance and career management, resulting in a structured approach to
development and succession planning”
COMPETITIVE REMUNERATION
MOL Group reward schemes have been designed to reinforce a merit-based culture to ensure a continuous increase in performance and results. MOL Group aligns and harmonizes reward across the Group in companies with similar business profiles, by applying tailored remuneration strategies, taking into consideration local benchmarks and the company’s market position. MOL Group's reward strategy is built on the international Total Remuneration approach, which includes major compensation elements including the Annual Base Salary, Short- and Long-Term Incentives and Benefits.
225

Ratio of corporate minimum wage to local minimum wage at significant (more than 100 employee) operating locations (%) [GRI Standard 202-1]
Country (main company) 2017
Austria (Roth Heizöle GmbH)* 100%
Bosnia Herzegovina (Energopetrol d.d.) 100%
Czech Republic (MOL Česká republika, s.r.o.) 219%
Croatia (INA d.d.) 132%
Hungary (MOL Plc.) 148%
Italy (IES S.p.A.)** 131%
Pakistan (MOL Pakistan Ltd.) 323%
Romania (MOL Romania PP s.r.l.) 158%
Russia (BaiTex LLC) 221%
Slovakia (Slovnaft a.s.) 161%
* ratio is calculated based on industrial (Trading) Collective Agreement, min. wage data for Austria** ratio is calculated based on industrial (Oil) Collective Agreement, min. wage data for Italy
MOL Group implements strict guidelines to ensure equal employee compensation regardless of gender, age and nationality. Group-level compensation policies are transparent and are published in group and local regulations. Company-level rules are also defined by Collective Agreements of Flagship companies.
SHORT-TERM AND LONG-TERM INCENTIVES; CASH AWARDS
The strategy behind MOL Group remuneration is to incentivize employees through a combination of short-term and long-term initi-atives. The aim of the MOL Short-Term Incentive system is to target strategic target groups to achieve challenging financial, opera-tional and individual performance goals, which reflect the delivery of key annual business priorities within the framework of MOL Group’s long-term strategy. The purpose of the Long-Term Incentive system is to drive and reward the delivery of sustainable value creation and to ensure that there is a complete alignment between MOL Group senior & top management and the strategic interests of shareholders. MOL Group promotes a performance driven culture through short-term incentives that align financial recogni-tion with business results. Competitive and differentiated total remuneration package is supported to encourage high achievement, while tailored short-term incentives for strategic target groups (e.g. sales incentive, trader incentive). In several MOL Group companies, separate award budgets and project bonus framework can be used to recognize employees with extraordinary performance and achievements with one-off payments.
BENEFITS, EMPLOYEE WELLBEING AND FLEXIBLE WORKING
MOL Group believes that investment in employee wellbeing contributes to employee engagement and helps maximize an innovative approach to reach full potential. Larger MOL Group companies offer a wide range of initiations supporting employees in respect of their health, financial planning, workplace environment and community and employer care in every life stage. MOL Group cares for the wellbeing of its constantly changing and diverse, multigenerational workforce whose needs are met through a wide range of programs, benefits, initiatives and wellbeing programs, making up an essential part of employees’ Total Remuneration. Insurance is a crucial benefit form in the Oil & Gas industry, and MOL Group puts strong focus on the health and safety of its work-force with various work conditions. Personal insurance is provided to all employees across the Group in various forms. MOL Group ensures that employees are covered by social benefits and pension. Employees may choose a voluntary pension fund and can use a part or the whole of their fringe benefits for this purpose.MOL Group provides attractive benefit schemes across its locations to ensure competitiveness on local markets together with all elements of the pay mix. Flexible benefits schemes are available at Flagship companies that enable employees to tailor make their benefits. When basic benefit elements are defined, local legislation, tax environment and competitiveness on local markets are screened to provide Group-level consistency. Flexible working options are available in several companies across the Group in order to leverage creativity and productivity of employees, encourage diversity, and a sustainable work-life balance. The two main forms are FlexiPlace which enables working from home and FlexiTime which enables flexible start and end working time.
NOTES ON SUSTAINABILITY PERFORMANCE

RECOGNITION
In line with MOL 2030 and based on employee surveys, Group level recognition framework will be enhanced during 2018. Various programs support the recognition of extraordinary effort and performance contributing to valuing people and enhancing employee experience. MOL Group HSE Chairman Award recognizes extraordinary projects and achievements on the fields of health, safety and the environment. In 2017, the Group-level Golden Barrel Award continued, recognizing the most innovative, strategic projects in various categories. In 2017, altogether 528 employees applied for the Award, submitting 105 nominations from more than 22 companies in four categories. Formal recognition programs are in place across the Group including Lifetime awards for employee loyalty and for those who have made exceptional achievements and significant work contribution during a longer tenure. In MOL Plc., a Wellbeing platform was further developed in order to consolidate and increase awareness among blue and white collar employees on the wide range of fix and voluntary benefits, while INA Group developed an internal beneFIT website, where all benefits are introduced under a single platform. Slovnaft provides contribution to supplementary pension savings for employees. Alternative to the pension savings in form of investment life insurance was implemented. In case of retirement severance is paid based on the years of service at the company, above the legal requirements.
EQUAL OPPORTUNITY PLAN
MOL Group companies apply and enforce the principle of equal treatment, committed to diversity and equal opportunities at work and promote equal opportunity regarding all its employees. To this effect MOL Plc. prepared equal opportunity plan, and estab-lished Equal Opportunity Committee. The purpose of the plan is to define the general principles, requirements, and practices in order to provide equal opportunity.
BLUE COLLAR STRATEGY 2020
MOL Group is facing the challenge attracting and retaining workforce in operational areas due to labour market and demographic changes across Central Eastern Europe. Blue Collar employees represent a significant ratio within the total employee number and their role is crucial to ensure sustainable operations as well as to contribute to the strategic projects of the Group. A Blue Collar pay for competence and certification, which also supports career path, was introduced throughout various divisions and sites across Croatia and Slovakia, providing transparent career ladder and training system for over 1000 employees. Revision of pay scales, grades and compensation package elements to increase external competitiveness is ongoing in order to build a more motivating and simple variable pay scheme. Strengthening employee wellbeing, increasing their awareness on the total rewards in addition to the base salary is in the focus. Support is given to workforce mobility to enable attraction and moves within MOL Group sites contrib-uting to accommodation and commuting expenses.
ANNUAL PEOPLE CYCLE (APC)
Annual People Cycle framework is a continuously developed system of processes, methodologies and tools that identify measure and develop employee performance and career management by aligning individual and team objectives with the MOL 2030 stra-tegic goals. In the course of 2017, continued efforts were made to foster an open feedback culture, and to recognize achievements and effort both individual and team levels in order to reach the goal of being the best choice of employees. A campaign was launched to encourage and motivate employees to give and ask for feedback, resulting in an increasing number of mid-year feedback sessions being incorporated. Furthermore, corporate values were incorporated into performance evaluations and target setting. As one of the tangible outputs of the 2017 APC improvement actions, short-term incentives are directly connected to overall business perfor-mance and each employee’s impact on it.
Employees covered by a predefined and standardized performance appraisal process (%) [GRI Standard 404-3]
Employee category 2013 2014 2015 2016 2017
Executive/ Top management 100% 100% 100% 100% 100%
Middle/ General management 100% 100% 100% 100% 100%
First Line Management/ Supervisor 100% 100% 100% 100% 100%
Specialist groups 64% 70% 72% 73% 95%
Employees (below HAY18) 42% 51% 54% 55% 90%
227

As part of the continuous improvement of the APC, SuccessFactors (a cloud talent management tool) was rolled out to additional 8000 employees during 2017. With the extension close to 40% of all MOL Group employees performance and talent management related data came under one common platform, supporting efficient human capital operations whilst providing comprehensive insight, ensuring transparency, fairness and consistency of HR decisions related to rewards and talent development activities. Career Management System (CMS) & Development processes enable the organization to develop and retain identified talents. During People Review Meetings, talent is reviewed, and development plans and career paths are defined and followed up.
Number of participants in career management system and development processes [GRI Standard 404-3]
APC processNumber of participants per year
2013 2014 2015 2016 2017
CMS & Development 2000 2100 2100 2100 6600*
Technical Career Ladder 915 725 1573**
Total 8173
* increase is due to INA introducing CMS to all colleagues at and below HAY17** increase is due to Downstream TCL kickoff
Technical Career Ladder program (TCL) provides talent retention and higher motivation, and provides employees the opportunity to understand and trace the technical part of their career path and objective conditions to fulfil for promotion. Knowledge and technical competencies are assessed for every petrol-technical professional (PTP), subsequent development plans are created. Assessments provide insight to knowledge gaps of every PTP to map which competencies should be improved for promotion. It is used for both Upstream and Downstream with the former being implemented in 2015, while the latter in 2017.
EMPLOYEE ENGAGEMENT
Related strategic objective: “By 2020 increase employee engagement level to 55%”
Employee engagement increased by 5 percentage points according to the 2017 survey, with areas of work safety, empowerment and line manager evaluation showing the biggest improvements. Response rate was kept at 80%, with almost every second employee providing an open comment.Across the Group, 80% of the actions were in progress or already completed by the end of 2017.
Employee engagement survey results (%)
2010 2012/13 2015 2017
Coverage 90 96 85 100
Response rate 64 62 80 80
Engagement level 70 47* 45 73**
* The engagement methodology changed in 2012 due to the engagement of a new service provider. As a result, the engagement data in the table do not show the trend for engagement from 2010 to 2012 since the basis of calculation is different. Compared to 2010 results, the difference is a 2% point decrease.
** The engagement methodology changed in 2017 due to the selection of a new service provider.
NOTES ON SUSTAINABILITY PERFORMANCE

4.3. DEVELOPMENT OF HUMAN CAPITAL
Related objectives: “Build Leadership capabilities, fill technical competency development gaps and have a global leadership compe-tency framework”
Training and development data for MOL Group [GRI Standard 404-1]
MOL Group Training Data
2014 2015 2016 2017
Average training time per employee (hours) 24 34 28 29
Average cost of training per employee (th HUF) 76 114 97 106
Average hours of training per employee group (hours)
Top Management (HAY 24 and above) 52 53 57 56
Middle Management (HAY 21 to 23) 53 77 83 79
First Line Management (HAY 18 to 20) 52 69 81 76
Expert (HAY 14 to 17) 38 61 42 46
Executor (HAY 13 and below) 21 19 25 16
Average training cost per employee group (th HUF)
Top Management (HAY 24 and above) 1,107 1,433 2111 840
Middle Management (HAY 21 to 23) 854 1,426 1818 1259
First Line Management (HAY 18 to 20) 368 483 569 510
Expert (HAY 14 to 17) 200 161 152 157
Executor (HAY 13 and below) 61 42 34 36
LEARNING AND DEVELOPMENT OBJECTIVES
In 2017 leadership development was in focus and the entire leadership development curricula was updated and upgraded in light of MOL Group’s 2030 Strategy. Furthermore technical capability development was enhanced by the Technical Career Ladder program and offered individual development plans for thousands of employees in technical areas. To keep and utilize the internal knowledge, the Mentoring Framework was launched to address the different needs for mentoring in an efficient manner.To increase managerial coverage and involvement, the modular leadership development program, Intensity, was localized at the three Flagships so that courses for all managerial level are provided in the local language and by local suppliers with heavy quality assurance. The program had 325 participants receiving an overall course satisfaction score of 90%, a 4% increase from 2016.In 2017 the third cohort of LEAD program was launched for Emerging and for Growing Global Leaders in partnership with Cotrugli School of Business, Thunderbird Global School of Management and SEED School for Executive Education. A curric-ulum was tailored to serve the new strategic directions. 48 LEAD participants were selected to start the program from a total of 500 applicants both from managerial and voluntary nominations.As part of knowledge sharing initiatives, Internal Academy sessions continued during 2017 through 5 events with a total of 650 participants, with access to local companies via live streaming. In INA, educations on sustainable development for 3rd and 4th level INA Group managers were continued during 2017, with 83% of relevant INA Group managers participating. Furthermore, during 2017, INA’s increasing use of internal trainers gradually displacing external ones generated savings in the amount of USD 172 thousand, as average employee satisfaction with trainings reached 4.9 (scale 1-5). Slovnaft continued its two-year Talent Development Program, SMART for potential leaders, involving 24 talents from across the company.
TECHNICAL CAPACITY BUILDING
Related objectives: “Sustain Technical Career Ladder (TCL) in E&P and Downstream; extend career ladder to relevant functional units"
In 2017, the Technical Career Ladder in both E&P and Downstream businesses continued via regular assessment cycles, profes-sional mentoring and individual development of affected colleagues.
2013 2014 2015 2016 2017
Exploration & Production 750 850 1,100 1,165 1,846
Downstream 750 950 950 1,846 2,738
HSE 30 300 300 300 300
Total 1,530 2,100 2,350 3,311 4,884
229

EXPLORATION & PRODUCTION SPECIFIC PROGRAMS
681 petrotechnical professionals were assessed across 16 job families and 6 E&P countries during 2017. As a result, six core job fami-lies were fine-tuned, 9% of PTPs have been promoted, and everyone received individual development plans. The E&P mentoring program was fine-tuned and expanded to Downstream TCL.
DOWNSTREAM SPECIFIC PROGRAMS
Technical Career LadderDownstream Technical Career Ladder Project continued with the objective to strengthen and develop the technical capabilities in line with the People strategic pillar in Downstream. In 2017, the second cycle of assessments were implemented, 4 new job families created, and 287 additional PTPs allocated to a job family. Downstream Mentoring program has been launched, and development activities started based on Individual Development Plans tailored to address individual gaps.
Career Ladder ExtensionCareer ladders in Group Strategy & Business Development, Group HR and Group Finance were launched during 2017. Reviews were held, self- and cross-assessment of competencies were implemented, and gap analysis delivered and competency map planned for 2018.To ensure a capable pipeline for Downstream Production, NEXT Downstream Production Leadership Development program was kicked off at the end of 2016. The first cohort successfully completed the 15 month long program in December 2017, leading to promotions for 75% of the participants and successful LEAD 2017 application for three.The 5th generation of PIMS Academy, the post-graduate accredited program, was revamped into the Value Chain Academy, which rolled out for the first time in 2017 in cooperation with the Hungarian University of Pannonia. The program is tailored to the different needs of the new business environment and organizational setup. 12 participants from 5 MOL Group Downstream coun-tries joined the first edition.In line with MOL Group Retail vision to become the leading brand in its core markets, and the aspiration “To be the choice of customers”, MOL Group developed the “Host Program”, a customer service program aiming to build a sustainable competitive advantage around customer service at the service stations. Following the trainings of over 2500 service station managers and hosts, they are expected to deliver the best service in the industry.
Culture 2030 Culture 2030 program started with the assessment of the current MOL Group DS culture, setting the desired culture by identi-fying the existing gaps, and designing the direction for the culture initiatives in 2016 onwards. Complemented with the Employee Engagement Survey findings, key improvement areas have been identified. Culture development was set as a performance target across the whole management of MOL Group to accelerate cultural change. Workshops for team development in accepting and successfully handling changes have been designed with pilot workshops delivered and full roll out planned for 2018. Change management has been integrated into internal leadership development programs. To further boost feedback culture, workshops and trainings were organized by Group HR and Culture Ambassadors. Overall visibility and availability of managers was enhanced by creating new opportunities for informal discussions, managers also started to spend full days working on Service Stations, and visit more often depos and sites. The efficiency of the internal meet-ings and communication among colleagues were also streamlined by introducing new meeting and e-mailing etiquettes.
4.4. COMMITMENT TO FAIR EMPLOYMENT
Related strategic objective: “Enhance responsible employer practices to ensure the engagement and diversity of the workforce”
EMPLOYEE RELATIONSMOL Group is supportive of the freedom of association and collective bargaining, and is committed to continuously improving social dialogue. In 2017, according to a weighted-average calculation based on data provided by MOL’s European Work Council, more than half of all employees were represented by trade unions in companies where such representation is possible (94% of all employees).
Trade unions and collective bargaining agreements (%) [GRI Standard 102-41]
2013 2014 2015 2016 2017
Employees covered by trade unions 96 94 95 96 94
Employees covered by collective bargaining agreements
90 89 92 89 88
The New Europe Program was extended in 2015 for the period 2016-2020. This agreement between MOL Group and the European Works Council has been in place since 2006, providing a framework for the key activities that contribute to the sustainable and responsible operating of MOL Group.
NOTES ON SUSTAINABILITY PERFORMANCE
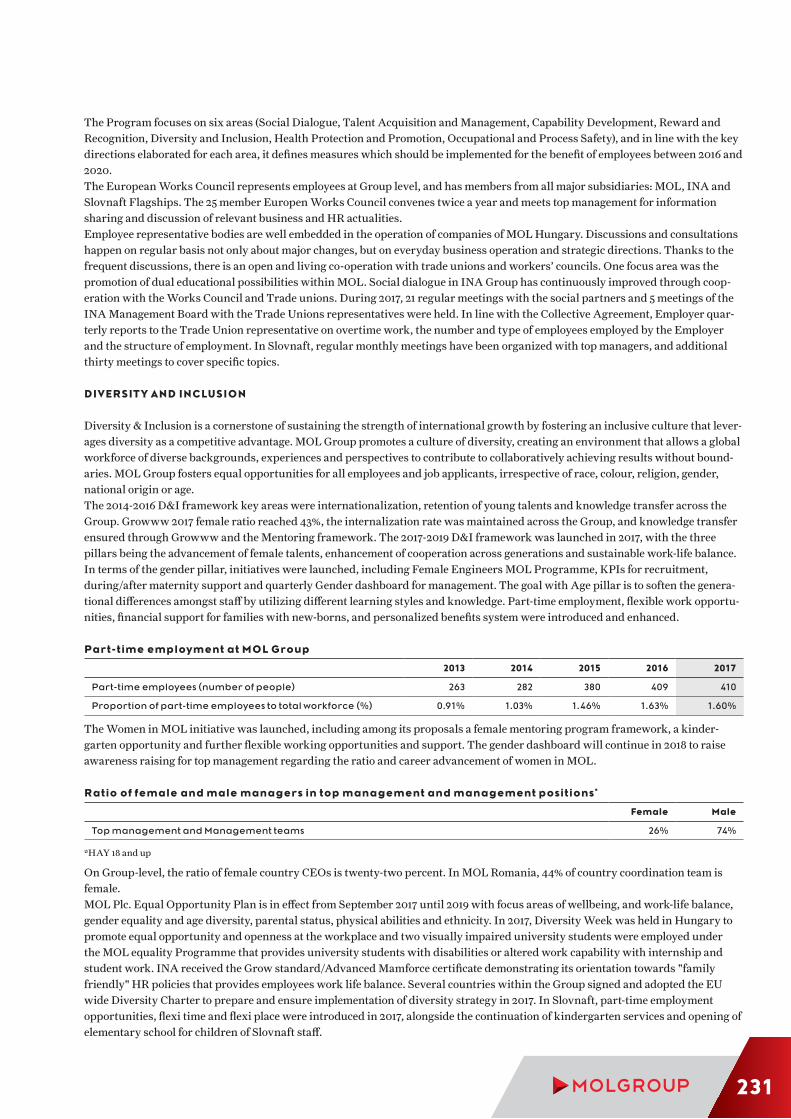
The Program focuses on six areas (Social Dialogue, Talent Acquisition and Management, Capability Development, Reward and Recognition, Diversity and Inclusion, Health Protection and Promotion, Occupational and Process Safety), and in line with the key directions elaborated for each area, it defines measures which should be implemented for the benefit of employees between 2016 and 2020.The European Works Council represents employees at Group level, and has members from all major subsidiaries: MOL, INA and Slovnaft Flagships. The 25 member Europen Works Council convenes twice a year and meets top management for information sharing and discussion of relevant business and HR actualities. Employee representative bodies are well embedded in the operation of companies of MOL Hungary. Discussions and consultations happen on regular basis not only about major changes, but on everyday business operation and strategic directions. Thanks to the frequent discussions, there is an open and living co-operation with trade unions and workers’ councils. One focus area was the promotion of dual educational possibilities within MOL. Social dialogue in INA Group has continuously improved through coop-eration with the Works Council and Trade unions. During 2017, 21 regular meetings with the social partners and 5 meetings of the INA Management Board with the Trade Unions representatives were held. In line with the Collective Agreement, Employer quar-terly reports to the Trade Union representative on overtime work, the number and type of employees employed by the Employer and the structure of employment. In Slovnaft, regular monthly meetings have been organized with top managers, and additional thirty meetings to cover specific topics.
DIVERSITY AND INCLUSION
Diversity & Inclusion is a cornerstone of sustaining the strength of international growth by fostering an inclusive culture that lever-ages diversity as a competitive advantage. MOL Group promotes a culture of diversity, creating an environment that allows a global workforce of diverse backgrounds, experiences and perspectives to contribute to collaboratively achieving results without bound-aries. MOL Group fosters equal opportunities for all employees and job applicants, irrespective of race, colour, religion, gender, national origin or age. The 2014-2016 D&I framework key areas were internationalization, retention of young talents and knowledge transfer across the Group. Growww 2017 female ratio reached 43%, the internalization rate was maintained across the Group, and knowledge transfer ensured through Growww and the Mentoring framework. The 2017-2019 D&I framework was launched in 2017, with the three pillars being the advancement of female talents, enhancement of cooperation across generations and sustainable work-life balance. In terms of the gender pillar, initiatives were launched, including Female Engineers MOL Programme, KPIs for recruitment, during/after maternity support and quarterly Gender dashboard for management. The goal with Age pillar is to soften the genera-tional differences amongst staff by utilizing different learning styles and knowledge. Part-time employment, flexible work opportu-nities, financial support for families with new-borns, and personalized benefits system were introduced and enhanced.
Part-time employment at MOL Group
2013 2014 2015 2016 2017
Part-time employees (number of people) 263 282 380 409 410
Proportion of part-time employees to total workforce (%) 0.91% 1.03% 1.46% 1.63% 1.60%
The Women in MOL initiative was launched, including among its proposals a female mentoring program framework, a kinder-garten opportunity and further flexible working opportunities and support. The gender dashboard will continue in 2018 to raise awareness raising for top management regarding the ratio and career advancement of women in MOL.
Ratio of female and male managers in top management and management positions*
Female Male
Top management and Management teams 26% 74%
*HAY 18 and up
On Group-level, the ratio of female country CEOs is twenty-two percent. In MOL Romania, 44% of country coordination team is female. MOL Plc. Equal Opportunity Plan is in effect from September 2017 until 2019 with focus areas of wellbeing, and work-life balance, gender equality and age diversity, parental status, physical abilities and ethnicity. In 2017, Diversity Week was held in Hungary to promote equal opportunity and openness at the workplace and two visually impaired university students were employed under the MOL equality Programme that provides university students with disabilities or altered work capability with internship and student work. INA received the Grow standard/Advanced Mamforce certificate demonstrating its orientation towards "family friendly" HR policies that provides employees work life balance. Several countries within the Group signed and adopted the EU wide Diversity Charter to prepare and ensure implementation of diversity strategy in 2017. In Slovnaft, part-time employment opportunities, flexi time and flexi place were introduced in 2017, alongside the continuation of kindergarten services and opening of elementary school for children of Slovnaft staff.
231

5. COMMUNITIESGeneral aim: “Enhance trust and credibility among stakeholders”
ACHIEVEMENTS:
In 2017, MOL Group supported social investment projects with 0.27% of its EBITDA, or 1.5 billion HUF in absolute terms (excluding leveraged donations derived from tax-base decreasing donation instruments).
A new Community Engagement Group Principle has been set up with clear processes, deadlines and supporting guidelines that allow: identification, anticipation and, where possible, control of the effects of stakeholder actions and reactions.
First year of the Group-level Corporate Volunteering framework: 6 countries involved, 97 projects submitted of which 27 selected and implemented. Number of included employees: 468.
CHALLENGES:
Managing community concerns and introducing local grievance management systems to an increasing number of sites. Establishing a long-term strategy together with local communities and not-for-profit organizations in operational areas
outside Europe. Prepare community engagement plans for each relevant operational site. Extend Corporate Volunteering framework to 12 countries.
5.1. COMMUNITY RELATIONS
Related objectives: “Develop, improve group-level social engagement plan” “All countries to have an annually updated social engagement plan, implementing key pillars of engagement”
COMMUNITY ENGAGEMENT
All MOL Group companies operate in environments and locations within which they affect various members of the community and these stakeholders affect MOL Group. This effect on communities can both be positive (providing decent work and wages, paying taxes, investing in the community etc.) and negative (harmful emissions, environmental damage, human rights violations, uneth-ical, unsafe work environment etc.). Companies in the oil and gas industry are under especially high stakeholder scrutiny due to the nature of the business because site-level operations can run considerable health, safety and environmental risks. Consequently, MOL Group faces the challenging and – if done appropriately – rewarding task of obtaining a "license to operate" in the communi-ties where it is operating. During 2017, a structured Community Engagement Group Principle was set up with clear processes, deadlines and supporting guidelines that allow for the identification, anticipation and, where possible, control of the effects of stakeholder actions and reac-tions. Roll-out including the pilot project will take place in 2018. The refreshed community engagement methodology allow miti-gation and containment of stakeholder-related risks and the capturing of opportunities that have the potential to create win-win situations for both the company and the communities at the earliest phase. In the handbook, the engagement cycle and tools are based on international standards and best practices. The main source of inspi-ration, which is also the foundation of the Community Engagement Group Principle and the MOL Group Sustainable Development Assurance process, is the AA1000SES:2015 Stakeholder Engagement Standard. Trends and best-practice examples are introduced in the appendix of the handbook and are built around relevant engagement tools. In the first phase of the project, 26 Community Engagement Officers and affected responsible from MOL, Slovnaft and INA were trained on the issue. During 2018 the Regulation will be implemented in all affected countries and relevant Local CEOs, Site and Project managers will likewise receive training on stakeholder management practices.MOL Group and its member companies engage with local stakeholders in several different ways. The most common is through site-level relationships, public hearings and joint activities. General operation-related concerns are usually related to operating technol-ogies (e.g. seismic measures, or investment projects that have environmental effects such as noise, or emissions).MOL Group maintain ongoing communication with authorities and official bodies related to the regulatory environment and MOL Group’s license to operate. Responses, comments and suggestions acquired through consultations and dialogue with opinion leaders and representatives of main interest groups are used as a valuable source of information in activity planning.In addition, MOL Group has particular ways of engaging which are designed to shape people’s attitudes and ways of thinking about how sustainability can be promoted.
NOTES ON SUSTAINABILITY PERFORMANCE
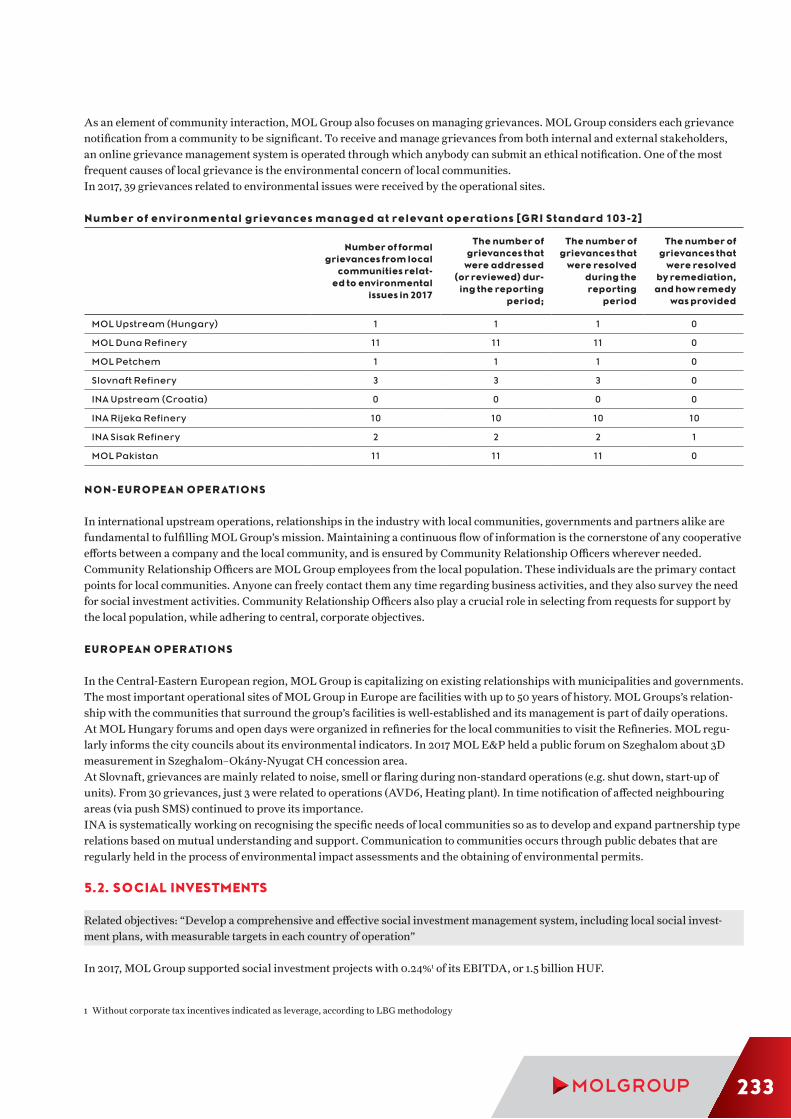
As an element of community interaction, MOL Group also focuses on managing grievances. MOL Group considers each grievance notification from a community to be significant. To receive and manage grievances from both internal and external stakeholders, an online grievance management system is operated through which anybody can submit an ethical notification. One of the most frequent causes of local grievance is the environmental concern of local communities.In 2017, 39 grievances related to environmental issues were received by the operational sites.
Number of environmental grievances managed at relevant operations [GRI Standard 103-2]
Number of formal grievances from local
communities relat-ed to environmental
issues in 2017
The number of grievances that were addressed
(or reviewed) dur-ing the reporting
period;
The number of grievances that
were resolved during the reporting
period
The number of grievances that
were resolved by remediation, and how remedy
was provided
MOL Upstream (Hungary) 1 1 1 0
MOL Duna Refinery 11 11 11 0
MOL Petchem 1 1 1 0
Slovnaft Refinery 3 3 3 0
INA Upstream (Croatia) 0 0 0 0
INA Rijeka Refinery 10 10 10 10
INA Sisak Refinery 2 2 2 1
MOL Pakistan 11 11 11 0
NON-EUROPEAN OPERATIONS
In international upstream operations, relationships in the industry with local communities, governments and partners alike are fundamental to fulfilling MOL Group’s mission. Maintaining a continuous flow of information is the cornerstone of any cooperative efforts between a company and the local community, and is ensured by Community Relationship Officers wherever needed.Community Relationship Officers are MOL Group employees from the local population. These individuals are the primary contact points for local communities. Anyone can freely contact them any time regarding business activities, and they also survey the need for social investment activities. Community Relationship Officers also play a crucial role in selecting from requests for support by the local population, while adhering to central, corporate objectives.
EUROPEAN OPERATIONS
In the Central-Eastern European region, MOL Group is capitalizing on existing relationships with municipalities and governments. The most important operational sites of MOL Group in Europe are facilities with up to 50 years of history. MOL Groups’s relation-ship with the communities that surround the group’s facilities is well-established and its management is part of daily operations.At MOL Hungary forums and open days were organized in refineries for the local communities to visit the Refineries. MOL regu-larly informs the city councils about its environmental indicators. In 2017 MOL E&P held a public forum on Szeghalom about 3D measurement in Szeghalom–Okány-Nyugat CH concession area.At Slovnaft, grievances are mainly related to noise, smell or flaring during non-standard operations (e.g. shut down, start-up of units). From 30 grievances, just 3 were related to operations (AVD6, Heating plant). In time notification of affected neighbouring areas (via push SMS) continued to prove its importance.INA is systematically working on recognising the specific needs of local communities so as to develop and expand partnership type relations based on mutual understanding and support. Communication to communities occurs through public debates that are regularly held in the process of environmental impact assessments and the obtaining of environmental permits.
5.2. SOCIAL INVESTMENTS
Related objectives: “Develop a comprehensive and effective social investment management system, including local social invest-ment plans, with measurable targets in each country of operation”
In 2017, MOL Group supported social investment projects with 0.24%1 of its EBITDA, or 1.5 billion HUF.
1 Without corporate tax incentives indicated as leverage, according to LBG methodology
233

Donations, in-kind and volunteering at MOL Group [GRI Standard 203-2]
Social investment by country* unit Hungary Romania Slovakia Croatia
Czech Republic Italy
Int.Upstream
Other coun-
tries Total
Donations in cash
HUF million 721.4 325.9 112.5 54.6 24.3 0.5 231.5 3.7 1,474.3
In-kind giving (product/ services)**
HUF million 7.6 – 21.7 9.3 – – – – 38.5
Leverage HUF million 789.1
* Including companies which have Corporate Giving Plan** Excluding the monetized value of corporate volunteering
Social responsibility objectives are designed to improve social and environmental conditions and contribute to the long-term socio-economic development of communities, rather than simply funding community investment projects.Social investment priority areas for MOL Group are the following:
Education: MOL Group seeks to facilitate access to basic and secondary education in areas where such infrastructure is not assured. Investing into local human capital benefits both business and society.
Healthcare: the goal is to create benefits by granting access to healthcare services and drinking water, or promoting sports and a healthy lifestyle, depending on the specific needs of local communities.
Environmental protection: define standards and supporting projects which are geared to saving traditional habitats.MOL Group prefers to supports diversified initiatives and projects which only require support during the start-up phase and which are later self-sustaining, especially when such initiatives are a response to global concerns.Based on MOL Hungary Flagship’s best practice, in 2017 Group Corporate Communications has developed a Group-level Corporate Giving Register System. This enables storing all the relevant information of MOL Group’s corporate giving projects in a trackable, reportable database. The LBG related social investment reports are also created automatically based on that database.
NON-EUROPEAN OPERATIONS
Relationships with industry, with local communities, governments and with partners alike are fundamental to fulfilling MOL Group’s mission. In international upstream operations, Community Relationship Officers select from local community requests that are based on central objectives. MOL Group always strives to understand local community needs and then create tailor-made social investment action plans for each area. A common feature of these social investments is that MOL Group contributes to supporting local public service and infrastructure, which both have a lasting impact on the lives of communities.In Pakistan (MOL Pakistan), the company plays indispensable role in improving locals’ quality of life. Free medical and eye camps were held in Kohat during 2017 to provide medical check-ups for poverty-stricken and underprivileged communities of the TAL Block, while a three day sports gala was also supported to fulfill an often neglected need of underprivileged communities in Karak.In Kazakhstan MOL Group sponsors and organizes events that promote Hungarian culture and foster business and diplomatic relations (in Astana and Almaty).
EUROPEAN OPERATIONS
MOL Group companies throughout the CEE region are well-established brands. As a result, MOL Group carries out annual corpo-rate giving awareness tracking surveys that investigate customer habits and the recognition of existing programs to understand the needs of society in core operating countries. This survey involved more than 5,000 stakeholders at a group level during 2017.
Annual Corporate Giving Awareness Tracking Survey for CEE
Hungary Slovakia Croatia Romania Chech Republic
60
50
40
30
20
10
0Sport Cultire Social
1926
33 3434
3531
54
37 40 37 39
30 28
NOTES ON SUSTAINABILITY PERFORMANCE

MOL Group contributes throughout the CEE region to social progress, economic development and preservation of the natural envi-ronment in the local communities through donations, mostly via own foundations. 31% of all donations tracked in the LBG data collection toolkit have a focus on education and youth, 11% on environment while 9% is spent on improving health. MOL Group’s corporate giving is also connected to business interests, such as the above-mentioned non-European projects in international explo-ration and production operations, which account for 25 % of the total social investment budget. Other such initiatives include maintaining cooperation with the most important customers and professional organizations. LBG-related data does not contain donations related to corporate tax incentives offered by the state.Social investments of MOL Group companies are mainly carried out through foundations with the aim to support talented youth and children's health care, caring for chronically ill or disabled children as well as supporting the environment through Green Belt initiatives in Hungary, Croatia, Slovakia Czech Republic and Romania.
VOLUNTEERING
Corporate volunteering by employee/country*
Hungary Romania Slovakia CroatiaCzech
Republic
Interna-tional
Upstream Italy Total
Employee volunteering (hours) 56 – 1,110 6,332 21 – – 7,519
* Including companies with more than 100 employees
In 2017 MOL Group HQ initiated Volunteering Idea Competition as part of the MOL Group Corporate Volunteering frame-work which strives to engage staff and share best local volunteering examples within member companies. MOL Groups provides the possibility for employees to be part of the change and bring engagement which would increase productivity and synergies between MOL Group Companies. MOL Group is focusing on traditional volunteering initiatives, which are gradually being trans-formed into skills based volunteering initiatives. Given the international reach of MOL Group, the aim is to be regarded by external stakeholders as a community member, increase corporate reputation and brand awareness, and build trust and loyalty among consumers.The MOL Group Volunteering Idea Competition pilot reached a huge success by collecting more than 90 ideas from 6 MOL Group countries during 2017. After the selection process 27 of these ideas were implemented. The volunteering committee granted funds primarily to those ideas which focus on local communities needs in the areas where MOL Group is operating. Several volunteering activities were carried out during 2017 by Slovnaft employees including the plantation a green alleys, assis-tance for the implementation of Sports Olympics for children from foster homes and socially deprived families as well as helping the Slovak Ornithological Society to clean and prepare surface for wintering and nesting of several bird species. In 2017 INA Volun-teer Club organized 50 actions with the participation of 867 members with a total with 6,936 volunteer hours focusing on environ-mental, humanitarian as well as children and youth. The Club currently counts 1,316 members, an increase of 26% compared to 2016.
5.3. LOCAL SUPPLIERS AND EMPLOYMENT
LOCAL SUPPLIERS
Employing local people in the areas in which MOL operates, as well as hiring local contractors when possible, is beneficial to the local economy as the income it generates increases the purchasing power of these communities. MOL Group understands that hiring local suppliers has multiple benefits and can also be a way of establishing a positive relation-ship with local communities. As a result, MOL Group contracts with such suppliers whenever it is beneficial, taking into considera-tion the expectations of local governments.In the countries in which MOL conducts International Upstream operations, local procurement is especially important as opera-tional sites are very often situated in areas populated by low-income communities. Hiring local contractors and employees therefore strengthens the relationship MOL Group has with all the stakeholders of the region, including local governments and communities.In countries where MOL Group is only involved in exploration activities, the opportunities for hiring local suppliers can be limited due to the specific knowledge and technological requirements. Where MOL Group undertakes production activities, the proportion of local suppliers is higher, especially in Russia where the involvement of local enterprises is close to 100%.
235

Number and ratio of local suppliers* [GRI Standard 204-1]
2015 2016 2017
Number of local suppliers (pcs) 18274 24643 23830
Hungary 14383 11930 9483
Slovakia 1950 10850 10402
Croatia 1086 1179 2616
Pakistan 513 472 523
Russia 242 183 391
Other 100 29 415
Ratio of local suppliers: by number (%) / by contracted value (%) 88% / 64% 88% / 65% 85% / 78%
Hungary 91% / 64% 92% / 57% 84% / 60%
Slovakia 78% / 44% 86% / 63% 87% / 82%
Croatia 85% / 78% 85% / 82% 90% / 92%
Pakistan 74% / 79% 65% / 52% 58% / 76%
Russia 98% / 98% 100% / 100% 98% / 100%
Other 51% / 65% 100% / 100% 76% / 85%
* Locally registered suppliers; the increase in total number of suppliers in Slovakia between 2015 and 2016 is due to the inclusion of SMaO (maintenance single-service companies) in the scope of reporting.
Maintaining a local supply chain creates the greatest benefit to society and to the local economy, especially when locally-owned small businesses are hired as contractors. The total value of contracts signed between MOL Group and locally registered businesses in upstream international countries during 2017 reached ca. HUF 45.1 bn (EUR 146 mn), of which the majority was signed in Paki-stan and Russia.
SUPPLIER MANAGEMENT
In 2017 the implementation and roll-out of a Supplier Qualification System (SQS) continued. This system is an important component of a group-level, integrated system that will deal with all supplier-related information, from the pre-screening to the post-evaluation stage. SQS includes automated assessment of risks associated with suppliers based on legal, ethical, financial and HSE related data and documentation and it also facilitates the supplier pre-qualification process.
LOCAL EMPLOYMENT
Across E&P International Operating companies, MOL Group follows local regulatory requirements and Production Sharing Agreement stipulations (where applicable) to ensure local content and maintain the expat quota – thus the majority of employees at E&P International Operating Companies are local nationals. MOL focuses on developing its local technical and office employees and ensures expat knowledge transfer (through mentoring, tutoring, internal training, etc.). In 2017, the number of local senior executives and local managers saw an increase against 2016.
Local managers in major international upstream locations [GRI Standard 202-2]
Country Indicator Locals Total
RussiaNumber of local senior executives 1 1
Number of local managers 6 7
PakistanNumber of local senior executives 2 4
Number of local managers 16 26
Overall Number of local senior executives 3 5
Number of local managers 22 33
INDIRECT ECONOMIC IMPACT
In the main countries where MOL Group has Upstream and midstream operations, the most significant indirect impact of MOL Group on the economies of these countries is through the energy it supplies. Another area in which the company can have a signif-icant positive impact on the societies of host countries as a result of the group’s operations is by improving access to infrastructure and energy. The development of infrastructure and improvements in access to energy can be directly related to the group’s opera-tions, or can occur based on contractual or other commitments.
NOTES ON SUSTAINABILITY PERFORMANCE

In Pakistan several communities still lack access to clean drinking water. As part of its social investment program in the last years MOL Pakistan has spent more than USD 800 thousand (Rs. 90 million) in executing effective water supply schemes in the most deprived districts of Khyber Pakhtunkhwa including Karak, Hangu, Bannu and Kohat.Previous examples of MOL Group’s indirect economic impact include the non-voluntary financial support given by MOL Pakistan for the construction of the Khushal Garh bridge, which improves safety and connectivity between the main provinces of Khyber Pakhtunkhwa and Punjab in Pakistan.
6. ETHICS AND GOVERNANCEGeneral aim: “Focus on responsible operations and long-term economic development”
ACHIEVEMENTS:
MOL Group Code of Ethics and Business Conduct (updated in 2016 based on Ethics Management System third-party audit) was rolled out with comprehensive communications and training campaign.
A total of 14,691 estimated hours of ethics training /eLearning courses were successfully deployed in MOL Group MOL Business Partner Code of Ethics was updated and published New ‘Template Code’ was published for business partners supporting them in implementation of own codes Supplier pre-screening and pre-qualification including ethics and compliance risk assessment went live. Based on previously completed group-level human rights risk assessment and vulnerable group identification, human rights
“due diligence” process implementation feasibility assessment was started at International E&P. MOL Group published on its website a report on payments to governments in countries where it has exploration and produc-
tion activities
CHALLENGES:
The inclusion of human-rights-related risk assessment in business processes is required, with a focus on international oper-ations
Further improvement of ethical compliance and corporate culture with tailor-made programs for relevant stakeholder groups
Further improve Compliance Program and anti-fraud activitiesOne of the most essential components of MOL Group’s operations is its commitment to ethical and compliant business conduct and individual behaviour. In the long run we are only able to face the challenges of a competitive market by accepting the imperative of moral responsibility, both as individuals and as a company. Ethics is at the core of corporate governance, and is integrated into MOL Group corporate strategy and operations. MOL Group sustainability strategy mirrors this approach by linking ethics and govern-ance issues.
6.1. ETHICS AND COMPLIANCE
Related objective: “Implement key pillars of ethics management system (code of ethics, e-learning, managerial presentation and business partner code of ethics) in all companies and reach 100% coverage”
MOL Group is determined to operate in good faith within the appropriate legal framework, obeying relevant laws, rules and regula-tions. We view regulatory measures as a minimum baseline, while MOL Group’s ethical framework goes beyond legal compliance, integrating standards which are commensurate with stakeholders’ expectations.MOL Group operates a comprehensive ethics management system and compliance programme which is focused on strengthening fair, legal and transparent market behaviour, respecting fundamental human rights, fighting corruption, and preserving and devel-oping ethical values. In 2017 MOL Group scored 97 (equivalent to industry best with a percentile ranking of 100%) in Dow Jones Sustainability Index Codes of Conduct / Compliance / Corruption & Bribery indicator.MOL Group has an Ethics Council composed of Group 2nd level managers of business and functional areas of the company, but as a body independent of the regular work organization, the Council has an employee delegate appointed by MOL Group European Works Council and it is chaired by an external business ethics scholar. The MOL Group Ethics Council’s scope covers every opera-tional and flagship company involved in the matrix operation and their internal and external stakeholders. INA d.d. and its subsidi-aries are covered by INA Group Ethics Council also chaired by an external ethics and labour law scholar.
237

The foundation of MOL Group’s ethics management system, a new Code of Ethics and Business Conduct (CoEBC) finalized in 2016 according to ethics management system third party audit findings, recommendations, external benchmarking and gap analyses, entered into effect of 1st March 2017. It was rolled out in a comprehensive campaign, during which the new CoEBC was delivered in hard copy (printed on environment friendly FSC paper in ‘green press’) to MOL Group employees in 12 languages combined with both extensive communications and managerial campaigns, and also a compulsory employee training campaign was deployed.The CoEBC covers, inter alia, human rights including HSE protection, fair labour, diversity, human dignity and privacy; transparency, anti-corruption, integrity and fair market behaviour; conflict of interests and employee loyalty issues; corporate social responsibility, community and political relations. INA d.d. and its subsidiaries are covered by the INA Group Code of Ethics (INA CoE) introduced at the end of 2010, which is aligned with MOL Group CoEBC, however, not fully identical to that. Harmonization is planned in 2018. The MOL Group CoEBC and INA CoE are available in 14 languages. 24865 (95%1) MOL Group employees received and signed reception of the Code. As part of standard process, every new employee is informed about Code and has to complete training.The MOL Group Business Partner Code of Ethics, which highlights the ethical values that are of utmost importance to MOL Group’s supply chain, and which among other things includes ethical values, human rights, fair labour, anti-discrimination, anti-corruption, fair market behaviour and compliance, is a component of 95% of supplier contracts, of 99.8% of service station operator partner contracts and 60% of sponsorship and corporate giving contracts. 80% of joint ventures, in which MOL Group has a stake of less than 51% or is not the operator, have adopted a Code of Ethics, thus influence is limited, are excluded from the scope).Within the ethics management system, MOL Group places special emphasis on disseminating the values and norms of the Code of Ethics and Business Conduct through ethics-related trainings.
Ethics trainings – mainly e-learning, in case of the employees without IT account, classroom courses and paper testing – of the new CoEBC addressing all the topics covered by the Code were successfully completed by employees at MOL Plc., 48 MOL Group companies.
Every level 1-3 manager has to deliver a presentation to their direct teams on CoEBC, past ethical cases and ethics manage-ment system indicators, plus cascade this task to their subordinated managers with the aim of reaching each employee.
eLearning, classroom courses, managerial presentations, service station employee trainings and other ethics training events totalled 14,535 hours during 2017.
Managers are requested to make a public self-certification statement on annual presentation completion. As special focus group training Chairperson of INA Group Ethics Council, held an ethics training course for Growww (fresh
graduate newcomers) population at INA Group.Conducting ethics risk assessments has been a key pillar of ethics management system since 2011. According to data for 2017, the highest ethical risks in MOL Group, in descending order of risk score, are: breaches of HSE and property protection (Secu-rity, mostly private usage of corporate assets) rules, corruption (incl. gifts to business partners and conflicts of interest), fair trade and competition, fraud, information security breaches, personal data protection, and harassment/bullying. According to external benchmarks, the riskiest countries for MOL Group operations (both from a corruption and from a human-rights perspective) are Kazakhstan, Iraq, Pakistan, Russia, and the Ukraine. Furthermore INA upstream projects in Angola, Cameroon and Egypt also require special awareness. In order to decrease risks, several initiatives have been rolled out:
Integration of an ethics compliance questionnaire into supplier pre-screening and pre-qualification system More focused e-learning material in line with updated CoEBC content Human rights training for security staff in Pakistan Security trainings at MOL Group companies, including the topics of avoiding fraud and conflicts of interest, and abiding by
house security rules are ongoing As of the 1st of April a new Thematic Unit is operating under Group Security: Anti-Fraud & Investigation Team An internal retail fuel-loss risk assessment was conducted during H1 2017 for the entire Hungarian Retail network according
to the methodology approved and piloted in 2016 A financial fraud risk assessment pilot was conducted for 1 MOL subsidiary by the Anti-Fraud & Investigation Team within
the “Digital Audit” pilot sponsored by the Group CFO and MOL Flagship CFO A Hydrocarbon Loss Risk Assessment programme started in MOL Pakistan, with an expat operating locally and with
Group Security (Anti-Fraud & Investigation Team) giving professional supervisionGroup Compliance and Ethics organisation and local teams have a constantly adjusted scope to the changing regulatory and busi-ness environment (Group Compliance Program), which does not cover all aspects of laws, regulations or standards that are handled by standard functions, it rather focuses on those compliance risks which require engagement on corporate level, e.g. competition law, anti-corruption legislation compliance, personal data protection rules and international trade controls and to prevent insider trading. Group Compliance Program is operated for minimizing compliance exposure by conducting audits, keeping records and process management. Compliance activity has the following features which are essential to implement MOL Group’s Compliance Program successfully:
Independent: Compliance has its own organization, experts and budget in MOL Group Credible: in-house enforcement of internal and external commitments by making audits and keeping up-to-date records for
the authority and investors
1 Not 100% due to difference of actual staff and total headcount (caused by e.g. permanent or maternity leaves, pending statuses, etc.)
NOTES ON SUSTAINABILITY PERFORMANCE

Authorized: all employees are obliged to support the operation of Compliance Program and activity of compliance teams Group-level quality assurance: regularly analyses and develops efficiency of group-level compliance risk management and
business compliance control processes in order to mitigate risks Reporting: Compliance operates whistle-blower system and directly reports to Supervisory Board
Group Compliance and Ethics organization operates a group level whistle-blowing system (’SpeakUp!’), conducts and coordinates internal investigations on behalf of the MOL Group Ethics Council; prepares risk analyses and training of employees; conducts process reviews and makes recommendations; provides consultancy. Main compliance focus areas in 2017-2018 are GDPR preparation and continue compliance program and reinforce anti-corruption focus improvement.
ANTI-FRAUD AND ANTI-CORRUPTION
MOL Group condemns every kind of fraud and corruption, fights against such behaviour through the means of prevention, intelli-gence and investigation. The first Anti-Fraud Team was established at the end of 2015 within the framework of Group Security. The Team was added with investigative roles and the Group Anti-Fraud & Investigation thematic unit was established as of the 1st of April, 2017. In 2017, the main focus was on developing the functional Anti-Fraud capabilities, focusing on efforts combating financial fraud and to estab-lish a “federal level” group investigation capability covering high priority and highly sensitive investigations and coordinating, controlling Flagship level investigation units. In 2017 a total number of 37 investigations were conducted on Group level. Another focus was to enhance the loss prevention capabilities with conducting the fuel loss risk assessment for the whole Hungarian Retail network (444 Service Stations) and validating the methodology by Internal Audit. The methodology was updated, the database and the findings were shared with the relevant units to support the decision making process and to allocate the resources in order to minimize Fuel Loss. After the Executive Board tasked IT and Group Security to present the “Revised Fuel Loss Management at MOL Retail”, the re-designed processes were submitted in Q4, 2017. The processes will combine the Fuel Loss Risk Assessment with data mining and big data analysis capabilities to enhance loss prevention, detection and correction. With the new organizational set-up the redesigned Anti-Fraud framework will contain a monthly Anti-Fraud Newsletter (for awareness and educational purposes), an Anti-Fraud Statement signed by top management (top-to-down commitment) and an Anti-Fraud & Investigation Group Principle regulation with relevant Process Descriptions (to be implemented in early 2018). The policy is designed to be in line with the UK Bribery Act and the US Foreign Corrupt Practices Act.MOL Group operates conflict of interest avoidance processes based on strict regulations. Every employee has to fill out a conflict of interest statement, and Group Security carries out periodic investigations. Anti-Fraud related training (about internal investigations and conflicts of interest) are mandatory for all employees and newcomers. The training that started in 2014-2015 is renewed and then delivered biannually.MOL Group sponsorship activities rely on strict ethical standards. We do not support religious organisations, political goals and parties, and any organisations or events violating human rights, the interest of the common good, offend public morals, or repre-sent any discriminative opinion. For more information visit: www.molgroup.info/en/about-mol-group/sponsorship/corpo-rate-giving-principles
6.2. ETHICAL CASES
Group Ethics Officer (a member of the MOL Group Compliance and Ethics unit) on behalf of MOL Group Ethics Council coordi-nates grievance and ‘whistle-blower’ report and investigations, manages whistle-blower protection and ethics-related consultancy, provides general compliance decision-making support. For INA Group Ethics Council operative support is provided by HR organi-zation, operation is managed directly by INA Group Ethics Council chairperson.Cases of misconduct are detected and investigated using various mechanisms throughout the Group by applying the principle of subsidiarity. Cases are inspected by the Ethics Council if the whistle-blower has turned to, or the concerned function escalates the case to the Ethics Council, thus the Ethics Council statistics does not mirror every – typically minor, common or trivial – internal ethical, compliance or security misconduct’s investigations. Data of cases handled by MOL Group and INA Group Ethics Coun-cils are consolidated below. Data on specific issues can be found in the corresponding chapters of this report. Data on fraud, theft, misappropriation and other potential criminal offence cases not needing elevated ethics procedure due to triviality, thus managed directly by Security, can be found at the end of this section.Grievances and whistle-blower reports are handled confidentially, while the online (web-based) submission process is publicly available in English and in Hungarian and anonymous reports are accepted as well. In addition, the Ethics Council operates a 24/7 hotline with an answering machine.The number of reports submitted via ‘Speak Up!’ and to INA Ethics Council and the number of investigations has been continuously increasing over the last five years. Compared to the 93 ethics-related complaints/reports submitted in 2016, a higher number (137 including retail customer complaints or 110 excluding these) was received by MOL Group and the INA Group Ethics Councils in 2017.
239

This continuous increase indicates an improvement in awareness about ethics and compliance by internal and external stakeholders, which is in line with the group’s visibility and awareness arising strategy. The proportion of ethics-related reports arriving from external (non-MOL Group company employee) stakeholders increased (30% of the total in 2016; 52% in 2017) as improved ‘SpeakUp!’ web-site visibility at mol.hu website encouraged Hungarian customers to submit satisfaction issues regarding retail service stations and host attitudes here. These were channelled to customer services, and only consumer protection compliance monitoring was kept. Excluding retail customer complaints, the proportion of ethics concern report from external sources was 25.5% in 2017, showing a slight decrease compared to 2016.
Ethical Cases Reports
2013 2014 2015 2016 20172017
W/O RETAIL CUSTOMERS
Ethics Concern Reports 81 88 90 93*** 137 110
o/w Internal 56 51 42 66 65 65
o/w External 25 37 48 27 72 35
Investigations 45 61 58 63 85 66
Misconducts 25 22 27 26* 47** 33
* Restatement: Investigations which commenced in 2016 and closed in 2017 revealed additional two cases of misconduct, resulting in a total of 26 case of misconduct for 2016.
** As of the end of 2017 12 (2 at INA) investigations were ongoing, 1 suspended until court proceeding is over.*** In 2016 Ethics Concern Reports contained 8 retail customer complaints.
External reports were submitted by customers (53%), service station operators’, suppliers’, subcontractors’ employees (12.5%), former employees and job applicants (12.5%), contractual partners and service station operators (8%), and concerned local residents, land owners (4%). In 8% of external reports, the submitter’s relationship with MOL Group was not revealed, since whistle-blowers have the option not to disclose such details.Ethics reports were received from 7 countries. In the Top 3 were Hungary with 69% of the cases (of which one fourth concerned retail customer complaints), Croatia (13%) and Pakistan (6%).
The most frequent topics of ethics concern reports are shown in the table below.
Topics of ethics complaints/‘whistle-blower’ reports in 2017 2016 2017
Unfair employment / termination 6 22
Harassment / Inappropriate communication 24 16
Insufficient service / Impoliteness 5 15
Discrimination / unethical performance evaluation 14 12
Defrauded customer – 10
HSE Breach 2 8
Fraud / Theft 14 7
Abuse of MOL's dominant position 0 5
Corruption / Bribery 3 4
Misleading customer information 2 4
Other (incl. defamation, violation of confidentiality etc.) 27 29
Regarding 66 ethics concern reports an investigation was justified (not considering the retail customer complaints where all was investigated), and in 33 cases ethical misconduct was verified by investigations conducted based on ethics concern reports in 2017. Ongoing cases at the end of 2017: 12 at MOL and 2 at INA. Consequences of confirmed misconduct included eight cases of termina-tion of employment and two cases of terminations of partner contracts, as well as 11 written and 3 verbal warnings, financial penal-ties, bonus reductions and numerous corrective measures incl. follow-up audits and staff trainings.In 2017, stakeholders sought advice from the Ethics Council in 7 instances on ethical questions. The Ethics Council annually reports about ethics-related cases to the Board of Directors’ Sustainable Development Committee and to the Supervisory Board, and publishes in internal publications and on the web (anonymized) details about the established cases of misconduct to raise aware-ness. More information about the nature of such misconduct is available on the website (www.molgroup.info/en/sustainability/ethics-and-governance/ethics-and-compliance/ethics-cases ).
NOTES ON SUSTAINABILITY PERFORMANCE
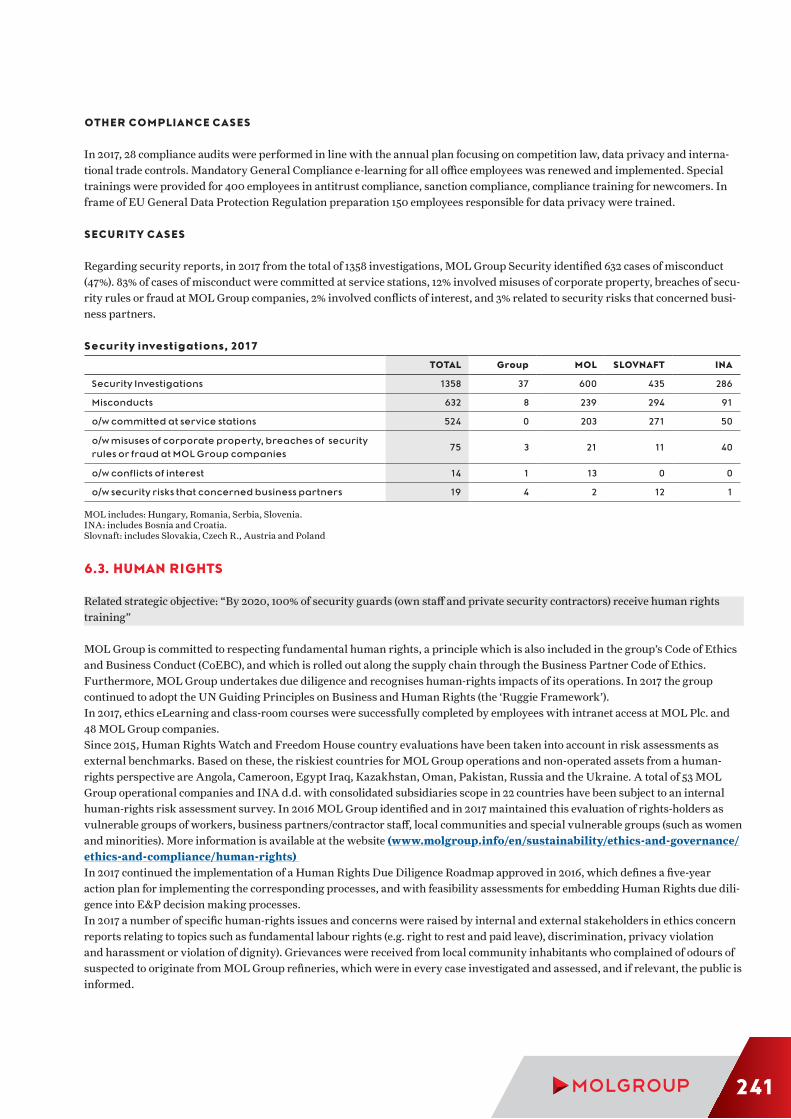
OTHER COMPLIANCE CASES
In 2017, 28 compliance audits were performed in line with the annual plan focusing on competition law, data privacy and interna-tional trade controls. Mandatory General Compliance e-learning for all office employees was renewed and implemented. Special trainings were provided for 400 employees in antitrust compliance, sanction compliance, compliance training for newcomers. In frame of EU General Data Protection Regulation preparation 150 employees responsible for data privacy were trained.
SECURITY CASES
Regarding security reports, in 2017 from the total of 1358 investigations, MOL Group Security identified 632 cases of misconduct (47%). 83% of cases of misconduct were committed at service stations, 12% involved misuses of corporate property, breaches of secu-rity rules or fraud at MOL Group companies, 2% involved conflicts of interest, and 3% related to security risks that concerned busi-ness partners.
Security investigations, 2017
TOTAL Group MOL SLOVNAFT INA
Security Investigations 1358 37 600 435 286
Misconducts 632 8 239 294 91
o/w committed at service stations 524 0 203 271 50
o/w misuses of corporate property, breaches of security rules or fraud at MOL Group companies
75 3 21 11 40
o/w conflicts of interest 14 1 13 0 0
o/w security risks that concerned business partners 19 4 2 12 1
MOL includes: Hungary, Romania, Serbia, Slovenia. INA: includes Bosnia and Croatia. Slovnaft: includes Slovakia, Czech R., Austria and Poland
6.3. HUMAN RIGHTS
Related strategic objective: “By 2020, 100% of security guards (own staff and private security contractors) receive human rights training”
MOL Group is committed to respecting fundamental human rights, a principle which is also included in the group’s Code of Ethics and Business Conduct (CoEBC), and which is rolled out along the supply chain through the Business Partner Code of Ethics. Furthermore, MOL Group undertakes due diligence and recognises human-rights impacts of its operations. In 2017 the group continued to adopt the UN Guiding Principles on Business and Human Rights (the ‘Ruggie Framework’).In 2017, ethics eLearning and class-room courses were successfully completed by employees with intranet access at MOL Plc. and 48 MOL Group companies.Since 2015, Human Rights Watch and Freedom House country evaluations have been taken into account in risk assessments as external benchmarks. Based on these, the riskiest countries for MOL Group operations and non-operated assets from a human-rights perspective are Angola, Cameroon, Egypt Iraq, Kazakhstan, Oman, Pakistan, Russia and the Ukraine. A total of 53 MOL Group operational companies and INA d.d. with consolidated subsidiaries scope in 22 countries have been subject to an internal human-rights risk assessment survey. In 2016 MOL Group identified and in 2017 maintained this evaluation of rights-holders as vulnerable groups of workers, business partners/contractor staff, local communities and special vulnerable groups (such as women and minorities). More information is available at the website (www.molgroup.info/en/sustainability/ethics-and-governance/ethics-and-compliance/human-rights) In 2017 continued the implementation of a Human Rights Due Diligence Roadmap approved in 2016, which defines a five-year action plan for implementing the corresponding processes, and with feasibility assessments for embedding Human Rights due dili-gence into E&P decision making processes.In 2017 a number of specific human-rights issues and concerns were raised by internal and external stakeholders in ethics concern reports relating to topics such as fundamental labour rights (e.g. right to rest and paid leave), discrimination, privacy violation and harassment or violation of dignity). Grievances were received from local community inhabitants who complained of odours of suspected to originate from MOL Group refineries, which were in every case investigated and assessed, and if relevant, the public is informed.
241

To ensure that human rights are protected through the supply chain, MOL Group strives to improve its Responsible Supply Chain Management and extend the implementation of its ethics values and norms, as well as transfer human rights-related knowledge, conduct prequalification activities, audits and due diligence. MOL Group Business Partner Code of Ethics highlighting ethical values – including human rights – and compliance rules most important in the supply chain is a part of 95% of supplier contracts, of 99.8% of service station operator contracts and 60% of sponsorship and corporate giving contracts. 80% of joint ventures – in which MOL Group has a stake of less than 51% or is not the operator – have a Code of Ethics addressing human rights as well.A risk-based supplier prequalification system was implemented which includes an ethics compliance due-diligence questionnaire with classic code of conduct and internal policy-related questions. It also collects data about fair labour practices and other human-rights related factors regarding potential suppliers and contractors.In Pakistan’s E&P operations in-house human-rights training was delivered to private security contractors and armed forces for 92% of security personnel in 2017.MOL Group is not engaged in activities which affect indigenous people. MOL’s modus operandi ensures the safeguarding of the rights of tribal populations and indigenous people. In this spirit, we commit to gaining free prior and informed consent in the event that indigenous people should be relocated from their land. So far, no resettlements have occurred at any of the group’s interna-tional operating locations.
6.4. TRANSPARENCY
The integrated Annual Report remains MOL Group’s most important sustainability-related disclosure. Several other forms of communication and channels are also used to disclose and inform internal and external stakeholders about the group’s sustaina-bility performance. Key sustainability performance indicators and activities have been part of quarterly flash reports and investor presentations, alongside key financial indicators for more than three years. MOL Group’s website (www.molgroup.info/en/sustainability) contains additional information about the topics described in this report, some in more detail and in a format that better suits a larger, non-expert audience.Large subsidiaries of MOL Group publish sustainability information in different ways:
In Croatia INA Group publishes its own integrated financial, non-financial Annual Report and has webpages dedicated to the topic of Sustainable Development. In 2017 INA has received a distinction in the Deloitte Central European Sustainability Report Award for the 2015 Annual Report.
In Hungary MOL Plc’s Downstream business (production, logistics and retail) prepare public disclosures about their envi-ronmental performance every year or on a bi-annual basis.
In Slovakia Slovnaft publishes its key sustainability performance indicators in its Annual Report, and also dedicates a section of its website to Sustainable Development and HSE
Local reports are available through the group’s website (www.molgroup.info/en/sustainability/report-and-data/local-reporting).We consult a number of stakeholder groups about sustainability performance and reporting both at corporate and on local level. In 2017, among other related initiatives we can highlight the following:
In Hungary according to MOL’s standard practices, the executive management of the European Workers’ Council (EWC) reviewes workforce-related information published in the MOL Group Annual Report
In Slovakia since 2016 an information platform using push SMS to communicate with the public, the system dispatches noti-fications about planned shutdowns of the refinery units. Open days organized on water day and earth day, on the internally organized “Green Day” meeting with local authorities and state authorities was organized to provide information on the company's activities
In Croatia in 2017 Open Door Day was held in Rijeka Refinery. Almost 400 people visited. In Sisak refinery 2 public hearings were held related to planned projects.
MOL Hungary organized open days in Danube and in Zala refineries where interested stakeholders could visit the sites. Internal stakeholders are consulted during the HSE week and councils are informed.
In countries where MOL Group is only involved in Exploration and Production operations, the energy industry as a whole may generate a significant proportion of national income (through royalties or production-sharing agreements). MOL Group acknowl-edges the importance of the transparency of payments related to extractive activities and observes any legislation or initiative connected to it. Between 2013 and 2016 MOL Group supported the Extractive Industries Transparency Initiative (EITI) at an inter-national level. In order to comply with relevant EU level regulations in 2017 for the first time MOL Group published on its website (www.molgroup.info/en/investor-relations/download-centre) a report on payments to governments in countries where it has exploration and production activities.
6.5. CUSTOMERS
MOL Group has approximately 30,000 wholesale customers and 1600 petrochemical customers. The main purpose is to serve customers on the highest level, therefore MOL Group constantly tracks their satisfaction. MOL Group believes success and contin-
NOTES ON SUSTAINABILITY PERFORMANCE

uous improvement can only be built on partnership and long-term cooperation between MOL Group and its customers, whether it is wholesale or retail consumers. We listen to their needs and strive to provide them with the best-in-class solutions to streamline their businesses and everyday operations.
CUSTOMER SATISFACTION IN GENERAL
Each of the business units has one or more customer-bases, depending on whether the product is marketed to wholesale customers or retail customers. In wholesale, MOL Group differentiates between Wholesale Fuel customers (fewer clients who buy larger quan-tities) and Fuel Card customers (more clients who buy smaller quantities through the retail network). In terms of customer satis-faction, MOL Group is in the process of elaborating a group level standardized survey, providing an overarching methodology covering all products, markets and customer types. The new setup allows to see each market individually, as well as to aggregate the results. Furthermore, it provides valuable insight into customer needs, giving the group useful feedback, thereby equipping MOL Group with clear actionable directions on where to improve.
WHOLESALE
MOL Group has been conducting customer satisfaction surveys among its wholesale customers since 2002 on its core markets with the aim of understanding customer expectations towards the group. The scope of the surveys are determined by MOL Group’s commercial and business strategy, with a focus on core markets. Lubricant product group results are consolidated into MOL and Slovnaft wholesale satisfaction indices. Surveys are usually conducted by independent market research companies. Based on the loyalty segments and satisfaction matrix, plans for improvement are quantified and implemented into the company’s quality objec-tives. The development actions based on the survey outcomes are monitored quarterly, and are adjusted according to the results of the survey each year. In year 2017 INA, MOL Romania and the petrochemical business unit conducted their own surveys, giving an indication on customer satisfaction. From 2018 on, all the B2B customers’ satisfaction will be measured with the new, unified meth-odology, providing vast knowledge and insights on the segment, giving the widest customer satisfaction related database ever in MOL Group’s life.
Wholesale customer satisfaction performance [GRI Standard 102-43]
Latest customer satisfaction survey results* Hungary Slovakia Croatia** Romania
Fuels 4.38 4.4 5.25 4.12
Card 4.3 4.3 5.28 4.25
* Croatia and Romania conducted surveys during 2017, Slovakia (2015), Hungary (2016) – all based on different methodologies** Croatia switched to a 1-6 scale in 2017. Remaining countries retained the 1-5 scale
RETAIL
Consumer Services (and Retail within it) is a key pillar in the 2030 transformation of the Group. A key aspect for the successful transformation is become the first choice of customers. So after an extensive customer research/segmentation study conducted in 2016 titled “Who is the Customer?”, MOL Retail, based on the insights, continued to develop its fuel and non-fuel strategies. Besides the ongoing roll-out of the Fresh Corner brand, MOL Retail introduced the new Group fuel strategy and continued to optimize its core assortment, introducing new offers and products in its service stations. And as a result of yearlong customer-centric efforts, including the SMILE program, MOL Retail moved to industry tier one in terms of consumer acceptance, while reaching the highest net promoter score ever in Hungary during 2017. Furthermore, MOL Retail managed to increase its active loyalty customer base by 12% year on year through an optimized and better targeted loyalty strategy. During 2017, MOL retail recorded zero lost time injuries during the reconstruction of Fresh Corners. Furthermore, altogether almost 400 Area and Service Station Managers, more than 2000 Hosts and over 100 Retail Management staff took part in the SMILE training across the group during the year, whilst several upgrades were made across the network, including the latest innovations in digital consumer friendly solutions, the first drive-through station for coffee and food, and as well as a renewed fuel range.
PETROCHEMICALS
MOL Group regularly (annually) conducts customer satisfaction research using a sample size of 550-600 chosen from the domestic (Hungarian, Slovakian) and European polymer partners of MOL Group. The objectives of the analysis are to monitor the satisfac-tion level of partners, to identify the companies’ strengths, and to pinpoint areas in need of development, as well as to track perfor-mance trends. In the autumn of 2017, MOL Group conducted a satisfaction survey using a sample size of 565 of which 436 successful interviews were conducted. Average satisfaction shows a positive tendency. Loyalty index has improved further in 2017. 45% of the
243

customers are completely satisfied and 90% show a strong satisfaction level. Similarly to last year, MOL Group performs outstand-ingly in terms of maintaining contact with customers (availability and competency of sales experts). 78% of respondents evaluate MOL Group more reliable compared to its competitors, which shows further improvement compared to 2016 (71%). MOL Group was defined by the respondents as a reliable partner of them with dedicated sales staff.
LUBRICANTS
Due to increasing competition on the lubricant market, in addition to the acquisition of new customers, MOL Group also dedicate particular attention to strengthening and further developing current business relationships. In addition to high-quality products, reliable logistics and flexible production capacities, MOL Group manages the particular needs of its partners with a customer-centric mind-set. MOL Group offers its customers a wide range of lubrication technology services, including specific problem-solving, company-tailored expert consulting and on-site lubricant maintenance, as well as LubCheck oil and machine diagnostics, enabling potential cost reductions. In 2017, MOL Group’s regionally operating Lubrication Technology HelpDesk (LubTechDesk) responded to 1,350 queries submitted from 19 countries. With its tailor-made lubrication management training, MOL Groups helps its customers (including at their site) in order to make their specific operations more efficient.
RESPONSIBLE ADVERTISING
In order to avoid misleading advertising, MOL Group thoroughly examine the intelligibility of the messages it seeks to convey. Most commonly, this means doing research with focus groups, where participants are able to express opinions and insights about particular messages and visuals. This method is used at the early and mid-phases of developing advertisements so as to obtain continuous feedback about how understandable and clear the messages MOL Group wants to communicate are. In addition, all MOL Group communication materials are checked by the Legal department – both at Group level and locally in countries where MOL Group operates – before they are released to the public. This process promotes and ensures more responsible advertising.
PRODUCT SAFETY
MOL Group is continuously assessing substances that are used by consumers which may have harmful effects on human health or the environment (substances classified as carcinogenic, mutagenic and reproductive toxic – CMR; persistent, bio-accumulative and toxic – PBT; or very persistent or very bio-accumulative – vPvB) or have physical hazards (Flammability, Explosiveness, etc.) within the frame of Registration, Evaluation, Authorization and Restriction of Chemicals (REACH) Regulation. Declarations of compliance with REACH, as well as the relevant safety data sheets, are available on the following websites:
MOL Hungary: www.reach.mol.hu/ MOL-LUB: www.mol.hu/hu/kenoanyag-es-autoapolas Slovnaft: www.slovnaft.sk/en/products/material-safety-data-sheets INA:www.ina.hr/customers/products-and-services/safe-management-of-product/safety-data-
sheets-10027/10027 INA (Maziva): www.ina-maziva.hr/hr/podrska/sigurnosno-tehnicki-list/45?teh_kar=2 IES: www.molgroupitaly.it/it/prodotti-e-servizi/prodotti-petroliferi/benzine-e-gasoli
All dossiers for substances in the scope of Concawe were updated in MOL Group. The submitted and updated information will inform customers about the product and their impact on human health and the environment.One solvent, which is in use in SLOVNAFT, MOL and MPC, the so called NMP (1-methyl-2-pyrrolidone), has been added to the Restriction list, new Derived No-Effect Levels (DNELs) relating to exposure to workers of 14.4 mg/m3 for exposure by inhalation and 4.8 mg/kg/day for dermal exposure have been identified.
CUSTOMER SAFETY
Consumer Services’ (including Retail) goal is to raise the awareness of its customers regarding safety behaviour, not only in MOL Group’s Service Stations, but also with supporting and useful instructions to be applied in everyday life. The vision is to be the first choice for Customers in fuel, convenience retailing and become a power brand in the group’s core markets whilst keeping all customers, colleagues and contractors safe! Supporting this initiative, the “Slip & Trip” campaign was launched throughout the retail network to reduce the possibility of unsafe acts. Furthermore, defibrillators have been installed in a number of service stations along the highway network as these stations experience, on average, higher traffic count.MOL Hungary held a Practical Safety day for employees to get acquainted with handling of different types of hazardous situa-tions and the possible ways of remedying them, which teaches not only how to intervene during emergency situations in the service station, but also in the case of customer safety.
NOTES ON SUSTAINABILITY PERFORMANCE

7. ABOUT SUSTAINABILITY REPORTING 7.1. SCOPE AND BOUNDARY
MOL consolidates sustainability information based on a ‘control approach’. We account for almost 100 percent of the sustainability data from operations controlled by the company, including those in which MOL or one of its subsidiaries acts as operator.In 2017 two significant entities were included in the data collection, namely CMEPS (power plant in Slovakia supplying Bratislava refinery) and OTI Group in Hungary a group of EPC contractor companies.HSE-related data is collected only at operations with significant potential health, safety and / or environmental impact through MOL Group’s dedicated reporting system provided by Enablon. HSE data coverage is 94% in proportion to revenue, incorporates environmental, safety and energy-related data from all HSE-relevant companies within the portfolio.Human Resources (HR) data, including sustainability reporting-related information, is collected using the group’s SAP enterprise resource management system. The scope of HR data collection in terms of headcount, turnover and trainings is 100% (including non-operated joint ventures as well). Other sustainability-related data are collected for subsidiaries with a headcount of over 100 employees ensuring a data coverage of 87% in proportion to revenue.Social investment data is collected from operations and subsidiaries which have approved corporate giving plans. This means that data was collected for almost all donations activities, however it means a coverage of 94% of operations, since not all entities have donation activities.Ethics-related data reporting requirements have been extended to all consolidated companies with at least one employee. This represents coverage of 98% in proportion to revenue. INA d.d. covers all of its subsidiaries itself, and reports INA Group-level consolidated data to Group Compliance & Ethics. The supply chain is considered less material according to the materiality assessment, since MOL’s activities with the largest poten-tial impact are executed within the company’s operational boundaries, as described above. Hence, the performance of MOL Group’s suppliers is incorporated using only the following indicators:
GHG Scope 2 and 3 emissions Contractor safety incidents, including fatalities Spending on local suppliers
7.2. REPORTING ON JOINT VENTURES
Operated joint ventures by definition fall within the scope of data reporting.In the case of joint ventures where MOL Group does not act as operator, we do not report sustainability data based on equity share. The only exceptions are for GHG emissions and HSE penalties, where in performance tables equity-share-based emissions are reported from MOL Group-related joint venture companies as well.Concerning non-operated joint ventures, the performance data included in the sustainability chapter do not include quantified information since MOL Group does not have operational control over these ventures (except for the inclusion of headcount data in the case of financially-consolidated companies). However, MOL Group hereby declares that it has presented any information related to the 2017 sustainability performance of these companies that was found to be material.
Midstream Joint Ventures and non-operated companies: Hungary (FGSZ): this natural gas transmission company is a 100% consolidated subsidiary, but it is not MOL operated due
to the unbundling regulations of the European Union. The key sustainability performance of FGSZ is summarized using the indicators included in the table below.
Selected performance indicators for FGSZ Plc. 2015-2017
Indicator Unit 2015 2016 2017
Total Direct GHG (scope-1) mn t 107,632 135,481 163,211
Total Water Withdrawals m3 12,097 8,724 6,932
Number of Spills (>1 m3) 0 0 0
Fatalities – own employees 0 0 0
Lost Time Injury Frequency (LTIF) – employees 3.7 0 0.82
Total workforce 760 746 685
Donations mn HUF 348 0 24.7
245

Downstream Joint Ventures and non-operated companies Hungary (JSR MOL Synthetic Rubber Ltd.): Through a joint venture with JSR Corporation we have started constructing a
new plant (60 kt/y capacity) to manufacture synthetic rubber (S-SBR) in Tiszaújváros. During this early phase of the project, safe construction is the most important sustainability issue. Zero lost time injuries were defined as the KPI. At the worksite, all the HSE rules pertaining to existing production facilities have been applied, and HSE performance is regularly discussed. During 2017, more than 1.284.684 worked hours were recorded, with 3 LTI cases.
Austria (Danuoil): Danuoil is a joint venture between Heizöle Roth & Genol (50% Genol & 50% Heizöle Roth). There is no operational responsibility for MOL Austria/Roth, and the workforce is employed by Genol. The MOL Austria Group LOG HSE Management system is implemented at DANUOIL, and MOL Austria’s HSE manager supervises supporting and consultancy services such as providing annual HSE training to operational staff, along with offering full support for SEVESO inspections, or other legal compliance requirements. Danuoil has recorded zero lost-time injuries since 2012.
Upstream Joint Ventures and non-operated companies: Europe (UK): HSE performance is discussed at senior meetings with JV partners. If there are any areas of concern or inci-
dents, the learning outcomes are discussed along with any remediation measures that are required. MOL Group manage-ment was not informed about any significant incidents during 2017.
Europe (Norway): Ongoing ‘farm in/out’ discussions are ongoing. The HSE department undertook an appraisal and provided input when required. MOL Group management was not informed about any significant incidents that took place during 2017.
FSU (Kazakhstan): Discussions are ongoing with partners about the possibility of an early production project, with full HSSE support. MOL Group management was not informed about any significant incidents that took place during 2017.
Middle East Joint Ventures and non-operated companies: KRI (Shaikhan field): In the Kurdistan Region of Iraq, Gulf Keystone (GKP) is the operator of the Shaikan field. Informa-
tion about HSE performance is regularly collected from this partner. MOL Group management was not informed about any significant incidents that took place during 2017.
In Pakistan, MOL has non-operated interests in two blocks (Karak, and Ghuri). MOL operational teams (Drilling, Project, etc.) review the HSE features of all projects that are undertaken by partners during the project sanction and approval process. MOL Group management was not informed about any significant incidents that took place during 2017.
7.3. NOTES ON SUSTAINABILITY DATA
We create sustainability performance indicators (as published in this report) using measurements and calculations where possible, whereas best available estimates are used only when necessary. Sustainability data is generated and calculated taking into considera-tion pertinent legislation at a local level. Aggregation processes are carried out according to relevant corporate guidelines and policies
Notes on environmental data: MOL Group discharges waste water into surface waters or into municipal sewage systems which is treated depending on
site circumstances and local. MOL Group does not believe that breaking down this data further according to destination and treatment method is material. Accordingly, it is not reported.
According to the information provided by contractors, waste disposal methods were classified using European Union guidelines. Communal waste is not included in MOL Group waste figures since collectors are legally responsible for reporting the
amount of waste collected, disposed and recovered.
Notes on divested upstream operations: Sustainable development performance of international upstream operations divested during the reporting year are not reported.
Restatements: Total direct energy consumption: the total direct energy consumption value for 2016 was not correct due to a calculation
error. It had to be restated from the reported 99.8 million GJ to 101.7 million GJ. The “direct gas” and ‘direct other HC’ energy consumption figures were reported correctly in 2016.
Total Petroleum hydrocarbon (TPH): one 18,25 tonnes was mistakenly reported by Tifon d.d in 2016. This amount was completely deducted from 2016, for 2017 a correct number of 0,9 tonnes was reported by this entity.
HSE Investments for 2016 is restated as only capital expenditures were included, omitting the inclusion of operating expenses. HSE Operating Costs for 2016 is restated due to erroneous calculation. Number of spills (>1bbl), and Number of spills (>1bbl) (HC content) for both 2015 and 2016 are restated due to erroneous calculations. Ethical misconducts for 2016 is restated due additional two cases of misconduct.
NOTES ON SUSTAINABILITY PERFORMANCE

7.4. AUDITS
A number of internal and external assessments are performed in order to audit compliance with internal regulations, to pinpoint areas and opportunities for improvement, and to raise awareness.
Internal assurance: MOL Group Internal Audit department is responsible for auditing compliance with internal regula-tions according to an approved audit plan. Besides this there are other assurance processes as well by other organizations to control and improve processes including performance reporting.
External assurance: the assurance process is planned and performed according to the International Federation of Account-ants’ ISAE3000 Revised standard. Within this framework, EY reviews all data under a limited scope of assurance, and for CO2 under ETS and Total Recordable Injury Rate for own employees under the scope of reasonable assurance. Since 2014, sustainability performance has also been assessed whether it is in line with the principles of Inclusivity, Materiality and Responsiveness, as defined by AA1000AS.
8. INDEPENDENT PRACTITIONER’S ASSURANCE REPORTTO THE MANAGEMENT OF MOL HUNGARIAN OIL AND GAS PLC:
This report is intended solely for the management of MOL Hungarian Oil and Gas Plc. (hereinafter ‘the Company’, ’MOL Group‘ or ‘MOL’) for the purpose of reporting on Sustainability Information Chapter in MOL Group’s Annual report (‘the Sustainability Report’), prepared by the Company for the year ended 31 December 2017 in accordance with Global Reporting Initiative Standards (‘GRI Standards’).
UNDERLYING SUBJECT MATTER AND APPLICABLE CRITERIA
The assurance engagement relates to the following subject matters on which the following applicable criteria are applied:The subject-matter of our work is to express assurance on the Sustainability Report prepared by the Company for the year ended 31 December 2017, including
limited assurance that the Sustainability Report is prepared in accordance with GRI Standards reasonable assurance on two specific indicators included in the Sustainability Report whether those are in line with the
requirements of GRI Standards: • CO2 emission under the EU Emissions Trading Scheme (ETS) and • Total Recordable Injury Rate (TRIR) for own employees.
SPECIFIC PURPOSE
This report is intended solely for the purposes specified in the first paragraph above and for your information and must not be used for other needs. The report refers exclusively to the Sustainability Report and must not be associated with any Company’s financial statements as a whole.
RESPONSIBLE PARTY’S RESPONSIBILITIES
The Company’s management is responsible for the preparation of the Sustainability Report in accordance with the GRI Stand-ards. In particular, the Company’s management is responsible for internal controls being designed and implemented to prevent the Sustainability Report from being materially misstated.In addition, the Company’s management is responsible for ensuring that the documentation provided to the practitioner is complete and accurate. The Company’s management is also responsible for maintaining the internal control system that reasonably ensures that the Sustainability Report described above is free from material misstatements, whether due to fraud or error.
PRACTITIONER’S RESPONSIBILITIES
We conducted our assurance engagement in accordance with the International Standard for Assurance Engagements (ISAE) 3000 Revised, Assurance Engagements Other Than Audits or Reviews of Historical Financial Information. These regulations require that we comply with ethical standards and plan and perform our assurance engagement to obtain limited assurance about the Sustainability Report and reasonable assurance over the two selected indicators as stipulated above (CO2 under ETS and TRIR).
247

We apply International Standard on Quality Control 1 (ISQC 1), and accordingly, we maintain a robust system of quality control, including policies and procedures documenting compliance with relevant ethical and professional standards and requirements in law or regulation.We comply with the independence and other ethical requirements of the IESBA Code of Ethics for Professional Accountants, which estab-lishes the fundamental principles of integrity, objectivity, professional competence and due care, confidentiality and professional behavior. The procedures selected depend on the practitioner’s judgment. The procedures include, in particular, inquiry of the personnel respon-sible for reporting and risk management and additional procedures aimed at obtaining evidence about the Sustainability Report. The assurance engagement performed represents a limited assurance engagement, except for the two specific indicators (CO2 emission under ETS and TRIR) where reasonable assurance is provided. The nature, timing and extent of procedures performed in a limited assur-ance engagement is limited compared with that necessary in a reasonable assurance engagement. Consequently, the level of assurance obtained in a limited assurance engagement is lower.We believe that the evidence we have obtained is sufficient and appropriate to provide a basis for our conclusion.In respect of the subject matter mentioned above we have performed mainly the following procedures:
1. Understanding and review of the Company’s internal controls, processes and systems set up for the preparation of the Sustaina-bility Report.
2. Interviewed a selection of MOL executives and senior managers to understand the current status of Sustainable Development activ-ities and progress made during the reporting period of 1st January to 31st December 2017.
3. Reviewed selected documents relating to Sustainable Development aspects of MOL’s performance, to understand progress made across the organisation and to test the coverage of required indicators as defined by GRI Standards within the Sustainability Report.
4. Reviewed MOL’s processes for determining material issues to be included in the Sustainability Report.5. Reviewed the consolidation of the selected data at Group level by:
• Holding interviews with specialists responsible for managing, collating, and reviewing data at corporate level.• Conducting data walk-throughs of reporting systems to assess the accuracy of calculations and assumptions, including an
assessment of the effectiveness of MOL’s internal review procedures.• Performing additional testing procedures in relation to the CO2 emission under ETS (review of third-party verification
reports) and own staff TRIR indicators (verification of data to source documents on a sample basis both at Group and site level, recalculation of the indicator) at both site and corporate level to gain reasonable assurance over these indicators.
6. Conducting site visits at four MOL locations (MOLTRANS, MOL Petrochemicals, Slovnaft Logistics, MOL Slovenia Retail) to test the application of MOL’s reporting procedures and test a sample of performance data back to source documentation for accuracy and completeness. Our site visits focused on selected indicators presented in the Sustainability Report, covering material aspects of MOL’s non-financial performance (energy consumption, air emission, environmental indicators, process safety, health & safety, social indicators).
7. Reviewed the narrative content of the Sustainability Report and the presentation of the selected data to assess whether: • The coverage of issues in the Sustainability Report is consistent with the outputs of MOL’s materiality process, and that the
descriptions of MOL’s approaches to materiality are consistent with our observations. • The selected data presented in the Sustainability Report corresponds with the information we have reviewed during the
course of our work. • The Report is consistent with the requirements for ‘Comprehensive’ reporting according to the GRI Standards.• There is supporting evidence for 25 qualitative statements, selected on a risk basis, within the Sustainability Report.
8. Assessment of the performance of MOL Group’s management related to the principles of Inclusivity, Materiality and Responsive-ness as defined by AA1000AS (2008).
PRACTITIONER’S CONCLUSION
Based on the procedures performed and evidence obtained, nothing has come to our attention that causes us to believe that the Sustainability Report was not prepared, in all material respects, in accordance with the GRI Standards.In our opinion, the CO2 emission under the EU Emissions Trading Scheme (ETS) and the Total Recordable Injury Rate for (TRIR) own employees of the Group within the Sustainability Report for the year ended 31 December 2017 has been prepared, in all mate-rial respects, in accordance with the GRI Standards.
OBSERVATIONS AND AREAS FOR IMPROVEMENT
Our observations and areas for improvement will be raised in a report to MOL management. Selected observations are provided below. These observations do not affect our conclusions on the Sustainability Report set out in this statement.
MOL introduced a new data collection and reporting system, MARK HSE in 2015. Whilst our reviews suggest that there has been a continuous and general improvement in data quality since the transition, there were still misstatements due to the misunderstanding of reporting definitions, mainly related to environment indicators. We therefore recommend that MOL continues to work with local colleagues across the business, and refine its reporting guidance, to improve the understanding of the system and reporting requirements.
NOTES ON SUSTAINABILITY PERFORMANCE

While performing our procedures, we noticed that, in some cases, the descriptions of injuries are not clear enough to deter-mine their category. As a result, we identified a number of items to be reclassified either due to incorrect injury type or incor-rect categorization of work-relatedness. Although this did not affect the TRIR indicator in a material level, we recommend MOL to use clear descriptions.
Szabó Gergely Ernst & Young Kft. Budapest, 6 April 2018
EUROPEAN WORKS COUNCIL REVIEW
In 2018 the European Works Council (EWC) of MOL Group was asked once again to review the “Notes to Sustainability Perfor-mance” Chapter of the company’s 2017 Annual Report and the sustainability information presented on the corporate website. The EWC performed the review in three separate stages:
The Council had the opportunity to comment on the structure and proposed content of the report in the initial phase of reporting, and main topics of interest were proposed by EWC members.
The EWC then reviewed the “Human Capital” and – as part of that – the “Employee relations” chapters during the prepara-tion process and commented on whether the content was complete and balanced. Their recommendations were also incorpo-rated into these chapters.
At the final stage of the review, the EWC was provided with the full text of the report and a roundtable was organized at which EWC members discussed the report with corporate HR and SD managers.
Based on the above events, the EWC formed the following opinion:
According to the members of the EWC, the disclosed information is complete and covers all material topics which are rele-vant to a group-level report.
The EWC agreed with the content of the report which concerns the Works Council. According to the EWC, the published information is accurate and the statements disclosed are valid.
249

SUPPLEMENTARY DATA
SUPPLEMENTARY DATA

HISTORICAL SUMMARY OF FINANCIAL INFORMATION (IFRS)
* Calculated with yearly average HUF/USD: 223.7 ** Each month in 2014, 2015, 2016 and 2017 is translated on its actual monthly average HUF/USD NBH rate *** Year-end HUF/USD: 2013 215.7 2014 259.1 2015 286.6 2016 293.7 2017 258.8
CONSOLIDATED INCOME STATEMENTS FOR THE YEARS ENDED 31 DECEMBER
2013(HUF mn)
2013 (USD mn*)
2014 (HUF mn)
2014 (USD mn**)
2015 restated
(HUF mn)
2015 restated
(USD mn**)2016
(HUF mn)2016
(USD mn**)2017
(HUF mn)2017
(USD mn**)
Net revenue and other operating income 5,476,113 24,480 4,893,205 21,082 4,177,650 14,951 3,578,321 12,714 4,155,863 15,207
Total operating expenses 5,494,741 24,563 4,853,125 20,859 4,394,881 15,689 3,270,416 11,615 3,801,496 13,931
Profit from operations (18,628) (83) 40,080 223 (217,231) (738) 307,905 1,099 354,367 1,278
Profit for the year attributable to equity holders of the parent
21,442 96 4,078 47 (260,999) (903) 263,497 941 306,952 1,112
CONSOLIDATED BALANCE SHEETS AS AT 31 DECEMBER
2013 (HUF mn)
2013 (USD mn***)
2014 restated
(HUF mn)
2014 restated
(USD mn***)
2015 restated
(HUF mn)
2015 restated
(USD mn***)
2016 (HUF mn)
2016 (USD mn***)
2017 (HUF mn)
2017 (USD mn***)
Non-current assets 2,802,642 12,993 3,242,487 12,513 2,858,226 9,972 2,867,180 9,763 2,891,579 11,172
Current assets 1,838,246 8,522 1,399,535 5,401 1,056,657 3,686 1,236,606 4,210 1,340,121 5,178
Total assets 4,640,888 21,515 4,642,022 17,914 3,914,883 13,658 4,103,786 13,973 4,231,700 16,350
Equity attributable to equity holders of the parent 1,687,739 7,824 1,749,745 6,752 1,452,219 5,067 1,492,072 5,081 1,740,954 6,727
Minority interest 473,517 2,195 445,993 1,721 364,349 1,271 309,554 1,053 314,817 1,216
Non-current liabilities 1,078,925 5,002 922,396 3,560 971,404 3,389 918,681 3,128 1,006,147 3,887
Current liabilities 1,400,707 6,494 1,523,888 5,881 1,126,911 3,931 1,383,479 4,711 1,169,782 4,520
Total equity and liabilities 4,640,888 21,515 4,642,022 17,914 3,914,883 13,658 4,103,786 13,973 4,231,700 16,350
CONSOLIDATED STETEMENTS OF CASH FLOWS FOR THE YEARS ENDED 31 DECEMBER
2013(HUF mn)
2013(USD mn*)
2014 restated
(HUF mn)
2014 restated
(USD mn**)
2015 restated
(HUF mn)
2015 restated
(USD mn**)2016
(HUF mn)2016
(USD mn**)2017
(HUF mn)2017
(USD mn**)
Net cash provided by operating activities 614,685 2,748 434,528 1,863 586,803 2,088 519,385 1,843 559,696 2,070
Net cash provided by / (used in) investing activities (124,994) (559) (558,459) (2,400) (213,253) (781) (306,968) (1,086) (255,220) (947)
Net cash provided by / (used in) financing activities (239,251) (1,070) (257,036) (1,146) (444,688) (1,565) (125,881) (439) (320,179) (1,133)
(Decrease)/increase in cash and cash equivalents 250,440 1,120 (380,967) (1,572) (71,214) (259) 85,090 312 (20,735) (29)
SUPPLEMENTARY DATA

CONSOLIDATED INCOME STATEMENTS FOR THE YEARS ENDED 31 DECEMBER
2013(HUF mn)
2013 (USD mn*)
2014 (HUF mn)
2014 (USD mn**)
2015 restated
(HUF mn)
2015 restated
(USD mn**)2016
(HUF mn)2016
(USD mn**)2017
(HUF mn)2017
(USD mn**)
Net revenue and other operating income 5,476,113 24,480 4,893,205 21,082 4,177,650 14,951 3,578,321 12,714 4,155,863 15,207
Total operating expenses 5,494,741 24,563 4,853,125 20,859 4,394,881 15,689 3,270,416 11,615 3,801,496 13,931
Profit from operations (18,628) (83) 40,080 223 (217,231) (738) 307,905 1,099 354,367 1,278
Profit for the year attributable to equity holders of the parent
21,442 96 4,078 47 (260,999) (903) 263,497 941 306,952 1,112
CONSOLIDATED BALANCE SHEETS AS AT 31 DECEMBER
2013 (HUF mn)
2013 (USD mn***)
2014 restated
(HUF mn)
2014 restated
(USD mn***)
2015 restated
(HUF mn)
2015 restated
(USD mn***)
2016 (HUF mn)
2016 (USD mn***)
2017 (HUF mn)
2017 (USD mn***)
Non-current assets 2,802,642 12,993 3,242,487 12,513 2,858,226 9,972 2,867,180 9,763 2,891,579 11,172
Current assets 1,838,246 8,522 1,399,535 5,401 1,056,657 3,686 1,236,606 4,210 1,340,121 5,178
Total assets 4,640,888 21,515 4,642,022 17,914 3,914,883 13,658 4,103,786 13,973 4,231,700 16,350
Equity attributable to equity holders of the parent 1,687,739 7,824 1,749,745 6,752 1,452,219 5,067 1,492,072 5,081 1,740,954 6,727
Minority interest 473,517 2,195 445,993 1,721 364,349 1,271 309,554 1,053 314,817 1,216
Non-current liabilities 1,078,925 5,002 922,396 3,560 971,404 3,389 918,681 3,128 1,006,147 3,887
Current liabilities 1,400,707 6,494 1,523,888 5,881 1,126,911 3,931 1,383,479 4,711 1,169,782 4,520
Total equity and liabilities 4,640,888 21,515 4,642,022 17,914 3,914,883 13,658 4,103,786 13,973 4,231,700 16,350
CONSOLIDATED STETEMENTS OF CASH FLOWS FOR THE YEARS ENDED 31 DECEMBER
2013(HUF mn)
2013(USD mn*)
2014 restated
(HUF mn)
2014 restated
(USD mn**)
2015 restated
(HUF mn)
2015 restated
(USD mn**)2016
(HUF mn)2016
(USD mn**)2017
(HUF mn)2017
(USD mn**)
Net cash provided by operating activities 614,685 2,748 434,528 1,863 586,803 2,088 519,385 1,843 559,696 2,070
Net cash provided by / (used in) investing activities (124,994) (559) (558,459) (2,400) (213,253) (781) (306,968) (1,086) (255,220) (947)
Net cash provided by / (used in) financing activities (239,251) (1,070) (257,036) (1,146) (444,688) (1,565) (125,881) (439) (320,179) (1,133)
(Decrease)/increase in cash and cash equivalents 250,440 1,120 (380,967) (1,572) (71,214) (259) 85,090 312 (20,735) (29)
253

UPSTREAMThe tables presented below provide supplementary information for the Group upstream activities. These disclosures are not audited.
GROSS RESERVES (ACCORDING TO SPE RULES)*
Proved reserves (1P)Natural gas Crude oil and condensate Combined
MmboeMcm MMboe kt Mmbbl
Hungary
Hungary as of December 31, 2013 8,306.7 43.5 3,930.3 29.7 73.2
Hungary as of December 31, 2014 8,268.5 43.3 3,781.9 28.6 71.9
Hungary as of December 31, 2015 7,688.6 41.8 3,268.6 25.1 67.0
Hungary as of December 31, 2016 (restated) 6,600.6 36.4 2,635.7 19.9 56.3
Production (1,660.6) (9.7) (795.2) (6.0) (15.7)
Extension and discoveries 0.6 0.0 13.5 0.1 0.1
Revision of previous estimates 623.7 2.8 823.3 6.2 9.1
Purchase/sale of minerals in place 144.0 1.0 18.9 0.1 1.1
Hungary as of December 31, 2017 5,708.2 30.5 2,696.3 20.4 50.9
Croatia
Croatia as of December 31, 2013 12,774.9 83.2 10,163.1 75.7 158.9
Croatia as of December 31, 2014 11,841.7 77.2 9,721.9 72.3 149.5
Croatia as of December 31, 2015 10,233.5 67.5 9,199.9 68.5 136.0
Croatia as of December 31, 2016 (restated) 9,022.8 60.0 8,470.0 63.0 123.0
Production (1,155.8) (7.3) (683.4) (5.1) (12.4)
Extension and discoveries 0.0 0.0 0.0 0.0 0.0
Revision of previous estimates 366.8 1.2 180.5 1.3 2.5
Purchase/sale of minerals in place 0.0 0.0 0.0 0.0 0.0
Croatia as of December 31, 2017 8,233.8 53.9 7,967.0 59.2 113.1
U.K. (North Sea)
U.K. (North Sea) as of December 31, 2014 113.3 0.7 1,920.7 15.5 16.2
U.K. (North Sea) as of December 31, 2015 82.4 0.5 1,951.2 14.1 14.6
U.K. (North Sea) as of December 31, 2016 (restated) 11.2 0.1 1,670.8 12.0 12.1
Production (36.2) (0.2) (276.7) (2.0) (2.2)
Extension and discoveries 0.0 0.0 0.0 0.0 0.0
Revision of previous estimates 38.7 0.2 61.3 0.4 0.6
Purchase/sale of minerals in place 0.0 0.0 0.0 0.0 0.0
U.K. (North Sea) as of December 31, 2017 13.7 0.1 1,455.4 10.5 10.6
KRI**
KRI as of December 31, 2013 0.0 0.0 0.0 0.0 0.0
KRI as of December 31, 2014 0.0 0.0 1,791.4 12.0 12.0
KRI as of December 31, 2015 0.0 0.0 1,617.8 10.8 10.8
KRI as of December 31, 2016 (restated) 0.0 0.0 1,421.4 9.5 9.5
Production 0.0 0.0 (199.1) (1.3) (1.3)
Extension and discoveries 0.0 0.0 0.0 0.0 0.0
Revision of previous estimates 0.0 0.0 0.0 0.0 0.0
Purchase/sale of minerals in place 0.0 0.0 0.0 0.0 0.0
KRI as of December 31, 2017 0.0 0.0 1,222.3 8.2 8.2
SUPPLEMENTARY DATA

Proved reserves (1P)Natural gas Crude oil and condensate Combined
MmboeMcm MMboe kt Mmbbl
Russia
Russia as of December 31, 2013 0.0 0.0 11,390.4 80.0 80.0
Russia as of December 31, 2014 0.0 0.0 6,466.5 45.5 45.5
Russia as of December 31, 2015 0.0 0.0 6,153.1 43.2 43.2
Russia as of December 31, 2016 (restated) 0.0 0.0 5,463.0 38.2 38.2
Production 0.0 0.0 (326.5) (2.3) (2.3)
Extension and discoveries 0.0 0.0 0.0 0.0 0.0
Revision of previous estimates 0.0 0.0 0.0 0.0 0.0
Purchase/sale of minerals in place 0.0 0.0 0.0 0.0 0.0
Russia as of December 31, 2017 0.0 0.0 5,136.5 36.0 36.0
Pakistan
Pakistan as of December 31, 2013 647.9 4.4 281.0 2.1 6.5
Pakistan as of December 31, 2014 390.1 2.6 180.7 1.4 4.0
Pakistan as of December 31, 2015 292.7 2.0 96.9 0.7 2.8
Pakistan as of December 31, 2016 (restated) 423.1 3.1 146.5 1.1 4.2
Production (295.4) (2.1) (136.4) (1.0) (3.1)
Extension and discoveries 154.9 1.1 21.2 0.2 1.2
Revision of previous estimates 239.8 1.7 85.9 0.6 2.4
Purchase/sale of minerals in place 0.0 0.0 0.0 0.0 0.0
Pakistan as of December 31, 2017 522.3 3.7 117.1 0.9 4.6
Kazakhstan
Kazakhstan as of December 31, 2013 2,301.5 13.5 1,232.6 9.8 23.4
Kazakhstan as of December 31, 2014 4,962.0 29.2 1,973.1 15.7 44.9
Kazakhstan as of December 31, 2015 4,962.0 29.2 1,973.1 15.7 44.9
Kazakhstan as of December 31, 2016 (restated) 4,909.0 28.8 1,833.0 16.1 44.9
Production 0.0 0.0 0.0 0.0 0.0
Extension and discoveries 0.0 0.0 0.0 0.0 0.0
Revision of previous estimates (4,457.4) (26.1) (1,474.4) (13.0) (39.1)
Purchase/sale of minerals in place 0.0 0.0 0.0 0.0 0.0
Kazakhstan as of December 31, 2017 451.6 2.7 358.6 3.2 5.8
Syria, Egypt and Angola
Syria, Egypt and Angola as of December 31, 2013 2,750.1 16.2 1,290.8 10.6 26.8
Syria, Egypt and Angola as of December 31, 2014 2,750.1 16.2 1,123.3 9.3 25.5
Syria, Egypt and Angola as of December 31, 2015 2,750.1 16.2 1,053.0 8.8 25.0
Syria, Egypt and Angola as of December 31, 2016 (restated)
2,750.1 16.2 1,089.9 9.1 25.3
Production 0.0 0.0 (114.8) (0.9) (0.9)
Extension and discoveries 0.0 0.0 0.0 0.0 0.0
Revision of previous estimates (2,750.1) (16.2) (604.2) (5.5) (21.6)
Purchase/sale of minerals in place 0.0 0.0 0.0 0.0 0.0
Syria, Egypt and Angola as of December 31, 2017 0.0 0.0 370.9 2.8 2.8
255

Proved reserves (1P)Natural gas Crude oil and condensate Combined
MmboeMcm MMboe kt Mmbbl
TOTAL MOL Group
TOTAL MOL Group as of December 31, 2013 26,781.0 160.8 28,288.2 207.9 368.7
TOTAL MOL Group as of December 31, 2014 28,325.5 169.2 26,959.6 200.4 369.5
TOTAL MOL Group as of December 31, 2015 26,009.2 157.2 25,313.7 187.0 344.3
TOTAL MOL Group as of December 31, 2016 (restated) 23,716.7 144.5 22,730.3 169.0 313.5
Production (3,148.0) (19.3) (2,532.2) (18.6) (37.9)
Extension and discoveries 155.4 1.1 34.7 0.3 1.3
Revision of previous estimates (5,938.5) (36.3) (927.6) (9.8) (46.2)
Purchase/sale of minerals in place 144.0 1.0 18.9 0.1 1.1
TOTAL MOL Group as of December 31, 2017 14,929.6 90.9 19,324.1 141.0 231.9
INA
INA as of December 31, 2013 15,524.9 99.4 11,453.9 86.2 185.6
INA as of December 31, 2014 14,591.7 93.4 10,845.2 81.7 175.1
INA as of December 31, 2015 12,983.6 83.7 10,252.9 77.3 161.0
INA as of December 31, 2016 (restated) 11,772.8 76.1 9,559.8 72.1 148.3
Production (1,155.8) (7.3) (798.2) (6.0) (13.2)
Extension and discoveries 0.0 0.0 0.0 0.0 0.0
Revision of previous estimates (2,383.3) (14.9) (423.7) (4.2) (19.1)
Purchase/sale of minerals in place 0.0 0.0 0.0 0.0 0.0
INA as of December 31, 2017 8,233.8 53.9 8,337.9 62.0 115.9
* The reserves include information about 100% of MMBF Ltd's reserves. These disclosures do not contain information about MOL Group’s share in equity consolidated Pearl project.
** KRI - Kurdistan Region of Iraq
GROSS RESERVES (ACCORDING TO SPE RULES)*
Proved + probable reserves (2P)Natural gas Crude oil and condensate Combined
MmboeMcm MMboe kt Mmbbl
Hungary
Hungary as of December 31, 2013 16,804.4 82.2 7,696.1 58.1 140.3
Hungary as of December 31, 2014 14,261.4 75.2 6,388.1 48.3 123.5
Hungary as of December 31, 2015 13,546.2 74.2 5,554.5 42.8 116.9
Hungary as of December 31, 2016 (restated) 12,393.4 68.6 4,858.0 36.7 105.2
Production (1,660.6) (9.7) (794.2) (6.0) (15.7)
Extension and discoveries 2.7 0.0 100.5 0.8 0.8
Revision of previous estimates 650.7 (1.2) 150.4 1.1 (0.1)
Purchase/sale of minerals in place 186.6 1.3 24.8 0.2 1.4
Hungary as of December 31, 2017 11,572.8 58.9 4,339.5 32.8 91.7
Croatia
Croatia as of December 31, 2013 17,666.1 115.6 12,447.8 92.5 208.1
Croatia as of December 31, 2014 15,258.1 99.5 12,846.5 95.4 194.9
Croatia as of December 31, 2015 12,264.7 81.2 12,163.7 90.3 171.5
Croatia as of December 31, 2016 (restated) 10,888.1 72.8 11,244.3 83.5 156.3
Production (1,155.8) (7.3) (683.4) (5.1) (12.4)
Extension and discoveries 0.0 0.0 0.0 0.0 0.0
Revision of previous estimates 438.7 1.7 (38.4) (0.3) 1.4
Purchase/sale of minerals in place 0.0 0.0 0.0 0.0 0.0
Croatia as of December 31, 2017 10,171.1 67.3 10,522.4 78.1 145.3
SUPPLEMENTARY DATA

Proved + probable reserves (2P)Natural gas Crude oil and condensate Combined
MmboeMcm MMboe kt Mmbbl
U.K. (North Sea)
U.K. (North Sea) as of December 31, 2014 188.9 1.1 3,602.5 29.3 30.4
U.K. (North Sea) as of December 31, 2015 179.6 1.1 3,409.9 24.6 25.7
U.K. (North Sea) as of December 31, 2016 (restat-ed)
50.3 0.3 3,161.4 22.8 23.2
Production (36.8) (0.2) (289.1) (2.1) (2.3)
Extension and discoveries 0.0 0.0 0.0 0.0 0.0
Revision of previous estimates 29.6 0.2 168.8 1.2 1.3
Purchase/sale of minerals in place 0.0 0.0 0.0 0.0 0.0
U.K. (North Sea) as of December 31, 2017 43.2 0.3 3,041.0 21.9 22.2
KRI**
KRI as of December 31, 2013 0.0 0.0 0.0 0.0 0.0
KRI as of December 31, 2014 0.0 0.0 2,298.6 15.4 15.4
KRI as of December 31, 2015 0.0 0.0 2,125.0 14.2 14.2
KRI as of December 31, 2016 (restated) 0.0 0.0 1,939.6 13.0 13.0
Production 0.0 0.0 (199.1) (1.3) (1.3)
Extension and discoveries 0.0 0.0 0.0 0.0 0.0
Revision of previous estimates 0.0 0.0 35.6 0.2 0.2
Purchase/sale of minerals in place 0.0 0.0 0.0 0.0 0.0
KRI as of December 31, 2017 0.0 0.0 1,776.1 11.9 11.9
Russia
Russia as of December 31, 2013 0.0 0.0 18,398.9 129.9 129.9
Russia as of December 31, 2014 0.0 0.0 10,371.6 74.5 74.5
Russia as of December 31, 2015 0.0 0.0 10,006.4 71.9 71.9
Russia as of December 31, 2016 (restated) 0.0 0.0 7,114.3 49.8 49.8
Production 0.0 0.0 (326.5) (2.3) (2.3)
Extension and discoveries 0.0 0.0 0.0 0.0 0.0
Revision of previous estimates 0.0 0.0 (42.5) (0.3) (0.3)
Purchase/sale of minerals in place 0.0 0.0 0.0 0.0 0.0
Russia as of December 31, 2017 0.0 0.0 6,745.3 47.2 47.2
Pakistan
Pakistan as of December 31, 2013 1,909.9 13.1 613.3 4.6 17.7
Pakistan as of December 31, 2014 1,455.7 10.0 451.5 3.4 13.4
Pakistan as of December 31, 2015 1,222.2 8.4 365.3 2.7 11.1
Pakistan as of December 31, 2016 (restated) 989.8 7.1 354.6 2.7 9.8
Production (295.4) (2.1) (136.4) (1.0) (3.1)
Extension and discoveries 174.1 1.2 22.1 0.2 1.4
Revision of previous estimates 117.0 0.9 67.4 0.5 1.4
Purchase/sale of minerals in place 0.0 0.0 0.0 0.0 0.0
Pakistan as of December 31, 2017 985.5 7.1 307.7 2.3 9.4
257

Proved + probable reserves (2P)Natural gas Crude oil and condensate Combined
MmboeMcm MMboe kt Mmbbl
Kazakhstan
Kazakhstan as of December 31, 2013 3,667.4 21.6 1,900.8 15.1 36.7
Kazakhstan as of December 31, 2014 6,670.6 39.3 2,651.7 21.1 60.4
Kazakhstan as of December 31, 2015 6,670.6 39.3 2,651.7 21.1 60.4
Kazakhstan as of December 31, 2016 (restated) 5,464.9 39.8 2,585.1 20.6 60.4
Production 0.0 0.0 0.0 0.0 0.0
Extension and discoveries 0.0 0.0 0.0 0.0 0.0
Revision of previous estimates (3,353.6) (27.4) (1,332.7) (9.6) (36.9)
Purchase/sale of minerals in place 0.0 0.0 0.0 0.0 0.0
Kazakhstan as of December 31, 2017 2,111.3 12.4 1,252.4 11.0 23.5
Syria, Egypt and Angola
Syria, Egypt and Angola as of December 31, 2013 4,357.9 25.7 2,118.3 17.3 43.0
Syria, Egypt and Angola as of December 31, 2014 4,357.9 25.7 2,042.6 16.8 42.5
Syria, Egypt and Angola as of December 31, 2015 4,357.9 25.7 1,976.0 16.3 42.0
Syria, Egypt and Angola as of December 31, 2016 (restated)
4,357.9 25.7 1,933.0 16.0 41.6
Production 0.0 0.0 (114.8) (0.9) (0.9)
Extension and discoveries 0.0 0.0 0.0 0.0 0.0
Revision of previous estimates (4,357.9) (25.7) (1,210.7) (10.5) (36.2)
Purchase/sale of minerals in place 0.0 0.0 0.0 0.0 0.0
Syria, Egypt and Angola as of December 31, 2017 0.0 0.0 607.5 4.6 4.6
TOTAL MOL Group
TOTAL MOL Group as of December 31, 2013 44,405.7 258.1 43,175.1 317.6 575.7
TOTAL MOL Group as of December 31, 2014 42,192.6 250.7 40,653.1 304.3 554.9
TOTAL MOL Group as of December 31, 2015 38,241.2 229.7 38,252.6 284.0 513.7
TOTAL MOL Group as of December 31, 2016 (restat-ed)
34,144.4 214.2 33,190.2 245.0 459.4
Production (3,148.5) (19.3) (2,543.7) (18.7) (38.0)
Extension and discoveries 176.8 1.2 122.7 0.9 2.1
Revision of previous estimates (6,475.5) (51.5) (2,202.1) (17.7) (69.2)
Purchase/sale of minerals in place 186.6 1.3 24.8 0.2 1.4
TOTAL MOL Group as of December 31, 2017 24,883.9 145.9 28,591.8 209.8 355.7
INA
INA as of December 31, 2013 22,024.0 141.2 14,566.0 109.8 251.1
INA as of December 31, 2014 19,616.0 125.1 14,889.2 112.2 237.4
INA as of December 31, 2015 16,622.6 106.9 14,139.7 106.6 213.5
INA as of December 31, 2016 (restated) 15,246.0 98.5 13,177.3 99.5 197.9
Production (1,155.8) (7.3) (798.2) (6.0) (13.2)
Extension and discoveries 0.0 0.0 0.0 0.0 0.0
Revision of previous estimates (3,919.2) (23.9) (1,249.1) (10.9) (34.8)
Purchase/sale of minerals in place 0.0 0.0 0.0 0.0 0.0
INA as of December 31, 2017 10,171.1 67.3 11,129.9 82.6 149.9
* The reserves include information about 100% of MMBF Ltd's reserves. These disclosures do not contain information about MOL Group’s share in equity consolidated Pearl project.
** KRI - Kurdistan Region of Iraq
SUPPLEMENTARY DATA

HYDROCARBON PRODUCTION
Daily Hydrocarbon production by countries (thousand boepd) 2013
2014 restated
2015 restated
2016 restated 2017
Hungary 43.2 41.6 41.0 44.4 42.8
Croatia 37.2 35.2 37.6 36.3 35.2
U.K. (North Sea) – 1.3 4.9 8.3 6.2
Russia 7.6 2.9 1.9 1.3 –
Pakistan 5.8 6.6 6.8 7.5 8.5
Kurdistan Region of Iraq 0.2 1.9 3.6 3.6 3.7
Syria – – – – –
Egypt 1.9 2.0 2.1 2.1 1.5
Angola 1.1 1.2 1.2 1.1 0.8
Average hydrocarbon production of fully consolidated companies 97.0 92.7 99.1 104.5 98.8
Russia (Baitex) 6.6 4.8 4.8 5.8 6.2
Kurdistan Region of Iraq (Pearl Petroleum)* – – – 2.3 2.4
Average hydrocarbon production of joint ventures and associated companies
6.6 4.8 4.8 8.1 8.6
Group level average hydrocarbon production 103.7 97.5 103.9 112.6 107.4
* Production from Pearl Petroleum reported from 2016
Daily Hydrocarbon production by products (thousand boepd) 2013
2014 restated
2015 restated
2016 restated 2017
crude oil 31.6 29.7 35.2 40.9 37.6
natural gas 57.8 54.9 56.9 56.0 54.2
condensate 7.6 8.1 7.1 7.5 7.1
Average hydrocarbon production of fully consolidated companies 97.0 92.7 99.1 104.5 98.8
crude oil 6.6 4.8 4.8 5.8 6.2
natural gas – – – – –
condensate – – – 2.3 2.4
Average hydrocarbon production of joint ventures and associ-ated companies
6.6 4.8 4.8 8.1 8.6
Group level average hydrocarbon production 103.7 97.5 103.9 112.6 107.4
COSTS
Direct production costs (USD/boe) 20132014
restated2015
restated2016
restated 2017
Average unit OPEX of fully consolidated comapanies – 8.0 7.6 6.3 6.7
Average unit OPEX of joint ventures and associated companies – 5.5 2.4 1.3 1.7
Group level average unit OPEX (USD/boe) 8.3 7.8 7.3 5.7 6.1
259

COSTS INCURRED (HUF MN)*
Consolidated companies Associated companies
TotalCEE** WE*** CIS**** Other***** Total
For year ended 31 December 2016
Acquisition of properties 0 0 0 0 0 – 0
Proved 0 0 0 0 0 – 0
Unproved 0 0 0 0 0 – 0
Exploration 7,113 5,438 120 10,106 22,777 – 22,777
G&G 229 2,903 3 1,117 4,251 – 4,251
Drilling 5,523 1,273 0 7,065 13,861 – 13,861
Rental fee, other 1,362 1,262 117 1,924 4,665 – 4,665
Development 42,893 46,083 234 6,986 96,195 – 96,195
Total costs incurred 50,006 51,521 353 17,092 118,972 – 118,972
For year ended 31 December 2017
Acquisition of properties 0 0 0 0 0 – 0
Proved 0 0 0 0 0 – 0
Unproved 0 0 0 0 0 – 0
Exploration 10,942 4,539 58 2,612 18,152 – 18,152
G&G 1,561 2,950 0 182 4,693 – 4,693
Drilling 6,967 722 0 1,227 8,916 – 8,916
Rental fee, other 2,414 867 58 1,203 4,542 – 4,542
Development 37,381 24,763 0 2,550 64,694 – 64,694
Total costs incurred 48,323 29,302 58 5,162 82,846 – 82,846
* Costs incurred by Group companies during the year in oil and gas property acquisition, exploration and development activities, whether capitalised or expensed directly, are shown in the table. These disclosures do not contain information about MOL Group’s share in equity consolidated Pearl project.
** CEE: Hungary, Croatia, Romania*** WE: United Kingdom, Norway**** CIS: Russia, Kazakhstan***** Other: Kurdistan Region of Iraq, Syria, Oman, Pakistan, Egypt, Angola
EARNINGS (HUF MN)*
Consolidated companies Associated companies
TotalCEE** WE*** CIS**** Other***** Total
For year ended 31 December 2016
Sales 221,991 30,276 1,540 40,806 294,613 – 294,613
third parties 1,365 30,276 1,540 40,806 73,987 – 73,987
intra-group 220,626 0 0 0 220,626 – 220,626
Production costs (43,097) (17,196) (1,801) (11,127) (73,220) – (73,220)
Exploration expense (548) (2,903) (3) (1,117) (4,570) – (4,570)
DD&A (110,710) (15,530) (2,251) (18,673) (147,164) – (147,164)
Other income/(costs) (11,551) 27,459 (5,387) (28,874) (18,352) – (18,352)
Earnings before taxation 56,087 22,106 (7,902) (18,985) 51,306 – 51,306
Taxation (42,551) 4,013 (6) (2,199) (40,743) – (40,743)
Earnings from operation 13,536 26,119 (7,907) (21,184) 10,563 – 10,563
SUPPLEMENTARY DATA

Consolidated companies Associated companies
TotalCEE** WE*** CIS**** Other***** Total
For year ended 31 December 2017
Sales 279,647 30,838 0 46,300 356,785 – 356,785
third parties 33,699 30,838 0 46,300 110,838 – 110,838
intra-group 245,948 0 0 0 245,948 – 245,948
Production costs (47,385) (16,628) 0 (8,930) (72,943) – (72,943)
Exploration expense (1,371) (3,806) 0 (679) (5,856) – (5,856)
DD&A (115,210) (8,663) (19) (15,552) (139,445) – (139,445)
Other income/(costs) (42,200) (8,374) (818) 1,436 (49,956) – (49,956)
Earnings before taxation 73,481 (6,633) (838) 22,575 88,585 – 88,585
Taxation (16,514) 3,547 (13) (4,436) (17,416) – (17,416)
Earnings from operation 56,967 (3,086) (850) 18,138 71,169 – 71,169
* Earnings of Group companies from exploration and production activities excluding financing costs and related tax effects. Other income/cost does not include the administration cost inside MOL Plc and INA Plc. These disclosures do not contain information about MOL Group’s share in equity consoli-dated Pearl project.
** CEE: Hungary, Croatia, Romania*** WE: United Kingdom, Norway**** CIS: Russia, Kazakhstan***** Other: Kurdistan Region of Iraq, Syria, Oman, Pakistan, Egypt, Angola
EXPLORATION AND DEVELOPMENT WELLS
COUNTRY CEE* WE** CIS*** Other**** Total
For year ended 31 December 2016
Wells tested 6 11 66 8 91
o/w exploration/appraisal 3 1 1 6 11
oil and gas producer 0 0 0 3 3
oil producer 1 0 0 0 1
natural gas producer 1 0 0 0 1
dry/non-commercial 1 1 0 3 5
suspended 0 0 1 0 1
o/w development wells 3 10 65 2 80
oil producer 2 9 65 0 76
natural gas producer 1 0 0 2 3
dry/ non commercial 0 1 0 0 1
Injection 0 0 0 0 0
For year ended 31 December 2017
Wells tested 6 8 53 3 70
o/w exploration/appraisal 4 1 0 2 7
oil and gas producer 0 0 0 0 0
oil producer 1 0 0 1 2
natural gas producer 0 0 0 1 1
dry/non-commercial 3 1 0 0 4
suspended 0 0 0 0 0
o/w development wells 2 7 53 1 63
oil producer 2 4 53 0 59
natural gas producer 0 0 0 1 1
dry/ non commercial 0 0 0 0 0
Injection 0 3 0 0 3
* CEE: Hungary, Croatia** WE: United Kingdom, Norway*** CIS: Russia, Kazakhstan**** Other: Kurdistan Region of Iraq, Syria, Oman, Pakistan, Egypt, Angola
261

GROUP'S PROCESSING BY REFINERIES (KT)
2013 2014 2015 2016 2017
Duna Refinery 8,107 8,413 7,925 7,981 8,293
Bratislava Refinery 6,828 6,146 6,905 6,761 6,711
Mantova Refinery 2,445 ,337 1,176 1,082 1,025
INA refineries 3,587 3,159 3,543 3,851 4,048
Total 20,507 17,541 19,039 19,229 19,542
EXTERNAL REFINED PRODUCTS SALES (KT)
2013 2014 2015 2016 2017
LPG 606 476 492 521 508
Naphtha 46 0 14 67 40
Motor gasoline 3,987 3,614 3,826 3,816 3,820
Diesel 9,363 9,133 9,402 9,724 10,044
Heating oils 780 721 702 645 622
Kerosene 419 384 396 438 472
Fuel oil 677 554 470 508 581
Bitumen 1,026 629 553 541 468
Other products 1,188 1,216 1,380 1,552 1,484
Total refined products 18,092 16,725 17,234 17,811 18,040
Petrochemical feedstock transfer 1,994 1,991 2,285 1,994 2,222
DOWNSTREAM
REFINING & MARKETING
SUPPLEMENTARY DATA

CRUDE OIL PRODUCT SALES (KT)*
2013 2014 2015 2016 2017
Sales in Hungary 3,908 3,937 3,972 4,036 4,160
Gas and heating oils 2,393 2,417 2,381 2,448 2,533
Motor gasolines 954 927 921 958 1 004
Fuel oils 13 9 4 0 3
Bitumen 91 126 141 115 102
Lubricants (without base oil) 15 16 18 27 18
Other products 442 442 507 488 500
Sales in Slovakia 1,501 1,515 1,586 1,695 1,624
Gas and heating oils 976 1,016 1,068 1,096 1,111
Motor gasolines 368 356 365 374 365
Lubricants (without base oil) 8 9 10 10 9
Bitumen 15 30 28 20 27
Other products 134 104 115 195 112
Sales in Croatia 1,796 1,666 1,687 1,808 1,849
Gas and heating oils 1,133 1,090 1,110 1,135 1,151
Gasolines 470 405 397 391 382
Lubricants (without base oil) 10 9 0 0 0
Bitumen 80 65 58 59 53
Other products 103 97 122 223 263
Export sales 10,294 9,133 9,528 9,750 9,898
Gas and heating oils 5,641 5,332 5,557 5,688 5,872
Gasolines 2,194 1,926 2,143 2,092 2,069
Lubricants (without base oil) 27 28 29 34 39
Bitumen 840 408 328 347 286
Other products 1,592 1,439 1,471 1,589 1,632
Total crude oil product sales 17,499 16,251 16,773 17,289 17,531
* Without LPG sales
GROUP'S PROCESSING BY REFINERIES FEEDSTOCKS IN 2017 (KT)
Duna Refinery
Bratislava Refinery INA refineries
MOL Group total
Own produced crude oil 625 0 587 1,212
Imported crude oil 5,884 5,557 2,803 14,245
Condensates 99 2 80 181
Other feedstock 1,685 1,152 578 3,905
Total refinery throughput 8,293 6,711 4,048 19,542
Purchased and sold products 1,159 66 480 1,673
263

GROUP'S REFINERY PRODUCTION (YIELD) BY PRODUCTS IN 2017 (KT)
Duna Refinery
Bratislava Refinery INA refineries
MOL Group total
LPG 92 207 242 532
Naphtha 940 507 52 1,499
Motor gasoline 1,048 1,463 1,006 3,673
Diesel and heating oil 3,547 3,017 1,494 8,909
Kerosene 235 75 133 443
Fuel oil 1 323 509 770
Bitumen 437 0 0 444
Other products 1,275 515 154 1,492
Own consumption + losses 717 605 458 1,781
PETROCHEMICAL
PETROCHEMICAL PRODUCTION (KT)
2013 2014 2015 2016 2017
Ethylene 684 656 737 678 767
Propylene 348 327 378 347 393
Other products 623 555 615 629 759
Total olefin 1,655 1,538 1,730 1,654 1,919
Butadiene 16 52 82
Raffinate 23 80 126
Total BDEU production 39 132 207
LDPE 158 151 177 193 220
HDPE 351 349 390 323 386
PP 472 443 534 500 530
Total polymers 981 943 1,101 1,016 1,136
TOTAL petrochemical production 2,636 2,480 2,870 2,802 3,262
PETROCHEMICAL SALES BY REGION (KT)
2013 2014 2015 2016 2017
Hungary 444 390 428 403 429
Slovakia 60 75 109 106 103
Other markets 798 661 761 735 881
Total petrochemical product sales 1,302 1,126 1,298 1,245 1,413
SUPPLEMENTARY DATA

CONSUMER SERVICESRETAIL SALES
Retail sales of refined products (kt)* 2013 2014 2015 2016 2017
Motor gasoline 1,105 1,073 1,143 1,237 1,263
Gas and heating oils 2,289 2,347 2,615 2,909 3,133
Other products 86 93 98 100 103
Total refined product retail sales 3,480 3,513 3,856 4,246 4,499
* Volume sold on company owned service stations
GASOLINE AND DIESEL SALES BY COUNTRIES (KT)
2013 2014 2015 2016 2016
Hungary 776 846 917 1 043 1 183
Slovakia 413 444 526 610 655
Croatia 941 1,044 1,045 1,028 1,037
Romania 498 492 571 643 693
Czech Republic 134 145 350 455 472
Other 632 449 349 367 356
Total 3,394 3,420 3,758 4,146 4,396
SERVICE STATIONS
Number of MOL Group service stations * 2013 2014 2015 2016 2016
Hungary 366 364 364 479 465
Croatia 435 434 431 430 428
Italy* 138 116 107 83 0
Slovakia 212 214 253 252 253
Romania 147 159 202 206 213
Bosnia and Herzegovina 104 102 100 101 103
Austria* 0 0 0 0 0
Serbia 38 42 47 53 60
Czech Republic 149 192 316 306 306
Slovenia 38 40 40 56 52
Other 1 1 1 1 1
Total 1,628 1,664 1,861 1,967 1,881
* with restatement of Italy, and Austria due to methodology change
265
GLOSSARY OF OIL AND GAS TERMS
ALS: Artificial Lifting System
Average realised hydrocarbon priceTotal revenue realised on hydrocarbon sales per barrel
BEVs Battery Electric Vehicles
BiofuelsBiofuels means liquid or gaseous fuel for transport produced from biomass, where "biomass" means the biodegradable fraction of products, waste and residues from biological origin from agri-culture (including vegetal and animal substances), forestry and related industries including fisheries and aquaculture, as well as the biodegradable fraction of industrial and municipal waste.
Barrel (bbl)Anglo-Saxon unit of measurement applied in the oil industry, one ton crude oil is nearly equal with 7-7.5 barrel. (Conversion rate applied onto crude oil grades in Hungary is 7.55 bbl/ton). One cubic metre oil is equal to 6.29 barrel.
Boe (barrel of crude oil equivalent)Volume equivalent obtained after conversion of the heating value of gas to crude oil on the basis of its thermal quantity. In its practical application, 1 boe is, in general 6000 cubic feet (about 170 normal m3) of gas.
BoepdBarrel of oil equivalent per day
Brent type crude oilMix of North Sea crude oils whose quoted price is considered as a benchmark in the international crude oil market.
Brent-Ural SpreadDifference between Brent and Ural crude oil's international price. The price of Ural type crude oil is quoted in Rotterdam (FOB ROT) and Mediterranean (CIF MED) region.
Butadiene (1,3 - butadiene)1,3-Butadiene is a simple conjugated diene with the formula C4H6. Butadiene is produced as a by product of the steam cracking process used to produce ethylene and other olefins. Typically isolated from C4 fraction. Colourless gas, flammable, irritative, carcinogen. It is an important industrial chemical used as a monomer in the production of synthetic rubber.
CondensatesGeneral term for a group of liquid phase hydrocarbons in which light components dominate and which are extracted at the surface by natural gas separation.
CompanyMOL Hungarian Oil and Gas Public Limited Company
Crack SpreadDifference between product's quoted price and crude oil price. The crack spread figures change according to global oil market trends (like consumption seasonality, refinery supply, changes of stocks).
DownstreamRefining and Marketing, Retail and Petrochemicals
Dry WellAn investigated borehole which does not confirm the existence of a hydrocarbon site or is not able to profitably produce crude oil or natural gas.
Enhanced oil recovery (EOR) Processes/technologies that can be used to recover more oil rela-tive to the primary and secondary methods.
EVElectric Vehicle
EVCSElectric Vehicle Charging Stations
Field developmentProcess of implementing underground and aboveground facili-ties necessary for the recovery of hydrocarbon reserves.
FPSOFloating Production, Storage and Offloading
Gross productionTotal quantity of crude oil and natural gas from hydrocarbon fields prior to the deduction of royalties.
HDPEHigh density polyethylene
ICEInternal Combustion Engine
GLOSSARY

JVJoint venture
Liquified Propane Gas (LPG)Hydrocarbon gas compound mainly consisting of propane and buthane, liquefied under high pressure, which is sold in cylin-ders for household purposes. These days the motoric usage of LPG spreads. This fuel is the „autogas”.
LDPELow density polyethylene
MMbblMillion barrel
MMboeMillion barrel of crude oil equivalent
mboepdThousand barrel of crude oil equivalent per day
MCMMillion cubic metre
MonomersBasic compounds of polymers (plastics, rubbers), basic elements (links) of polymer chains in high-molecular-weight materials. Nowadays the most important monomers, the basic petrochem-icals are short-chained olefins (ethylene, propylene, butadiene) along with their simple derivatives, and the simplest aromatic compound: benzene. Primary sources of all these monomers are the olefin plants.
NCI (Nelson complexity index)The Nelson complexity index, developed by Wilbur Nelson in 1960, is a measure of the secondary conversion capacity of a petroleum refinery relative to the primary distillation capacity.
Net productionTotal crude oil and natural gas quantity from the hydrocarbon fields following the deduction of mining royalties.
OlefinThis is collective noun for open-chained hydrocarbons including unsaturated double carbon-carbon bond(s). The simplest repre-sentatives of these compounds, ethylene and propylene are basic petrochemicals. The most important asset in olefin produc-tion is the so-called steam cracker (olefin plant), which converts naphtha, chemical gasoil and other light hydrocarbons to key products as ethylene and propylene by cracking and dehydro-genation.
PolimerA complexity of repeating units of organic or inorganic macro-molecules
Polypropylene (PP)A thermoplastic produced by polymerisation of propylene. Has a significant - and increasing - share among commodity plastics. Parameters (such as pressure, temperature, applied additives and catalysts) of industrial processes aiming at PP production show significant differences, consequently a wide range of prod-ucts with different characteristics can be produced. Addition of ethylene into the polymerisation process as co-monomer leads to PP copolymers. PP can be used in a wide variety of application sit has good resistance to heat and low water absorption.
PPMPPM is a measure of the concentration of a substance in a liquid, used where low levels of concentration are significant. The ppm value is equivalent to the absolute fractional amount multiplied by one million. For example, 10 ppm equals 10 kilogram of a substance for a million kilogram (one kiloton) of a liquid.
Production Sharing Agreement (PSA)Agreement for sharing the production of an oil field or a gas field between the State and the Investors, having the production license for the field.
PropyleneThe second member of the alkene homologous series, empir-ical formula: C3H6. There is a single double bond between two carbon atoms.
Proved reserves (SPE 1P)Proved reserves are those quantities of petroleum claimed to have a reasonable certainty (normally at least 90% confidence) of being recoverable under existing economic and political condi-tions, with existing technology.
Proved + probable reserves (SPE 2P)It includes proved reserves + probable reserves (that are attrib-uted to known accumulations and claim 50% confidence level of recovery).
Putting into productionAccomplishment of surface and underground facilities neces-sary for the production of hydrocarbon reserves.
Refinery marginDifference between product's international quoted price and the actual crude oil price. Or: The unit profitability of a (theoretical or actual) refinery, which is determined by crude oil product, as well as unit refining costs.
Refinery complexityRefinery complexity demonstrates, what white product yield can be achieved from 1 barrel of crude oil. The more complex the refinery, the higher is the white product yield from the same quality crude oil ie. the less fuel oil it produces. One of the best measure for complexity is Nelson index, which calculates complexity from the existence of different refinery plants and from the ratio of their capacity to distillation capacity.
267

ReserveEstimated volume of crude oil, condensate, natural gas and other components that can commercially be extracted by using known recovery methods from a known accumulation under the prevailing economic and operating conditions.
SCM (Supply Chain Management)Supply Chain Management coordinates the procurement of crude oil, other refinery feedstock and products, as well as refining, logistics related to procurement or sales, and the whole-sale of crude oil products. It targets to maximise MOL Group profit with optimising through the whole value chain.
SME Small and Medium Enterprises
SPE based reserve valuation Method used by the Society of Petroleum Engineers
Thermal Power Plant (TPP)A thermal power station is a power plant in which the prime mover is steam driven. Water is heated, turns into steam and spins a steam turbine which drives an electrical generator (regional average net electric efficiency of existing thermal power plants is approximately 35%).
TransitGas transmission through pipeline, which crosses the border of one member of the European Economic Area and its starting or end-point is outside the European Economic Area.
Transmission pipelineThis pipeline, including its accessories and fittings, is used for transmitting natural gas, and its starting or kick-off points are the national border of the country, inlet points of gas produc-tion facilities, inlet and outlet points of underground gas storage facilities, and the end or terminal points are the national border of the country, outlet points of gas transfer stations (city gates), inlet and outlet points of underground gas storage facilities.
Unit production costTotal cost of lifting, gathering and processing of crude oil and natural gas per barrel of crude oil equivalent
UpstreamExploration and Production Segment.
Ural Blend Russian, export quality crude oil. Heavy and sour (with high sulphur content) crude oil, therefore the price of Ural Blend is lower than that of light Brent crude oil, which has low sulphur content.
VC fundsVenture Capital funds
FINANCIAL TERMS
ADRAmerican Depository Receipt, depository certificates issued by a foreign depository on the issuers shares, which are deposited with a Hungarian custodian.
CAPEXCapital Expenditures
Clean-CCS EBITDA Operating profitAs of Q2 2013 our applied clean CCS methodology eliminates from EBITDA/operating profit inventory holding gain/loss (i.e.: reflecting actual cost of supply of crude oil and other major raw materials); impairment on inventories; FX gains/losses on debtors and creditors; furthermore adjusts EBITDA/operating profit by capturing the results of underlying hedge transactions. Clean CCS figures of the base periods were modified as well according to the improved methodology.
EBITDA (Earnings before interest, tax, depreciation and amortisation)Operating profit plus depreciation and amortisation
EPSEarnings per Share is based on the profit attributable to ordi-nary shareholders using the weighted average number of shares outstanding during the year after deduction of the average number of treasury shares held over the period.
Financial CovenantIt is the rate calculated from specific terms of P&L, Balance Sheet and Cash-Flow. (Eg.: Net Debt per EBITDA, EBITDA per Total Interest Expense) Financial Covenants are primarily applied in loan facility agreements to limit lenders' credit risk.
GearingRatio of net debt to net debt plus equity
Net debtNet debt = Long-term debt, net of current portion + short-term debt + current portion of long-term debt – short term invest-ments – cash and cash equivalents
IFRSInternational Financial Reporting Standards, formerly Interna-tional Accounting Standards (IAS)
Market capitalisationNumber of shares (issued share capital excluding Treasury stock) multiplied by the actual stock market price.
Net incomeAttributable to equity holders of the parent Profit after taxation after the Groups share of associated companies and the deduc-tion of profits due to minority interest.
GLOSSARY

Operating cash flowNet cash provided by operating activities to be used for invest-ment activities, interest payments and dividend payments to shareholders.
ROACE (Return on average capital employed)Operating profit after taxation/average capital employedOperating profit after taxation = operating profit x (100% - calcu-lated corporate tax ratio)Average capital employed = opening capital employed/2 + closing capital employed/2Capital employed = total assets – long term financial investments – work in progress – cash and cash equivalents – short term liabilities + short term loans and credits
ROE (Return on Equity)Net income divided by shareholders equity
Shareholder’s returnReturn resulting from the movements of the share price and the amount of dividend paid
SUSTAINABLE DEVELOPMENT
APCAim of Annual People Cycle is to have a sustainable and inte-grated people management process at MOL Group. The yearly repeating assessment cycle ensures regular feedback on perfor-mance, career & development opportunities, and links current performance to long-term career growth.
BOD (Biological Oxygen Demand)The rate of wastewater pollution expressed by the amount of oxygen required by micro-organisms for the biological oxidation of organic waste in a unit volume of waste water.
Business and Human RightsThis area is examining the impact of a company’s activities on human rights, and proposes guidelines to manage these. In 2011, the UN Committee lead by Harvard Kennedy School of Govern-ment Professor John Ruggie published guidelines for states and companies regarding how to observe and manage their human rights impacts. MOL Group follows the resulting UN Guiding Principles on Business and Human Rights, and the corre-sponding general and sectorial indicator of the GRI Standards to devise its actions and report on activities.
COD (Chemical Oxygen Demand)A parameter similar to BOD, differing only in that the oxidation of components in waste water is based on the use of chemicals.
CO2 intensity – CWTWe have been monitoring the GHG performance of our refining business since 2010 using the CONCAWE – Solomon CO2 inten-sity indicator (CWT – Complexity Weighted Tonnes). This indi-cator is production-based and takes into account the complexity
of the installations. The methodology is based on different emis-sions factors characterising different point sources. The meas-urement unit is one tonne of CO2 per one kilotonne of production (t CO2/kt).
CO2 intensity – HVCIn our petrochemical business we are using an indicator of the production of high value chemicals (HVC). With this, MOL Petrochemicals’ performance becomes comparable on an inter-national level. The measurement unit is one tonne of CO2 per one kilotonne of production (t CO2/kt).
Donations in cashIs a monetary support provided without any return considera-tion in a financial or other form. It is closely related to the social role and responsibility of the Company, and can contribute to the Company's positive image.
Employee Engagement SurveyEmployee engagement is a strategic part of a healthy and produc-tive workplace and a priority for sustaining and promoting our human capital and business strategy. We deploy biannually an employee engagement survey (the Roundtable Survey) in most of our companies within MOL Group and many of our locations worldwide. Since 2012, Aon Hewitt’s ‘Say, Stay, Strive’ model has been used. Engagement is calculated by determining each employee’s average response to the six engagement questions based on the Aon Hewitt six-point response scale. If the average rating for an employee equals or exceeds 4.5, that individual is assessed as ‘engaged’. The engagement score is the total propor-tion of employees who are ‘engaged’.
Employee volunteering during paid working hoursEmployee volunteering is a service provided by the company staff during paid working hours supporting communities or for charitable purposes.
ETS (Emission trading scheme)The Greenhouse Gas Emission Trading scheme of the European Union is a market based instrument for cost effective reduction of Greenhouse Gas Emissions.
European Works CouncilEuropean works councils (EWCs) are bodies representing the European employees of a company. Through them, workers are informed and consulted at transnational level by management on the progress of the business and any significant decision that could affect them.The right to establish EWCs was introduced by Directive 94/45/EC for undertakings or groups of undertakings employing at least 1,000 employees in the European Union and the other countries of the European Economic Area (Iceland, Liechten-stein and Norway) with at least 150 employees in each of two Member States. Source: www.ec.europa.eu/social/BlobServlet?docId=6647&langId=en
269

GHG (Greenhouse gases)Gases that contribute to the formation of an undesirable insu-lating blanket around the Earth by trapping heat from infrared radiation (CO2, CH4, N2O, HFC, PFC, SF6). MOL Group is collecting direct and indirect GHG emissions data according to international standards (e.g. GHG Protocol) listed under scopes: Scope 1 emissions (direct emissions) – are direct GHG
emissions from sources that are owned or controlled by MOL Group. Scope 1 can include emissions from fossil fuels burned on site, emissions from entity-owned or entity-leased vehi-cles, and other direct sources
Scope 2 emissions (indirect emissions) – are indirect GHG emissions resulting from the generation of electricity, heating and cooling, or steam generated off-site, but purchased by the entity
– Scope 2 location-based – reflects the average emissions intensity of grids on which energy consumption occurs (using grid-average emission factor);
– Scope 2 market-based – reflects proper disclosure of the electricity mix, companies account for the share of green electricity they purchase and / or apply the “residual mix” to account for the rest of the electricity.
Scope 3 emissions – include indirect GHG emissions from sources not owned or directly controlled by MOL Group but related to the entity’s activities. They are a consequence of the activities of the company, but occur from sources not owned or controlled by the company. Some examples include third party deliveries, business travel activities and use of sold products and services (e.g. fuel, etc.)
GRI (Global Reporting Initiative)A multi-stakeholder process and independent institution whose mission is to develop and disseminate globally applicable Sustainability Reporting Guidelines.
Growww program:The Growww graduate recruitment and development program, launched in 2007, provides graduates with a unique opportunity to start their career in a global company and to build work expe-rience through training, on-the-job assignments and mentoring from the best professionals in various Oil and Gas disciplines in an intercultural working environment.
HAY: MOL Group’s existing job grading system is based on the HAY methodology. HAY enables the company to manage a single, logical, transparent and consistent system that ensures the adequate treatment of its employees based on the nature of their work and their position within the company.
HSEHealth, Safety and Environment
In-kind givingA non-monetary support provided without any return consider-ation in a financial or other form, which is closely related to the social role and responsibility of the Company, and can contribute to the Company's positive image.
Leverage (social investments)Is the leverage of cash and resources coming from the employees, partners of a company or other third party donor, as a result of a social investment project implemented by the same company.
London Benchmarking Group donation measure-ment methodologyIt is an internationally acclaimed method to measure a company s social investments. Over 300 companies worldwide are using the LBG methodology to measure, manage and report on the value, output, leverage and impact of such projects.
LTIF (Lost Time Injury Frequency)The number of incidents of lost time injury (LTI) per one million hours worked
Materiality assessmentThe purpose of materiality assessment is to highlight a company s most important strategic sustainability areas, which will be in the focus of transparency and of resource allocation to foster improvements. Materiality assessment is a key pillar of the GRI reporting standard.
PM (Particulate Matter)Particulate matter is finely dispersed solid matter produced by burning and other technological processes; the most dangerous are fractions finer than 10 µm (PM10).
RAR (Road accident rate)The number of road accidents per 1 million km driven
RemediationPreventing, minimising, remedying or mitigating the effects of pollution in relation to contaminated land or water, or restoring such land or water to its former state.
SD (Sustainable Development)Development that meets the needs of the present without compromising the ability of future generations to meet their own needs” (source: UN / Brundtland Report, 1987).
Social InvestmentsThe voluntary contribution of companies to communities located near their operations and to society at large with the aim to support external stakeholders in their fields of interest, typi-cally through transfer of knowledge, skills or resources.
GLOSSARY

Spills Unintended and/or uncontrolled release of liquefied hazardous materials exceeding 1 cubic metre volume to the environment (groundwater, surface water, soil).
SS (Solid Substances)Particles which do not dissolve in water
Technical Career LadderA career ladder in human resources is a system clearly setting professional knowledge and experience requirements to make career advancement and promotion more transparent. Group E&P and Group HR implemented a Technical Career Ladder (TCL) across the E&P community in 2015 and allocated 940 petro-technical professionals (PTPs) to 7 TCL levels through 14 Job Families.
TPH (Total Petroleum Hydrocarbons)Is a parameter used to measure the concentration or mass of petroleum hydrocarbon constituents present in a given amount of soil or water.
VOC (Volatile Organic Compounds)Volatile organic compounds (VOCs) are emitted as gases from certain solids or liquids and include a variety of chemicals, some of which may have short- and long-term adverse health effects and participates in atmospheric photochemical reactions. They are defined as any organic compound with a vapour pressure of 0.01 kPa or higher at 293.15 K (20 ºC), or which has similar volatility under the actual conditions of use (methane is not included); most ground-level ozone (smog) results from a reac-tion between NOX and VOCs.
VRUVapour recovery unit – a relatively simple system that can capture vapours that otherwise will be vented into the atmos-phere
HSE indicatorsFor the exact definitions of the HSE indicators please visit our Sustainable Development website.www.molgroup.info/hu/sustainability
271

CONTACT INFORMATIONCorporate AddressMOL Hungarian Oil and Gas Public Limited Company (MOL Plc.)H-1117 Budapest, Október huszonharmadika u. 18.H-1502 Budapest, Pf.: 22Phone: (+36-1) 209-0000, 209-1010, 209-2020
Share RegistrarKELER Zrt.H-1074 Budapest, Rákóczi u. 70-72.Phone: (+36-1) 483-6251, (+36-1) 483-6289E-mail: [email protected]
Stock Exchange Trading InformationBudapest Stock ExchangeH-1054 Budapest, Szabadság tér 7.Phone: (+36-1) 429-6857Fax: (+36-1) 429-6899E-mail: [email protected]
Warsaw Stock ExchangeGiełda Papierów Wartosciowych w Warszawie S.A.4 Ksiazeca Street 00-498, Warsaw PolandPhone: (+4822) 628 32 32Fax: (+4822) 628 17 54E-mail: [email protected]
DR InformationThe Bank of New York MellonSlawek Soltowski, Vice President101 Barclay Street, 22 West New York, NY 10286 USAPhone: 00 1 212 815 3503 Fax: 00 1 212 571 3050Email: [email protected]
AnnouncementsThe company publishes its announcements
• in MOL’s website: www.molgroup.info/en/, direct link: http://molgroup.info/en/investor-relations/regu-lated-information
• in Budapest Stock Exchange’s website: www.bse.hu/ and
• in Warsaw Stock Exchange’s website.
Investor RelationsH-1117 Budapest, Október huszonharmadika u. 18.Phone: (+36-1) 464-1395Fax: (+36-1) 464-1335E-mail: [email protected]
Investor Relations ManagerRóbert Réthy E-mail: [email protected] and shareholder contactsZoltán PandiE-mail: [email protected]
Zsuzsanna NagyE-mail: [email protected]
Small shareholder and custody contactZoltán Fogarasi E-mail: [email protected]
Sustainable DevelopmentGergely JancsárE-mail: [email protected]
IMPRINT
Executive publisher: MOL Group Corporate Communica-tions, Investor Relations, Sustainable DevelopmentManaging editor: MOL Group Investor RelationsDesign & Publisher: MOL Group Corporate Communications, Hamu és Gyémánt Kiadó
CONTACT INFORMATION

![arXiv:2008.07889v3 [quant-ph] 16 Nov 2021 - X-MOL](https://static.fdokumen.com/doc/165x107/631feb8d9353b08ff5016b58/arxiv200807889v3-quant-ph-16-nov-2021-x-mol.jpg)