Dietary Coleus amboinicus Lour. decreases ruminal ... - X-MOL
19
RESEARCH Open Access Dietary Coleus amboinicus Lour. decreases ruminal methanogenesis and biohydrogenation, and improves meat quality and fatty acid composition in longissimus thoracis muscle of lambs Yulianri Rizki Yanza 1,2 , Malgorzata Szumacher-Strabel 1 , Dorota Lechniak 3 , Sylwester Ślusarczyk 4 , Pawel Kolodziejski 5 , Amlan Kumar Patra 6 , Zora Váradyová 7 , Dariusz Lisiak 8 , Mina Vazirigohar 9 and Adam Cieslak 1* Abstract Background: Methane production and fatty acids (FA) biohydrogenation in the rumen are two main constraints in ruminant production causing environmental burden and reducing food product quality. Rumen functions can be modulated by the biologically active compounds (BACs) of plant origins as shown in several studies e.g. reduction in methane emission, modulation of FA composition with positive impact on the ruminant products. Coleus amboinicus Lour. (CAL) contains high concentration of polyphenols that may potentially reduce methane production and modulate ruminal biohydrogenation of unsaturated FA. This study aimed to investigate the effect of BAC of Coleus amboinicus Lour. (CAL) fed to growing lambs on ruminal methane production, biohydrogenation of unsaturated FA and meat characteristics. In this study, the in vitro experiment aiming at determining the most effective CAL dose for in vivo experiments was followed by two in vivo experiments in rumen-cannulated rams and growing lambs. Experiment 1 (RUSITEC) comprised of control and three experimental diets differing in CAL content (10%, 15%, and 20% of the total diet). The two in vivo experiments were conducted on six growing, rumen-cannulated lambs (Exp. 2) and 16 growing lambs (Exp. 3). Animals were assigned into the control (CON) and experimental (20% of CAL) groups. Several parameters were examined in vitro (pH, ammonia and VFA concentrations, protozoa, methanogens and select bacteria populations) and in vivo (methane production, digestibility, ruminal microorganism populations, meat quality, fatty acids profiles in rumen fluid and meat, transcript expression of 5 genes in meat). © The Author(s). 2022 Open Access This article is licensed under a Creative Commons Attribution 4.0 International License, which permits use, sharing, adaptation, distribution and reproduction in any medium or format, as long as you give appropriate credit to the original author(s) and the source, provide a link to the Creative Commons licence, and indicate if changes were made. The images or other third party material in this article are included in the article's Creative Commons licence, unless indicated otherwise in a credit line to the material. If material is not included in the article's Creative Commons licence and your intended use is not permitted by statutory regulation or exceeds the permitted use, you will need to obtain permission directly from the copyright holder. To view a copy of this licence, visit http://creativecommons.org/licenses/by/4.0/. The Creative Commons Public Domain Dedication waiver (http://creativecommons.org/publicdomain/zero/1.0/) applies to the data made available in this article, unless otherwise stated in a credit line to the data. * Correspondence: [email protected] 1 Department of Animal Nutrition, Faculty of Veterinary Medicine and Animal Science, Poznań University of Life Sciences, 60-637 Poznań, Poland Full list of author information is available at the end of the article Yanza et al. Journal of Animal Science and Biotechnology (2022) 13:5 https://doi.org/10.1186/s40104-021-00654-3
-
Upload
khangminh22 -
Category
Documents
-
view
1 -
download
0
Transcript of Dietary Coleus amboinicus Lour. decreases ruminal ... - X-MOL

RESEARCH Open Access
Dietary Coleus amboinicus Lour. decreasesruminal methanogenesis andbiohydrogenation, and improves meatquality and fatty acid composition inlongissimus thoracis muscle of lambsYulianri Rizki Yanza1,2, Malgorzata Szumacher-Strabel1, Dorota Lechniak3, Sylwester Ślusarczyk4, Pawel Kolodziejski5,Amlan Kumar Patra6, Zora Váradyová7, Dariusz Lisiak8, Mina Vazirigohar9 and Adam Cieslak1*
Abstract
Background: Methane production and fatty acids (FA) biohydrogenation in the rumen are two main constraints inruminant production causing environmental burden and reducing food product quality. Rumen functions can bemodulated by the biologically active compounds (BACs) of plant origins as shown in several studies e.g. reductionin methane emission, modulation of FA composition with positive impact on the ruminant products. Coleusamboinicus Lour. (CAL) contains high concentration of polyphenols that may potentially reduce methaneproduction and modulate ruminal biohydrogenation of unsaturated FA.This study aimed to investigate the effect of BAC of Coleus amboinicus Lour. (CAL) fed to growing lambs on ruminalmethane production, biohydrogenation of unsaturated FA and meat characteristics. In this study, the in vitroexperiment aiming at determining the most effective CAL dose for in vivo experiments was followed by twoin vivo experiments in rumen-cannulated rams and growing lambs. Experiment 1 (RUSITEC) comprised of controland three experimental diets differing in CAL content (10%, 15%, and 20% of the total diet). The two in vivoexperiments were conducted on six growing, rumen-cannulated lambs (Exp. 2) and 16 growing lambs (Exp. 3).Animals were assigned into the control (CON) and experimental (20% of CAL) groups. Several parameters wereexamined in vitro (pH, ammonia and VFA concentrations, protozoa, methanogens and select bacteria populations)and in vivo (methane production, digestibility, ruminal microorganism populations, meat quality, fatty acids profilesin rumen fluid and meat, transcript expression of 5 genes in meat).
© The Author(s). 2022 Open Access This article is licensed under a Creative Commons Attribution 4.0 International License,which permits use, sharing, adaptation, distribution and reproduction in any medium or format, as long as you giveappropriate credit to the original author(s) and the source, provide a link to the Creative Commons licence, and indicate ifchanges were made. The images or other third party material in this article are included in the article's Creative Commonslicence, unless indicated otherwise in a credit line to the material. If material is not included in the article's Creative Commonslicence and your intended use is not permitted by statutory regulation or exceeds the permitted use, you will need to obtainpermission directly from the copyright holder. To view a copy of this licence, visit http://creativecommons.org/licenses/by/4.0/.The Creative Commons Public Domain Dedication waiver (http://creativecommons.org/publicdomain/zero/1.0/) applies to thedata made available in this article, unless otherwise stated in a credit line to the data.
* Correspondence: [email protected] of Animal Nutrition, Faculty of Veterinary Medicine and AnimalScience, Poznań University of Life Sciences, 60-637 Poznań, PolandFull list of author information is available at the end of the article
Yanza et al. Journal of Animal Science and Biotechnology (2022) 13:5 https://doi.org/10.1186/s40104-021-00654-3

Results: CAL lowered in vitro methane production by 51%. In the in vivo Exp. 3, CAL decreased methaneproduction by 20% compared with the CON group, which corresponded to reduction of total methanogen countsby up to 28% in all experiments, notably Methanobacteriales. In Exp. 3, CAL increased or tended to increasepopulations of some rumen bacteria (Ruminococcus albus, Megasphaera elsdenii, Butyrivibrio proteoclasticus, andButyrivibrio fibrisolvens). Dietary CAL suppressed the Holotricha population, but increased or tended to increaseEntodiniomorpha population in vivo. An increase in the polyunsaturated fatty acid (PUFA) proportion in the rumenof lambs was noted in response to the CAL diet, which was mainly attributable to the increase in C18:3 cis-9 cis-12cis-15 (LNA) proportion. CAL reduced the mRNA expression of four out of five genes investigated in meat (fatty acidsynthase, stearoyl-CoA desaturase, lipoprotein lipase, and fatty acid desaturase 1).
Conclusions: Summarizing, polyphenols of CAL origin (20% in diet) mitigated ruminal methane production byinhibiting the methanogen communities. CAL supplementation also improved ruminal environment by modulatingruminal bacteria involved in fermentation and biohydrogenation of FA. Besides, CAL elevated the LNAconcentration, which improved meat quality through increased deposition of n-3 PUFA.
Highlight
• Coleus amboinicus Lour. (CAL) into sheep diet decreased CH4 emission.• CAL did not reduce nutrient digestibility, but inhibited the methanogen community.• CAL increased ruminal propionate proportion and decreased acetate/propionate ratio.• CAL elevated n-3 fatty acid concentration in ruminal fluid and meat.• Supplementation of CAL improved some meat quality traits.
Keywords: Bioactive compounds, Biohydrogenation, Meat characteristics, Methane, Microorganism, Ruminalfermentation, Sheep
IntroductionMethane (CH4) is a greenhouse gas mainly produced byanaerobic enteric fermentation in the rumen. The en-teric CH4 production also represents a loss of the totalenergy (2–12%) decreases the efficiency of animal pro-duction [1]. Enteric CH4 emission is thus one of themain targets of greenhouse gas mitigation efforts to re-duce CH4 production in the animal sector.Biologically active compounds (BACs) have been rec-
ognized as modulators of rumen microbial fermentation,including methanogenesis [2, 3]. Thus, the BACs can re-duce the negative animal impact on the environmentsuch as enteric methane emission [4]. The use of BACsmay also modulate the ruminal biohydrogenation (BH)of unsaturated fatty acids (UFAs), causing changes in thefatty acid (FA) profile of the ruminal fluid and conse-quently of ruminant products. Reduction of ruminalCH4 production should be balanced with improvementsin rumen performance, and enrichment of animal prod-ucts with beneficial FAs for sustainable adoption of CH4
mitigation technologies in the livestock industry [1, 5].Researchers are still searching for the most effectivesources and doses of BACs that could be recommendedfor long-term application.One category of BACs are polyphenols, such as phen-
olic acids, flavonoids, condensed tannins and hydrolys-able tannins [3]. Coleus amboinicus Lour. (CAL) is richin polyphenolic compounds (mostly phenolic acids and
flavonoids), diterpenes, and alkaloids [6, 7]. C. amboini-cus grows in tropical regions, including Asia, Africa andAustralia, and is used in human medicine for long time[7]. Our previous short-term in vitro study revealed thecapacity of CAL to decrease CH4 production and tomodulate ruminal FA composition, mainly n-3 polyun-saturated fatty acids (PUFAs) by altering the microbialactivity linked to methanogenesis and FA biohydrogena-tion [6]. However there is no published evidence docu-menting effect of polyphenol-rich CAL on ruminalfermentation by a long-term in vitro study or by an inin vivo experiment.Therefore, this study investigated the effects and mode
of action of BACs present in CAL on rumen methano-genesis and BH in growing lambs through a long-termin vitro and two in vivo experiments. We hypothesizedthat CAL could 1) affect rumen microbial population(mainly methanogens) and consequently mitigate rumi-nal CH4 production, and 2) modulate the BH of UFA,especially n-3 PUFAs, in the rumen and animal tissues,presumably, without any negative effect on rumen pa-rameters or animal performance.
Materials and methodsExperimental designThe CAL used in this study were purchased from a com-mercial source (Karya Herbal Nasional Ltd., companyland-plot at Bogor, Indonesia 6°70′28″S; 106°90′90″E
Yanza et al. Journal of Animal Science and Biotechnology (2022) 13:5 Page 2 of 19

and 6°43′30.1″S; 107°05′09.2″E). The CAL were ran-domly collected after 2 to 3-month growth period anddried in an oven at 50–60 °C for 48 h. The leaves wereground and prepared for analyses.
In vitro experimentThe Exp. 1 was carried out using the long-term in vitrorumen simulation technique (RUSITEC) following theprocedures described by Kozłowska et al. [8]. The RUSI-TEC experiment was designed with a completely ran-domized block design with four diets and two replicatesin each run, and repeated three times. The four isonitro-genous and isoenergetic diets were prepared as follows:diet 1: a control diet CON based on grass silage (5.7 gDM) and concentrate (5.3 g DM); diet 2: 10% CAL (6.4 gDM of grass silage, 3.5 g DM of concentrate, and 1.1 gDM of CAL); diet 3: 15% CAL (6.5 g DM of grass silage,2.85 g DM of concentrate, and 1.65 g DM of CAL diet),and diet 4: 20% CAL (6.5 g DM of grass silage, 2.3 g DMof concentrate, and 2.2 g DM of CAL). The diets for ani-mals donating the rumen fluids as well as animals forin vivo experiments were formulated using the IZ INRA[9] system to meet the animals’ nutrient requirements(average for 20 kg of body weight and 150 g/d of growth:0.72 unit for meat production per day and 69 g proteintruly digestible in the small intestine per day). Thechemical composition of the grass silage, concentrate,and CAL are presented in Table 1. Rumen fluid andsolid digesta for the in vitro experiment diet were col-lected before morning feeding from six rumen-cannulated lambs (20 ± 3 kg) for microbial inocula. Thelambs, donors of the rumen fluid, were fed the same dietas in the CON treatment.Samples of fermentation fluid were collected directly
from each fermenter 3 h before replacing the bags withthe diets. The pH, ammonia concentration, VFA profile,feed degradability, protozoa count, and populations ofmethanogen, total bacteria, and select bacteria were ana-lyzed. To determine FA profile, samples of the ferment-ing fluid were directly collected from the effluent vesselswhile the bags were being replaced. Fermentation gaseswere collected over 24 h using gas-tight bags (Tecobag81, Tesseraux Container, Bürstadt, Germany).
In vivo experimentThe Exp. 2 employed six rumen-cannulated lambs allo-cated into two treatments, i.e., the control diet (CON)and the experimental diet (CAL-containing diet) in acrossover design. The highest level of CAL (20%) was se-lected based on the in vitro results from RUSITEC ex-periment. Lambs on CON diet received 352 g DM/d ofconcentrate and 379 g DM/d of grass silage. The experi-mental lambs received concentrate, CAL and grass sil-age. During the first 14 d of the experiment, the
concentrate (352 g/d) in the experimental diet was grad-ually replaced by CAL from 46 g DM/d to 173 g DM/d.From d 15, the experimental lambs received 176 g DM/dof concentrate, 173 g DM/d of CAL and 507 g DM/d ofgrass silage. The CAL dose of 173 g DM/d correspondedto 20% of CAL in daily diet intake (856 g DM/d). In Exp.2, each period lasted 24 d, with a 21-day adaptationperiod and a 3-day sampling period. Rumen fluid fromeach lamb was collected daily for 3 d of the experimentalperiod, before morning feeding (0 h), and then at 3 h and6 h after morning feeding [8]. The pH, ammonia concen-tration, VFA profile, and numbers of protozoa, methano-gens, and total bacteria were analyzed. Meanwhile,samples for quantification of total bacteria and methano-gens using fluorescence in situ hybridization (FISH)were only collected at the 3 h timepoint.In Exp. 3, sixteen growing lambs (20 ± 3 kg live weight)
were used for the final production performance test.Lambs were randomly allocated into CON or CAL diet-ary treatments based on their live weight (n = 8 pergroup). Lambs were kept individually during the wholeexperiment, except during the period when respiratorychambers were used. In order to reduce stress associated
Table 1 Chemical composition and fatty acids profile of dietarycomponents and CAL
Item Grass Silage Concentrate CAL
Dry matter content, g/kg 416 889 919
Chemicals composition, g/kg DM
Ash 86.9 71.9 153
Organic matter 913 928 847
Crude protein 187 203 214
Ether extract 20.6 38.0 43.3
aNDF 456 238 405
Fatty acids, g/100 g FA
C14:0 0.90 0.20 0.45
C16:0 19.9 16.3 18.7
C18:0 5.88 3.71 4.35
C18:1 cis- 9 8.80 23.7 2.50
C18:2 cis- 9. cis- 12 14.4 42.7 10.8
C18:3 cis- 9 cis- 12 cis- 15 36.1 9.20 45.1
∑ Other FA 13.9 4.23 18.1
∑ SFA 30.1 21.4 26.0
∑ UFA 69.9 78.6 74.0
∑ MUFA 14.3 26.2 14.8
∑ PUFA 55.5 52.5 59.2
∑ n-6 FA 17.7 43.0 12.3
∑ n-3 FA 37.8 9.42 46.9
CAL C. amboinicus Lour., DM dry matter, aNDF NDF analyzed with α-amylase,FA fatty acids, SFA saturated fatty acids, UFA unsaturated fatty acids, MUFAmonounsaturated fatty acids, PUFA polyunsaturated fatty acids
Yanza et al. Journal of Animal Science and Biotechnology (2022) 13:5 Page 3 of 19

with isolation, two animals were always kept together ineach cage placed in the respiratory chamber. The experi-ment lasted 30 d, a 21-day adaptation stage and an 8-day sampling period, with 1-day for the slaughteringprocess. During the adaptation period, the lambs wereadapted to the CAL diet, as in Exp. 2. The CON lambswere fed the control diet comprised of grass silage (379 gDM/d) and concentrate (352 g DM/d). The CAL lambswere fed grass silage (507 kg DM/d), concentrate (176 gDM/d), and CAL (173 g DM/d). The diets were formu-lated following the IZ INRA [9] system to meet animals’major nutritional requirements. All animals had free ac-cess to fresh water. The CON and CAL diets were fed inequal proportion at 8:00 h and 20:00 h daily. Feed in-take, feed residue, and amount of feces were recordeddaily. Animal weights were recorded weekly. During thesampling period (from d 22 to d 28 of the experiment),each cage was transferred into a respiratory chamber bydaily rotation in order to determine the direct CH4 emis-sion for 24 h consecutively. Two respiratory chamberswere used. Each cage was tested twice but in order toobtain individual lamb’s gasses production, obtained re-sults were divided by two.On the last day of experiment (d 30), the animals were
slaughtered 3 h after morning feeding. After slaughter-ing, the rumen digesta were taken from the top, bottom,and middle of the rumen and squeezed through a four-layer cheese-cloth for analysis of pH, ammonia concen-tration, and VFA profile in ruminal fluid, FA profile, andpopulations of protozoa, methanogens, total bacteria,and select bacteria in digesta. Samples of muscle fromthe right side of each carcass and drawn at the level ofthe thirteenth thoracic rib was immediately collected.Approximately 5 g of longissimus thoracis (LT) musclewas shock-frozen in liquid nitrogen for gene expressionanalysis. The LT muscle (ca. 50 g) was cooled and trans-ferred in a cool (4 °C) atmosphere to the laboratory forFA analysis. All collected samples were stored at − 80 °Cuntil analysis.
Meat quality traitsThe LT (100 g) from the right-half carcass was used formeat quality analysis that was performed at the labora-tory of the Institute of Agricultural and Food Biotech-nology (Poland). The pH was measured in triplicates 24h post-mortem on samples of LT muscle using a pHmeter with an integrated electrode (pH meter 1140,Mettler-Toledo, USA) following ISO 2917 (2001) in-structions. For the instrumental evaluation of meatcolor, 10 mm thick steaks of LT muscle were cut to-wards the direction of muscle fibers and exposed to elec-tric light for 15 min. The values of L* (lightness), a*(redness), and b* (yellowness) were determined in tripli-cates using a Minolta Chroma Meter CR- 400 (Konica-
Minolta, Japan). Compositional analysis of LT muscle(water, intramuscular fat (IMF) and total protein con-tent) was performed using minced samples according tothe methods described in ISO 1442 (2000) for water,ISO 1444 (2000) for fat (using a Soxtherm device, Ger-hardt Analytical System, Germany), and PN-75/A-04018(2000) for protein (using a Kjeltec System 1002 DistillingUnit, FOSS Analytical, Denmark). The water-holdingcapacity (WHC) of minced LT muscle samples was de-termined as described by Grau and Hamm [10], withlater modifications introduced by Pohja and Ninivaara[11]. Visual evaluations of meat color and marbling ofLT muscle samples were performed by a panel of fourassessors using a 1–8 point Soicarni scale for meat color,with 1 being the lightest and 8 the darkest color, and a1–4 point scale for marbling (developed by the Instituteof Agricultural and Food Biotechnology, Poland), with 1being related to minor and 4 to the greatest marbling.The taste panel of four professional assessors, trained inrating lamb for meat-eating quantity, was used to assessaroma, juiciness, tenderness, and flavor on boiled LTsamples. Assessors scored the samples for each trait sep-arately on a 1–5 point scale, where 1 was related to badand 5 to a very good level of the traits according to themethodology of Barylko-Pikielna [12]. Concerning theabove mentioned visual and sensory evaluations of meat,the mean values of the scores given by four assessorswere taken for further calculations.
Determination of phenolic acid, flavonoid, andditerpenoid contentsThe CAL preparation and extraction were caried out asdescribed previously [7]. All the analyses were performedin triplicate for three independent samples that werestored in a freezer at − 20 °C before analysis. The CALbioactive compounds (phenolic acid, flavonoid, and di-terpenoid) were analyzed by ultra-high-resolution massspectrometry (UHRMS) on Dionex UltiMate 3000RSsystem (Thermo Scientific, Darmstadt, Germany) with acharged aerosol detector interfaced with a high-resolution quadrupole time-of-flight mass spectrometer(HR/QTOF/MS, Compact, Bruker Daltonik, Bremen,Germany) according to the procedure of Ślusarczyket al. [7].
Determination of the chemical composition of feedsSamples of grass silage, concentrate, CAL, and feceswere analyzed according to AOAC [13] for DM (methodno. 934.01), ash (method no. 942.05), crude protein (CP;using a Kjel-Foss Automatic 16,210 analyzer; method no.976.05), and ether extract (EE, using a Soxhlet SystemHT analyzer; method no. 973.18). The organic matter(OM) content was calculated by subtracting ash concen-tration from DM content. The aNDF was determined
Yanza et al. Journal of Animal Science and Biotechnology (2022) 13:5 Page 4 of 19

following the method of Van Soest et al. [14], with theaddition of amylase and sodium sulfite without residualash.
Basic rumen fermentation analysis and CH4 measurementThe pH of ruminal samples from all experiments wasmeasured immediately after samples collection using apH meter (CP-104; Elmetron, Zabrze, Poland). The am-monia concentration was analyzed using the colorimet-ric Nessler method described earlier by Bryszak et al. [5].The VFA profile was determined by gas chromatography(GC Varian CP 3380, Sugarland, TX, USA) following theprotocol of Varadyova et al. [15]. The in vitro CH4 con-centration was measured using a gas chromatography inSRI PeakSimple model 310 (Alltech, PA, USA) followingthe procedure described by Kozłowska et al. [8]. Me-thane production in the in vivo experiment was mea-sured using two respiration chambers (SPA System,Wrocław, Poland). The total chamber volume (8.2 m3)was ventilated by recirculating fans set at 40 m3/h givingapproximately 5 air changes per hour. The temperatureand relative humidity were set at 16 °C and 60%, respect-ively. The concentrations of CH4 and CO2 were mea-sured using two nondispersive infrared spectroscopydetectors operating in the near-infrared spectrum (Ser-vomex 4100, Servomex, UK; 1210 Gfx detector). Mea-surements were taken at two-second intervals. Two
measuring channels were used: the concentration ofCO2 in the range of 0–2.5% (0–48, 450 mg/m3) and theCH4 concentration in the range of 0–1000 ppm (0–706mg/m3). The sample was collected and then ducted tothe analyzer via a polyethylene tube with a diameter of8 mm. The sampling rate was 0.6 L/min. Before startingthe experiment, the analyzers were calibrated using ascalibration gases (99.999% nitrogen gas by volume, 1210ppm CH4 in nitrogen, and 4680 ppm CO2 in nitrogen).The analyzer was equipped with a 0.17 L cuvette with anoptical track of 540 mm for CH4 and a 0.012 L cuvettewith an optical track length of 154 mm for CO2.
Microbial quantificationThe protozoa population was quantified following themethod described by Michalowski et al. [16]. Methano-gen numbers were quantified by fluorescence in situhybridization (FISH) technique according to the proced-ure of Yanza et al. [6]. For bacteria quantification, totalDNA was extracted from fermented fluid using QIAampDNA Stool mini kit (Qiagen GmbH, Hilden, Germany)according to Yanza et al. [6]. Sequences of primers spe-cific to the particular bacterial species or genera are pre-sented in Table 2 [17–24]. Bacteria quantification wasperformed with a QuantStudio 12 Flex PCR system (LifeTechnologies, Grand Island, NY, USA).
Table 2 The sequences of primers specific to the analyzed bacteria species
Species Primer sequences (5′ to 3′) Reference
Streptococcus bovis F: TTCCTAGAGATAGGAAGTTTCTTCGG [17]
R: ATGATGGCAACTAACAATAGGGGT
Ruminococcus flavefaciens F:CGAACGGAGATAATTTGAGTTTACTTAGG [18]
R: CGGTCTCTGTATGTTATGAGGTATTACC
Ruminococcus albus F: CCCTAAAAGCAGTCTTAGTTCG [19]
R: CCTCCTTGCGGTTAGAACA
Megasphaera elsdenii F: AGATGGGGACAACAGCTGGA [17]
R: CGAAAGCTCCGAAGAGCCT
Prevotella spp. F: GAAGGTCCCCCACATTG [17]
R:CAATCGGAGTTCTTCGTG
Lactobacillus spp. F: TATGGTAATTGTGTGNCAGCMGCCGCGGTAA [20]
R: AGTCAGTCAGCCGGACTACHVGGGTWTCTAAT
Fibrobacter succinogenes F: GTTCGGAATTACTGGGCGTAAA [21]
R: CGCCTGCCCCTGAACTATC
Butyrivibrio proteoclasticus F: TCCTAGTGTAGCGGTGAAATG [22]
R: TTAGCGACGGCACTGAATGCCTA
Butyrivibrio fibrisolvens F: ACACACCGCCCGTCACA [23]
R: TCCTTACGGTTGGGTCACAGA
Anaerovibrio lipolytica F: GAAATGGATTCTAGTGGCAAACG [24]
R:ACATCGGTCATGCGACCAA
Yanza et al. Journal of Animal Science and Biotechnology (2022) 13:5 Page 5 of 19

Analysis of fatty acid in feed and meat samplesThe FA profiles of the grass silage, concentrate, CAL,rumen fluid, and LT muscle were analyzed following theprocedure of Bryszak et al. [5]. Sample hydrolysis was car-ried out in a closed system using screw-cap Teflon-stoppered tubes (Pyrex, 15mL). Three milliliters of 2mol/L NaOH was added to 100, 2500, 100, 10, and 500mg ofgrass silage, concentrate, CAL, rumen fluid, and meatsamples, respectively A gas chromatograph (GC Bruker456-GC, USA) fitted with a flame ionization detector anda 100m fused-silica capillary column (0.25mm i.d.) coatedwith 0.25 μm Agilent HP (Chrompack CP7420) were used.The conjugated linoleic acid (CLA) peaks were identifiedvia comparison with the retention times of the referencestandard (conjugated linoleic acid methyl esters, and amixture of cis- and trans-9, − 11 and − 10,12-octadecadie-noic acid methyl esters; Sigma) using Galaxie Work Sta-tion 10.1 (Varian, CA, USA). The desaturase index,atherogenic index, and thrombogenic index were calcu-lated as described by Bryszak et al. [5].
Analysis of mRNA expression in meat samplesTranscript analysis of FADS1, FASN, LPL, SCD, andELOVL5 genes in the meat samples was performed usingquantitative PCR (qPCR) analysis. Total RNA was isolatedfrom 100mg of LT muscle using Extrazol reagent. In brief,the meat samples were homogenized in 0.5mL of Extrazolreagent using a TissueLyser II (Qiagen, USA). After 10min incubation, 200 μL of chloroform was added andshaken vigorously for 15 s. The samples were then incu-bated for 10min at room temperature and centrifuged for15min at 12,000 × g. Next, the upper aqueous phase wastransferred to a new tube and 0.5mL of isopropanol wasadded. The samples were again incubated and centrifugedas in the previous step. The resulting RNA pellet waswashed with 1mL of 75% EtOH and dissolved in RNAsefree water (Sigma Aldrich). The quantity and quality ofthe isolated total RNA was checked using an NP80 Nano-Photometer (Implen, Germany). A reverse transcriptionreaction (RT) was carried out with 1 μg of total RNA andthe Firescript RT cDNA Synthesis MIX with Oligo (dT)and Random primers (Solis BioDyne), following the
manufacturer’s protocol. The mRNA expression wasquantified using QuantStudio 12 Flex PCR system (LifeTechnologies, Thermo Fisher Scientific, Waltham, MA,USA) and SYBR Green PCR Master Mix (Thermo FisherScientific, Waltham, MA, USA). The primer pairs used forRT-qPCR amplification are listed in Table 3 [25]. The spe-cificity of reaction products was determined by the melt-ing points (0.1 C/s transition rate). Two genes have beenconsidered as reference, GAPDH and β-actin. Due to itshigher stability, the β-actin gene was applied and relativemRNA expression was evaluated by delta-delta CT(ΔΔCT).
Statistical analysisThe data of the experiment 1 (RUSITEC) were analyzedusing a mixed model procedure (PROC MIXED) in SAS(university edition, version 9.4; SAS Institute, Cary, NC,USA) with repeated measures of day and fermentertreated as the experimental unit. The dietary treatmentwas considered as the fixed effect, experimental run as therandom effect, and the day (6 to 10 d) as the repeated fac-tor. Differences among treatments were further deter-mined using Tukey’s post hoc test and linear orthogonalcontrast was used to ascertain the tendency of the dose ef-fect of CAL. In experiment 2, data were analyzed usingPROC MIXED of SAS with the model containing dietarygroup, hour, and their interaction (group × h) as the fixedeffects and the animal and hour of sample collection asthe random effect with repeated measures. When the sig-nificant value of the interaction occurred, Tukey’s posthoc test was used to estimate the differences betweenmeans. In experiment 3, data were analyzed using PROCTTEST procedure of SAS, and for all parameters each ani-mal was considered as the experimental unit. Significancewas accepted at P < 0.05 and tended to significance at0.05 < P < 0.10. All the values are shown as group meanswith pooled standard errors of means.
ResultsNutrients and phytochemical composition of CALThe CAL had higher CP, EE, and ash concentrationsthan the concentrate and grass silage (Table 1). It also
Table 3 The sequences of primers specific to the analyzed genes expression in the longissimus thoracis muscle of lambs
Genename
Primer sequence (5′ to 3′) Reference
Forward Reverse
SCD GAGTACCGCTGGCACATCAA CTAAGACGGCAGCCTTGGAT [25]
ELOVL5 TGCTTCAGTTTGTGCTGACC TGGTCCTTCTGGTGCTCTCT [25]
FASN GGAGGACGCTTTCCGTTACA TGCTCTTCCTCACGTACCTGAA [25]
FADS1 CTGCTGTACCTGCTGCACAT ACGGACAGGTGTCCAAAGTC [25]
LPL TCATCGTGGTGGACTGGCT CATCCGCCATCCAGTTCATA [25]
Analyzed expression of five genes: SCD stearoyl-CoA desaturase, ELOVL5 fatty acid elongase 5, FADS1 fatty acid desaturase 1, FASN fatty acid synthase and LPLlipoprotein lipase
Yanza et al. Journal of Animal Science and Biotechnology (2022) 13:5 Page 6 of 19

had relatively higher PUFA proportion, especially of n-3FA, mainly due to the high content of C18:3 cis-9, cis-12, cis-15. The CAL contained 20.24 mg/g DM of totalpolyphenolic compounds and 19.6 mg/g DM of diter-penes. Among the various diterpenes present in CAL,acetoxy dihydroxy royleanone had the highest concen-tration (13.4 mg/g DM). The CAL also contained 4.78mg/g DM of dihydroxyroyleanone. Among the polyphe-nols, luteolin-O-glucuronide was 4.34 mg/g DM, ros-marinic acid 3.35 mg/g DM, and caffeic acid 3.19 mg/gDM (Table 4).
In vitro experiment (Exp. 1)Increased supplementation with CAL did not alter thebasic ruminal fermentation parameters, such as pH andconcentrations of ammonia or total VFA (Table 5).However, the molar proportions of acetate, propionate,butyrate, isovalerate, and valerate were dose-dependent.The proportions of acetate and isovalerate were lower inthe 15% and 20% CAL treatments (P < 0.05), but theproportions of butyrate and valerate were higher in theCAL diets than in CON (P ≤ 0.02). A linearly lower (P <0.01) A/P ratio was observed with increasing CAL. Di-gestibility of DM, OM, and NDF was unaffected by CAL,but a higher crude protein digestibility was noted for the10% and 20% CAL supplementation with a linear re-sponse (P = 0.03). Total gas and CH4 production (mL ormL/g DM) decreased linearly (P < 0.02) with increasinglevels of CAL in diets. Protozoa counts were unaffectedby the CAL diet (Table 6). The 10% CAL addition in-creased the populations of Streptococcus bovis, Prevotellaspp., Butyrivibrio proteoclasticus, and Butyrivibrio fibri-solvens (P ≤ 0.02). The CAL treatments linearly de-creased the total Archaea and Methanobacterialespopulations (P < 0.01).The FA proportions in the ruminal fluid were altered
by CAL supplementation (Table 7). The C18:0, C18:1trans-10, C18:1 trans-11, total C18:1 trans, C20:1 trans,decreased linearly with increasing levels of CAL in thediets (P < 0.05). The C18:1cis-9, C18:1cis-11, C24:1, C18:2 cis-12 trans-10 (CLA), C18:2 cis-9 cis-12 (linoleic acids;LA), PUFA, and n-6 FA proportions in CAL treatmentsincreased linearly (P < 0.05). The CAL treatments had alower total SFA and higher total UFA proportion in ru-minal fluid, and both were altered in a linear manner(P < 0.01). Also, the total BH intermediates, LA-BH andLNA-BH were decreased by CAL with a linear response(P < 0.01). The C18:3 cis-9 cis-12 cis-15, n-3 FA, totalCLA, PUFA/SFA and LNA/LA proportions were higherat 20% CAL supplementation (P ≤ 0.05) than the CON.
In vivo experimentIn Exp. 2, ruminal pH and ammonia concentration incannulated lambs fed the CAL diet was higher than in
the CON group (P < 0.01), and these variables werepost-feeding time dependent (P < 0.01; Table 8). Thetotal VFA concentration was similar in both diets andwas time-dependent (P < 0.01). Butyrate, isovalerate, andvalerate proportions decreased when CAL treatment wasused (P < 0.01). Time-dependent variation was observed
Table 4 Identified contents of the phenolic acids, flavonoids,and diterpenes in CAL
Compounds Content, mg/g DM
Siringing acid 0.26
Vanilic acid 0.06
Dihydroxy benzoic acid 0.19
Hydroxy benzoic acid 1.03
Caffeic acid 3.20
Dihydro ferulic acid-O-glucuronide 0.25
Luteolin-O-(hexosyl) 0.42
Luteolin-O-glucuronide 4.34
Ferulic acid 0.25
Rosmarinic acid derivative 0.34
Apigenin-O-glucuronide 2.89
Rosmarinic acid 3.36
Luteolin-O-(maloylglycosyl) 1.73
Apigenin derivative 0.88
Carnosci acid glucoside 0.08
Luteolin 0.18
Luteolin-O-(rhamnosyl-hexosyl) 0.15
Apigenin 0.12
3′.4′-Dimethoxy quercetin 0.14
Salvianolic acid C 0.27
Diterpene derivative 0.37
Salvianolic acid C derivative 0.12
5.7-Dihydroxy-4′.6-dimethoxy flavone 0.075
Dihydroxy kaurenoic acid 0.045
Trihydroxy-ent-kauranoic acid 0.02
Rosmanol 0.085
Dihydroxy kaurenoic acid 0.17
Longikaurin A 0.28
Dihydroxy royleanone 4.78
Epirosmanol 0.11
Dihydroxy-16-kauren-19-oic acid 0.10
Diterpene 0.22
Acetyl dihydroxy royleanone 13.41
Total phenolic acids 9.30
Total flavonoids 10.94
Total polyphenolic content 20.24
Total diterpenes 19.59
Yanza et al. Journal of Animal Science and Biotechnology (2022) 13:5 Page 7 of 19

in almost all the individual VFA proportions. The ratioof acetate to propionate (A/P) decreased in both diet-and time-dependent manners (P < 0.01).Holotricha had a lower population in the CAL group
than in the CON group (P = 0.02; Table 9). Entodinio-morpha and total protozoa tended to increase (P = 0.07;P = 0.06, respectively) due to CAL supplementation. TheCAL diet tended to increase total bacteria abundance(P = 0.09, Table 9). Populations of all methanogens,Methanobacteriales and Methanomicrobiales weredecreased by the CAL diet (P ≤ 0.04).In Exp. 3, the CAL diet did not affect performance
of growing lambs or feed digestibility (Table 10),but significantly lowered the CH4 productionexpressed as a L/d, L/kg DMI, L/kg OM (P < 0.01),and CH4/BW (P = 0.02). The pH value was higher
(P = 0.05) and ammonia concentration tended to in-crease (P = 0.09), when the CAL diet was used. TotalVFA concentration did not change, but the propion-ate proportion was higher (P = 0.01) in the CALgroup than in CON group. The concentrations ofisovalerate and valerate as well as the A/P ratiowere lower (P ≤ 0.04) in CAL group than the CONgroup.The protozoa population was increased (P < 0.01) by
the CAL diet (Table 11) as a result of the increasedpopulation of Entodiniomorpha; but Holotricha popula-tion decreased (P < 0.01). M. elsdenii and B. proteoclasti-cus were higher (P ≤ 0.02) in the CAL group than theCON group. Numbers of R. albus, Prevotella spp., andB. fibrisolvens tended to increase (P = 0.06; P = 0.10; P =0.09, respectively) with the CAL diet. The total
Table 5 The effect of CAL on in vitro ruminal fermentation and methane production (Exp. 1)
Parameters CON CAL, % DM SEM P-value
10 15 20 Diet L
Rumen fermentation
Redox potential, mV − 335 − 336 − 329 − 333 2.11 0.35 0.34
pH 6.89 6.89 6.91 6.91 0.001 0.12 0.08
NH3, mmol/L 9.19 9.19 9.11 9.18 0.25 0.99 0.96
Total VFA, mmol/L 44.7 44.4 44.6 47.1 1.15 0.62 0.36
VFA, molar percent
Acetate (A) 61.3a 59.7ab 58.2b 56.9c 0.74 0.01 < 0.01
Propionate (P) 22.9bc 22.7c 23.7ab 24.7a 0.37 < 0.01 < 0.01
Isobutyrate 3.36 3.56 3.57 3.62 0.17 0.78 0.35
Butyrate 8.19b 9.10a 9.36a 9.36a 0.14 0.02 < 0.01
Isovalerate 1.01ab 1.12a 0.91b 0.93b 0.03 0.04 0.13
Valerate 3.01c 3.76b 4.15ab 4.22a 0.14 < 0.01 < 0.01
A/P ratio 2.75a 2.69a 2.51b 2.35b 0.07 < 0.01 < 0.01
Digestibility, g/kg DM
Dry matter 505 526 499 518 6.40 0.38 0.78
Organic matter 516 530 504 524 6.36 0.47 0.99
Crude protein 430b 489a 453ab 489a 7.82 0.01 0.03
Neutral detergent fiber 491 506 483 488 7.11 0.66 0.59
Total gas and methane emission
Gas, mL 2902a 2984a 2920a 2534b 51.0 < 0.01 0.01
Gas, mL/g DM 264a 271a 265a 230b 4.63 < 0.01 0.01
CH4, mL 92.0a 79.0ab 71.1b 46.6c 3.84 < 0.01 < 0.01
CH4, mL/g DM 8.64a 7.41ab 6.45b 4.22c 0.34 < 0.01 < 0.01
CH4, mL/L gas 33.6a 28.3ab 24.2b 18.2c 1.24 < 0.01 < 0.01
CH4, mL/g DMD 17.1a 14.0b 14.9ab 8.61c 0.70 < 0.01 < 0.01
CH4, mL/g OMD 16.8a 13.0ab 12.4b 8.90b 0.69 < 0.01 < 0.01
CH4, mL/g NDF 15.6 14.4 13.9 8.46 0.80 0.08 0.02
CON control diet, CAL Coleus amboinicus Lour. diet, SEM standard error of means, L linear response, DM dry matter, NH3 ammonia, VFA volatile fatty acid, CH4
methane, DMD dry matter digestibility, OMD organic matter digestiblityDifferent superscripts (a, b, c) within the same row indicate significant differences (P < 0.05)
Yanza et al. Journal of Animal Science and Biotechnology (2022) 13:5 Page 8 of 19

methanogens and Methanobacteriales decreased (P <0.01 and P = 0.05, respectively) due to CALsupplementation.In Exp. 3, the proportions of C16:0, C23:0, C24:1,
LNA, PUFA, the sum of n-6, and the sum of n-3 FA inruminal fluid were increased by the CAL diet (P ≤ 0.05,Table 12). The CAL diet significantly decreased the pro-portions of C18:0 andC18:1 trans-10 (P < 0.05). TotalSFA and PUFA/SFA tended to decrease while the totalUFA tended to increase (P < 0.10). The ruminal biohy-drogenation percentage of LA and LNA decreased in theCAL diet (P < 0.05). Stearic acid (C18:0), sum of SFA,thrombogenicity index (TI), and the atherogenicity index(AI) were decreased (P ≤ 0.05) in LT muscle by CALdiet. The proportions of C18:3 cis-9 cis-12 cis-15, sum ofUFA, PUFA/SFA, total CLA, DΔ9, DΔ9 18:1/18:0, DΔ9RA/VA increased (P ≤ 0.05) in the muscle for the CALdiet. The proportions of total PUFA and total n-3 FA inLT muscle tended to increase (P = 0.07; P = 0.07; P =0.08, respectively) when the CAL diet was used.The CAL diet significantly decreased the mRNA ex-
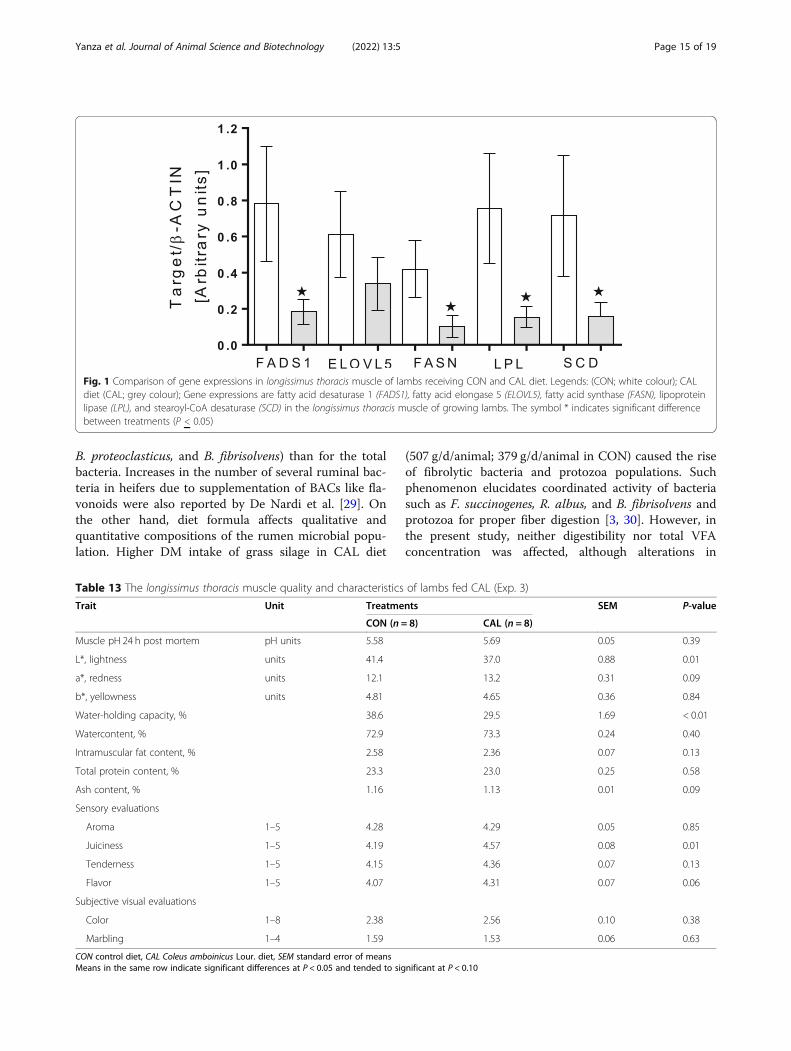
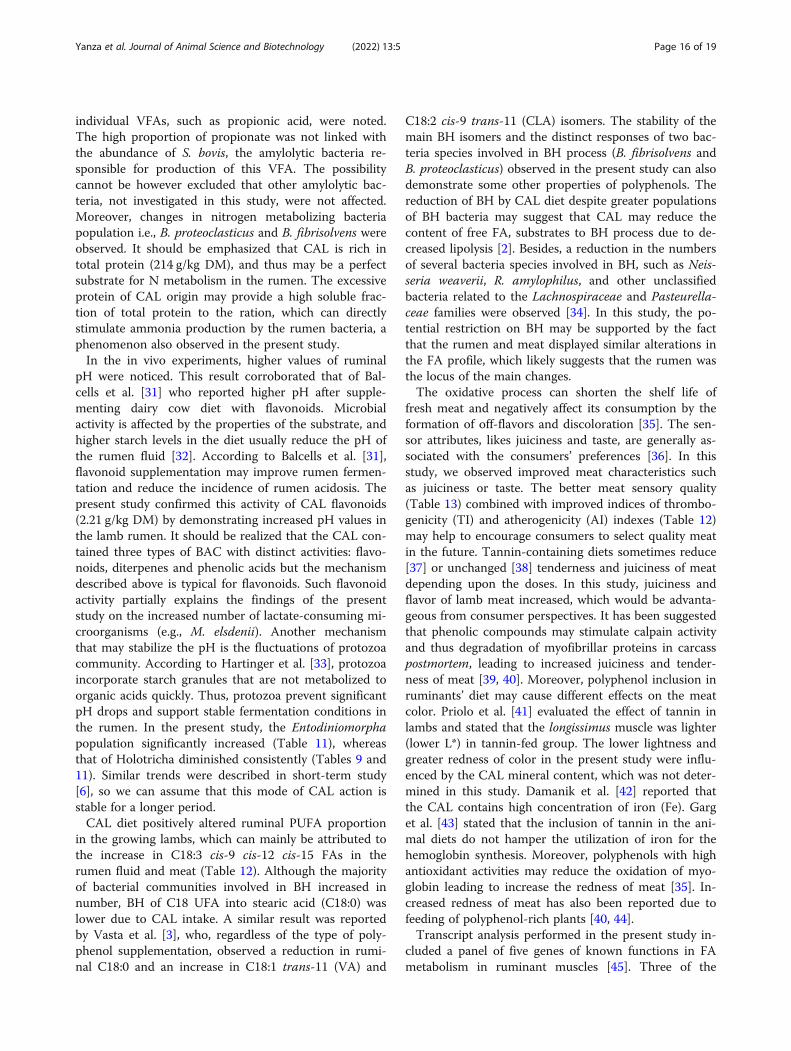
pressions of FADS1, FASN, LPL, and SCD genes, but notthe expression of ELOVL5 (Fig. 1). The CAL diet alsosignificantly affected some meat characteristics. Light-ness color and water-holding capacity of meat were re-duced, whereas meat juiciness was increased (P ≤ 0.01,Table 13) by CAL diet. Redness and flavor values tended
to increase (P = 0.09; P = 0.06, respectively), whereas theash content tended to decrease due to CAL supplemen-tation (P = 0.09).
DiscussionNutrients and phytochemical composition of Coleusamboinicus LourSeveral studies confirmed that CAL is rich in nutrients,ash, and BACs [6, 7]. In comparison to previous study[7], the CAL examined in this experiment was character-ized by higher concentrations of protein (214 vs. 196 g/kg DM), aNDF (405 vs. 363 g/kg DM), α-linolenic acid(45.1 vs. 35.83 g/100 g FA), and total PUFA (59.2 vs.56.15 g/100 g FA). Regarding BACs, in this study similarconcentrations of phenolic acids (9.30 mg/g DM) weredetected as in Yanza et al. [6], whereas flavonoids levelwas four times higher (10.94 mg/g DM). Thus, totalpolyphenolic content equaled 20.24 mg/g DM. In case ofditerpenes, their content equaled 19.79 mg/g DM andwas nine times higher compared to Yanza et al. [6]study. The most abundant component of CAL was acetyldihydroxy royleanone (13.4 mg/g DM), unlike in thestudy of Yanza et al. [6] where rosmarinic acid domi-nated. The differences between these results and thoseof Yanza et al. [6] may reflect characteristics of the plantmaterials such as harvesting time (2–3months and 4–6months, respectively) or management of plantation (e.g.,
Table 6 The effect of CAL on in vitro ruminal microorganisms (Exp. 1)
Variables CON CAL, % DM SEM P-value
10 15 20 Diet L
Total protozoa, 103/mL 4.89 4.68 4.68 4.91 0.003 0.40 0.91
Holotricha, 103/mL 0.05 0.04 0.04 0.05 0.06 0.72 0.55
Entodinomorpha, 103/mL 4.85 4.64 4.64 4.87 0.07 0.39 0.91
Total bacteria, 108/mL 4.74 4.31 4.51 4.48 0.06 0.08 0.27
Streptococcus bovis* 1.00ab 5.26a 0.08b 0.16b 0.70 0.01 0.76
Ruminococcus flavefaciens* 1.00 0.43 0.88 0.43 0.19 0.63 0.38
Ruminococcus albus* 1.00 0.10 3.16 18.5 3.08 0.13 0.09
Megasphaera elsdenii* 1.00 4.07 4.63 3.69 0.86 0.47 0.20
Prevotella spp.* 1.00b 8.54a 1.93ab 0.46b 1.06 0.02 0.84
Lactobacillus spp.* 1.00 0.05 0.33 0.11 0.05 0.12 0.22
Fibrobacter succinogenes* 1.00 0.57 0.28 0.02 0.10 0.27 0.40
Butyrivibrio proteoclasticus* 1.00b 5.42a 2.38ab 1.53b 0.54 < 0.01 0.47
Butyrivibrio fibrisolvens* 1.00b 15.0a 4.83ab 3.61ab 1.60 0.01 0.53
Anaerovibrio lipolytica* 1.00 0.23 0.81 0.34 0.13 0.12 0.15
Total methanogens, 107/mL 4.39a 3.87b 3.91b 3.32c 0.10 < 0.01 < 0.01
Methanobacteriales, 106/mL 3.05a 2.85b 2.81bc 2.67c 0.04 < 0.01 < 0.01
Methanomicrobiales, 106/mL 3.06a 2.89b 2.97b 2.67ab 0.04 0.01 0.13
CON control diet, CAL Coleus amboinicus Lour. diet, SEM standard error of means, L linear response*Relative transcript abundance (ΔΔ CT)Different superscripts (a, b, c) within the same row indicate significant differences (P < 0.05)
Yanza et al. Journal of Animal Science and Biotechnology (2022) 13:5 Page 9 of 19

Table 7 The effect of CAL on in vitro ruminal FA composition (Exp. 1)
Fatty acid, % of total FA CON CAL, % DM SEM P-value
10 15 20 Diet L
Saturated FA
C10:0 0.26 0.31 0.30 0.28 0.02 0.84 0.77
C12:0 1.33 1.30 1.62 1.42 0.07 0.28 0.29
C14:0 1.53 1.51 1.51 1.47 0.04 0.94 0.56
C15:0 1.14 1.13 1.10 1.09 0.03 0.91 0.49
C16:0 21.2 21.3 21.7 20.9 0.20 0.48 0.89
C17:0 0.76 0.72 0.72 0.72 0.02 0.78 0.39
C18:0 41.0a 36.7b 36.5b 33.8b 0.77 < 0.01 < 0.01
C20:0 0.07 0.09 0.08 0.06 0.01 0.63 0.54
C21:0 0.20 0.21 0.18 0.19 0.02 0.95 0.77
C22:0 0.13 0.16 0.16 0.18 0.01 0.46 0.13
C23:0 0.17 0.16 0.14 0.15 0.01 0.82 0.43
C24:0 0.52 0.46 0.45 0.44 0.02 0.17 0.04
Monounsaturated FA
C14:1 0.50 0.48 0.37 0.38 0.03 0.12 0.04
C15:1 0.52 0.62 0.55 0.60 0.03 0.69 0.57
C16:1 0.57 0.77 0.61 0.89 0.06 0.16 0.11
C17:1 0.21 0.23 0.25 0.24 0.02 0.90 0.47
C18:1 trans-10 1.01a 0.80ab 0.65b 0.57b 0.06 0.05 < 0.01
C18:1 trans-11 (VA) 2.40a 1.84b 1.86b 1.67b 0.08 < 0.01 < 0.01
C18:1 cis-9 10.9b 12.9a 13.8a 13.7a 0.37 0.02 < 0.01
C18:1 cis-11 1.14b 1.26ab 1.33a 1.31a 0.03 0.03 < 0.01
C18:1 cis-12 0.14 0.14 0.11 0.12 0.01 0.68 0.37
C18:1 cis-13 0.20 0.14 0.09 0.14 0.02 0.11 0.09
C18:1 cis-14 0.33 0.36 0.37 0.37 0.02 0.85 0.42
C20:1 trans 0.95a 0.89ab 0.87ab 0.81b 0.02 0.05 < 0.01
C24:1 0.15b 0.16b 0.27a 0.28a 0.02 < 0.01 0.03
Polyunsaturated FA
C18:2 cis-12 trans-10 0.23b 0.30a 0.23b 0.32a 0.01 < 0.01 0.04
C18:2 cis-9 trans-11 (RA) 0.09 0.12 0.13 0.09 0.01 0.45 0.99
C18:2 cis-9 cis-12 (LA) 10.5b 12.6a 12.3a 13.0a 0.35 0.04 0.02
C18:3 cis-6 cis-9 cis-12 0.12 0.09 0.10 0.11 0.01 0.43 0.84
C18:3 cis-9cis-12cis-15 (LNA) 1.25b 1.79ab 1.59ab 4.10a 0.35 0.01 < 0.01
C20:2 0.32 0.31 0.32 0.28 0.03 0.96 0.72
C22:2 0.12 0.09 0.10 0.11 0.01 0.65 0.75
∑ SFA 68.3a 64.1b 64.4b 60.7c 0.79 < 0.01 < 0.01
∑ UFA 31.7a 35.9b 35.6b 39.2c 0.79 < 0.01 < 0.01
∑ MUFA 19.0 20.6 20.8 21.2 0.38 0.15 0.04
∑ PUFA 12.6c 15.3b 14.8bc 17.9a 0.55 < 0.01 < 0.01
∑ n-6 11.1b 13.1a 12.8ab 13.5a 0.35 0.04 0.02
∑ n-3 1.25b 1.79b 1.59b 4.10a 0.35 0.01 < 0.01
n-6/n-3 9.11 8.75 8.98 6.94 0.44 0.26 0.11
PUFA/SFA 0.19b 0.25b 0.23b 0.31a 0.01 < 0.01 < 0.01
Yanza et al. Journal of Animal Science and Biotechnology (2022) 13:5 Page 10 of 19

watering and fertilizer application) [7]. The CAL used in thisstudy had higher BAC content than that in Yanza et al. [6]and thus had a more pronounced action in the rumen.
In vitro experiment (10 d RUSITEC fermentation, Exp. 1)The gradual replacement of concentrate by CAL (from10% to 20%) decreased methane production and dimin-ished population of ruminal methanogens. Reduction intotal methanogens (by 24%) and mitigation of CH4 pro-duction (by 51%; CH4/DM substrate) were observed forthe 20% CAL content. Likewise, 20% of CAL in the dieteffectively decreased CH4 production expressed as CH4/digestible DM, CH4/digestible OM and CH4/digestibleNDF by 47%, 50%, and 45% respectively. We have noted
the inhibition of methanogens via a direct toxic antibac-terial effect of BAC, but without adverse effects on rumi-nal fermentation or DM degradability. Despite the toxicaction of BAC on methanogens, no effect on protozoaand ruminal bacteria was observed. Only the lowest levelof CAL (10%) increased the population of the bacteriaPrevotella spp., B. proteoclasticus, and B. fibrisolvens. Adistinct effect of the lowest CAL supplementation wasalso observed in our previous study on Saponaria offici-nalis [26, 27]. We hypothesized that the basic nutrientcomponents of a plant can either interact with BAC orbecome physically less available for microbiota, resultingin a decreased antibacterial activity. Moreover, the anti-methanogenic effect of CAL reduced methanogen
Table 7 The effect of CAL on in vitro ruminal FA composition (Exp. 1) (Continued)
Fatty acid, % of total FA CON CAL, % DM SEM P-value
10 15 20 Diet L
LNA/LA 0.12b 0.14b 0.13b 0.31a 0.03 0.01 < 0.01
∑ C18:1 16.0 17.5 17.9 17.9 0.38 0.21 0.06
∑ C18:1 trans- 3.33a 2.50b 2.59b 2.28b 0.09 < 0.01 < 0.01
∑ C18:1 cis- 12.8b 15.0a 15.3a 15.7a 0.40 0.03 < 0.01
∑ CLA 0.32b 0.42a 0.36ab 0.41a 0.02 0.05 0.11
∑ MCFA 27.0 27.4 27.8 27.1 0.27 0.69 0.83
∑ LCFA 73.0 72.6 72.2 72.8 0.27 0.72 0.69
BH Int 4.31a 3.57b 3.52b 3.31b 0.10 < 0.01 < 0.01
LA BH, % 64.6a 57.2b 56.1b 53.6b 1.26 < 0.01 < 0.01
LNA BH, % 94.2a 92.0a 91.5a 78.1b 1.88 < 0.01 < 0.01
RA/VA 0.05 0.08 0.07 0.07 0.01 0.24 0.44
CON control diet, CAL Coleus amboinicus Lour. diet, SEM standard error of means, L linear response, VA vaccenic acid, RA rumenic acid, SFA saturated fatty acids,MUFA monounsaturated fatty acids, PUFA polyunsaturated fatty acids, LA linoleic acid, MCFA medium-chain fatty acids, LCFA long-chain fatty acids, BH intbiohydrogenation intermediates, CLA conjugated linoleic acids, LA BH, biohydrogenation of linoleic acid, LNA BH biohydrogenation of linolenic acidDifferent superscripts (a, b, c) within the same row indicate significant differences at P < 0.05 and tended to significant at P < 0.10
Table 8 The effect of CAL on ruminal fermentation in cannulated lambs (Exp. 2)
Parameters 0 h 3 h 6 h Group SEM P-value
CON CAL SEM CON CAL SEM CON CAL SEM CON CAL D H D ×H
pH 6.87 7.05 0.09 5.95 6.39 0.06 6.34 6.58 0.04 6.39 6.67 0.05 < 0.01 < 0.01 0.20
NH3, mmol/L 8.75 10.4 0.33 9.34 11.2 0.45 5.85 8.93 0.57 7.98 10.2 0.30 < 0.01 < 0.01 0.27
Total VFA, mmol/L 66.8 67.9 2.77 103.6 101.3 3.83 83.4 86.9 1.50 84.6 85.4 2.36 0.79 < 0.01 0.73
VFA, molar percent
Acetate (A) 71.6 69.8 0.39 66.2 66.4 0.41 67.4 67.7 0.44 68.4 67.9 0.32 0.29 < 0.01 0.08
Propionate (P) 15.6 d 17.5c 0.34 16.3 d 20.1a 0.49 15.7d 18.9b 0.39 15.9 18.8 0.25 < 0.01 < 0.01 0.04
Isobutyrate 0.42 0.61 0.07 0.52 0.93 0.10 0.46 0.76 0.07 0.47 0.77 0.05 < 0.01 0.15 0.61
Butyrate 10.3b 10.5b 0.11 14.9a 11.1b 0.50 14.4a 11.2b 0.51 13.2 11.0 0.28 < 0.01 < 0.01 < 0.01
Isovalerate 1.00 0.75 0.05 0.53 0.41 0.02 0.62 0.44 0.03 0.72 0.53 0.03 < 0.01 < 0.01 0.31
Valerate 1.11c 0.92d 0.04 1.59a 1.07cd 0.07 1.36b 1.03cd 0.07 1.36 1.01 0.04 < 0.01 < 0.01 0.01
A/P ratio 4.61 4.04 0.11 4.07 3.33 0.10 4.29 3.61 0.09 4.33 3.66 0.06 < 0.01 < 0.01 0.71
CON control diet, CAL Coleus amboinicus Lour. diet, SEM standard error of means. D diet, H hour, VFA volatile fatty acidsMeans in the same row indicate significant differences at P < 0.05 and tended to significant at P < 0.10
Yanza et al. Journal of Animal Science and Biotechnology (2022) 13:5 Page 11 of 19

population which in turn lowered the A:P ratio, probablyby shifting the free-hydrogen pathways to propionateproduction.Coleus amboinicus (Lour.) is also a rich source of UFA
with the predominance of α-linolenic acid (LNA). Thehigher fat concentration in CAL than in grass silage (43vs 21 g/kg DM, respectively) may increase the ruminalFA content, and consequently that of LNA. The effect ofCAL in the diet on FA profile in the rumen differedfrom that on bacteria population. Dietary CAL modu-lated the ruminal FA composition by lowering SFA andelevating MUFA and PUFA proportions. The alterationsin MUFA and PUFA profiles suggest the changes in BHprocess in the rumen. Based on the previous study [6],we had assumed that polyphenol compounds of CALorigin (flavonoid, phenolic acids, and diterpenes) canalter the action of the ruminal microbiota involved inBH. For instance, the CAL diet decreased C18:1 transconcentration due to the BH process of LA. High quan-tities of polyphenols and diterpenes reduced the finalBH step of the C18:1 cis-9 and caused a linear decreasein the concentration of stearic acid (C18:0). A similarphenomenon was observed by Vasta et al. [3], whodescribed a negative effect of different polyphenols onC18:0 accumulation in the rumen digesta. Hence,current study results were demonstrate the protectiveaction of CAL on BH of MUFA and PUFA.
Table 9 The effect of CAL on ruminal microbial populations incannulated lambs (Exp. 2)
Parameters Control CAL SEM P-value
Total protozoa, 105/mL 4.43 5.76 0.42 0.06
Holotricha, 105/mL 0.08 0.04 0.01 0.02
Entodiniomorpha, 105/mL 4.35 5.72 0.42 0.07
Total bacteria, 109/mL 4.12 4.37 0.07 0.09
Total methanogens, 108/mL 5.34 4.17 0.18 < 0.01
Methanobacteriales, 107/mL 4.20 3.03 0.16 < 0.01
Methanomicrobiales, 107/mL 3.35 2.97 0.09 0.04
CON control diet, CAL Coleus amboinicus Lour. diet, SEM standard errorof meansMeans in the same row indicate significant differences at P < 0.05 and tendedto significant at P < 0.10
Table 10 Impact of CAL on performance, methane emission,and ruminal fermentation of lambs (Exp. 3)Parameters CON CAL SEM P-value
Body weigth, kg
Inital BW 19.3 19.7 0.66 0.70
Final BW 25.1 26.8 0.53 0.13
ADG, g/d 167 196 9.45 0.14
Total tract digestibility, g/kg
Dry matter 630 649 8.27 0.26
Organic matter 607 604 6.80 0.82
Crude protein 604 601 7.71 0.85
Neutral detergent fiber 577 578 13.3 0.97
Methane emission
CH4, L/d 20.0 15.9 0.11 < 0.01
CO2, L/d 307 274 2.24 < 0.01
CH4/CO2, mL/L 63.6 54.4 0.26 < 0.01
CH4, L/kg DM intake 29.9 21.1 1.44 < 0.01
CH4, L/kg OM intake 32.4 23.3 1.49 < 0.01
CH4, L/kg BW 1.02 0.82 0.05 0.02
Rumen fermentation
pH 6.22 6.35 0.04 0.05
NH3, mmol/L 9.92 15.5 0.64 0.09
Total VFA, mmol/L 112 118 3.70 0.48
VFA, molar percent
Acetate (A) 69.9 68.1 0.51 0.07
Propionate (P) 17.7 19.8 0.46 0.01
Isobutyrate 0.95 0.79 0.05 0.08
Butyrate 9.92 10.2 0.30 0.70
Isovalerate 0.47 0.23 0.05 < 0.01
Valerate 1.06 0.86 0.05 0.04
A/P ratio 3.96 3.46 0.11 0.01
CON control diet, CAL Coleus amboinicus Lour. diet, SEM standard error ofmeans, DM dry matter, OM organic matter, BW body weight, ADG averagedaily gain, VFA volatile fatty acidsMeans in the same row indicate significant differences at P < 0.05 and tendedto significant at P < 0.10
Table 11 The effect of CAL on ruminal microbial populations inlambs (Exp. 3)
Parameters CON CAL SEM P-value
Total protozoa, 105/mL 6.47 8.43 0.45 < 0.01
Holotricha, 105/mL 0.05 0.02 0.01 < 0.01
Entodinomorpha, 105/mL 6.42 8.41 0.46 < 0.01
Total bacteria, 109/mL 4.89 4.77 0.09 0.55
Streptococcus bovis* 1.01 0.83 0.26 0.75
Ruminococcus flavefaciens* 1.00 0.94 0.24 0.91
Ruminococcus albus* 1.00 4.71 0.92 0.06
Megasphaera elsdenii* 1.00 7.68 1.44 0.03
Prevotella spp.* 1.00 3.85 0.86 0.10
Lactobacillus spp.* 1.00 0.10 0.47 0.38
Fibrobacter succinogenes* 1.00 5.60 1.89 0.24
Butyrivibrio proteoclasticus* 1.00 15.9 3.03 0.02
Butyrivibrio fibrisolvens* 1.00 4.55 1.06 0.09
Total methanogens, 108/mL 5.08 3.61 0.28 < 0.01
Methanobacteriales, 107/mL 3.23 2.73 0.12 0.05
Methanomicrobiales, 107/mL 3.08 3.00 0.13 0.75
CON control diet, CAL Coleus amboinicus Lour. diet, SEM standard errorof means*Relative transcript abundance (ΔΔ CT)Means in the same row indicate significant differences at P < 0.05 and tendedto significant at P < 0.10
Yanza et al. Journal of Animal Science and Biotechnology (2022) 13:5 Page 12 of 19
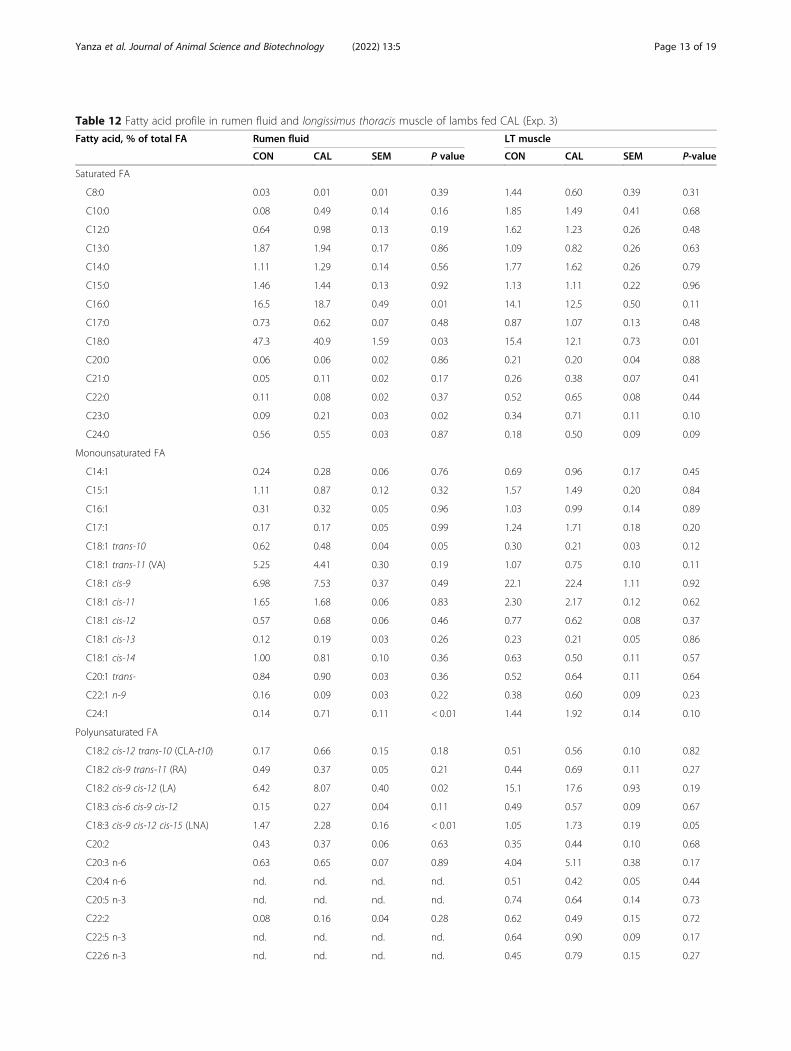
Table 12 Fatty acid profile in rumen fluid and longissimus thoracis muscle of lambs fed CAL (Exp. 3)
Fatty acid, % of total FA Rumen fluid LT muscle
CON CAL SEM P value CON CAL SEM P-value
Saturated FA
C8:0 0.03 0.01 0.01 0.39 1.44 0.60 0.39 0.31
C10:0 0.08 0.49 0.14 0.16 1.85 1.49 0.41 0.68
C12:0 0.64 0.98 0.13 0.19 1.62 1.23 0.26 0.48
C13:0 1.87 1.94 0.17 0.86 1.09 0.82 0.26 0.63
C14:0 1.11 1.29 0.14 0.56 1.77 1.62 0.26 0.79
C15:0 1.46 1.44 0.13 0.92 1.13 1.11 0.22 0.96
C16:0 16.5 18.7 0.49 0.01 14.1 12.5 0.50 0.11
C17:0 0.73 0.62 0.07 0.48 0.87 1.07 0.13 0.48
C18:0 47.3 40.9 1.59 0.03 15.4 12.1 0.73 0.01
C20:0 0.06 0.06 0.02 0.86 0.21 0.20 0.04 0.88
C21:0 0.05 0.11 0.02 0.17 0.26 0.38 0.07 0.41
C22:0 0.11 0.08 0.02 0.37 0.52 0.65 0.08 0.44
C23:0 0.09 0.21 0.03 0.02 0.34 0.71 0.11 0.10
C24:0 0.56 0.55 0.03 0.87 0.18 0.50 0.09 0.09
Monounsaturated FA
C14:1 0.24 0.28 0.06 0.76 0.69 0.96 0.17 0.45
C15:1 1.11 0.87 0.12 0.32 1.57 1.49 0.20 0.84
C16:1 0.31 0.32 0.05 0.96 1.03 0.99 0.14 0.89
C17:1 0.17 0.17 0.05 0.99 1.24 1.71 0.18 0.20
C18:1 trans-10 0.62 0.48 0.04 0.05 0.30 0.21 0.03 0.12
C18:1 trans-11 (VA) 5.25 4.41 0.30 0.19 1.07 0.75 0.10 0.11
C18:1 cis-9 6.98 7.53 0.37 0.49 22.1 22.4 1.11 0.92
C18:1 cis-11 1.65 1.68 0.06 0.83 2.30 2.17 0.12 0.62
C18:1 cis-12 0.57 0.68 0.06 0.46 0.77 0.62 0.08 0.37
C18:1 cis-13 0.12 0.19 0.03 0.26 0.23 0.21 0.05 0.86
C18:1 cis-14 1.00 0.81 0.10 0.36 0.63 0.50 0.11 0.57
C20:1 trans- 0.84 0.90 0.03 0.36 0.52 0.64 0.11 0.64
C22:1 n-9 0.16 0.09 0.03 0.22 0.38 0.60 0.09 0.23
C24:1 0.14 0.71 0.11 < 0.01 1.44 1.92 0.14 0.10
Polyunsaturated FA
C18:2 cis-12 trans-10 (CLA-t10) 0.17 0.66 0.15 0.18 0.51 0.56 0.10 0.82
C18:2 cis-9 trans-11 (RA) 0.49 0.37 0.05 0.21 0.44 0.69 0.11 0.27
C18:2 cis-9 cis-12 (LA) 6.42 8.07 0.40 0.02 15.1 17.6 0.93 0.19
C18:3 cis-6 cis-9 cis-12 0.15 0.27 0.04 0.11 0.49 0.57 0.09 0.67
C18:3 cis-9 cis-12 cis-15 (LNA) 1.47 2.28 0.16 < 0.01 1.05 1.73 0.19 0.05
C20:2 0.43 0.37 0.06 0.63 0.35 0.44 0.10 0.68
C20:3 n-6 0.63 0.65 0.07 0.89 4.04 5.11 0.38 0.17
C20:4 n-6 nd. nd. nd. nd. 0.51 0.42 0.05 0.44
C20:5 n-3 nd. nd. nd. nd. 0.74 0.64 0.14 0.73
C22:2 0.08 0.16 0.04 0.28 0.62 0.49 0.15 0.72
C22:5 n-3 nd. nd. nd. nd. 0.64 0.90 0.09 0.17
C22:6 n-3 nd. nd. nd. nd. 0.45 0.79 0.15 0.27
Yanza et al. Journal of Animal Science and Biotechnology (2022) 13:5 Page 13 of 19

In vivo experiments: Exp. 2 with cannulated lambs andExp. 3 with growing lambsRuminal fermentation parameters of growing lambs re-ceiving 20% of CAL corroborated the results of thecurrent in vitro study. The CAL diet containing 4.08 g oftotal polyphenols per kg of DM and 3.96 g of total diter-penes per kg of DM, mitigated methane emission (L/dand L/DM intake) by 20% and 29%, respectively, and didnot interfere with DM, OM, or NDF digestibility. De-creases in CH4 production are usually associated with
adverse effects on fiber digestibility [28]. However, CH4
mitigation was directly linked to the reduction in totalmethanogen and Methanobacteriales (in both, cannu-lated and growing lambs) as well as in Methanomicro-biales populations (in the cannulated lambs) rather thanto the reduction of carbohydrate digestibility [25].Supplementing the diet with 20% of CAL had a posi-
tive effect on the total protozoa in the rumen of growinglambs. The effect was also more pronounced for a fewparticular bacterial species (namely R. albus, M. elsdenii,
Table 12 Fatty acid profile in rumen fluid and longissimus thoracis muscle of lambs fed CAL (Exp. 3) (Continued)
Fatty acid, % of total FA Rumen fluid LT muscle
CON CAL SEM P value CON CAL SEM P-value
∑ SFA 70.5 67.3 0.96 0.10 40.8 34.9 1.24 0.01
∑ UFA 29.5 32.7 0.96 0.10 59.2 65.1 1.24 0.01
∑ MUFA 18.7 20.1 0.60 0.66 34.3 35.1 0.95 0.70
∑ PUFA 10.8 12.5 0.51 < 0.01 24.9 30.0 1.01 0.07
∑ n-6 8.90 9.72 0.42 0.02 21.6 25.2 1.23 0.17
∑ n-3 1.47 2.28 0.16 < 0.01 2.88 4.06 0.31 0.07
n-6/n-3 6.05 4.37 0.39 0.02 7.86 6.74 0.73 0.47
PUFA/SFA 0.15 0.19 0.01 0.07 0.62 0.86 0.05 0.01
LNA/LA 0.21 0.30 0.02 0.02 0.07 0.10 0.01 0.31
∑ C18:1 15.7 16.8 0.64 0.45 27.4 26.8 1.22 0.81
∑ C18:1 trans- 5.48 5.08 0.28 0.52 1.37 0.96 0.11 0.06
∑ C18:1 cis- 10.2 11.7 0.58 0.23 26.1 25.8 1.19 0.94
∑ CLA 0.64 0.99 0.19 0.36 0.95 1.61 0.18 0.04
∑ MCFA 23.3 26.3 0.94 0.12 26.3 22.8 1.25 0.17
∑ LCFA 76.7 73.7 0.94 0.12 73.7 77.2 1.25 0.17
BH intermediates 7.81 7.76 0.46 0.95 nd. nd. nd. nd.
LA BH, % 74.2 67.6 1.58 0.03 nd. nd. nd. nd.
LNA BH, % 94.4 91.5 0.61 < 0.01 nd. nd. nd. nd.
RA/VA 0.08 0.11 0.02 0.50 nd. nd. nd. nd.
Desaturation index (DI) Δ9 nd. nd. nd. nd. 0.41 0.47 0.01 0.01
DΔ9. C14:1/C14:0 nd. nd. nd. nd. 0.29 0.37 0.06 0.50
DΔ9. 16:1/16:0 nd. nd. nd. nd. 0.07 0.07 0.01 0.85
DΔ9. 18:1/18:0 nd. nd. nd. nd. 0.59 0.65 0.01 0.01
DΔ9. RA/VA nd. nd. nd. nd. 0.27 0.48 0.06 0.04
DΔ9. MUFA/SFA nd. nd. nd. nd. 0.46 0.50 0.01 0.08
DΔ5. n-6. 20:4n-6/20:3n-6 nd. nd. nd. nd. 0.12 0.08 0.01 0.11
DΔ5. D6. n-6. 20:4n-6/18:3n-6 nd. nd. nd. nd. 0.53 0.43 0.06 0.43
DΔ4. n-3. 22:6n-3/22:5n-3 nd. nd. nd. nd. 0.33 0.41 0.06 0.53
Elongase index nd. nd. nd. nd. 0.71 0.72 0.01 0.92
Thrombogenic index nd. nd. nd. nd. 0.85 0.62 0.05 < 0.01
Atherogenicity index nd. nd. nd. nd. 0.63 0.48 0.03 0.03
CON control diet, CAL Coleus amboinicus Lour. diet, SEM standard error of means, SFA saturated fatty acids, UFA unsaturated fatty acids, MUFA monounsaturatedfatty acids, PUFA polyunsaturated fatty acids, BH biohydrogenation, LNA linolenic acid, RA rumenic acid, VA vaccenic acid, LA linoleic acid, MCFA medium-chainfatty acids, LCFA long-chain fatty acids, nd. not determinedMeans in the same row indicate significant differences at P < 0.05 and tended to significant at P < 0.10
Yanza et al. Journal of Animal Science and Biotechnology (2022) 13:5 Page 14 of 19
B. proteoclasticus, and B. fibrisolvens) than for the totalbacteria. Increases in the number of several ruminal bac-teria in heifers due to supplementation of BACs like fla-vonoids were also reported by De Nardi et al. [29]. Onthe other hand, diet formula affects qualitative andquantitative compositions of the rumen microbial popu-lation. Higher DM intake of grass silage in CAL diet
(507 g/d/animal; 379 g/d/animal in CON) caused the riseof fibrolytic bacteria and protozoa populations. Suchphenomenon elucidates coordinated activity of bacteriasuch as F. succinogenes, R. albus, and B. fibrisolvens andprotozoa for proper fiber digestion [3, 30]. However, inthe present study, neither digestibility nor total VFAconcentration was affected, although alterations in
Fig. 1 Comparison of gene expressions in longissimus thoracis muscle of lambs receiving CON and CAL diet. Legends: (CON; white colour); CALdiet (CAL; grey colour); Gene expressions are fatty acid desaturase 1 (FADS1), fatty acid elongase 5 (ELOVL5), fatty acid synthase (FASN), lipoproteinlipase (LPL), and stearoyl-CoA desaturase (SCD) in the longissimus thoracis muscle of growing lambs. The symbol * indicates significant differencebetween treatments (P < 0.05)
Table 13 The longissimus thoracis muscle quality and characteristics of lambs fed CAL (Exp. 3)
Trait Unit Treatments SEM P-value
CON (n = 8) CAL (n = 8)
Muscle pH 24 h post mortem pH units 5.58 5.69 0.05 0.39
L*, lightness units 41.4 37.0 0.88 0.01
a*, redness units 12.1 13.2 0.31 0.09
b*, yellowness units 4.81 4.65 0.36 0.84
Water-holding capacity, % 38.6 29.5 1.69 < 0.01
Watercontent, % 72.9 73.3 0.24 0.40
Intramuscular fat content, % 2.58 2.36 0.07 0.13
Total protein content, % 23.3 23.0 0.25 0.58
Ash content, % 1.16 1.13 0.01 0.09
Sensory evaluations
Aroma 1–5 4.28 4.29 0.05 0.85
Juiciness 1–5 4.19 4.57 0.08 0.01
Tenderness 1–5 4.15 4.36 0.07 0.13
Flavor 1–5 4.07 4.31 0.07 0.06
Subjective visual evaluations
Color 1–8 2.38 2.56 0.10 0.38
Marbling 1–4 1.59 1.53 0.06 0.63
CON control diet, CAL Coleus amboinicus Lour. diet, SEM standard error of meansMeans in the same row indicate significant differences at P < 0.05 and tended to significant at P < 0.10
Yanza et al. Journal of Animal Science and Biotechnology (2022) 13:5 Page 15 of 19
individual VFAs, such as propionic acid, were noted.The high proportion of propionate was not linked withthe abundance of S. bovis, the amylolytic bacteria re-sponsible for production of this VFA. The possibilitycannot be however excluded that other amylolytic bac-teria, not investigated in this study, were not affected.Moreover, changes in nitrogen metabolizing bacteriapopulation i.e., B. proteoclasticus and B. fibrisolvens wereobserved. It should be emphasized that CAL is rich intotal protein (214 g/kg DM), and thus may be a perfectsubstrate for N metabolism in the rumen. The excessiveprotein of CAL origin may provide a high soluble frac-tion of total protein to the ration, which can directlystimulate ammonia production by the rumen bacteria, aphenomenon also observed in the present study.In the in vivo experiments, higher values of ruminal
pH were noticed. This result corroborated that of Bal-cells et al. [31] who reported higher pH after supple-menting dairy cow diet with flavonoids. Microbialactivity is affected by the properties of the substrate, andhigher starch levels in the diet usually reduce the pH ofthe rumen fluid [32]. According to Balcells et al. [31],flavonoid supplementation may improve rumen fermen-tation and reduce the incidence of rumen acidosis. Thepresent study confirmed this activity of CAL flavonoids(2.21 g/kg DM) by demonstrating increased pH values inthe lamb rumen. It should be realized that the CAL con-tained three types of BAC with distinct activities: flavo-noids, diterpenes and phenolic acids but the mechanismdescribed above is typical for flavonoids. Such flavonoidactivity partially explains the findings of the presentstudy on the increased number of lactate-consuming mi-croorganisms (e.g., M. elsdenii). Another mechanismthat may stabilize the pH is the fluctuations of protozoacommunity. According to Hartinger et al. [33], protozoaincorporate starch granules that are not metabolized toorganic acids quickly. Thus, protozoa prevent significantpH drops and support stable fermentation conditions inthe rumen. In the present study, the Entodiniomorphapopulation significantly increased (Table 11), whereasthat of Holotricha diminished consistently (Tables 9 and11). Similar trends were described in short-term study[6], so we can assume that this mode of CAL action isstable for a longer period.CAL diet positively altered ruminal PUFA proportion
in the growing lambs, which can mainly be attributed tothe increase in C18:3 cis-9 cis-12 cis-15 FAs in therumen fluid and meat (Table 12). Although the majorityof bacterial communities involved in BH increased innumber, BH of C18 UFA into stearic acid (C18:0) waslower due to CAL intake. A similar result was reportedby Vasta et al. [3], who, regardless of the type of poly-phenol supplementation, observed a reduction in rumi-nal C18:0 and an increase in C18:1 trans-11 (VA) and
C18:2 cis-9 trans-11 (CLA) isomers. The stability of themain BH isomers and the distinct responses of two bac-teria species involved in BH process (B. fibrisolvens andB. proteoclasticus) observed in the present study can alsodemonstrate some other properties of polyphenols. Thereduction of BH by CAL diet despite greater populationsof BH bacteria may suggest that CAL may reduce thecontent of free FA, substrates to BH process due to de-creased lipolysis [2]. Besides, a reduction in the numbersof several bacteria species involved in BH, such as Neis-seria weaverii, R. amylophilus, and other unclassifiedbacteria related to the Lachnospiraceae and Pasteurella-ceae families were observed [34]. In this study, the po-tential restriction on BH may be supported by the factthat the rumen and meat displayed similar alterations inthe FA profile, which likely suggests that the rumen wasthe locus of the main changes.The oxidative process can shorten the shelf life of
fresh meat and negatively affect its consumption by theformation of off-flavors and discoloration [35]. The sen-sor attributes, likes juiciness and taste, are generally as-sociated with the consumers’ preferences [36]. In thisstudy, we observed improved meat characteristics suchas juiciness or taste. The better meat sensory quality(Table 13) combined with improved indices of thrombo-genicity (TI) and atherogenicity (AI) indexes (Table 12)may help to encourage consumers to select quality meatin the future. Tannin-containing diets sometimes reduce[37] or unchanged [38] tenderness and juiciness of meatdepending upon the doses. In this study, juiciness andflavor of lamb meat increased, which would be advanta-geous from consumer perspectives. It has been suggestedthat phenolic compounds may stimulate calpain activityand thus degradation of myofibrillar proteins in carcasspostmortem, leading to increased juiciness and tender-ness of meat [39, 40]. Moreover, polyphenol inclusion inruminants’ diet may cause different effects on the meatcolor. Priolo et al. [41] evaluated the effect of tannin inlambs and stated that the longissimus muscle was lighter(lower L*) in tannin-fed group. The lower lightness andgreater redness of color in the present study were influ-enced by the CAL mineral content, which was not deter-mined in this study. Damanik et al. [42] reported thatthe CAL contains high concentration of iron (Fe). Garget al. [43] stated that the inclusion of tannin in the ani-mal diets do not hamper the utilization of iron for thehemoglobin synthesis. Moreover, polyphenols with highantioxidant activities may reduce the oxidation of myo-globin leading to increase the redness of meat [35]. In-creased redness of meat has also been reported due tofeeding of polyphenol-rich plants [40, 44].Transcript analysis performed in the present study in-
cluded a panel of five genes of known functions in FAmetabolism in ruminant muscles [45]. Three of the
Yanza et al. Journal of Animal Science and Biotechnology (2022) 13:5 Page 16 of 19

genes (FASN, SCD, and ELOVL5) control the denovo synthesis and elongation of FA, whereas theLPL and FADS1 genes are involved in FA transport.Meat from lambs fed the CAL diet was characterizedby a significant reduction in the mRNA content offour genes (FASN, SCD, LPL, and FADS1), whereasno changes were observed for the ELOVL5 tran-script. However, considering the complexity of theentire gene expression processes and the great varia-tions in transcript lifespans, any conclusions must bedrawn with caution. Alterations in the transcript ex-pression of genes regulating lipid metabolism wasnot reflected in the profile of FA controlled by thosegenes. For example, the reduced mRNA level of theSCD gene was not accompanied by a lower level ofC18:1 cis-9. According to Garnsworthy et al. [46],the level of C18:1 cis-9 in the fat of ruminant prod-ucts is highly dependent upon the SCD gene control-ling de novo FA synthesis. Besides, the lack ofdifference in C18:1 cis-9 concentration in responseto CAL diet containing 4.08 g of total polyphenolsper kg of DM and 3.96 g of total diterpenes per kgof DM may suggest that the synthesis of endogenousFA was unaffected. On the other hand, the reducedtranscript levels of the LPL gene may be associatedwith the decreased biosynthesis of MUFA. The lackof alteration in the mRNA content of the ELOVL5gene regulating FA elongation and the increased n-3concentration (mainly LNA) in meat may reflect n-3metabolism in the rumen, rather than that in mus-cles. The reduced transcript content of another twogenes -FADS1 and FASN- may be linked to the in-hibition of the initial stages of the BH process.Pewan et al. [47] suggested that the FASN proteincomplex controls de novo biosynthesis of long-chainFA and affects FA deposition in meat, adipose tissue,and milk. The published evidence on the correlationsbetween n-3 PUFA profile, the activity of lipogenicgenes (such as FASN), and meat quality, however, isvery limited [47]. Nevertheless, the n-3 PUFA profileof the meat of lambs fed CAL was improved, whichsuggests that changes in the FA profile had alreadyoccurred in the rumen, leading to more PUFA beingavailable to the tissue. Higher n-3 PUFA levels inmeat are beneficial to human health and supportcardiovascular, retinal, and brain functions [48, 49].Positive changes in the FA profile of meat from theexperimental lambs increased its quality but highercontent of PUFAs could decrease the meat shelf lifedue to a rapid oxidization of FAs ensuing from twoor more double bonds in their structure [50]. How-ever, an important aspect is the improvement ofpostmortem characteristics and nutritional quality ofmeat from lambs fed CAL supplemented diet.
ConclusionsIn conclusions, polyphenols of CAL origin reduce CH4
production, which is associated with diminished Archaeacommunities. Consistent effects of CAL polyphenols onthe final products of ruminal fermentation and loweringthe A/P ratio were noted in both in vitro and in vivo ex-periments. Moreover, the CAL diet increased lambs’ nu-trient intakes with no alteration in ruminal digestibility.Such CAL mode of action also affected ruminal bacteriainvolved in fermentation and BH what caused an in-crease in LNA concentration and ultimately increase de-position of n-3 PUFA. Consequently, 20% of CALimproved the meat characteristics and nutritional qualitywithout negative effects on rumen fermentation andgrowth performance. Considering the diverse propertiesof Coleus amboinicus Lour., it can be an alternative feedto reduce greenhouse gas emissions and to improve thequality of ruminant products. This study shows that theuse of dietary CAL could be useful for sustainable ru-minant production in tropical areas as well as otherparts of world for improving nutrition, reducing envir-onmental issues and improving ruminant-derived foodproducts.
AbbreviationsADG: Average daily gain; AI: Atherogenicity; aNDF: Ash free NDF; A/Pratio: Acetate/Propionate ratio; BAC: Biologically active compounds;BH: Biohydrogenation; BW: Body weight; CAL: Coleus amboinicus Lour;CH4: Methane emission; CO2: Carbon dioxide emission; CLA: Conjugatedlinoleic acid; CP: Crude protein; DΔ: Desaturation Δ at –n; DAPI: 4,6-diamidino-2-phenylindole; DI: Desaturation index; DM: Dry matter; DMD: Drymatter digestibility; DMI: Dry matter intake; DNA: Deoxyribonucleic acids;EE: Ether extract; EI: Elongase index; ELOVL5: Fatty acid elongase 5; FA: Fattyacids; FADS1: Fatty acid desaturase 1; FASN: Fatty acid synthase;FISH: Fluorescence in situ hybridization; IVDMD: in vitro dry matterdigestibility; LA: α-Linoleic acids; LCFA: Long chain fatty acids; LT: Longissimusthoracis; LNA: α-Linolenic acids; LPL: Lipoprotein lipase; MCFA: Medium chainfatty acids; mRNA: Messenger-RNA; MUFA: Monounsaturated fatty acids;NDFD: Neutral detergent fibre digestibility; NH3: Ammonia; OM: Organicmatter; PBS: Phosphate-buffered saline; PUFA: Polyunsaturated fatty acids;qPCR: Quantitative PCR; RA: Rumenic acid; RTA: Relative transcript abundance(ΔΔ CT); RUSITEC: Rumen simulation technique; SCD: Stearoyl-CoAdesaturase;SFA: Saturated fatty acids; SPE: Solid phase extraction; TI: Thrombogenicity;UFA: Unsaturated fatty acids; VA: Vaccenic acid; VFA: Volatile fatty acids
AcknowledgementsThe authors are grateful to the Polish National Agency for AcademicExchange (NAWA) for awarded YRY the Ignacy Lukasiewicz scholarship(NAWA 015/IL/1617). The authors are grateful to Magda Bryszak, HaihaoHuang, Min Gao and Sylwia Inglot for their technical assistance.
Authors’ contributionsYRY designed the study protocol, provided laboratory analysis, helped withstatistical analyses, interpreted the data and wrote first version of themanuscript. MSz interpreted the data and improved the manuscript. DLinterpreted the data, reviewed and improved the manuscript. SS providedlaboratory analysis of plants’ phenolic acid, flavonoid, and diterpenoidcontents. PK performed the laboratory analysis. AKP interpreted the data,revised the content substantially and reviewed the manuscript. ZV providedlaboratory analysis of rumen fluid. DLi provided laboratory analysis of meat.MV interpreted the data and collected references for discussion. ACdesigned the study protocol, interpreted the data, wrote the manuscript,and finally reviewed the manuscript. All authors read and approved the finalmanuscript.
Yanza et al. Journal of Animal Science and Biotechnology (2022) 13:5 Page 17 of 19

FundingThis study was funded by the National Science Centre funding programGrant 2018/31/N/NZ9/01589.
Availability of data and materialsThe experimental datasets of the present study can be obtained from thecorresponding author on reasonable request.
Declarations
Ethics approval and consent to participateAll experimental procedures were performed in accordance with theguidelines of the National Ethical Commission for Animal Research (Ministryof Science and Higher Education, Poland). The study was approved by theLocal Ethical Commission of Poznan University of Life Sciences (licensepermit no. 35/2019).
Competing interestsThe authors declare that they have no competing interests.
Author details1Department of Animal Nutrition, Faculty of Veterinary Medicine and AnimalScience, Poznań University of Life Sciences, 60-637 Poznań, Poland.2Department of Biology Education, Universitas Islam Riau, Jl. KaharuddinNasution 113, Pekanbaru 28284, Indonesia. 3Department of Genetics andAnimal Breeding, Poznań University of Life Sciences, Wołyńska 33, 60-637Poznań, Poland. 4Department of Pharmaceutical Biology and Botany,Wrocław Medical University, 50-556 Wrocław, Poland. 5Department of AnimalPhysiology and Biochemistry, Faculty of Veterinary Medicine and AnimalScience, Poznań University of Life Sciences, 60-637 Poznań, Poland.6Department of Animal Nutrition, West Bengal University of Animal andFishery Sciences, Belgachia, K.B. Sarani 37, Kolkata 700037, India. 7Institute ofAnimal Physiology, Centre of Biosciences of Slovak Academy of Sciences,Šoltésovej 4-6, 040 01 Košice, Slovak Republic. 8Department of Meat and FatTechnology, Wacław Dąbrowski Institute of Agricultural and FoodBiotechnology, Rakowiecka 36, 02-532 Warszawa, Poland. 9Zist Dam Group,University Incubator Center, University of Zanjan, Zanjan 45371-38791, Iran.
Received: 27 June 2021 Accepted: 21 November 2021
References1. Lan W, Yang C. Ruminal methane production: associated
microorganisms and the potential of applying hydrogen-utilizingbacteria for mitigation. Sci Total Environ. 2019;654:1270–83. https://doi.org/10.1016/j.scitotenv.2018.11.180.
2. Buccioni A, Decandia M, Minieri S, Molle G, Cabiddu A. Lipid metabolism inthe rumen: new insights on lipolysis and biohydrogenation with anemphasis on the role of endogenous plant factors. Anim Feed Sci Technol.2012;174(1-2):1–25. https://doi.org/10.1016/j.anifeedsci.2012.02.009.
3. Vasta V, Daghio M, Cappucci A, Buccioni A, Serra A, Viti C, et al. Invitedreview: plant polyphenols and rumen microbiota responsible for fatty acidbiohydrogenation, fiber digestion, and methane emission: experimentalevidence and methodological approaches. J Dairy Sci. 2019;102(5):3781–804.https://doi.org/10.3168/jds.2018-14985.
4. Tullo E, Finzi A, Guarino M. Review: environmental impact of livestockfarming and precision livestock farming as a mitigation strategy. SciTotal Environ. 2019;650(Pt 2):2751–60. https://doi.org/10.1016/j.scitotenv.2018.10.018.
5. Bryszak M, Szumacher-Strabel M, El-Sherbiny M, Stochmal A, Oleszek W, RojE, et al. Effects of berry seed residues on ruminal fermentation, methaneconcentration, milk production, and fatty acid proportions in the rumenand milk of dairy cows. J Dairy Sci. 2019;102(2):1257–73. https://doi.org/10.3168/jds.2018-15322.
6. Yanza YR, Szumacher-Strabel M, Bryszak M, Gao M, Kolodziejski P, StochmalA, et al. Coleus amboinicus (Lour.) leaves as a modulator of ruminalmethanogenesis and biohydrogenation in vitro. J Anim Sci. 2018;96(11):4868–81. https://doi.org/10.1093/jas/sky321.
7. Ślusarczyk S, Cieślak A, Yanza YR, Szumacher-Strabel M, Varadyova Z,Stafiniak M, et al. Phytochemical profile and antioxidant activities of Coleus
amboinicus Lour. cultivated in Indonesia and Poland. Molecules. 2021;26(10):2915. https://doi.org/10.3390/molecules26102915.
8. Kozłowska M, Cieslak A, Jozwik A, El-Sherbiny M, Gogulski M, Lechniak D,et al. Effects of partially replacing grass silage by lucerne silage cultivars in ahigh-forage diet on ruminal fermentation, methane production, and fattyacid composition in the rumen and milk of dairy cows. Anim Feed SciTechnol. 2021;277:114959. https://doi.org/10.1016/j.anifeedsci.2021.114959.
9. IZ-INRA. Research Institute of Animal Production. Standards for Cattle, Sheepand Goat Nutrition (in Polish). Warszawa (Poland): Omnitech Press; 1993p 1-102.
10. Grau R, Hamm R. Eine einfache mathodezur bestimmung derwasserbindung in fleisch. Fleischwirtschaft. 1952;4:295–7.
11. Pohja NS, Ninivaara FP. Die Bestimmung der wasserbindung desfleischesmittels der konstandrückmethods. Fleischwirschaft. 1957;9:193–5.
12. Barylko-Pikielna N. Zarysanalizy sensorycznej żywności (outline of foodsensory analysis). Warszawa (Poland): Wydawnictwo Naukowo-Techniczne;1975.
13. AOAC. Official methods of analysis of AOAC international. 18th ed.Gaithersburg: MD AOAC International; 2007.
14. Van Soest PJ, Robertson JB, Lewis BA. Methods for dietary fiber, neutraldetergent fiber, and nonstarch polysaccharides in relation to animalnutrition. J Dairy Sci. 1991;74(10):3583–97. https://doi.org/10.3168/jds.S0022-0302(91)78551-2.
15. Varadyova Z, Kisidayova S, Cobanova K, Gresakova L, Babjak M, Konigova A,et al. The impact of a mixture of medicinal herbs on ruminal fermentation,parasitological status and hematological parameters of the lambsexperimentally infected with Haemonchus contortus. Small Rumin Res. 2017;151:124–32. https://doi.org/10.1016/j.smallrumres.2017.04.023.
16. Michalowski T, Harmeyer J, Breves G. The passage of protozoa from thereticulo-rumen through the omasum of sheep. Br J Nutr. 1986;56(3):625–34.https://doi.org/10.1079/bjn19860143.
17. Yu Y, Lee C, Kim J, Hwang S. Group-specific primer and probe sets to detectmethanogenic communities using quantitative real-time polymerase chainreaction. Biotechnol Bioeng. 2005;89(6):670–9. https://doi.org/10.1002/bit.20347.
18. Zeng J, Bian Y, Xing P, Wu QL. Macrophyte species drive the variation ofbacterioplankton community composition in a shallow freshwater lake. ApplEnviron Microbiol. 2012;78(1):177–84. https://doi.org/10.1128/AEM.05117-11.
19. Wang RF, Cao WW, Cerniglia CE. PCR detection of Ruminococcus spp. inhuman and animal faecal samples. Mol Cell Probes. 1997;11(4):259–65.https://doi.org/10.1006/mcpr.1997.0111.
20. Poeker SA, Geirnaert A, Berchtold L, Greppi A, Krych L, Steinert RE, et al.Understanding the prebiotic potential of different dietary fibers using anin vitro continuous adult fermentation model (PolyFermS). Sci Rep. 2018;8(1):1–12. https://doi.org/10.1038/s41598-018-22438-y.
21. Denman SE, McSweeney CS. Development of a real-time PCR assay formonitoring anaerobic fungal and cellulolytic bacterial populations withinthe rumen. FEMS Microbiol Ecol. 2006;58(3):572–82. https://doi.org/10.1111/j.1574-6941.2006.00190.x.
22. Potu RB, Abu Ghazaleh AA, Hastings D, Jones K, Ibrahim SA. The effect oflipid supplements on ruminal bacteria in continuous culture fermentersvaries with the fatty acid composition. J Microbiol. 2011;49(2):216–23.https://doi.org/10.1007/s12275-011-0365-1.
23. Li M, Penner GB, Hernandez-Sanabria E, Oba M, Guan LL. Effects of samplinglocation and time, and host animal on assessment of bacterial diversity andfermentation parameters in the bovine rumen. J Appl Microbiol. 2009;107(6):1924–34. https://doi.org/10.1111/j.1365-2672.2009.04376.x.
24. Minuti A, Palladino A, Khan MJ, Alqarni S, Agrawal A, Piccioli-Capelli F, et al.Abundance of ruminal bacteria, epithelial gene expression, and systemicbiomarkers of metabolism and inflammation are altered during theperipartal period in dairy cows. J Dairy Sci. 2015;98L(12):8940–51. https://doi.org/10.3168/jds.2015-9722.
25. Urrutia O, Soret B, Insausti K, Mendizabal JA, Purroy A, Arana A. The effectsof linseed or chia seed dietary supplementation on adipose tissuedevelopment, fatty acid composition, and lipogenic gene expression inlambs. Small Rumin Res. 2015;123(2-3):204–11. https://doi.org/10.1016/j.smallrumres.2014.12.008.
26. Sitarek P, Toma M, Ntungwe E, Kowalczyk T, Skala E, Wieczfinska J, et al.Insight the biological activities of selected abietane diterpenes isolated fromPlectranthus spp. Biomolecules. 2020;10(2):1–13. https://doi.org/10.3390/biom10020194.
Yanza et al. Journal of Animal Science and Biotechnology (2022) 13:5 Page 18 of 19

27. Cieslak A, Zmora P, Stochmal A, Pecio L, Oleszek W, Pers-Kamczyc E, et al.Rumen antimethanogenic effect of Saponaria officinalis L. phytochemicalsin vitro. J Agric Sci. 2014;152(6):981–93. https://doi.org/10.1017/S0021859614000239.
28. Patra AK, Yu Z. Effective reduction of enteric methane production by acombination of nitrate and saponin without adverse effect on feeddegradability, fermentation, or bacterial and archaeal communities of therumen. Bioresour Technol. 2013;148:352–60. https://doi.org/10.1016/j.biortech.2013.08.140.
29. De Nardi R, Marchesini G, Li S, Khafipour E, Plaizier KJC, Gianesella M, et al.Metagenomic analysis of rumen microbial population in dairy heifers fed ahigh grain diet supplemented with dicarboxylic acids or polyphenols. BMCVet Res. 2016;12(1):1–9. https://doi.org/10.1186/s12917-016-0653-4.
30. Krause DO, Denman SE, Mackie RI, Morrison M, Rae AL, Attwood GT, et al.Opportunities to improve fiber degradation in the rumen: microbiology,ecology, and genomics. FEMS Microbiol Rev. 2003;27(5):663–93. https://doi.org/10.1016/S0168-6445(03)00072-X.
31. Balcells J, Aris A, Serrano A, Seradj AR, Crespo J, Devant M. Effects of anextract of plant flavonoids (bioflavex) on rumen fermentation andperformance in heifers fed high-concentrate diets. J Anim Sci. 2012;90(13):4975–84. https://doi.org/10.2527/jas.2011-4955.
32. Ungerfeld EM. Metabolic hydrogen flows in rumen fermentation: principlesand possibilities of interventions. Front Microbiol. 2020;11:589. https://doi.org/10.3389/fmicb.2020.00589.
33. Hartinger T, Gresner N, Sudekum KH. Does intra-ruminal nitrogen recyclingwaste valuable resources? A review of major players and their manipulation.J Anim Sci Biotechnol. 2018;9:33. https://doi.org/10.1186/s40104-018-0249-x.
34. Buccioni A, Pauselli M, Minieri S, Roscini V, Mannelli F, Rapaccini S, et al.Chestnut or quebracho tannins in the diet of grazing ewes supplementedwith soybean oil: effects on animal performances, blood parameters andfatty acid composition of plasma and milk lipids. Small Rumin Res. 2017;153:23–30. https://doi.org/10.1016/j.smallrumres.2017.05.006.
35. Forman H, Davies K, Ursini F. How do nutritional antioxidants really work:nucleophilic tone and Para-hormesis versus free radical scavenging in vivo.Free Radic Biol Med. 2014;66:24–35. https://doi.org/10.1016/j.freeradbiomed.2013.05.045.
36. Font-i-Furnols M, Guerrero L. Consumer preference, behavior andperception about meat and meat products: an overview. Meat Sci. 2014;98(3):361–71. https://doi.org/10.1016/j.meatsci.2014.06.025.
37. Francisco A, Alves SP, Portugal PV, Dentinho MT, Jerónimo E, Sengo S, et al.Effects of dietary inclusion of citrus pulp and rockrose soft stems and leaveson lamb meat quality and fatty acid composition. Animal. 2018;12(4):872–81. https://doi.org/10.1017/S1751731117002269.
38. Dentinho MTP, Paulos K, Francisco A, Belo AT, Jerónimo E, Almeida J, et al.Effect of soybean meal treatment with Cistus ladanifer condensed tannins ingrowth performance, carcass and meat quality of lambs. Livest Sci. 2020;236:104021. https://doi.org/10.1016/j.livsci.2020.104021.
39. Moran L, Andres S, Bodas R, Prieto N, Giraldez FJ. Meat texture andantioxidant status are improved when carnosic acid is included in the dietof fattening lambs. Meat Sci. 2012;91(4):430–4. https://doi.org/10.1016/j.meatsci.2012.02.027.
40. Yusuf AL, Adeyemi KD, Roselina K, Alimon AR, Goh YM, Samsudin AA, et al.Dietary supplementation of different parts of Andrographis paniculata affectsthe fatty acids, lipid oxidation, microbiota, and quality attributes oflongissimus muscle in goats. Food Res Int. 2018;111:699–707. https://doi.org/10.1016/j.foodres.2018.06.015.
41. Priolo A, Waghorn G, Lanza M, Biondi L, Pennisi P. Polyethylene glycol as ameans for reducing the impact of condensed tannins in carob pulp: effectson lamb growth, performance and meat quality. J Anim Sci. 2000;78(4):810–6. https://doi.org/10.2527/2000.784810x.
42. Damanik R. Torbangun (Coleus amboinicus Lour): a Bataknese traditionalcuisine perceived as lactagogue by Bataknese lactating women inSimalungun, north Sumatera. Indonesia J Hum Lact. 2009;25(1):64–72.https://doi.org/10.1177/0890334408326086.
43. Garg SK, Makkar HPS, Nagal KB, Sharma SK, Wadhwa DR, Singh B. Oak(Quercus incana) leaf poisoning in cattle. Vet Hum Toxicol. 1992;34(2):161–4.
44. Andres S, Tejido ML, Bodas R, Moran L, Prieto N, Blanco C, et al. Quercetindietary supplementation of fattening lambs at 0.2% rate reducesdiscolouration and microbial growth in meat during refrigerated storage.Meat Sci. 2013;93:207–12. https://doi.org/10.1016/j.meatsci.2012.08.023.
45. Liu S, Huang J, Wang X, Ma Y. Transcription factors regulate adipocytedifferentiation in beef cattle. Anim Genet. 2020;51(3):351–7. https://doi.org/10.1111/age.12931.
46. Garnsworthy PC, Feng S, Lock AL, Royal MD. Short communication:heritability of milk fatty acid composition and stearoyl-CoA desaturaseindices in dairy cows. J Dairy Sci. 2010;93(4):1743–8. https://doi.org/10.3168/jds.2009-2695.
47. Pewan SB, Otto JR, Huerlimann R, Budd AM, Mwangi FW, Edmunds RC, et al.Genetics of omega-3 long-chain polyunsaturated fatty acid metabolism andmeat-eating quality in Tattykeel Australian White lambs. Genes (Basel). 2020;11:587. https://doi.org/10.3390/genes11050587.
48. Pewan SB, Otto JR, Huerlimann R, Budd AM, Mwangi FW, Edmunds RC, et al.Effects of fatty acids on meat quality: a review. Meat Sci. 2004;66(1):21–32.https://doi.org/10.1016/S0309-1740(03)00022-6.
49. Vasta V, Luciano G. The effects of dietary consumption of plants secondarycompounds on small ruminants’ products quality. Small Rumin Res. 2011;101(1-3):150–9. https://doi.org/10.1016/j.smallrumres.2011.09.035.
50. Wood JD, Richardson RI, Nute GR, Fisher AV, Campo MM, Kasapidou E, et al.Effects of fatty acids on meat quality: a review. Meat Sci. 2003;66(1):21–32.https://doi.org/10.1016/S0309-1740(03)00022-6.
Yanza et al. Journal of Animal Science and Biotechnology (2022) 13:5 Page 19 of 19
![arXiv:2008.07889v3 [quant-ph] 16 Nov 2021 - X-MOL](https://static.fdokumen.com/doc/165x107/631feb8d9353b08ff5016b58/arxiv200807889v3-quant-ph-16-nov-2021-x-mol.jpg)