The HITRAN2016 molecular spectroscopic database - X-MOL
68
W&M ScholarWorks W&M ScholarWorks Arts & Sciences Articles Arts and Sciences 12-2017 The HITRAN2016 molecular spectroscopic database The HITRAN2016 molecular spectroscopic database I. E. Gordon [email protected] L. S. Rothman C. Hill R. V. Kochanov Y. Tan See next page for additional authors Follow this and additional works at: https://scholarworks.wm.edu/aspubs Recommended Citation Recommended Citation Gordon, I. E.; Rothman, L. S.; Hill, C.; Kochanov, R. V.; Tan, Y.; Bernath, P. F.; Birk, M.; Boudon, V.; Campargue, A.; Chance, K. V.; Drouin, B. J.; Flaud, J. -M.; Gamache, R. R.; Hodges, J. T.; Jacquemart, D.; Perevalov, V. I.; Perrin, A.; Shine, K. P.; Smith, M. -A. H.; Tennyson, J.; Toon, G. C.; Tran, H.; Tyuterev, V. G.; Barbe, A.; and Devi, V. Malathy, The HITRAN2016 molecular spectroscopic database (2017). JOURNAL OF QUANTITATIVE SPECTROSCOPY & RADIATIVE TRANSFER, 203. 10.1016/j.jqsrt.2017.06.038 This Article is brought to you for free and open access by the Arts and Sciences at W&M ScholarWorks. It has been accepted for inclusion in Arts & Sciences Articles by an authorized administrator of W&M ScholarWorks. For more information, please contact [email protected].
-
Upload
khangminh22 -
Category
Documents
-
view
4 -
download
0
Transcript of The HITRAN2016 molecular spectroscopic database - X-MOL

W&M ScholarWorks W&M ScholarWorks
Arts & Sciences Articles Arts and Sciences
12-2017
The HITRAN2016 molecular spectroscopic database The HITRAN2016 molecular spectroscopic database
I. E. Gordon [email protected]
L. S. Rothman
C. Hill
R. V. Kochanov
Y. Tan
See next page for additional authors
Follow this and additional works at: https://scholarworks.wm.edu/aspubs
Recommended Citation Recommended Citation Gordon, I. E.; Rothman, L. S.; Hill, C.; Kochanov, R. V.; Tan, Y.; Bernath, P. F.; Birk, M.; Boudon, V.; Campargue, A.; Chance, K. V.; Drouin, B. J.; Flaud, J. -M.; Gamache, R. R.; Hodges, J. T.; Jacquemart, D.; Perevalov, V. I.; Perrin, A.; Shine, K. P.; Smith, M. -A. H.; Tennyson, J.; Toon, G. C.; Tran, H.; Tyuterev, V. G.; Barbe, A.; and Devi, V. Malathy, The HITRAN2016 molecular spectroscopic database (2017). JOURNAL OF QUANTITATIVE SPECTROSCOPY & RADIATIVE TRANSFER, 203. 10.1016/j.jqsrt.2017.06.038
This Article is brought to you for free and open access by the Arts and Sciences at W&M ScholarWorks. It has been accepted for inclusion in Arts & Sciences Articles by an authorized administrator of W&M ScholarWorks. For more information, please contact [email protected].

Authors Authors I. E. Gordon, L. S. Rothman, C. Hill, R. V. Kochanov, Y. Tan, P. F. Bernath, M. Birk, V. Boudon, A. Campargue, K. V. Chance, B. J. Drouin, J. -M. Flaud, R. R. Gamache, J. T. Hodges, D. Jacquemart, V. I. Perevalov, A. Perrin, K. P. Shine, M. -A. H. Smith, J. Tennyson, G. C. Toon, H. Tran, V. G. Tyuterev, A. Barbe, and V. Malathy Devi
This article is available at W&M ScholarWorks: https://scholarworks.wm.edu/aspubs/114

ARTICLE IN PRESS
JID: JQSRT [m5G; August 21, 2017;14:18 ]
Journal of Quantitative Spectroscopy & Radiative Transfer 0 0 0 (2017) 1–66
Contents lists available at ScienceDirect
Journal of Quantitative Spectroscopy & Radiative Transfer
journal homepage: www.elsevier.com/locate/jqsrt
The HITRAN2016 molecular spectroscopic database
I.E. Gordon
a , ∗, L.S. Rothman
a , C. Hill a , b , R.V. Kochanov
a , c , Y. Tan
a , P.F. Bernath
d , M. Birk
e , V. Boudon
f , A. Campargue
g , K.V. Chance
a , B.J. Drouin
h , J.-M. Flaud
i , R.R. Gamache
j , J.T. Hodges k , D. Jacquemart l , V.I. Perevalov
m , A. Perrin
n , K.P. Shine
o , M.-A.H. Smith
p , J. Tennyson
b , G.C. Toon
h , H. Tran
n , V.G. Tyuterev
q , A. Barbe
q , A.G. Császár r , rr , V.M. Devi s , T. Furtenbacher r , J.J. Harrison
t , tt , ttt , J.-M. Hartmann
n , A. Jolly
i , T.J. Johnson
u , T. Karman
a , v , I. Kleiner i , A .A . Kyuberis a , w , J. Loos e , O.M. Lyulin
m , S.T. Massie
x , S.N. Mikhailenko
m , N. Moazzen-Ahmadi y , H.S.P. Müller z , O.V. Naumenko
m , A.V. Nikitin
m , O.L. Polyansky
b , w , M. Rey
q , M. Rotger q , S.W. Sharpe
u , K. Sung
h , E. Starikova
m , S.A. Tashkun
m , J. Vander Auwera
aa , G. Wagner e , J. Wilzewski a , e , P. Wcisło
bb , S. Yu
h , E.J. Zak
b
a Harvard-Smithsonian Center for Astrophysics, Atomic and Molecular Physics Division, Cambridge, MA, USA b University College London, Dept. of Physics and Astronomy, London WC1E 6BT, UK c Tomsk State University, Laboratory of Quantum Mechanics of Molecules and Radiative Processes, Tomsk, Russia d Old Dominion University, Dept. of Chemistry & Biochemistry, Norfolk, VA, USA e DLR, Institute for Remote Sensing Technology, Wessling, Germany f Université de Bourgogne Franche-Comté, Laboratoire Interdisciplinaire Carnot de Bourgogne, UMR 6303 CNRS, Dijon Cedex, France g Université Grenoble, Grenoble, France h California Institute of Technology, Jet Propulsion Laboratory, Pasadena, CA, USA i Université Paris Est, LISA, Créteil, France j University of Massachusetts, Dept. of Environmental, Earth & Atmospheric Sciences, Lowell, MA, USA k NIST, Chemical Sciences Division, Gaithersburg, MD, USA l Université Pierre et Marie Curie, LADIR, Paris, France m Institute of Atmospheric Optics, Laboratory of Theoretical Spectroscopy, Tomsk, Russia n CNRS, Ecole Polytechnique, Université Paris-Saclay, Laboratoire de Météorologie Dynamique/IPSL, 91128 Palaiseau, France o University of Reading, Dept. of Meteorology, Reading, UK p NASA Langley Research Center, Science Directorate, Hampton, VA, USA q Université de Reims, GSMA, Reims, France r MTA-ELTE Complex Chemical Systems Research Group, Budapest, Hungary s The College of William and Mary, Dept. of Physics, Williamsburg, VA, USA t University of Leicester, Department of Physics and Astronomy, Leicester, UK u Battelle Pacific Northwest National Laboratory, Richland, WA, USA v Radboud University, Institute for Molecules and Materials, Nijmegen, The Netherlands w Institute of Applied Physics of Russian Academy of Sciences, Nizhny Novgorod, Russia x University of Colorado, Laboratory for Atmospheric and Space Physics, Boulder, CO, USA y The University of Calgary, Dept. of Physics and Astronomy, Calgary, AB, Canada z University of Cologne, I. Physikalisches Institut, Cologne, Germany aa Université Libre de Bruxelles, Service de Chimie Quantique et Photophysique, C.P. 160/09, B-1050 Brussels, Belgium
bb Nicolaus Copernicus University, Institute of Physics, Torun, Poland tt University of Leicester, National Centre for Earth Observation, Leicester, UK ttt University of Leicester, Leicester Institute for Space and Earth Observation, Leicester, UK rr E ӧtv ӧs Loránd University, Institute of Chemistry, Budapest, Hungary
∗ Corresponding author.
E-mail address: [email protected] (I.E. Gordon).
http://dx.doi.org/10.1016/j.jqsrt.2017.06.038
0022-4073/Published by Elsevier Ltd. This is an open access article under the CC BY-NC-ND license. ( http://creativecommons.org/licenses/by-nc-nd/4.0/ )
Please cite this article as: I.E. Gordon et al., The HITRAN2016 molecular spectroscopic database, Journal of Quantitative Spectroscopy &
Radiative Transfer (2017), http://dx.doi.org/10.1016/j.jqsrt.2017.06.038

2 I.E. Gordon et al. / Journal of Quantitative Spectroscopy & Radiative Transfer 0 0 0 (2017) 1–66
ARTICLE IN PRESS
JID: JQSRT [m5G; August 21, 2017;14:18 ]
a r t i c l e i n f o
Article history:
Received 23 February 2017
Revised 29 June 2017
Accepted 29 June 2017
Available online xxx
Keywords:
HITRAN
Spectroscopic database
Molecular spectroscopy
Molecular absorption
Spectroscopic line parameters
Absorption cross-sections
Collision-induced absorption
Aerosols
a b s t r a c t
This paper describes the contents of the 2016 edition of the HITRAN molecular spectroscopic compila-
tion. The new edition replaces the previous HITRAN edition of 2012 and its updates during the inter-
vening years. The HITRAN molecular absorption compilation is composed of five major components: the
traditional line-by-line spectroscopic parameters required for high-resolution radiative-transfer codes, in-
frared absorption cross-sections for molecules not yet amenable to representation in a line-by-line form,
collision-induced absorption data, aerosol indices of refraction, and general tables such as partition sums
that apply globally to the data. The new HITRAN is greatly extended in terms of accuracy, spectral cov-
erage, additional absorption phenomena, added line-shape formalisms, and validity. Moreover, molecules,
isotopologues, and perturbing gases have been added that address the issues of atmospheres beyond the
Earth. Of considerable note, experimental IR cross-sections for almost 300 additional molecules impor-
tant in different areas of atmospheric science have been added to the database. The compilation can be
accessed through www.hitran.org . Most of the HITRAN data have now been cast into an underlying rela-
tional database structure that offers many advantages over the long-standing sequential text-based struc-
ture. The new structure empowers the user in many ways. It enables the incorporation of an extended set
of fundamental parameters per transition, sophisticated line-shape formalisms, easy user-defined output
formats, and very convenient searching, filtering, and plotting of data. A powerful application program-
ming interface making use of structured query language (SQL) features for higher-level applications of
HITRAN is also provided.
Published by Elsevier Ltd.
This is an open access article under the CC BY-NC-ND license.
( http://creativecommons.org/licenses/by-nc-nd/4.0/ )
1. Introduction
This article describes the data and software that have been
added, modified, or enhanced in the HITRAN ( Hi gh Resolution
Tran smission) compilation since the previous edition of 2012
[1] (hereafter called HITRAN2012 in the text). The line-by-line por-
tion and the absorption cross-sections of the new edition, hereafter
called HITRAN2016, have now been cast into an underlying rela-
tional database structure as opposed to the long-standing fixed-
length ASCII record format. A user-friendly powerful internet tool,
HITRAN online (accessible through www.hitran.org ), is provided to
the user to query, filter, and plot sections of the data and to re-
trieve outputs in a host of convenient formats (see Hill et al. [2] ).
The HITRAN compilation is composed of several components
that include ( 1 ) line-by-line spectroscopic parameters for high res-
olution molecular absorption and radiance calculations (from the
microwave through the ultraviolet region of the spectrum); ( 2 ) in-
frared absorption cross-sections (generally representing absorption
by molecules that have very dense spectra or many low-lying vi-
brational modes); ( 3 ) collision-induced absorption datasets; ( 4 ) ta-
bles of aerosol refractive indices; and ( 5 ) global data that apply in
a general manner to the archive. The updates to these five portions
of HITRAN as well as the new underlying system of data structure
with accompanying internet user interface will be discussed in the
following sections.
The new edition of the HITRAN database substantially increases
the database’s potential to accurately model radiative processes in
the atmosphere of the Earth and other planets. Apart from improv-
ing the accuracy of the existing parameters, more parameters have
been introduced, and new bands and isotopologues added. Two
gases (C 2 N 2 and COCl 2 ) are introduced to the database for the first
time. Finally, a very dramatic expansion of the cross-sectional part
of the database is featured in this new edition.
It is necessary to call attention to some specifics of the HITRAN
database. The units used throughout HITRAN editions including
this one do not strictly adhere to the SI system for both historical
and application-specific reasons. Thus cm
−1 (reciprocal centimeter)
is seen throughout, as is atm (atmosphere) for pressure (in SI units
of Pascals, 101,325 Pa = 1 atm). Also, the symbol ν is used through-
out for line position in cm
−1 , thereby dropping the tilde ( ˜ ν) that is
the official designation of wavenumber. The HITRAN unit for inten-
sity is traditionally expressed as cm
-1 /(molecule cm
-2 ) rather than
simplifying to the equivalent cm molecule -1 .
1.1. Overview of parameters (including new ones)
The traditional and probably most applied portion of HITRAN is
the line list of high-resolution spectral parameters. These line-by-
line parameters reflect values of individual transitions between en-
ergy levels of rovibronic states that are required by high-resolution
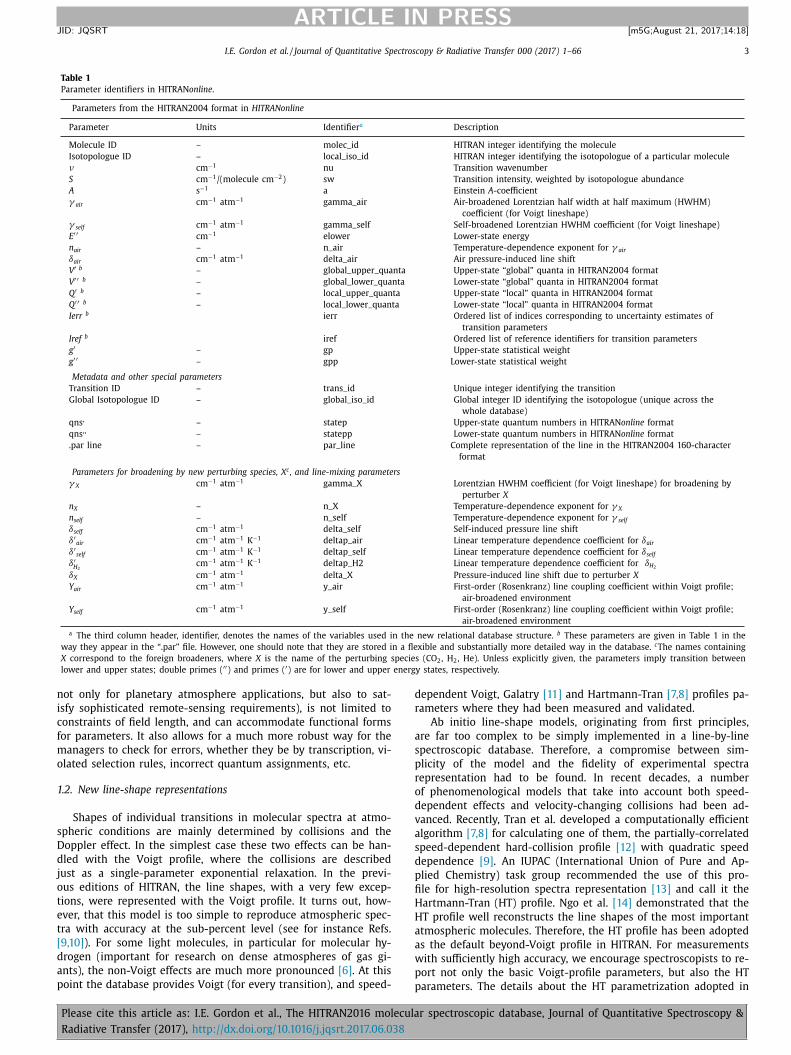
radiative-transfer codes. These parameters are shown in Tables
1 and 2 . Table 1 gives an overview of parameters that are tradition-
ally provided in the “.par” format as per HITRAN2004 [3] formal-
ism as well as broadening and shift parameters due to the pres-
sure of H 2 , He and CO 2 (see Wilzewski et al. [4] , Hill et al. [2] and
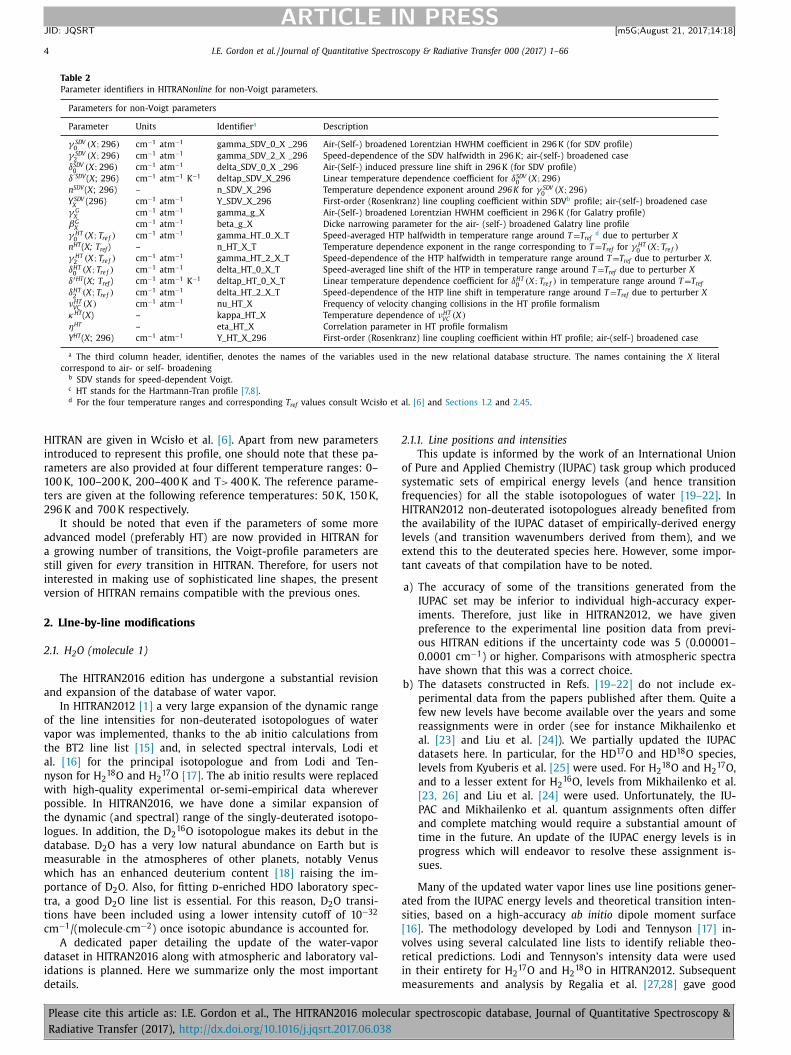
Kochanov et al. [5] for details). Table 2 provides information on the
parameters required for non-Voigt line-shape representations (see
Wcisło et al. [6] , Hill et al. [2] and Kochanov et al. [5] for details).
Ideally, they would arise from theoretically-consistent calculations;
however, since the emphasis in HITRAN is to provide the user with
the most accurate values available, they are often the values ob-
tained from controlled laboratory measurements when quantum-
mechanical calculations are not yet of comparable accuracy. Nev-
ertheless, theoretical calculations and semi-empirical formulae are
widely used in HITRAN to both interpolate and extrapolate needed
parameters for transitions missing from the limited observed set.
Section 2 presents a description of changes made to the line-
by-line portion of HITRAN. It is organized in the order of the
molecules in HITRAN (a sequential number related to the entry
of the molecule into HITRAN). The discussions in the molecular
sub-sections give an overview of the addition of new bands, re-
placement of line positions and/or intensities, and new or modified
line-shape parameters where applicable. There are also citations to
more detailed studies of the modifications.
With the recent advances in both laboratory spectrometers and
the power of theoretical treatments such as ab initio calculations,
the accuracy and the access to weak, yet important, transitions
have had a big impact on this edition of HITRAN.
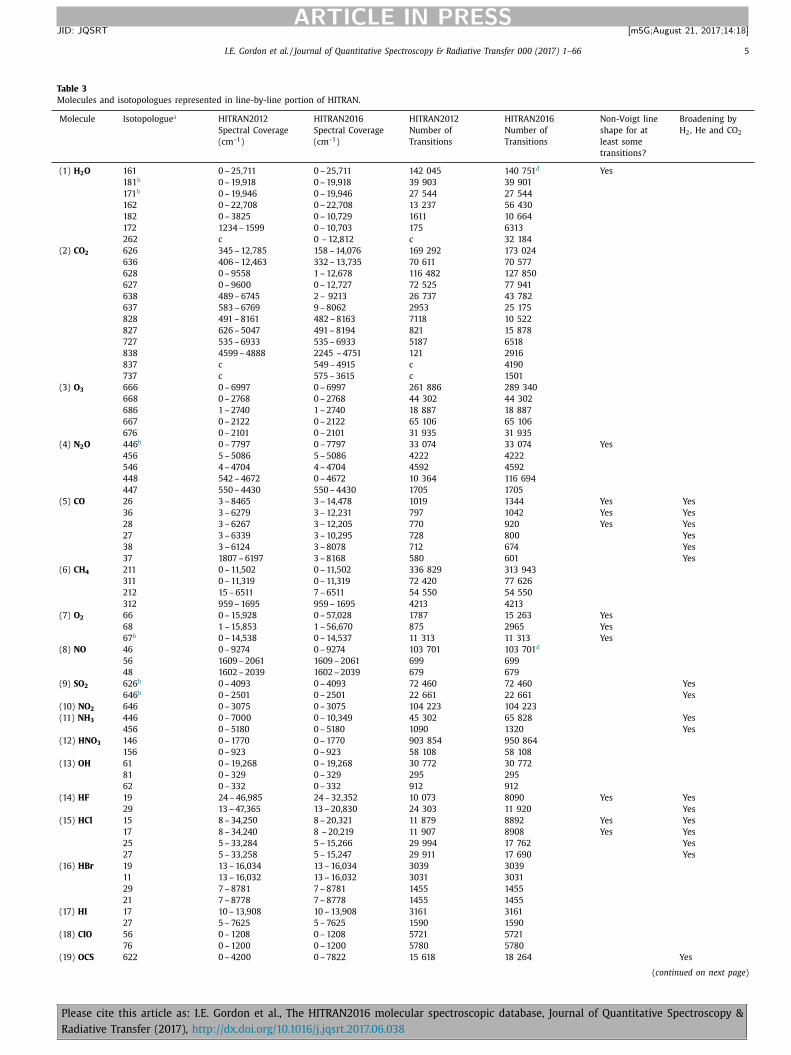
Table 3 provides an overview of changes and additions to the
database with respect to the HITRAN2012 edition.
The line-by-line parameters (as well as the portion of HITRAN
devoted to cross-sections) have now been cast into a relational
database structure, described in Section 6.1 . This underlying struc-
ture has many advantages that were not available in the previ-
ous fixed-length format of previous HITRAN editions. The database
is now able to add many more parameters (becoming necessary
Please cite this article as: I.E. Gordon et al., The HITRAN2016 molecular spectroscopic database, Journal of Quantitative Spectroscopy &
Radiative Transfer (2017), http://dx.doi.org/10.1016/j.jqsrt.2017.06.038
I.E. Gordon et al. / Journal of Quantitative Spectroscopy & Radiative Transfer 0 0 0 (2017) 1–66 3
ARTICLE IN PRESS
JID: JQSRT [m5G; August 21, 2017;14:18 ]
Table 1
Parameter identifiers in HITRAN online .
Parameters from the HITRAN2004 format in HITRANonline
Parameter Units Identifier a Description
Molecule ID – molec_id HITRAN integer identifying the molecule
Isotopologue ID – local_iso_id HITRAN integer identifying the isotopologue of a particular molecule
ν cm
−1 nu Transition wavenumber
S cm
−1 /(molecule cm
−2 ) sw Transition intensity, weighted by isotopologue abundance
A s −1 a Einstein A -coefficient
γ air cm
−1 atm
−1 gamma_air Air-broadened Lorentzian half width at half maximum (HWHM)
coefficient (for Voigt lineshape)
γ self cm
−1 atm
−1 gamma_self Self-broadened Lorentzian HWHM coefficient (for Voigt lineshape)
E ′ ′ cm
−1 elower Lower-state energy
n air – n_air Temperature-dependence exponent for γ air
δair cm
−1 atm
−1 delta_air Air pressure-induced line shift
V ′ b – global_upper_quanta Upper-state “global” quanta in HITRAN2004 format
V ′ ′ b – global_lower_quanta Lower-state “global” quanta in HITRAN2004 format
Q ′ b – local_upper_quanta Upper-state “local” quanta in HITRAN2004 format
Q ′ ′ b – local_lower_quanta Lower-state “local” quanta in HITRAN2004 format
Ierr b ierr Ordered list of indices corresponding to uncertainty estimates of
transition parameters
Iref b iref Ordered list of reference identifiers for transition parameters
g ′ – gp Upper-state statistical weight
g ′ ′ – gpp Lower-state statistical weight
Metadata and other special parameters
Transition ID – trans_id Unique integer identifying the transition
Global Isotopologue ID – global_iso_id Global integer ID identifying the isotopologue (unique across the
whole database)
qns ׳ – statep Upper-state quantum numbers in HITRAN online format
qns ׳׳ – statepp Lower-state quantum numbers in HITRAN online format
.par line – par_line Complete representation of the line in the HITRAN2004 160-character
format
Parameters for broadening by new perturbing species, X c , and line-mixing parameters
γ X cm
−1 atm
−1 gamma_X Lorentzian HWHM coefficient (for Voigt lineshape) for broadening by
perturber X
n X – n_X Temperature-dependence exponent for γ X
n self – n_self Temperature-dependence exponent for γ self
δself cm
−1 atm
−1 delta_self Self-induced pressure line shift
δ′ air cm
−1 atm
−1 K −1 deltap_air Linear temperature dependence coefficient for δair
δ′ self cm
−1 atm
−1 K −1 deltap_self Linear temperature dependence coefficient for δself
δ′ H 2
cm
−1 atm
−1 K −1 deltap_H2 Linear temperature dependence coefficient for δH 2
δX cm
−1 atm
−1 delta_X Pressure-induced line shift due to perturber X
Y air cm
−1 atm
−1 y_air First-order (Rosenkranz) line coupling coefficient within Voigt profile;
air-broadened environment
Y self cm
−1 atm
−1 y_self First-order (Rosenkranz) line coupling coefficient within Voigt profile;
air-broadened environment
a The third column header, identifier, denotes the names of the variables used in the new relational database structure. b These parameters are given in Table 1 in the
way they appear in the “.par” file. However, one should note that they are stored in a flexible and substantially more detailed way in the database. c The names containing
X correspond to the foreign broadeners, where X is the name of the perturbing species (CO 2 , H 2 , He). Unless explicitly given, the parameters imply transition between
lower and upper states; double primes ( ′′ ) and primes ( ′ ) are for lower and upper energy states, respectively.
not only for planetary atmosphere applications, but also to sat-
isfy sophisticated remote-sensing requirements), is not limited to
constraints of field length, and can accommodate functional forms
for parameters. It also allows for a much more robust way for the
managers to check for errors, whether they be by transcription, vi-
olated selection rules, incorrect quantum assignments, etc.
1.2. New line-shape representations
Shapes of individual transitions in molecular spectra at atmo-
spheric conditions are mainly determined by collisions and the
Doppler effect. In the simplest case these two effects can be han-
dled with the Voigt profile, where the collisions are described
just as a single-parameter exponential relaxation. In the previ-
ous editions of HITRAN, the line shapes, with a very few excep-
tions, were represented with the Voigt profile. It turns out, how-
ever, that this model is too simple to reproduce atmospheric spec-
tra with accuracy at the sub-percent level (see for instance Refs.
[9,10] ). For some light molecules, in particular for molecular hy-
drogen (important for research on dense atmospheres of gas gi-
ants), the non-Voigt effects are much more pronounced [6] . At this
point the database provides Voigt (for every transition), and speed-
dependent Voigt, Galatry [11] and Hartmann-Tran [7,8] profiles pa-
rameters where they had been measured and validated.
Ab initio line-shape models, originating from first principles,
are far too complex to be simply implemented in a line-by-line
spectroscopic database. Therefore, a compromise between sim-
plicity of the model and the fidelity of experimental spectra
representation had to be found. In recent decades, a number
of phenomenological models that take into account both speed-
dependent effects and velocity-changing collisions had been ad-
vanced. Recently, Tran et al. developed a computationally efficient
algorithm [7,8] for calculating one of them, the partially-correlated
speed-dependent hard-collision profile [12] with quadratic speed
dependence [9] . An IUPAC (International Union of Pure and Ap-
plied Chemistry) task group recommended the use of this pro-
file for high-resolution spectra representation [13] and call it the
Hartmann-Tran (HT) profile. Ngo et al. [14] demonstrated that the
HT profile well reconstructs the line shapes of the most important
atmospheric molecules. Therefore, the HT profile has been adopted
as the default beyond-Voigt profile in HITRAN. For measurements
with sufficiently high accuracy, we encourage spectroscopists to re-
port not only the basic Voigt-profile parameters, but also the HT
parameters. The details about the HT parametrization adopted in
Please cite this article as: I.E. Gordon et al., The HITRAN2016 molecular spectroscopic database, Journal of Quantitative Spectroscopy &
Radiative Transfer (2017), http://dx.doi.org/10.1016/j.jqsrt.2017.06.038
4 I.E. Gordon et al. / Journal of Quantitative Spectroscopy & Radiative Transfer 0 0 0 (2017) 1–66
ARTICLE IN PRESS
JID: JQSRT [m5G; August 21, 2017;14:18 ]
Table 2
Parameter identifiers in HITRAN online for non-Voigt parameters.
Parameters for non-Voigt parameters
Parameter Units Identifier a Description
γ SDV 0 ( X; 296 ) cm
−1 atm
−1 gamma_SDV_0_X _296 Air-(Self-) broadened Lorentzian HWHM coefficient in 296 K (for SDV profile)
γ SDV 2 ( X; 296 ) cm
−1 atm
−1 gamma_SDV_2_X _296 Speed-dependence of the SDV halfwidth in 296 K; air-(self-) broadened case
δSDV 0 ( X; 296 ) cm
−1 atm
−1 delta_SDV_0_X _296 Air-(Self-) induced pressure line shift in 296 K (for SDV profile)
δ′ SDV ( X ; 296) cm
−1 atm
−1 K −1 deltap_SDV_X_296 Linear temperature dependence coefficient for δSDV 0 ( X; 296 )
n SDV ( X ; 296) – n_SDV_X_296 Temperature dependence exponent around 296 K for γ SDV 0 ( X; 296 )
Y SDV X (296) cm
−1 atm
−1 Y_SDV_X_296 First-order (Rosenkranz) line coupling coefficient within SDV b profile; air-(self-) broadened case
γ G X cm
−1 atm
−1 gamma_g_X Air-(Self-) broadened Lorentzian HWHM coefficient in 296 K (for Galatry profile)
βG X cm
−1 atm
−1 beta_g_X Dicke narrowing parameter for the air- (self-) broadened Galatry line profile
γ HT 0 (X; T re f ) cm
−1 atm
−1 gamma_HT_0_X_T Speed-averaged HTP halfwidth in temperature range around T = T ref d due to perturber X
n HT ( X; T ref ) – n_HT_X_T Temperature dependence exponent in the range corresponding to T = T ref for γ HT 0 (X; T re f )
γ HT 2 (X; T re f ) cm
−1 atm
−1 gamma_HT_2_X_T Speed-dependence of the HTP halfwidth in temperature range around T = T ref due to perturber X .
δHT 0 (X; T re f ) cm
−1 atm
−1 delta_HT_0_X_T Speed-averaged line shift of the HTP in temperature range around T = T ref due to perturber X
δ′ HT ( X; T ref ) cm
−1 atm
−1 K −1 deltap_HT_0_X_T Linear temperature dependence coefficient for δHT 0 (X; T re f ) in temperature range around T = T ref
δHT 2 (X; T re f ) cm
−1 atm
−1 delta_HT_2_X_T Speed-dependence of the HTP line shift in temperature range around T = T ref due to perturber X
νHT VC (X ) cm
−1 atm
−1 nu_HT_X Frequency of velocity changing collisions in the HT profile formalism
κHT ( X ) – kappa_HT_X Temperature dependence of νHT VC (X )
ηHT – eta_HT_X Correlation parameter in HT profile formalism
Y HT ( X ; 296) cm
−1 atm
−1 Y_HT_X_296 First-order (Rosenkranz) line coupling coefficient within HT profile; air-(self-) broadened case
a The third column header, identifier, denotes the names of the variables used in the new relational database structure. The names containing the X literal
correspond to air- or self- broadening b SDV stands for speed-dependent Voigt. c HT stands for the Hartmann-Tran profile [7,8] . d For the four temperature ranges and corresponding T ref values consult Wcisło et al. [6] and Sections 1.2 and 2.45 .
HITRAN are given in Wcisło et al. [6] . Apart from new parameters
introduced to represent this profile, one should note that these pa-
rameters are also provided at four different temperature ranges: 0–
100 K, 100–200 K, 200–400 K and T > 400 K. The reference parame-
ters are given at the following reference temperatures: 50 K, 150 K,
296 K and 700 K respectively.
It should be noted that even if the parameters of some more
advanced model (preferably HT) are now provided in HITRAN for
a growing number of transitions, the Voigt-profile parameters are
still given for every transition in HITRAN. Therefore, for users not
interested in making use of sophisticated line shapes, the present
version of HITRAN remains compatible with the previous ones.
2. LIne-by-line modifications
2.1. H 2 O (molecule 1)
The HITRAN2016 edition has undergone a substantial revision
and expansion of the database of water vapor.
In HITRAN2012 [1] a very large expansion of the dynamic range
of the line intensities for non-deuterated isotopologues of water
vapor was implemented, thanks to the ab initio calculations from
the BT2 line list [15] and, in selected spectral intervals, Lodi et
al. [16] for the principal isotopologue and from Lodi and Ten-
nyson for H 2 18 O and H 2
17 O [17] . The ab initio results were replaced
with high-quality experimental or-semi-empirical data wherever
possible. In HITRAN2016, we have done a similar expansion of
the dynamic (and spectral) range of the singly-deuterated isotopo-
logues. In addition, the D 2 16 O isotopologue makes its debut in the
database. D 2 O has a very low natural abundance on Earth but is
measurable in the atmospheres of other planets, notably Venus
which has an enhanced deuterium content [18] raising the im-
portance of D 2 O. Also, for fitting d -enriched HDO laboratory spec-
tra, a good D 2 O line list is essential. For this reason, D 2 O transi-
tions have been included using a lower intensity cutoff of 10 −32
cm
−1 /(molecule ·cm
−2 ) once isotopic abundance is accounted for.
A dedicated paper detailing the update of the water-vapor
dataset in HITRAN2016 along with atmospheric and laboratory val-
idations is planned. Here we summarize only the most important
details.
2.1.1. Line positions and intensities
This update is informed by the work of an International Union
of Pure and Applied Chemistry (IUPAC) task group which produced
systematic sets of empirical energy levels (and hence transition
frequencies) for all the stable isotopologues of water [19–22] . In
HITRAN2012 non-deuterated isotopologues already benefited from
the availability of the IUPAC dataset of empirically-derived energy
levels (and transition wavenumbers derived from them), and we
extend this to the deuterated species here. However, some impor-
tant caveats of that compilation have to be noted.
a) The accuracy of some of the transitions generated from the
IUPAC set may be inferior to individual high-accuracy exper-
iments. Therefore, just like in HITRAN2012, we have given
preference to the experimental line position data from previ-
ous HITRAN editions if the uncertainty code was 5 (0.0 0 0 01–
0.0 0 01 cm
−1 ) or higher. Comparisons with atmospheric spectra
have shown that this was a correct choice.
b) The datasets constructed in Refs. [19–22] do not include ex-
perimental data from the papers published after them. Quite a
few new levels have become available over the years and some
reassignments were in order (see for instance Mikhailenko et
al. [23] and Liu et al. [24] ). We partially updated the IUPAC
datasets here. In particular, for the HD
17 O and HD
18 O species,
levels from Kyuberis et al. [25] were used. For H 2 18 O and H 2
17 O,
and to a lesser extent for H 2 16 O, levels from Mikhailenko et al.
[23, 26] and Liu et al. [24] were used. Unfortunately, the IU-
PAC and Mikhailenko et al. quantum assignments often differ
and complete matching would require a substantial amount of
time in the future. An update of the IUPAC energy levels is in
progress which will endeavor to resolve these assignment is-
sues.
Many of the updated water vapor lines use line positions gener-
ated from the IUPAC energy levels and theoretical transition inten-
sities, based on a high-accuracy ab initio dipole moment surface
[16] . The methodology developed by Lodi and Tennyson [17] in-
volves using several calculated line lists to identify reliable theo-
retical predictions. Lodi and Tennyson’s intensity data were used
in their entirety for H 2 17 O and H 2
18 O in HITRAN2012. Subsequent
measurements and analysis by Regalia et al. [27,28] gave good
Please cite this article as: I.E. Gordon et al., The HITRAN2016 molecular spectroscopic database, Journal of Quantitative Spectroscopy &
Radiative Transfer (2017), http://dx.doi.org/10.1016/j.jqsrt.2017.06.038
I.E. Gordon et al. / Journal of Quantitative Spectroscopy & Radiative Transfer 0 0 0 (2017) 1–66 5
ARTICLE IN PRESS
JID: JQSRT [m5G; August 21, 2017;14:18 ]
Table 3
Molecules and isotopologues represented in line-by-line portion of HITRAN.
Molecule Isotopologue a HITRAN2012
Spectral Coverage
(cm
–1 )
HITRAN2016
Spectral Coverage
(cm
–1 )
HITRAN2012
Number of
Transitions
HITRAN2016
Number of
Transitions
Non-Voigt line
shape for at
least some
transitions?
Broadening by
H 2 , He and CO 2
(1) H 2 O 161 0 – 25,711 0 – 25,711 142 045 140 751 d Yes
181 b 0 – 19,918 0 – 19,918 39 903 39 901
171 b 0 – 19,946 0 – 19,946 27 544 27 544
162 0 – 22,708 0 – 22,708 13 237 56 430
182 0 – 3825 0 – 10,729 1611 10 664
172 1234 – 1599 0 – 10,703 175 6313
262 c 0 – 12,812 c 32 184
(2) CO 2 626 345 – 12,785 158 – 14,076 169 292 173 024
636 406 – 12,463 332 – 13,735 70 611 70 577
628 0 – 9558 1 – 12,678 116 482 127 850
627 0 – 9600 0 – 12,727 72 525 77 941
638 489 – 6745 2 – 9213 26 737 43 782
637 583 – 6769 9 – 8062 2953 25 175
828 491 – 8161 482 – 8163 7118 10 522
827 626 – 5047 491 – 8194 821 15 878
727 535 – 6933 535 – 6933 5187 6518
838 4599 – 4888 2245 – 4751 121 2916
837 c 549 – 4915 c 4190
737 c 575 – 3615 c 1501
(3) O 3 666 0 – 6997 0 – 6997 261 886 289 340
668 0 – 2768 0 – 2768 44 302 44 302
686 1 – 2740 1 – 2740 18 887 18 887
667 0 – 2122 0 – 2122 65 106 65 106
676 0 – 2101 0 – 2101 31 935 31 935
(4) N 2 O 446 b 0 – 7797 0 – 7797 33 074 33 074 Yes
456 5 – 5086 5 – 5086 4222 4222
546 4 – 4704 4 – 4704 4592 4592
448 542 – 4672 0 – 4672 10 364 116 694
447 550 – 4430 550 – 4430 1705 1705
(5) CO 26 3 – 8465 3 – 14,478 1019 1344 Yes Yes
36 3 – 6279 3 – 12,231 797 1042 Yes Yes
28 3 – 6267 3 – 12,205 770 920 Yes Yes
27 3 – 6339 3 – 10,295 728 800 Yes
38 3 – 6124 3 – 8078 712 674 Yes
37 1807 – 6197 3 – 8168 580 601 Yes
(6) CH 4 211 0 – 11,502 0 – 11,502 336 829 313 943
311 0 – 11,319 0 – 11,319 72 420 77 626
212 15 – 6511 7 – 6511 54 550 54 550
312 959 – 1695 959 – 1695 4213 4213
(7) O 2 66 0 – 15,928 0 – 57,028 1787 15 263 Yes
68 1 – 15,853 1 – 56,670 875 2965 Yes
67 b 0 – 14,538 0 – 14,537 11 313 11 313 Yes
(8) NO 46 0 – 9274 0 – 9274 103 701 103 701 d
56 1609 – 2061 1609 – 2061 699 699
48 1602 – 2039 1602 – 2039 679 679
(9) SO 2 626 b 0 – 4093 0 – 4093 72 460 72 460 Yes
646 b 0 – 2501 0 – 2501 22 661 22 661 Yes
(10) NO 2 646 0 – 3075 0 – 3075 104 223 104 223
(11) NH 3 446 0 – 70 0 0 0 – 10,349 45 302 65 828 Yes
456 0 – 5180 0 – 5180 1090 1320 Yes
(12) HNO 3 146 0 – 1770 0 – 1770 903 854 950 864
156 0 – 923 0 – 923 58 108 58 108
(13) OH 61 0 – 19,268 0 – 19,268 30 772 30 772
81 0 – 329 0 – 329 295 295
62 0 – 332 0 – 332 912 912
(14) HF 19 24 – 46,985 24 – 32,352 10 073 8090 Yes Yes
29 13 – 47,365 13 – 20,830 24 303 11 920 Yes
(15) HCl 15 8 – 34,250 8 – 20,321 11 879 8892 Yes Yes
17 8 – 34,240 8 – 20,219 11 907 8908 Yes Yes
25 5 – 33,284 5 – 15,266 29 994 17 762 Yes
27 5 – 33,258 5 – 15,247 29 911 17 690 Yes
(16) HBr 19 13 – 16,034 13 – 16,034 3039 3039
11 13 – 16,032 13 – 16,032 3031 3031
29 7 – 8781 7 – 8781 1455 1455
21 7 – 8778 7 – 8778 1455 1455
(17) HI 17 10 – 13,908 10 – 13,908 3161 3161
27 5 – 7625 5 – 7625 1590 1590
(18) ClO 56 0 – 1208 0 – 1208 5721 5721
76 0 – 1200 0 – 1200 5780 5780
(19) OCS 622 0 – 4200 0 – 7822 15 618 18 264 Yes
( continued on next page )
Please cite this article as: I.E. Gordon et al., The HITRAN2016 molecular spectroscopic database, Journal of Quantitative Spectroscopy &
Radiative Transfer (2017), http://dx.doi.org/10.1016/j.jqsrt.2017.06.038

6 I.E. Gordon et al. / Journal of Quantitative Spectroscopy & Radiative Transfer 0 0 0 (2017) 1–66
ARTICLE IN PRESS
JID: JQSRT [m5G; August 21, 2017;14:18 ]
Table 3 ( continued )
Molecule Isotopologue a HITRAN2012
Spectral Coverage
(cm
–1 )
HITRAN2016
Spectral Coverage
(cm
–1 )
HITRAN2012
Number of
Transitions
HITRAN2016
Number of
Transitions
Non-Voigt line
shape for at
least some
transitions?
Broadening by
H 2 , He and CO 2
624 0 – 4166 0 – 7796 6087 6846 Yes
632 0 – 4056 0 – 6660 3129 3275 Yes
623 0 – 4164 0 – 6631 2886 3005 Yes
822 0 – 4046 0 – 4046 1641 1640 Yes
(20) H 2 CO 126 0 – 3100 0 – 3100 40 670 40 670
136 0 – 117 0 – 117 2309 2309
128 0 – 101 0 – 101 1622 1622
(21) HOCl 165 b 1 – 3800 1 – 3800 8877 8877
176 b 1 – 3800 1 – 3800 7399 7399
(22) N 2 44 11 – 9355 11 – 9355 1107 1107
45 b 11 – 2578 11 – 2578 161 161
(23) HCN 124 0 – 3424 0 – 17,586 2955 58 108
134 2 – 3405 2 – 3405 652 652
125 2 – 3420 2 – 3420 646 646
(24) CH 3 Cl 215 0 – 3198 0 – 3198 107 642 110 462
217 0 – 3198 0 – 3198 104 854 109 113
(25) H 2 O 2 1661 b 0 – 1731 0 – 1731 126 983 126 983
(26) C 2 H 2 1221 604 – 9890 13 – 9890 12 613 22 866 Yes
1231 613 – 6589 613 – 6589 285 285 Yes
1222 1 – 789 1 – 789 7512 7512 Yes
(27) C 2 H 6 1221 706 – 3001 225 – 3001 43 592 54 460
1231 725 – 919 285 – 919 6037 7107
(28) PH 3 1111 0 – 3602 0 – 3602 22 190 22 190
(29) COF 2 269 696 – 2002 725 – 2002 168 793 168 793
369 686 – 815 686 – 815 15 311 15 311
(30) SF 6 29 580 – 996 580 – 996 2 889 065 2 889 065
(31) H 2 S 121 b 2 – 11,330 2 – 11,330 36 561 36 561
141 b 5 – 11,227 5 – 11,227 11 352 11 352
131 b 5 – 11,072 5 – 11,072 6322 6322
(32)
HCOOH
126 10 – 1890 10 – 1890 62 684 62 684
(33) HO 2 166 b 0 – 3676 0 – 3676 38 804 38 804
(34) O 6 b 68 – 159 68 – 159 2 2
(35)
ClONO 2
5646 763 – 798 763 – 798 21 988 21 988
7646 765 – 791 765 – 791 10 211 10 211
(36) NO
+ 46 1634 – 2531 3 – 2531 1206 1270
(37) HOBr 169 0 – 316 0 – 316 2177 2177
161 0 – 316 0 – 316 2181 2181
(38) C 2 H 4 221 701 – 3243 620 – 3243 18 097 59 536
231 2947 – 3181 614 – 3181 281 18 095
(39) CH 3 OH 2161 b 0 – 1408 0 – 1408 19 897 19 897
(40) CH 3 Br 219 794 – 1706 794 – 1706 18 692 18 692
211 796 – 1697 796 – 1697 18 219 18 219
(41) CH 3 CN 2124 890 – 946 890 – 946 d 3572 3572 d
(42) CF 4 29 594 – 1313 582 – 1519 60 033 842 709
(43) C 4 H 2 2211 0 – 758 0 – 1303 124 126 251 245
(44) HC 3 N 1224 0 – 760 0 – 760 180 332 180 332
(45) H 2 11 15 – 36,024 15 – 27,185 4017 3480 Yes
12 b 3 – 36,406 3 – 36,406 5129 5129 Yes
(46) CS 22 1 – 2586 1 – 2586 1088 1088
24 1 – 1359 1 – 1359 396 396
32 1 – 1331 1 – 1331 396 396
23 1 – 156 1 – 156 198 198
(47) SO 3 26 0 – 2825 0 – 2825 10 881 14 295
(48) C 2 N 2 4224 c 200 – 307 c 71 775
(49) COCl 2 2655 c 793 – 900 c 164 436
2657 c 800 – 892 c 145 477
a Abbreviated code for isotopologues. b Although spectral ranges and amount of lines is unchanged with respect to HITRAN2012, there are changes to spectral parameters of lines for these isotopologues. c Not included in HITRAN2012. d These numbers will change eventually once changes discussed in sections 2.8 and 2.41 will be finalized.
agreement with these intensities. The present update relies heavily
on Lodi-Tennyson style calculations for all isotopologues, supple-
mented with high-quality experimental data where available. This
approach has proven to work well in application to atmospheric
and laboratory spectra (see for instance Campargue et al. [29] and
Ponomarev et al. [30] ).
Given the reliance on these theoretical intensities, it is impor-
tant to understand the systematic errors which ab initio calcu-
lations may show. In the same issue of this journal, Birk et al.
[31] give an extensive intercomparison of ab initio calculations
with high-quality experimental data. The experimental intensities
used in the intercomparison are all included in the HITRAN2016
update. Much of the data show agreement between ab initio and
experiment within 2%. However, for some bands, notably those in-
volving excitation of the stretching modes, there are larger offsets
of up to 8% which can be attributed to systematic errors in the ab
Please cite this article as: I.E. Gordon et al., The HITRAN2016 molecular spectroscopic database, Journal of Quantitative Spectroscopy &
Radiative Transfer (2017), http://dx.doi.org/10.1016/j.jqsrt.2017.06.038

I.E. Gordon et al. / Journal of Quantitative Spectroscopy & Radiative Transfer 0 0 0 (2017) 1–66 7
ARTICLE IN PRESS
JID: JQSRT [m5G; August 21, 2017;14:18 ]
Fig. 1. Percentage ab initio -experimental vs. intensity for bands in the 1850–2280 cm
−1 and 2390–40 0 0 cm
−1 regions of H 2 16 O. The error limit of the experimental data is
1% [31] .
initio dipole moment calculations. Furthermore, in the ν1 funda-
mental, differences show a systematic dependence on wavenum-
ber, �K a and �J . Other vibrational bands involving the changes in
ν1 quanta also showed larger systematic errors. The theoretical cal-
culations also have problems in predicting local resonances accu-
rately, although these resonances start to appear more frequently
in the NIR part of the spectrum. The information on systematic dif-
ferences between the ab initio theory and experiment for H 2 16 O
can be used to estimate uncertainties for minor isotopologues for
which no high-accuracy experimental intensities are available.
An important finding of this work is that for an individual vi-
brational band an intensity-independent offset appears in graphi-
cal representations of differences between experiment and theory
vs. intensity. This information can be used to validate experiment
as well as theory. The constant offset can also be used to predict
weak line intensities where experimental data are unavailable by
scaling ab initio values.
Fig. 1 compares theory and experiment for the 1850–2280 cm
−1
and 2390–40 0 0 cm
−1 regions. The agreements for the fundamental
bands (0 01)-(0 0 0), (010)-(0 0 0), the overtone (020)-(0 0 0), the hot
bands (030)-(010), (020)-(010), (011)-(010), (001–010), (100)-(010)
are all excellent, mainly within 2%. The bands involving changes in
the ν1 quanta, (10 0)-(0 0 0) and (110)-(010), however, show large
scatter and an offset around −2%. The scatter includes the sys-
tematic differences of + 5% to −13%, which becomes obvious when
plotting the differences against wavenumber or lower-state energy
and color coding �K a and/or �J [31] .
The 2016 update provides comprehensive line lists for the six
main isotopologues of water: H 2 16 O, H 2
18 O, H 2 17 O, HD
16 O, HD
18 O
and HD
17 O, as well as the newly-added isotopologue D 2 16 O. The
use of variational calculations to provide the underlying line lists
guarantees the completeness of the lists for the intensity cutoff
employed. This completeness leads to a significant expansion of
the number of important transitions of the deuterated isotopo-
logues into the NIR (near-infrared) region. These line lists are pre-
sented and analyzed in articles published in this issue [25] . Fig. 2
shows an example where atmospheric retrieval from a Total Car-
bon Column Observing Network (TCCON) [32] spectrum benefits
from inclusion of HDO lines in the NIR. It is also important to note
a significant increase in coverage for HD
17 O and HD
18 O which were
poorly represented in previous HITRAN releases.
The variational (calculated) intensities described above were
then replaced with intensities from available high-quality experi-
ments, many of which were already in the HITRAN2012 database.
The details will be given in a dedicated paper, but some of the ex-
periments that represent a substantial bulk of new experimental
intensity data are described below.
2.1.1.1. DLR experiments. An extensive work in the spectral ranges
1850–2280 cm
−1 and 2390–40 0 0 cm
−1 was carried out by Loos
et al. [33,34] and in the range 4190–4340 cm
−1 by Birk et al.
[31] . In Fig. 3 we will refer to these, and the experiments from
the same authors that are already in HITRAN, as DLR. In Loos
et al. [33,34] line positions, intensities, self- and air-broadened
line-shape parameters, their temperature dependence as well as
Rosenkranz line coupling coefficients were retrieved from numer-
ous Fourier-Transform transmittance measurements of self- and
air-broadened water vapor at 296 K as well as air-broadened wa-
ter vapor measurements at low and high temperatures. During
the analysis, a large effort was undertaken to give consolidated
error bars. In the analysis, a multispectrum fitting approach ap-
plying a quadratic speed-dependent hard collision model based
on the Hartmann-Tran profile [7,8] and extended to account for
line mixing in the Rosenkranz first order perturbation approxima-
tion [35] was used. Line positions, intensities and self-broadening,
self-speed-dependence and self-shift parameters, as well as in
some cases self-line coupling coefficients, were retrieved from pure
water-vapor measurements of total pressures up to 20 mbar. Air-
broadening, speed-dependence, pressure shift parameters, Dicke
narrowing and line-mixing coefficients as well as temperature-
dependence parameters were obtained from air-broadened mea-
surements at ambient temperature and total pressures from 30 to
10 0 0 mbar as well as low and high-temperature measurements
at 100 mbar total pressure. The intensities of lines with retrieved
line parameters range from 3 × 10 −26 to 3 × 10 −19 cm
-1 /(molecule
cm
-2 ). In the 4190–4340 cm
−1 region, several Fourier-Transform
transmittance spectra of pure and air-broadened water vapor at
296 K as well as low and high temperatures were measured and
analyzed by Birk et al. [31] . These measurements were dedicated
to water vapor parameters to be used in TROPOMI/S5-P [36] re-
trievals. The analysis was also based on a multispectrum fit using
the HT profile. Line positions, intensities, self- and air-broadened
line-shape parameters including speed-dependence and Dicke nar-
rowing parameters as well as their temperature dependence were
retrieved in the analysis.
Please cite this article as: I.E. Gordon et al., The HITRAN2016 molecular spectroscopic database, Journal of Quantitative Spectroscopy &
Radiative Transfer (2017), http://dx.doi.org/10.1016/j.jqsrt.2017.06.038

8 I.E. Gordon et al. / Journal of Quantitative Spectroscopy & Radiative Transfer 0 0 0 (2017) 1–66
ARTICLE IN PRESS
JID: JQSRT [m5G; August 21, 2017;14:18 ]
Fig. 2. Spectral fits to the high-H 2 O Darwin (Australia) spectrum using the HITRAN2012 line list (left panel) and the new line list (right panel). The improvement in the
residuals is due to the addition of HDO lines (three in this plot) denoted by the orange trace. Note the slight change of scale in the residuals on the left and right sides.
Fig. 3. Flow diagram for the construction of line positions and intensities for H 2 16 O below 8340 cm
−1 . See text for details.
Please cite this article as: I.E. Gordon et al., The HITRAN2016 molecular spectroscopic database, Journal of Quantitative Spectroscopy &
Radiative Transfer (2017), http://dx.doi.org/10.1016/j.jqsrt.2017.06.038

I.E. Gordon et al. / Journal of Quantitative Spectroscopy & Radiative Transfer 0 0 0 (2017) 1–66 9
ARTICLE IN PRESS
JID: JQSRT [m5G; August 21, 2017;14:18 ]
Fig. 4. Flow diagram for the construction of line positions and intensities for H 2 18 O and H 2
17 O. The asterisks indicate that the IUPAC levels were slightly updated in this
work. LED refers to the experimental data from Ref. [26] . See text for details.
2.1.1.2. MiKaMo16 experimental set. Recently, Mikhailenko et al.
[23] have compiled a database of measurements in 5850–
8340 cm
−1 region from the Grenoble-Tomsk collaboration reported
in Refs. [37–41] supplemented with measurements from Siron-
neau and Hodges [42] and for strong lines from Toth [43] and for
very weak lines from ab initio work of Partridge and Schwenke
[44,45] . This database is here referred to as MiKaMo16. Unfortu-
nately, due to some differences in assignments with the variational
Lodi-Tennyson-like line lists described above, it was hard to take
full advantage of this line list. However, tests against TCCON spec-
tra have shown that this line list is superior to any other line list
in the region of 70 0 0–8340 cm
−1 . It was therefore used in HI-
TRAN2016 in that region as is almost everywhere in this spectral
region. This, however, creates some consistency issues with assign-
ments of energy levels throughout the database, but substantial
improvement of atmospheric retrievals justifies this approach.
As examples of the complexity of the update, Figs. 3 and 4
show the flow diagrams of the construction of position-intensity
line lists of the principal isotopologue (only up to 8340 cm
−1 for
simplicity) and for H 2 18 O/H 2
17 O respectively. Note that the line list
from Lodi et al. [16] for the principal isotopologue is limited to
10 −28 cm
−1 /(molecule cm
−2 ); therefore intensities for weaker lines
still originate from HITRAN2012/BT2.
Whenever a rotational quantum number could not be deter-
mined unambiguously, the index of symmetry (1, 2, 3, and 4 as
defined in the BT2 work [15] ) accompanied with a negative sign
was used. Note that 1 and 2 indicate para states, whereas 3 and 4
indicate ortho states. For the case of unassigned vibrational quanta,
a “-2” label has been adopted.
Please cite this article as: I.E. Gordon et al., The HITRAN2016 molecular spectroscopic database, Journal of Quantitative Spectroscopy &
Radiative Transfer (2017), http://dx.doi.org/10.1016/j.jqsrt.2017.06.038

10 I.E. Gordon et al. / Journal of Quantitative Spectroscopy & Radiative Transfer 0 0 0 (2017) 1–66
ARTICLE IN PRESS
JID: JQSRT [m5G; August 21, 2017;14:18 ]
2.1.2. Line-shape parameters for the H 2 16 O, H 2
18 O and H 2 17 O line
lists
The air-broadened half widths (in Voigt profile formalism) for
the first three isotopologues of water in HITRAN2008 and, with
some modifications, in HITRAN2012 were derived using the proce-
dure “Diet” described by Gordon et al. [46] . This procedure contin-
ues to be used in this edition with experimental outliers identified
and removed. One notable example is the removal of a large por-
tion of the half widths measured in Jenouvrier et al. [47] from the
experimental data that feeds the “Diet”. Indeed, some of the recent
evaluations of atmospheric spectra showed that many data in Jen-
ovrier et al. are questionable (see for instance Armante et al. [48] ).
However, although the removal of this extensive dataset from the
updated Gordon et al. [46] procedure, as was done in the GEISA
database [49] and the MiKaMo16 linelist, have improved the resid-
uals in some of the lines, some of the residuals became worse than
in HITRAN2012. The main problem here is due to the fact that,
while there are definite outliers in the values reported in Jenou-
vrier et al. [47] , it is the most extensive study of the air-broadened
line widths in the 420 0–660 0 cm
−1 region. In fact, for many tran-
sitions no other measurements exist. Removal of these measure-
ments from the experimental dataset has invoked the use of the
approximations of different levels (some are very crude) from the
work of Jacquemart et al. [50] for many of the transitions. The only
solution in this case was to filter the Jenouvrier et al. dataset. This
was done through direct comparisons with the TCCON spectra for
some of the transitions and cross-comparison with similar rota-
tional transitions but from other bands, accounting for vibrational
dependence from Eq. (1) of Jacquemart et al. [50] . After this fil-
tering procedure, about 1400 measurements (out of almost 50 0 0)
from Jenouvrier et al. [47] were retained.
It is also important to emphasize that measurements by Birk
and Wagner [51] in the ν2 band region were given a priority
and were written into the database directly as was done in HI-
TRAN2012.
Since the modeling of water vapor absorption lines using a
Voigt model is no longer sufficient in many applications and the
HT profile provides considerably higher accuracy, experimental HT
profile parameters of Birk et al. and Loos et al. [31,33,34] in
the spectral ranges 1850–2280 cm
−1 , 2390–40 0 0 cm
−1 and 4190–
4340 cm
−1 were accommodated wherever possible. The experi-
ments and analysis procedures applied are described briefly in
Section 2.1.1 .
2.1.3. Line-shape parameters for the deuterated isotopologues
The addition of the line-shape parameters for D 2 O follows a
similar procedure as the other isotopologues; however, the avail-
able data for air-broadening of D 2 O are considerably less complete
than for the other isotopologues. There are some measurements for
air-broadening of D 2 O [52–55] as well as Complex Robert-Bonamy
calculations [56] . These data amount to several hundred lines from
the measured data and just over 550 lines from the theoretical cal-
culations. Using these data, average values as a function of J ′′ were
determined and extrapolation to J ′′ = 50 was done using a third-
order polynomial fit.
Using these data, the half widths and some line shifts have
been added to the D 2 O lines in the database using a priority
scheme. First, the measured values were added; if the measure-
ment did not exist for the transition in question, the theoretical
value was used. If neither exists, the J -averaged value was used.
This algorithm allowed half widths to be added to all D 2 O lines in
the HITRAN database.
For self-broadening parameters of D 2 O, the work of Gamache et
al. [57] was used. These data are an extensive set of calculations for
D 2 O rotational band transitions extended to 6536 lines using the
partner transition rule [58] . Using these data, a set of J -averaged
half widths was determined for J = 0–50 [57] . These data have been
added to the algorithm that adds line-shape data to the water lines
in the HITRAN database.
2.1.4. Future plans
Recently, Lampel et al. [59] have identified important ab-
sorption features in atmospheric spectra due to water vibration-
rotation transitions in the near ultraviolet around 363 nm. Labo-
ratory measurements of water vibration-rotation transition inten-
sities only extend to 25,470 cm
−1 (393 nm) [60] although multi-
photon spectra do provide some information on energy levels in
the region of question [61,62] . Future updates will look to extend
coverage to water absorption in the near ultraviolet; these data
are important for upcoming satellite missions, including TEMPO
[63] which will record spectra at these wavelengths.
At the intensity limit assumed for D 2 16 O, the even rarer iso-
topologues D 2 17 O and D 2
18 O should also be visible. Line lists for
these two species have also been prepared as part of the work
on deuterated water in Ref. [25] ; these data will be added in the
forthcoming updates to HITRAN2016.
We will be populating the database of the HT line-shape pa-
rameters after evaluating existing literature values and new mea-
surements as they become available.
2.2. CO 2 (molecule 2)
Accurate and comprehensive line lists for all naturally abundant
isotopologues of carbon dioxide are required by remote-sensing
missions dedicated to monitor the concentration of carbon dioxide
in Earth’s atmosphere. The recently launched OCO-2 mission [64–
66] , together with several other space and ground based projects
(GOSAT [67] , AIRS [68] , ASCENDS [69] , TCCON [32] , NDACC [70] )
are dedicated to explicitly monitor the atmospheric CO 2 content.
These experiments aim not only to look at overall CO 2 concentra-
tion and its variation, but also wish to pinpoint where CO 2 is being
produced (sources) and where it is absorbed (sinks). This activity is
clearly vital to monitoring and essential for eventually controlling
the CO 2 content of the atmosphere [71] . A successful retrieval of
CO 2 concentration requires validated line lists with transition in-
tensities given at sub-percent accuracy, line positions accurate to
0.0 0 01 cm
−1 or better, and beyond-Voigt-profile line-shape mod-
els [65,72,73] .
Determination of isotopic ratios of carbon in Earth’s samples
and astrophysical objects remains crucial for modeling geophysi-
cal processes. For example, quantification of 14 C in fossil fuels can
provide information about the sources of human-related contribu-
tion to the total CO 2 concentration in the terrestrial atmosphere.
This can be done with recently developed cavity-enhanced laser
spectroscopic techniques in the IR [74–76] . However, these mea-
surements require a priori simultaneous knowledge of reliable line
intensities of many isotopologues. Precise determination of 13 C/ 12 C
and
16 O/ 17 O/ 18 O ratios is also vital, for instance, in understand-
ing processes of formation of radiation fields in the Martian at-
mosphere, which is 96% rich in carbon dioxide [77] .
A summary of the carbon dioxide line list in the HITRAN2012
database and comparison to HITRAN2016 is given in Table 4 . The
HITRAN2012 database was considerably improved with respect to
its previous 2008 edition. However, several issues related to spec-
tral completeness, inconsistency of multiple data sources, and in-
sufficient accuracy of line intensities, still remained unsolved. The
majority of entries in the 2012 version of the HITRAN database
were taken from the effective Hamiltonian calculations included in
the 2008 edition of the CDSD-296 database [78] .
For less abundant isotopologues, obtaining high-quality experi-
mental data is not trivial. Therefore fits of the effective Hamilto-
nian or the effective dipole moment [78] , were based on only four
Please cite this article as: I.E. Gordon et al., The HITRAN2016 molecular spectroscopic database, Journal of Quantitative Spectroscopy &
Radiative Transfer (2017), http://dx.doi.org/10.1016/j.jqsrt.2017.06.038

I.E. Gordon et al. / Journal of Quantitative Spectroscopy & Radiative Transfer 0 0 0 (2017) 1–66 11
ARTICLE IN PRESS
JID: JQSRT [m5G; August 21, 2017;14:18 ]
Table 4
Comparison of HITRAN2016 and HITRAN2012 line lists for isotopologues of carbon dioxide.
ISO/abundance HITRAN2012 HITRAN2016
Number of lines Spectral region (cm
−1 ) Q(296 K) Number of lines Spectral region (cm
−1 ) Q(296 K)
626/0.984204 169,292 345.936–12,784.056 286.94 173,024 158.301–14,075.298 286.094
636/1.1057 × 10 −2 70,611 406.834–12,462.046 578.41 70,577 332.649–13,734.963 576.644
628/3.9470 × 10 −3 116,482 0.736–9557.398 609.48 127,850 1.472–12,677.181 607.713
627/7.3399 × 10 −4 72,525 0.757–9599.317 3552.70 77,941 0.757–12,726.562 3542.610
638/4.4345 × 10 −5 26,737 489.678–6744.158 1229.10 43,782 2.945–9212.609 1225.270
637/8.2462 × 10 −6 2953 583.593–6768.643 7162.90 25,175 9.086–8061.741 7140.024
828/3.9556 × 10 −6 7118 4 91.6 88–8160.439 324.21 10,522 482.813–8162.743 323.424
728/1.4718 × 10 −6 821 626.438–5046.875 3776.40 15,878 491.181–8193.172 3766.044
727/1.3685 × 10 −7 5187 535.384–6932.980 11,0 02.0 0 6518 535.383–6932.693 10,971.91
838/4.4 4 40 × 10 −8 121 4599.239–4887.290 653.50 2916 2245.898–4750.068 652.242
837/1.653 × 10 −8 N/A N/A 7615.20 4190 54 9.472–4 914.4 96 7593.900
737/1.5375 × 10 −9 N/A N/A N/A 1501 575.852–3614.084 22,129.96
646/radioactive N/A N/A N/A 41,610 426.445–7928.788 2033.353
Note : ISO is the AFGL shorthand notation for the isotopologue, abundance is the terrestrial value assumed by HITRAN, and Q(296) is the
partition sum at 296 K.
Fig. 5. Overview of the line lists of stable symmetric isotopologues of carbon dioxide in HITRAN2012 and HITRAN2016.
major isotopologues 12 C
16 O 2 , 13 C
16 O 2 , 16 O
12 C
18 O and
16 O
12 C
17 O, for
which measured spectroscopic parameters were available. As a re-
sult, several spectral gaps were present in HITRAN2012 (see for in-
stance discussion in Refs. [79,80] ) which represent regions where
experimental data were unavailable. For similar reasons, no entries
were included in the database for the 18 O
13 C
17 O, 17 O
13 C
17 O, and
16 O
14 C
16 O isotopologues (837, 737, and 646 in old AFGL notation).
An overview of this problem is displayed in Figs. 5 and 6 , where
CO 2 ro-vibrational spectra from HITRAN2012 and HITRAN2016 are
compared for different isotopologues.
Wherever possible, the effective Hamiltonian fits were extrapo-
lated to the trace isotopologues, using a method of isotopic sub-
stitution [81] . In the 2012 edition, multiple data sources caused
sporadic discontinuities in intensity patterns of ro-vibrational lines
[82–84] . Furthermore, a high percentage of line intensities in HI-
TRAN2012 have stated uncertainty of 20% or worse (HITRAN un-
certainty index equal to 3). Although this assessment has been
proven to be overly pessimistic in many cases [82,83,85–87] , the
uncertainty budget, especially for the Effective Hamiltonian cal-
culations, was still too high for precise measurements of at-
mospheric CO 2 concentration. The most accurate entries in HI-
TRAN2012 were taken from NASA JPL measurements by Toth et
al. [88–90] and covered the 1.6-μm and 2.06-μm spectral regions,
which are used in remote-sensing measurements. The stated 1–
5% accuracy of these experimental line intensities (HITRAN uncer-
tainty index equal to 7 and 6), has been confirmed by a number of
comparisons [82,83,91] ; nonetheless the rigorous requirements for
part-per-million resolution in measurements of CO 2 atmospheric
concentration were not achieved.
Since the 2012 release of the HITRAN database, a large num-
ber of experimental and theoretical studies have been devoted
to improve the knowledge of line positions, line intensities and
line shapes of CO 2 isotopologues. For a comprehensive review of
Please cite this article as: I.E. Gordon et al., The HITRAN2016 molecular spectroscopic database, Journal of Quantitative Spectroscopy &
Radiative Transfer (2017), http://dx.doi.org/10.1016/j.jqsrt.2017.06.038

12 I.E. Gordon et al. / Journal of Quantitative Spectroscopy & Radiative Transfer 0 0 0 (2017) 1–66
ARTICLE IN PRESS
JID: JQSRT [m5G; August 21, 2017;14:18 ]
Fig. 6. Overview of the line lists of stable asymmetric isotopologues of carbon dioxide in HITRAN2012 and HITRAN2016.
measurements and theoretical models see Ref [92] . and references
therein.
Theoretical line lists (denoted as "Ames") for 12 stable and one
radioactive (646) isotopologue of CO 2 were published by Huang
et al. in the 0–20,0 0 0 cm
−1 spectral region and for temperatures
below 1500 K [79,93,94] . Room-temperature line lists (denoted as
"UCL-IAO") for 13 CO 2 isotopologues were also calculated by Zak
et al. [82,83,85,91] in the 0–80 0 0 cm
−1 spectral region. Both of
these latter studies contained intensities computed with ab initio
dipole moment surfaces and semi-empirical line positions, based
on a fitted potential energy surface for the Ames effort and on the
effective Hamiltonian calculations for UCL-IAO. A major advantage
of the variational approach used in the Ames and UCL-IAO line
lists is that it should give similar accuracy for all isotopologues.
This allows coverage of spectral regions currently not probed by
experiments for rare isotopologues. UCL-IAO also provides uncer-
tainty estimates of line intensities, based on a purely theoretical
methodology [17] . Such a reliable analysis allows for the detection
of ro-vibrational resonance interactions, which significantly lower
the accuracy of theoretical line positions and intensities. Using this
method, the lines identified as unreliable have been replaced with
the data from CDSD-296 [92] and, in several cases of interpolyad
resonance interactions (asymmetric isotopologues), with the exper-
imental data from Lyulin et al. [95] , Karlovets et al. [96,97] and
Campargue et al. [98] .
Recently, there have been a number of high-precision near-IR
spectroscopic measurements which provide rigorous tests of the-
oretical line intensities based on effective dipole moment surface
and ab initio calculations [84–87,99] . Particularly, in the 1.6-μm
and 2.0-μm spectral regions, the UCL-IAO line lists have been ex-
perimentally verified as accurate to the sub-percent level. Fig. 7
compares the UCL-IAO and Ames line lists to HITRAN2012 (Toth et
al. blue open circles [100, 101] ) for the 20012 −00001 band and
to state-of-the-art experiments including advanced high-resolution
laser measurements [101–104] . A number of comparisons here
suggest that the UCL-IAO study models line intensities more ac-
Fig. 7. Comparison of line intensities between HITRAN2016, HITRAN2012 (Toth et
al. [88] ), and other accurate experimental and theoretical sources for the 20012 -
0 0 0 01 band (2-μm band) of 12 C 16 O 2 : measurements Wübbeler et al. [102] , NIST
[104] and UniNA2 [103] , and theory Ames-1 [79] . The zero relative deviation line
corresponds to HITRAN2016 line intensities (in this case from Zak et al. [82] ). The
running index m equals - J, J , and J + 1 for the P, Q, and R branches, respectively.
curately than the Ames study. Note that more recent results from
Ames, which are available from their website ( www.huang.seti.
org ), give closer agreement with UCL-IAO. From Fig. 7 it is clear
that there is a 1–3% average difference in line intensities between
the new and the previous version of HITRAN for this band. The
independent experiments from the National Institute of Standards
and Technology [104] , and the University of Naples II [103] con-
firm, however, a conservative 0.5% accuracy of line intensities for
this band in HITRAN2016. This level of accuracy could potentially
satisfy even the most stringent requirements of current remote-
sensing missions. Interestingly, although line intensities for this
band and the 20013 − 00001 and 30013 – 00001 bands probed
by OCO-2 originate from the same source (Toth et al. [100] ), the
agreement between UCL-IAO and HITRAN2012 is substantially bet-
ter for the OCO-2 bands.
For wavenumbers greater than 80 0 0 cm
−1 , the majority of the
line parameters were taken from CDSD-296 [92] . As we have al-
ready mentioned above, both HITRAN2012 and CDSD-296 have
several spectral gaps, in particular in the wavenumber region
Please cite this article as: I.E. Gordon et al., The HITRAN2016 molecular spectroscopic database, Journal of Quantitative Spectroscopy &
Radiative Transfer (2017), http://dx.doi.org/10.1016/j.jqsrt.2017.06.038

I.E. Gordon et al. / Journal of Quantitative Spectroscopy & Radiative Transfer 0 0 0 (2017) 1–66 13
ARTICLE IN PRESS
JID: JQSRT [m5G; August 21, 2017;14:18 ]
greater than 80 0 0 cm
−1 . Recently, several experimental studies of
the carbon dioxide spectra in the high-frequency region have been
performed [105–108] . The measured line intensities allowed deter-
mining the absent effective dipole moment parameters for several
series of transitions. Using these effective dipole moment parame-
ters and an effective Hamiltonian from Ref. [109] , the line positions
and intensities for the principal isotopologue were generated and
included into HITRAN2016 covering the 980 0–10,50 0 cm
−1 and
11,60 0–12,40 0 cm
−1 wavenumber gaps.
Line positions were updated with respect to the previous ver-
sion of the database. The majority of lines come from the effective
Hamiltonian calculations included in UCL-IAO line lists, which are
based on the fits to the observed line positions collected from the
literature and published in the latest, 2015 release of the CDSD-
296 database [92] . These fits were completed and updated with
recent, accurate measurements performed on isotopically-enriched
samples of CO 2 . Uncertainties in the fitted line positions depend
on the quality of the experimental data and vary from 0.001 cm
−1
to 10 −9 cm
−1 . For asymmetric isotopologues, a number of bands
are affected by strong interpolyad anharmonic resonance inter-
actions. The effective Hamiltonian model does not include this
type of interaction for the asymmetric isotopologues. Hence in
such cases, line positions were taken directly from measurements
[80,95–98,110,111] .
The uncertainty codes for the line positions were trans-
ferred from CDSD-296 to HITRAN2016. The uncertainty code 3
(0.001–0.01 cm
−1 ) was given for the line positions in the 9800–
10,500 cm
−1 and 11,600–12,400 cm
−1 wavenumber regions. Parti-
tion functions in the current release of the database are based on
the direct summations taken from the variational calculations of
Huang et al. [79] . On average, the new partition functions agree
excellently with those of CDSD-296 [83] ; however they do not
agree perfectly with those in HITRAN2012 (from TIPS [112] ) and
three previous editions of the database and differ at 296 K by about
−0.3%. Although this difference is marginal, it could have an effect
in the applications where sub-percent accuracy is required.
As stated above, the radioactive isotopologue 14 CO 2 , 646, has
been added to the database. This is the first edition of HITRAN
where radioactive species have been incorporated (also for CO, see
Section 2.5 ). All lines of the 646 isotopologue were taken from
the UCL line lists given in Ref. [83] . Due to issues with what
constitutes a so-called natural terrestrial abundance of radioactive
species (which is part of the traditional definition of intensities in
HITRAN, see Eq. (1) of the Definitions and Units documentation in
HITRAN online ), line intensities for these type of species are given
for unit abundance; a 10 −27 cm
−1 /(molecule ·cm
−2 ) cut-off value
for the intensity has been applied. This cut-off produced 41,610
lines in the J range 0 to 114. Vibrational assignments for the 646
isotopologue were based on isotopic shifts of energy levels and re-
spective assignments for the 626 and 636 isotopologues, and hence
should be regarded as provisional. An abundance-scaled intensity
cut-off of 10 −30 cm
−1 /(molecule ·cm
−2 ) is used for all stable iso-
topologues. Note that, for the time being, data for the radioactive
isotopologues are provided as static files rather than through the
HITRAN online interface.
Uncertainties of line intensities were informed by theoret-
ical error analysis, which classified lines as reliable, interme-
diate, or unreliable. Bands with reliable lines stronger than
10 −23 cm
−1 /(molecule ·cm
−2 ) (for unit abundance) were as-
signed HITRAN uncertainty code 8 (i.e. accuracy of 1% or bet-
ter). Line intensities of reliable parallel bands weaker than
10 −23 cm
−1 /(molecule ·cm
−2 ) were given an uncertainty code 7
(i.e. accuracy 1-2%). Reliable perpendicular bands weaker than
10 −23 cm
−1 /(molecule ·cm
−2 ) and intermediate lines were marked
with HITRAN uncertainty code 6 (i.e. accuracy 2-5%). So-called un-
reliable lines were taken from the effective dipole moment cal-
culations [92] and experiments. Typical intensity uncertainties for
these entries range between 5 and 20%.
It is important to point out that an intensive study of the 1.6-
μm and 2.06-μm bands that includes non-Voigt lineshapes and line
mixing has been published by the OCO-2 spectroscopy support
group ABSCO (ABSorption COefficient tables for the OCO-2 mission)
[84,86] . The data were fit using a multi spectrum fit procedure
which, among other things, enables retrieval of the line-shape pa-
rameters using the speed-dependent Voigt (SDV) profile as well as
line mixing. These are very good experiments and it is debatable
whether to use them for the strong and weak bands in place of
UCL-IAO parameters described above. Indeed the ABSCO team have
validated (using TCCON spectra) the cross-sections generated using
results of Refs. [84,86] and found them to be the most efficient
[113] . However, achieving high-precision results in nuanced corre-
lations, with line mixing and model assumptions that can create
discontinuities in inter-band comparisons, is difficult. At the mo-
ment, HITRAN cannot provide users with tools that can be used to
generate cross-sections from the works of Devi et al. [84] and Ben-
ner et al. [86] . The usable products of the ABSCO effort are absorp-
tion coefficients (available upon request from the ABSCO group)
rather than spectral parameters, which are available in the pub-
lications. Moreover, these absorption coefficients are empirically
scaled by the factors of 0.6% and 1.4% for the 1.6-μm and 2.06-μm
bands respectively, due to lingering data and/or model biases (the
use of partition function HITRAN 2012/TIPS is up to 0.3% of this
factor). After these studies, an update of the multi spectrum fitting
code with CDSD partition functions was done. Additional methods
to adjust the intensity distribution closer to the UCL list by scaling
experimental conditions within the uncertainties are under eval-
uation. The intensities of the band at 2.06 μm are already within
0.7% of Zak et al. [82] , indicating that the additional 0.7% scaling
of ABSCO cross-sections may be unrelated to intensities. These is-
sues will be considered for future editions of the database.
For wavenumbers greater than 80 0 0 cm
−1 , two sources of the
line intensities are used: CDSD-296 [92] and the newly-generated
line list in the 980 0–10,50 0 cm
−1 and 11,60 0–12,40 0 cm
−1 regions
based on the new measurements [105–108] . The uncertainty codes
of the CDSD-296 line intensities were transferred to HITRAN2016.
Based on the uncertainties of the line intensity measurements in
the 10,700–10,860 cm
−1 region [106] , we use uncertainty code 5
(5% −10%) for the line intensities of the 30 03i-0 0 0 01 (i = 1,2,3,4)
series of bands and based on the uncertainties of the line in-
tensity measurements in the 10,0 0 0–10,30 0 cm
−1 and 11,600–
12,400 cm
−1 [107] wavenumber regions we use uncertainty code
3 ( > 20%) for the line intensities of the 40 03i-0 0 0 01 (i = 1,2,3,4,5)
and of the 60 01i-0 0 0 01 (i = 1,2,3,4,5,6,7) series of bands.
The Voigt line-shape parameters throughout the entire database
were calculated using the predictive routine of Gamache and Lam-
ouroux explained in Refs. [114–116] . For the line mixing, we now
provide a code from Lamouroux et al. [117] which has been up-
dated to operate with HITRAN2016. We note that Lamouroux et al.
[117] line mixing coupled with the HITRAN2012 data has worked
really well and in fact produced residuals hardly exceeding 1%
when applied to the TCCON data in Ref. [113] , although slightly
inferior to the ABSCO cross-sections in the 2.06-μm region.
2.3. O 3 (molecule 3)
The spectroscopic database for ozone is important for atmo-
spheric and environmental applications due to its critical roles in
UV shielding, radiative transfer and health. It is also considered a
possible bio-marker for future observations of exoplanets [118] . In
order to understand the impacts of ozone on the atmosphere and
Please cite this article as: I.E. Gordon et al., The HITRAN2016 molecular spectroscopic database, Journal of Quantitative Spectroscopy &
Radiative Transfer (2017), http://dx.doi.org/10.1016/j.jqsrt.2017.06.038

14 I.E. Gordon et al. / Journal of Quantitative Spectroscopy & Radiative Transfer 0 0 0 (2017) 1–66
ARTICLE IN PRESS
JID: JQSRT [m5G; August 21, 2017;14:18 ]
Fig. 8. Log intensity diagram for the 16 O 3 lines in the 20 0–50 0 0 cm
−1 range in HITRAN2016: every point corresponds to a single transition. Newly included lines are colored
green, updated lines blue and unchanged HITRAN2012 lines grey (intensities are given in cm
-1 /molecule ·cm
-2 at 296 K).
to monitor ozone a precise, knowledge of its line parameters at all
wavelengths is required.
The ozone parameters for this edition of HITRAN have been up-
dated in two steps. First, the parameters of spectroscopic models,
line positions, intensities, and lower-state energy levels resulting
from analyses of experimental spectra have been introduced into
the S&MPO (Spectroscopy and Molecular Properties of Ozone) in-
formation system [119] . The S&MPO offers various tools for spec-
tral simulations and for comparisons with experimental records.
At the initial stage of the work, line lists were generated using
empirically-fitted model parameters of the effective Hamiltonians
(EH) which considered nearby strongly interacting levels and of
the corresponding effective dipole transition moments (ETM). This
procedure was necessary to obtain complete sets of transitions
as only a limited number of unblended lines could be accurately
measured in congested ozone spectra. State-of-the-art studies of
ozone laboratory spectra in the infrared have been recently re-
viewed by Barbe et al. [120] and Mikhailenko [121] . Note that
most of the compilations of ozone data in the infrared accessible
via the VAMDC (Virtual Atomic and Molecular Data Center) portal
[122,123] are also based on the S&MPO line lists. This is the case of
recent improvements in HITRAN and also in GEISA [49] for which
the last release essentially contained the earlier 2015 update from
the S&MPO.
In the second step, the line lists were validated by simulating
atmospheric spectra as discussed in Section 2.3.3 .
The new or completely recalculated bands of the principal iso-
topologue of ozone implemented in HITRAN2016 are summarized
in Table 5 . The present release of the ozone data contains 29,006
new lines and 46,688 updated lines of 16 O 3 (a graphical overview
in the 20 0-50 0 0 cm
-1 region can be seen in Fig. 8 ).
2.3.1. Cold bands
2.3.1.1. 5-μm region: tetrad {(0 02),(101),(20 0),(030)} – (0 0 0). The 5-
μm range is of particular importance for the retrieval of atmo-
spheric ozone from ground-based and satellite observations, as this
is the second strongest absorbing range in the ozone spectrum af-
ter the 10-μm bands. For this reason, the consistency of ozone in-
tensities between the 5-μm and 10-μm regions as well as with UV
ozone absorption is a major issue that has been a subject of many
discussions ([124,125] and references therein). The line parameters
in previous HITRAN versions for the strongest bands, i.e. the first
triad ν1 + ν3 , 2 ν1 , 2 ν3 , in the 5-μm interval were from the work by
Flaud et al. [126] . Subsequently, the FTS spectra were re-visited by
Barbe et al. [127] though the corresponding data had not been in-
cluded in HITRAN. Recently new measurements and analyses have
been performed by the GSMA (Groupe de Spectrométrie Molécu-
laire et Atmosphérique) team from Reims University [120,128] . In
2015, a major update of line positions and intensities based on
the list generated together with the Laboratory of Theoretical Spec-
troscopy of the Institute of Atmospheric Optics (Tomsk) was intro-
duced in the S&MPO [119] . For the 2 ν1 and 2 ν3 bands, the differ-
ence in the integrated intensities, S V , exceeded 6% between S&MPO
and HITRAN2012. The analysis [128] covering the 1856–2273 cm
−1
region also included the 3 ν2 band, which is coupled with ν1 + ν3
via an accidental Coriolis interaction. Another resonance accounted
for in this list explains the anomalously strong �K a = 5 lines that
have been detected in atmospheric observations by Goldman et
al. [129] . Janssen et al. [125] reported a comparative study of the
sensitivity of FTIR ground-based measurements of the atmospheric
ozone concentration with respect to line parameters included in
the HITRAN2012, GEISA2015 and S&MPO databases in 10- and 5-
μm regions. They have concluded that “only S&MPO gives an en-
tirely consistent result at the ± 1% level”. Consequently, we in-
clude the S&MPO line positions and intensities in the present HI-
TRAN release. This should improve both intensity distribution in
the ro-vibrational lines of the 5-μm bands and their consistency
with the 10-μm range. The line-shape parameters for all the lines
were estimated using the semi-empirical procedure described in
the HITRAN2008 paper. This model largely relies on a slightly re-
vised empirical model for the fundamental bands from Ref. [130] .
2.3.1.2. 2335–2617 cm
−1 : bands {(120),(021)}–(0 0 0). Another spec-
tral interval where S&MPO and HITRAN2012 ozone data differ sig-
nificantly is for the 2 ν2 + ν3 , ν1 + 2 ν2 bands in the 2335-2617 cm
−1
range. Previous HITRAN versions included the MIPAS list [131] for
Please cite this article as: I.E. Gordon et al., The HITRAN2016 molecular spectroscopic database, Journal of Quantitative Spectroscopy &
Radiative Transfer (2017), http://dx.doi.org/10.1016/j.jqsrt.2017.06.038

I.E. Gordon et al. / Journal of Quantitative Spectroscopy & Radiative Transfer 0 0 0 (2017) 1–66 15
ARTICLE IN PRESS
JID: JQSRT [m5G; August 21, 2017;14:18 ]
Table 5
HITRAN2016 ozone update summary: principal isotopologue 16 O 3 .
Band v ′ -v ′′ N Region (cm
−1 ) S v
001–010 1781 281.14–377.51 1.255 × 10 −21
100–010 619 295.42–446.63 2.646 × 10 −23
030–020 2558 598.26–804.86 1.942 × 10 −21
101–020 6 656.12–725.68 4.937 × 10 −25
0 02–10 0 1779 899.45–1176.42 3.233 × 10 −21
101–100 3604 911.32–1215.49 6.100 × 10 −20
101–001 3457 921.37–1211.67 5.148 × 10 −21
0 02–0 01 4379 926.56–1193.79 1.651 × 10 −19
20 0–10 0 3966 940.22–1229.80 3.141 × 10 −21
030–100 20 956.13–1170.40 1.916 × 10 −23
20 0–0 01 2964 956.68–1235.44 6.852 × 10 −21
030–001 15 957.33–1201.66 2.254 × 10 −24
002–010 467 1302.52–1435.34 3.750 × 10 −23
101–010 1637 1347.52–1438.73 9.393 × 10 −22
030–010 369 1366.12–1475.95 2.268 × 10 −23
200–010 102 1366.62–1541.76 5.305 × 10 −24
0 02–0 0 0 6486 1856.83–2280.54 1.019 × 10 −19
20 0–0 0 0 6122 1909.98–2340.81 3.020 × 10 −20
101–0 0 0 7067 1921.44–2328.94 1.194 × 10 −18
030–0 0 0 105 2022.87–2272.37 4.092 × 10 −22
021–0 0 0 1482 2335.99–2440.14 4.360 × 10 −22
120–0 0 0 2095 2395.22–2616.83 3.063 × 10 −22
013–010 2459 2889.23–3090.28 4.735 × 10 −21
112–010 2046 2910.00–3121.94 3.816 × 10 −22
023–010 1355 3564.72–3657.05 3.676 × 10 −22
013–0 0 0 2673 3584.62–3791.77 5.713 × 10 −21
122–010 620 3584.75–3751.75 3.530 × 10 −23
112–0 0 0 3056 3600.25–3831.27 8.306 × 10 −22
400–010 4 3623.87–3653.87 6.743 × 10 −25
311–100 729 3739.97–3826.22 2.398 × 10 −23
0 05–10 0 508 3742.91–3726.13 1.660 × 10 −23
104–100 51 3752.69–3863.55 8.192 × 10 −25
0 05–0 01 278 3807.31–3917.54 9.849 × 10 −24
311–001 436 3810.30–3946.73 9.846 × 10 −24
104–001 950 3820.17–3894.94 2.218 × 10 −22
005–010 848 4128.33–4228.24 2.371 × 10 −23
311–010 1018 4129.14–4228.62 3.4 4 4 × 10 −23
104–010 66 4146.09–4228.28 6.310 × 10 −25
023–0 0 0 1192 4268.37–4357.21 1.928 × 10 −22
122–0 0 0 724 4284.15–4454.93 4.359 × 10 −23
40 0–0 0 0 8 4325.56–4398.58 5.896 × 10 −25
213–100 63 4384.72–4423.50 1.417 × 10 −24
321–100 126 4 429.78–4 466.82 5.750 × 10 −24
114–001 306 4452.15–4508.72 1.313 × 10 −23
213–010 503 4757.08–4825.80 2.346 × 10 −23
104–0 0 0 1093 4 802.98–4 978.61 7.789 × 10 −23
0 05–0 0 0 1514 4 806.33–4 938.21 5.300 × 10 −22
311–0 0 0 1053 4 827.65–4 928.4 9 3.450 × 10 −22
Note : N is the number of transitions, S v is the integrated intensity in units of cm
1 /(molecule ·cm
2 ).
2 ν2 + ν3 and older data from Flaud et al. [126] for ν1 + 2 ν2 . S&MPO
data in this range were initially based on the analyses of Barbe
et al. [132] . Subsequently, new Reims FTS measurements with a
better signal-to-noise ratio [120] suggested an empirical intensity
scaling factor of 0.86 for these bands. The resulting line list is pro-
vided for this release of HITRAN. Recently, accurate ab initio dipole
moment surfaces of ozone were constructed by Tyuterev et al.
[133] that allowed theoretical intensities to be obtained from varia-
tional nuclear-motion calculations which used the potential energy
surface of Ref [134] . The shape of the ν1 + 2 ν2 band given by these
calculations is qualitatively more consistent with the S&MPO data
incorporated in the new list of HITRAN2016 than HITRAN2012 (see
Fig. 9 ).
2.3.1.3. 3584–3831 cm
−1 range: {(013),(112)}–(0 0 0) bands. The
S&MPO contains data for the ν2 + 3 ν3 and ν1 + ν2 + 2 ν3 bands in
the range 3584–3831 cm
−1 based on a larger sample of assigned
transitions [135] than the previous releases of HITRAN (see Table
4 of Babikov et al. [119] ). The parameters can be found in the cor-
responding sections of the online S&MPO site [119] , and 5729 tran-
sitions are now included that makes the integrated intensity of the
ν1 + ν2 + 2 ν3 band nearly 5 times stronger ( Table 5 ) than in the
previous release.
2.3.1.4. 4268–4399 cm
−1 range: {(023),(122),(40 0)}–(0 0 0) bands.
In the range 4200– 4525 cm
−1 , only the 3 ν1 + ν3 [136] and
2 ν1 + 2 ν2 + ν3 [137] cold bands were included in the previ-
ous releases of HITRAN, whereas the 2 ν2 + 3 ν3 , ν1 + 2 ν2 + 2 ν3
and 4 ν1 bands in the 4268–4399 cm
−1 range were miss-
ing, although they correspond to a total integrated intensity
of 2.4 × 10 −22 cm
−1 /molecule cm
−2 . The corresponding analyses
[121,138] are as yet unpublished, but the line parameters can be
found at the online S&MPO site [119] and are now incorporated in
HITRAN2016.
2.3.1.5. 4802–4929 cm
−1 range: {(005),(311),(104)}– (000) bands.
Line parameters for the 5 ν3 , 3 ν1 + ν2 + ν3 and ν1 + 4 ν3 bands
around 4900 cm
−1 are calculated for the HITRAN database us-
ing the spectroscopic parameters of Flaud et al. [139] . These
bands were then re-analyzed using new spectra recorded in
Please cite this article as: I.E. Gordon et al., The HITRAN2016 molecular spectroscopic database, Journal of Quantitative Spectroscopy &
Radiative Transfer (2017), http://dx.doi.org/10.1016/j.jqsrt.2017.06.038

16 I.E. Gordon et al. / Journal of Quantitative Spectroscopy & Radiative Transfer 0 0 0 (2017) 1–66
ARTICLE IN PRESS
JID: JQSRT [m5G; August 21, 2017;14:18 ]
Fig. 9. Comparison of HITRAN2012 and HITRAN2016 ozone line lists in the range
of 2 ν2 + ν3 and ν1 + 2 ν2 bands with recent ab initio calculations using the dipole-
moment surface of Tyuterev et al. [133] that provides qualitative confirmation of
the rotational distribution of intensities in the ν1 + 2 ν2 band given by HITRAN2016.
Reims [120] resulting in a new set of the Hamiltonian parame-
ters for the strongly coupled {(005),(104),(311)} vibration states.
The corresponding line lists have been generated using these im-
proved spectroscopic parameters. Unpublished Hamiltonian param-
eters can be found in the S&MPO system at http://smpo.iao.ru/
1408x675/en/lev/par/1/19/ . The (S&MPO
–HITRAN2012) differences
in the line positions are up to 0.065 cm
−1 . The intensity ratios for
three cold bands are shown in Fig. 10 .
2.3.2. Hot bands
2.3.2.1. 281–447 cm
−1 (dyad - ν2 ). The ozone spectrum in the range
281–447 cm
−1 is dominated by hot ν3 - ν2 and ν1 - ν2 bands whose
intensities were underestimated in the previous HITRAN releases
compared to the S&MPO line list [120] which was generated using
the empirical transition moments parameters of Birk et al. [140] .
The S&MPO parameters are confirmed by the recent ab initio in-
tensity calculations [133] and the corresponding update is thus in-
cluded in the present HITRAN release.
2.3.2.2. 598–1541 cm
−1 : hot bands towards the tetrad re-
gion. The unpublished version of the newly determined
tetrad {(0 02),(101),(20 0),(030)} parameters by Tyuterev et
al. [128] can be found at the S&MPO online site ( http:
//smpo.iao.ru/1396x659/en/lev/par/1/6/ ). Using this set, 14 hot
bands in the range 598–1541 cm
−1 that go from the (010), (020),
(0 01) and (10 0) states to the tetrad were re-calculated and are
now included in the present HITRAN release with a significantly
augmented number of transitions. The transition moment pa-
rameters of Ref. [128] for {(101),(030)}–(010) bands and those
extrapolated from cold bands [141] were used.
2.3.2.3. 2889–3122 cm
−1 range: {(013),(112)}–(010) bands ; 3564–
3752 cm
-1 range: {(023),(122)}–(010) bands . In the ranges 2889–
3122 cm
−1 and 3564–3752 cm
−1 the {(013),(112)}–(010) and
{(023),(122)}–(010) hot bands are updated using the same upper-
state EH parameters as for the corresponding cold bands and the
ETM parameters of Mikhailenko et al. [142]
2.3.2.4. 3623–4229 cm
−1 : hot bands to the V = 5 triad
{(005),(311),(104)}. New line lists for 14 hot bands in the range
3623–4229 cm
−1 corresponding to the transitions from the (010,
(001) and (100) states to the updated [120] triad {(005),(311),(104)}
of five vibrational quanta are also included.
2.3.2.5. 4384–4826 cm
−1 : missing hot bands to (213),(321) and (114)
upper states. The coupled vibrational states {(213),(321),(114)}
have been re-analyzed in Ref [143] with the FTS spectra recorded
in Reims. Using these upper-state parameters we now provide
four associated hot bands [119] in the range 4384–4826 cm
−1
that were missing in previous HITRAN versions. The ETM pa-
rameters were extrapolated from the corresponding cold bands:
for 2 ν2 + ν2 + 3 ν3 - ν1 and ν2 + ν2 + 4 ν3 - ν3 from Ref [144] , for
2 ν2 + ν2 + 3 ν3 - ν2 from Ref [145] , and for 3 ν2 + 2 ν2 + ν3 - ν1 from Ref
[137] .
2.3.3. Validations and empirical corrections
As mentioned in the introduction to Section 2.3 , the second
step was a validation of effective model calculations by a compar-
ison of simulated absorption cross-sections with observed spectra.
To this end, high-resolution laboratory FTS spectra of Reims and
Kitt-Peak (up to 5700 cm
−1 ) were used alongside MklV balloon
atmospheric spectra [146] , using similar procedures to those de-
scribed by Toon et al. in [147] . The MkIV balloon spectra cover
650–5650 cm
−1 simultaneously in every spectrum, so every win-
dow is fitted in every spectrum, making it easier to quantify
window-to-window biases.
No major problems were seen with the initial O 3 data set pre-
pared for HITRAN2016, at least for strong and medium-strength
bands. The new line list provides improved spectral fits in the
2100 cm
−1 region as compared with HITRAN2012 and also better
consistency with other bands in terms of the retrieved O 3 amounts
in the 20 0 0–220 0 cm
−1 region. But it was found that empirical
corrections were needed to some line positions to reduce residu-
als between observed and simulated cross-sections. These correc-
tions concern a limited sample of about 0.1% transitions and are
essentially of two types. First, small line position corrections are
typically of the order of ∼10 −3 cm
−1 up to 10 −2 cm
−1 in a few
cases. The most extreme deviations were corrected already for HI-
TRAN2016, but additional corrections will be done in the near fu-
ture. Note that these corrections are not reflected in Table 5 where
Please cite this article as: I.E. Gordon et al., The HITRAN2016 molecular spectroscopic database, Journal of Quantitative Spectroscopy &
Radiative Transfer (2017), http://dx.doi.org/10.1016/j.jqsrt.2017.06.038
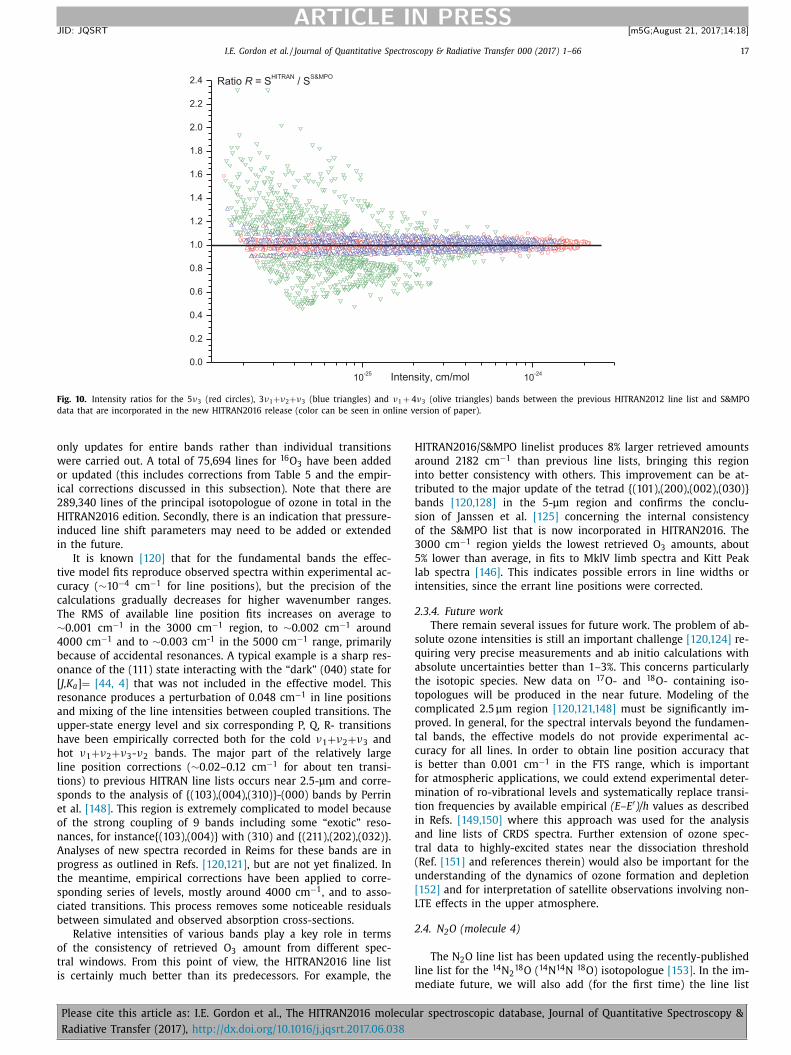
I.E. Gordon et al. / Journal of Quantitative Spectroscopy & Radiative Transfer 0 0 0 (2017) 1–66 17
ARTICLE IN PRESS
JID: JQSRT [m5G; August 21, 2017;14:18 ]
Fig. 10. Intensity ratios for the 5 ν3 (red circles), 3 ν1 + ν2 + ν3 (blue triangles) and ν1 + 4 ν3 (olive triangles) bands between the previous HITRAN2012 line list and S&MPO
data that are incorporated in the new HITRAN2016 release (color can be seen in online version of paper).
only updates for entire bands rather than individual transitions
were carried out. A total of 75,694 lines for 16 O 3 have been added
or updated (this includes corrections from Table 5 and the empir-
ical corrections discussed in this subsection). Note that there are
289,340 lines of the principal isotopologue of ozone in total in the
HITRAN2016 edition. Secondly, there is an indication that pressure-
induced line shift parameters may need to be added or extended
in the future.
It is known [120] that for the fundamental bands the effec-
tive model fits reproduce observed spectra within experimental ac-
curacy ( ∼10 −4 cm
−1 for line positions), but the precision of the
calculations gradually decreases for higher wavenumber ranges.
The RMS of available line position fits increases on average to
∼0.001 cm
−1 in the 3000 cm
−1 region, to ∼0.002 cm
−1 around
40 0 0 cm
−1 and to ∼0.003 cm
-1 in the 50 0 0 cm
−1 range, primarily
because of accidental resonances. A typical example is a sharp res-
onance of the (111) state interacting with the “dark” (040) state for
[ J,K a ] = [44, 4] that was not included in the effective model. This
resonance produces a perturbation of 0.048 cm
−1 in line positions
and mixing of the line intensities between coupled transitions. The
upper-state energy level and six corresponding P, Q, R- transitions
have been empirically corrected both for the cold ν1 + ν2 + ν3 and
hot ν1 + ν2 + ν3 - ν2 bands. The major part of the relatively large
line position corrections ( ∼0.02–0.12 cm
−1 for about ten transi-
tions) to previous HITRAN line lists occurs near 2.5-μm and corre-
sponds to the analysis of {(103),(004),(310)}-(000) bands by Perrin
et al. [148] . This region is extremely complicated to model because
of the strong coupling of 9 bands including some “exotic” reso-
nances, for instance{(103),(004)} with (310) and {(211),(202),(032)}.
Analyses of new spectra recorded in Reims for these bands are in
progress as outlined in Refs. [120,121] , but are not yet finalized. In
the meantime, empirical corrections have been applied to corre-
sponding series of levels, mostly around 40 0 0 cm
−1 , and to asso-
ciated transitions. This process removes some noticeable residuals
between simulated and observed absorption cross-sections.
Relative intensities of various bands play a key role in terms
of the consistency of retrieved O 3 amount from different spec-
tral windows. From this point of view, the HITRAN2016 line list
is certainly much better than its predecessors. For example, the
HITRAN2016/S&MPO linelist produces 8% larger retrieved amounts
around 2182 cm
−1 than previous line lists, bringing this region
into better consistency with others. This improvement can be at-
tributed to the major update of the tetrad {(101),(20 0),(0 02),(030)}
bands [120,128] in the 5-μm region and confirms the conclu-
sion of Janssen et al. [125] concerning the internal consistency
of the S&MPO list that is now incorporated in HITRAN2016. The
30 0 0 cm
−1 region yields the lowest retrieved O 3 amounts, about
5% lower than average, in fits to MklV limb spectra and Kitt Peak
lab spectra [146] . This indicates possible errors in line widths or
intensities, since the errant line positions were corrected.
2.3.4. Future work
There remain several issues for future work. The problem of ab-
solute ozone intensities is still an important challenge [120,124] re-
quiring very precise measurements and ab initio calculations with
absolute uncertainties better than 1–3%. This concerns particularly
the isotopic species. New data on
17 O- and
18 O- containing iso-
topologues will be produced in the near future. Modeling of the
complicated 2.5 μm region [120,121,148] must be significantly im-
proved. In general, for the spectral intervals beyond the fundamen-
tal bands, the effective models do not provide experimental ac-
curacy for all lines. In order to obtain line position accuracy that
is better than 0.001 cm
−1 in the FTS range, which is important
for atmospheric applications, we could extend experimental deter-
mination of ro-vibrational levels and systematically replace transi-
tion frequencies by available empirical (E–E ′ )/h values as described
in Refs. [149,150] where this approach was used for the analysis
and line lists of CRDS spectra. Further extension of ozone spec-
tral data to highly-excited states near the dissociation threshold
(Ref. [151] and references therein) would also be important for the
understanding of the dynamics of ozone formation and depletion
[152] and for interpretation of satellite observations involving non-
LTE effects in the upper atmosphere.
2.4. N 2 O (molecule 4)
The N 2 O line list has been updated using the recently-published
line list for the 14 N 2 18 O ( 14 N
14 N
18 O) isotopologue [153] . In the im-
mediate future, we will also add (for the first time) the line list
Please cite this article as: I.E. Gordon et al., The HITRAN2016 molecular spectroscopic database, Journal of Quantitative Spectroscopy &
Radiative Transfer (2017), http://dx.doi.org/10.1016/j.jqsrt.2017.06.038

18 I.E. Gordon et al. / Journal of Quantitative Spectroscopy & Radiative Transfer 0 0 0 (2017) 1–66
ARTICLE IN PRESS
JID: JQSRT [m5G; August 21, 2017;14:18 ]
that has already been constructed for the 15 N 2 16 O ( 15 N
15 N
16 O) iso-
topologue based on Ref. [154] . Both line lists were generated using
the results of the global modeling of the line positions and inten-
sities within the framework of the method of effective operators.
The polyad model of effective Hamiltonian (EH) [155] was used
in both cases. The parameters of the effective Hamiltonians were
fit to the line positions collected from the literature. The global
RMS of the line position fit for 15 N 2 16 O is 0.0011 cm
−1 and for 14 N 2
18 O is 0.0016 cm
−1 . The uncertainties in the fitted line posi-
tions depend on the quality of experimental data and vary from
0.0046 cm
−1 to 2 × 10 −6 cm
−1 .
The line intensities were calculated using fitted sets of the ef-
fective dipole moment parameters for a particular isotopologue
where possible. Note that the line intensity measurements for rare
isotopologues of N 2 O are very scarce. Therefore, based on the the-
oretical results of Ref. [156] (in which contributions due to isotopic
substitution to the values of the effective dipole moment parame-
ters were shown to be negligible) the majority of the line intensi-
ties were calculated using the effective dipole moment parameters
of the principal isotopologue [157] . The partition sums were taken
from Ref. [112] for 14 N 2 18 O and calculated using direct summation
for 15 N 2 16 O [154] .
It is well known that the nitrous oxide EH polyad model does
not work in a totally satisfactory manner because of the exis-
tence of a number of Coriolis and anharmonic interpolyad reso-
nance interactions (see, for example, Refs. [158,159] ). But usually
these kinds of interactions take place in the high-wavenumber
region for the weak bands. Adopting an intensity cutoff of
10 −29 cm
−1 /molecule cm
−2 at 296 K, including the isotopic abun-
dance factors 1.986 × 10 −3 for 14 N 2 18 O and 1.32 × 10 −5 for 15 N 2
16 O,
overcomes the problem of the interpolyad resonance perturbations
in practice because the most affected transitions are omitted. Nev-
ertheless, line parameters for the very weak bands have to be used
with caution.
For the 14 N 2 18 O isotopologue, Toth’s [160] lines given in HI-
TRAN2012 are retained and only new line parameters from the
line list of Ref. [153] are added to HITRAN2016. Line positions
from the line lists of Refs. [153,154] are assigned uncertainty code
6 (0.0 0 0 0 01–0.0 0 0 01 cm
−1 ) in the MW region and 3 (0.001–
0.01 cm
−1 ) in the IR region. For the line intensities from these line
lists, the uncertainty code 3 ( > 20%) is adopted.
Line-shape parameters as well as Rosenkranz [35] line-mixing
coefficients for the main isotopologue lines belonging to the ν3
ro-vibrational band are taken from the work of Loos et al. [161] .
These parameters originate from a multispectrum fit of air broad-
ened Fourier-Transform transmittance measurements at ambient
temperature. The experimental data of Loos et al. was fitted using
a quadratic speed-dependent Voigt model based on the Hartmann-
Tran profile [7,8,14] , extended to account for line mixing in the
Rosenkranz first-order perturbation approximation [35] . As a re-
sult, air-broadening, air-speed-dependence, air pressure shift and
line-mixing parameters were retrieved in the spectral range 2184.8
to 2251.6 cm
−1 for P- and R-branch lines up to J ′′ = 40 and 39, re-
spectively.
2.5. CO (molecule 5)
In order to improve the quality and consistency (between bands
and isotopologues) of the intensities of the lines of carbon monox-
ide in HITRAN, a new piece-wise dipole moment function (DMF)
was created [162] using the direct fit approach that was developed
in Ref. [163] , supplemented with new ab initio calculations [162] .
In order to ensure the best results, new experiments were carried
out in Ref. [162] for the 4–0 band and the first measurements of
the 6–0 band were performed to add into the direct fit.
The line intensity and position calculations were performed us-
ing this new DMF in conjunction with the wavefunctions calcu-
lated from the experimentally-determined potential energy func-
tion (PEF) from Coxon and Hajigeorgiou [164] . Calculations were
carried out using version 8.0 of LEVEL [165] .
The new dipole moment function has proven to be a substan-
tial improvement over the one used previously. In this edition of
the database it was used to calculate HITRAN intensity values in all
the bands of all isotopologues. Fig. 6 of Li et al. [162] shows a com-
parison of the available experimental data in different bands of the
principal isotopologue, with new calculations, HITRAN2012, and ab
initio calculations. It is clear that intensities from Li et al. agree
much better with experimental values than previous data. This also
becomes important for the consistency of intensities between the
isotopologues (due to the use of the same dipole moment func-
tion for all of them); previously a lot of lines for the principal iso-
topologues had intensities from accurate laboratory measurements
whereas minor isotopologue intensities were still calculated with
outdated dipole moment functions. Finally, the new work allows
one to add a few more bands and also line lists for radioactive
isotopologues of carbon monoxide, which, as we mentioned in the
CO 2 section, are provided in static files rather than through the HI-
TRANonline interface.
Apart from the intensities, the Li et al. line list features: a)
line positions calculated based on the potential energy function
from Ref. [164] ; b) air- and self-broadening parameters from a so-
phisticated semi-empirical approach, c) air-induced shift obtained
for all the lines by extrapolating measurements carried out in the
2–0 band by Devi et al. [166] , where the Hartmann and Boulet
[167] approach was used for extrapolating; d) widths (and their
temperature dependencies) and shift due to pressure of H 2 and
CO 2 important for planetary and combustion research were also
provided employing semi-empirical approaches similar to the ones
used for air and self pressure-induced values.
We have adapted the Li et al. line list for this edition of the
HITRAN database with a few notable changes:
1) Since the original Li et al. line list was aimed at high-
temperature applications, it was truncated here with an inten-
sity cutoff of 10 −31 cm
−1 /(molecule •cm
−2 ) (in natural abun-
dance of the isotopologues) for all the lines except those in
the MW region where a cutoff of 10 −42 cm
−1 /(molecule •cm
−2 )
was used to satisfy some astrophysical applications.
2) It was found that there was a minor compatibility issue be-
tween LEVEL and PEF from Coxon and Hajigeorgiou [164] . This
resulted in a growing (with rotational quantum number) devia-
tion of the calculated line positions from their real values. This
has now been fixed.
3) The line positions from the high-accuracy experiments that
employ best calibration standards, including frequency combs,
were used wherever available. In the first overtone, data from
Pollock et al. [168] were used, in the second overtone data from
Refs. [169,170] were employed, while in the fifth overtone Tan
et al. line positions were taken when available [171] .
4) When high-quality experimental measurements of the air- and
self-broadening and shift parameters were available in HI-
TRAN2012, they were taken in place of the semi-empirical
values from Li et al. This includes the values for the speed-
dependent Voigt (with line mixing) profile for the first overtone
from Devi et al. [166,172] .
5) Helium-broadening parameters, their temperature dependence
and pressure shift due to He were added. The broadening pa-
rameters were taken from Sinclair et al. [173] who provide both
experimental values and values obtained from a fit to a semi-
empirical model. We used experimental values where available
and semi-empirical values for all other transitions. Although
Please cite this article as: I.E. Gordon et al., The HITRAN2016 molecular spectroscopic database, Journal of Quantitative Spectroscopy &
Radiative Transfer (2017), http://dx.doi.org/10.1016/j.jqsrt.2017.06.038
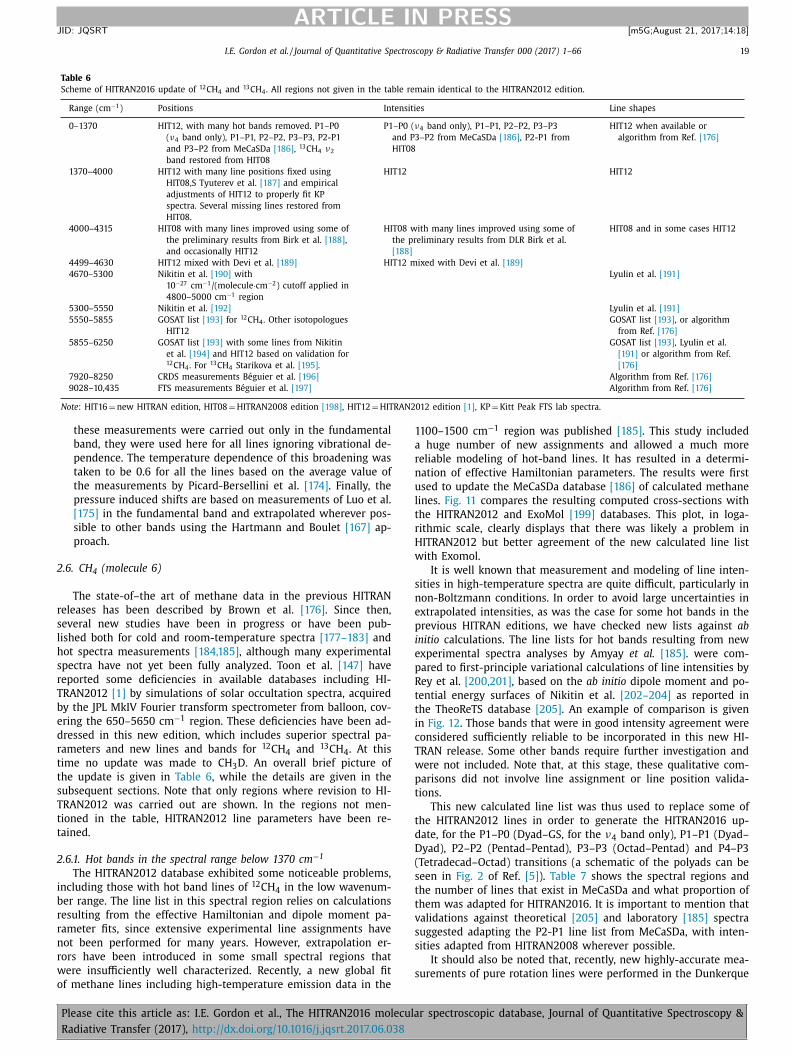
I.E. Gordon et al. / Journal of Quantitative Spectroscopy & Radiative Transfer 0 0 0 (2017) 1–66 19
ARTICLE IN PRESS
JID: JQSRT [m5G; August 21, 2017;14:18 ]
Table 6
Scheme of HITRAN2016 update of 12 CH 4 and 13 CH 4 . All regions not given in the table remain identical to the HITRAN2012 edition.
Range (cm
−1 ) Positions Intensities Line shapes
0–1370 HIT12, with many hot bands removed. P1–P0
( ν4 band only), P1–P1, P2–P2, P3–P3, P2-P1
and P3–P2 from MeCaSDa [186] , 13 CH 4 ν2
band restored from HIT08
P1–P0 ( ν4 band only), P1–P1, P2–P2, P3–P3
and P3–P2 from MeCaSDa [186] , P2-P1 from
HIT08
HIT12 when available or
algorithm from Ref. [176]
1370–40 0 0 HIT12 with many line positions fixed using
HIT08,S Tyuterev et al. [187] and empirical
adjustments of HIT12 to properly fit KP
spectra. Several missing lines restored from
HIT08.
HIT12 HIT12
40 0 0–4315 HIT08 with many lines improved using some of
the preliminary results from Birk et al. [188] ,
and occasionally HIT12
HIT08 with many lines improved using some of
the preliminary results from DLR Birk et al.
[188]
HIT08 and in some cases HIT12
4499–4630 HIT12 mixed with Devi et al. [189] HIT12 mixed with Devi et al. [189]
4670–5300 Nikitin et al. [190] with
10 −27 cm
−1 /(molecule ·cm
−2 ) cutoff applied in
480 0–50 0 0 cm
−1 region
Lyulin et al. [191]
5300–5550 Nikitin et al. [192] Lyulin et al. [191]
5550–5855 GOSAT list [193] for 12 CH 4 . Other isotopologues
HIT12
GOSAT list [193] , or algorithm
from Ref. [176]
5855–6250 GOSAT list [193] with some lines from Nikitin
et al. [194] and HIT12 based on validation for 12 CH 4 . For 13 CH 4 Starikova et al. [195] .
GOSAT list [193] , Lyulin et al.
[191] or algorithm from Ref.
[176]
7920–8250 CRDS measurements Béguier et al. [196] Algorithm from Ref. [176]
9028–10,435 FTS measurements Béguier et al. [197] Algorithm from Ref. [176]
Note : HIT16 = new HITRAN edition, HIT08 = HITRAN2008 edition [198] , HIT12 = HITRAN2012 edition [1] , KP = Kitt Peak FTS lab spectra.
these measurements were carried out only in the fundamental
band, they were used here for all lines ignoring vibrational de-
pendence. The temperature dependence of this broadening was
taken to be 0.6 for all the lines based on the average value of
the measurements by Picard-Bersellini et al. [174] . Finally, the
pressure induced shifts are based on measurements of Luo et al.
[175] in the fundamental band and extrapolated wherever pos-
sible to other bands using the Hartmann and Boulet [167] ap-
proach.
2.6. CH 4 (molecule 6)
The state-of–the art of methane data in the previous HITRAN
releases has been described by Brown et al. [176] . Since then,
several new studies have been in progress or have been pub-
lished both for cold and room-temperature spectra [177–183] and
hot spectra measurements [184,185] , although many experimental
spectra have not yet been fully analyzed. Toon et al. [147] have
reported some deficiencies in available databases including HI-
TRAN2012 [1] by simulations of solar occultation spectra, acquired
by the JPL MkIV Fourier transform spectrometer from balloon, cov-
ering the 650–5650 cm
−1 region. These deficiencies have been ad-
dressed in this new edition, which includes superior spectral pa-
rameters and new lines and bands for 12 CH 4 and
13 CH 4 . At this
time no update was made to CH 3 D. An overall brief picture of
the update is given in Table 6 , while the details are given in the
subsequent sections. Note that only regions where revision to HI-
TRAN2012 was carried out are shown. In the regions not men-
tioned in the table, HITRAN2012 line parameters have been re-
tained.
2.6.1. Hot bands in the spectral range below 1370 cm
−1
The HITRAN2012 database exhibited some noticeable problems,
including those with hot band lines of 12 CH 4 in the low wavenum-
ber range. The line list in this spectral region relies on calculations
resulting from the effective Hamiltonian and dipole moment pa-
rameter fits, since extensive experimental line assignments have
not been performed for many years. However, extrapolation er-
rors have been introduced in some small spectral regions that
were insufficiently well characterized. Recently, a new global fit
of methane lines including high-temperature emission data in the
1100–1500 cm
−1 region was published [185] . This study included
a huge number of new assignments and allowed a much more
reliable modeling of hot-band lines. It has resulted in a determi-
nation of effective Hamiltonian parameters. The results were first
used to update the MeCaSDa database [186] of calculated methane
lines. Fig. 11 compares the resulting computed cross-sections with
the HITRAN2012 and ExoMol [199] databases. This plot, in loga-
rithmic scale, clearly displays that there was likely a problem in
HITRAN2012 but better agreement of the new calculated line list
with Exomol.
It is well known that measurement and modeling of line inten-
sities in high-temperature spectra are quite difficult, particularly in
non-Boltzmann conditions. In order to avoid large uncertainties in
extrapolated intensities, as was the case for some hot bands in the
previous HITRAN editions, we have checked new lists against ab
initio calculations. The line lists for hot bands resulting from new
experimental spectra analyses by Amyay et al. [185] . were com-
pared to first-principle variational calculations of line intensities by
Rey et al. [200,201] , based on the ab initio dipole moment and po-
tential energy surfaces of Nikitin et al. [202–204] as reported in
the TheoReTS database [205] . An example of comparison is given
in Fig. 12 . Those bands that were in good intensity agreement were
considered sufficiently reliable to be incorporated in this new HI-
TRAN release. Some other bands require further investigation and
were not included. Note that, at this stage, these qualitative com-
parisons did not involve line assignment or line position valida-
tions.
This new calculated line list was thus used to replace some of
the HITRAN2012 lines in order to generate the HITRAN2016 up-
date, for the P1–P0 (Dyad–GS, for the ν4 band only), P1–P1 (Dyad–
Dyad), P2–P2 (Pentad–Pentad), P3–P3 (Octad–Pentad) and P4–P3
(Tetradecad–Octad) transitions (a schematic of the polyads can be
seen in Fig. 2 of Ref. [5] ). Table 7 shows the spectral regions and
the number of lines that exist in MeCaSDa and what proportion of
them was adapted for HITRAN2016. It is important to mention that
validations against theoretical [205] and laboratory [185] spectra
suggested adapting the P2-P1 line list from MeCaSDa, with inten-
sities adapted from HITRAN2008 wherever possible.
It should also be noted that, recently, new highly-accurate mea-
surements of pure rotation lines were performed in the Dunkerque
Please cite this article as: I.E. Gordon et al., The HITRAN2016 molecular spectroscopic database, Journal of Quantitative Spectroscopy &
Radiative Transfer (2017), http://dx.doi.org/10.1016/j.jqsrt.2017.06.038

20 I.E. Gordon et al. / Journal of Quantitative Spectroscopy & Radiative Transfer 0 0 0 (2017) 1–66
ARTICLE IN PRESS
JID: JQSRT [m5G; August 21, 2017;14:18 ]
Fig. 11. Comparison of cross-sections calculated at 1 cm
−1 resolution between different databases: MeCaSDa [186] (used for the present HITRAN update), HITRAN2012, and
ExoMol [199] .
Fig. 12. Comparison of line intensities for hot bands of 12 CH 4 in the 7 to 8 μm range using the HITRAN2016 updated list based on experimental spectra analyses, Amyay et
al. [185] (upper panels in black) with variational calculations, Rey et al. [201] based on ab initio dipole moment [202] and potential energy [203,204] surfaces using the line
list included in the TheoReTS database [205] (lower panels upside down in red).
Table 7
Number of calculated 12 CH 4 lines taken from the MeCaSDa database [186] for some transi-
tions, up to a maximum J value. The difference for the number of lines in the two databases
is due to a different intensity cut-off with I min down to 10 −40 cm/molecule in MeCaSDa.
The weakest transitions were not retained for the present HITRAN update that includes I min
= 10 −25 for P3-P2 and 10 −30 cm/molecule for other hot bands.
Transition P1–P0 ( ν4 ) P1–P1 P2–P2 < 300 cm
–1 P3–P2 < 1370 cm
–1
J max 30 30 30 30
# lines (MeCaSDa) 13,315 54,677 457,620 2,175,406
# lines(HIT16) 9662 9721 10,701 950
group [206] . These lines have been included in the global fit lead-
ing to the effective Hamiltonian parameters used for the present
update.
2.6.2. 1370–40 0 0 cm
−1 region
This region mainly includes the ν2 band, the Pentad bands and
relatively weak bands at the lower part of the Octad. As discussed
by Toon et al. [147] , HITRAN2012 data were plagued with erro-
neous line positions for lines of intermediate strength, many of
which had been substantially superior in the HITRAN2008 edition
of the database. It was found that a large number of these lines
had been assigned line position uncertainty code 1 (i.e. between
0.1 and 1 cm
−1 ) and originate from the model used in Daumont
et al. [207] . For HITRAN2016, wherever possible in the Pentad re-
Please cite this article as: I.E. Gordon et al., The HITRAN2016 molecular spectroscopic database, Journal of Quantitative Spectroscopy &
Radiative Transfer (2017), http://dx.doi.org/10.1016/j.jqsrt.2017.06.038

I.E. Gordon et al. / Journal of Quantitative Spectroscopy & Radiative Transfer 0 0 0 (2017) 1–66 21
ARTICLE IN PRESS
JID: JQSRT [m5G; August 21, 2017;14:18 ]
gion, these transitions were reverted to HITRAN2008 and, where
this was not possible, line positions from Tyuterev et al. [187] were
used. Unfortunately not all problematic line positions were easy to
identify on a global scale by just the uncertainty index. Validations
against Kitt Peak FT spectra recorded at multiple thermodynamic
conditions have shown that more errors associated with line posi-
tions remained although the offending lines were not labeled with
a low uncertainty code. The most obvious outliers have been iden-
tified and fixed either by employing Ref. [187] or adjusting line po-
sitions to fit the low-pressure KP experimental spectra. This pro-
vided a significant improvement of the residuals, including those
discussed in Toon et al. [147] .
2.6.3. 40 0 0–4630 cm
−1 (correspond to strongest octad bands)
Just as for the Pentad region, HITRAN2012 data had substantial
errors in line positions for lines of intermediate strength, while
better values actually existed in the HITRAN2008 edition of the
database. However, unlike the Pentad region, the intensities of
lines in the Octad region were also often inferior to those from HI-
TRAN2008. Also, unlike the Pentad region, reverting line positions
of HITRAN2012 lines with uncertainty code 1 to the HITRAN2008
values did not always work. One should also keep in mind that HI-
TRAN2008 was not better than HITRAN2012 everywhere in this re-
gion. In addition to lacking 13 CH 4 lines in that region, HITRAN2008
contained many duplicated transitions. Often a transition would
appear as an empirical unassigned line as well as predictions from
Hilico et al. [208] . With that being said, some observable transi-
tions were also missing in HITRAN2008.
The following procedure was therefore developed:
1) In the 40 0 0–4315 cm
−1 region, the HITRAN20 08 line list was
used as the starting point. Many unassigned empirical lines
were then given assignments and lower-state energies from
corresponding predicted Hilico et al. [208] lines, while pre-
dicted lines (usually with inaccurate line position and inten-
sity) were removed. In the region 4190–4315 cm
−1 , parame-
ters of lines with the worst remaining residuals (with respect
to low-pressure Kitt Peak FTS spectra) were then replaced with
the preliminary results of Birk et al. [188] , which used quantum
assignments of yet unpublished theoretical work [209] that was
not always the same as in HITRAN2012.
2) In the 4315–4499 cm
−1 region, HITRAN2012 parameters were
retained.
3) In the 4499–4630 cm
−1 region, a mixture of HITRAN2012 with
parameters from Devi et al. (where available) was used [189] .
Fig. 13 shows fits to TCCON spectra measured from Park Falls,
WI, in March 2005 at a solar zenith angle of 58 deg., in windows
used by TCCON to retrieve CO. The left panels show fits to the re-
gion occupied by the CO P-branch. The right panels show fits in
the R-branch region. The CO lines are less than 10% deep and so
are mainly hidden by stronger CH 4 and solar lines. The upper pan-
els show fits using HITRAN2012 CH 4 ; the lower panels with the HI-
TRAN2016 CH 4 linelist. The rms spectral fits and the peak residuals
are significantly reduced in both windows with the HITRAN2016
linelist. The retrieved CH 4 amounts (written over the top right of
each panel) are much more consistent between the two windows
using the HITRAN2016 linelist (0.1%), than when using HITRAN2012
(2%). It implies that the 2016 CH 4 intensities are much more self-
consistent across these two regions than in HITRAN2012. With that
being said, there is still large room for improvements. A more con-
sistent Octad list in terms of line parameters and assignments is
planned to be worked out for the next HITRAN update.
2.6.4. Tetradecad range 4800–6250 cm
−1
Contrary to the low-energy range, in the Tetradecad range and
above, positions and intensities are mostly experimental values.
The Tetradecad of methane contains 14 bands with 60 strongly
coupled sub-bands with very congested spectra difficult to ana-
lyze because of numerous resonance perturbations. The previous
HITRAN2012 line list was mainly based on the analysis of Refs.
[210,211] , which included about 30 0 0 assigned lines. This was
only a partial assignment with relatively large uncertainties for
about 70% of weak sub-bands. In HITRAN2016, major updates have
been included in four spectral intervals. Long-path Fourier Trans-
form spectra ( L = 1600 m) in the lower Tetradecad interval 4800–
5300 cm
−1 recorded in Reims have been re-analyzed by Nikitin et
al. [190] . The list includes transitions with line positions adjusted
according to their measured values and transitions with calculated
line positions, all intensities being derived from the model fit. For
HITRAN2016 in the 480 0–50 0 0 cm
−1 region, transitions with in-
tensities greater than 10 −27 cm
−1 /(molecule ·cm
−2 ) were retained.
In the next interval, 5300–5550 cm
−1 , the list contains mostly
observed positions and intensities. The analysis is in progress
[192] , but a preliminary empirical line list is included in the
present release because the previous versions were quite poor in
this range.
In the interval 5550–6250 cm
−1 , a recent version of the
GOSAT line list [193] is included. In the 2 ν3 region (5855–
6250 cm
−1 ), the GOSAT line list [193] was supplemented with
predominantly experimental line parameters of the WKLMC list
(Wang-Kassi-Leshchishina-Mondelain-Campargue) obtained from
high-sensitivity laser measurements in Grenoble [212] . The previ-
ous GOSAT assignments [211] included in the HITRAN2012 list have
been considerably extended in the recent work [194] based on
new analyses in the 5855–6250 cm
−1 range. The modeling of these
complicated spectra was accomplished using an approach combin-
ing ab initio calculations with effective Hamiltonian (EH) fits. Initial
values of the EH parameters were first computed from the molecu-
lar potential energy surface of Nikitin et al. [203] using irreducible
tensor techniques [213,214] via the high-order contact transforma-
tion method as described by Tyuterev et al. [187] . This information
has been only partially adapted for HITRAN2016. Indeed, the val-
idations against experimental and atmospheric spectra (similar to
those done in Toon et al. [147] ) showed that the GOSAT line list
[193] produces better residuals than the one from Ref. [194] , al-
though the latter one is substantially more complete in terms of
both amount of lines and proportion of assigned lines. In the end,
the GOSAT line list [193] was supplemented with some lines from
Ref. [194] and occasionally with HITRAN2012. For instance, very ac-
curate line positions measured with frequency comb in Zolot et al.
[215] were retained. In the future, a more sophisticated combina-
tion of the GOSAT line list [193] and the one from Ref. [194] will
be performed. For broadening, a combination of parameters from
Lyulin et al. [191] , GOSAT line list and HITRAN2012 was used.
2.6.5. Higher wavenumber ranges
In the Icosad range (630 0–750 0 cm
−1 ), the WKLMC list pro-
vided empirical values of the lower-state energy levels. Recently,
on the basis of global variational ab initio spectra predictions [180] ,
about 13,0 0 0 transitions of 108 new bands have been assigned
[216] in the WKLMC list at 80 K and 296 K. The assigned experi-
mental list at 80 K as well as calculated ones are provided as Sup-
plementary Material of Rey et al. [216] . These assignments will be
transferred and extended in the WKLMC list at 296 K and included
in the next update of HITRAN.
Fig. 14 gives an overview comparison between the HITRAN2012
and HITRAN2016 lists of 12 CH 4 above 7920 cm
−1 . New room-
temperature measurements by Cavity Ring Down Spectroscopy
(CRDS) in the 7920–8250 cm
−1 interval have allowed better char-
acterizing of the 1.25-μm methane transparency window [21] . In
the Triacontad region (8250–9028 cm
−1 ), line parameters relying
on FTS measurements by Brown [42] remain unaltered with re-
Please cite this article as: I.E. Gordon et al., The HITRAN2016 molecular spectroscopic database, Journal of Quantitative Spectroscopy &
Radiative Transfer (2017), http://dx.doi.org/10.1016/j.jqsrt.2017.06.038

22 I.E. Gordon et al. / Journal of Quantitative Spectroscopy & Radiative Transfer 0 0 0 (2017) 1–66
ARTICLE IN PRESS
JID: JQSRT [m5G; August 21, 2017;14:18 ]
Fig. 13. Fits to TCCON spectra measured from Park Falls, WI, in March 2005 at a solar zenith angle of 58 deg., in windows used by TCCON to retrieve CO. The left panels
show fits to the region occupied by the CO P-branch. The right panels show fits in the R-branch region. The upper panels show fits using HITRAN 2012 CH 4 ; the lower
panels with the HITRAN2016 CH 4 linelist. Note different scales.
spect to HITRAN2012. Above 9028 cm
−1 , new FTS line parame-
ters are adopted in the region of the 3 ν3 band (9028–9200 cm
−1 )
[22] . From the same FTS spectra, the first empirical line list was
retrieved in the Tetracontad region (9520–10,435 cm
−1 ) [22] . It is
worth mentioning that between 7920 cm
−1 and 10,923 cm
−1 no
assignments or empirical lower-state energy values are provided
except for a few tens of transitions in the region of the 3 ν3 band
near 9046 cm
−1 . Complementary information in this case can be
provided by variational ab initio predictions [31] . The estimated er-
ror for line positions in the best first-principle calculation in the
1-μm range is on average ∼ 0.3–2 cm
−1 ; that is not sufficient
for high-resolution applications. However, intensities are in qual-
itatively good agreement with observations, see Fig. 15 . Recent ab
initio intensity results [217] for the strongest 12 CH 4 lines below
7600 cm
−1 have confirmed accurately measured intensity values
to 1–3% on average for the “stable” transitions non perturbed by
accidental resonances. Predicted spectra [31] include lower-state
energies for all lines and can be recalculated for various tem-
perature conditions that make it suitable for low- and medium-
resolution modeling of observations in planetary atmospheres sim-
ilar to those reported for Titan in Ref [45] .
Finally, in the 10,923–11,502 cm
−1 spectral range, the HITRAN
lists reproduce line parameters derived by Intracavity Laser Ab-
sorption Spectroscopy (ICLAS) [220] . For the ICLAS data [176,220] ,
empirical lower-state energy values were derived by the two-
temperature-method [221] .
2.6.6. 13 CH 4 isotopologue
In HITRAN2012, the entire ν2 band of 13 CH 4 (centered at about
1550 cm
−1 ) was accidentally dropped from the compilation. This
band is now restored back from HITRAN2008 [198] .
For the 13 CH 4 isotopologue, new measurements and analyses in
the 3750–4700 cm
−1 octad range have been reported by Brown et
al. [222] for temperatures between 80 and 296 K. This included
over 4700 positions and 3300 intensities for assigned observed
transitions. The line list based on the analysis and spectra fits of
this range contains 9500 calculated lines. It is available as supple-
mentary material attached to Ref. [222] and will be incorporated
in the next HITRAN update.
First assignments of the strongest bands at the high-
wavenumber boundary of the 13 CH 4 Tetradecad (5852–6200 cm
−1
region dominated by 2 ν 3 ) have been reported by Starikova et
al. [195] . Differential Absorption spectra (DAS) recorded in Greno-
ble [223] at 80 K and 296 K have been used for this analysis. For
the 80 K spectra, about 2900 lines of 3717 observed lines were
assigned. The theoretical model in both spectral intervals, 3750–
470 0 cm
−1 and 5852–620 0 cm
−1 , was based on the combined ap-
proach [187] using ab initio predictions for line positions and in-
tensities [224] with subsequent EH fits, which is similar to that for
the main
12 CH 4 isotopologue as outlined in Section 2.6.4 Supple-
mentary materials of Ref. [195] contain a partially-assigned exper-
imental DAS list at 80 K. For the present HITRAN2016 release, the
assignments were extended for the 296 K list. Note that many ob-
served absorption features in the congested spectrum could have
Please cite this article as: I.E. Gordon et al., The HITRAN2016 molecular spectroscopic database, Journal of Quantitative Spectroscopy &
Radiative Transfer (2017), http://dx.doi.org/10.1016/j.jqsrt.2017.06.038

I.E. Gordon et al. / Journal of Quantitative Spectroscopy & Radiative Transfer 0 0 0 (2017) 1–66 23
ARTICLE IN PRESS
JID: JQSRT [m5G; August 21, 2017;14:18 ]
Fig. 14. Overview comparison of the HITRAN line list of 12 CH 4 above 7920 cm
−1
in the 2012 and 2016 editions. In this region, line parameters all have an empiri-
cal origin: CRDS between 7920 and 8250 cm
−1 [196] , FTS by Brown in the 8250–
9028 cm
−1 interval [218] by Béguier et al. in the 9028–10,923 cm
−1 interval [197] ,
and ICLAS between 11,0 0 0 and 11,500 cm
−1 [219] . The different polyad and cor-
responding quantum numbers, P, are indicated. (The polyad number P is equal to
2(V 1 + V 3 ) + V 2 + V 4 , where V i are the normal mode vibrational quantum numbers).
Fig. 15. Comparison of unassigned experimental line list of 12 CH 4 in the Tetracon-
tad range (Béguier et al. [197] ) included in HITRAN2016 (upper panels in black)
with variational calculations, Rey et al. [205] based on ab initio dipole moment
[202] , and potential energy [203,204] surfaces using the line list included in the
TheoReTS database [205] (lower panel upside down in red).
contributions from various overlapping transitions. As the assign-
ment criteria, the ratio R = I re-calc /{ I obs (296 K)} was used as well as
the coincidence of J low
obtained theoretically and via the empirical
2T-method. Here I re-calc stands for intensities re-calculated from the
80 K DAS list via the Boltzmann factor. In doubtful cases, but with
consistent J low
values, we have kept empirical line parameters. For
big R deviations and inconsistent J low
values, a default value E low
= 333.3333 cm
−1 was applied. The self- and air- line broadening
were calculated following the method described in the GOSAT pa-
per [211] .
Fig. 16 , giving the overview of 13 CH 4 lines in the 2 ν3 range,
shows that most of the strong and medium lines in the HI-
TRAN2016 release have consistent assignments.
An extension of this work using the approach of Ref. [216] is in
progress for the Icosad range of 13 CH 4 [225] .
2.6.7. CH 3 D and other isotopologues
The parameters for this singly-deuterated methane molecule
have not been updated for the 2016 edition. We note a recent pa-
per by Bray et al. [226] which indicated the need for updating the
intensities of CH 3 D in the pure rotational band. We are considering
this work for a future update of HITRAN.
2.6.8. Line-shape parameters for methane
Our knowledge of pressure broadening of methane by air, N 2 ,
H 2 , He, CH 4 , and other gases remains incomplete, particularly for
the near-infrared and for weaker transitions in all spectral regions.
Basic coefficients of Lorentz broadening (widths, shifts, tempera-
ture dependences) all vary as a function of the transition quan-
tum numbers, and values obtained for the fundamental bands are
not easily applicable to the very complicated polyads having mul-
tiple underlying vibrational states. Available measured values for
Lorentz pressure broadened line-shape parameters from the pre-
vious edition of HITRAN were transferred into the new compi-
lation, but most of the lines have been given crudely-estimated
air- and self-broadened half widths, as described by Brown et al.
[176] . Good theoretical models, confirmed by measurements, must
be implemented in order to have accurate values, not the esti-
mates used here for 99% of the present database. Since the release
of the 2012 database, additional methane line-shape measure-
ments have become available in several spectral regions for 12 CH 4
[179,181,183,189,227–232] , and CH 3 D [226,233,234] , and these will
be added in the future updates to HITRAN2016.
The recent study of Mendonca et al. [235] illustrates the
growing evidence that for remote-sensing applications requiring
the highest accuracies of line parameters to model the observed
methane spectrum, Voigt lineshapes are inadequate. It is well
known that collisional line mixing can significantly affect absorp-
tion spectral shapes, and line mixing cannot be neglected for ac-
curate retrievals of atmospheric CH 4 abundance. The HITRAN2012
database [1] had included the line-mixing parameters for CO 2 , CO
and O 2 , however without providing guidance or tools for users to
implement these parameters in their calculations. The new struc-
ture of the HITRAN database [236] and the HITRAN Application
Programming Interface (HAPI) [5] provide the potential for the
inclusion of line-mixing parameters in the database and provide
tools for their implementation.
A theoretical approach proposed to model line-mixing effects
for CH 4 by Tran et al. [ [237–239] has been successfully applied to
calculate absorption in the ν3 , ν4 and 2 ν3 bands. The same model
has been used to simulate the spectra in the ν2 + ν3 band as a
test to demonstrate whether it can be applied to other vibrational
bands. Comparisons with spectra measured under different pres-
sure conditions [189] show that line mixing only weakly affects
the absorption spectral line shape of this band under these pres-
sure conditions. Therefore, more calculations for other vibrational
bands under large pressure conditions are needed to demonstrate
if this model can be applied to various vibrational bands. While the
work of Tran et al. ( [239] and references therein) represents signif-
icant progress in understanding non-Voigt line shapes in methane,
additional laboratory studies of line mixing, speed dependence and
narrowing are required to provide the basic parameters for future
methane compilations in the spectral regions most utilized for re-
mote sensing.
2.7. O 2 (molecule 7)
An extensive update of the HITRAN oxygen line list for the new
edition makes use of the following significant progress on: ( 1 ) a
self-consistent set of energy levels and line positions for the entire
HITRAN oxygen line list; ( 2 ) lineshape, line mixing, collision in-
duced absorption (CIA), and new speed-dependent Voigt (SDV) for-
malism for the A-band; ( 3 ) HT profile parameters for the B- bands.
We also added the b 1 + g (v = 3)-X
3 −g (v = 0) and b 1 +
g (v = 2)-
X
3 −g (v = 1) bands.
2.7.1. Line positions and energy levels
A self-consistent set of spectroscopic constants from an updated
isotopically invariant Dunham fit by Yu et al. in 2014 [240] were
Please cite this article as: I.E. Gordon et al., The HITRAN2016 molecular spectroscopic database, Journal of Quantitative Spectroscopy &
Radiative Transfer (2017), http://dx.doi.org/10.1016/j.jqsrt.2017.06.038

24 I.E. Gordon et al. / Journal of Quantitative Spectroscopy & Radiative Transfer 0 0 0 (2017) 1–66
ARTICLE IN PRESS
JID: JQSRT [m5G; August 21, 2017;14:18 ]
Fig. 16. Overview of assigned lines [195] in the experimental 13 CH 4 DAS list [223] included in HITRAN2016 in the 1.66-μm range.
used to update line positions and energy levels throughout the
entire HITRAN2012 oxygen line list, except for the so-called zero-
frequency lines (due to Zeeman splitting of the ground state), see
HITRAN1986 paper for details [241] . This updated Dunham fit was
obtained by adding new microwave and infrared measurements
[242,243] to the first global analysis of O 2 by Yu et al. in 2012
[244] that simultaneously fits all available experimental line po-
sitions for all the bands and isotopologues from the microwave
to UV region. The new microwave measurements [242] include
324 rotational transitions in the a 1 �g v = 0 and 1 states of the six
O 2 isotopologues and helped determine two more hyperfine pa-
rameters, the electric quadrupole interaction eQq and the nuclear
spin-rotation interaction, C I . The new infrared work [243] reported
1644 b 1 + g − X 3 −
g transition frequencies for the six O 2 isotopo-
logues and revealed a 0.2 cm
−1 calibration error in the 17 O
18 O
v ′ − v ′′ = 1 − 0 Raman data of Edwards et al. [245] . It resolved
discrepancies in the Raman data for 16 O
17 O, 17 O
17 O, and
17 O
18 O,
and improved the vibrational parameterization of the ground elec-
tronic state.
A quantum number assignment error has been fixed in HI-
TRAN2016 for 17 lines in the �N �J = PO branch of the 16 O
16 O
a − X(v ′ , v ′′ ) = (0 , 0) band. These lines were incorrectly labeled
with a shift of two in N
′′ and J ′′ in HITRAN2012, as was pointed
out in Yu et al. [240] .
Band-by-band comparisons of the updated line positions and
lower state energies versus the HITRAN2012 compilation were
performed. For all the bands in the a 1 �g − X 3 −g system (for
which the data in HITRAN originate from Refs. [246 −249] , sys-
tematic differences, smaller than experimental uncertainties, were
found for measured lines and expected deviations were found
for extrapolated lines. As depicted in the upper left panel of Fig.
17 , systematic differences of 0.0 0 07 cm
−1 were found for the 16 O
16 O a − X(v ′ , v ′′ ) = (0 , 0) band. Similar deviations were found
for all other bands except the A-band ( b − X(v ′ , v ′′ ) = (0 , 0) ) of 16 O
16 O, 16 O
17 O and
16 O
18 O, where the data originated from Refs.
[250,251] (see discussion below).
As shown in upper right, lower left and lower right panels of
Fig. 17 , deviations are very small for one sub-group of the A-band
transitions while they are large for another sub-group. The sub-
group of transitions with small deviations belongs to the P O, P P, P Q
branches while the other sub-group with large deviations belongs
to the N O, R R, R Q, R S and
T S branches.
2.7.2. A-band region near 762 nm
The line list for the A-band in HITRAN2012 originates from the
data from the Long et al. [250,251] papers. Here an update of
the principal isotopologue magnetic dipole allowed transitions is
given that incorporates a self-consistent model of collisional line-
shapes, collisional line mixing and collision induced absorption in
a multispectrum fit to a wide range of experimental data sets de-
scribed in Drouin et al. [252] (hereafter referred to as Drouin 2017).
The lineshape chosen was the speed-dependent Voigt profile and
effects of line mixing were introduced as a fixed W-matrix de-
rived from the theoretical line mixing formalism of Tran, Boulet
and Hartmann in 2006 [253] . Strong correlation was observed be-
tween the scaled line-mixing parameterization and the collision-
induced absorption derived as remaining non-resonant absorption.
Correlation was also observed between the line-by-line parame-
ters correlations in the R-branch band-head region and the scaled
line-mixing parameterization. The self and air-broadening parame-
ters as well as air-pressure shift parameters do not deviate signif-
icantly from HITRAN 2012, with smooth trends that closely match
the polynomial expressions of Long et al. that were used in the
prior compilation. Unlike HITRAN 2012, minor erratic deviations
of these parameters (which were minimized in the chosen scal-
ing of the line mixing) are retained in the compilation for self-
consistency. The self-pressure shift parameters are provided for the
first time in this HITRAN edition, and these values differ systemat-
ically by 0.006 cm
−1 atm
−1 from those given by Long et al. [251] .
The air broadening temperature dependence is also systematically
shifted to higher values in comparison to HITRAN 2012. The self-
broadening temperature dependence is also provided for this band
for the first time in HITRAN and it is even more systematically
shifted in comparison to published values from Brown & Plymate
[254] . Temperature dependences of the pressure-shift are also in-
cluded in the new line-by-line parameterization; there is no prior
parameterization for comparisons of these values. The final fit-
ted line-by-line parameter is the ‘speed-dependence’ of the pres-
sure broadening, which replaces the Dicke parameter determined
in Long’s work and included in the supplemental listing of HITRAN
2012. Qualitative comparison of these two ‘narrowing’ parameters
shows that there is a similar m dependence in each parameter set,
each with a more pronounced slope at m < 0 (the P-branch). Use of
the speed-dependent Voigt allows this lineshape profile to be cast
within the more encompassing Hartmann-Tran profile. Line-by- line
line-mixing parameters (Rosenkranz parameters) were not fitted in
Please cite this article as: I.E. Gordon et al., The HITRAN2016 molecular spectroscopic database, Journal of Quantitative Spectroscopy &
Radiative Transfer (2017), http://dx.doi.org/10.1016/j.jqsrt.2017.06.038

I.E. Gordon et al. / Journal of Quantitative Spectroscopy & Radiative Transfer 0 0 0 (2017) 1–66 25
ARTICLE IN PRESS
JID: JQSRT [m5G; August 21, 2017;14:18 ]
Fig. 17. Comparisons of the updated positions versus the HITRAN2012 compilation. The panels show differences between listed frequencies labeled by the quantum number
J ′′ plotted vs. line intensities for the transitions for the atmospheric IR a 1 �g − X 3 −g system of 16 O 16 O and the atmospheric b 1 +
g − X 3 −g system of 16 O 16 O, 16 O 18 O and
16 O 17 O. Note that half of the b 1 + g − X 3 −
g magnetic dipole transitions were removed from the plots for the purpose of clarity because the spin pairs were on top of each
other.
Drouin 2017 [252] , but rather a full W-matrix formalism based on
theoretical work, empirically modified to improve the multispec-
trum fit quality, was implemented. The empirical corrections that
attenuated line mixing at high rotational excitation (see Tran and
Hartmann, [255] ) were abandoned in favor of the removal of mix-
ing between differing spin-states. The effects of this correction are
clearly evident in the derived Rosenkranz parameters, which oscil-
late between even and odd J (or m ) values when the spin-changing
collisional mixing is allowed, but follow a smooth trend with J (or
m ) when they are removed. Predoi-Cross et al. [256,257] provide
fitted room-temperature Rosenkranz parameters (and other line-
shape parameters) that agree with the parameters of Drouin 2017.
The modified line mixing parameterization significantly alters the
derived collision-induced absorption, with this absorption appear-
ing narrower and stronger, with a shape and extent that conforms
more closely to the resonant band. The collision-induced absorp-
tion derived for air is provided separately in the corresponding sec-
tion of the HITRAN database, see Section 4 for details.
For the convenience of HITRAN users, two transformations have
been applied to the line-shape/line- mixing parameterization given
by Drouin 2017. First, given the primary usage of the oxygen
database to model the Earth’s atmosphere, the foreign-broadening
line-shape parameters presented in Drouin 2017 have been con-
verted to air-broadening parameters using the binary mixing ratio
[N 2 ]:[O 2 ] = 0.79:0.21. Second, the scaled, full-W-matrices for for-
eign and self line mixing and the associated temperature depen-
dence were evaluated for 1 atm of air at four ‘standard’ temper-
atures and then composed into first order line-by-line Rosenkranz
parameters. This representation of the line mixing is based on sim-
ilar representations provided for the fine-structure line mixing in
the microwave spectrum and is both easier to tabulate as well as
more efficient to compute. We note that the multidimensional oxy-
gen A-band cross-section table (ABSCO 5.0), now in use for the re-
duction of OCO-2 [64] atmospheric data, utilizes the parameteri-
zation of Drouin 2017 in its native form, and was calculated with
the same source code as the multi-spectrum fitting program. The
differences between the ABSCO 5.0 table and the HITRAN database
are due to the two cosmetic modifications indicated above, as well
as the replacement of line centers with the more precise values
derived from the work of Yu et al. [240] described above.
2.7.3. New addition of b 1 ∑ +
g (v = 3) − X 3 ∑ −
g (v = 0) and b 1 ∑ +
g
(v = 2) − X 3 ∑ −
g ( v = 1 ) bands and merging in the UV lines for 16 O 2
Atmospheric spectra can show where important bands are
missing. Fig. 18 shows a high-air mass ground-based Kitt Peak
spectrum fitted using the HITRAN 2012 line list. It is clear that
the b 1 + 9 (v = 3) − X 3 −
g (v = 0) band of O 2 at 0.58 μm is miss-
ing in the compilation. The line list for this band was calculated
and while there were data to calculate line positions [258] , no in-
formation was available for intensities, and this atmospheric spec-
trum was used to scale the intensities to fit the observations. We
also note that line positions used in HITRAN2016 for this band
differ from those in Yu et al. [240] . This is due to the fact that
the measurements in Ref. [258] were carried out using a relatively
high pressure of oxygen. It is accounted for in the fit here but not
completely in Ref. [240] . Broadening and shift parameters for this
Please cite this article as: I.E. Gordon et al., The HITRAN2016 molecular spectroscopic database, Journal of Quantitative Spectroscopy &
Radiative Transfer (2017), http://dx.doi.org/10.1016/j.jqsrt.2017.06.038

26 I.E. Gordon et al. / Journal of Quantitative Spectroscopy & Radiative Transfer 0 0 0 (2017) 1–66
ARTICLE IN PRESS
JID: JQSRT [m5G; August 21, 2017;14:18 ]
Fig. 18. High-air mass ground-based Kitt Peak spectrum fitted without (a) and with (b) b 1 + g (v = 3)- X 3 −
g (v = 0) band of O 2 .
band were estimated using the approach described in Gordon et
al. [259] . Fig. 18 b shows that the inclusion of this band makes the
difference and it was included into HITRAN2016.
In a similar fashion it was discovered that it is important to in-
clude the b 1 ∑ +
g (v = 2) − X 3 ∑ −
g (v = 1) band (basically a hot band
underlying the B -band). Intensities for this band were also deter-
mined based on atmospheric spectra.
Finally, the UV bands of oxygen are not stored separately any-
more and one can retrieve them from www.hitran.org in the same
manner as the other bands.
2.7.4. B-band
Recently Domysławska et al. [260] developed a dataset of
the line-shape parameters for the B-band of self-broadened O 2
(the main isotopologue), based on accurate CRDS measurements
[261,262] . The dataset includes 49 lines from the P and R branches.
It was observed that, at the considered level of signal-to-noise ra-
tio, the spectra are well reproduced by the speed-dependent Voigt
profile with quadratic speed dependence. In the near future we
plan to incorporate these data into HITRAN within the formal-
ism of the Hartmann-Tran profile by setting the frequency of the
velocity-changing collisions, νVC , and the correlation parameter, η,
to zero.
2.8. NO (molecule 8)
Nitric oxide is an important constituent of the terrestrial atmo-
sphere, where it is commonly detected and quantified by its fun-
damental IR band. The rotational spectrum plays an important role
for the detection in diverse interstellar sources, but may also be
used for detection in the Earth’s upper atmosphere; Müller et al.
[263] give a brief overview with appropriate references.
Positions and intensities for all stable NO isotopologues and for
the first excited state in the pure rotation transition (1-1) of the
principal isotopologue were based on Müller et al. [263] who per-
formed a combined fit of all available rotational data together with
heterodyne IR data of the fundamental band of the main species.
All experimental data were carefully evaluated, a few poorly-fitting
transition frequencies were omitted, and the uncertainties of some
additional data were slightly adjusted as detailed in Ref. [263] .
The 14 N
16 O line position and intensity data consist of millime-
ter and lower submillimeter data from Pickett et al. [264] and tun-
able far-IR data from Varberg et al. [265] in v = 0. The -doubling
transitions in v = 0 were mainly taken from Meerts and Dymanus
[266] ; additional data were taken from Refs. [267,268] . Further -
doubling transitions in v = 0 and 1 were taken from Dale et al.
[269] and Lowe et al. [270] . Also used in the fit were the v = 1–
0 heterodyne IR data from Hinz et al. [271] and the very accurate
data from Saupe et al. [272] .
Millimeter and lower submillimeter data of 15 N
16 O were con-
tributed by Saleck et al. [273] , and tunable far-IR data by Varberg
et al. [265] . The -doubling transitions were taken from Meerts
and Dymanus [266] . Millimeter and lower submillimeter data of
the isotopologue 14 N
18 O were also published by Saleck et al. [273] ,
and tunable far-IR data by Müller et al. [263] . Finally, millimeter
data of 14 N
17 O and
15 N
18 O were taken from Saleck et al. [274] .
A very accurate value of the ground-state electric dipole mo-
ment of 14 N
16 O was published in Ref. [268] ; a value for v = 1
was determined in Ref. [275] . The strength of the magnetic dipole
Please cite this article as: I.E. Gordon et al., The HITRAN2016 molecular spectroscopic database, Journal of Quantitative Spectroscopy &
Radiative Transfer (2017), http://dx.doi.org/10.1016/j.jqsrt.2017.06.038

I.E. Gordon et al. / Journal of Quantitative Spectroscopy & Radiative Transfer 0 0 0 (2017) 1–66 27
ARTICLE IN PRESS
JID: JQSRT [m5G; August 21, 2017;14:18 ]
transition was derived from the electron spin-rotation parameter γemploying Curl’s relationship [276] to evaluate the g -factor of the
respective isotopologue and in the appropriate vibrational state.
The data set has been extended considerably by FTIR data of 14 N
16 O reaching high v and by FTIR data of minor isotopic species
from Ref. [277] . This will be used for future editions of HITRAN and
HITEMP [278] . The spectroscopic model developed in this study
has also been used to compute g -factors for the system [279] .
2.9. SO 2 (molecule 9)
Since the 2008 edition of HITRAN, the air-broadening coeffi-
cients of sulfur dioxide have been a constant, γ air = 0.1025 cm
−1 ,
for line positions lower than 30 0 0 cm
−1 ; with γ air = 0.1 cm
−1
for line positions larger than 30 0 0 cm
−1 (see HITRAN20 08 pa-
per [198] for details). Recently, new measurements have been
made of the air-broadening coefficients of SO 2 from infrared
and submillimeter-wave spectra [280,281] . When analyzing these
data together with previously available experiments [282–285] , a
slow decrease of the air-broadening coefficients with increasing
( J ′′ + 0.2K a ′′ ) lower-state quantum number combination was ob-
served (see the report by Tan et al. [286] for details). The vibra-
tional dependence of the broadening parameters is demonstrated
to be very small or negligible.
A linear extrapolation (see Eq. (1) ) up to ( J ′′ + 0.2Ka ′′ ) ≤ 62 (with
error code 4 (10–20%)) was used, while for the transitions with
( J ′′ + 0.2Ka ′′ ) > 62, the value corresponding to the experimental
value with the largest ( J ′′ + 0.2Ka ′′ ) was used.
γair = 0 . 10731 − 2 . 88311 × 10
−4 (J ′′ + 0 . 2 K
′′ a
)(1)
A complete line-by-line database of room temperature self-
broadening coefficients for about 1650 SO 2 transitions has been
compiled by Tasinato et al. [287] . These data are used to update
the self-broadening coefficients for the corresponding transitions.
The error code has been set to 5, since we estimate the accuracy
to be 5–6%. We also use the average values from Ref. [287] (with
error code 4) of the same quantum numbers ( J ′′ , K a ′′ ) for all the
other transitions with corresponding rotational quantum numbers.
More details about this update of air and self-broadening parame-
ters can be found in the report by Tan et al. [286] .
Another update to the SO 2 data is the addition of pressure
shifts, line widths and their temperature-dependence exponents in
H 2 , He and CO 2 environments for every HITRAN transition. This
update is described in detail by Wilzewski et al. [4] . While shifts
of the SO 2 lines due to H 2 , He or CO 2 were set to the default
value of zero for every line because no reports of these parame-
ters exist in available peer-reviewed sources, broadening parame-
ters and their temperature exponents have been added based on
Refs. [280,281,284,288,289] . Especially in the case of the SO 2 –CO 2
system, the amount of available data used to construct the line list
of broadening parameters is minimal, and future measurements
of the SO 2 –H 2 , -He and -CO 2 systems would help to improve the
present semi-empirical parameter sets.
There has been significant recent progress in the computation
of extensive, accurate theoretical line lists for both room tempera-
ture [290,291] and hot [292] SO 2 . The intensities in these line lists
are accurate enough to provide alternatives for missing bands of
both the main and the minor isotopologues; this should be con-
sidered in future updates. They can be supplemented with line po-
sitions calculated using constants from recent works from Ulenikov
et al. [293–297] and references therein.
2.10. NO 2 (molecule 10)
Unchanged.
2.11. NH 3 (molecule 11)
NH 3 is a very important constituent of the atmospheres of gi-
ant planets and small, cold stars. It is also abundant in various en-
vironments of the interstellar medium and occurs in the terrestrial
atmosphere. The isotopologue with
15 N can be very important for
studying isotopic fractionation or for studying the opacity of lines
pertaining to 14 NH 3 .
Positions and intensities of the 15 NH 3 pure-tunneling and
rotation-tunneling transitions were taken from the CDMS. It is
based on rotation-tunneling transition frequencies from Belov et
al. [298] and Winnewisser et al. [299] , on pure tunneling data from
Kukolich [300] , in part corrected by Hougen [301] , and from Sasada
[302] . Also included are FIR data from Urban et al. [303] and Car-
lotti et al. [304] . Initial spectroscopic parameters were taken from a
modified fit of 14 NH 3 data by Chen et al. [305] . Quantum chemical
calculations and trial fits suggested that the C rotational constant
cannot be determined reliably from these data. Therefore, its value
was kept fixed to the 14 NH 3 value derived from Ref. [306] mod-
ified by the 14 NH 3 / 15 NH 3 difference calculated from energies cal-
culated by Huang et al. [306] . The dipole moment and its first or-
der J and K distortion corrections were taken from Tanaka et al.
[307] . The rotation-tunneling transitions extend to J = 14 [304] , and
the pure tunneling transitions [302] even higher in J . The predic-
tions should show FIR accuracy at least up to J = 14, but predictions
higher than J = 15 should be viewed with increasing caution. More-
over, frequencies and possibly also intensities of the weak �K = 3
transitions should be viewed with some caution.
HITRAN2012 only contained ammonia transitions up to
70 0 0 cm
−1 . Recently, Barton et al. [308] analyzed Fourier Trans-
form (FT) absorption spectra recorded at the National Solar Ob-
servatory by C. De Bergh in 1980, providing partially-assigned lists
of measured line positions and intensities. The present update in-
cludes 8468 lines in the region 7400–8640 cm
−1 [308] ; 2474 of
these lines are fully assigned using the quantum numbers recom-
mended by Down et al. [309] . Barton et al. [310] have also analyzed
and partially assigned a further spectrum covering the 8800 to
10,400 cm
−1 region. These data were also included in HITRAN2016.
At lower wavenumbers, comparisons between the HITRAN data
and comprehensive variational line lists [311,312] give good agree-
ment below 40 0 0 cm
−1 . However, comparisons with these line
lists suggest that the current HITRAN compilation is missing a sig-
nificant number of lines in the 40 0 0–70 0 0 cm
-1 region. Attempts
to resolve this problem using a combination of available variational
line lists referred to as BYTe [311,312] and empirical energy levels
provided using the MARVEL procedure [313] to give a hybrid line
list referred to as “BARVEL” proved to be inferior to HITRAN2012
when compared with cross sections from PNNL [314] . It would ap-
pear that further work is needed on both the computed line list
and the MARVEL dataset in this region. Work in both these direc-
tions is currently being undertaken and, in particular, a new high-
accuracy ab initio potential energy surface [315] should provide a
much better starting point for improved nuclear motion calcula-
tions.
Pressure-broadening coefficients and their temperature depen-
dence exponent were calculated from the polynomial coefficients
of Nemtchinov et al. [316] derived from the ν2 band measure-
ments. Nemtchinov et al. suggested that the rotational dependence
of the air- and self-broadening half width, γ air and γ self , can be
represented using the following polynomial:
γ 0 ( m, K ) = β0 + β1 m + β2 K + β3 m
2 + β4 K
2 + β5 mK (2)
where m = | − J , J , J + 1| for the P, Q and R branches, and β i are
the polynomial coefficients. This polynomial was used only for
J ≤ 8 with error code 6 for both γ air and γ self , and for the other
transitions with, J > 8 the extrapolated value corresponding to the
Please cite this article as: I.E. Gordon et al., The HITRAN2016 molecular spectroscopic database, Journal of Quantitative Spectroscopy &
Radiative Transfer (2017), http://dx.doi.org/10.1016/j.jqsrt.2017.06.038
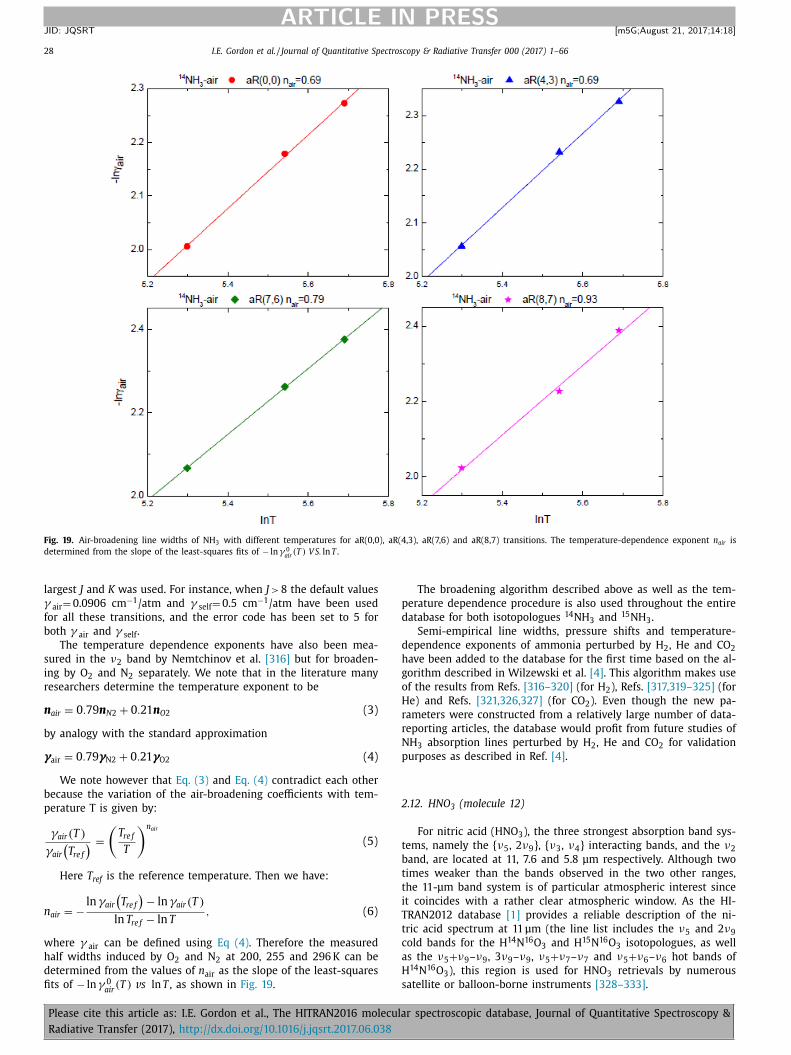
28 I.E. Gordon et al. / Journal of Quantitative Spectroscopy & Radiative Transfer 0 0 0 (2017) 1–66
ARTICLE IN PRESS
JID: JQSRT [m5G; August 21, 2017;14:18 ]
Fig. 19. Air-broadening line widths of NH 3 with different temperatures for aR(0,0), aR(4,3), aR(7,6) and aR(8,7) transitions. The temperature-dependence exponent n air is
determined from the slope of the least-squares fits of − ln γ 0 air
(T ) V S. ln T .
largest J and K was used. For instance, when J > 8 the default values
γ air = 0.0906 cm
−1 /atm and γ self = 0.5 cm
−1 /atm have been used
for all these transitions, and the error code has been set to 5 for
both γ air and γ self .
The temperature dependence exponents have also been mea-
sured in the ν2 band by Nemtchinov et al. [316] but for broaden-
ing by O 2 and N 2 separately. We note that in the literature many
researchers determine the temperature exponent to be
n air = 0 . 79 n N2 + 0 . 21 n O 2 (3)
by analogy with the standard approximation
γair = 0 . 79 γN2 + 0 . 21 γO2 (4)
We note however that Eq. (3) and Eq. (4) contradict each other
because the variation of the air-broadening coefficients with tem-
perature T is given by:
γair ( T )
γair
(T re f
) =
(T re f
T
)n air
(5)
Here T ref is the reference temperature. Then we have:
n air = −ln γair
(T re f
)− ln γair ( T )
ln T re f − ln T , (6)
where γ air can be defined using Eq (4) . Therefore the measured
half widths induced by O 2 and N 2 at 200, 255 and 296 K can be
determined from the values of n air as the slope of the least-squares
fits of − ln γ 0 air
(T ) v s ln T , as shown in Fig. 19 .
The broadening algorithm described above as well as the tem-
perature dependence procedure is also used throughout the entire
database for both isotopologues 14 NH 3 and
15 NH 3 .
Semi-empirical line widths, pressure shifts and temperature-
dependence exponents of ammonia perturbed by H 2 , He and CO 2
have been added to the database for the first time based on the al-
gorithm described in Wilzewski et al. [4] . This algorithm makes use
of the results from Refs. [316–320] (for H 2 ), Refs. [317,319–325] (for
He) and Refs. [321,326,327] (for CO 2 ). Even though the new pa-
rameters were constructed from a relatively large number of data-
reporting articles, the database would profit from future studies of
NH 3 absorption lines perturbed by H 2 , He and CO 2 for validation
purposes as described in Ref. [4] .
2.12. HNO 3 (molecule 12)
For nitric acid (HNO 3 ), the three strongest absorption band sys-
tems, namely the { ν5 , 2 ν9 }, { ν3 , ν4 } interacting bands, and the ν2
band, are located at 11, 7.6 and 5.8 μm respectively. Although two
times weaker than the bands observed in the two other ranges,
the 11-μm band system is of particular atmospheric interest since
it coincides with a rather clear atmospheric window. As the HI-
TRAN2012 database [1] provides a reliable description of the ni-
tric acid spectrum at 11 μm (the line list includes the ν5 and 2 ν9
cold bands for the H
14 N
16 O 3 and H
15 N
16 O 3 isotopologues, as well
as the ν5 + ν9 –ν9 , 3 ν9 –ν9 , ν5 + ν7 –ν7 and ν5 + ν6 –ν6 hot bands of
H
14 N
16 O 3 ), this region is used for HNO 3 retrievals by numerous
satellite or balloon-borne instruments [328–333] .
Please cite this article as: I.E. Gordon et al., The HITRAN2016 molecular spectroscopic database, Journal of Quantitative Spectroscopy &
Radiative Transfer (2017), http://dx.doi.org/10.1016/j.jqsrt.2017.06.038

I.E. Gordon et al. / Journal of Quantitative Spectroscopy & Radiative Transfer 0 0 0 (2017) 1–66 29
ARTICLE IN PRESS
JID: JQSRT [m5G; August 21, 2017;14:18 ]
Table 8
Comparison of the HNO 3 line parameters in the 7.6-μm region in the 2012 and 2016 edi-
tions of HITRAN.
(a) HITRAN2012
Band N S tot (10 –18 ) νmin νmax S min (10 –23 ) S max (10 –21 )
ν3 21,308 25.37 1098.376 1387.849 1.037 31.33
ν4 19,584 12.78 1229.867 1387.561 1.037 18.67
Sum 38.15
(b) HITRAN2016
Band N S tot (10 –18 ) νmin νmax S min (10 –25 ) S max (10 –21 )
ν3 16,408 24.94 1252.010 1394.177 4.910 32.0
ν4 18,105 9.834 1238.929 1387.081 4.020 10.7
2 ν6 2451 0.1194 1243.465 1348.275 4.624 3.660
ν5 + ν9 13,817 0.7163 1246.929 1390.071 2.081 3.543
ν7 + ν8 11,125 0.7615 1246.422 1395.679 2.314 5.017
3 ν9 13,894 1.177 1233.107 1388.497 4.582 2.378
Sum 37.55
ν3 + ν9 –ν9 12,106 1.408 1271.050 1394.899 5.285 1.798
Note: N is the number of lines, νmin and νmax (cm
–1 ) are the lower and upper ranges of
the band, S min and S max are the smallest and largest line intensity (cm
–1 /{molecule cm
−2 }
at 296 K) and S tot is the sum of the line intensities.
However, retrievals of nitric acid at altitudes higher than
∼35 km, where it is less abundant, require use of the stronger in-
frared signatures at 5.8 or 7.6 μm. Because the first spectral re-
gion overlaps rather strongly with water vapor absorption in at-
mospheric spectra, the 7.6-μm band system is preferable. However,
most satellite or balloon-borne instruments avoided using this lat-
ter region up to now for HNO 3 retrievals because of the poor qual-
ity of the available HNO 3 line positions and line intensities.
For HNO 3 , the 7.6-μm spectral region in HITRAN2012 is limited
to the ν3 and ν4 cold bands of the main isotopologue, H
14 N
16 O 3 .
In addition, the quality of the line positions and intensities avail-
able therein is rather poor, mainly because the theoretical model
used at that time [334] accounted only for the interactions cou-
pling energy levels belonging to the ν3 and ν4 bright states but
was neglecting interactions with several dark states present in the
same energy range.
Therefore it was decided to update the HNO 3 line list at 7.6 μm.
First, a complete reinvestigation of the line positions for nitric acid
at 7.6 μm was performed [335] . In contrast to the previous analy-
sis [334] , the new Hamiltonian model accounted properly for the
various vibration-rotation resonances and torsional effects affecting
the ν3 and ν4 bright states and the four dark states 2 ν6 , 3 ν9 , ν5 +
ν9 and ν7 + ν8 . Additionally, the ν3 + ν9 –ν9 hot band was identified
for the first time [335] .
At the end of this first study [335] , a new list of line posi-
tions and of preliminary line intensities was generated. This list
included contribution from the ν3 and ν4 cold bands, the 2 ν6 ,
3 ν9 , ν5 + ν9 , ν7 + ν8 dark bands, and the ν3 + ν9 –ν9 hot band of the
main isotopologue. The final line intensities at 7.6 μm were gen-
erated through a calibration process during which the HNO 3 vol
mixing ratio profiles retrieved from the “Michelson Interferome-
ter for Passive Atmospheric Sounding” (MIPAS) limb emission ra-
diances in the 11- and 7.6-μm domains were compared. This line
list at 7.6 μm, which was also validated using the available labo-
ratory information (individual line intensities and absorption cross
sections), proved to provide an improved description of the 7.6-μm
region absorption of nitric acid [336] .
Table 8 compares the HNO 3 line lists at 7.6 μm given in the
2012 and 2016 releases of HITRAN showing significant changes. Fi-
nally, Fig. 20 compares the observed spectrum in the 7.6-μm spec-
tral region (laboratory spectrum recorded in Giessen) to synthetic
spectra generated using HITRAN2012 and HITRAN2016 showing the
improvements brought by the new data as shown by the resid-
Fig. 20. Overview of the Fourier transform spectrum recorded at high resolution
in Giessen University in 2004 [335] and comparisons with the models performed
using the HITRAN2012 and HITRAN2016 editions.
uals. In conclusion, it is expected that this study should help to
improve HNO 3 satellite retrievals by allowing measurements to be
performed simultaneously in the 11- and 7.6-μm spectral regions.
In the HITRAN2008 paper, the several-item roadmap for the im-
provements to the nitric acid spectroscopy was presented. A major-
ity of these problems have now been solved. However, the biggest
challenge still remains, the lack of a line-by-line list for the ν1
band of HNO 3 centered at 3551 cm
−1 . It is a pronounced feature
that interferes with other gases absorbing at these wavenumbers.
Fig. 5 in the paper by Toon et al. [147] shows how the lack of
spectroscopic parameters negatively affects retrievals from the Mk
IV balloon observations. Low-resolution spectra of this band ex-
ist in the PNNL database [314] but at a limited set of thermo-
dynamic conditions, while ab initio calculations for this molecule
[337,338] do not yet allow accurate atmospheric retrievals.
2.13. OH (molecule 13)
The line list for the hydroxyl radical remained unchanged. The
recent study by Brooke et al. [339] could be considered for updat-
ing intensities of the weak lines (this is more relevant for HITEMP
[278] ) in the near future.
Please cite this article as: I.E. Gordon et al., The HITRAN2016 molecular spectroscopic database, Journal of Quantitative Spectroscopy &
Radiative Transfer (2017), http://dx.doi.org/10.1016/j.jqsrt.2017.06.038

30 I.E. Gordon et al. / Journal of Quantitative Spectroscopy & Radiative Transfer 0 0 0 (2017) 1–66
ARTICLE IN PRESS
JID: JQSRT [m5G; August 21, 2017;14:18 ]
2.14. HF (molecule 14)
Transitions of HF with changes in vibrational quantum number,
�v, larger than 10 were removed from the database along with
transitions with �v > 8 for DF. This removal was carried out be-
cause there were numerical issues in calculating the intensities of
these transitions. Medvedev et al. [340] explain how the use of
double precision in calculating overtone intensities may lead to nu-
merical errors and that quadruple precision is needed. Additional
numerical errors occur depending on the interpolation techniques
used for the dipole moment functions as explained in Medvedev
et al. [341] .
Broadening, shifting and temperature-dependence parameters
of HF due to the pressure of H 2 , He and CO 2 have been added to
HITRAN for the first time. The semi-empirical procedure described
in Wilzewski et al. [4] was developed using results from Ref.
[342] (for H 2 ), Refs. [343–345] (for CO 2 ) and Refs. [346–348] (for
He). To expand and validate the present parameters, more mea-
surements are needed, while it would also be valuable to have
more dedicated data for DF.
2.15. HCl (molecule 15)
The intensity issue mentioned above for HF concerning the re-
moval of high overtones of all isotopologues was likewise applied
to HCl (i.e. transitions with �v > 8 were removed for all four iso-
topologues of hydrogen chloride).
Ref. [4] describes in detail the addition of H 2 -, He- and CO 2 -
broadening, -shifting and temperature-dependence parameters of
HCl to the database. Semi-empirical HCl-CO 2 broadening and shift-
ing parameters for each HITRAN transition are based on Refs.
[345,349] and sophisticated extrapolations of these results, while
Refs. [350,351] were used to construct HCl-He linewidths and
shifts. For the HCl-H 2 system, the new parameters are based on
Refs. [352–355] . In the future, measurements of the temperature-
dependence of foreign-broadened HCl spectral lines will be very
helpful additions to the database.
2.16. HBr (molecule 16)
Unchanged.
2.17. HI (molecule 17)
Unchanged.
2.18. ClO (molecule 18)
Unchanged.
2.19. OCS (molecule 19)
Carbonyl sulfide is the most abundant sulfur-containing species
in the free troposphere, often monitored using optical remote sens-
ing in the 5-μm region [356] . OCS is present in the atmosphere
of Venus [357] . The increasing interest for the application of very
sensitive cavity ring down spectroscopy to the in situ detection of
trace species [358] makes the near infrared range more and more
attractive. However, the HITRAN2012 database provided spectro-
scopic information for OCS only up to 4200 cm
–1 [1] . Recently,
Fourier transform spectra of carbonyl sulfide were recorded be-
tween 6170 and 6680 cm
–1 and between 7700 and 8160 cm
–1 us-
ing a femto/OPO laser absorption source and cavity enhanced spec-
troscopy [359] . The strongest bands observed in these two regions
are 3 ν1 + 2 ν3 (near 6640 cm
–1 ) and 2 ν1 + 3 ν3 (near 7812 cm
–1 ), re-
spectively. The line positions thus measured (with an accuracy es-
timated to be 0.001 cm
–1 for not-too-weak unblended lines) were
used to update a global polyad model of carbonyl sulfide (see Ref.
[360] and references therein).
This global polyad model was then used to generate a list of
line positions, assignments, lower-state energies, and relative in-
tensities for the main isotopologue. Because quantitative inten-
sity information could not be retrieved from the measured spec-
tra, the predicted relative intensities had to be scaled relying on
additional information. A scaling factor was determined for each
of the two spectral regions by matching calculated spectra of the
3 ν1 + 2 ν3 and 2 ν1 + 3 ν3 bands to their Fourier transform spec-
tra, recorded previously [360] . Because predicted relative intensi-
ties only make sense for transitions involving levels belonging to
the same polyads, these two scaling factors could only be applied
to bands corresponding to transitions involving upper vibrational
levels belonging to the same polyads as the upper levels of the
3 ν1 + 2 ν3 and 2 ν1 + 3 ν3 bands. Line intensities could therefore be
obtained for cold bands matching this constraint, and hot bands in-
volving variations of the vibrational quantum numbers identical to
these cold bands (thus assuming that the vibrational dependence
of the transition moments is negligible). Because isotopic substi-
tution is not expected to significantly change the transition mo-
ments, line intensities were also obtained for the same bands be-
longing to 16 O
12 C
34 S, 16 O
13 C
32 S and
16 O
12 C
33 S. All these predicted
bands cover the ranges 6484–6650 cm
–1 (region A) and 7728–
7821 cm
–1 (region B). These two regions, involving a total of 3660
predicted lines, are presented in Figs. 13 and 14 of Ref. [359] . Note
that only lines having intensities larger than 3.0 × 10 –28 (region
A) and 6.7 × 10 –28 (region B) cm
–1 /(molecule cm
–2 ) at 296 K were
considered. These intensity thresholds are slightly lower than the
experimental limits. The supplementary material of Ref. [359] also
includes a list of line positions, assignments, and lower-state en-
ergies for 3417 additional lines of 16 O
12 C
32 S, 16 O
12 C
34 S, 16 O
13 C
32 S
and
16 O
12 C
33 S, covering the 6200–6449 cm
–1 and 7901–8120 cm
–1
ranges. Because of the constraint mentioned above, the relative in-
tensities of these lines could not be scaled and were set to zero,
and they were not included in HITRAN2016.
The spectroscopic information included in the new edition of
HITRAN is the data of regions A and B obtained as described
above, to which 10 lines belonging to the 2 ν1 + 2 ν2 °+ 2 ν3 band of
the 16 O
13 C
32 S isotopologue (between 6650 and 6660 cm
–1 ) were
added. The origin of this band is located near 6650.773 cm
–1 . Re-
lying on predictions of the global polyad model, which turned out
to be as close as a few 10 –3 cm
–1 to the observed positions, 17
P and R branch lines of the 2 ν1 + 2 ν2 °+ 2 ν3 band of 16 O
13 C
32 S
could be observed, their positions measured in the spectra of Ref.
[359] and included in the global modeling to yield improved pre-
dictions. These improved predictions are included in this edition
of HITRAN. Note that the upper level of this band is the highest
ever observed for 16 O
13 C
32 S. In the supplementary material of Ref.
[359] , 152 pairs of upper vibrational levels have identical assign-
ments as a result of the combined effects of heavy mixing near
avoided crossings and the assignments of the levels being based on
the largest coefficient of their eigenvectors. To remove these dupli-
cate assignments, one vibrational level in each pair was manually
reassigned through careful examination of the corresponding en-
ergy level structures. Additionally, it was found that the line inten-
sities provided in the supplementary material of Ref. [359] could
be affected by the number of significant digits used when stor-
ing intermediate results. The line intensities provided in this edi-
tion of HITRAN correct this problem and are listed with the ap-
propriate number of significant digits. The HITRAN line list for
OCS contains self- and air-broadening coefficients for all the lines
calculated using the Padé approximant proposed of Koshelev and
Tretyakov [361] .
H 2 -, He- and CO 2 -broadened linewidths of OCS were added to
HITRAN for the first time based on semi-empirical models derived
Please cite this article as: I.E. Gordon et al., The HITRAN2016 molecular spectroscopic database, Journal of Quantitative Spectroscopy &
Radiative Transfer (2017), http://dx.doi.org/10.1016/j.jqsrt.2017.06.038

I.E. Gordon et al. / Journal of Quantitative Spectroscopy & Radiative Transfer 0 0 0 (2017) 1–66 31
ARTICLE IN PRESS
JID: JQSRT [m5G; August 21, 2017;14:18 ]
in Wilzewski et al. [4] . The following experimental data were used
to derive these models: Ref. [362] (for H 2 ), Refs. [362–365] (for He)
and Ref. [366] (for CO 2 ). There are no lineshifts and temperature-
dependence parameters due to H 2 , He or CO 2 available in the lit-
erature.
2.20. H 2 CO (molecule 20)
Unchanged.
2.21. HOCl (molecule 21)
The ν2 band region of hypochlorous acid, HOCl, was first in-
troduced in HITRAN2004 [3] based on the line list from Vander
Auwera et al. [367] . It was found that 49 lines of the principal
isotopologue of HOCl in HITRAN had an incorrect vibrational as-
signment being attributed to the ν2 band, while in reality they are
2 ν3 lines. Also, the quantum rotational assignment of the line at
1237.62928 cm
−1 was incorrect. All of the assignments are now
fixed, based on the correct information provided in the original
publication [367] .
2.22. N 2 (molecule 22)
It was found that the abundance of the 14 N
15 N isotopologue
was incorrectly calculated in the original release of HITRAN2012;
this issue with the intensities has been fixed in the latest edition.
2.23. HCN (molecule 23)
Hydrogen cyanide is a trace atmospheric species that can result
from biomass burning [368–370] ; its presence in the troposphere
is being routinely monitored [371,372] . The use of HCN spectra
for diagnostic applications in medicine are also being investigated
[373] . HCN, and its isomer HNC (which is not yet in HITRAN), are
important astronomical species with, for example, the recent ten-
tative detection of HCN in the super-Earth exoplanet 55 Cancri e
[374] .
The spectrum of 1 H
12 C
14 N at wavenumbers below 3500 cm
−1
has been included in HITRAN for some time. Here we extend the
data available to higher wavenumbers. These data were based on
the semi-empirical line list generated by Barber et al. [375] as part
of the ExoMol project [376] . For full line lists appropriate for higher
temperatures and covering both HCN and HNC the reader should
consult these sources directly.
HITRAN has been updated with
1 H
12 C
14 N lines for wavenum-
bers above 3500 cm
−1 and limited to transitions which have inten-
sity greater than 10 −29 cm
−1 /(molecule •cm
−2 ); these criteria give
a total of 55,153 lines in that spectral region. Wavenumbers for the
majority of these lines were taken from the empirical energy levels
of Mellau [377,378] . However, transition intensities are ones com-
puted by Harris et al. [379] using the ab initio dipole moment and
potential energy surface of Van Mourik et al. [380] . The Harris et
al. c alculations are not sufficiently accurate for transition frequen-
cies but the evidence is that the transition intensities can be con-
sidered fairly reliable [381] . An overview of the HCN line list in
HITRAN2016 is given in Fig. 21 .
The air-broadening half widths were calculated using semi-
empirical expressions derived in Yang et al. [382] . Self-broadening
parameters were calculated using the procedure explained in the
HITRAN2004 paper [3] , see Eq. (20) there and discussion around
it.
2.24. CH 3 Cl (molecule 24)
The parameters of methyl chloride for 43,147 lines (7079
of which are new), were calculated based on a recent analy-
sis [383] of Fourier transform spectra in the range of 1900–
2600 cm
−1 . The data from the supplementary file of Ref.
[383] were used in the update. The error code 4 was given for
line positions and the error code 5 (5–10%)- for line intensities,
see Ref. [383] for details on uncertainties. We also recalculated the
Einstein A coefficients for the lines which had changed intensi-
ties. In addition, a couple of issues that have been identified in
the 3-μm region of CH 3 Cl in HITRAN2012 were fixed. In particu-
lar, the air-broadening temperature dependencies, n air, of the lines
around 3 μm used to be negative while they are supposed to be
positive. And all of the lines in the 3-μm band have a shift of
−0.02 cm
−1 /atm. We compared the calculated spectra from the HI-
TRAN database with the PNNL database [314] and the results show
that such a strong shift of the lines appears to be incorrect. There-
fore the shifts were set to be zero and n air to be positive around 3
μm. In a similar fashion we removed the shift of −0.02 cm
−1 /atm
in the ν2 + ν6 band around 5 μm.
Both experimental measurements and calculations have been
made of the self- and air- broadening coefficients of CH 3 Cl recently,
allowing for a relatively sophisticated update of these parameters
in HITRAN. The available results have been collected and evaluated
to update the database for CH 3 Cl. The details are as follows:
For self-broadening coefficients of CH 3 Cl:
1. The CH 3 35 Cl self-broadening coefficients at reference temper-
ature 296 K for the R-branch ( �K = 0) were computed using
a semi-empirical (SE) method described by Dudaryonok et al.
[384] . We used these semi-empirical calculations for R-branch
and P-branch (for all �K values) lines in all of the bands of
the two isotopologues CH 3 35 Cl and CH 3
37 Cl considered in the
database. The average value of RMS-deviations of the SE CH 3 Cl
self-broadening coefficients from the experimental data of Ref.
[385] is 0.0408 cm
−1 /atm. We used the ratio of the individual
half widths to this value to estimate the uncertainties and de-
termine a corresponding error code.
Only R-branch transitions for quantum number ranges of
0 ≤J ≤ 70, 0 ≤K ≤ 20 are available from Ref. [1] . The empiri-
cal relation enables evaluation of the P-branch and Q-branch
broadening coefficients from those of the R-branch
γP ( J, K ) ≈ γR ( J − 1 , K ) ≈ γQ ( J, K ) (7)
2. Experimental results collected from the literature were applied
to corresponding transitions with the same J and K . These ex-
perimental values supersede the calculated ones:
(a) Experimental results from Ref [386] . are used for the
same isotopologue, ( J ′ ,K
′ -J ′′ ,K
′′ ) transitions in all of the
bands, with the error code set to 5 (5–10%).
(b) Experimental results from Ref [385] . are for both pure ro-
tational ( J = 6, 31, 37, 40, 45, 50) and ν1 bands of CH 3 Cl.
The measured self-broadening coefficients for pure rota-
tional transitions are used for the corresponding tran-
sitions in the database. Experimental results for the ν1
band are used for transitions sharing the same quantum
numbers throughout other bands.
For air-broadening coefficients of CH 3 Cl:
1. The air-broadening coefficients and associated temperature ex-
ponents for both CH 3 35 Cl and CH 3
37 Cl ro-vibrational transitions
of R-branches ( �K = 0) are calculated by a semi-classical (SC)
approach [387] . The SC calculation are used for R-branch and
P-branch (for all �K values) lines in all of the bands assuming
γ P ( J,K ) ≈ γ R ( J −1, K ).
2. Experimental results from Ref. [388] and Ref. [389] are used for
the transitions sharing the same rotational quantum numbers.
Please cite this article as: I.E. Gordon et al., The HITRAN2016 molecular spectroscopic database, Journal of Quantitative Spectroscopy &
Radiative Transfer (2017), http://dx.doi.org/10.1016/j.jqsrt.2017.06.038

32 I.E. Gordon et al. / Journal of Quantitative Spectroscopy & Radiative Transfer 0 0 0 (2017) 1–66
ARTICLE IN PRESS
JID: JQSRT [m5G; August 21, 2017;14:18 ]
Fig. 21. Overview of the transitions of HCN in HITRAN2016 with new bands revealed.
Fig. 22. Comparison of the SAlTY line list [424] with the phosphine data from HITRAN2012 at room temperature; also shown are the recent results of Malathy Devi et al.
[426] .
For air-broadening temperature dependencies of CH 3 Cl:
The air-broadening temperature exponents have been up-
dated using the SC calculations of Buldyreva [387] . Only the ro-
vibrational transitions of R-branches and P-branches were calcu-
lated. The values for Q-branches were kept at the constant value
of 0.70 for n P ( J,K ) ≈ n R ( J −1, K ).
2.25. H 2 O 2 (molecule 25)
For hydrogen peroxide, H 2 O 2 , the measurements of the air-
broadening half widths from Refs. [390–392] were included for the
corresponding transitions. The majority of the air-broadened coef-
ficients in the database still have the same value of 0.1 cm
-1 /atm
estimated from the measurements of Malathy Devi et al. [392] .
Currently the H 2 O 2 line list contained in HITRAN only covers
wavelengths longer than 5 μm. PNNL [314] and recent ab initio cal-
culations [393,394] show strong features near 2.75 μm associated
with the OH stretch. More laboratory work is needed to obtain re-
liable line lists in that region.
2.26. C 2 H 2 (molecule 26)
New bands of acetylene from the wavenumber regions
13 − 248 cm
–1 and 390 − 634 cm
–1 were added using the results of
Refs. [395–397] . The new data incorporated into HITRAN2016 are
Please cite this article as: I.E. Gordon et al., The HITRAN2016 molecular spectroscopic database, Journal of Quantitative Spectroscopy &
Radiative Transfer (2017), http://dx.doi.org/10.1016/j.jqsrt.2017.06.038

I.E. Gordon et al. / Journal of Quantitative Spectroscopy & Radiative Transfer 0 0 0 (2017) 1–66 33
ARTICLE IN PRESS
JID: JQSRT [m5G; August 21, 2017;14:18 ]
based mainly on the global modeling of both line positions and in-
tensities performed in Tomsk within the framework of the method
of effective operators [395] . The new measurements performed by
Jacquemart et al. [397] considerably extend the available experi-
mental data in the 390–634 cm
−1 region and allow an increase in
the number of the fitted effective dipole moment (EDM) parame-
ters responsible for the line intensities in the 13–634 cm
−1 region.
This extended set of EDM parameters has better extrapolation abil-
ities compared to that published in Ref. [395] . Using the eigenfunc-
tions of the effective Hamiltonian from Ref. [395] and the new set
of EDM parameters, a new list of line positions and intensities was
generated. This list was used to update the C 2 H 2 line list in the
13 − 248 cm
–1 and 390 − 634 cm
–1 regions.
Global modeling of the rovibrational energies of the bending
vibrational states has also been performed in the Jet Propulsion
Laboratory (JPL) [396] using an EH for the bending modes. The
comparisons to the observed line positions showed that the JPL
calculated line positions are slightly closer to the observations for
the high values of the angular momentum quantum numbers than
those derived from Ref. [395] . Thus it was decided to use JPL line
positions (when available) for these bands.
The line list has been completed by other parameters (self-
and air-broadening coefficients, temperature exponents of air-
broadening coefficients, air-shift coefficients) as described in
Section 4 of Jacquemart et al. [398] .
Uncertainty codes 4 (0.0 0 01 to 0.001 cm
−1 ) for the line posi-
tions and 6 (2–5%) for the line intensities were used in the case
of the observed bands. For predicted bands, an uncertainty code 3
(0.001 to 0.01 cm
−1 ) for the line positions and 4 (10–20%) for the
line intensities were adopted. For the JPL line positions, the uncer-
tainty code 5 (0.0 0 0 01 to 0.0 0 01 cm
−1 ) was used.
The labeling V 1 V 2 V 3 V 4 � 4 � 5 J ε of the ro-vibrational states
has been used in the list; see Jacquemart et al. [397] for details.
In addition, it was discovered that the Q-branch in the
ν2 + 2 ν4 + ν5 band near 2.58 μm was missing from the database. It
is now provided based on the model of Lyulin and Perevalov [395] .
In our effort to expand the database to spectral line param-
eters relevant to the study of planetary atmospheres, we have
compiled semi-empirical parameter sets of C 2 H 2 broadened and
shifted by the pressure of H 2 , He and CO 2 together with the cor-
responding temperature dependence of the linewidth. This update
was described in detail in Wilzewski et al. [4] . These new pa-
rameters were constructed from Refs. [257,399–402] for H 2 , Refs.
[403,404] for He and Refs. [405,406] for CO 2 .
Further studies of these line-shape parameters are important
to improve our current update. This is especially true for the
C 2 H 2 –CO 2 system, where almost no shift parameters and no
temperature-dependence values have been reported in the litera-
ture to this point.
We note a recent study by Lyulin and Campargue [407] where
empirical line lists for some of the NIR bands of acetylene are pro-
vided. These will be considered for future updates of HITRAN.
2.27. C 2 H 6 (molecule 27)
Ethane (C 2 H 6 ) is the second most abundant hydrocarbon af-
ter CH 4 in the stratospheres of the outer planets (see for instance
Ref. [408] ) and Titan [409] . It therefore plays an important role
as a tracer of atmospheric chemistry and dynamics. C 2 H 6 is a di-
rect product of CH 4 photochemistry and is a key constituent in
photochemical modeling. In addition to the ν9 fundamental of
ethane, which is the strongest band seen in Titan observed in the
10-μm terrestrial window, the weak v 4 torsional band at ∼35 μm
(289 cm
−1 ) has been detected on Titan by Cassini/CIRS [410] . Al-
though the torsional band is not infrared active in the lowest order
and hence very weak in a laboratory setting, the features near 35
μm are seen relatively strong in the Cassini/CIRS spectrum of Ti-
tan. This new development in the far-infrared enables astronomers
to probe the lower altitudes of Titan’s atmosphere.
2.27.1. 12 C 2 H 6
Since the last update in HITRAN2012 [1] for 12 C 2 H 6 at 12 μm
reported by Devi et al. [411,412] and at 7 μm reported by di Lauro
et al. [413] , significant progress has been made for ethane in the
far- and mid-infrared regions. Moazzen-Ahmadi et al. [414] stud-
ied the features in the 35-μm region both in laboratory measure-
ments and theoretical modeling, which included the torsional fun-
damental v 4 , and the first torsional hot band, 2 v 4 - v 4 , of 12 C 2 H 6
and the Q-branch of the 13 CH 3 12 CH 3 v 6 band. Multiple sets of pure
ethane spectra were obtained at cold temperatures down to 166 K
at the Jet Propulsion Laboratory using a multipass absorption cell
with 52-m path length. Starting with the earlier global analyses
of ethane considering inter-vibrational interactions among the tor-
sional levels of ν3 , ν9 , 3 ν4 bands [415] , the observed spectra were
fit by adjusting independent dipole constants and the same value
for self-broadening parameter for every transition. The observed
spectra were reproduced to the residuals of 1% (the reader is re-
ferred to Fig. 1 in Ref. [415] ).
It was found that the modeling of the transition intensities re-
quired an expansion of the dipole moment operator to higher or-
der; this introduced Herman-Wallis like terms. The line positions
and line intensities of the torsional band ( v 4 ) of 12 C 2 H 6 at 35 μm
reported by Moazzen-Ahmadi et al. [414] have been adopted in
this update. The uncertainties for line positions are set to no better
than 0.0 0 03 cm
−1 (HITRAN code = 4), while those of the line in-
tensities are conservatively set to be 5 to 10% (HITRAN code = 5).
For the pressure-broadened widths of the torsional band ( v 4 ) at
35 μm, it should be noted that self- and N 2 -broadened widths are
listed in this version, for which we adopted the values calculated
by using the linear expressions for ν9 transitions reported by Devi
et al. [411,412] , similar to what was done for C 2 H 6 in the 7-μm
region in HITRAN2008 [198] . The uncertainties for widths are con-
servatively set to 10-20% (HITRAN code = 4). The uncertainties for
the temperature dependence exponents of the widths are thought
to be 10-25% (HITRAN code = 3).
In the near future two minor isotopologues of ethane could be
updated in the 12 μm region; one is for the 13 C singly-enriched v 12
band of ethane ( 13 CH 3 12 CH 3 ) at 12.2 μm measured by Devi et al.
[416] and the other for the singly-deuterated ethane (C 2 H 5 D) at
12.5 μm studied by Daly et al. [417] . In particular, new studies were
reported for 13 CH 3 12 CH 3 in the v 12 band in the 12 μm region by
Devi et al. [416] and in the 7 μm region by di Lauro et al. [418] for
the v 4 , v 9 , v 10 and v 6 + v 11 bands between 1345 and 1557 cm
−1 .
Their intensities were reported at 130 K with partially completed
theoretical modeling.
2.28. PH 3 (molecule 28)
Phosphine (PH 3 ) is a molecule of interest in astronomy, and its
features have long been observed and identified in the spectra of
Jupiter and Saturn ( e.g . Refs. [419–422] ). Because of its great im-
portance in the Earth’s and other planetary atmospheres includ-
ing the interstellar medium, PH 3 has been the subject of a large
number of experimental and theoretical investigations. Far infrared
(FIR) line parameters of PH 3 were included for the first time in the
HITRAN2012 database [1] . No updates have been made for any of
the spectral line parameters for the infrared (IR) bands of phos-
phine since the HITRAN2008 database [198] . After the release of
the HITRAN2012 database, there have been a few experimental and
theoretical studies reported on phosphine [423–426] . Sousa-Silva
et al. [423,424] generated a line list for phosphine; their room tem-
perature line list consists of 137 million transitions among the 5.6
Please cite this article as: I.E. Gordon et al., The HITRAN2016 molecular spectroscopic database, Journal of Quantitative Spectroscopy &
Radiative Transfer (2017), http://dx.doi.org/10.1016/j.jqsrt.2017.06.038

34 I.E. Gordon et al. / Journal of Quantitative Spectroscopy & Radiative Transfer 0 0 0 (2017) 1–66
ARTICLE IN PRESS
JID: JQSRT [m5G; August 21, 2017;14:18 ]
million energy levels for the ro-vibrational states up to J max = 31
and energies up to 80 0 0 cm
−1 . It was augmented by a more ex-
tensive and more accurate “hot” line list capable of simulating ob-
served spectra from astronomical bodies at higher temperatures
( e.g . 1500 K). In the near infrared region that is important for re-
mote sensing of the outer planets, especially Jupiter and Saturn,
the two most extensive and comprehensive experimental measure-
ments of phosphine to date include: ( 1 ) the line positions and in-
tensities for the five bands (2 ν2 , ν2 + ν4 , 2 ν4 , ν1 and the ν3 ) in
the pentad region between 1950 and 2450 cm
−1 [426] and ( 2 ) the
measurements of spectral line-shape parameters ( e.g ., pressure-
broadened half widths, pressure shifts, and collisional line mixing
coefficients) for the ν2 + ν4 , 2 ν4 , ν1 and the ν3 bands [425] .
The measurements reported in Ref. [426] show an increase in
the number of individual fitted intensities for the fundamental
bands ν1 and ν3 from 20 and 50 reported in the previous labo-
ratory measurements of Tarrago et al. [2.2. 28.11 ] to 184 and 409,
respectively. The actual number of measured intensities in these
bands were 337 and 829, respectively; however only the best se-
lected lines were used in the determination of the pentad band
strength. Positions and intensities for more than 40 0 0 individual
transitions in the pentad were retrieved from analyses of the FTS
spectra recorded at the National Solar Observatory (NSO) on Kitt
Peak, and the PNNL spectra [314] . The results published in Refs.
[425,426] included 53 A + A- doublet components that are split by
the Coriolis interaction between the ν1 and ν3 bands, and nearly
150 vibrationally-mixed perturbation-allowed transitions. The pre-
dicted spectrum from the analysis, however, did not reproduce the
experimental spectrum fully because the precisions of the mea-
surements were better than the calculations (for example see Fig.
9 from Ref. [426] ). To improve the calculations, a global vibra-
tional and intensity analysis combining the pentad measurements
[425,426] with data in the dyad and the octad regions should be
undertaken.
It appears that the SAlTY line list from the recent ab initio cal-
culations [424] is in much better agreement with Ref. [426] than
with the HITRAN2012 data. Figure 22 shows a comparison of the
SAlTY line list [424] with the phosphine data from HITRAN2012
[1] at room temperature; also shown are the recent results of
Malathy Devi et al. [426] .
Recently, Nikitin et al. [427] have reported theoretical pre-
dictions of phosphine spectra based on ab initio dipole moment
[428] and potential energy surfaces [429] . These calculations per-
mitted a qualitatively correct agreement with observed data up to
the octad range (2733–3660 cm
−1 ). An example of the compari-
son between these ab initio and experimental PNNL spectra [314] is
given in Fig. 23 . The theoretical approach to these variational cal-
culations is described in Rey et al. [430] and the corresponding line
list and ab initio cross-sections in the range (0-70 0 0 cm
−1 ) is avail-
able in the TheoReTS database [205] .
The ab initio calculations described above (especially line posi-
tions) may not be of sufficient quality to model room-temperature
high resolution spectra to the HITRAN standard of accuracy. How-
ever, they are very helpful in assigning experimental spectra and
invaluable in high-temperature simulations and will be considered
for inclusion in a future edition of the HITEMP database [278] .
The theoretical background and the set of programs used for
both the energy and intensity fittings in the analysis of Malathy
Devi et al. are described in Ref. [426] . Along with the positions
and intensities, line-shape parameters were measured for a large
number of transitions (over 840 Lorentz self-broadened half width
coefficients, 620 self-shift coefficients, 185 speed dependence pa-
rameters, and collisional line-mixing parameters for 10 A + A- dou-
blet transitions) in the 2 ν4 , ν1 and ν3 bands, and those measure-
ments are reported in a separate article [425] . As mentioned in
the analysis of positions and intensities [426] , the parameters in
Fig. 23. Comparison of experimental PNNL absorbance cross-sections [314] of PH 3
in the dyad and pentad ranges (in black) with variational calculations Rey et al.
[205] (upside down in red).
the pentad region are important for the exploration of chemistry
and dynamics on Saturn using the existing Cassini/VIMS observa-
tions. The results reported in Refs. [425,426] (which have appropri-
ate supplementary materials) are applicable to a variety of remote-
sensing studies including the analyses of the near infrared data of
Jupiter from the Juno mission and ESA’s Jupiter Icy Moons Explorer
(JUICE).
Creation of a line list of PH 3 in the pentad and octad regions
is in progress and is expected to be available as an update to the
HITRAN2016 database.
2.29. COF 2 (molecule 29)
Unchanged.
2.30. SF 6 (molecule 30)
Unchanged.
2.31. H 2 S (molecule 31)
Line positions for 654 transitions in the (010)–(0 0 0) band were
updated using experimental upper- state energy levels for H 2 32 S,
H 2 33 S, and H 2
34 S isotopologues reported in Ulenikov et al. [431] .
while the lower-state energy levels were calculated using the
rotational constants of Flaud et al. [432] . It appeared that the
band center of this band was off by about 0.002 cm
−1 in HI-
TRAN2012 while some higher- J rotational transitions were off by
up to ∼0.055 cm
−1 .
In the triad region it was found that values for different pa-
rameters for some of the lines were not transferred correctly from
Ref. [433] to HITRAN20 0 0 [434] . This issue remained all the way
through HITRAN2012, but has been fixed for HITRAN2016.
Intensity distribution of some of the multiplets in the NIR re-
gion was found to be inaccurate in the previous version in HITRAN
for many lines where the experimental intensity for the entire
multiplet were given to every component in the multiplet, rather
than the intensity being divided between components. This is fixed
in HITRAN2016.
The air-broadening coefficients of hydrogen sulfide (H 2 S) in the
HITRAN database were set to a constant value, γ air = 0.0740 cm
−1
atm
−1 at 296 K, for most of the transitions (since HITRAN2004 [3] )
Please cite this article as: I.E. Gordon et al., The HITRAN2016 molecular spectroscopic database, Journal of Quantitative Spectroscopy &
Radiative Transfer (2017), http://dx.doi.org/10.1016/j.jqsrt.2017.06.038

I.E. Gordon et al. / Journal of Quantitative Spectroscopy & Radiative Transfer 0 0 0 (2017) 1–66 35
ARTICLE IN PRESS
JID: JQSRT [m5G; August 21, 2017;14:18 ]
Fig. 24. Experimental air-and self-broadening coefficients of H 2 S lines Left panel: Air-broadening coefficients. Waschull1994 stands for Ref. [435] , Sumpf1996- Ref. [436] ,
Ball1999- Ref. [440] , Kissel2002-Ref. [437] , Ciaffoni2008- Ref. [441] . Right panel: Self-broadening coefficients. Sumpf1996s stands for Ref. [438] .
based on the average value of available experimental data while
just a few half widths were based on experimental values. For HI-
TRAN2016, a thorough survey of measurements of both the air-
broadening and self-broadening coefficients of H 2 S has been made
[435–438] . The report by Tan et al. [439] describes the results in
more detail. In brief, a slow decrease of the air-(and self-) broaden-
ing coefficients with increasing ( J ′ ′ + 0.2 K a
′ ′ ) lower-state quantum
number combination can be seen in Fig. 24 . The vibrational de-
pendence of the broadening parameters is neglected and we use
the semi-empirical method based on the linear fit to the available
experimental data to compute both air- and self-broadening coef-
ficients of H 2 S for all the isotopologues. This linear approaching
value could only be used within the range probed by experiments.
So for lower-state rotational quantum number J ′ ′ < 12, the error
code was set to 4 (between 10 and 20%) for both self- and air-
broadening coefficients; for 12 ≤ J ′ ′ ≤ 18, the error code was set to 3
( > 20%); and for J ′ ′ > 18, the value of both self- and air-broadening
coefficients was set to the linear fit value corresponding to J ′ ′ = 18,
and the error code was 2 (estimate).
2.32. HCOOH (molecule 32)
Unchanged.
2.33. HO 2 (molecule 33)
The air-broadening coefficients of the hydroperoxyl radical had
not been modified since HITRAN2004 [3] in which they were set
to a constant, γ air = 0.107 cm
−1 /atm (based on the measurement in
Ref. [442] ). In the meantime, a number of different measurements
of γ air have been performed using infrared and submillimeter-
wave spectra [4 42–4 47] . These measurements indicate a small vi-
brational dependence and a slow linear dependence with rota-
tional quanta for γ air .
The following approach was chosen for the air-broadening val-
ues in HITRAN2016. Experimental values were used wherever
available for all the transitions with the corresponding rotational
quantum numbers (in all the bands). For all other lines, a linear
extrapolation with ( J ′′ + 0.2K a ′′ ) < 17 was used:
γair = 0 . 1367 − 0 . 0027 ×(J ′′ + 0 . 2 K
′′ a
)(8)
For all transitions with ( J ′′ + 0.2K a ′′ ) > 17, the value correspond-
ing to the experimental value with the largest ( J ′′ + 0.2K a ′′ ) was
used. More details on the aforementioned algorithm are given in
the report by Tan et al. [448] .
For the self-broadening, a default estimate value of
0.3 cm
−1 /atm was assigned to all transitions.
2.34. O (“molecule” 34)
The values of line positions and lower-state energies for the O
atom have been reverted to those given in the HITRAN1996-20 0 0
editions [434,449] . They originate from Zink et al. [450] . The HI-
TRAN2004 to 2012 editions used outdated values from the older
version of the JPL catalogue [451] (downloaded in 2004), although
the reference code mistakenly pointed to the work of Zink et al.
The values have since been fixed in the JPL catalogue [451] (down-
loaded in 2015), and consequently we reverted back to the more
accurate values of Zink et al. [450] .
2.35. ClONO 2 (molecule 35)
Unchanged.
2.36. NO
+ (molecule 36)
The fundamental band of the NO
+ molecule (in ground-
electronic state 1 + ) as well as its hot bands were introduced
into the HITRAN1996 edition [449] and updated in 2008 [198] . As
pointed out by López-Puertas et al. [452] and references therein,
the molecule is an important constituent of Earth’s ionosphere. Ref.
[452] actually used atmospheric observations to determine transi-
tion frequencies of its fundamental band and the associated hot
band. The identification of NO
+ in the terrestrial atmosphere by
rotational spectroscopy should be possible. In addition, NO
+ was
recently identified tentatively in the interstellar medium [453] .
The new edition of HITRAN adds the previously omitted pure-
rotation transitions. The current prediction of the rotational spec-
trum corresponds to the recently created version 2 of the CDMS
[454] . The data are based on a fit to rotational data [455] as well
as ro-vibrational data [452,456] . The dipole moment of 0.380 D is
from a quantum-chemical calculation [457] .
The ground state rotational data extend to the J = 8–7 transition
near 32 cm
–1 . Therefore, predictions should be reliable to at least
up to 70 cm
–1 . The entry now also contains predictions of rota-
tional transitions in v = 1; these are more uncertain than those in
v = 0.
2.37. HOBr (molecule 37)
Unchanged.
Please cite this article as: I.E. Gordon et al., The HITRAN2016 molecular spectroscopic database, Journal of Quantitative Spectroscopy &
Radiative Transfer (2017), http://dx.doi.org/10.1016/j.jqsrt.2017.06.038

36 I.E. Gordon et al. / Journal of Quantitative Spectroscopy & Radiative Transfer 0 0 0 (2017) 1–66
ARTICLE IN PRESS
JID: JQSRT [m5G; August 21, 2017;14:18 ]
2.38. C 2 H 4 (molecule 38)
Ethylene, C 2 H 4 , is both a naturally-occurring compound and a
tropospheric pollutant on the Earth [458] . It is also present as a
by-product of methane photochemistry in the atmosphere of outer
solar system bodies including Saturn [459] and Titan [409] . Opti-
cal remote sensing of ethylene in planetary atmospheres often re-
lies on the strongest band observed in the 10-μm spectral region,
namely the ν7 fundamental of the main isotopologue [460] . The
extensive work carried out in this range of the ro-vibration spec-
trum of 12 C 2 H 4 was recently reviewed by Alkadrou et al. [461] . The
data available in HITRAN2012 for the 10-μm region corresponds to
the infrared active ν10 , ν7 and ν12 bands of 12 C 2 H 4 , and the in-
frared and Raman inactive ν4 band of the same isotopologue, lo-
cated near 826, 949, 1442 and 1026 cm
–1 , respectively. The infor-
mation for the ν10 , ν7 and ν4 bands dates back to the 20 0 0 edi-
tion of HITRAN [434] . It was generated relying on the frequency
analysis of Willaert et al. [462] , Cauuet et al. [463] , Legrand et
al. [464] and Rusinek et al. [465] , and intensities measured for 13
lines of the ν7 band observed in the range 940–970 cm
–1 [466] .
Spectroscopic information obtained for the ν12 band by Rotger et
al. [467] was added in the 2008 edition [198] .
A global frequency and intensity analysis of the 10-μm
ν10 / ν7 / ν4 / ν12 band system of 12 C 2 H 4 was very recently carried
out using the tensorial formalism developed in Dijon for X 2 Y 4
asymmetric-top molecules and including the Coriolis interactions
affecting the upper vibrational levels 10 1 , 7 1 , 4 1 and 12 1 [461] .
Relying on spectroscopic information available in the literature or
specifically retrieved from high-resolution Fourier transform in-
frared spectra, a total of 10,757 line positions and 1645 line inten-
sities were assigned and fitted with global root mean square devi-
ations of 2.6 × 10 –4 cm
–1 and 2.5%, respectively. Using the results
of that work and information available in the literature, a HITRAN-
formatted list of parameters for 65,776 lines belonging to the ν10 ,
ν7 , ν4 and ν12 bands of 12 C 2 H 4 and covering the 620–1525 cm
–1
range was generated [461] . Comparisons of experimental spectra
with spectra calculated for the same physical conditions with this
line list and HITRAN 2012 are presented in Figs. 5 to 7 of Ref. [461] .
They show that the modeling provided by this line list is signifi-
cantly better than HITRAN 2012 for the ν10 band, comparable for
the ν7 band (and for the ν4 band hidden beneath it), and slightly
worse for the ν12 band.
In the line list of Ref. [461] , the vibration-rotation levels are as-
signed using the traditional ( J, K a , K c ) labels, where J is the quan-
tum number associated with the total angular momentum of the
molecule, and K a and K c are associated with its projections along
the molecular symmetry axes corresponding to the limiting prolate
and oblate symmetric top approximations. As the tensorial formal-
ism characterizes these levels using (J, C, α) labels (C is the ro-
vibrational symmetry in the D 2h group, and α is a ranking number
used to sort the energy levels within a (J, C) block), a “translation”
had to be carried out when generating the line list. It was very
recently found that K a and K c labels were incorrect for a number
of heavily-mixed rotational levels of the 10 1 , 7 1 and 4 1 upper vi-
brational levels. A corrected line list was therefore generated and
submitted for publication [468] .
The spectroscopic information available in HITRAN for the 10-
μm region of 12 C 2 H 4 has been updated in the following way.
Data for the ν10 , ν7 and ν4 bands were taken from the corrected
line list of Alkadrou et al. [468] ; however, lines having intensity
smaller than 10 –30 cm
–1 /(molecule cm
–2 ) at 296 K were ignored.
The line positions are given a HITRAN error code of 4 or 0 (0.0 0 01–
0.001 cm
−1 and larger than 1 cm
−1 respectively) depending on
whether the corresponding J ′′ and K a ′′ values are or are not in
the ranges included in the frequency analysis of Ref. [461] . Sim-
ilarly, an error code of 5 (5–10%) characterizes the intensities of
lines in the ν10 and ν7 bands corresponding to transitions involv-
ing J ′′ and K a ′′ values in the ranges included in the intensity anal-
ysis of Ref. [461] . The error code is set to 0 for all other line in-
tensities. Note that errors in the degeneracies provided for the ro-
tational levels in the 10 1 and 7 1 vibrational levels in the line lists
of Refs. [461] and [468] are corrected here. Data for the ν12 band
was taken from HITRAN2012; however, 187 lines having an inten-
sity smaller than 10 –30 cm
–1 /(molecule cm
–2 ) at 296 K have been
excluded, to be consistent with the information provided for the
three other bands. For all the lines, the self-broadening coefficients
were calculated using the empirical expressions reported in Ref.
[460] , the air-broadening coefficients were generated as described
in [467] , and the temperature dependence exponent n was set to
0.76, determined as described in Ref. [461] .
The consistency of the C 2 H 4 analyses that served for the up-
dated line list has been confirmed by extensive variational calcu-
lations [469] based on ab initio potential energy [470] and dipole
moment surfaces [471] . This sort of qualitative band-shape valida-
tion was found to be particularly important for modeling compli-
cated intensity perturbations involving “dark” states and for check-
ing for possible contributions of hot bands. The corresponding vari-
ational methods are described by Rey et al. [469] , and the results
of ab initio based calculations including cold and hot bands in the
range 0–60 0 0 cm
−1 can be found in the TheoReTS database [205] .
These calculations agree well with the new HITRAN2016 line list
and experimental PNNL spectra [314] in the 10-μm region.
New bands of 12 C
13 CH 4 are included in the new version of the
database. More precisely, the new parameters which were derived
from high-resolution Fourier transform spectra are those of the
ν10 , ν8, ν7, ν4, ν6 bands, which absorb in the 615–1339 cm
−1 spec-
tral region [472,473] . Their accuracy can be estimated to be of the
order of 0.6 × 10 −3 cm
−1 for the positions [473] and 4% for the in-
tensities [472] . The broadening parameters were determined in the
same fashion as for the principal isotopologue described above.
Fig. 25 (generated using HAPI described in Section 6 ) shows
that the HITRAN2016 ethylene line list models experimental spec-
tra from PNNL [314] much better than HITRAN2012.
2.39. CH 3 OH (molecule 39)
It was found that lower-state energies in the IR spectra of
methanol introduced in HITRAN2004 [3] do not follow HITRAN for-
malism in that the lowest allowed energy level should be equal to
zero. Yet the convention was observed in the MW region. The low-
est energy in the IR spectra was 128.1069 cm
−1 instead of zero.
This has been fixed now to follow the usual convention.
2.40. CH 3 Br (molecule 40)
Unchanged.
2.41. CH 3 CN (molecule 41)
Methyl cyanide, also known as acetonitrile or cyanomethane,
a trace species in the terrestrial atmosphere [474] , has also been
seen in comets [475] and in the atmosphere of Titan [476] , and
is an important species in various environments of the interstel-
lar medium. Müller et al. [479] provided a brief overview as well
as appropriate references. The ν4 band of methyl cyanide was in-
troduced into HITRAN2008 [198] . The data were based on a mul-
tispectrum analysis of this band and a preliminary modeling of
the positions and intensities [477,478] . The ν4 band is actually the
third lowest wavelength band, with ν8 and 2 ν8 being at longer
wavelengths. The prospects of detecting transitions of ν8 or 2 ν8
with the James-Webb Space Telescope or other instruments in
space or in Earth’s atmosphere are uncertain. The data are thought
Please cite this article as: I.E. Gordon et al., The HITRAN2016 molecular spectroscopic database, Journal of Quantitative Spectroscopy &
Radiative Transfer (2017), http://dx.doi.org/10.1016/j.jqsrt.2017.06.038

I.E. Gordon et al. / Journal of Quantitative Spectroscopy & Radiative Transfer 0 0 0 (2017) 1–66 37
ARTICLE IN PRESS
JID: JQSRT [m5G; August 21, 2017;14:18 ]
Fig. 25. HITRAN2016 vs HITRAN2012 when simulating PNNL experimental data in the a) 700–850 cm
−1 , b) in the 850–1100 cm
−1 regions of ethylene spectra (1 atm., 296 K).
to be important for the excitation or de-excitation of the v = 0
transitions or of bands with much greater intensity, such as ν6 .
The following update is planned in the immediate future, fol-
lowing the HITRAN2016 release. The current line position and in-
tensity predictions for ν8 , 2 ν8 , and 2 ν8 –ν8 are from the CDMS
[454] ; the entries are actually combined CDMS and JPL entries.
The predictions are based on a combined fit of rotational and ro-
vibrational data involving states up to v 8 = 2 that was published
by Müller et al. [479] . The analysis takes into account interactions
among these states as well as interactions of v 8 = 2 with v 4 = 1, v 7 = 1, and v 8 = 3 and of the last three states among each other.
The ν8 transition frequencies were taken from Koivusaari [480] ,
and the 2 ν8 transition frequencies were from Müller et al. [479] .
Most of the v 8 = 1 and 2 rotational data as well as some v = 0 data
are also from Müller et al. [479] . Most of the additional ground-
state data were published by Cazzoli and Puzzarini [481] and by
Müller et al. [482] . Information of the K level structure in the
ground vibrational state is based on Anttila et al. [483] and on the
perturbations treated in Ref. [479] . Additional v 8 = 1 and 2 data
were published by Bauer et al. [484] . Parameters describing the
three states around 10 μm were taken mostly from the study of
Tolonen at al. [485] .
Please cite this article as: I.E. Gordon et al., The HITRAN2016 molecular spectroscopic database, Journal of Quantitative Spectroscopy &
Radiative Transfer (2017), http://dx.doi.org/10.1016/j.jqsrt.2017.06.038

38 I.E. Gordon et al. / Journal of Quantitative Spectroscopy & Radiative Transfer 0 0 0 (2017) 1–66
ARTICLE IN PRESS
JID: JQSRT [m5G; August 21, 2017;14:18 ]
Fig. 26. Comparison between an experimental spectrum [487] and calculations using the previous HITRAN2012 line list (inverted and scaled) and that constituting the
HITRAN2016 update.
The transition dipole moments were evaluated by Müller at al.
[479] as were line broadening and shifting parameters which were
transferred from the ν4 band [477] . The predictions should be reli-
able throughout, but slight caution is recommended for the highest
K transitions of 2 ν8 ( K = 13 and 14).
Assignments for the ν4 band are probably complete as far as
the available spectral recordings are concerned. However, the pre-
liminary analysis in Ref. [478] , together with data from Ref. [479] ,
affected the ground-state parameters substantially such that a new
modeling effort will be necessary. The analysis should be com-
pleted well before the next HITRAN update, and further data may
be available as well.
2.42. CF 4 (molecule 42)
Carbon tetrafluoride, CF 4 , is a greenhouse gas with a huge
global warming potential. Up to now, only the ν3 fundamental
band was present in HITRAN. However, this band represents only
about 65% of the absorption intensity at room temperature due to
the presence of hot bands.
A new global fit of all CF 4 assigned lines involving the ν2 ,
ν3 and ν4 modes, as well as a separate one consisting of the
ν1 mode have been performed, including some new experimental
data which was recently recorded in the Groupe de Spectrométrie
Moléculaire et Atmosphérique, Université de Reims-Champagne-
Ardenne. This study [486] will be published soon. It has resulted
in new reliable effective Hamiltonian parameters for 12 CF 4 , which,
in turn, allow an improved calculation of the ν4 and ν3 fundamen-
tal bands and, also and for the first time, of the ν3 + ν2 - ν2 hot
band which represents about 17 % of the absorption intensity in
this region at room temperature. The dipole moment parameters
have also been corrected. This will be explained in detail in Ref.
[486] . Thus, the present update completely replaces the previous
data and includes the ν4 , ν3 and ν3 + ν2 - ν2 bands.
Fig. 26 shows a comparison between an experimental spectrum
from the Rennes group [487] and the calculation constituting the
HITRAN2016 update.
2.43. C 4 H 2 (molecule 43)
The ν9 band region (around 220 cm
−1 ) and the ν8 band re-
gion (around 650 cm
−1 ) of diacetylene, C 4 H 2 , is important in in-
terpreting Titan [488] observations. The ν9 band region has been
completely replaced with a new line list derived from a combined
analysis presented in Refs. [4 88,4 89] . The updated line list provides
new intensity for the lines already existing in the database but also
includes numerous hot bands. The ν8 band region was updated by
scaling the intensities of all the lines in that region by a factor of
0.8 based on the recommendation given in Jolly et al. [489] . Finally,
the ν6 + ν8 region (around 1200 cm
−1 ) was introduced into HITRAN
for the first time based on the predictions from the global analy-
ses. This band is important in astrophysics as it has been observed
in the atmosphere of Titan and the preplanetary nebula SMP LMC
11 with the Spitzer Infrared Spectrograph [490] .
2.44. HC 3 N (molecule 44)
Unchanged.
2.45. H 2 (molecule 45)
Molecular hydrogen (H 2 ) is the most abundant gas in the atmo-
sphere of gaseous giants. It was first introduced in HITRAN2012 [1] .
The line list covered the quadrupole-allowed transitions for the H 2
isotopologue and dipole-allowed transitions for HD in their ground
electronic states.
An update was made for singly-deuterated molecular hydrogen
(HD) shortly after the release of the HITRAN2012 database. It was
discovered by J. Mendrok (Lulea University of Technology, Kiruna,
Sweden) that the abundance of the HD molecule was incorrectly
calculated in the original release of HITRAN2012; this issue has
now been fixed. The implication was that the intensities of the
electric dipole transitions originally reported needed to be multi-
plied by a factor of two, although it did not affect the Einstein-A
coefficients.
Please cite this article as: I.E. Gordon et al., The HITRAN2016 molecular spectroscopic database, Journal of Quantitative Spectroscopy &
Radiative Transfer (2017), http://dx.doi.org/10.1016/j.jqsrt.2017.06.038
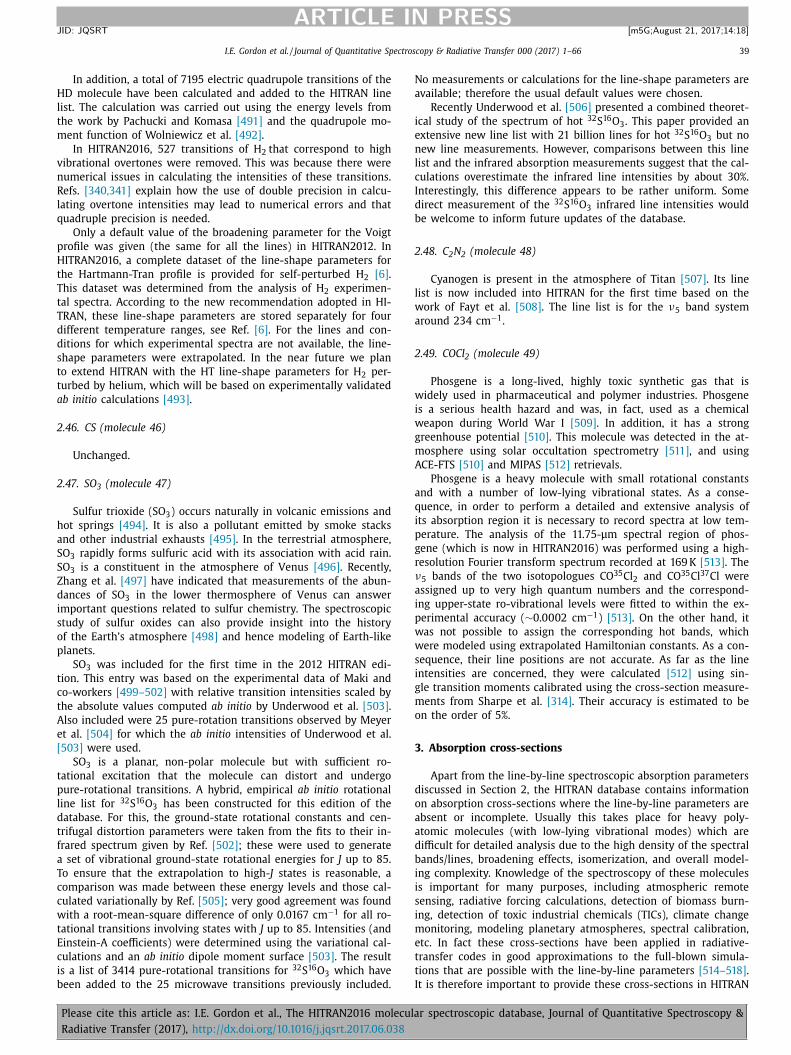
I.E. Gordon et al. / Journal of Quantitative Spectroscopy & Radiative Transfer 0 0 0 (2017) 1–66 39
ARTICLE IN PRESS
JID: JQSRT [m5G; August 21, 2017;14:18 ]
In addition, a total of 7195 electric quadrupole transitions of the
HD molecule have been calculated and added to the HITRAN line
list. The calculation was carried out using the energy levels from
the work by Pachucki and Komasa [491] and the quadrupole mo-
ment function of Wolniewicz et al. [492] .
In HITRAN2016, 527 transitions of H 2 that correspond to high
vibrational overtones were removed. This was because there were
numerical issues in calculating the intensities of these transitions.
Refs. [340,341] explain how the use of double precision in calcu-
lating overtone intensities may lead to numerical errors and that
quadruple precision is needed.
Only a default value of the broadening parameter for the Voigt
profile was given (the same for all the lines) in HITRAN2012. In
HITRAN2016, a complete dataset of the line-shape parameters for
the Hartmann-Tran profile is provided for self-perturbed H 2 [6] .
This dataset was determined from the analysis of H 2 experimen-
tal spectra. According to the new recommendation adopted in HI-
TRAN, these line-shape parameters are stored separately for four
different tem perature ranges, see Ref. [6] . For the lines and con-
ditions for which experimental spectra are not available, the line-
shape parameters were extrapolated. In the near future we plan
to extend HITRAN with the HT line-shape parameters for H 2 per-
turbed by helium, which will be based on experimentally validated
ab initio calculations [493] .
2.46. CS (molecule 46)
Unchanged.
2.47. SO 3 (molecule 47)
Sulfur trioxide (SO 3 ) occurs naturally in volcanic emissions and
hot springs [494] . It is also a pollutant emitted by smoke stacks
and other industrial exhausts [495] . In the terrestrial atmosphere,
SO 3 rapidly forms sulfuric acid with its association with acid rain.
SO 3 is a constituent in the atmosphere of Venus [496] . Recently,
Zhang et al. [497] have indicated that measurements of the abun-
dances of SO 3 in the lower thermosphere of Venus can answer
important questions related to sulfur chemistry. The spectroscopic
study of sulfur oxides can also provide insight into the history
of the Earth’s atmosphere [498] and hence modeling of Earth-like
planets.
SO 3 was included for the first time in the 2012 HITRAN edi-
tion. This entry was based on the experimental data of Maki and
co-workers [499–502] with relative transition intensities scaled by
the absolute values computed ab initio by Underwood et al. [503] .
Also included were 25 pure-rotation transitions observed by Meyer
et al. [504] for which the ab initio intensities of Underwood et al.
[503] were used.
SO 3 is a planar, non-polar molecule but with sufficient ro-
tational excitation that the molecule can distort and undergo
pure-rotational transitions. A hybrid, empirical ab initio rotational
line list for 32 S 16 O 3 has been constructed for this edition of the
database. For this, the ground-state rotational constants and cen-
trifugal distortion parameters were taken from the fits to their in-
frared spectrum given by Ref. [502] ; these were used to generate
a set of vibrational ground-state rotational energies for J up to 85.
To ensure that the extrapolation to high- J states is reasonable, a
comparison was made between these energy levels and those cal-
culated variationally by Ref. [505] ; very good agreement was found
with a root-mean-square difference of only 0.0167 cm
−1 for all ro-
tational transitions involving states with J up to 85. Intensities (and
Einstein-A coefficients) were determined using the variational cal-
culations and an ab initio dipole moment surface [503] . The result
is a list of 3414 pure-rotational transitions for 32 S 16 O 3 which have
been added to the 25 microwave transitions previously included.
No measurements or calculations for the line-shape parameters are
available; therefore the usual default values were chosen.
Recently Underwood et al. [506] presented a combined theoret-
ical study of the spectrum of hot 32 S 16 O 3 . This paper provided an
extensive new line list with 21 billion lines for hot 32 S 16 O 3 but no
new line measurements. However, comparisons between this line
list and the infrared absorption measurements suggest that the cal-
culations overestimate the infrared line intensities by about 30%.
Interestingly, this difference appears to be rather uniform. Some
direct measurement of the 32 S 16 O 3 infrared line intensities would
be welcome to inform future updates of the database.
2.48. C 2 N 2 (molecule 48)
Cyanogen is present in the atmosphere of Titan [507] . Its line
list is now included into HITRAN for the first time based on the
work of Fayt et al. [508] . The line list is for the ν5 band system
around 234 cm
−1 .
2.49. COCl 2 (molecule 49)
Phosgene is a long-lived, highly toxic synthetic gas that is
widely used in pharmaceutical and polymer industries. Phosgene
is a serious health hazard and was, in fact, used as a chemical
weapon during World War I [509] . In addition, it has a strong
greenhouse potential [510] . This molecule was detected in the at-
mosphere using solar occultation spectrometry [511] , and using
ACE-FTS [510] and MIPAS [512] retrievals.
Phosgene is a heavy molecule with small rotational constants
and with a number of low-lying vibrational states. As a conse-
quence, in order to perform a detailed and extensive analysis of
its absorption region it is necessary to record spectra at low tem-
perature. The analysis of the 11.75-μm spectral region of phos-
gene (which is now in HITRAN2016) was performed using a high-
resolution Fourier transform spectrum recorded at 169 K [513] . The
ν5 bands of the two isotopologues CO
35 Cl 2 and CO
35 Cl 37 Cl were
assigned up to very high quantum numbers and the correspond-
ing upper-state ro-vibrational levels were fitted to within the ex-
perimental accuracy ( ∼0.0 0 02 cm
−1 ) [513] . On the other hand, it
was not possible to assign the corresponding hot bands, which
were modeled using extrapolated Hamiltonian constants. As a con-
sequence, their line positions are not accurate. As far as the line
intensities are concerned, they were calculated [512] using sin-
gle transition moments calibrated using the cross-section measure-
ments from Sharpe et al. [314] . Their accuracy is estimated to be
on the order of 5%.
3. Absorption cross-sections
Apart from the line-by-line spectroscopic absorption parameters
discussed in Section 2, the HITRAN database contains information
on absorption cross-sections where the line-by-line parameters are
absent or incomplete. Usually this takes place for heavy poly-
atomic molecules (with low-lying vibrational modes) which are
difficult for detailed analysis due to the high density of the spectral
bands/lines, broadening effects, isomerization, and overall model-
ing complexity. Knowledge of the spectroscopy of these molecules
is important for many purposes, including atmospheric remote
sensing, radiative forcing calculations, detection of biomass burn-
ing, detection of toxic industrial chemicals (TICs), climate change
monitoring, modeling planetary atmospheres, spectral calibration,
etc. In fact these cross-sections have been applied in radiative-
transfer codes in good approximations to the full-blown simula-
tions that are possible with the line-by-line parameters [514–518] .
It is therefore important to provide these cross-sections in HITRAN
Please cite this article as: I.E. Gordon et al., The HITRAN2016 molecular spectroscopic database, Journal of Quantitative Spectroscopy &
Radiative Transfer (2017), http://dx.doi.org/10.1016/j.jqsrt.2017.06.038

40 I.E. Gordon et al. / Journal of Quantitative Spectroscopy & Radiative Transfer 0 0 0 (2017) 1–66
ARTICLE IN PRESS
JID: JQSRT [m5G; August 21, 2017;14:18 ]
covering wide spectral ranges and at diverse thermodynamic con-
ditions.
The cross-section files are provided in the HITRAN format de-
scribed in Ref. [449] and are further described on the official
HITRAN website ( http://hitran.org/docs/cross- sections- definitions/ ).
Each cross-section is given in a separate file with a header con-
taining molecule name, chemical formula, wavenumber range,
temperature, pressure, broadener, resolution of the experiment,
and source. The file is completed with the value of each cross-
section at equal intervals within the range, given in units of
cm
2 molecule −1 . The cross-sections come from high-resolution lab-
oratory observations, predominantly from Fourier transform spec-
trometers. Some of these measurements include small negative
values, which for the HITRAN-formatted cross-sections were sub-
stituted by zeroes; in these cases we provide all the original cross-
sections in a supplementary “Alternate” folder, because the nega-
tive values provide the user with some information about the noise
level in the measurements.
The HITRAN2012 edition of the database contained cross-
sections for about fifty gases. For the HITRAN2016 edition we have
increased the amount of gases almost six fold by adding new
data in the infrared spectral range. A dedicated paper detailing
this update will be published separately. Here we only provide
a brief summary and overview tables. Around 220 molecules of
atmospheric, industrial, and remote sensing interests were taken
from the quantitative spectroscopy PNNL (Pacific Northwest Na-
tional Laboratory) database, described in Sharpe et al. [314] . This
compilation was updated with 55 molecules from more recent
work of Johnson et al. [519] . Twelve of these 55 molcules are new
to PNNL. Spectra for these molecules will be indispensable, par-
ticularly for biomass burning detection. The PNNL database con-
tains calibration-quality composite spectra given at atmospheric
pressure and three temperatures (5 °C, 25 °C, and 50 °C). All
these cross-sections were measured using the FT-IR technique with
0.112 cm
−1 spectral resolution on a Bruker IFS 66v/S spectrometer.
In addition, a large portion of new molecules of atmospheric in-
terest was taken from the 2013 review by Hodnebrog et al. [520] .
The data presented in this review are more varied than PNNL con-
sidering spectral resolution, while containing all the strong spec-
tral features important in radiative forcing calculations (on Earth).
The subset of air and nitrogen broadened cross-sections from this
review is for 700–750 Torr pressure range and room temperature.
Some lower-temperature data for 253 K from Highwood and Shine
[521] were also included into HITRAN2016. Finally, more recently
measured data were taken from Wagner and Birk for BrONO 2
[522] , Harrison et al. for CFC-12 [523] , HCFC-22 [524] , CCl 4 [525] ,
HFC-23 [526] , HFC-134a [527] , Reed and Hodges (2015) for ethane
[528] , as well as newly measured and revised data for many
molecules from Refs. [529–540] .
The summary on the new and updated compounds divided by
categories is presented in Table 9 . These categories are imple-
mented in HITRAN online for the convenience of users to browse
the data. This summary does not include those compounds that
were not updated. For instance, there are no new UV cross-sections
that were added; therefore molecules that had only UV cross-
sections in HITRAN2012 are not included in this table.
In Fig. 27 we show an example of the update for the ac-
etaldehyde molecule (CH 3 CHO). The new data were taken from
the PNNL database [314] , while the data from HITRAN2012 were
originally from Tereszchuk and Bernath [541] . Sixteen cross-section
temperature-pressure sets from Ref. [541] are presented in HI-
TRAN2012 in the 240 0–340 0 cm
−1 spectral range. These cross-
sections were calibrated using the PNNL data [541] and thus are
in a good agreement with the update, in particular for absorp-
tion between 6.0 × 10 −21 and 1.0 × 10 −19 cm
2 molecule −1 . For this
molecule, the new update extends the temperature range up to
323 K and the wavenumber range from 510 to 6500 cm
−1 . The up-
date includes stronger features in the mid-infrared which were ab-
sent in HITRAN2012. The data from Ref. [541] are also retained in
the new HITRAN release.
In Table 10 the updates to the cross-sections of the molecules
already existing in HITRAN2012 are presented. High-quality data
were taken from different sources for the ranges which were ei-
ther absent or covered insufficiently. Updates for molecules that
were not previously in HITRAN are presented in Table 11 . In both
Table 10 and Table 11 we give total ranges for the wavenumber,
pressure, temperature, and resolution. Each line in both of the ta-
bles summarizes all updated cross-sections for the given molecule,
including those relegated to the alternate folder. If the broadener is
not provided, self-broadening is assumed. Both tables contain total
pressure of the sample including the buffer gas (where applicable).
While the extent of the update of the cross-sectional part of the
database is impressive, this section of the database is by no means
complete. In the future we plan further revision of high-quality
data that become available in the literature and by the facilitation
of new experiments. In the near future we also plan to extend the
database to include planetary-relevant cross-sections that recently
became available, including those given in Refs. [548–552] . An ex-
tensive update of the UV cross-sections is also planned.
4. Collision-induced absorption
Collision-induced absorption (CIA) was first introduced into HI-
TRAN in the 2012 edition and was largely based on the data col-
lected in Richard et al. [586] . This section of the database is ac-
cessible through ( www.hitran.org/cia ). CIA refers to absorption by
transient electric dipoles induced by the interaction between col-
liding molecules. Due to the short life-time of collision complexes,
this typically leads to broad absorption features underlying the
much sharper lines due to absorption by isolated molecules. As CIA
arises from binary collision complexes, the intensity scales with
the number densities of both the absorber and the perturber, i.e.,
with the square of the pressure at constant volume mixing ra-
tio. To be completely explicit, the transmittance at wavenumber ν ,
τ abs-pert ( ν), is related to the collision-induced cross section tabu-
lated in the HITRAN CIA section, k abs-pert ( ν), through
−ln
[τabs −pert ( ν)
]= k abs −pert ( ν) ρabs ρpert L, (10)
where ρabs and ρpert are the number densities of the absorber and
perturber, respectively, and L is the path length. The CIA cross sec-
tions tabulated in HITRAN are given in cm
5 molecule −2 throughout
[586] .
Often the relevant perturber will be air, i.e., a 21:79 mixture
of O 2 :N 2 (the amount of argon in the atmosphere coupled with
its poor efficiency as a collisional partner makes this assumption
quite reasonable). In that case, one can either add absorber-O 2
and absorber-N 2 contributions, or equivalently use the absorber-Air
files which are introduced in this version of HITRAN. In the latter
case, the perturber number density equals the air number density
given by ρpert = ρAir = ρO2 + ρN2 .
4.1. Molecular oxygen 1.27-μm band
The CIA data for the 1.27-μm band (corresponding to X
3 −g (v
= 0) → a 1 �g (v = 0)) of O 2 have been revised in the current re-
lease of HITRAN. In this region, CIA is stronger whereas magnetic
dipole lines are weaker when compared to the oxygen A-band.
Hence, under atmospheric conditions, CIA contributes significantly
to the absorption in the 1.27-μm band.
All data included for this transition are taken from the experi-
ment by Maté et al. [587] , recorded using a Fourier transform spec-
trometer. Data recorded for pure O 2 can be found in the O 2 −O 2
Please cite this article as: I.E. Gordon et al., The HITRAN2016 molecular spectroscopic database, Journal of Quantitative Spectroscopy &
Radiative Transfer (2017), http://dx.doi.org/10.1016/j.jqsrt.2017.06.038

I.E. Gordon et al. / Journal of Quantitative Spectroscopy & Radiative Transfer 0 0 0 (2017) 1–66 41
ARTICLE IN PRESS
JID: JQSRT [m5G; August 21, 2017;14:18 ]
Table 9
Categorization for the molecules in the HITRAN2016 update.
Category N src N mol N sets
Halogenated alcohols and ethers 27 63 106
Hydrochlorofluorocarbons 7 17 84
Hydrofluorocarbons 17 32 128
Fully fluorinated species 12 21 64
Chlorocarbons and hydrochlorocarbons 4 23 104
Chlorofluorocarbons 5 11 63
Bromocarbons, hydrobromocarbons, and halons 4 12 99
Hydrocarbons 3 30 80
Alcohols, ethers and other oxygenated hydrocarbons 2 76 174
Nitriles, amines and other nitrogenated hydrocarbons 3 24 62
Sulfur-containing species 3 13 35
Iodocarbons and hydroiodocarbons 1 3 8
Other molecules 2 2 5
Note : N src is the number of sources (references), N mol is the number of molecules in the category (some
molecules can be present in more than one category), and N sets is the number of temperature-pressure sets.
Fig. 27. Update for cross-sections for acetaldehyde. Comparison of three temperature-pressure cross-section sets from PNNL [314] (update) with corresponding data from
HITRAN2012 (Ref. [541] ).
file. These data have been corrected for an error in HITRAN2012,
which accidentally contained O 2 −Air spectra. Data recorded for air
mixtures of 21:79 O 2 :N 2 can be found in the O 2 −Air file, which is
described above. In the previous version of HITRAN, data for such
mixtures could be found in the O 2 −N 2 file, but these have been
moved to the O 2 −Air file to stress that these also include O 2 −O 2
contributions. One should not double count the O 2 −O 2 CIA by
including both O 2 −O 2 and O 2 −Air contributions in atmospheric
models. This has replaced the data of Smith and Newnham for this
band [588] . The data previously provided in this band for O 2 :N 2
mixtures contained magnetic dipole lines due to O 2 monomer ab-
sorption. This issue has now been resolved, as the monomer lines
have been subtracted from the present data.
4.2. Oxygen 1.06-μm band in air
The molecular oxygen X
3 −g (v = 0) → a 1 �g (v = 1) transition
at 1.06 μm has much weaker magnetic dipole lines than what is
observed for the 1.27-μm band, and hence the 1.06-μm band is
dominated by collision-induced absorption. The previous version
of HITRAN already contained spectra for this transition, for dif-
ferent O 2 :N 2 mixtures, measured by Smith and Newnham [588] .
These spectra have been re-analyzed by fitting spectra for different
mixtures to contributions of O 2 −O 2 and O 2 −N 2 collisional pairs.
This is illustrated in Fig. 28 , which shows two spectra, for 50:50
and 75:25 mixtures of O 2 :N 2 , both at T = 230 K. These spectra can
be reproduced essentially using only the O 2 −O 2 contribution as
shown. The contribution of O 2 −N 2 is smaller than the error bars
and noise levels. The spectra determined in this way have lower
noise levels than direct measurements for air mixtures, where the
absorption is weaker due to the lower O 2 density. These data have
been smoothed further and are now available in the O 2 −Air file.
4.3. Oxygen A band in air
Collision-induced absorption in the oxygen A band is also of
atmospheric interest. In spite of the smaller contribution of CIA
in this band, relative to the much stronger magnetic dipole lines,
CIA is significant for high-accuracy measurements including air-
mass calibration of the OCO-2 instrument [589] . The HITRAN CIA
database already contained data for O 2 −O 2 and O 2 −N 2 from Tran
et al. [253] , valid for temperatures between 200 and 300 K. For
Please cite this article as: I.E. Gordon et al., The HITRAN2016 molecular spectroscopic database, Journal of Quantitative Spectroscopy &
Radiative Transfer (2017), http://dx.doi.org/10.1016/j.jqsrt.2017.06.038

42 I.E. Gordon et al. / Journal of Quantitative Spectroscopy & Radiative Transfer 0 0 0 (2017) 1–66
ARTICLE IN PRESS
JID: JQSRT [m5G; August 21, 2017;14:18 ]
Table 10
Summary for the updates for compounds already existing in HITRAN2012.
Molecule CAS ♦ Wavenumber
range (cm
−1 )
T (K) P (Torr) Resolution
(cm
−1 )
Broadener Reference
Acetylaldehyde 75–07–0 510–6500 278–323 760 0.112 N 2 Sharpe et al. (2004) [314]
Bromine nitrate 40423–14–1 765–1320 204–293 0–141 0.014 air Wagner and Birk (2016) [522]
Carbon
tetrachloride
56–23–5 700–860 207–297 7–760 0.01–0.112 air Harrison et al. JQSRT (2016) [525] , Wallington
et al. (2016) [540] ∗
CFC-11 75–69–4 570–6500 278–323 700–760 0.112–0.5 N 2 , air Sharpe et al. (2004) [314] , Sihra et al. (2001)
[542] ∗
CFC-113 76–13–1 620–50 0 0 278–323 760 0.112 N 2 Sharpe et al. (2004) [314]
CFC-114 76–14–2 60 0–50 0 0 278–323 760 0.112 N 2 Sharpe et al. (2004) [314]
CFC-115 76–15–3 525–6500 278–323 760 0.112 N 2 Sharpe et al. (2004) [314] ∗
CFC-12 75–71–8 800–1270 189–295 7–761 0.01–0.03 air Harrison AMT (2015) [523]
CFC-13 75–72–9 60 0–650 0 278–323 760 0.112 N 2 Sharpe et al. (2004) [314] ∗
Ethane 74–84–0 60 0–650 0 278–323 760 0.112 N 2 Sharpe et al. (2004) [314] ∗ , Reed et al. (2015)
[528]
Ethylene 74–85–1 60 0–650 0 278–323 760 0.112 N 2 Sharpe et al. (2004) [314] ∗
Formaldehyde 50–00–0 60 0–650 0 278–323 760 0.112 N 2 Sharpe et al. (2004) [314] ∗
Formic acid 64–18–6 540–7200 298–323 760 0.112 N 2 Sharpe et al. (2004) [314] ∗
HCFC-123 306–83–2 40 0–650 0 278–323 700–760 0.112–0.5 N 2 , air Sharpe et al. (2004) [314] , Sihra et al. (2001)
[542] ∗
HCFC-124 2837–89–0 40 0–650 0 278–323 700–760 0.112–0.5 N 2 , air Sharpe et al. (2004) [314] , Sihra et al. (2001)
[542] ∗
HCFC-141b 1717–00–6 50 0–650 0 278–323 700–760 0.112–0.5 N 2 , air Sharpe et al. (2004) [314] , Sihra et al. (2001)
[542] ∗
HCFC142b 75–68–3 50 0–650 0 278–323 700–760 0.112–0.5 N 2 , air Sharpe et al. (2004) [314] , Sihra et al. (2001)
[542] ∗
HCFC-21 75–43–4 60 0–730 0 278–323 700–760 0.112–0.5 N 2 , air Sharpe et al. (2004) [314] , Sihra et al. (2001)
[542] ∗
HCFC-22 75–45–6 720–1380 190–295 7–762 0.01–0.03 air Harrison AMT (2016) [524]
HCFC-225ca 422–56–0 650–1400 296 700 0.5 air Sihra et al. (2001) [542]
HCFC-225cb 507–55–1 70 0–140 0 296 700 0.5 air Sihra et al. (2001) [542]
Hexafluoroethane 76–16–4 40 0–650 0 253–323 0–760 0.01–0.5 N 2 , air, self Highwood and Shine (20 0 0) [521] , Bravo et al.
(2010b) [543] , Sihra et al. (2001) [542] ∗ ,
Sharpe et al. (2004) [314]
HFC-125 354–33–6 450–6500 278–323 700–760 0.112–0.5 N 2 , air Young et al. (2009b) [544] , Sharpe et al. (2004)
[314] , Sihra et al. (2001) [542] ∗
HFC-134 359–35–3 350–6500 278–323 700–760 0.112–0.5 N 2 , air Sharpe et al. (2004) [314] , Sihra et al. (2001)
[542] ∗
HFC-134a 811–97–2 750–1600 190–296 22–761 0.015 air Harrison JQSRT (2015) [527]
HFC-143a 420–46–2 50 0–650 0 253–323 0–760 0.03–0.5 N 2 , air, self Highwood and Shine (20 0 0) [521] ∗ , Sharpe et
al. (2004) [314] , Sihra et al. (2001) [542] ∗ , Le
Bris and Graham. JQSRT (2015) [535]
HFC-152a 75–37–6 40 0–650 0 253–323 0–760 0.03–0.5 N 2 , air, self Highwood and Shine (20 0 0) [521] , Sharpe et al.
(2004) [314] , Sihra et al. (2001) [542] ∗
HFC-32 75–10–5 40 0–650 0 253–323 0–760 0.03–0.5 N 2 , air, self Highwood and Shine (20 0 0) [521] , Sharpe et al.
(2004) [314] , Gohar et al. (2004) [545] ,
Hydrogen peroxide 7722–84–1 510–7500 298–323 760 0.112 N 2 Johnson et al. (2010) [519] ∗
Methylbromide 74–83–9 50 0–650 0 278–323 700–760 0.112–0.5 N 2 , air Sharpe et al. (2004) [314] ∗ ,
Phosphine 7803–51–2 60 0–650 0 278–323 760 0.112 N 2 Sharpe et al. (2004) [314] ∗
Propane 74–98–6 60 0–650 0 278–323 760 0.112 N 2 Sharpe et al. (2004) [314]
Tetrafluoromethane 75–73–0 50 0–650 0 278–323 700–760 0.112–0.5 N 2 , air Sharpe et al. (2004) [314] , Hurley et al. (2005)
[546] ∗
Toluene 108–88–3 60 0–650 0 278–323 760 0.112 N 2 Sharpe et al. (2004) [314]
Trifluoromethylsulfur
pentafluoride
373–80–8 10 0–650 0 278–323 760 0.112–0.9 N 2 Nielsen et al. (2002) [547] ∗
m-Xylene 108–38–3 580–6500 298–323 760 0.112 N 2 Sharpe et al. (2004) [314]
o-Xylene 95–47–6 60 0–650 0 298–323 760 0.112 N 2 Sharpe et al. (2004) [314]
p-Xylene 106–42–3 580–6500 298–323 760 0.112 N 2 Sharpe et al. (2004) [314]
♦ Chemical Abstracts Service number ∗Data from these sources can be found in the alternate folder.
convenience, we now also provide the spectrum for O 2 −Air, ob-
tained by combining the available O 2 −O 2 and O 2 −N 2 data. In the
alternate folder, we now also include O 2 −Air data from Drouin
et al. [252] obtained in a multispectrum fitting approach. Line-by-
line parameters determined in the same multispectrum fit, are also
available in HITRAN2016. Consistent use of both line-by-line and
CIA data accurately reproduces the total absorption under atmo-
spheric conditions, and has been shown to reduce systematic er-
rors in atmospheric retrievals [252] .
4.4. Planned update
This update represents a small revision of the HITRAN CIA sec-
tion, and we aim to extend the CIA section with recently measured
and calculated spectra in the near future. This update will include
existing and new collisional pairs. We also plan to further update
different spectral regions for molecular oxygen.
Please cite this article as: I.E. Gordon et al., The HITRAN2016 molecular spectroscopic database, Journal of Quantitative Spectroscopy &
Radiative Transfer (2017), http://dx.doi.org/10.1016/j.jqsrt.2017.06.038

I.E. Gordon et al. / Journal of Quantitative Spectroscopy & Radiative Transfer 0 0 0 (2017) 1–66 43
ARTICLE IN PRESS
JID: JQSRT [m5G; August 21, 2017;14:18 ]
5. Aerosol refractive indices
Optical depths in the atmosphere are determined by the spa-
tial and temporal distributions of gases, clouds, and aerosols [590] .
Clouds and aerosols also take part in chemical reactions in both
the liquid and solid phases [591] . The interpretation of remote-
sensing retrievals of gaseous species is limited frequently by how
well one can separate gaseous opacity from that of clouds and
aerosols. Knowledge of the refractive indices of the aerosols and
cloud particles and their size distributions is necessary in order
to specify their optical properties. HITRAN2016 contains refractive
indices in the visible, infrared, and millimeter spectral ranges of
many types of cloud and aerosol particles. Table 12 lists the HI-
TRAN2016 indices.
As discussed by Bohren and Huffman [633] , the refractive index
m is a function of wavelength, and has a real, m real , and imaginary,
m imag , component:
m = m real + i m imag (11)
Table 11
Summary of the new compounds for which cross-sections were added in HITRAN.
Molecule CAS Wavenumber
range, cm
−1
T, K P,Torr Resolution, cm
−1 Broadener Reference
(E)-1-Chloro-3,3,3-
trifluoroprop-1-ene
102687–65–0 60 0–20 0 0 295 700 0.25 air Andersen et al. (2008)
[553]
(E)-HFC-1225ye 5595–10–8 650–20 0 0 296 700 0.25 air Hurley et al. (2007) [554]
(Perfluoro-n-butyl)-
ethylene
19430–93–4 650–1999 298 700 0.25 air Andersen et al. (2012b)
[555]
(Perfluoro-n-octyl)-ethylene 21652–58–4 650–1999 298 700 0.25 air Andersen et al. (2012b)
[555]
(Z)-HFC-1225ye 5528–43–8 650–20 0 0 296 700 0.25 air Hurley et al. (2007) [554]
(Z)-HFC-1234ze 29118–25–0 60 0–20 0 0 296 700 0.25 air Nilsson et al. (2009) [556]
1,1,1,2-Tetrachloro-ethane 630–20–6 530–6500 278–323 760 0.112 N 2 Sharpe et al. (2004) [314]
1,1,2,2-Tetrachloro ethane 79–34–5 530–6500 278–323 760 0.112 N 2 Sharpe et al. (2004) [314]
1,1,2,2-Tetrafluoro-1,2-
dimethoxyethane
73287–23–7 150–1900 296 700 0.25 air Andersen et al. (2004)
[557]
1,1,2,2-Tetrafluoro-3-
methoxypropane
60598–17–6 450–3200 298 1.0 Oyaro et al. (2004) [558]
1,1,2-Trichloro-ethane 79–00–5 60 0–650 0 278–323 760 0.112 N 2 Sharpe et al. (2004) [314]
1,1,2-Trifluoro-2-
(trifluoromethoxy)-
ethane
84011–06–3 440–3200 298 1.0 Oyaro et al. (2005) [559]
1,1-Dichloroethane 75–34–3 560–6500 278–323 760 0.112 N 2 Sharpe et al. (2004) [314]
1,2-Dichloropropane 78–87–5 590–6500 278–323 760 0.112 N 2 Sharpe et al. (2004) [314]
1,2-Diclorobenzene 95–50–1 60 0–650 0 278–323 760 0.112 N 2 Sharpe et al. (2004) [314]
1,2-Difluoro-1,2-
dichloroethane
431–06–1 550–6500 278–323 760 0.112 N 2 Sharpe et al. (2004) [314]
1,3-Butadiene 106–99–0 530–6500 278–323 760 0.112 N 2 Sharpe et al. (2004) [314]
1,3-Dichlorobenzene 541–73–1 60 0–650 0 278–323 760 0.112 N 2 Sharpe et al. (2004) [314]
1,3-Dichloropropane 142–28–9 570–6500 278–323 760 0.112 N 2 Sharpe et al. (2004) [314]
1,4-Dichlorobenzene 106–46–7 60 0–650 0 298–323 760 0.112 N 2 Sharpe et al. (2004) [314]
1-Butene 25167–67–3 525–6500 278–323 760 0.112 N 2 Sharpe et al. (2004) [314]
1-Ethoxy-1,1,2,3,3,3-
hexafluoropropane
380–34–7 40 0–350 0 298 1.0 Oyaro et al. (2005) [559]
1H,1H,2H,2H-
Perfluorononan-1-ol
755–02–2 500–2250 296 700 0.5 air Waterland et al. (2005)
[560]
1H,1H,2H,2H-
Perfluoroundecan-1-ol
87017–97–8 60 0–20 0 0 296 700 0.5 air Waterland et al. (2005)
[560]
1-Nonene 124–11–8 550–6500 298–323 760 0.112 N 2 Sharpe et al. (2004) [314]
1-Penten-3-ol 616–25–1 550–7300 298–323 760 0.112 N 2 Johnson et al. (2010) [519]
2,2,2-trifluoro-acetaldehyde 40 0–250 0 296–298 700 0.5–1.0 air Sellevag et al. (2004a)
[561] , Hashikawa et al.
(2004) [562] ∗
2,2,2-Trifluoroethanol 75–89–8 70–7250 278–323 760 0.112–1.0 N 2 Sharpe et al. (2004) [314] ,
Sellevag et al. (2004b)
[563]
2,2,3,3,4,4,4-
Heptafluorobutan-1-ol
375–01–9 40 0–40 01 298 0.01 Sellevag et al. (2007)
[533] ∗ , Bravo et al.
(2010a) [564]
2,2,3,3-Tetrafluoro-1-
propanol
76–37–9 40 0–40 0 0 298 Sellevag et al. (2007) [533]
2,2,3,4,4,4-Hexafluoro-1-
butanol
382–31–0 40 0–40 0 0 298 Sellevag et al. (2007) [533]
2,2-Difluoroethanol 359–13–7 70–4800 293 1.0 Sellevag et al. (2004b)
[563]
2,3-Butanedione 431–03–8 580–6500 278–323 760 0.112 N 2 Johnson et al. (2010) [519]
2,3-Dimethylfuran 14920–89–9 510–6500 278–323 760 0.112 N 2 Johnson et al. (2010) [519]
2,5-Dimethylfuran 625–86–5 550–70 0 0 278–323 760 0.112 N 2 Johnson et al. (2010) [519]
2,6-Dimethoxyphenol 91–10–1 580–6500 323 760 0.112 N 2 Johnson et al. (2010) [519]
2-Carene 554–61–0 60 0–730 0 298–323 760 0.112 N 2 Johnson et al. (2010) [519]
2-Ethyltoluene 611–14–3 520–6500 298–323 760 0.112 N 2 Sharpe et al. (2004) [314]
2-Fluoroethanol 371–62–0 80–7250 293–323 760 0.112–1.0 N 2 Sharpe et al. (2004) [314] ,
Sellevag et al. (2004b)
[563]
( continued on next page )
Please cite this article as: I.E. Gordon et al., The HITRAN2016 molecular spectroscopic database, Journal of Quantitative Spectroscopy &
Radiative Transfer (2017), http://dx.doi.org/10.1016/j.jqsrt.2017.06.038

44 I.E. Gordon et al. / Journal of Quantitative Spectroscopy & Radiative Transfer 0 0 0 (2017) 1–66
ARTICLE IN PRESS
JID: JQSRT [m5G; August 21, 2017;14:18 ]
Table 11 ( continued )
Molecule CAS Wavenumber
range, cm
−1
T, K P,Torr Resolution, cm
−1 Broadener Reference
2H, 3H-Perfluoropentane 138495–42–8 50 0–650 0 278–323 760 0.112 N 2 Sharpe et al. (2004) [314]
2-Hexanol 626–93–7 520–7250 298–323 760 0.112 N 2 Johnson et al. (2010) [519]
2-Methylfuran 534–22–5 550–6500 278–323 760 0.112 N 2 Johnson et al. (2010) [519]
2-Nonanone 821–55–6 550–6500 298–323 760 0.112 N 2 Johnson et al. (2010) [519]
2-Pentylfuran 3777–69–3 550–7300 298–323 760 0.112 N 2 Johnson et al. (2010) [519]
2-Vinylpyridine 100–69–6 540–7300 298–323 760 0.112 N 2 Johnson et al. (2010) [519]
3,3,3-Trifluoropropanal 460–40–2 40 0–350 0 298 1.0 Sellevag et al. (2004a)
[561]
3,3,4,4,5,5,6,6,7,7,7-
Undecafluoro-heptan-1-ol
185689–57–0 60 0–20 0 0 296 700 0.5 air Waterland et al. (2005)
[560]
3,3-Demethyl-2-pentanol 19781–24–9 520–7250 298–323 760 0.112 N 2 Johnson et al. (2010) [519]
3-Carene 13466–78–9 60 0–730 0 298–323 760 0.112 N 2 Johnson et al. (2010) [519]
3-Methoxyphenol 150–19–6 550–6500 323–333 760 0.112 N 2 Johnson et al. (2010) [519]
3-Methylfuran 930–27–8 550–6500 278–323 760 0.112 N 2 Johnson et al. (2010) [519]
3-Pentanol 584–02–1 570–7250 298–323 760 0.112 N 2 Johnson et al. (2010) [519]
4-Ethyltoluene 622–96–8 60 0–650 0 298–323 760 0.112 N 2 Sharpe et al. (2004) [314]
4-Methyl-1-pentanol 626–89–1 520–7250 298–323 760 0.112 N 2 Johnson et al. (2010) [519]
4-Methylvaleric acid 646–07–1 50 0–730 0 323–338 760 0.112 N 2 Johnson et al. (2010) [519]
4-Penten-1-ol 821–09–0 520–7400 298–323 760 0.112 N 2 Johnson et al. (2010) [519]
5-Nonanol 623–93–8 580–7200 298–323 760 0.112 N 2 Johnson et al. (2010) [519]
Acetic acid 64–19–7 550–7100 298–323 760 0.112 N 2 Sharpe et al. (2004) [314]
Acetol 116–09–6 435–7200 298–323 760 0.112 N 2 Johnson et al. (2010) [519]
Acrolein 107–02–8 540–6500 278–323 760 0.112 N 2 Sharpe et al. (2004) [314]
Acrylic acid 79–10–7 525–6500 323 760 0.112 N 2 Johnson et al. (2010) [519]
Acrylonitrile 107–13–1 550–6500 278–323 760 0.112 N 2 Sharpe et al. (2004) [314]
Allyl trifluoroacetate 383–67–5 60 0–20 0 0 298 0.03 air Rodrigues et al. (2016)
[538]
alpha-Pinene (1S) (-) 7785–26–4 60 0–650 0 298–323 760 0.112 N 2 Sharpe et al. (2004) [314]
Benzaldehyde 100–52–7 60 0–650 0 278–323 760 0.112 N 2 Sharpe et al. (2004) [314]
Benzyl alcohol 100–51–6 550–7400 298–323 760 0.112 N 2 Sharpe et al. (2004) [314]
beta-Pinene (1S) (-) 18172–67–3 60 0–650 0 298–323 760 0.112 N 2 Sharpe et al. (2004) [314]
bis (2-Chloroethyl) ether 111–44–4 550–6500 298–323 760 0.112 N 2 Sharpe et al. (2004) [314]
Bromochloromethane 74–97–5 550–7100 278–323 760 0.112 N 2 Sharpe et al. (2004) [314]
Bromoform 75–25–2 60 0–650 0 278–323 760 0.112 N 2 Sharpe et al. (2004) [314]
C 2 Cl 3 H 3 71–55–6 50 0–650 0 278–323 760 0.112 N 2 Sharpe et al. (2004) [314]
C 4 H 5 F 3 O 2 383–63–1 50 0–650 0 278–323 760 0.112 N 2 Sharpe et al. (2004) [314]
Carbon disulfide 75–15–0 60 0–650 0 278–323 760 0.112 N 2 Sharpe et al. (2004) [314]
CF 3 CH 2 CH 2 OH 2240–88–2 40 0–40 0 0 296–298 700 0.5 air Waterland et al. (2005)
[560] , Sellevag et al.
(2007) [533] ∗
CFC-112 76–12–0 550–6500 278–323 760 0.112–1.0 N 2 Sharpe et al. (2004) [314] ,
Davis et al. (2016) [529] ∗
CFC-112a 76–11–9 550–6500 278–323 760 0.112–1.0 N 2 Sharpe et al. (2004) [314] ,
Davis et al. (2016) [529] ∗
CFC-113a 354–58–5 550–1730 295–296 2.7 0.01–1.0 Davis et al. (2016) [529] ∗ ,
Etminan et al. (2014)
[530]
CFC-114a 374–07–2 550–1397 296 1.0 Davis et al. (2016) [529]
Chloroacetone 78–95–5 60 0–650 0 278–323 760 0.112 N 2 Sharpe et al. (2004) [314]
Chlorobenzene 108–90–7 60 0–650 0 278–323 760 0.112 N 2 Sharpe et al. (2004) [314]
Chloroethane 75–00–3 590–6500 278–323 760 0.112 N 2 Sharpe et al. (2004) [314]
Chloromethanol 657–2500 295 700 0.25 N 2 Wallington et al. (20 0 0)
[565]
Cineole 470–82–6 520–7300 323 760 0.112 N 2 Johnson et al. (2010) [519]
cis-1,3-Dichloro propene 10061–01–5 60 0–650 0 278–323 760 0.112 N 2 Sharpe et al. (2004) [314]
Crotonaldehyde 123–73–9 50 0–650 0 278–323 760 0.112 N 2 Johnson et al. (2010) [519]
Diacetone alcohol 123–42–2 520–70 0 0 298–323 760 0.112 N 2 Johnson et al. (2010) [519]
Dibromomethane 74–95–3 50 0–710 0 278–323 700–760 0.112–0.5 N 2 , air Sharpe et al. (2004) [314] ,
Sihra et al. (2001) [542] ∗
Dichloromethane 75–09–2 60 0–650 0 278–323 760 0.112 N 2 Sharpe et al. (2004) [314] ,
Wallington et al. (2016)
[540] ∗
Dichloromethanol 657–2500 295 700 0.25 N 2 Wallington et al. (20 0 0)
[565]
Diethylamine 109–89–7 590–70 0 0 278–323 760 0.112 N 2 Sharpe et al. (2004) [314]
Diiodomethane 75–11–6 530–7100 298–323 760 0.112 N 2 Sharpe et al. (2004) [314]
Diisopropylamine 108–18–9 550–6500 278–323 760 0.112 N 2 Sharpe et al. (2004) [314]
Dimethyl disulfide 624–92–0 60 0–650 0 278–323 760 0.112 N 2 Sharpe et al. (2004) [314]
Dimethyl ether 115–10–6 60 0–650 0 278–323 760 0.112 N 2 Sharpe et al. (2004) [314]
Dimethyl sulfate 77–78–1 525–6500 298–323 760 0.112 N 2 Sharpe et al. (2004) [314]
Dimethyl sulfide 75–18–3 60 0–650 0 278–323 760 0.112 N 2 Sharpe et al. (2004) [314]
Dimethyl sulfoxide 67–68–5 575–6500 298–323 760 0.112 N 2 Sharpe et al. (2004) [314]
Dimethylamine 124–40–3 550–6700 278–323 760 0.112 N 2 Sharpe et al. (2004) [314]
D-Limonene 5989–27–5 520–6500 298–323 760 0.112 N 2 Johnson et al. (2010) [519]
DL-Limonene 138–86–3 580–6500 298–323 760 0.112 N 2 Johnson et al. (2010) [519]
( continued on next page )
Please cite this article as: I.E. Gordon et al., The HITRAN2016 molecular spectroscopic database, Journal of Quantitative Spectroscopy &
Radiative Transfer (2017), http://dx.doi.org/10.1016/j.jqsrt.2017.06.038

I.E. Gordon et al. / Journal of Quantitative Spectroscopy & Radiative Transfer 0 0 0 (2017) 1–66 45
ARTICLE IN PRESS
JID: JQSRT [m5G; August 21, 2017;14:18 ]
Table 11 ( continued )
Molecule CAS Wavenumber
range, cm
−1
T, K P,Torr Resolution, cm
−1 Broadener Reference
E-C10F18 60433–12–7 650–1500 296 700 0.5 air Shine et al. (2005) [566]
EDB 106–93–4 570–6500 278–323 760 0.112 N 2 Sharpe et al. (2004) [314]
Ethyl acetate 141–78–6 565–6500 278–323 760 0.112 N 2 Sharpe et al. (2004) [314]
Ethyl acrylate 140–88–5 580–6500 278–323 760 0.112 N 2 Sharpe et al. (2004) [314]
Ethyl alcohol 64–17–5 60 0–750 0 278–323 760 0.112 N 2 Sharpe et al. (2004) [314]
Ethyl benzoate 93–89–0 60 0–650 0 323 760 0.112 N 2 Johnson et al. (2010) [519]
Ethyl formate 109–94–4 60 0–650 0 278–323 760 0.112 N 2 Sharpe et al. (2004) [314]
Ethylamine 75–04–7 60 0–70 0 0 278–323 760 0.112 N 2 Sharpe et al. (2004) [314]
Ethylenediamine 107–15–3 550–6500 278–323 760 0.112 N 2 Sharpe et al. (2004) [314]
Ethyliodide 75–03–6 60 0–650 0 278–323 760 0.112 N 2 Sharpe et al. (2004) [314]
EVE 109–92–2 570–6500 278–323 760 0.112 N 2 Sharpe et al. (2004) [314]
Fluoroether E-1 3330–15–2 450–1450 298 1.0 Oyaro et al. (2005) [559]
Formic acid, dimer 14523–98–9 540–7200 278–298 760 0.112 N 2 Sharpe et al. (2004) [314]
Furan 110–00–9 550–6500 278–323 760 0.112 N 2 Sharpe et al. (2004) [314]
Furfural 98–01–1 550–6500 298–323 760 0.112 N 2 Johnson et al. (2010) [519]
Furfuryl alcohol 98–00–0 550–7300 298–323 760 0.112 N 2 Sharpe et al. (2004) [314]
Geraniol 106–24–1 60 0–650 0 323 760 0.112 N 2 Johnson et al. (2010) [519]
Glycolaldehyde 141–46–8 570–6500 298–332 760 0.112 N 2 Johnson et al. (2010) [519]
Glyoxal 107–22–2 60 0–650 0 278–323 760 0.112 N 2 Johnson et al. (2010) [519]
Guaiacol 90–05–1 520–7250 298–323 760 0.112 N 2 Johnson et al. (2010) [519]
Halon-1201 1511–62–2 500–1550 296 700 0.5 air Sihra et al. (2001) [542]
Halon-1202 75–61–6 575–6500 278–323 760 0.112 N 2 Sharpe et al. (2004) [314]
Halon-1211 353–59–3 50 0–650 0 278–323 700–760 0.112–0.5 N 2 , air Sharpe et al. (2004) [314] ,
Sihra et al. (2001) [542] ∗
Halon-1301 75–63–8 510–6500 278–323 700–760 0.112–0.5 N 2 , air Sharpe et al. (2004) [314] ,
Sihra et al. (2001) [542] ∗
Halon-2311 151–67–7 600–1499 298 700 0.25 air Andersen et al. (2012a)
[567]
Halon-2402 124–73–2 50 0–650 0 278–323 700–760 0.112–0.5 N 2 , air Sharpe et al. (2004) [314] ,
Sihra et al. (2001) [542] ∗
HCFC-121 354–14–3 560–6500 278–323 760 0.112 N 2 Sharpe et al. (2004) [314]
HCFC-132a 354–23–4 520–6500 278–323 760 0.112 N 2 Sharpe et al. (2004) [314]
HCFC-133a 75–88–7 50 0–710 0 278–323 7–760 0.01–1.0 N 2 , He Sharpe et al. (2004) [314] ,
McGillen et al. (2015)
[536] ∗ , Etminan et al.
(2014) [530]
HCFE-235ca2 13838–16–9 600–1450 298 700 0.25 air Andersen et al. (2012a)
[567]
HCFE-235da2 26675–46–7 350–40 0 0 296–298 0-700 0.25–1.0 air, self Andersen et al. (2010)
[568] , Ryan and Nielsen
(2010) [569] ∗ , Sihra et al.
(2001) [542] ∗
Heptafluorobutyraldehyde 375–02–0 60 0–250 0 296 700 0.5 air Hashikawa et al. (2004)
[562]
Hexachloro-1,3-butadiene 87–68–3 530–6500 298–323 760 0.112 N 2 Sharpe et al. (2004) [314]
Hexachlorocyclopentadiene 77–47–4 575–6500 323 760 0.112 N 2 Sharpe et al. (2004) [314]
Hexafluorobenzene 392–56–3 580–6500 298–323 760 0.112 N 2 Sharpe et al. (2004) [314]
Hexafluoropropene 116–15–4 10 0–650 0 278–323 740–760 0.112–1.0 N 2 , air Sharpe et al. (2004) [314] ,
Acerboni et al. (2001)
[570] ∗
Hexyl acetate 142–92–7 580–6500 298–323 760 0.112 N 2 Johnson et al. (2010) [519]
HFC-1234yf 754–12–1 70 0–20 0 0 296 700 0.25 air Nielsen et al. (2007) [571]
HFC-1345zfc 374–27–6 650–1999 298 700 0.25 air Andersen et al. (2012b)
[555]
HFC-143 430–66–0 350–1550 296 700 0.5 air Sihra et al. (2001) [542]
HFC-152 624–72–6 70 0–310 0 296 700 0.25 air Wallington et al. (1994)
[572]
HFC-161 353–36–6 350–1600 296 700 0.5 air Sihra et al. (2001) [542]
HFC-227ca 2252–84–8 400–1550 296 700 0.5 air Sihra et al. (2001) [542]
HFC-227ea 431–89–0 40 0–650 0 278–323 700–760 0.112–0.5 N 2 , air Sharpe et al. (2004) [314] ,
Gohar et al. (2004) [545]
HFC-23 75–46–7 950–1500 187–295 23–763 0.015 Air Harrison JQSRT (2013)
[526] ,
HFC-236cb 677–56–5 300–1550 296 700 0.5 air Sihra et al. (2001) [542]
HFC-236fa 690–39–1 350–1500 296 700 0.5 air Sihra et al. (2001) [542]
HFC-245cb 1814–88–6 400–1550 296 700 0.5 air Sihra et al. (2001) [542]
HFC-245fa 460–73–1 640–1500 296 700 0.5 air Sihra et al. (2001) [542]
HFC-272ca 420–45–1 30 0–150 0 296 700 0.5 air Sihra et al. (2001) [542]
HFC-329p 375–17–7 50 0–40 0 0 296 700 0.25 air Young et al. (2009b) [544]
HFC-365mfc 406–58–6 60 0–20 0 0 296 700 0.25 air Inoue et al. (2008) [573]
HFC-41 593–53–3 50 0–650 0 278–323 700–760 0.112–0.5 N 2 , air Sharpe et al. (2004) [314] ,
Sihra et al. (2001) [542] ∗
( continued on next page )
Please cite this article as: I.E. Gordon et al., The HITRAN2016 molecular spectroscopic database, Journal of Quantitative Spectroscopy &
Radiative Transfer (2017), http://dx.doi.org/10.1016/j.jqsrt.2017.06.038

46 I.E. Gordon et al. / Journal of Quantitative Spectroscopy & Radiative Transfer 0 0 0 (2017) 1–66
ARTICLE IN PRESS
JID: JQSRT [m5G; August 21, 2017;14:18 ]
Table 11 ( continued )
Molecule CAS Wavenumber
range, cm
−1
T, K P,Torr Resolution, cm
−1 Broadener Reference
HFE-125 3822–68–2 400–1650 296 700 0.5 air Sihra et al. (2001) [542]
HFE-143a 421–14–7 550–1550 296 700 0.5 air Sihra et al. (2001) [542]
HFE-216 1187–93–5 850–1999 296 700 0.25 air Mashino et al. (20 0 0) [574]
HFE-227ea 2356–62–9 40 0–320 0 298 1.0 Oyaro et al. (2005) [559]
HFE-236ea2 57041–67–5 450–3200 298 700 0.25–1.0 air Andersen et al. (2010)
[568] ∗ , Oyaro et al.
(2005) [559]
HFE-245fa2 1885–48–9 350–3200 296–298 700 0.5–1.0 air Oyaro et al. (2005) [559] ∗ ,
Sihra et al. (2001) [542]
HFE-263fb1 460–43–5 450–3300 296–298 700 0.25–1.0 air Osterstrom et al. (2012)
[575] , Oyaro et al. (2005)
[559] ∗
HFE-263m1 690–22–2 450–3200 298 1.0 Oyaro et al. (2005) [559]
HFE-329me3 428454–68–6 60 0–20 0 0 296 700 0.25 air Wallington et al. (2004)
[576]
HFE-338mec3 56860–85–6 50 0–350 0 296–298 700 0.25–1.0 air Wallington et al. (2004)
[576] , Oyaro et al. (2005)
[559] ∗
HFE-347mcc3 375–03–1 70 0–140 0 298 0.03 Bravo et al. (2010a) [564]
HFE-347mmz1 28523–86–6 40 0–40 0 0 298 0-700 0.25–1.0 air, self Andersen et al. (2010)
[568] , Ryan and Nielsen
(2010) [569] ∗
HFE-356mff2 333–36–8 475–3100 296–298 700 0.5–1.0 air Oyaro et al. (2004) [558] ∗ ,
Sihra et al. (2001) [542]
HFE-356mmz1 13171–18–1 450–3200 298 1.0 Oyaro et al. (2004) [558]
HFE-365mcf3 378–16–5 435–3150 298 1.0 Oyaro et al. (2004) [558]
HFE-449s1 350–1550 296–298 0-700 0.01–0.5 air, self Sihra et al. (2001) [542] ∗ ,
Bravo et al. (2010a) [564]
HFE-7200 50 0–160 0 296–298 0-700 0.01–0.5 air, self Sihra et al. (2001) [542] ∗ ,
Bravo et al. (2010a) [564]
HFE-7300 132182–92–4 60 0–20 0 0 298 1.0 Rodriguez et al. (2014)
[539]
HFE-7500 297730–93–9 60 0–20 0 0 298 1.0 Rodriguez et al. (2014)
[539]
HFIP 530–3400 304–362 0.1 Godin et al. (this issue)
HFO-1243zf 677–21–4 500–1999 296–298 700 0.25–1.0 air, He Andersen et al. (2012b)
[555] , Gonzalez et al.
(2015) [534] ∗
(E)-HFC-1234ze 1645–83–6 650–20 0 0 296 700 0.25 air Sondergaard et al. (2007)
[577]
HFO-1438ezy(E) 600–1997 296 1.0 He Papadimitriou and
Burkholder. (2016) [537]
HG-01 188690–78–0 25–2999 296 1.0 air Myhre et al. (1999) [578]
HG’-02 485399–46–0 150–1800 296 700 0.25 air Andersen et al. (2004)
[557]
HG’-03 4 85399–4 8–2 150–1800 296 700 0.25 air Andersen et al. (2004)
[557]
HG-10 78522–47–1 25–30 0 0 296 1.0 air Myhre et al. (1999) [578]
HG-11 40 0–20 0 0 296 700 0.25–0.5 air Wallington et al. (2009)
[579] , Sihra et al. (2001)
[542] ∗
Hydrazine 302–01–2 60 0–70 0 0 298–323 760 0.112 N 2 Sharpe et al. (2004) [314]
i-HFE-7100 163702–08–7 300–1650 296 700 0.5 air Sihra et al. (2001) [542]
i-HFE-7200 163702–06–5 40 0–150 0 296 700 0.5 air Sihra et al. (2001) [542]
Isobutane 75–28–5 60 0–650 0 278–323 760 0.112 N 2 Sharpe et al. (2004) [314]
Isobutene 115–11–7 60 0–650 0 278–323 760 0.112 N 2 Sharpe et al. (2004) [314]
Isobutyric acid 79–31–2 530–7250 340 760 0.112 N 2 Johnson et al. (2010) [519]
Isocyanic acid 75–13–8 50 0–70 0 0 298 760 0.112 N 2 Sharpe et al. (2004) [314]
Isopentane 78–78–4 60 0–650 0 278–323 760 0.112 N 2 Sharpe et al. (2004) [314]
Isopentyl acetate 123–92–2 550–6500 298–323 760 0.112 N 2 Johnson et al. (2010) [519]
Isophorone 78–59–1 60 0–650 0 298–323 760 0.112 N 2 Sharpe et al. (2004) [314]
isoprene 78–79–5 60 0–650 0 278–323 760 0.112 N 2 Sharpe et al. (2004) [314]
Isopropylamine 75–31–0 60 0–680 0 278–323 760 0.112 N 2 Sharpe et al. (2004) [314]
Isovaleraldehyde 590–86–3 50 0–650 0 278–323 760 0.112 N 2 Johnson et al. (2010) [519]
Limonene oxide 1195–92–2 510–6500 298–323 760 0.112 N 2 Johnson et al. (2010) [519]
m-Cresol 108–39–4 570–6500 298–323 760 0.112 N 2 Sharpe et al. (2004) [314]
Menthol 89–78–1 580–6500 323 760 0.112 N 2 Johnson et al. (2010) [519]
Methyl 2-methyl butyrate 868–57–5 520–6500 298–323 760 0.112 N 2 Johnson et al. (2010) [519]
Methyl acetoacetate 105–45–3 520–6500 298–323 760 0.112 N 2 Johnson et al. (2010) [519]
( continued on next page )
Please cite this article as: I.E. Gordon et al., The HITRAN2016 molecular spectroscopic database, Journal of Quantitative Spectroscopy &
Radiative Transfer (2017), http://dx.doi.org/10.1016/j.jqsrt.2017.06.038

I.E. Gordon et al. / Journal of Quantitative Spectroscopy & Radiative Transfer 0 0 0 (2017) 1–66 47
ARTICLE IN PRESS
JID: JQSRT [m5G; August 21, 2017;14:18 ]
Table 11 ( continued )
Molecule CAS Wavenumber
range, cm
−1
T, K P,Torr Resolution, cm
−1 Broadener Reference
Methyl butyl ether 628–28–4 60 0–650 0 278–323 760 0.112 N 2 Sharpe et al. (2004) [314]
Methyl glyoxal 78–98–8 550–6500 298–323 760 0.112 N 2 Johnson et al. (2010) [519]
Methyl iodide 74–88–4 50 0–690 0 278–323 760 0.112 N 2 Sharpe et al. (2004) [314]
Methyl isoamyl ketone 110–12–3 550–6500 298–323 760 0.112 N 2 Sharpe et al. (2004) [314]
Methyl isothio-cyanate 556–61–6 60 0–650 0 278–323 760 0.112 N 2 Sharpe et al. (2004) [314]
Methyl mercaptan 74–93–1 60 0–650 0 278–323 760 0.112 N 2 Sharpe et al. (2004) [314]
Methyl methacrylate 80–62–6 550–6500 278–323 760 0.112 N 2 Sharpe et al. (2004) [314]
Methyl nitrite 624–91–9 520–6500 278–323 760 0.112 N 2 Sharpe et al. (2004) [314]
Methyl pivalate 598–98–1 550–6500 278–323 760 0.112 N 2 Sharpe et al. (2004) [314]
Methyl propionate 554–12–1 530–6500 278–323 760 0.112 N 2 Sharpe et al. (2004) [314]
Methyl propyl ketone 107–87–9 520–6500 278–323 760 0.112 N 2 Johnson et al. (2010) [519]
Methyl salicylate 119–36–8 550–6500 298–323 760 0.112 N 2 Sharpe et al. (2004) [314]
Methyl vinyl ether 107–25–5 550–6500 278–323 760 0.112 N 2 Johnson et al. (2010) [519]
Methylethyl ketone 78–93–3 550–6500 278–323 760 0.112 N 2 Sharpe et al. (2004) [314]
Myrcene 123–35–3 520–6500 298–323 760 0.112 N 2 Johnson et al. (2010) [519]
N,N-Diethylformamide 617–84–5 520–6500 298–323 760 0.112 N 2 Sharpe et al. (2004) [314] ,
Johnson et al. (2010)
[519]
N,N-Diethylaniline 91–66–7 550–6500 298–323 760 0.112 N 2 Sharpe et al. (2004) [314]
Naphthalene 91–20–3 60 0–650 0 323 760 0.112 N 2 Sharpe et al. (2004) [314]
n-Butane 106–97–8 60 0–650 0 278–323 760 0.112 N 2 Sharpe et al. (2004) [314]
n-Butylamine 109–73–9 60 0–70 0 0 278–323 760 0.112 N 2 Sharpe et al. (2004) [314]
n-C 3 F 7 OCH 3 60 0–20 0 0 295 700 0.25 N 2 Ninomiya et al. (20 0 0)
[580]
n-Heptane 142–82–5 60 0–650 0 278–323 760 0.112 N 2 Sharpe et al. (2004) [314]
n-Hexadecane 544–76–3 550–6500 323 760 0.112 N 2 Johnson et al. (2010) [519]
n-Hexane 110–54–3 60 0–650 0 278–323 760 0.112 N 2 Sharpe et al. (2004) [314]
n-HFE-7100 163702–07–6 300–1520 296 700 0.5 air Sihra et al. (2001) [542]
Nitrobenzene 98–95–3 550–6500 298–323 760 0.112 N 2 Sharpe et al. (2004) [314]
Nitrogen trifluoride 7783–54–2 40 0–650 0 278–323 700–760 0.112–0.5 N 2 , air Sharpe et al. (2004) [314] ,
Robson et al. (2006)
[581] ∗
Nitrous acid 7782–77–6 550–6500 298 760 0.112 N 2 Sharpe et al. (2004) [314]
Nonafluoropentanal 375–53–1 60 0–250 0 296 700 0.5 air Hashikawa et al. (2004)
[562]
n-Pentadecane 629–62–9 570–6500 298–323 760 0.112 N 2 Johnson et al. (2010) [519]
Octane 111–65–9 60 0–650 0 278–323 760 0.112 N 2 Sharpe et al. (2004) [314]
Octanoic acid 124–07–2 550–6500 298–323 760 0.112 N 2 Johnson et al. (2010) [519]
o-Toluidine 95–53–4 550–7300 298–323 760 0.112 N 2 Sharpe et al. (2004) [314]
Pentafluoropropionaldehyde
422–06–0 60 0–250 0 296 700 0.5 air Hashikawa et al. (2004)
[562]
Pentane 109–66–0 570–6500 278–323 760 0.112 N 2 Sharpe et al. (2004) [314]
Perfluoro-2-methyl-3-
pentanone
756–13–8 450–20 0 0 298 1.0 air D’Anna et al. (2005) [582]
Perfluorobut-1-ene 357–26–6 60 0–20 0 0 296 700 0.25 N 2 Young et al. (2009a) [583]
Perfluorobuta-1,3-diene 685–63–2 10 0–260 0 293 740 1.0 air Acerboni et al. (2001) [570]
Perfluorobutane 355–25–9 450–6500 278–323 700–760 0.01–0.5 N 2 , air Sharpe et al. (2004) [314] ,
Bravo et al. (2010b)
[543] ∗
Perfluoropentane 678–26–2 50 0–650 0 278–323 0-760 0.01–0.112 N 2 , air, self Sharpe et al. (2004) [314] ,
Bravo et al. (2010b) [543]
PFC-1114 116–14–3 10 0–260 0 293 740 1.0 air Acerboni et al. (2001) [570]
PFC-218 76–19–7 50 0–650 0 278–323 700–760 0.01–0.5 N 2 , air Sharpe et al. (2004) [314] ,
Sihra et al. (2001) [542] ∗ ,
Bravo et al. (2010b)
[543] ∗
PFC-318 115–25–3 550–6500 253–323 0–760 0.03-0.112 N 2, self Highwood and Shine
(20 0 0) [521] , Sharpe et
al. (2004) [314]
PFC–51–14 355–42–0 70 0–140 0 297 0.01 Bravo et al. (2010b) [543]
PFC–71–18 70 0–140 0 297 0.01 Bravo et al. (2010b) [543]
PFC–91–18 306–94–5 0–20 0 0 296 700 0.5 air Shine et al. (2005) [566]
PFPMIE 1309353–34–1 60 0–150 0 296 700 0.25 air Young et al. (2006) [584]
PFPO 422–05–9 490–40 0 0 298–362 0.1 Sellevag et al. (2007)
[533] ∗ , Godin et al.
(2017) [532]
PFTBA 311–89–7 550–20 0 0 298–344 0.1 Godin et al. (2016) [531]
Phenol 108–95–2 550–7300 298–323 760 0.112 N 2 Johnson et al. (2010) [519]
Phosgene 75–44–5 535–6500 278–323 760 0.112 N 2 Sharpe et al. (2004) [314]
Piperidine 110–89–4 510–6700 278–323 760 0.112 N 2 Sharpe et al. (2004) [314]
Propionaldehyde 123–38–6 520–6500 278–323 760 0.112 N 2 Sharpe et al. (2004) [314]
Propylene carbonate 108–32–7 60 0–650 0 298–323 760 0.112 N 2 Johnson et al. (2010) [519]
Propylenimine 75–55–8 60 0–670 0 278–323 760 0.112 N 2 Sharpe et al. (2004) [314]
R124A 354–25–6 525–6500 278–323 760 0.112 N 2 Sharpe et al. (2004) [314]
( continued on next page )
Please cite this article as: I.E. Gordon et al., The HITRAN2016 molecular spectroscopic database, Journal of Quantitative Spectroscopy &
Radiative Transfer (2017), http://dx.doi.org/10.1016/j.jqsrt.2017.06.038

48 I.E. Gordon et al. / Journal of Quantitative Spectroscopy & Radiative Transfer 0 0 0 (2017) 1–66
ARTICLE IN PRESS
JID: JQSRT [m5G; August 21, 2017;14:18 ]
Table 11 ( continued )
Molecule CAS Wavenumber
range, cm
−1
T, K P,Torr Resolution, cm
−1 Broadener Reference
R132A 471–43–2 510–6500 278–323 760 0.112 N 2 Sharpe et al. (2004) [314]
R141 430–57–9 550–6500 278–323 760 0.112 N 2 Sharpe et al. (2004) [314]
sec-Amylamine 625–30–9 540–6900 278–323 760 0.112 N 2 Sharpe et al. (2004) [314]
Styrene (monomer) 100–42–5 60 0–650 0 298–323 760 0.112 N 2 Sharpe et al. (2004) [314]
Sulfuryl fluoride 2699–79–8 50 0–650 0 278–323 700–760 0.112–0.25 N 2 , air Sharpe et al. (2004) [314] ,
Andersen et al. (2009)
[585] ∗
TE-6 25291–17–2 650–1999 298 700 0.25 air Andersen et al. (2012b)
[555]
Tetrachloroethylene 127–18–4 60 0–650 0 278–323 760 0.112 N 2 Sharpe et al. (2004) [314]
trans-1,2-Dichloroethene 156–60–5 540–6500 278–323 760 0.112 N 2 Sharpe et al. (2004) [314]
trans-1,3-Dichloropropene 10061–02–6 60 0–650 0 278–323 760 0.112 N 2 Sharpe et al. (2004) [314]
Trichloroethylene 79–01–6 595–6500 278–323 760 0.112 N 2 Sharpe et al. (2004) [314]
Trichloromethane 67–66–3 580–7200 295–323 700–760 0.01–0.25 N 2 , self Highwood and Shine
(20 0 0) [521] , Sharpe et
al. (2004) [314] ,
Wallington et al. (2016)
[540] ∗
Trichloromethanol 657–2500 295 700 0.25 N 2 Wallington et al. (20 0 0)
[565]
Triethylamine 121–44–8 575–7100 278–323 760 0.112 N 2 Sharpe et al. (2004) [314]
Trifluoroacetic acid 76–05–1 540–7050 298 760 0.112 N 2 Sharpe et al. (2004) [314]
Trimethylamine 75–50–3 60 0–650 0 278–323 760 0.112 N 2 Sharpe et al. (2004) [314]
Valeraldehyde 110–62–3 60 0–650 0 278–323 760 0.112 N 2 Johnson et al. (2010) [519]
Valeric acid 109–52–4 520–7100 340 760 0.112 N 2 Johnson et al. (2010) [519]
Vinyl chloride 75–01–4 540–6500 278–323 760 0.112 N 2 Sharpe et al. (2004) [314]
Vinyl fluoride 75–02–5 50 0–650 0 278–323 760 0.112 N 2 Sharpe et al. (2004) [314]
Vinyl toluene 100–80–1 550–6500 298–323 760 0.112 N 2 Johnson et al. (2010) [519]
Vinyl trifluoroacetate 433–28–3 60 0–20 0 0 298 0.03 air Rodrigues et al. (2016)
[538]
Z-C10F18 60433–11–6 650–1500 296 700 0.5 air Shine et al. (2005) [566]
∗Data from these sources can be found in the alternate folder.
Fig. 28. Raw experimental CIA data for the oxygen 1.06-μm band at T = 230 K for
50:50 and 75:25 O 2 :N 2 mixtures, and the contributions of O 2 −O 2 and O 2 −N 2 de-
termined from these data. For readability in gray scale, the legend is ordered verti-
cally according to the peak intensity.
A plane light wave of wavelength λ is attenuated along the
propagation x axis according to
E = E 0 exp(−2 πm imag x /λ) ex p(i2 πm real x /λ − i2 πct /λ) , (12)
with time t and the speed of light c. The imaginary refractive in-
dex m imag determines the amount of light absorption in a medium,
attenuating the light intensity by exp( −4 πm imag x/ λ) along a path
of distance x.
New HITRAN2016 indices include refractive indices associated
with exoplanet atmospheres. Indices (see Table 12 ) of materi-
als which condense out at temperatures from 1725 K (e.g. SiO 2 )
to 700 K (e.g. ZnS) include most of the condensates tabulated
Fig. 29. Comparison of the real and imaginary indices of ZnS and TiO 2 from 1 to
20 μm. Since particle extinction spectra in the infrared have a wavelength depen-
dence which is similar to the wavelength dependence of the imaginary index, the
extinction spectra of ZnS and TiO 2 particles will be very different.
by Wakeford and Sing [634] , who calculated transmission spec-
tral properties of clouds for hot-Jupiter exoplanets. Many of the
indices have been kindly provided to HITRAN2016 by Harrald
Mutschke of the Friedrich Schiller University Jena. Additional in-
dices of materials (e.g. Mg spinels with a variety of impurities)
not tabulated in Table 12 can be downloaded from the exten-
sive Jena web site ( http://www.astro.uni-jena.de/Laboratory/OCDB/
index.html ). An example of the new indices is presented in Fig. 29 ,
which displays the real and imaginary indices of ZnS and TiO 2 , two
possible exoplanet particle compositions.
Please cite this article as: I.E. Gordon et al., The HITRAN2016 molecular spectroscopic database, Journal of Quantitative Spectroscopy &
Radiative Transfer (2017), http://dx.doi.org/10.1016/j.jqsrt.2017.06.038
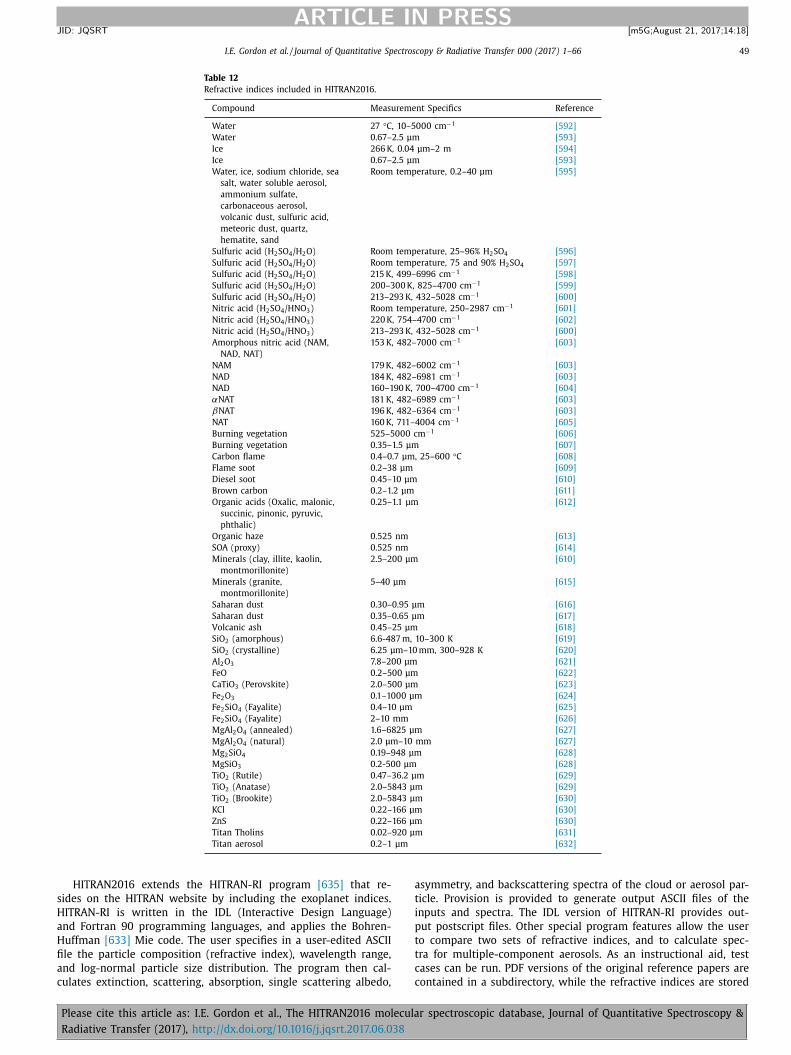
I.E. Gordon et al. / Journal of Quantitative Spectroscopy & Radiative Transfer 0 0 0 (2017) 1–66 49
ARTICLE IN PRESS
JID: JQSRT [m5G; August 21, 2017;14:18 ]
Table 12
Refractive indices included in HITRAN2016.
Compound Measurement Specifics Reference
Water 27 °C, 10–50 0 0 cm
−1 [592]
Water 0.67–2.5 μm [593]
Ice 266 K , 0.04 μm–2 m [594]
Ice 0.67–2.5 μm [593]
Water, ice, sodium chloride, sea
salt, water soluble aerosol,
ammonium sulfate,
carbonaceous aerosol,
volcanic dust, sulfuric acid,
meteoric dust, quartz,
hematite, sand
Room temperature, 0.2–40 μm [595]
Sulfuric acid (H 2 SO 4 /H 2 O) Room temperature, 25–96% H 2 SO 4 [596]
Sulfuric acid (H 2 SO 4 /H 2 O) Room temperature, 75 and 90% H 2 SO 4 [597]
Sulfuric acid (H 2 SO 4 /H 2 O) 215 K, 499–6996 cm
−1 [598]
Sulfuric acid (H 2 SO 4 /H 2 O) 20 0–30 0 K, 825–470 0 cm
−1 [599]
Sulfuric acid (H 2 SO 4 /H 2 O) 213–293 K, 432–5028 cm
−1 [600]
Nitric acid (H 2 SO 4 /HNO 3 ) Room temperature, 250–2987 cm
−1 [601]
Nitric acid (H 2 SO 4 /HNO 3 ) 220 K, 754–4700 cm
−1 [602]
Nitric acid (H 2 SO 4 /HNO 3 ) 213–293 K, 432–5028 cm
−1 [600]
Amorphous nitric acid (NAM,
NAD, NAT)
153 K, 482–70 0 0 cm
−1 [603]
NAM 179 K, 482–6002 cm
−1 [603]
NAD 184 K, 482–6981 cm
−1 [603]
NAD 160–190 K, 700–4700 cm
−1 [604]
αNAT 181 K, 482–6989 cm
−1 [603]
βNAT 196 K, 482–6364 cm
−1 [603]
NAT 160 K, 711–4004 cm
−1 [605]
Burning vegetation 525–50 0 0 cm
−1 [606]
Burning vegetation 0.35–1.5 μm [607]
Carbon flame 0.4–0.7 μm, 25–600 °C [608]
Flame soot 0.2–38 μm [609]
Diesel soot 0.45–10 μm [610]
Brown carbon 0.2–1.2 μm [611]
Organic acids (Oxalic, malonic,
succinic, pinonic, pyruvic,
phthalic)
0.25–1.1 μm [612]
Organic haze 0.525 nm [613]
SOA (proxy) 0.525 nm [614]
Minerals (clay, illite, kaolin,
montmorillonite)
2.5–200 μm [610]
Minerals (granite,
montmorillonite)
5–40 μm [615]
Saharan dust 0.30–0.95 μm [616]
Saharan dust 0.35–0.65 μm [617]
Volcanic ash 0.45–25 μm [618]
SiO 2 (amorphous) 6.6-487 m, 10–300 K [619]
SiO 2 (crystalline) 6.25 μm–10 mm, 300–928 K [620]
Al 2 O 3 7.8–200 μm [621]
FeO 0.2–500 μm [622]
CaTiO 3 (Perovskite) 2.0–500 μm [623]
Fe 2 O 3 0.1–10 0 0 μm [624]
Fe 2 SiO 4 (Fayalite) 0.4–10 μm [625]
Fe 2 SiO 4 (Fayalite) 2–10 mm [626]
MgAl 2 O 4 (annealed) 1.6–6825 μm [627]
MgAl 2 O 4 (natural) 2.0 μm–10 mm [627]
Mg 2 SiO 4 0.19–948 μm [628]
MgSiO 3 0.2-500 μm [628]
TiO 2 (Rutile) 0.47–36.2 μm [629]
TiO 2 (Anatase) 2.0–5843 μm [629]
TiO 2 (Brookite) 2.0–5843 μm [630]
KCl 0.22–166 μm [630]
ZnS 0.22–166 μm [630]
Titan Tholins 0.02–920 μm [631]
Titan aerosol 0.2–1 μm [632]
HITRAN2016 extends the HITRAN-RI program [635] that re-
sides on the HITRAN website by including the exoplanet indices.
HITRAN-RI is written in the IDL (Interactive Design Language)
and Fortran 90 programming languages, and applies the Bohren-
Huffman [633] Mie code. The user specifies in a user-edited ASCII
file the particle composition (refractive index), wavelength range,
and log-normal particle size distribution. The program then cal-
culates extinction, scattering, absorption, single scattering albedo,
asymmetry, and backscattering spectra of the cloud or aerosol par-
ticle. Provision is provided to generate output ASCII files of the
inputs and spectra. The IDL version of HITRAN-RI provides out-
put postscript files. Other special program features allow the user
to compare two sets of refractive indices, and to calculate spec-
tra for multiple-component aerosols. As an instructional aid, test
cases can be run. PDF versions of the original reference papers are
contained in a subdirectory, while the refractive indices are stored
Please cite this article as: I.E. Gordon et al., The HITRAN2016 molecular spectroscopic database, Journal of Quantitative Spectroscopy &
Radiative Transfer (2017), http://dx.doi.org/10.1016/j.jqsrt.2017.06.038

50 I.E. Gordon et al. / Journal of Quantitative Spectroscopy & Radiative Transfer 0 0 0 (2017) 1–66
ARTICLE IN PRESS
JID: JQSRT [m5G; August 21, 2017;14:18 ]
in subdirectories in ASCII and NetCDF formats. The user can use
the ASCII files to quickly look up the real and imaginary indices at
a specific wavelength, while the HITRAN-RI program accesses the
netCDF files. HITRAN-RI allows the user to read in user-specified
refractive indices. The source code of HITRAN-RI can also be mod-
ified and added to by the user.
6. Global data and software
6.1. Database structure and interface ( www.hitran.org)
Since June 2015, users have been able to access the HITRAN
line-by-line data not only by downloading them in the tradi-
tional ASCII 160-character (.par) format from the ftp site, but
also through the easy-to-use interface HITRAN online, available at
www.hitran.org . Cross sections can also be accessed through this
dynamic interface, while CIA and aerosols sections of the database
are also accessible, though so far only as static files. This new tool
(described in Hill et al. [2] ) allows custom filtering and selection
of molecules and their isotopologues in the wavenumber region of
interest. The default output format is still .par, but users are given
an opportunity to create their own, customized output formats, in-
cluding the HDF5 format widely used by NASA scientists. The flexi-
bility of the formats is achieved due to the fact that the database is
cast into a relational format [236] : it is now a compilation of tables
of parameters and metadata that are interconnected and search-
able using Structured Query Language (SQL) (see Refs. [2] and
[236] for details). This new flexible database format offers many
advantages over the static fixed-width ASCII files. Indeed, we have
now introduced non-Voigt line shapes [6] , broadening parameters
by perturbing gases other than air or self [4] , and other parame-
ters that are important for accurate atmospheric retrievals. Other
advantages of the new structure include allowing more significant
figures (for instance, important for line positions of the MW tran-
sitions) and checks on data integrity. Further advantages include
immediate access to the references for every parameter (including
the automatic generation of bibliography in both HTML and BibTeX
format), generation of interactive plots of retrieved line-by-line
and cross-section data (with full features such as zoom, etc.), and
more-detailed filtering (such as by individual vibrational bands),
etc.
HITRAN online has received a warm welcome from the commu-
nity, with over 6200 researchers registered with it (as of mid-June
2017). The rate of new users signing up on www.hitran.org has not
dropped below 50 per week. Extensive documentation regarding
the definition and use of HITRAN parameters is now directly ac-
cessible on the website.
There are a few new features that have been introduced to the
HITRAN online interface since its original release. First, in order to
make the selection of several dozen new special parameters less
cumbersome, we “bundled” the parameters associated with se-
lected line profiles. In the example shown in Fig. 30 one can see
how the Hartmann-Tran profile can be selected.
6.2. HITRAN application programming interface (HAPI)
The HITRAN Application Programming Interface (HAPI) is a free
open source Python module (library) which provides a set of
tools for working with structured spectroscopic data from differ-
ent sources. It is described in detail in Ref. [5] . Here we give a
brief overview of its features.
Originally created as an extension of the HITRAN online web in-
terface [2] to allow users sophisticated calculations and manipu-
lations with the HITRAN data on their computers, HAPI can han-
dle user-supplied custom data in a flexible way and fully sup-
ports the HITRAN online data scheme and formats of the HITRAN
[1] database.
The principal aim of HAPI is facilitating physically-sound inter-
pretation of observations and more realistic models for a wide va-
riety of applications such as astrophysics, planetary science, cli-
mate simulations, remote sensing, theoretical spectroscopy, and
data mining. Having such a tool is important in particular to pre-
vent possible errors in radiative-transfer calculations caused by
misuse of spectroscopic tools and databases (see example dis-
cussed in Ref. [636] for instance).
The HAPI package can be obtained via the HITRAN online web-
site ( http://hitran.org/hapi ) or from the Zenodo community ( http:
//zenodo.org/communities/hapi/about/ ). The current version (1.1) is
distributed under a permissive open source license (MIT). Addi-
tional links can be found on the official HITRAN site.
HAPI consists of two major parts. First, it has a simple built-in
database management system written in pure Python, which gives
a capability of data processing and filtering. Second, HAPI incorpo-
rates a set of tools for spectra simulation accounting for the tem-
perature, pressure, optical path length, and instrument properties.
In more detail, the HAPI features are as follows:
• Support for standard HITRAN parameters given in “160-
character” or “.par” format which is described in Ref. [3] , • Support for the newly added types of parameters such as for-
eign broadenings and shifts, speed dependencies for non-Voigt
profiles, line mixing coefficients, etc. • Communication with the HITRAN online web interface using the
REST HTTP protocol in order to get the most up-to-date HITRAN
data, • Python implementations for line profiles including the partially
correlated quadratic speed-dependent hard collision model
(Hartmann-Tran profile [7,8,13,14] ), • Python implementation of the Total Internal Partition Sums
(based on TIPS-2011 [112] and incorporating a large update out-
lined in this paper), • High-resolution single-layer spectra simulation accounting for
pressure, temperature, optical path length and instrument func-
tion. In the simplest case, the simulation is performed in a sin-
gle step using a functional approach. See Fig. 25 where HAPI
was used to generate cross-sections of ethylene to compare
with experimental data. • Capability of modeling the absorption cross sections broadened
by a mixture of gases of astrophysical and planetary inter-
ests. The parameters for the foreign broadenings and shift are
gradually being added to the HITRAN online system (see out-
line in Refs. [4] [5] ). Fig. 31 shows an example of how one
can generate cross-sections of acetylene broadened by differ-
ent planetary-relevant proportions of hydrogen and helium (see
Section 2.26 for details). • Flexibility in the scheme of the absorption cross-section calcu-
lation. Each part of the scheme given in Ref. [5] can be cus-
tomized by user. • Capability of extending the HAPI functionality by adding cus-
tom line shapes, partition sums, instrumental functions, envi-
ronment dependences, and radiative-transfer code. • Compatibility with a large set of third-party libraries in Python,
C/C ++ , Java etc…
In the near future, in order to improve the simulation of the ab-
sorption cross sections, it is planned to include the full relaxation
matrix calculation for line mixing for a number of molecules of
atmospheric importance [117,238,239] . Inclusion of the line mix-
ing in the calculation is expected to enable sub-percent accuracy
(provided other parameters are known very accurately) for bands
of atmospheric gases to better satisfy highly-precise ground and
satellite measurements.
Please cite this article as: I.E. Gordon et al., The HITRAN2016 molecular spectroscopic database, Journal of Quantitative Spectroscopy &
Radiative Transfer (2017), http://dx.doi.org/10.1016/j.jqsrt.2017.06.038

I.E. Gordon et al. / Journal of Quantitative Spectroscopy & Radiative Transfer 0 0 0 (2017) 1–66 51
ARTICLE IN PRESS
JID: JQSRT [m5G; August 21, 2017;14:18 ]
Fig. 30. Groups of related parameters such as those relating to the HT profile in different temperature regions are selected from a separate set of overlay panels in the
HITRAN online interface. When one or more temperature groups are chosen, the three "Common parameters" are also automatically selected. Conversely, these common
parameters are removed from the selection when no temperature group is chosen for this profile. Different broadening species are presented on separate panels, and may
be selected from the labeled tabs at the top of the overlay.
Fig. 31. Cross-sections of acetylene in different environments of hydrogen and helium, generated with HAPI.
At the current time HAPI requires the user to be familiar with
Python, although most of the functions are prewritten and with
the help of the manual one does not need to have advanced
knowledge of that computer language. In order to extend the range
of users, we plan to create a flexible graphical user interface (GUI).
This interface will give the user a possibility to simulate, plot and
compare line-by-line and raw spectral data with a flexible control
of scale, units, and computational parameters (just as is possible in
the current Python version of HAPI). The new software will sup-
port Windows, Linux and MacOS.
Please cite this article as: I.E. Gordon et al., The HITRAN2016 molecular spectroscopic database, Journal of Quantitative Spectroscopy &
Radiative Transfer (2017), http://dx.doi.org/10.1016/j.jqsrt.2017.06.038

52 I.E. Gordon et al. / Journal of Quantitative Spectroscopy & Radiative Transfer 0 0 0 (2017) 1–66
ARTICLE IN PRESS
JID: JQSRT [m5G; August 21, 2017;14:18 ]
Table 13
List of isotopologues whose partition sums have been updated for this edition of HITRAN. Note that there a few rare isotopologues here that are
not in HITRAN.
Molecule ID Isotopologues
1 H 2 16 O, H 2
18 O, H 2 17 O, HD 16 O, HD 18 O, HD 17 O, D 2
16 O, D 2 18 O, D 2
17 O
2 12 C 16 O 2 , 13 C 16 O 2 ,
16 O 12 C 18 O, 16 O 12 C 17 O, 16 O 13 C 18 O, 16 O 13 C 17 O, 12 C 18 O 2 , 17 O 12 C 18 O, 12 C 17 O 2 ,
13 C 18 O 2 , 18 O 13 C 17 O, 13 C 17 O 2 ,
14 C 16 O 2 4 14 N 2
16 O
5 12 C 16 O, 13 C 16 O, 12 C 18 O, 12 C 17 O, 13 C 18 O, 13 C 17 O, 14 C 16 O, 14 C 18 O, 14 C 17 O
6 12 CH 4
7 16 O 2 , 16 O 18 O, 16 O 17 O, 18 O 18 O, 18 O 17 O, 17 O 17 O
11 14 NH 3 , 15 NH 3
12 H
14 N
16 O 3 , H
15 N
16 O 3 13 16 OH
14 H
19 F, D 19 F
15 H
35 Cl, H
37 Cl, D 35 Cl, D 37 Cl
16 H
79 Br, H
81 Br, D 79 Br, D 81 Br
17 H
127 I, D 127 I
20 H 2 12 C 16 O
22 14 N 2 , 14 N
15 N, 15 N 2
23 H
12 C 14 N, H
13 C 14 N, H
12 C 15 N
25 H 2 16 O 2
26 12 C 2 H 2
28 31 PH 3
29 12 C 16 O 19 F 2 , 13 C 16 O 19 F 2
31 H 2 32 S, H 2
34 S, H 2 33 S
39 12 CH 3 16 OH
47 32 S 16 O 3 49 12 C 16 O 35 Cl 2 ,
12 C 16 O 35 Cl 37 Cl
6.3. Total internal partition sums (TIPS)
Total internal partition sums (TIPS) were determined for all
molecules and isotopologues in HITRAN2016 and for a number of
isotopologues of molecules of interest in planetary atmospheres.
The current TIPS data are calculated in one-degree steps from
1 K to T max , where T max is determined separately for each iso-
topologue based on convergence of the partition sums. The TIPS
are comprised of updated calculations and values from previous
studies of TIPS [112,637–639] . The updates can be grouped into
several categories: improvements in ab initio calculations that al-
low direct sums over energy levels, improved Q vib values using
the anharmonic approximation [640] , and calculations for new
molecule/isotopologues in the HITRAN database. The updates that
were made for isotopologues in this edition of HITRAN are listed
in Table 13 . The updates are detailed in an accompanying paper
[641] in this HITRAN2016 special issue. Note that an error was
found in Tables 1 and 2 of Ref. [641] where the values correspond-
ing to partition sums of the 16 O
17 O isotopologue were a factor
of six too large. This has been fixed in the official release of HI-
TRAN2016.
The TIPS are made available to the scientific community in
the form of tables and codes that rapidly recall the TIPS for
any molecule, isotopologue, and temperature. There are several
codes that are distributed with this edition of HITRAN: FOR-
TRAN codes TIPS_2017.for and BD_TIPS_2017.for and a python code
TIPS_2017.py with associated dictionaries. TIPS_2017.for is a stand-
alone code that queries the user for a molecule, isotopologue, and
temperature and returns Q(T). BD_TIPS_2017.for is a subroutine ap-
plication that users can insert into their codes to return Q(T) for
a molecule/isotopologue/temperature selection. The python code
uses python dictionaries to recall Q(T). The dictionaries are labeled
by the molecule number and local ID number, see the TIPS arti-
cle [641] for details. Details are given to develop custom python
algorithms for particular molecule/isotopologue combinations. The
TIPS python package was incorporated into the HITRAN Application
Programming Interface (HAPI) [5] in order to seamlessly integrate
into the cross-section generating process. The tables and codes are
available at faculty.uml.edu/Robert_Gamache and www.hitran.org .
7. Conclusions
The improvements, expansions and new structure in the new
HITRAN database release have been elaborated upon. For the line-
by-line data, improved line position, intensity, and line-shape pa-
rameters for many of the previously existing molecules and iso-
topologues have been introduced. Many new lines/bands have been
added for different molecules and their isotopologues allowing for
a more complete database (for atmospheric applications) and for
the expansion of the spectral coverage of the existing line lists.
Additionally, HITRAN continues evolving in terms of structure and
scope. A new relational database structure has been established
[2] that enabled significant expansion of the amount of important
spectroscopic parameters provided in the database. Literally dozens
of new parameters have been introduced that allow accommoda-
tion of non-Voigt line shapes [6] ; flexible representation of broad-
ening parameters and their temperature dependencies; broaden-
ing and shift of spectral lines due to pressure of gases domi-
nant in planetary atmospheres [4] (namely, H 2 , He and CO 2 ). This
extensive expansion of the database would have been very im-
practical in the old fixed-length ASCII format of previous HITRAN
editions. An interface on the internet has also been established
( www.hitran.org ) that provides the diverse group of HITRAN users
with much power to filter, extract, plot, and query the database.
Even more power has been given to the user through the intro-
duction of the HITRAN Application Programming Interface (HAPI)
[5] . HAPI is currently a set of Python libraries which not only al-
lows users to download data from the database but also to carry
out: 1) single-layer absorption calculations at different thermody-
namic conditions, accounting for an instrument function, new line
shape parametrizations, perturbing gas or gases, etc, 2) extended
functionality provided by custom functions, line lists and partition
sums.
Several new molecules and isotopologues have been added to
the line-by-line portion of the compilation, which improve model-
ing of the absorption of the terrestrial atmosphere and beyond.
One of the main highlights of the new edition is the monumen-
tal expansion of the cross-sectional part of the database which in-
creased (in terms of amount of gases) about six-fold and now fea-
Please cite this article as: I.E. Gordon et al., The HITRAN2016 molecular spectroscopic database, Journal of Quantitative Spectroscopy &
Radiative Transfer (2017), http://dx.doi.org/10.1016/j.jqsrt.2017.06.038

I.E. Gordon et al. / Journal of Quantitative Spectroscopy & Radiative Transfer 0 0 0 (2017) 1–66 53
ARTICLE IN PRESS
JID: JQSRT [m5G; August 21, 2017;14:18 ]
tures over 300 species. These cross-sections can also be accessible
through www.hitran.org where they are divided into categories for
easy browsing.
Aerosols and collision induced absorption datasets have also
been revised and extended.
The compilation is free and can be accessed through www.
hitran.org . We recommend citing this article when using the HI-
TRAN2016 data. If an update to a certain molecule is announced
on the website and is being used, then we encourage users to cite
when they downloaded the data.
8. Future work
While HITRAN continues to be an international standard for
reference spectroscopy for atmospheric and planetary gases, there
is still substantial room for improvement. In many subsections
throughout the paper we mention the avenues for improvements
for individual molecules, but they are really just the tip of the ice-
berg.
The studies of the terrestrial atmosphere require further im-
provements to the existing parameters and what is more challeng-
ing: population of the dataset of the non-Voigt line-shape param-
eters. As was discussed above, the amount of measurements and
calculations of the parameters obtained using the recommended
HT profile are scarce and it will take time before a majority of HI-
TRAN lines will have these parameters provided. Also, we remind
experimentalists and theoreticians to take extreme care when fit-
ting to these parameters to avoid correlations.
The line mixing for many molecules is now available in
HITRAN through diagonal (Rozenkranz) parametrization. Other
parametrizations require provision of additional software (just as
it is done in this edition in the case of carbon dioxide) that may
have to be molecule or even band-specific. HAPI offers an excellent
avenue for addition of this extra functionality.
At the moment only seven HITRAN gases have pressure broad-
ening (and their temperature dependence) and pressure shift of
lines by H 2 , He and CO 2 . We would like to extend this to all gases
important for planetary research. Also, in order to aid modeling of
the terrestrial atmosphere, we will add parameters associated with
broadening of spectral lines by water vapor (which is sufficiently
abundant to make an impact on retrievals in the tropics, for in-
stance).
With an exception of a few diatomic molecules (namely NO,
OH, HF, HCl, HBr, HI and H 2 ) HITRAN data are limited to tem-
peratures encountered in the Earth atmosphere and will be de-
ficient when modeling high-temperature environments including
stellar and some planetary atmospheres. The users are encour-
aged to employ the HITEMP database for these applications [278] .
However, there are currently only five gases that are provided in
HITEMP (H 2 O, CO 2 , CO, NO, OH) and a major update of the HITEMP
database will be released in the near future. This update will in-
clude improvement of the spectroscopy of the existing HITEMP
gases but also will introduce additional molecules.
While a major update is featured here for the cross-sectional
part of the database, we note that it is still far from complete in
terms of gases. Moreover, all of the current updates are in the IR
part of the spectrum and another substantial update is needed for
the UV cross-sections.
A massive revision and expansion of the CIA data is planned for
the near future.
Structure and the tools provided with the database are also a
very important part of the HITRAN database. We plan further im-
provements to the documentation for the HITRAN online interface
and the development of video tutorials. Finally, development of an
interactive interface is planned for HAPI, for which video tutorials
will also be created.
Acknowledgments
The management and development of the HITRAN molecu-
lar database has been supported by NASA AURA program grant
NNX14AI55G and NASA Planetary Atmosphere grant NNX13AI59G ,
and NASA PDART grant NNX16AG51G . Portions of the research de-
scribed in this paper were performed at the Jet Propulsion Labo-
ratory, California Institute of Technology, under contract with the
National Aeronautics and Space Administration, Government spon-
sorship acknowledged.
We gratefully acknowledge the many researchers who pro-
vided data, experimental and/or theoretical: Abdulsamee Alka-
drou, Lorenzo Barrett, Emma Barton, Chris Benner, Linda Brown,
Jeanna Buldyreva, John Coxon, Phillip Coles, Ludovic Daumont,
Jolanta Domyslawska, Andre Fayt, Photos Hadjigeorgiou, Shuim-
ing Hu, Ekaterina Karlovets, Samir Kassi, Julien Lamouroux, Daniel
Lisak, Lorenzo Lodi, Gang Li, Anwen Liu, Didier Mondelain, Tatyana
Petrova, Laurence Régalia, Candice Renaud, Cyril Richard, Alexander
M. Solodov, Alexander A. Solodov, Mikhail Tretyakov, Daniel Under-
wood, Sergey Yurchenko, Nikolai Zobov.
Those who provided independent validations are also acknowl-
edged: Matthew Alvorado, Joshua Baraban, Chris Boone, Athena
Coustenis, Jose Fonfria, Erik Kerstel, Xiong Liu, Emile Medvedev,
Jana Mendrok, Eli Mlawer, Johannes Orphal, Fabiano Oyafuso, Vivi-
enne Payne, Steven Ross, Kang Sun, Geronimo Villanueva.
References
[1] Rothman LS, Gordon IE, Babikov Y, Barbe A, Chris Benner D, Bernath PF, et al.
The HITRAN2012 molecular spectroscopic database. J Quant Spectrosc Radiat Transf 2013;130:4–50. doi: 10.1016/j.jqsrt.2013.07.002 .
[2] Hill C, Gordon IE, Kochanov RV, Barrett L, Wilzewski JS, Rothman LS. HITRA- Nonline: An online interface and the flexible representation of spectroscopic
data in the HITRAN database. J Quant Spectrosc Radiat Transf 2016;177:4–14. doi: 10.1016/j.jqsrt.2015.12.012 .
[3] Rothman LS, Jacquemart D, Barbe A, Chris Benner D, Birk M, Brown LR, et al.
The HITRAN 2004 molecular spectroscopic database. J Quant Spectrosc Radiat Transf 2005;96:139–204. doi: 10.1016/j.jqsrt.2004.10.008 .
[4] Wilzewski JS, Gordon IE, Kochanov RV, Hill C, Rothman LS. H 2 , He, and CO 2 line-broadening coefficients, pressure shifts and temperature-dependence ex-
ponents for the HITRAN database. Part 1: SO 2 , NH 3 , HF, HCl, OCS and C 2 H 2 . J Quant Spectrosc Radiat Transf 2016;168:193–206. doi: 10.1016/j.jqsrt.2015.09.
003 .
[5] Kochanov RV, Gordon IE, Rothman LS, Wcisło P, Hill C, Wilzewski JS. HITRAN application programming interface (HAPI): a comprehensive ap-
proach to working with spectroscopic data. J Quant Spectrosc Radiat Transf 2016;177:15–30. doi: 10.1016/j.jqsrt.2016.03.005 .
[6] Wcisło P, Gordon IE, Tran H, Tan Y, Hu S-M, Campargue A, et al. The imple- mentation of non-Voigt line profiles in the HITRAN database: H 2 case study.
J Quant Spectrosc Radiat Transf 2016;177:75–91. doi: 10.1016/j.jqsrt.2016.01.
024 . [7] Tran H, Ngo NH, Hartmann J-M. Efficient computation of some speed-
dependent isolated line profiles. J Quant Spectrosc Radiat Transf 2013;129:199–203. doi: 10.1016/j.jqsrt.2013.06.015 .
[8] Tran H, Ngo NH, Hartmann J-M. Erratum to “Efficient computation of some speed-dependent isolated line profiles” [J. Quant. Spectrosc. Radiat. Transfer
129 (2013) 199–203]. J Quant Spectrosc Radiat Transf 2014;134:104. doi: 10.
1016/j.jqsrt.2013.10.015 . [9] Boone CD, Walker KA, Bernath PF. Speed-dependent Voigt profile for water
vapor in infrared remote sensing applications. J Quant Spectrosc Radiat Transf 2007;105:525–32. doi: 10.1016/j.jqsrt.2006.11.015 .
[10] Miller CE, Brown LR, Toth RA, Benner DC, Devi VM. Spectroscopic chal- lenges for high accuracy retrievals of atmospheric CO 2 and the Orbiting Car-
bon Observatory (OCO) experiment. Comptes Rendus Phys 2005;6:876–87.
doi: 10.1016/j.crhy.20 05.09.0 05 . [11] Galatry L. Simultaneous effect of doppler and foreign gas broadening on spec-
tral lines. Phys Rev 1961;122:1218–23. doi: 10.1103/PhysRev.122.1218 . [12] Pine AS. Asymmetries and correlations in speed-dependent Dicke-narrowed
line shapes of argon-broadened HF. J Quant Spectrosc Radiat Transf 1999;62:397–423. doi: 10.1016/S0 022-4073(98)0 0112-5 .
[13] Tennyson J, Bernath PF, Campargue A, Császár AG, Daumont L, Gamache RR, et al. Recommended isolated-line profile for representing high-resolution
spectroscopic transitions (IUPAC Technical Report). Pure Appl Chem
2014;86:1931–43. doi: 10.1515/pac- 2014- 0208 . [14] Ngo NH, Lisak D, Tran H, Hartmann J-M. An isolated line-shape model to
go beyond the Voigt profile in spectroscopic databases and radiative transfer codes. J Quant Spectrosc Radiat Transf 2013;129:89–100. doi: 10.1016/j.jqsrt.
2013.05.034 .
Please cite this article as: I.E. Gordon et al., The HITRAN2016 molecular spectroscopic database, Journal of Quantitative Spectroscopy &
Radiative Transfer (2017), http://dx.doi.org/10.1016/j.jqsrt.2017.06.038

54 I.E. Gordon et al. / Journal of Quantitative Spectroscopy & Radiative Transfer 0 0 0 (2017) 1–66
ARTICLE IN PRESS
JID: JQSRT [m5G; August 21, 2017;14:18 ]
[15] Barber RJ, Tennyson J, Harris GJ, Tolchenov RN. A high-accuracy computed water line list. Mon Not R Astron Soc 2006;368:1087–94. doi: 10.1111/j.
1365-2966.2006.10184.x . [16] Lodi L, Tennyson J, Polyansky OL. A global, high accuracy ab initio dipole mo-
ment surface for the electronic ground state of the water molecule. J Chem
Phys 2011;135:34113. doi: 10.1063/1.3604934 .
[17] Lodi L, Tennyson J. Line lists for H 2 18 O and H 2
17 O based on empirical line positions and ab initio intensities. J Quant Spectrosc Radiat Transf
2012;113:850–8. doi: 10.1016/j.jqsrt.2012.02.023 .
[18] Krasnopolsky VA, Belyaev DA, Gordon IE, Li G, Rothman LS. Observations of D/H ratios in H 2 O, HCl, and HF on Venus and new DCl and DF line strengths.
Icarus 2013;224:57–65. doi: 10.1016/j.icarus.2013.02.010 . [19] Tennyson J, Bernath PF, Brown LR, Campargue A, Carleer MR, Császár AG,
et al. IUPAC critical evaluation of the rotational–vibrational spectra of water vapor. Part I—Energy levels and transition wavenumbers for H 2
17 O and H 2 18 O.
J Quant Spectrosc Radiat Transf 2009;110:573–96. doi: 10.1016/j.jqsrt.2009.02.
014 . [20] Tennyson J, Bernath PF, Brown LR, Campargue A, Császár AG, Daumont L,
et al. IUPAC critical evaluation of the rotational–vibrational spectra of water vapor. Part II. J Quant Spectrosc Radiat Transf 2010;111:2160–84. doi: 10.1016/
j.jqsrt.2010.06.012 . [21] Tennyson J, Bernath PF, Brown LR, Campargue A, Császár AG, Daumont L,
et al. IUPAC critical evaluation of the rotational–vibrational spectra of water
vapor, Part III: energy levels and transition wavenumbers for H 2 16 O. J Quant
Spectrosc Radiat Transf 2013;117:29–58. doi: 10.1016/j.jqsrt.2012.10.002 .
[22] Tennyson J, Bernath PF, Brown LR, Campargue A, Császár AG, Daumont L, et al. IUPAC critical evaluation of the rotational–vibrational spectra of water
vapor. Part IV. Energy levels and transition wavenumbers for D 2 16 O, D 2
17 O, and D 2
18 O. J Quant Spectrosc Radiat Transf 2014;142:93–108. doi: 10.1016/j.
jqsrt.2014.03.019 .
[23] Mikhailenko SN, Kassi S, Mondelain D, Gamache RR, Campargue A. A spec- troscopic database for water vapor between 5850 and 8340 cm
−1 . J Quant
Spectrosc Radiat Transf 2016;179:198–216. doi: 10.1016/j.jqsrt.2016.03.035 . [24] Liu A-W, Naumenko OV, Kassi S, Campargue A. CW-Cavity ring down spec-
troscopy of deuterated water in the 1.58 μm atmospheric transparency win- dow. J Quant Spectrosc Radiat Transf 2014;138:97–106. doi: 10.1016/j.jqsrt.
2014.02.002 .
[25] Kyuberis AA, Zobov NF, Naumenko OV, Voronin BA, Polyansky OL, Lodi L, et al. Room temperature linelists for deuterated water. J Quant Spectrosc Ra-
diat Transf 2017 this issue. http://doi.org/10.1016/j.jqsrt.2017.06.026 . [26] Mikhailenko SN, Serdyukov VI, Sinitsa LN. LED-based Fourier transform spec-
troscopy of H 2 18 O in the 15,0 0 0–16,0 0 0 cm
−1 range. J Quant Spectrosc Radiat Transf 2015;156:36–46. doi: 10.1016/j.jqsrt.2015.02.001 .
[27] Regalia L, Oudot C, Mikhailenko S, Wang L, Thomas X, Jenouvrier A, et al. Wa-
ter vapor line parameters from 6450 to 9400 cm
−1 . J Quant Spectrosc Radiat Transf 2014;136:119–36. doi: 10.1016/j.jqsrt.2013.11.019 .
[28] Mikhailenko S, Régalia L. Inventory of data included in HITRAN2012 edi- tion for water vapor between 6450 and 9400 cm
−1 . J Mol Spectrosc
2016;327:159–70. doi: 10.1016/j.jms.2016.01.001 . [29] Campargue A, Mikhailenko SN, Vasilchenko S, Reynaud C, Béguier S,
Cermák P, et al. The absorption spectrum of water vapor in the 2.2 μm trans- parency window: High sensitivity measurements and spectroscopic database.
J Quant Spectrosc Radiat Transf 2017;189:407–16. doi: 10.1016/j.jqsrt.2016.12.
016 . [30] Ponomarev YN, Solodov AA, Solodov AM, Petrova TM, Naumenko OV. FTIR
spectrometer with 30 m optical cell and its applications to the sensitive mea- surements of selective and nonselective absorption spectra. J Quant Spectrosc
Radiat Transf 2016;177:253–60. doi: 10.1016/j.jqsrt.2016.02.026 . [31] Birk M, Wagner G, Loos J, Lodi L, Polyansky OL, Kyuberis AA, et al. Accurate
line intensities for water transitions in the infrared: Comparison of theory
and experiment. J Quant Spectrosc Radiat Transf 2017 This issue:HITRAN Spe- cial issue. doi: 10.1016/j.jqsrt.2017.03.040 .
[32] Wunch D, Toon GC, Blavier J-FL, Washenfelder RA, Notholt J, Connor BJ, et al. The total carbon column observing network. Philos Trans R Soc A Math Phys
Eng Sci 2011;369:2087–112. doi: 10.1098/rsta.2010.0240 . [33] Loos J, Birk M, Wagner G. Measurement of air-broadening line shape pa-
rameters and temperature dependence parameters of H 2 O lines in the spec-
tral ranges 1850–2280 cm
−1 and 2390–40 0 0 cm
−1 . J Quant Spectrosc Radiat Transf 2017 HITRAN Spe. doi: 10.1016/j.jqsrt.2017.03.033 .
[34] Loos J, Birk M, Wagner G. Measurement of position, intensities and self- broadened line shape parameters of H2O lines in the spectral ranges 1850–
2280 cm
-1 and 2390–40 0 0 cm
-1 . J Quant Spectrosc Radiat Transf 2017 HITRAN
Spe. 10.1016/j.jqsrt.2017.02.013 .
[35] Rosenkranz P. Shape of the 5 mm oxygen band in the atmosphere. IEEE Trans
Antennas Propag 1975;23:498–506. doi: 10.1109/TAP.1975.1141119 . [36] Veefkind JP, Aben I, McMullan K, Förster H, de Vries J, Otter G, et al. TROPOMI
on the ESA Sentinel-5 Precursor: A GMES mission for global observations of the atmospheric composition for climate, air quality and ozone layer applica-
tions. Remote Sens Environ 2012;120:70–83. doi: 10.1016/j.rse.2011.09.027 . [37] Leshchishina O, Mikhailenko S, Mondelain D, Kassi S, Campargue A. CRDS of
water vapor at 0.1 Torr between 6886 and 7406 cm
−1 . J Quant Spectrosc Ra-
diat Transf 2012;113:2155–66. doi: 10.1016/j.jqsrt.2012.06.026 . [38] Campargue A, Mikhailenko SN, Lohan BG, Karlovets EV, Mondelain D, Kassi S.
The absorption spectrum of water vapor in the 1.25 μm atmospheric window
(7911–8337 cm
−1 ). J Quant Spectrosc Radiat Transf 2015;157:135–52. doi: 10.
1016/j.jqsrt.2015.02.011 .
[39] Mikhailenko S, Kassi S, Wang L, Campargue A. The absorption spectrum of water in the 1.25 μm transparency window (7408–7920 cm
−1 ). J Mol Spec-
trosc 2011;269:92–103. doi: 10.1016/j.jms.2011.05.005 . [40] Mikhailenko SN, Mondelain D, Kassi S, Campargue A. An accurate and com-
plete empirical line list for water vapor between 5850 and 7920 cm
−1 . J Quant Spectrosc Radiat Transf 2014;140:48–57. doi: 10.1016/j.jqsrt.2014.02.
006 . [41] Leshchishina O, Mikhailenko SN, Mondelain D, Kassi S, Campargue A. An im-
proved line list for water vapor in the 1.5 μm transparency window by highly
sensitive CRDS between 5852 and 6607 cm
−1 . J Quant Spectrosc Radiat Transf 2013;130:69–80. doi: 10.1016/j.jqsrt.2013.04.010 .
[42] Sironneau VT, Hodges JT. Line shapes, positions and intensities of water tran- sitions near 1.28 μm. J Quant Spectrosc Radiat Transf 2015;152:1–15. doi: 10.
1016/j.jqsrt.2014.10.020 . [43] Toth RA. Linelist of water vapor parameters from 500 to 80 0 0 cm
−1 http:
//mark4sun.jpl.nasa.gov/h2o.html .
[44] Schwenke DW, Partridge H. Convergence testing of the analytic represen- tation of an ab initio dipole moment function for water: improved fitting
yields improved intensities. J Chem Phys 20 0 0;113:6592–7. doi: 10.1063/1. 1311392 .
[45] Partridge H, Schwenke DW. The determination of an accurate isotope depen- dent potential energy surface for water from extensive ab initio calculations
and experimental data. J Chem Phys 1997;106:4618–39. doi: 10.1063/1.473987 .
[46] Gordon IE, Rothman LS, Gamache RR, Jacquemart D, Boone C, Bernath PF, et al. Current updates of the water-vapor line list in HITRAN: a new “Diet”
for air-broadened half-widths. J Quant Spectrosc Radiat Transf 2007;108:389–402. doi: 10.1016/j.jqsrt.20 07.06.0 09 .
[47] Jenouvrier A, Daumont L, Régalia-Jarlot L, Tyuterev VG, Carleer M, Van- daele AC, et al. Fourier transform measurements of water vapor line pa-
rameters in the 420 0–660 0 cm
−1 region. J Quant Spectrosc Radiat Transf
2007;105:326–55. doi: 10.1016/j.jqsrt.2006.11.007 . [48] Armante R, Scott N, Crevoisier C, Capelle V, Crepeau L, Chédin A. Evaluation
of spectroscopic databases through radiative transfer simulations compared to observations. Application to the validation of GEISA 2015 with IASI and
TCCON. J Mol Spectrosc 2016;327:180–92. doi: 10.1016/j.jms.2016.04.004 . [49] Jacquinet-Husson N, Armante R, Scott NA, Chédin A, Crépeau L, Boutam-
mine C, et al. The 2015 edition of the GEISA spectroscopic database. J Mol
Spectrosc 2016;327:31–72. doi: 10.1016/j.jms.2016.06.007 . [50] Jacquemart D, Gamache R, Rothman LS. Semi-empirical calculation of air-
broadened half-widths and air pressure-induced frequency shifts of water- vapor absorption lines. J Quant Spectrosc Radiat Transf 2005;96:205–39.
doi: 10.1016/j.jqsrt.2004.11.018 . [51] Birk M, Wagner G. Temperature-dependent air broadening of water in the
1250–1750 cm
−1 range. J Quant Spectrosc Radiat Transf 2012;113:889–928.
doi: 10.1016/j.jqsrt.2011.12.013 . [52] Malathy Devi V, Rinsland CP, Benner DC, Smith MAH. Tunable diode laser
measurements of air- and N 2 -broadened halfwidths in the ν2 band of D 2 O. Appl Opt 1986;25:336. doi: 10.1364/AO.25.0 0 0336 .
[53] Rinsland CP, Smith MAH, Devi VM, Benner DC. Measurements of Lorentz- broadening coefficients and pressure-induced line-shift coefficients in the ν1
band of HD 16 O and the ν3 band of D 2 16 O. J Mol Spectrosc 1992;156:507–11.
doi: 10.1016/0022- 2852(92)90251- I .
[54] Rinsland CP, Smith MAH, Malathy Devi V, Benner DC. Measurements of
Lorentz-broadening coefficients and pressure-induced line shift coefficients in the ν2 band of D 2
16 O. J Mol Spectrosc 1991;150:173–83. doi: 10.1016/
0 022-2852(91)9020 0-T . [55] Toth RA. Air- and N2-Broadening Parameters of HDO and D 2 O, 709 to
1936 cm
−1 . J Mol Spectrosc 1999;198:358–70. doi: 10.1006/jmsp.1999.7966 . [56] Gamache RR, Fischer J. Half-widths of H 2
16 O, H 2 18 O, H 2
17 O, HD 16 O, and
D 2 16 O: I. Comparison between isotopomers. J Quant Spectrosc Radiat Transf
2003;78:289–304. doi: 10.1016/S0022- 4073(02)00217- 0 . [57] Gamache RR, Farese M, Renaud CL. A spectral line list for water isotopologues
in the 1100–4100 cm
−1 region for application to CO 2 -rich planetary atmo- spheres. J Mol Spectrosc 2016;326:144–50. doi: 10.1016/j.jms.2015.09.001 .
[58] Brown LR, Humphrey CM, Gamache RR. CO 2 -broadened water in the pure rotation and ν2 fundamental regions. J Mol Spectrosc 2007;246:1–21. doi: 10.
1016/j.jms.2007.07.010 .
[59] Lampel J, Pöhler D, Polyansky OL, Kyuberis AA, Zobov NF, Tennyson J, et al. Detection of water vapour absorption around 363 nm in measured atmo-
spheric absorption spectra and its effect on DOAS evaluations. Atmos Chem
Phys 2017;17:1271–95. doi: 10.5194/acp-17-1271-2017 .
[60] Dupré P, Gherman T, Zobov NF, Tolchenov RN, Tennyson J. Continuous-wave cavity ringdown spectroscopy of the 8 ν polyad of water in the 25195 −25340
cm
−1 range. J Chem Phys 2005;123:154307. doi: 10.1063/1.2055247 .
[61] Grechko M, Maksyutenko P, Zobov NF, Shirin SV, Polyansky OL, Rizzo TR, et al. Collisionally Assisted Spectroscopy of Water from 27 0 0 0 to 34 0 0 0 cm
−1 . J
Phys Chem A 2008;112:10539–45. doi: 10.1021/jp805849q . [62] Maksyutenko P, Muenter JS, Zobov NF, Shirin SV, Polyansky OL, Rizzo TR,
et al. Approaching the full set of energy levels of water. J Chem Phys 2007;126:241101. doi: 10.1063/1.2748751 .
[63] Zoogman P, Liu X, Suleiman RM, Pennington WF, Flittner DE, Al-Saadi JA,
et al. Tropospheric emissions: Monitoring of pollution (TEMPO). J Quant Spec- trosc Radiat Transf 2017;186:17–39. doi: 10.1016/j.jqsrt.2016.05.008 .
[64] Crisp D, Atlas R, Breon F-M, Brown L, Burrows J, Ciais P, et al. The Orbiting Carbon Observatory (OCO) mission. Adv Sp Res 20 04;34:70 0–9. doi: 10.1016/
j.asr.2003.08.062 .
Please cite this article as: I.E. Gordon et al., The HITRAN2016 molecular spectroscopic database, Journal of Quantitative Spectroscopy &
Radiative Transfer (2017), http://dx.doi.org/10.1016/j.jqsrt.2017.06.038

I.E. Gordon et al. / Journal of Quantitative Spectroscopy & Radiative Transfer 0 0 0 (2017) 1–66 55
ARTICLE IN PRESS
JID: JQSRT [m5G; August 21, 2017;14:18 ]
[65] Connor B, Bösch H, McDuffie J, Taylor T, Fu D, Frankenberg C, et al. Quan- tification of uncertainties in OCO-2 measurements of XCO 2 : simulations
and linear error analysis. Atmos Meas Tech 2016;9:5227–38. doi: 10.5194/ amt- 9- 5227- 2016 .
[66] Wunch D, Wennberg PO, Osterman G, Fisher B, Naylor B, Roehl CM, et al. Comparisons of the Orbiting Carbon Observatory-2 (OCO-2) XCO 2 mea-
surements with TCCON. Atmos Meas Tech Discuss 2016:1–45. doi: 10.5194/ amt- 2016- 227 .
[67] Butz A, Guerlet S, Hasekamp O, Schepers D, Galli A, Aben I, et al. To-
ward accurate CO 2 and CH 4 observations from GOSAT. Geophys Res Lett 2011;38:L14812. doi: 10.1029/2011GL047888 .
[68] Ravi Kumar K, Valsala V, Tiwari YK, Revadekar JV, Pillai P, Chakraborty S, et al. Intra-seasonal variability of atmospheric CO 2 concentrations over In-
dia during summer monsoons. Atmos Environ 2016;142:229–37. doi: 10.1016/ j.atmosenv.2016.07.023 .
[69] Abshire JB, Riris H, Allan GR, Weaver CJ, Mao J, Sun X, et al. In: Singh UN,
Pappalardo G, editors. A lidar approach to measure CO 2 concentrations from
space for the ASCENDS mission; 2010 . 78320D. doi: 10.1117/12.868567 .
[70] Hase F. Improved instrumental line shape monitoring for the ground-based, high-resolution FTIR spectrometers of the network for the detection of atmo-
spheric composition change. Atmos Meas Tech 2012;5:603–10. doi: 10.5194/ amt- 5- 603- 2012 .
[71] Emmert JT, Stevens MH, Bernath PF, Drob DP, Boone CD. Observations of in-
creasing carbon dioxide concentration in Earth’s thermosphere. Nat Geosci 2012;5:868–71. doi: 10.1038/ngeo1626 .
[72] Wunch D, Wennberg PO, Toon GC, Connor BJ, Fisher B, Osterman GB, et al. A method for evaluating bias in global measurements of CO 2 to-
tal columns from space. Atmos Chem Phys 2011;11:12317–37. doi: 10.5194/ acp- 11- 12317-2011 .
[73] Miller CE, Crisp D, DeCola PL, Olsen SC, Randerson JT, Michalak AM,
et al. Precision requirements for space-based X-CO 2 data. J Geophys Res 2007;112:D10314. doi: 10.1029/20 06JD0 07659 .
[74] Giusfredi G, Bartalini S, Borri S, Cancio P, Galli I, Mazzotti D, et al. Saturated- absorption cavity ring-down spectroscopy. Phys Rev Lett 2010;104:110801.
doi: 10.1103/PhysRevLett.104.110801 . [75] Galli I, Bartalini S, Borri S, Cancio P, Mazzotti D, De Natale P, et al.
Molecular Gas Sensing Below Parts Per Trillion: Radiocarbon-Dioxide Optical
Detection. Phys Rev Lett 2011;107:270802. doi: 10.1103/PhysRevLett.107. 270802 .
[76] McCartt AD, Ognibene T, Bench G, Turteltaub K. Measurements of carbon-14 with cavity ring-down spectroscopy. Nucl Instrum Methods Phys Res Sect B
Beam Interact with Mater Atoms 2015;361:277–80. doi: 10.1016/j.nimb.2015. 05.036 .
[77] Shved GM. On the abundances of carbon dioxide isotopologues in the at-
mospheres of mars and earth. Sol Syst Res 2016;50:161–4. doi: 10.1134/ S0 038094616020 064 .
[78] Perevalov VI, Tashkun SA. CDSD-296 (Carbon Dioxide Spectroscopic Data- bank): Updated and Enlarged Version for Atmospheric Applications. 2008.
doi: 10.5281/zenodo.17520 . [79] Huang X, Gamache RR, Freedman RS, Schwenke DW, Lee TJ. Reliable in-
frared line lists for 13 CO 2 isotopologues up to E ′ = 18,0 0 0 cm −1 and 1500 K, with line shape parameters. J Quant Spectrosc Radiat Transf 2014;147:134–44.
doi: 10.1016/j.jqsrt.2014.05.015 .
[80] Vasilchenko S, Konefal M, Mondelain D, Kassi S, Cermák P, Tashkun SA, et al. The CO 2 absorption spectrum in the 2.3 μm transparency window by
high sensitivity CRDS: (I) Rovibrational lines. J Quant Spectrosc Radiat Transf 2016;184:233–40. doi: 10.1016/j.jqsrt.2016.07.002 .
[81] Karlovets EV, Perevalov VI. The influence of isotopic substitution on the effec- tive dipole moment parameters of CO 2 molecule. Opt Spectrosc 2015;119:16–
21. doi: 10.1134/S0 03040 0X15070139 .
[82] Zak E, Tennyson J, Polyansky OL, Lodi L, Zobov NF, Tashkun SA, et al. A room
temperature CO 2 line list with ab initio computed intensities. J Quant Spec-
trosc Radiat Transf 2016;177:31–42. doi: 10.1016/j.jqsrt.2015.12.022 . [83] Zak EJ, Tennyson J, Polyansky OL, Lodi L, Zobov NF, Tashkun SA, et al.
Room temperature line lists for CO 2 symmetric isotopologues with ab ini- tio computed intensities. J Quant Spectrosc Radiat Transf 2017;189:267–80.
doi: 10.1016/j.jqsrt.2016.11.022 .
[84] Devi VM, Benner DC, Sung K, Brown LR, Crawford TJ, Miller CE, et al. Line parameters including temperature dependences of self- and air-broadened
line shapes of 12 C 16 O 2 : 1.6-μm region. J Quant Spectrosc Radiat Transf 2016;177:117–44. doi: 10.1016/j.jqsrt.2015.12.020 .
[85] Polyansky OL, Bielska K, Ghysels M, Lodi L, Zobov NF, Hodges JT, et al. High- Accuracy CO 2 Line Intensities Determined from Theory and Experiment. Phys
Rev Lett 2015;114:243001. doi: 10.1103/PhysRevLett.114.243001 .
[86] Benner DC, Devi VM, Sung K, Brown LR, Miller CE, Payne VH, et al. Line parameters including temperature dependences of air- and self-broadened
line shapes of 12 C 16 O 2 : 2.06-μm region. J Mol Spectrosc 2016;326:21–47. doi: 10.1016/j.jms.2016.02.012 .
[87] Jacquemart D, Gueye F, Lyulin OM, Karlovets EV, Baron D, Perevalov VI. Infrared spectroscopy of CO 2 isotopologues from 2200 to 70 0 0 cm
−1 : I—
Characterizing experimental uncertainties of positions and intensities. J
Quant Spectrosc Radiat Transf 2012;113:961–75. doi: 10.1016/j.jqsrt.2012.02. 020 .
[88] Toth RA, Miller CE, Brown LR, Devi VM, Benner DC. Line strengths of 16 O 13 C 16 O, 16 O 13 C 18 O, 16 O 13 C 17 O and 18 O 13 C 18 O between 2200 and 6800 cm
−1 .
J Mol Spectrosc 2008;251:64–89. doi: 10.1016/j.jms.2008.01.009 .
[89] Toth RA, Miller CE, Brown LR, Devi VM, Benner DC. Line positions and strengths of 16 O 12 C 18 O, 18 O 12 C 18 O and 17 O 12 C 18 O between 2200
and 70 0 0 cm
−1 . J Mol Spectrosc 20 07;243:43–61. doi: 10.1016/j.jms.2007.03. 005 .
[90] Toth RA, Brown LR, Miller CE, Malathy Devi V, Benner DC. Spectroscopic database of CO 2 line parameters: 430 0–70 0 0 cm
−1 . J Quant Spectrosc Radiat
Transf 2008;109:906–21. doi: 10.1016/j.jqsrt.20 07.12.0 04 . [91] Zak EJ, Tennyson J, Polyansky OL, Lodi L, Zobov NF, Tashkun SA, et al. Room
temperature linelists for CO 2 asymmetric isotopologues with ab initio com-
puted intensities. J Quant Spectrosc Radiat Transf 2017. doi: 10.1016/j.jqsrt. 2017.01.037 .
[92] Tashkun SA, Perevalov VI, Gamache RR, Lamouroux J. CDSD-296, high reso- lution carbon dioxide spectroscopic databank: version for atmospheric appli-
cations. J Quant Spectrosc Radiat Transf 2015;152:45–73. doi: 10.1016/j.jqsrt. 2014.10.017 .
[93] Schwenke DW, Tashkun SA, Lee TJ. An isotopic-independent highly accurate
potential energy surface for CO 2 isotopologues and an initial 12 C 16 O 2 infrared line list. J Chem Phys 2012;136:124311. doi: 10.1063/1.3697540 .
[94] Huang X, Freedman RS, Tashkun SA, Schwenke DW, Lee TJ. Semi-empirical 12 C 16 O 2 IR line lists for simulations up to 1500 K and 20,000 cm
−1 . J Quant
Spectrosc Radiat Transf 2013;130:134–46. doi: 10.1016/j.jqsrt.2013.05.018 . [95] Lyulin OM, Karlovets EV, Jacquemart D, Lu Y, Liu AW, Perevalov VI. Infrared
spectroscopy of 17 O- and 18 O-enriched carbon dioxide in the 170 0–830 0 cm
−1
wavenumber region. J Quant Spectrosc Radiat Transf 2012;113:2167–81. doi: 10.1016/j.jqsrt.2012.06.028 .
[96] Karlovets EV, Campargue A, Mondelain D, Béguier S, Kassi S, Tashkun SA, et al. High sensitivity cavity ring down spectroscopy of 18 O enriched carbon
dioxide between 5850 and 70 0 0 cm
−1 : I. Analysis and theoretical modeling of the 16 O 12 C 18 O spectrum. J Quant Spectrosc Radiat Transf 2013;130:116–33.
doi: 10.1016/j.jqsrt.2013.05.019 .
[97] Karlovets EV, Campargue A , Mondelain D, Kassi S, Tashkun SA , Perevalov VI. High sensitivity cavity ring down spectroscopy of 18 O enriched carbon diox-
ide between 5850 and 70 0 0 cm
−1 : Part II—analysis and theoretical model- ing of the 12 C 18 O 2 ,
13 C 18 O 2 . J Quant Spectrosc Radiat Transf 2014;136:71–88.
doi: 10.1016/j.jqsrt.2013.11.005 . [98] Campargue A, Song KF, Mouton N, Perevalov VI, Kassi S. High sensitivity CW-
cavity ring down spectroscopy of five 13 CO 2 isotopologues of carbon dioxide
in the 1.26–1.44 μm region (I): line positions. J Quant Spectrosc Radiat Transf 2010;111:659–74. doi: 10.1016/j.jqsrt.2009.11.013 .
[99] Durry G, Li JS, Vinogradov I, Titov A, Joly L, Cousin J, et al. Near infrared diode laser spectroscopy of C 2 H 2 , H 2 O, CO 2 and their isotopologues and the
application to TDLAS, a tunable diode laser spectrometer for the martian PHOBOS-GRUNT space mission. Appl Phys B 2010;99:339–51. doi: 10.1007/
s00340- 010- 3924- y .
[100] Toth RA, Brown LR, Miller CE, Devi VM, Benner DC. Line strengths of 12 C 16 O 2 : 4550–70 0 0 cm
−1 . J Mol Spectrosc 2006;239:221–42. doi: 10.1016/j.jms.2006.
08.001 . [101] Miller CE, Brown LR, Toth RA, Benner DC, Malathy Devi V. Near-Infrared Car-
bon Dioxide Spectral Database, The 10th HITRAN Database Conference Cam- brifge, MA, June 2008. http://dx.doi.org/10.5281/zenodo.16555 .
[102] Wübbeler G, Víquez GJP, Jousten K, Werhahn O, Elster C. Comparison and assessment of procedures for calculating the R(12) line strength of the
ν1 + 2 ν2 + ν3 band of CO 2 . J Chem Phys 2011;135:204304. doi: 10.1063/
1.3662134 . [103] Odintsova TA, Fasci E, Moretti L, Zak EJ, Polyansky OL, Tennyson J, et al.
Highly accurate intensity factors of pure CO 2 lines near 2 μm. J Chem Phys 2017;146:244309. doi: 10.1063/1.4989925 .
[104] Hodges J.T. in preparation. 2017. [105] Petrova TM, Solodov AM, Solodov AA, Lyulin OM, Tashkun SA, Perevalov VI.
Measurements of 12 CO 2 line parameters in the 8790–8860, 9340–9650 and
11,430–11,505 cm
−1 wavenumber regions by means of Fourier transform
spectroscopy. J Quant Spectrosc Radiat Transf 2013;124:21–7. doi: 10.1016/j.
jqsrt.2013.03.017 . [106] Petrova TM, Solodov AM, Solodov AA, Lyulin OM, Borkov YG, Tashkun SA,
et al. Measurements of CO 2 line parameters in the 9250–9500 cm
−1 and 10,700–10,860 cm
−1 regions. J Quant Spectrosc Radiat Transf 2015;164:109–
16. doi: 10.1016/j.jqsrt.2015.06.001 .
[107] Tan Y, Zhao X-Q, Liu A-W, Hu S-M, Lyulin OM, Tashkun SA, et al. Cavity ring- down spectroscopy of CO 2 overtone bands near 830 nm. J Quant Spectrosc
Radiat Transf 2015;165:22–7. doi: 10.1016/j.jqsrt.2015.06.010 . [108] Solodov AM, Petrova TM, Solodov AA, Borkov YG, Tashkun SA, Perevalov VI.
Measurements of the CO 2 line parameters in the 10 0 0 0-1030 0 cm
−1 region. J Quant Spectrosc Radiat Transf 2017 this issue. http://doi.org/10.1016/j.jqsrt.
2017.04.012 .
[109] Majcherova Z, Macko P, Romanini D, Perevalov VI, Tashkun SA, Teffo J-L, et al. High-sensitivity CW-cavity ringdown spectroscopy of 12 CO 2 near 1.5 μm. J
Mol Spectrosc 2005;230:1–21. doi: 10.1016/j.jms.2004.09.011 . [110] Karlovets EV, Campargue A , Mondelain D, Kassi S, Tashkun SA , Perevalov VI.
High sensitivity cavity ring down spectroscopy of 18 O enriched carbon diox- ide between 5850 and 70 0 0 cm
-1 : Part III–Analysis and theoretical modeling
of the 12 C 17 O 2 , 16 O 12 C 17 O. J Quant Spectrosc Radiat Transf 2014;136:89–107.
doi: 10.1016/j.jqsrt.2013.11.006 . [111] Kassi S, Karlovets EV, Tashkun SA, Perevalov VI, Campargue A. Analysis and
theoretical modeling of the 18 O enriched carbon dioxide spectrum by CRDS near 1.35μm: (I) 16 O 12 C 18 O, 16 O 12 C 17 O, 12 C 16 O 2 and 13 C 16 O 2 . J Quant Spectrosc
Radiat Transf 2017;187:414–25. doi: 10.1016/j.jqsrt.2016.09.002 .
Please cite this article as: I.E. Gordon et al., The HITRAN2016 molecular spectroscopic database, Journal of Quantitative Spectroscopy &
Radiative Transfer (2017), http://dx.doi.org/10.1016/j.jqsrt.2017.06.038
56 I.E. Gordon et al. / Journal of Quantitative Spectroscopy & Radiative Transfer 0 0 0 (2017) 1–66
ARTICLE IN PRESS
JID: JQSRT [m5G; August 21, 2017;14:18 ]
[112] Laraia AL, Gamache RR, Lamouroux J, Gordon IE, Rothman LS. Total internal partition sums to support planetary remote sensing. Icarus 2011;215:391–
400. doi: 10.1016/j.icarus.2011.06.004 . [113] Oyafuso F, Payne VH, Drouin BJ, Devi VM, Benner DC, Sung K, et al. High
accuracy absorption coefficients for the Orbiting Carbon Observatory-2 (OCO- 2) mission: Validation of updated carbon dioxide cross-sections using atmo-
spheric spectra. J Quant Spectrosc Radiat Transf 2017 submitted:this issue. doi: 10.1016/j.jqsrt.2017.06.012 .
[114] Gamache RR, Lamouroux J. Predicting accurate line shape parameters for CO 2 transitions. J Quant Spectrosc Radiat Transf 2013;130:158–71. doi: 10.1016/j. jqsrt.2013.05.021 .
[115] Lamouroux J, Gamache RR, Laraia AL, Hartmann J-M, Boulet C. Semi- classical calculations of half-widths and line shifts for transitions in the
30 012 ← 0 0 0 01 and 30 013 ← 0 0 0 01 bands of CO 2 . III: Self collisions. J Quant Spectrosc Radiat Transf 2012;113:1536–46. doi: 10.1016/j.jqsrt.2012.03.035 .
[116] Lamouroux J, Gamache RR, Laraia AL, Hartmann J-M, Boulet C. Semi-
classical calculations of half-widths and line shifts for transitions in the 30 012 ← 0 0 0 01 and 30 013 ← 0 0 0 01 bands of CO 2 II: Collisions with O 2 and air.
J Quant Spectrosc Radiat Transf 2012;113:991–1003. doi: 10.1016/j.jqsrt.2012. 02.015 .
[117] Lamouroux J, Régalia L, Thomas X, Vander Auwera J, Gamache RR, Hart- mann JM. CO 2 line-mixing database and software update and its tests in the
2.1 μm and 4.3 μm regions. J Quant Spectrosc Radiat Transf 2015;151:88–96.
doi: 10.1016/j.jqsrt.2014.09.017 . [118] Hedelt P, von Paris P, Godolt M, Gebauer S, Grenfell JL, Rauer H, et al.
Spectral features of earth-like planets and their detectability at different or- bital distances around F, G, and K-type stars. Astron Astrophys 2013;9:15.
doi: 10.1051/0 0 04-6361/201117723 . [119] Babikov YL, Mikhailenko SN, Barbe A, Tyuterev VG. S&MPO-An information
system for ozone spectroscopy on the WEB. J Quant Spectrosc Radiat Transf
2014;145:169–96. doi: 10.1016/j.jqsrt.2014.04.024 . [120] Barbe A, Mikhailenko S, Starikova E, De Backer M-R, Tyuterev VG, Mon-
delain D, et al. Ozone spectroscopy in the electronic ground state: High- resolution spectra analyses and update of line parameters since 2003. J Quant
Spectrosc Radiat Transf 2013;130:172–90. doi: 10.1016/j.jqsrt.2013.06.007 . [121] Mikhailenko SN . Studies of ozone absorption spectra between 20 0 0 and 2015.
Atmos Ocean Opt 2015;28:587–606 .
[122] Rixon G., Dubernet M.L., Piskunov N., Walton N., Mason N., Le Sidaner P., et al. VAMDC—The Virtual Atomic and Molecular Data Centre—A New Way to
Disseminate Atomic and Molecular Data—VAMDC Level 1 Release, 2011, p. 107–15. doi:10.1063/1.3585810.
[123] Dubernet ML, Antony BK, Ba YA, Babikov YL, Bartschat K, Boudon V, et al. The virtual atomic and molecular data centre (VAMDC) consortium. J Phys B
At Mol Opt Phys 2016;49:74003. doi: 10.1088/0953-4075/49/7/074003 .
[124] Picquet-Varrault B, Orphal J, Doussin J-F, Carlier P, Flaud J-M. Laboratory intercomparison of the ozone absorption coefficients in the mid-infrared
(10 μm) and ultraviolet (300 −350 nm) spectral regions. J Phys Chem A 2005;109:1008–14. doi: 10.1021/jp0405411 .
[125] Janssen C, Boursier C, Jeseck P, Té Y. Line parameter study of ozone at 5 and 10 μm using atmospheric FTIR spectra from the ground: A spectroscopic
database and wavelength region comparison. J Mol Spectrosc 2016;326:48–59. doi: 10.1016/j.jms.2016.04.003 .
[126] Flaud J-M , Camy-Peyret C , Rinsland CP , Smith MAH , Malathy Devi V . Atlas
of ozone line parameters from microwave to medium infrared. New York: Academic Press; 1990 .
[127] Barbe A, Plateaux JJ, Bouazza S, Sulakshina O, Mikhailenko S, Tyuterev V, et al. Experimental and theoretical study of absolute intensities of ozone
spectral lines in the range 1850–2300 cm
−1 . J Quant Spectrosc Radiat Transf 1994;52:341–55. doi: 10.1016/0022-4073(94)90164-3 .
[128] Tyuterev VG , Barbe A , Mikhailenko SN , Tashkun SA . Ozone 5 μm range revis-
ited: accurate laboratory measurements and ab initio calculations. 13th HI- TRAN Database Conf.; 2014 .
[129] Goldman A, Barbe A, Tyuterev VG, De Backer-Barilly M-R, Hannigan JW, Cof- fey MT, et al. Identification of enhanced absorption by 16 O 3 lines around
5 μm in high-resolution FTIR solar spectra. J Quant Spectrosc Radiat Transf 2005;96:241–50. doi: 10.1016/j.jqsrt.2004.10.009 .
[130] Wagner G, Birk M, Schreier F, Flaud JM. Spectroscopic database for ozone
in the fundamental spectral regions. J Geophys Res Atmos 2002;107:1–18. doi: 10.1029/20 01JD0 0 0818 .
[131] Flaud J-M , Piccolo C , Carli B , Perrin A , Coudert LH , Teffo JL , et al. Molecular line parameters for the MIPAS (Michelson Interferometer for Passive Atmo-
spheric Sounding) experiment. Atmos Ocean Opt 2003;16:172–82 . [132] Barbe A, Sulakshina O, Plateaux JJ, Hamdouni A, Bouazza S. High-resolution
infrared spectra of ozone in the 230 0-260 0 cm
−1 Region. J Mol Spectrosc
1995;170:244–50. doi: 10.1006/jmsp.1995.1068 . [133] Tyuterev VG, Kochanov R V, Tashkun SA. Accurate ab initio dipole moment
surfaces of ozone: first principle intensity predictions for rotationally re- solved spectra in a large range of overtone and combination bands. J Chem
Phys 2017;146:64304. doi: 10.1063/1.4973977 . [134] Tyuterev VG, Kochanov R V, Tashkun SA, Holka F, Szalay PG. New analyt-
ical model for the ozone electronic ground state potential surface and ac-
curate ab initio vibrational predictions at high energy range. J Chem Phys 2013;139:134307. doi: 10.1063/1.4821638 .
[135] Bouazza S, Mikhailenko S, Barbe A, Regalia L, Tyuterev VG, Plateaux JJ. The ν1 + ν2 + 2 ν3 and ν2 + 3 ν3 Bands of 16 O 3 . J Mol Spectrosc 1995;174:510–19.
doi: 10.10 06/jmsp.1995.0 019 .
[136] Barbe A, Sulakshina O, Plateaux JJ, Tyuterev VG, Bouazza S. Line Positions and Intensities of the 3 ν1 + ν3 Band of Ozone. J Mol Spectrosc 1996;175:296–302.
doi: 10.10 06/jmsp.1996.0 035 . [137] Barbe A, Mikhailenko S, Tyuterev V, Hamdouni A, Plateaux JJ. Analysis of the
2 ν1 + 2 ν2 + ν3 Band of Ozone. J Mol Spectrosc 1995;171:583–8. doi: 10.1006/ jmsp.1995.1147 .
[138] Barbe A., Mikhailenko S.N. Unpublished results. 2017. [139] Flaud J-M, Barbe A, Camy-Peyret C, Plateaux JJ. High resolution analysis of the
5 ν3 , 3 ν1 + ν2 + ν3 , and ν1 + 4 ν3 bands of 16 O 3 : line positions and intensities. J
Mol Spectrosc 1996;177:34–9. doi: 10.1006/jmsp.1996.0114 . [140] Birk M, Wagner G, Flaud JM, Hausamann D. Line strengths in the ν3 −ν2
hot band of ozone. J Mol Spectrosc 1994;163:262–75. doi: 10.1006/jmsp.1994. 1022 .
[141] Flaud JM, Wagner G, Birk M, Camy-Peyret C, Claveau C, De Backer-Barilly MR, et al. Ozone absorption around 10 μm. J Geophys Res Atmos 2003;108:4269.
doi: 10.1029/20 02JD0 02755 .
[142] Mikhailenko S, Barbe A, Tyuterev V. Extended analysis of line positions and intensities of ozone bands in the 290 0–340 0 cm
−1 region. J Mol Spectrosc
2002;215:29–41. doi: 10.1006/jmsp.2002.8597 . [143] Barbe A, De Backer M-R, Starikova E, Tashkun SA, Thomas X, Tyuterev VG. FTS
high resolution spectra of 16 O 3 in 3500 and 5500 cm
−1 regions. First example of new theoretical modelling for a polyad of strongly coupled states. J Quant
Spectrosc Radiat Transf 2012;113:829–39. doi: 10.1016/j.jqsrt.2012.02.034 .
[144] Mikhailenko S, Barbe A, Tyuterev VG, Regalia L, Plateaux JJ. Line positions and intensities of the ν1 + ν2 + 3 ν3 , ν2 + 4 ν3 , and 3 ν1 + 2 ν2 bands of ozone. J Mol
Spectrosc 1996;180:227–35. doi: 10.1006/jmsp.1996.0246 . [145] Barbe A, Plateaux JJ, Tyuterev VG, Mikhailenko S. Analysis of high resolution
measurements of the 2 ν1 + 3 ν3 band of ozone: coriolis interaction with the ν1 + 3 ν2 + 2 ν3 band. J Quant Spectrosc Radiat Transf 1998;59:185–94. doi: 10.
1016/S0 022-4073(97)0 0117-9 .
[146] Toon G.C. Evaluation of HITRAN 2016 O 3 linelist 2017. http://mark4sun.jpl. nasa.gov/report/o3 _ spectroscopy _ evaluation _ 20170117.pdf .
[147] Toon GC, Blavier J-F, Sung K, Rothman LS, Gordon IE. HITRAN spectroscopy evaluation using solar occultation FTIR spectra. J Quant Spectrosc Radiat
Transf 2016;182:324–36. doi: 10.1016/j.jqsrt.2016.05.021 . [148] Perrin A, Vasserot A-M, Flaud J-M, Camy-Peyret C, Malathy Devi V,
Smith MAH, et al. The 2.5-μm bands of ozone: line positions and intensities.
J Mol Spectrosc 1991;149:519–29. doi: 10.1016/0022- 2852(91)90307- V . [149] Campargue A, Kassi S, Romanini D, Barbe A, De Backer-Barilly M-R,
Tyuterev VG. CW-cavity ring down spectroscopy of the ozone molecule in the 6625–6830 cm
−1 region. J Mol Spectrosc 2006;240:1–13. doi: 10.1016/j.
jms.2006.07.010 . [150] Barbe A, De Backer-Barilly M-R, Tyuterev VG, Kassi S, Campargue A. Detection
and analysis of new bands of 16 O 3 by CRDS between 6500 and 7300 cm
−1 . J
Mol Spectrosc 2011;269:175–86. doi: 10.1016/j.jms.2011.06.005 . [151] Tyuterev VG, Kochanov R, Campargue A, Kassi S, Mondelain D, Barbe A, et al.
Does the “Reef Structure” at the ozone transition state towards the disso- ciation exist? New insight from calculations and ultrasensitive spectroscopy
experiments. Phys Rev Lett 2014;113:143002. doi: 10.1103/PhysRevLett.113. 143002 .
[152] Marcus RA. Theory of mass-independent fractionation of isotopes, phase space accessibility, and a role of isotopic symmetry. Proc Natl Acad Sci
2013;110:17703–7. doi: 10.1073/pnas.1213080110 .
[153] Tashkun SA, Perevalov VI, Karlovets EV, Kassi S, Campargue A. High sensitivity cavity ring down spectroscopy of N 2 O near 1.22μm: (II) 14 N 2
16 O line intensity
modeling and global fit of 14 N 2 18 O line positions. J Quant Spectrosc Radiat
Transf 2016;176:62–9. doi: 10.1016/j.jqsrt.2016.02.020 .
[154] Tashkun SA, Perevalov VI, Liu A-W, Hu S-M. Global modeling of the 15 N 2 16 O
line positions within the framework of the polyad model of effective Hamil-
tonian and a room temperature 15 N 2 16 O line list. J Quant Spectrosc Radiat
Transf 2016;175:1–7. doi: 10.1016/j.jqsrt.2016.01.038 . [155] Perevalov VI, Tashkun SA, Kochanov RV, Liu A-W, Campargue A. Global mod-
eling of the 14 N 2 16 O line positions within the framework of the polyad model
of effective Hamiltonian. J Quant Spectrosc Radiat Transf 2012;113:1004–12.
doi: 10.1016/j.jqsrt.2011.12.008 . [156] Karlovets EV , Perevalov VI . Calculation of the carbon dioxide effective dipole
moment parameters of the qJ and q 2 J types for rare isotopologues. Opt Atmos
I Okeana (in Russ) 2011;24:101–6 . [157] Tashkun SA, Perevalov VI, Lavrentieva NN. NOSD-10 0 0, the high-temperature
nitrous oxide spectroscopic databank. J Quant Spectrosc Radiat Transf 2016;177:43–8. doi: 10.1016/j.jqsrt.2015.11.014 .
[158] Ding Y, Perevalov VI, Tashkun SA, Teffo J-L, Hu S, Bertseva E, et al. Weak overtone transitions of N 2 O around 1.05 μm by ICLAS-VECSEL. J Mol Spectrosc
2003;220:80–6. doi: 10.1016/S0022- 2852(03)00060- 2 .
[159] Liu AW, Kassi S, Malara P, Romanini D, Perevalov VI, Tashkun SA, et al. High sensitivity CW-cavity ring down spectroscopy of N 2 O near 1.5 μm (I). J Mol
Spectrosc 2007;244:33–47. doi: 10.1016/j.jms.2007.01.007 . [160] Toth R.A. Linelist of N 2 O parameters from 500 to 7500 cm
−1 . n.d. http://
mark4sun.jpl.nasa.gov/n2o.html . [161] Loos J, Birk M, Wagner G. Pressure broadening, -shift, speed dependence and
line mixing in the ν3 rovibrational band of N 2 O. J Quant Spectrosc Radiat
Transf 2015;151:300–9. doi: 10.1016/j.jqsrt.2014.10.008 . [162] Li G, Gordon IE, Rothman LS, Tan Y, Hu S-M, Kassi S, et al. Rovibrational
line lists for nine isotopologues of the CO molecule in the X 1 + ground electronic state. Astrophys J Suppl Ser 2015;216:15. doi: 10.1088/0 067-0 049/
216/1/15 .
Please cite this article as: I.E. Gordon et al., The HITRAN2016 molecular spectroscopic database, Journal of Quantitative Spectroscopy &
Radiative Transfer (2017), http://dx.doi.org/10.1016/j.jqsrt.2017.06.038

I.E. Gordon et al. / Journal of Quantitative Spectroscopy & Radiative Transfer 0 0 0 (2017) 1–66 57
ARTICLE IN PRESS
JID: JQSRT [m5G; August 21, 2017;14:18 ]
[163] Li G, Gordon IE, Bernath PF, Rothman LS. Direct fit of experimental ro- vibrational intensities to the dipole moment function: Application to HCl. J
Quant Spectrosc Radiat Transf 2011;112:1543–50. doi: 10.1016/j.jqsrt.2011.03. 014 .
[164] Coxon JA, Hajigeorgiou PG. Direct potential fit analysis of the X 1 + ground state of CO. J Chem Phys 2004;121:2992–3008. doi: 10.1063/1.1768167 .
[165] Le Roy RJ.. LEVEL: A computer program for solving the radial Schrödinger equation for bound and quasibound levels. J Quant Spectrosc Radiat Transf
2017;186:167–78. doi: 10.1016/j.jqsrt.2016.05.028 .
[166] Malathy Devi V, Chris Benner D, Smith MAH, Mantz AW, Sung K, Brown LR, et al. Spectral line parameters including temperature dependences of self-
and air-broadening in the 2 ← 0 band of CO at 2.3 μm. J Quant Spectrosc Ra- diat Transf 2012;113:1013–33. doi: 10.1016/j.jqsrt.2012.02.010 .
[167] Hartmann J-M, Boulet C. Line shape parameters for HF in a bath of argon as a test of classical path models. J Chem Phys 20 0 0;113:90 0 0. doi: 10.1063/1.
1319346 .
[168] Pollock CR, Petersen FR, Jennings DA, Wells JS, Maki AG. Absolute frequency measurements of the 2-0 band of CO at 2.3 μm; Calibration standard frequen-
cies from high resolution color center laser spectroscopy. J Mol Spectrosc 1983;99:357–68. doi: 10.1016/0022- 2852(83)90320- X .
[169] Mondelain D, Sala T, Kassi S, Romanini D, Marangoni M, Campargue A. Broad- band and highly sensitive comb-assisted cavity ring down spectroscopy of
CO near 1.57 μm with sub-MHz frequency accuracy. J Quant Spectrosc Radiat
Transf 2015;154:35–43. doi: 10.1016/j.jqsrt.2014.11.021 . [170] Cygan A, Wójtewicz S, Kowzan G, Zaborowski M, Wcisło P, Nawrocki J,
et al. Absolute molecular transition frequencies measured by three cavity- enhanced spectroscopy techniques. J Chem Phys 2016;144:0–11. doi: 10.1063/
1.4952651 . [171] Tan Y, Wang J, Zhao X-Q, Liu A-W, Hu S-M. Cavity ring-down spectroscopy
of the fifth overtone of CO. J Quant Spectrosc Radiat Transf 2017;187:274–9.
doi: 10.1016/j.jqsrt.2016.10.003 . [172] Malathy Devi V, Chris Benner D, Smith MAH, Mantz AW, Sung K,
Brown LR. Spectral line parameters including temperature dependences of air-broadening for the 2 ← 0 bands of 13 C 16 O and 12 C 18 O at 2.3 μm. J Mol Spec-
trosc 2012;276–277:33–48. doi: 10.1016/j.jms.2012.05.005 . [173] Sinclair PM, Duggan P, Berman R, Drummond JR, May AD. Line broadening in
the fundamental band of CO in CO–He and CO–Ar mixtures. J Mol Spectrosc
1998;191:258–64. doi: 10.1006/jmsp.1998.7628 . [174] Picard-Bersellini A, Charneau R, Brechignac P. Pressure broadening of CO in-
frared lines perturbed by H 2 and He. J Chem Phys 1983;78:5900. doi: 10.1063/ 1.4 4 4594 .
[175] Luo C, Wehr R, Drummond JR, May AD, Thibault F, Boissoles J, et al. Shifting and broadening in the fundamental band of CO highly diluted in He and Ar:
a comparison with theory. J Chem Phys 2001;115:2198–206. doi: 10.1063/1.
1383049 . [176] Brown LR, Sung K, Benner DC, Devi VM, Boudon V, Gabard T, et al. Methane
line parameters in the HITRAN2012 database. J Quant Spectrosc Radiat Transf 2013;130:201–19. doi: 10.1016/j.jqsrt.2013.06.020 .
[177] Kozlov DN, Sadovskii DA, Radi PP. Laser-induced grating spectroscopy of highly excited overtone and combination vibrational states of methane. J Mol
Spectrosc 2013;291:23–32. doi: 10.1016/j.jms.2013.04.005 . [178] Ulenikov ON, Bekhtereva ES, Albert S, Bauerecker S, Niederer HM, Quack M.
Survey of the high resolution infrared spectrum of methane ( 12 CH 4 and 13 CH 4 ): Partial vibrational assignment extended towards 12 0 0 0 cm
−1 . J Chem
Phys 2014;141:234302. doi: 10.1063/1.4899263 .
[179] Devi VM, Benner DC, Sung K, Crawford TJ, Yu S, Brown LR, et al. Self- and air- broadened line shapes in the 2 ν3 P and R branches of 12 CH 4 . J Mol Spectrosc
2015;315:114–36. doi: 10.1016/j.jms.2015.05.003 . [180] Rey M, Nikitin AV, Tyuterev VG. Convergence of normal mode variational cal-
culations of methane spectra: Theoretical linelist in the icosad range com-
puted from potential energy and dipole moment surfaces. J Quant Spectrosc Radiat Transf 2015;164:207–20. doi: 10.1016/j.jqsrt.2015.06.009 .
[181] Delahaye T, Maxwell SE, Reed ZD, Lin H, Hodges JT, Sung K, et al. Pre- cise methane absorption measurements in the 1.64 μm spectral region for
the MERLIN mission. J Geophys Res Atmos 2016;121:7360–70. doi: 10.1002/ 2016JD025024 .
[182] Nikitin AV, Rey M, Tashkun SA, Kassi S, Mondelain D, Campargue A, et al.
Analyses and modeling of the 12 CH 4 spectrum at 80 K between 6539 and 6800 cm
−1 . J Quant Spectrosc Radiat Transf 2016;168:207–16. doi: 10.1016/
j.jqsrt.2015.09.014 . [183] Hashemi R, Predoi-Cross A, Nikitin AV, Tyuterev VG, Sung K, Smith MAH,
et al. Spectroscopic line parameters of 12 CH 4 for atmospheric composition retrievals in the 430 0–450 0 cm
−1 region. J Quant Spectrosc Radiat Transf
2017;186:106–17. doi: 10.1016/j.jqsrt.2016.03.024 .
[184] Hargreaves RJ, Bernath PF, Bailey J, Dulick M. Empirical line lists and absorption cross sections for methane at high temperatures. Astrophys J
2015;813:12. doi: 10.1088/0 0 04-637X/813/1/12 . [185] Amyay B, Louviot M, Pirali O, Georges R, Vander Auwera J, Boudon V. Global
analysis of the high temperature infrared emission spectrum of 12 CH 4 in the dyad ( ν 2 / ν 4 ) region. J Chem Phys 2016;144:24312. doi: 10.1063/1.4939521 .
[186] Ba YA, Wenger C, Surleau R, Boudon V, Rotger M, Daumont L, et al. MeCaSDa
and ECaSDa: methane and ethene calculated spectroscopic databases for the virtual atomic and molecular data centre. J Quant Spectrosc Radiat Transf
2013;130:62–8. doi: 10.1016/j.jqsrt.2013.05.001 . [187] Tyuterev V, Tashkun S, Rey M, Kochanov R, Nikitin A, Delahaye T. Accu-
rate Spectroscopic Models for Methane Polyads Derived from a Potential
Energy Surface Using High-Order Contact Transformations. J Phys Chem A 2013;117:13779–805. doi: 10.1021/jp408116j .
[188] Birk M , Wagner G , Loos J , Wilzewski J , Mondelain D , Campargue A , et al. Methane and water spectroscopic database for TROPOMI/Sentinel-5 Pre-
cursor in the 2.3 μm region EGU-2017, Vienna:; 2017 . [189] Devi VM, Benner DC, Smith MAH, Mantz AW, Sung K, Crawford TJ, et al. Self-
and air-broadened line shape parameters in the ν2 + ν3 band of 12 CH 4 : 4500–4630 cm
−1 . J Quant Spectrosc Radiat Transf 2015;152:149–65. doi: 10.1016/j.
jqsrt.2014.11.011 .
[190] Nikitin AV, Thomas X, Régalia L, Daumont L, Rey M, Tashkun SA, et al. Mea- surements and modeling of long-path 12 CH 4 spectra in the 480 0–530 0 cm
−1
region. J Quant Spectrosc Radiat Transf 2014;138:116–23. doi: 10.1016/j.jqsrt. 2014.02.005 .
[191] Lyulin OM, Nikitin AV, Perevalov VI, Morino I, Yokota T, Kumazawa R, et al. Measurements of N 2 - and O 2 -broadening and shifting parameters of methane
spectral lines in the 5550-6236 cm
−1 region. J Quant Spectrosc Radiat Transf
2009;110:654–68. doi: 10.1016/j.jqsrt.2009.02.012 . [192] Nikitin A.V., Thomas X., Daumont L., Rey M., Sung K., Toon G.C., et al. Mea-
surements and analysis of 12 CH 4 spectra in the 5300-5550 cm
−1 region 2017:in preparation.
[193] Nikitin AV, Lyulin OM, Mikhailenko SN, Perevalov VI, Filippov NN, Grig- oriev IM, et al. GOSAT-2014 methane spectral line list. J Quant Spectrosc Ra-
diat Transf 2015;154:63–71. doi: 10.1016/j.jqsrt.2014.12.003 .
[194] Nikitin AV, Chizhmakova IS, Rey M, Tashkun SA, Kassi S, Mondelain D, et al. Analysis of the absorption spectrum of 12 CH4 in the region 5855-6250 cm
−1
of the 2 ν3 band. J Quant Spectrosc Radiat Transf 2017 this issue. doi: 10.1016/ j.jqsrt.2017.05.014 .
[195] Starikova E, Nikitin AV, Rey M, Tashkun SA, Mondelain D, Kassi S, et al. As- signment and modeling of the absorption spectrum of 13 CH 4 band (5853–
6201 cm
−1 ). J Quant Spectrosc Radiat Transf 2016;177:170–80. doi: 10.1016/j.
jqsrt.2015.12.023 . [196] Béguier S, Kassi S, Campargue A. An empirical line list for methane in the
1.25 μm transparency window. J Mol Spectrosc 2015;308–309:1–5. doi: 10. 1016/j.jms.2014.12.020 .
[197] Béguier S, Liu AW, Campargue A. An empirical line list for methane near 1 μm
(9028–10,435 cm
−1 ). J Quant Spectrosc Radiat Transf 2015;166:6–12. doi: 10.
1016/j.jqsrt.2015.07.003 .
[198] Rothman LS, Gordon IE, Barbe A, Benner DC, Bernath PF, Birk M, et al. The HI- TRAN 2008 molecular spectroscopic database. J Quant Spectrosc Radiat Transf
2009;110:533–72. doi: 10.1016/j.jqsrt.2009.02.013 . [199] Tennyson J, Yurchenko SN, Al-Refaie AF, Barton EJ, Chubb KL, Coles PA,
et al. The ExoMol database: Molecular line lists for exoplanet and other hot atmospheres. J Mol Spectrosc 2016;327:73–94. doi: 10.1016/j.jms.2016.05.
002 .
[200] Rey M, Nikitin A V, Tyuterev VG. First principles intensity calculations of the methane rovibrational spectra in the infrared up to 9300 cm
−1 . Phys Chem
Chem Phys 2013;15:10049. doi: 10.1039/c3cp50275a . [201] Rey M, Nikitin A V, Tyuterev VG. Theoretical hot methane line lists up
to T = 20 0 0 K for astrophysical applications. Astrophys J 2014;789:2. doi: 10. 1088/0 0 04-637X/789/1/2 .
[202] Nikitin AV, Rey M, Tyuterev VG. New dipole moment surfaces of methane. Chem Phys Lett 2013;565:5–11. doi: 10.1016/j.cplett.2013.02.022 .
[203] Nikitin AV, Rey M, Tyuterev VG. Rotational and vibrational energy levels of
methane calculated from a new potential energy surface. Chem Phys Lett 2011;501:179–86. doi: 10.1016/j.cplett.2010.11.008 .
[204] Nikitin AV, Rey M, Tyuterev VG. First fully ab initio potential energy sur- face of methane with a spectroscopic accuracy. J Chem Phys 2016;145:114309.
doi: 10.1063/1.4961973 . [205] Rey M, Nikitin A V, Babikov YL, Tyuterev VG. TheoReTS–An information sys-
tem for theoretical spectra based on variational predictions from molecular
potential energy and dipole moment surfaces. J Mol Spectrosc 2016;327:138–58. doi: 10.1016/j.jms.2016.04.006 .
[206] Bray C, Cuisset A, Hindle F, Mouret G, Bocquet R, Boudon V. Spectral lines of methane measured up to 2.6 THz at sub-MHz accuracy with a CW-THz
photomixing spectrometer: Line positions of rotational transitions induced by centrifugal distortion. J Quant Spectrosc Radiat Transf 2017 This Issue. doi: 10.
1016/j.jqsrt.2017.04.010 .
[207] Daumont L, Nikitin AV, Thomas X, Régalia L, Von der Heyden P, Tyuterev VG, et al. New assignments in the 2 μm transparency window of the 12 CH 4 Octad
band system. J Quant Spectrosc Radiat Transf 2013;116:101–9. doi: 10.1016/j. jqsrt.2012.08.025 .
[208] Hilico J-C, Robert O, Loëte M, Toumi S, Pine AS, Brown LR. Analysis of the in- teracting octad system of 12 CH 4 . J Mol Spectrosc 2001;208:1–13. doi: 10.1006/
jmsp.2001.8364 .
[209] Tyuterev V, Rey M, Delahaye T, Tashkun S, Nikitin A V, Kochanov R. New ap- proach for spectroscopic data reduction using ab initio calculations and ex-
perimental lines: application to methane. 13th Bienn. HITRAN Conf.. Cam- bridge, MA; 2014. doi: 10.5281/zenodo.11210 .
[210] Nikitin AV, Boudon V, Wenger C, Albert S, Brown LR, Bauerecker S, et al. High resolution spectroscopy and the first global analysis of the Tetradecad re-
gion of methane 12 CH 4 . Phys Chem Chem Phys 2013;15:10071. doi: 10.1039/
c3cp50799h . [211] Nikitin AV, Lyulin OM, Mikhailenko SN, Perevalov VI, Filippov NN, Grig-
oriev IM, et al. GOSAT-2009 methane spectral line list in the 5550–6236 cm
−1
range. J Quant Spectrosc Radiat Transf 2010;111:2211–24. doi: 10.1016/j.jqsrt.
2010.05.010 .
Please cite this article as: I.E. Gordon et al., The HITRAN2016 molecular spectroscopic database, Journal of Quantitative Spectroscopy &
Radiative Transfer (2017), http://dx.doi.org/10.1016/j.jqsrt.2017.06.038

58 I.E. Gordon et al. / Journal of Quantitative Spectroscopy & Radiative Transfer 0 0 0 (2017) 1–66
ARTICLE IN PRESS
JID: JQSRT [m5G; August 21, 2017;14:18 ]
[212] Campargue A, Leshchishina O, Wang L, Mondelain D, Kassi S. The WKLMC empirical line lists (5852–7919 cm
−1 ) for methane between 80 K and 296
K: “Final” lists for atmospheric and planetary applications. J Mol Spectrosc 2013;291:16–22. doi: 10.1016/j.jms.2013.03.001 .
[213] Rey M, Nikitin AV, Tyuterev VG. Complete nuclear motion Hamiltonian in the irreducible normal mode tensor operator formalism for the methane
molecule. J Chem Phys 2012;136:244106, . doi: 10.1063/1.4730030 . [214] Nikitin AV, Rey M, Champion JP, Tyuterev VG. Extension of the MIRS com-
puter package for the modeling of molecular spectra: From effective to full
ab initio ro-vibrational Hamiltonians in irreducible tensor form. J Quant Spec- trosc Radiat Transf 2012;113:1034–42. doi: 10.1016/j.jqsrt.2012.01.027 .
[215] Zolot AM, Giorgetta FR, Baumann E, Swann WC, Coddington I, Newbury NR. Broad-band frequency references in the near-infrared: Accurate dual comb
spectroscopy of methane and acetylene. J Quant Spectrosc Radiat Transf 2013;118:26–39. doi: 10.1016/j.jqsrt.2012.11.024 .
[216] Rey M, Nikitin A V, Campargue A, Kassi S, Mondelain D, Tyuterev VG.
Ab initio variational predictions for understanding highly congested spec- tra: rovibrational assignment of 108 new methane sub-bands in the icosad
range (6280–7800 cm
−1 ). Phys Chem Chem Phys 2016;18:176–89. doi: 10. 1039/C5CP05265C .
[217] Nikitin AV, Rey M, Tyuterev VG. Accurate line intensities of methane from
first-principles calculations. J Quant Spectrosc Radiat Transf 2017;200:90–9.
doi: 10.1016/j.jqsrt.2017.05.023 .
[218] Brown LR. Empirical line parameters of methane from 1.1 to 2.1 μm. J Quant Spectrosc Radiat Transf 2005;96:251–70. doi: 10.1016/j.jqsrt.2004.12.037 .
[219] Campargue A, Wang L, Liu AW, Hu SM, Kassi S. Empirical line parameters of methane in the 1.63–1.48 μm transparency window by high sensitivity
Cavity Ring Down Spectroscopy. Chem Phys 2010;373:203–10. doi: 10.1016/j. chemphys.2010.05.011 .
[220] Benner DC, Devi VM, O’Brien JJ, Shaji S, Spickler PT, Houck CP, et al. Empirical
line parameters of CH 4 from 10923 to 11502 cm
−1 2017:in preparation. [221] Kassi S, Gao B, Romanini D, Campargue A. The near-infrared (1.30–1.70 μm)
absorption spectrum of methane down to 77 K. Phys Chem Chem Phys 2008;10:4410. doi: 10.1039/b805947k .
[222] Brown LR, Nikitin AV, Sung K, Rey M, Tashkun SA, Tyuterev VG, et al. Mea- surements and modeling of cold 13 CH 4 spectra in the 3750–4700 cm
−1 re-
gion. J Quant Spectrosc Radiat Transf 2016;174:88–100. doi: 10.1016/j.jqsrt.
2016.01.016 . [223] Campargue A, Segovia JL, Béguier S, Kassi S, Mondelain D. The absorp-
tion spectrum of 13 CH 4 in the region of the 2 ν3 band at 1.66 μm: Empiri- cal line lists and temperature dependence. J Quant Spectrosc Radiat Transf
2015;152:140–8. doi: 10.1016/j.jqsrt.2014.11.012 . [224] Rey M, Nikitin AV, Tyuterev VG. Predictions for methane spectra from po-
tential energy and dipole moment surfaces: Isotopic shifts and comparative
study of 13 CH 4 and 12 CH 4 . J Mol Spectrosc 2013;291:85–97. doi: 10.1016/j.jms. 2013.04.003 .
[225] Campargue A, Béguier S, Zbiri Y, Mondelain D, Kassi S, Karlovets EV, et al. The 13 CH 4 absorption spectrum in the Icosad range (6600–7692 cm
−1 ) at 80 K
and 296 K: Empirical line lists and temperature dependence. J Mol Spectrosc 2016;326:115–21. doi: 10.1016/j.jms.2016.01.005 .
[226] Bray C, Cuisset A, Hindle F, Bocquet R, Mouret G, Drouin BJ. CH 3 D photomix- ing spectroscopy up to 2.5THz: New set of rotational and dipole parame-
ters, first THz self-broadening measurements. J Quant Spectrosc Radiat Transf
2017;189:198–205. doi: 10.1016/j.jqsrt.2016.11.011 . [227] Delahaye T, Landsheere X, Pangui E, Huet F, Hartmann J-M, Tran H. Mea-
surements of H 2 O broadening coefficients of infrared methane lines. J Quant Spectrosc Radiat Transf 2016;173:40–8. doi: 10.1016/j.jqsrt.2015.12.015 .
[228] Fissiaux L, Delière Q, Blanquet G, Robert S, Vandaele AC, Lepère M. CO 2 - broadening coefficients in the ν4 fundamental band of methane at room tem-
perature and application to CO 2 -rich planetary atmospheres. J Mol Spectrosc
2014;297:35–40. doi: 10.1016/j.jms.2014.01.006 . [229] Ghysels M, Gomez L, Cousin J, Tran H, Amarouche N, Engel A, et al. Tem-
perature dependences of air-broadening, air-narrowing and line-mixing co- efficients of the methane ν3 R(6) manifold lines—Application to in-situ
measurements of atmospheric methane. J Quant Spectrosc Radiat Transf 2014;133:206–16. doi: 10.1016/j.jqsrt.2013.08.003 .
[230] Jahjah M, Nguyen L, Moreno MP, Cadoret M, Zondy J-J. Measurements of N 2 -
broadening and pressure-shift coefficients in the ν3 -band of 12 CH 4 using a cw-OPO. J Quant Spectrosc Radiat Transf 2015;151:251–9. doi: 10.1016/j.jqsrt.
2014.10.006 . [231] Kapitanov VA, Ponomarev YN, Protasevich AE, Osipov KY. Lineshape models
testing on CH 4 spectral line 6105.6257 cm
−1 (R9F1, R9F2) of 2 ν3 band broad- ened by N 2 and Ne. J Mol Spectrosc 2013;291:57–60. doi: 10.1016/j.jms.2013.
03.009 .
[232] Devi VM, Benner DC, Sung K, Brown LR, Crawford TJ, Yu S, et al. Spectral line parameters including line shapes in the 2 ν3 Q branch of 12 CH 4 . J Quant
Spectrosc Radiat Transf 2016;177:152–69. doi: 10.1016/j.jqsrt.2015.12.009 . [233] Predoi-Cross A, Malathy Devi V, Sutradhar P, Sinyakova T, Buldyreva J, Sung K,
et al. Temperature dependences of self- and N 2 -broadened line-shape param- eters in the ν3 and ν5 bands of 12 CH 3 D: Measurements and calculations. J
Quant Spectrosc Radiat Transf 2016;177:181–215. doi: 10.1016/j.jqsrt.2016.01.
003 . [234] Tang Y, Yang SL, Lehmann KK. Measurements of CH 3 D line strengths,
foreign pressure-broadening, and pressure-shift coefficients at near-IR re- gion using continuous-wave cavity ring-down spectroscopy. J Mol Spectrosc
2013;291:48–56. doi: 10.1016/j.jms.2013.03.004 .
[235] Mendonca J, Strong K, Sung K, Devi VM, Toon GC, Wunch D, et al. Using high- resolution laboratory and ground-based solar spectra to assess CH 4 absorp-
tion coefficient calculations. J Quant Spectrosc Radiat Transf 2017;190:48–59. doi: 10.1016/j.jqsrt.2016.12.013 .
[236] Hill C, Gordon IE, Rothman LS, Tennyson J. A new relational database struc- ture and online interface for the HITRAN database. J Quant Spectrosc Radiat
Transf 2013;130:51–61. doi: 10.1016/j.jqsrt.2013.04.027 . [237] Tran H, Flaud P-M, Fouchet T, Gabard T, Hartmann J-M. Model, software and
database for line-mixing effects in the ν3 and ν4 bands of CH 4 and tests
using laboratory and planetary measurements—II: H 2 (and He) broadening and the atmospheres of Jupiter and Saturn. J Quant Spectrosc Radiat Transf
2006;101:306–24. doi: 10.1016/j.jqsrt.2005.11.033 . [238] Tran H, Flaud P-M, Gabard T, Hase F, von Clarmann T, Camy-Peyret C, et al.
Model, software and database for line-mixing effects in the ν3 and ν4 bands of CH 4 and tests using laboratory and planetary measurements—I: N 2 (and
air) broadenings and the earth atmosphere. J Quant Spectrosc Radiat Transf
2006;101:284–305. doi: 10.1016/j.jqsrt.2005.11.020 . [239] Tran H, Hartmann J-M, Toon G, Brown LR, Frankenberg C, Warneke T, et al.
The 2 ν3 band of CH4 revisited with line mixing: Consequences for spec- troscopy and atmospheric retrievals at 1.67 μm. J Quant Spectrosc Radiat
Transf 2010;111:1344–56. doi: 10.1016/j.jqsrt.2010.02.015 . [240] Yu S, Drouin BJ, Miller CE. High resolution spectral analysis of oxygen.
IV. Energy levels, partition sums, band constants, RKR potentials, Franck-
Condon factors involving the X 3 g − , a 1 �g and b 1 g
+ states. J Chem Phys 2014;141:174302. doi: 10.1063/1.4900510 .
[241] Rothman LS, Gamache RR, Goldman A, Brown LR, Toth RA, Pickett HM, et al. The HITRAN database: 1986 edition. Appl Opt 1987;26:4058. doi: 10.1364/AO.
26.004058 . [242] Drouin BJ, Gupta H, Yu S, Miller CE, Müller HSP. High resolution spectral anal-
ysis of oxygen. II. Rotational spectra of a 1 �g O 2 isotopologues. J Chem Phys
2012;137:24305. doi: 10.1063/1.4719169 . [243] Drouin BJ, Yu S, Elliott BM, Crawford TJ, Miller CE. High resolution spectral
analysis of oxygen. III. Laboratory investigation of the airglow bands. J Chem
Phys 2013;139:144301. doi: 10.1063/1.4821759 .
[244] Yu S, Miller CE, Drouin BJ, Müller HSP. High resolution spectral analysis of oxygen. I. Isotopically invariant Dunham fit for the X 3 g
− , a 1 �g, b g + states.
J Chem Phys 2012;137:24304. doi: 10.1063/1.4719170 .
[245] Edwards HGM, Long DA, Najm KAB. The pure rotation Raman spectrum of 17 O 18 O. J Raman Spectrosc 1986;17:431–2. doi: 10.1002/jrs.1250170509 .
[246] Leshchishina O, Kassi S, Gordon IE, Yu S, Campargue A. The band of 16 O 17 O, 17 O 18 O and 17 O 2 by high sensitivity CRDS near 1.27 μm. J Quant Spectrosc Ra-
diat Transf 2011;112:1257–65. doi: 10.1016/j.jqsrt.2011.01.014 . [247] Leshchishina O, Kassi S, Gordon IE, Rothman LS, Wang L, Campargue A. High
sensitivity CRDS of the a 1 �g −X 3 g − band of oxygen near 1.27 μm: extended
observations, quadrupole transitions, hot bands and minor isotopologues. J Quant Spectrosc Radiat Transf 2010;111:2236–45. doi: 10.1016/j.jqsrt.2010.05.
014 . [248] Kassi S, Leshchishina O, Gordon IE, Yu S, Campargue A. Hyperfine structure of
the transitions of 16 O 17 O, 17 O 18 O and 17 O 2 by CRDS at 80 K. Chem Phys Lett 2011;502:37–41. doi: 10.1016/j.cplett.2010.12.017 .
[249] Gordon IE, Kassi S, Campargue A, Toon GC. First identification of the elec- tric quadrupole transitions of oxygen in solar and laboratory spectra. J Quant
Spectrosc Radiat Transf 2010;111:1174–83. doi: 10.1016/j.jqsrt.2010.01.008 .
[250] Long DA, Havey DK, Yu SS, Okumura M, Miller CE, Hodges JT. O 2 A-band line parameters to support atmospheric remote sensing. Part II: The rare isotopo-
logues. J Quant Spectrosc Radiat Transf 2011;112:2527–41. doi: 10.1016/j.jqsrt. 2011.07.002 .
[251] Long DA, Havey DK, Okumura M, Miller CE, Hodges JT. O 2 A-band line param- eters to support atmospheric remote sensing. J Quant Spectrosc Radiat Transf
2010;111:2021–36. doi: 10.1016/j.jqsrt.2010.05.011 .
[252] Drouin BJ, Benner DC, Brown LR, Cich MJ, Crawford TJ, Devi VM, et al. Mul- tispectrum analysis of the oxygen A-band. J Quant Spectrosc Radiat Transf
2017;186:118–38. doi: 10.1016/j.jqsrt.2016.03.037 . [253] Tran H, Boulet C, Hartmann J-M. Line mixing and collision-induced ab-
sorption by oxygen in the A band: laboratory measurements, model, and tools for atmospheric spectra computations. J Geophys Res 2006;111:D15210.
doi: 10.1029/20 05JD0 06869 .
[254] Brown L, Plymate C. Experimental Line Parameters of the Oxygen A Band at 760 nm. J Mol Spectrosc 20 0 0;199:166–79. doi: 10.1006/jmsp.1999.8012 .
[255] Tran H, Hartmann J-M. An improved O 2 A band absorption model and its consequences for retrievals of photon paths and surface pressures. J Geophys
Res 2008;113:D18104. doi: 10.1029/20 08JD010 011 . [256] Predoi-Cross A, Holladay C, Heung H, Bouanich J-P, Mellau GC, Keller R, et al.
Nitrogen-broadened lineshapes in the oxygen A-band: Experimental results
and theoretical calculations. J Mol Spectrosc 2008;251:159–75. doi: 10.1016/j. jms.2008.02.010 .
[257] Predoi-Cross A, Hambrook K, Keller R, Povey C, Schofield I, Hurtmans D, et al. Spectroscopic lineshape study of the self-perturbed oxygen A-band. J Mol
Spectrosc 2008;248:85–110. doi: 10.1016/j.jms.20 07.11.0 07 . [258] Biennier L, Campargue A. High resolution spectrum of the (3–0) band
of the b 1 + g –X 3 −
g red atmospheric system of oxygen. J Mol Spectrosc
1998;188:248–50. doi: 10.1006/jmsp.1997.7521 . [259] Gordon IE, Rothman LS, Toon GC. Revision of spectral parameters for the B-
and γ -bands of oxygen and their validation against atmospheric spectra. J Quant Spectrosc Radiat Transf 2011;112:2310–22. doi: 10.1016/j.jqsrt.2011.05.
007 .
Please cite this article as: I.E. Gordon et al., The HITRAN2016 molecular spectroscopic database, Journal of Quantitative Spectroscopy &
Radiative Transfer (2017), http://dx.doi.org/10.1016/j.jqsrt.2017.06.038

I.E. Gordon et al. / Journal of Quantitative Spectroscopy & Radiative Transfer 0 0 0 (2017) 1–66 59
ARTICLE IN PRESS
JID: JQSRT [m5G; August 21, 2017;14:18 ]
[260] Domysławska J, Wójtewicz S, Masłowski P, Cygan A, Bielska K, Trawi nski RS, et al. A new approach to spectral line shapes of the weak oxygen transitions
for atmospheric applications. J Quant Spectrosc Radiat Transf 2016;169:111–21. doi: 10.1016/j.jqsrt.2015.10.019 .
[261] Domysławska J, Wójtewicz S, Masłowski P, Cygan A, Bielska K, Trawi nski RS, et al. Spectral line shapes and frequencies of the molecular oxygen B-band
R-branch transitions. J Quant Spectrosc Radiat Transf 2015;155:22–31. doi: 10. 1016/j.jqsrt.2014.12.015 .
[262] Wójtewicz S, Cygan A, Masłowski P, Domysławska J, Lisak D, Trawi nski RS,
et al. Spectral line shapes of self-broadened P-branch transitions of oxygen B band. J Quant Spectrosc Radiat Transf 2014;144:36–48. doi: 10.1016/j.jqsrt.
2014.03.029 . [263] Müller HSP, Kobayashi K, Takahashi K, Tomaru K, Matsushima F. Terahertz
spectroscopy of N
18 O and isotopic invariant fit of several nitric oxide iso- topologs. J Mol Spectrosc 2015;310:92–8. doi: 10.1016/j.jms.2014.12.002 .
[264] Pickett HM , Cohen EA , Waters JW , Phillips T . The rotational spectrum of NO.
In: Abstr. OSU Int. Symp. Mol. Spectrosc; 1979. p. 1970–9 . [265] Varberg TD, Stroh F, Evenson KM. Far-infrared rotational and fine-structure
transition frequencies and molecular constants of 14 NO and 15 NO. J Mol Spec- trosc 1999;196:5–13. doi: 10.1006/jmsp.1999.7850 .
[266] Meerts WL, Dymanus A. The hyperfine -doubling spectrum of 14 N
16 O and 14 N
16 O. J Mol Spectrosc 1972;44:320–46. doi: 10.1016/0022-2852(72)90109-9 .
[267] Meerts WL. A theoretical reinvestigation of the rotational and hyperfine
lambda doubling spectra of diatomic molecules with a 2 � state: the spec- trum of NO. Chem Phys 1976;14:421–5. doi: 10.1016/0301-0104(76)80139-5 .
[268] Neumann RM. High-precision radiofrequency spectrum of 14 N
16 O. Astrophys J 1970;161:779. doi: 10.1086/150578 .
[269] Dale RM, Johns JWC, McKellar ARW, Riggin M. High-resolution laser magnetic resonance and infrared-radiofrequency double-resonance spectroscopy of NO
and its isotopes near 5.4 μm. J Mol Spectrosc 1977;67:440–58. doi: 10.1016/
0 022-2852(77)90 051-0 . [270] Lowe RS, McKellar ARW, Veillette P, Meerts WL. Hyperfine and -doubling
parameters for the v = 1 state of NO from infrared-radiofrequency double res- onance. J Mol Spectrosc 1981;88:372–7. doi: 10.1016/0022-2852(81)90187-9 .
[271] Hinz A, Wells JS, Maki AG. Heterodyne frequency measurements on the ni- tric oxide fundamental band. J Mol Spectrosc 1986;119:120–5. doi: 10.1016/
0022- 2852(86)90206- 7 .
[272] Saupe S, Meyer B, Wappelhorst MH, Urban W, Maki AG. Sub-doppler hetero- dyne frequency measurements and calibration tables for the nitric oxide fun-
damental band. J Mol Spectrosc 1996;179:13–21. doi: 10.1006/jmsp.1996.0179 . [273] Saleck AH, Yamada KMT, Winnewisser G. Isotopic nitric oxide spec-
tra and breakdown of the Born-Oppenheimer approximation. Mol Phys 1991;72:1135–48. doi: 10.1080/00268979100100811 .
[274] Saleck AH, Liedtke M, Dolgner A, Winnewisser G. Rotational spectra of 14 N
17 O and 15 N
18 O. Zeitschrift Für Naturforsch A 1994;49. doi: 10.1515/ zna- 1994- 1203 .
[275] Liu Y, Guo Y, Lin J, Huang G, Duan C, Li F. Measurement of the electric dipole moment of NO (X 2 � ν = 0,1) by mid-infrared laser magnetic resonance spec-
troscopy. Mol Phys 2001;99:1457–61. doi: 10.1080/00268970110059642 . [276] Curl RF. The relationship between electron spin rotation coupling con-
stants and g -tensor components. Mol Phys 1965;9:585–97. doi: 10.1080/ 0 026897650 010 0761 .
[277] Wong A, Yurchenko SN, Bernath P, Müller HSP, McConkey S, Tennyson J. Exo-
Mol line list XXI: nitric oxide (NO). Mon Not R Astron Soc 2017;870:882–97. doi: 10.1093/mnras/stx1211 .
[278] Rothman LS, Gordon IE, Barber RJ, Dothe H, Gamache RR, Goldman a, et al. HITEMP, the high-temperature molecular spectroscopic database. J Quant
Spectrosc Radiat Transf 2010;111:2139–50. doi: 10.1016/j.jqsrt.2010.05.001 . [279] Semenov M, Yurchenko SN, Tennyson J. Predicted Landé g-factors for open
shell diatomic molecules. J Mol Spectrosc 2016;330:57–62. doi: 10.1016/j.jms.
2016.11.004 . [280] Cazzoli G, Puzzarini C. N 2 -, O 2 -, H 2 -, and He-broadening of SO 2 rotational
lines in the mm-/submm-wave and THz frequency regions: The J and Ka dependence. J Quant Spectrosc Radiat Transf 2012;113:1051–7. doi: 10.1016/
j.jqsrt.2012.01.011 . [281] Tasinato N, Pietropolli Charmet A, Stoppa P, Giorgianni S, Buffa G. N 2 -, O 2 -
and He-collision-induced broadening of sulfur dioxide ro-vibrational lines in
the 9.2 μm atmospheric window. Spectrochim Acta-Part A Mol Biomol Spec- trosc 2014;118:373–9. doi: 10.1016/j.saa.2013.08.071 .
[282] Kühnemann F, Heiner Y, Sumpf B, Herrmann K. Line broadening in the ν3 band of SO 2 : studied with diode laser spectroscopy. J Mol Spectrosc
1992;152:1–12. doi: 10.1016/0022-2852(92)90111-Z . [283] Sumpf B, Fleischmann O, Kronfeldt H-D. Self-, air-, and nitrogen-broadening
in the ν1 band of SO 2 . J Mol Spectrosc 1996;176:127–32. doi: 10.1006/jmsp.
1996.0068 . [284] Ball CD, Dutta JM, Goyette TM, Helminger P, De Lucia FC. The pressure broad-
ening of SO 2 by N 2 , O 2 , He, and H 2 between 90 and 500 K. J Quant Spectrosc Radiat Transf 1996;56:109–17. doi: 10.1016/0 022-4073(96)0 0 016-7 .
[285] Henningsen J, Barbe A, De Backer-Barilly M-R. Revised molecular param- eters for 32 S 16 O 2 and 34 S 16 O 2 from high resolution study of the infrared
spectrum in the 7-8 μm wavelength region. J Quant Spectrosc Radiat Transf
2008;109:2491–510. doi: 10.1016/j.jqsrt.2008.04.001 . [286] Tan Y, Kochanov RV, Rothman LS, Gordon IE. The broadening coefficients of
SO 2 . 2016. doi:10.5281/zenodo.163447. [287] Tasinato N, Charmet AP, Stoppa P, Buffa G, Puzzarini C. A complete listing
of sulfur dioxide self-broadening coefficients for atmospheric applications by
coupling infrared and microwave spectroscopy to semiclassical calculations. J Quant Spectrosc Radiat Transf 2013;130:233–48. doi: 10.1016/j.jqsrt.2013.03.
015 . [288] Sumpf B, Fleischmann O, Waschull J, Heiner Y, Kronfeldt H-D. Noble gas
pressure broadening in the v 1 and v 3 band of SO 2 studied with IR tunable diode laser spectroscopy. Infrared Phys Technol 1995;36:439–45. doi: 10.1016/
1350-4495(94)0 0 084-X . [289] Krishnaji, Chandra S. Molecular interaction and linewidth of the asymmetric
molecule SO 2 . II. SO 2 -CO 2 collisions. J Chem Phys 1963;38:1019. doi: 10.1063/
1.1733747 . [290] Huang X, Schwenke DW, Lee TJ. Ames 32 S 16 O 18 O line list for high-resolution
experimental IR analysis. J Mol Spectrosc 2016;330:101–11. doi: 10.1016/j.jms. 2016.08.013 .
[291] Huang X, Schwenke DW, Lee TJ. Empirical infrared line lists for five SO 2 iso- topologues: 32/33/34/36S16O2 and 32S18O2. J Mol Spectrosc 2015;311:19–24.
doi: 10.1016/j.jms.2015.01.010 .
[292] Underwood DS, Tennyson J, Yurchenko SN, Huang X, Schwenke DW, Lee TJ, et al. ExoMol molecular line lists–XIV. The rotation–vibration spectrum of hot
SO 2 . Mon Not R Astron Soc 2016;459:3890–9. doi: 10.1093/mnras/stw849 . [293] Ulenikov ON, Bekhtereva ES, Gromova OV, Zamotaeva VA, Sklyarova EA,
Sydow C, et al. First high resolution analysis of the 2 ν1 , 2 ν3 , and ν1 + ν3
bands of S 18 O 2 . J Quant Spectrosc Radiat Transf 2016;185:12–21. doi: 10.1016/
j.jqsrt.2016.08.008 .
[294] Ulenikov ON, Gromova OV, Bekhtereva ES, Krivchikova YV, Sklyarova EA, But- tersack T, et al. High resolution FTIR study of 34 S 16 O 2 : the bands 2 ν3 , 2 ν1 + ν2
and 2 ν1 + ν2 - ν2 . J Mol Spectrosc 2015;318:26–33. doi: 10.1016/j.jms.2015.09. 009 .
[295] Ulenikov ON, Gromova OV, Bekhtereva ES, Bolotova IB, Konov IA, Horne- man V-M, et al. High resolution analysis of the SO 2 spectrum in the 2600–
2900 cm
−1 region: 2 ν3 , ν2 + 2 ν3 −ν2 and 2 ν1 + ν2 bands. J Quant Spectrosc
Radiat Transf 2012;113:500–17. doi: 10.1016/j.jqsrt.2012.01.006 . [296] Ulenikov ON, Bekhtereva ES, Gromova OV, Zamotaeva VA, Kuznetsov SI,
Sydow C, et al. High resolution study of the rotational structure of dou- bly excited vibrational states of 32 S 16 O 18 O: the first analysis of the 2 ν1 ,
ν1 + ν3 , and 2 ν3 bands. J Quant Spectrosc Radiat Transf 2017;189:344–50. doi: 10.1016/j.jqsrt.2016.12.019 .
[297] Ulenikov ON, Gromova OV, Bekhtereva ES, Fomchenko AL, Sydow C,
Bauerecker S. First high resolution analysis of the 3 ν1 band of 34 S 16 O 2 . J Mol Spectrosc 2016;319:50–4. doi: 10.1016/j.jms.2015.11.002 .
[298] Belov SP, Klaus T, Plummer GM, Schieder R, Winnewisser G. Sub-doppler spectroscopy of ammonia near 570 GHz. Zeitschrift Für Naturforsch A
1995;50. doi: 10.1515/zna- 1995- 1224 . [299] Winnewisser G, Belov SP, Klaus T, Urban S. Ro-inversional spectrum of am-
monia. Zeitschrift Für Naturforsch A 1996;51. doi: 10.1515/zna- 1996- 0312 .
[300] Kukolich SG. Hyperfine Structure of 15 NH 3 . Phys Rev 1968;172:59–63. doi: 10. 1103/PhysRev.172.59 .
[301] Hougen JT. Reinterpretation of molecular beam hyperfine data for 14 NH 3 and 15 NH 3 . J Chem Phys 1972;57:4207–17. doi: 10.1063/1.1678050 .
[302] Sasada H. Microwave inversion spectrum of 15 NH 3 . J Mol Spectrosc 1980;83:15–20. doi: 10.1016/0022- 2852(80)90307- 0 .
[303] Urban S, Klee S, Yamada KMT. Ground state ro-inversional transitions of 15 NH 3 in the far-infrared region. J Mol Spectrosc 1994;168:384–9. doi: 10.
1006/jmsp.1994.1287 .
[304] Carlotti M, Trombetti A, Velino B, Vrbancich J. The rotation-inversion spec- trum of 15 NH 3 . J Mol Spectrosc 1980;83:401–7. doi: 10.1016/0022-2852(80)
90064-8 . [305] Chen P, Pearson JC, Pickett HM, Matsuura S, Blake GA. Measurements of
14 NH 3 in the ν2 = 1 state by a solid-state, photomixing, THz spectrometer, and a simultaneous analysis of the microwave, terahertz, and infrared tran-
sitions between the ground and ν2 inversion–rotation levels. J Mol Spectrosc
2006;236:116–26. doi: 10.1016/j.jms.2006.01.002 . [306] Huang X, Schwenke DW, Lee TJ. Rovibrational spectra of ammonia. II. De-
tailed analysis, comparison, and prediction of spectroscopic assignments for 14 NH 3 ,
15 NH 3 , and 14 ND 3 . J Chem Phys 2011;134:44321. doi: 10.1063/1.
3541352 . [307] Tanaka K, Ito H, Tanaka T. CO 2 laser–microwave double resonance spec-
troscopy of NH 3 : precise measurement of dipole moment in the ground state.
J Chem Phys 1987;87:1557–67. doi: 10.1063/1.453725 . [308] Barton EJ, Yurchenko SN, Tennyson J, B?guier S, Campargue A. A near infrared
line list for NH 3 : analysis of a Kitt Peak spectrum after 35 years. J Mol Spec- trosc 2016;325:7–12. doi: 10.1016/j.jms.2016.05.001 .
[309] Down MJ, Hill C, Yurchenko SN, Tennyson J, Brown LR, Kleiner I. Re -analysis of ammonia spectra: updating the HITRAN
14 NH 3 database. J Quant Spectrosc
Radiat Transf 2013;130:260–72. doi: 10.1016/j.jqsrt.2013.05.027 .
[310] Barton EJ, Polyansky OL, Yurchenko SN, Tennyson J, Civiš S, Ferus M, et al. Absorption spectra of ammonia near 1 μm. J Quant Spectrosc Radiat Transf
2017 This issue. doi: 10.1016/j.jqsrt.2017.03.042 . [311] Yurchenko SN, Barber RJ, Yachmenev A, Thiel W, Jensen P, Tennyson J.
A variationally computed T = 300 K line list for NH 3 . J Phys Chem A 2009;113:11845–55. doi: 10.1021/jp9029425 .
[312] Yurchenko SN, Barber RJ, Tennyson J. A variationally computed line list for
hot NH 3 . Mon Not R Astron Soc 2011;413:1828–34. doi: 10.1111/j.1365-2966. 2011.18261.x .
[313] Al Derzi AR, Furtenbacher T, Tennyson J, Yurchenko SN, Császár AG. MARVEL analysis of the measured high-resolution spectra of 14 NH 3 . J Quant Spectrosc
Radiat Transf 2015;161:117–30. doi: 10.1016/j.jqsrt.2015.03.034 .
Please cite this article as: I.E. Gordon et al., The HITRAN2016 molecular spectroscopic database, Journal of Quantitative Spectroscopy &
Radiative Transfer (2017), http://dx.doi.org/10.1016/j.jqsrt.2017.06.038

60 I.E. Gordon et al. / Journal of Quantitative Spectroscopy & Radiative Transfer 0 0 0 (2017) 1–66
ARTICLE IN PRESS
JID: JQSRT [m5G; August 21, 2017;14:18 ]
[314] Sharpe SW, Johnson TJ, Sams RL, Chu PM, Rhoderick GC, Johnson PA. Gas-phase databases for quantitative infrared spectroscopy. Appl Spectrosc
20 04;58:1452–61. doi: 10.1366/0 0 03702042641281 . [315] Polyansky OL, Ovsyannikov RI, Kyuberis AA, Lodi L, Tennyson J, Yachmenev A,
et al. Calculation of rotation-vibration energy levels of the ammonia molecule based on an ab initio potential energy surface. J Mol Spectrosc 2016;327:21–
30. doi: 10.1016/j.jms.2016.08.003 . [316] Nemtchinov V, Sung K, Varanasi P. Measurements of line intensities and
half-widths in the 10-μm bands of 14 NH 3 . J Quant Spectrosc Radiat Transf
2004;83:243–65. doi: 10.1016/S0022- 4073(02)00354- 0 . [317] Baldacchini G, D’Amato F, Buffa G, Tarrini O, Rosa MD, Pelagalli F. Temper-
ature dependence of foreign gas broadening and shift of the aQ(9,9) tran- sition line of ammonia. J Quant Spectrosc Radiat Transf 2001;68:625–33.
doi: 10.1016/S0 022-4073(0 0)0 0 043-1 . [318] Dhib M, Echargui MA, Aroui H, Orphal J, Hartmann JM. Line shift and mixing
in the v 4 and 2(V 2 ) band of NH 3 perturbed by H 2 and Ar. J Mol Spectrosc
2005;233:138–48. doi: 10.1016/j.jms.2005.06.012 . [319] Raynaud F, Lemoine B, Rohart F. High precision pressure-induced lineshifts
measured with a frequency-stabilized diode laser: application to the ν2 and (2 ν2 −ν2 ) bands of NH 3 . J Mol Spectrosc 1994;168:584–92. doi: 10.1006/jmsp.
1994.1304 . [320] Pine AS, Markov VN, Buffa G, Tarrini O. N 2 , O 2 , H 2 , Ar and He broadening in
the ν1 band of NH 3 . J Quant Spectrosc Radiat Transf 1993;50:337–48. doi: 10.
1016/0 022-4073(93)90 069-T . [321] Dhib M, Echargui MA, Aroui H, Orphal J. Shifting and line mixing parameters
in the ν4 band of NH 3 perturbed by CO 2 and He: experimental results and theoretical calculations. J Mol Spectrosc 2006;238:168–77. doi: 10.1016/j.jms.
2006.04.013 . [322] Broquier M, Picard-Bersellini a, Aroui H, Billing GD. Pressure broadening and
cross relaxation of ammonia perturbed by hydrogen and helium: Implications
on intermolecular potentials and discussion of rotational effects. J Chem Phys 1988;88:1551. doi: 10.1063/1.454134 .
[323] Broquier M, Picard-Bersellini A, Hall J. An inelastic rotational transfer study of NH 3 , colliding with H 2 , and He. Chem Phys Lett 1987;136:531–4. doi: 10.
1016/0 0 09- 2614(87)80512- 2 . [324] Keffer CE, Conner CP, Smith WH. Hydrogen broadening of vibrational-
rotational transitions of ammonia lying near 6450 A. J Quant Spectrosc Radiat
Transf 1985;33:193–6. doi: 10.1016/0022-4073(85)90148-7 . [325] Varanasi P. Infrared line widths at planetary atmospheric temperatures,
J Quant Spectrosc Radiat Transf 1988;39:13–25. http://dx.doi.org/10.1016/ 0 022-4073(88)90 015-5 .
[326] Baldacchini G, Bizzarri A, Nencini L, Sorge V, Buffa G, Tarrini O. Foreign-gas pressure broadening and shift of ammonia transition lines in the ν2 vibra-
tional bands. J Quant Spectrosc Radiat Transf 1990;43:371–80. doi: 10.1016/
0 022-4073(90)90 0 03-O . [327] Aroui H, Picard-Bersellini A, Chevalier M, Broquier M, Gherissi S. Pressure-
broadening and cross-relaxation rates of rotation–inversion transitions in the ν4 band of NH 3 perturbed by CO 2 . J Mol Spectrosc 1996;176:162–8. doi: 10.
10 06/jmsp.1996.0 073 . [328] Raspollini P, Belotti C, Burgess A, Carli B, Carlotti M, Ceccherini S, et al. MIPAS
level 2 operational analysis. Atmos Chem Phys 2006;6:5605–30. doi: 10.5194/ acp- 6- 5605- 2006 .
[329] Raspollini P, Carli B, Carlotti M, Ceccherini S, Dehn A, Dinelli BM, et al.
Ten years of MIPAS measurements with ESA Level 2 processor V6 ; Part 1: Retrieval algorithm and diagnostics of the products. Atmos Meas Tech
2013;6:2419–39. doi: 10.5194/amt- 6- 2419- 2013 . [330] Wespes C, Hurtmans D, Clerbaux C, Santee ML, Martin R V, Coheur PF. Global
distributions of nitric acid from IASI/MetOP measurements. Atmos Chem Phys 2009;9:7949–62. doi: 10.5194/acp- 9- 7949- 2009 .
[331] Wang DY, Höpfner M, Blom CE, Ward WE, Fischer H, Blumenstock T, et al.
Validation of MIPAS HNO 3 operational data. Atmos Chem Phys 2007;7:4905–34. doi: 10.5194/acp- 7- 4905- 2007 .
[332] Wolff MA, Kerzenmacher T, Strong K, Walker KA, Toohey M, Dupuy E, et al. Validation of HNO 3 , ClONO 2 , and N 2 O 5 from the Atmospheric Chemistry
Experiment Fourier Transform Spectrometer (ACE-FTS). Atmos Chem Phys 2008;8:3529–62. doi: 10.5194/acp- 8- 3529- 2008 .
[333] Irie H, Sugita T, Nakajima H, Yokota T, Oelhaf H, Wetzel G, et al. Valida-
tion of stratospheric nitric acid profiles observed by Improved Limb Atmo- spheric Spectrometer (ILAS)–II. J Geophys Res 2006 111:D11S03. doi: 10.1029/
20 05JD0 06115 . [334] Perrin A, Lado-Bordowsky O, Valentin A. The v 3 and v 4 interacting bands of
HNO 3 line positions and line intensities. Mol Phys 1989;67:249–70. doi: 10. 1080/0 026897890 0101061 .
[335] Perrin A. New Analysis of the ν3 and ν4 Bands of HNO 3 in the 7.6 μm Region.
J Phys Chem A 2013;117:13236–48. doi: 10.1021/jp401979v . [336] Perrin A, Flaud J-M, Ridolfi M, Vander Auwera J, Carlotti M. MIPAS database:
new HNO 3 line parameters at 7.6 μm validated with MIPAS satellite measure- ments. Atmos Meas Tech 2016;9:2067–76. doi: 10.5194/amt- 9- 2067- 2016 .
[337] Pavlyuchko AI, Yurchenko SN, Tennyson J. ExoMol molecular line lists–XI. The spectrum of nitric acid. Mon Not R Astron Soc 2015;452:1702–6. doi: 10.1093/
mnras/stv1376 .
[338] Pavlyuchko AI, Yurchenko SN, Tennyson J. A hybrid variational-perturbation calculation of the ro-vibrational spectrum of nitric acid. J Chem Phys
2015;142:94309. doi: 10.1063/1.4913741 . [339] Brooke JSA, Bernath PF, Western CM, Sneden C, Af s ar M, Li G, et al. Line
strengths of rovibrational and rotational transitions in the X 2 � ground state
of OH. J Quant Spectrosc Radiat Transf 2016;168:142–57. doi: 10.1016/j.jqsrt. 2015.07.021 .
[340] Medvedev ES, Meshkov VV, Stolyarov AV, Gordon IE. Peculiarities of high- overtone transition probabilities in carbon monoxide revealed by high-
precision calculation. J Chem Phys 2015;143:154301. doi: 10.1063/1.4933136 . [341] Medvedev ES, Meshkov VV, Stolyarov AV, Ushakov VG, Gordon IE. Impact of
the dipole-moment representation on the intensity of high overtones. J Mol Spectrosc 2016;330:36–42. doi: 10.1016/j.jms.2016.06.013 .
[342] Meredith RE. Broadening of hydrogen fluoride lines by H 2 , D 2 , and N 2 . J Chem
Phys 1974;60:3388. doi: 10.1063/1.1681547 . [343] Shaw BM, Lovell RJ. Foreign-gas broadening of HF by CO 2 . J Opt Soc Am
1969;59:1598. doi: 10.1364/JOSA.59.001598 . [344] Varanasi P, Sarangi SK, Tejwani GDT. Line shape parameters for HCl and HF
in a CO 2 atmosphere. J Quant Spectrosc Radiat Transf 1972;12:857–72. doi: 10. 1016/0 022-4073(72)90 074-X .
[345] Guelachvili G, Smith MAH. Measurements of pressure-induced shifts in the
1-0 and 2-0 bands of HF and in the 2-0 bands of H
35 Cl and H
37 Cl. J Quant Spectrosc Radiat Transf 1978;20:35–47. doi: 10.1016/0 022-4073(78)90 0 04-3 .
[346] Chou S, Baer DS, Hanson RK. Diode–laser measurements of He-, Ar-, and N 2 -broadened HF lineshapes in the first overtone band. J Mol Spectrosc
1999;196:70–6. doi: 10.1006/jmsp.1999.7847 . [347] Bonczyk PA. Determination of the linewidth dependence on foreign-gas pres-
sure for 3.4-μm DF spectra. Phys Rev A 1976;13:251–2. doi: 10.1103/PhysRevA.
13.251 . [348] Bachet G . Experimental study on elongation of first 5 lines of pure rotation of
hydrogen-fluoride perturbed by strange compressed gases. Comptes Rendus Hebd Des Seances L’Academie Des Sci Ser B 1972;274:1319–21 .
[349] Tudorie M, Földes T, Vandaele AC, Vander Auwera J. CO 2 pressure broadening and shift coefficients for the 1–0 band of HCl and DCl. J Quant Spectrosc
Radiat Transf 2012;113:1092–101. doi: 10.1016/j.jqsrt.2012.01.025 .
[350] Rank DH, Eastman DP, Rao BS, Wiggins TA. Breadths and shifts of molecular band lines due to perturbation by foreign gases. J Mol Spectrosc 1963;10:34–
50. doi: 10.1016/0022-2852(63)90152-8 . [351] Hurtmans D, Henry A, Valentin A, Boulet C. Narrowing broadening and shift-
ing parameters for R(2) and P(14) lines in the HCl fundamental band per- turbed by N 2 and rare gases from tunable diode laser spectroscopy. J Mol
Spectrosc 2009;254:126–36. doi: 10.1016/j.jms.2009.01.015 .
[352] Rank DH, Birtley WB, Eastman DP, Wiggins TA. Pressure-Induced Shifts of HCl Lines Due to Foreign Gases. J Chem Phys 1960;32:296–7. doi: 10.1063/
1.1700921 . [353] Houdeau JP, Larvor M, Haeusler C. Etude à basse température des largeurs
et des déplacements des raies rovibrationnelles de la bande fondamentale de H
35 Cl comprimé par N 2 , O 2 , D 2 et H 2 . Can J Phys 1980;58:318–24. doi: 10.
1139/p80-046 .
[354] Babrov H, Ameer G, Benesch W. Molecular collision cross sections from in- frared absorption measurements. J Chem Phys 1960;33:145. doi: 10.1063/1.
1731069 . [355] Toth RA, Hunt RH, Plyler EK. Linewidths of HCl broadened by H 2 , D 2 , and
HCN. J Chem Phys 1970;53:4303–7. doi: 10.1063/1.1673937 . [356] Lejeune B, Mahieu E, Vollmer MK, Reimann S, Bernath PF, Boone CD, et al.
Optimized approach to retrieve information on atmospheric carbonyl sulfide (OCS) above the Jungfraujoch station and change in its abundance since 1995.
J Quant Spectrosc Radiat Transf 2017;186:81–95. doi: 10.1016/j.jqsrt.2016.06.
001 . [357] Krasnopolsky VA. High-resolution spectroscopy of Venus: Detection of OCS,
upper limit to H 2 S, and latitudinal variations of CO and HF in the upper cloud layer. Icarus 2008;197:377–85. doi: 10.1016/j.icarus.2008.05.020 .
[358] Phillips NG, Ackley R, Crosson ER, Down A, Hutyra LR, Brondfield M, et al. Mapping urban pipeline leaks: methane leaks across Boston. Environ Pollut
2013;173:1–4. doi: 10.1016/j.envpol.2012.11.003 .
[359] Golebiowski D, de Ghellinck d’Elseghem Vaernewijck X, Herman M, Van- der Auwera J, Fayt A. High sensitivity (femto-FT-CEAS) spectra of carbonyl
sulphide between 6200 and 8200 cm
−1 , and new energy pattern in the global rovibrational analysis of 16 O 12 C 32 S. J Quant Spectrosc Radiat Transf
2014;149:184–203. doi: 10.1016/j.jqsrt.2014.07.005 . [360] Rbaihi E, Belafhal A, Vander Auwera J, Naïm S, Fayt A. Fourier transform spec-
troscopy of carbonyl sulfide from 4800 to 80 0 0 cm
−1 and new global analysis
of 16 O 12 C 32 S. J Mol Spectrosc 1998;191:32–44. doi: 10.1006/jmsp.1998.7616 . [361] Koshelev MA, Tretyakov MY. Collisional broadening and shifting of OCS ro-
tational spectrum lines. J Quant Spectrosc Radiat Transf 2009;110:118–28. doi: 10.1016/j.jqsrt.2008.09.010 .
[362] Broquier M, Picard-Bersellini A, Whitaker BJ, Green S. Rotational inelas- tic cross sections for OCS–Ar, OCS–He, OCS–H 2 collisions: A comparison
between theory and experiment. J Chem Phys 1986;84:2104–7. doi: 10.1063/
1.450421 . [363] Liuima FA, Bushkovitch AV, Rouse AG. Pressure Broadening of OCS in Foreign
Gas Mixtures. Phys Rev 1954;96:434–5. doi: 10.1103/PhysRev.96.434 . [364] Mäder H, Ekkers J, Hoke W, Flygare WH. A π , τ , π /2 type pulse sequence
method for the determination of T 1 in rotational transitions. J Chem Phys 1975;62:4380–7. doi: 10.1063/1.430338 .
[365] Murphy JS. Collision broadening of rotational absorption lines. III. Broaden-
ing by linear molecules and inert gases and the determination of molecular quadrupole moments. J Chem Phys 196 8;4 9:3333. doi: 10.1063/1.1670605 .
[366] Bouanich J-P, Campers C, Blanquet G, Walrand J. Diode-laser measurements of Ar- and CO 2 -broadened linewidths in the v 1 band of OCS. J Quant Spectrosc
Radiat Transf 1988;39:353–65. doi: 10.1016/0022-4073(88)90100-8 .
Please cite this article as: I.E. Gordon et al., The HITRAN2016 molecular spectroscopic database, Journal of Quantitative Spectroscopy &
Radiative Transfer (2017), http://dx.doi.org/10.1016/j.jqsrt.2017.06.038

I.E. Gordon et al. / Journal of Quantitative Spectroscopy & Radiative Transfer 0 0 0 (2017) 1–66 61
ARTICLE IN PRESS
JID: JQSRT [m5G; August 21, 2017;14:18 ]
[367] Vander Auwera J, Kleffmann J, Flaud J-M, Pawelke G, Bürger H, Hurtmans D, et al. Absolute ν2 line intensities of HOCl by simultaneous measurements in
the infrared with a tunable diode laser and far-infrared region using a Fourier transform spectrometer. J Mol Spectrosc 20 0 0;204:36–47. doi: 10.1006/jmsp.
20 0 0.8197 . [368] Lutsch E, Dammers E, Conway S, Strong K. Long-range transport of NH 3 ,
CO, HCN, and C 2 H 6 from the 2014 Canadian wildfires. Geophys Res Lett 2016;43:8286–97. doi: 10.1002/2016GL070114 .
[369] Viatte C, Strong K, Paton-Walsh C, Mendonca J, O’Neill NT, Drummond JR.
Measurements of CO, HCN, and C 2 H 6 total columns in smoke plumes trans- ported from the 2010 Russian Boreal Forest Fires to the Canadian high arctic.
Atmos-Ocean 2013;51:522–31. doi: 10.1080/07055900.2013.823373 . [370] Akagi SK, Yokelson RJ, Wiedinmyer C, Alvarado MJ, Reid JS, Karl T, et al. Emis-
sion factors for open and domestic biomass burning for use in atmospheric models. Atmos Chem Phys 2011;11:4039–72. doi: 10.5194/acp-11-4039-2011 .
[371] Vigouroux C, Stavrakou T, Whaley C, Dils B, Duflot V, Hermans C, et al.
FTIR time-series of biomass burning products (HCN, C 2 H 6 , C 2 H 2 , CH 3 OH, and HCOOH) at Reunion Island (21 ° S, 55 ° E) and comparisons with model data.
Atmos Chem Phys 2012;12:10367–85. doi: 10.5194/acp- 12- 10367- 2012 . [372] Viatte C, Strong K, Walker KA, Drummond JR. Five years of CO, HCN, C 2 H 6 ,
C 2 H 2 , CH 3 OH, HCOOH and H 2 CO total columns measured in the Canadian high Arctic. Atmos Meas Tech 2014;7:1547–70. doi: 10.5194/amt- 7- 1547- 2014 .
[373] Marchenko D, Neerincx AH, Mandon J, Zhang J, Boerkamp M, Mink J,
et al. A compact laser-based spectrometer for detection of C 2 H 2 in ex- haled breath and HCN in vitro. Appl Phys B 2015;118:275–80. doi: 10.1007/
s00340- 014- 5983- y . [374] Tsiaras A, Rocchetto M, Waldmann IP, Venot O, Varley R, Morello G, et al.
Detection of an Atmosphere Around The Super-Earth 55 Cancri e. Astrophys J 2016;820:99. doi: 10.3847/0 0 04-637X/820/2/99 .
[375] Barber RJ, Strange JK, Hill C, Polyansky OL, Mellau GC, Yurchenko SN, et al.
ExoMol line lists-III. An improved hot rotation-vibration line list for HCN and HNC. Mon Not R Astron Soc 2014;437:1828–35. doi: 10.1093/mnras/stt2011 .
[376] Tennyson J, Yurchenko SN. ExoMol: molecular line lists for exoplanet and other atmospheres. Mon Not R Astron Soc 2012;425:21–33. doi: 10.1111/j.
1365-2966.2012.21440.x . [377] Mellau GC. Complete experimental rovibrational eigenenergies of HCN up to
6880 cm
−1 above the ground state. J Chem Phys 2011;134:234303. doi: 10.
1063/1.3598942 . [378] Mellau GC. Rovibrational eigenenergy structure of the [H,C,N] molecular sys-
tem. J Chem Phys 2011;134:194302. doi: 10.1063/1.3590026 . [379] Harris GJ, Tennyson J, Kaminsky BM, Pavlenko YV, Jones HRA. Improved
HCN/HNC linelist, model atmospheres and synthetic spectra for WZ Cas. Mon Not R Astron Soc 20 06;367:40 0–6. doi: 10.1111/j.1365-2966.2005.09960.x .
[380] van Mourik T, Harris GJ, Polyansky OL, Tennyson J, Császár AG, Knowles PJ.
Ab initio global potential, dipole, adiabatic, and relativistic correction sur- faces for the HCN–HNC system. J Chem Phys 2001;115:3706–18. doi: 10.1063/
1.1383586 . [381] Harris GJ, Polyansky OL, Tennyson J. Ab initio rotation–vibration spectra of
HCN and HNC. Spectrochim Acta Part A Mol Biomol Spectrosc 2002;58:673–90. doi: 10.1016/S1386-1425(01)00664-3 .
[382] Yang C, Buldyreva J, Gordon IE, Rohart F, Cuisset A, Mouret G, et al. Oxygen, nitrogen and air broadening of HCN spectral lines at terahertz frequencies. J
Quant Spectrosc Radiat Transf 2008;109:2857–68. doi: 10.1016/j.jqsrt.2008.08.
005 . [383] Nikitin AV, Dmitrieva TA, Gordon IE. Improved spectroscopic line list of
methyl chloride in the 190 0-260 0 cm
−1 spectral region. J Quant Spectrosc Radiat Transf 2015. doi: 10.1016/j.jqsrt.2016.03.007 .
[384] Dudaryonok AS, Lavrentieva NN, Buldyreva JV. CH3Cl self-broadening coef- ficients and their temperature dependence. J Quant Spectrosc Radiat Transf
2013;130:321–6. doi: 10.1016/j.jqsrt.2013.07.013 .
[385] Bray C, Jacquemart D, Lacome N, Guinet M, Cuisset A, Eliet S, et al. Analysis of self-broadened pure rotational and rovibrational lines of methyl chloride at
room temperature. J Quant Spectrosc Radiat Transf 2013;116:87–100. doi: 10. 1016/j.jqsrt.2012.09.013 .
[386] Barbouchi Ramchani A, Jacquemart D, Dhib M, Aroui H. Line positions, inten- sities and self-broadening coefficients for the ν5 band of methyl chloride. J
Quant Spectrosc Radiat Transf 2013;120:1–15. doi: 10.1016/j.jqsrt.2013.02.002 .
[387] Buldyreva J. Air-broadening coefficients of CH 3 35 Cl and CH 3
37 Cl rovibrational lines and their temperature dependence by a semi-classical approach. J Quant
Spectrosc Radiat Transf 2013;130:315–20. doi: 10.1016/j.jqsrt.2013.04.003 . [388] Guinet M, Rohart F, Buldyreva J, Gupta V, Eliet S, Motiyenko RA, et al. Ex-
perimental studies by complementary terahertz techniques and semi-classical calculations of N 2 - broadening coefficients of CH 3
35 Cl. J Quant Spectrosc Ra-
diat Transf 2012;113:1113–26. doi: 10.1016/j.jqsrt.2012.01.022 .
[389] Buldyreva J, Margulès L, Motiyenko RA, Rohart F. Speed dependence of CH 3
35 Cl–O2 line-broadening parameters probed on rotational transitions:
measurements and semi-classical calculations. J Quant Spectrosc Radiat Transf 2013;130:304–14. doi: 10.1016/j.jqsrt.2013.05.023 .
[390] Sato TO, Mizoguchi A, Mendrok J, Kanamori H, Kasai Y. Measurement of the pressure broadening coefficient of the 625 GHz transition of H 2 O 2 in the
sub-millimeter-wave region. J Quant Spectrosc Radiat Transf 2010;111:821–5.
doi: 10.1016/j.jqsrt.2009.11.022 . [391] Goyette TM, Ebenstein WL, Shostak SL, De Lucia FC, Helminger P. Pressure
broadening of NO 2 , CF 2 Cl 2 , HDO and HOOH by O 2 and N 2 in the millimeter wave region. J Quant Spectrosc Radiat Transf 1988;40:129–34. doi: 10.1016/
0022- 4073(88)90150- 1 .
[392] Devi VM, Rinsland CP, Smith Ma, Benner DC, Fridovich B. Tunable diode laser measurements of air-broadened linewidths in the ν6 band of H 2 O 2 . Appl Opt
1986;25:1844–7. doi: 10.1364/AO.25.001844 . [393] Al-Refaie AF, Polyansky OL, Ovsyannikov RI, Tennyson J, Yurchenko SN. Ex-
oMol line lists–XV. A new hot line list for hydrogen peroxide. Mon Not R Astron Soc 2016;461:1012–22. doi: 10.1093/mnras/stw1295 .
[394] Al-Refaie AF, Ovsyannikov RI, Polyansky OL, Yurchenko SN, Tennyson J. A variationally calculated room temperature line-list for H 2 O 2 . J Mol Spectrosc
2015;318:84–90. doi: 10.1016/j.jms.2015.10.004 .
[395] Lyulin OM, Perevalov VI. Global modeling of vibration-rotation spectra of the acetylene molecule. J Quant Spectrosc Radiat Transf 2016;177:59–74. doi: 10.
1016/j.jqsrt.2015.12.021 . [396] Drouin BJ, Yu S. Acetylene spectra near 2.6 THz. J Mol Spectrosc
2011;269:254–6. doi: 10.1016/j.jms.2011.06.004 . [397] Jacquemart D, Lyulin OM, Perevalov VI. Recommended acetylene line list
in the 20 − 240 cm
–1 and 400 − 630 cm
–1 regions: new measurements and
global modeling. J Quant Spectrosc Radiat Transf 2017 this issue. doi: 10.1016/ j.jqsrt.2017.03.008 .
[398] Jacquemart D, Mandin J-Y, Dana V, Régalia-Jarlot L, Plateaux J-J, Décatoire D, et al. The spectrum of acetylene in the 5-μm region from new line-parameter
measurements. J Quant Spectrosc Radiat Transf 2003;76:237–67. doi: 10.1016/ S0 022-4073(02)0 0 055-9 .
[399] Lambot D, Blanquet G, Walrand J, Bouanich J-P. Diode-laser measurements
of H 2 -broadening coefficients in the ν5 band of C 2 H 2 . J Mol Spectrosc 1991;150:164–72. doi: 10.1016/0022-2852(91)90199-K .
[400] Thibault F, Corretja B, Viel A, Bermejo D, Martínez RZ, Bussery-Honvault B. Linewidths of C 2 H 2 perturbed by H 2 : experiments and calculations from
an ab initio potential. Phys Chem Chem Phys 2008;10:5419. doi: 10.1039/ b804306j .
[401] Thibault F, Ivanov SV, Buzykin OG, Gomez L, Dhyne M, Joubert P, et al. Com-
parison of classical, semiclassical and quantum methods in hydrogen broad- ening of acetylene lines. J Quant Spectrosc Radiat Transf 2011;112:1429–37.
doi: 10.1016/j.jqsrt.2011.02.011 . [402] Babay A, Ibrahimi M, Lemaire V, Lemoine B, Rohart F, Bouanich JP. Line fre-
quency shifting in the ν5 band of C 2 H 2 . J Quant Spectrosc Radiat Transf 1998;59:195–202. doi: 10.1016/S0 022-4073(97)0 0122-2 .
[403] Thibault F. Theoretical He-broadening coefficients of infrared and Ra-
man C 2 H 2 lines and their temperature dependence. J Mol Spectrosc 2005;234:286–8. doi: 10.1016/j.jms.2005.09.008 .
[404] Bond KS, Collett ND, Fuller EP, Hardwick JL, Hinds EE, Keiber TW, et al. Temperature dependence of pressure broadening and shifts of acetylene
at 1550 nm by He, Ne, and Ar. Appl Phys B 2008;90:255–62. doi: 10.1007/ s0 0340-0 07-2842-0 .
[405] Martin B, Walrand J, Blanquet G, Bouanich J-P, Lepère M. CO 2 -broadening co-
efficients in the ν4 + ν5 band of acetylene. J Mol Spectrosc 2006;236:52–7. doi: 10.1016/j.jms.2005.12.011 .
[406] Minutolo P, Corsi C, D’Amato F, De Rosa M. Self- and foreign-broadening and shift coefficients for C 2 H 2 lines at 1.54 μm. Eur Phys J D 2001;17:175–9.
doi: 10.1007/s100530170020 . [407] Lyulin OM, Campargue A. An empirical spectroscopic database for acetylene
in the regions of 5850–6341 cm
−1 and 70 0 0–9415 cm
−1 . J Quant Spectrosc Radiat Transf 2017. doi: 10.1016/j.jqsrt.2017.01.036 .
[408] Sada PV, Mccabe GH, Bjoraker GL, Jennings DE, Reuter DC. 13 C-Ethane in the
atmospheres of Jupiter and Saturn. Astrophys J 1996;472:903–7. doi: 10.1086/ 178120 .
[409] Flasar FM. Titan’s atmospheric temperatures, winds, and composition. Science (80-) 2005;308:975–8. doi: 10.1126/science.1111150 .
[410] Jennings D.E. Private communication 2015. [411] Malathy Devi V, Chris Benner D, Rinsland CP, Smith MAH, Sams RL, Blake TA,
et al. Multispectrum measurements of spectral line parameters including
temperature dependences of N 2 - and self-broadened half-width coefficients in the region of the ν9 band of 12 C 2 H 6 . J Quant Spectrosc Radiat Transf
2010;111:2481–504. doi: 10.1016/j.jqsrt.2010.07.010 . [412] Malathy Devi V, Rinsland CP, Chris Benner D, Sams RL, Blake TA. Mul-
tispectrum analysis of the ν9 band of 12 C 2 H 6 : positions, intensities, self- and N 2 -broadened half-width coefficients. J Quant Spectrosc Radiat Transf
2010;111:1234–51. doi: 10.1016/j.jqsrt.2009.10.017 .
[413] Di Lauro C, Lattanzi F, Brown LR, Sung K, Vander Auwera J, Mantz AW, et al. High resolution investigation of the 7 μm region of the ethane spectrum.
Planet Space Sci 2012;60:93–101. doi: 10.1016/j.pss.2011.01.008 . [414] Moazzen-Ahmadi N, Norooz Oliaee J, Ozier I, Wishnow EH, Sung K, Craw-
ford TJ, et al. An intensity study of the torsional bands of ethane at 35 μm. J Quant Spectrosc Radiat Transf 2015;151:123–32. doi: 10.1016/j.jqsrt.2014.09.
016 .
[415] Moazzen-Ahmadi N. A combined frequency analysis of the ν3 , ν9 , 3 ν4 and the far-infrared bands of ethane: a reassessment of the torsional param-
eters for the ground vibrational state. J Mol Spectrosc 2002;214:144–51. doi: 10.10 06/jmsp.20 02.8599 .
[416] Devi VM, Benner DC, Sung K, Crawford TJ, Mantz AW, Smith MAH. Line positions and intensities for the ν12 band of 13 C 12 CH 6 . J Mol Spectrosc
2014;301:28–38. doi: 10.1016/j.jms.2014.05.005 .
[417] Daly AM, Drouin BJ, Pearson JC, Sung K, Brown LR, Mantz A, et al. The ν17
band of C 2 H 5 D from 770 to 880 cm
−1 . J Mol Spectrosc 2015;316:1–10. doi: 10.
1016/j.jms.2015.06.006 .
Please cite this article as: I.E. Gordon et al., The HITRAN2016 molecular spectroscopic database, Journal of Quantitative Spectroscopy &
Radiative Transfer (2017), http://dx.doi.org/10.1016/j.jqsrt.2017.06.038

62 I.E. Gordon et al. / Journal of Quantitative Spectroscopy & Radiative Transfer 0 0 0 (2017) 1–66
ARTICLE IN PRESS
JID: JQSRT [m5G; August 21, 2017;14:18 ]
[418] di Lauro C, Lattanzi F, Brown LR, Sung K, Mantz AW, Smith MAH. The ν4 , ν9 , ν10 and ν6 + ν11 bands of 12 CH 3
13 CH 3 between 1345 and 1557 cm
−1 . J Mol
Spectrosc 2014;302:36–49. doi: 10.1016/j.jms.2014.06.001 . [419] Kunde V, Hanel R, Maguire W, Gautier D, Baluteau JP, Marten A, et al. The tro-
pospheric gas composition of Jupiter’s north equatorial belt /NH 3 , PH 3 , CH 3 D, GeH 4 , H 2 O/ and the Jovian D/H isotopic ratio. Astrophys J 1982;263:443.
doi: 10.1086/160516 . [420] Noll K. The spectrum of Saturn from 1990 to 2230 cm
−1 : abundances of
AsH 3 , CH 3 D, CO, GeH 4 , NH 3 , and PH 3 . Icarus 1991;89:168–89. doi: 10.1016/
0 019-1035(91)90 096-C . [421] Ridgway ST, Wallace L, Smith GR. The 80 0-120 0 inverse centimeter absorp-
tion spectrum of Jupiter. Astrophys J 1976;207:1002. doi: 10.1086/154570 . [422] Larson HP, Fink U, Smith HA, Davis DS. The middle-infrared spectrum of
Saturn-evidence for phosphine and upper limits to other trace atmospheric constituents. Astrophys J 1980;240:327. doi: 10.1086/158236 .
[423] Sousa-Silva C, Yurchenko SN, Tennyson J. A computed room temperature line
list for phosphine. J Mol Spectrosc 2013;288:28–37. doi: 10.1016/j.jms.2013.04. 002 .
[424] Sousa-Silva C, Al-Refaie AF, Tennyson J, Yurchenko SN. ExoMol line lists-VII. The rotation-vibration spectrum of phosphine up to 1500 K. Mon Not R As-
tron Soc 2014;446:2337–47. doi: 10.1093/mnras/stu2246 . [425] Malathy Devi V, Benner DC, Kleiner I, Sams RL, Fletcher LN. Line
shape parameters of PH 3 transitions in the Pentad near 4-5 μm: self-
broadened widths, shifts, line mixing and speed dependence. J Mol Spectrosc 2014;302:17–33. doi: 10.1016/j.jms.2014.06.003 .
[426] Malathy Devi V, Kleiner I, Sams RL, Brown LR, Benner DC, Fletcher LN. Line positions and intensities of the phosphine (PH 3 ) Pentad near 4.5 μm. J Mol
Spectrosc 2014;298:11–23. doi: 10.1016/j.jms.2014.01.013 . [427] Nikitin AV, Ivanova YA, Rey M, Tashkun SA, Toon GC, Sung K, et al. Analysis
of PH 3 spectra in the octad range 2733-3660 cm
−1 . J Quant Spectrosc Radiat
Transf 2017:1–8 this issue. doi: 10.1016/j.jqsrt.2017.04.032 . [428] Nikitin AV, Holka F, Tyuterev VG, Fremont J. Vibration energy levels of the
PH 3 , PH 2 D, and PHD 2 molecules calculated from high order potential energy surface. J Chem Phys 2009;130:244312. doi: 10.1063/1.3156311 .
[429] Nikitin AV, Rey M, Tyuterev VG. High order dipole moment surfaces of PH 3 and ab initio intensity predictions in the Octad range. J Mol Spectrosc
2014;305:40–7. doi: 10.1016/j.jms.2014.09.010 .
[430] Rey M, Nikitin AV, Tyuterev VG. Ab initio ro-vibrational Hamiltonian in irre- ducible tensor formalism: a method for computing energy levels from poten-
tial energy surfaces for symmetric-top molecules. Mol Phys 2010;108:2121–35. doi: 10.1080/00268976.2010.506892 .
[431] Ulenikov ON, Malikova AB, Koivusaari M, Alanko S, Anttila R. High resolution vibrational–rotational spectrum of H 2 S in the region of the ν2 fundamental
band. J Mol Spectrosc 1996;176:229–35. doi: 10.10 06/jmsp.1996.0 082 .
[432] Flaud J-M, Camy-Peyret C, Johns JWC. The far-infrared spectrum of hydrogen sulfide. The (0 0 0) rotational constants of H 2
32 S, H 2 33 S, and H 2
34 S. Can J Phys
1983;61:1462–73. doi: 10.1139/p83-188 . [433] Brown LR, Crisp JA, Crisp D, Naumenko OV, Smirnov MA, Sinitsa LN, et al.
The absorption spectrum of H 2 S between 2150 and 4260 cm
−1 : analysis of the positions and intensities in the first (2 ν2 , ν1 , and ν3 ) and second (3 ν2 ,
ν1 + ν2 , and ν2 + ν3 ). J Mol Spectrosc 1998;188:148–74. doi: 10.1006/jmsp.1997. 7501 .
[434] Rothman LS, Barbe A, Chris Benner D, Brown LR, Camy-Peyret C, Carleer MR,
et al. The HITRAN molecular spectroscopic database: edition of 20 0 0 includ- ing updates through 2001. J Quant Spectrosc Radiat Transf 2003;82:5–44.
doi: 10.1016/S0 022-4073(03)0 0146-8 . [435] Waschull J, Kuhnemann F, Sumpf B. Self-, air, and helium broadening
in the ν2 band of H 2 S. J Mol Spectrosc 1994;165:150–8. doi: 10.1006/jmsp. 1994.1117 .
[436] Sumpf B, Meusel I, Kronfeldt H-D. Self- and air-broadening in the ν1 and ν3
bands of H 2 S. J Mol Spectrosc 1996;177:143–5. doi: 10.1006/jmsp.1996.0126 . [437] Kissel A, Sumpf B, Kronfeldt H-D, Tikhomirov B, Ponomarev Y. Molecular-Gas-
Pressure-induced line-shift and line-broadening in the ν2 -band of H 2 S. J Mol Spectrosc 2002;216:345–54. doi: 10.1006/jmsp.2002.8630 .
[438] Sumpf B. Experimental investigation of the self-broadening coefficients in the ν1 + ν3 band of SO 2 and the 2 ν2 band of H 2 S. J Mol Spectrosc 1997;181:160–
7. doi: 10.1006/jmsp.1996.7168 .
[439] Tan Y, Kochanov RV, Rothman LS, Gordon IE. The broadening coefficients of H 2 S 2016. doi: 10.5281/zenodo.345381 .
[440] Ball CD, Dutta JM, Beaky MM, Goyette TM, De Lucia FC. Variable-temperature pressure broadening of H 2 S by O 2 and N 2 . J Quant Spectrosc Radiat Transf
1999;61:775–80. doi: 10.1016/S0 022-4073(98)0 0 065-X . [441] Ciaffoni L, Cummings BL, Denzer W, Peverall R, Procter SR, Ritchie GAD.
Line strength and collisional broadening studies of hydrogen sulphide in the
1.58 μm region using diode laser spectroscopy. Appl Phys B 2008;92:627–33. doi: 10.10 07/s0 0340-0 08-3119-y .
[4 42] Nelson DD, Zahniser MS. Air-broadened linewidth measurements in the ν2
vibrational band of the hydroperoxyl radical. J Mol Spectrosc 1994;166:273–
9. doi: 10.1006/jmsp.1994.1193 . [443] Minamida M, Tonokura K. Air broadening coefficients for the ν3 band of hy-
droperoxyl radicals. J Quant Spectrosc Radiat Transf 2014;148:65–9. doi: 10.
1016/j.jqsrt.2014.06.020 . [4 4 4] Mizoguchi A, Yagi T, Kondo K, Sato TO, Kanamori H. Submillimeter-wave mea-
surements of N 2 and O 2 pressure broadening for HO 2 radical generated by Hg-photosensitized reaction. J Quant Spectrosc Radiat Transf 2012;113:279–
85. doi: 10.1016/j.jqsrt.2011.11.009 .
[445] Miyano S, Tonokura K. Measurements of nitrogen-broadening coefficients in the ν3 band of the hydroperoxyl radical using a continuous wave
quantum cascade laser. J Mol Spectrosc 2011;265:47–51. doi: 10.1016/j.jms. 2010.10.010 .
[446] Chance K, Denatale P, Bellini M, Inguscio M, Dilonardo G, Fusina L. Pressure broadening of the 2.4978-THz rotational lines of HO 2 by N 2 and O 2 . J Mol
Spectrosc 1994;163:67–70. doi: 10.1006/jmsp.1994.1007 . [447] Ibrahim N, Thiebaud J, Orphal J, Fittschen C. Air-broadening coefficients of
the HO 2 radical in the 2 ν1 band measured using cw-CRDS. J Mol Spectrosc
2007;242:64–9. doi: 10.1016/j.jms.2007.02.007 . [448] Tan Y, Kochanov RV, Rothman LS, Gordon IE. The air-broadening coefficients
of HO 2 . 2016. doi:10.5281/zenodo.35917. [449] Rothman LS, Rinsland CP, Goldman A, Massie ST, Edwards DP, Flaud J-M,
et al. The HITRAN molecular spectroscopic database and HAWKS (HITRAN
Atmospheric Workstation): 1996 edition. J Quant Spectrosc Radiat Transf
1998;60:665–710. doi: 10.1016/S0 022-4073(98)0 0 078-8 .
[450] Zink LR, Evenson KM, Matsushima F, Nelis T, Robinson RL. Atomic oxygen fine-structure splittings with tunable far-infrared spectroscopy. Astrophys J
1991;371:L85. doi: 10.1086/186008 . [451] Pickett HM, Poynter RL, Cohen EA, Delitsky ML, Pearson JC, Müller HSP. Sub-
millimeter, millimeter, and microwave spectral line catalog. J Quant Spectrosc Radiat Transf 1998;60:883–90. doi: 10.1016/S0 022-4073(98)0 0 091-0 .
[452] López-Puertas M, Flaud J-M, Peralta-Calvillo J, Funke B, Gil-López S. NO + fun-
damental and first hot ro-vibrational line frequencies from MIPAS/Envisat at- mospheric spectra. J Mol Spectrosc 2006;237:218–24. doi: 10.1016/j.jms.2006.
03.015 . [453] Cernicharo J, Bailleux S, Alekseev E, Fuente A, Roueff E, Gerin M, et al. Ten-
tative detection of the nitrosylium ion in space. Astrophys J 2014;795:40. doi: 10.1088/0 0 04-637X/795/1/40 .
[454] Endres CP, Schlemmer S, Schilke P, Stutzki J, Müller HSP. The Cologne
Database for Molecular Spectroscopy, CDMS, in the Virtual Atomic and Molecular Data Centre, VAMDC. J Mol Spectrosc 2016;327:95–104. doi: 10.
1016/j.jms.2016.03.005 . [455] Bowman WC, Herbst E, De Lucia FC. Millimeter and submillimeter spectrum
of NO + . J Chem Phys 1982;77:4261–2. doi: 10.1063/1.4 4 4307 . [456] Ho WC, Ozier I, Cramb DT, Gerry MCL. Diode laser spectroscopy of the vibra-
tional fundamental of NO + . J Mol Spectrosc 1991;149:559–61. doi: 10.1016/
0022- 2852(91)90311- W . [457] Polák R, Fišer J. A comparative icMRCI study of some NO + , NO and NO −
electronic ground state properties. Chem Phys 2004;303:73–83. doi: 10.1016/ j.chemphys.2004.04.027 .
[458] Sawada S, Totsuka T. Natural and anthropogenic sources and fate of atmo- spheric ethylene. Atmos Environ 1986;20:821–32. doi: 10.1016/0 0 04-6981(86)
90266-0 .
[459] Hesman BE, Bjoraker GL, Sada PV, Achterberg RK, Jennings DE, Romani PN, et al. Elusive ethylene detected in Saturn’s northern storm region. Astrophys
J 2012;760:24. doi: 10.1088/0 0 04-637X/760/1/24 . [460] Vander Auwera J, Fayt A, Tudorie M, Rotger M, Boudon V, Franco B, et al.
Self-broadening coefficients and improved line intensities for the ν7 band of ethylene near 10.5 μm, and impact on ethylene retrievals from Jungfraujoch
solar spectra. J Quant Spectrosc Radiat Transf 2014;148:177–85. doi: 10.1016/j. jqsrt.2014.07.003 .
[461] Alkadrou A, Bourgeois M-T, Rotger M, Boudon V, Vander Auwera J. Global
frequency and intensity analysis of the ν10 / ν7 / ν4 / ν12 band system of 12 C 2 H 4
at 10 μm using the D 2h Top Data System. J Quant Spectrosc Radiat Transf
2016;182:158–71. doi: 10.1016/j.jqsrt.2016.05.024 . [462] Willaert F, Demaison J, Margules L, Mäder H, Spahn H, Giesen T, et al.
The spectrum of ethylene from microwave to submillimetre-wave. Mol Phys 2006;104:273–92. doi: 10.1080/00268970500273314 .
[463] Cauuet I, Walrand J, Blanquet G, Valentin a, Henry L, Lambeau C, et al. Ex-
tension to third-order Coriolis terms of the analysis of ν10 , ν7 , and ν4 levels of ethylene on the basis of Fourier transform and diode laser spectra. J Mol
Spectrosc 1990;139:191–214. doi: 10.1016/0022- 2852(90)90251- K . [464] Legrand J, Azizi M, Herlemont F, Fayt A. Saturation spectroscopy of C 2 H 4
using a CO 2 laser sideband spectrometer. J Mol Spectrosc 1995;171:13–21. doi: 10.1006/jmsp.1995.1099 .
[465] Rusinek E, Fichoux H, Khelkhal M, Herlemont F, Legrand J, Fayt A. Subdoppler
study of the ν7 band of C 2 H 4 with a CO 2 laser sideband spectrometer. J Mol Spectrosc 1998;189:64–73. doi: 10.1006/jmsp.1998.7539 .
[466] Blass WE, Jennings L, Ewing AC, Daunt SJ, Weber MC, Senesac L, et al. Ab- solute intensities in the ν7 band of ethylene: tunable laser measurements
used to calibrate FTS broadband spectra. J Quant Spectrosc Radiat Transf 2001;68:467–72. doi: 10.1016/S0 022-4073(0 0)0 0 050-9 .
[467] Rotger M, Boudon V, Vander Auwera J. Line positions and intensities in the
ν12 band of ethylene near 1450 cm
−1 : an experimental and theoretical study. J Quant Spectrosc Radiat Transf 2008;109:952–62. doi: 10.1016/j.jqsrt.2007.12.
005 . [468] Alkadrou A, Bourgeois M-T, Rotger M, Boudon V, Vander Auwera J. Corrigen-
dum to “Global frequency and intensity analysis of the ν10 / ν7 / ν4 / ν12 band system of 12 C 2 H 4 at 10 μm using the D2h top data system. J Quant Spectrosc
Radiat Transf 2017;190:88. doi: 10.1016/j.jqsrt.2017.01.007 .
[469] Rey M, Delahaye T, Nikitin A V, Tyuterev VG. First theoretical global line lists of ethylene ( 12 C 2 H 4 ) spectra for the temperature range 50-700 K in
the far-infrared for quantification of absorption and emission in planetary atmospheres. Astron Astrophys 2016;594:A47. doi: 10.1051/0 0 04-6361/
201629004 .
Please cite this article as: I.E. Gordon et al., The HITRAN2016 molecular spectroscopic database, Journal of Quantitative Spectroscopy &
Radiative Transfer (2017), http://dx.doi.org/10.1016/j.jqsrt.2017.06.038

I.E. Gordon et al. / Journal of Quantitative Spectroscopy & Radiative Transfer 0 0 0 (2017) 1–66 63
ARTICLE IN PRESS
JID: JQSRT [m5G; August 21, 2017;14:18 ]
[470] Delahaye T, Nikitin A, Rey M, Szalay PG, Tyuterev VG. A new accurate ground- state potential energy surface of ethylene and predictions for rotational and
vibrational energy levels. J Chem Phys 2014;141. doi: 10.1063/1.4894419 . [471] Delahaye T, Nikitin AV, Rey M, Szalay PG, Tyuterev VG. Accurate 12D dipole
moment surfaces of ethylene. Chem Phys Lett 2015;639:275–82. doi: 10.1016/ j.cplett.2015.09.042 .
[472] Flaud J-M, Lafferty WJ, Malathy Devi V, Sams RL, Chris Benner D. Absolute line intensities and self-broadened half-width coefficients in the ethylene-
1- 13 C bands in the 700–1190 cm
−1 region. J Mol Spectrosc 2011;267:3–12.
doi: 10.1016/j.jms.2011.01.002 . [473] Flaud J-M, Lafferty WJ, Sams R, Malathy Devi V. High resolution analysis
of the ethylene-1- 13 C spectrum in the 8.4–14.3-μm region. J Mol Spectrosc 2010;259:39–45. doi: 10.1016/j.jms.2009.10.003 .
[474] Kleinböhl A, Toon GC, Sen B, Blavier JFL, Weisenstein DK, Wennberg PO. In- frared measurements of atmospheric CH 3 CN. Geophys Res Lett 2005;32:1–5.
doi: 10.1029/2005GL024283 .
[475] Remijan AJ, Milam SN, Womack M, Apponi AJ, Ziurys LM, Wyckoff S, et al. The distribution, excitation, and formation of cometary molecules: methanol,
methyl cyanide, and ethylene glycol. Astrophys J 2008;689:613–21. doi: 10. 1086/592242 .
[476] Marten A. New millimeter heterodyne observations of Titan: vertical distri- butions of nitriles HCN, HC 3 N, CH 3 CN, and the isotopic ratio 15 N/ 14 N in its
atmosphere. Icarus 2002;158:532–44. doi: 10.10 06/icar.20 02.6897 .
[477] Rinsland CP, Malathy Devi V, Chris Benner D, Blake TA, Sams RL, Brown LR, et al. Multispectrum analysis of the ν4 band of CH 3 CN: Positions, intensities,
self- and N 2 -broadening, and pressure-induced shifts. J Quant Spectrosc Ra- diat Transf 2008;109:974–94. doi: 10.1016/j.jqsrt.2007.11.013 .
[478] Müller HSP. https://molspect.chemistry.ohio-state.edu/symposium _ 65/ symposium/Abstracts/p003.pdf .
[479] Müller HSP, Brown LR, Drouin BJ, Pearson JC, Kleiner I, Sams RL, et al. Ro-
tational spectroscopy as a tool to investigate interactions between vibra- tional polyads in symmetric top molecules: Low-lying states v 8 < 3 of methyl
cyanide CH 3 CN. J Mol Spectrosc 2015;312:22–37. doi: 10.1016/j.jms.2015.02. 009 .
[480] Koivusaari M, Horneman V-M, Anttila R. High-resolution study of the in- frared band ν8 of CH 3 CN. J Mol Spectrosc 1992;152:377–88. doi: 10.1016/
0 022-2852(92)90 076-Z .
[481] Cazzoli G, Puzzarini C. The Lamb-dip spectrum of methylcyanide: precise ro- tational transition frequencies and improved ground-state rotational parame-
ters. J Mol Spectrosc 2006;240:153–63. doi: 10.1016/j.jms.2006.09.013 . [482] Müller HSP, Drouin BJ, Pearson JC. Rotational spectra of isotopic species of
methyl cyanide, CH 3 CN, in their ground vibrational states up to terahertz frequencies. Astron Astrophys 2009;506:1487–99. doi: 10.1051/0 0 04-6361/
200912932 .
[483] Anttila R, Horneman VM, Koivusaari M, Paso R. Ground State Constants A 0 , D K0 and H K0 of CH 3 CN. J Mol Spectrosc 1993;157:198–207. doi: 10.1006/jmsp.
1993.1016 . [484] Bauer A, Tarrago G, Remy A. Analysis of the rotational spectrum of C 3v
molecules by using factorization and diagonalization of the energy matrix. J Mol Spectrosc 1975;58:111–24. doi: 10.1016/0022-2852(75)90160-5 .
[485] Tolonen AM, Koivusaari M, Paso R, Schroderus J, Alanko S, Anttila R. The in- frared spectrum of methyl cyanide between 850 and 1150 cm
−1 : analysis of
the ν4 , ν7 , and 3 ν18 bands with resonances. J Mol Spectrosc 1993;160:554–
65. doi: 10.1006/jmsp.1993.1201 . [486] Carlos M., Gruson O., Rotger M., Thomas X., Loëte M., Boudon V. High-
resolution spectroscopy and analysis of various bands of CF 4 to elucidate its hot band structure. 2017.
[487] Georges R. Private communication. 2016. [488] Jolly A, Fayt A, Benilan Y, Jacquemart D, Nixon CA. The ν8 bending mode
of diacetylene: from laboratory spectroscopy to the detection of 13 C iso-
topologues in Titan’s atmosphere. Astrophys J 2010;714:852–9. doi: 10.1088/ 0 0 04-637X/714/1/852 .
[489] Jolly A, Manceron L, Kwabia-Tchana F, Benilan Y, Gazeau M-C. Revised in- frared bending mode intensities for diacetylene (C 4 H 2 ): Application to Titan.
Planet Space Sci 2014;97:60–4. doi: 10.1016/j.pss.2014.03.020 . [490] Malek SE, Cami J, Bernard-Salas J. The rich circumstellar chemistry of Smp
Lmc 11. Astrophys J 2012;744:16. doi: 10.1088/0 0 04-637X/744/1/16 .
[491] Pachucki K, Komasa J. Electric dipole rovibrational transitions in the HD molecule. Phys Rev A 2008;78:52503. doi: 10.1103/PhysRevA.78.052503 .
[492] Wolniewicz L, Simbotin I, Dalgarno A. Quadrupole transition probabilities for the excited rovibrational states of H 2 . Astrophys J Suppl Ser 1998;293. doi: 10.
1086/313091 . [493] Thibault F, Wcisło P, Ciuryło R. A test of H 2 -He potential energy surfaces. Eur
Phys J D 2016;70:236. doi: 10.1140/epjd/e2016-70114-9 .
[494] Michaud J-P, Krupitsky D, Grove JS, Anderson BS. Volcano related atmospheric toxicants in Hilo and Hawaii volcanoes national park: implications for human
health. Neurotoxicology 2005;26:555–63. doi: 10.1016/j.neuro.20 04.12.0 04 . [495] Hieta T, Merimaa M. Simultaneous detection of SO 2 , SO 3 and H 2 O using
QCL spectrometer for combustion applications. Appl Phys B 2014;117:847–54. doi: 10.10 07/s0 0340- 014- 5896- 9 .
[496] Zhang X, Liang M-C, Montmessin F, Bertaux J-L, Parkinson C, Yung YL. Pho-
tolysis of sulphuric acid as the source of sulphur oxides in the mesosphere of Venus. Nat Geosci 2010;3:834–7. doi: 10.1038/ngeo989 .
[497] Zhang X, Liang MC, Mills FP, Belyaev DA, Yung YL. Sulfur chemistry in the middle atmosphere of Venus. Icarus 2012;217:714–39. doi: 10.1016/j.icarus.
2011.06.016 .
[498] Whitehill AR, Xie C, Hu X, Xie D, Guo H, Ono S. Vibronic origin of sulfur mass-independent isotope effect in photoexcitation of SO 2 and the implica-
tions to the early earth’s atmosphere. Proc Natl Acad Sci 2013;110:17697–702. doi: 10.1073/pnas.1306979110 .
[499] Ortigoso J, Escribano R, Maki AG. The ν2 and ν4 IR bands of SO 3 . J Mol Spec- trosc 1989;138:602–13. doi: 10.1016/0 022-2852(89)90 021-0 .
[500] Kaldor A, Maki AG, Dorney AJ, Mills IM. The assignment of ν2 and ν4 of SO 3 . J Mol Spectrosc 1973;45:247–52. doi: 10.1016/0022-2852(73)90155-0 .
[501] Maki A, Blake Ta, Sams RL, Frieh J, Barber J, Masiello T, et al. Analysis
of some combination-overtone infrared bands of 32 S 16 O 3 . J Mol Spectrosc 2004;225:109–22. doi: 10.1016/j.jms.2004.02.008 .
[502] Maki A, Blake TA, Sams RL, Vulpanovici N, Barber J, Chrysostom ETH, et al. High-Resolution Infrared Spectra of the ν2 , ν3 , ν4 , and 2 ν3 Bands of 32 S 16 O 3 .
J Mol Spectrosc 2001;210:240–9. doi: 10.10 06/jmsp.20 01.8454 . [503] Underwood DS, Tennyson J, Yurchenko SN. An ab initio variationally com-
puted room-temperature line list for 32 S 16 O 3 . Phys Chem Chem Phys
2013;15:10118. doi: 10.1039/c3cp50303h . [504] Meyer V, Sutter DH, Dreizler H. The centrifugally induced pure rotational
spectrum and the structure of sulfur trioxide. A microwave Fourier trans- form study of a nonpolar molecule. Zeitschrift Für Naturforsch A 1991;46.
doi: 10.1515/zna- 1991- 0811 . [505] Underwood DS, Yurchenko SN, Tennyson J, Jensen P. Rotational spectrum of
SO 3 and theoretical evidence for the formation of sixfold rotational energy-
level clusters in its vibrational ground state. J Chem Phys 2014;140. doi: 10. 1063/1.4882865 .
[506] Underwood DS, Yurchenko SN, Tennyson J, Al-Refaie AF, Clausen S, Fa- teev A. ExoMol molecular line lists–XVII. The rotation–vibration spectrum of
hot SO 3 . Mon Not R Astron Soc 2016;462:4300–13. doi: 10.1093/mnras/ stw1828 .
[507] Teanby NA, Irwin PGJ, de Kok R, Jolly A, Bezard B, Nixon CA, et al. Titan’s
stratospheric C 2 N 2 , C 3 H 4 , and C 4 H 2 abundances from Cassini/CIRS far-infrared spectra. Icarus 2009;202:620–31. doi: 10.1016/j.icarus.2009.03.022 .
[508] Fayt A, Jolly A, Benilan Y, Manceron L, Kwabia-Tchana F, Guillemin J-C. Frequency and intensity analyses of the far infrared ν5 band system of
cyanogen (C 2 N 2 ) and applications to Titan. J Quant Spectrosc Radiat Transf 2012;113:1195–219. doi: 10.1016/j.jqsrt.2012.02.003 .
[509] Kiester E . An incomplete history of World War I. Pier 9, Murdoch Books;
2007 . [510] Fu D, Boone CD, Bernath PF, Walker KA, Nassar R, Manney GL, et al. Global
phosgene observations from the atmospheric chemistry experiment (ACE) mission. Geophys Res Lett 2007;34:L17815. doi: 10.1029/2007GL029942 .
[511] Toon GC, Blavier J-F, Sen B, Drouin BJ. Atmospheric COCl 2 measured by so- lar occultation spectrometry. Geophys Res Lett 2001;28:2835–8. doi: 10.1029/
20 0 0GL012156 .
[512] Valeri M, Carlotti M, Flaud J-M, Raspollini P, Ridolfi M, Dinelli BM. Phosgene in the UTLS: seasonal and latitudinal variations from MIPAS observations. At-
mos Meas Tech Discuss 2016:1–19. doi: 10.5194/amt- 2016- 62 . [513] Tchana FK, Lafferty WJ, Flaud J-M, Manceron L, Ndao M. High-resolution anal-
ysis of the ν1 and ν5 bands of phosgene 35 Cl 2 CO and 35 Cl 37 ClCO. Mol Phys 2015;113:3241–6. doi: 10.1080/00268976.2015.1015638 .
[514] Clough SA, Shephard MW, Mlawer EJ, Delamere JS, Iacono MJ, Cady-Pereira K, et al. Atmospheric radiative transfer modeling: a summary of the AER codes.
J Quant Spectrosc Radiat Transf 2005;91:233–44. doi: 10.1016/j.jqsrt.2004.05.
058 . [515] Chetwynd JH, Wang J, Anderson GP, Fast Atmospheric Signature CODE.
(FASCODE): an update and applications in atmospheric remote sensing. In: Wang J, Hays PB, editors. SPIE’s 1994 Int. Symp. Opt. Imaging, Instrum., In-
ternational Society for Optics and Photonics; 1994. p. 613. doi: 10.1117/12. 187599 .
[516] Anderson GP, Kneizys FX, Chetwynd JH Jr, Rothman LS, Hoke ML, Berk A,
et al. Reviewing atmospheric radiative transfer modeling: new developments in high- and moderate-resolution FASCODE/FASE and MODTRAN SPIE’s 1996
Int Symp Opt Sci Eng Instrum, 82. editors. International Society for Optics and Photonics; 1996. doi: 101117/12256105 .
[517] Killinger DK, Wilcox WE, Pliutau D. HITRAN-PC: 25 years of academic devel- opment and commercialization of laser atmospheric transmission software
for environmental remote sensing. Technol Innov 2012;14:303–27. doi: 10.
3727/194982412X1350 0 042169054 . [518] Edwards P. GENLN2: A General Line-by-line Atmospheric Transmittance and
Radiance Model. Version 3.0 Description and Users Guide 1992. doi: 10.5065/ D6W37T86 .
[519] Johnson TJ, Profeta LTM, Sams RL, Griffith DWT, Yokelson RL. An infrared spectral database for detection of gases emitted by biomass burning. Vib
Spectrosc 2010;53:97–102. doi: 10.1016/j.vibspec.2010.02.010 .
[520] Hodnebrog Ø, Etminan M, Fuglestvedt JS, Marston G, Myhre G, Nielsen CJ, et al. Global warming potentials and radiative efficiencies of halocarbons and
related compounds: A comprehensive review. Rev Geophys 2013;51:300–78. doi: 10.10 02/rog.20 013 .
[521] Highwood E, Shine K. Radiative forcing and global warming potentials of 11 halogenated compounds. J Quant Spectrosc Radiat Transf 20 0 0;66:169–83.
doi: 10.1016/S0 022-4073(99)0 0215-0 .
[522] Wagner G, Birk M. New infrared spectroscopic database for bromine nitrate. J Mol Spectrosc 2016;326:95–105. doi: 10.1016/j.jms.2016.03.007 .
[523] Harrison JJ. New and improved infrared absorption cross sections for dichlorodifluoromethane (CFC-12). Atmos Meas Tech 2015;8:3197–207.
doi: 10.5194/amt- 8- 3197- 2015 .
Please cite this article as: I.E. Gordon et al., The HITRAN2016 molecular spectroscopic database, Journal of Quantitative Spectroscopy &
Radiative Transfer (2017), http://dx.doi.org/10.1016/j.jqsrt.2017.06.038

64 I.E. Gordon et al. / Journal of Quantitative Spectroscopy & Radiative Transfer 0 0 0 (2017) 1–66
ARTICLE IN PRESS
JID: JQSRT [m5G; August 21, 2017;14:18 ]
[524] Harrison JJ. New and improved infrared absorption cross sections for chlorod- ifluoromethane (HCFC-22). Atmos Meas Tech 2016;9:2593–601. doi: 10.5194/
amt- 9- 2593- 2016 . [525] Harrison JJ, Boone CD, Bernath PF. New and improved infra-red absorption
cross sections and ACE-FTS retrievals of carbon tetrachloride (CCl4). J Quant Spectrosc Radiat Transf 2017;186:139–49. doi: 10.1016/j.jqsrt.2016.04.025 .
[526] Harrison JJ. Infrared absorption cross sections for trifluoromethane. J Quant Spectrosc Radiat Transf 2013;130:359–64. doi: 10.1016/j.jqsrt.2013.05.026 .
[527] Harrison JJ. Infrared absorption cross sections for 1,1,1,2-tetrafluoroethane. J
Quant Spectrosc Radiat Transf 2015;151:210–16. doi: 10.1016/j.jqsrt.2014.09. 023 .
[528] Reed ZD, Hodges JT. Self- and air-broadened cross sections of ethane (C 2 H 6 ) determined by frequency-stabilized cavity ring-down spectroscopy
near 1.68 μm. J Quant Spectrosc Radiat Transf 2015;159:87–93. doi: 10.1016/ j.jqsrt.2015.03.010 .
[529] Davis ME, Bernard F, McGillen MR, Fleming EL, Burkholder JB. UV and
infrared absorption spectra, atmospheric lifetimes, and ozone depletion and global warming potentials for CCl 2 FCCl 2 F (CFC-112), CCl 3 CClF 2 (CFC-
112a), CCl 3 CF 3 (CFC-113a), and CCl 2 FCF 3 (CFC-114a). Atmos Chem Phys 2016;16:8043–52. doi: 10.5194/acp-16-8043-2016 .
[530] Etminan M, Highwood EJ, Laube JC, McPheat R, Marston G, Shine KP, et al. Infrared absorption spectra, radiative efficiencies, and global warming po-
tentials of newly-detected halogenated compounds: CFC-113a, CFC-112 and
HCFC-133a. Atmosphere (Basel) 2014;5:473–83. doi: 10.3390/atmos5030473 . [531] Godin PJ, Cabaj A, Conway S, Hong AC, Le Bris K, Mabury SA, et al.
Temperature-dependent absorption cross-sections of perfluorotributylamine. J Mol Spectrosc 2016;323:53–8. doi: 10.1016/j.jms.2015.11.004 .
[532] Godin PJ, Cabaj A, Xu L-H, Le Bris K, Strong K. A study of the tem- perature dependence of the infrared absorption cross-sections of 2,2,3,3,3-
pentafluoropropanol in the range of 298–362 K. J Quant Spectrosc Radiat
Transf 2017;186:150–7. doi: 10.1016/j.jqsrt.2016.05.031 . [533] Sellevag SR , D’Anna B , Nielsen CJ . Infrared absorption cross-sections and
estimated global warming potentials of CF 3 CH 2 CH 2 OH, CHF 2 CF 2 CH 2 OH, CF 3 CF 2 CH 2 OH, CF 3 CHFCF 2 CH 2 OH, and CF 3 CF 2 CF 2 CH 2 OH. Asian Chem Lett
2007;11:33–40 . [534] González S, Jiménez E, Ballesteros B, Martínez E, Albaladejo J. Hydroxyl
radical reaction rate coefficients as a function of temperature and IR ab-
sorption cross sections for CF 3 CH = CH 2 (HFO-1243zf), potential replacement of CF 3 CH 2 F (HFC-134a). Environ Sci Pollut Res 2014:4793–805. doi: 10.1007/
s11356- 014- 3426- 2 . [535] Le Bris K, Graham L. Quantitative comparisons of absorption cross-section
spectra and integrated intensities of HFC-143a. J Quant Spectrosc Radiat Transf 2015;151:13–17. doi: 10.1016/j.jqsrt.2014.09.005 .
[536] McGillen MR, Bernard F, Fleming EL, Burkholder JB. HCFC-133a (CF 3 CH 2 Cl):
OH rate coefficient, UV and infrared absorption spectra, and atmospheric im- plications. Geophys Res Lett 2015;42:6098–105. doi: 10.1002/2015GL064939 .
[537] Papadimitriou VC, Burkholder JB. OH radical reaction rate coefficients, in- frared spectrum, and global warming potential of (CF 3 ) 2 CFCH
= CHF (HFO-
1438ezy( E )). J Phys Chem A 2016;120:6618–28. doi: 10.1021/acs.jpca.6b06096 . [538] Rodríguez A, Bravo I, Rodríguez D, Tajuelo M, Diaz-de-Mera Y, Aranda A. The
environmental impact of unsaturated fluoroesters: atmospheric chemistry to- wards OH radicals and Cl atoms, radiative behavior and cumulative ozone
creation. RSC Adv 2016;6:21833–43. doi: 10.1039/C6RA00630B .
[539] Rodríguez A, Rodríguez D, Moraleda A, Bravo I, Moreno E, Notario A. Atmo- spheric chemistry of HFE-7300 and HFE-7500: temperature dependent kinet-
ics, atmospheric lifetimes, infrared spectra and global warming potentials. At- mos Environ 2014;96:145–53. doi: 10.1016/j.atmosenv.2014.07.033 .
[540] Wallington TJ, Pivesso BP, Lira AM, Anderson JE, Nielsen CJ, Andersen NH, et al. CH 3 Cl, CH 2 Cl 2 , CHCl 3 , and CCl 4 : infrared spectra, radiative efficiencies,
and global warming potentials. J Quant Spectrosc Radiat Transf 2016;174:56–
64. doi: 10.1016/j.jqsrt.2016.01.029 . [541] Tereszchuk KA, Bernath PF. Infrared absorption cross-sections for acetalde-
hyde (CH 3 CHO) in the 3 μm region. J Quant Spectrosc Radiat Transf 2011;112:990–3. doi: 10.1016/j.jqsrt.2010.12.003 .
[542] Sihra K, Hurley MD, Shine KP, Wallington TJ. Updated radiative forcing es- timates of 65 halocarbons and nonmethane hydrocarbons. J Geophys Res
2001;106:20493–505. doi: 10.1029/2000JD900716 .
[543] Bravo I, Aranda A, Hurley MD, Marston G, Nutt DR, Shine KP, et al. Infrared absorption spectra, radiative efficiencies, and global warming potentials of
perfluorocarbons: comparison between experiment and theory. J Geophys Res Atmos 2010b;115:1–12. doi: 10.1029/2010JD014771 .
[544] Young CJ, Hurley MD, Wallington TJ, Mabury SA. Atmospheric chemistry of CF 3 CF 2 H and CF 3 CF 2 CF 2 CF 2 H: Kinetics and products of gas-phase reactions
with Cl atoms and OH radicals, infrared spectra, and formation of perfluoro-
carboxylic acids. Chem Phys Lett 2009b;473:251–6. doi: 10.1016/j.cplett.2009. 04.001 .
[545] Gohar LK, Myhre G, Shine KP. Updated radiative forcing estimates of four halocarbons. J Geophys Res 2004;109:D01107. doi: 10.1029/
20 03JD0 04320 . [546] Hurley MD, Wallington TJ, Buchanan GA, Gohar LK, Marston G, Shine KP.
IR spectrum and radiative forcing of CF 4 revisited. J Geophys Res D Atmos
2005;110:1–8. doi: 10.1029/2004JD005201 . [547] Nielsen OJ, Nicolaisen FM, Bacher C, Hurley MD, Wallington TJ, Shine KP.
Infrared spectrum and global warming potential of SF 5 CF 3 . Atmos Environ 2002;36 1237–40. doi: 10.1016/S1352-2310(01)00551-9 .
[548] Sung K, Toon GC, Mantz AW, Smith MAH. FT-IR measurements of cold C 3 H 8
cross sections at 7–15 μm for Titan atmosphere. Icarus 2013;226:1499–513. doi: 10.1016/j.icarus.2013.07.028 .
[549] Buzan EM, Hargreaves RJ, Bernath PF. High resolution absorption cross sec- tions for propylene in the 3 μm region at high temperatures. Mol Astrophys
2016;3–4:16–20. doi: 10.1016/j.molap.2016.06.001 . [550] Hargreaves RJ, Buzan E, Dulick M, Bernath PF. High-resolution absorption
cross sections of C 2 H 6 at elevated temperatures. Mol Astrophys 2015;1:20–5. doi: 10.1016/j.molap.2015.09.001 .
[551] Sung K, Toon GC, Crawford TJ. N 2 - and (H 2 + He)-broadened cross sections of
benzene (C 6 H 6 ) in the 7–15 μm region for the Titan and jovian atmospheres. Icarus 2016;271:438–52. doi: 10.1016/j.icarus.2016.01.012 .
[552] Beale CA, Hargreaves RJ, Bernath PF. Temperature-dependent high resolu- tion absorption cross sections of propane. J Quant Spectrosc Radiat Transf
2016;182:219–24. doi: 10.1016/j.jqsrt.2016.06.006 . [553] Andersen MPS, Nilsson EJK, Nielsen OJ, Johnson MS, Hurley MD, Walling-
ton TJ. Atmospheric chemistry of trans-CF 3 CHCHCl: Kinetics of the gas-phase
reactions with Cl atoms, OH radicals, and O3. J Photochem Photobiol A Chem
2008;199:92–7. doi: 10.1016/j.jphotochem.2008.05.013 .
[554] Hurley MD, Ball JC, Wallington TJ. Atmospheric chemistry of the Z and E isomers of CF 3 CFCHF; kinetics, mechanisms, and products of gas-phase reac-
tions with Cl atoms, OH radicals, and O 3 . J Phys Chem A 2007;111:9789–95. doi: 10.1021/jp0753530 .
[555] Sulbaek Andersen MP, Waterland RL, Sander SP, Nielsen OJ, Wallington TJ.
Atmospheric chemistry of CxF 2 x + 1CHCH 2 (x = 1, 2, 4, 6 and 8): radiative efficiencies and global warming potentials. J Photochem Photobiol A Chem
2012b;233:50–2. doi: 10.1016/j.jphotochem.2012.02.020 . [556] Nilsson EJK, Nielsen OJ, Johnson MS, Hurley MD, Wallington TJ. Atmospheric
chemistry of cis-CF 3 CH{double bond, long}CHF: Kinetics of reactions with OH
radicals and O 3 and products of OH radical initiated oxidation. Chem Phys
Lett 2009;473:233–7. doi: 10.1016/j.cplett.2009.03.076 .
[557] Sulbaek Andersen MP, Hurley MD, Wallington TJ, Blandini F, Jensen NR, Li- brando V, et al. Atmospheric chemistry of CH 3 O(CF 2 CF 2 O)nCH 3 (n = 1-3): Ki-
netics and mechanism of oxidation initiated by Cl atoms and OH radicals, IR spectra, and global warming potentials. J Phys Chem A 2004;108:1964–72.
doi: 10.1021/jp036615a . [558] Oyaro N, Sellevåg SR, Nielsen CJ. Study of the OH and Cl-initiated oxidation,
IR absorption cross-section, radiative forcing, and global warming potential
of four C 4 -hydrofluoroethers. Environ Sci Technol 2004;38:5567–76. doi: 10. 1021/es0497330 .
[559] Oyaro N, Sellevåg SR, Nielsen CJ. Atmospheric chemistry of hydrofluo- roethers: reaction of a series of hydrofluoroethers with OH radicals and Cl
atoms, atmospheric lifetimes, and global warming potentials. J Phys Chem A 2005;109:337–46. doi: 10.1021/jp047860c .
[560] Waterland RL, Hurley MD, Misner Ja, Wallington TJ, Melo SML, Strong K,
et al. Gas phase UV and IR absorption spectra of CF 3 CH 2 CH 2 OH and F(CF 2 CF 2 )xCH 2 CH 2 OH (x = 2, 3, 4). J Fluor Chem 2005;126:1288–96. doi: 10.
1016/j.jfluchem.2005.06.010 . [561] Sellevag SR, Kelly T, Sidebottom H, Nielsen CJ. A study of the IR and
UV–Vis absorption cross-sections, photolysis and OH-initiated oxidation of CF 3 CHO and CF 3 CH 2 CHO. Phys Chem Chem Phys 2004a;6:1243–52. doi: 10.
1039/b315941h . [562] Hashikawa Y, Kawasaki M, Waterland RL, Hurley MD, Ball JC, Wallington TJ,
et al. Gas phase UV and IR absorption spectra of CxF 2 x + 1CHO (x = 1–4). J
Fluor Chem 2004;125:1925–32. doi: 10.1016/j.jfluchem.2004.07.006 . [563] Sellevåg SR, Nielsen CJ, Søvde OA, Myhre G, Sundet JK, Stordal F, et al.
Atmospheric gas-phase degradation and global warming potentials of 2- fluoroethanol, 2,2-difluoroethanol, and 2,2,2-trifluoroethanol. Atmos Environ
2004b;38:6725–35. doi: 10.1016/j.atmosenv.2004.09.023 . [564] Bravo I, Díaz-de-Mera Y, Aranda A, Smith K, Shine KP, Marston G.
Atmospheric chemistry of C 4 F 9 OC 2 H 5 (HFE-7200), C 4 F 9 OCH 3 (HFE-7100),
C 3 F 7 OCH 3 (HFE-70 0 0) and C 3 F 7 CH 2 OH: temperature dependence of the ki- netics of their reactions with OH radicals, atmospheric lifetimes and global
warming potentials. Phys Chem Chem Phys 2010a;12:5115–25. doi: 10.1039/ b923092k .
[565] Wallington TJ, Schneider WF, Barnes I, Becker KH, Sehested J, Nielsen OJ. Sta- bility and infrared spectra of mono-, di-, and trichloromethanol. Chem Phys
Lett 20 0 0;322:97–102. doi: 10.1016/S0 0 09-2614(0 0)0 0384-5 .
[566] Shine KP, Gohar LK, Hurley MD, Marston G, Martin D, Simmonds PG, et al. Perfluorodecalin: global warming potential and first detection in the atmo-
sphere. Atmos Environ 2005;39:1759–63. doi: 10.1016/j.atmosenv.2005.01.001 . [567] Andersen MPS, Nielsen OJ, Wallington TJ, Karpichev B, Sander SP. Assessing
the impact on global climate from general anesthetic gases. Anesth Analg 2012a;114:1081–5. doi: 10.1213/ANE.0b013e31824d6150 .
[568] Sulbaek Andersen MP, Sander SP, Nielsen OJ, Wagner DS, Sanford TJ,
Wallington TJ. Inhalation anaesthetics and climate change. Br J Anaesth 2010;105:760–6. doi: 10.1093/bja/aeq259 .
[569] Ryan SM, Nielsen CJ. Global warming potential of inhaled anesthetics: application to clinical use. Anesth Analg 2010;111:92–8. doi: 10.1213/ANE.
0b013e3181e058d7 . [570] Acerboni G, Beukes JA, Jensen NR, Hjorth J, Myhre G, Nielsen CJ, et al. Atmo-
spheric degradation and global warming potentials of three perfluoroalkenes.
Atmos Environ 2001;35:4113–23. doi: 10.1016/S1352-2310(01)00209-6 . [571] Nielsen OJ, Javadi MS, Sulbaek Andersen MP, Hurley MD, Wallington TJ,
Singh R. Atmospheric chemistry of CF3CFCH 2 : Kinetics and mechanisms of gas-phase reactions with Cl atoms, OH radicals, and O 3 . Chem Phys Lett
2007;439:18–22. doi: 10.1016/j.cplett.2007.03.053 .
Please cite this article as: I.E. Gordon et al., The HITRAN2016 molecular spectroscopic database, Journal of Quantitative Spectroscopy &
Radiative Transfer (2017), http://dx.doi.org/10.1016/j.jqsrt.2017.06.038

I.E. Gordon et al. / Journal of Quantitative Spectroscopy & Radiative Transfer 0 0 0 (2017) 1–66 65
ARTICLE IN PRESS
JID: JQSRT [m5G; August 21, 2017;14:18 ]
[572] Wallington TJ, Hurley MD, Ball JC, Ellermann T, Nielsen OJ, Sehested J. At- mospheric chemistry of HFC-152: UV absorption spectrum of CH 2 FCFHO 2 radicals, kinetics of the reaction CH 2 FCFHO 2 + NO .fwdarw. CH 2 FCHFO + NO 2 , and fate of the alkoxy radical CH 2 FCFHO. J Phys Chem 1994;98:5435–40.
doi: 10.1021/j10 0 072a0 08 . [573] Inoue Y, Kawasaki M, Wallington TJ, Hurley MD. Atmospheric chemistry of
CF 3 CH 2 CF 2 CH 3 (HFC-365mfc): kinetics and mechanism of chlorine atom ini- tiated oxidation, infrared spectrum, and global warming potential. Chem Phys
Lett 2008;462:164–8. doi: 10.1016/j.cplett.2008.07.054 .
[574] Mashino M, Ninomiya Y, Kawasaki M, Wallington TJ, Hurley MD. Atmospheric chemistry of CF 3 CF = CF 2 : kinetics and mechanism of its reactions with OH
radicals, Cl atoms, and ozone. J Phys Chem A 20 0 0;104:7255–60. doi: 10.1021/ jp0 0 0498r .
[575] Østerstrøm FF, Nielsen OJ, Sulbaek Andersen MP, Wallington TJ. Atmospheric chemistry of CF 3 CH 2 OCH 3 : reaction with chlorine atoms and OH radicals, ki-
netics, degradation mechanism and global warming potential. Chem Phys Lett
2012;524:32–7. doi: 10.1016/j.cplett.2011.12.047 . [576] Wallington TJ, Hurley MD, Nielsen OJ, Sulbaek Andersen MP. Atmospheric
chemistry of CF 3 CFHCF 2 OCF 3 and CF 3 CFHCF 2 OCF 2 H: reaction with Cl atoms and OH radicals, degradation mechanism, and global warming potentials. J
Phys Chem A 2004;108:11333–8. doi: 10.1021/jp046454q . [577] Søndergaard R, Nielsen OJ, Hurley MD, Wallington TJ, Singh R. Atmospheric
chemistry of trans-CF 3 CHCHF: kinetics of the gas-phase reactions with Cl
atoms, OH radicals, and O 3 . Chem Phys Lett 2007;443:199–204. doi: 10.1016/ j.cplett.2007.06.084 .
[578] Myhre G, Nielsen C, Powell D, Stordal F. Infrared absorption cross section, radiative forcing, and GWP of four hydrofluoro(poly)ethers. Atmos Environ
1999;33:4 4 47–58. doi: 10.1016/S1352-2310(99)00208-3 . [579] Wallington TJ, Hurley MD, Nielsen OJ. The radiative efficiency of
HCF 2 OCF 2 OCF 2 CF 2 OCF 2 H (H-Galden 1040x) revisited. Atmos Environ
2009;43:4247–9. doi: 10.1016/j.atmosenv.2009.05.046 . [580] Ninomiya Y, Kawasaki M, Guschin A, Molina LT, Molina MJ, Wallington TJ.
Atmospheric chemistry of n-C 3 F 7 OCH 3 : reaction with OH radicals and Cl atoms and atmospheric fate of n-C 3 F 7 OCH 2 O( •) radicals. Environ Sci Technol
20 0 0;34:2973–8. doi: 10.1021/es991449z . [581] Robson JI, Gohar LK, Hurley MD, Shine KP, Wallington TJ. Revised IR spec-
trum, radiative efficiency and global warming potential of nitrogen trifluo-
ride. Geophys Res Lett 2006;33:2–4. doi: 10.1029/2006GL026210 . [582] D’Anna B, Sellevåg SR, Wirtz K, Nielsen CJ. Photolysis study of perfluoro-2-
methyl-3-pentanone under natural sunlight conditions. Environ Sci Technol 2005;39:8708–11. doi: 10.1021/es048088u .
[583] Young CJ, Hurley MD, Wallington TJ, Mabury SA. Atmospheric chemistry of perfluorobutenes (CF 3 CFCFCF 3 and CF 3 CF 2 CFCF 2 ): Kinetics and mechanisms
of reactions with OH radicals and chlorine atoms, IR spectra, global warm-
ing potentials, and oxidation to perfluorocarboxylic acids. Atmos Environ 2009a;43:3717–24. doi: 10.1016/j.atmosenv.2009.04.025 .
[584] Young CJ, Hurley MD, Wallington TJ, Mabury SA. Atmospheric lifetime and global warming potential of a perfluoropolyether. Environ Sci Technol
2006;40:2242–6. doi: 10.1021/es052077z . [585] Sulbaek Andersen MP, Blake DR, Rowland FS, Hurley MD, Wallington TJ. At-
mospheric chemistry of sulfuryl fluoride: reaction with OH radicals, Cl atoms and O 3 , atmospheric lifetime, IR spectrum, and global warming potential. En-
viron Sci Technol 2009;43:1067–70. doi: 10.1021/es802439f .
[586] Richard C, Gordon IE, Rothman LS, Abel M, Frommhold L, Gustafsson M, et al. New section of the HITRAN database: collision-induced absorption (CIA). J
Quant Spectrosc Radiat Transf 2012;113:1276–85. doi: 10.1016/j.jqsrt.2011.11. 004 .
[587] Maté B, Lugez C, Fraser GT, Lafferty WJ. Absolute intensities for the O 2 1.27 μm continuum absorption. J Geophys Res Atmos 1999;104:30585–90.
doi: 10.1029/1999JD900824 .
[588] Smith KM, Newnham DA. Near-infrared absorption cross sections and inte- grated absorption intensities of molecular oxygen (O 2 , O 2 -O 2 , and O 2 -N 2 ). J
Geophys Res Atmos 20 0 0;105:7383–96. doi: 10.1029/1999JD901171 . [589] Eldering A, Boland S, Solish B, Crisp D, Kahn P, Gunson M. High precision
atmospheric CO 2 measurements from space: The design and implementation of OCO-2. In: 2012 IEEE Aerosp. Conf.. IEEE; 2012. p. 1–10. doi: 10.1109/AERO.
2012.6187176 .
[590] Thomas GE , Stamnes K . Radiative transfer in the atmosphere and ocean. Cam- bridge: Cambridge University Press; 1999 .
[591] Brasseur GP , Solomon S . Aeronomy of the middle atmosphere. Dordrecht: Springer; 2005 .
[592] Downing HD, Williams D. Optical constants of water in the infrared. J Geo- phys Res 1975;80:1656–61. doi: 10.1029/JC080i012p01656 .
[593] Kou L, Labrie D, Chylek P. Refractive indices of water and ice in the
0.65- to 2.5-μm spectral range. Appl Opt 1993;32:3531. doi: 10.1364/AO.32. 003531 .
[594] Warren SG, Brandt RE. Optical constants of ice from the ultraviolet to the microwave: a revised compilation. J Geophys Res 2008;113:D14220. doi: 10.
1029/20 07JD0 09744 . [595] Fenn RW , Clough SA , Gallery WO , Good RE , Kneizys FX , Mill JD , et al. Jursa AS,
editor Optical and infrared properties of the atmosphere. Handb. Geophys. Sp.
Environ. 1985 . [596] Palmer KF, Williams D. Optical constants of sulfuric acid; application to the
clouds of Venus? Appl Opt 1975;14:208. doi: 10.1364/AO.14.0 0 0208 . [597] Remsberg EE, Lavery D, Crawford B. Optical constants for sulfuric and nitric
acids. J Chem Eng Data 1974;19:263–5. doi: 10.1021/je60 062a0 03 .
[598] Tisdale RT, Glandorf DL, Tolbert MA, Toon OB. Infrared optical constants of low-temperature H 2 SO 4 solutions representative of stratospheric sulfate
aerosols. J Geophys Res Atmos 1998;103:25353–70. doi: 10.1029/98JD02457 . [599] Niedziela RF, Norman ML, DeForest CL, Miller RE, Worsnop DR. A
temperature- and composition-dependent study of H 2 SO 4 aerosol optical constants using Fourier transform and tunable diode laser infrared spec-
troscopy. J Phys Chem A 1999;103:8030–40. doi: 10.1021/jp991323o . [600] Biermann UM, Luo BP, Peter T. Absorption spectra and optical constants of
binary and ternary solutions of H 2 SO 4 , HNO 3 , and H 2 O in the mid infrared
at atmospheric temperatures. J Phys Chem A 20 0 0;104:783–93. doi: 10.1021/ jp992349i .
[601] Querry MR, Tyler IL. Reflectance and complex refractive indices in the in- frared for aqueous solutions of nitric acid. J Chem Phys 1980;72:2495–9.
doi: 10.1063/1.439445 . [602] Norman ML, Qian J, Miller RE, Worsnop DR. Infrared complex refractive
indices of supercooled liquid HNO 3 /H 2 O aerosols. J Geophys Res Atmos
1999;104:30571–84. doi: 10.1029/1999JD900902 . [603] Toon OB, Tolbert MA, Koehler BG, Middlebrook AM, Jordan J. Infrared opti-
cal constants of H 2 O ice, amorphous nitric acid solutions, and nitric acid hy- drates. J Geophys Res 1994;99:25631. doi: 10.1029/94JD02388 .
[604] Niedziela RF, Miller RE, Worsnop DR. Temperature- and frequency-dependent optical constants for nitric acid dihydrate from aerosol spectroscopy. J Phys
Chem A 1998;102:6477–84. doi: 10.1021/jp981299z .
[605] Richwine LJ, Clapp ML, Miller RE, Worsnop DR. Complex refractive in- dices in the infrared of nitric acid trihydrate aerosols. Geophys Res Lett
1995;22:2625–8. doi: 10.1029/95GL02650 . [606] Sutherland RA, Khanna RK. Optical properties of organic-based aerosols pro-
duced by burning vegetation. Aerosol Sci Technol 1991;14:331–42. doi: 10. 1080/02786829108959495 .
[607] Magi BI, Fu Q, Redemann J. A methodology to retrieve self-consistent aerosol
optical properties using common aircraft measurements. J Geophys Res 2007 112:D24S12. doi: 10.1029/20 06JD0 08312 .
[608] Stagg BJ, Charalampopoulos TT. Refractive indices of pyrolytic graphite, amor- phous carbon, and flame soot in the temperature range 25 ° to 600 °C. Com-
bust Flame 1993;94:381–96. doi: 10.1016/0010-2180(93)90121-I . [609] Chang H, Charalampopoulos TT. Determination of the wavelength depen-
dence of refractive indices of flame soot. Proc R Soc A Math Phys Eng Sci
1990;430:577–91. doi: 10.1098/rspa.1990.0107 . [610] Querry MR . Optical constants of minerals and other materials from the mil-
limeter to the ultraviolet. Aberdeen: Chemical Research, Development Engi- neering Center, CRDEC-CR-88009:; 1987 .
[611] Alexander DTL, Crozier PA, Anderson JR. Brown carbon spheres in East Asian outflow and their optical properties. Science (80-) 2008;321:833–6. doi: 10.
1126/science.1155296 .
[612] Lund Myhre CE, Nielsen CJ. Optical properties in the UV and visible spectral region of organic acids relevant to tropospheric aerosols. Atmos Chem Phys
2004;4:1759–69. doi: 10.5194/acp- 4- 1759- 2004 . [613] Hasenkopf CA, Beaver MR, Trainer MG, Langley Dewitt H, Freedman MA,
Toon OB, et al. Optical properties of Titan and early Earth haze laboratory analogs in the mid-visible. Icarus 2010;207:903–13. doi: 10.1016/j.icarus.2009.
12.015 . [614] Zarzana KJ, De Haan DO, Freedman MA, Hasenkopf CA, Tolbert MA. Optical
properties of the products of α-dicarbonyl and amine reactions in simulated
cloud droplets. Environ Sci Technol 2012;46:4845–51. doi: 10.1021/es2040152 . [615] Toon OB, B Pollack J, Sagan C. Physical properties of the particles composing
the Martian dust storm of 1971–1972. Icarus 1977;30:663–96. doi: 10.1016/ 0019-1035(77)90088-4 .
[616] Wagner R, Ajtai T, Kandler K, Lieke K, Linke C, Müller T, et al. Complex refractive indices of Saharan dust samples at visible and near UV wave-
lengths: a laboratory study. Atmos Chem Phys 2012;12:2491–512. doi: 10.
5194/acp- 12- 2491- 2012 . [617] Sinyuk A, Torres O, Dubovik O. Combined use of satellite and surface observa-
tions to infer the imaginary part of refractive index of Saharan dust. Geophys Res Lett 2003;30. doi: 10.1029/2002GL016189 .
[618] Grainger RG, Peters DM, Thomas GE, Smith AJA, Siddans R, Carboni E, et al. Measuring volcanic plume and ash properties from space Remote sensing
of volcanoes and volcanic Processes: integrating observation and modeling.
Pyle D, Mather T, editors. Spec Publ Geo Soc; 2013. doi: 10.1144/SP380.14 . [619] Henning T, Mutschke H. Low temperature infrared properties of cosmic dust
analogues. Astron Astrophys 1997;327:743–54 http://aa.springer.de/papers/ 73270 02/230 0743/small.htm .
[620] Zeidler S, Posch T, Mutschke H. Optical constants of refractory oxides at high temperatures. Astron Astrophys 2013;553:A81. doi: 10.1051/0 0 04-6361/
201220459 .
[621] Begemann B, Dorschner J, Henning T, Mutschke H, Gurtler J, Kompe C, et al. Aluminum Oxide and the Opacity of Oxygen-rich Circumstellar Dust in the
12–17 μ range. Astrophys J 1997;476:199–208. doi: 10.1086/303597 . [622] Henning T , Begemann B , Mutschke H , Dorschner J . Optical properties of oxide
dust grains. Astron Astrophys Suppl Ser 1995;112:143–9 . [623] Posch T, Kerschbaum F, Fabian D, Mutschke H, Dorschner J, Tamanai A, et al.
Infrared properties of solid titanium oxides: exploring potential primary dust
condensates. Astrophys J Suppl Ser 2003;149:437–45. doi: 10.1086/379167 . [624] Unpublished data n.d. http://www.astro.uni-jena.de/Laboratory/OCDB/
mgfeoxides.html#C . [625] Unpublished data n.d. http://www.astro.uni-jena.de/Laboratory/OCDB/
crsilicates.html#C .
Please cite this article as: I.E. Gordon et al., The HITRAN2016 molecular spectroscopic database, Journal of Quantitative Spectroscopy &
Radiative Transfer (2017), http://dx.doi.org/10.1016/j.jqsrt.2017.06.038

66 I.E. Gordon et al. / Journal of Quantitative Spectroscopy & Radiative Transfer 0 0 0 (2017) 1–66
ARTICLE IN PRESS
JID: JQSRT [m5G; August 21, 2017;14:18 ]
[626] Fabian D, Henning T, Jäger C, Mutschke H, Dorschner J, Wehrhan O. Steps toward interstellar silicate mineralogy. Astron Astrophys 2001;378:228–38.
doi: 10.1051/0 0 04-6361:20 011196 . [627] Fabian D, Posch T, Mutschke H, Kerschbaum F, Dorschner J. Infrared optical
properties of spinels, A study of the carrier of the 13, 17 and 32 μ emission features observed in ISO-SWS spectra of oxygen-rich AGB stars. Astron Astro-
phys 2001;373:1125–38. doi: 10.1051/0004-6361:20010657 . [628] Jäger C, Dorschner J, Mutschke H, Posch T, Henning T. Steps toward interstel-
lar silicate mineralogy VII. Spectral properties and crystallization behaviour
of magnesium silicates produced by the sol-gel method. Astron Astrophys 2003;408:193–204. doi: 10.1051/0004-6361:20030916 .
[629] Zeidler S, Posch T, Mutschke H, Richter H, Wehrhan O. Near-infrared ab- sorption properties of oxygen-rich stardust analogs: The influence of col-
oring metal ions. Astron Astrophys 2011;526:A68. doi: 10.1051/0 0 04-6361/ 201015219 .
[630] Posch T , Kerschbaum F , Mutschke HD , Fabian D , Clément D , Dorschner J . Fea-
tures of oxide dust particles in circumstellar shells of AGB stars. In: Exploit. ISO Data Arch. Infrared Astron. Internet Age, Siguenza, Spain, June 24-27;
2002. p. 14 . [631] Khare BN, Sagan C, Arakawa ET, Suits F, Callcott TA, Williams MW. Op-
tical constants of organic tholins produced in a simulated Titanian atmo- sphere: From soft x-ray to microwave frequencies. Icarus 1984;60:127–37.
doi: 10.1016/0019-1035(84)90142-8 .
[632] Ramirez S, Coll IP, da Silva A, Navarro-Gonzalez R, Lafait J, Raulin F. Com- plex refractive index of Titan’s aerosol analogues in the 20 0–90 0 nm Domain.
Icarus 2002;156:515–29. doi: 10.10 06/icar.20 01.6783 . [633] Bohren CF, Huffman DR. Absorption and scattering of light by small particles.
New York: John Wiley and Sons; 1983. doi: 10.1002/9783527618156 .
[634] Wakeford HR, Sing DK. Transmission spectral properties of clouds for hot Jupiter exoplanets. Astron Astrophys 2015;573:A122. doi: 10.1051/0 0 04-6361/
201424207 . [635] Massie ST, Hervig M. HITRAN 2012 refractive indices. J Quant Spectrosc Radiat
Transf 2013;130:373–80. doi: 10.1016/j.jqsrt.2013.06.022 . [636] Kochanov R V, Gordon IE, Rothman LS, Sharpe SW, Johnson TJ, Sams RL.
Comment on “Radiative forcings for 28 potential Archean greenhouse gases”by Byrne and Goldblatt (2014. Clim Past 2015;11:1097–105. doi: 10.5194/
cp- 11- 1097- 2015 .
[637] Fischer J, Gamache RR, Goldman a, Rothman LS, Perrin a. Total internal parti- tion sums for molecular species in the 20 0 0 edition of the HITRAN database.
J Quant Spectrosc Radiat Transf 2003;82:401–12. doi: 10.1016/S0022-4073(03) 00166-3 .
[638] Fischer J, Gamache RR. Total internal partition sums for molecules of as- trophysical interest. J Quant Spectrosc Radiat Transf 2002;74:263–72. doi: 10.
1016/S0022-4073(01)00234-5 .
[639] Goldman A, Gamache RR, Perrin A, Flaud J-M, Rinsland CP, Rothman LS. HITRAN partition functions and weighted transition-moments squared. J
Quant Spectrosc Radiat Transf 20 0 0;66:455–86. doi: 10.1016/S0022-4073(99) 00176-4 .
[640] Herzberg G . Infrared and raman spectra of polyatomic molecules. New Jersey: D. Van Nostrand Company, Inc.; 1960 .
[641] Gamache RR, Roller C, Lopes E, Gordon IE, Rothman LS, Polyansky OL, et al.
Total internal partition sums for 166 isotopologues of 51 molecules important in planetary atmospheres: application to HITRAN2016 and beyond. J Quant
Spectrosc Radiat Transf 2017 this issue. doi: 10.1016/j.jqsrt.2017.03.045 .
Please cite this article as: I.E. Gordon et al., The HITRAN2016 molecular spectroscopic database, Journal of Quantitative Spectroscopy &
Radiative Transfer (2017), http://dx.doi.org/10.1016/j.jqsrt.2017.06.038