
Analysis of Human Cytomegalovirus-Encoded MicroRNA Activity during Infection
Upload
independentCategory
view
0download
0
Sensitivity-Encoded Spectroscopic Imaging
Ulrike Dydak, Markus Weiger, Klaas P. Pruessmann, Dieter Meier, and Peter Boesiger*
Sensitivity encoding (SENSE) offers a new, highly effective ap-proach to reducing the acquisition time in spectroscopic imaging(SI). In contrast to conventional fast SI techniques, which accel-erate k-space sampling, this method permits reducing the numberof phase encoding steps in each phase encoding dimension ofconventional SI. Using a coil array for data acquisition, the missingencoding information is recovered exploiting knowledge of thedistinct spatial sensitivities of the individual coil elements. In thiswork, SENSE is applied to 2D spectroscopic imaging. Fourfoldreduction of scan time is achieved at preserved spectral andspatial resolution, maintaining a reasonable SNR. The basic prop-erties of the proposed method are demonstrated by phantomexperiments. The in vivo feasibility of SENSE-SI is verified bymetabolic imaging of N-acetylaspartate, creatine, and choline inthe human brain. These results are compared to conventional SI,with special attention to the spatial response and the SNR. MagnReson Med 46:713–722, 2001. © 2001 Wiley-Liss, Inc.
Key words: fast spectroscopic imaging; SENSE; CSI; sensitivityencoding
In recent years, studies on the metabolism of the healthyand pathologic human brain are increasingly performedusing proton magnetic resonance spectroscopic imaging(SI) (1–6). For the investigation of local metabolite con-centrations, the advantage of SI over single voxel spectros-copy lies in the spatial resolution obtained by acquiring awhole grid of spectra. These spectra show only a slightreduction in the signal-to-noise ratio (SNR) per unit vol-ume and unit time with respect to single voxel spectros-copy (7). Furthermore, displaying the resulting metabolitelevels as images permits an easy comparison of local me-tabolism changes with other data, e.g., anatomical imagesand functional activation maps. The major disadvantage ofstandard SI techniques (8,9) is the long acquisition time ofhigh-resolution measurements, which considerably com-plicates clinical application.
The long acquisition time of SI measurements with twospatial dimensions arises from the large number of sam-ples to be collected, i.e., Kx 3 Ky 3 Nt samples in the twospatial dimensions and one time/spectral dimension. Inconventional spectroscopic imaging k-space is sampled byacquiring Nt data points in the time dimension per exci-tation, thus requiring Kx 3 Ky excitations for a complete 2Dspatial image. In the past decade, several fast SI methodshave been proposed in response to this problem, whichrely on sampling k-space in a more time efficient way.
One fast SI technique, proposed by Duyn and Moonen(10), exploits the fact that at lower field strengths T2 is much
longer than T*2 for the metabolites of interest, allowing one toacquire several spin-echoes per excitation, which are sepa-rately phase-encoded. The time savings achievable with thistechnique depend on the length of the spin-echo train, whichtypically ranges from 2 to 4. However, measurements withshort echo spacing are not feasible with this technique, as theacquisition interval and thus the spectral resolution are lim-ited by the echo spacing. Furthermore, acquiring multiplespin-echoes results in uneven T2-weighting of k-space,which adversely affects the point-spread function of the tech-nique. Another type of fast SI technique uses readout gradi-ents for spatial encoding. Based on an SI method originallyproposed by Mansfield (11), proton echo-planar spectro-scopic imaging (PEPSI) by Posse et al. (12) saves time byacquiring Kx 3 Nt data points per excitation using echo-planar trajectories. A third option is the acquisition of Kx 3Ky data points per excitation, as done in the typical Seppo-nen experiment (13), where the chemical shift information isencoded by incrementing the evolution period for each ex-citation. Several concepts known from fast MR imaging, suchas echo-planar imaging (EPI), U-FLARE, and spiral acquisi-tion, have been successfully applied for this purpose (14–16). In this case, the spatial resolution and the scan time canbe varied independently, with the scan time determining thespectral resolution.
Throughout, these fast SI methods require sampling afull set of Kx 3 Ky 3 Nt data points and achieve scan timereduction by accomplishing a greater number of samplesper excitation. In this work, a new fast SI method is pre-sented which takes a fundamentally different approach. Itis based on the concept of sensitivity encoding (SENSE),originally described for fast MR imaging (17), which per-mits undersampling k-space by using multiple receivercoils for signal acquisition. In SENSE reconstruction, thespatial encoding information lost through undersamplingis recovered using knowledge of the distinct individualcoil sensitivities. By applying this concept to each spatialphase encoding dimension, the scan times required forspectroscopic imaging can be substantially reduced with-out compromising spatial or spectral resolution.
The basic concepts of sensitivity-encoded SI are explainedin the Methods section. In order to evaluate the relativeperformance of the new technique, a comparison between 2DSENSE-SI and conventional 2D SI is presented, using both invitro and in vivo experiments. In the phantom study, specialattention is given to the specific SNR and spatial responsebehavior of SENSE-SI. The in vivo feasibility of the newtechnique is demonstrated by a brain study, yielding high-resolution maps of N-acetylaspartate, creatine, and cholineconcentration in one-fourth the conventional scan time.
METHODSSENSE-SI
SENSE (17) utilizes spatial information related to the coilsensitivities of a receiver array for signal localization,
Institute for Biomedical Engineering, University of Zurich and Swiss FederalInstitute of Technology Zurich, Zurich, Switzerland.Grant sponsor: Swiss National Science Foundation; Grant number:31-52173.97.*Correspondence to: Prof. Dr. P. Boesiger, Institute for Biomedical Engineer-ing, University and ETH Zurich, Gloriastrasse 35, CH-8092 Zurich, Switzer-land.Received 10 October 2000; revised 19 April 2001; accepted 19 April 2001.
Magnetic Resonance in Medicine 46:713–722 (2001)
© 2001 Wiley-Liss, Inc. 713

while using the homogeneous RF field of the body coil forexcitation. This permits reducing the scan time by decreas-ing the sampling density in k-space, which is equivalent toreducing the field-of-view (FOV). The sensitivities of thereceiver coils provide complementary information en-abling image reconstruction free of aliasing artifacts,which would otherwise result from undersamplingk-space. The minimal number of receiver channels re-quired for such a reconstruction is given by the reductionfactor of k-space sampling density.
For most efficient scan time reduction in conventionalSI, the SENSE method can be applied to both spatial phaseencoding dimensions, x and y (18). For a SENSE-SI exper-iment the FOV is reduced by a factor Rx in x direction anda factor Ry in y direction. In this fashion, only a fraction ofk-space positions is sampled as compared with full k-space sampling, leading to scan time reduction by thefactor R 5 Rx 3 Ry. Thus, if the full FOV is to be resolvedby n 3 n spectra (Fig. 1a), only n/Rx 3 n/Ry individualsignals need to be sampled. In the imaging domain, thissampling scheme corresponds to an n/Rx 3 n/Ry gridwithin a reduced FOV (Fig. 1b).
Figure 1c shows the aliasing artifacts after conventionalFourier reconstruction resulting from such undersam-
pling. Each voxel in the reduced FOV represents theweighted signal sum of four voxels in the full FOV. Thus,one spectrum from the reduced FOV will contain metab-olite peaks originating from any of these four locations(Fig. 1d). In order to create full-FOV metabolite maps,these signal contributions need to be separated. This isachieved by SENSE reconstruction, which exploits the factthat each signal contribution is weighted according to thelocal sensitivity of the respective coil. With two spatialand one frequency dimension, the basic SENSE-SI exper-iment is similar to 2D SENSE (19), as the spectral encodingof the frequency dimension by the chemical shift can beviewed as equivalent to spatial encoding with magneticfield gradients. Thus, the spectral dimension is simplytreated as a third dimension with no undersampling. Afterdiscrete Fourier transform in all three dimensions, analiased image needs to be unfolded for every samplingfrequency in the spectral direction. Consider one voxel inthe reduced FOV, and the corresponding set of voxels inthe full FOV (Fig. 1b). Following the notation used in Ref.17, let S denote the sensitivity matrix, containing the spa-tial sensitivity of each coil for each superimposed voxelposition. Then the unfolding matrix U is given by:
U 5 ~SHC21S!21SHC21, [1]
where the superscript H denotes the transposed complexconjugate and C is the receiver noise matrix, describingthe levels and correlation of noise in the receiver channels.The matrix C is determined experimentally, using:
Cg,g9 5 hgh*g9, [2]
where hy denotes the pure noise output of the g-th receiverchannel, the bar denotes time averaging, and the asteriskdenotes the complex conjugate. Note that Eq. [2] is statis-tically equivalent to eq. A9 in Ref. 17.
For each spectral sampling point l, signal separation isachieved by:
vl 5 Ual, [3]
where the vector al lists the complex image values of thechosen voxel in the aliased images obtained by each coil,and the resulting vector vl lists the separated voxel valuesfor the originally superimposed voxels in the full-FOV.This procedure is repeated for each voxel in the reducedFOV to obtain a full image, and for each l in spectraldirection to obtain a full spectroscopic imaging dataset. Asa result, each spectrum only shows peaks of metabolitesactually contained in the corresponding full-FOV voxel(Fig. 1d).
Spatial Response Function
Closely related to the point spread function (PSF), thespatial response function (SRF) of a voxel is a spatialweighting function describing the signal origin in thatvoxel and is identical to the voxel function described inRef. 17. As signals of different spatial origin are separatedin SENSE reconstruction, the behavior of the SRF becomes
FIG. 1. Schematic representation of an object containing two dif-ferent metabolites (white and gray compartment): For a SENSEexperiment the full FOV of a conventional SI measurement with agrid of 32 3 32 pixels (a) is reduced by a factor two in bothdimensions, covering only a 16 3 16 grid (b) with the same nominalspatial resolution. This way only every fourth point in k-space issampled compared to full k-space sampling, leading to a scan timereduction of four. Applying Fourier reconstruction, such undersam-pling results in aliasing artifacts, as shown in c. Voxel A is theweighted sum of the four voxels depicted in a and b. Therefore, thespectrum of voxel A in d exhibits peaks at two frequencies corre-sponding to the weighted sum of the signals of the contributingvoxels B, C, and D.
714 Dydak et al.
particularly important. Using spatial sensitivities of coilarray elements for image reconstruction, in SENSE-SI thespatial response function also depends to some degree onsensitivity relations and varies slightly from voxel tovoxel.
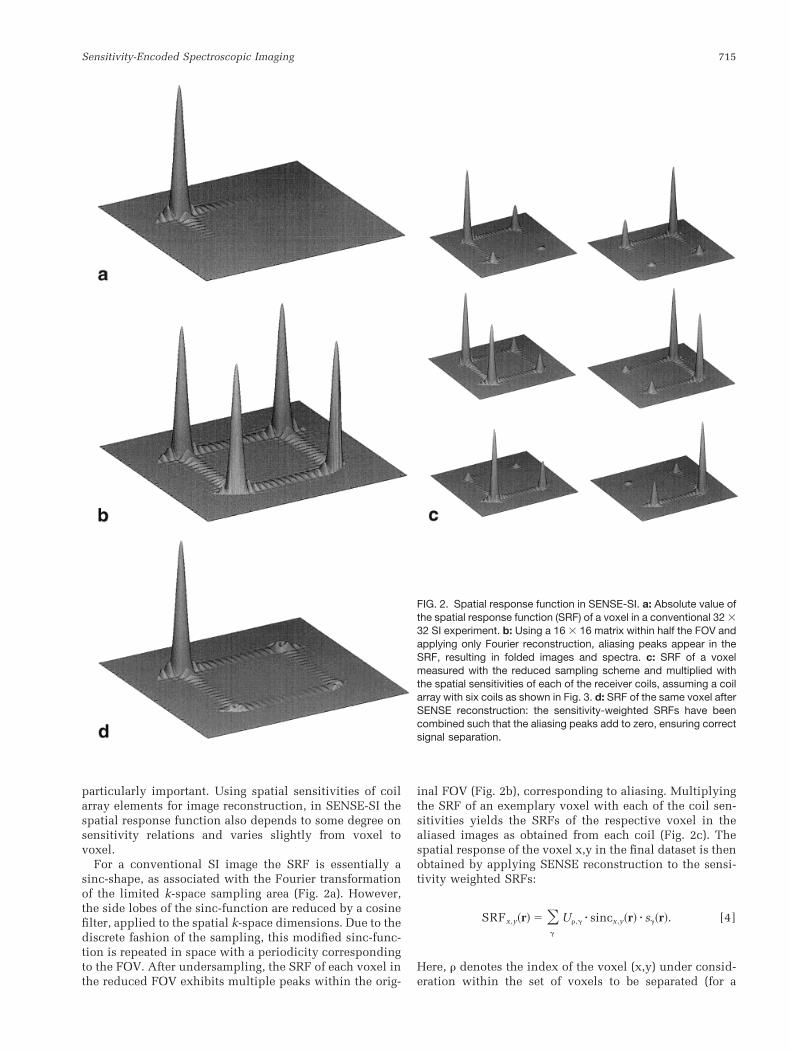
For a conventional SI image the SRF is essentially asinc-shape, as associated with the Fourier transformationof the limited k-space sampling area (Fig. 2a). However,the side lobes of the sinc-function are reduced by a cosinefilter, applied to the spatial k-space dimensions. Due to thediscrete fashion of the sampling, this modified sinc-func-tion is repeated in space with a periodicity correspondingto the FOV. After undersampling, the SRF of each voxel inthe reduced FOV exhibits multiple peaks within the orig-
inal FOV (Fig. 2b), corresponding to aliasing. Multiplyingthe SRF of an exemplary voxel with each of the coil sen-sitivities yields the SRFs of the respective voxel in thealiased images as obtained from each coil (Fig. 2c). Thespatial response of the voxel x,y in the final dataset is thenobtained by applying SENSE reconstruction to the sensi-tivity weighted SRFs:
SRFx,y~r! 5 Og
Ur,g z sincx,y~r! z sg~r!. [4]
Here, r denotes the index of the voxel (x,y) under consid-eration within the set of voxels to be separated (for a
FIG. 2. Spatial response function in SENSE-SI. a: Absolute value ofthe spatial response function (SRF) of a voxel in a conventional 32 332 SI experiment. b: Using a 16 3 16 matrix within half the FOV andapplying only Fourier reconstruction, aliasing peaks appear in theSRF, resulting in folded images and spectra. c: SRF of a voxelmeasured with the reduced sampling scheme and multiplied withthe spatial sensitivities of each of the receiver coils, assuming a coilarray with six coils as shown in Fig. 3. d: SRF of the same voxel afterSENSE reconstruction: the sensitivity-weighted SRFs have beencombined such that the aliasing peaks add to zero, ensuring correctsignal separation.
Sensitivity-Encoded Spectroscopic Imaging 715

reduction factor R 5 4, e.g., r 5 1, . . . , 4), l counts thecoils and sl(r) is the complex spatial sensitivity of the coill. U is the unfolding matrix as defined in Eq. [1] and thesinc-function, centered in the voxel x,y, is periodic accord-ing to the reduced FOV.
By the unfolding matrix, the weighting coefficients foreach voxel are chosen such that aliasing peaks within theimaged object add to zero (Fig. 2d). The actual degree ofaliasing of a particular voxel is determined by the SENSEreduction factor R, the size of the object, and the locationof the voxel. For two reasons SENSE reconstruction isperformed only for voxels within the object border: first,the sensitivity outside the object cannot be readily as-sessed; second, reducing the degree of aliasing improvesthe SNR (17). However, as will be seen in the Resultssection, it is advisable to extend the sensitivities and thereconstruction somewhat beyond the object border. If avoxel has one of its aliasing peaks just outside the objectborder, the signal contribution from the tail or first sidelobes of that aliasing peak may be larger than in conven-tional SI and may lead to visible artifacts. Therefore, vox-els within one side lobe off the object border should alsobe reconstructed on the basis of slightly extrapolated sen-sitivities, such that aliasing peaks at these locations ap-proximately add to zero as well.
Signal-to-Noise Ratio
The propagation of white noise in SENSE reconstructionwas previously studied in Ref. 17. According to that anal-ysis, the SNR in a SENSE dataset compares with thatobtained by full Fourier encoding according to:
SNRSENSE 5SNRconv
gÎR, g $ 1 [5]
where R 5 Rx 3 Ry denotes the net reduction factor, and gdenotes the local geometry factor, which depends on theshape, size, and placement of the receiver coils. The ge-ometry factor describes the ability of the coil configurationto separate pixels superimposed by aliasing and is opti-mally equal to 1. In an SI experiment, the SNR of themetabolite images closely relates to the SNR of the spectra,thus only the SNR of spectra is discussed here.
In order to compare the SNR of conventional SI spectrawith that of the corresponding SENSE-SI spectra, the fol-lowing definitions were used: The signal of a peak is givenby the integral of the absolute data values over the peakinterval, as used for calculating the metabolite images.Peak intervals were chosen 0.2 ppm wide and symmetricalaround the peak’s maximum. As the spectra were not fittedfor data analysis, the integral provides more reliable valuesthan the peak amplitude. The noise level was defined asthe standard deviation of the real part of the data samplesin a noise interval, which was chosen between 9.42 and7.13 ppm. SNR evaluations were performed after all post-processing, so the noise determination was based on acorrected baseline. The SNR of a metabolite peak, SNRpeak,is then defined as the ratio of S/N with:
signal 5 Ouxiu and
noise 5 s(noise) zÎNsignal 5 ÎOi
Re~xi!2
Nnoisez ÎNsignal
[6]
where Nsignal is the number of samples in the peak inter-val, Nnoise is the number of samples in the noise interval,and xi denotes the complex spectrum data.
Experimental Setup
The receiver coil array consists of six elements, two ofwhich are circular, with a diameter of 20 cm. The otherfour elements are rectangular with dimensions 10 320 cm. The placement of these coils with respect to eachother and to the object was chosen such that the geometryfactor described above was close to 1, corresponding tominimal loss in SNR. In vivo the two circular elementswere placed in anterior and posterior position, with therectangular elements arranged in pairs to the left and rightof the head (Fig. 3a). For the phantom experiment, thearrangement was rotated by 90°, such that the circularelements covered the left and right sides and the rectan-gular elements the anterior and posterior sides of the phan-tom (Fig. 3b).
The phantom used is an elliptically shaped acrylic tank(150 3 200 3 225 mm3), with three glass spheres (diame-ter 5 40 mm) mounted inside, which can be filled withdifferent metabolic solutions (20). The glass spheres con-tained a 10 mmol/l solution of N-acetylaspartate (NAA), a20 mmol/l solution of creatine (CRE), and a 10 mmol/llactate (LAC) solution respectively, while the tank wasfilled with a 10 mmol/l creatine solution. Electrical con-ductivity, relaxation times, and the pH value were ad-justed to in vivo conditions by adding potassium chloride,nickel chloride, and caustic soda or hydrochloric acid.Because of the elliptic shape of the phantom, the homoge-neity of the magnetic field is disturbed only slightly and ina similar fashion as by a human head.
Acquisition Protocol and Data Processing
Spectroscopic imaging data was obtained from healthyvolunteers as well as from the phantom using a 1.5 T
FIG. 3. Experimental setup of the coil array in vivo (a) and in thephantom experiment (b). Solid black lines represent rectangularelements (10 3 20 cm), void lines represent circular elements (di-ameter 5 20 cm).
716 Dydak et al.

Philips Gyroscan ACS-NT whole body scanner. In eachexperiment a conventional SI measurement was followedby a SENSE-SI measurement. The sensitivity informationneeded for SENSE reconstruction was obtained as in theoriginal SENSE procedure from a reference scan, acquiringan image of the slice to be examined with each of thesurface coils simultaneously, and the body coil. This ref-erence scan has to be performed with exactly the samegeometrical setup as chosen for the SI experiment.
For conventional SI, 32 3 32 spectra were obtained froma square FOV of 230 mm2. For the SENSE experiment witha reduction factor of Rx 5 Ry 5 2, only 16 3 16 spectraneeded to be acquired. The FOV was reduced by a factortwo in each phase encoding dimension, thus maintainingthe nominal spatial resolution. A chemical shift selectivesaturation (CHESS) sequence (21) was used for water sup-pression. Subcutaneous fat was suppressed by an outervolume suppression technique, as described in Ref. 10,consisting of 10–12 presaturated slabs covering the skull.In vivo, a volume of interest (VOI) of 169 3 120 3 25 mm3
was selected by the PRESS sequence (22). In the phantomexperiments the VOI was chosen equal to the FOV. Perrepetition time (TR 5 1500 ms) one echo (TE 5 136 ms)with 512 samples was acquired using a bandwidth of750 Hz, resulting in a spectral resolution of 1.5 Hz. Beforeeach SI measurement a B0-map was acquired with half thespatial resolution to enable correction for B0-inhomogene-ities in the postprocessing of the data. The B0-map in theSENSE case was also measured with half the FOV andreconstructed with the SENSE algorithm.
SI data from the full and reduced FOV, respectively, wasobtained simultaneously with each of the six surface coil
channels. Besides the SENSE reconstruction, all postpro-cessing was identical for the conventional and theSENSE-SI data. First a cosine k-space filter was applied tothe dataset of each coil. Next, the six datasets were com-bined to one full-FOV dataset either by sensitivity-cor-rected summation in the case of conventional spectro-scopic imaging, or by using the SENSE reconstructionalgorithm. Further data processing of the reconstructedfull-FOV dataset comprised the B0-correction and an ex-ponential time filter. Reduction of the residual water sig-nal was achieved by shifting all FIDs over several pointsand subtracting these from the originals. The signals withzero frequency, the water frequency, are nulled in thisfashion. Thereafter, zero order phase correction and poly-nomial baseline correction in the frequency domain wereapplied to all spectra. Metabolite images were obtained byintegrating the spectra over the modulus peak belonging tothat specific metabolite in each voxel. A resolution of256 3 256 pixels was attained by Fourier interpolation. Invivo NAA, creatine plus phosphocreatine (CRE), and cho-line-containing compounds (CHO) maps were investi-gated, while the phantom supplied NAA, creatine, andlactate images.
RESULTS
Phantom Experiments
Figure 4 shows results from the phantom experiment,demonstrating that spectra and image voxels superim-posed by aliasing are separated with the SENSE algo-rithm. Figure 4b shows the creatine map of the slice
FIG. 4. In vitro results. a: The phantom wasfilled with a creatine solution of 10 mmol/l con-centration and the glass spheres were filledfrom left to right with NAA (10 mmol/l), creatine(20 mmol/l), and lactate (10 mmol/l). b: Thecreatine map of the slice depicted in a, ac-quired with conventional SI in 26 min. The cre-atine map of the same slice acquired with halfthe FOV in only 6.5 min is shown withoutSENSE reconstruction in c, exhibiting aliasingartifacts due to undersampling. With SENSEreconstruction the foldover is removed (d). Vox-els A–D are explained in Fig. 5.
Sensitivity-Encoded Spectroscopic Imaging 717

depicted in Fig. 4a acquired with conventional SI in26 min. The creatine map of the same slice acquiredwith half the FOV in only 6.5 min is shown withoutSENSE reconstruction in Fig. 4c, exhibiting aliasing ar-tifacts due to undersampling. With SENSE reconstruc-tion the foldover is removed (Fig. 4d).
Figure 5 shows the spectra of the voxels labeled in Fig.4. Due to undersampling in the spatial dimensions, thespectrum of voxel A (Figs. 4c, 5a) represents a weightedsum of the spectra of the four voxels shown in the fullimages. Thus it contains signal both from the NAA-sphereas well as from the LAC-sphere (black voxels in Fig. 4a).The other two voxels (white) lie outside the phantom anddo not contribute to the signal. After SENSE reconstruc-tion the two contributing spectra, spectrum B (Fig. 5b),containing NAA, and spectrum C (Fig. 5c), containingLAC, are separated. For comparison, spectra D and E inFig. 5d,e show spectra from the same locations as B and C,but were acquired with conventional SI. SENSE and con-
ventionally acquired spectra are scaled differently accord-ing to their maximum amplitude: residual water peaks aswell as, e.g., residual NAA and CRE peaks in Fig. 5c,appear more prominent in SENSE spectra than in conven-tional spectra. These residual metabolite peaks are not dueto unfolding imperfections, but stem from the spatial re-sponse function, which displays larger side lobes in theSENSE case and thus leads to increased contamination.However, such contamination can also be observed inconventional SI, when the side lobes of the SRF do notcancel out due to sharp edges.
Signal-to-Noise Ratio
In the phantom experiment, two metabolite peaks, NAA at2.02 ppm and LAC at 1.3 ppm, were evaluated for SNR.Voxel B and C from Fig. 4, both centered in a glass spherefilled with NAA or LAC, respectively, were comparedbetween conventional SI and SENSE-SI. Table 1 summa-
FIG. 5. a: Due to undersampling, spectrum A fromvoxel A in Fig. 4 is the weighted sum of the spectrafrom the four voxels shown in the full images.Signal from NAA as well as from lactate and poorlysuppressed water can be distinguished. The twocontributing spectra, shown after SENSE recon-struction, are spectrum B from voxel B (b), con-taining NAA, and spectrum C from voxel C (c)containing lactate. For comparison, spectra D (d)and E (e) show the same voxels as B and C, buthave been acquired with full phase encoding.
Table 1SNR of Metabolite Peaks in Corresponding Voxels in SENSE-SI Compared to Conventional SI
SNRconv. SNRSENSE
SNRconv.
SNRSENSE
Geometryfactor g
g p =R
Phantom (Fig. 4)voxel B (NAA) 227 108 2.11 6 0.14 1.008 2.02voxel C (Lac) 114 55 2.07 6 0.09 1.009 2.02
In vivo (Fig. 7)black voxel (NAA) 136 63 2.16 1.052 2.10black voxel (Cre) 65 28 2.32 1.052 2.10black voxel (Cho) 71 37 1.92 1.052 2.10
The table lists the SNRs of three voxels: SNRNAA of voxel B (Fig. 4) and SNRLac of voxel C (Fig. 4) in the phantom measurements, andSNRNAA, SNRCRE, and SNRCHO of the voxel shown in black in Fig. 7 (in vivo). It can be seen that the factor g z =R, as obtained from Eq.[5], gives a good approximation for the ratio of SNRconv. to SNRSENSE. In the phantom experiment four equivalent SENSE measurementswere evaluated for SNR. Thus, it was possible to give an approximation for the error of the ratio. Although SNRconv. and SNRSENSE arerounded numbers in this table, the ratio is calculated with the exact numbers.
718 Dydak et al.
rizes the peak-specific SNR for those voxels in the conven-tional and the SENSE-SI case, respectively. The signalinterval for the SNR evaluation was chosen to be ninesample points or 0.2 ppm around the peak of interest. Thenoise interval contained 100 sample points (2.3 ppm ). TheSENSE experiment was repeated four times for an estima-tion of the error. All values given for the SENSE experi-ment are mean values of these four measurements anderrors are given by the SD. Next to the values found ex-perimentally, the theoretical value for the ratioSNRconv./SNRSENSE with white noise, g z =R, according toEq. [5], is listed in the last column for each voxel. Rdenotes the SENSE reduction factor, in our case four, andg stands for the geometry factor as described in the Meth-ods section. For both voxels the experimental value is wellpredicted by theory. The SNR loss in SENSE-SI with op-timized coil geometry is entirely accounted for by thereduction in sample points: With a SENSE reduction factorof four it is shown that the loss in SNR is a factor of two.
Spatial Response Function
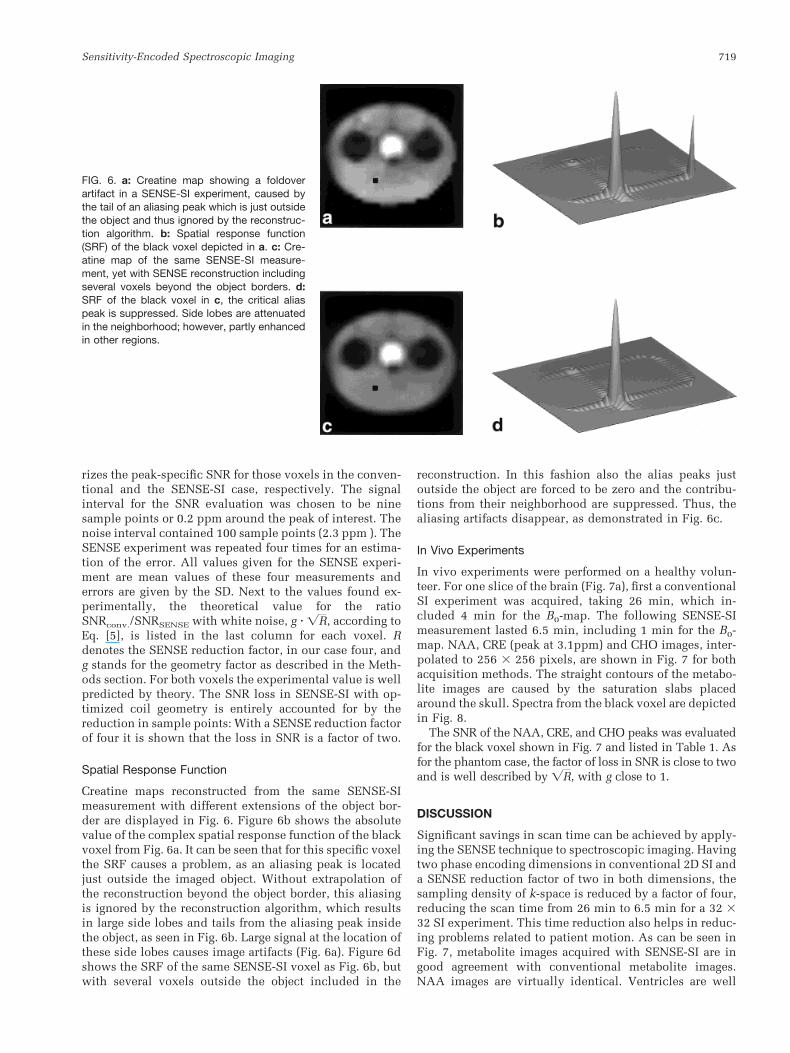
Creatine maps reconstructed from the same SENSE-SImeasurement with different extensions of the object bor-der are displayed in Fig. 6. Figure 6b shows the absolutevalue of the complex spatial response function of the blackvoxel from Fig. 6a. It can be seen that for this specific voxelthe SRF causes a problem, as an aliasing peak is locatedjust outside the imaged object. Without extrapolation ofthe reconstruction beyond the object border, this aliasingis ignored by the reconstruction algorithm, which resultsin large side lobes and tails from the aliasing peak insidethe object, as seen in Fig. 6b. Large signal at the location ofthese side lobes causes image artifacts (Fig. 6a). Figure 6dshows the SRF of the same SENSE-SI voxel as Fig. 6b, butwith several voxels outside the object included in the
reconstruction. In this fashion also the alias peaks justoutside the object are forced to be zero and the contribu-tions from their neighborhood are suppressed. Thus, thealiasing artifacts disappear, as demonstrated in Fig. 6c.
In Vivo Experiments
In vivo experiments were performed on a healthy volun-teer. For one slice of the brain (Fig. 7a), first a conventionalSI experiment was acquired, taking 26 min, which in-cluded 4 min for the B0-map. The following SENSE-SImeasurement lasted 6.5 min, including 1 min for the B0-map. NAA, CRE (peak at 3.1ppm) and CHO images, inter-polated to 256 3 256 pixels, are shown in Fig. 7 for bothacquisition methods. The straight contours of the metabo-lite images are caused by the saturation slabs placedaround the skull. Spectra from the black voxel are depictedin Fig. 8.
The SNR of the NAA, CRE, and CHO peaks was evaluatedfor the black voxel shown in Fig. 7 and listed in Table 1. Asfor the phantom case, the factor of loss in SNR is close to twoand is well described by =R, with g close to 1.
DISCUSSION
Significant savings in scan time can be achieved by apply-ing the SENSE technique to spectroscopic imaging. Havingtwo phase encoding dimensions in conventional 2D SI anda SENSE reduction factor of two in both dimensions, thesampling density of k-space is reduced by a factor of four,reducing the scan time from 26 min to 6.5 min for a 32 332 SI experiment. This time reduction also helps in reduc-ing problems related to patient motion. As can be seen inFig. 7, metabolite images acquired with SENSE-SI are ingood agreement with conventional metabolite images.NAA images are virtually identical. Ventricles are well
FIG. 6. a: Creatine map showing a foldoverartifact in a SENSE-SI experiment, caused bythe tail of an aliasing peak which is just outsidethe object and thus ignored by the reconstruc-tion algorithm. b: Spatial response function(SRF) of the black voxel depicted in a. c: Cre-atine map of the same SENSE-SI measure-ment, yet with SENSE reconstruction includingseveral voxels beyond the object borders. d:SRF of the black voxel in c, the critical aliaspeak is suppressed. Side lobes are attenuatedin the neighborhood; however, partly enhancedin other regions.
Sensitivity-Encoded Spectroscopic Imaging 719

discernible and though the fat suppression was not com-pletely successful, no aliasing of the lipid signals wasfound in the SENSE spectroscopic images. CRE and CHOimages agree in key features, yet slight differences areobservable due to the lower SNR and the different spatialresponse function. Artifacts due to the spatial responsefunction in spectroscopic imaging in general, combinedwith the lower SNR in SENSE-SI, are especially visible inphantom studies with large concentration differences andsharp edges.
Reducing the acquisition time always brings about areduction of the SNR. However, considering Gaussiannoise, the SNR per unit volume and per unit time inSENSE-SI remains equal to that in conventional SI, exceptfor the factor 1/g. This geometry factor was optimized bythe placement of the coils, such that g nearly equals 1.
Many other fast methods exhibit loss in spectral resolu-tion and/or restrictions in the chosen spectral bandwidthor echo time. No parameter restrictions of any kind arenecessary to achieve time-saving in SENSE-SI, and bothspectral as well as spatial resolution are maintained. Nei-ther does this method show increased sensitivity to lipidcontamination. The SENSE reduction factor can be chosenindependently for each dimension, compromising be-tween scan time reduction and SNR. Furthermore, theextension to 3D SI with a sampling reduction of R 5 Rx 3Ry 3 Rz is straightforward, as the third phase encodingdimension can be undersampled accordingly, leading toR-fold scan time reduction. For this purpose, a minimumof R coils would be necessary and a suitable coil place-ment has to be found in order to keep the geometry factorclose to 1. Alternatively, the reduced acquisition time ofSENSE-SI may permit 2D kinetic studies in cases wherechanges of metabolite concentration over time are of in-terest.
An important additional advantage of SENSE-SI is itscharacter of being a multicoil acquisition rather than aspecific pulse sequence. This allows combining it withother fast SI methods. Applying SENSE to any fast SImethod with spatial phase encoding will reduce the scantime by the SENSE reduction factor. One candidate isspectroscopic imaging with multiple echoes, where thescan time is first reduced by the number of echoes ac-quired and then by an additional factor four when com-bining it with SENSE (23). Other fast SI techniques wouldnot become faster, but might gain spatial resolution.
FIG. 8. 1H Spectrum from the black voxel depicted in Fig. 7, ac-quired with conventional SI (a) and with SENSE-SI (b). The onlydiscernible difference is the lower SNR in b.
FIG. 7. In vivo results. Comparison of 32 3 32 metabolite imagesfrom the slice shown in a: The metabolite maps on the left hand side— (b) NAA, (d) CRE, and (f) CHO — were acquired with conventionalSI in 26 min. The images on the right hand side — (c) NAA, (e) CRE,and (g) CHO — were acquired with SENSE-SI within 6.5 min. Allmetabolite images were interpolated to 256 3 256 pixels.
720 Dydak et al.

In fast SI techniques, which encode the chemical shiftwith the method described by Sepponen (13), the scantime depends on the number of spectral samples acquired.Within each repetition time a full image is acquired with afast imaging method for each chemical shift encoding.SENSE would allow acquiring images with higher spatialresolution when combined with any of these methods.However, when combining the speed benefits of multiplefast methods it has to be kept in mind that the SNR isgenerally governed by the square root of the total acquisi-tion time. The trade-off between reduction in scan timeand loss in SNR has to be considered for a reasonablechoice of the SENSE reduction factor. This considerationmust include the aim of a study, as well as the geometry ofthe object, the metabolite of interest, the available time forthe measurement, or any other specific situation.
Furthermore, an optimized coil array can improve theoverall SNR in SENSE-SI. As the size of our coil arrayelements is not yet optimized for measurements of thehead, improvements of SNR are likely with a specific headcoil array, as has been shown in other works (20). In theSENSE case a careful design of an optimized coil has totake into account not only noise coupling but also main-taining the g-factor optimal (24).
For a correct reconstruction of a metabolite image inSENSE-SI, the behavior of the spatial response functionhas to be considered. As shown in Fig. 6, the reconstruc-tion parameters play a vital role in the behavior of the SRFof certain voxel. Extending the reconstruction several vox-els beyond the object border improves the result consider-ably. In finding an optimal extension of the reconstruction,one has to consider that minor side lobes are slightlyenhanced whenever major side lobes are suppressed.Therefore, the best reconstruction parameters also dependon the actual shape and size of the object to be imaged.
Applying sensitivity encoding to multislice SI tech-niques will be even more efficient regarding scan time. Asthe low concentrations of the metabolites investigated re-quire a minimal repetition time of 1.5–2 sec in order not tolose signal due to saturation effects, more than one slicecan be sampled with the SENSE method within one TRwithout compromising SNR, spatial or spectral resolution.This also holds for conventional SI. However, some fasttechniques such as multiecho SI require the full repetitiontime for the acquisition of several spin echoes. As a con-sequence, not only a short acquisition time per echo isrequired, leading to low spectral resolution, but also alonger repetition time, and thus a longer scan time, isneeded when multiple slices are to be acquired. Thus, thetotal scan time increases with the number of slices. Inmultislice SENSE-SI all acquisition parameters can staythe same as in single slice SI, as long as the product ofacquisition time and number of slices fits into the repeti-tion time. For example, two spectroscopic imaging sliceswith a spectral resolution of 1.5 Hz and a bandwidth of750 Hz can be easily acquired with a repetition time of1.5 sec and no additional scan time with SENSE-SI. In thiscase, the reference scan needed for the coil sensitivitieshas to be done for each of the slices.
SENSE-SI is expected to be particularly useful at higherfield strengths. The quality of SENSE metabolite imageswill clearly improve as the inherent SNR increases. This
advantage may even facilitate spectroscopic imaging withenhanced spatial resolution. Furthermore, since multipleechoes are not required, the spatial resolution of SENSE-SIwill not be degraded by the reductions in T2 seen at higherfield strengths. Due to its favorable performance at shortT2, SENSE-SI may also prove valuable for 31P-SI. For thisoption, however, the determination of coil sensitivitymaps poses a particular challenge yet to be investigated.
CONCLUSION
Sensitivity encoding with a receiver array has proven apowerful tool for fast spectroscopic imaging. The findingsof this work demonstrate that, using SENSE, metabolitemaps can be acquired substantially faster than with con-ventional SI methods alone, and without certain disadvan-tages inherent to other fast SI methods. This improvementis particularly promising as it adds to the potential value ofmetabolic imaging as a clinical tool. Without limiting thechoice of the k-space sampling pattern or spatial or spec-tral resolution, it may be combined with existing fast SImethods for additional enhancement of scan speed or res-olution. Furthermore, not depending on long T2 relaxationtimes, SENSE-SI is a promising concept for high-field SI.
ACKNOWLEDGMENTS
The authors thank Johan Van den Brink and Rolf Lamer-ichs from Philips Medical Systems in Best, The Nether-lands, for the impulse that lead to this work and for soft-ware support. We thank the Philips Research Laboratoriesin Hamburg for material support; in particular, the authorsthank Christoph Leussler and Peter Roschmann, who builtthe six-element coil array, and Dr. Tobias Schaffter forproviding the spectroscopic imaging phantom.
REFERENCES
1. Barker PB, Szopinski K, Horska A. Metabolic heterogeneity at the levelof the anterior and posterior commissures. Magn Reson Med 2000;43:348–354.
2. Vermathen P, Laxer KD, Matson GB, Weiner MW. Hippocampalstructures: anterioposterior N-acetylaspartate differences in patientswith epilepsy and control subjects as shown with proton MR spectro-scopic imaging. Radiology 2000;214:403–410.
3. Carhuapoma JR, Wanh PY, Beauchamp NJ, Keyl PM, Hanley DF, BarkerPB. Diffusion-weighted MRI and proton MR spectroscopic imaging inthe study of secondary neuronal injury after intracerebral hemorrhage.Stroke 2000;31:726–732.
4. Fitzgerald KD, Moore GJ, Paulson LA, Steward CM, Rosenberg DR.Proton spectroscopic imaging of the thalamus in treatment-naıve pedi-atric obsessive-compulsive disorder. Biol Psychiatry 2000:47:174–182.
5. Scheidler J, Hricak H, Vigneron DB, Yu KK, Sokolov DL, Huang LR,Zadoulek CJ, Nelson SJ, Carroll PR, Kurhanewicz J. Prostate cancer:localization with three-dimensional proton MR spectroscopic imag-ing—clinicopathologic study. Radiology 1999;213:473–480.
6. Pfefferbaum A, Adalsteinsson E, Spielman D, Sullivan EV, Lim KO. Invivo spectroscopic quantification of the N-acetyl moiety, creatine, andcholine from large volumes of brain gray and white matter: effects ofnormal aging. Magn Reson Med 1999;41:276–284.
7. Maudsley AA. Sensitivity in Fourier imaging. J Magn Reson 1986;68:363–366
8. Brown TB, Kincaid BM, Ugurbil K. NMR chemical shift imaging inthree dimensions. Proc Natl Acad Sci USA 1982;79:3523–3526.
9. Maudsley AA, Hilal SK. Spatially resolved high resolution spectros-copy by four-dimensional NMR. J Magn Reson 1983;51:147–152.
Sensitivity-Encoded Spectroscopic Imaging 721

10. Duyn JH, Moonen CTW. Fast proton spectroscopic imaging of humanbrain using multiple spin-echoes. Magn Reson Med 1993;30:409–414.
11. Mansfield P. Spatial mapping of the chemical shift in NMR. MagnReson Med 1984;1:370–386.
12. Posse S, Tedeschi G, Risinger R, Ogg R, LeBihan D. High speed 1Hspectroscopic imaging in human brain by echo planar spatial-spectralencoding. Magn Reson Med 1995;33:34–40.
13. Sepponen RS, Sipponen JT, Tanttu JI. A method for chemical shiftimaging: demonstration of bone marrow involvement with protonchemical shift imaging. J Comput Assist Tomogr 1984;8:585–587.
14. Guimaras AR, Baker JR, Jenkins BG, Lee PL, Weisskopf RM, Rosen BR,Gonzales RG. Echoplanar chemical shift imaging. Magn Reson Med1999;41:877–882.
15. Norris DG, Dreher W. Fast proton spectroscopic imaging using thesliced k-space method. Magn Reson Med 1993;30:641–645.
16. Adalsteinsson E, Irarrazabal P, Topp S, Meyer C, Macovsci A, SpielmanDM. Volumetric spectroscopic imaging with spiral-based k-space tra-jectories. Magn Reson Med 1998;39:889–898.
17. Pruessmann KP, Weiger M, Scheidegger MB, Boesiger P. SENSE: sen-sitivity encoding for fast MRI. Magn Reson Med 1999;42:952–962.
18. Dydak U, Weiger M, Pruessmann KP, Van den Brink J, Lamerichs R,Meier D, Boesiger P. Scan time reduction in spectroscopic imagingusing SENSE. In: Proc 7th Annual Meeting ISMRM, Philadelphia,1999. p 679.
19. Weiger M, Pruessmann KP, Boesiger P. 2D SENSE for faster 3D imaging.In: Proc 8th Annual Meeting ISMRM, Denver, 2000. p 152.
20. Schaeffter T, Boernert P, Leussler C, Carlsen IC, Leibfritz D. Fast 1Hspectroscopic imaging using a multi-element head coil array. MagnReson Med 1998;40:185–193.
21. Haase A, Frahm J, Haenicke W, Matthaei D. 1H NMR chemical shiftselective (CHESS) imaging. Phys Med Biol 1985;4:341–344.
22. Bottomley PA. Spatial localization in NMR spectroscopy in vivo. AnnNY Acad Sci 1987;508:333–348.
23. Dydak U, Weiger M, Pruessmann KP, Meier D, Boesiger P. Sensitivityencoded multi-echo spectroscopic imaging. In: Proc 8th Annual Meet-ing ISMRM, Denver, 2000. p 368.
24. Weiger M, Pruessmann KP, Leussler C, Roschmann P, Boesiger P.Specific coil design for SENSE: a six-element cardiac array. MagnReson Med 2001;45:495–504.
722 Dydak et al.
Copyright © 2022 FDOKUMEN