
Sensitivity encoded silicon photomultiplier—a new sensor for high-resolution PET-MRI
17
This content has been downloaded from IOPscience. Please scroll down to see the full text. Download details: IP Address: 110.4.24.170 This content was downloaded on 12/10/2013 at 09:19 Please note that terms and conditions apply. Sensitivity encoded silicon photomultiplier—a new sensor for high-resolution PET-MRI View the table of contents for this issue, or go to the journal homepage for more 2013 Phys. Med. Biol. 58 4733 (http://iopscience.iop.org/0031-9155/58/14/4733) Home Search Collections Journals About Contact us My IOPscience
Transcript of Sensitivity encoded silicon photomultiplier—a new sensor for high-resolution PET-MRI

This content has been downloaded from IOPscience. Please scroll down to see the full text.
Download details:
IP Address: 110.4.24.170
This content was downloaded on 12/10/2013 at 09:19
Please note that terms and conditions apply.
Sensitivity encoded silicon photomultiplier—a new sensor for high-resolution PET-MRI
View the table of contents for this issue, or go to the journal homepage for more
2013 Phys. Med. Biol. 58 4733
(http://iopscience.iop.org/0031-9155/58/14/4733)
Home Search Collections Journals About Contact us My IOPscience
IOP PUBLISHING PHYSICS IN MEDICINE AND BIOLOGY
Phys. Med. Biol. 58 (2013) 4733–4748 doi:10.1088/0031-9155/58/14/4733
Sensitivity encoded silicon photomultiplier—a newsensor for high-resolution PET-MRI
Volkmar Schulz1,3, Yannick Berker1, Arne Berneking3,Negar Omidvari3, Fabian Kiessling2, Alberto Gola4
and Claudio Piemonte4
1 Department of Physics of Molecular Imaging Systems, Institute of Experimental MolecularImaging, RWTH Aachen University, Pauwelsstrasse 20, D-52074 Aachen, Germany2 Institute of Experimental Molecular Imaging (ExMI), RWTH Aachen University,Pauwelsstrasse 20, D-52074 Aachen, Germany3 Department Molecular Imaging Systems, Philips Research Europe—Aachen,Pauwelsstrasse 17, D-52074 Aachen, Germany4 Department of Silicon Radiation Sensors, Fondazione Bruno Kessler (FBK),Via Sommarive 18, I-38123 Trento Povo, TN, Italy
E-mail: [email protected]
Received 1 February 2013, in final form 17 April 2013Published 20 June 2013Online at stacks.iop.org/PMB/58/4733
AbstractDetectors for simultaneous positron emission tomography and magneticresonance imaging in particular with sub-mm spatial resolution are commonlycomposed of scintillator crystal arrays, readout via arrays of solid state sensors,such as avalanche photo diodes (APDs) or silicon photomultipliers (SiPMs).Usually a light guide between the crystals and the sensor is used to enable theidentification of crystals which are smaller than the sensor elements. However,this complicates crystal identification at the gaps and edges of the sensor arrays.A solution is to use as many sensors as crystals with a direct coupling, whichunfortunately increases the complexity and power consumption of the readoutelectronics. Since 1997, position-sensitive APDs have been successfully usedto identify sub-mm crystals. Unfortunately, these devices show a limitationin their time resolution and a degradation of spatial resolution when placed inhigher magnetic fields. To overcome these limitations, this paper presents a newsensor concept that extends conventional SiPMs by adding position informationvia the spatial encoding of the channel sensitivity. The concept allows a directcoupling of high-resolution crystal arrays to the sensor with a reduced amountof readout channels. The theory of sensitivity encoding is detailed and linked tocompressed sensing to compute unique sparse solutions. Two devices have beendesigned using one- and two-dimensional linear sensitivity encoding with eightand four readout channels, respectively. Flood histograms of both devices showthe capability to precisely identify all 4 × 4 LYSO crystals with dimensionsof 0.93 × 0.93 × 10 mm3. For these crystals, the energy and time resolution(MV ± SD) of the devices with one (two)-dimensional encoding have beenmeasured to be 12.3 · (1 ± 0.047)% (13.7 · (1 ± 0.047)%) around 511 keV
0031-9155/13/144733+16$33.00 © 2013 Institute of Physics and Engineering in Medicine Printed in the UK & the USA 4733

4734 V Schulz et al
with a paired coincidence time resolution (full width at half maximum) of462 · (1 ± 0.054) ps (452 · (1 ± 0.078) ps).
(Some figures may appear in colour only in the online journal)
1. Introduction
In recent decades, solid state sensors such as avalanche photo diodes (APDs) andsilicon photomultipliers (SiPMs) have evolved into an alternative detector technology tophotomultiplier tubes (PMTs) (Lewellen 2008, Nassalski et al 2008, Song et al 2010) forpositron emission tomography (PET), especially when combined with magnetic resonanceimaging (MRI). This development was to some extent triggered by the pioneer work ofShao et al (1997) in which long optical fibres were used to place the PMTs outside ahigh (3 T) magnetic field enabling the first simultaneous acquisition of PET and MRI athigh image resolution. Nine years later, Pichler et al (2006) demonstrated the performancebenefits gained by the direct detection of the scintillation light inside the 7 T MRI-bore withAPDs.
Parallel to this evolution, preclinical applications have always requested higher resolutionPET systems (Yang et al 2011, Heuveling et al 2011, Thorek et al 2012, Gargiulo et al 2012).Pixelated crystal arrays combined with APDs or SiPM arrays have shown to be a powerfulPET detector concept achieving sub-mm resolution in preclinical PET (James et al 2009,Yamamoto et al 2011). In order to use crystal arrays with a smaller pitch than the linear size ofthe SiPM channel, commonly, light guides are used between crystals and sensors distributingthe scintillation light across the sensor array. However, major side effects of light guides arethe insufficient separation of the crystals at the edges of the detector array and the need forlow trigger thresholds to support a sufficiently complete sampling of the light distribution.Furthermore, as the distributed scintillation light usually occupies a larger sensor area, pile-upat higher count rates, especially when short-lived tracers (such as Rb-82, O-15 or N-13) areused, degrades the noise equivalent count rate. Using as many sensors elements as crystals(1:1 coupling) seemed to be a way out for the mentioned limitations. However, in preclinicalimaging, a targeted spatial resolution of 0.5 mm, reflecting 5 mm clinical PET (Larobinaet al 2006, Lewellen 2008), would lead to an increased number of channels and finally to ahigh density of the readout electronic with an increased power consumption. In 1997, Burgeret al announced the concept of position-sensitive APDs (PSAPDs) allowing the identificationof small crystals directly attached to the PSAPD (Burger et al 1997). Further applicationsof PSAPDs have shown promising results (LSO, 1 × 1 × 20 mm3, dE/E = 19%, pairedcoincidence time resolution (pCTR) of 3.2 ns full width at half maximum (FWHM), 20 ◦C)with respect to crystal identification (Burr et al 2003, Shah et al 2004), also in combinationwith depth of interaction identification using double-sided readout (Dokhale et al 2004).Unfortunately, distortion in a high static magnetic field, e.g. 7 T, has been reported, whichhas led to algorithms that compensate the reported distortion (Chaudhari et al 2009). On theother hand, SiPMs are proven to have a faster response and thus offering the measurement oftime-of-flight pCTR down to the 100 ps (FWHM) range (Schaart et al 2010).
Recently, RMD (Watertown, USA) translated the idea of using resistive networks, as usedin PSAPDs to SiPMs (McClish et al 2010) and announced the first position-sensitive solidstate silicon photomultiplier (PS-SSPM). The proof of concept for the PS-SSPMs was reportedusing a test device with 2 × 2 active areas of 1.5 × 1.5 mm2 each. Successful identification of
Sensitivity encoded SiPM—a new sensor for high-resolution PET-MRI 4735
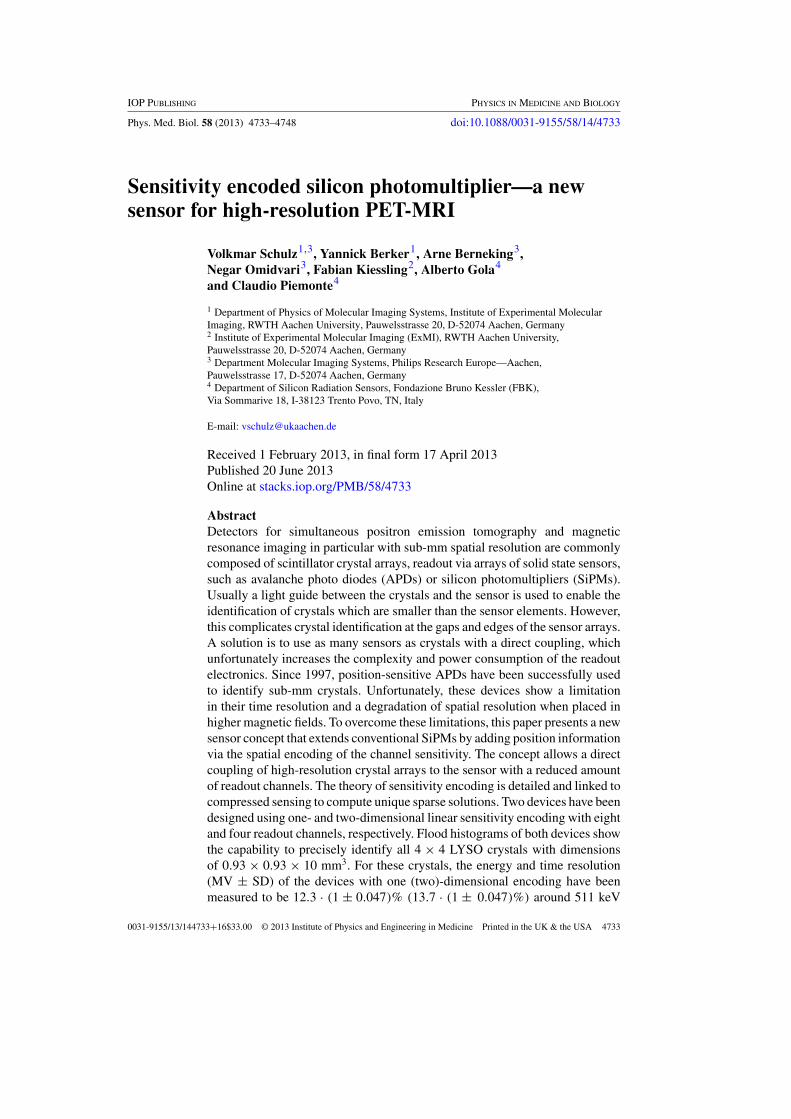
Figure 1. Sensor area A partitioned into P subareas Ap, called sample domains. A set of sampledomains Ap define the support Sn of a channel n with its sensitivity distribution sn(�x). Furthermore,K crystals are located over the P subareas Ap.
all 3 × 3 LYSO pixels with the sizes of 0.5 × 0.5 × 5 mm3 was demonstrated. Furthermore,an energy and timing resolution using a 1 × 1 × 20 mm3 LYSO crystal of dE/E = 19.1%with a pCTR of 0.9 ns (FWHM) were reported.
The aim of this paper is to present an alternative idea and first results of a sensitivityencoded silicon photomultiplier (SeSP). The SeSP concept combines the idea of structuringthe sensitivity of the individual SiPM channels, and by this using a light encoding principle,with the advantages of the fast response of SiPMs (Schulz et al 2011). Thus, a SeSP device willoffer the identification of at least one γ -photon–crystal interaction with N readout channels bythe identification of a sparse solution; even K > N crystals are directly coupled to the sensor.This paper derives the theory of sensitivity encoding which allows the development of newreconstruction and design options. Results on energy, time and position resolution using smallLYSO arrays for two different proof-of-concept devices are shown, which are the most criticalparameters for high-resolution preclinical PET detectors.
2. Method and material
2.1. Fundamentals of sensitivity encoding
In order to derive the concept of sensitivity encoding for scintillator-based detectors, weconsider a rectangular sensor with the area A in the x-y-planes, as depicted in figure 1. Thesensor is partitioned into P sub-areas Ap, which we call the sample domains. We assume thatthe sensitivity sn(�x) of a readout channel n is defined across a collection of sample areas Ap.We call this collection the support Sn of channel n. Furthermore, we assume that an array withK scintillator crystals is connected to this sensor area. The interactions of gamma photonswith crystal k will lead to a mean light distribution ηk(�x). We assume that the mean lightdistribution of this interaction could be written as a product of the normalized mean lightdistribution �0
k (�x), measured around the photopeak, and a mean amplitude αk:
ηk(�x) = �0k (�x)αk,
⟨�0
k (�x)|1⟩A = 1. (1)

4736 V Schulz et al
In this equation, �0k (�x) is normalized according to the inner product∫
Aa(�x)b(�x) da = 〈a|b〉A . (2)
The mean response ckn of channel n caused by a γ -photon interaction with crystal k is given
by the projection of the mean light distribution to the corresponding channel sensitivitydistribution sn(�x):
ckn = gn
P∑p=1
⟨sn(�x)|�0
k (�x)⟩Ap
αk. (3)
We call gn the linear gain factor of channel n. As sn(�x) may detect light from other crystals,the overall channel response cn caused by all possible γ -photon–crystal interactions is givenvia the superposition of all K possible ck
n:
cn = gn
K∑k=1
P∑p=1
⟨sn(�x)|�0
k (�x)⟩Ap
αk. (4)
Furthermore, with the assumption of constant mean light and sensitivity distributions alongAp and with definition of,
snp = 〈sn(�x)|1〉Ap, �0pk = ⟨
1|�0k (�x)
⟩Ap
, (5)
the mean channel responses �c of the entire sensor for arbitrary scintillation events could bewritten in the vector notation,
�c = gSL0�α = H0�α. (6)
In this equation, the N × N matrix g is the diagonal gain matrix. The known N × P matrixS is defined via snp and thus contains information about the channel crystal encoding. Theusually unknown P × K matrix L is defined via the elements �0
pk and reflects how the light isdistributed across the elements Ap on average. We denote the N × K matrix H0 as the systemmatrix of our sensor. A column�h0
k of the system matrix H0 thus defines the mean response ofa scintillation in the crystal k around the photopeak:
H0 = [�h0
1, . . . ,�h0
K
]. (7)
For the desired case of N < K, the above system could not be solved for an arbitrary vector �α.However, we know that for PET, in most cases the solution vector �α has only z � K non-zerocomponents (�α is z-sparse), e.g. with z = 1 (single photopeak interaction or Compton escape)or z > 1 (pile-up events or Compton scatter) entries. This sparseness allows us to construe thesensitivity encoding problem as a classical compressed sensing (CS) problem. Thus, in CSterms, the light distribution matrix L0 corresponds to the functional basis at the photopeak ofour light distribution, while the sensitivity matrix S corresponds to the so-called measurementmatrix. From CS it is known that in the case of a noise-free system, there is a unique z-sparsesolution with z entries if all possible 2z combinations of column vectors of H0 are linearlyindependent. This property is described by the Kruskal-rank (K-rank) σ (H0) = 2z of thematrix H0 (Candes et al 2006, Mishali and Eldar 2008). Other properties of H0, such as therestricted isometric property or the statistics of the null-space, are important to find the bestz-sparse solution if the measurement contains noise (Stojnic et al 2008). Nevertheless, findingthe optimal z-sparse solution for a given H0 could be taken as a combinatorial problem. As (6)holds only for the mean response around the photopeak, we minimize the residual of (6) fora measurement �c m and all possible sets of crystal indices κ = {k1, . . . , ki, ki+1, . . . , kz}ki<ki+1
with respect to their L2-norm:
�αmκ = arg min
�ακ
‖�c m − Hκ�ακ‖2. (8)

Sensitivity encoded SiPM—a new sensor for high-resolution PET-MRI 4737
(a) (b)
Figure 2. Normalized sensitivity matrices for 4×4 crystals with (a) 1:1 coupling between channelsand crystals leading to 4 × 4 readout channels, (b) one-dimensional linear encoding with 4 × 2readout channels, (c) two-dimensional linear encoding scheme with 2 × 2 readout channels. Thescaling from blue (1.0) to white (0.0) indicates the normalized sensitivity of channel n (row)for crystal k (column) with a normalization on the largest component. The red dotted rectangleindicates an encoding for crystal k = 6 with 1 out of 16 (a), 2 out of 8 (b) and with all four(c) channels.
Here, �αmκ ∈ R
z and the submatrix Hκ ∈ RN×z are given by
�αmκ = (
HTκ Hκ
)−1HT
κ �cm, Hκ = [�h0
k1, . . . ,�h0
kz
]. (9)
The minimization as proposed implies the solution of(K
z
)linear systems of the order z. The
corresponding energy portions �αmκ need to be scaled to the photopeak position using a diagonal
gain correction matrix G0κ ∈ R
z×z:
�Emκ = G0
κ�αmκ , G0
κ = diag(g0
kiki
). (10)
For the special case in which we assume only one gamma crystal interaction, we willuse the centre-of-gravity (COG) calculation to assess the position accuracy with conventionalCOG (or flood) histograms to compute H0:
�pm =∑N
n=1 �xncmn∑N
n=1 cmn
. (11)
Here, the vector �pm denotes the geometric position of the actual event m, cmn is the actual
measurement of channel n and the components of�xn are the corresponding x- and y-coordinates.
2.2. Linear 1D and 2D light encoding schemes
The previous section does not contain specific assumptions on the crystal array nor on thesensor design. The most obvious and simple design would be a sensor with as many readoutchannel as crystals (N = P = K) in which the sensitivity matrix, which we call S0D ∈ R
K×K ,is given by the identity matrix, see figure 2(a). As indicated via the red dotted rectangle infigure 2(a), the crystal k = 6 has the channel number n = k = 6. However, we would liketo use the theory of sensitivity encoding to reduce the number of readout channels (N � K)directly in the sensor design, preferably allowing the identification of all individual crystals.
Intuitively, we followed the idea of encoding the position along one dimension of a lineararray of crystals via unique ratios of two associated channels ci and ci+1. In particular, the

4738 V Schulz et al
encoding could be realized via a linear increase and decrease of the sensitivity areas of the twoinvolved channels. Accordingly, we will refer to this encoding scheme as 1D encoding. Anapplication of this encoding scheme to an array of 4 × 4 crystals with four parallel 1D rowsleads to the sensitivity matrix S1D ∈ R
8×16 which is given in figure 2(b). As an example, thered dotted rectangle in figure 2(b) shows that the crystal k = 6 is encoded via the unique ratioof channels n = (3, 4). For square arrays with K crystals, this encoding would allow us toreduce the amount of readout channels to N = 2 × √
K. The K-rank of this encoding schemeis σ (S1D) = 2, which allows the computation of �α with z = 1.
Obviously, the idea of linear encoding could be used in two orthogonal directions, whichcould be realized by using one pair of channels for vertical and another pair of channels forhorizontal linear encoding. We will refer to this encoding in this paper as 2D encoding. Thesensitivity matrix S2D ∈ R
4×16 of this encoding scheme for the 4 × 4 crystal arrays is givenin figure 2(c). Again as an example, the red dotted rectangle in figure 2(c) shows that crystalk = 6 is encoded via the unique ratio of all four channels. The 2D concept would allow usto reduce the amount of readout channels to N = 2 × 2. In the same manner, σ (S2D) = 2,
which means that we can estimate one crystal interaction. Interestingly, CS theory tells ushow to define other sensitivity matrices which would allow us to differentiate more than onegamma–crystal interaction point (Donoho 2006).
2.3. 1D and 2D light encoding sensors
This section describes the possible implementations of the above-mentioned 1D and 2Dencoding schemes. During the design of these devices, the following boundary conditionshaven been chosen.
• The Geiger-mode cells are still distributed in a regular way over the entire sensitive area.• Each Geiger-mode cell is connected to only one out of the N readout channels.• Each channel has the same amount of Geiger-mode cells.• No additional processing steps in the fabrication are made to realize the encoding schemes.• In order to avoid light spreading, each crystal is coupled via a thin optical medium directly
to the sensor.
1D-SeSP. The 1D encoding scheme is realized according to figure 3(a) with a linearstepwise decrease/increase of sensitivity. The sample domains Ap have the same size as thecrystals (P = K). In particular, for p ∈ {1, 4}, channels c2p−1 and c2p do have the sensitivitys2p−1 = {1, 2/3, 1/3, 0} and s2p = {0, 1/3, 2/3, 1}. For instance, a sensitivity distributionof 1 or 2/3 of channel n in the area Ap corresponds to a connection of all or ≈2/3 of theGeiger-mode cells to this specific channel. The Geiger-mode cell pitch of this design is47.6 μm, leading to 21 × 19 cells under each crystal. The pictures of the sensor concept anddevice are given in figure 3. The sensitive area is 4 × 4 mm2 with an outline of the siliconchip of 5 × 5 mm2. The channel capacitance is about 40 pF, while the dark-count-rate (DCR)at room temperature is about 5 × 10⁶ counts s−1 at 4 V above breakdown voltage.
2D-SeSP. The 2D encoding scheme was realized using subareas Ap with half the sizeof the crystal dimension in the horizontal direction (P = 2K), as shown in figure 4(a). Theareas Ap are then alternately used for x and y encoding similar to the 1D encoding scheme. Inparticular, the ratio between channel c1(green) and c2(blue) is used for horizontal encoding,while the ratio between c3(red) and c4(yellow) is used for vertical encoding. The Geiger-modecell pitch and size are identical to the 1D design but with large gaps in the vertical direction atthe location of the crystal edges (grey dotted lines), leading to 19×19 cells under each crystal.The purpose of these additional gaps in the vertical direction was to increase the crystal sensor

Sensitivity encoded SiPM—a new sensor for high-resolution PET-MRI 4739
(a) (b)
Figure 3. Sensor design with the sensitivity distribution of four one-dimensional linear encodedchannels for a 1D-SeSP with 2 × 4 readout channels. The colours red and yellow indicate whethera cell is electrically connected to channel c2p−1 or c2p, p ∈ {1, 2, 3, 4}. The sensitive area of thedevice is 4 × 4 mm2, while the sensitive area for a crystal is defined by 21 × 19 cells in thevertical × horizontal direction with a linear cell extension of 47.6 μm.
(a) (b)
Figure 4. Sensor design with a sensitivity distribution of a two-dimensional linear encoded channelswith 2 × 2 readout channels. The colours red and yellow indicates whether this channel is assignedto c3 or c4, while the colour green and blue indicates whether a cell is assigned to channel c1 orc2. The sensitive area is 4 × 4 mm2, while the sensitive area is defined by 19 × 19 cells in thevertical × horizontal direction with a linear cell extension of 47.6 μm.
alignment tolerances. The cell connection is realized in a horizontal manner and thus does notbenefit from the existence of these gaps.
A picture of the sensor device is given in figure 4(b). Currently, no effort has been spenton minimizing the area of the conductive bridge. A future design which allows for stacked butisolated metal layers would thus enable to improve the fill factor of the entire device due tosmall dead areas for cell connection. The sensitive area is 4 × 4 mm2 with an outline of thesilicon chip of 5 × 5 mm2. The channel capacitance is about 80 pF, while the DCR at roomtemperature is about 1 × 10⁷ counts s−1 at 4 V above the breakdown voltage.
2.4. Measurement set-up
1D-SeSP and 2D-SeSP devices with 4 × 4 mm2 have been assembled with 4 × 4 LYSO arrays(Agile, Knoxville, USA) with 0.93 × 0.93 × 10 mm3 crystals. The separation of the crystalswas achieved via reflective foil (VikuitiTM, 3M). All crystal arrays have been mounted via
4740 V Schulz et al
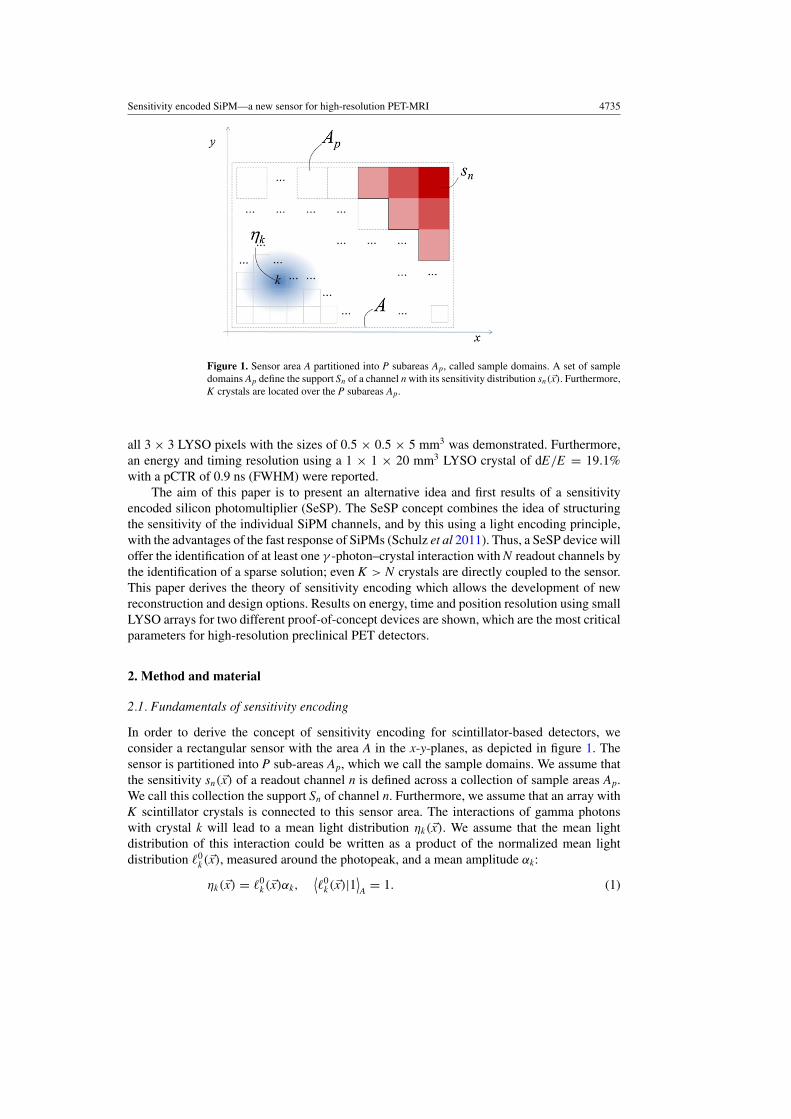
Figure 5. Energy histograms (measured in singles mode) of all 4 × 4 crystals of the 1D-SeSPdesign. Parameters are Vbr + �V = (28.5 + 4.5) V, least-squares crystal identification of (8), about2 × 106 events. The red lines indicate the fits with the Gaussian curves. No distortion correctionof the energy around the photopeak was applied.
MeltmountTM (Cargille Laboratories, USA) to the sensor arrays with careful alignment to thesensor outline. Measurements have been made in singles and coincidence modes. Each SeSPchannel has been connected via a serial 100 resistor to the reverse bias voltageVb = Vbr+�V .A blocking capacitor of 47 nF has been used in parallel to this serial connection. The voltagedrop over the resistor is fully differentially coupled via two 47 nF capacitors to a two-stage low-noise transimpedance amplifier (TI, THS3202) with a gain of 0.8×4.3. The amplifiers are readout via a VME rack (CAEN V775(TDC), V792(QDC), V895(LED), Philips Scientific 704/726(Coincidence and Control Logic)). The reference sensor for coincidence measurements is aHamamatsu H6524 PMT, which is equipped with a TeflonTM wrapped 4 × 4 × 6 mm3 LYSOcrystal. The pCTR of the reference sensor was measured to be 277 ps (FWHM). Coincidencewindow was set to 300 ns, while the signal integration time for the QDC was set to 400 ns. ANa-22 point source of 2.6 MBq was placed with a distance of 10 and 90 mm to the PMT andthe SeSP, respectively. Trigger thresholds were set to 10 mV (after amplification) for the SeSP.Prior to the measurement, the mean values of the electronic offsets �ci,o have been measured.All measurements have been performed at environment temperature (23 ◦C) without activecooling of any of the devices.
3. Results
3.1. Energy and timing resolution
Figure 5 shows the energy histograms for a 1D-SeSP design for all 4×4 crystals. Singles modemeasurements have been used in order to show the saturation effect, which is comparable for

Sensitivity encoded SiPM—a new sensor for high-resolution PET-MRI 4741
Figure 6. Energy histograms (measured in coincidence mode) of all 4 × 4 crystals of the 2D-SeSPdesign. Parameters of measurement: Vbr +�V = (29.3+4.1) V, least-squares crystal identificationof (8), about 2 × 10⁶ events. The red lines indicate the fits with the Gaussian curves. No distortioncorrection of the energy around the photopeak was applied.
the 1D and 2D devices, as the cell designs are equal and the fill factors are very similar. Allhistograms were calculated using (8). After photopeak identification, the photopeaks werescaled to 511 keV with crystal-individual gain factors g0
κκ , using (10), with no additionalnonlinearity (saturation) correction. The energy resolution dE/E was measured in FWHM byfitting a Gaussian curve to the photopeak area of each histogram. Under similar conditions,figure 6 shows energy histograms of the 2D-SeSP, but measured in coincidence mode. Energyresolutions and corresponding gain factors are summarized for a 1D-SeSP (left) and 2D-SeSP(right) via intensity plots in figure 7. The mean value (MV) and standard deviation (SD) ofthe energy resolution for a 1D- and 2D-SeSP were measured to 12.31 · (1 ± 0.047)% and13.74 · (1 ± 0.047)%, respectively.
pCTR in FWHM for each crystal k (pCTRk) was estimated from the individual timedifference �tk in reference to a PMT (pCTRPMT = 277 ps (FWHM)) taking the first timestamp of all SeSP channels. The time difference histograms �tk of the 2D-SeSP are shown infigure 8. The 4 × 4 pCTRs of two SeSPs have then been computed using the equation
∀k ∈ K : pCTRk =√
τ 2k + τ 2, τ 2
k = �t2k − pCTR2
PMT
2, (12)
and are shown with their corresponding skews in figure 9. Here, τ denotes the mean valueof all τk. In this figure, the skews �Tk correspond to the peak position of the Gaussiancurve in figure 8. The MV and SD in FWHM of pCTR across the 1D- and 2D-SeSP arraysare 461.7 · (1 ± 0.054) and 451.5 · (1 ± 0.078) ps, respectively.

4742 V Schulz et al
Figure 7. Intensity plots of energy resolutions (FWHM) and gain factors for 1D (left) and 2D (right)SeSP sensor with 4 × 4 crystals. MV ± SD of the energy resolutions are 12.31·(1 ± 0.047)%(1D-SeSP), and 13.74·(1 ± 0.047)% (2D-SeSP). MV ± SD of the normalized gain factors are0.97 · (1 ± 0.027) (1D-SeSP) and 0.88 · (1 ± 0.059) (2D-SeSP).
Figure 8. Timing histograms of all 4 × 4 crystals of the 2D-SeSP design in coincidence to areference photomultiplier (PMT) with pCTR of 277 ps (FWHM). Parameters of measurement:Vbr + �V = (29.3 + 4.1) V, least-squares crystal identification of (8), about 2 × 10⁶ events. Thered lines indicate the fits with the Gaussian curves.

Sensitivity encoded SiPM—a new sensor for high-resolution PET-MRI 4743
Figure 9. Intensity plots of pCTR in FWHM and the skew �T for the 1D (left) and 2D (right) SeSPsensors with 4 × 4 crystals. Parameters of the measurement: 1D-SeSP Vbr + �V = (32.6 + 5.4)
V, about 2 × 10⁶ events, MV and SD of pCTR across the array are 461.7 · (1 ± 0.054) ps (MV ±SD in FWHM); 2D-SeSP Vbr +�V = (29.3 + 4.1) V, about 2 × 10⁶ events. MV and SD of pCTRacross the array are 451.5 · (1 ± 0.078) ps (MV ± SD in FWHM). In both cases, least-squarescrystal identification was used.
3.2. Flood histograms and line profiles
Flood histograms of the 1D- and 2D-SeSP detectors have been computed from coincidencemeasurements using COG positions from (11) accepting only events of αm
k within the FWHMaround the photopeak. All these events αm
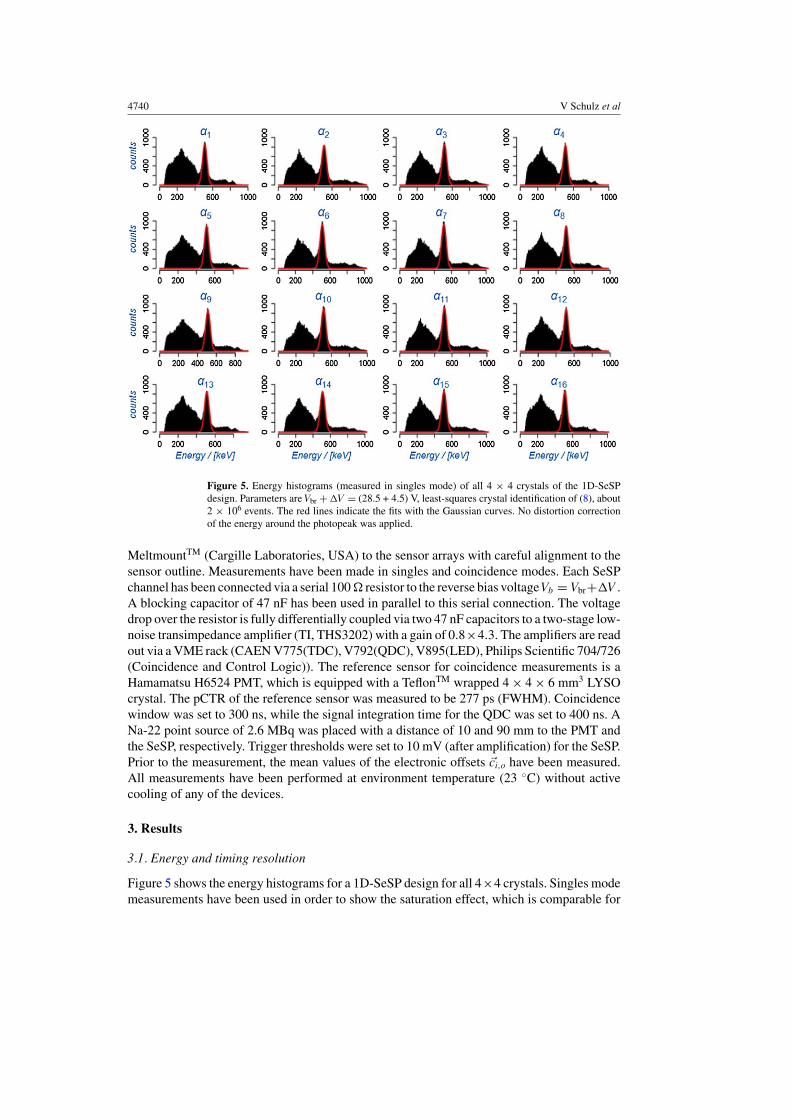
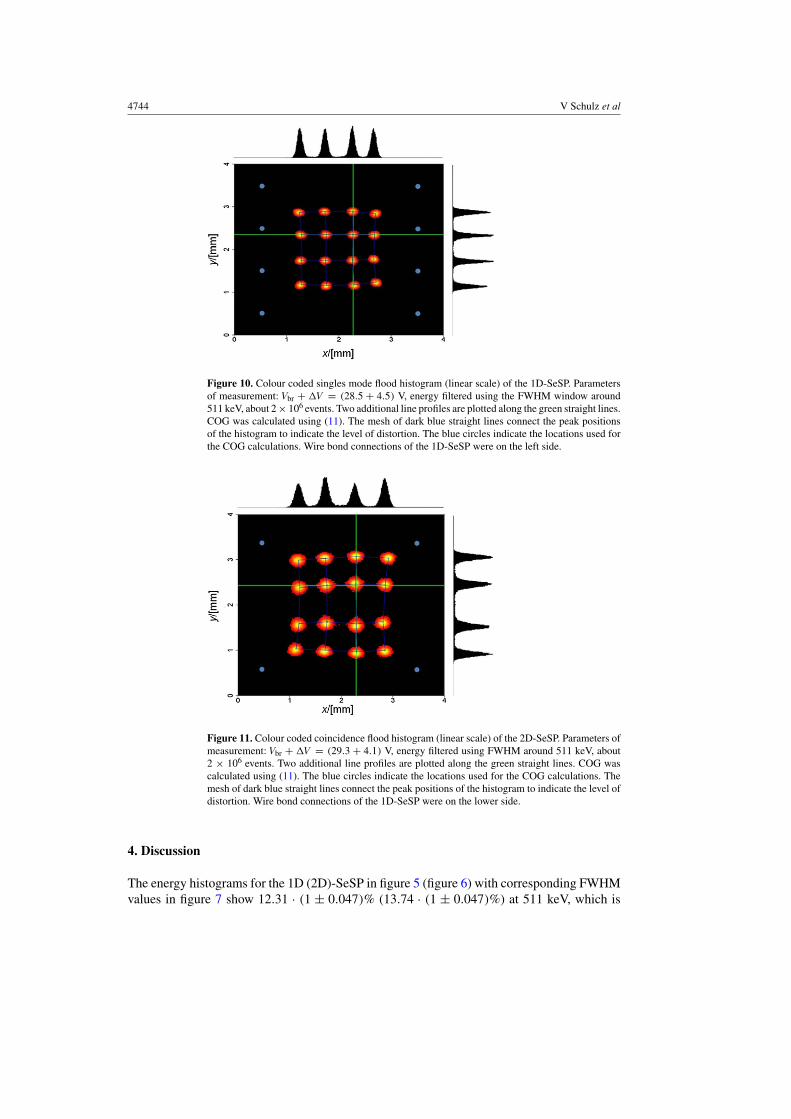
k have been used to compute the system matrices.Figure 10 shows the colour coded flood histogram for the 1D-SeSP design of figure 2(b) withadditional line profiles along two selected lines (green) indicating the peak to value ratios.Similar to the 1D device, figure 11 shows the flood histogram for the 2D-SeSP design infigure 2(c), also with two intensity profiles (green lines). In both cases, all 16 crystals can beclearly identified.
3.3. System matrices H01D,2D
The system matrices H01D and H0
2D for the 1D and 2D encoding have been calculated from theCOG flood histograms. In particular, each column vector�hk of H0 has been computed from themean value of �c m within the FWHM of the photopeak position with COG, but geometricallyrestricted to events within a radius of 0.1 mm around the peak of the spot.
3.4. Identification of multiple events
Crystal indices have been computed using (8) for z = 1 and z = 2 to prove the consistency ofthese two sets of solutions considering both encoding schemes. The corresponding histogramscontaining the first 4 × 10⁴ events are shown in figure 13. Here, figures 13(a) and (d) containall events, while figures 13(b) and (e) and figures 13(c) and (f) contain subsets, in which thecrystal index of the solution which was achieved for z = 1 is not part (inconsistent) and is part(consistent) of the indices which have been achieved for z = 2, respectively.
4744 V Schulz et al
Figure 10. Colour coded singles mode flood histogram (linear scale) of the 1D-SeSP. Parametersof measurement: Vbr + �V = (28.5 + 4.5) V, energy filtered using the FWHM window around511 keV, about 2 × 10⁶ events. Two additional line profiles are plotted along the green straight lines.COG was calculated using (11). The mesh of dark blue straight lines connect the peak positionsof the histogram to indicate the level of distortion. The blue circles indicate the locations used forthe COG calculations. Wire bond connections of the 1D-SeSP were on the left side.
Figure 11. Colour coded coincidence flood histogram (linear scale) of the 2D-SeSP. Parameters ofmeasurement: Vbr + �V = (29.3 + 4.1) V, energy filtered using FWHM around 511 keV, about2 × 106 events. Two additional line profiles are plotted along the green straight lines. COG wascalculated using (11). The blue circles indicate the locations used for the COG calculations. Themesh of dark blue straight lines connect the peak positions of the histogram to indicate the level ofdistortion. Wire bond connections of the 1D-SeSP were on the lower side.
4. Discussion
The energy histograms for the 1D (2D)-SeSP in figure 5 (figure 6) with corresponding FWHMvalues in figure 7 show 12.31 · (1 ± 0.047)% (13.74 · (1 ± 0.047)%) at 511 keV, which is
Sensitivity encoded SiPM—a new sensor for high-resolution PET-MRI 4745
better than the reported 0.9 ns for 1 × 1 × 20 mm3 of McClish et al. Photopeak and Comptonedges are clearly visible in both designs for all crystals. Under each crystal, only 21 × 19(19 × 19) SiPM-cells are located in the case of the 1D(2D) design. Due to the direct couplingof the crystals to the sensors, significant saturation effects are to be expected, leading tothe compression/expansion of the energy spectrum above/below the photopeak. This effectcould be observed in the energy histogram of the 1D device, which has been measured insingles mode, showing the position of the 1275 keV peak around 850–900 keV. However, asthe calculation of αm
k via (8) results in a linearization around the photopeak, no saturationcorrection was applied. Nevertheless, a slight asymmetric shape of the Gaussian is noticeable.Future designs with smaller Geiger-mode cells may help to improve the energy resolution andlinearity. On the other hand, smaller cells will also lead to a lower fill factor and thus to alower photon detection efficiency, which will reduce the energy and timing resolution of thedevice. Therefore, a trade-off investigation is needed to find the optimal design parameters.The flood histograms of the 1D(2D)-SeSPs in figure 10 (figure 11) show good separationof all 4 × 4 crystals, and no crystal identification problems at the edges are visible. Inboth cases, small cushion-like distortion of the flood histogram is noticeable. The energy andposition resolution indicate the potential identification of even smaller crystals by using smallerGeiger-mode cells. In terms of the peak-to-value ratio, the 1D-SeSP clearly outperforms the2D-SeSP. This might be caused by the fact that a channel in a 2D device has twice the areaand thus twice the dark noise. Furthermore, the self-dissipation of the analogue signal causedby twice amount of Geiger-mode cells is also doubled compared to the 1D-SeSP. This effectmay limit the overall sensor area in future designs.
The normalized intensity plots of the system matrix of H01D (H0
2D) in figure 12 indicatea significant similarity to the sensitivity encoding matrices of figure 2(b) (figure 2(c)). Thissimilarity is mainly caused by an intended light concentration under the crystal due to thedirect coupling of the crystal to the SeSP, causing only minor parasitic light sharing. In thecurrent implementation of the system matrix computation, the selection of the crystal index isstill done via the identification of the spots in the flood histogram, which implies a sufficientseparation with respect to the COG measure. This approach may lead to some restrictions tosensor or crystal size with higher compression ratios K/N and thus may request alternativeclassification schemes.
The Gaussian widths and positions of the time difference measurements of both designssummarized as given in figure 9 indicate homogeneous responses for the 1D-SeSP with461.7 · (1 ± 0.054) ps (MV ± SD) and for the 2D-SeSP with 451.5 · (1 ± 0.078) ps (MV ±SD of FWHM) pCTR. As an example, figure 8 shows the time difference measurements ofthe 2D-SeSP (at room temperature) to a PMT with a pCTR of 277 ps (FWHM). The timingand energy measurements reflect the good light collection and detection efficiency supportedby the direct coupling of the crystal to the device. The skew shows a systematic increase asa function of the connection line length which needs to be taken into account. It should benoted that besides the optimization of the bias voltages, no systematic optimization of thereadout circuits with respect to timing has been made. Similar to the measurement of theenergy resolution, pCTR is also expected to be degraded in larger devices due to the alreadymention effects.
The presented SeSP designs aim at reducing the amount of channels, which leads, in thecase of less readout channels (N) than crystals (K), to a system matrix H0 ∈ R
N×K that is notinvertible. From CS theory, we know that the K-rank (σ (S1D,2D) = 2) allows us to calculatefor the proposed sensitivity matrices a unique z-sparse solution for z = 1, resulting in a singleαm
k . However, this restriction does not connote that a solution for z = 2 always fails, and itis interesting to investigate in which cases and how often this happens. Furthermore, in the

4746 V Schulz et al
Figure 12. Intensity plots of the measured system matrices H01D (upper) and H0
2D (lower) for4 × 4 crystals and eight (1D) and four (2D) readout channels. Each column is normalizedon the largest entry, thus scaling linearly from 0 (white) to 1 (blue). Parameters: 1D-SeSPVbr + �V = (28.5 + 4.5) V; 2D-SeSP Vbr + �V = (29.3 + 4.1) V.
case of a single crystal interaction, a solution with z = 2 should lead to two energies, oneof which is close to zero. In such a case, a solution with z = 1 is to be expected to lead tothe same (consistent) crystal index and energy. For multiple crystal interactions or non-uniqueencodings, as evoked by the linear encoding, we would expect different sets of solutions(inconsistent) for some events. This behavior is reflected by figures 13(a) and (d) for the 1Dand 2D design, respectively. Figures 13(b) and (e) contain all events that show inconsistentcrystal indices, which are in the case of the 1D design limited to the linear encoding areas. Theconsistent results are shown in figures 13(c) and (f). The diagonal structure of figures 13(c)and (f) indicates consistency also within the linear encoding areas. Furthermore, it shows thatthe 1D-SeSP design could resolve potential multiple interactions between the different linearencoding areas for 75% of the events. Although figure 13(f) indicates high consistency rates,the absolute number of consistent events is just about 43% and thus significantly lower thanin the 1D design. But still multiple crystal interactions, such as Compton scatters or pile-upevents, could be identified in some cases.
It is interesting to note that in the principle encoding scheme S could be designed in away which would allow to identify sparse solutions with z > 1, while keeping the amount ofreadout channels the same for both devices. Such a device would enable the identification andpositioning of multiple events for almost all events. As the light-sharing matrix L correspondsto the basis functions in CS theory, the condition of L plays an important role to benefit fromthis feature in practice.

Sensitivity encoded SiPM—a new sensor for high-resolution PET-MRI 4747
(a) (b) (c)
(d) (e) (f)
Figure 13. Histograms of crystal indices for solutions of (8) with z = 1 (horizontal axis) overindices from z = 2 (vertical axis). The first row contains results for the 1D-SeSP, while the secondrow corresponds to results achieved with the 2D-SeSP. The first column contains all events, whilein the third (second) column, all events are plotted in which the index for z = 1 is (not) part of theindices of the identified pair (z = 2). The histogram covers the first 40 000 events of the previouslyshown measurements. The number of events in the plots are (a) 40 000, (b) 10 121, (c) 29 879,(d) 40 000, (e) 22 856 and (f) 17 144.
5. Conclusion
We have demonstrated the feasibility of a new SiPM device which makes use of sensitivityencoding in order to reduce the amount of readout channels. Accurate identification of all 4 ×4 crystals of a regular array has been demonstrated with devices with 2 × 4 (one-dimensionalencoding) and 2 × 2 (two-dimensional encoding) readout channels. Good energy resolution(<13.8% (MV)), paired coincidence timing resolution (<462 ps MV in FWHM) and stableoperation have been achieved for both devices. In future work, new designs with other encodingschemes and larger detector areas will be investigated.
Acknowledgments
This research was supported by the European Community Seventh Framework Programme,project number 241711: SUB nanosecond Leverage In PET/MR ImAging (SUBLIMA). AllSeSPs have been manufactured by FBK. VS is a part-time employee of Philips Research. Apatent application relevant to this work has been submitted by Koninklijke Philips ElectronicsN.V. with VS as the inventor.

4748 V Schulz et al
References
Burger P, Keters M, Van Buul L and Verplancke J 1997 New generations of position sensitive silicon detectors MRSFall Meeting (Boston, 5 Dec. 1997) vol 487 pp 411–22
Burr K C et al 2003 Evaluation of a position sensitive avalanche photodiode for pet IEEE Trans. Nucl. Sci. 50 792–6Candes E J, Romberg J and Tao T 2006 Robust uncertainty principles: exact signal frequency information IEEE
Trans. Inform. Theory 52 489–509Chaudhari A J, Joshi A A, Wu Y, Leahy R M, Cherry S R and Badawi R D 2009 Spatial distortion correction and
crystal identification for MRI-compatible position-sensitive avalanche photodiode-based PET scanners IEEETrans. Nucl. Sci. 56 549–56
Dokhale P A, Silverman R W, Shah K S, Grazioso R, Farrell R, Glodo J, McClish M A, Entine G, Tran V Hand Cherry S R 2004 Performance measurements of a depth-encoding PET detector module based on position-sensitive avalanche photodiode read-out Phys. Med. Biol. 49 4293–304
Donoho D L 2006 Compressed sensing IEEE Trans. Inform. Theory 52 1289–306Gargiulo S, Greco A, Gramanzini M, Petretta M P, Ferro A, Larobina M, Panico M, Brunetti A and Cuocolo A 2012
PET/CT imaging in mouse models of myocardial ischemia J. Biomed. Biotechnol. 2012 541872Heuveling D A, Visser G W M, Baclayon M, Roos W H, Wuite G J L, Hoekstra O S, Leemans C R, de Bree R and
van Dongen G A M S 2011 89Zr-nanocolloidal albumin-based PET/CT lymphoscintigraphy for sentinel nodedetection in head and neck cancer: preclinical results J. Nucl. Med. 52 1580–4
James S S, Yang Y, Wu Y, Farrell R, Dokhale P, Shah K S and Cherry S R 2009 Experimental characterization andsystem simulations of depth of interaction PET detectors using 0.5 mm and 0.7 mm LSO arrays Phys. Med.Biol. 54 4605–19
Larobina M, Brunetti A and Salvatore M 2006 Small animal PET: a review of commercially available imaging systemsCurr. Med. Imaging Rev. 2 187–92
Lewellen T K 2008 Recent developments in PET detector technology Phys. Med. Biol. 53 R287–317McClish M, Dokhale P, Christian J, Stapels C, Johnson E, Robertson R and Shah K S 2010 Performance measurements
of CMOS position sensitive solid-state photomultipliers IEEE Trans. Nucl. Sci. 57 2280–6Mishali M and Eldar Y 2008 The REMBO algorithm: accelerated recovery of jointly sparse vectors 16th
European Signal Processing Conf. (EUSIPCO 2008) (Lausanne, Switzerland, 25–29 Aug. 2008) (availableat www.eurasip.org/Proceedings/Eusipco/Eusipco2008/papers/1569104696.pdf)
Nassalski A, Mroszynski M, Syntfeld-Kazuch A, Swiderski T, Szczesniak L, Wolski D and Batsch T 2008 Applicationof hamamatsu S8550 APD array to the common PET/CT detector IEEE Trans. Nucl. Sci. 55 2460–4
Pichler B J, Judenhofer M S, Catana C, Walton J H, Kneilling M, Nutt R E, Siegel S B, Claussen C D and Cherry S R2006 Performance test of an LSO-APD detector in a 7-T MRI scanner for simultaneous PET/MRI J. Nucl. Med.47 639–47 (available at http://jnm.snmjournals.org/content/47/4/639.abstarct)
Schaart D R, Seifert S, Vinke R, van Dam H T, Dendooven P, Lohner H and Beekman F J 2010 LaBr(3):Ce andSiPMs for time-of-flight PET: achieving 100 ps coincidence resolving time Phys. Med. Biol. 55 N179–89
Schulz V, Dueppenbeckerl P, Lerche C W, Gola A, Ferre A, Taroli A and Piemonte C 2011 Sensitivity encoded siliconphotomultipliers (SeSPs): a novel detector design for uniform crystal identification IEEE Nucl. Sci. Symp. andMed. Imaging Conf. vol 2 pp 3027–9
Shah K, Grazioso R, Farrell R, Glodo J, McClish M, Entine G, Dokhale P and Cherry S 2004 Position sensitive APDsfor small animal PET imaging IEEE Trans. Nucl. Sci. 51 91–5
Shao Y, Cherry S R, Farahani K, Meadors K, Siegel S, Silverman R W and Marsden P K 1997 Simultaneous PETand MR imaging Phys. Med. Biol. 42 1965–70
Song T Y, Wu H, Komarov S, Siegel S B and Tai Y-C 2010 A sub-millimeter resolution PET detector module usinga multi-pixel photon counter array Phys. Med. Biol. 55 2573–87
Stojnic M, Xu W and Hassibi B 2008 Compressed sensing-probabilistic analysis of a null-space characterizationIEEE Int. Conf. on Acoustics, Speech, and Signal Processing vol 2 pp 3377–80
Thorek D L J, Abou D S, Beattie B J, Bartlett R M, Huang R, Zanzonico P B and Grimm J 2012 Positronlymphography: multimodal, high-resolution, dynamic mapping and resection of lymph nodes after intradermalinjection of 18F-FDG J. Nucl. Med. 53 1438–45
Yamamoto S, Watabe H, Kanai Y, Imaizumi M, Watabe T, Shimosegawa E and Hatazawa J 2011 Development of ahigh-resolution Si-PM-based gamma camera system Phys. Med. Biol. 56 7555–67
Yang Y, James S S, Wu Y, Du H, Qi J, Farrell R, Dokhale P A, Shah K S, Vaigneur K and Cherry S R 2011 TaperedLSO arrays for small animal PET Phys. Med. Biol. 56 139–53