Spectroscopic Assessment of Platinum Group Elements of ...
13
International Journal of Environmental Research and Public Health Article Spectroscopic Assessment of Platinum Group Elements of PM 10 Particles Sampled in Three Different Areas in Jeddah, Saudi Arabia Mohammad W. Kadi 1, *, Iqbal Ismail 1,2 , Nadeem Ali 2 and Abdallah A. Shaltout 3,4 1 Department of Chemistry, Faculty of Science, King Abdulaziz University, P.O. Box 80203, Jeddah 21589, Saudi Arabia; [email protected] 2 Center of Excellence in Environmental Studies, King Abdulaziz University, Jeddah 21589, Saudi Arabia; [email protected] 3 Spectroscopy Department, Physics Division, National Research Centre, Cairo, El Behooth St., 12622 Dokki, Egypt; [email protected] 4 Physics Department, Faculty of Science, Taif University, P.O. Box 888, Taif 21974, Saudi Arabia * Correspondence: [email protected] Received: 14 April 2020; Accepted: 9 May 2020; Published: 11 May 2020 Abstract: Platinum group elements (PGE) including Ru, Rh, Pt and Pd have been quantified in air particulate matter with an aerodynamic diameter equal or less than 10 microns (PM 10 ) using inductively coupled plasma mass spectrometry (ICP-MS). PM 10 aerosols have been collected from three sites representing various activities in Jeddah city, Saudi Arabia. These locations are residential site with heavy traffic, industrial site and heavy traffic and a light traffic site outside the city. To obtain reasonable data of the PGE concentrations, a group from 10 to 15 PM 10 samples were collected every month. The annual and seasonal variation of the mass concentration of the PGE were demonstrated. In all locations, Pt and Pd were relatively higher than Ru and Rh possibly because their main use is in automobile catalytic converters. Concentrations of observed PGE in PM 10 could be arranged in ascending order as: Rh < Ru < Pd < Pt. In case of Ru and Pt, there are clear similarities in terms of the overall mean concentrations at the sampling locations. Due to the high concentration of Ru, Rh and Pd at low traffic site, there are certainly other sources of these elements rather than vehicle catalytic converters. However, at the industrial/heavy traffic location, high concentrations of Ru were detected during February 2015. In addition, high Pt concentrations were also detected at the light traffic site during May 2015. Results indicate that Pt source in PM 10 is mainly the automobile catalytic converters. Keywords: ICP-MS; PM 10 aerosols; platinum group elements (PGE); Jeddah 1. Introduction In the last decades, notable increase in the production of the platinum group elements, including platinum (Pt), palladium (Pd), rhodium (Rh) and ruthenium (Ru), has been recognized. Although platinum group elements (PGE) have low natural abundance in the continental crust, they have a wide range of applications in electrical, chemical, pesticide, dyestuff production, polymer processing, pharmaceuticals (anticancer drugs, hydration and dehydration reactions), dental implants, and industrial applications including petroleum industries [1]. In the years of 1975 and 1986, the PGE were introduced as automobile exhaust catalysts in North America and Europe, respectively [1]. The objective was to convert noxious gases produced by the vehicles’ exhaust, such as nitrous oxide, carbon monoxide, and various hydrocarbons emissions into amiable forms. Afterwards, the use of PGE as automobile exhaust catalysts was widespread all over the world. Prior to the application of Int. J. Environ. Res. Public Health 2020, 17, 3339; doi:10.3390/ijerph17093339 www.mdpi.com/journal/ijerph
-
Upload
khangminh22 -
Category
Documents
-
view
2 -
download
0
Transcript of Spectroscopic Assessment of Platinum Group Elements of ...

International Journal of
Environmental Research
and Public Health
Article
Spectroscopic Assessment of Platinum GroupElements of PM10 Particles Sampled in ThreeDifferent Areas in Jeddah, Saudi Arabia
Mohammad W. Kadi 1,*, Iqbal Ismail 1,2, Nadeem Ali 2 and Abdallah A. Shaltout 3,4
1 Department of Chemistry, Faculty of Science, King Abdulaziz University, P.O. Box 80203,Jeddah 21589, Saudi Arabia; [email protected]
2 Center of Excellence in Environmental Studies, King Abdulaziz University, Jeddah 21589, Saudi Arabia;[email protected]
3 Spectroscopy Department, Physics Division, National Research Centre, Cairo, El Behooth St.,12622 Dokki, Egypt; [email protected]
4 Physics Department, Faculty of Science, Taif University, P.O. Box 888, Taif 21974, Saudi Arabia* Correspondence: [email protected]
Received: 14 April 2020; Accepted: 9 May 2020; Published: 11 May 2020
Abstract: Platinum group elements (PGE) including Ru, Rh, Pt and Pd have been quantified inair particulate matter with an aerodynamic diameter equal or less than 10 microns (PM10) usinginductively coupled plasma mass spectrometry (ICP-MS). PM10 aerosols have been collected fromthree sites representing various activities in Jeddah city, Saudi Arabia. These locations are residentialsite with heavy traffic, industrial site and heavy traffic and a light traffic site outside the city. To obtainreasonable data of the PGE concentrations, a group from 10 to 15 PM10 samples were collected everymonth. The annual and seasonal variation of the mass concentration of the PGE were demonstrated.In all locations, Pt and Pd were relatively higher than Ru and Rh possibly because their main useis in automobile catalytic converters. Concentrations of observed PGE in PM10 could be arrangedin ascending order as: Rh < Ru < Pd < Pt. In case of Ru and Pt, there are clear similarities in termsof the overall mean concentrations at the sampling locations. Due to the high concentration of Ru,Rh and Pd at low traffic site, there are certainly other sources of these elements rather than vehiclecatalytic converters. However, at the industrial/heavy traffic location, high concentrations of Ruwere detected during February 2015. In addition, high Pt concentrations were also detected at thelight traffic site during May 2015. Results indicate that Pt source in PM10 is mainly the automobilecatalytic converters.
Keywords: ICP-MS; PM10 aerosols; platinum group elements (PGE); Jeddah
1. Introduction
In the last decades, notable increase in the production of the platinum group elements, includingplatinum (Pt), palladium (Pd), rhodium (Rh) and ruthenium (Ru), has been recognized. Althoughplatinum group elements (PGE) have low natural abundance in the continental crust, they have awide range of applications in electrical, chemical, pesticide, dyestuff production, polymer processing,pharmaceuticals (anticancer drugs, hydration and dehydration reactions), dental implants, andindustrial applications including petroleum industries [1]. In the years of 1975 and 1986, the PGEwere introduced as automobile exhaust catalysts in North America and Europe, respectively [1].The objective was to convert noxious gases produced by the vehicles’ exhaust, such as nitrous oxide,carbon monoxide, and various hydrocarbons emissions into amiable forms. Afterwards, the use ofPGE as automobile exhaust catalysts was widespread all over the world. Prior to the application of
Int. J. Environ. Res. Public Health 2020, 17, 3339; doi:10.3390/ijerph17093339 www.mdpi.com/journal/ijerph

Int. J. Environ. Res. Public Health 2020, 17, 3339 2 of 13
vehicle exhaust catalysts, the concentrations of the PGE were less than 1 pg m−3 or almost not found inthe ambient air. Nowadays, the industrial application of automobile catalytic converters consumes agreat portion of the PGE production [2,3]. For noxious gas reduction, Pt and Pd were mainly usedalong with Rh at various ratios. As the PGE are extensively used to decrease noxious gases in air, theirconcentrations in ambient air are rising over time with a dependence on several parameters such as;type of engine, type of catalyst, traffic density and speed of the driving [4,5]. Although air qualityimproves as a result of the introduction of PGE as catalytic converters, a remarkable increase in theconcentration of these metals in the atmosphere was detected [6–11]. Therefore, the increase of PGE inthe atmosphere may cause further environmental contamination especially at specific locations such asgarages, tunnels and high traffic-density areas.
Due to the low concentrations of the PGE in ambient particulate matter, there is limited informationabout their toxicity, environmental bioavailability and influence on human health [12,13]. In thepresence of chloride, halogenated PGE complexes might be produced, which have damaging influenceon lung cells. Using Te and Hg co-precipitation methods, the concentration of the PGE (Pt, Pd, and Rh)has been determined in fractionated airborne dust, PM10, PM2.5 and PM1 collected from rural andurban areas in Germany [9]. In all size fractions, the concentration of the PGE increased over time, andremarkable high concentration of Pd was found compared to Pt and Rh. The highest concentrationof PGE was found in PM10, and its concentration decreased as the size of the fractionated airborneparticles decreased [9,14]. An increase in the concentration of PGE levels in urine as a function ofexposure by bus drivers and traffic police officers has been demonstrated [15,16]. The determination ofPGE concentration in PM10 collected from different cities around the world has been presented in theliterature [1,6–11,17–21]. Although PGE are not soluble in water, their toxicity and chemical formsdepend on their solubility in the biological media [1,3,22].
Several studies have presented concentrations of PGE in airborne particulate matters collected fromdifferent locations in Europe, Latin America, United States, Canada and China [5–7,9,10,17,21,23–25].However, information about concentration levels of PGE in airborne particulate matters collected fromSaudi Arabia is not available. Therefore, the present work represents the first attempt to determinethe PGE in PM10 samples collected from three different locations in Jeddah city, Saudi Arabia. PM10
aerosols were collected during the period from June 2014 to May 2015 covering the four seasons of theyear. The three sampling locations have different activities in terms of traffic intensity, populations andindustrial activities. Gathering information about the concentration and the spatial distribution of thePGE during the working day, weekend and the overall annual mean in PM10 samples is the aim of thepresent work. Besides, seasonal variations of PGE were demonstrated.
2. Materials and Methods
2.1. Reagents and Materials
Deionized water with a resistance of 18.2 MΩ cm was obtained from a Milli-Q system (Millipore,Billerica, MA USA) and used throughout. Multi element standard solutions of Au, Hf, Ir, Pd, Rt, Rh,Ru, Sb, Sn and Te were used and prepared freshly by proper dilution from 10 mg L−1 stock standardsolution (Perkin Elmer, Waltham, MA, Germany). Nitric acid (69%, Merck, Darmstadt, Germany)and hydrochloric acid (37%, Merck, Darmstadt, Germany) were used for PM10 digestion. A certifiedreference material (CRM) of atmospheric particulate matter (NIST 1648a, National Institute of Standardand Technology, Gaithersburg, ML, USA) was used to confirm the accuracy of the present analyticalprocedure. The CRM was digested with the same digestion procedure of PM10 samples.
2.2. Sampling Collection
Three sequential air samplers (Partisol Plus 2025-D, Thermo Fisher Scientific, Waltham, MA, USA)were used to simultaneously collect PM10 samples from three different locations at a height of ~10 mabove the ground and far away from the direct influence of the traffic density. Quartz microfiber

Int. J. Environ. Res. Public Health 2020, 17, 3339 3 of 13
filters with a diameter of 47 mm were used for PM10 collection. Filters were weighed before andafter sampling to determine the mass concentrations of the PM10 samples. The filters were weighedusing a micro-balance (Model XPE206DR, Mettler Toledo, Muntinlupa, Philippines). The air samplercan hold up to 16 filter sets and can be programmed to automatically change the filters accordingto a pre-set sampling periods. Samples were collected for twelve-month period starting June 2014through May 2015 covering the different four seasons. Each sample was collected every other dayfor 24 h at flow rate of 15 L min−1 with the following environmental parameters recorded for eachsample: sampling time, atmospheric temperature, atmospheric pressure, sampling flow rate, samplingvolume, wind speed and relative humidity. Therefore, the number of collected samples was about 180samples/location and a grand total of PM10 samples was 545 samples.
PM10 samples were collected from three different locations in Jeddah city, Saudi Arabia, whichhave different environmental conditions in terms of traffic density, human activities and population.The first location was the main campus of King Abdulaziz University (S1) with a latitude of 21.49and longitude of 39.23. It is characterized as a residential/heavy traffic location, whereas the locationrepresents a populous region near to the major highway. Besides, the location has a heavy traffic notonly on the nearby highway, but also around the campus of the university. More than 70,000 facultymembers and students are usually using their private vehicles as means of transportation. The secondlocation is located at the southeast of the city at the old Makkah road (S2) and has a latitude of 21.45 andlongitude of 39.29. It has heavy duty traffic with heavy trucking dominated. In addition, the secondlocation has many industrial activities such as different types of workshops, ceramic tiles fabrication,construction materials and many other light industries. The last location is called Durrat Alarous (S3),which is a beach resort, and it has a latitude of 21.9 and longitude of 39.02. The location is on the redsea shore and it is characterized with low traffic and sparse population. The positions of the threesampling locations in Jeddah is illustrated in Figure 1.
Int. J. Environ. Res. Public Health 2020, 17, x 3 of 13
weighed using a micro-balance (Model XPE206DR, Mettler Toledo, Muntinlupa, Philippines). The air sampler can hold up to 16 filter sets and can be programmed to automatically change the filters according to a pre-set sampling periods. Samples were collected for twelve-month period starting June 2014 through May 2015 covering the different four seasons. Each sample was collected every other day for 24 h at flow rate of 15 L min−1 with the following environmental parameters recorded for each sample: sampling time, atmospheric temperature, atmospheric pressure, sampling flow rate, sampling volume, wind speed and relative humidity. Therefore, the number of collected samples was about 180 samples/location and a grand total of PM10 samples was 545 samples.
PM10 samples were collected from three different locations in Jeddah city, Saudi Arabia, which have different environmental conditions in terms of traffic density, human activities and population. The first location was the main campus of King Abdulaziz University (S1) with a latitude of 21.49 and longitude of 39.23. It is characterized as a residential/heavy traffic location, whereas the location represents a populous region near to the major highway. Besides, the location has a heavy traffic not only on the nearby highway, but also around the campus of the university. More than 70,000 faculty members and students are usually using their private vehicles as means of transportation. The second location is located at the southeast of the city at the old Makkah road (S2) and has a latitude of 21.45 and longitude of 39.29. It has heavy duty traffic with heavy trucking dominated. In addition, the second location has many industrial activities such as different types of workshops, ceramic tiles fabrication, construction materials and many other light industries. The last location is called Durrat Alarous (S3), which is a beach resort, and it has a latitude of 21.9 and longitude of 39.02. The location is on the red sea shore and it is characterized with low traffic and sparse population. The positions of the three sampling locations in Jeddah is illustrated in Figure 1.
Figure 1. Air particulate matter with an aerodynamic diameter equal or less than 10 microns (PM10) sampling locations in Jeddah city, Saudi Arabia.
2.3. Digestion of the PM10 samples
Collected PM10 samples on the quartz microfiber filters were digested completely using a microwave digestion system (TOP wave Analytik Jena AG, Jena, Germany). Aqua regia (12 mL; 3 mL of 69% HNO3 and 9 mL of 37% HCl) was used for digestion. The digested PM10 samples were diluted to a final volume of 25 mL with deionized water.
2.4. Inductively Coupled Plasma Mass Spectrometry (ICP-MS)
Figure 1. Air particulate matter with an aerodynamic diameter equal or less than 10 microns (PM10)sampling locations in Jeddah city, Saudi Arabia.
2.3. Digestion of the PM10 Samples
Collected PM10 samples on the quartz microfiber filters were digested completely using amicrowave digestion system (TOP wave Analytik Jena AG, Jena, Germany). Aqua regia (12 mL; 3 mLof 69% HNO3 and 9 mL of 37% HCl) was used for digestion. The digested PM10 samples were dilutedto a final volume of 25 mL with deionized water.

Int. J. Environ. Res. Public Health 2020, 17, 3339 4 of 13
2.4. Inductively Coupled Plasma Mass Spectrometry (ICP-MS)
An inductively coupled plasma mass spectrometer ELAN 6000 (NexION 300D, Perkin Elmer,Waltham, MA, USA) was used for the quantitative analysis of the PGE in the PM10 particulates. Pureargon gas was used as a plasma gas and for nebulization at flow rate of 0.65 L min−1. A microconcentricnebulizer (MCN−100, CETAC Technologies, Omaha, USA) coupled with a cyclonic spray chamberwas used. For the sample flow control, a peristaltic pump (Ismatec, Glattbrugg, Switzerland) was used.Before using the microconcentric nebulizer, performance checks for sensitivity of oxide and doublycharged ions formation, using a conventional cross flow nebulizer and a Scott spray chamber wascarried out. The digested PM10 aerosols were injected into the nebulizer with a flow rate of 30 µL min−1.The radio frequency (RF) power was 1600 W. The lens voltage, analog stage voltage and the pulsestage voltage were 9.55 V, −1745 V, and 950 V, respectively. The instrument conditions were auto lensmode on, peak hopping measure mode, dwell time of 40 ms, 40 sweeps/reading, reading/replicate,3 replicates, and 1200 ms integration time. Platinum sampler and skimmer cones were used.
2.5. Quality Assurance of the Analytical Method
Quality assurance was checked through the analysis of a CRM. Recoveries were in agreementwith the certified values which indicate good analytical values of the observed concentrations. Table 1illustrates the measured and certified concentrations of the CRM 1648a, which is composed ofatmospheric particulate matter. Unfortunately, there is no certified values for the PGEs.
Table 1. Certified and measured concentration of the detected elements in the certified referencematerial (SRM 1678a).
Element Certified Values Measured Values Unit
As 115.5 ± 3.9 111.55 ± 6.3 µg/gCd 73.7 ± 2.3 70.76 ± 4.5 µg/gCe 54.6 ± 2.2 22.68 ± 3.4 µg/gCo 17.93 ± 0.68 14.50 ± 1.1 µg/gCr 402 ± 13 387.97 ± 33 µg/gCu 610 ± 70 763 ± 54 µg/gFe 3.92 ± 0.21 3.5 ± 0.11 %Mg 0.813 ± 0.012 0.74 ± 0.021 %Mn 790 ± 44 703.74 ± 56 µg/gNi 81.1 ± 6.8 88.1 ± 7.6 µg/gPb 0.655 ± 0.033 0.63 ± 0.041 %Sb 45.4 ± 1.4 41 ± 2.7 µg/gV 127 ± 11 86 ± 17 µg/g
Zn 4800 ± 270 4790 ± 321 µg/g
3. Results and Discussion
3.1. Quantitative Elemental Analysis of Platinum Group Elements
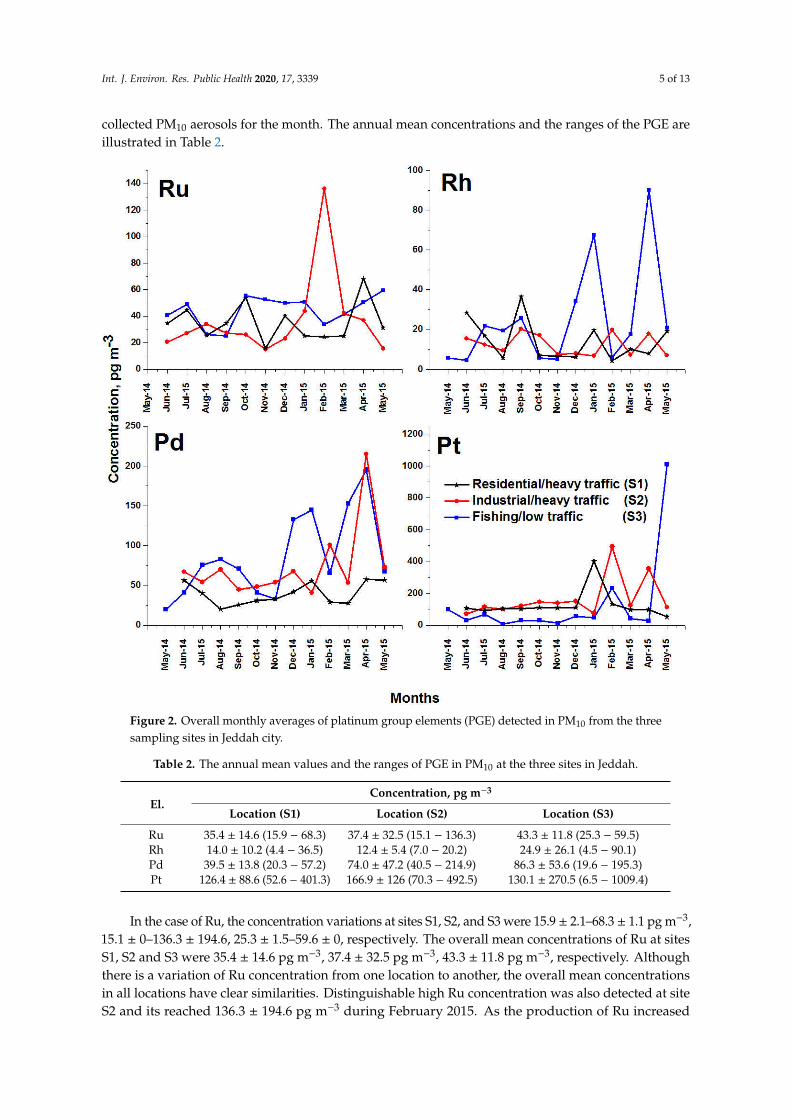
Standard calibration curves starting from 0 to 7000 ng/L were prepared and used for the ICP-MS.An excellent linearity of the calibration curves was obtained with regression coefficients range from0.998 to 0.999. Although there are six PGE (Ru, Rh, Pd, Pt, Os and Ir), the concentrations of Os and Irare not detectable in the ambient air particulates using the ICP-MS. In addition, Os and Ir were neverreported in the air particulates. The quantitative analysis results were calculated in pg/m3. For thecurrent three locations, the monthly averages of the detected concentration of the PGE in PM10 aerosolsis illustrated in Figure 2. During each month, approximately fifteen PM10 samples were collected.The concentrations of the PGE in some PM10 aerosols were undetectable as they fall below the limitsof detection. Therefore, the monthly averages represent the mean values of the detected PGE in the
Int. J. Environ. Res. Public Health 2020, 17, 3339 5 of 13
collected PM10 aerosols for the month. The annual mean concentrations and the ranges of the PGE areillustrated in Table 2.
Int. J. Environ. Res. Public Health 2020, 17, x 5 of 13
Figure 2. Overall monthly averages of platinum group elements (PGE) detected in PM10 from the three sampling sites in Jeddah city.
In the case of Ru, the concentration variations at sites S1, S2, and S3 were 15.9 ± 2.1–68.3 ± 1.1 pg m−3, 15.1 ± 0–136.3 ± 194.6, 25.3 ± 1.5–59.6 ± 0, respectively. The overall mean concentrations of Ru at sites S1, S2 and S3 were 35.4 ± 14.6 pg m−3, 37.4 ± 32.5 pg m−3, 43.3 ± 11.8 pg m−3, respectively. Although there is a variation of Ru concentration from one location to another, the overall mean concentrations in all locations have clear similarities. Distinguishable high Ru concentration was also detected at site S2 and its reached 136.3 ± 194.6 pg m−3 during February 2015. As the production of Ru increased recently [26], additional applications of Ru were also found, e.g., as wear resistant electrical contacts, thick film resistors, and ultraviolet photomasks. In addition, it is used in mixed metal oxide anodes that are used for cathodic protection of underground and submerged structures. The industrial wide range of Ru applications could be the main source in the atmosphere.
Concentrations of Rh in PM10 sample are always lower than Ru. The monthly average concentrations of Rh at sites S1, S2 and S3 were 14.0 ± 10.2 pg m−3, 12.4 ± 5.4 pg m−3, and 24.9 ± 26.1 pg m−3, respectively. At S1 and S2 sites which are recognized as heavy traffic/residential and heavy traffic/industrial, the variations of Rh were 4.4–36.5 pg m−3 and 7.6–20.2 pg m−3, respectively; small variations were observed at S1 and S2 locations, and the Rh concentrations were always less than the 40 pg m−3 detected during September 2014 at the S1 location. At S3 location, which is recognized as a light traffic, Rh concentrations have remarkable variation, ranging from 5.0 to 90.1 pg m−3. The largest variation of Rh concentration was due to the high concentration of Rh during individual days of
Figure 2. Overall monthly averages of platinum group elements (PGE) detected in PM10 from the threesampling sites in Jeddah city.
Table 2. The annual mean values and the ranges of PGE in PM10 at the three sites in Jeddah.
El.Concentration, pg m−3
Location (S1) Location (S2) Location (S3)
Ru 35.4 ± 14.6 (15.9 − 68.3) 37.4 ± 32.5 (15.1 − 136.3) 43.3 ± 11.8 (25.3 − 59.5)Rh 14.0 ± 10.2 (4.4 − 36.5) 12.4 ± 5.4 (7.0 − 20.2) 24.9 ± 26.1 (4.5 − 90.1)Pd 39.5 ± 13.8 (20.3 − 57.2) 74.0 ± 47.2 (40.5 − 214.9) 86.3 ± 53.6 (19.6 − 195.3)Pt 126.4 ± 88.6 (52.6 − 401.3) 166.9 ± 126 (70.3 − 492.5) 130.1 ± 270.5 (6.5 − 1009.4)
In the case of Ru, the concentration variations at sites S1, S2, and S3 were 15.9 ± 2.1–68.3 ± 1.1 pg m−3,15.1 ± 0–136.3 ± 194.6, 25.3 ± 1.5–59.6 ± 0, respectively. The overall mean concentrations of Ru at sitesS1, S2 and S3 were 35.4 ± 14.6 pg m−3, 37.4 ± 32.5 pg m−3, 43.3 ± 11.8 pg m−3, respectively. Althoughthere is a variation of Ru concentration from one location to another, the overall mean concentrationsin all locations have clear similarities. Distinguishable high Ru concentration was also detected at siteS2 and its reached 136.3 ± 194.6 pg m−3 during February 2015. As the production of Ru increased

Int. J. Environ. Res. Public Health 2020, 17, 3339 6 of 13
recently [26], additional applications of Ru were also found, e.g., as wear resistant electrical contacts,thick film resistors, and ultraviolet photomasks. In addition, it is used in mixed metal oxide anodesthat are used for cathodic protection of underground and submerged structures. The industrial widerange of Ru applications could be the main source in the atmosphere.
Concentrations of Rh in PM10 sample are always lower than Ru. The monthly averageconcentrations of Rh at sites S1, S2 and S3 were 14.0 ± 10.2 pg m−3, 12.4 ± 5.4 pg m−3, and24.9 ± 26.1 pg m−3, respectively. At S1 and S2 sites which are recognized as heavy traffic/residentialand heavy traffic/industrial, the variations of Rh were 4.4–36.5 pg m−3 and 7.6–20.2 pg m−3, respectively;small variations were observed at S1 and S2 locations, and the Rh concentrations were always less thanthe 40 pg m−3 detected during September 2014 at the S1 location. At S3 location, which is recognized asa light traffic, Rh concentrations have remarkable variation, ranging from 5.0 to 90.1 pg m−3. The largestvariation of Rh concentration was due to the high concentration of Rh during individual days ofJanuary and April 2015, which reached to 430.1 pg m−3. It is clear that, location S3 has the highestconcentration of Rh, which is approximately twice the detected values in S1 and S2 locations. The highvalue of standard deviation at S3 locations (~26 pg m−3) indicates the instability of the atmosphericaerosol near to the red sea coast. Although S3 location is recognized as a low traffic site, the highconcentration of Rh originates from the automobile catalytic converters due to the high atmosphericdispersion during January and April 2015. As it is well known, approximately 80% of the produced Rhis used as catalysts. Additional sources of Rh could be the fiber glass and flat-panel glass industry, aswell as the high temperature and corrosion resistive materials [27].
Looking to Pd, its concentrations in PM10 aerosols collected from different sites is relativelyhigher than Ru and Rh but lower than Pt. The overall monthly average concentrations of Pd were39.5 ± 13.8 pg m−3, 86.3 ± 53.6 pg m−3 and 73.9 ± 47.2 pg m−3, at sites S1, S2 and S3, respectively.Although the S3 location was considered as low traffic, its Pd concentration during April representsthe highest values comparing with other locations. Besides, the variations of Pd concentration atS3 site ranges from 19.6 ± 24.9 to 195.3 ± 200.4 pg m−3. At locations S1 and S2, the variations ofPd concentrations were 20.3 ± 16.4 to 57.2 ± 42.7 pg m−3 and 40.5 ± 27.2 to 214.9 ± 589.7 pg m−3,respectively. Starting from December 2014 up to May 2015, there was an increase in Pd concentrationat sites S2 and S3 whereas the overall concentration of Pd at the university site (S1) had relativelyminor changes. The main sources of Pd in the atmosphere could be the heavy usage of Pd in vehiclecatalytic converters, jewelry, blood sugar test strips, dentistry, and electric contacts [28]. Of course thevehicle catalytic converters represent the main source of Pd, but the additional mentioned sources ofPd could participate in PM10 aerosols. This could be deuced from the relative higher concentrations ofthese elements at the low traffic site (S3).
Pt represents the main element in the PGE, and its concentration in all locations represents thehighest concentration comparing with other PGE. The monthly overall average concentrations of Ptwere 126.4 ± 88.6 pg m−3, 166.9 ± 126 and 130.1 ± 271 pg m−3, at locations S1, S2 and S3, respectively.As shown in Table 2, the overall averages of the detected concentrations of Pt in all sites are relativelyclose to each other, which is very interesting. This could be reasonable because Pt was the main elementused for automobile catalyst converters. Pt could be released during operation of the vehicle due to themechanical deterioration and abrasion. The emission of PGEs is depending on the operating conditionof the engine, the type of the catalysts, the type of the fuel additives and the vehicle speed. However,the variation of Pt concentrations in all sites was also recognized. At location S1, the Pt varies from52.6 ± 74.5 to 401.3 ± 1100 pg m−3, and its concentration during January 2015 was relatively high.At location S2, Pt varies from 70.3 ± 40.4 to 492.5 ± 1015 pg m−3, and the highest Pt concentration wasfound during February and April 2015. At location S3, Pt varies from 6.5 ± 0 to 1009.4 ± 126 6 pg m−3,and the highest Pt concentration was detected during May 2015. The variation of the concentration ofPt at the low traffic area (S3) is lower than in other areas of heavy traffic, even though the averagevalues are comparable, which confirms the source of the Pt is in air, Figure 2. In addition, the average

Int. J. Environ. Res. Public Health 2020, 17, 3339 7 of 13
concentration of Pt at heavy traffic/industrial area represents the highest value, which refers to anadditional source of the Pt in the atmosphere, which is the industrial activities.
3.2. Annual Mean Values of PGE
Based on the individual measurements during the period of study and regardless of the seasonalvariation as well as working days and weekends, the annual mean values for each element wascalculated and is presented in Table 2. As expected, the highest concentration of the PGE belongs to Ptfollowed by Pd and then Ru and finally Rh. The annual mean values of Ru and Rh are comparablein locations S1 and S2 whereas the highest annual mean value was measured at location S3. In thecase of Pd, the lowest concentration was found at the residential/ heavy traffic site (S1) whereasits concentration increases at the industrial/heavy traffic area (S2). The highest concentration of Pdwas found at the fishing /low traffic area (S3). In the case of Pt, the industrial/heavy traffic area(S2). The highest concentration of Pd was found at the industrial/heavy traffic area (S2) whereasPt concentration in the two other sites is comparable. The high contents of PGE at the location S2(industrial/heavy traffic) confirms the existence of other industrial sources rather than the automobilecatalytic converters.
3.3. Seasonal Variations of PGE
The seasonal variations of Ru, Rh, Pd and Pt during the four seasons of the sampling period areillustrated in Figure 3. The overall average of each season is presented. In the case of Rh, the averageconcentrations at the sites S1 and S2 have a recognized low variation, and these values fluctuatefrom 10 ± 8 to 17 ± 11 pg m−3, Figure 3. The remarkable stability of Ru concentrations at the twolocations (S1 and S2) during all four seasons confirms the association of the sources of Rh, which isthe vehicle catalytic convertors. The low contents of Rh could be an indication of its low contents inthe catalytic convertors. The case is different at the low traffic site (S3) whereas high concentrationsof Rh were found with high standard deviation values especially during winter and spring 2015.The maximum Rh concentration at location S3 was found during the spring 2015 (43 ± 141 pg/m3).The high concentration of Ru during the winter and spring 2015 at location S3 could be an indicationof the low dispersion in the atmosphere during these seasons as well as other anthropogenic sources.Besides, ship emissions may be an additional source because the location S3 is close to the internationalSea Port of Jeddah. In case of Ru, there is a clear stability of the concentrations at the three sites withfew exceptions. A slight increase of Ru during winter and spring 2015 at location S3 was recognized.Furthermore, a remarkable increase of Ru at location S2 during winter with remarkable high standarddeviation was also found. The use of Rh and Ru for catalytic converters is generally very limited, thiscould be the reason for the stability of Rh and Ru concentrations at all locations. Possible sourcesof the Rh and Ru in the atmosphere could be the natural resources in the surrounding desert andanthropogenic sources including catalytic converters, aircrafts, glass and polymer production [25].
Looking at the distribution of Pd concentrations, higher concentrations were observed duringwinter and spring at all sites with noticeable large standard deviations. The maximum seasonal valuewas found at location S3 during spring 2015, and it equals 138 ± 65 pg m−3. The lower seasonalvalues were found during the summer and autumn 2014. Similar seasonal behavior was also observedfor Pt whereas the highest Pt concentrations were found during the winter and spring seasons withhigh standard deviation. The highest concentration of Pt was found at location S3 and it equals360 ± 563 pg m−3. As the Pt and Pd are the main elements used for the automobile catalytic convertors,their concentrations in the ambient air particulates are always higher than Ru and Rh. Previous studiesreported that the concentration of various elements increased during winter due to the low dispersionof atmospheric aerosols, which causes the increase in the concentrations at locations that have hightraffic [29–33]. The same manner was found not only during the winter but also during the spring2015, Figure 3. The low variations of the PGE could be recognized in most of the three locations duringthe summer and autumn seasons whereas high variations were found during the winter and spring

Int. J. Environ. Res. Public Health 2020, 17, 3339 8 of 13
seasons. At the heavy traffic/residential area (S1), there are no remarkable seasonal changes in theconcentration of Ru, Rh and Pd, and the variations are in the range of the standard deviation values.The heavy traffic/industrial area (S2) has higher concentrations of Pt and Pd than the location S1 duringall seasons. On the other hand, the low traffic site (S3) had the highest concentrations of PGE duringspring 2015.
Int. J. Environ. Res. Public Health 2020, 17, x 8 of 13
3.3.Seasonal Variations of PGE
The seasonal variations of Ru, Rh, Pd and Pt during the four seasons of the sampling period are illustrated in Figure 3. The overall average of each season is presented. In the case of Rh, the average concentrations at the sites S1 and S2 have a recognized low variation, and these values fluctuate from 10±8 to 17 ± 11 pg m−3, Figure 3. The remarkable stability of Ru concentrations at the two locations (S1 and S2) during all four seasons confirms the association of the sources of Rh, which is the vehicle catalytic convertors. The low contents of Rh could be an indication of its low contents in the catalytic convertors. The case is different at the low traffic site (S3) whereas high concentrations of Rh were found with high standard deviation values especially during winter and spring 2015. The maximum Rh concentration at location S3 was found during the spring 2015 (43 ± 141 pg/m3). The high concentration of Ru during the winter and spring 2015 at location S3 could be an indication of the low dispersion in the atmosphere during these seasons as well as other anthropogenic sources. Besides, ship emissions may be an additional source because the location S3 is close to the international Sea Port of Jeddah. In case of Ru, there is a clear stability of the concentrations at the three sites with few exceptions. A slight increase of Ru during winter and spring 2015 at location S3 was recognized. Furthermore, a remarkable increase of Ru at location S2 during winter with remarkable high standard deviation was also found. The use of Rh and Ru for catalytic converters is generally very limited, this could be the reason for the stability of Rh and Ru concentrations at all locations. Possible sources of the Rh and Ru in the atmosphere could be the natural resources in the surrounding desert and anthropogenic sources including catalytic converters, aircrafts, glass and polymer production [25].
Figure 3. Seasonal variations of Ru, Rh, Pd and Pt in PM10 collected from three different sites in Jeddah city.
Looking at the distribution of Pd concentrations, higher concentrations were observed during winter and spring at all sites with noticeable large standard deviations. The maximum seasonal value
Figure 3. Seasonal variations of Ru, Rh, Pd and Pt in PM10 collected from three different sites inJeddah city.
3.4. Concentrations of PGE during Working Days and Weekends
To illustrate the variation of the PGE concentration during working days and weekends, Figure 4depicts the annual averages during the whole year for Ru, Rh, Pd, and Pt. The use of the annualmean values of the PGEs concentrations, as an indication of the variation during working days andweekends, gives an acceptable estimation of these elements in Jeddah’s atmosphere. Generally, thereis a clear indication of the increase of PGE concentrations during weekends with the exception ofRu concentration at location S2. During the weekends, concentrations of Pd increased at the heavytraffic areas (S1 and S2), and no changes of concentration were recognized at the low traffic area(S3). However, the industrial/heavy traffic location (S2) had higher concentrations of PGE than theresidential/heavy traffic location (S1) during the working days and weekends. Therefore, sources ofPGE at the industrial/heavy traffic area (S2) are not only automobile catalytic converters but also otherindustrial and anthropogenic sources. The high concentration of the PGE during the weekends atlocations S1, S2 and S3 could be an indication of the low dispersion in the atmosphere during theweekends. In addition, the noticeable increase of the number of vehicles and trips coming to Jeddahcity during the weekends might be an indication of the increase of the exhausts from the vehicles inthe atmosphere. Due to the potential use of PGE in automobile catalytic converters, there are risksto humans and the environment because the emission of PGE in the atmosphere is a combination

Int. J. Environ. Res. Public Health 2020, 17, 3339 9 of 13
between chemical and thermal aging, which is easily solubilized and mobilized in the atmosphere.In addition, the fine PGE emission uptake by the organism could result in conversion to toxic speciesassociated with increases of mortality [23].Int. J. Environ. Res. Public Health 2020, 17, x 10 of 13
Figure 4. Concentration variations of Ru, Rh, Pd and Pt during working days and weekends in PM10 collected from three different sites in Jeddah city.
3.5. Comparison with Published Data
Table 3 illustrates a comparison between the observed quantitative analysis results of the PGE and the published data for PM10 aerosols. The comparison was carried out for the available published data from the following cities; Göteborg, Sweden; Madrid, Spain; Rome, Italy; Frankfurt, Germany; Buenos Aires, Argentina; Vienna, Austria; Boston, USA; Mexico City, Mexico. Determination of Ru in PM10 aerosols was presented only in the PM10 samples of the present work, and it was not quantified in the PM10 aerosols all over the world earlier. The other PGE were compared with the different mentioned locations. In the case of Rh, the observed results in the three sites in Jeddah city show somewhat elevated values [7].
A similar case was also found for Pd where observed concentrations are higher than those reported in the literature (Rome, Italy) [7]. The case of Pt in the present work is relatively similar to Pd. The obtained average value of Pt (130.1 ± 271 pg m−3) is higher than the highest values found in the literature at Frankfort, Germany, which is equal 15.7 pg m−3 [14]. It is worthwhile to mention that averages observed here are from limited numbers of sample and not extensive sampling each day of the year. However, the obtained averages of the PGE could represent the annual mean values whereas the sampling was continued for a whole year from June 2014 to May 2015. Concentrations of PGE in Jeddah city are characterized by high concentrations compared with the published data. This could be due to several reasons. In Jeddah city, the inhabitants are basically using their private automobiles for transportation since public transport is very scarce. In addition, the high concentration of PGE in Jeddah’s atmosphere could indicate the absence of recycling of spent catalytic converters, which may result in erosion of their material due to environmental factors and hence escape to the atmosphere. This is of course in addition to their use in operating vehicles. Furthermore, the main reason for the presence of PGE could be its heavy use in the automobile catalytic converter
Figure 4. Concentration variations of Ru, Rh, Pd and Pt during working days and weekends in PM10
collected from three different sites in Jeddah city.
3.5. Comparison with Published Data
Table 3 illustrates a comparison between the observed quantitative analysis results of the PGE andthe published data for PM10 aerosols. The comparison was carried out for the available published datafrom the following cities; Göteborg, Sweden; Madrid, Spain; Rome, Italy; Frankfurt, Germany; BuenosAires, Argentina; Vienna, Austria; Boston, USA; Mexico City, Mexico. Determination of Ru in PM10
aerosols was presented only in the PM10 samples of the present work, and it was not quantified in thePM10 aerosols all over the world earlier. The other PGE were compared with the different mentionedlocations. In the case of Rh, the observed results in the three sites in Jeddah city show somewhatelevated values [7].

Int. J. Environ. Res. Public Health 2020, 17, 3339 10 of 13
Table 3. Concentration of the PGE in PM10 (pg m−3) collected from various cities.
Reference Location/Conditions City/Country Concentration, pg/m3
Ru Rh Pd Pt
Present work Low traffic/fishing(S3)
Jeddah, SaudiArabia
43.3 ± 11.8(25.3 − 59.5)
24.9 ± 26.1(4.5 − 90.1)
86.3 ± 53.6(19.6 − 195.3)
130.1 ± 270.5(6.5 − 1009.4)
Present workHeavy
traffic/industrial(S2)
Jeddah, SaudiArabia
37.4 ± 32.5(15.1 − 136.3)
12.4 ± 5.4(7.0 − 20.2)
74.0 ± 47.2(44.8 − 214.9)
74.0 ± 47.2(44.8 − 214.9)
Present workHeavy
traffic/residential(S1)
Jeddah, SaudiArabia
35.4 ± 14.6(15.9 − 68.3)
14.0 ± 10.2(4.4 − 36.5)
39.5 ± 13.8(20.3 − 57.2)
126.4 ± 88.6(52.6 − 401.3)
[8] 70,000 cars/day Göteborg, Sweden - 2.9 (1.3 − 4.3) 4.9(1.3 − 9.7) 14.1 (7.6 −19.2)
[8] <10,000 cars/day Göteborg, Sweden - 0.6 (0.3 − 1.2) 1.8(< 0.6 − 4.4) 2.1 (0.9 − 3.0)
[6] Five sites 3.3(< 0.2 − 12.2)
12.8(< 0.1 − 57.1)
[7] Downtown Madrid, Spain 2.8 7.3[7] Ring-road Madrid, Spain 4.6 17.7[7] Downtown Göteborg, Sweden 2.7 4.6 13.1[7] Ring-road Göteborg, Sweden 0.8 1.6 4.1[7] Downtown Rome, Italy - 2.2 42.7 8.6[7] Ring-road Rome, Italy 3.0 54.9 8.1
[14] Major street(32550 cars/day)
Frankfurt,Germany 2.9 (1.8 − 4.5) 25.1
(9.4 − 29.3)15.7
(8.7 − 28.4)
[14] Side Street ( <1000 cars/day)
Frankfurt,Germany 0.7 (0.7–1.1) 8.9 (5.1–15.6) 6.2 (4.1–9.5)
[14] nonurban Frankfurt,Germany 0.8 (0.3–1.5) 7.8 (4.7–11.7) 5.2 (3.0–7.9)
[2] Seven inner citysites
Buenos Aires,Argentina
3.9(0.3 − 16.8)
12.9(2.3 − 47.7)
[20] Downtown Vienna, Austria 0.4 ± 0.1 2.6 ± 0.6 4.3 ± 1.7
[19] Site 1 (20000cars/day) Boston, USA 2.2 (0.5–5.9) 11.0 (1.0–26) 9.4 (0.6–17)
[19] Site 2 (10000cars/day) Boston, USA 1.3 (0.3–5.9) 7.1 (0.8–39) 6.2 (0.6–36)
[18] Five sites Mexico City,Mexico 3.2 ± 2.2 11 ± 4 9.3 ± 1.9
A similar case was also found for Pd where observed concentrations are higher than thosereported in the literature (Rome, Italy) [7]. The case of Pt in the present work is relatively similar to Pd.The obtained average value of Pt (130.1 ± 271 pg m−3) is higher than the highest values found in theliterature at Frankfort, Germany, which is equal 15.7 pg m−3 [14]. It is worthwhile to mention thataverages observed here are from limited numbers of sample and not extensive sampling each day ofthe year. However, the obtained averages of the PGE could represent the annual mean values whereasthe sampling was continued for a whole year from June 2014 to May 2015. Concentrations of PGE inJeddah city are characterized by high concentrations compared with the published data. This could bedue to several reasons. In Jeddah city, the inhabitants are basically using their private automobilesfor transportation since public transport is very scarce. In addition, the high concentration of PGE inJeddah’s atmosphere could indicate the absence of recycling of spent catalytic converters, which mayresult in erosion of their material due to environmental factors and hence escape to the atmosphere.This is of course in addition to their use in operating vehicles. Furthermore, the main reason for thepresence of PGE could be its heavy use in the automobile catalytic converter and the dental PGEalloys, given that at Jeddah city, the basic mean of transportation is private vehicles and trucking.It was mentioned that the number of vehicles in Jeddah city reached 1.5 Million [32]. In addition, PGEand its compositions are usually used as a chemical modifier in graphite furnace atomic absorptionspectrometry [33–38], which may increase the concentration of PGE in the ambient air.

Int. J. Environ. Res. Public Health 2020, 17, 3339 11 of 13
4. Conclusions
This work presents the first quantitative elemental analysis of PGE in the PM10 aerosols collectedfrom three different sites that have low and heavy density of traffic in Jeddah, Saudi Arabia. For thefirst time, Ru quantification in the present PM10 aerosols was determined whereas it was not quantifiedbefore in the PM10 aerosols all over the world. The observed levels of PGEs in Jeddah show higherconcentrations than reported values possibly because the shear high numbers of operating vehiclesand the lack of recycling of spent catalytic converters in the city. Higher concentrations at a site withlow traffic density could indicate that catalytic converters are not the only source of these elements.In case of Pt, the average concentrations in all locations are more or less similar, which confirmsthe same origins in the catalytic converters. The noticeable increase of the PGE concentrations atthe industrial/heavy traffic locations confirms the contribution of the industrial activities beside thecatalytic converter source.
Author Contributions: Conceptualization, M.W.K. and I.I.; methodology, M.W.K. and N.A.; validation, M.W.K.,A.A.S.; formal analysis, M.W.K. and A.A.S.; investigation, M.W.K., I.I., N.A.; resources, M.W.K. and I.I.; datacuration, M.W.K., N.A., A.A.S.; writing—original draft preparation, M.W.K. and A.A.S.; writing—review andediting, M.W.K. and A.A.S.; visualization, M.W.K. and A.A.S.; supervision, M.W.K.; project administration, M.W.K.and I.I.; funding acquisition, M.W.K. All authors have read and agreed to the published version of the manuscript.
Funding: This project was funded by the National Plan for Science, Technology and Innovation (MAARIFAH)–KingAbdulaziz City for Science and Technology, Kingdom of Saudi Arabia; award number (12-ENV2249-03). The authorsalso acknowledge with thanks the Science and Technology Unit, King Abdulaziz University for technical support.
Conflicts of Interest: The authors declare no conflict of interest.
References
1. Wiseman, C.L.S.; Zereini, F. Airborne particulate matter, platinum group elements and human health:A review of recent evidence. Sci. Total Environ. 2009, 407, 2493–2500. [CrossRef] [PubMed]
2. Puls, C.; Limbeck, A.; Hann, S. Bioaccessibility of palladium and platinum in urban aerosol particulates.Atmos. Environ. 2012, 55, 213–219. [CrossRef]
3. Bencs, L.; Ravindra, K.; van Grieken, R. Platinum: Environmental Pollution and Health Effects. In Encyclopediaof Environmental Health; Nriagu, J.O., Ed.; Elsevier: Burlington, NJ, USA, 2011; pp. 580–595.
4. Artelt, S.; Kock, H.; König, H.P.; Levsen, K.; Rosner, G. Engine dynamometer experiments: Platinum emissionsfrom differently aged three-way catalytic converters. Atmos. Environ. 1999, 33, 3559–3567. [CrossRef]
5. Pan, S.; Zhang, G.; Sun, Y.; Chakraborty, P. Accumulating characteristics of platinum group elements (PGE)in urban environment. China Sci. Total Environ. 2009, 407, 4248–4252. [CrossRef]
6. Gomez, B.; Gomez, M.; Sanchez, J.L.; Fernandez, R.; Palacios, M.A. Platinum and rhodium distribution inairborne particulate matter and road dust. Sci. Total Environ. 2001, 269, 131–144. [CrossRef]
7. Gomez, B.; Palacios, M.A.; Gomez, M.; Sanchez, J.L.; Morrison, G.; Rauch, S.; McLeod, C.; Ma, R.; Caroli, S.;Alimonti, A. Levels and risk assessment for humans and ecosystems of platinum-group elements in theairborne particles and road dust of some European cities. Sci. Total Environ. 2002, 299, 1–19. [CrossRef]
8. Rauch, S.; Lu, M.; Morrison, G.M. Heterogeneity of platinum group metals in airborne particles.Environ. Sci. Technol. 2001, 35, 595–599. [CrossRef]
9. Zereini, F.; Alsenz, H.; Wiseman, C.L.S.; Püttmann, W.; Reimer, E.; Schleyer, R.; Bieber, E.; Wallasch, M.Platinum group elements (Pt, Pd, Rh) in airborne particulate matter in rural vs. urban areas of Germany:Concentrations and spatial patterns of distribution. Sci. Total Environ. 2012, 416, 261–268. [CrossRef]
10. Zereini, F.; Alt, F.; Messerschmidt, J.; Wiseman, C.; Feldmann, I.; von Bohlen, A. Concentration and particlesize distribution of heavy metals in urban airborne particulate matter in Frankfurt am Main, Germany.Environ. Sci. Technol. 2005, 39, 2983–2989. [CrossRef]
11. Zereini, F.; Wiseman, C.; Alt, F.; Messerschmidt, J.; Müller, J.; Urban, H. Platinum and rhodium concentrationsin airborne particulate matter in Germany from 1988 to 1998. Environ. Sci. Technol. 2001, 35, 1996–2000.[CrossRef]

Int. J. Environ. Res. Public Health 2020, 17, 3339 12 of 13
12. Schmid, M.; Zimmermann, S.; Krug, H.F.; Sures, B. Influence of platinum, palladium and rhodium ascompared with cadmium, nickel and chromium on cell viability and oxidative stress in human bronchialepithelial cells. Environ. Intern. 2007, 33, 385–390. [CrossRef] [PubMed]
13. Dillner, A.N.; Shafer, M.M.; Schauer, J.J. A novel method using polyurethane foam (PUF) substrates todetermine trace element concentrations in size-segregated atmospheric particulate matter on short timescales. Aerosol. Sci. Tech. 2007, 41, 75–85. [CrossRef]
14. Zereini, F.; Alt, F.; Messerschmidt, J.; von Bohlen, A.; Liebl, K.; Püttmann, W. Concentration and Distributionof Platinum Group Elements (Pt, Pd, Rh) in Airborne Particulate Matter in Frankfurt am Main, Germany.Environ. Sci. Technol. 2004, 38, 1686–1692. [CrossRef] [PubMed]
15. Iavicoli, I.; Bocca, B.; Caroli, S.; Caimi, S.; Alimonti, A.; Carelli, G.; Fontana, L. Exposure of Rome citytram drivers to airborne platinum, rhodium, and palladium. J. Occup. Environ. Med. 2008, 50, 1158–1166.[CrossRef]
16. Iavicoli, I.; Bocca, B.; Carelli, G.; Caroli, S.; Caimi, S.; Alimonti, A.; Fontana, L. Biomonitoring of tramdriversexposed to airborne platinum, rhodium and palladium. Int. Arch. Occup. Environ. Health 2007, 81, 109–114.[CrossRef]
17. Wiseman, C.L.S.; Pour, Z.H.; Zereini, F. Platinum group element and cerium concentrations in roadsideenvironments in Toronto, Canada. Chemosphere 2016, 145, 61–67. [CrossRef]
18. Rauch, S.; Peucker-Ehrenbrink, B.; Molina, L.T.; Molina, M.J.; Ramos, R.; Hemond, H. Platinum groupelements in airborne particles in Mexico City. Environ. Sci. Technol. 2006, 40, 7554–7560. [CrossRef]
19. Rauch, S.; Hemond, H.F.; Peucker-Ehrenbrink, B.; Ek, K.H.; Morrison, G.M. Platinum group elementconcentrations and osmium isotopic composition in urban airborne particles from Boston, Massachusetts.Environ. Sci. Technol. 2005, 39, 9464–9470. [CrossRef]
20. Kanitsar, K.; Koellensperger, G.; Hann, S.; Limbeck, A.; Puxbaum, H.; Stingeder, G. Determination of Pt, Pdand Rh by inductively coupled plasma sector field mass spectrometry (ICP-SFMS) in size-classified urbanaerosol samples. J. Anal. At. Spectrom. 2003, 18, 239–246. [CrossRef]
21. Bocca, B.; Caimi, S.; Smichowski, P.; Gomez, D.; Caroli, S. Monitoring Pt and Rh in urban aerosols fromBuenos Aires, Argentina. Sci. Total Environ. 2006, 358, 255–264. [CrossRef]
22. Reith, F.; Campbell, S.G.; Ball, A.A.S.; Pring, A.; Southam, G. Platinum in Earth surface environments.Earth Sci. Rev. 2014, 131, 1–21. [CrossRef]
23. Yajun, W.; Xiaozheng, L. Health Risk of Platinum Group Elements from Automobile Catalysts. Procedia Eng.2012, 45, 1004–1009.
24. Liu, Y.; Tian, F.; Liu, C.; Zhang, L. Platinum group elements in the precipitation of the dry region of Xinjiangand factors affecting their deposition to land: The case of Changii City, China. Atmos. Pollut. Res. 2015, 6,178–183. [CrossRef]
25. Birke, M.; Rauch, U.; Stummeyer, J.; Lorenz, H.; Keilert, B. A review of platinum group element (PGE)geochemistry and a study of the changes of PGE contents in the topsoil of Berlin, Germany, between 1992and 2013. J. Geochem. Explor. 2018, 187, 72–96. [CrossRef]
26. Emsley, J. “Ruthenium”. In Nature’s Building Blocks: An A-Z Guide to the Elements; Oxford University Press:Oxford, UK, 2003.
27. Pushpavanam, M.; Raman, V.; Shenoi, B.A. Rhodium—Electrodeposition and applications. Surf. Technol.1981, 12, 351–360. [CrossRef]
28. Rushforth, R. Palladium in Restorative Dentistry Superior Physical properties make Palladium an idealdental metal. Platin. Met. Rev. 2004, 48, 30–31.
29. Shaltout, A.A.; Hassan, S.K.; Karydas, A.G.; Zaki, Z.I.; Mostafa, N.Y.; Kregsamer, P.; Wobrauschek, P.;Streli, C. Comparative elemental analysis of fine particulate matter (PM2.5) from industrial and residentialareas in Greater Cairo-Egypt by a means of a multi-secondary target emergy dispersive X-ray fluorescencespectrometer. Spectrochim. Acta B 2018, 145, 29–35. [CrossRef]
30. Shaltout, A.A.; Hassan, S.K.; Karydas, A.G.; Harfouche, M.; Abd-Elkader, O.H.; Kregsamer, P.;Wobrauschek, P.; Streli, C. EDXRF analysis of suspended particulate matter (SPM) from residential andindustrial areas in Cairo, Egypt. X Ray Spectrom. 2018, 47, 223–230. [CrossRef]

Int. J. Environ. Res. Public Health 2020, 17, 3339 13 of 13
31. Shaltout, A.A.; Hassan, S.K.; Alomairy, S.E.; Manousakas, M.; Karydas, A.G.; Eleftheriadis, K. Correlationbetween inorganic pollutants in the suspended particulate matter (SPM) and fine particulate matter (PM2.5)collected from industrial and residential areas in Greater Cairo, Egypt, Air Quality. Atmos. Health 2019, 12,241–250. [CrossRef]
32. Shaltout, A.A.; Harfouche, M.; Ahmed, S.I.; Czyzycki, M.; Karydas, A.G. Synchrotron radiation totalreflection X-ray fluorescence (SR-TXRF) and X-ray absorption near edge structure (XANES) of fractionatedair particulates collected from Jeddah, Saudi Arabia. Microchem. J. 2018, 137, 78–84. [CrossRef]
33. Shaltout, A.A.; Ahmed, S.I.; Harfouche, M.; Hassan, S.K.; Eid, K.A. Lead speciation of PM2.5 collected fromGreater Cairo, Egypt and Zarqa, Jordan: An energy dispersive X-ray fluorescence and X-ray absorption nearedge structure study. X-Ray Spectrom. 2019, 48, 38–45. [CrossRef]
34. Shaltout, A.A.; Welz, B.; Castilho, I.N.B. Determinations of Sb and Mo in Cairo’s dust using high-resolutioncontinuum source graphite furnace atomic absorption spectrometry and direct solid sample analysis.Atmos. Environ. 2013, 81, 18–24. [CrossRef]
35. Shaltout, A.A.; Seoudi, R.; El-Ashkar, E.A.; Eid, K.A. Developed Method for Spectroscopic Studies of ViscousSamples. Anal. Lett. 2008, 41, 3034–3048. [CrossRef]
36. Shaltout, A.A.; Castilho, I.N.B.; Welz, B.; Carasek, E.; Martens, I.B.G.; Martens, A.; Cozzolino, S.M.F. Methoddevelopment and optimization for the determination of selenium in bean and soil samples using hydridegeneration electrothermal atomic absorption spectrometry. Talanta 2011, 85, 1350–1356. [CrossRef]
37. Shaltout, A.A.; Abdel-Aal, M.S.; Welz, B.; Castilho, I.N.B. Determination of Cd, Cu, Ni, and Pb in black teafrom Saudi Arabia using graphite furnace atomic absorption spectrometry after microwave-assisted aciddigestion. Anal. Lett. 2013, 46, 2089–2100. [CrossRef]
38. Castilho, I.N.B.; Welz, B.; Vale, M.G.R.; de Andrade, J.B.; Smichowski, P.; Shaltout, A.A.; Colares, L.; Carasek, E.Comparison of three different sample preparation procedures for the determination of traffic-related elementsin airborne particulate matter collected on glass fiber filters. Talanta 2012, 88, 689–695. [CrossRef] [PubMed]
© 2020 by the authors. Licensee MDPI, Basel, Switzerland. This article is an open accessarticle distributed under the terms and conditions of the Creative Commons Attribution(CC BY) license (http://creativecommons.org/licenses/by/4.0/).