DRUG ANALYSIS SPECTROSCOPIC METHODS
70
YEREVAN STATE MEDICAL UNIVERSITY AFTER M. HERATSI DEPARTMENT OF PHARMACY PHARMACEUTICAL CHEMISTRY DRUG ANALYSIS SPECTROSCOPIC METHODS Manual for pharmacy students YEREVAN 2020
-
Upload
khangminh22 -
Category
Documents
-
view
0 -
download
0
Transcript of DRUG ANALYSIS SPECTROSCOPIC METHODS

YEREVAN STATE MEDICAL UNIVERSITY AFTER M. HERATSI
DEPARTMENT OF PHARMACY
PHARMACEUTICAL CHEMISTRY
DRUG ANALYSIS SPECTROSCOPIC METHODS
Manual
for pharmacy students
YEREVAN 2020

1
SPECTROSCOPIC METHODS OF ANALYSIS
Characteristics of electromagnetic specter
Among different physical methods of organic molecule structure identification electromagnetic
radiation with wide frequency range interaction with a substance has important role: started from
radio waves until -rays (whole electromagnetic specter).
Light wave consists of electric and magnetic fields perpendicular to each other, which amplitude
is changed according to sinusoid while the beam spreads (figure 1).
Figure 1: Electromagnetic light wave in yz plane of electric field: vector E and in xz
plane of magnetic field: vector H.
Wave energy is expressed by Plank’s equation:
E=hc/=h,
where h-Plank’s constant (6.63x10⁻³⁴ J*sec)
c- light speed (3*108m/sec)
-wave length
-frequency.
Electromagnetic radiation can be characterized by either wave or energetic parameters. Wave
parameter could be expressed by wave length (A0, nm, mmk, mk, cm, m) and vibration
frequency: (sec-1), which are connected to each other by the following formula:
=c/
Wave number is often used (it is also called frequency). It is measured by cm-1:
ύ=1/λ
Energy transition between two energy levels is measured by electron-volts (ev) or calories (cal).
Connection between wave length and wave number is expressed by the following relation:
(nm)=107/ύ(cm-1).
When the light with I0 intensity falls on the tested substance, some of it reflects (Ir) from that
substance surface, the other portion is scattered by the substance particles (Is), and the third part
(Ia) is absorbed by the molecules. Radiation with residual intensity (I) comes out from the
substance (figure 2).

2
Figure 2: Light beam intensity (I0) decrease in result of absorption (Ia), refraction (Ir)
and Scattering (Is).
Thus,
I0 = I + Ir + Is + Ia.
It is necessary to distinguish external (non-quantum) and internal (quantum) effects.
Ir by its value and direction is conditioned only by the macroscopic properties of the sample,
and doesn’t contain any information about its intermolecular structure.
Is is conditioned by substance particles diameter and light wavelength relation and reaches the
maximum value when the mentioned two parameters are comparable values. Scattered radiation
can be emitted from very small particles of the substance (Tindal scatter) as well as from its
molecules (Rayleigh scattering). In case of Raleigh phenomenon, excitation light results in
electrons compulsory vibration in the molecule. These vibrating electronic dipoles are a secondary
source of radiation, and the light emitted from them has the same frequency as the absorbed light.
This type of scattering, as well as reflection, is external effects of light and substance interaction.
Ia is the light portion which is absorbed by the molecules (internal effects). If absorption occurs,
it means that the molecule has been excited or has turned to an excited state.
The probability of this or that process is due to the nature of molecule. A change of molecule's
energy state is expressed by Bor’s equation:
E=Ef -Ei= h,
where E is a change of system energy.
Ef and Ei are the system energies in final (f) and initial (i) states.
If the final energy is higher than initial energy (Ef>Ei), E is positive and it corresponds to
beam absorption. If E is negative (Ef<Ei) energy is emitted. In the first case we have absorption
spectra, and in the second one emission spectra.
Thus, as noted, part of the radiation is absorbed by the substance under the influence of
electromagnetic radiation. In this case, light energy is transformed into another type of energy
(caused by exciting beam wavelength).
The entire specter of electromagnetic rays is presented in Table1, which is expressed in both
energy (ev) and wave parameters.

3
Table 1:
Characteristics of electromagnetic specter
Radiation Wavelength (cm) Radiation
energy
(EV)
Processes - taking place
during emission and
absorption
-rays 10-11-10-8 107 Energy state alteration of
nuclei (-resonance
spectroscopy)
X-rays 10-8-10-6 105 Energy state alteration of
atom’s inner electrons
(Roentgen spectroscopy)
Ultraviolet and visible 10-6-10-4 10 Energy state alteration of outer
electrons (electronic specters)
Infrared 10-4-10-2 10-1 Vibration of atoms in
molecule (vibrational spectra)
Microwaves 10-1-10 10-3 Vibration of atoms in crystal
lattice, alteration of rotational
energetic state
Radio waves >100 <10-6 Alteration of nuclei and
electrons spins energetic state
(NMR, EPR spectroscopy)
Electromagnetic specter is spread from 10-10cm -rays to 105cm radio waves. Thus, wavelength
is changed by 15 orders in the electromagnetic specter. Energy according to specter is also altered
by 15 orders and is changed from 107ev (for rigid rays) to 10-8ev (for radio waves).
The high energy region of the specter begins with 10-11 wavelengths -rays which have 107ev
and more energy. This radiation leads to alteration of nuclei’s energetic state and gives information
about nuclei forces interactions (-resonance spectroscopy region).
The energy of 100,000ev order (wave length is 10-8cm) corresponds to Roentgen rays which
alters inner electrons’ energetic state closed to atom’s nuclei. The study of this interaction allows
to detect inner electrons bond energy (Roentgen spectral study region).
The energy with dozen ev order (wave length is greater than 10-6cm) responsible for UV and
visible region and corresponds to energy alteration of valent electrons (electronic spectroscopy
region). The whole UV region is divided into three main parts;
1. near UV region 300-400nm (it relates to visible region),
2. farther UV region 200-300nm,
3. vacuum UV 10-200nm.
Basic measurements by spectrophotometer is possible to conduct in near region and in farther
region with a special device. The vacuum UV region has no analytical usage.
Next region is the infrared region which is spread from 10-4 to 10-2cm wave lengths. The energy
of this region corresponds to energetic transitions within atoms’ vibrational levels in molecules
and is a component of ev decimal part (vibration spectroscopy region).
The microwave region relates to the infrared region. Microwave absorption is connected with
the atom’s rotational energetic state alteration and atom’s vibrations in crystal lattice (microwave
spectroscopy region).
4
The final is the radio spectroscopy region (nuclear magnetic resonance- NMR; proton magnetic
resonance- PMR; and electron magnetic resonance- EMR region). These beams form alteration of
nuclei and electrons’ spins energetic state.
It is impossible to investigate an entire electromagnetic specter with only one device. The
methods used in spectroscopy are significantly changed passing from one region to another but the
main principles are the same.
In the absorption spectroscopy devices are used, which consist of the following structural
elements:
• light (radiation) source,
• monochromator which gives chance to separate monochromatic radiation,
• output gap,
• sample carrier or holder (in UV and visible spectroscopy: cuvette, in atom absorption
spectroscopy: flame, etc.),
• receiving-recording system, detector.
A radiation source should emit polychromatic light with a required intensity. However,
practically there is no universal light source that can emit radiation from the investigating whole
region (from vacuum UV to farther IR region). For example, the incandescent bulb is suitable only
for visible and near infrared regions and is absolutely useless for UV and farther IR regions.
A monochromator is required in spectroscopic methods, as for study either certain narrow
region of beam is taken (non-monochromatic light): in case of colorimetry, photocolorimetry or
beams of one wavelength (monochromatic light) in all spectroscopic methods. Before,
monochromator role played prisms, and currently they are replaced by optical nets which are of
course made of those substances which do not absorb in studied region (glass, quartz, potassium
bromide, etc.). The monochromator breaks the light into separate waves or waves bunch, which
passing through the narrow output gap pass through the tested substance.
A sample carrier as well as the entire optical system must be permeable for the beams of the
investigated region. The glass, for example, is not suitable for both IR and UV rays as it absorbs
in these regions.
A receiver, also called detector, transforms the received light signal to the measured electrical
tension.
From the mentioned it is clear that the studied whole region is impossible to study with the help
of one device. Additionally, there are quite different ways to prepare samples for implementation
spectroscopy in different regions.
It is important to consider about light sources in spectrometers:
● Any radiation source has a certain heating time: this means that continuous radiation is
received in a few minutes, after which radiation long-term stability is observed.
● As any incandescent bulb, the radiation sources can be worn out in spectrometers, which in
time leads to I0 intensity decrease.
● Light sources with the constant distribution of energy are emitted in a wide range of waves,
but the radiation intensities in this case are not equal, i.e. I0 is conditioned by wavelength.
Besides, detector sensitivity is conditioned by wave frequency, which, in its turn, is the base for
two types of spectrometers creation: single beam and double beam.
Single beam spectrometer
As it is seen from the name, there is only one light beam in these devices, which falls on the
receiver. These types of devices are intended only for quantitative analysis, in which the light

5
intensity I0 is initially measured at the beginning of experiment only for one wavelength (or, if it
is necessary, for certain periods).
Figure 3: Principle of quantitative analysis (I0 and I detection).
As it is seen from the schematic diagram of the device, at first the light intensity is measured
without sample in the absorbing compartment (in practice, the absorbing compartment is not
empty, but contains a "zero" solution, for example, in the UV and visible spectroscopy it is the
solvent in which tested sample was dissolved).
Double beam spectrometer
These devices contain more complex optics and are more expensive than single beam
spectrometers. They are specially designed to record spectra. The necessity of these type of
devices is conditioned by dependence of light source I0 intensity from radiated wave length. As
for getting the specter it is necessary to pass rays with different wavelength through the sample,
for each of them it is necessary to record its I0 value, thus it is more expedient that the light passes
through the sample and comparing compartment. This can be performed with a rotating mirror: in
that case detector reacts at the same frequency, consequently accepting I and I0.
Figure 4: Schematic structure of double beam spectrometer.
Thus, only double beam spectrometers are used to record spectra, which, of course, give
possibility also perform quantitative detection. In such devices, absorbing compartments can be
found both before and after the monochromator, as shown in the figure.

6
Absorption lаws
Spectroscopy methods of analysis are based on specific absorption of electromagnetic radiation
by tested substance and are used for light-absorbing substances: structure investigation,
identification, and quantitative analysis. Spectrophotometry is a spectroscopy analysis method,
which is based on monochrome radiation absorption by substance. Measurements, which are used
for detection of absorbed electromagnetic radiation, are based on two laws. The first law was
formulated by Lambert and then worked out by Bouguer in 1729. This law expresses the
connection between substance’s absorption ability and layer thickness. Parallel flux intensity of
light monochrome radiation passing through a homogeneous absorbing environment is decreased
by exponential law:
I=Ioe-kd,
where
Io is the intensity of falling monochromatic radiation,
I- intensity of the transmitted monochromatic radiation,
d- absorption layer thickness,
k- absorption coefficient which is individual for each wavelength.
This law can be expressed by logarithm form:
I=I010-k1
d,
where k1 is an inverse value of substance such property passing through which radiation bunch
decreases 10 times. Usually Bouguer-Lambert law is used as follows:
D=lglo/l=k1d,
where k1=0.4343k; D is an optical density which characterizes substance’s absorbing property;
d is an absorption layer thickness.
All substances follow Bouguer’s law.
The second law was formulated by Beer in 1862, which expresses the connection between
substance’s absorbing ability and its concentration in solution.
k=χc,
where c is solution concentration,
χ is an absorption coefficient of a solution, concentration of which is 1.
χ value is a physical constant typical for each substance and can be used for identification. χ
value base on optical density (D) measurement gives chance to detect given substance quantity in
solution of unknown concentration.
Thus, according to Bouguer-Lambert-Beer’s combined law has the following form:
I=Ioe-χcd.
Logarithm form is also used:
D=lglo/l=χ1cd, χ1=0.4343χ,
where χ1 and χ are absorption coefficients.
Bouguer-Lambert-Beer’s combined law is true only for monochromatic radiation and can’t be
used in spectrophotometric method.
In contrast to Bouguer-Lambert’s law, Beer’s law isn’t universal. Deflections from Beer’s law
are due to intermolecular interactions in the solution. Beer’s law practical usage for the given
substance is based on the correlation between optical density and concentration. When solution
follows Beer’s law, that correlation is linear for different wave lengths. Deflections from Beers’
law are usually in the infrared region of specter. It is conditioned by concentric solutions, which
7
are used for absorption spectra measurements, where intermolecular interactions are strong
enough.
Absorption spectra expression forms
Spectral data are registered as a correlation of absorption index from wave length, thus, are
expressed by means of two changeable data’s-intensity and wave length factors. These two factors
expressing methods depend on working conditions, studied region and further usage of obtained
data. Wave length parameter can be expressed in the optical specter’s whole region by inverse
centimeters (cm-1) or depending on studied region: by angstroms (A0), nanometers (nm),
millimicrometers (mmk) for visible and UV regions, micrometer (mk) for infrared region. Rarely
frequency is used which is expressed by inverse seconds (sec-1).
Intensity index can be expressed by the following ways:
I/Io----transparency (by the unit parts),
I/Iox100%---transparency, % (by percent),
Io-I/ Io----absorption (by the unit parts),
Io-I/ Iox100---absorption, % (by percent),
D=lgIo/I---optical density.
In some cases, lnlo/l is used in the infrared region.
In the mentioned methods, layer thickness and concentration could be expressed by any units;
thickness-mm, cm; concentration-g/l, mg/l, mg/ml, mol/l.
Concentration (c) can be expressed by mol/l or g/100ml units. Depending on this, molar or
specific absorption coefficients are detected. The molar absorption coefficient (ε) or extinction is
the optical density of substance one molar solution with 10mm layer thickness and specific
absorption coefficient (E1cm 1%) is optical density of 1g substance containing solution in 100ml in
the same layer thickness conditions. In that case Bouguer-Lambert-Beer’s law is written as
follows:
D= εcd or ε=D/cd or D=E c d
Specific absorption coefficient can be converted to the molar absorption coefficient by using
the following formula:
ε= E1sm 1% x M/10,
where M is substance molar mass.
Intensity coefficient can be expressed in the ordinate axis as ε or lgε. The last expression is used
in UV region, where substance absorption intensity is changed by several orders.
If the absorption curve width is comparative to device’s spectral hole width, so the absorption
curve form is distorted and the absorption molar coefficient value doesn’t correspond to the real
value and is called absorption “seeming” factor ε0.
As shown in the graphics (figure 5), the form of absorption layer depends on the ordinate
system choice, where registration is conducted. For comparing absorption layers, it is desirable to
observe built graphics in the same coordinate system. Moreover, only using ε, lgε and intensity
factors shape of absorption layer doesn’t depend on concentration.
Absorption specter can be characterized by the following values:
1. absorption maximum wave length and that maximum intensity,
2. absorption minimum wave length and intensity in that part,
3. absorption layer curve: inflection (wing) by corresponding wave length and intensity in that
part.

8
Figure 5: Electronic spectra of fenantrene absorption in different coordinate systems.
Absorption electronic spectra characteristics according to organic molecules structure
In the 1000-10.000 Å region absorption is conditioned by electronic state alterations in a
molecule. Consequently, in UV and visible regions, absorption spectra are called electronic.
Molecule has quantum energetic levels and its energy consists of electronic, vibrational and
rotational states energies’ sum:
E=Eelec. + Evibr. + Erot.
Radiation absorption leads to alteration of that states’ energies, in which result electronic,
vibrational and rotational spectra are formed (figure 6). Moreover, each electronic level has its
vibrational and rotational levels.
10-1-10-3 kcal/mol energy corresponds to rotational spectra, thus they are in farther infrared and
microwave regions. Vibrational spectra are expressed in middle and near infrared regions, and
electronic spectra are formed due to transitions between electronic states and are observed in

9
ultraviolet and visible regions. In a result of such energy absorption, beside electronic transitions
simultaneously alterations are carried out also in vibrational and rotational states.
Figure 6: Diatom molecules energetic levels’ scheme:
E-electronic levels, ν-vibrational levels, and j-rotational levels.
In the organic molecules, UV and visible beams absorption is conditioned by single and
multiple bonds’ valent electrons (σ, π electrons) and heteroatom’s unshared electron pair electrons
(n-electrons) transitions. These electrons have different energies and for that reason they are
excited under different wave lengths influences. In the organic molecules electrons’ energetic
levels order is presented in the figure 7.
anti-bonding σ*-orbital
anti-bonding π*-orbital
non-bonding n-orbital
bonding π-orbital
bonding σ-orbital
Figure 7: Electronic transitions in molecules.
As it is shown in the scheme, bonding π-orbital’s energy is higher than bonding σ-orbital’s
energy. For the anti-bonding orbitals, the relation is reversed: σ*- orbital’s energy is higher than
π*-orbital’s energy.
Electrons transition from the bonding orbital to the appropriate anti-bonding orbital is
mentioned by N―›V transition. These transitions are σ―›σ* and π―›π*.

10
σ―›σ* transitions require the highest energy (figure 7), therefore, their absorption layer is in
the vacuum UV region (<170nm). π electrons excitation demands less energy and absorption for
π―›π* transition is in longer wavelength region of the specter. Electrons located on n-levels could
pass to the anti-bonding π* and σ* orbital. n―›σ* and n―›π* transitions are mentioned by N―›Q.
The intensity of n―›π* transition absorption layer usually is quite less than other transition curves
intensities. In organic molecules which don’t contain π and n electrons, the only transition is
σ―›σ*. In saturated compounds, the presence of an atom with an unshared electron couple leads
to the n―›σ* transition located in the longer-wave region than the σ―›σ* transition. n―›π*
transitions occur in those compounds where a heteroatom is linked by multiple bonds to another
atom. In simple non conjugated systems these transitions are the longest-waves. In case of
conjugation bonding, the π orbital with high energy could have more energy than n-orbital and
thus, π―›π* transition curve will be a longer wave.
Polyatomic molecules which include electrons in different states and different transitions (from
general state to excited states) could occur under radiation.
Absorption curve displacement is seen due to intermolecular and intramolecular interactions as
a result of energy alterations of general and excited states. However, it could occur as a result from
energy alteration of the general state or energy alteration of both states. If in result of general and
excited states’ energy alteration difference between them isn’t changed so that appropriate curve
isn’t displaced, though, in this case can be alteration of electron density distribution.
Absorption curves are characterized by wave length and absorption intensity within the electron
spectrum. The absorption curve’s wave length, which is responsible for the electron’s transition,
corresponds to that electron’s transition energy.
In electronic spectroscopy, absorption curve intensity is measured by the molar coefficient
value in the curve maximum (εmax or lgεmax). The absorption curve also can be characterized by
intensity integral -A:
A=∫ευdυ
Where ευ is the molar absorption coefficient in the case of υ frequency and υ1 and υ2 are wave
numbers. The intensity integral is measured by the absorption curve area within the ε―υ
coordinates.
The absorption curve intensity is detected by the possibility of transition.
The transition possibility between m and n states is detected by the transition moment:
Mmn=∫ψ*mMψndτ,
where ψ-wave function, τ-dependence on time.
Several rules exist, which determine conditions that inhibit absorption within the spectrum.
They are called rules of choice:
1. Rule of choice according to spine
Transitions are prohibited during which electron spine alteration is carried out. However,
sometimes due to spine-spine and spine-orbital interactions absorption curves responsible for those
transitions appear in the spectrum with less intensity (≤10-6). In heavy metal containing molecules,
spine-orbital interactions are significant and their appropriate curves are appeared with expressed
intensity.
Transitions that occur without electron spine alteration are called singlet-singlet. Transitions
that occur with electron spine alteration are called singlet-triplet.

11
2. Rule of choice according to symmetry
The transition moment is a vector quantity and could be divided into X, Y, and Z parts. If
molecule’s general and excited states’ symmetry is so, that all these integrals equal 0, then the
transition is inhibited according to symmetry. When even one integral is differed from 0, transition
is allowed.
3. Rule of choice according to local symmetry
Compounds that include unsaturated groups like C=O, C=S, C=N, N=N, N=O yield absorption
curves with singlet-singlet n―›π* transitions. The intensity of this absorption curve isn’t high. If
n electrons are on the non-hybridized p-orbital, then the transition moment is equal to 0 and the
n―›π* transition is inhibited. In this case, transition is prohibited according to local symmetry. If
electrons are located on hybrid orbitals, then the transition moment does not equal 0 and its
quantity is detected by atoms inserted into hybrid orbitals. Hybrid nsp orbitals are located on the
bottom of np orbitals according to their energy, therefore absorption curves responsible for np―›π*
transitions will be in the longer wave regions than absorption curves of the nsp―›π* transition.
4. Inhibition rules where more than one electron excitement occurs.
Electron transition is well illustrated in the formaldehyde molecule which contains σ, π and n
electrons.
The formaldehyde molecule has a planar structure in the general state and 12 electrons are
distributed in the 6 following orbitals:
1. C-H group symmetric and non symmetric bonding σ-orbitals,
2. C=O group bonding σ-orbital,
3. C=O group bonding π-orbital,
4. bonding orbital of oxygen atom’s unshared electron couple.
One of the unshared electron couples of an oxygen atom is in a p-orbital (np) and the second is
in a hybrid sp-orbital (nsp).
High energy occupied orbitals will be non bonding p-orbitals, then bonding π-orbital, non
bonding sp, and bonding σ-orbitals.
The reduced-energy non occupied orbital of formaldehyde molecule will be an anti-bonding π-
orbital (π*), and the following is an anti-bonding σ-orbital C=O (σ*):
Figure 8: Scheme of formaldehyde electronic transitions energetic levels.
Longer wave curves in the formaldehyde spectrum λmax=295nm (εmax=10) belong to the
transition from the non-bonding p-orbital to the anti-bonding π* orbital, referred to the n―› π*
transition. The corresponding curve intensity is less studied because this transition is inhibited

12
according to local symmetry. In the shorter wave region, formaldehyde also has 2 intense
absorption curves in the UV region. The first curve is 185 nm and the second is 155 nm and belong
to transitions, respectively np―›σ* and π―›π*.
Chromophors are the functional groups which provide absorption in the UV and visible regions.
Auxochromes are the functional groups (-OH, -OR, -NH2), which form complexes with
chromophors leading to bato-chrome, hypso-chrome shifts, and hyper-chrome, and hypo-chrome
effects.
Bato-chrome shift or “red shift’’ is the curve’s shift to the long wave’s side. For example, alkyl
groups give such kind of displacements, which are located near the chromophors.
Hypso-chrome shift or “blue shift’’ occurs when the curve is shifted to the short wave’s side.
Hyper chrome effect leads to an increase in absorption intensity.
Hypo chrome effect leads to a decrease in absorption intensity.
Factors influencing on the chromophore’s absorption ability
pH, solvent or neighboring molecules polarity, and neighboring chromophores relative
orientation influence on the chromophores’ absorption ability. These factors are based on
adsorption spectroscopy which is used for the macromolecule’s characterization.
pH- influence. Solution pH detects chromophores ionization degree and form. pH- influence
on tyrosine specters is presented in the Figure 9.
Figure 9: Thyrosine absorption specter at pH 6 and pH 13 conditions.
Increasing OH- group dissociation of phenolic residue both λmax- and ε- increase.
Polarity influence. In case of polar chromophores (especially, if molecule contains O, N or S
atoms) in the hydroxyl group (H2O, alcohols) containing polar solvents λmax- is observed in case
of the shorter waves than in non-polar solvents.
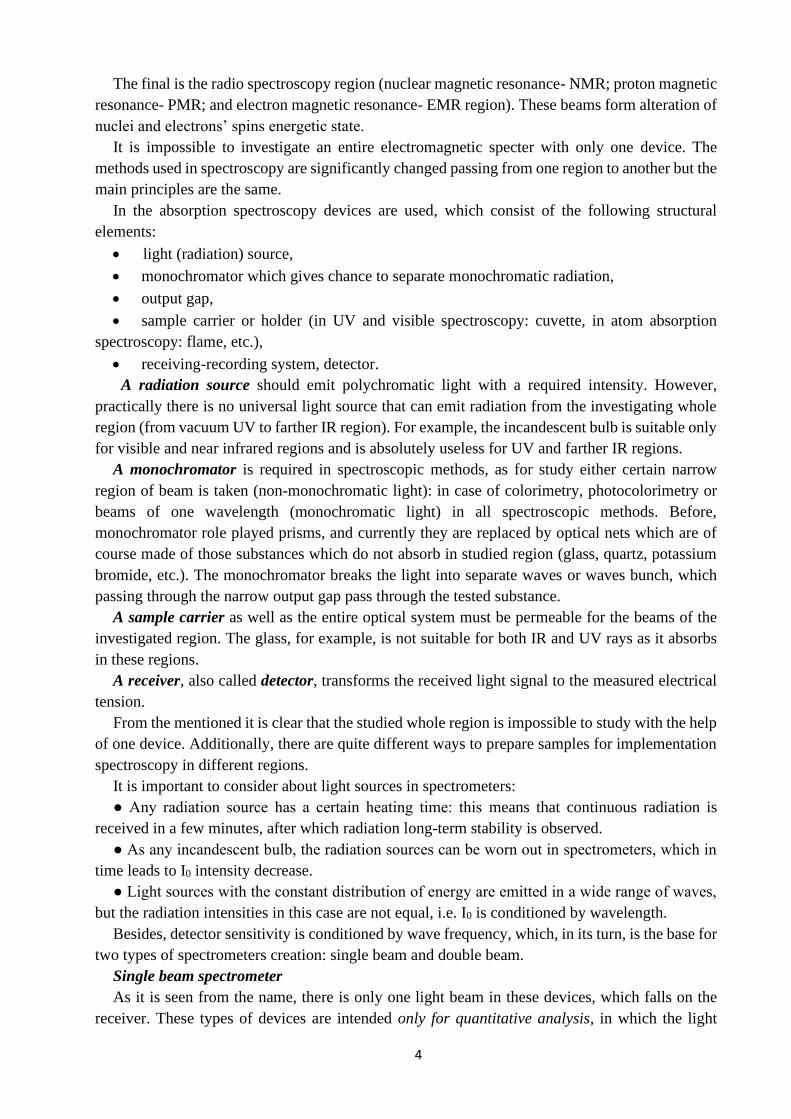
Solvent polarity influence on tyrosine specter is presented in the Figure 10.
It is shown λmax-shift in less polar solvent.
13
Figure 10: Solvent’s polarity influence on tyrosine absorption specter
solvents: water (unceasing curve) and
20%- ethylenglycol (dotted line curve).
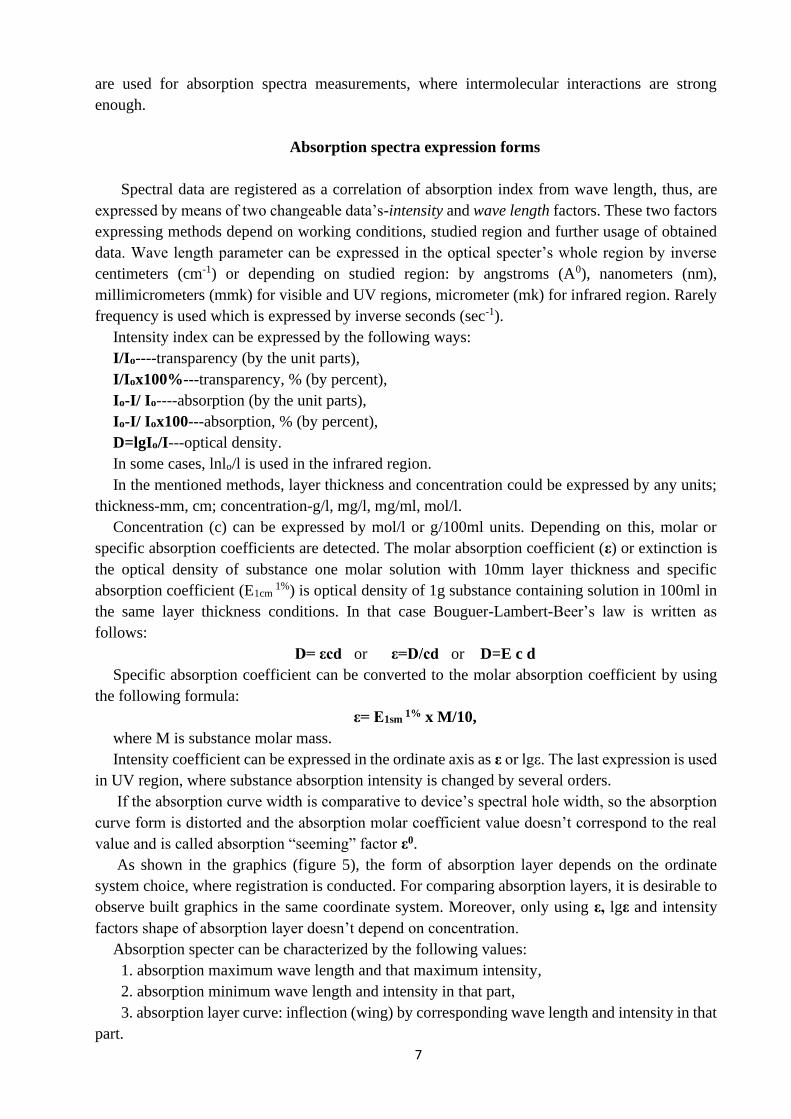
Orientation influence. λmax- and ε- values depend on geometric features of the molecule. It is
known nucleic acids hipochromy, i.e. nucleotide absorption coefficient value decrease, when free
nucleotides are included in polynucleotides content, in which nucleotides bases sequentially
binding with each other are located close.
ε- value further decrease are noticed in polynucleotides helix, where nucleotide residues have
more streamlined ordering. This is shown in figure 11.
Figure 11: Optical density decrease characterizing hypochromy, DNA absorption
specters for mono-chain (1), bi-chain (2) forms and free nucleotides (3) case.

14
In result of large number of important biological compounds and macromolecules research,
structures of which are studied in various conditions, a number of experimental facts were
collected which can be called absorption spectroscopy applicable rules used in biochemistry. There
are:
1. If aminoacids (tryptophan, tyrosine, phenylalanine and histidin) are in the less polar
environment, λmax- and ε- are increased. Therefore, if λ max and ε greater value is noticed in the
specter of amino acid (from the protein composition) in polar solution, than in free amino acid
specter in case of the same solvent, so the amino acid is in the protein inner part (it is “hidden”)
and covered with non-polar amino acids. If the protein specter is sensitive toward solvent polarity
changes, thus the amino acid for which there is noticed λmax- and ε- change must be located in
the protein surface.
2. In case of aminoacids λmax- and ε- are always increasing, when titrated group (eg, tyrosine
OH- and cystein SH-) are charged. Therefore, if it is not noticed change in the any of these amino
acids specter, and the pH- is such that free amino acids ionization should take place, so it is hidden
in the protein non-polar part. If the amino acid groups ionization pK- value, which is detected by
spectral change at the pH-change, is such as free aminoacids in the solution, the amino acid is in
the protein surface. If pK- value, detected by specter change at changing pH is sigtificantly
different, so the amino acid is probably in very polar environment (e.g. tirozine surrounded by
carboxylic groups).
Electronic absorption spectra of different organic compounds:
Aliphatic compounds
Saturated compounds. In saturated compounds (alkanes and cyclic alkanes) containing only
simple bonds, the σ―› σ* transition is possible and appropriate curves are in the vacuum UV
region. For example, methane has an absorption curve in 125nm and ethane in 135nm. In the
spectrum of saturated compounds containing heteroatoms with unshared electron couples, long
wave curves belong to the n―›σ* transition. In this absorption region, other curves can be appear
occurring as a result of a σ―› σ* transition.
Table 2:
Unsaturated compounds. Unsaturated carbohydrates with isolated double bonds have
intensive absorption curves due to a π―› π* transition in the 165-200nm region. Ethylene absorbs
in the 165nm region. Alkyl substitutes in ethylene carbon atoms lead to a π―› π* transition curve
dislocation to the long wave side and appropriate absorption is occurrs in 175-200 nm. Cyclic

15
unsaturated carbohydrates have a spectrum similar to alkenes. Thus, π―› π* transition curves of
cyclic compounds appear in 183 nm. Alkenes and cyclic alkenes absorption intensity’s change
from ε=6500 to ε=12000.
In acetylene carbohydrates with C≡C isolated bonds, the π―› π* transition curve occurs. The
acetylene absorption curve is in 173nm, alkyl acetylene has absorption in λmax=187nm and
dialkylacetilene is characterized by an absorption curve with λmax =190nm.
Table 2:
Double bonds lead to absorption curve dislocation to the long wave side and increase intensity.
Polyene spectrums are characterized by vibration structures of the absorption curve. Distance
between vibration peaks is equal to 1500-1600cm-1 which corresponds to an alteration of the C=C
bond vibration state in the excited electronic state.
Figure 12: Figure 13:
In the polyene chain, the C=C bond substitution by C≡C bond practically does not change the
absorption curve location but does lead to a decrease in intensity.
Cyclic dienes result in absorption in longer waves than linear compounds. Their absorption
intensity is low.
Compounds, that contain conjugated triple bonds C≡C (polyenes), have several absorption
curves with vibration structures. Diacetylene has absorption in the 210-250nm region with average
intensity. In the polyene spectra, expect average intensity curves in the 340-390 nm region.

16
Absorption curves with higher intensities also appear in 200-280 nm region (ε>100000), as well
curves with vibration structures. Distance between vibration peaks of polyacetylene is about
2000cm-1.
Carbonyl compounds
Carbonyl compounds are aldehydes, ketones, carbonic acids and their esters, chloranhydrides,
anhydrides and amides. All of these compounds contain heteroatom binding by multiple bonds.
As mentioned above in these groups, three types of transitions are possible: π―› π*, n―› π* and
n―›σ*.
Absorption responsible for the n―›π* transition is more likely for carbonyl compounds. The
n―› π* transition curve has the following characteristics:
1. The molar absorption coefficient is not great (for C =O, ε≤100, C=N, ε≤2000).
2. Solvent polarity increase lead to dislocation of the n―› π* transition curve maximum to the
short-wave side (blue shift) due to a decrease in general state energy and an increase in excited
state energy.
3. In an acidic environment, the n―›π* transition curve disappears due to a blockade of
heteroatom’s unshared electron couple.
4. Usually less energy corresponds to the n―›π* transition and the curve is in the longer wave
within the spectrum.
Saturated carbonyl compounds. As mentioned above, formaldehyde has 3 absorption
curves with maximums of 295, 185, 155 nm. These curves correspond to n―›π*, n―›σ* and
π―›π* transitions, respectively. Short wave curves (λmax=155 nm), are more intensive. n―›π*
transition curves are inhibited according to local symmetry and differ by small intensity (ε295=10).
Saturated aldehydes and ketones have 2 absorptions within the vacuum UV region. One of
these is in 170-200 nm regions and the second is in 150-170nm region.
Longer wave curves belong to the n―›σ* transition (acetaldehyde λmax=182 nm, lgεmax=4.01
and acetone λmax=195 nm, lgεmax=3.96) whereas short wave curves (acetaldehyde λmax=167 nm,
lgεmax=4.3) belong to the π―›π* transition. Saturated aldehydes and ketones belong to the n―›π*
transition curve in the 270-290nm region. The transition of formaldehyde to acetaldehyde and
acetone results in n―›π* transition curve hypsochrome shift.
Table 4:
Carbonyl group’s n―›π* transitions absorption maximum values in different
environments
Compound λmax nm εmax Solvent
HCHO
CH3CHO
CH3COCH3
CH3COOH
CH3COCI
CH3COOC2H5
CH3CONH2
295
290
279
204
235
204
214
10
16,6
14,8
41
53
60
-
Vapors
Heptan
Hexan
Alcohol
Hexan
Water
››
17
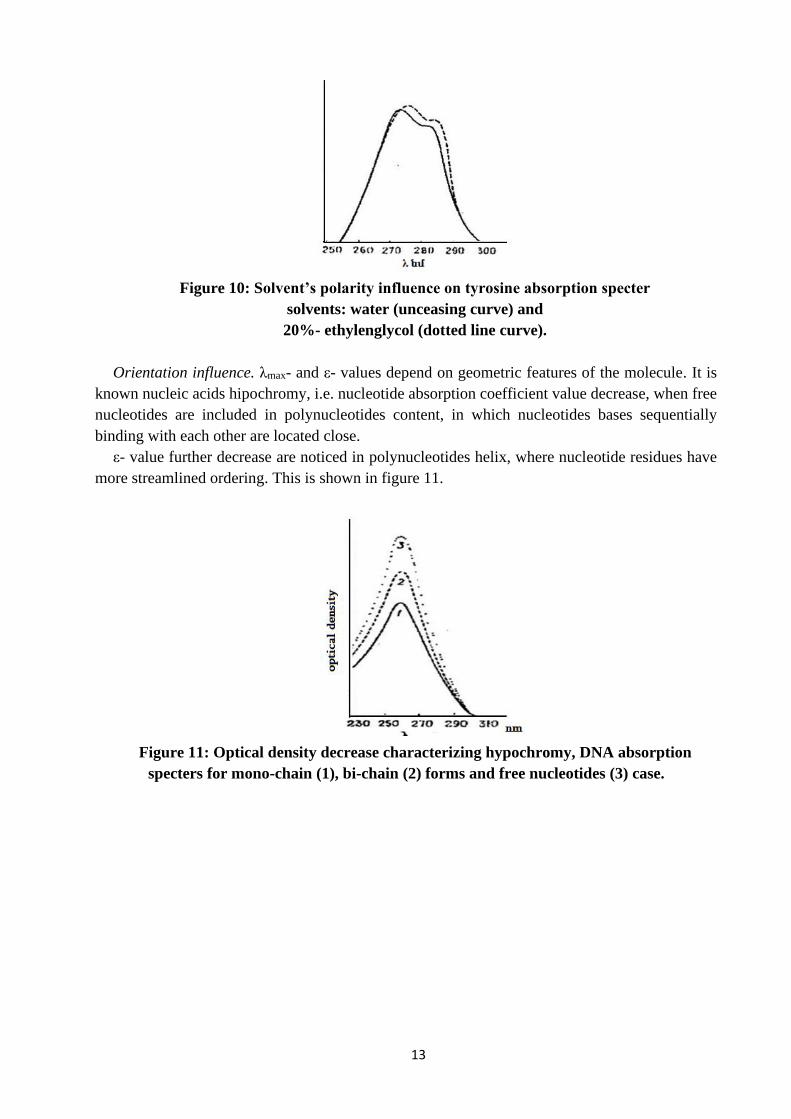
This occurs due to the inductive effect of the alkyl group that increases carbonyl groups’ excited
π* level energy while energy of non-bonding n-electrons is not changed. Aldehyde group hydrogen
substitution by OR, NR2, Hal groups results in n―› π* transition curve hypsochrome shift, which
is also due to an increase in excited π* state energy and saving n-electrons’ energy.
Figure 14:
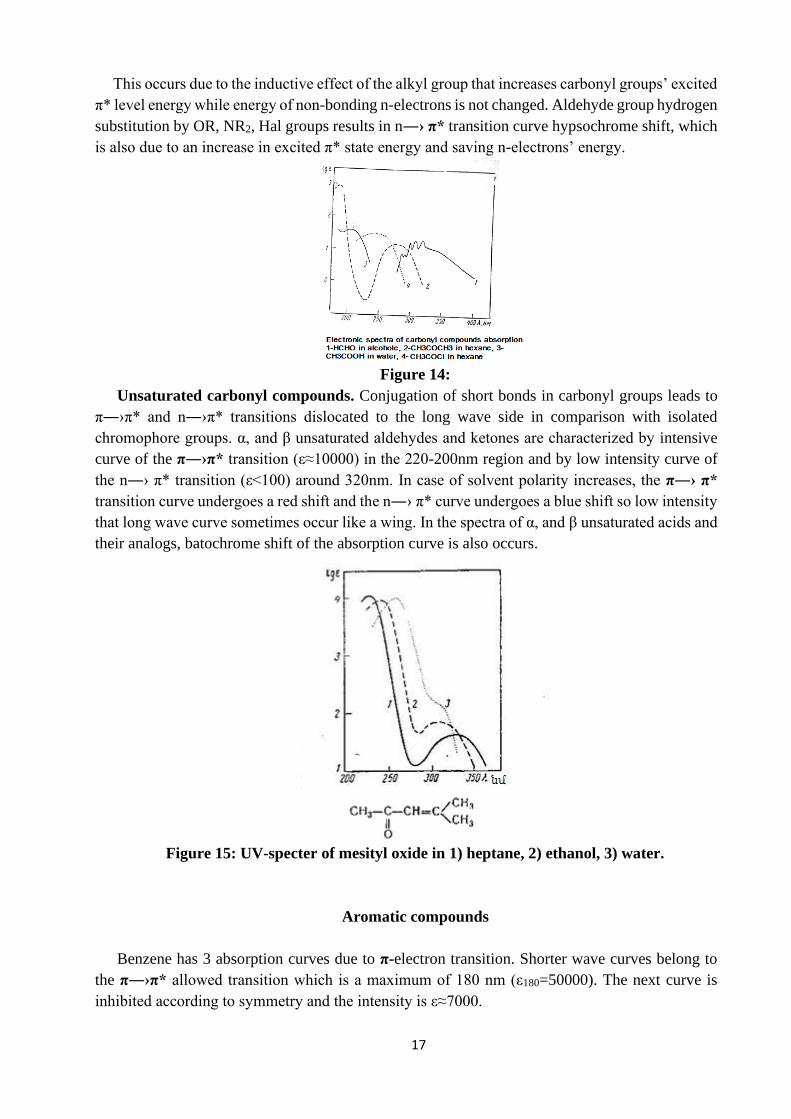
Unsaturated carbonyl compounds. Conjugation of short bonds in carbonyl groups leads to
π―›π* and n―›π* transitions dislocated to the long wave side in comparison with isolated
chromophore groups. α, and β unsaturated aldehydes and ketones are characterized by intensive
curve of the π―›π* transition (ε≈10000) in the 220-200nm region and by low intensity curve of
the n―› π* transition (ε<100) around 320nm. In case of solvent polarity increases, the π―› π*
transition curve undergoes a red shift and the n―› π* curve undergoes a blue shift so low intensity
that long wave curve sometimes occur like a wing. In the spectra of α, and β unsaturated acids and
their analogs, batochrome shift of the absorption curve is also occurs.
Figure 15: UV-specter of mesityl oxide in 1) heptane, 2) ethanol, 3) water.
Aromatic compounds
Benzene has 3 absorption curves due to π-electron transition. Shorter wave curves belong to
the π―›π* allowed transition which is a maximum of 180 nm (ε180=50000). The next curve is
inhibited according to symmetry and the intensity is ε≈7000.

18
The typical absorption for benzene, “benzene absorption curve”, is located in the 230-260nm
regions. It is inhibited according to symmetry, has less intensity (ε≈200), and expressed vibration
structure.
Substituent insertion in the benzene ring leads to spectrum dislocation due to substituent nature.
If the substituent possesses only inductive effects (-N+R3), then a change to the benzene spectrum
is slight. A change during substitution is due to a conjugation effect and is determined by the
interaction force of the substituent and the benzene ring π electron. It is not determined by the
substituent nature that is, substituent is electro donor or electro acceptor.
Alkyl substituents and halogens result in a slight curve shift to the long wave side and increase
in intensity. The vibration structure of benzene ring is unchanged.
Figure 16:
Insertion of polar groups with an unshared electron couple in the benzene ring (OH, OR, NH2,
NR2) leads to expressed batochrome shift. The benzene ring intensity is increased about 10 times.
In an aniline molecule, vibration structure almost disappears. This change of spectrum is due to an
interaction of heteroatom’s unshared electron couple and benzene ring electrons. In case of
unshared electrons pair blockage (e.g. salt formation of amino group), the absorption specter
becomes similar to the specter of benzene alkyl homologs.
Multiple bonds containing substituents lead to an increase of the absorption curve intensity and
dislocation to the long wave side. If the substituent is a carbonyl group, n―›π* transition curves
are seen. They are well visible in the benzaldehyde and acetophene spectra in non-polar solvents.
In polar solvents, the n―›π* transition weak curves are covered by the benzene absorption curve.
The n―›π* transition curve is not detected in benzoic acid and its derivatives.

19
Figure 17: Figure 18:
The n―›π* transition curve is expressed clearly in the spectra of aromatic nitrozo compounds.
In the nitrobenzene spectrum, intensity is also low and belongs to the nitro group n―›π* transition.
Figure 19: Figure 20:

20
Figure 21: Figure 22:
The other part of the nitrobenzene specter is strongly altered in comparison to specter of other
mono substituted benzenes. A strong change in specter also is seen for the phenyldiazonium cation.
For nitro and carbonyl compounds, intermolecular charge movements may occur and nitrobenzene
(λmax=252 nm, ε=8660) short wave absorption is considered a curve of charge transition. In case
of accumulation, conjugated multiple bonds in substituent wide intensive absorption curves occur.
Figure 23:
If two substituents are in the benzene ring, the spectrum of the compound is due to the
substituents’ nature and position to each other. The greatest change of spectrum is noticed in those
bisubstituted benzene compounds which contain both electron donor and electron acceptor
substituents, however, spectrum nature is due to their position. Ortho- and meta- isomers have
similar spectra but the para-isomer spectrum differs sharply and as a rule has one intensity
absorption curve.
21
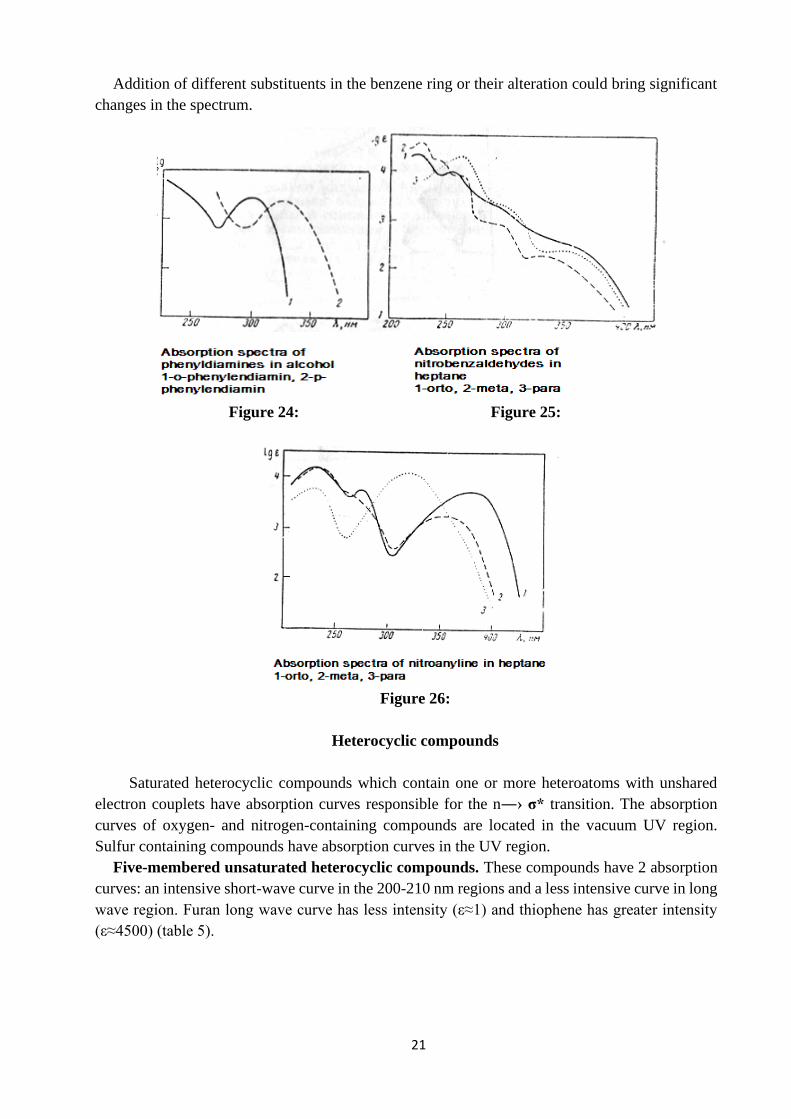
Addition of different substituents in the benzene ring or their alteration could bring significant
changes in the spectrum.
Figure 24: Figure 25:
Figure 26:
Heterocyclic compounds
Saturated heterocyclic compounds which contain one or more heteroatoms with unshared
electron couplets have absorption curves responsible for the n―› σ* transition. The absorption
curves of oxygen- and nitrogen-containing compounds are located in the vacuum UV region.
Sulfur containing compounds have absorption curves in the UV region.
Five-membered unsaturated heterocyclic compounds. These compounds have 2 absorption
curves: an intensive short-wave curve in the 200-210 nm regions and a less intensive curve in long
wave region. Furan long wave curve has less intensity (ε≈1) and thiophene has greater intensity
(ε≈4500) (table 5).

22
Table 5:
Non saturated five-membered heterocyclic compounds’ absorption
Compound λmaxnm εmax λmax nm εmax Solvent
Furan
Thiophen
Pyrol
Imidazol
Pyrazol
1,2,3-Triazol
Thiazol
200
-
210
210
210
210
-
10000
-
15000
5000
5000
3980
-
252
235
350
250
250
-
240
1
4500
300
60
60
-
4000
Hexane
››
››
Alcohol
››
››
››
In polar solvents, furan and pirole long wave curves have vibration structure. Insertion of a
substituent containing an unshared electron couple or multiple bonds leads to a batochrome shift.
Condensated five-membered heterocyclic benzene rings containing compounds also have 2
absorption curves with vibration structure.
Table 6:
Absorption of furan derivatives
Compound λmax, nm εmax λmax, nm εmax Solvent
Furan
O
CHO
O
COOCH3
O
COCH3
O
CH=CHCOOH
200
278
245
275
303
10000
15000
17000
13900
50000
252
-
-
-
-
1
-
-
-
-
Hexane
Water
Alcohol
Water
Hexane
23
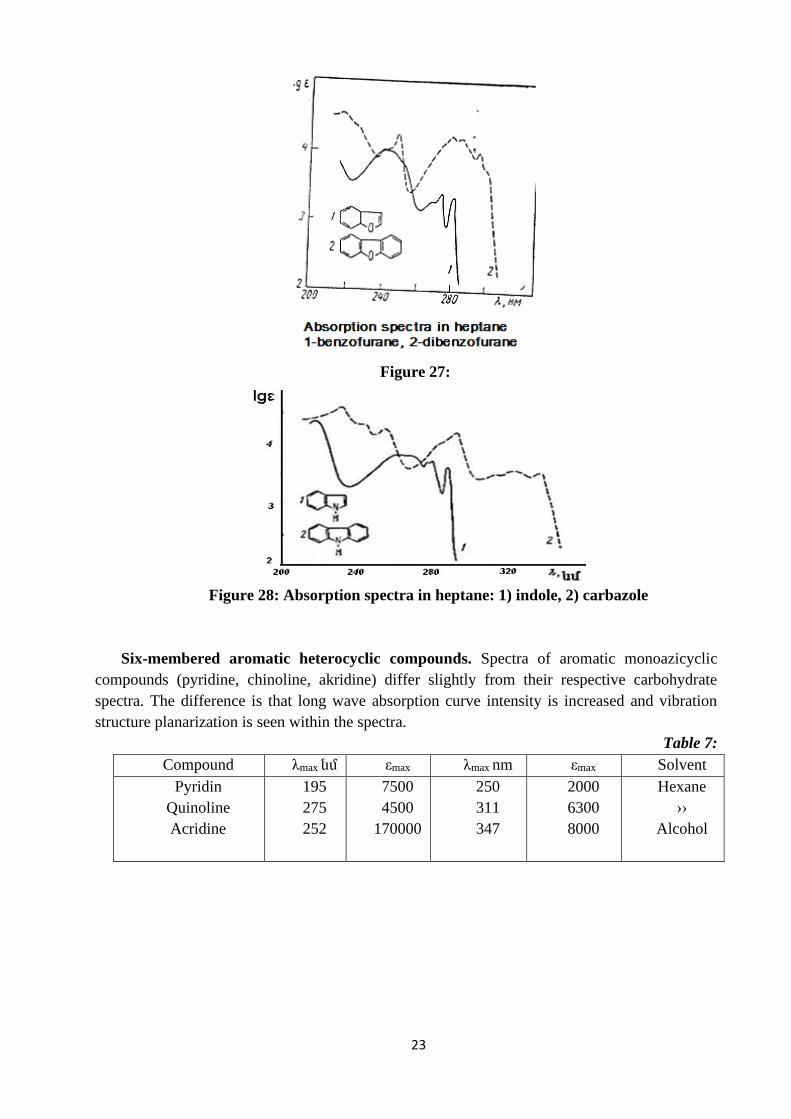
Figure 27:
Figure 28: Absorption spectra in heptane: 1) indole, 2) carbazole
Six-membered aromatic heterocyclic compounds. Spectra of aromatic monoazicyclic
compounds (pyridine, chinoline, akridine) differ slightly from their respective carbohydrate
spectra. The difference is that long wave absorption curve intensity is increased and vibration
structure planarization is seen within the spectra.
Table 7:
Compound λmax նմ εmax λmax nm εmax Solvent
Pyridin
Quinoline
Acridine
195
275
252
7500
4500
170000
250
311
347
2000
6300
8000
Hexane
››
Alcohol

24
Figure 29: Figure 30:
=CH group substitution by =N- in aromatic compounds leads to n―›π* transition. n―›π*
absorption does not occur in the pyridine molecule; it appears like wing in the spectrum. The
addition of nitrogen atoms in the cycle dislocates n―›π* to the long wave side and for diazo cyclic
compounds, it is distinctly different. In the symmetric tetrazine molecule, it is seen in visible
region.
Figure 31: Figure 32:
Electronic spectra usage for the detection and identification of organic compound
structures
Electronic spectra in the 200-800nm interval are used widely for organic compound structure
identification and detection because measurement below 190 nm demands complicated devices.
As it is known, aliphatic and alicyclic carbohydrates and their derivatives, alcohols, ethers and
amines, don’t absorb in the 800-200 nm region. Mono-olefins and mono-acetylenes absorption
also is within this limit. The absorption curve end of the chlorine alkyl and unconjugated carbonic
acids is in the 200-250 nm regions. Thus, these compounds are not studied by common UV
spectroscopy.
25
Electronic spectra are used for those organic compounds which contain conjugated multiple
bonds, non conjugated compounds with heteroatoms, n―›π* transition curves above 200 nm, and
for some halogen derivatives.
In the study of organic compound absorption, we are guided by the absorption molar coefficient
and wave length maximum. Absorption low intensity curves (lgε≤2) are due to carbonyl and
thiocarbonyl groups in aldehydes and ketones, nitro- and nitrozo- groups. Absorption curves in the
250-300 nm lgε=2÷3 region is due to common benzene compounds. Those curves usually have
vibrational structure.
Intensive absorption curves (λmax>200 nm and lgε≥4) characterize compounds with conjugated
bonds. Absorption curve position is due to molecular structure and the chromophore groups’
position to each other. If chromophores are linked directly, then considerable changes are noticed
in the specter in comparison to those compounds with separated chromophores.
If chromophores are linked by one methyl group the interaction between them is decreased
significantly and a change in specter is not great. This is also true when intermolecular interactions
do not occur (for example, keto-enol tautomerization).
If two chromophores are separated from each other by two or more methyl groups, then the
specter appears as an overlap of compounds spectra containing an isolated choromophores specter.
In some cases, if chromophores are divided by saturated groups, the specter is changed. This
may be due to chromophores’ close proximity, causing their π- electrons to interact with each
other. Intermolecular interaction of this type occurs in carbonyl compounds. For example, for
ketone carbonyl group absorption, the curve is dislocated to 305 nm and the intensity is great which
is due to the carbonyl group location near to the double bond.
1. Conjugated and non conjugated compounds easily differ with respect to UV spectra.
2. Multiple systems’ structures in unsaturated carbohydrates and carbonyl compounds are
determined by the absorption curve maximum value.
3. Conjugation breaking connected with steric factors leads to a change in the absorption
specter. For instance, large volume substituent insertion at ortho-position of diphenyl compounds
dislocates molecular co-planarity and the absorption specter becomes similar to the appropriate
substituted benzene specter.
The same is noticed in ortho-substituted anilines where substituents break nitrogen n-
electrons’ interaction with benzene ring π-electrons.
4. UV-spectroscopy could be used for identification of cis- and trans- isomers if they include
conjugated multiple bonds, however, as a rule, the intensity of the π―›π* transition long wave
absorption curve for the trans isomer is always higher than the cis-isomer.
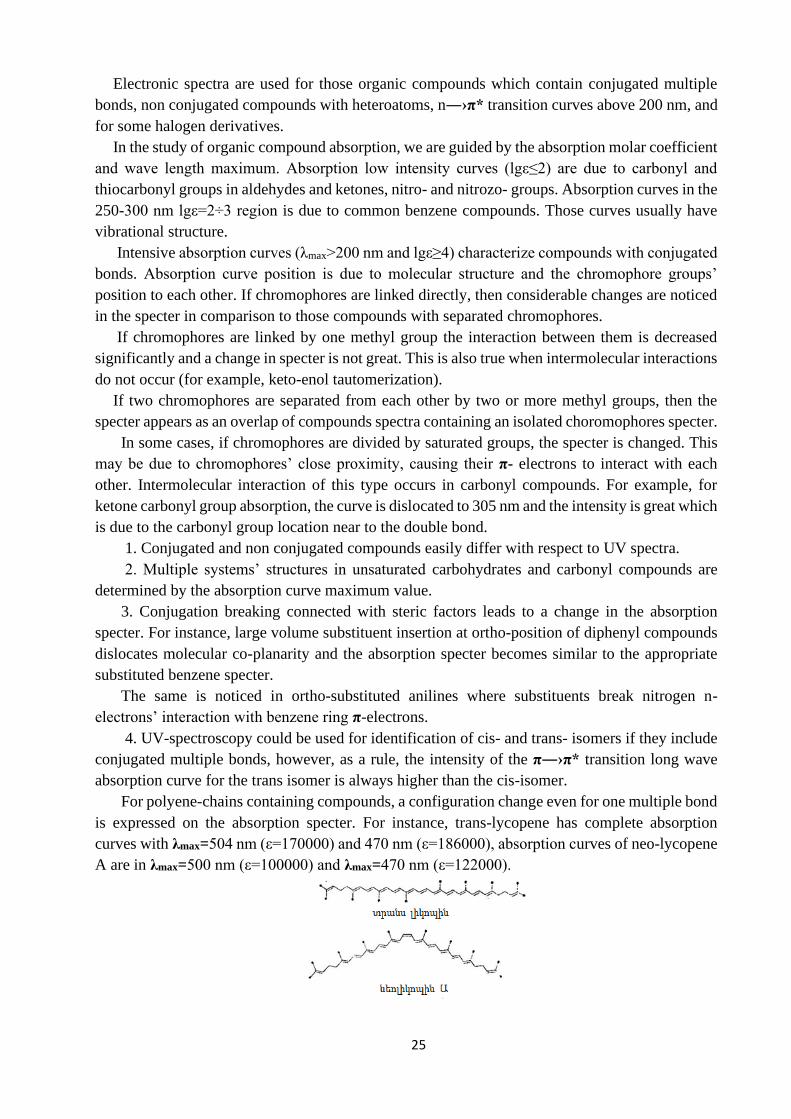
For polyene-chains containing compounds, a configuration change even for one multiple bond
is expressed on the absorption specter. For instance, trans-lycopene has complete absorption
curves with λmax=504 nm (ε=170000) and 470 nm (ε=186000), absorption curves of neo-lycopene
A are in λmax=500 nm (ε=100000) and λmax=470 nm (ε=122000).

26
It is necessary to compare the spectra of tested substance with the substances of known spectra
for studying organic compound’s structure by using absorption spectra.
Since UV spectra are mainly found in conjugated unsaturated bonding systems, the spectra of
substances containing such multiple bonding systems can be used as a model compound. It should
be considered that when comparing the absorbtions of tested substance and model sunstance it is
not enough to use only the wavelength and intensity, the whole range should be compared, and only
in case of the entire absorption layer is matched conjugated system identification can be carried out.
UV spectroscopy method is used for both drug identification and quantitative analysis. In this
case the calculations are performed using Bouguer-Lambert-Beer’s law. The electronic spectra of
drugs are obtained by using very dilute solutions (10-2-10-5M). As solvents those substances can be
used that do not form absorption in the studied region and do not interact with the dissolved
substane. In the UV and visible region spectroscopy, most frequently used solvents are saturated
hydrocarbons, water, alcohols, simple ethers and acids.
It should be considered that the solvents influence on the tested substance absorption specter.
The observed changes are conditioned by the nature and properties of solvent. If the non-polar
compound is dissolved in non-polar solvent, the specter is similar to the gas phase specter. In the
polar solvents, the specter of non-polar compounds is modified by the dipole-induced dipole
interaction. More significant specter changes are observed dissolving the polar substance in polar
solvent. They are conditioned by strong dipole-dipole interactions. In the protonated solvents
hydrogen bonds are also formed, which moreover modify the absorption spectra of substances.
The usage of UV-spectroscopy method in molecular biology and biophysics
UV-spectroscopy can also be used for detecting macromolecules structural parameters (e.g., α-
spiral degree). By UV-spectroscopy, it is possible to control protein molecules interaction and
detect conditions of that process, kinetics.
By UV-spectroscopy method spiral-coil transitions in proteins or denaturation and renaturation
in DNA double chain are detected in case of pH, temperature, ionic forces change. hidden
chromophore inside the protein in case of denaturation (macromolecules conformation
modification), becomes accessible towards solvent, which is accompanied by hyperchromism.
One of the applications of UV-spectroscopy is proteins’ spectroscopic titration. In many studies
of protein structure, there is a need for protons dissociation pK detection of amino acids ionized
terminal groups, as this value indicates amino acids location in proton. It can be often detected by
spectroscopic method, as parallel with dissociation any of the chromophores specter is changed
(e.g., in case of tyrosine). Consider hypothetic protein containing tyrosine. Let's assume that 5
tyrosine residues are contained. If all of these are located on the protein surface and are ionized
increasing the pH, thus the specter responsible for tyrosine residue at high pH conditions will be
close to free tyrosine specter, which is expressed in Figure 12. In other words, D295 (λmax for ionic
forms) dependence from pH is the A absorption layer in the figure. When, on the contrary, three
tyrosine residues are located inside in non-polar section, the obtained absorption layer corresponds
to the B absorbing layer shown in the figure. By the way, in case of very high pH, D295 increase is
observed in the absorption layer. It shows that internal tyrosine residues have become available
for the solvent, that is, the protein has been opened (transformed). If three internal tyrosine residues
were found in the polar region, the absorption layer would be similar to the C absorption layer

27
(figure 12), which shows that these three residues have pK value, which occupying the
intermediate position, is differed from the other two states.
Figure 33: Tyrosine titration absorption layers, which were obtained at λ295 wavelength.
Protein contains 5 tyrosine residues: A-all 5 residues are on the surface; B-two residues are
on the surface, three in non-polar region and therefore are not titrated; C-three internal
residues are in the polar region and are available for the solvent.

28
LUMINESCENCE METHODS OF DRUGS ANALYSIS
Many organic and inorganic substances are able to automatically emit light under influences of
different factors. This process is called luminescence. According to the character of luminescence
formation reason, the following types of luminescence are differentiated, which are represented in
the table 8.
Table 8:
Types of luminescence
Luminescence type Excitation mechanism Example
Radioluminescence
stimulation by gamma-radiation
of high-energy particles or
radioactive processes
self-lighting numbers in the
clock display
Electroluminescence stimulation by electric field lighting of gas discharged
lamps
Chemiluminescence stimulation by chemical reactions
energy
white phosphorus oxidation in
the air
Bioluminescence biochemical luminescent fishes, bacteria
Triboluminescence stimulation by mechanical
influence crushing of sugar crystals
Crystal luminescence crystallization arsenic oxides
Thermoluminescence stimulation by radiation (heating) Lamps, luminophores of TV
Photoluminescence light absorption in UV/visible or
IR-region
fluorescence and
phosphorescence
Two types of luminescence have great importance in the chemical analysis:
chemiluminescence and photoluminescence.
Chemiluminescence is the light radiation in result of chemical reaction (often oxidation). The
molecule is excited, that is, absorbs energy. When this energy is released, the molecule either itself
emits light or transmits its energy to another molecule, which then emits light. Synthetic chemicals
have the chemiluminescence property. Typical luminogens are, for example, acridine ether,
luminol, lofin, etc.
Photoluminescence is the emitted light after a certain time of absorbed electromagnetic
radiation by atom or molecule. The emitted light is a result of transition states energies difference
(from excited singlet state to the stable electronic level).
Bioluminescence is a special type of chemiluminescence that occurs in living organisms, such
as bacteria. In this case enzymes (eg, luciferases) and substrates (eg, luciferins) are essential.
Luminescence also can be classified according to light back emitting presence. It can be stopped
immediately after stopping excitation; this process is called fluorescence; and it can be continued
during some time after stimulation stopping; this process is called phosphorescence. The average
duration of fluorescence is 10-8sec; phosphorescence is 10-3sec. In the latter case the average length
of duration can be extended from several seconds to several hours. This difference in durations has
a simple physical explanation. In the case of fluorescence there is a single-singlet transition and in
the case of phosphorescence singlet-triplet transition exists. In case when from the singlet state

29
fluorescence reversion is conducted very easily and fast, the reversion from the triplet state to the
ground state is difficult because in this case spin change should be carried out again.
In the chemical analysis usually fluorescence is used, that is why method is called fluorimetry.
Fluorescence methods of analysis are based on substance light emitting intensity detection after
processing by UV/visible radiations (photoluminescence), wavelength is 200-800nm.
Fluorimetry is an emission spectroscopy method that is used both in identity and quantitative
analysis.
The advantages of this method are:
● provides information on the surrounding molecular environment,
● can be used to control dynamic processes during nanoseconds such as protein motion or their
complexes changes study,
● can be used to investigate the binding processes of drugs with proteins and receptors,
● it is highly sensitive method and can be used in subnanomoles quantities, up to unique
molecules detection.
This method is applied in a limited number of compounds, is conditioned by UV absorbed
specter and is very sensitive toward temperature changes.
Theoretical bases of fluorescence
Usually exciting compound returns the absorbed energy excess by non-radiation deactivation
way. In this case, the excitation energy is transformed into the kinetic or vibrational energy (heat
emission). It is supposed also that in case of non-fluorescence substances deactivation is carried
out due to pre-dissociation processes, which is possible because the excitation energy is enough
for the destruction of corresponding chemical bond. On the other hand, if the structure of the
compound does not allow for such processes performance (e.g. substances with rigid structure),
some of the energy excess may be released in the radiation form. Thus, photoluminescence is
possible only in case of those organic compounds which contain π-bond electrons. This is
explained by the fact that, on the one hand, there is small amount of energy required for such
electrons excitation, on the other hand, these compounds have such a strong system of bond which
limits the possibility of non-radiation deactivation. Some metals ions (uranium), many complexes
and organic compounds (mainly aromatic) possess fluorescence ability. Almost all the aromatic
compounds (in the presence of appropriate substituents) are able to cause fluorescence. Thus,
flourofor /luminescence/ groups are aromatic rings, conjugated systems (with coupled double
bonds), electron-donor groups connected to aromatic ring, but electron-acceptor groups, contrary,
decrease or completely eliminate luminescence.
At the room temperature majority of that molecules are in lowest vibrational level of the basic
state. In result of quant’s (h0) absorption substance molecules are excited passing to the excited
B state (first or second excited state) and after some time returns to the ground A state losing
energy excess in quant form. However, some part of the energy is radiated in thermal radiation hT
quant form, which leads to the molecule certain stabilization in lowest excited C level, then h
quant is radiated in the visible or UV region of specter, which is conditioned by passing to the
ground state.

30
Figure 34: Fluorescence formation mechanism.
Fluorescence radiation frequency is always lower (longer wavelength, red or batochrome shift)
than exciting radiation frequency because of thermal radiation. This principle is called Stock’s law.
As a result of excitation molecule can reach to any vibrational level which are characterized as
subtypes of individual excitation states. If the molecule absorbing energy, reaches to upper
vibrational level of any excited state, then it very quickly loses vibrational energy excess due to
collisions and again turns to the lowest vibrational level of excited state (Figure 35). Thus, in
molecules, additional internal transitions are carried out from the upper vibrational levels to the
lowest vibrational level of first excitation state close to energy. As a result, however, the molecule
does not reach yet to the vibrational level of the ground state. These transitions are conducted
without radiation (non-radiation deactivation), the duration is 10-12. Then, the molecule irradiates
its energy excess in the form of light, passing from the first excited state to vibrational levels of
ground state.
Figure 35. Energy state of light absortion and fluorescence
In case of atoms excitation, such deviation is not observed (atomofluorescence spectroscopy),
as vibrational levels are absent in atoms.
Fluorescence main characteristics are quantum and energetic yields, and fluorescence
specter as well. Quantum yield is the number of molecules radiated quant’s (Nr) ratio to the
number of absorbed quants (Na). Energetic yield is the ratio of radiated Er and absorbed Ea energies.

31
Quantum Bq and energetic Be yields depend on radiation and absorption light frequency and wave
length.
Bq=Nr/Na; Be=Er/Ea; Be=υr/υa Bq=λa/λr K
Thus, fluorescence generally depends on exciting radiation wave length, but fluorescence
specter doesn’t depend on exciting radiation wave length and is a substance characteristic.
Substance fluorescence and absorption spectra are connected with each other by some laws.
First is Stock’s law, according to which fluorescence spectrum is in longer wave length
region, than absorption spectrum λrλa.
Second is the mirror symmetry law, according to which absorption and fluorescence spectra
built in frequency scale are symmetric to each other (Figure 36).
Since energy intervals between vibrational levels are energy intervals of lower electronic
levels, it leads to the formation of compound’s radiation absorption and emission symmetric
spectra. The transition from the ground state lowest vibrational level to the lowest vibrational level
of first excited state, the 0-0 transition, is the same from the energy point of view in case of both
absorption and emission. Therefore, both spectra, absorbing and fluorescence, have 0-0 transition
curve. In case of all other transitions, absorption needs greater energy than any transition at
fluorescence radiation. The emission layers are dispersed to the lower energy level toward
absorption layers of the mirror-symmetric 0-0 (batochrom shift) transition (Figure 36).
Figure 36. Excitation and emission mirror spectrum
Thus, all the absorption and fluorescence spectra theoretically must be covered in the
wavelength that corresponds to the 0-0 transition. Actually, 0-0 transitions are rarely match in case
of absorption and emission. This is explained by the fact that in the range of wavelengts where the
absorption and emission spectra are overlapped, a partial reabsorption of emitted light is carried
out, which is conditioned by absorbing substance concentration and layer thickness.
In the first excited state, the absorption of energy affects on the molecule's shape in small
amount. This means that the vibration levels distribution are similar in the main and first excited
states. Therefore, the energetic ranges between the emission radiation layers are similar to the
ranges of absorption layers. Due to this the fluorescence specter is often a mirror image of the
absorption specter.
Since fluorescence radiation is always conditioned by the transitions from the lowest vibrational
level of the first excited state, so the external form of the radiation specter is not conditioned by
excitation light wavelength.
As molecules can pass to the different vibrational levels of stable (not excited) state by emitting,
so the released photons will have different energies and hence different frequencies. Thus, by
examining different frequencies of the emitted light, the structure of different vibration levels can
be detected.

32
Substance emission specter is obtained by measuring light emissions in different frequency
conditions in case of absorbing light certain constant wave.
Excitation specter is detected by measuring various emission spectra in different wave length
conditions. Excitation specter depends on:
• -bonds conjugation degree; electrons quantity, which participate in the conjugation.
Double bonds addition decreases excitation radiation energy.
• Aromatic rings quantity. In case of ring addition radiation wave length increases and energy
decreases.
Fluorescence methods usage in drug analysis
Nowdays fluorescence methods are widely used in biochemistry, biophysics, cellular and
molecular biology as well as in clinical chemistry for diagnostic purposes. Fluorimetry is
remarkable with high sensitivity (fluororescence photometry may be up to four times sensitive to
absorbtion photometry), and with a large range of linearity, it is performed without substance
degradation and a large amount of tested substance is not necessary for measurement.
Fluorescence analysis methods are carried out by direct and indirect ways. In direct method
fluorescence intensity is measured directly. In indirect fluorescence analysis fluorescence serves
as an indicator indicating substance detection end. Method of direct fluorescence analysis is based
on Vavilov’s law. According to this law solution’s fluorescence intensity is in linear correlation
with concentration in low concentrations region (10-7-10-4 mol/dm3).
If = КС.
Increasing the solution’s concentration, the linear correlation is broken in the result of
fluorescence quenching or fluorescence intensity decrease.
Here, error percent of analytical detection is high, and usually measurements are not
conducted in concentric concentrations range.
Fluorescence intensity is changed depending on:
●substance concentration,
●quantum and energetic yields,
●exciting radiation wavelength,
●solution temperature,
●foreign mixtures presence in solution,
●solution pH value,
●solution nature.
Under these factors either fluorescence enhancement or fluorescence quenching or decrease
can be carred out. The latter is performed because the radiating energy is transferred to other
molecules in solution and fluorescence is not caused. Temperature quenching occurs when the
temperature increases. Concentration quenching is performed in case of concentric solutions.
Foreign mixtures presence in solution also can lead to fluorescence quenching. Heavy metal
ions, halogen ions, oxygen, as well as large number of unsaturated and aromatic compounds are
strongly quenching substances and interfere analysis. However, this phenomenon is also used in
substances analysis, in this case, primarily, pyrocatechine, hydroquinone and other phenols as well
as aniline, nitrobenzene and other similar compounds are used as quenching substances.
Most of the luminescence substances have typical pH range, in which fluorescence occurs.

33
By fluorescence method those substances can be detected, which:
• have their own fluorescence (vitamin B1 detection),
• form fluorescent compounds with different reagents (Al3+ detection by its complex with
salicylic-o-aminophenol),
• don’t have own fluorescence, but interacting with other fluorescence substances lead to
fluorescence quench (Zn2+ is a fluorescence quench for rodamine (C)-thiocianate).
As a reagent, the substance can be used for the non-fluorescence cation, which fluorescence
specter is changed as a result of interaction with tested substance. Zn compounds fluorescence blue
with salicylicdehyde semicarbazone, when the reagent itself has yellowish-green fluorescence.
One of the varieties of fluorescence method is extraction-fluorescence analysis, in result of
which the formed compound is extracted from the water solution by an organic solvent, and then
fluorescence intensity of extract is measured. By this method, Al content is detected by obtaining
its oxyquinolate, which is then extracted with chloroform. Fluorescence intensity of chloroform
extract is measured by fluorimeter.
As an indirect fluorescence method titration with fluorescent indicators is widely used.
As a result of interaction with corresponding reagents, even non-fluorescence substances can
turn into light-emitting products which can be detected by fluorimetric method. For example,
fluorescent indicators are used for metals detection. These indicators form complexes with metals
and change fluorescence properties.
Oxido-reductive fluorescent indicators change fluorescence intensity or color depending on
system’s oxido-reductive potential. For example, during titration of cerium sulfate by Fe3+ in
presence of siloxane indicator (Si6H6O3)n solution’s fluorescence disappears in case of titrant’s
small amount of excess.
Fluorescence indicators are widely used in acid-base titration methods. Acid-base fluorescent
indicators possess different fluorescence in ionized and non-ionized forms and are characterized
by pH certain interval of fluorescence color transition. Fluorescence indicators compared with
usual indicators have color transition narrower interval, which increases analysis precision.
Fluorescent indicators can be used for titration of turbid or dark-colored environments. Titration
process is carried out in darkness by luminescence lamp brightening titrating solution, where
indicator is added.
Table 9:
Fluorescence indicators
Name Structure pH range Color of fluorescence
anthranilic acid COOH
NH2
1,5-3,0 colorless-sky blue
salicylic acid OH
COOH
2,5-4,0 colorless-blue
acridine CH
N 5,2-6,6 green-violet
luminol
NH2
CO
CO
NH
NH 6,0-7,0 colorless-blue
In chemistry and pharmacy fluorescence method is used for analysis of metals spots, organic
(aromatic) compounds, vitamin D, B1. By this method by means of luminescence lamp quality of
food, water, and presence of pathogen organisms can be detected as well.

34
Devices used in fluorimetry
The principle of fluorimetry is that the substance is excited by the beam released from the light
source, after which the fluorescence radiation intensity is measured as a function of exciting beam
wavelength and the emission. In contrast to absorbtion spectroscopy, in this method two
wavelengths: excited and emitted are always considered.
Fluorescence measurement is conducted by photoelectrofluorimeter (figure 37), which consists
of:
• exciting light source (mercury-quartz or xenon lamp),
• light filter,
• cuvette, in which tested solution is filled,
• fluorescent radiation receiver (photoelement),
• amplifier,
• measuring device.
Figure 37. Structure of fluorimeter
Fluorescence radiation released in all directions is recorded at 900 degrees over the falling beam.
The distance between receiver (detector) and cuvette should be as small as possible.
For conducting fluorimetric analysis calibration graph is used. Standard solutions
fluorescence intensity is detected for the calibration graph building. Comparison of analyte and
standard solutions fluorescence intensities is used as well.

35
INFRARED (IR)-SPECTROSCOPY
Infrared spectroscopy usage in pharmaceutical analysis
The phenomenon of substances interaction with infrared (IR) radiation has been revealed by U.
Ebn and I. Festing in 1861. Currently, infrared spectroscopy is one of the main methods for
studying various chemical substances, including drugs.
The method was incorporated in SPh X in 1968, where it was recommended as a means of
quality control for 3 pharmaceuticals (fluorotane, oxalicin and methicillin sodium salts), and data
on certain aspects of IR-spectroscopy were included in the pharmacopoeia "physicochemical,
chemical and biological studies general methods" section.
After SPh X edition, the number of drugs for which study this method was rcommended has
significantly increased, which can be explained by annually published pharmacopeia articles.
The IR-spectroscopy is included in all modern pharmacopeias. For example, international
pharmacopeia (Geneva, 1990) offers this method for analyzing half of the drugs included therein.
Taking into account the informative value of IR specters (informative method), for a long time this
method is one of the most important methods for analyzing substances. IR-spectra decoding is
practically much simpler and faster (especially by computerized method) than theoretical analysis
of corresponding UV and visible spectra. The existence of many patterns and rules make it possible
to make quite reliable predictions about the molecular structure of the investigated substance. IR-
spectra can be obtained not only for individual substances, but also for a number of ready-made
drugs. It is conditioned that the excipients included in the composition of a medicinal product (e.g.,
tablets) should have no effect on the specter of the main (effecting) substance. This condition is
usually possible if the percentage of excipients is not too high, usually less than 60-70%. IR-
spectroscopy is a compulsory method for standard substances quality control, additionally, it is
currently included in pharmacopeial article (PhA) of many drugs. The method can be used to prove
the absence of the drug substances derivatives (the same sequence) of similar structure (mixtures
detection) in the pharmacopeia analysis. For example, in the PhA of estocin belonging to aryl
aliphatic acids ethers group it is necessary that in the IR-specter which is obtained in the 3300-
3500 cm-1 region in vaseline oil should be absent absorption layer typical to free hydroxyl group
(in contrast to aminazine and metacin). In mixtures extra absorption layers appearance, shapes of
individual absorption layers, absorption layers intensity and sharpness are checked.
Thus, IR-spectroscopy is used in pharmacy:
● to detect the structure of new substances that have been obtained through chemical synthesis
or from natural objects (animal or plant raw materials, microorganisms products), while examining
metabolites' structures,
● to detect drugs identity,
● to detect drugs purity,
● for drugs quantitative analysis,
● to control technological process of drugs production.

36
Theoretical bases of IR-spectroscopy
IR-spectroscopy is an investigation method for substances which is based on absorption of IR-
radiation, in result of which promotes vibrational and rotational vibrations in molecules.
In most of the molecules, there is a change in the atomic vibrational energetic states, so the IR-
spectra are called vibrational or molecular.
Thus, the term “vibrational spectroscopy” is used to describe infrared and Raman (Combination
scattering) spectroscopic methods. The physical nature of these spectra is different. IR-absorption
spectra are conditioned by transitions between molecul’s vibrational levels, and combination
scattering spectra։ by change of molecul’s polarization in result of vibration. Raman and infrared
spectroscopic methods give similar information and each method can be used to accomplish the
other method.
It is known, that atoms in molecules are never in ground state, but there are vibrated around
somewhat medium position, as a result atoms arrangement to each other is periodically changed.
IR-rays increase the vibrations because of which some of the radiation energy is transmitted to the
molecule, resulting in IR-rays intensity decrease arising from substance. Intensity loss ΔJ=J0-J is
the function from wavelength like in electron spectra.
Vibrational spectroscopy
Types of vibration
Thus, in 2.5 to 50 mkm wavelengths region, in molecule atoms vibrational and general molecule
rotational motions are excited. Spectra recorded in this region give information about substance’s
molecular structure. As we know, the infrared region is the largest part of the electromagnetic
specter, wavelength of which varies from 1mkm-1mm. It can be divided into three main regions:
Near-infrared (overtone region) 0.8-2.5 μm (12 500-4000 cm-1),
Middle-infrared (vibration-rotation region) 2.5-50 μm (4000-200 cm"1), the energy required
to induce the vibrations of atoms in the molecules generally corresponds to a wavelength energy
of 1-15 cm or a wavelength of 200 to 4000 cm -1,
Far-infrared (rotation region) 50-1000 μm (200-10 cm'1) The near and far words describe
being close to the visible region.
The main region of interest for analytical purposes is from 2.5 to 25 mkm (i. e. wavenumber
4000 to 400 cm-1 Middle-infrared region). Normal optical materials such as glass or quartz absorb
strongly in the infrared, so instruments for carrying our measurements in this region differ from
those used for the electronic (UV/visible) region. As mentioned Infrared spectra originate from the
different modes of vibration and rotation of a molecule. At wavelengths below 25 pm the radiation
has sufficient energy to cause changes in the vibrational energy levels of the molecule, and these
are accompanied by changes in the rotational energy levels. The pure rotational spectra of
molecules occur in the far-infrared region.
Atoms inside the molecule are motional due to their atomic bonds. They vibrate by certain
(resonance) frequency, which is conditioned by atomic mass and bond strength. Because of atoms’
small sizes their resonance frequency is about 1013 cm -1, and the frequency of the IR-rays is
1013cm-1, comparable to that value, so it is possible to transfer energy between the molecule and
the IR radiation. Since molecular vibrational levels are quantified, the result is that the transition
energy between them and, hence, the vibration frequencies can have only certain definite values.

37
Absorbing the light quantum, the molecule can reach to higher vibrational level, usually from the
ground vibrational state to exited state.
Infrared radiation absorption causes vibrations that are conditioned by the change of the bonds
length or angle between the atoms. It means that, depending on the absorbed radiation frequency
some bonds start to periodically stretch and shorten or the angle between the bonds are changed.
Thus, the main types of vibration are valence and deformation vibrations.
The vibrations that lead to change in length of the bonds between joined atoms and are not
accompanied by the deviation of the internuclear axis are called valence. In other words, the
valence vibrations are called the atoms’ nuclei vibrations along the bond. This type of vibrations
is mentioned with ν (ν C = C, ν C = O).
Two balls system joined by spring can serve as anapproximate schematic model of valence
vibration (the balls replace the atoms and spring to the chemical bond). In the case of pulling or
pressing the spring, the balls begin to vibrate around the position of balance performing harmonic
vibrations, which vibration frequency is expressed by Hook’s equation:
where։
ν- is vibration frequency;
c- is light speed;
F-is strength constant or rigidity that characterizes bond strength or the force that returns the
balls to the balance position.
mr- is the atoms’ given mass that is calculated by the following formula:
where m1 and m2 are separate atoms’ masses.
The given mass is also mentioned with μ and can be detected by the following formula։
μ=A1A2/1000L(A1+A2),
where A1 and A2 are atoms’ relative atomic masses,
L is Avogadro's constant (NA).
Usually there is an agreement between the calculated and tested values of the given wave
number. As an example we can discuss C-O bond in methanol, in which case F = 5x10² N/m, μ =
6,85mu (same atomic mass constant = 1,66x10⁻²⁷ kg) and light speed c=2,998x1010 cm/s.
Investigated C-O bond specter in methanol will be 1034 cm-1 detecting by the formula. However,
this simple calculation does not consider any possible effects from other atoms in the molecule.
The frequencies of valence vibrations are detected by atomic mass and bond strength (energy).
The larger is the mass, the smaller is the frequency, for example:
The stronger is the bond and larger rigidity, the higher is vibration frequency։
Valence vibrations can be symmetric (νs) if two bonds simultaneously extend or shorten, and
the pair of atoms simultaneously attract each other or disattract, and asymmetric, if one of the
bonds get shorter, the other elongates (νas), in that case different atoms pairs attraction and
disattraction is not performed simultaneously.
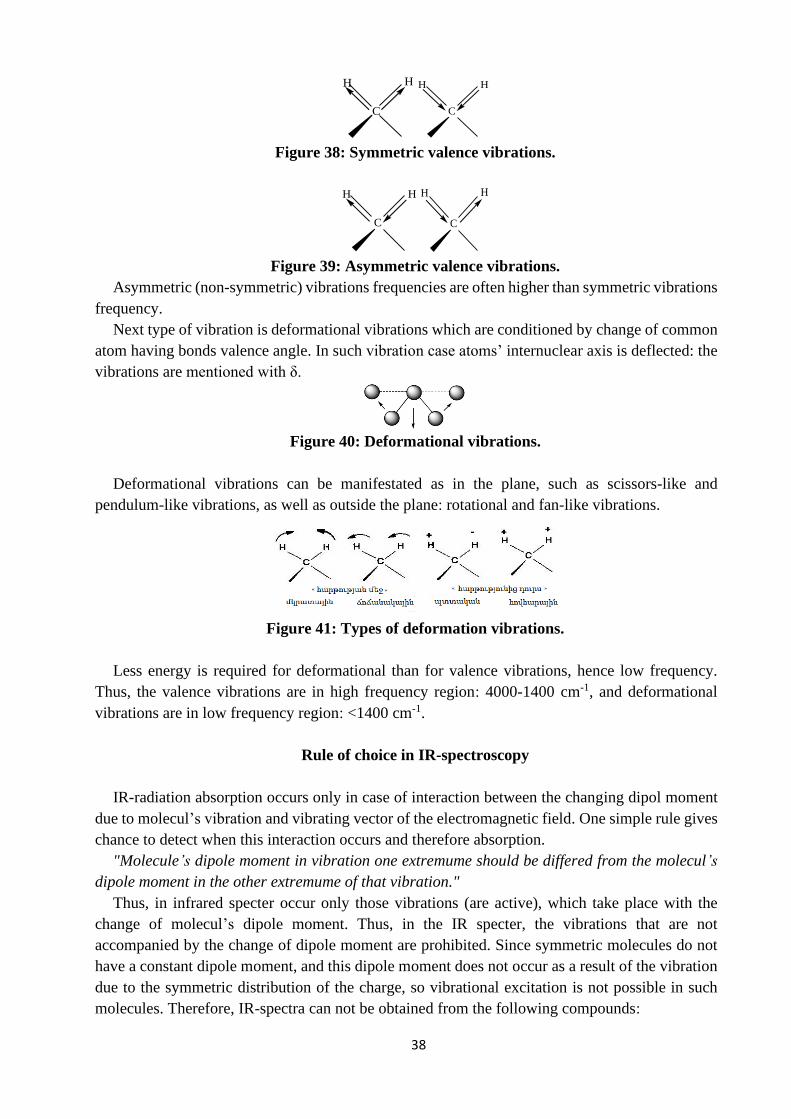
38
C
HH
C
H H
Figure 38: Symmetric valence vibrations.
C
H H
C
H H
Figure 39: Asymmetric valence vibrations.
Asymmetric (non-symmetric) vibrations frequencies are often higher than symmetric vibrations
frequency.
Next type of vibration is deformational vibrations which are conditioned by change of common
atom having bonds valence angle. In such vibration case atoms’ internuclear axis is deflected: the
vibrations are mentioned with δ.
Figure 40: Deformational vibrations.
Deformational vibrations can be manifestated as in the plane, such as scissors-like and
pendulum-like vibrations, as well as outside the plane։ rotational and fan-like vibrations.
Figure 41: Types of deformation vibrations.
Less energy is required for deformational than for valence vibrations, hence low frequency.
Thus, the valence vibrations are in high frequency region։ 4000-1400 cm-1, and deformational
vibrations are in low frequency region։ <1400 cm-1.
Rule of choice in IR-spectroscopy
IR-radiation absorption occurs only in case of interaction between the changing dipol moment
due to molecul’s vibration and vibrating vector of the electromagnetic field. One simple rule gives
chance to detect when this interaction occurs and therefore absorption.
"Molecule’s dipole moment in vibration one extremume should be differed from the molecul’s
dipole moment in the other extremume of that vibration."
Thus, in infrared specter occur only those vibrations (are active), which take place with the
change of molecul’s dipole moment. Thus, in the IR specter, the vibrations that are not
accompanied by the change of dipole moment are prohibited. Since symmetric molecules do not
have a constant dipole moment, and this dipole moment does not occur as a result of the vibration
due to the symmetric distribution of the charge, so vibrational excitation is not possible in such
molecules. Therefore, IR-spectra can not be obtained from the following compounds։
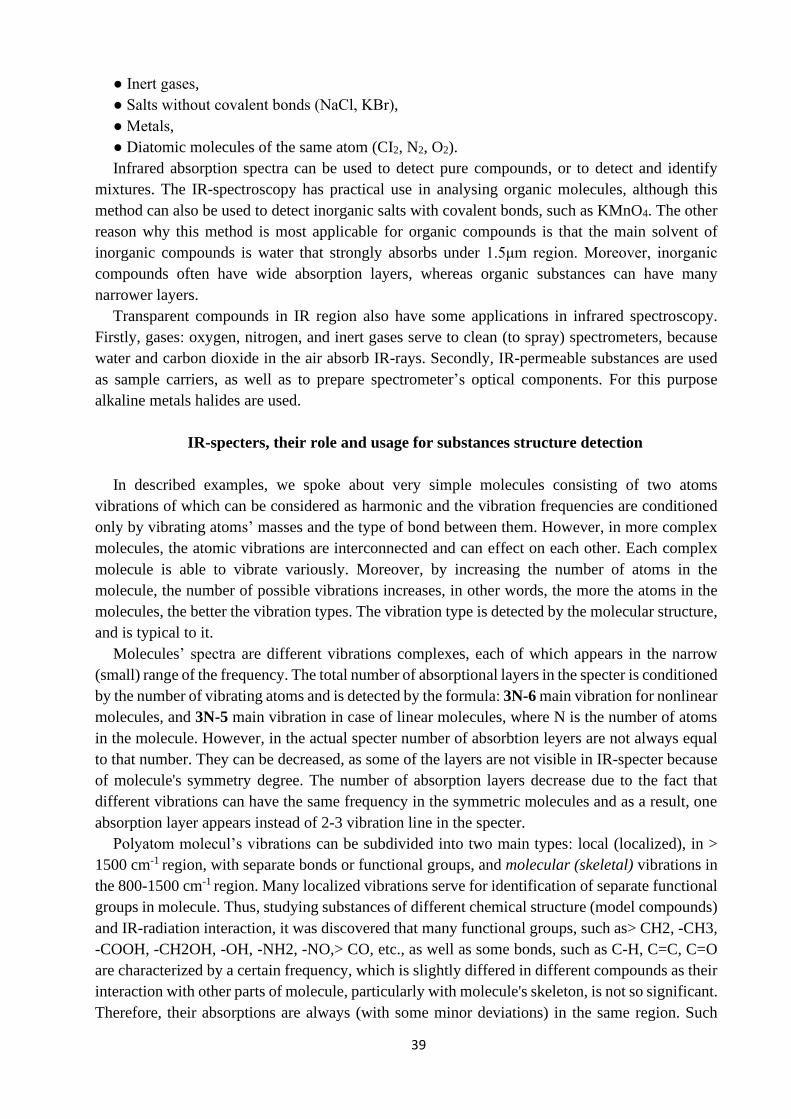
39
● Inert gases,
● Salts without covalent bonds (NaCl, KBr),
● Metals,
● Diatomic molecules of the same atom (CI2, N2, O2).
Infrared absorption spectra can be used to detect pure compounds, or to detect and identify
mixtures. The IR-spectroscopy has practical use in analysing organic molecules, although this
method can also be used to detect inorganic salts with covalent bonds, such as KMnO4. The other
reason why this method is most applicable for organic compounds is that the main solvent of
inorganic compounds is water that strongly absorbs under 1.5μm region. Moreover, inorganic
compounds often have wide absorption layers, whereas organic substances can have many
narrower layers.
Transparent compounds in IR region also have some applications in infrared spectroscopy.
Firstly, gases։ oxygen, nitrogen, and inert gases serve to clean (to spray) spectrometers, because
water and carbon dioxide in the air absorb IR-rays. Secondly, IR-permeable substances are used
as sample carriers, as well as to prepare spectrometer’s optical components. For this purpose
alkaline metals halides are used.
IR-specters, their role and usage for substances structure detection
In described examples, we spoke about very simple molecules consisting of two atoms
vibrations of which can be considered as harmonic and the vibration frequencies are conditioned
only by vibrating atoms’ masses and the type of bond between them. However, in more complex
molecules, the atomic vibrations are interconnected and can effect on each other. Each complex
molecule is able to vibrate variously. Moreover, by increasing the number of atoms in the
molecule, the number of possible vibrations increases, in other words, the more the atoms in the
molecules, the better the vibration types. The vibration type is detected by the molecular structure,
and is typical to it.
Molecules’ spectra are different vibrations complexes, each of which appears in the narrow
(small) range of the frequency. The total number of absorptional layers in the specter is conditioned
by the number of vibrating atoms and is detected by the formula։ 3N-6 main vibration for nonlinear
molecules, and 3N-5 main vibration in case of linear molecules, where N is the number of atoms
in the molecule. However, in the actual specter number of absorbtion leyers are not always equal
to that number. They can be decreased, as some of the layers are not visible in IR-specter because
of molecule's symmetry degree. The number of absorption layers decrease due to the fact that
different vibrations can have the same frequency in the symmetric molecules and as a result, one
absorption layer appears instead of 2-3 vibration line in the specter.
Polyatom molecul’s vibrations can be subdivided into two main types։ local (localized), in >
1500 cm-1 region, with separate bonds or functional groups, and molecular (skeletal) vibrations in
the 800-1500 cm-1 region. Many localized vibrations serve for identification of separate functional
groups in molecule. Thus, studying substances of different chemical structure (model compounds)
and IR-radiation interaction, it was discovered that many functional groups, such as> CH2, -CH3,
-COOH, -CH2OH, -OH, -NH2, -NO,> CO, etc., as well as some bonds, such as C-H, C=C, C=O
are characterized by a certain frequency, which is slightly differed in different compounds as their
interaction with other parts of molecule, particularly with molecule's skeleton, is not so significant.
Therefore, their absorptions are always (with some minor deviations) in the same region. Such

40
localized frequencies are called characteristic or group frequency. That is why the IR-
spectroscopy is mainly used to detect functional groups in the molecule.
Group frequencies are mentioned with ν and for the basic classes of organic compounds are
shown in the tables (Apendix 1). This gives possibility to detect compound’s structural units by
using tabular data. These vibrational forms are useful for the confirmation of compound structure,
particularly for estimating the structure of unknown substance. From the position of the spectral
lines towards each other, it is possible to conclude about the functional groups configuration.
Molecule’s skeleton vibrations absorption specter is relatively in low energy region։ <1500 cm-
1 (wavelength>6.7mkm). These spectral lines are often overlapped and makes localized vibrations
identification difficult below 1500cm-1. In this region, there are often appear non main vibrations։
overtones and combined lines.
In molecule like any kind of energy state, the vibrational energy of atoms is also quanted and
vibrational quantum numbers are only expressed by complete numbers։ ν=0, 1, 2, 3 .... In contrast
with excitation energy of rotational motion, the excitation energy of atomic vibrations usually
significantly exceeds molecules’ thermal energy at room temperature. It means that practically in
normal conditions atoms vibrations by termal method generally are not excited. That is, all the
atoms are of their lowest vibrational energy level, and observed IR-radiation absorption is fulfilled
due to transition of higher energetic level than ν=0 level. From this level, theoretically, transitions
to all upraised levels are possible, but parallel to the ν increase the possibility of these transitions,
and consequently the intensity drasticly decreases. According to initial and final states of
vibrational quantum numbers, there are the following types of transitions։
ν= 0 -ν= 1՝ main vibration,
ν= 0 -ν= 2՝ first overtone,
ν= 0 -ν= 3՝ second overtone.
As it is noticed, the most intensive absorption corresponds to transition from ν=0 to ν=1, and it
is mentioned as main vibration. The overtones are significantly less intensive, and according to
their larger energy, are in short-wave region in the specter compared to the main vibration. For the
first overtone excitation, approximately double energy of the main vibration is required and for the
second overtone excitation - triple energy.
Combined lines (component frequencies) appear as a result of two or more vibrations overlap.
Sometimes, very high intensity lines appear in spectra, which are formed as a result of Fermi
resonance. These absorption layers of resonance interaction occur when the overtone of the given
frequency and any other main frequency have the same values, that is, they coinside. In certain
cases, these component frequencies are used for diagnostic purposes, but generally they don’t have
practical use.
Thus, the IR-specter of compound consists of two regions։
● Higher than 1500cm-1 region, where localized absorption lines of functional groups are
available,
● Lower than 1500cm-1 region, where many absorption lines characterize the whole molecule.
This region is known as "fingerprint" for obvious reasons, and it is used for substance identity by
comparing with the reference.
Thus, for detection of pure compound, the specter of unknown substance is compared with other
limited number of possible spectra. When a coincidence is observed between the spectra, the
detection ends. This process is particularly valued to detect structural isomers (but not optical
isomers).
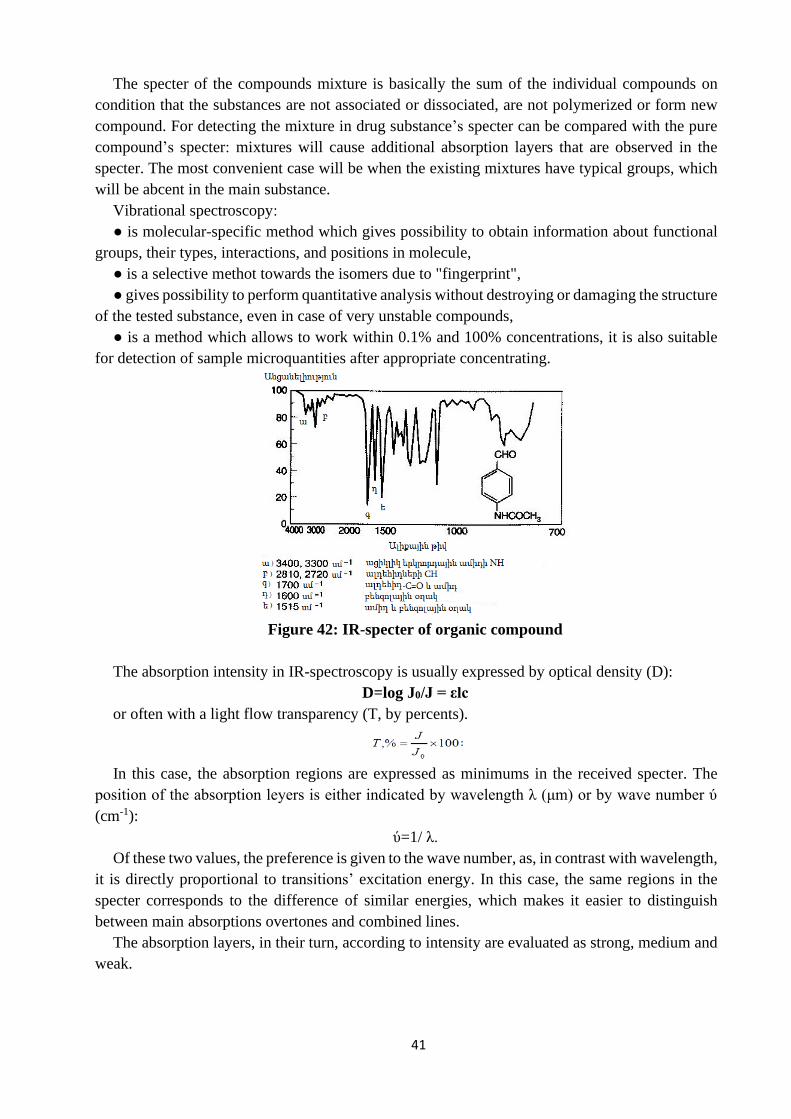
41
The specter of the compounds mixture is basically the sum of the individual compounds on
condition that the substances are not associated or dissociated, are not polymerized or form new
compound. For detecting the mixture in drug substance’s specter can be compared with the pure
compound’s specter։ mixtures will cause additional absorption layers that are observed in the
specter. The most convenient case will be when the existing mixtures have typical groups, which
will be abcent in the main substance.
Vibrational spectroscopy։
● is molecular-specific method which gives possibility to obtain information about functional
groups, their types, interactions, and positions in molecule,
● is a selective methot towards the isomers due to "fingerprint",
● gives possibility to perform quantitative analysis without destroying or damaging the structure
of the tested substance, even in case of very unstable compounds,
● is a method which allows to work within 0.1% and 100% concentrations, it is also suitable
for detection of sample microquantities after appropriate concentrating.
Figure 42: IR-specter of organic compound
The absorption intensity in IR-spectroscopy is usually expressed by optical density (D):
D=log J0/J = εlc
or often with a light flow transparency (T, by percents).
In this case, the absorption regions are expressed as minimums in the received specter. The
position of the absorption leyers is either indicated by wavelength λ (μm) or by wave number ύ
(cm-1):
ύ=1/ λ.
Of these two values, the preference is given to the wave number, as, in contrast with wavelength,
it is directly proportional to transitions’ excitation energy. In this case, the same regions in the
specter corresponds to the difference of similar energies, which makes it easier to distinguish
between main absorptions overtones and combined lines.
The absorption layers, in their turn, according to intensity are evaluated as strong, medium and
weak.

42
Quantitative analysis in IR-spectroscopy. Beer’s law
Thus, infrared spectra record using either absorption (D) or transparency (T) by percents, or
both, as in UV and visible electronic spectra. Here, Lambert-Beer’s law also is applied, which,
however, may have some deviations in case of concentric samples։
D=εcl= log1/T=logIo/I.
In case of the compound’s mixture (in the case where the absorption layers cover each other)
the obtained absorption in case of the certain wavelenght (or frequency) is the sum of mixture’s
individual components absorption at that wavelength։
Aobtained=A1+A2+A3=ε1c1l+ε2c2l+ε3c3l։
In case where the absorption layers do not overlap each other, quantitative detection is
conducted samely as for individual compounds.
Substances quantitative detection in IR-spectroscopy, especially in the past, had disadvantages
and limitations. This is conditioned by the following reasons։
● The molar absorption coefficients (molar absorptions) are usually ten times smaller than the
electronic reagion constants. Thus, the infrared method is usually less sensitive.
● The most suitable is T=55% to T=20% range (D=0,26 to D=0,70) for quantitative
measurements։ the accuracy of measurement outside of these values dramatically decreases.
● The error of old spectrometers is 1% in the range of mentioned T values.
Although nothing can correct the method disadvantage conditioned by low molar absorption,
nevertheless, the design and improvement of modern device, the implimentation of retio recording
and FT-IR type of devices, overcome limitations due to accuracy and instrumental factors. As a
result, quantitative infrared methods are currently mostly used, and are often for quality control
and substances structure identification.
Devices used in IR-spectroscopy
Tested sample radiation is on the base of substance’s IR specter by IR radiation of constantly
changed frequency.
IR spectrometer is like UV and visible spectrometers structure, but the structure of this device
is more complicated.
The IR radiation sources are heat, such as Nernst’s shtift or ceramic axis from carborundum
(SiC, carbide silica, globar), which is heated by electric current. Nernst’s shtift is a mixture of
zirconium, torium, and anthrium oxides.
All optical materials of the device (lenses, cuvettes and former prisms) must be permeable for
the IR-radiation. Alkali halide crystals (LiF, 2000-3800cm-1, NaCl։ 700-2000cm-1 and KBr։ 400-
700cm-1) were used in the old type of prismal monochromators, currently the water-soluble and
hygroscopic substances have been replaced by diffractional net.
In order to record specters, double beam spectrometers are mainly used here (Figure 43). On
these devices, a solvent-free cuvette is inserted on the path of the second beam, or KBr tin plate
without the sample. By the help of prisms or diffractional nets the light flow is devided into two
identical rays, the one passes through the cuvette filled with the sample, and the other with the
cuvette of comparing solution. Radiation enters into the monochromator, which allows to devide
the radiation to a very certain frequencies and smoothly alter it.

43
Figure 43: Scheme of double beam spectrometer.
The detector records the difference between the intensities of two light streams (main and
comparative ray) flowed from the monochromator. Since IR radiation is thermal radiation, the
detector should accurately measure temperature changes and convert them into electrical impulse,
which is enhanced and regulated by autorecording potentiometer.
To obtain correct result, the device should be placed on a solid, stable, non-vibrating surface,
which is especially important for recording the specter. The device should be kept away from
heating devices and water source (humidity). The latter is especially important because water
makes difficult to obtain the IR spectra absorbing the IR radiation.
Implementation of the IR-spectroscopic method involves the following stages։
1. Preparation of tested sample,
2. Specter registration by device,
3. Interpretation of data։ specter analysis.
Preparation of tested sample
In fact, spectrometric studies can be conducted in all aggregate states։ solid, liquid, gas and in
any consistencies, in types of membranes or solutions. Preparation of samples within IR methods,
significantly differs from the methods used in UV and visible spectroscopy. This is usually can be
explained by substances high molar absorption. The amount of substance required for analysis is
measured by mg. In case of gases, the thickness of substance layer should be big, and thin in case
of pure solutions and solids, since the density of absorbing substances is greater in this case. Taking
into account the hygroscopicity of the cuvettes used in IR-spectroscopy they are not suitable for
the analysis of water solutions.
Analysis of liquids and solutions by IR-spectroscopy
Liquid samples are studied in cuvettes, which are placed on the pathway of light. For obvious
reasons, water is used as a solvent only in combination scattering spectroscopy. This method also
allows working with glass cuvettes. Usually it is not difficult to prepare organic liquids samples,
as most of them do not break the salt-cuvettes. In IR-spectroscopy, complete or collected cuvettes
are used. Two flat parallel plates form windows, in which liquid sample is placed. These plates are
combined with steel tin plates. The thickness of this cuvettes layer can be changed. Usually, the
thickness of cuvette working layer is from 10μm to 1mm. Another advantage of the collecting
cuvettes is that they can also measure viscous liquids, paste-like substances, which after
measurement, cuvettes can be detached and cleaned. In IR-spectroscopy cuvettes with the
changeable layer thickness are ireplacible։ to compensate solvent absorption; quantitative
analyzes, and differential studies implementation. By accurately changing the layer thickness it is

44
possible to obtain important details in the compound specter. The layer thickness is regulated by
screw and the sample into the cuvette is added by a special syringe.
In most cases, during fluids analysis there comes nessecity to dilute them. As it has repeatedly
mentioned water is not used in this case, but beside water the other solvents also can absorb in IR-
region. For this reason, it is preferable to use those kind of substances as a solvent, which don’t
have large molecular sizes and symmetric structure, thus in IR-spectroscopy CS2, CCl4 are greatly
important.
Analysis of solid substances in IR-spectroscopy
Generally, for analyzing solid substaces it is commonly used to obtain solid substaces solutions,
but in IR-spectroscopy solid substaces investigate by obtaining their homogeneous thin layer
ribbon-like shape which is fixed to the sample holder. The sample holder in this case is a tin plate
with rectangular hole on which the tested sample ribbon is placed, from above it is closed by a
magnet plate, which also has an open rectangular window. The magnet provides the tin plate’s
fixation in vertical position.
Two methods are used to dilute solid samples։
● compression method by KBr,
● suspensions obtain by fluid paraffin bases.
The cost of the tested substance in this case is very small - a few milligrams. This quantity can
also be reduced by using special equipment.
Compression method by KBr
This method of solid and powdered substances is widely used in IR-spectroscopy. It is quite
time-consuming and labor-intensive, as it is necessary to weigh and grind the sample thoroughly,
as well as to clean the pressing device. 1-2mg of the tested substance is thoroughly rubbed by 200-
300mg hyperpure KBr by hand in mortar made of agate. The particles sizes of the substance should
be smaller than the length of the studied wave for obtaining high-quality spectra. For homogeneous
grinding and distributing the sample, vibrational mills can be used, by which several samples can
be prepared at the same time. Since the KBr is permeable from 43,000 to 400cm-1 region, and does
not cause absorption, so in the sample prepared by this method (in contrast, for example solvents
usage) is recorded only tested rubbed substance specter.
The rubbed mass is beeing compressed by hydravlic press machine for getting tablets-like
briquettes. In case of 10 tonnes of force KBr becomes plastic and mixing with the sample "solid
solution" is obtained. In order to remove moisture from tablet, compression is carried out in
vacuum. Additionally, until the mixting KBr is dried in drying chamber at 40C0. The water
contained in KBr is expressed immediately by absorbtion in the specter.
For standard measurements, tablets are prepared with 13 mm diameter, and in microanalysis –
tablets up to 2 mm diameter. It should be remembered that the crystal lettuce of the sample can be
changed during the compression, becides if the sample’s and KBr's refraction indexes are
significantly differed (KBr n=1.53), thus the asymmetric distortion of spectral lines can occur, to
avoid it other refraction indexes having substances are used։ KJ (n=1.62), AgCl (n=1.98), KRs
(n=2.37).

45
Methods for preparing samples with paraffin oil
In this case, in paraffin oil studied substance suspension is obtained. Approximately 2 mg of
substance is rubbed in mortar with a few drops of liquid paraffin oil (high molecular liquid
paraffins mixture). The oil contributes to the decrease of light reflections from the surface of
substance crystalline microparticles. Its refraction index should be as close as possible to the tested
substance refraction index. Obtained "milk porridge" is placed between the walls of the collecting
cuvette and then transparency specter is recorded in the passing light. Paraffin absorption lines
which refer to the CH2 and CH3 groups vibrations cover these groups vibrations in tested sample
as accurate compensation can not be performed in this case. This method is used in case of those
samples which interact with KBr or for which there is no other solvent than water.
Analysis of gases by IR-spectroscopy
Since oxygen and nitrogen do not absorb in IR-region, this method is ideal to identify gases։
CO, CO2, CH4, N2O, NH3, SO2, HCl or some other solvents’ vapours in the atmosphere. Of
course, there are some difficulties due to that for gases thicker layer is required. Additionally, the
gases absorption spectra are more complex than those of solid and liquid substances absorption
spectra.
Combination scattering or Raman-spectroscopy
Non-elastic scattering of light was discovered in 1928 by an indian physicist Raman and Raman
- measurements were widely used in 1930s than infrared measurements. This type of spectroscopy
is acomplishing to IR-spectroscopy, but the Raman effect is significantly differed from the other
methodes of molecular spectroscopy by light quants absorption and vibration excition type. Here
it is not about absorbed or emitted, but about scattered radiation spectroscopy.
The difference between these new frequencies (Raman lines) and the original frequency is
conditioned by the molecular structure, is characteristic to the radiated molecule, and numerically
identical with molecule’s certain vibrational and rotational frequencies. Obtained combination
scattering spectra (Raman spectra) can be concern to the tested substance molecules vibrations.
Depending on the spectral lines’ intensity, frequency and form it is possible to conclude about the
sample identity or structure. In result of excitation different conditions in the combination
scattering spectra such vibrations can be studied which are not active in IR-region. Of course, there
are vibrations that are not active both in IR and Raman spectra. The simultaneous use of these two
methods gives possibility more thorough study compound’s structure.
Theoretical bases of combination scatering spectroscopy
Combination scattering lines appear in specter when monochromatic light perpendicular falls
to study direction and the spectral separation of scattered light occurs.
Under visible and UV-rays impact electronic orbitals of molecules are deviated from their
equilibrium state. It means that the electrons begin to vibrate at the same frequency as the
frequency of the falling light. As a result they become the source of radiation for Rayleigh
scattering, which beams have the same frequency as the falling light beam. The entire energy
which was absorbed by the primary rays is again released in the secondary radiation type, and

46
energy change in this case is not observed. As a result, electrons are not excited, but remain in
their original configuration area. The precondition for this phenomenon is that the wavelength of
the given length is far from the wavelength by which influence electronic transitions are carried
out in the molecule.
Thus, the prevailing part of the scattered light has the same frequency as the falling light.
However, the more easy electrons move in the molecule, i.e. the higher is their polarization ability,
the stronger the electronic orbitals are deformated. As in case of such deformations, it is about
valence electronic orbitals by which chemical bond formation is conditioned, and hence the
intraatomar space and bond’s angle, so their geometrical structure change leads to the change of
that chemical bonds’ length or angle change between atoms. As a result, this leads to atomic and
respectively molecular vibrations. In case when in IR-spectroscopy these vibrations were excited
directly by IR light rays, in Raman spectroscopy they are mediated by deformations of electronic
orbitals.
The energy required for that excitiation is transmitted from the beam of the falling light. In this
case, along with the Rayleigh scattering, spectral lines are formed, which are deviated from the
initial excitation line by the measure of certain frequencies. Diferencies of the excitation line and
that spectral lines are Raman frequencies, which are detected on the base of IR-spectroscopy.
Combination scattering deviation in the specter from the Rayleigh line as in IR is expressed by
wave number cm-1.
The combination scattering specter consists of weaker lines than Rayleigh’s and either in higher
or lower energy regions (compared to the Rayleigh line). Here, there are differed Stock’s in lower
frequency, and anti Stock’s in higher frequencies appeared lines.
Stock’s lines appear in the non-elastic collision of the photon and molecule when the latter
absorbs energy in a single vibrational or rotational quantum measure։ ΔE. In this case, photon loses
appropriate amount of energy։ according to ΔE=hգv equation, the frequency deviates to the
measure of ν value.
As opposed to, anti-Stock’s lines are formed when the molecule is in excited rotational or
vibrational state. Moreover, photon absorbs this rotational or vibrational energy such that the
combination scattering spectral line frequency is greater than excitation wave line frequency by
the measure of ν value. The molecule in this case is less excited or is on zero state.
Figure 44: Scheme of energetic levels for Stock’s and Anti-Stock’s lines.

47
Since most of the molecules are in main vibrational state at room temperature, so the anti Stocks
lines which correspond to transitions of lower energy levels than excited state usually have less
probability. Consequently, combination scattering typical specter usually contains along with one
Rayleigh’s line Stokes lines with high-intensity and anti Stocks lines with low-intensity. As the
temperature increases, the number of excited molecules can increase, so the probability of anti
Stocks lines increases with temperature.
Rules of choice in Raman-spectroscopy
Like in IR-spectroscopy, there are rules of choice in this case. Interacting with the light, the
electrons pass to vibration state which size is conditioned by molecul’s polarization degree. In the
result of the polarization change which is caused by electrical dipole moment change, molecules
can interact with light.
Combination-active are molecules those vibrations and rotations at which vibrational and
rotational motion molecul’s polarization is changed. IR-active are molecules those vibrations and
rotations during which vibrational and rotational motion molecul’s diple momentum is changed.
Most of the molecular vibrations are mainly infrared and Raman active. However, in the case
of molecules with the center of symmetry, the principle of mutual exception is applied, which is
detected by an alternative prohibition rule, according to which in case of symmetry center having
molecules symmetric vibrations toward the symmetry are IR active and are combination-active
and vice versa, asymmetric vibrations are active in IR spectra, which are inactive in CS spectra.
This is very important conclusion which proves that these two methods complete each other. If the
Raman and infrared spectra of the molecule have the same peaks at the same frequencies, the
molecule can not have a symmetry center.
Table 10:
Different types of vibrations IR and combination activity in CO2 molecule
In case of symmetric valence vibration, the molecule stretches and compresses, i.e. electrons
concentration is changed in unit volume, consequently the molecule polarization changes.
Therefore, such vibration is a combination-active. But in the same case the dipole moment does
not change and it is IR inactive. It is clear that in case of asymmetric vibration the image is the
opposite.
The frequency of Raman specter refers to the force constant and the given mass by the same
expression as in case of infrared spectroscopy.
In combination scattering spectroscopy, mercury lamps are used from which specter 435.8nm
length having wave is separated as for the excitation monochromatic light is necessary which

48
wavelength is far from the sample absorption specter. Currantly, in modern devices laser light
sources are used that allow for getting more monochromatic light. Combination scattering is
usually seen at 900 or 1800 angles.
Considering the excitation wave length (visible region), in this case, water can be used as a
solvent, as well as glass and quartz cuvettes which was impossible in IR-spectroscopy.
Raman spectroscopy has the following advantages over infrared spectroscopy.
1. Water is an excellent solvent for Raman spectroscopy whereas it cannot be used in infrared
studies.
2. Preparing the sample in this case is easy.
3. Glass and quartz cells can be used in Raman spectroscopy.
4. Raman spectra are usually simpler than the corresponding infrared spectra, so overlapping
bands are much less common in Raman spectroscopy.
5. Totally symmetric modes of vibration can be studied by the Raman effect, whereas they are
not observed in infrared spectroscopy.
6. Because of the nature of the Raman effect, one instrument can be used to cover the entire
range of molecular vibration frequencies.
7. The intensity of a Raman line is directly proportional to concentration, whereas Beer’s law
has to be applied in infrared spectroscopy. Thus, quantitative analysis is often more convenient in
Raman spectroscopy and often more accurate.
8. As the combination scattering of transparent polymers is relatively weak, this method can
be used to analyze wrapped substances which has great practical importance in modern
pharmaceutical analysis. By this way, for instance, tablets composition can be detected without
breaking blister’s wholeness of wrap.
Combination scattering spectroscopy can be used to detect molecular structure. Disadvantages
of this method are։
● Low intensity of spectral lines with only 1% of total scattered light. The intensity of
combination scattering lines is detected by altering the molecule polarization.
● The sensitivity of the analysis is not so big.
● Any type of resonance interaction, such as fluorescence, is able to overlap combination
scattering lines. The only chance to correct this disadvantage is the use of such an excitation wave
which is far from the fluorescence causing wave. It was not possible or hard to conduct when
mercury lamps were used, which are lighting in fluorescent region, but it could be used by applying
laser light sources.

49
APPENDIX 1.
Group frequencies characterizing functional groups in IR-specter
Group frequencies typical to alkanes, alkenes and aromatic compounds

50
Absorption frequiencies typical to hydroxyl group in alcohols, phenols and acids

51
Absorption frequiencies typical to amines, imines and their salts

52
Absorption frequiencies typical to carbonyl group
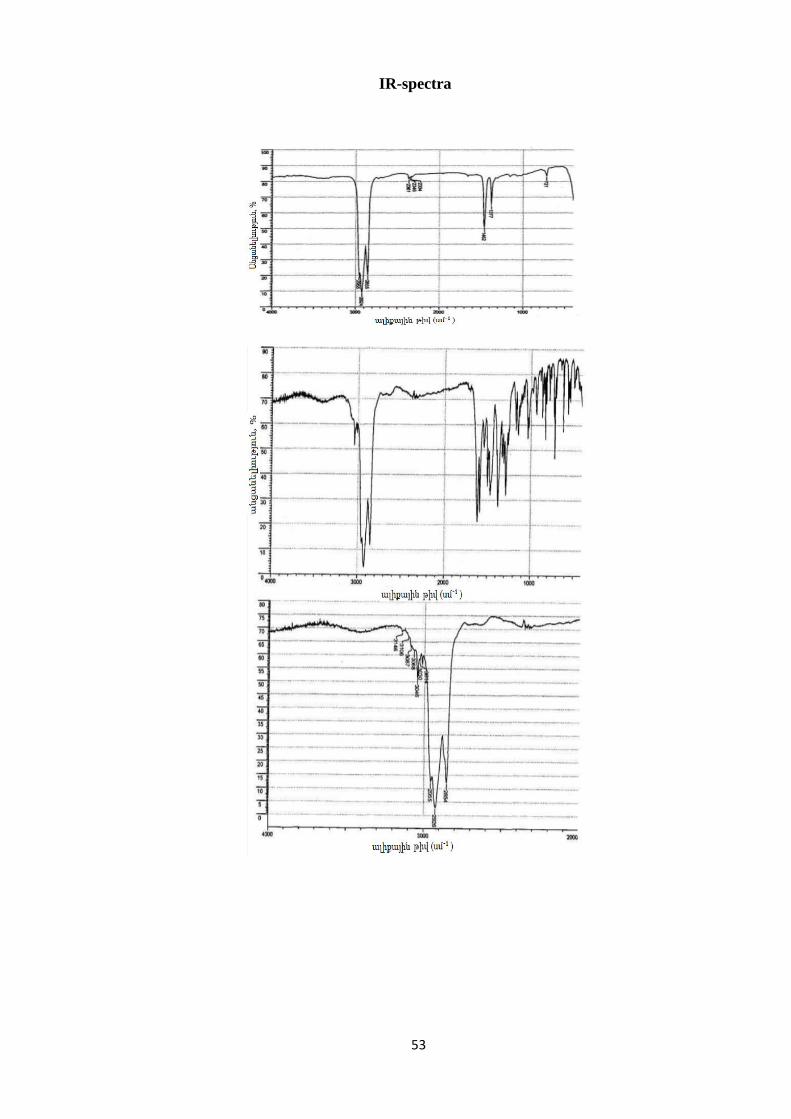
53
IR-spectra

54

55

56

57
ATOMIC ABSORPTION AND FLAME EMISSION SPECTROSCOPY
As it is known, atoms and molecules can be found in discrete energetic states, and transitions
between these states are possible due to energy absorption or emission. Moreover, the only
radiation is absorbed or released, the energy of which (E) corresponds to the energy difference
between two levels (ΔE). Only certain energy levels are possible for atoms, each of which is
conditioned by the electrons’ specific orientation in the atom. Thus, if the electronic, vibrational
and rotational states can be altered in the molecules, the energy change of an atom occurs only
through electrons transitions between the orbitals of different energies. Because of the limited
number of electrons, the energy exchange with the environment cannot be realized continuously
and is carried out in case of a very definite (ΔE) values, to which correspond certain absorption
and emission wave frequencies. These frequencies, in some context, are atoms “own” frequencies.
The atoms interaction with electromagnetic radiation can be approximately described by
comparing it with the resonance of the mechanical oscillator, thus the atom absorbs only the
frequencies ν1, ν2, ν3 which correspond to its own frequency from continuous light specter. Atom
excited with the waves of same frequency can emit to the lower-energy orbitals through electrons
transition. Atomic spectra are linear spectra. As external valent electrons transitions are carried
out in atoms, thus atoms’ absorption and emission spectra are in the UV and visible region of
electromagnetic spectrum. In atoms both transitions emission and absorption are used in
spectroscopic methods.
Along with the light energy, thermal energy can also cause excited state in the atom. It means
that depending on the external environmental temperature different energy levels have different
levels of placement and absorption will occur as far as the low energy levels of electrons are placed
and the high energy levels of electrons are less saturated. The Boltzmann equation is true for two
states, E0 - ground state and E1 - excited state, in thermal balance
N1/N0 = (g1/g0)e-ΔE/kT
where,
N1 -is the number of atoms in the excited state,
N0 -is the number of atoms in the ground state,
g1/g0 is the ratio of static weights for the ground and excitation states;
ΔE -is the excitation energy, equal to hν,
k- is Boltzmann’s constant,
T-temperature is Kelvin.
The general description of the method
In the base of this method lies the known phenomenon that in the presence of metal vapors, the
colorless flame is colored (for example, in case of sodium it becomes yellow). If the emitting light
of this flame divides by means of monochromator, the corresponding element will be detected in
respect to the presence of open lines in the specter. In the absence of metal, the source of the beam
(flame) emits continuous, even specter (flame background), and in case of metal presence, the
specter becomes linear, the reason of which, as it was mentioned, are transitions of the metal atom
valent electrons between different energetic levels that occur by heat or light excitation. Thus,
when a solution containing metal salt (or another metal-containing compound) is introduced into

58
the flame (for example, in the acetylene flame) then the vapor containing metal atoms is formed.
Some of the metal atoms in this gaseous state may rise the energetic level and the energy absorbed
during the thermal excitation atom releases in the form of typical emission specter. This
phenomenon lies in the base of flame emission spectroscopy (FES) or flame photometry.
However, even in vapors state, most of the atoms are in ground (not excited) state and is able
to absorb light beams. If the atom's excitation is carried out under the influence of light, thus, as
mentioned earlier, the atom absorbs waves of certain energy amount, and in this case absorption
spectra are formed. The absorption takes place as much as the atoms in the ground state are present
in vapor. This is the basic principle of atomic absorption spectroscopy (AAS). Another method
based on light energy emission which was absorbed by atoms is atomic fluorescence
spectroscopy (AFS).
Atomic absorption is possible only when metal atoms are present in the absorbing compartment,
that is, the testing sample, for example the salt of metal, must convert to the atomic state. This
happens under high temperature condition. It is known that at temperatures higher than 2000oC,
almost all known chemical compounds are in the atomic state, that is, except of some exceptions,
there are no ions and molecules at this temperature. The further increase in temperature will lead
to the heat excitation of atoms, which will continue until all the atoms convert to the ionized state
by plasma formation (Figure 45). In this state, atoms can’t absorb the corresponding light and the
atomic absorption phenomenon will no longer be observed. Thus, the temperature should be high
enough to provide substance’s full and rapid transition to the atomic state, on the other hand, not
so high that atoms can no longer absorb the light beams. Thus, ideally at AAS, the atoms must be
only in ground state in vapor, in case of FES, the temperature should be higher so that more atoms
are found to be in excited state, and the emission specter is more expressed (but in this case also
there is a T0 limit, from which atoms lose their energy and plasma is formed, which is also not
advisable).
Substance’s transfer to the atomic state can be achieved by using the appropriate flame. In the
gas state, the import process of the metal atoms can be presented as follows. When the solution of
metal-containing compound is inserted into the flame, the following stages are rapidly occurred:
Figure 45: Atomization stages of metal containing compounds.

59
1. solvent evaporation by the formation of a solid residue;
2. solid residue evaporation, which is carried out by dissociation of the ground state atoms in
the substance;
3. some atoms excitation by flame heat energy by transition to higher energy levels and
absorbed energy radiation (FES);
4. atoms light excitation and emission in the flame (AAS and AFS).
In the flame, the dominant part of the atoms is in its ground (E0- the lowest energy level) state.
When the light of the corresponding frequency passes through the flame, even minimal amount of
energy absorption leads to the atoms transition to the first excited state - E1 energy level, also
called resonance energy level.
Figure 46: Simplified energy level diagram
Statistically, at the atom’s excitation placement possibility of this energy level is the highest.
More noticeable absorption of energy leads to atom’s transitions to E2, E3 states.
The amount of absorbed energy ΔE is detected by Bohr’s equation:
ΔE= E1 - E0 = hν = hc/λ
where,
c - is the light speed;
h – Plank’s constant;
ν - is the frequency;
and λ - is the wavelength of the absorbed beam.
Transition from E1 to E0 corresponds to beam emission of ν frequency.
After short time (about 10-8 s), after being in excited metastable conditions, the atoms drop back
down to their ground state by releasing their typical wavelengths. Emission specter includes not
only transitions from excited state to ground state (e.g. E3 to E0, E2 to E0), but also transitions such
as E3 to E2, E3 to E1 (figure 46). Thus, the emission specter of the given element can be difficult
enough. Theoretically, radiation absorption is also possible from the excited states, such as E1 to
E2, E2 to E3 transitions, but as in practice, the ratio between excited and ground state atoms is very
small, so the absorption specter of the certain element usually consists of only the transitions of
ground state to higher energy states, and is simpler in its nature than the emission specter.
According to Boltzmann equation, N1/N0 ratio depends on excitation energy (ΔE) and
temperature (T). In the case of increasing temperature and lowering ΔE (when dealing with
transitions with longer wave frequencies regions), N1/N0 ratio increases. The calculation shows
that only a small fraction of atoms is excited, even in the most favorable conditions, i.e., when the
temperature is high and the excitation energy is low. Alkaline and alkaline-earth metals, the

60
energies difference between their electron orbitals, is relatively small, absorb and emit in the
visible region of the specter (this is the reason they give a certain color to colorless flame);
therefore, they are excited at lower temperatures. This also can be explained the usage limitations
of the flame emission spectroscopy, it is used mainly for substances containing alkaline and, in
some cases, alkaline-earth metals identity and quantitative analysis (NaCl, KJ) in injection and
dialysis liquids and for other metallic mixtures detection as well in inorganic salts. On the other
hand, flamephotometry is a clear, affordable and selective method with relatively simple devices
that allows quantitative detection of the mentioned metals (Na, K, Li, Ca, Ba) with high accuracy.
Table 11 shows the dependence of N1/N0 ratio on temperature and the appropriate wavelengths
for some metals.
Table 11
Since the absorption spectra of many elements are simple in their nature compare to emission
spectra, thus atomic absorption spectroscopy is less prone to interelement interferences than flame
emission spectroscopy. Moreover, considering the high ratio of the number of atoms in the ground
and excited states, atomic adsorption spectroscopy is more sensitive than flame emission
spectroscopy (in case of heat excitation fewer atoms transit to the excited state than in case of light
excitation). However, in this ratio, the wavelength of resonance line is important (crucial) factor,
and in flame emission spectroscopy the elements which resonance lines have relatively low energy
values are more sensitive than those which resonance lines are associated with higher energy
values. Thus, sodium’s emission line at 589 nm shows high sensitivity in flame emission
spectroscopy, whereas zinc’s emission line is relatively less sensitive at 213.9 nm.
Atomic absorption spectroscopy is used to detect presence of heavy metals in different samples
(biological, nutritional) and drugs. This method is more sensitive than flame photometry; it is
highly selective method for drugs quality control. Disadvantages of the method are:
- it is mostly used for metals detection;
- for detection of each element, certain cathode lamp is required, as atoms absorb and emit in
very narrow range. For instance, for identification of zinc (which absorbs and emits at 214 nm)
cathodic lamp covered with zinc is used (cathode lamp is covered by its material for each metal).
The disadvantage is that the lamp should be changed for detecting each element, and only one
metal can be detected at the same time. Modern devices are equipped with up to 12 cathode lamps.

61
Linear spectra
If the atom had only one excited state, we would have received only one absorption spectral
line, in fact, the atomic spectra consist of many lines, spaces between which decrease along with
the wavelength decrease, the absorption intensity also decreases until the moment when in the
specter no line is seen: full absorption is carried out. This point is called spectral series boundary
or continuous environment of ionization.
Figure 47: Sodium atomic specter.
All the electronic transitions and, consequently, the number of spectral lines for the certain
element depends on its external electrons’ distribution. Atoms containing less electrons in external
orbital, such as alkali metals, have a minimum number of spectral lines and vice versa, the atoms
of complex external electron structure, especially elements of the supporting groups, have rather
complex absorption spectra.
For example, Na has an electron in its outer orbital in ground state, which, in case of heat or
light excitation, passes to a higher energy orbital, as shown in Figure 48. Subsequently, the
electron passes to a lower energy level, in which result sodium emits yellow light at 589.3 nm
wavelength, conditioned by 3p-3s transition, which is the most intensive line of sodium specter. In
the Na specter, there are two more lines, at 330.2 and 819.5 nm wavelengths, which are
conditioned by transitions from other levels, but for Na “yellow” line of its specter is
characteristic.
Figure 48: Sodium valent electrons transitions.

62
Besides, as we have seen already, different energies are required for different atoms excitation,
and therefore different wavelengths and passing from the alkali metals to heavy metals resonance
line shifts to the shorter wavelengths side, up to vacuum UV zone (metal-like elements, elements
of d subgroup). Theoretically, any element can be detected by atomic absorption method, but in
practice, there are limitations which are conditioned by used device.
Thus, the absorption of metals is in visible and UV-region and the absorption of the metal-like
elements is carried out mainly in vacuum UV-region, so AAS is used primarily for metal elements
identity and quantitative analysis. For detecting metal’s identity, only one characteristic spectral
line is sufficient and it is not mandatory to realize registration of element entire linear specter. Any
line is selective and is typical for a particular element, though some coincidence might occur with
the other elements line. All the lines of the atomic specter are resonance and, depending on their
transition possibility are differed by their absorption intensity. For simple atomic structures,
alkaline and alkaline-earth metals, the most intensive, hence the easiest excited line corresponds
to the transition from the ground state to the first excited state, E0- E1. This transition usually
requires less energy, so this line has long wavelength. The most intensive line among a number of
atoms corresponds to transition from ground to higher energy levels. Generally, for atoms
detection as a characteristic line, the most effective line of the specter is used, but in some cases,
it is possible to use less intensive line to avoid coincidences. Usually, the characteristics of the
main resonance lines are given by the atomic absorption device as well.
Absorption for one line is also measured for quantitative analysis. Here, also Lambert-Ber’s
combined law is worked, in this case, the intensity of emission source is directly conditioned by
the number of absorbing atoms. In atomic absorption spectroscopy, as in the molecular absorption,
the optical density D is detected by the logarithmic ratio of falling light intensity (I0) and passed
light intensity (Ip).
D = logI0/Ip = KLN0,
where,
N0 is the atoms concentration in flame (number of atoms per milliliter),
L- length of the pathway passed through flame (cm),
K- absorption coefficient constant.
This is a linear function for small values of optical density.
Graded graphs are used for quantitative analysis by these methods, which are build testing a
few standard samples and "zero" solution.
Sensitivity and detection limit of the method
The analytical sensitivity of the element analysis method is usually expressed by two
measurable indicators: characteristic concentration and detection limit. Characteristic
concentration is the amount of sensitivity which is the mass of the analyzed element that gives
D=0.0044 absorption signal, which corresponds to 1% absorption. Detecting minimum limit (as
in other analytical methods) is the concentration of the element in the solution which forms 3 times
more intensive absorption from the main line noise (in this case from the absorption line of zero
solution). It is noteworthy to mention that it is impossible precise detection near to this limit, as
the error possibility in this case is 33.3%. For this reason, laboratory tests usually are carried out
for concentrations exceeding minimum detection limit 6-10 times.

63
Used devices
Devices used for flame emission, atomic absorption and atomic fluorescence spectroscopy have
the following main structural components:
Figure 49: The schematic structure of atomic absorption, atomic fluorescence and flame
emission spectrometers
The flame-atomization providing component (in flame method) is present in all methods’
devices (AAS, FES, AFS) and represents a mixture of burning and oxidant gases, which transforms
metal containing sample into atoms in gaseous state. In these methods a nebulizer-burner system
is required. In contrast to UV and visible spectroscopic methods, where the absorbing compartment
is a quartz cuvette, the absorbing compartment in AAS and FES is a flame of the burner where the
atoms of the tested sample are present. The sample is introduced into the burner by injection way
only in form of solution after which, with the help of nebulizer which provides sample’s
transformation to fine aerosol, passes into the flame.
Figure 50: The structure of nebuliser-burner.

64
The aerosol drops of the solution should have diameter maximum of several μm for effective
atomization of the sample. Larger drops should be removed, as for their evaporation and salts
decomposition more time is required, in which result complete atomization may not occur. Thus,
system’s sensitivity is evaluated by its ability to convert the solution to the desired particle state
by large drops sedimentation. The yield of ready aerosol can be 5-15%. As a nebulizing
environment oxidant gas (for instance, air) can be used, which is given under 2-3 bar pressure.
Since, according to Lambert-Ber's law, the absorption is directly proportional to the passed light
pathway in the absorbing compartment, the burners are made in the form of long path. Usually,
the burner path has a length of 10 cm and a width of 0.5 cm. For the light passing through the
length of the path it is required that the burner should be placed directly on the pathway of the
beam.
Table 12:
Flame temperatures with various fuels
Fuel gas Temperature (K)
Air Nitrous oxide
Acetylene 2400 3200
Hydrogen 2300 2900
Propane 2200 3000
An essential requirement of flame emission and atomic absorption spectroscopy is a flame
temperature greater than 2000K. As an oxidant gas usually, air, nitrous oxide (NO) or oxygen
diluted with either nitrogen or argon are used. As a fuel gas, methane, propane, acetylene, hydrogen
are used. In the table 13 some of gas mixtures characteristics are presented. The acetylene-air
mixture is the most frequently used gaseous mixture in the atomic absorption spectroscopy which
temperature is t0=2300°C. This flame is absolutely permeable in the quite wide range of the specter
and gives some absorption only at wavelength less than 230nm.
Table 13:
Flames characteristics of various gas mixtures.
Fuel Oxidizer
Temperature
of flame, 0C
Burning speed
sm•sec-1
Nature
of flame Analytic usage
CH4 air 1800 55 laminar Alkaline metals detection
C2H8 air 2300 260 laminar
Absorbing chamber for
atomic absorption
spectroscopy
H2 O2 2600 3700 turbulent Used for heavy metals
detection
C2H8 N2O 2800 120 laminar
Absorbing chamber for
atomic absorption
spectroscopy

65
The usage of acetylene-air mixture is convenient because it has wide ranges of applications,
thus, for example, in standard conditions, it works by principle of weak oxidizer (in the air excess).
Under strong oxidation conditions it can be used for some noble metals, Au, Ir, Pd, Pt, Rh detection
with high sensitivity and without decomposition of sample. In case of alkaline-earth metals, in
contrast, it is convenient to use flame with weak reducing properties (acetylene excess).
The other mixture used for absorption chamber in atomic absorption is the mixture of acetylene-
nitrogen oxide gases (t0=2800oC), which is used for the elements which are difficult to detect with
acetylene-air mixture. This mentioned flame has expressed reducing properties and is used for
those elements detection that have great affinity to the oxygen: aluminum, bor, silicium.
The disadvantages of the atomization-flame method are: at first, the sample should be in liquid
form in form of solution and its viscosity should not be too high. Samples such as blood, blood
serum, and oils should be diluted beforehand. Additional procedures are required for this, as well
as the waste of time and ssubstances. To obtain the analytic signal, a certain minimum sample
volume (0.5-1mL) is required. According to data, only 5-15% of the inserted sample reaches the
flame and the sensitivity of this method sometimes does not enough to detect very small quantities.
And finally, the flame has certain self-absorption, which disturbs measuring in further UV-region.
Beside flame method, there are also other methods of atomization the sample, using the non-
flammable chamber for which burner is not required. These methods are:
• usage of graphite tube heaters,
• hydride compounds and cold vapor method.
The graphite tube has a length of 30 mm and an internal diameter of 6 mm and is found in the
cooling chamber on the pathway of AAS beam filled with any inert gas, argon or nitrogen, which
protects the graphite from burning. A few mcl of sample is put in the chamber and it is heated up
to 3000oC. In such tube evaporation and atomization of the sample occurs at the same time.
Moreover, it should be noted that, in contrast to flame method, here the efficiency of samples
imsertion is 50-90%.
On the other hand, this method allows to import samples not only in form of a solution (even in
viscous), but also in solid form, in form of a powder or suspension. The method difference is that
the tube temperature remains high about 10sec during which the atomization is carried out, then
the tube is cooled up to room temperature, while the flame temperature always remains constant.
This helps to abolish the existing substances, such as solvent during the analysis.
Figure 51: The working principle of graphite tube heater.

66
However, the greatest advantage of this method is its sensitivity, which exceeds flame method
100-1000 times, its detection limit is within picograms limit, and the sample volume can be 10-50
mcl in this case. However, in contrast to flame method, this method is slower, 2-3 minutes (10sec
in flame method) are needed for analysis, and for the next analysis the heater should be cooled up
to room temperature with the help of water. The other, the more serious disadvantage is that there
may be chemical interferences in the graphite tube, which may become noticeable inhibition
reason of signal. It is not possible to eliminate them correcting the background as in flame method,
but require complex procedures.
Next non-flame method is based on the use of hydrid compounds and mercury cold vapors. In
this method, the phenomenon is used, that some elements of IV, V and VI major groups form
volatile hydrides with hydrogen. The great advantage of this method is that the analyzed element
is released from other components containing in the sample prior to atomization in the gasous
hydride form, that is why, there is almost no spectral interferences occur in case of method correct
usage.
Thus, hydride generating elements such as arsenic, selenium, tellurium, bismuth, tin (stannum),
antimony can be released and detected with high sensitivity and almost without deviations. In the
reaction tube in the result of reaction with the reducer sodium bortetrahydride gasous hydrides are
formed, which pass through up to 800-1000oC heated quartz tube along with the formed hydrogen
vapors by argon flow. There, at relatively low temperatures, atomization is occurred. In case of
flame, due to the substance conversion to gaseous state dilution is carried out by 105-106, whereas
in hydride method dilution factor does not exceed 500. In this case, the sensitivity of method
increases 103 times compared to flame method. In hydride method detection absolute limit is
smaller than that of graphite tube usage, but the amount of sample wasted is greater about 0.5ml,
the relative standard deviation is 1-2%. On the other hand, the sample preparation process here is
more laborious than in graphite tube method, the sample should be fully dissolved, and the
detecting element should be converted to required oxidation degree.
By the same method mercury also can be detected which is already in atomic vapor state at
room temperature, and it should only be transported by inert gas flow to absorbing chamber.
Figure 52: The scheme of hydride compounds and mercury cold vapors method.
Taking into account the high toxicity of mercury, it should be detected everywhere, even in
drinking water, where its quantity must not exceed 0.002mg/l. Mercury shows low sensitivity in
flame and, in case of graphite tubes usage, a problem occurs when the mercury is released from
matrix as it evaporates at low temperatures and is practically impossible to perform. Thus, this
method is the most preferable for the mercury detection, since the problem is only to reduce

67
mercury to free metal with the help of suitable reducer. Mercury is the only metal which has
considerable amount of vapor pressure at room temperature, that provides detection standard
limits approximately 0.1 mcg/l (100 billion portion). Tin chloride or sodium borhydride are used
as reducer. During the latter's usage any of the mercury, organic or inorganic compound
decomposition happens, in case of tin chloride, pre-mineralization or hydrolysis of organic
compound is required.
Monochromator: in flame emition method it is necessary to isolate emitted light, and in atomic
absorption method monochromator serves to isolate emitted light from the cathode lamp.
Detector: is available in all types of devices, atomic absorption, atomic fluorescence and flame
emission spectrometers: it is light-sensitive chamber. The detector is connected to the
corresponding recorder by which the absorption, emission or fluorescence spectra are obtained.
Source of Resonance Line: it is also required source of resonance line (light) in atomic
absorption and atomic fluorescence spectroscopy. Moreover, these sources of light are usually
changed (automatically or mechanically) for each element detection. As already mentioned, the
source of light is a cathode lamp that is covered by corresponding element. The source of light in
atomic absorption spectrometer is in the same direction as a detector, and in atomic fluorescence
spectrometer it is located under straight angle towards detector from the right side as shown in
Figure 49.
The cathode lamp is a glass cylindric tube which under pressure is filled with any inert gas,
neon or argon.
Figure 53: Cathode lamp structure.
There are anode and cathode inside the lamp. The cathode is small cylinder filled with an
element of interest or made of this substance. Anode is a tube made of tungsten (wolfram) or
nickel. When 100-400V voltage is given between the anode and cathode, inert gas ionization is
carried out; the ions touched by the cathode are discharged, simultaneously the cathode metal
atoms are detached and excited. Transiting from the excited state to ground state, the atoms emit
waves with corresponding frequency. In AAS also combined lamps are used, in which mixtures
of more than two elements are present. The advantage is that with these lamps several elements
can be detected at the same time. The disadvantage is that the intensity of the specter for each
element is less than in case of individual lamps usage and this is more noticeable in lamps
containing more than 4 components. Generally, this method is not so justified. Nowadays, there
are used devices that have several lamps simultaneously gathered into a narrow bunch of 3 mm

68
diameter through special optics that passes through an absorbing chamber, and then is split by
polycromator to separate beams.
Atomic absorption spectroscopy corresponding method choice criteria
By choosing one of the mentioned three methods is conditioned by a number of factors for
solving certain analytical problem. Here, it should be considered not only the sensitivity of method,
but also the time required for analysis and the waste of sample. In table 14 each method criteria
are shown which can serve as a support to orientate in that matter.
Table 14:
Different methods of atomic absorption spectroscopy
By flame
• high accuracy
• high speed
• detection limit in million parts range
By graphite tube heaters
• detection limit from milliard to trillion parts range
• work with microsamples
• Possibility of solid sample dosage
By hydrides and mercury
cold vapor
• the best detection limits for Hg, As, Bi, Sb, Se, Sn, Te
• interference relative absence
Besides, sometimes the automatization possibility of method should be considered. In fact,
flame, graphite tube and hydides (cold) vapors methodes are handful for automatization.
Interferences of atomic absorption spectroscopy
Since the atomic absorption spectroscopy is relative method, i.e. quantitative detection is carried
out only based on standards, so any behavior of the sample differing from the standard can be a
reason of interferences. Depending on the caused reasons interferences are:
• chemical,
• physical,
• ionized,
• background,
• spectral.
Chemical interference is the formation of any compound which can interfere quantitative
atomization of the element. When aerosol drops dry, chemical reactions can occur, for example, if
in the solution where calcium is detected Na+, Cl-, SO42- ions are contained, first of all CaSO4 is
formed in the flame, which is transformed into CaO under heat influence, which ialmost doesn’t
undergo atomization, but if CaCl2 is used for calibration, CaO does not occur. Thus, under the
same Ca quantity conditions in the standard and tested sample’s flame, lesser calcium ions are
formed due to sulphate ions. The universal method to avoid such disorders is the addition of
another cation with excess, which with sulphate forms less saluble salt than tested element. In the
given example barium can be used: CaCl2 is formed and the entire is sedimented in BaSO4
sediment form.

69
In phosphates presence, hardly melting calcium phosphate can be formed, which can be
dissociated to atoms with great difficulty. In this case, complex forming ethylenediamine tetra
acetic acid is added which prevents the formation of calcium phosphate, on the other hand calcium
is easily undegoes atomization.
To avoid such interferences, they are also used with a higher heat and strong recovery
properties, with a mixture of acetylene/nitrogen oxide that can even atomize even difficult
compounds.
Physical interferences include all the disorders in which the number of atoms is detected by
the physical properties of the sample. In any case, this is due to the ability of the spray to produce
aerosols, which, in turn, depends on the following physical properties of the sample:
• density,
• viscosity,
• surface tension.
If the sample and the standard have different physical properties, the number of aerosols in the
unit times are formed, causing different quantities atoms formation. In order to avoid such
interferences, the samples are diluted, but this is possible when the concentration of the detected
element is high enough. If the components influencing the physical properties of the sample, thus
the standard can also be prepared by adding them. If it is not possible to match the physical
properties of the sample and the standard, then adds the method of adding, constantly increasing
the standard concentration, builds the graph, and submits the data.
There are also special hydraulic, high pressure nebulizers in which physical interferences are
not occur.
Ionization interferences. Many metals alkaline and alkaline-earth are ionized in high-
temperature conditions losing electrons. Since ionized atoms have quite different spectra, so it
can’t be detected by atomic absorption method. Thus, the total loss of atoms and disorders reoccur.
There are two principal approaches to avoid such interferences.
At first, a lower temperature flame can be used: air-hydrogen, in which, for example, sodium is
almost not ionized, whereas it is 20% ionized in the air-acetylene mixture. On the other hand, the
loss of electron is a reversible process, and the balance can be shifted to the left, adding to the
sample easy ionizable element (mainly potassium or cesium), due to which excess of electrons is
formed.
Spectral interferences. These types of disorders are not typical for the atomic absorption
method, but may occur when multi-element lamps used.