Redalyc.Locating and Applying Critical Discourse Analysis ...
Upload
khangminh22Category
view
3download
0
Applying systems biology methods to identify putativedrug targets in the metabolism of the malaria pathogen
Plasmodium falciparum
D I S S E R T A T I O N
zur Erlangung des akademischen Grades
doctor rerum naturalium(Dr. rer. nat.)
im Fach Biologie
eingereicht an derMathematisch-Naturwissenschaftlichen Fakultät I
Humboldt-Universität zu Berlin
vonFrau Dipl.-Bioinf. Carola Huthmacher
Präsident der Humboldt-Universität zu Berlin:Prof. Dr. Dr. h.c. Christoph Markschies
Dekan der Mathematisch-Naturwissenschaftlichen Fakultät I:Prof. Dr. Lutz-Helmut Schön
Gutachter:1. Prof. Dr. Hermann-Georg Holzhütter2. Prof. Dr. Edda Klipp3. Prof. Dr. Richard Lucius
eingereicht am: 21. Januar 2010Tag der mündlichen Prüfung: 07. Juni 2010
Abstract
Despite enormous efforts to combat malaria, the disease still afflicts up to half a billionpeople each year, of which more than one million die. Currently no effective vaccine iswithin sight, and resistances to antimalarial drugs are wide-spread. Thus, new medicinesagainst malaria are urgently needed.In order to aid the process of drug target detection, the present work carries out
a computational analysis of the metabolism of Plasmodium falciparum, the deadliestmalaria pathogen. A comprehensive compartmentalized metabolic network is assem-bled, which is able to reproduce metabolic processes known from the literature to occurin the parasite. On the basis of this network metabolic fluxes are predicted for theindividual life cycle stages of P. falciparum. In this context, a flux balance approach isdeveloped to obtain metabolic flux distributions that are consistent with gene expres-sion profiles observed during the respective stages. The predictions are found to be ingood accordance with experimentally determined metabolite exchanges between para-site and infected erythrocyte. Knockout simulations, which are conducted with a similarapproach, reveal indispensable metabolic reactions within the parasite. These putativedrug targets cover almost 90% of a set of experimentally confirmed essential enzymesif the assumption is made that nutrient uptake from the host cell is limited. A com-parison demonstrates that the applied flux balance approach yields target predictionswith higher specificity than the topology based choke-point analysis. The previouslypredicted stage-specific flux distributions allow to filter the obtained set of drug targetcandidates with respect to malaria prophylaxis, therapy or both, providing a promisingstarting point for further drug development.
Keywords:malaria, metabolic network, drug target, flux balance analysis

Zusammenfassung
Trotz weltweiter Bemühungen, die Tropenkrankheit Malaria zurückzudrängen, erkran-ken jährlich bis zu einer halben Milliarde Menschen an Malaria mit der Folge von übereiner Million Todesopfern. Da zur Zeit eine wirksame Impfung nicht in Sicht ist undsich Resistenzen gegen gängige Medikamente ausbreiten, werden dringend neue Anti-malariamittel benötigt.Um die Suche nach neuen Angriffsorten für Medikamente zu unterstützen, unter-
sucht die vorliegende Arbeit mit einem rechnergestützten Ansatz den Stoffwechsel vonPlasmodium falciparum, dem tödlichsten Malaria-Erreger. Basierend auf einem aus demaktuellen Forschungsstand rekonstruierten metabolischen Netzwerk des Parasiten wer-den metabolische Flüsse für die einzelnen Stadien des Lebenszyklus von P. falciparumberechnet. Dabei wird ein im Rahmen dieser Arbeit entwickelter Fluss-Bilanz-Analyse-Ansatz verwendet, der ausgehend von in den jeweiligen Entwicklungsstadien gemessenenGenexpressionsprofilen entsprechende Flussverteilungen ableitet. Für das so ermitteltestadienspezifische Flussgeschehen ergibt sich eine gute Übereinstimmung mit bekanntenAustauschprozessen von Stoffen zwischen Parasit und infiziertem Erythrozyt. KnockoutSimulationen, die mit Hilfe einer ähnlichen Vorhersagemethode durchgeführte werden,decken essentielle metabolische Reaktionen im Netzwerk auf. Fast 90% eines Sets vonexperimentell bestimmten essentiellen Enzymen wird wiedergefunden, wenn die Annah-me getroffen wird, dass Nährstoffe nur begrenzt aus der Wirtszelle aufgenommen werdenkönnen. Die als essentiell vorhergesagten Enzyme stellen mögliche Angriffsorte für Me-dikamente dar. Anhand der Flussverteilungen, die für die einzelnen Entwicklungsstadienberechnet wurden, können diese potenziellen Targets nach Relevanz für Malaria Pro-phylaxe und Therapie sortiert werden, je nachdem, in welchem Stadium die Enzymeals aktiv vorhergesagt wurden. Dies bietet einen vielversprechenden Startpunkt für dieEntwicklung von neuen Antimalariamitteln.
Schlagwörter:Malaria, Metabolisches Netzwerk, Wirkstoff Angriffsort, Fluss-Bilanz-Analyse

Dedication
To my parents and Eugen Doce.
iv
Contents
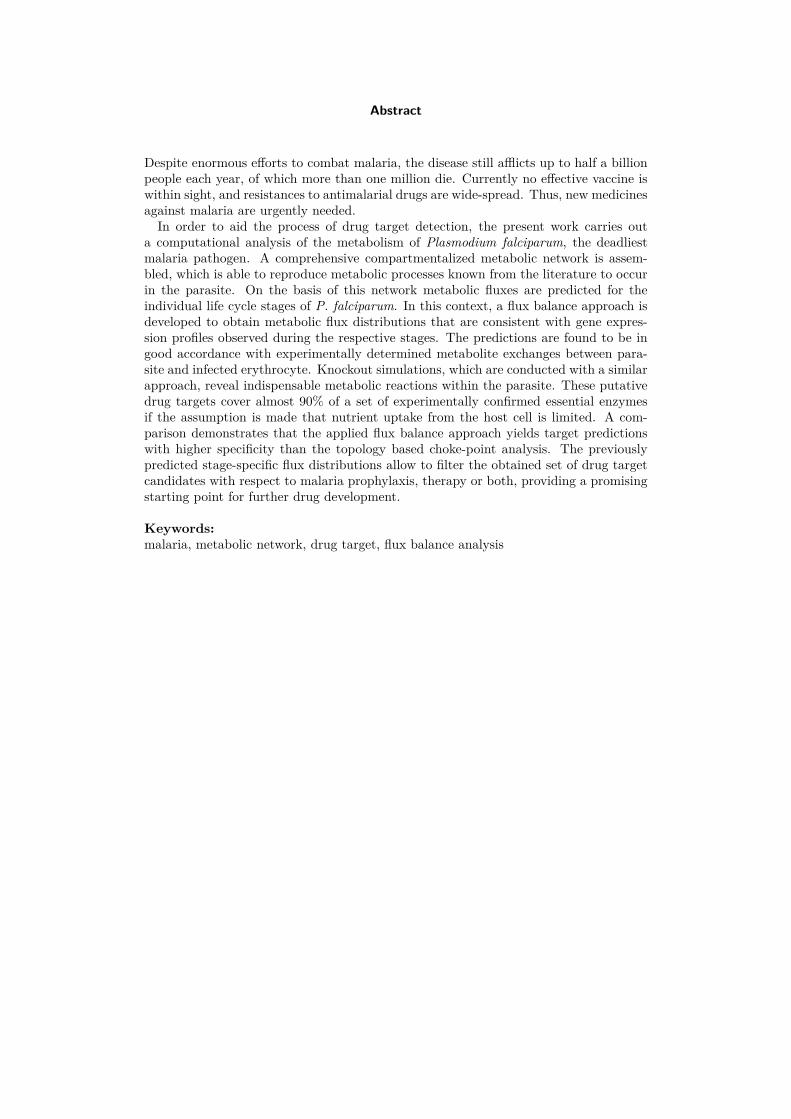
1 Introduction 11.1 Objectives of this work . . . . . . . . . . . . . . . . . . . . . . . . . . . . . . . 41.2 Outline of the working program . . . . . . . . . . . . . . . . . . . . . . . . . . 5
2 Biological background 62.1 The disease malaria . . . . . . . . . . . . . . . . . . . . . . . . . . . . . . . . 6
2.1.1 The pathogen . . . . . . . . . . . . . . . . . . . . . . . . . . . . . . . . 62.1.2 The life cycle of Plasmodium falciparum . . . . . . . . . . . . . . . . . 62.1.3 Clinical symptoms . . . . . . . . . . . . . . . . . . . . . . . . . . . . . 72.1.4 Clinical diagnostics . . . . . . . . . . . . . . . . . . . . . . . . . . . . . 82.1.5 Treatment . . . . . . . . . . . . . . . . . . . . . . . . . . . . . . . . . . 82.1.6 Prevention . . . . . . . . . . . . . . . . . . . . . . . . . . . . . . . . . 92.1.7 Malaria drug targets . . . . . . . . . . . . . . . . . . . . . . . . . . . . 10
2.2 Drug discovery pipeline . . . . . . . . . . . . . . . . . . . . . . . . . . . . . . 12
3 Available experimental data for P. falciparum 153.1 Genome-wide transcriptomic data . . . . . . . . . . . . . . . . . . . . . . . . . 15
3.1.1 Bozdech data set . . . . . . . . . . . . . . . . . . . . . . . . . . . . . . 153.1.2 Le Roch data set . . . . . . . . . . . . . . . . . . . . . . . . . . . . . . 163.1.3 Sacci data set . . . . . . . . . . . . . . . . . . . . . . . . . . . . . . . . 163.1.4 Tarun data set . . . . . . . . . . . . . . . . . . . . . . . . . . . . . . . 163.1.5 Daily data set . . . . . . . . . . . . . . . . . . . . . . . . . . . . . . . . 16
3.2 Further available high-throughput data . . . . . . . . . . . . . . . . . . . . . . 17
4 Related work 184.1 Relevant databases . . . . . . . . . . . . . . . . . . . . . . . . . . . . . . . . . 18
4.1.1 Malaria Parasite Metabolic Pathways . . . . . . . . . . . . . . . . . . 184.1.2 PlasmoCyc . . . . . . . . . . . . . . . . . . . . . . . . . . . . . . . . . 184.1.3 KEGG . . . . . . . . . . . . . . . . . . . . . . . . . . . . . . . . . . . . 194.1.4 BRENDA . . . . . . . . . . . . . . . . . . . . . . . . . . . . . . . . . . 194.1.5 Reactome . . . . . . . . . . . . . . . . . . . . . . . . . . . . . . . . . . 194.1.6 Transport Classification Database . . . . . . . . . . . . . . . . . . . . 194.1.7 Gene Ontology . . . . . . . . . . . . . . . . . . . . . . . . . . . . . . . 20
4.2 Flux balance analysis . . . . . . . . . . . . . . . . . . . . . . . . . . . . . . . . 204.2.1 MinModes . . . . . . . . . . . . . . . . . . . . . . . . . . . . . . . . . . 22
4.3 Integrating gene expression data into flux calculations . . . . . . . . . . . . . 234.3.1 GIMME algorithm . . . . . . . . . . . . . . . . . . . . . . . . . . . . . 234.3.2 Shlomi approach . . . . . . . . . . . . . . . . . . . . . . . . . . . . . . 244.3.3 E-Flux algorithm . . . . . . . . . . . . . . . . . . . . . . . . . . . . . . 25
v

Contents
4.4 Network based drug target analysis . . . . . . . . . . . . . . . . . . . . . . . . 264.4.1 Metabolic control analysis . . . . . . . . . . . . . . . . . . . . . . . . . 274.4.2 Choke-point analysis . . . . . . . . . . . . . . . . . . . . . . . . . . . . 294.4.3 Minimal cut sets . . . . . . . . . . . . . . . . . . . . . . . . . . . . . . 294.4.4 Gene knockout simulations based on flux balance analysis . . . . . . . 30
5 Metabolic Network Reconstruction 325.1 Introduction . . . . . . . . . . . . . . . . . . . . . . . . . . . . . . . . . . . . . 325.2 Metabolic network of P. falciparum . . . . . . . . . . . . . . . . . . . . . . . . 335.3 Metabolic network of the human erythrocyte host cell . . . . . . . . . . . . . 355.4 Consistency checks . . . . . . . . . . . . . . . . . . . . . . . . . . . . . . . . . 365.5 Discussion . . . . . . . . . . . . . . . . . . . . . . . . . . . . . . . . . . . . . . 38
6 Predicting life cycle specific metabolism 406.1 Introduction . . . . . . . . . . . . . . . . . . . . . . . . . . . . . . . . . . . . . 406.2 Applied gene expression profiles . . . . . . . . . . . . . . . . . . . . . . . . . . 416.3 Gene expression data mapped onto metabolic pathways . . . . . . . . . . . . 436.4 Metabolic flux predictions for different life cycle stages . . . . . . . . . . . . . 486.5 Metabolite exchange with host . . . . . . . . . . . . . . . . . . . . . . . . . . 506.6 Improved metabolic flux predictions for the blood stage . . . . . . . . . . . . 546.7 Calculated fluxes mapped onto metabolic pathways . . . . . . . . . . . . . . . 616.8 Validation with proteomics and metabolomics data . . . . . . . . . . . . . . . 616.9 Determination of fluxes with higher reliability . . . . . . . . . . . . . . . . . . 656.10 Discussion . . . . . . . . . . . . . . . . . . . . . . . . . . . . . . . . . . . . . . 68
7 Identification of putative drug targets 707.1 Introduction . . . . . . . . . . . . . . . . . . . . . . . . . . . . . . . . . . . . . 707.2 Detection of essential reactions via flux balance analysis . . . . . . . . . . . . 717.3 Essential reactions in the metabolism of P. falciparum . . . . . . . . . . . . . 727.4 Performance comparison with choke-point analysis . . . . . . . . . . . . . . . 787.5 Ranking of predicted drug targets . . . . . . . . . . . . . . . . . . . . . . . . . 797.6 Discussion . . . . . . . . . . . . . . . . . . . . . . . . . . . . . . . . . . . . . . 83
8 Conclusions and outlook 84
Applied experimental data 861 Gene expression data . . . . . . . . . . . . . . . . . . . . . . . . . . . . . . . . 862 Proteomics data . . . . . . . . . . . . . . . . . . . . . . . . . . . . . . . . . . 963 Metabolomics data . . . . . . . . . . . . . . . . . . . . . . . . . . . . . . . . . 98
Complete list of predicted essential reactions with assigned gene 100
Bibliography 112
List of Figures 159
List of Tables 161
vi

Contents
Abbreviations 161
Acknowledgements 163
Declaration 164
vii

Chapter 1
Introduction
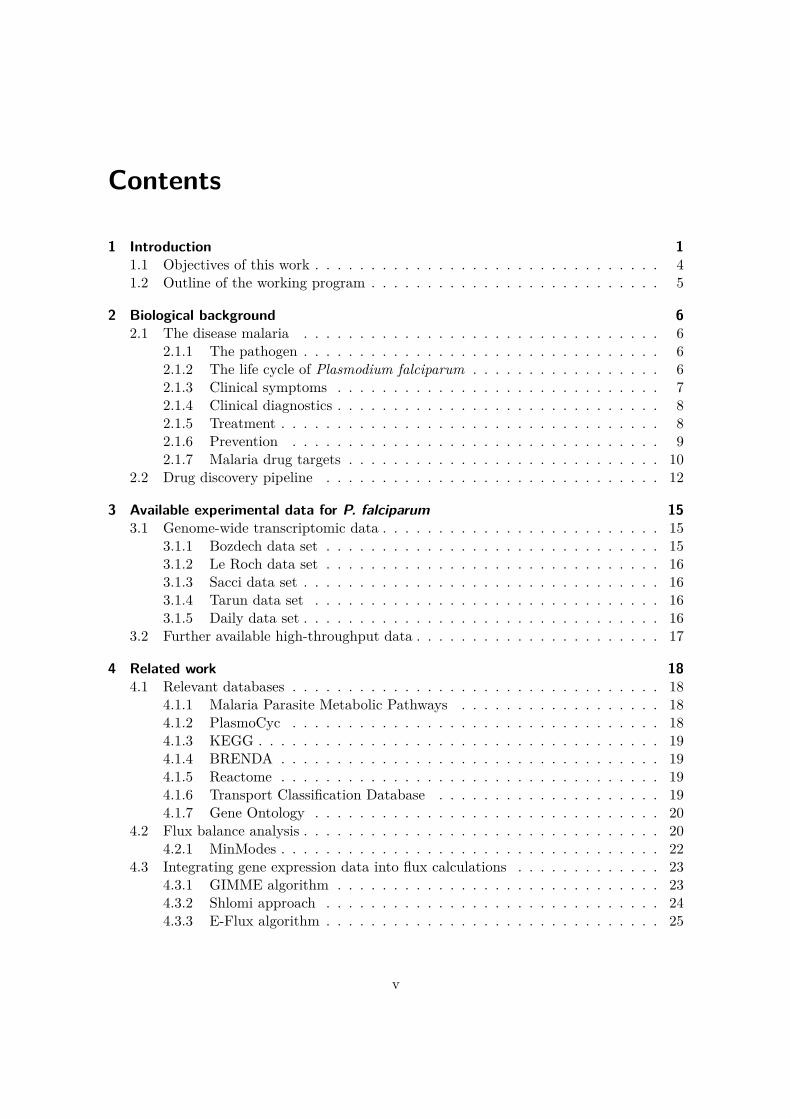
Malaria represents one of the major health issues worldwide. According to estimations ofthe World Health Organization (WHO), there were around 250 million clinical cases andalmost one million disease related deaths in 2006, of which more than half were childrenunder the age of five [545]. About 50% of the world population lives in endemic areas,situated mostly in Africa, Asia, and South-America (see Fig. 1.1). Especially in Africa,where about 90% of the malaria cases occur, the disease has significant negative impact onthe economic development [428].
Figure 1.1: Malaria endemic countries. Estimated incidences of malaria in 2006 per 1,000population (source: [545]).
The disease, which is characterized by periodical fever attacks, is caused by protozoanparasites of the genus Plasmodium. Among the five Plasmodium species that are able toinfect humans, P. falciparum is responsible for 90% of the disease related deaths. Pathogensare typically transfered by tropical mosquitoes to the human host where they first multiplywithin the liver and subsequently periodically within erythrocytes.Malaria exists presumably for more than 50,000 years [232]. It was once widespread, not
only in today’s endemic areas, but also in most of Europe and North-America. A worldwideprogram to eradicate malaria with the aid of the insecticide DDT (dichlorodiphenyltrichloro-
1
Chapter 1 Introduction
ethane) and available antimalarials was initiated in the 1950s by the WHO. The extinctionof the disease was successful in Europe, North-America, the Soviet Union and Australia,but not in underdeveloped countries in tropical areas. Nowadays, only about one thousandmalaria cases occur in Germany every year, of which all are imported from other countries.Experts see only little chances for the return of malaria to Germany, since a good health caresystem exists and a critical amount of infected people is missing. However, mosquito speciesable to transmit the disease exist in Germany and due to global warming temperatures thatare needed for pathogen development might not be uncommon in the future [578].Several non-profit initiatives, including the WHO and its Roll Back Malaria partnership,
the Bill and Melinda Gates Foundation, the Global Fund to Fight AIDS, Tuberculosis andMalaria as well as the Affordable Medicines Facility for Malaria, have recently reintroducedthe agenda of complete eradication of malaria in all countries [416]. In order to achieve thisgoal of extinction of all Plasmodium species causing malaria in humans, effective drugs andvaccines are needed to treat and prevent malaria.The malaria parasite is able to outwit the host’s immune system by hiding within host
cells and avoiding clearance through the spleen with the help of highly variable proteinsthat are transported to the surface of infected erythrocytes, allowing adherence to wallsof blood vessels. Therefore, vaccine development is challenging with the result that up tonow no approved vaccine is available to facilitate long-term malaria prophylaxis. The globalinitiative Malaria Vaccine Technology Roadmap seeks to develop a malaria vaccine by 2025that has a protective efficacy of more than 80% and lasts longer than four years [213].Currently used antimalarial drugs correspond to five major drug classes (quinolines, an-
tifolates, artemisinin derivatives, antibiotica and the ubiquinone analog atovaquone). Dueto the strong selection pressure associated with the administration of antimalarials, drugresistances have been developed in many areas [190, 14]. Recently, reduced susceptibilityeven to artemisinin-based combination therapies, the recommended first-line treatments offalciparum malaria, has been reported in western Cambodia [122]. Mechanisms of resis-tance are still uncertain for most of the currently used drugs, making the process of drugdevelopment even more complicated.As resistances to currently used antimalarials are spreading and a vaccine providing full
and long lasting protection against clinical disease is not expected to be available soon,new effective antimalarial drugs are needed. This demand has been neglected in the lastyears by the pharmaceutical industry, due to the limited buying power of the population ofdisease-endemic countries, making cost coverage of research and development investmentsuncertain. To overcome this shortage in discovery of novel antimalarials, which can be soldat affordable prices, non-profit collaborations have been established between academia andpharmaceutical industry such as the Medicines for Malaria Venture [358].A very crucial step in drug discovery is the identification of appropriate biological drug
targets, as improper target selection has been found to be the main cause for the highfailure rate of drug development [71]. Most of the currently used antimalarial drugs act onenzymes and thus interfere with the metabolism of the parasite [560, 220, 91]. This trendhas also been found for marketed small-molecule drug targets in man of which almost 50%are enzymes [208]. Therefore, investigating the metabolic network of the malaria pathogenseems to be a promising approach to identify novel drug targets.The majority of antimalarials interferes with the asexual blood stages of the parasite
and are thus suitable for treatment of disease symptoms. In order to successfully eradicate
2

Chapter 1 Introduction
malaria more drugs will be needed which additionally hamper transmission of parasites bymosquitoes and kill liver stages to prevent the onset of the disease. Thorough analysis of thepathogen’s individual life cycle stages will therefore be a prerequisite for the developmentof such drugs.Advances in high-throughput technologies such as high-throughput genome sequencing,
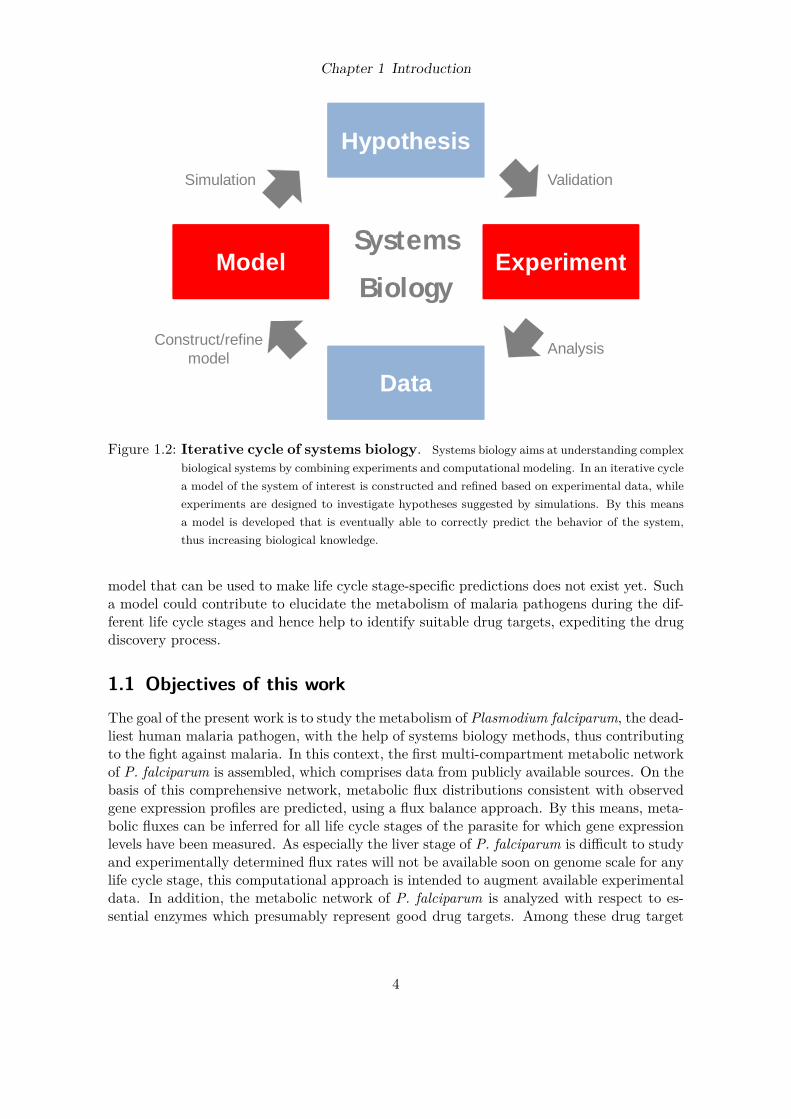
microarrays, mass-spectrometry, yeast two-hybrid assays and chromatin immunoprecipita-tion (ChIP)-chip assays have facilitated organism specific large-scale“omics” studies. It is now possible to analyze cells on a genome wide scale with respect togenomic sequences (genomics), gene expression levels (transcriptomics), expressed proteinsand posttranscriptional protein modifications (proteomics), the set of present small-moleculemetabolites (metabolomics) and physical interactions between proteins or proteins and DNA(interactomics). In order to evaluate this wealth of available large-scale data the young re-search field systems biology has evolved which has the goal to understand the complex anddynamic processes within a cell. In contrast to classical molecular biology, not only theseparate system components are considered, but also the interactions between them. Basedon experimental data, mathematical models describing the biological system are developed.Computers can therefore be used to simulate the behavior of the system of interest and topredict effects of system perturbations, e.g., the consequences of administering a drug thatinhibits a certain enzyme. In an iterative process, model derived predictions are evaluatedwith wet lab experiments, and in case experiments and prediction disagree, the model isrefined to further improve prediction quality (see Fig. 1.2). A systems biology approachhas the advantage that system wide effects of local changes can be estimated, thus revealinghow to control or optimize parts of the system. This is beneficial especially for medical ap-plications where drug targets are sought whose inhibition have large effects on the system,as well as for biotechnological applications where the yield of certain processes has to beoptimized.Comprehensive biochemical networks, including metabolic networks [360], transcriptional
regulatory networks [198, 193] and signaling networks [376], have been reconstructed andtransformed into mathematical models on the basis of experimental high-throughput data.Especially metabolic networks have become available for multiple organisms from all threemajor domains of the tree of life [12, 84, 125, 298, 174, 138, 359, 139, 218, 443]. Thesereconstructions have been the subject of different applications like metabolic engineering,drug target discovery and network property analysis (see review [360] for more details). Ingeneral, good accordance between predictions and experimental data could be observed inthese studies. For example, gene knockout simulations in yeast showed that predictionswith 95% sensitivity and 86% specificity are possible [478], suggesting that systems biologyapproaches represent a valuable strategy.Multiple studies using high-throughput technologies have been conducted to examine
malaria pathogens. Genome sequences of the species P. falciparum, P.vivax and P.knowlesiare now available [161, 75, 370] and allow comparative analysis of these organisms. Fur-thermore, the presence of gene transcripts and proteins has been evaluated for several de-velopmental stages of the parasites [59, 419, 427, 501, 147, 275, 276, 185, 112, 501]. Lately,even metabolite levels have been measured during different time points of the blood stage[503, 366]. Several groups have started to reconstruct the metabolic network of P. falci-parum [170, 561, 241, 309], and the network topology has been analyzed with respect toputative drug targets [561, 136]. However, a consistent compartmentalized computational
3
Chapter 1 Introduction
Hypothesis
Data
Model ExperimentSystems
Biology
Simulation Validation
AnalysisConstruct/refinemodel
Figure 1.2: Iterative cycle of systems biology. Systems biology aims at understanding complexbiological systems by combining experiments and computational modeling. In an iterative cyclea model of the system of interest is constructed and refined based on experimental data, whileexperiments are designed to investigate hypotheses suggested by simulations. By this meansa model is developed that is eventually able to correctly predict the behavior of the system,thus increasing biological knowledge.
model that can be used to make life cycle stage-specific predictions does not exist yet. Sucha model could contribute to elucidate the metabolism of malaria pathogens during the dif-ferent life cycle stages and hence help to identify suitable drug targets, expediting the drugdiscovery process.
1.1 Objectives of this workThe goal of the present work is to study the metabolism of Plasmodium falciparum, the dead-liest human malaria pathogen, with the help of systems biology methods, thus contributingto the fight against malaria. In this context, the first multi-compartment metabolic networkof P. falciparum is assembled, which comprises data from publicly available sources. On thebasis of this comprehensive network, metabolic flux distributions consistent with observedgene expression profiles are predicted, using a flux balance approach. By this means, meta-bolic fluxes can be inferred for all life cycle stages of the parasite for which gene expressionlevels have been measured. As especially the liver stage of P. falciparum is difficult to studyand experimentally determined flux rates will not be available soon on genome scale for anylife cycle stage, this computational approach is intended to augment available experimentaldata. In addition, the metabolic network of P. falciparum is analyzed with respect to es-sential enzymes which presumably represent good drug targets. Among these drug target
4
Chapter 1 Introduction
candidates those suitable for malaria prophylaxis or treatment can be determined with thehelp of predicted life cycle stage-specific metabolic fluxes, as such enzymes have to be activeduring the liver stage or the blood stage, respectively. Additional criteria like homology tohuman enzymes and functional similarity to therapeutic targets in other organisms help tofurther filter the set of putative targets.
1.2 Outline of the working programIn the following, an introduction to the topic malaria is given (Chapter 2), explaining thelife cycle of the pathogen as well as disease symptoms and ways to diagnose and treatthe disease. Furthermore, known antimalarial drug targets are summarized and the processunderlying the discovery of new drugs is described. Chapter 3 reviews available experimentallarge scale data for P. falciparum, in particular gene expression data, which can be usedto model the metabolism of the parasite. Databases relevant for the modeling processand related computational approaches are outlined in Chapter 4. This chapter includesmethods allowing the prediction of metabolic fluxes on the basis of gene expression dataand proposed approaches to identify putative drug targets in metabolic networks. Theassembly of the compartmentalized metabolic network of P. falciparum as well as the humanerythrocyte, one of the parasite’s host cells, is described in Chapter 5. Subsequently, theapproach applied to these networks in order to infer life cycle stage-specific metabolismis explained and predicted flux distributions are evaluated with respect to experimentallyobserved metabolite exchanges between host and parasite and in addition with proteomicsand metabolomics data (Chapter 6). Finally, putative drug targets in the metabolism of P.falciparum detected by an in silico knockout study are evaluated and ranked (Chapter 7).
5

Chapter 2
Biological background
2.1 The disease malaria2.1.1 The pathogenOriginally, people thought that malaria (ital.: mala aria = bad air) is caused by the aircoming from swamps due to disease occurrence in these areas. Only since the discoveryby Charles Louis Alphonse Laveran in 1880 of moving crescent-shaped bodies in a blooddrop from a sick soldier it is known that protozoan parasites of the genus Plasmodium causethe disease [277]. Five species are pathogenic to humans: Plasmodium falciparum, whichis responsible for 90% of the disease related deaths, Plasmodium vivax, Plasmodium ovale,Plasmodium malariae as well as the primate malaria parasite Plasmodium knowlesi.Plasmodium parasites are unicellular eukaryotes that not only use humans as hosts, but
also rodents, birds, monkeys and reptiles. Beside a nucleus the parasites possess a mitochon-drion [517], a chloroplast-like organelle without photosynthetic activity called apicoplast[403], an endoplasmic reticulum (ER) [516] and a golgi apparatus [487]. In addition, a foodvacuole [120] and secretory organelles (rhoptries, micronemes and dense granules) [245] de-velop during certain time points of the parasite’s life cycle, contributing to the differentmorphological states. The genome of P. falciparum consists of 14 nuclear chromosomes andhas a size of ∼ 23 Mb. In addition, a small linear genome exists in the mitochondrion (∼ 6kb) and a small circular genome in the apicoplast (∼ 35 kb). A first draft of the genomesequence was published in 2002 [161], revealing an unusually high percentage of A/T con-tent (80.6%). Bioinformatics approaches identified more than 5,300 open reading frames, ofwhich up to now only half are functionally annotated.
2.1.2 The life cycle of Plasmodium falciparumP. falciparum has a rather complex life cycle, since it involves different hosts and tissues[510] as depicted in Fig. 2.1. Typically, a cycle starts with an infected female anophelinemosquito taking a blood-meal and thereby injecting parasites into the human blood stream.These sporozoites travel then to the liver where they invade hepatocytes and undergo asex-ual replication known as exo-erythrocytic schizogony, which involves multiple rounds ofnuclear division without cytokinesis. In contrast to P. falciparum, Plasmodium vivax andPlasmodium ovale may rest within hepatocytes (hypnozoite stage) before they proceed withdevelopment months or even years later. The progeny of one parasite can consist of severalthousand new parasites. These so-called merozoites leave the liver in hepatocyte-derivedvesicles (merosomes) that protect the parasites from the host immune system. Merozoites
6

Chapter 2 Biological background
Merozoite Sporozoite
Merozoite
RingTrophozoite
Schizont
Macro-/Micro-gametocyte
Macro-/Micro-gametocyte
Ookinete
Oozyst
Sporozoite
SchizontMerozoite
Mos-quito
Liver
Blood
Figure 2.1: Life cycle of P. falciparum. The different parasite forms during the life cycle areannotated to the respective stages. Graphics are modified from [150, 362, 99].
released into the circulation are able to infect erythrocytes which serve the parasites as an-other nutrient resource. The intraerythrocytic developmental cycle (IDC) comprises severalstages. Due to its characteristic morphology, the early stage is referred to as the ring formwhich is followed by the trophozoite stage and the formation of schizonts. The release of upto 32 new merozoites after asexual reproduction in erythrocytes triggers the symptoms ofmalaria, since parasite specific particles are set free that activate the human immune system.In some cases parasites differentiate during the blood stage into female (macrogametocytes)and male (microgametocytes) gametocytes, which have no further activity within the humanhost. If a mosquito takes a blood meal, gametocytes get into the midgut of the mosquitowhere the environmental conditions induce the fertilization of macrogametes by microga-metes. The resultant ookinete builds a cyst on the outside of the stomach wall (oocyst),producing sporozoites (sporogony) that travel to the salivary gland of the mosquito afteroocyst rupture. Here the sporozoites wait to be reinjected into the human blood stream tostart a new cycle.
2.1.3 Clinical symptomsMalaria symptoms [177, 510] occur, depending on the the Plasmodium species, 7–15 days(P. falciparum), 12–18 days (P. vivax, P. ovale) or 18–40 days (P. malariae) subsequentto a mosquito bite. Longer periods of incubation are possible due to ineffective use ofprophylactic drugs or the formation of dormant liver forms (hypnozoites), leading to latencyperiods up to 40 years. Disease symptoms include flu-like symptoms such as fever, headache,shivering, joint pain and vomiting which makes it sometimes difficult to diagnose malaria.
7

Chapter 2 Biological background
In addition anemia, hemoglobinuria, convulsions, splenomegaly, hepatomegaly through tokidney failure, circulatory collapse and coma may occur. Malaria is characterized by acyclical onset of symptoms, every second day for P. vivax and P. ovale infections (malariatertiana) and every third day for P. malariae (malaria quartana). P. falciparum causeseither fever, recurring in periods shorter than two days, or less intensive continuous fever(malaria tropica). Malaria episodes typically start with an intense feeling of cold andvigorous shivering (cold stage), followed by fever with body temperatures of 40 ◦C (hotstage). After three to four hours temperature declines to normal accompanied by strongsweating (sweating stage). Symptoms are triggered by the rupture of infected erythrocyteswhich release not only new parasites, but also toxins, inducing the secretion of cytokines bycells of the immune system. Cytokines are responsible for the fever as well as a decreasingblood sugar level and suppression of erythrocyte production in the bone marrow. Togetherwith parasite induced lysis of erythrocytes and removal of infected cells by the spleen thismay result in severe anemia. P. falciparum is the only human malaria pathogen that isable to produce proteins which are exported to the erythrocyte cell surface and have theability to adhere to endothelial cells of blood vessels. As a consequence blood circulationis impaired in affected tissues, causing a shortage of oxygen and nutrients. Malaria mayresult in life-threatening coma (cerebral malaria) or severe adverse outcomes for pregnantwomen and their babies (placental malaria) if the central nervous system is involved or theplacenta.
2.1.4 Clinical diagnosticsThe most common technique to diagnose malaria are microscopic examinations of bloodfilms, either using thin films or thick films derived from a larger volume of blood [177, 510].While analyses of thick films are more sensitive and are therefore used in routine diagnosis,thin films allow species identification. In areas, where microscopic examinations are notpossible, immunological tests are applied that allow the detection of parasitic antigens withinminutes. However, these test are relatively expensive, are less sensitive than thick bloodfilms and are not always able to distinguish the different Plasmodium species. The mostsensitive method to malaria is polymerase chain reaction (PCR), which detects parasiticnucleic acids. But since PCR requires a specialized laboratory besides being expensive, itis not often applied. In case none of the above mentioned diagnostic tests are available,malaria may even be diagnosed upon symptoms such as periodic temperature patterns, nailbed pallor and splenomegaly.
2.1.5 TreatmentDrugs currently used to treat malaria include five classes of compounds: quinolines (qui-nine, chloroquine, amodiaquine, primaquine, mefloquine, piperaquine), antifolates (sulfa-doxine, pyrimethamine, proguanil, chlorproguanil, dapsone), artemisinin derivatives (art-emisinin, artesunate, artemether, OZ277), antibiotica (fosmidomycin, tetracyclines, clin-damycin, azithromycin) and the ubiquinone analog atovaquone [332, 91]. The first widelyused antimalarial, quinine, was extracted in 1820 from the bark of the Andean Cinchona treewhich had been used in Peru to cure malaria and then brought to Europe by Jesuits. Later,it was replaced by the more effective synthetic quinoline compound chloroquine which be-
8

Chapter 2 Biological background
came the medication of choice due to its low production costs and few side effects. However,in the last years resistances to this drug have emerged in many areas of the world [14]. Theantifolate fansidar, which consists of the active compounds sulfadoxine and pyrimethamine,became an alternative drug to chloroquine until recently it started to fail as well [14]. Theworld health organization currently advises to treat malaria on the basis of combinationtherapies, meaning the simultaneous use of two or more drugs with unrelated targets in theparasite to avoid fast progression of resistance development [368]. Artemisinin-based combi-nation therapy (ACT) are recommended as first-line treatment for uncomplicated malaria inareas experiencing resistance to older medications. Artemisinin is obtained from the plantArtemisia annua, which has been used in traditional Chinese medicine for more than 2,000years. In areas where resistances have not occurred yet, non-artemisinin based combinations(non-ACTs), including fansidar with chloroquine or amodiaquine are advised.
2.1.6 PreventionEfforts to prevent the spread of malaria include the control of mosquitos, the protectionof people from mosquito bites and the usage of prophylactic drugs. In order to reducemosquito populations, their habitats have been eliminated by draining and poisoning ofwetlands. Attempts of direct mosquito eradication have been made as well. In the 1950sthe insecticide DDT was applied in a worldwide campaign, which resulted in the eliminationof malaria among others in North-America and Europe. The discovery that DDT hasnegative effects on the environment, especially on birds, and that mosquitos had developedresistances discredited DDT. Today, insecticides are still used on the interior walls of homes(Indoor residual spraying), where mosquitos were found to rest after a blood meal. Lesscommon strategies in mosquito control are radiation and genetic modification of mosquitosto obtain species that are either steril and do not produce offspring upon mating or areresistant to malaria and therefore do not transmit the disease anymore. Prevention ofdisease transmission is the goal of bed nets which have been shown to provide protectionfrom mosquito bites, with improving results when treated with insecticides. This approachtakes advantage of the fact that Anopheles mosquitos feed at night.Another branch of malaria prevention is chemoprophylaxis which aims at stopping the
disease before the onset of symptoms. Travelers in endemic areas have the option to takeprophylactic drugs such as mefloquine (Lariam), doxycycline and the combination of ato-vaquone and proguanil hydrochloride (Malarone). Due to high costs and drug side effects,this is not applicable for residents of malarial regions.Natural immunity to malaria pathogens does only occur after repeated infection with
multiple Plasmodium strains. The acquired immunity, often referred to as malarial toler-ance, is however not a sterile protection, but keeps parasitemia densities low and people arefree of symptoms for most of the time (clinical immunity). Up to now, there are no clini-cally approved malaria vaccines available. Multiple vaccine candidates are currently underdevelopment and testing, though [507]. Most candidates are based on the circumsporozoiteprotein (CSP) which is present on the surface of sporozoites and was found to be boundby antibodies of the immune system, preventing the sporozoite from invading hepatocytes.The most promising candidate, a CSP derived vaccine, is RTS,S/AS02A, which will soonenter Phase III clinical trials [64].
9

Chapter 2 Biological background
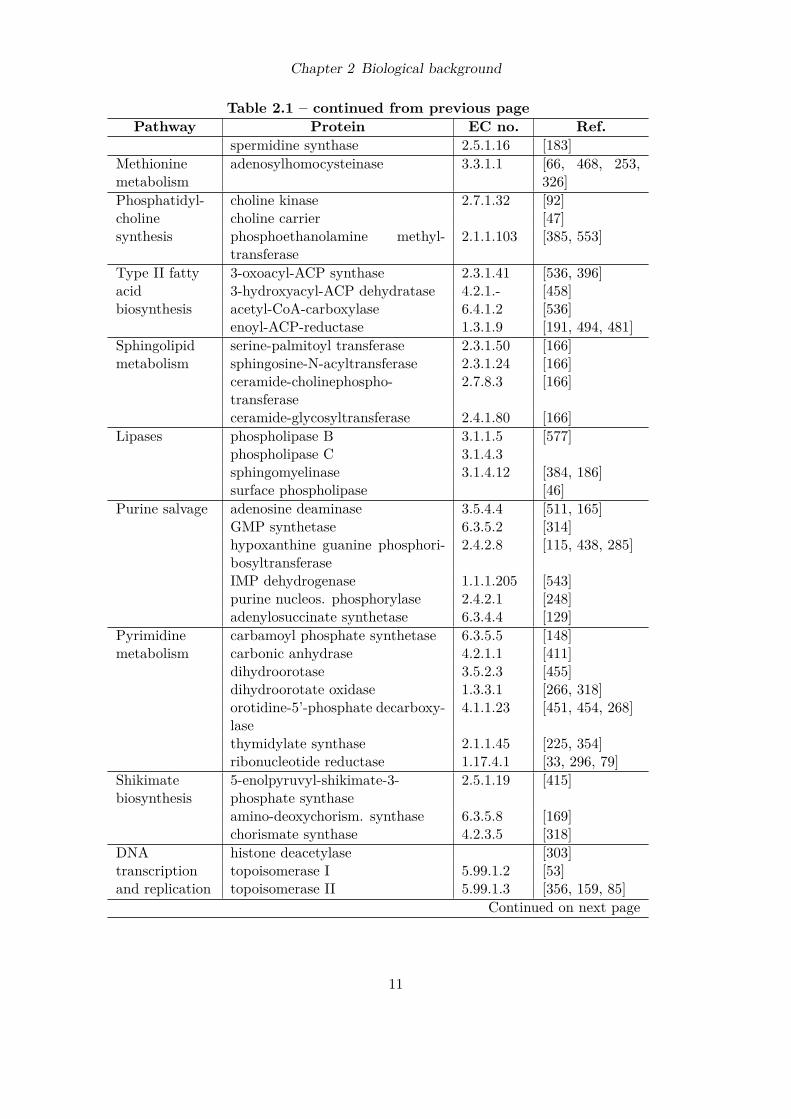
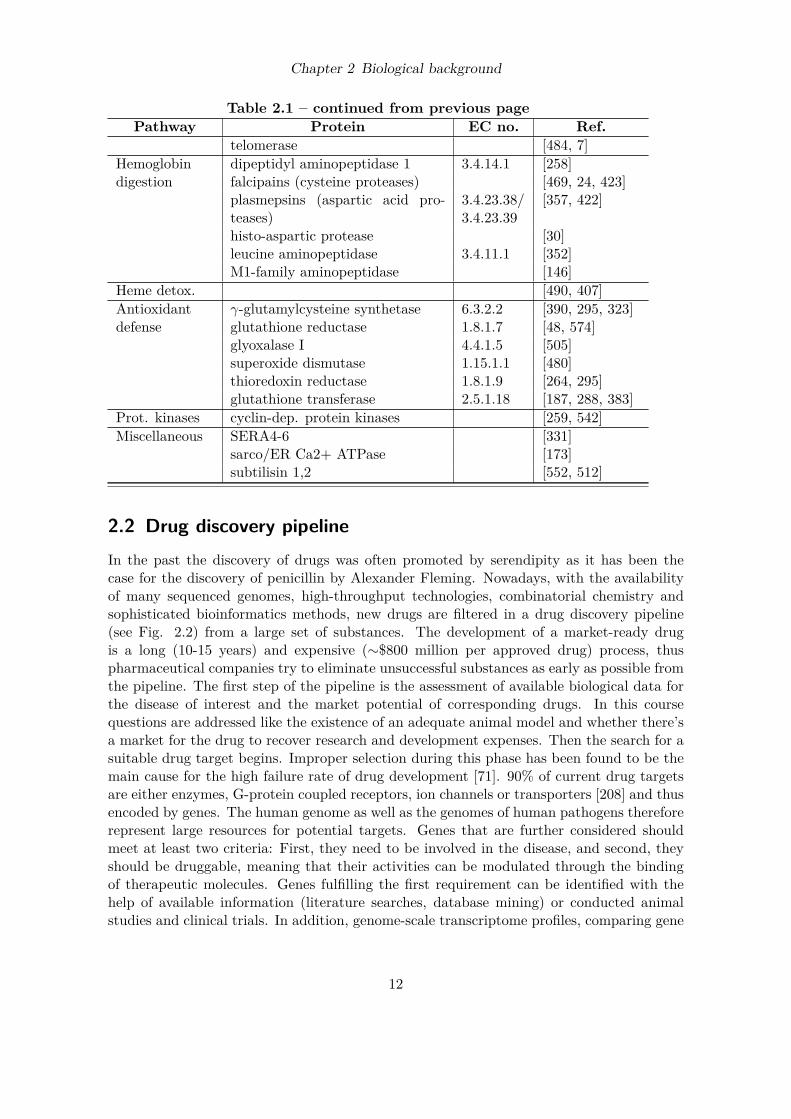
2.1.7 Malaria drug targetsMost of the currently used antimalarials either target the metabolism of the pathogen orthe detoxification of heme which is produced during hemoglobin degradation of the bloodstage. In addition, most drugs are effective during the blood stage, the stage where malariasymptoms occur. Due to the rapidly growing resistances to currently used drugs, newantimalarials are urgently needed. New drugs can be developed either by designing newmolecules inhibiting established targets or by identifying novel putative targets. Table2.1 reviews both known targets and putative novel targets for the rational design of newantimalarial drugs [560, 220, 91].
Table 2.1: Established and suggested targets for antimalarial drugs.Pathway Protein EC no. Ref.
Energymetabolism
aldolase 4.1.2.13 [541, 223]hexose transporter [229, 434]lactate dehydrogenase 1.1.1.27 [509, 74]
Mitochondrialelectrontransport
NADH dehydrogenase 1.6.5.3 [267]succinate dehydrogenase 1.3.99.1 [492]cytochrome c reductase 1.10.2.2 [144]
Folatemetabolism
dihydrofolate reductase 1.5.1.3 [347, 142, 113]dihydropteroate synthase 2.5.1.15 [347, 508, 316]
Hemebiosynthesis
δ-aminolevulinate synthase 2.3.1.37 [520, 493]δ-aminolevulinate dehydratase 4.2.1.24 [55]
Proteinbiosynthesis
ribosomes [546]threonine-tRNA ligase 6.1.1.3 [425]alanine-tRNA ligase 6.1.1.7 [102]
Proteinmodification
peptide deformylase 3.5.1.88 [60]protein-S-isoprenylcysteine-O-methyltransferase
2.1.1.100 [34, 548]
farnesyl-diphosphate farnesyl-transferase
2.5.1.58 [80]
protein farnesyltransferase [80, 547]GPIbiosynthesis
N-acetyl glucosaminylphos-phatidylinositol deacetylase
3.5.1.89 [477]
Isoprenoidbiosynthesis
1-deoxy-D-xylulose-5-phosphatereductoisomerase
1.1.1.267 [230]
2-C-methyl-D-erythritol-2,4-cyclodiphosphate synthase
4.6.1.12 [109]
Ubiquinonebiosynthesis
3-Demethylubiquinone-9,3-O-methyltransferase
2.1.1.64 [308]
Polyaminemetabolism
ornithine decarboxylase 4.1.1.17 [20, 50, 42]S-adenosylmethionine decarboxy-lase
4.1.1.50 [556]
Continued on next page
10
Chapter 2 Biological background
Table 2.1 – continued from previous pagePathway Protein EC no. Ref.
spermidine synthase 2.5.1.16 [183]Methioninemetabolism
adenosylhomocysteinase 3.3.1.1 [66, 468, 253,326]
Phosphatidyl-cholinesynthesis
choline kinase 2.7.1.32 [92]choline carrier [47]phosphoethanolamine methyl-transferase
2.1.1.103 [385, 553]
Type II fattyacidbiosynthesis
3-oxoacyl-ACP synthase 2.3.1.41 [536, 396]3-hydroxyacyl-ACP dehydratase 4.2.1.- [458]acetyl-CoA-carboxylase 6.4.1.2 [536]enoyl-ACP-reductase 1.3.1.9 [191, 494, 481]
Sphingolipidmetabolism
serine-palmitoyl transferase 2.3.1.50 [166]sphingosine-N-acyltransferase 2.3.1.24 [166]ceramide-cholinephospho-transferase
2.7.8.3 [166]
ceramide-glycosyltransferase 2.4.1.80 [166]Lipases phospholipase B 3.1.1.5 [577]
phospholipase C 3.1.4.3sphingomyelinase 3.1.4.12 [384, 186]surface phospholipase [46]
Purine salvage adenosine deaminase 3.5.4.4 [511, 165]GMP synthetase 6.3.5.2 [314]hypoxanthine guanine phosphori-bosyltransferase
2.4.2.8 [115, 438, 285]
IMP dehydrogenase 1.1.1.205 [543]purine nucleos. phosphorylase 2.4.2.1 [248]adenylosuccinate synthetase 6.3.4.4 [129]
Pyrimidinemetabolism
carbamoyl phosphate synthetase 6.3.5.5 [148]carbonic anhydrase 4.2.1.1 [411]dihydroorotase 3.5.2.3 [455]dihydroorotate oxidase 1.3.3.1 [266, 318]orotidine-5’-phosphate decarboxy-lase
4.1.1.23 [451, 454, 268]
thymidylate synthase 2.1.1.45 [225, 354]ribonucleotide reductase 1.17.4.1 [33, 296, 79]
Shikimatebiosynthesis
5-enolpyruvyl-shikimate-3-phosphate synthase
2.5.1.19 [415]
amino-deoxychorism. synthase 6.3.5.8 [169]chorismate synthase 4.2.3.5 [318]
DNAtranscriptionand replication
histone deacetylase [303]topoisomerase I 5.99.1.2 [53]topoisomerase II 5.99.1.3 [356, 159, 85]
Continued on next page
11
Chapter 2 Biological background
Table 2.1 – continued from previous pagePathway Protein EC no. Ref.
telomerase [484, 7]Hemoglobindigestion
dipeptidyl aminopeptidase 1 3.4.14.1 [258]falcipains (cysteine proteases) [469, 24, 423]plasmepsins (aspartic acid pro-teases)
3.4.23.38/3.4.23.39
[357, 422]
histo-aspartic protease [30]leucine aminopeptidase 3.4.11.1 [352]M1-family aminopeptidase [146]
Heme detox. [490, 407]Antioxidantdefense
γ-glutamylcysteine synthetase 6.3.2.2 [390, 295, 323]glutathione reductase 1.8.1.7 [48, 574]glyoxalase I 4.4.1.5 [505]superoxide dismutase 1.15.1.1 [480]thioredoxin reductase 1.8.1.9 [264, 295]glutathione transferase 2.5.1.18 [187, 288, 383]
Prot. kinases cyclin-dep. protein kinases [259, 542]Miscellaneous SERA4-6 [331]
sarco/ER Ca2+ ATPase [173]subtilisin 1,2 [552, 512]
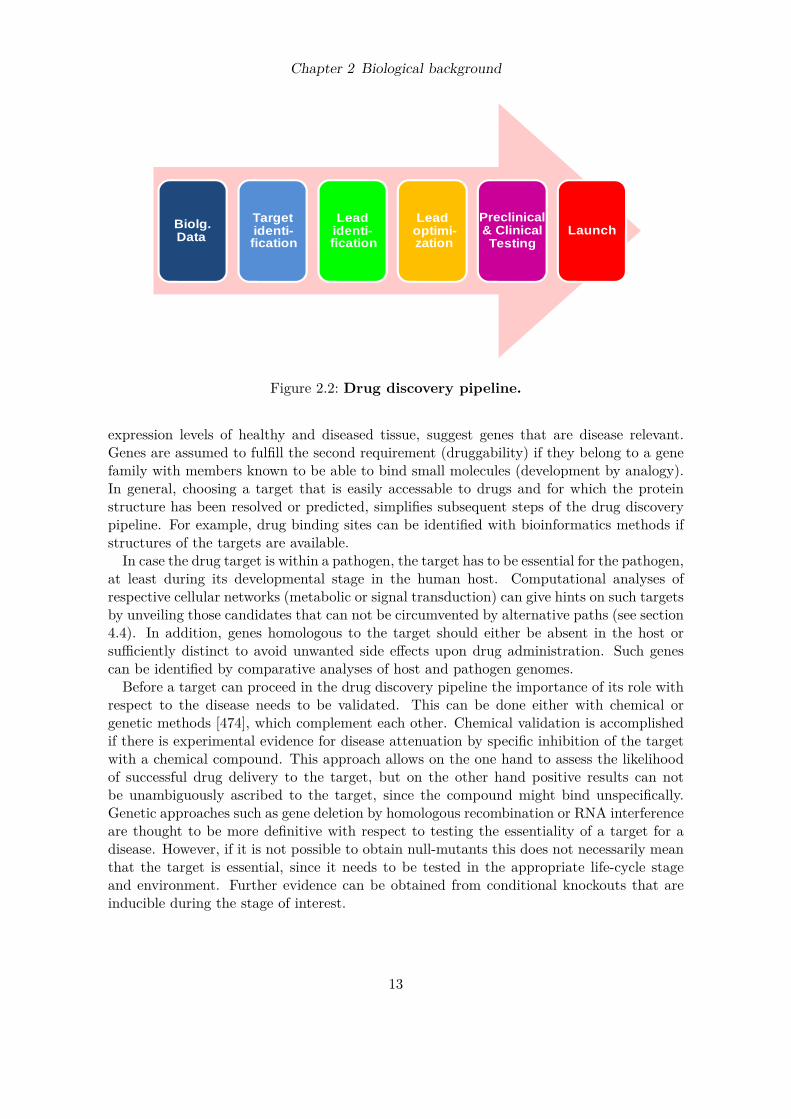
2.2 Drug discovery pipelineIn the past the discovery of drugs was often promoted by serendipity as it has been thecase for the discovery of penicillin by Alexander Fleming. Nowadays, with the availabilityof many sequenced genomes, high-throughput technologies, combinatorial chemistry andsophisticated bioinformatics methods, new drugs are filtered in a drug discovery pipeline(see Fig. 2.2) from a large set of substances. The development of a market-ready drugis a long (10-15 years) and expensive (∼$800 million per approved drug) process, thuspharmaceutical companies try to eliminate unsuccessful substances as early as possible fromthe pipeline. The first step of the pipeline is the assessment of available biological data forthe disease of interest and the market potential of corresponding drugs. In this coursequestions are addressed like the existence of an adequate animal model and whether there’sa market for the drug to recover research and development expenses. Then the search for asuitable drug target begins. Improper selection during this phase has been found to be themain cause for the high failure rate of drug development [71]. 90% of current drug targetsare either enzymes, G-protein coupled receptors, ion channels or transporters [208] and thusencoded by genes. The human genome as well as the genomes of human pathogens thereforerepresent large resources for potential targets. Genes that are further considered shouldmeet at least two criteria: First, they need to be involved in the disease, and second, theyshould be druggable, meaning that their activities can be modulated through the bindingof therapeutic molecules. Genes fulfilling the first requirement can be identified with thehelp of available information (literature searches, database mining) or conducted animalstudies and clinical trials. In addition, genome-scale transcriptome profiles, comparing gene
12
Chapter 2 Biological background
Biolg. Data
Target identi-fication
Lead identi-fication
Lead optimi-zation
& Clinical LaunchTesting
Preclinical
Figure 2.2: Drug discovery pipeline.
expression levels of healthy and diseased tissue, suggest genes that are disease relevant.Genes are assumed to fulfill the second requirement (druggability) if they belong to a genefamily with members known to be able to bind small molecules (development by analogy).In general, choosing a target that is easily accessable to drugs and for which the proteinstructure has been resolved or predicted, simplifies subsequent steps of the drug discoverypipeline. For example, drug binding sites can be identified with bioinformatics methods ifstructures of the targets are available.In case the drug target is within a pathogen, the target has to be essential for the pathogen,
at least during its developmental stage in the human host. Computational analyses ofrespective cellular networks (metabolic or signal transduction) can give hints on such targetsby unveiling those candidates that can not be circumvented by alternative paths (see section4.4). In addition, genes homologous to the target should either be absent in the host orsufficiently distinct to avoid unwanted side effects upon drug administration. Such genescan be identified by comparative analyses of host and pathogen genomes.Before a target can proceed in the drug discovery pipeline the importance of its role with
respect to the disease needs to be validated. This can be done either with chemical orgenetic methods [474], which complement each other. Chemical validation is accomplishedif there is experimental evidence for disease attenuation by specific inhibition of the targetwith a chemical compound. This approach allows on the one hand to assess the likelihoodof successful drug delivery to the target, but on the other hand positive results can notbe unambiguously ascribed to the target, since the compound might bind unspecifically.Genetic approaches such as gene deletion by homologous recombination or RNA interferenceare thought to be more definitive with respect to testing the essentiality of a target for adisease. However, if it is not possible to obtain null-mutants this does not necessarily meanthat the target is essential, since it needs to be tested in the appropriate life-cycle stageand environment. Further evidence can be obtained from conditional knockouts that areinducible during the stage of interest.
13

Chapter 2 Biological background
When the target is settled a lead molecule that binds to the target is sought. High-throughput screening (HTS) approaches that rely on miniaturized and automated assaysallow to test large libraries of compounds within a short time. If the 3D structure of a targetprotein is known, the binding affinity of small molecules can alternatively be predicted bycomputer-aided virtual screening approaches, or a compound that fits into the bindingpocket can be designed de novo. Those compounds (leads) that show high affinity for thetarget are further optimized to increase selectivity and reduce toxicity. In this context, aset of molecules that is structurally related to the lead compound is generated by means ofcombinatorial chemistry and subsequently tested.After the lead optimization process is finished, pharmacokinetics and pharmacodynamics
are tested in preclinical trials with animals. If these trials are successful the drug candidateis tested with a small number of healthy humans (clinical phase I). In clinical phase II thedrug is administered to up to 500 hundred patients suffering from the respective diseaseand in clinical phase III to more than 1,000 patients. If the drug is then approved bythe authorities of a country, commercialization of the drug may start and finally amortizeresearch and development costs.
14

Chapter 3
Available experimental data for P. falciparum
The modeling process of cellular systems is always accompanied by experimental data suchas kinetic constants which build a foundation for the computational model. With the adventof high-throughput techniques several types of experimental data have become available ongenome-scale such as transcriptomic [59, 419, 427, 112, 501], proteomic [147, 185, 501] andprotein interaction data [273]. Compared to proteomics and metabolomics data [503] moredata is on-hand from measurements of gene transcript levels, providing a broad basis forcomputational simulations.
3.1 Genome-wide transcriptomic dataMicroarrays facilitate the analysis of the transcriptome and genomic characteristics of cellsin a high-throughput manner. Corresponding experiments basically consist of three steps.In the first step, the array is designed and produced. Then data are collected during theactual experiment which includes tissue preparation, mRNA isolation, mRNA labeling,hybridization and scanning. Finally, scanner images are analyzed, data points normalizedand further evaluated in order to extract the underlying information. Different types ofmicroarrays are available that vary with respect to the following aspects of the productionprocess and application:
• array probes: cDNA (complementary DNA; obtained from mRNA by RT-PCR) vs.oligo (synthesized short DNA fragments)
• probe fixation: spotting (spotting robot immobilizes probes on array) vs. in-situprobe synthesis (probes are synthesized on array)
• one color (absolute experiment: only one sample per array) vs. two color exper-iment (comparative experiment: two samples labeled with different fluorophores arehybridized on same array)
In the last years several genome-scale experiments have been conducted, giving an insighton the transcriptome of malaria pathogens during different life cycle stages.
3.1.1 Bozdech data setOne of the first genome-scale transcriptome studies of P. falciparum was published byBozdech et al. in 2003 [59]. Custom designed DNA microarrays with oligonucleotidesrespresenting predicted open reading frames (ORFs) were used to monitor gene expressionduring the intraerythrocytic developmental cycle (IDC) on an one hour timescale resolution.
15

Chapter 3 Available experimental data for P. falciparum
The individual mRNA samples were hybridized in a comparative experiment against areference pool comprising all extracted samples. The study revealed that the majority ofgenes was expressed during the IDC, leaving only a small percentage of genes specific toother developmental stages. Furthermore, about three quarters of those genes that weretranscribed during the IDC were found to be activated only once during the 48 hours cycle.Evaluation of functionally annotated genes showed that the presence of gene transcriptscorrelates well with the biological function of the respective proteins.
3.1.2 Le Roch data setAn approach for gene function annotation with the help of expression profiling [419] waspresented by Le Roch and colleagues. In this context they measured gene expression in P.falciparum during the mosquito stage (salivary gland sporozoite), the sexual stage (game-tocytes present in human blood) and seven time points of the erythrocytic asexual stage(early and late ring stage, early and late trophozoite, early and late schizont, and merozoite).Gene transcript levels were analyzed in an one-color approach with custom designed high-density oligonucleotide arrays covering predicted coding and non-coding sequences. Thestudy demonstrated that genes with similar functions exhibit similar expression profiles andthus microarray experiments can be used to further annotate functionally uncharacterizedgenes.
3.1.3 Sacci data setGene expression during the liver stage of malaria pathogen development was analyzed ongenome-scale for the first time by Sacci et al. in 2005 [427]. Due to difficulties in theseanalyses for the human parasite, they constructed a liver stage cDNA library for the rodentparasite P. yoelii. Liver stage schizonts were extracted by laser capture microdissection.Subsequently, mRNA was isolated, transcribed into cDNA and amplified. BLAST searcheswith the sequenced cDNAs identified genes expressed during late liver stage.
3.1.4 Tarun data setRecently, another transcriptome study for P. yoelii has been published by Tarun and col-leagues [501], covering three time points during the liver stage (24 h, 40 h, and 50 h post-infection) which they compared to two time points during the mosquito stage (10 days(midgut) and 15 days (salivary gland) after blood meal) and two time points during theblood stage (schizont and mixed blood stages). For efficient isolation of infected hepatocytes,green fluorescent protein-tagged parasites and fluorescence activated cell sorting were uti-lized. Parasitic liver stages were found to be highly metabolically active with up-regulatedmitochondrial activity.
3.1.5 Daily data setBoth above mentioned gene expression data sets covering the blood stage of P. falciparumare obtained from blood cultures and thus might not fully reflect in vivo gene expression. Incontrast, the genome-scale transcriptome study presented by Daily and coworkers assesses43 samples derived from the blood of P. falciparum infected patients which contain mostly
16

Chapter 3 Available experimental data for P. falciparum
ring stages of the parasite [112]. These samples were found to correspond to three groups:starvation response accompanied by metabolism of alternative carbon sources (cluster 1),active growth based on glycolytic metabolism (cluster 2) and environmental stress response(cluster 3).
3.2 Further available high-throughput dataMost of the large-scale studies conducted for P. falciparum examined the transcriptomeof the parasite [59, 419, 112, 576] thanks to the relatively simple microarray technologythat allows to measure mRNA levels of thousands of genes simultaneously. Fewer timepoints of the parasite’s life cycle have been analyzed with respect to present proteins. ForP. falciparum protein profiles of the blood stage [147, 275] as well as the mosquito stage[147, 275, 276] have been determined. Up to now, the liver stage proteome has only beenanalyzed for the rodent malaria pathogen P. yoelii. Mass spectrometry studies investigatingthe proteome of the parasite recovered less protein species than were suggested to be presentby transcriptome analyses [501]. This might be due to varying levels of sensitivity inherentto the detection methods.Physical interactions between proteins have been assayed with a yeast two-hybrid system
that revealed almost 3,000 unique interactions. A lot less is known about the metabolome ofP. falciparum. About 50 metabolites have been identified by NMR spectroscopy in maturetrophozoites [503] and about 90 in a liquid chromatography-tandem mass spectrometrystudy that analyzed seven time points of the intraerythrocytic developmental cycle [366].
17

Chapter 4
Related work
4.1 Relevant databases4.1.1 Malaria Parasite Metabolic PathwaysA fundamental resource for information about the metabolism of Plasmodium falciparum isthe Malaria Parasite Metabolic Pathways (MPMP) website (http://sites.huji.ac.il/malaria/) designed by H. Ginsburg [170], whose concern was to present available informa-tion in a clear and educative way. The website is structured in more than 100 maps, notonly describing classical metabolic pathways and metabolite transport, but also biologicalprocesses such as cell-cell interaction, replication, transcription and translation. Metabolicpathway maps were manually derived from the KEGG database and adapted accordingto the present knowledge of parasite biochemistry and annotations of the P. falciparumgenome. Pathways were considered to occur in P. falciparum if either most enzymes aresuggested by genome annotation or biochemical evidences imply their functionality. Thus,certain enzymes may not be associated with any gene. Each enzyme entry is linked to sup-plementary information from other databases, including PlasmoDB, GeneDB, BRENDAand ExPASy ENZYME. In addition, enzymes are graphically annotated with informationon inhibitors as well as a 48h clock that displays gene transcription during the blood stage.
4.1.2 PlasmoCycPlasmoCyc (http://plasmocyc.stanford.edu/) is a metabolic pathway data-base derived from the genome annotations of Plasmodium falciparum. A first draft ofPlasmoCyc was generated computationally with the PathoLogic software [372], which re-quires a reference pathway database as input in addition to the genome annotation. Basedon annotated gene product qualifiers and EC numbers PathoLogic infers biochemical reac-tions that occur within an organism. The more reactions of a pathway contained in thereference pathway database are predicted, the more likely is the presence of the respectivepathway in the organism. The resulting network was complemented with pathways fromthe Malaria Parasite Metabolic Pathways website as well as reactions extracted from sci-entific literature. The online interface of the PlasmoCyc database visualizes the metabolicnetwork in the form of pathway maps. Enzymatic reactions are linked to more detailedrepresentations with chemical structures of involved metabolites as well as information onthe protein subunits of enzyme complexes. PlasmoCyc is integrated into the BioCyc websitewhich provides a collection of organism-specific pathway databases.
18
Chapter 4 Related work
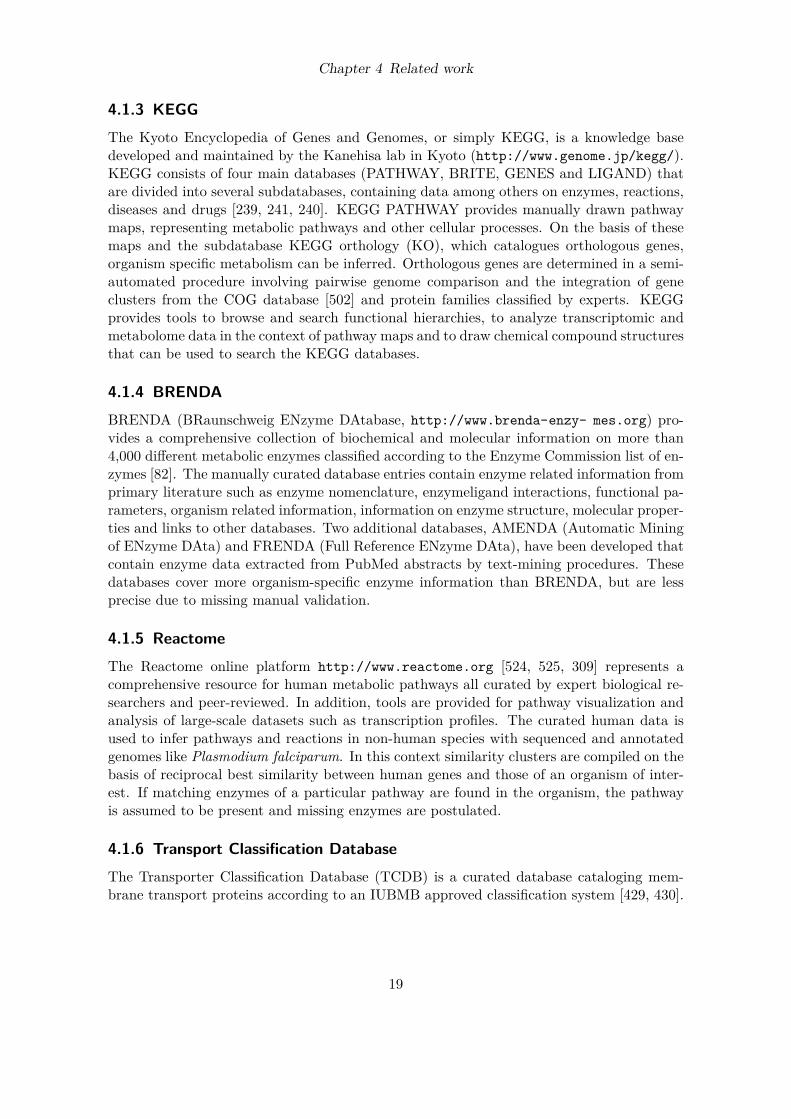
4.1.3 KEGGThe Kyoto Encyclopedia of Genes and Genomes, or simply KEGG, is a knowledge basedeveloped and maintained by the Kanehisa lab in Kyoto (http://www.genome.jp/kegg/).KEGG consists of four main databases (PATHWAY, BRITE, GENES and LIGAND) thatare divided into several subdatabases, containing data among others on enzymes, reactions,diseases and drugs [239, 241, 240]. KEGG PATHWAY provides manually drawn pathwaymaps, representing metabolic pathways and other cellular processes. On the basis of thesemaps and the subdatabase KEGG orthology (KO), which catalogues orthologous genes,organism specific metabolism can be inferred. Orthologous genes are determined in a semi-automated procedure involving pairwise genome comparison and the integration of geneclusters from the COG database [502] and protein families classified by experts. KEGGprovides tools to browse and search functional hierarchies, to analyze transcriptomic andmetabolome data in the context of pathway maps and to draw chemical compound structuresthat can be used to search the KEGG databases.
4.1.4 BRENDABRENDA (BRaunschweig ENzyme DAtabase, http://www.brenda-enzy- mes.org) pro-vides a comprehensive collection of biochemical and molecular information on more than4,000 different metabolic enzymes classified according to the Enzyme Commission list of en-zymes [82]. The manually curated database entries contain enzyme related information fromprimary literature such as enzyme nomenclature, enzymeligand interactions, functional pa-rameters, organism related information, information on enzyme structure, molecular proper-ties and links to other databases. Two additional databases, AMENDA (Automatic Miningof ENzyme DAta) and FRENDA (Full Reference ENzyme DAta), have been developed thatcontain enzyme data extracted from PubMed abstracts by text-mining procedures. Thesedatabases cover more organism-specific enzyme information than BRENDA, but are lessprecise due to missing manual validation.
4.1.5 ReactomeThe Reactome online platform http://www.reactome.org [524, 525, 309] represents acomprehensive resource for human metabolic pathways all curated by expert biological re-searchers and peer-reviewed. In addition, tools are provided for pathway visualization andanalysis of large-scale datasets such as transcription profiles. The curated human data isused to infer pathways and reactions in non-human species with sequenced and annotatedgenomes like Plasmodium falciparum. In this context similarity clusters are compiled on thebasis of reciprocal best similarity between human genes and those of an organism of inter-est. If matching enzymes of a particular pathway are found in the organism, the pathwayis assumed to be present and missing enzymes are postulated.
4.1.6 Transport Classification DatabaseThe Transporter Classification Database (TCDB) is a curated database cataloging mem-brane transport proteins according to an IUBMB approved classification system [429, 430].
19

Chapter 4 Related work
Similar to the Enzyme Commission (EC) system for classification of enzymes, TCDB pro-vides a classification of membrane transport proteins and in addition information aboutprotein sequence, structure and function as well as evolutionary information about trans-port systems from multiple organisms including P. falciparum. The database is hosted athttp://www.tcdb.org/ and currently encompasses about 5,000 representative transportersand putative transporters in more than 500 families which were compiled from primary lit-erature. Several tools are offered that allow to classify newly identified membrane proteinsand to annotate genome sequences.
4.1.7 Gene OntologyThe goal of the Gene Ontology (GO) initiative is to provide a controlled vocabulary thatstandardizes attributes assigned to genes and gene products to describe their roles in anyorganism [19]. Attributes are related to three main categories: cellular component, biologicalprocess and molecular function. Each of these categories is structured as a hierarchicaldirected acyclic graph where terms are linked by either of the two relationships “is-a” or“part-of”. Terms can have several parent terms and several child terms. Multiple databasesincluding PlasmoDB, the Plasmodium genome resource [22], have already annotated theirdata with GO terms and provide references to support the annotations. This data is availableat http://www.geneontology.org together with tools to access and process the data.
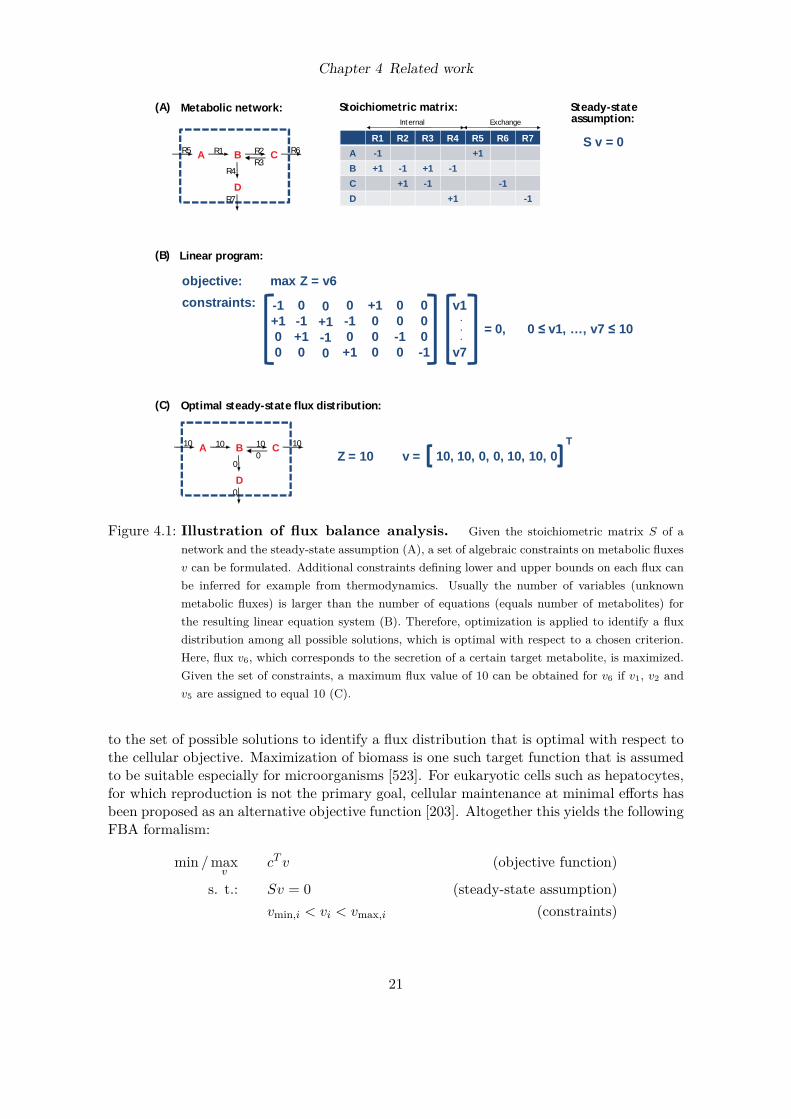
4.2 Flux balance analysisFlux balance analysis (FBA) is a commonly used method to investigate the metabolic capa-bilities of cellular systems, since it allows to estimate unknown fluxes in metabolic networkswith respect to cellular constraints [130, 394, 138, 280, 125, 139, 218, 298, 365, 12, 84, 137,359, 398, 337, 360, 404] (see Fig. 4.1 for illustration). Among others, FBA has been usedfor metabolic engineering studies [387, 281], drug target prediction [233, 135, 279] as well asgrowth prediction on different media [320, 522]. In contrast to kinetic modeling, no detailedrate equations are required, predestining the method for large metabolic networks whichlack full kinetic characterization of all enzymes. Prerequisite is rather the stoichiometricmatrix S, which describes the number of metabolite molecules consumed and producedby each reaction of the metabolic network, as well as knowledge about the cellular objec-tive. The basis of FBA is the flux balance principle which assumes the system to be atquasi steady-state, as biochemical reactions are typically much faster than changes in thephenotype of a cell during growth or differentiation. Thus, the sum of fluxes producing ametabolite equals the sum of fluxes consuming the metabolite:
Sv = 0
where v is the metabolic flux vector, containing internal metabolite fluxes as well as exchangefluxes. The solution space of the resultant linear equation system is a high dimensionalflux cone, containing all flux configurations that are feasible at steady-state. Constraintsderived from thermodynamics and cellular environment conditions further restrict the so-lution space. Organisms are thought to be optimized in the course of evolution. Therefore,a biologically meaningful objective function, which is a linear function of fluxes, is applied
20
Chapter 4 Related work
BA C
D
R1 R2 R3 R4 R5 R6 R7A -1 +1B +1 -1 +1 -1C +1 -1 -1D +1 -1
R1 R2R3
R4
R5 R6
R7
Internal Exchange
S v = 0
Steady- -state
Linear program:
objective: max Z = v6constraints: -1
+100
0-1+10
0+1-10
0-10
+1
+1000
00-10
000-1
v1
v7
.
.
.= 0, 0 ≤ v1, …, v7 ≤ 10
Optimal steady-state flux distribution:
BA C
D
10 100
0
10 10
0
Z = 10T
10, 10, 0, 0, 10, 10, 0v =
Metabolic network: Stoichiometric matrix:assumption:
(A)
(B)
(C)
Figure 4.1: Illustration of flux balance analysis. Given the stoichiometric matrix S of anetwork and the steady-state assumption (A), a set of algebraic constraints on metabolic fluxesv can be formulated. Additional constraints defining lower and upper bounds on each flux canbe inferred for example from thermodynamics. Usually the number of variables (unknownmetabolic fluxes) is larger than the number of equations (equals number of metabolites) forthe resulting linear equation system (B). Therefore, optimization is applied to identify a fluxdistribution among all possible solutions, which is optimal with respect to a chosen criterion.Here, flux v6, which corresponds to the secretion of a certain target metabolite, is maximized.Given the set of constraints, a maximum flux value of 10 can be obtained for v6 if v1, v2 andv5 are assigned to equal 10 (C).
to the set of possible solutions to identify a flux distribution that is optimal with respect tothe cellular objective. Maximization of biomass is one such target function that is assumedto be suitable especially for microorganisms [523]. For eukaryotic cells such as hepatocytes,for which reproduction is not the primary goal, cellular maintenance at minimal efforts hasbeen proposed as an alternative objective function [203]. Altogether this yields the followingFBA formalism:
min /maxv
cT v (objective function)
s. t.: Sv = 0 (steady-state assumption)vmin,i < vi < vmax,i (constraints)
21

Chapter 4 Related work
where c is the vector of linear combination coefficients and vmin and vmax are the lower andupper bounds on fluxes.
4.2.1 MinModesDetermining metabolic fluxes that are linked to certain cellular functions is often a difficulttask, especially in large metabolic networks. To avoid tedious experiments several structuralanalysis concepts have been developed, including elementary modes and extremal pathways[442, 449]. These methods explore for a given metabolic network all routes (modes) con-verting substrates into output metabolites. The main disadvantage of these methods is thelarge number of modes arising from combinatorial multiplicity when network size increases.The concept of MinModes (see Fig. 4.2) is an approach based on flux balance analysis todecompose flux distributions into a manageable number of functionally interpretable modes[201]. A MinMode is defined as a minimal steady-state flux distribution that allows forthe production of a exactly one target metabolite, corresponding to a certain functionalrequirement of the cell. The underlying assumption is that flux distributions are basicallysuperpositions of multiple MinModes with different relative intensities, which are reflectedin the coefficients of the linear combination. Thus, comparing the coefficients of two fluxdistributions decomposed into MinModes unveils directly changes in cellular functions.
X
A B C
D E
H
GF
MinMode( X )
A B C
Figure 4.2: MinMode illustration. A MinMode is defined as a steady-state flux distribution whichis optimal with respect to the flux minimization principle (sum of non-zero fluxes is minimal)and yields a single unit of the metabolite of interest. In the illustrated example network theMinMode for metabolite X is indicated by the red line.
22

Chapter 4 Related work
4.3 Integrating gene expression data into flux calculationsGenome sequence analysis only reveals which metabolic reactions could possibly occurwithin an organism, but not which reactions are actually active during a certain time point,not to mention the quantitative contributions of each reaction. Objective functions repre-senting cellular goals are supposed to drive flux balance analysis to the identification of trueflux distributions. However, considering that currently no organism is fully characterized,suggests that proposed objective functions do not fully cover the true cellular objectives.Furthermore, organisms might pursue different goals during different stages of their lifes-pan and cells of multi-cellular organisms might even fulfill different tasks depending on thetissue. A hint on the cellular status can be provided by gene expression experiments whichmonitor the presence of gene transcripts during a certain time point and allow inferenceson the subsequent presence of corresponding enzymes. Integration of gene expression datainto flux balance calculations therefore has the potential to improve the modeling of cellularmetabolism.
4.3.1 GIMME algorithmA straight forward way to integrate transcriptomic data into FBA was proposed by Åkessonet al. [4]. The basic assumption is that if a gene is not expressed, the corresponding enzymeis absent and thus the respective reaction is not catalyzed. In FBA calculations this isimplemented as additional constraints that keep fluxes through reactions to zero if enzymesare not present, thereby reducing the feasible solution space. Improved predictions of themetabolic behavior of yeast cells in batch cultures were obtained with this approach. Due tothe simplicity of this approach, no flux distributions can be predicted if required metabolicfunctionalities can not be achieved without enzymes suggested by gene expression data tobe absent.An approach solving this problem was published by Becker and Palsson [38] who named
their method GIMME (Gene Inactivity Moderated by Metabolism and Expression, see Fig.4.3). Similar to the Åkesson approach, reactions with expression values below a certainthreshold are removed from the network, and an optimal flux distribution is sought thatmeets the required metabolic functionalities. In case the problem is infeasible, optimizationis used to find the most consistent set of reactions to obtain a valid flux distribution:
min∑
ci | vi |
s. t.: Sv = 0ai < vi < bi
ci ={xcutoff − xi if xcutoff > xi
0 otherwise
where xi is the corresponding gene expression value and xcutoff a threshold above whichenzyme presence is assumed. The degree of inconsistency between predicted fluxes and geneexpression data is given by the value of the objective function.
23
Chapter 4 Related work
AC E
FE2
T1E1
E4
E5 obj = 10E3
B D
E6
cell cannot achieve desired functionality (obj) without at leastone of the inactive reactions
AC E
F10
100
10
0 obj = 100
B D
10
Inconsistency Score= 10*(10-9)= 10
AC E
F0
1010
0
10 obj = 1010
B D
0
Inconsistency Score= 10*(10-1) + 10*(10-2) + 10*(10-1)= 260
Lowest Inconsistency Score
Expression above threshold
Expression below threshold
Enzyme Expression
E1 1
E2 30
E3 2
E4 9
E5 1
E6 40
T1 20
Threshold = 10(A)
(B)
(C)
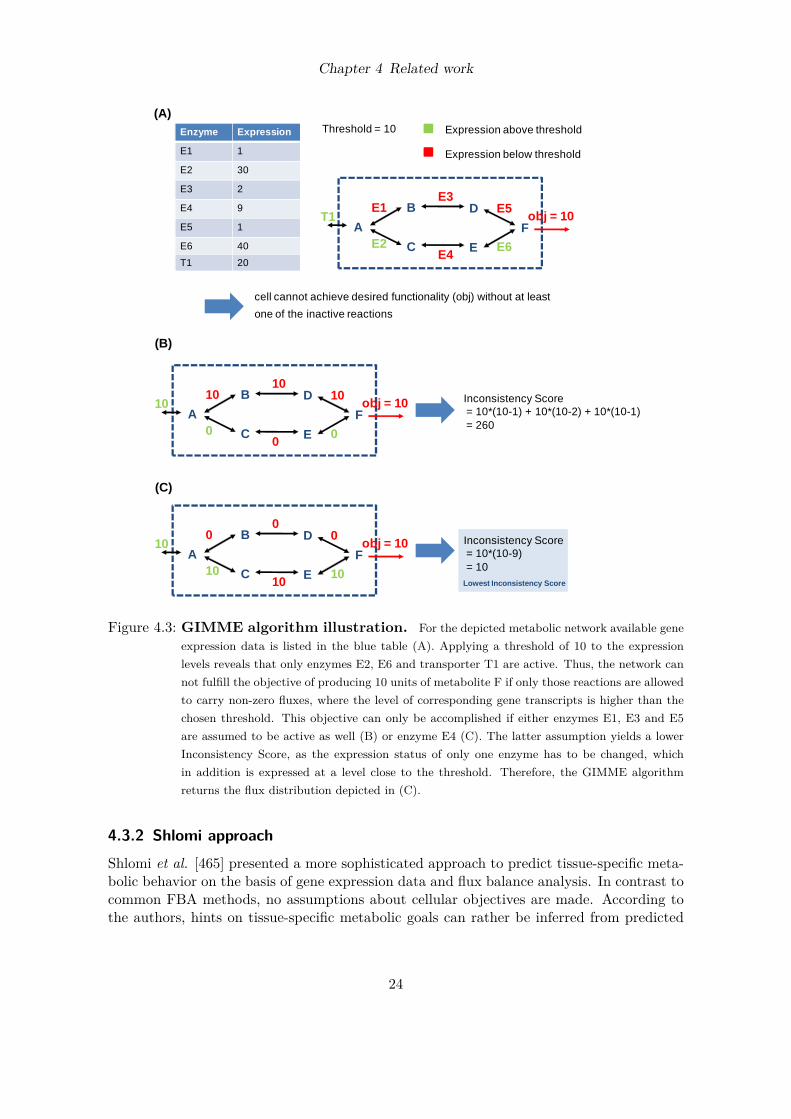
Figure 4.3: GIMME algorithm illustration. For the depicted metabolic network available geneexpression data is listed in the blue table (A). Applying a threshold of 10 to the expressionlevels reveals that only enzymes E2, E6 and transporter T1 are active. Thus, the network cannot fulfill the objective of producing 10 units of metabolite F if only those reactions are allowedto carry non-zero fluxes, where the level of corresponding gene transcripts is higher than thechosen threshold. This objective can only be accomplished if either enzymes E1, E3 and E5are assumed to be active as well (B) or enzyme E4 (C). The latter assumption yields a lowerInconsistency Score, as the expression status of only one enzyme has to be changed, whichin addition is expressed at a level close to the threshold. Therefore, the GIMME algorithmreturns the flux distribution depicted in (C).
4.3.2 Shlomi approachShlomi et al. [465] presented a more sophisticated approach to predict tissue-specific meta-bolic behavior on the basis of gene expression data and flux balance analysis. In contrast tocommon FBA methods, no assumptions about cellular objectives are made. According tothe authors, hints on tissue-specific metabolic goals can rather be inferred from predicted
24

Chapter 4 Related work
metabolite uptake and secretion. The concept of the Shlomi approach is to maximize theconformity of metabolic fluxes with the expression status of corresponding genes, but notto insist on total agreement like the Åkesson approach in the case of unexpressed genes (seeFig. 4.4). This takes into account post-transcriptional regulation, which arranges that onthe one hand certain gene transcripts are not translated into enzymatic proteins, while onthe other hand, certain gene transcripts present at almost undetectable levels are trans-lated with high efficiency. The corresponding mixed integer linear programming problem isformulated as follows:
maxv,y0,y1p,y1n
∑i∈RNE
y0,i +∑
i∈RE
(y1p,i + y1n,i) (4.1)
s. t.: Sv = 0 (4.2)vmin ≤ v ≤ vmax (4.3)vi + y1p,i(vmin,i − ε) ≥ vmin,i, ∀i ∈ RE (4.4)vi + y1n,i(vmax,i + ε) ≤ vmax,i, ∀i ∈ RE (4.5)vmin,i(1− y0,i) ≤ vi ≤ vmax,i(1− y0,i), ∀i ∈ RNE (4.6)v ∈ Rm (4.7)y0,i, y1p,i, y1n,i ∈ [0, 1] (4.8)
where v is the flux vector and S the stoichiometric matrix describing the topology of themetabolic network. The steady-state assumption is ensured by (4.6). Thermodynamicconstraints restricting flux directions are imposed on the solution space by (4.7). Twoboolean variables (y1p,i, y1n,i) are introduced for reactions corresponding to expressed genes(RE). Inequalities (4.8) and (4.9) enforce fluxes in forward or backward direction to be largerthan threshold ε = 1 if the respective boolean variables are set to 1. Similar, inequality(4.10) guarantees that reactions associated with unexpressed genes (RNE) do not carry anyflux if the boolean variables y0,i are equal to 1. The sum of these binary variables composesthe objective function that is sought to be maximized, in order to obtain flux distributionsthat are consistent with corresponding expression profiles.This approach was applied to predict tissue-specific metabolism for ten human tissues in-
cluding liver, brain and heart. Comparisons with available data sources for tissue specificityof genes, reactions and metabolites showed significant correlations between predictions andthese data sets.
4.3.3 E-Flux algorithmVery recently Colijn et al. proposed a novel method called E-Flux to infer the metabolicstatus of a cell from gene expression profiles [96]. Like the approaches reviewed in theprevious sections, E-Flux extends the flux balance analysis concept. The basic idea is tointroduce lower and upper flux bounds for all reactions of a metabolic network as a functionof measured gene expression (see Fig. 4.5). Upper flux bounds are set to the expressionvalues of corresponding genes and are normalized with respect to the highest bound. If areaction is catalyzed by an enzyme complex, the minimum expression value of all complexcomponents is chosen as an upper flux bound. In case of isozymes catalyzing the samereaction, the upper flux bound is set to the sum of all corresponding expression values.
25
Chapter 4 Related work
A
B C
D
F
E
G
E1
E2
E3E4
T1
T2
Highly expressed
Lowly expressed
Downregulated
Active reactionInactive reaction
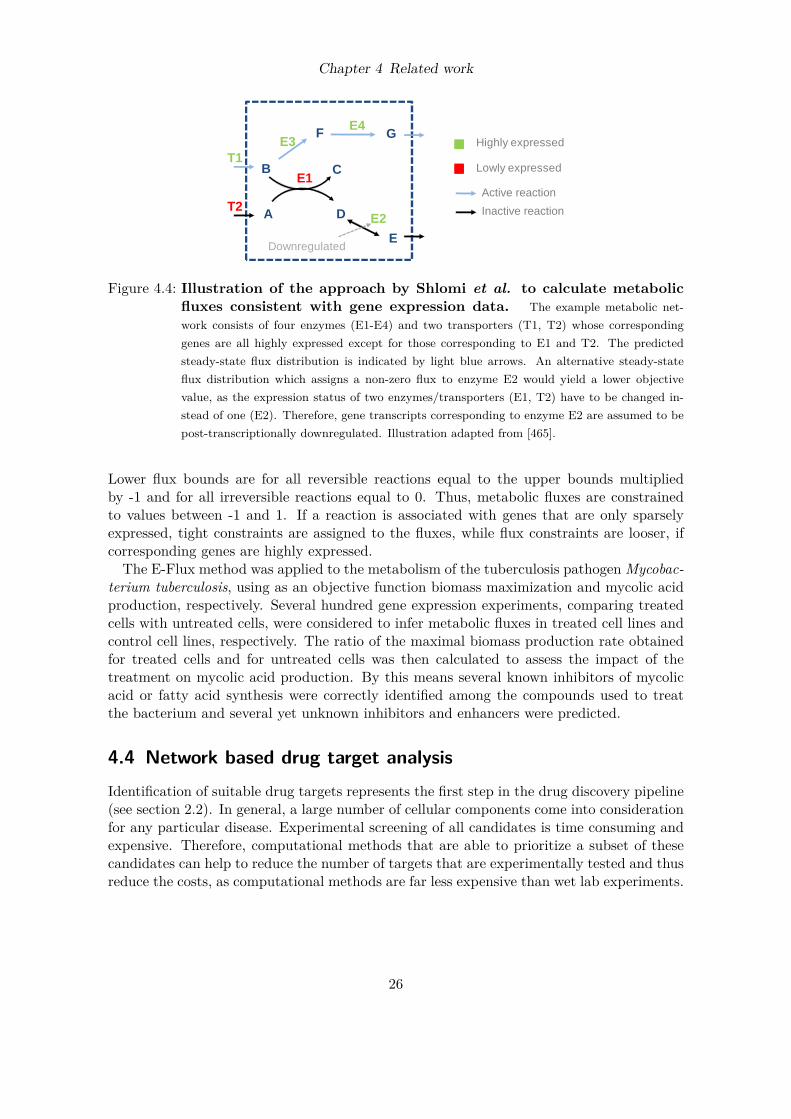
Figure 4.4: Illustration of the approach by Shlomi et al. to calculate metabolicfluxes consistent with gene expression data. The example metabolic net-work consists of four enzymes (E1-E4) and two transporters (T1, T2) whose correspondinggenes are all highly expressed except for those corresponding to E1 and T2. The predictedsteady-state flux distribution is indicated by light blue arrows. An alternative steady-stateflux distribution which assigns a non-zero flux to enzyme E2 would yield a lower objectivevalue, as the expression status of two enzymes/transporters (E1, T2) have to be changed in-stead of one (E2). Therefore, gene transcripts corresponding to enzyme E2 are assumed to bepost-transcriptionally downregulated. Illustration adapted from [465].
Lower flux bounds are for all reversible reactions equal to the upper bounds multipliedby -1 and for all irreversible reactions equal to 0. Thus, metabolic fluxes are constrainedto values between -1 and 1. If a reaction is associated with genes that are only sparselyexpressed, tight constraints are assigned to the fluxes, while flux constraints are looser, ifcorresponding genes are highly expressed.The E-Flux method was applied to the metabolism of the tuberculosis pathogen Mycobac-
terium tuberculosis, using as an objective function biomass maximization and mycolic acidproduction, respectively. Several hundred gene expression experiments, comparing treatedcells with untreated cells, were considered to infer metabolic fluxes in treated cell lines andcontrol cell lines, respectively. The ratio of the maximal biomass production rate obtainedfor treated cells and for untreated cells was then calculated to assess the impact of thetreatment on mycolic acid production. By this means several known inhibitors of mycolicacid or fatty acid synthesis were correctly identified among the compounds used to treatthe bacterium and several yet unknown inhibitors and enhancers were predicted.
4.4 Network based drug target analysisIdentification of suitable drug targets represents the first step in the drug discovery pipeline(see section 2.2). In general, a large number of cellular components come into considerationfor any particular disease. Experimental screening of all candidates is time consuming andexpensive. Therefore, computational methods that are able to prioritize a subset of thesecandidates can help to reduce the number of targets that are experimentally tested and thusreduce the costs, as computational methods are far less expensive than wet lab experiments.
26

Chapter 4 Related work
A
B
C
D Biomass
A
B
C
D Biomass
G1G2G3G4
G1G2G3G4
Gene expression Network Predicted fluxes
R1 R2
R3 R4
R1 R2
R3 R4
R1 R2 R3 R4
R1 R2 R3 R4
MaxFlux = f(G1)(A)
(B)
Figure 4.5: Illustration of the E-Flux method. Constraints imposed by the E-Flux methodon possible metabolic fluxes through the example network are illustrated by pipes surroundingreaction arrows. The higher expression levels of corresponding genes are, the higher are theupper limits on fluxes and thus the larger are the diameters of the pipes. (A) and (B) show theflux rates obtained with the E-Flux algorithm for two different gene expression states (green:low expression, red: high expression). When gene G1 is lowly expressed (A), reaction R1 isrestrained to carry a small flux. Although gene G2 is highly expressed, the flux through reactionR2 cannot be higher than that through R1 due to the steady-state condition. However, if G1has a similarly high expression level as G2 (B) R1 and R2 are both assigned to high flux values,which in contrast to (A) exceed the fluxes through the moderately active reactions R3 and R4.Illustration adapted from [96].
4.4.1 Metabolic control analysisAs outlined in section 2.2 components of a biological network are generally considered tobe good drug targets if they are essential for disease progression. Complete inhibition ofany of these components would result in disease attenuation. However, complete inhibitionof enzymes is difficult, since most drugs are designed as reversibly binding competitive sub-strate analogs and thus can be supplanted by the substrate which accumulates upon enzymeinhibition [101]. Therefore, drugs are more effective if they act on targets that have a largeinfluence on pathways even when inhibited only partially. Such targets can be identifiedwith the help of metabolic control analysis (MCA) [235, 195, 141], a mathematical frame-work that was originally developed for metabolic networks, but has been extended to otherbiological networks [210, 421]. So called flux control coefficients CJ
i and concentrationcontrol coefficients CX
i (see Fig. 4.6) quantify the impact of a network component i(e.g., an enzyme) on the network flux J or component concentration X (e.g., metaboliteconcentration), respectively, as follows:
CJi =
∂ ln J∂ ln pi
∂ ln vi∂ ln pi
, CXi =
∂ ln X∂ ln pi
∂ ln vi∂ ln pi
27
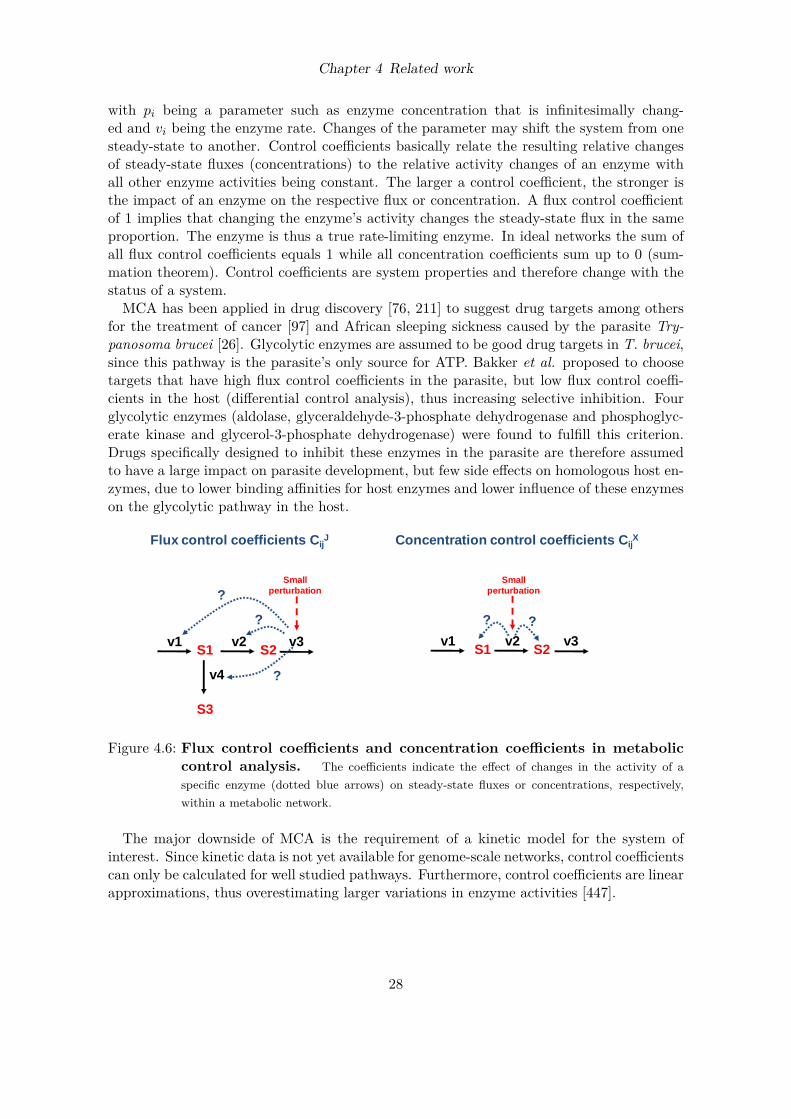
Chapter 4 Related work
with pi being a parameter such as enzyme concentration that is infinitesimally chang-ed and vi being the enzyme rate. Changes of the parameter may shift the system from onesteady-state to another. Control coefficients basically relate the resulting relative changesof steady-state fluxes (concentrations) to the relative activity changes of an enzyme withall other enzyme activities being constant. The larger a control coefficient, the stronger isthe impact of an enzyme on the respective flux or concentration. A flux control coefficientof 1 implies that changing the enzyme’s activity changes the steady-state flux in the sameproportion. The enzyme is thus a true rate-limiting enzyme. In ideal networks the sum ofall flux control coefficients equals 1 while all concentration coefficients sum up to 0 (sum-mation theorem). Control coefficients are system properties and therefore change with thestatus of a system.MCA has been applied in drug discovery [76, 211] to suggest drug targets among others
for the treatment of cancer [97] and African sleeping sickness caused by the parasite Try-panosoma brucei [26]. Glycolytic enzymes are assumed to be good drug targets in T. brucei,since this pathway is the parasite’s only source for ATP. Bakker et al. proposed to choosetargets that have high flux control coefficients in the parasite, but low flux control coeffi-cients in the host (differential control analysis), thus increasing selective inhibition. Fourglycolytic enzymes (aldolase, glyceraldehyde-3-phosphate dehydrogenase and phosphoglyc-erate kinase and glycerol-3-phosphate dehydrogenase) were found to fulfill this criterion.Drugs specifically designed to inhibit these enzymes in the parasite are therefore assumedto have a large impact on parasite development, but few side effects on homologous host en-zymes, due to lower binding affinities for host enzymes and lower influence of these enzymeson the glycolytic pathway in the host.
S1
S3
S2v1 v2 v3
v4
?
?
?
Smallperturbation
S1 S2v1 v2 v3? ?
Flux control coefficients CijJ Concentration control coefficients Cij
X
Smallperturbation
Figure 4.6: Flux control coefficients and concentration coefficients in metaboliccontrol analysis. The coefficients indicate the effect of changes in the activity of aspecific enzyme (dotted blue arrows) on steady-state fluxes or concentrations, respectively,within a metabolic network.
The major downside of MCA is the requirement of a kinetic model for the system ofinterest. Since kinetic data is not yet available for genome-scale networks, control coefficientscan only be calculated for well studied pathways. Furthermore, control coefficients are linearapproximations, thus overestimating larger variations in enzyme activities [447].
28

Chapter 4 Related work
4.4.2 Choke-point analysisChoke-point analysis is a simple topology based approach to identify presumably essentialenzymes even in genome-scale metabolic networks. Choke-points are enzymes that eitheruniquely consume or produce a certain metabolite (see Fig. 4.7). Inhibition of such anenzyme likely results either in accumulation of metabolites, which is potentially toxic forthe cell, or in depletion of possibly essential metabolites, making the enzyme indispensable.The essentiality of enzymes has been assessed with this method for several organisms [561,401, 472, 136], revealing that choke-point analysis is able to detect validated drug targets.Rahman et al. combined choke-point analysis with the concept of load-points, whichare network hot spots with a high number of k-shortest paths passing through, but a lownumber of attached nearest neighbors [401]. Ranking choke-points according to their load isassumed to prioritize biochemically important enzymes, since a high load indicates that anenzyme connects a large number of metabolites via a shortest path. Another improvementof choke-point analysis was proposed by Fatumo et al. who suggested an algorithm thatanalyses whether all compounds downstream of a knocked-out reaction can be produced byother pathways with an equal number of enzymatic steps as it would be possible with thecomplete metabolic network [136]. Combination of this algorithm and choke-point analysisresulted in a higher accuracy and precision for predicted drug targets.
A
B
C
D ECP2
CP1
CP3
Figure 4.7: Illustration of choke-points. The example metabolic network contains three choke-points: CP1, because it produces a unique product; CP2, because it consumes a unique sub-strate and CP3 because it both consumes a unique substrate and produces a unique product.Illustration adapted from [561].
Choke-point analysis is a simple and fast method to predict drug targets, requiring onlythe network topology as input, but no further experimental data. However, the methodtends to yield many false positives [561] and thus low accuracy, especially when the networkhas a large periphery, which might be the case in incomplete networks.
4.4.3 Minimal cut setsAnother network topology based approach to detect components critical for metabolic func-tioning is the concept of minimal cut sets (MCS) [256, 255], which is implemented inthe CellNetAnalyzer software available at http://www.mpi-magdeburg.mpg.de/projects/cna/cna.html. A MCS is a irreducible set of network components whose removal will leadto a failure in certain network functions such as the production of target metabolites (seeFig. 4.8). Given a user defined objective function all MCSs of a metabolic network can becomputed on the basis of elementary flux modes (EM), which are minimal metabolic routesthrough a network operating at steady-state [448, 449]. Any feasible steady-state flux dis-
29

Chapter 4 Related work
tribution can be represented by a linear combination of elementary flux modes. For eachEM that involves the objective reaction, a MCS contains at least one reaction active in thisEM. Thus, removing all reactions of a MCS from the metabolic network of interest ensuresthat no feasible and balanced flux distribution through the network exists that involvesthe objective reaction, as all EMs containing this reaction have vanished. The proposedalgorithm calculates MCSs by iteratively enlarging a set of reactions by adding a reactioncontained in an EM that involves the objective reaction, but does not contain any reactionof the current set. When a set of reactions coveres all EMs corresponding to the objectivefunction and is not a superset of other sets with the same characteristic, the set is consideredto be a MCS.
A
P2
BR1
R2
R4
R5 R3
S P1
A
P2
BR1
R2
R4
R5 R3
S P1 A
P2
BR1
R2
R4
R5 R3
S P1
EM1 EM2
A
P2
BR1
R2
R4
R5 R3
S P1
EM3
A
P2
BR1
R2
R4
R5 R3
S P1 A
P2
BR1
R2
R4
R5 R3
S P1
MCS1 MCS2
A
P2
BR1
R2
R4
R5 R3
S P1
MCS3
x xx
x
Elementary Modes
Minimal cut sets (repressing production of P1)
(A)
(B)
(C)
Figure 4.8: Illustration of minimal cut sets concept. The metabolic network depictedin (A) contains three elementary modes (B) of which two include the objective function R4(highlighted by blue box). Based on these elementary modes the minimal cut sets which repressthe synthesis of P1, the product of the objective function, can be computed (C). Illustrationadapted from [255].
4.4.4 Gene knockout simulations based on flux balance analysisFlux balance analysis methods allow to simulate the outcome of gene knockouts, wheninformation is available on nutrients that can be imported and target metabolites that
30

Chapter 4 Related work
are produced by a cell [131, 377]. In this context a reaction of interest is restricted tocarry no flux, while the network is asked to produce the target metabolites. This basicallycorresponds to the calculation of MinModes for each essential metabolite without using thereaction under examination. If the simulation is successful and a flux distribution satisfyingthe constraints can be found, the tested reaction is assumed to be not essential, since thenetwork utilizes other reactions to fulfill the task. Otherwise, the enzyme catalyzing thisreaction can be considered as a putative drug target, as its inhibition would prevent thesynthesis of essential metabolites and thus cell maintenance or growth.
31
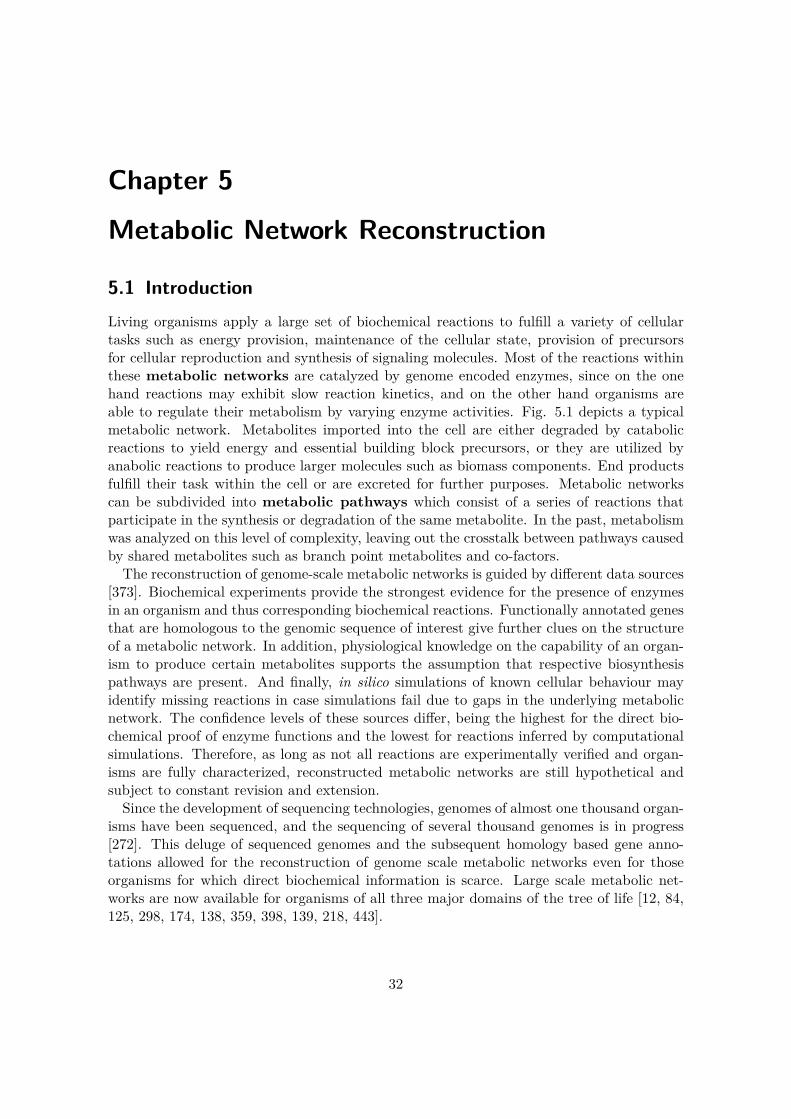
Chapter 5
Metabolic Network Reconstruction
5.1 IntroductionLiving organisms apply a large set of biochemical reactions to fulfill a variety of cellulartasks such as energy provision, maintenance of the cellular state, provision of precursorsfor cellular reproduction and synthesis of signaling molecules. Most of the reactions withinthese metabolic networks are catalyzed by genome encoded enzymes, since on the onehand reactions may exhibit slow reaction kinetics, and on the other hand organisms areable to regulate their metabolism by varying enzyme activities. Fig. 5.1 depicts a typicalmetabolic network. Metabolites imported into the cell are either degraded by catabolicreactions to yield energy and essential building block precursors, or they are utilized byanabolic reactions to produce larger molecules such as biomass components. End productsfulfill their task within the cell or are excreted for further purposes. Metabolic networkscan be subdivided into metabolic pathways which consist of a series of reactions thatparticipate in the synthesis or degradation of the same metabolite. In the past, metabolismwas analyzed on this level of complexity, leaving out the crosstalk between pathways causedby shared metabolites such as branch point metabolites and co-factors.The reconstruction of genome-scale metabolic networks is guided by different data sources
[373]. Biochemical experiments provide the strongest evidence for the presence of enzymesin an organism and thus corresponding biochemical reactions. Functionally annotated genesthat are homologous to the genomic sequence of interest give further clues on the structureof a metabolic network. In addition, physiological knowledge on the capability of an organ-ism to produce certain metabolites supports the assumption that respective biosynthesispathways are present. And finally, in silico simulations of known cellular behaviour mayidentify missing reactions in case simulations fail due to gaps in the underlying metabolicnetwork. The confidence levels of these sources differ, being the highest for the direct bio-chemical proof of enzyme functions and the lowest for reactions inferred by computationalsimulations. Therefore, as long as not all reactions are experimentally verified and organ-isms are fully characterized, reconstructed metabolic networks are still hypothetical andsubject to constant revision and extension.Since the development of sequencing technologies, genomes of almost one thousand organ-
isms have been sequenced, and the sequencing of several thousand genomes is in progress[272]. This deluge of sequenced genomes and the subsequent homology based gene anno-tations allowed for the reconstruction of genome scale metabolic networks even for thoseorganisms for which direct biochemical information is scarce. Large scale metabolic net-works are now available for organisms of all three major domains of the tree of life [12, 84,125, 298, 174, 138, 359, 398, 139, 218, 443].
32

Chapter 5 Metabolic Network Reconstruction
Energy-yielding nutrients
Energy-poor end products
CarbohydratesFatsProteins
H2OCO2NH3
Cell macromolecules
PolysaccharideLipidsProteinsNucleic acids
Precursor molecules
SugarsFatty acidsAmino acidsNucleotides
Cat
abol
ism
Anabolism
ATP
NADPH
Chemicalenergy
Figure 5.1: Metabolic network scheme. Adapted from [162].
5.2 Metabolic network of P. falciparumThe basis for any genome scale metabolic network of P. falciparum constitute the functionalannotations of the genome sequence [161], which are catalogued in the PlasmoDB database[22] (http://www.plasmodb.org/plasmo/home.jsp). Based on these annotations, as wellas literature knowledge, several groups have started to infer metabolic pathways occurringin the parasite [170, 561, 241, 309]. However, none of these initiatives made the effort toconstruct a functional, compartmentalized and consistent metabolic model.The presented thesis aims at compiling a compartmentalized, comprehensive metabolic
network which is able to fulfill cellular functions known from the literature to occur inP. falciparum. Therefore, data from multiple online resources have been integrated in theassembly process. Biochemical reactions were gathered from the Malaria Parasite MetabolicPathways (MPMP) website (release of November 2007), the KEGG database (release ofFebruary 2009), the BioCyc database (release of August 6th 2007 forP. falciparum 3D7),the Reactome database (release of November 2007) and the BRENDA database (release ofJanuary 2007).KEGG reactions were considered as present in P. falciparum if genes of the parasite were
assigned via the KEGG Orthology (KO), a classification of orthologous and paralogousgroups of genes determined based on high sequence similarities to genes of known function.Hagai Ginsburg kindly provided a list of genes and EC numbers corresponding to metabolicpathways listed on the MPMP website. All KEGG reactions associated with these ECnumbers were checked for their presence in any of the pathways depicted at the MPMPwebsite and, where appropriate, added to the metabolic network. Similarly, all KEGG
33

Chapter 5 Metabolic Network Reconstruction
reactions associated with EC numbers that are annotated as present in P. falciparum by theBRENDA database were included in the network. Furthermore, all reactions from BioCycthat are listed in the PlasmoCyc subdatabase as well as all reactions from Reactome thatare inferred by sequence homology to occur in P. falciparum were added to the network.As BioCyc reactions are mostly computationally inferred, reactions were removed that areassociated to pathways that are assumed to not be present in P. falciparum [171], exceptfor the chorismate biosynthesis pathway.Since each resource uses individual identifiers for reactions and metabolites, it was neces-
sary to map the reactions onto each other. The KEGG identifiers were chosen as an overallmeans of identification. P. falciparum reactions suggested by BioCyc and Reactome weremapped to KEGG reactions via annotated genes or EC numbers. In case that way thecorresponding KEGG reaction was not found, involved metabolites were mapped to KEGGmetabolites either with the help of annotated ChEBI or PubChem identifiers, or, if suchcross-references were not available, the PubChem database was queried for matching syn-onyms. The KEGG metabolite identifiers were then assembled to find the correspondingKEGG reaction. For several reactions no matching KEGG reaction could be found by thismeans. In such cases, the reaction equation translated to respective KEGG metabolites wasassigned with a new unique identifier starting with the letter ’Q’ followed by five digits inthe style of the KEGG identifiers.Each reaction of the resulting metabolic network (see Fig. 5.2 and Table 5.1) was as-
signed to one of the following compartments: cytosol, nucleus, mitochondrion, apicoplast,endoplasmic reticulum, or food vacuole. The default compartment for all reactions is thecytosol. This assignment was overruled if a gene catalyzing a certain reaction is annotatedwith another compartment by the Gene Ontology database. In addition, compartments werereassigned when reactions are assigned by the MPMP website to a different compartmentor when corresponding genes contain signal sequences for the apicoplast or mitochondrion.Information on transporters transferring metabolites between the different compartments aswell as between the host and the parasite, were mostly obtained from the MPMP website,and in addition, from the Transport Classification database, BioCyc, and the Reactomedatabase.Reactions were assumed to be irreversible if high Gibbs free energies were predicted or ob-
served [311, 312, 221]. In addition, pairs of synthesis and decay reactions were defined as irre-versible in case the synthesis step involved energy-rich metabolites such as ATP or CoA con-jugate but the decay step not, e.g.,Acyl-CoA + 1-Acyl-sn-glycero-3-phosphocholine<=> CoA + Phosphatidylcholine and Phosphatidylcholine + H2O <=> 1-Acyl-sn-glycero-3-phosphocholine + Fatty acid .
Organism ReactionsTrans-porters
Meta-bolites Genes Compart-
mentsPlasmodiumfalciparum
998 377 1,622 579 6
Human 349 88 566 1erythrocyte
Table 5.1: Overview of assembled metabolic networks for P. falciparum and thehuman erythrocyte.
34

Chapter 5 Metabolic Network Reconstruction
GPI anchor biosynthesis Hemoglobin digestionER V
AM
C
Citric acid cycleElectron transport chain
Ubiquinone biosynthesisHeme biosynthesisFe-S cluster synthesis
Fe-S cluster synthesisLipoic acid salvage
Isoprene biosynthesisFatty acid biosynthesis
Lipoic acid biosynthesis
Phospholipid metaboism
Dolichol metabolism
Inositol-phosphate metabolismSphingomyelin metabolism
Terpenoid metabolism
Pyrimidine metabolismPurine metabolism
Amino acid metabolismAmino sugar metabolism
Glycolysis
Pentose phosphate cycle
CoA biosynthesisFolate metabolism
Nicotinate metabolismVitamin B6 metabolism
Riboflavin metabolismThiamine metabolism
NDNA replication
transcription
transcriptiontranscriptionDNA replication DNA replication
Figure 5.2: Overview of metabolic pathways present in P. falciparum.
5.3 Metabolic network of the human erythrocyte host cellThe best studied system among the host cells of P. falciparum is the human erythrocyte,due to its reduced metabolic capacity and relatively simple availability. As predictionsare thought to improve when the parasite is integrated into its natural environment, themetabolic network of this cell type was additionally compiled. For the human erythrocytemultiple metabolic networks have been published that comprise the cell’s core metabolism,including glycolysis, pentose phosphate pathway, glutathione metabolism and adenine nu-cleotide metabolism (see [351, 217] and contained references). However, these networks lackmetabolic pathways providing cofactors such as thiamin diphosphate and pyridoxal phos-phate that are required for full cellular functioning. Therefore, the metabolic network ofthe human erythrocyte was assembled from available online resources to obtain a networkthat is as complete as possible. As a main source served the enzyme database BRENDA[82], from which all EC numbers were extracted that are assigned to enzymes of humanerythrocytes. Furthermore, the human red blood cell database [379], which catalogues theproteome of human red blood cells, was queried for enzymes to complement those obtainedfrom BRENDA. Subsequently, the EC numbers were used to extract reactions from theKEGG database. Transport processes listed at the Malaria Parasite Metabolic Pathwayswebsite were added to the network and amended with transporters extracted from pri-mary literature [222, 413, 529, 414, 433, 467, 257, 366, 43, 94, 260, 328, 61, 573, 15]. An
35

Chapter 5 Metabolic Network Reconstruction
overview of the network can be found in Table 5.1. The best studied system among thehost cells of P. falciparum is the human erythrocyte, due to its reduced metabolic capacityand relatively simple availability. As predictions are thought to improve when the para-site is integrated into its natural environment, the metabolic network of this cell type wasadditionally compiled. For the human erythrocyte multiple metabolic networks have beenpublished that comprise the cell’s core metabolism, including glycolysis, pentose phosphatepathway, glutathione metabolism and adenine nucleotide metabolism (see [351, 217] andcontained references). However, these networks lack metabolic pathways providing cofac-tors such as thiamin diphosphate and pyridoxal phosphate that are required for full cellularfunctioning. Therefore, the metabolic network of the human erythrocyte was assembledfrom available online resources to obtain a network that is as complete as possible. As amain source served the enzyme database BRENDA [82], from which all EC numbers wereextracted that are assigned to enzymes of human erythrocytes. Furthermore, the humanred blood cell database [379], which catalogues the proteome of human red blood cells, wasqueried for enzymes to complement those obtained from BRENDA. Subsequently, the ECnumbers were used to extract reactions from the KEGG database. Transport processeslisted at the Malaria Parasite Metabolic Pathways website were added to the network andamended with transporters extracted from primary literature [222, 413, 529, 414, 433, 467].An overview of the network can be found in Table 5.1.
5.4 Consistency checksThe compiled metabolic networks of P. falciparum and the human erythrocyte were testedfor consistency to obtain functional metabolic models. In a first step, highly specific meta-bolites such as α-D-Glucose were replaced by more general metabolites (D-Glucose), usinga manually compiled list of substitutions. Moreover, reactions containing generic terms like’fatty acid’ were split into a set of reactions, each using a respectively more specific metabo-lite (tetradecanoic acid, hexadecanoic acid, etc.). Next, generic reactions (A + n B → n C+ D) were removed and reactions describing the synthesis or degradation of macromolecules(A + B → A) were modified in such a way that one metabolite does not occur on both sidesof a reaction equation. Finally, reaction duplets that were already present in the originaldata or were generated by the consistency procedure were deleted.Up to this point, the metabolic network is basically just a set of accumulated reactions. To
transform the network into a fully operative model, flux balance simulations were conductedwith regard to the producibility of important biomass precursors such as lipids, nucleotides,amino acids, carbohydrates, and cofactors (see Table 5.2). In this context MinModes [201]were calculated for each of these metabolites, which are basically minimal steady-state fluxdistributions that allow for the production of a certain metabolite. In case no MinModecould be calculated, i.e., no path exists that converts external nutrients into the metabo-lite of interest, precursors of the metabolite (as defined by metabolic maps of KEGG andMPMP) were consecutively checked with respect to their producibility until one was foundthat is producible, thus revealing missing reactions and transporters. Endproducts andintermediates of pathways known from the literature to occur in P. falciparum, e.g., glycol-ysis, pentose phosphate cycle, hemoglobin degradation and glutathione conjugate export,were examined in the same way. This process revealed that mostly intracellular transporters
36

Chapter 5 Metabolic Network Reconstruction
were missing in the network. Reactions that had to be added include tRNA ligases in themitochondrion and apicoplast, DNA and protein synthesis reactions, and the biosynthesisof unsaturated fatty acids.
Table 5.2: Essential metabolites for parasite and erythrocyte. Cellular compart-ments: [n] = nucleus, [a] = apicoplast, [m] = mitochondrion, [er] = endoplas-mic reticulum, [v] = food vacuole. The first nine metabolites represent pseudo-metabolites, which are needed to test respective reactions.
Metabolite Parasitic stages where assumedto be essential
active-cytochrome-c-reductase[m] all stagesactive-glutathione-reductase all stagesactive-glutathione-transferase all stagesactive-glyoxalase-II all stagesactive-SAH-hydrolase all stagesactive-superoxide-dismutase all stagesactive-superoxide-dismutase[m] all stagesactive-superoxide-dismutase[v] all stagesactive-thioredoxin-reductase all stagesATP all stagescAMP all stagesCardiolipin all stagesCholesterol all stagesCoA all stagesDiacylglycerol all stagesDNA[a] all stages except: merozoite,
mosquito midgut sporozoite,mosquito salivary gland sporozoite,gametocyte
DNA[m] all stages except: merozoite,mosquito midgut sporozoite,mosquito salivary gland sporozoite,gametocyte
DNA[n] all stages except: merozoite,mosquito midgut sporozoite,mosquito salivary gland sporozoite,gametocyte
eIF5A-precursor-hypusine all stagesFAD all stagesFe-S protein[a] all stagesFe-S protein all stagesGlycoprotein all stagesGPI-protein[er] all stagesHeme[m] all stagesHemozoin[v] only blood stages
Continued on next page
37

Chapter 5 Metabolic Network Reconstruction
Table 5.2 – continued from previous pageMetabolite Parasitic stages where assumed
to be essentialHexadecanoic acid all stagesH+-pumped[m] all stagesIsopentenyl diphosphate all stagesmRNA[a] all stagesmRNA[m] all stagesmRNA[n] all stagesNAD+ all stagesNADP+ all stagesOctadecanoic acid all stagesPhosphatidate all stagesPhosphatidylcholine all stagesPhosphatidyl-D-myo-inositol all stagesPhosphatidylethanolamine all stagesPhosphatidylserine all stagesProtein[a] all stagesProtein[c] all stagesProtein[m] all stagesProtein-C-terminal-S-farnesyl-L-cysteine-methyl-ester
all stages
Protein-N6-(lipoyl)lysine[a] only late liver stagesProtein-N6-(lipoyl)lysine[m] all stagesPyridoxal phosphate all stagesS-adenosyl-L-methionine all stagesS-geranylgeranyl-protein all stagesSphingomyelin all stagesTetrahydrofolate all stagesThiamin diphosphate all stagesTriacylglycerol all stagesUbiquinone[m] all stages(9Z)-Hexadecenoic acid all stages(9Z)-Octadecenoic acid all stages(9Z,12Z)-Octadecadienoic acid all stages
5.5 DiscussionGenome-scale metabolic reconstructions are typically derived from genome annotationswhich are coupled with data from comprehensive databases about enzymes and metabolicpathways such as EXPASY and KEGG. Primary literature is then used to complementthe initial reconstruction. This process of validating each individual reaction of a recon-structed metabolic network is very time consuming and may easily demand several man-years. Therefore, the presented metabolic network of P. falciparum was instead compiledfrom preprocessed data generated by several scientific groups based on primary literature
38
Chapter 5 Metabolic Network Reconstruction
and computational inferences. Consistency checks and flux balance simulations identifiedgaps in pathways and facilitated the development of the first functional compartmentalizedmetabolic network of P. falciparum.Most metabolic networks previously reconstructed do not consider the environment of
an organism in terms of other organisms. The first multispecies metabolic network waspublished by Stolyar and colleagues [486] which represents syntrophic interactions amongthe anaerobic microorganisms Desulfovibrio vulgaris and Methanococcus maripaludis. Con-ducted simulations accurately predicted metabolic fluxes and the relative abundance of thetwo organisms. So far, no efforts have been made to computationally analyze the metabolicinteractions between P. falciparum and its host cells. Hence, the compiled metabolic net-works of P. falciparum and the human erythrocyte present a good opportunity to explorethe exchange of metabolites during the blood stage of parasite development.Reconstructed metabolic networks have been proven useful for multiple applications, in-
cluding interpretation of high-throughput data, guidance of metabolic engineering, hypoth-esis testing and analysis of network properties (see [361] and references therein). In general,the quality of results derived from such reconstructions depends heavily on the informa-tion used to attain them. For example, about 50% of the predicted genes in P. falciparumare not annotated yet, suggesting that the compiled metabolic network is not complete.Furthermore, as pointed out in [171], most of the dababases (BioCyc, KEGG, Reactome)infer metabolic pathways computationally which results in predictions where actually onlyone or two enzymes of the pathway are associated with genomic sequences and thereforevery likely do not occur in the parasite. To cope with this problem, those pathways wereremoved that are suggested by [171] to be not present in P. falciparum. Moreover, it islikely that in the future genes will be discovered in the genome of the parasite that encodefor missing enzymes thereby filling current annotation gaps of the metabolic network. Butstill, as not every single reaction has been validated in the network compilation process, it islikely that fractions of the metabolic network are not correct which may influence simulationoutcomes. However, compared to currently available reconstructions of the P. falciparummetabolism, the network presented here is not only the most comprehensive one, but hasalso been proven to be functional, hence providing a basis for further analysis.
39

Chapter 6
Predicting life cycle specific metabolism
6.1 IntroductionReconstructions of metabolic networks as presented in the previous chapter provide the basisfor predictions on the metabolic behavior of a cell. Not only local, but also system-wideeffects of cellular perturbations like varying environments or inhibition of certain enzymescan be assessed with the help of such large-scale networks [361].The metabolism of P. falciparum has been analyzed in a network based approach by Yeh et
al. [561] and Fatumo et al. [136]. Yeh and colleagues developed PlasmoCyc, a sub-databaseof BioCyc, which contains P. falciparum related metabolic reactions annotated with genomicsequences. Putative drug targets were identified in the resulting metabolic network by choke-point analysis. Metabolic data from PlasmoCyc was also analyzed by Fatumo et al. withrespect to essential enzymes. The applied breadth first search approach inspects whethermetabolites downstream of a blocked reaction are producible via alternative routes and thusthe reaction is dispensable. Combined with choke-point analysis this approach improvesthe precision of the prediction results compared to choke-point analysis alone. However,drug targets proposed by these approaches are presumably of limited quality, since they arederived from metabolic networks that are not further processed using additional informationsuch as cellular compartments and transport processes. Moreover, they did not considerthe different life cycle stages of the parasite, during which the metabolism might vary dueto different cellular environments.As outlined in section 4.2 flux balance analysis (FBA) is a commonly used computational
method to gain insight into the metabolic capabilities of a cell. Several extensions of thismethodology have been proposed that integrate high-throughput data in order to obtainmore realistic metabolic flux predictions for a particular cellular condition [4, 38, 465, 96,417]. These approaches add constraints to the basic FBA formalism that reflect gene orprotein expression, which, in contrast to metabolite levels, are available on genome-scalefor multiple organisms. For example, reactions were constrained to a flux value of zero ifexpression of the corresponding transcript or enzyme could not be detected [4, 417, 96]. Lessstrict approaches do not exclude such reactions, but rather seek flux distributions which aremost consistent with expression data [465, 38].This work intends to deduce stage-specific metabolism for all stages of the life cycle
of P. falciparum with the help of flux balance analysis and gene expression profiles. Forthis purpose the approach developed by Shlomi et al. [465] was adapted and applied tothe assembled metabolic network under consideration of gene expression profiles measuredduring different life cycle stages.
40
Chapter 6 Predicting life cycle specific metabolism
6.2 Applied gene expression profilesLarge-scale gene expression profiles are available for the blood stage of P. falciparum aswell as the mosquito stage. However, the liver stage in the human host is experimentallydifficult to assess and therefore gene expression data covering this stage in P. yoelii, a closerelative of P. falciparum causing malaria in rodents, were additionally considered in thisstudy. Gene expression is assumed to be sufficiently similar in these two Plasmodium species,justifying the utilization of P. yoelii data to infer metabolic fluxes in P. falciparum. Geneexpression data has been gathered from five publications (see Table 1): (a) a genome-scaletranscriptome analysis of P. falciparum covering the intraerythrocytic developmental cycle(IDC) by Bozdech et al. [59] (see section 3.1.1), (b) a genome-scale transcriptome analysisby Le Roch et al. [419] examining the blood stage and the mosquito stage of P. falciparum(see section 3.1.2), (c) a cDNA library obtained from liver stage expression analysis of therodent malaria pathogen P. yoelii by Sacci et al. [427] (see section 3.1.3), (d) a data setfrom Tarun et al. [501], which includes samples extracted from P. yoelii during the liverstage, the mosquito stage and the blood stage (see section 3.1.4) and (e) a genome-scaletranscriptome analysis by Daily et al. of 43 samples derived from the blood of P. falciparuminfected patients which contain mostly ring stages of the parasite [112] (see section 3.1.5).In total, 110 gene expression samples were analyzed.In a first step, the accordance of these data sets was checked with regard to corresponding
stages. For this purpose the expression status was determined for each gene of every expres-sion sample. For the Le Roch data set the same parameter cutoffs were applied as mentionedin [419] (thermocycling treatments data): expression level E > 10 and likelihood of geneabsence (calculated by the match-only integral distribution algorithm) logP < −0.5. Genescovered by the Bozdech and Tarun data sets were considered to be expressed if the corre-sponding signal-to-noise ratio (s2n = (mean(FG)−mean(BG)) / std(BG), with FG beingthe pixel signal intensity resulting from specific hybridization and BG being the backgroundintensity caused by non-specific binding), is greater or equal to a threshold. Signal-to-noiseratios were extracted from the raw data, averaged over all replicates and normalized usingquantile normalization [54]. Applying a too low or too high threshold results in almost allgenes being expressed or silenced, respectively. For the Bozdech data set the threshold twas chosen in such a way that the average Euclidean distance between the binary expressionvalues
expr (g | t) ={
0 if gene g is silent given threshold t1 if gene g is expressed given threshold t
is maximal for non-consecutive pairs of samples and minimal for consecutive pairs:
41
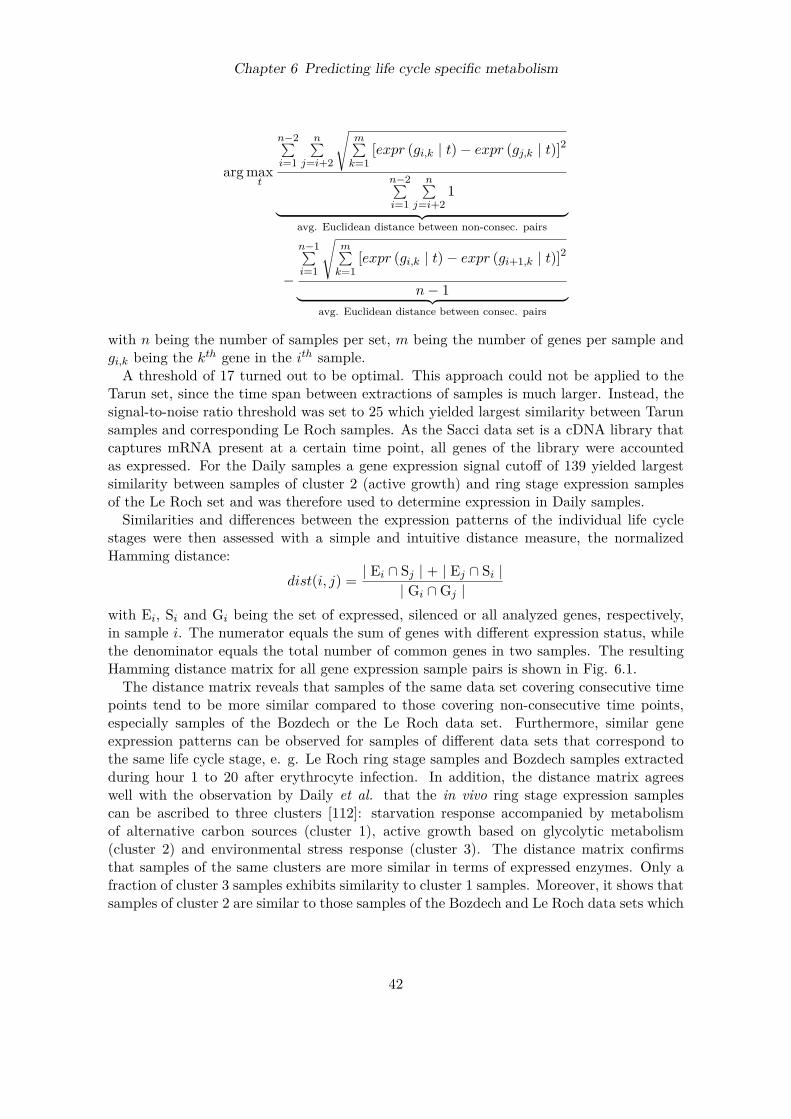
Chapter 6 Predicting life cycle specific metabolism
arg maxt
n−2∑i=1
n∑j=i+2
√m∑
k=1[expr (gi,k | t)− expr (gj,k | t)]2
n−2∑i=1
n∑j=i+2
1︸ ︷︷ ︸avg. Euclidean distance between non-consec. pairs
−
n−1∑i=1
√m∑
k=1[expr (gi,k | t)− expr (gi+1,k | t)]2
n− 1︸ ︷︷ ︸avg. Euclidean distance between consec. pairs
with n being the number of samples per set, m being the number of genes per sample andgi,k being the kth gene in the ith sample.A threshold of 17 turned out to be optimal. This approach could not be applied to the
Tarun set, since the time span between extractions of samples is much larger. Instead, thesignal-to-noise ratio threshold was set to 25 which yielded largest similarity between Tarunsamples and corresponding Le Roch samples. As the Sacci data set is a cDNA library thatcaptures mRNA present at a certain time point, all genes of the library were accountedas expressed. For the Daily samples a gene expression signal cutoff of 139 yielded largestsimilarity between samples of cluster 2 (active growth) and ring stage expression samplesof the Le Roch set and was therefore used to determine expression in Daily samples.Similarities and differences between the expression patterns of the individual life cycle
stages were then assessed with a simple and intuitive distance measure, the normalizedHamming distance:
dist(i, j) = | Ei ∩ Sj | + | Ej ∩ Si || Gi ∩Gj |
with Ei, Si and Gi being the set of expressed, silenced or all analyzed genes, respectively,in sample i. The numerator equals the sum of genes with different expression status, whilethe denominator equals the total number of common genes in two samples. The resultingHamming distance matrix for all gene expression sample pairs is shown in Fig. 6.1.The distance matrix reveals that samples of the same data set covering consecutive time
points tend to be more similar compared to those covering non-consecutive time points,especially samples of the Bozdech or the Le Roch data set. Furthermore, similar geneexpression patterns can be observed for samples of different data sets that correspond tothe same life cycle stage, e. g. Le Roch ring stage samples and Bozdech samples extractedduring hour 1 to 20 after erythrocyte infection. In addition, the distance matrix agreeswell with the observation by Daily et al. that the in vivo ring stage expression samplescan be ascribed to three clusters [112]: starvation response accompanied by metabolismof alternative carbon sources (cluster 1), active growth based on glycolytic metabolism(cluster 2) and environmental stress response (cluster 3). The distance matrix confirmsthat samples of the same clusters are more similar in terms of expressed enzymes. Only afraction of cluster 3 samples exhibits similarity to cluster 1 samples. Moreover, it shows thatsamples of cluster 2 are similar to those samples of the Bozdech and Le Roch data sets which
42
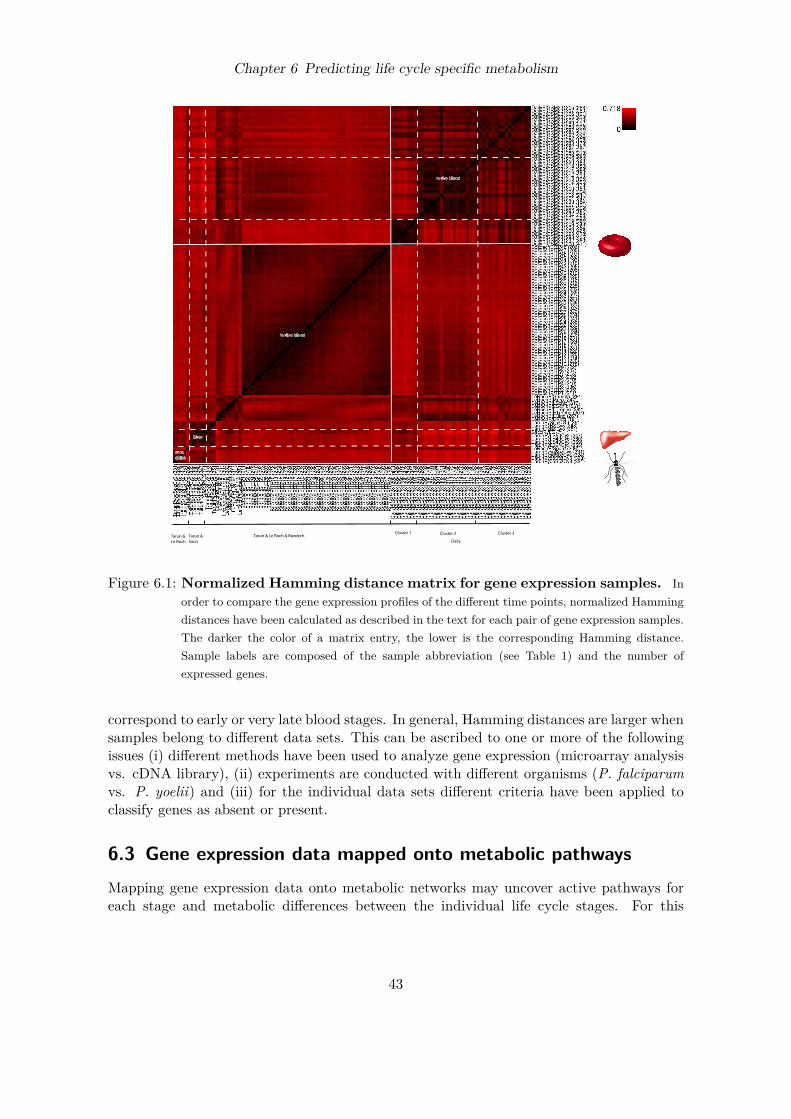
Chapter 6 Predicting life cycle specific metabolism
Liver
in vitro blood
in vivo blood
Tarun &Le Roch
Tarun &Sacci
Tarun & Le Roch & BozdechDaily
Cluster 1 Cluster 2 Cluster 3
Figure 6.1: Normalized Hamming distance matrix for gene expression samples. Inorder to compare the gene expression profiles of the different time points, normalized Hammingdistances have been calculated as described in the text for each pair of gene expression samples.The darker the color of a matrix entry, the lower is the corresponding Hamming distance.Sample labels are composed of the sample abbreviation (see Table 1) and the number ofexpressed genes.
correspond to early or very late blood stages. In general, Hamming distances are larger whensamples belong to different data sets. This can be ascribed to one or more of the followingissues (i) different methods have been used to analyze gene expression (microarray analysisvs. cDNA library), (ii) experiments are conducted with different organisms (P. falciparumvs. P. yoelii) and (iii) for the individual data sets different criteria have been applied toclassify genes as absent or present.
6.3 Gene expression data mapped onto metabolic pathwaysMapping gene expression data onto metabolic networks may uncover active pathways foreach stage and metabolic differences between the individual life cycle stages. For this
43

Chapter 6 Predicting life cycle specific metabolism
Figure 6.2: Bozdech gene expression samples mapped onto metabolic pathways.Mapping gene expression data onto metabolic networks may uncover active pathways for eachstage as well as metabolic differences between the individual life cycle stages. For this purpose,the ratio of expressed genes per KEGG pathway (# expressed genes / # of pathway associatedgenes with available expression data) was calculated for each Bozdech gene expression sample.The darker the color of a matrix entry, the lower is the ratio. Clusters of pathways with similarpatterns of expressed genes during the individual life cycle time points were calculated withthe built-in function hclust (’average’ method) of the statistics software R (colored bars).
purpose, the ratio of expressed genes per pathway (as defined by KEGG) was calculated foreach gene expression sample (see Fig. 6.2 - 6.5) and pathway clusters were determined.Three pathway clusters can be identified for the Bozdech and the Le Roch data sets,
which roughly correspond to each other (see green, blue, and yellow bar in Fig. 6.2 and Fig.6.3). The green clusters, which have 10 pathways in common (e. g. glycolysis, glycerophos-pholipid metabolism and porphyrin metabolism), contain pathways where only a fractionof pathway associated genes are expressed during the IDC with a maximum of expressedgenes during late trophozoite and early schizont stage. Pathways associated with the blueclusters (common pathways: fatty acid biosynthesis, lipoic acid metabolism, vitamin B6metabolism and one carbon pool by folate metabolism) show gene expression almost exclu-
44

Chapter 6 Predicting life cycle specific metabolism
Figure 6.3: Le Roch gene expression samples mapped onto metabolic pathways.See caption of Fig. 6.2.
sively during late trophozoite and early schizont stages of the IDC, while those of the yellowclusters (common pathways: pentose phosphate pathway, inositol phosphate metabolism)exhibit many expressed genes during all phases of the intraerythrocytic developmental cy-cle. Notably, during the gametocyte stage (Le Roch data set) a high number of genes areexpressed in all pathways and in contrast only few genes during the invasive stages (LeRoch data: sporozoite, merozoite). Pathway clusters as described above for the blood stageare not as apparent for the Tarun data, since this stage has not been analyzed as detailed.Nevertheless, certain pathways group together as seen for the Bozdech and Le Roch datasets (see colored bars in 6.4). Daily and coworkers found that their ring stage expressionsamples can be divided into three clusters: starvation response accompanied by metabolismof alternative carbon sources (cluster 1), active growth based on glycolytic metabolism (clus-ter 2) and environmental stress response (cluster 3). These clusters can be found as wellwhen expression samples are mapped to metabolic pathways as shown in 6.5. In samples ofcluster 1 almost all enzymes are expressed in each of the considered pathways, suggestingthat required metabolites cannot be obtained in sufficient amounts from the host and thusthe parasite has to activate all possible pathways in order to obtain these metabolites. In
45

Chapter 6 Predicting life cycle specific metabolism
Figure 6.4: Tarun gene expression samples mapped onto metabolic pathways.See caption of Fig. 6.2.
contrast, less enzymes are expressed in samples corresponding to cluster 2. Here, enzymesof sugar metabolism related pathways like glycolysis, pentose phosphate pathway and glyc-erophospholipid metabolism (blue bar) are mostly activated. Similar expression patternscan be observed for cluster 3 samples. However, more enzymes are expressed in certainpathways such as fatty acid synthesis, thiamine metabolism and ubiquinone biosynthesis(pink bar).In general, the majority of metabolic pathway genes is expressed during starvation (Daily
data) or late trophozoite and early schizont stage where reproduction of biomass is at itspeak [366]. Pathways showing similar patterns of activation and suppression are presumablyco-regulated. Especially in the case of purine and pyrimidine biosynthesis this is plausible,since both nucleotide types are needed in large amounts at the same time during DNAreplication and mRNA synthesis. Likewise the expression of genes associated with fattyacid biosynthesis, pyruvate metabolism, and lipoic acid metabolism seems to be coupled,since only few genes are expressed during blood stages but significantly more during liverstages. Most of the reactions assigned to these three KEGG pathways are assumed totake place in the apicoplast and are linked to each other. When fatty acid demand is fully
46

Chapter 6 Predicting life cycle specific metabolism
Cluster 1
Cluster 2
Cluster 3
Figure 6.5: Daily gene expression samples mapped onto metabolic pathways.See caption of Fig. 6.2.
satisfied by import, which is suggested for the blood stage by findings of Vaughan et al. [526],neither the precursor acetyl-CoA (pyruvate pathway) nor lipoic acid, a cofactor of pyruvatedehydrogenase catalyzing acetyl-CoA synthesis, are needed within the apicoplast. Thus, itseems reasonable that these three pathways, which cluster together when considering theBozdech dataset, are co-regulated.
47

Chapter 6 Predicting life cycle specific metabolism
6.4 Metabolic flux predictions for different life cycle stagesGene expression data give an impression of the metabolic status of a cell, as has beenshown in the previous section. However, gene expression data alone are not sufficient todeduce metabolic fluxes. Simply assuming a correlation between gene expression levels andmetabolic fluxes is not appropriate, since it has been shown that neither mRNA levels andprotein levels always correlate well [181, 214, 176, 86] nor enzyme levels and correspondingflux rates of catalyzed reactions [134, 504]. Furthermore, expression data is not alwaysavailable for all genes of interest, or in some cases, there are no genes assigned to metabolicreactions at all, if they are rather inferred from metabolic context than based on directbiochemical evidence. In addition, from gene expression data alone no information can begained with regard to which nutrients are imported into the cell and which metabolites aresecreted. Flux balance approaches provide a means to predict flux distributions despite suchobstacles. Flux values can be predicted even for those reactions where no gene expressiondata is available, as fluxes are not independent due to the assumed steady-state condition,which requires the sum of fluxes producing a metabolite to equal the sum of fluxes consum-ing it. A reasonable objective function describing the cellular goals is essential to obtainmeaningful flux distributions with FBA. In the case of P. falciparum the overall goal isreproduction, and thus biomass production. At the same time the parasite has an interestto keep its host cell alive for the period of replication which sets an upper limit on thereplication rate. Depending on how well the organism of interest is already studied, theobjective function might neglect certain metabolically important issues, e.g., a metaboliteessential for reproduction that has not been noticed yet. On this account, an approach isapplied here that combines FBA and gene expression information to calculate flux distribu-tions for the different parasitic life cycle stages. The integration of expression data ensuresthat metabolic aspects not captured by the objective function are nevertheless representedin the calculated flux distributions.Flux distributions were predicted for the different parasitic life cycle stages based on the
method proposed by Shlomi et al. [465], which maximizes the number of reactions whoseactivity is consistent with the expression state of corresponding genes. The original methodby Shlomi has several limitations, though: synthesis of metabolites needed for growth isnot guaranteed; reactions of low confidence are treated the same as those with annotatedgenes; in order to maximize the objective function, all reactions catalyzed by the same geneproduct are sought to be active simultaneously in case the gene is expressed; furthermore, nolimits are set on available nutrients. Therefore, this approach was modified in several ways(see Fig. 6.6): (a) Constraints were added to ensure the production of important biomassprecursors such as phospholipids, which are needed for parasite reproduction (see Table5.2). These target metabolites might vary depending on the stage covered by the givengene expression sample. DNA synthesis is important for stages aiming at reproduction, liketrophozoites. In contrast, for invasive forms of the parasite (sporozoite, merozoite, etc.)this is not an issue and therefore not considered in flux calculations corresponding to thesestages. Furthermore, blood stages need to incorporate heme from hemoglobin degradationinto hemozoin molecules in order to prevent intoxication and cell lysis. This makes hemozoina target metabolite for these stages, but not for liver or mosquito stages where hemoglobinis not present. Targeted deletions of critical fatty acid synthesis enzymes in P. yoelii andP. falciparum suggest that fatty acid synthesis in the apicoplast is only essential during late
48

Chapter 6 Predicting life cycle specific metabolism
liver stage [526]. This implies that pyruvate dehydrogenase (PDH), which provides fattyacid synthase with acetyl-CoA, is not essential during any other stage and thus lipoate, acofactor of PDH, is as well dispensable in the apicoplast. Since PDH is the only enzymein the apicoplast that requires lipoate, lipoate biosynthesis is demanded in this organelleonly during late liver stage. (b) For all reactions whose existence is not supported bygenome annotations, boolean variables (y2,i) and constraints were introduced that keepthese reactions inactive if the respective variable is set to 1. This is useful as especiallydata from the BioCyc database contain reactions without any associated gene that arenevertheless declared to be present in P. falciparum to fill gaps in pathways. (c) In contrastto the original Shlomi approach, the modified method does not seek all reactions catalyzedby the same enzyme to be simultaneously active if the respective gene is expressed. As theobjective function of the approach proposed by Shlomi et al. maximizes the sum of booleanvariables that represent reaction activity, higher objective function values are obtained ifnon-zero fluxes are assigned to all reactions corresponding to expressed genes. However,this might not always be appropriate. Therefore, for each expressed gene a boolean variable(y3,i) and constraints were added, ensuring that at least one of the reactions associated toan expressed gene has to carry a non-zero flux in case the respective variable is set to 1.Replacing variables y1p and y1n (see section 4.3.2 for more details of the Shlomi approach) inthe objective function with this variable type avoids that all reactions catalyzed by the sameexpressed enzyme are sought to be active at the same time to further optimize the objectivefunction value. (d) With respect to the restrained access of the parasite to nutrients ofthe host, the network is forced to fulfill its tasks with a minimum amount of externallysupplied metabolites by subtracting the absolute flux values through the parasite’s plasmamembrane transporters from the objective function value. The corresponding mixed integerlinear program reads as follows:
maxv+,v−,y0,y2,y3
∑i∈RNE
αy0,i +∑
i∈RNG
βy2,i +∑
i∈GE
γy3,i −∑i∈T
δv+i (6.1)
s. t.: Sv = 0 (6.2)vmin,i ≤ v ≤ vmax,i (6.3)vi ≥ 1, for all target fluxes (6.4)vi + y1p,i(vmin,i − ε) ≥ vmin,i, ∀i ∈ RE (6.5)vi + y1n,i(vmax,i + ε) ≤ vmax,i, ∀i ∈ RE (6.6)vmin,i (1− y0) ≤ vi ≤ vmax,i (1− y0) , ∀i ∈ RNE (6.7)vmin,i (1− y2) ≤ vi ≤ vmax,i (1− y2) , ∀i ∈ RNG (6.8)y3,i − y1p,r(i) ≥ 0, ∀i ∈ GE (6.9)y3,i − y1n,r(i) ≥ 0, ∀i ∈ GE (6.10)
y3,i ≤∑
y1p,r(i) +∑
y1n,r(i), ∀i ∈ GE (6.11)v = v+ − v− (6.12)y0, y1p, y1n, y2, y3 ∈ [0, 1] (6.13)v+, v− ≥ 0 (6.14)
49

Chapter 6 Predicting life cycle specific metabolism
Within the solution space, which is defined by (6.2)-(6.14), a flux distribution is soughtthat maximizes the objective function given in (6.1). α denotes the reward for setting thefluxes of reactions to zero that correspond to unexpressed genes (RNE), β represents thereward for assigning a zero flux to such reactions that are not associated with any gene(RNG), γ denotes the reward for having a non-zero flux through any reaction assigned toan expressed gene (GE), while δ is the penalty for forward fluxes v+ through parasiticplasma membrane transporters (T ) importing external metabolites. The variables were setas follows: α = 2, β = 0.1, γ = 1, and δ = 0.5. Inequalities (6.5)-(6.7) are the same asin [465] with ε = 1 and (6.8) is analogous to (6.7) to obtain a zero flux through reactionswithout associated genes. The subsequent inequalities (6.9)-(6.11) ensure that if a binaryvariable of type y3 is set to 1, at least one of the corresponding variables of type y1 haveto equal 1 as well. Matching variables y1 and y3 are identified via function r(i) that mapsa gene onto a set of reactions that are catalyzed by the gene product. Biomass productionis ensured by (6.4), which requires effluxes of at least one molecule of the respective targetmetabolites through system boundaries.The modified approach was applied to each of the gene expression samples extracted from
different time points of parasite development (see Table 1) to predict respective metabolicfluxes during these time points. In order to compare the resulting flux distributions for theindividual time points, normalized Hamming distances were computed for all flux distri-bution pairs (see Fig. 6.7). In general, the calculated flux distributions are more similarto each other (max. Hamming distance: 0.188) than the corresponding gene expressionsamples (max. Hamming distance: 0.718). However, similarity patterns as observed forthe gene expression data are also detectable for the flux profiles. For example, flux profilescorresponding to consecutive time points during the blood stage are more similar than thoseof non-consecutive time points (see Bozdech data; trophozoite stage vs. schizont) and fluxprofiles corresponding to in vivo expression profiles of the same cluster tend to be moresimilar than those of different clusters.As experimental data on intra-parasitic metabolic fluxes are not available, the plausibility
of calculated flux distributions was checked by comparing predicted exchange fluxes betweenhost and parasite with available experimental observations.
6.5 Metabolite exchange with hostDuring its life cycle, P. falciparum is exposed to different environments and has to dealwith different nutrient supply. It has been shown for Trypanosoma brucei that the parasiteis able to remodel its metabolism depending on the available carbon sources [104]. It isvery likely that P. falciparum utilizes likewise varying parts of its enzyme equipment asa function of available nutrients, which results in varying sets of metabolites transportedthrough the parasite’s plasma membrane during the individual developmental stages.
50

Chapter 6 Predicting life cycle specific metabolism
Reactions /transporters
Gene Gene expressiont1 t2
Aex A G1 present
Bex B G2
Cex C G3Eex E G3Fex F G4A B G5B+C D G6E F
A G
presentpresent
present
present
present
present
Aex
Bex
A
B
Cex
Eex
C
E
Biomass
G
FexF
D
t1
Aex
Bex
A
B
Cex
Eex
C
E
Biomass
G
FexF
D
t2
?
? ?
?
?
?
?
A
Aex
Bex
A
B
Cex
Eex
C
E
Biomass
G
FexF
D
a
a
t2
e
e
e
1
10
1
9
1010
11
b
bc
f
f
f
B
Biomass composition:G = 10D = 1
a
Environmental condition:c[Bex] >> c[Aex] = c[Cex]
e
d Minimize amount ofutilized nutrients
Penalize reactionswithout assigned genes
b
Do not require all reactionscatalyzed by same gene tobe active at same time
c
Consider gene expressionof previous time points
f
51
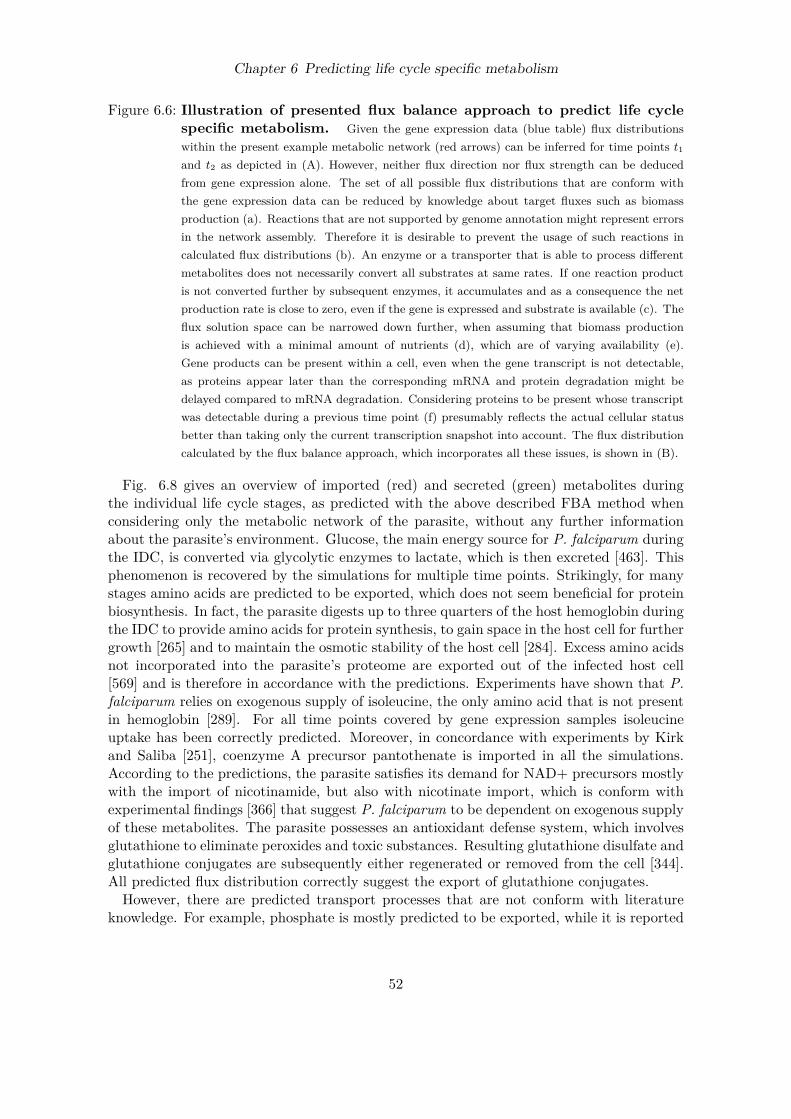
Chapter 6 Predicting life cycle specific metabolism
Figure 6.6: Illustration of presented flux balance approach to predict life cyclespecific metabolism. Given the gene expression data (blue table) flux distributionswithin the present example metabolic network (red arrows) can be inferred for time points t1
and t2 as depicted in (A). However, neither flux direction nor flux strength can be deducedfrom gene expression alone. The set of all possible flux distributions that are conform withthe gene expression data can be reduced by knowledge about target fluxes such as biomassproduction (a). Reactions that are not supported by genome annotation might represent errorsin the network assembly. Therefore it is desirable to prevent the usage of such reactions incalculated flux distributions (b). An enzyme or a transporter that is able to process differentmetabolites does not necessarily convert all substrates at same rates. If one reaction productis not converted further by subsequent enzymes, it accumulates and as a consequence the netproduction rate is close to zero, even if the gene is expressed and substrate is available (c). Theflux solution space can be narrowed down further, when assuming that biomass productionis achieved with a minimal amount of nutrients (d), which are of varying availability (e).Gene products can be present within a cell, even when the gene transcript is not detectable,as proteins appear later than the corresponding mRNA and protein degradation might bedelayed compared to mRNA degradation. Considering proteins to be present whose transcriptwas detectable during a previous time point (f) presumably reflects the actual cellular statusbetter than taking only the current transcription snapshot into account. The flux distributioncalculated by the flux balance approach, which incorporates all these issues, is shown in (B).
Fig. 6.8 gives an overview of imported (red) and secreted (green) metabolites duringthe individual life cycle stages, as predicted with the above described FBA method whenconsidering only the metabolic network of the parasite, without any further informationabout the parasite’s environment. Glucose, the main energy source for P. falciparum duringthe IDC, is converted via glycolytic enzymes to lactate, which is then excreted [463]. Thisphenomenon is recovered by the simulations for multiple time points. Strikingly, for manystages amino acids are predicted to be exported, which does not seem beneficial for proteinbiosynthesis. In fact, the parasite digests up to three quarters of the host hemoglobin duringthe IDC to provide amino acids for protein synthesis, to gain space in the host cell for furthergrowth [265] and to maintain the osmotic stability of the host cell [284]. Excess amino acidsnot incorporated into the parasite’s proteome are exported out of the infected host cell[569] and is therefore in accordance with the predictions. Experiments have shown that P.falciparum relies on exogenous supply of isoleucine, the only amino acid that is not presentin hemoglobin [289]. For all time points covered by gene expression samples isoleucineuptake has been correctly predicted. Moreover, in concordance with experiments by Kirkand Saliba [251], coenzyme A precursor pantothenate is imported in all the simulations.According to the predictions, the parasite satisfies its demand for NAD+ precursors mostlywith the import of nicotinamide, but also with nicotinate import, which is conform withexperimental findings [366] that suggest P. falciparum to be dependent on exogenous supplyof these metabolites. The parasite possesses an antioxidant defense system, which involvesglutathione to eliminate peroxides and toxic substances. Resulting glutathione disulfate andglutathione conjugates are subsequently either regenerated or removed from the cell [344].All predicted flux distribution correctly suggest the export of glutathione conjugates.However, there are predicted transport processes that are not conform with literature
knowledge. For example, phosphate is mostly predicted to be exported, while it is reported
52

Chapter 6 Predicting life cycle specific metabolism
Tarun &Le Roch
Tarun &Sacci
Tarun & Le Roch & BozdechDaily
Cluster 1 Cluster 2 Cluster 3
Liver
in vitro blood
in vivo blood
Figure 6.7: Normalized Hamming distance matrix for calculated flux distribu-tions. Flux distributions have been predicted with the developed flux balance approachfor each time point of the parasite’s life cycle for which a gene expression profile exists. Sim-ulations were conducted considering only the metabolic network of the parasite without anyfurther constraints reflecting the parasite’s environment and without considering the expressionstatus of genes during preceding time points. In order to compare the individual flux distribu-tions normalized Hamming distances (see text for formula) have been determined for all pairsof flux distributions. The darker the color of a matrix entry, the lower is the correspondingHamming distance.
to be taken up [435]. Likewise, ATP is imported rather than exported to support the hostas proposed by Kanaani and Ginsburg [237] and hemoglobin is predicted to be taken upduring liver stages where no hemoglobin is present. Furthermore, purine precursors areimported mostly in the form of inosine, guanosine, and adenosine, while hypoxanthine isexported, despite being available in higher concentrations in the blood plasma than theother purine precursors. These discrepancies indicate that further constraints reflectingthe parasites environment are needed in order to obtain more reliable flux predictions. Inaddition, uptake of host proteins during other stages than the blood stage and subsequentdegradation of these proteins in the food vacuole seems to be conceivable, as respective
53

Chapter 6 Predicting life cycle specific metabolism
Tarun &Le Roch
Tarun &Sacci
Tarun & Le Roch & BozdechDaily
Cluster 1 Cluster 2 Cluster 3
Figure 6.8: Predicted host parasite metabolite exchanges. Flux distributions have beenpredicted with the flux balance approach for each time point of the parasite’s life cycle for whicha gene expression profile exists. Simulations were conducted considering only the metabolicnetwork of the parasite without any further constraints reflecting the parasite’s environmentand without considering the expression status of genes during preceding time points. Resultingmetabolite exchanges between host and parasite are depicted in this figure. Red matrix entriesrepresent metabolites that are predicted to be imported into the parasite while green matrixentries represent metabolites secreted into the host compartment.
peptidases have been detected throughout the developmental cycle.
6.6 Improved metabolic flux predictions for the blood stageMost of the knowledge about the malaria pathogen P. falciparum is related to the bloodstage, due to simple experimental accessibility and the fact that among the host cells theerythrocyte is the best studied system. As predictions for the blood stage are assumedto improve when this knowledge is integrated, the parasite’s metabolic network was com-bined with that of the erythrocyte, and the combined network was forced to produce in
54
Chapter 6 Predicting life cycle specific metabolism
addition metabolites important for erythrocyte metabolism. Furthermore, constraints re-flecting knowledge about the blood stage were incorporated into the calculations. Forexample, the parasite was forced to consume at least a certain amount of hemoglobinand glucose, since both metabolites are known to be consumed by the parasite in largeamounts [133, 251]. Uptake limits were set for several metabolites, including purine precur-sors, sugars, cofactors and phospholipid headgroup precursors, which are proportional tothe respective blood plasma concentrations as listed in the Human Metabolome Database(http://www.hmdb.ca/). In addition, constraints were added that ensure trapping of purineprecursors as well as choline and ethanolamine within the parasite due to phosphorylation[252, 282]. Observations by Mehta et al. [322] indicate that P. falciparum is able to repressglycolysis of erythrocytes by inhibiting their glycolytic enzymes phosphofructokinase andpyruvate kinase. In concordance with these observations both host enzymes were inhibitedin flux calculations that correspond to stages subsequent to the ring stage of the IDC.For a certain fraction of P. falciparum genes, the transcriptome was found to correlate
better with the proteome of the following than the current stage [420]. For this reason, con-sidering only the gene expression snapshot of a single time point does not give a completepicture on the actual present proteome. Including the gene expression status of previoustime points into the calculations should therefore further improve flux predictions. The algo-rithm was modified in such a way that genes were considered to be expressed, if a transcriptis either present during the time point of interest or during a time span of approximately12 hours prior to this time point (concerns 12 preceding samples of Bozdech data set and2 preceding samples of Le Roch data set). Since the time intervals between samples cov-ering the liver or the mosquito stage are larger, this modification was only applied to fluxpredictions related to the blood stage.Metabolites predicted to be exchanged between host and parasite when using the im-
proved algorithm (combination of host and parasite network, additional constraints reflect-ing knowledge about the blood stage as well as consideration of gene expression status ofpreceding time points; see Fig. 6.9 for Hamming distance matrix between calculated fluxdistributions) are in considerably better accordance with experimental findings (see Table6.1 and Fig. 6.10) than before. In contrast to the previous predictions, purine precursorsand choline are only imported and not secreted, while amino acids (except for isoleucine)are only exported. For the flux calculations hemoglobin is assumed to be digested at higherrates during trophozoite and schizont stages of the IDC, which releases iron that can beutilized by the parasite [168, 292, 132]. When the host’s glycolytic enzymes phosphofruc-tokinase and pyruvate kinase are inhibited (trophozoite and schizont stages), ATP can nolonger be obtained from the host. Thus, the parasite needs to produce more ATP on itsown, which requires the import of additional phosphate. Moreover, in order to ensure hostsurvival for a certain time period, the parasite provides the host with ATP, which is inaccordance with findings by Kanaani and Ginsburg [237].In general, flux profiles derived from in vitro (Bozdech and Le Roch data set) and in vivo
gene expression samples (Daily data set) are fairly similar in terms of exchanged metabolitesbetween host and parasite, especially those corresponding to the active growth like cluster(cluster 2). One main difference is that more purine precursor types are predicted to beimported for the in vivo samples. The main differences between in vivo clusters is theabsence of predicted fatty acid and choline import for samples of the starvation like cluster(cluster 1). This could be attributed to environmental conditions that result in a lack
55

Chapter 6 Predicting life cycle specific metabolism
Le Roch Bozdech
Daily
Cluster 1 Cluster 2 Cluster 3
Figure 6.9: Normalized Hamming distance matrix for calculated flux distribu-tions using improved algorithm. Flux distributions have been predicted with theimproved flux balance approach for each gene expression sample derived from the blood stage.Simulations were conducted on the basis of the combined metabolic network of parasite andhost and additional constraints reflecting knowledge about the blood stage. Furthermore, theexpression status of genes during preceding time points was considered for the flux calculations.In order to compare the individual flux distributions normalized Hamming distances (see textfor formula) have been determined for all pairs of flux distributions. The darker the color of amatrix entry, the lower is the corresponding Hamming distance.
of nutrients required for parasite growth. Cell membrane production is then either notpossible or not the main focus and thus the import of membrane precursors like fatty acidsand choline is not required.There are still some metabolites whose predicted transfer direction through the parasite’s
plasma membrane does not meet literature knowledge. For example, it has been found thatarginine contained in the medium is imported and depleted by the parasite, resulting inornithine which is then excreted [366]. In contrast, the simulations suggest arginine export.Since the experimental observations were made at excessively high arginine concentrations,further experiments are needed to examine arginine transport under physiological condi-
56

Chapter 6 Predicting life cycle specific metabolism
Le Roch Bozdech
Daily
Cluster 1 Cluster 2 Cluster 3
Figure 6.10: Predicted host parasite metabolite exchanges using improved algo-rithm. Flux distributions have been predicted with the improved flux balance approach(see Fig. 6.6) for each time point of the intraerythrocytic developmental cycle for which agene expression profile exists. Simulations were conducted on the basis of the combined meta-bolic network of parasite and host and additional constraints reflecting knowledge about theblood stage. Furthermore, the expression status of genes during preceding time points wasconsidered for the flux calculations. Resulting metabolite exchanges between host and para-site are depicted in this figure. Red matrix entries represent metabolites that are predictedto be imported into the parasite, while green matrix entries represent metabolites secretedinto the host compartment.
tions. The predictions are more in line with experiments by Liu et al. [289] which indicatethat hemoglobin degradation satisfies the parasite’s demand for all amino acids during theblood stage except for isoleucine and thus isoleucine is the only amino acid required tobe taken up. Other predicted metabolite transports that contradict literature knowledgeare those of formate, hydrogencarbonate and ethanolamine. Almost no transport is pre-dicted for ethanolamine, because the transport process is not associated with any gene andtherefore our algorithm avoids to assign non-zero fluxes. However, this is not the case forformate and hydrogencarbonate, but rather missing reactions and transport processes in the
57
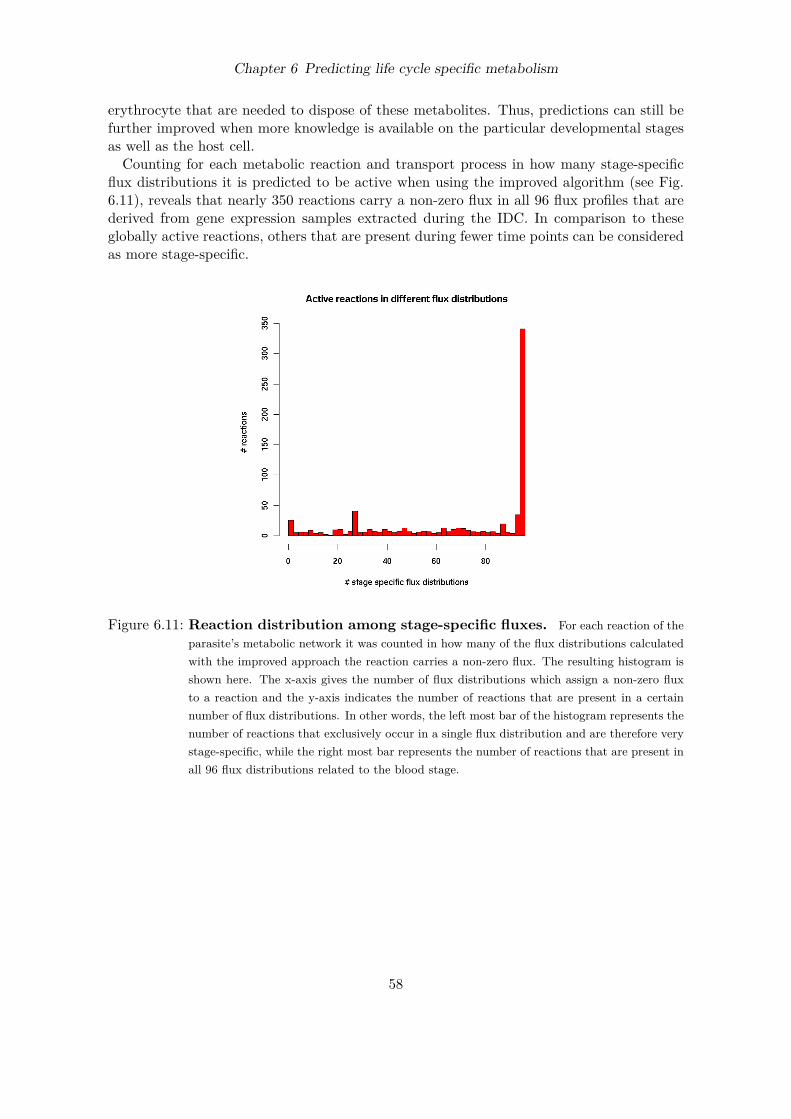
Chapter 6 Predicting life cycle specific metabolism
erythrocyte that are needed to dispose of these metabolites. Thus, predictions can still befurther improved when more knowledge is available on the particular developmental stagesas well as the host cell.Counting for each metabolic reaction and transport process in how many stage-specific
flux distributions it is predicted to be active when using the improved algorithm (see Fig.6.11), reveals that nearly 350 reactions carry a non-zero flux in all 96 flux profiles that arederived from gene expression samples extracted during the IDC. In comparison to theseglobally active reactions, others that are present during fewer time points can be consideredas more stage-specific.
Figure 6.11: Reaction distribution among stage-specific fluxes. For each reaction of theparasite’s metabolic network it was counted in how many of the flux distributions calculatedwith the improved approach the reaction carries a non-zero flux. The resulting histogram isshown here. The x-axis gives the number of flux distributions which assign a non-zero fluxto a reaction and the y-axis indicates the number of reactions that are present in a certainnumber of flux distributions. In other words, the left most bar of the histogram represents thenumber of reactions that exclusively occur in a single flux distribution and are therefore verystage-specific, while the right most bar represents the number of reactions that are present inall 96 flux distributions related to the blood stage.
58

Chapter 6 Predicting life cycle specific metabolism
Table6.1:Metab
oliteexchan
gesbe
tweenpa
rasite
andho
st:pred
iction
vs.expe
riment.
Metab
olite
Predicted
Exp
erim
ent
Com
ment
Referen
ces
Glucose
uptake
uptake
[170
,306
,463
]La
ctate
secretion
secretion
[170
,306
,463
]Hem
oglobin
uptake
uptake
[170
,463
]Aminoacids
secretion
secretion
[170
,306
,463
]Isoleu
cine
uptake
uptake
[170
,306
],[463
]Nuc
leosides
/nu
cleoba
ses
uptake
uptake
[170
,306
,378
]Cho
line
uptake
uptake
[170
,306
,3,2
82]
Etha
nolamine
noexchan
geup
take
No
gene
assig
ned
toetha
nolaminetran
sporter
[170
,3]
Phosph
atidylcholine
uptake
uptake
[170
,184
]Ph
osph
atidyletha
nolamine
uptake
uptake
[170
,184
]Ph
osph
atidylserin
eup
take
uptake
[170
]Ph
osph
ate
uptake
uptake
[170
,306
,435
]Pa
ntothe
nate
uptake
uptake
[170
,306
,251
]Nicotinam
ide/nicotin
ate
uptake
uptake
[170
,366
]Fo
late
mostly
uptake
uptake
[170
,306
]4-am
inob
enzoic
acid
uptake
uptake
[170
,306
]ADP
uptake
/secre-
tion
uptake
secretionin
early
bloo
dstag
ewhe
nAT
Pcan
still
besal-
vagedfrom
host
[170
,306
,237
]
ATP
uptake
/secre-
tion
secretion
uptake
inearly
bloo
dstag
ewhe
nho
stglycolysisisno
tre-
pressedyet
[170
,306
,237
]
Glycerol
uptake
/secre-
tion
uptake
/secretion
[170
,306
]
Glutathione
conjug
ate
secretion
secretion
[170
,306
,344
]Con
tinue
don
next
page
59

Chapter 6 Predicting life cycle specific metabolism
Tab
le6.1–continue
dfrom
previous
page
Metab
olite
Predicted
Exp
erim
ent
Com
ment
Referen
ces
Ornith
ine
noexchan
ge/
secretion
secretion
[366
]
Cho
lesterol
uptake
uptake
[170
]Fo
rmate
noexchan
gesecretion
Erythrocyte
lacks
reactio
nsan
dtran
sport
processes
todisposeof
metab
olite
[170
,306
]
Fe2+
noexchan
ge/
uptake
uptake
[170
,306
]
H+
mostly
secretion
secretion
[170
,306
]HC03
-no
exchan
gesecretion
Erythrocyte
lacks
reactio
nsan
dtran
sport
processes
todisposeof
metab
olite
[170
,306
]
60

Chapter 6 Predicting life cycle specific metabolism
6.7 Calculated fluxes mapped onto metabolic pathwaysIn order to explore the predicted flux distributions derived from the improved algorithm onthe level of metabolic pathways, a second mapping was done. This time, instead of countingexpressed genes per KEGG pathway, reactions carrying non-zero fluxes were counted, toassess whether a pathway is active or not and whether there are changes during the IDC(see Fig. 6.12, 6.13 and Fig. 6.14). Due to the integration of gene expression states ofpreceding time points into the calculations, more enzymes are considered to be present thanare suggested by the corresponding gene expression sample. In general, for consecutive timepoints the number of active reactions per pathway does not vary as much as the number ofexpressed genes per pathway (compare to Fig. 6.2 and Fig. 6.3). Therefore, fewer metabolicchanges are predicted between the individual time points than are suggested by the geneexpression data. Nevertheless, time dependent activity variation can be observed for certainpathways. For example, fewer reactions corresponding to folate biosynthesis are predictedto be active during the ring stage than during subsequent stages. In contrast, for the citricacid cycle as well as sphingolipid metabolism an increase in active reactions is predictedduring schizont and early ring stage.Predictions derived from in vivo gene expression samples show mainly similar pathway
activity levels. Samples of the starvation-like cluster (cluster 1) vary from the others onlywith respect to lipid metabolism related pathways, which have a higher fraction of activereactions (especially the fatty acid biosynthesis pathway), and energy metabolism. Lessreactions of the glycolytic pathway are active while more reactions of the citric acid cycleare active compared to cluster 2. The same holds true for some samples of the stressresponse-like cluster (cluster 3).However, for some pathways the flux distributions vary substantially from the reported
expression profiles. For instance, according to the flux predictions, synthesis of terpenoids(part of steroid synthesis pathway) takes place during the complete IDC, while gene ex-pression data suggest this pathway to be only active during ring and trophozoite stages.This is due to the chosen set of target metabolites required to be produced during the in-dividual stages (see Table 5.2), which includes isopentenyl diphosphate. This might not beappropriate for all time points.
6.8 Validation with proteomics and metabolomics dataFor further validation the predicted stage-specific flux distributions were compared to avail-able proteomics data. Five data sets were considered in this process, including three datasets extracted from P. falciparum during blood and mosquito stages [147, 275, 276], onedata set that covers these stages in the rodent malaria pathogen P. berghei [185] and onedata set obtained from the liver stage of P. yoelii, another rodent malaria pathogen [501].The individual life cycle stages that were analyzed in these studies are listed in Table 2 andTable 3. For each observed protein sample the percentage of enzymes that is predicted tobe active in the stage-specific flux distributions was calculated and plotted in Fig. 6.15.Tendentially, if only few enzymes were detected during a specific stage, like the salivary
gland sporozoite stage in the study by Hall et al. (HallPbSporo), a higher percentage ofthese enzymes are recovered by the predictions. Accordance between proteome data sets
61

Chapter 6 Predicting life cycle specific metabolism
Figure 6.12: Predicted metabolic fluxes consistent with Bozdech gene expressiondata mapped onto metabolic pathways. Flux distributions have been pre-dicted with the improved flux balance approach for each time point of the intraerythrocyticdevelopmental cycle for which a gene expression profile exists. Simulations were conductedon the basis of the combined metabolic network of parasite and host and additional con-straints reflecting knowledge about the blood stage. Furthermore, the expression status ofgenes during preceding time points was considered for the flux calculations. In order to ex-plore the predicted flux distributions on the level of metabolic pathways, the flux profiles weremapped onto KEGG pathways and active reactions were counted, revealing active pathwaysand changes during the IDC. The darker the color of a matrix entry the fewer reactions ofthe corresponding pathway are active.
and predicted flux distributions does not only depend on the size of the proteome data set,though. For example, the gametocytes sample (LasonderPfGametocyte) extracted fromblood cultures correlates better with flux distributions predicted for blood stages than thesmaller sporozoite derived sample (FlorensPfSporo). In general, flux distributions predictedfor mosquito stages show less agreement with proteome samples than flux distributionspredicted for other stages. Nevertheless, flux distributions associated with salivary glandsporozoites (TarunPyooSpz, TarunPysgSpz) have large overlaps with proteome samples of
62

Chapter 6 Predicting life cycle specific metabolism
Figure 6.13: Predicted metabolic fluxes consistent with Le Roch gene expressiondata mapped onto metabolic pathways. Same as Fig. 6.12, but fluxes werecalculated using Le Roch gene expression data.
the same stage (LasonderPfSgSporo, HallPbSporo, HallPbOocyst). Likewise, proteomesamples extracted during the liver stages show best correlation with corresponding predictedflux profiles. Concerning the blood stage of the parasite’s life cycle, a higher percentageof enzymes detected during the trophozoite and schizont stage (LasonderPfTrophoSchz,FlorensPfTropho) are predicted to be active during the schizont stage when consideringthose flux distributions derived from Le Roch gene expression samples. For blood stagerelated flux distributions derived from Bozdech gene expression samples the trophozoiteproteome samples correlate slightly better with trophozoite stage related flux distributions.Regarding the in vivo expression sample derived predictions more agreement with bloodstage proteome is found for samples of cluster 1 and 3.Additionally, predicted flux distributions were analyzed with respect to metabolites that
are produced or consumed by active reactions and thus should be present during the re-spective stage. These metabolites were compared to experimentally determined sets ofmetabolites detected during seven time points of the intraerythrocytic developmental cycle(Olszewski data set) [366] or extracted with different methods from mature trophozoites
63

Chapter 6 Predicting life cycle specific metabolism
Figure 6.14: Predicted metabolic fluxes consistent with Daily gene expressiondata mapped onto metabolic pathways. Same as Fig. 6.12, but fluxes werecalculated using Daily gene expression data.
(Teng data set) [503], respectively. The percentage of experimentally detected metabolitescovered by predictions was computed for each of the eleven sets (see Fig. 6.16). Sincethe Teng metabolomics samples are quite small and contain mostly metabolites of the coremetabolism, they are almost all present in all life cycle stage-specific flux predictions. Incontrast, less metabolites of the Olszewski samples are recovered by the predictions. Nev-ertheless, more than 80% of the metabolites contained in these sets (which are more thandouble the size of the Teng metabolite sets) are involved in reactions that are predicted tobe active during the blood stage. All seven Olszewski samples consist of the same meta-bolites (only concentrations vary during the individual time points), suggesting that thesemetabolites are present during the whole IDC. Discrepancies between predictions and ex-perimental results are not necessarily due to limited prediction quality. For example, it isconceivable that metabolites diffuse into the cell and are experimentally detected, but noenzyme is expressed that is able to convert the metabolite. Furthermore, the metabolomicssamples contain less than one hundred metabolites, suggesting that a large fraction of theactually present metabolites were not experimentally analyzed.
64

Chapter 6 Predicting life cycle specific metabolism
Cluster 1 Cluster 2 Cluster 3
Figure 6.15: Overlap of experimentally determined proteins with stage-specificsets of enzymes predicted to be active. The applied proteome samples (y-axis)are specified in Table 2. Numbers in parenthesis indicate the number of genes that correspondto the metabolic network and are covered by a proteomics sample (y-axis) or the numberof genes associated with active reactions (x-axis), respectively. Matrix entries depict thepercentage of experimentally determined metabolic enzymes recovered by the stage-specificflux predictions. Improved predictions were considered for blood stage flux distributions.
6.9 Determination of fluxes with higher reliabilityFor each stage of the parasite’s developmental cycle, so-called consensus reactions weredetermined that are predicted to be active for all gene expression samples covering thesame stage. These reactions are more likely to actually occur during a certain stage, sincethey are derived from different data samples. In order to identify consensus reactions, allcalculated flux profiles were grouped into 13 sets (LS24, LS40, LS50, eRing, lRing, eTropho,lTropho, eSchiz, lSchiz, Mero, Gameto, ooSporo, sgSporo; see Table 1) with respect torepresented stages, and those reactions were determined that carry a non-zero flux in allflux profiles of the same set. For all stages of the intraerythrocytic developmental cyclethose flux profiles were considered that were calculated with the improved algorithm.
65

Chapter 6 Predicting life cycle specific metabolism
Cluster 1 Cluster 2 Cluster 3
Figure 6.16: Overlap of experimentally determined metabolites with stage-specific sets of metabolites predicted to be present. The appliedmetabolomics samples (y-axis) are specified in Table 3. Numbers in parenthesis indicatethe number of metabolites that correspond to the metabolic network and are covered bya metabolomics sample (y-axis) or the number of metabolites involved in a predicted fluxdistribution (x-axis), respectively. Matrix entries depict the percentage of experimentally de-termined metabolites recovered by the stage-specific flux predictions. Improved predictionswere considered for blood stage flux distributions.
For each blood stage and each metabolic pathway the fraction of consensus reactions pertotal number of pathway reactions was computed to uncover the distribution of consensusreactions among pathways (see Fig. 6.17). To get an impression of how many consensusreactions are shared between the different stages, this fraction was also computed for thoseconsensus reactions that two sets have in common. In several pathways the same reactionsare active during the whole IDC (e. g. ubiquinone biosynthesis and terpenoid biosynthesis).These are mostly biosynthesis pathways where alternative routes are rare and the endprod-ucts are considered to be essential. Therefore, the network is forced to produce them, whichresults in a large overlap between the predicted fluxes through these pathways for all time
66

Chapter 6 Predicting life cycle specific metabolism
Figure 6.17: Overview of pathway specific consensus reactions for different timepoints of intraerythrocytic cycle. Consensus reactions (reactions that are pre-dicted to be active for all gene expression samples, covering the same stage) were determinedfor all stages of the IDC. These reactions are more likely to actually occur during a certainstage, since they are derived from different data samples. In order to identify consensus re-actions, all calculated flux profiles corresponding to the blood stage were grouped into sevensets (see Table 1) with respect to represented stages and those reactions were determinedthat carry a non-zero flux in all flux profiles of the same set. For each blood stage and eachmetabolic pathway the fraction of consensus reactions per total number of pathway reactionswas computed to uncover the distribution of consensus reactions among pathways. To getan impression of how many consensus reactions are shared between the different stages, thisfraction was also computed for those consensus reactions that two sets have in common. Thedarker the color of a matrix entry the lower is the percentage of consensus reactions.
points. By contrast there are pathways where more accordance can be observed for tropho-zoite and schizont stages (e.g. glutathione metabolism, pentose phosphate pathway). Thisis mainly due to the fact that consensus reactions for the early and late ring stage are de-rived from many more samples than those for other stages. Especially the heterogeneous invivo expression samples contribute to a low number of consensus reactions for these stages.
67
Chapter 6 Predicting life cycle specific metabolism
The citric acid cycle is one of the few pathways where a certain level of agreement existsbetween ring and schizont stages.
6.10 DiscussionA relatively simple approach to obtain global insight into the metabolism of a cell undercertain conditions is to analyze gene expression and to infer active metabolic pathwaysbased on the presence of corresponding enzyme mRNA transcripts (e.g. [56, 567, 234, 437]).Multiple tools have been developed in the last years to aid this process [93, 374, 334, 286].However, more detailed information such as flux rates and flux directions cannot be gainedfrom gene expression data alone. Additional metabolomics and tracer experiments arerequired to obtain this information. A computer based alternative is flux balance analysis,which derives metabolic flux rates by solving an optimization problem that reflects the fluxbalance principle and an assumed objective for the metabolism of an organism of interest.In contrast to kinetic modeling, no detailed rate equations are required, thus making thismethod appropriate for large-scale metabolic networks lacking full kinetic characterization.In this work an approach that combines gene expression data with flux balance analysis hasbeen applied to P. falciparum to infer life cycle stage-specific metabolism. This strategywas assumed to complement the weaknesses of each approach, allowing to predict metabolicfluxes even for those parts of the metabolic network which are not associated with geneexpression data or which might not be covered by the applied objective function due toincomplete knowledge of cellular objectives. As has been shown, flux distributions derivedfrom this approach differ for certain pathways from what is expected when only takinginto account gene expression profiles mapped onto metabolic pathways. For example, theterpenoid biosynthesis pathway is predicted to be active during the whole IDC, while fewgenes of this pathway are expressed during merozoite and ring stage. These discrepancies aredue to the chosen target metabolites whose production requires enzymes of this pathway tobe active. To evaluate whether these predictions are inadequate or mRNA levels are simplynot fully conclusive, experimental data of present enzymes and pathway intermediates areneeded. Comparisons with experimentally observed enzyme and metabolite profiles revealedgood accordance for most of the stage-specific flux distributions. However, due to the smallnumber of examined stages as well as the relatively small number of measured enzymes andmetabolites, detailed evaluation of predicted flux distributions is not possible. Differences inpredicted fluxes and observed enzyme profiles might additionally be caused by the appliedsignal-to-noise cutoff for the classification of gene expression. Especially for the Tarun dataset, where a high cutoff was chosen and thus more genes are considered to be not expressed,this could play a role. Another issue could be the fact that only one solution was consideredhere, but FBA might yield multiple solutions, which are equally optimal with respect tothe applied objective function. It is possible that alternative optimal solutions agree betterwith experimental data. Therefore, prediction improvements could be obtained when fluxranges are considered that reflect alternative solutions rather than fixed flux values. Suchranges can be determined with the help of a concept called flux variability analysis [300].Integration of available information about present enzymes and metabolites will furtherimprove FBA predictions.In general, better predictions could be obtained if more details were known about the
68

Chapter 6 Predicting life cycle specific metabolism
biochemical composition of the parasite during the different developmental stages, allowingto use for each stage an adapted set of target metabolites. Furthermore, incorporation ofadditional information such as available nutrients, capacities of transport proteins and hostcell metabolism would further improve predictions as has been demonstrated for stages ofthe intraerythrocytic developmental cycle. Until such information is available for all stagesof parasite development, flux distributions derived from flux balance analysis and geneexpression data are a good starting point to get an insight on the parasite’s metabolism ongenome-scale.
69

Chapter 7
Identification of putative drug targets
7.1 IntroductionTypically, the first step in the drug discovery process is the identification and validationof a suitable drug target. Subsequently, a potential drug is determined by either high-throughput screening against a library of drug-like compounds or rational drug design. Inorder to prevent waste of resources, it is important that the target candidate is well chosen.Several criteria exists that help to identify potent drug targets. The two most importantproperties are: (1) the target is druggable, i.e., the target possesses a binding site forsmall molecules that might modulate its activity and (2) the target is essential for diseaseprogression.Druggable proteins have been analyzed with respect to common structural features, re-
vealing that these characteristics are good predictors for potential targets [575, 353, 89].In case structural information is not available, genomic sequence properties shared amongdrug targets have been shown to be an alternative basis for druggability predictions [25].Proteins critical for processes involved in disease progression can be detected by net-
work based approaches that consider the whole system and not only local properties. Ifa pathway has been found to be essential for disease progression and kinetic informationis available for all involved enzymes, metabolic control analysis can be used to determinethose enzymes that have the largest influence on the pathway and thus presumably repre-sent efficient targets [76, 211]. However, very often such information is not available. Arelative simple alternative method is the choke-point analysis, which identifies reactionsthat are for particular metabolites the only source or sink in the metabolic network ofinterest [561, 188, 472, 473]. Inhibition of such reactions results in accumulation or deple-tion of these metabolites with presumably negative effects on the cellular system. Manyknown drug targets in the metabolism of pathogens have been shown to be choke-points[561, 472]. A major disadvantage of this method is the high number of predicted targets.Other proposed network based drug target detection approaches have in common that acertain knowledge about the cellular objective is required, e.g., target metabolites essentialfor the development of pathogenic cells. An example hereof is a concept called minimal cutsets, which determines a minimal set of blocked reactions that are required for the inacti-vation of certain network functions [256, 255, 189]. Computation time for large metabolicnetworks is quite high, though, as the approach requires to compute all feasible and bal-anced flux distributions for the network of interest (elementary flux modes) whose numbergrows exponentially with network size. An approach that is characterized by relativelylow computation times is flux balance analysis. This concept has been applied to simulateknockouts in several organisms with good agreement between phenotype predictions and
70

Chapter 7 Identification of putative drug targets
experimental observations [135, 279, 233, 377, 131].
7.2 Detection of essential reactions via flux balance analysisThe main goal of this work is the identification of novel putative drug targets in Plasmodiumfalciparum. For this purpose flux balance simulations were conducted, in order to analyze thecompiled metabolic network with regard to essential reactions required for the productionof important cellular metabolites. Enzymes catalyzing such reactions represent potentialdrug targets, since their inhibition would result in a shortage of required metabolites andthereby in impaired development. The linear program underlying the knockout simulationsconducted in this study reads as follows:
minv
∑| vi | (7.1)
s. t.: Sv = 0 (7.2)vmin,i < vi < vmax,i (7.3)vi > 1 for target metabolite efflux (7.4)vi = 0 for knocked-out enzymes (7.5)
Here, S is the stoichiometric matrix of the cellular system, vi are internal fluxes as well asexchange fluxes, and vmin and vmax represent lower and upper bounds on fluxes. The solu-tion space that contains all feasible flux distributions is defined by linear equations derivedfrom the steady-state assumption (7.2) as well as thermodynamics and knowledge aboutenzyme and transporter capacities (7.3). Production of metabolites assumed to be essen-tial during any time point of parasite development (see Table 5.2) is ensured by forcing anefflux of these metabolites through the system boundary (7.4). In addition, fluxes througha reaction of interest are fixed to zero, mimicking the knockout of the corresponding gene.For each reaction of the metabolic network of P. falciparum such a linear program wasformulated. In case the solution space of the problem was empty, the knocked-out reactionwas considered to be indispensable. Hence, the corresponding enzyme represents a putativedrug target, since no path exists converting external nutrients into all target metabolites,which presumably results in impaired parsite development. In contrast to the FBA cal-culations conducted in the previous chapter, no gene expression data was considered forthe identification of essential reactions. Furthermore, no assumptions were made about thecellular environment and nutrient uptake was not restricted.As not all metabolites are equally important during all time points of parasite develop-
ment, e.g., DNA building blocks are not required to be synthesized during the merozoitestage, a reaction detected by this means might not be globally essential, but rather duringthose time points when the particular metabolite requiring the activity of the reaction isindispensable. On the other hand, certain reactions that are not detected as essential mightbe incorrectly classified if nutrients are in reality not available in sufficient amounts duringall time points, which is in contradiction to the simulation assumption. In this case essentialmetabolites cannot be derived from imported precursors, but rather need to be completelysynthesized, making additional reactions indispensable. To sum up, all reactions identified
71
Chapter 7 Identification of putative drug targets
as essential by this approach are essential during at least one developmental stage, but notall reactions that are essential during any stage are necessarily recovered.
7.3 Essential reactions in the metabolism of P. falciparumFlux balance knockout simulations identified 307 reactions that are essential for the para-site. To evaluate these results a gold standard set was compiled containing 57 enzymes thatwere shown to have antimalarial effects upon inhibition or silencing (see Table 7.1). 35 ofthese gold standard enzymes correspond to reactions that were predicted to be indispens-able. Blocking simultaneously all reactions catalyzed by the same gene product recoveredtwo further targets (dihydrofolate reductase and hypoxanthine phosphoribosyltransferase)contained in the gold standard set. Among the 20 remaining enzymes 13 were detected asessential, if additionally transporters were constrained that import biomass precursors by-passing the respective enzyme. For example, inhibition of the spermidine transporter makesthe spermidine synthase indispensable. These enzymes are therefore either not metabolicallyessential during all environmental conditions, but only during those stages where particularnutrients are not present in sufficient amounts, or the respective parasitic transporters arenot efficient enough. Furthermore, GMP synthase was detected if the import of guanineand guanosine was constrained and all reactions catalyzed by the enzyme were blocked.Ornithine decarboxylase was not found by this means, as a an alternative path exists tosynthesize putrescine, which involves carbamoylputrescine amidase. Blocking this enzymein addition to the spermidine and putrescine transporters makes ornithine decarboxylase in-dispensable. Carbamoylputrescine amidase is very likely not present in P. falciparum, sinceit was added in the BioCyc database to fill gaps in the putrescine biosynthesis pathway ofwhich only one enzyme is associated with a gene. Succinate dehydrogenase and NADH dehy-drogenase, which are not even detected when nutrient import is limited, are presumably falsepositives. For both enzymes of the mitochondrial electron transport chain antimalarial ac-tivity was demonstrated through inhibition with substrate analogs of ubiquinone [267, 492].As ubiquinone, the substrate of both enzymes, can be provided with electrons by severalenzymes (succinate dehydrogenase, NADH dehydrogenase, dihydroorotate dehydrogenase,FAD-dependent glycerol-3-phosphate dehydrogenase, malate-quinone oxidoreductase), it isnot quite obvious why inhibition of only one enzyme should result in impaired parasitedevelopment. One explanation could be that the ubiquinone analogs do not only inhibitone enzyme, but also others that use ubiquinone as a substrate. This is supported by thefindings of Painter et al. [371] who discovered that an active mitochondrial electron trans-port chain might only be required for the disposal of electrons derived from dihydroorotatedehydrogenase, an essential enzyme for pyrimidine biosynthesis. They showed that par-asites expressing the corresponding yeast enzyme, which does not require ubiquinone asan electron acceptor, are insensitive to atovaquone, an inhibitor of the electron transportchain Complex III. This suggests that the antimalarial effect of ubiquinone analogs wasrather due to either additional inhibition of the downstream Complex III or simultane-ous inhibition of all enzymes providing ubiquinone with electrons (including dihydroorotatedehydrogenase), instead of the sole inhibition of succinate dehydrogenase or NADH de-hydrogenase. The simulations indicate furthermore that neither sole inhibition of cholinekinase nor sole inhibition of phosphoethanolamine methyltransferase kills the parasite, be-
72
Chapter 7 Identification of putative drug targets
cause phosphatidylcholine can be derived from choline as well as from ethanolamine [385].The question remains whether these pathways are indeed able to fully compensate the lossof the alternative pathway, as both have been suggested to affect parasite growth [92, 553].However, the findings by Choubey et al. [92] can also be explained by unspecific inhibitorbinding (both experiments utilized miltefosin analogs), resulting in the inhibition of bothcholine kinase and phosphoethanolamine methyltransferase [385]. Finally, the gold standardenzyme fructose-bisphosphate aldolase was not detected by the knockout simulations. Es-sentiality of this glycolytic enzyme was not confirmed by the simulations, since ATP can begenerated from glycerol-3-phosphate (derived from imported glycerol) and glyceraldehyde-3-phosphate (produced in pentose phosphate pathway), which enter glycolysis downstreamof the enzyme. These metabolites might yield lower amounts of ATP, though, due to thelower concentration of glycerol in the blood compared to glucose. Buscaglia et al. [68]demonstrated that aldolase bridges the actin-myosin motor, which is involved in glidingmotility and host cell invasion, and an invasin protein that connects to host cell receptors.Metabolite (and drug) binding to aldolase prevents interactions between aldolase and theinvasin protein, which has negative effects on parasite motility. Therefore, the observedreduction of parasitemia upon aldolase inhibition might rather be caused by impaired hostcell invasion than metabolic effects.
73
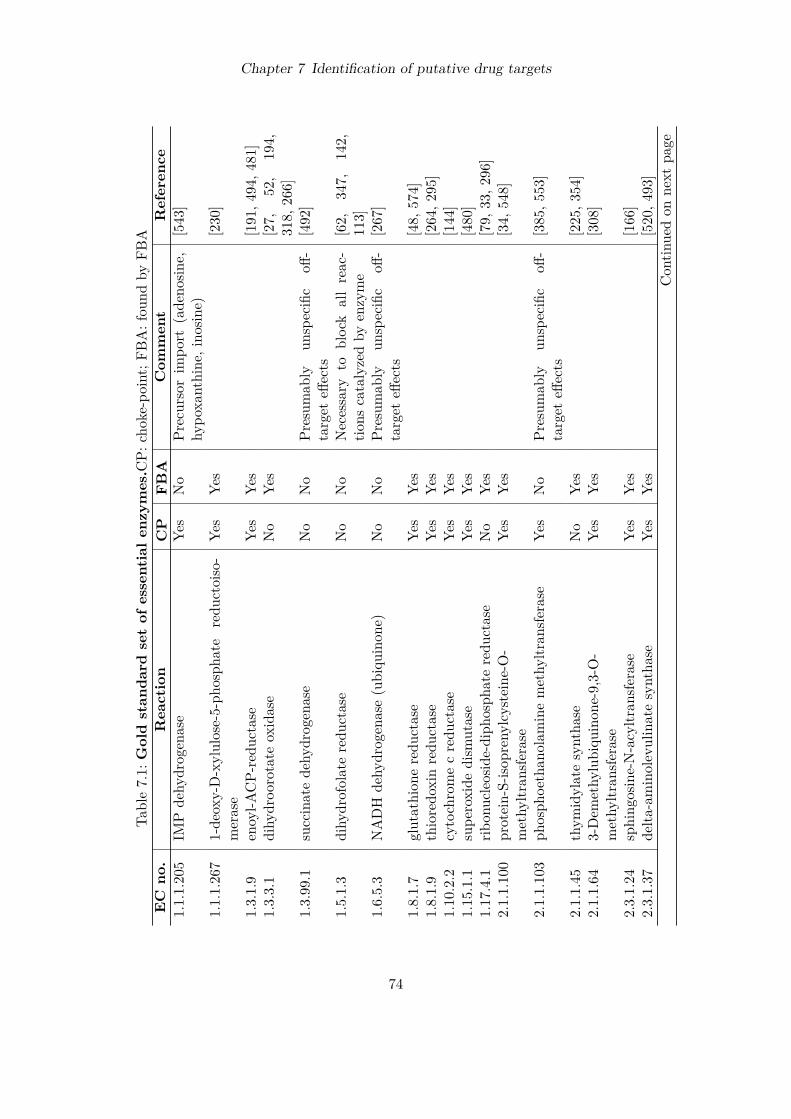
Chapter 7 Identification of putative drug targets
Table7.1:Goldstan
dard
setof
essentialen
zymes.C
P:choke-po
int;FB
A:fou
ndby
FBA
EC
no.
Reaction
CP
FBA
Com
ment
Referen
ce1.1.1.20
5IM
Pde
hydrog
enase
Yes
No
Precursorim
port
(ade
nosin
e,hy
poxa
nthine
,ino
sine)
[543
]
1.1.1.26
71-de
oxy-D-xylulose-5-ph
osph
ate
redu
ctoiso-
merase
Yes
Yes
[230
]
1.3.1.9
enoyl-A
CP-
redu
ctase
Yes
Yes
[191
,494
,481
]1.3.3.1
dihy
droo
rotate
oxidase
No
Yes
[27,
52,
194,
318,
266]
1.3.99
.1succinatede
hydrog
enase
No
No
Presum
ably
unspecific
off-
target
effects
[492
]
1.5.1.3
dihy
drofolateredu
ctase
No
No
Necessary
toblock
allreac-
tions
catalyzedby
enzyme
[62,
347,
142,
113]
1.6.5.3
NADH
dehy
drog
enase(ubiqu
inon
e)No
No
Presum
ably
unspecific
off-
target
effects
[267
]
1.8.1.7
glutathion
eredu
ctase
Yes
Yes
[48,
574]
1.8.1.9
thioredo
xinredu
ctase
Yes
Yes
[264
,295
]1.10
.2.2
cytochromecredu
ctase
Yes
Yes
[144
]1.15
.1.1
supe
roxide
dism
utase
Yes
Yes
[480
]1.17
.4.1
ribon
ucleoside-diph
osph
ateredu
ctase
No
Yes
[79,
33,2
96]
2.1.1.10
0protein-S-iso
prenylcysteine
-O-
methy
ltran
sferase
Yes
Yes
[34,
548]
2.1.1.10
3ph
osph
oethan
olam
inemethy
ltran
sferase
Yes
No
Presum
ably
unspecific
off-
target
effects
[385
,553
]
2.1.1.45
thym
idylatesyntha
seNo
Yes
[225
,354
]2.1.1.64
3-Dem
ethy
lubiqu
inon
e-9,3-O-
methy
ltran
sferase
Yes
Yes
[308
]
2.3.1.24
sphing
osine-N-acyltr
ansferase
Yes
Yes
[166
]2.3.1.37
delta
-aminolevulinatesyntha
seYe
sYe
s[520
,493
]Con
tinue
don
next
page
74

Chapter 7 Identification of putative drug targets
Tab
le7.1–continue
dfrom
previous
page
EC
no.
Reaction
CP
FBA
Com
ment
Referen
ce2.3.1.41
3-Oxo
acyl-[a
cyl-c
arrie
rprotein]
syntha
seYe
sYe
s[536
,396
]2.3.1.50
serin
e-pa
lmito
yltran
sferase
No
Yes
[166
]2.4.2.1
purin
e-nu
cleosid
eph
osph
orylase
Yes
No
Precursor
impo
rt(hyp
oxan
-thine,
xanthine
)[248
]
2.4.2.8
hypo
xanthine
phosph
oribosyltran
sferase
Yes
No
Necessary
toblock
allreac-
tions
catalyzedby
enzyme
[115
,438
,285
]
2.5.1.15
dihy
drop
teroatesyntha
seYe
sNo
Precursorim
port
(folate)
[316
,508
,347
]2.5.1.16
spermidinesyntha
seYe
sNo
Precursor
impo
rt(spe
rmi-
dine
)[183
]
2.5.1.18
glutathion
etran
sferase
Yes
Yes
[157
,18
7,28
8,38
3]2.5.1.19
3-Ph
osph
oshikimate-1-
carboxyv
inyltran
sferase
Yes
No
Precursor
impo
rt(4-
Aminob
enzoate,
folate)
[415
]
2.5.1.58
farnesyl-dipho
spha
te-fa
rnesyltran
sferase
No
Yes
[80]
2.7.1.32
cholinekina
seNo
No
Presum
ably
unspecific
off-
target
effects
[92]
2.7.8.3
ceramide-cholinep
hospho
tran
sferase
Yes
Yes
[166
]3.3.1.1
S-ad
enosyl-l-ho
mocysteinehy
drolase
Yes
Yes
[326
,25
3,46
8,66
]3.4.11
.1leuc
ineam
inop
eptid
ase
Yes
No
Precursor
impo
rt(amino
acids)
[352
]
3.4.14
.1dipe
ptidyl
aminop
eptid
ase1
No
No
Precursor
impo
rt(amino
acids)
[258
]
3.4.23
.38
plasmep
sins(aspartic
acid
proteases)
No
No
Precursor
impo
rt(amino
acids)
[357
,422
]
3.4.23
.39
plasmep
sins(aspartic
acid
proteases)
No
No
Precursor
impo
rt(amino
acids)
[357
,422
]
3.5.1.89
N-acetyl-g
lucosaminylph
osph
atidylinosito
lde
acetylase
No
Yes
[477
]
Con
tinue
don
next
page
75

Chapter 7 Identification of putative drug targets
Tab
le7.1–continue
dfrom
previous
page
EC
no.
Reaction
CP
FBA
Com
ment
Referen
ce3.5.2.3
dihy
droo
rotase
Yes
Yes
[455
,266
]3.5.4.4
aden
osinede
aminase
Yes
No
Precursor
impo
rt(hyp
oxan
-thine,
inosine,
xanthine
)[165
,511
]
4.1.1.17
ornithinede
carboxylase
No
No
Precursor
impo
rt(spe
rmi-
dine
,pu
trescine
);alternative
reactio
n
[20,
50,4
2]
4.1.1.23
orotidine-5-ph
osph
atede
carbox
ylase
Yes
Yes
[41,
327,
268,
454,
451]
4.1.1.50
aden
osylmethion
inede
carboxylase
No
No
Precursor
impo
rt(spe
rmi-
dine
)[556
]
4.1.2.13
fruc
tose-bisp
hospha
tealdo
lase
Yes
No
Presum
ablemainan
timalarial
effectis
impa
iredho
stcellin-
vasio
n
[541
,223
]
4.2.1.1
carbon
ican
hydrase
Yes
Yes
[411
]4.2.1.24
δ-am
inolevulinic
acid
dehy
dratase
No
Yes
[55]
4.2.1.58
-61
3-hy
drox
yacyl-A
CP
dehy
dratase
Yes
Yes
[458
]
4.2.3.5
chorism
atesyntha
seYe
sNo
Precursor
impo
rt(4-
Aminob
enzoate,
folate)
[318
]
4.4.1.5
lactoylglutathione
lyase
Yes
Yes
[505
]4.6.1.12
2-C-m
ethy
l-D-erythrit
ol-2,4-
cyclod
ipho
spha
te-syn
thase
No
Yes
[109
]
5.99
.1.2
topo
isomeraseI
Yes
Yes
[53]
5.99
.1.3
topo
isomeraseII
Yes
Yes
[159
,85,
356]
6.1.1.3
threon
ine-tR
NA
ligase
Yes
Yes
[425
]6.1.1.7
alan
ine-tR
NA
ligase
Yes
Yes
[102
]6.3.2.2
γ-glutamylcysteine
synthe
tase
Yes
Yes
[390
,295
,323
]6.3.4.4
adenylosuc
cina
tesynthe
tase
Yes
Yes
[129
]Con
tinue
don
next
page
76

Chapter 7 Identification of putative drug targets
Tab
le7.1–continue
dfrom
previous
page
EC
no.
Reaction
CP
FBA
Com
ment
Referen
ce6.3.5.2
GMP
synthe
tase
No
No
Necessary
toblock
allreac-
tions
catalyzed
byen
zyme;
precursor
impo
rt(gua
-nine
/gua
nosin
e)
[314
]
6.3.5.5
carbam
oyl-p
hospha
tesyntha
seNo
Yes
[148
]6.3.5.8
amino-de
oxycho
rismatesyntha
seNo
No
Precursor
impo
rt(4-
Aminob
enzoate,
folate)
[536
]
77
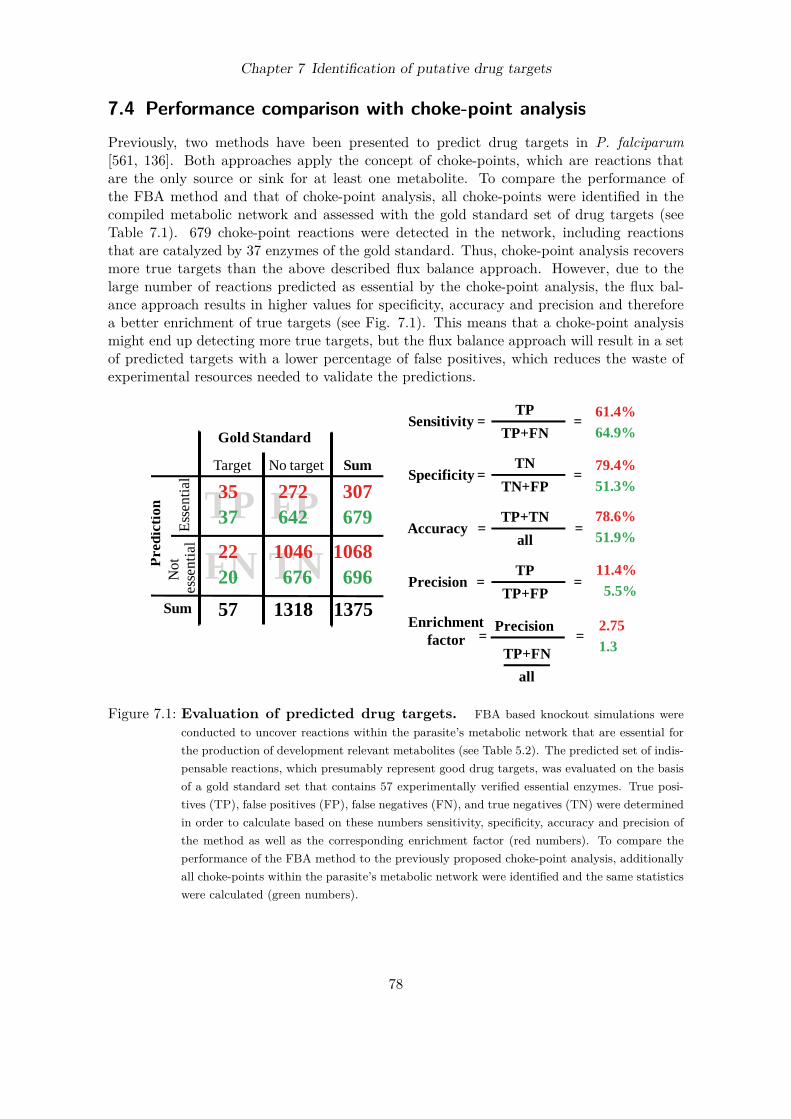
Chapter 7 Identification of putative drug targets
7.4 Performance comparison with choke-point analysisPreviously, two methods have been presented to predict drug targets in P. falciparum[561, 136]. Both approaches apply the concept of choke-points, which are reactions thatare the only source or sink for at least one metabolite. To compare the performance ofthe FBA method and that of choke-point analysis, all choke-points were identified in thecompiled metabolic network and assessed with the gold standard set of drug targets (seeTable 7.1). 679 choke-point reactions were detected in the network, including reactionsthat are catalyzed by 37 enzymes of the gold standard. Thus, choke-point analysis recoversmore true targets than the above described flux balance approach. However, due to thelarge number of reactions predicted as essential by the choke-point analysis, the flux bal-ance approach results in higher values for specificity, accuracy and precision and thereforea better enrichment of true targets (see Fig. 7.1). This means that a choke-point analysismight end up detecting more true targets, but the flux balance approach will result in a setof predicted targets with a lower percentage of false positives, which reduces the waste ofexperimental resources needed to validate the predictions.
Gold Standard
Pred
ictio
n
Target No target
Not
es
sent
ial
Esse
ntia
l
Sum
Sum
TPFN
FPTN
3537
272642
307679
2220
1046676
1068696
57 1318 1375
Sensitivity = =TP
TP+FN
Specificity = =TN
TN+FP
Accuracy = =TP+TN
all
Precision = =TP
TP+FP
61.4%64.9%
79.4%51.3%
78.6%51.9%
11.4%5.5%
Enrichmentfactor
Precision
all
2.751.3
= =TP+FN
Figure 7.1: Evaluation of predicted drug targets. FBA based knockout simulations wereconducted to uncover reactions within the parasite’s metabolic network that are essential forthe production of development relevant metabolites (see Table 5.2). The predicted set of indis-pensable reactions, which presumably represent good drug targets, was evaluated on the basisof a gold standard set that contains 57 experimentally verified essential enzymes. True posi-tives (TP), false positives (FP), false negatives (FN), and true negatives (TN) were determinedin order to calculate based on these numbers sensitivity, specificity, accuracy and precision ofthe method as well as the corresponding enrichment factor (red numbers). To compare theperformance of the FBA method to the previously proposed choke-point analysis, additionallyall choke-points within the parasite’s metabolic network were identified and the same statisticswere calculated (green numbers).
78

Chapter 7 Identification of putative drug targets
7.5 Ranking of predicted drug targetsSome of the targets predicted by the flux balance approach that are not covered by the goldstandard might nevertheless be valid targets. To address this question, the SuperTargetdatabase [179] was queried with the respective EC numbers to check whether some of thesereactions are catalyzed by enzymes that were previously targeted in the course of medicaltreatments or were shown to have effects on the viability of an organism or pathogenic cell.Of 155 reactions that are assigned to genes and are predicted to be essential but are notcovered by the gold standard enzymes, 39 correspond to enzymes that are listed in theSuperTarget database as drug targets.To avoid unwanted side effects within the human host, it is beneficial to target para-
sitic enzymes that are not homologous to human enzymes. Therefore a BLAST search wascompleted on human protein sequences (non-redundant protein sequences) using the pre-dicted parasitic protein sequences from PlasmoDB as queries. Analogous to [561] an E-valuesignificance threshold of < 0.075 was applied to determine homologous sequences. Of the198 reactions that were predicted to be essential and are associated with genes, 168 arecatalyzed by enzymes that are homologous to human enzymes. The gene products catalyz-ing the remaining 30 reactions represent presumably good drug target candidates. Targetswith human homologs may still be interesting targets as long as binding sites for potentialinhibitors are sufficiently distinct.As discussed above, reactions predicted to be essential are not necessarily essential during
all time points. Therefore, the stage-specific metabolic fluxes calculated in the previouschapter were considered to get an idea during which stages reactions are essential. In thiscontext, the consensus reactions calculated for each life cycle stage (reactions that carry anon-zero flux in all flux profiles corresponding to the same life cycle stage) were mappedonto the set of essential reactions (see Table 4). This mapping gives a hint on targets thatare present during all time points as opposed to those that are only active during certainstages. Depending on the time point when a reaction of the latter type is essential, drugsdesigned to inhibit the respective enzyme can either be applied as prophylactic drugs tokill the liver stages of the parasite and prevent disease symptoms or to treat the disease bykilling blood stages of the parasite, respectively.Predicted drug target reactions that do not correspond to the gold standard set, but are
associated with genes, were ranked according to a score that represents the sum of weightingfactors assigned to the following features (see Table 4): weighting factor 2 if correspondinggenes are not homologous to human genes, weighting factor 1 if the enzymatic function is tar-geted in any organism (i.e., EC number is listed in the SuperTarget database) and weightingfactor 1 if the reaction is active during all parasitic life cycle stages. The latter weighting fac-tor prioritizes exemplarily those targets that are suitable for prophylaxis and disease treat-ment. Depending on which developmental stage of the parasite one is interested in to inhibitthis weighting factor can be adapted. The 30 top ranking targets are listed in Table 7.2.Strikingly, among the eight top ranking enzymes/transporters four enzymes and one trans-porter are assigned to the apicoplast, which harbors prokaryotic biochemical pathways andwas therefore proposed as an interesting drug target [403, 546]. Three of the top ranking en-zymes are involved in the biosynthesis of isopentenyl diphosphate (IPP). Since two enzymesof the IPP biosynthesis pathway (1-deoxy-D-xylulose-5-phosphate reductoisomerase, 2-C-methyl-D-erythritol-2,4-cyclodiphosphate-synthase) have already been suggested as poten-
79
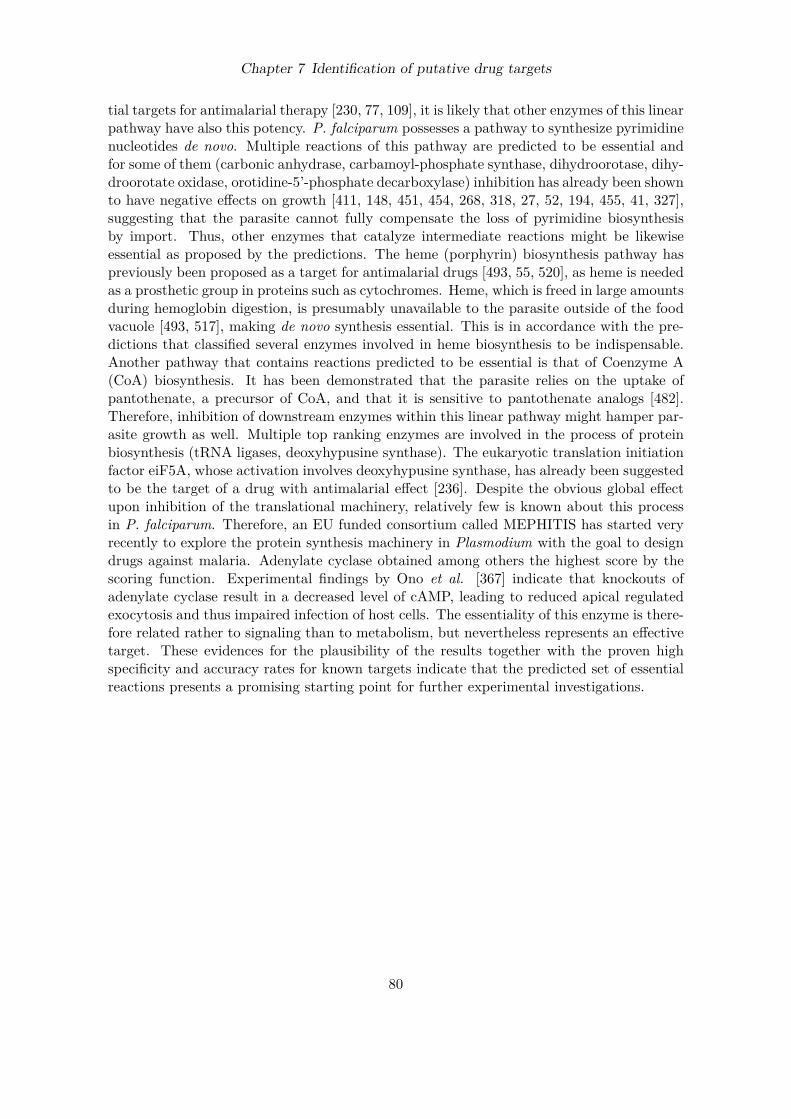
Chapter 7 Identification of putative drug targets
tial targets for antimalarial therapy [230, 77, 109], it is likely that other enzymes of this linearpathway have also this potency. P. falciparum possesses a pathway to synthesize pyrimidinenucleotides de novo. Multiple reactions of this pathway are predicted to be essential andfor some of them (carbonic anhydrase, carbamoyl-phosphate synthase, dihydroorotase, dihy-droorotate oxidase, orotidine-5’-phosphate decarboxylase) inhibition has already been shownto have negative effects on growth [411, 148, 451, 454, 268, 318, 27, 52, 194, 455, 41, 327],suggesting that the parasite cannot fully compensate the loss of pyrimidine biosynthesisby import. Thus, other enzymes that catalyze intermediate reactions might be likewiseessential as proposed by the predictions. The heme (porphyrin) biosynthesis pathway haspreviously been proposed as a target for antimalarial drugs [493, 55, 520], as heme is neededas a prosthetic group in proteins such as cytochromes. Heme, which is freed in large amountsduring hemoglobin digestion, is presumably unavailable to the parasite outside of the foodvacuole [493, 517], making de novo synthesis essential. This is in accordance with the pre-dictions that classified several enzymes involved in heme biosynthesis to be indispensable.Another pathway that contains reactions predicted to be essential is that of Coenzyme A(CoA) biosynthesis. It has been demonstrated that the parasite relies on the uptake ofpantothenate, a precursor of CoA, and that it is sensitive to pantothenate analogs [482].Therefore, inhibition of downstream enzymes within this linear pathway might hamper par-asite growth as well. Multiple top ranking enzymes are involved in the process of proteinbiosynthesis (tRNA ligases, deoxyhypusine synthase). The eukaryotic translation initiationfactor eiF5A, whose activation involves deoxyhypusine synthase, has already been suggestedto be the target of a drug with antimalarial effect [236]. Despite the obvious global effectupon inhibition of the translational machinery, relatively few is known about this processin P. falciparum. Therefore, an EU funded consortium called MEPHITIS has started veryrecently to explore the protein synthesis machinery in Plasmodium with the goal to designdrugs against malaria. Adenylate cyclase obtained among others the highest score by thescoring function. Experimental findings by Ono et al. [367] indicate that knockouts ofadenylate cyclase result in a decreased level of cAMP, leading to reduced apical regulatedexocytosis and thus impaired infection of host cells. The essentiality of this enzyme is there-fore related rather to signaling than to metabolism, but nevertheless represents an effectivetarget. These evidences for the plausibility of the results together with the proven highspecificity and accuracy rates for known targets indicate that the predicted set of essentialreactions presents a promising starting point for further experimental investigations.
80
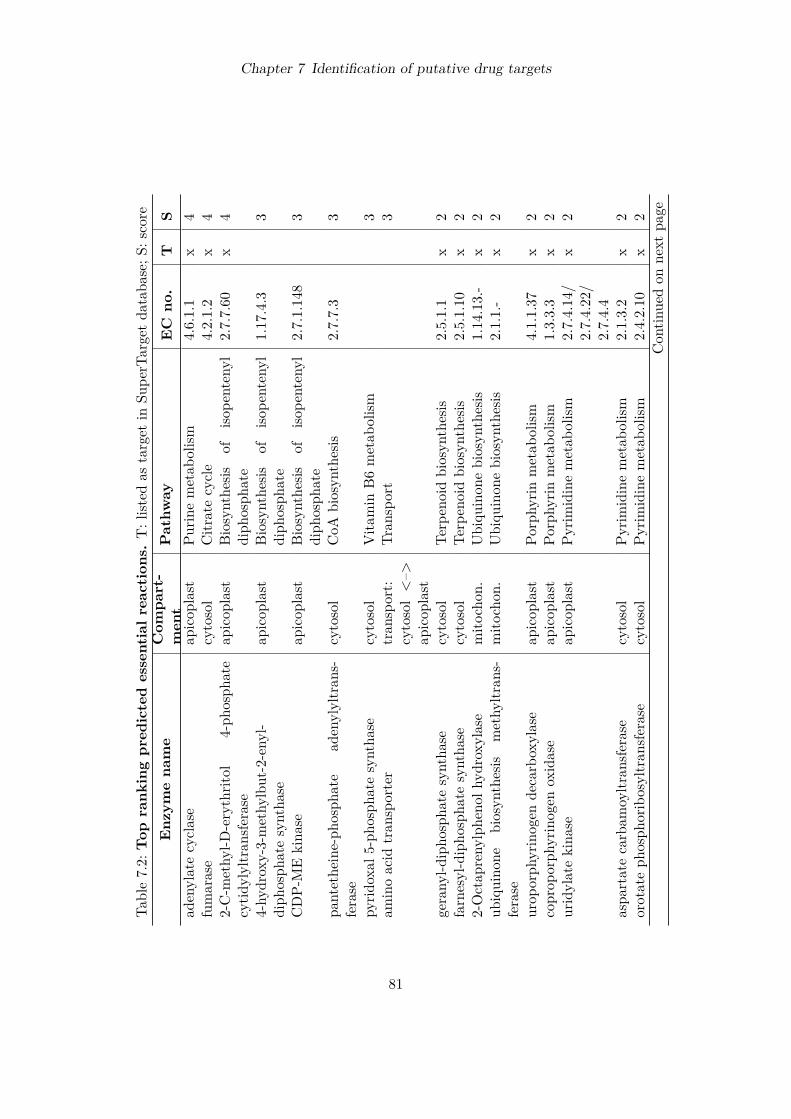
Chapter 7 Identification of putative drug targets
Table7.2:Top
rank
ingpred
ictedessentialreaction
s.T:list
edas
target
inSu
perT
argetda
taba
se;S
:score
Enz
ymena
me
Com
part-
ment
Pathw
ayEC
no.
TS
adenylatecyclase
apicop
last
Purin
emetab
olism
4.6.1.1
x4
fumarase
cytosol
Citr
atecycle
4.2.1.2
x4
2-C-m
ethy
l-D-erythrit
ol4-ph
osph
ate
cytid
ylyltran
sferase
apicop
last
Biosynthe
sisof
isope
ntenyl
diph
osph
ate
2.7.7.60
x4
4-hy
drox
y-3-methy
lbut-2-eny
l-diph
osph
atesyntha
seap
icop
last
Biosynthe
sisof
isope
ntenyl
diph
osph
ate
1.17
.4.3
3
CDP-
ME
kina
seap
icop
last
Biosynthe
sisof
isope
ntenyl
diph
osph
ate
2.7.1.14
83
pantethe
ine-ph
osph
ate
adenylyltran
s-ferase
cytosol
CoA
biosyn
thesis
2.7.7.3
3
pyrid
oxal
5-ph
osph
atesyntha
secytosol
Vita
min
B6metab
olism
3am
inoacid
tran
sporter
tran
sport:
cytosol<–>
apicop
last
Tran
sport
3
gerany
l-dipho
spha
tesyntha
secytosol
Terpen
oidbiosyn
thesis
2.5.1.1
x2
farnesyl-dipho
spha
tesyntha
secytosol
Terpen
oidbiosyn
thesis
2.5.1.10
x2
2-Octap
reny
lphe
nolh
ydroxy
lase
mito
chon
.Ubiqu
inon
ebiosyn
thesis
1.14
.13.-
x2
ubiquino
nebiosyn
thesis
methy
ltran
s-ferase
mito
chon
.Ubiqu
inon
ebiosyn
thesis
2.1.1.-
x2
urop
orph
yrinog
ende
carboxylase
apicop
last
Porphy
rinmetab
olism
4.1.1.37
x2
coprop
orph
yrinog
enox
idase
apicop
last
Porphy
rinmetab
olism
1.3.3.3
x2
uridylatekina
seap
icop
last
Pyrim
idinemetab
olism
2.7.4.14
/2.7.4.22
/2.7.4.4
x2
aspa
rtatecarbam
oyltr
ansferase
cytosol
Pyrim
idinemetab
olism
2.1.3.2
x2
orotateph
osph
oribosyltran
sferase
cytosol
Pyrim
idinemetab
olism
2.4.2.10
x2
Con
tinue
don
next
page
81

Chapter 7 Identification of putative drug targets
Tab
le7.2–continue
dfrom
previous
page
Enz
ymena
me
Com
part-
ment
Pathw
ayEC
no.
TS
cysteine
desulfu
rase
apicop
last/
mito
chon
.Fe
-S-protein
biog
enesis
2.8.1.7
x2
tRNA
ligase(Ile,L
ys,M
et,T
rp,T
yr)
cytosol/
api-
coplast/
mi-
tochon
.
Aminoa
cyl-t
RNA
biosyn
the-
sis6.1.1.1/
6.1.1.2/
6.1.1.5/
6.1.1.6/
6.1.1.10
x2
glutathion
esyntha
secytosol
Glutathione
metab
olism
6.3.2.3
x2
ribofl
avin
kina
secytosol
Ribofl
avin
metab
olism
2.7.1.26
x2
gluc
osam
ine6-ph
osph
atesyntha
seap
icop
last
Aminosug
arsmetab
olism
2.6.1.16
x2
man
nose-6-pho
spha
teiso
merase
cytosol
Fruc
tose
and
man
nose
meta-
bolism
5.3.1.8
x2
cytochrome-coxidase
mito
chon
.Oxida
tiveph
osph
orylation
1.9.3.1
x2
choline-ph
osph
atecytid
ylyltran
sferase
cytosol
Glyceroph
osph
olipid
meta-
bolism
2.7.7.15
x2
deoxyh
ypusinesyntha
secytosol
Activationof
eiF5
A2.5.1.46
x2
82

Chapter 7 Identification of putative drug targets
7.6 DiscussionExperimental validation of drug targets with the help of gene knockout techniques is a timeconsuming issue. Flux balance analysis provides a fast means to reduce the search space,since reactions essential for parasite development can be identified on the basis of theirinvolvement in the synthesis process of indispensable metabolites. Drug targets predictedin this work were evaluated on the basis of a set of known essential enzymes, revealingthat the applied flux balance approach is able to enrich true targets in the set of predictedtargets. The presented FBA approach has the advantage over other computational drugtarget detection methods that it performs reasonably well, as has been demonstrated by acomparison with choke-point analysis, and that it requires only short computation times.The latter plays a role especially when the metabolic network of interest is large and beyondthe capabilities of methods such as minimal cut sets that need to explore all paths througha network.Additional information including homology to host enzymes and reported negative effects
on cell development in other organisms was used to rank proposed targets. Targets withhigh ranks were found to be involved in metabolic pathways, which contain enzymes alreadyknown to be essential for parasite development.As has been shown for fatty acid synthase [526], which is only essential during late liver
stage, the importance of enzymes might vary during different life cycle stages. Therefore,predictions of metabolic fluxes during the individual stages of parasite development mayhelp to identify reactions that are always active opposed to those that only occur duringcertain stages. By this means, targets can be identified that are suitable for prophylaxis,therapy or both (depending on the applied scoring criterion), thereby aiding the drug targetdetection process.
83

Chapter 8
Conclusions and outlook
The goal of this work was to explore the capabilities of systems biology methods in the con-text of drug target detection within the metabolism of the malaria pathogen P. falciparumand distinction between targets suitable for malaria prophylaxis, therapy or both. For thispurpose, a comprehensive multi-compartment metabolic network was compiled for the par-asite based on data from several resources. This network was validated by flux balancesimulations to obtain a consistent network that is able to fulfill metabolic processes, such ashemoglobin digestion, known from the literature to occur in P. falciparum. With the help ofan adapted version of the method proposed by Shlomi et al. [465], metabolic flux distribu-tions corresponding to the parasite’s individual life cycle stages were derived from gene ex-pression profiles measured during respective stages. These predicted flux distributions wereshown to agree well with literature knowledge in terms of exchanged metabolites betweenparasite and host during the blood stage. However, it was necessary to integrate additionalinformation into the calculations in order to obtain this level of accordance. The meta-bolic network of the parasite was combined with that of the erythrocyte and stage-specificknowledge like plasma metabolite concentrations was considered to account for the actualcellular environment of the parasite. In addition, gene expression data of previous stageswere included, since enzymes might be present although corresponding gene transcripts arealready degraded. Experimentally determined exchanges between host and parasite areonly available for the blood stage, preventing evaluation of predictions corresponding toother stages. As predictions depend on the incorporation of further information, predic-tion quality is likely to be limited for those stages where it was not possible to integratesuch information (liver and mosquito stages). This is also suggested by proteomics data,which coincide better with blood stage flux distributions than with those corresponding tomosquito stages. Considering available proteomics and metabolomics data, will presumablyimprove predictions, as such data are closer to the phenotype than gene expression data dueto posttranscriptional regulation. Flux predictions for liver stages can be further improvedwhen the metabolic network of the hepatocyte, which has been completed very recently, isintegrated into the calculations.The assembled metabolic network of P. falciparum has been shown to be useful with
respect to identification of putative drug targets. About two thirds of experimentally vali-dated essential enzymes could be recovered by flux balance knockout simulations. Almost allremaining true targets were detected when additionally available nutrients were constrained,suggesting that the parasite is not able to compensate inhibited pathways by import of re-spective nutrients although transporters exist. More information about provided nutrientsas well as target metabolites is required to improve predictions, as enzyme essentiality doesnot only depend on network topology, but also on the cellular environment present during
84

Chapter 8 Conclusions and outlook
a stage of interest. This is supported by the results of a comparison between choke-pointanalysis, a pure topology based method, and the here applied flux balance approach, whichsucceeds the former in terms of specificity, accuracy and precision.For the knockout simulations a set of target metabolites was considered that includes all
metabolites essential during any life cycle stage of the parasite. Therefore, not all enzymesthat were found to be indispensable are essential during all stages. Overlaying the metabolicnetwork with stage-specific flux predictions, reveals which enzymes come into question astargets during the different stages, i.e., which targets are suitable for malaria prophylaxis(essential during liver stages) or malaria treatment (essential during blood stages).With regard to the iterative cycle underlying systems biology approaches (see Fig. 1.2),
the present work is currently in the phase of hypothesis generation. A model describing themetabolism of P. falciparum has been constructed based on available data and simulationshave been conducted that allow to make predictions on stage-specific metabolism and oneffects of knockouts. These predictions now await experimental validation. Data derivedfrom these experiments will then help to refine the model and to improve predictions untilthe model reproduces reality reasonably well.The current trend is to refine predictions by combining reconstructed cellular networks
with different types of high-throughput data, e.g., metabolic networks with gene expressiondata as presented here. Since proteomics data and to a smaller extent metabolomics dataare available for P. falciparum, future extensions of the parasite’s metabolism model couldinclude constraints reflecting these data. In addition, observed protein-protein interactionscould be used to distinguish isoenzymes from components of a multi-enzyme complex, whichonly fulfill their function when all components are expressed simultaneously. P. falciparumgenes are assumed to be posttranscriptionally regulated, but increasing hints suggest thatregulation at the level of transcription initiation also plays a role [59, 271, 290, 291]. Tran-scription factors have been identified by bioinformatics approaches [161, 72] and putativecis-regulatory elements have been detected by statistical analysis of promoter regions ofco-expressed genes [564]. In addition, ChIP-on-chip (chromatin immunoprecipitation) tech-nology is available that will help to investigate interactions between proteins and DNA, thusidentifying transcription factors and respective promoter regions. These efforts will even-tually allow to reconstruct the gene regulatory network of the parasite, which can then becombined with the metabolic network. By this means, the impact on metabolism and henceparasite viability upon inhibition of transcription factors can be assessed and putative drugtargets identified. The more experimentally determined information can be incorporatedinto the model, the less assumptions have to be made. The ultimate goal is a compre-hensive model that combines metabolism, gene regulation and signal transduction, makingassumptions about cellular objectives redundant, as they are intrinsic to the model itself.
85

Applied experimental data
1 Gene expression data
86

Applied experimental data
Table1:Gen
eexpression
samples.
Sample
Set
Source
Organ
ism
Stage
Exp
erim
ent
TarunP
yLS2
4Cy3
LS24
Tarun
P.yoelii
24h
post
liver
infection;
Cy3
labe
led
2-coloroligomicroarray
TarunP
yLS4
0Cy3
LS40
Tarun
P.yoelii
40h
post
liver
infection;
Cy3
labe
led
2-coloroligomicroarray
TarunP
yLS4
0Cy5
LS40
Tarun
P.yoelii
40h
post
liver
infection;
Cy5
labe
led
2-coloroligomicroarray
TarunP
yLS5
0Cy3
LS50
Tarun
P.yoelii
50h
post
liver
infection;
Cy3
labe
led
2-coloroligomicroarray
TarunP
yBSC
y3eR
ing,
lRing,
eTroph
o,lTroph
o,eS
chiz,
lSchiz
Tarun
P.yoelii
mixed
erythrocytic
stag
es;
Cy3
labe
led
2-coloroligomicroarray
TarunP
yBSC
y5eR
ing,
lRing,
eTroph
o,lTroph
o,eS
chiz,
lSchiz
Tarun
P.yoelii
mixed
erythrocytic
stag
es;
Cy5
labe
led
2-coloroligomicroarray
TarunP
ySchzC
y5eS
chiz,
lSchiz
Tarun
P.yoelii
erythrocytic
schizonts;
Cy5
labe
led
2-coloroligomicroarray
TarunP
yooS
pzCy3
ooSp
oro
Tarun
P.yoelii
1d
post
bloo
dmeal
mosqu
itomidgu
tsporo-
zoite
s;Cy3
labe
led
2-coloroligomicroarray
Con
tinue
don
next
page
87

Applied experimental data
Tab
le1–continue
dfrom
previous
page
Sample
Set
Source
Organ
ism
Stage
Exp
erim
ent
TarunP
yooS
pzCy5
ooSp
oro
Tarun
P.yoelii
1d
post
bloo
dmeal
mosqu
itomidgu
tsporo-
zoite
s;Cy5
labe
led
2-coloroligomicroarray
TarunP
ysgS
pzCy3
sgSp
oro
Tarun
P.yoelii
15d
post
bloo
dmeal
mosqu
itosaliv
ary
glan
dsporozoites;
Cy3
labe
led
2-coloroligomicroarray
TarunP
ysgS
pzCy5
sgSp
oro
Tarun
P.yoelii
15d
post
bloo
dmeal
mosqu
itosaliv
ary
glan
dsporozoites;
Cy5
labe
led
2-coloroligomicroarray
SacciPyL
S40
LS40
Sacci
P.yoelii
40hpo
stliv
erinfection
cDNA
library
LeRochP
fERing
eRing
LeRoch
P.falciparum
early
ringstag
esoligomicroarray
LeRochP
fLRing
lRing
LeRoch
P.falciparum
late
ringstag
esoligomicroarray
LeRochP
fETr
opho
eTroph
oLe
Roch
P.falciparum
early
trop
hozoite
soligomicroarray
LeRochP
fLTr
opho
lTroph
oLe
Roch
P.falciparum
late
trop
hozoite
soligomicroarray
LeRochP
fESchiz
eSchiz
LeRoch
P.falciparum
early
erythrocytic
sch-
izon
tsoligomicroarray
LeRochP
fLSchiz
lSchiz
LeRoch
P.falciparum
late
erythrocytic
schizonts
oligomicroarray
LeRochP
fMero
Mero
LeRoch
P.falciparum
merozoite
stag
eoligomicroarray
LeRochP
fGam
eto
Gam
eto
LeRoch
P.falciparum
gametocytestag
eoligomicroarray
LeRochP
fSpo
rosgSp
oro
LeRoch
P.falciparum
mosqu
itosaliv
ary
glan
dsporozoites
oligomicroarray
Bozde
chPfTP1
eRing
Bozde
chP.
falciparum
1hpo
sterythrocyteinfec-
tion;
Cy5
labe
led
2-coloroligomicroarray
Bozde
chPfTP2
eRing
Bozde
chP.
falciparum
2hpo
sterythrocyteinfec-
tion;
Cy5
labe
led
2-coloroligomicroarray
Bozde
chPfTP3
eRing
Bozde
chP.
falciparum
3hpo
sterythrocyteinfec-
tion;
Cy5
labe
led
2-coloroligomicroarray
Bozde
chPfTP4
eRing
Bozde
chP.
falciparum
4hpo
sterythrocyteinfec-
tion;
Cy5
labe
led
2-coloroligomicroarray
Con
tinue
don
next
page
88

Applied experimental data
Tab
le1–continue
dfrom
previous
page
Sample
Set
Source
Organ
ism
Stage
Exp
erim
ent
Bozde
chPfTP5
eRing
Bozde
chP.
falciparum
5hpo
sterythrocyteinfec-
tion;
Cy5
labe
led
2-coloroligomicroarray
Bozde
chPfTP6
eRing
Bozde
chP.
falciparum
6hpo
sterythrocyteinfec-
tion;
Cy5
labe
led
2-coloroligomicroarray
Bozde
chPfTP7
eRing
Bozde
chP.
falciparum
7hpo
sterythrocyteinfec-
tion;
Cy5
labe
led
2-coloroligomicroarray
Bozde
chPfTP8
eRing
Bozde
chP.
falciparum
8hpo
sterythrocyteinfec-
tion;
Cy5
labe
led
2-coloroligomicroarray
Bozde
chPfTP9
lRing
Bozde
chP.
falciparum
9hpo
sterythrocyteinfec-
tion;
Cy5
labe
led
2-coloroligomicroarray
Bozde
chPfTP1
0lR
ing
Bozde
chP.
falciparum
10h
post
erythrocytein-
fection;
Cy5
labe
led
2-coloroligomicroarray
Bozde
chPfTP1
1lR
ing
Bozde
chP.
falciparum
11h
post
erythrocytein-
fection;
Cy5
labe
led
2-coloroligomicroarray
Bozde
chPfTP1
2lR
ing
Bozde
chP.
falciparum
12h
post
erythrocytein-
fection;
Cy5
labe
led
2-coloroligomicroarray
Bozde
chPfTP1
3lR
ing
Bozde
chP.
falciparum
13h
post
erythrocytein-
fection;
Cy5
labe
led
2-coloroligomicroarray
Bozde
chPfTP1
4lR
ing
Bozde
chP.
falciparum
14h
post
erythrocytein-
fection;
Cy5
labe
led
2-coloroligomicroarray
Bozde
chPfTP1
5lR
ing
Bozde
chP.
falciparum
15h
post
erythrocytein-
fection;
Cy5
labe
led
2-coloroligomicroarray
Bozde
chPfTP1
6lR
ing
Bozde
chP.
falciparum
16h
post
erythrocytein-
fection;
Cy5
labe
led
2-coloroligomicroarray
Bozde
chPfTP1
7eT
roph
oBozde
chP.
falciparum
17h
post
erythrocytein-
fection;
Cy5
labe
led
2-coloroligomicroarray
Bozde
chPfTP1
8eT
roph
oBozde
chP.
falciparum
18h
post
erythrocytein-
fection;
Cy5
labe
led
2-coloroligomicroarray
Con
tinue
don
next
page
89

Applied experimental data
Tab
le1–continue
dfrom
previous
page
Sample
Set
Source
Organ
ism
Stage
Exp
erim
ent
Bozde
chPfTP1
9eT
roph
oBozde
chP.
falciparum
19h
post
erythrocytein-
fection;
Cy5
labe
led
2-coloroligomicroarray
Bozde
chPfTP2
0eT
roph
oBozde
chP.
falciparum
20h
post
erythrocytein-
fection;
Cy5
labe
led
2-coloroligomicroarray
Bozde
chPfTP2
1eT
roph
oBozde
chP.
falciparum
21h
post
erythrocytein-
fection;
Cy5
labe
led
2-coloroligomicroarray
Bozde
chPfTP2
2eT
roph
oBozde
chP.
falciparum
22h
post
erythrocytein-
fection;
Cy5
labe
led
2-coloroligomicroarray
Bozde
chPfTP2
4lTroph
oBozde
chP.
falciparum
24h
post
erythrocytein-
fection;
Cy5
labe
led
2-coloroligomicroarray
Bozde
chPfTP2
5lTroph
oBozde
chP.
falciparum
25h
post
erythrocytein-
fection;
Cy5
labe
led
2-coloroligomicroarray
Bozde
chPfTP2
6lTroph
oBozde
chP.
falciparum
26h
post
erythrocytein-
fection;
Cy5
labe
led
2-coloroligomicroarray
Bozde
chPfTP2
7lTroph
oBozde
chP.
falciparum
27h
post
erythrocytein-
fection;
Cy5
labe
led
2-coloroligomicroarray
Bozde
chPfTP2
8lTroph
oBozde
chP.
falciparum
28h
post
erythrocytein-
fection;
Cy5
labe
led
2-coloroligomicroarray
Bozde
chPfTP3
0eS
chiz
Bozde
chP.
falciparum
30h
post
erythrocytein-
fection;
Cy5
labe
led
2-coloroligomicroarray
Bozde
chPfTP3
1eS
chiz
Bozde
chP.
falciparum
31h
post
erythrocytein-
fection;
Cy5
labe
led
2-coloroligomicroarray
Bozde
chPfTP3
2eS
chiz
Bozde
chP.
falciparum
32h
post
erythrocytein-
fection;
Cy5
labe
led
2-coloroligomicroarray
Bozde
chPfTP3
3eS
chiz
Bozde
chP.
falciparum
33h
post
erythrocytein-
fection;
Cy5
labe
led
2-coloroligomicroarray
Bozde
chPfTP3
4eS
chiz
Bozde
chP.
falciparum
34h
post
erythrocytein-
fection;
Cy5
labe
led
2-coloroligomicroarray
Con
tinue
don
next
page
90

Applied experimental data
Tab
le1–continue
dfrom
previous
page
Sample
Set
Source
Organ
ism
Stage
Exp
erim
ent
Bozde
chPfTP3
5eS
chiz
Bozde
chP.
falciparum
35h
post
erythrocytein-
fection;
Cy5
labe
led
2-coloroligomicroarray
Bozde
chPfTP3
6eS
chiz
Bozde
chP.
falciparum
36h
post
erythrocytein-
fection;
Cy5
labe
led
2-coloroligomicroarray
Bozde
chPfTP3
7eS
chiz
Bozde
chP.
falciparum
37h
post
erythrocytein-
fection;
Cy5
labe
led
2-coloroligomicroarray
Bozde
chPfTP3
8lSchiz
Bozde
chP.
falciparum
38h
post
erythrocytein-
fection;
Cy5
labe
led
2-coloroligomicroarray
Bozde
chPfTP3
9lSchiz
Bozde
chP.
falciparum
39h
post
erythrocytein-
fection;
Cy5
labe
led
2-coloroligomicroarray
Bozde
chPfTP4
0lSchiz
Bozde
chP.
falciparum
40h
post
erythrocytein-
fection;
Cy5
labe
led
2-coloroligomicroarray
Bozde
chPfTP4
1lSchiz
Bozde
chP.
falciparum
41h
post
erythrocytein-
fection;
Cy5
labe
led
2-coloroligomicroarray
Bozde
chPfTP4
2lSchiz
Bozde
chP.
falciparum
42h
post
erythrocytein-
fection;
Cy5
labe
led
2-coloroligomicroarray
Bozde
chPfTP4
3lSchiz
Bozde
chP.
falciparum
43h
post
erythrocytein-
fection;
Cy5
labe
led
2-coloroligomicroarray
Bozde
chPfTP4
4lSchiz
Bozde
chP.
falciparum
44h
post
erythrocytein-
fection;
Cy5
labe
led
2-coloroligomicroarray
Bozde
chPfTP4
5lSchiz
Bozde
chP.
falciparum
45h
post
erythrocytein-
fection;
Cy5
labe
led
2-coloroligomicroarray
Bozde
chPfTP4
6lSchiz
Bozde
chP.
falciparum
46h
post
erythrocytein-
fection;
Cy5
labe
led
2-coloroligomicroarray
Bozde
chPfTP4
7Mero
Bozde
chP.
falciparum
47h
post
erythrocytein-
fection;
Cy5
labe
led
2-coloroligomicroarray
Bozde
chPfTP4
8Mero
Bozde
chP.
falciparum
48h
post
erythrocytein-
fection;
Cy5
labe
led
2-coloroligomicroarray
Con
tinue
don
next
page
91

Applied experimental data
Tab
le1–continue
dfrom
previous
page
Sample
Set
Source
Organ
ism
Stage
Exp
erim
ent
DailyPfGSM
2312
78eR
ing,
lRing
Daily
P.falciparum
Environm
entalstress
clus-
ter
oligomicroarray
DailyPfGSM
2312
79eR
ing,
lRing
Daily
P.falciparum
Environm
entalstress
clus-
ter
oligomicroarray
DailyPfGSM
2312
80eR
ing,
lRing
Daily
P.falciparum
Environm
entalstress
clus-
ter
oligomicroarray
DailyPfGSM
2312
81eR
ing,
lRing
Daily
P.falciparum
Environm
entalstress
clus-
ter
oligomicroarray
DailyPfGSM
2312
82eR
ing,
lRing
Daily
P.falciparum
Environm
entalstress
clus-
ter
oligomicroarray
DailyPfGSM
2312
83eR
ing,
lRing
Daily
P.falciparum
Environm
entalstress
clus-
ter
oligomicroarray
DailyPfGSM
2312
84eR
ing,
lRing
Daily
P.falciparum
Environm
entalstress
clus-
ter
oligomicroarray
DailyPfGSM
2312
85eR
ing,
lRing
Daily
P.falciparum
Environm
entalstress
clus-
ter
oligomicroarray
DailyPfGSM
2312
86eR
ing,
lRing
Daily
P.falciparum
Environm
entalstress
clus-
ter
oligomicroarray
DailyPfGSM
2312
87eR
ing,
lRing
Daily
P.falciparum
Environm
entalstress
clus-
ter
oligomicroarray
DailyPfGSM
2312
88eR
ing,
lRing
Daily
P.falciparum
Environm
entalstress
clus-
ter
oligomicroarray
DailyPfGSM
2312
89eR
ing,
lRing
Daily
P.falciparum
Environm
entalstress
clus-
ter
oligomicroarray
DailyPfGSM
2312
90eR
ing,
lRing
Daily
P.falciparum
Starvatio
ncluster
oligomicroarray
DailyPfGSM
2312
91eR
ing,
lRing
Daily
P.falciparum
Activegrow
thcluster
oligomicroarray
Con
tinue
don
next
page
92

Applied experimental data
Tab
le1–continue
dfrom
previous
page
Sample
Set
Source
Organ
ism
Stage
Exp
erim
ent
DailyPfGSM
2312
92eR
ing,
lRing
Daily
P.falciparum
Starvatio
ncluster
oligomicroarray
DailyPfGSM
2312
93eR
ing,
lRing
Daily
P.falciparum
Starvatio
ncluster
oligomicroarray
DailyPfGSM
2312
94eR
ing,
lRing
Daily
P.falciparum
Activegrow
thcluster
oligomicroarray
DailyPfGSM
2312
95eR
ing,
lRing
Daily
P.falciparum
Activegrow
thcluster
oligomicroarray
DailyPfGSM
2312
96eR
ing,
lRing
Daily
P.falciparum
Activegrow
thcluster
oligomicroarray
DailyPfGSM
2312
97eR
ing,
lRing
Daily
P.falciparum
Activegrow
thcluster
oligomicroarray
DailyPfGSM
2312
98eR
ing,
lRing
Daily
P.falciparum
Starvatio
ncluster
oligomicroarray
DailyPfGSM
2312
99eR
ing,
lRing
Daily
P.falciparum
Activegrow
thcluster
oligomicroarray
DailyPfGSM
2313
00eR
ing,
lRing
Daily
P.falciparum
Starvatio
ncluster
oligomicroarray
DailyPfGSM
2313
01eR
ing,
lRing
Daily
P.falciparum
Activegrow
thcluster
oligomicroarray
DailyPfGSM
2313
02eR
ing,
lRing
Daily
P.falciparum
Activegrow
thcluster
oligomicroarray
DailyPfGSM
2313
03eR
ing,
lRing
Daily
P.falciparum
Starvatio
ncluster
oligomicroarray
DailyPfGSM
2313
04eR
ing,
lRing
Daily
P.falciparum
Environm
entalstress
clus-
ter
oligomicroarray
DailyPfGSM
2313
05eR
ing,
lRing
Daily
P.falciparum
Environm
entalstress
clus-
ter
oligomicroarray
Con
tinue
don
next
page
93

Applied experimental data
Tab
le1–continue
dfrom
previous
page
Sample
Set
Source
Organ
ism
Stage
Exp
erim
ent
DailyPfGSM
2313
06eR
ing,
lRing
Daily
P.falciparum
Environm
entalstress
clus-
ter
oligomicroarray
DailyPfGSM
2313
07eR
ing,
lRing
Daily
P.falciparum
Environm
entalstress
clus-
ter
oligomicroarray
DailyPfGSM
2313
08eR
ing,
lRing
Daily
P.falciparum
Activegrow
thcluster
oligomicroarray
DailyPfGSM
2313
09eR
ing,
lRing
Daily
P.falciparum
Starvatio
ncluster
oligomicroarray
DailyPfGSM
2313
10eR
ing,
lRing
Daily
P.falciparum
Activegrow
thcluster
oligomicroarray
DailyPfGSM
2313
11eR
ing,
lRing
Daily
P.falciparum
Activegrow
thcluster
oligomicroarray
DailyPfGSM
2313
12eR
ing,
lRing
Daily
P.falciparum
Activegrow
thcluster
oligomicroarray
DailyPfGSM
2313
13eR
ing,
lRing
Daily
P.falciparum
Activegrow
thcluster
oligomicroarray
DailyPfGSM
2313
14eR
ing,
lRing
Daily
P.falciparum
Activegrow
thcluster
oligomicroarray
DailyPfGSM
2313
15eR
ing,
lRing
Daily
P.falciparum
Environm
entalstress
clus-
ter
oligomicroarray
DailyPfGSM
2313
16eR
ing,
lRing
Daily
P.falciparum
Activegrow
thcluster
oligomicroarray
DailyPfGSM
2313
17eR
ing,
lRing
Daily
P.falciparum
Activegrow
thcluster
oligomicroarray
DailyPfGSM
2313
18eR
ing,
lRing
Daily
P.falciparum
Activegrow
thcluster
oligomicroarray
DailyPfGSM
2313
19eR
ing,
lRing
Daily
P.falciparum
Starvatio
ncluster
oligomicroarray
Con
tinue
don
next
page
94

Applied experimental data
Tab
le1–continue
dfrom
previous
page
Sample
Set
Source
Organ
ism
Stage
Exp
erim
ent
DailyPfGSM
2313
20eR
ing,
lRing
Daily
P.falciparum
Activegrow
thcluster
oligomicroarray
95

Applied experimental data
2 Proteomics data
96
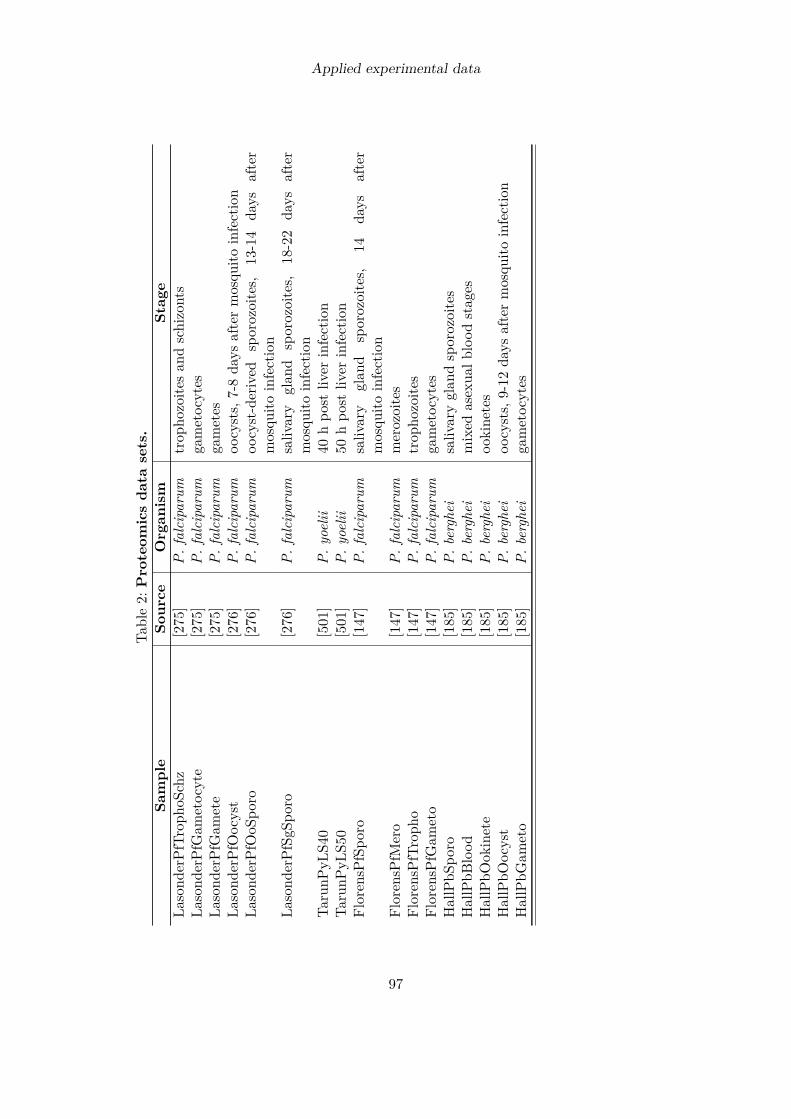
Applied experimental data
Table2:Proteom
icsda
tasets.
Sample
Source
Organ
ism
Stage
Lasond
erPfTr
opho
Schz
[275
]P.
falciparum
trop
hozoite
san
dschizonts
Lasond
erPfGam
etocyte
[275
]P.
falciparum
gametocytes
Lasond
erPfGam
ete
[275
]P.
falciparum
gametes
Lasond
erPfOocyst
[276
]P.
falciparum
oocysts,
7-8da
ysaftermosqu
itoinfection
Lasond
erPfOoS
poro
[276
]P.
falciparum
oocyst-derived
sporozoites,
13-14
days
after
mosqu
itoinfection
Lasond
erPfSg
Sporo
[276
]P.
falciparum
saliv
ary
glan
dsporozoites,
18-22
days
after
mosqu
itoinfection
TarunP
yLS4
0[501
]P.
yoelii
40hpo
stliv
erinfection
TarunP
yLS5
0[501
]P.
yoelii
50hpo
stliv
erinfection
Floren
sPfSpo
ro[147
]P.
falciparum
saliv
ary
glan
dsporozoites,
14da
ysafter
mosqu
itoinfection
Floren
sPfM
ero
[147
]P.
falciparum
merozoites
Floren
sPfTroph
o[147
]P.
falciparum
trop
hozoite
sFloren
sPfG
ameto
[147
]P.
falciparum
gametocytes
HallPbS
poro
[185
]P.
berghei
saliv
aryglan
dsporozoites
HallPbB
lood
[185
]P.
berghei
mixed
asexua
lblood
stag
esHallPbO
okinete
[185
]P.
berghei
ookine
tes
HallPbO
ocyst
[185
]P.
berghei
oocysts,
9-12
days
aftermosqu
itoinfection
HallPbG
ameto
[185
]P.
berghei
gametocytes
97

Applied experimental data
3 Metabolomics data
98

Applied experimental data
Table3:Metab
olom
icsda
tasets.
Sample
Source
Organ
ism
Stage
Teng
PfTr
opho
zoite
PA[503
]P.
falciparum
trop
hozoite
s,pe
rchloric
acid
extractio
nmetho
dTe
ngPfTr
opho
zoite
MW
[503
]P.
falciparum
trop
hozoite
s,metha
nol/water
extractio
nmetho
dTe
ngPfTr
opho
zoite
MCW
[503
]P.
falciparum
trop
hozoite
s,metha
nol/chloroform
/water
ex-
tractio
nmetho
dTe
ngPfTr
opho
zoite
M[503
]P.
falciparum
trop
hozoite
s,metha
nole
xtractionmetho
dOlsz
ewskiPfB
lood
TP0
[366
]P.
falciparum
0hpo
sterythrocyteinfection
Olsz
ewskiPfB
lood
TP8
[366
]P.
falciparum
8hpo
sterythrocyteinfection
Olsz
ewskiPfB
lood
TP1
6[366
]P.
falciparum
16hpo
sterythrocyteinfection
Olsz
ewskiPfB
lood
TP2
4[366
]P.
falciparum
24hpo
sterythrocyteinfection
Olsz
ewskiPfB
lood
TP3
2[366
]P.
falciparum
32hpo
sterythrocyteinfection
Olsz
ewskiPfB
lood
TP4
0[366
]P.
falciparum
40hpo
sterythrocyteinfection
Olsz
ewskiPfB
lood
TP4
8[366
]P.
falciparum
48hpo
sterythrocyteinfection
99

Complete list of predicted essential reactionswith assigned gene
100

Complete list of predicted essential reactions with assigned gene
Table4:Ran
kedpred
ictedessentialreaction
s.a=
LS24,b=
LS40,c=
LS50,d=
EryE
Ring,
e=
EryL
Ring,
f=
EryE
Trop
ho,g=
EryL
Trop
ho,h
=Er
yESchz
,i=
EryL
Schz
,j=
EryM
ero,
k=
EryG
ameto,
l=Mosqu
itoSg
Sporo,
m=
Mosqu
itoOoS
poro,T
=en
zyme
listedin
Supe
rTargetDB,S
=score
Equ
ation
ab
cd
ef
gh
ij
kl
mEC
no.
TS
ATP
<=>
3́,5́-Cyclic
AMP
+Py
-roph
osph
ate
xx
xx
xx
xx
xx
xx
x4.6.1.1
x4
(S)-Malate<=>
Fumarate+
H2O
xx
xx
xx
xx
xx
xx
x4.2.1.2
x4
2-C-M
ethy
l-D-erythrit
ol4-ph
osph
ate+
CTP
<=>
4-(C
ytidine5́-diph
osph
o)-
2-C-m
ethy
l-D-erythrit
ol+
Pyroph
os-
phate
xx
xx
xx
xx
xx
xx
x2.7.7.60
x4
2-C-M
ethy
l-D-erythrit
ol-2,4-
cyclod
ipho
spha
te+
Red
uced
-ferred
oxin
+2
H+
–>1-Hyd
roxy
-2-methy
l-2-butenyl-4-dipho
spha
te+
H2O
+Oxidized-ferred
oxin
xx
xx
xx
xx
xx
xx
x1.17.4.3
3
ATP
+Pa
ntetheine4́-ph
osph
ate<=>
Pyroph
osph
ate+
Dep
hospho
-CoA
xx
xx
xx
xx
xx
xx
x2.7.7.3
3
4-(C
ytidine
5́-diph
osph
o)-2-C
-methy
l-D-erythrit
ol+
ATP<=>
2-Ph
osph
o-4-
(cytidine
5́-diph
osph
o)-2-C
-methy
l-D-
erythrito
l+ADP
xx
xx
xx
xx
xx
xx
x2.7.1.148
3
D-G
lyceraldehyd
e3-ph
osph
ate
+D-
Ribulose
5-ph
osph
ate
+L-Glutamine
<=>
Pyrid
oxal
phosph
ate
+L-
Glutamate
xx
xx
xx
xx
xx
xx
x3
Glycine
+H+
<–>
Glycine
[a]+
H+[a]
xx
xx
xx
xx
xx
xx
x3
L-Ly
sine
+H+
<–>
L-Ly
sine[a]
+H+[a]
xx
xx
xx
xx
xx
xx
x3
L-Aspartate
+H+
<–>
L-Aspartate[a]
+H+[a]
xx
xx
xx
xx
xx
xx
x3
L-Arginine+
H+
<–>
L-Arginine[a]
+H+[a]
xx
xx
xx
xx
xx
xx
x3
Con
tinue
don
next
page
101
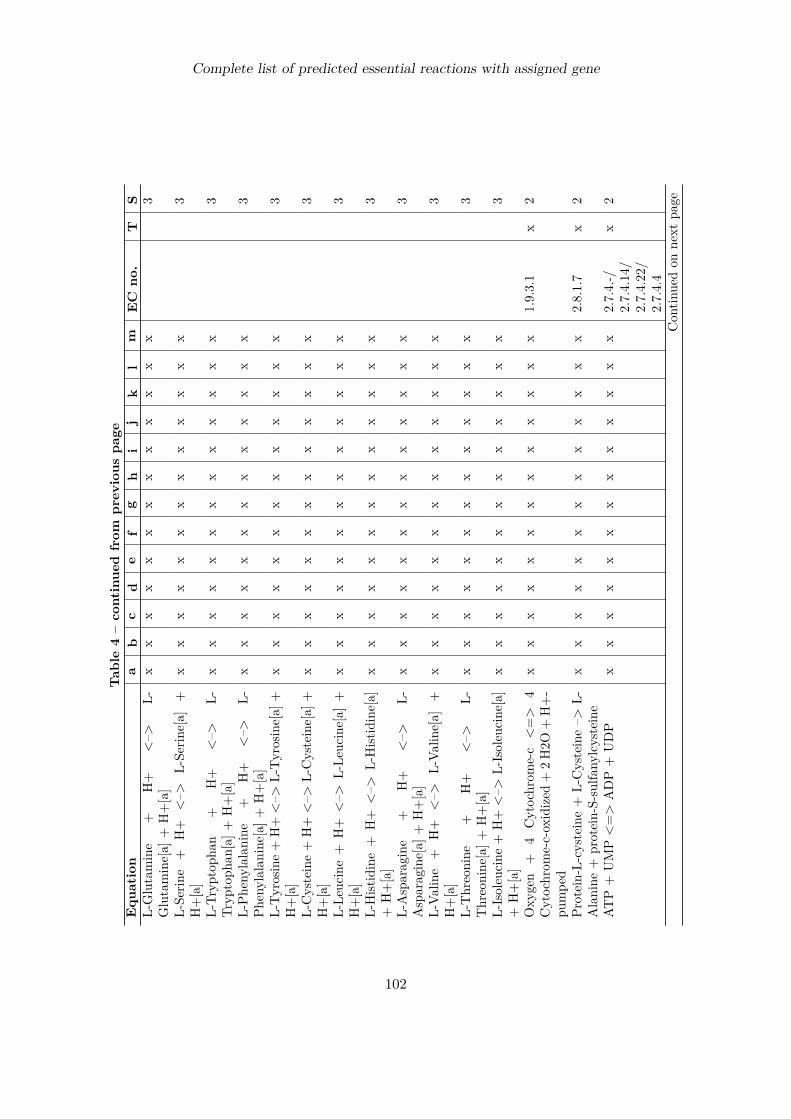
Complete list of predicted essential reactions with assigned gene
Tab
le4–continue
dfrom
previous
page
Equ
ation
ab
cd
ef
gh
ij
kl
mEC
no.
TS
L-Glutamine
+H+
<–>
L-Glutamine[a]
+H+[a]
xx
xx
xx
xx
xx
xx
x3
L-Se
rine
+H+
<–>
L-Se
rine[a]
+H+[a]
xx
xx
xx
xx
xx
xx
x3
L-Tr
yptoph
an+
H+
<–>
L-Tr
yptoph
an[a]+
H+[a]
xx
xx
xx
xx
xx
xx
x3
L-Ph
enylalan
ine
+H+
<–>
L-Ph
enylalan
ine[a]
+H+[a]
xx
xx
xx
xx
xx
xx
x3
L-Tyrosine+
H+
<–>
L-Tyrosine[a]
+H+[a]
xx
xx
xx
xx
xx
xx
x3
L-Cysteine+
H+
<–>
L-Cysteine[a]
+H+[a]
xx
xx
xx
xx
xx
xx
x3
L-Le
ucine+
H+
<–>
L-Le
ucine[a]
+H+[a]
xx
xx
xx
xx
xx
xx
x3
L-Hist
idine+
H+
<–>
L-Hist
idine[a]
+H+[a]
xx
xx
xx
xx
xx
xx
x3
L-Asparagine
+H+
<–>
L-Asparagine[a]
+H+[a]
xx
xx
xx
xx
xx
xx
x3
L-Va
line
+H+
<–>
L-Va
line[a]
+H+[a]
xx
xx
xx
xx
xx
xx
x3
L-Threonine
+H+
<–>
L-Threonine
[a]+
H+[a]
xx
xx
xx
xx
xx
xx
x3
L-Isoleu
cine
+H+
<–>
L-Isoleu
cine
[a]
+H+[a]
xx
xx
xx
xx
xx
xx
x3
Oxy
gen
+4
Cytochrom
e-c
<=>
4Cytochrom
e-c-oxidized
+2H2O
+H+-
pumpe
d
xx
xx
xx
xx
xx
xx
x1.9.3.1
x2
Protein-L-cysteine
+L-Cysteine–>
L-Alanine
+protein-S-sulfa
nylcysteine
xx
xx
xx
xx
xx
xx
x2.8.1.7
x2
ATP
+UMP
<=>
ADP
+UDP
xx
xx
xx
xx
xx
xx
x2.7.4.-/
2.7.4.14/
2.7.4.22/
2.7.4.4
x2
Con
tinue
don
next
page
102
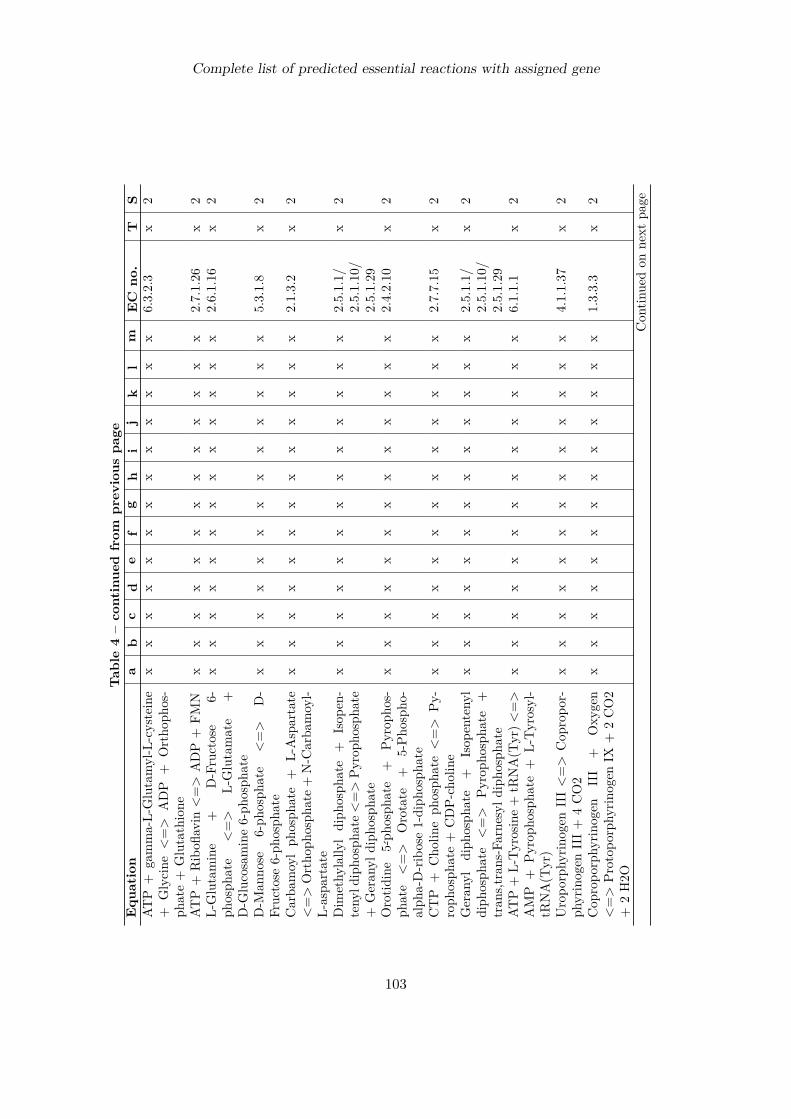
Complete list of predicted essential reactions with assigned gene
Tab
le4–continue
dfrom
previous
page
Equ
ation
ab
cd
ef
gh
ij
kl
mEC
no.
TS
ATP
+gamma-L-Glutamyl-L-cysteine
+Glycine
<=>
ADP
+Ortho
phos-
phate+
Glutathione
xx
xx
xx
xx
xx
xx
x6.3.2.3
x2
ATP
+Ribofl
avin
<=>
ADP
+FM
Nx
xx
xx
xx
xx
xx
xx
2.7.1.26
x2
L-Glutamine
+D-Fructose
6-ph
osph
ate
<=>
L-Glutamate
+D-G
lucosamine6-ph
osph
ate
xx
xx
xx
xx
xx
xx
x2.6.1.16
x2
D-M
anno
se6-ph
osph
ate
<=>
D-
Fruc
tose
6-ph
osph
ate
xx
xx
xx
xx
xx
xx
x5.3.1.8
x2
Carba
moylph
osph
ate
+L-Aspartate
<=>
Ortho
phosph
ate+
N-C
arba
moyl-
L-aspa
rtate
xx
xx
xx
xx
xx
xx
x2.1.3.2
x2
Dim
ethy
lally
ldiph
osph
ate
+Isop
en-
teny
ldipho
spha
te<=>
Pyroph
osph
ate
+Geran
yldiph
osph
ate
xx
xx
xx
xx
xx
xx
x2.5.1.1/
2.5.1.10/
2.5.1.29
x2
Orotid
ine
5́-ph
osph
ate
+Py
roph
os-
phate
<=>
Orotate
+5-Ph
osph
o-alph
a-D-ribose1-diph
osph
ate
xx
xx
xx
xx
xx
xx
x2.4.2.10
x2
CTP
+Cho
lineph
osph
ate<=>
Py-
roph
osph
ate+
CDP-
choline
xx
xx
xx
xx
xx
xx
x2.7.7.15
x2
Geran
yldiph
osph
ate
+Isop
enteny
ldiph
osph
ate
<=>
Pyroph
osph
ate
+tran
s,trans-Farne
syld
ipho
spha
te
xx
xx
xx
xx
xx
xx
x2.5.1.1/
2.5.1.10/
2.5.1.29
x2
ATP+
L-Tyrosine+
tRNA(T
yr)<
=>
AMP
+Py
roph
osph
ate+
L-Tyrosyl-
tRNA(T
yr)
xx
xx
xx
xx
xx
xx
x6.1.1.1
x2
Uropo
rphy
rinogen
III<=>
Cop
ropo
r-ph
yrinogen
III+
4CO2
xx
xx
xx
xx
xx
xx
x4.1.1.37
x2
Cop
ropo
rphy
rinogen
III
+Oxy
gen
<=>
Protop
orph
yrinogen
IX+
2CO2
+2H2O
xx
xx
xx
xx
xx
xx
x1.3.3.3
x2
Con
tinue
don
next
page
103

Complete list of predicted essential reactions with assigned gene
Tab
le4–continue
dfrom
previous
page
Equ
ation
ab
cd
ef
gh
ij
kl
mEC
no.
TS
ATP+
L-Isoleu
cine
+tR
NA(Ile)<
=>
AMP
+Py
roph
osph
ate+
L-Isoleu
cyl-
tRNA(Ile)
xx
xx
xx
xx
xx
xx
x6.1.1.5
x2
ATP
+L-Ly
sine+
tRNA(L
ys)<=>
AMP
+Py
roph
osph
ate
+L-Ly
syl-
tRNA
xx
xx
xx
xx
xx
xx
x6.1.1.6
x2
ATP
+L-Methion
ine
+tR
NA(M
et)
<=>
AMP
+Py
roph
osph
ate
+L-
Methion
yl-tRNA
xx
xx
xx
xx
xx
xx
x6.1.1.10
x2
ATP
+L-Tr
yptoph
an+
tRNA(T
rp)
<=>
AMP
+Py
roph
osph
ate
+L-
Tryp
toph
anyl-tRNA(T
rp)
xx
xx
xx
xx
xx
xx
x6.1.1.2
x2
2-Octap
reny
l-6-m
etho
xyph
enol
+Oxy
-gen
+NADPH
<=>
2-Octap
reny
l-6-
metho
xy-1,4-ben
zoqu
inon
e+
NADP+
+H2O
xx
xx
xx
xx
xx
xx
x1.13.12.-/
1.14.13.-/
1.14.3.-
x2
2-Octap
reny
l-6-m
etho
xy-1,4-
benz
oquino
ne+
S-Ade
nosyl-L
-methion
ine
<=>
2-Octap
reny
l-3-
methy
l-6-m
etho
xy-1,4-ben
zoqu
inon
e+
S-Ade
nosyl-L
-hom
ocysteine
xx
xx
xx
xx
xx
xx
x2.1.1.-
x2
eIF5
A-precu
rsor-ly
sine
+Sp
ermidine
<=>
eIF5
A-precu
rsor-deoxy
hypu
sine
+1,3-Diaminop
ropa
ne
xx
xx
xx
xx
xx
xx
x2.5.1.46
x2
Geran
ylgerany
l-dipho
spha
te+
Protein-
L-cysteine
–>S-gerany
lgeran
yl-protein
+Py
roph
osph
ate
xx
xx
xx
xx
xx
xx
x2.5.1.59/
2.5.1.60
1
(R)-S-La
ctoylglutathione
+H2O
<=>
Glutathione
+(R
)-La
ctate
+activ
e-glyoxa
lase-II
xx
xx
xx
xx
xx
xx
x3.1.2.6
1
ATP+
(9Z)-H
exad
ecenoic-acid
+CoA
<=>
AMP
+(9Z)-H
exad
ecen
oyl-C
oA+
Dipho
spha
te
xx
xx
xx
xx
xx
xx
x6.2.1.3
1
Con
tinue
don
next
page
104
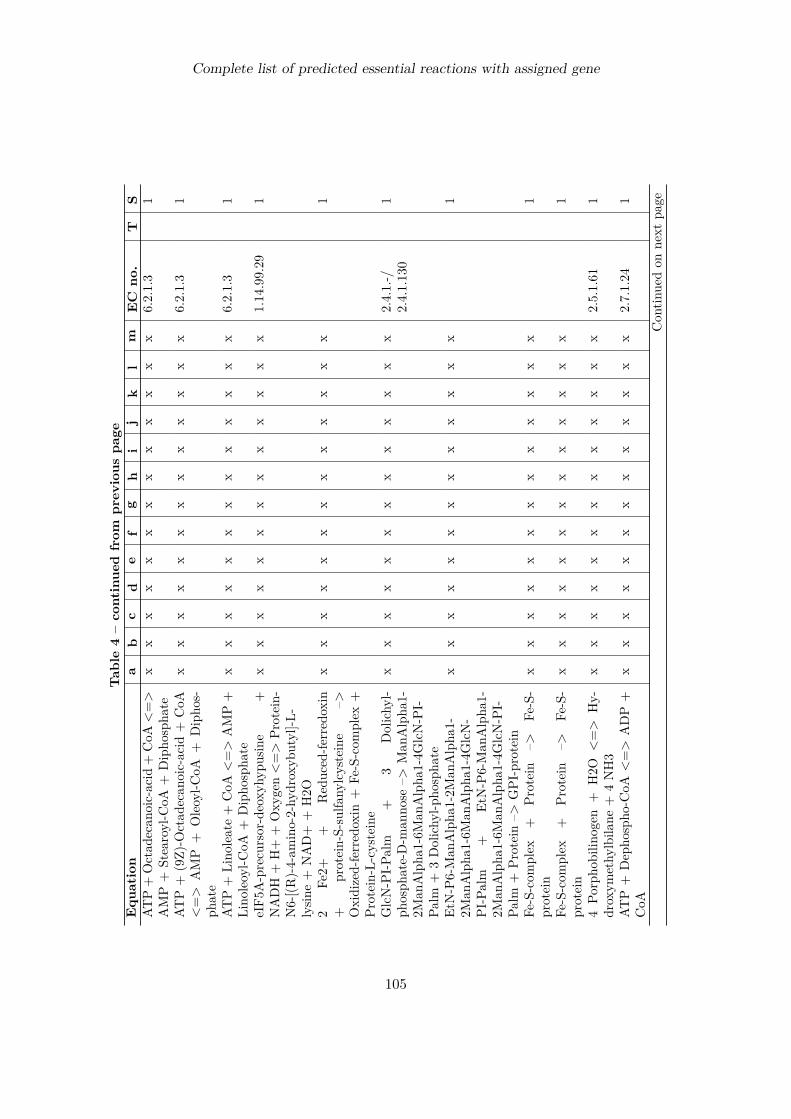
Complete list of predicted essential reactions with assigned gene
Tab
le4–continue
dfrom
previous
page
Equ
ation
ab
cd
ef
gh
ij
kl
mEC
no.
TS
ATP+
Octad
ecan
oic-acid
+CoA
<=>
AMP
+Stearoyl-C
oA+
Dipho
spha
tex
xx
xx
xx
xx
xx
xx
6.2.1.3
1
ATP
+(9Z)-O
ctad
ecan
oic-acid
+CoA
<=>
AMP
+Oleoyl-C
oA+
Dipho
s-ph
ate
xx
xx
xx
xx
xx
xx
x6.2.1.3
1
ATP+
Lino
leate+
CoA
<=>
AMP+
Lino
leoyl-C
oA+
Dipho
spha
tex
xx
xx
xx
xx
xx
xx
6.2.1.3
1
eIF5
A-precu
rsor-deoxy
hypu
sine
+NADH
+H+
+Oxy
gen<=>
Protein-
N6-[(R
)-4-am
ino-2-hy
droxyb
utyl]-L
-lysin
e+
NAD+
+H2O
xx
xx
xx
xx
xx
xx
x1.14.99.29
1
2Fe
2++
Red
uced-fe
rred
oxin
+protein-S-sulfa
nylcysteine
–>Oxidized-ferred
oxin
+Fe
-S-com
plex
+Pr
otein-L-cysteine
xx
xx
xx
xx
xx
xx
x1
GlcN-P
I-Pa
lm+
3Dolichy
l-ph
osph
ate-D-m
anno
se–>
Man
Alpha
1-2M
anAlpha
1-6M
anAlpha
1-4G
lcN-P
I-Pa
lm+
3Dolichy
l-pho
spha
te
xx
xx
xx
xx
xx
xx
x2.4.1.-/
2.4.1.130
1
EtN-P
6-Man
Alpha
1-2M
anAlpha
1-2M
anAlpha
1-6M
anAlpha
1-4G
lcN-
PI-Palm
+Et
N-P
6-Man
Alpha
1-2M
anAlpha
1-6M
anAlpha
1-4G
lcN-P
I-Pa
lm+
Protein–>
GPI
-protein
xx
xx
xx
xx
xx
xx
x1
Fe-S-com
plex
+Pr
otein
–>Fe
-S-
protein
xx
xx
xx
xx
xx
xx
x1
Fe-S-com
plex
+Pr
otein
–>Fe
-S-
protein
xx
xx
xx
xx
xx
xx
x1
4Po
rpho
bilin
ogen
+H2O
<=>
Hy-
droxym
ethy
lbila
ne+
4NH3
xx
xx
xx
xx
xx
xx
x2.5.1.61
1
ATP
+Dep
hospho
-CoA
<=>
ADP
+CoA
xx
xx
xx
xx
xx
xx
x2.7.1.24
1
Con
tinue
don
next
page
105
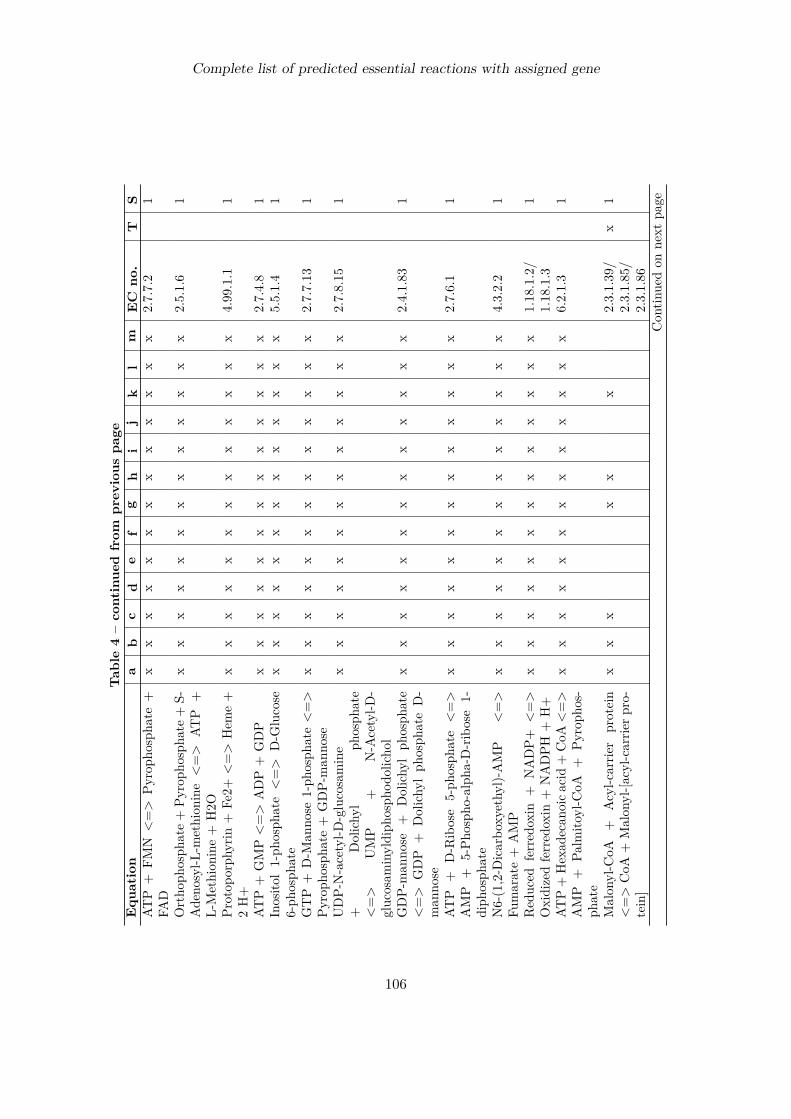
Complete list of predicted essential reactions with assigned gene
Tab
le4–continue
dfrom
previous
page
Equ
ation
ab
cd
ef
gh
ij
kl
mEC
no.
TS
ATP
+FM
N<=>
Pyroph
osph
ate+
FAD
xx
xx
xx
xx
xx
xx
x2.7.7.2
1
Ortho
phosph
ate+
Pyroph
osph
ate+
S-Ade
nosyl-L
-methion
ine
<=>
ATP
+L-Methion
ine+
H2O
xx
xx
xx
xx
xx
xx
x2.5.1.6
1
Protop
orph
yrin
+Fe
2+<=>
Hem
e+
2H+
xx
xx
xx
xx
xx
xx
x4.99.1.1
1
ATP
+GMP
<=>
ADP
+GDP
xx
xx
xx
xx
xx
xx
x2.7.4.8
1Inosito
l1-ph
osph
ate
<=>
D-G
lucose
6-ph
osph
ate
xx
xx
xx
xx
xx
xx
x5.5.1.4
1
GTP
+D-M
anno
se1-ph
osph
ate<=>
Pyroph
osph
ate+
GDP-
man
nose
xx
xx
xx
xx
xx
xx
x2.7.7.13
1
UDP-
N-acetyl-D
-glucosamine
+Dolichy
lph
osph
ate
<=>
UMP
+N-A
cetyl-D
-gluc
osam
inyldiph
osph
odolicho
l
xx
xx
xx
xx
xx
xx
x2.7.8.15
1
GDP-
man
nose
+Dolichy
lph
osph
ate
<=>
GDP
+Dolichy
lph
osph
ateD-
man
nose
xx
xx
xx
xx
xx
xx
x2.4.1.83
1
ATP
+D-R
ibose
5-ph
osph
ate
<=>
AMP
+5-Ph
osph
o-alph
a-D-ribose
1-diph
osph
ate
xx
xx
xx
xx
xx
xx
x2.7.6.1
1
N6-(1,2-D
icarbo
xyethy
l)-AMP
<=>
Fumarate+
AMP
xx
xx
xx
xx
xx
xx
x4.3.2.2
1
Red
uced
ferred
oxin
+NADP+
<=>
Oxidizedferred
oxin
+NADPH
+H+
xx
xx
xx
xx
xx
xx
x1.18.1.2/
1.18.1.3
1
ATP+
Hexad
ecan
oica
cid+
CoA
<=>
AMP
+Pa
lmito
yl-C
oA+
Pyroph
os-
phate
xx
xx
xx
xx
xx
xx
x6.2.1.3
1
Malon
yl-C
oA+
Acyl-c
arrie
rprotein
<=>
CoA
+Malon
yl-[a
cyl-c
arrie
rpro-
tein]
xx
xx
xx
2.3.1.39/
2.3.1.85/
2.3.1.86
x1
Con
tinue
don
next
page
106
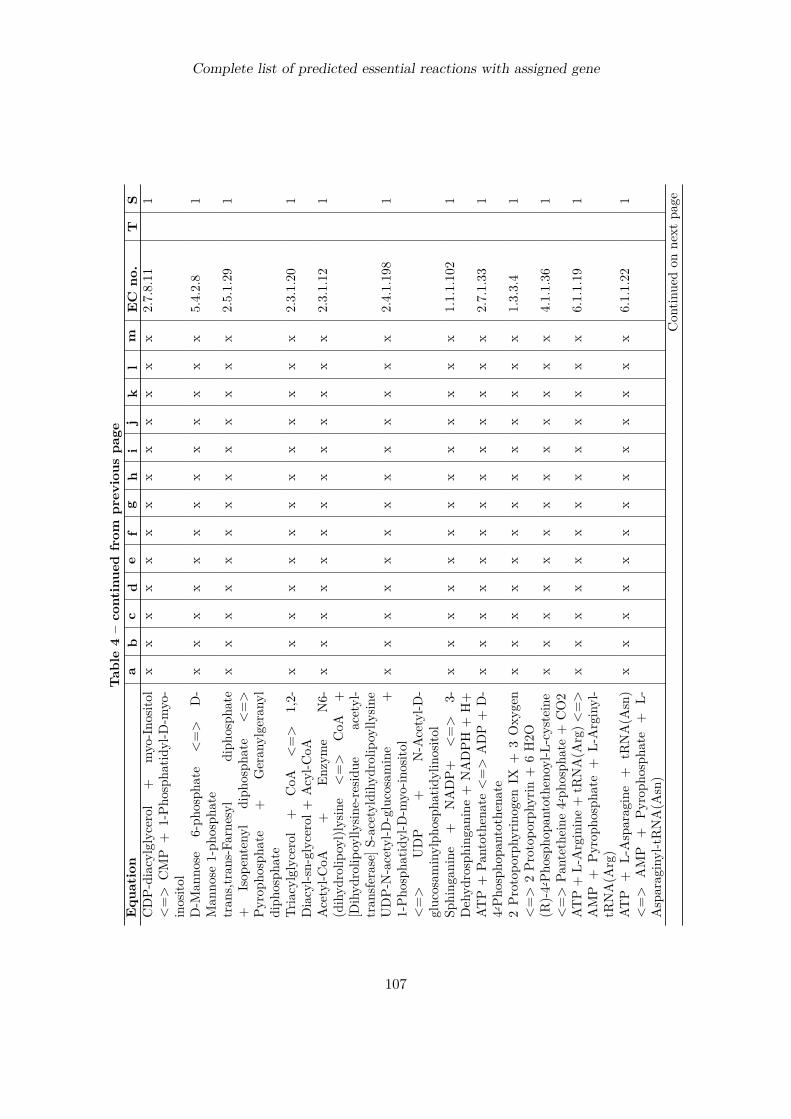
Complete list of predicted essential reactions with assigned gene
Tab
le4–continue
dfrom
previous
page
Equ
ation
ab
cd
ef
gh
ij
kl
mEC
no.
TS
CDP-
diacylglycerol
+myo-Ino
sitol
<=>
CMP
+1-Ph
osph
atidyl-D
-myo-
inosito
l
xx
xx
xx
xx
xx
xx
x2.7.8.11
1
D-M
anno
se6-ph
osph
ate
<=>
D-
Man
nose
1-ph
osph
ate
xx
xx
xx
xx
xx
xx
x5.4.2.8
1
tran
s,trans-Farne
syl
diph
osph
ate
+Isop
enteny
ldiph
osph
ate
<=>
Pyroph
osph
ate
+Geran
ylgerany
ldiph
osph
ate
xx
xx
xx
xx
xx
xx
x2.5.1.29
1
Triacylglycerol
+CoA
<=>
1,2-
Diacyl-s
n-glycerol
+Acyl-C
oAx
xx
xx
xx
xx
xx
xx
2.3.1.20
1
Acetyl-C
oA+
Enzyme
N6-
(dihyd
rolip
oyl)lysine
<=>
CoA
+[D
ihyd
rolip
oylly
sine-resid
ueacetyl-
tran
sferase]
S-acetyldihy
drolipoylly
sine
xx
xx
xx
xx
xx
xx
x2.3.1.12
1
UDP-
N-acetyl-D
-glucosamine
+1-Ph
osph
atidyl-D
-myo-in
osito
l<=>
UDP
+N-A
cetyl-D
-gluc
osam
inylph
osph
atidylinosito
l
xx
xx
xx
xx
xx
xx
x2.4.1.198
1
Sphing
anine
+NADP+
<=>
3-Dehyd
rosphing
anine+
NADPH
+H+
xx
xx
xx
xx
xx
xx
x1.1.1.102
1
ATP
+Pa
ntothe
nate
<=>
ADP
+D-
4́-Ph
osph
opan
tothen
ate
xx
xx
xx
xx
xx
xx
x2.7.1.33
1
2Pr
otop
orph
yrinogen
IX+
3Oxy
gen
<=>
2Pr
otop
orph
yrin
+6H2O
xx
xx
xx
xx
xx
xx
x1.3.3.4
1
(R)-4́-Ph
osph
opan
tothen
oyl-L
-cysteine
<=>
Pantethe
ine4́-ph
osph
ate+
CO2
xx
xx
xx
xx
xx
xx
x4.1.1.36
1
ATP+
L-Arginine+
tRNA(A
rg)<
=>
AMP
+Py
roph
osph
ate+
L-Arginyl-
tRNA(A
rg)
xx
xx
xx
xx
xx
xx
x6.1.1.19
1
ATP
+L-Asparagine
+tR
NA(A
sn)
<=>
AMP
+Py
roph
osph
ate
+L-
Asparaginyl-tRNA(A
sn)
xx
xx
xx
xx
xx
xx
x6.1.1.22
1
Con
tinue
don
next
page
107
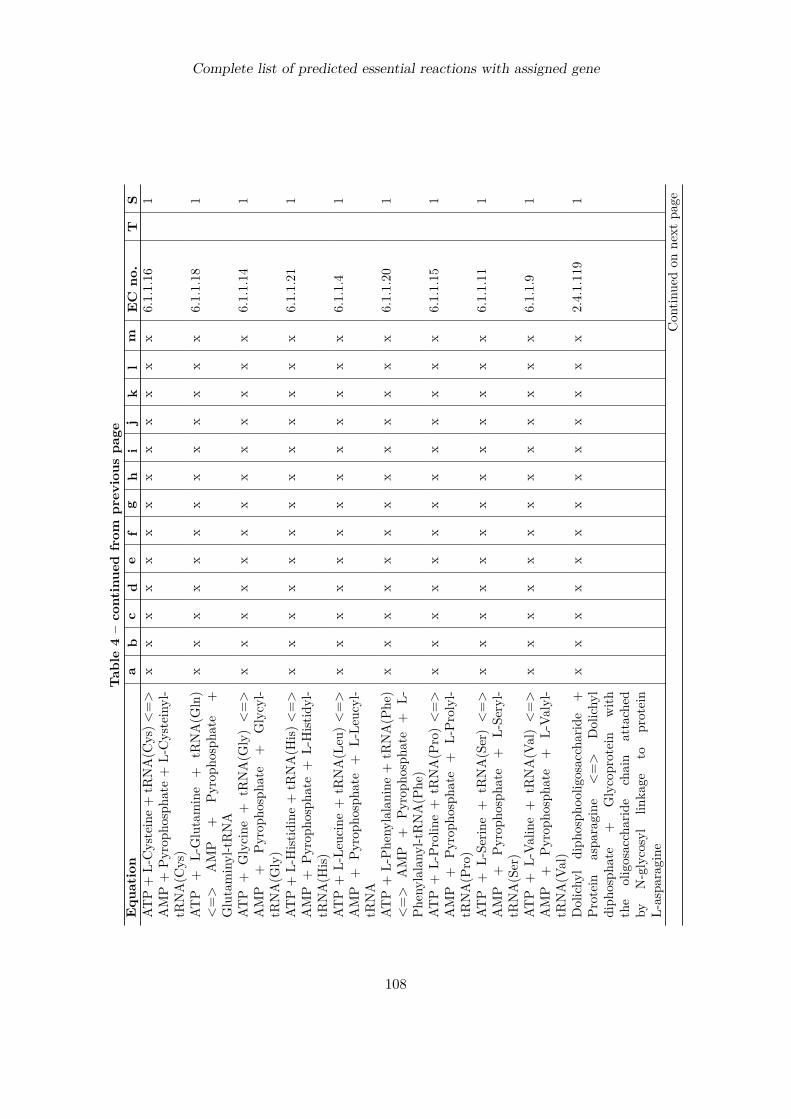
Complete list of predicted essential reactions with assigned gene
Tab
le4–continue
dfrom
previous
page
Equ
ation
ab
cd
ef
gh
ij
kl
mEC
no.
TS
ATP+
L-Cysteine+
tRNA(C
ys)<
=>
AMP+
Pyroph
osph
ate+
L-Cysteinyl-
tRNA(C
ys)
xx
xx
xx
xx
xx
xx
x6.1.1.16
1
ATP
+L-Glutamine
+tR
NA(G
ln)
<=>
AMP
+Py
roph
osph
ate
+Glutaminyl-tRNA
xx
xx
xx
xx
xx
xx
x6.1.1.18
1
ATP
+Glycine
+tR
NA(G
ly)<=>
AMP
+Py
roph
osph
ate
+Glycyl-
tRNA(G
ly)
xx
xx
xx
xx
xx
xx
x6.1.1.14
1
ATP+
L-Hist
idine+
tRNA(H
is)<=>
AMP
+Py
roph
osph
ate+
L-Hist
idyl-
tRNA(H
is)
xx
xx
xx
xx
xx
xx
x6.1.1.21
1
ATP
+L-Le
ucine+
tRNA(L
eu)<=>
AMP
+Py
roph
osph
ate
+L-Le
ucyl-
tRNA
xx
xx
xx
xx
xx
xx
x6.1.1.4
1
ATP
+L-Ph
enylalan
ine+
tRNA(P
he)
<=>
AMP
+Py
roph
osph
ate
+L-
Phenylalan
yl-tRNA(P
he)
xx
xx
xx
xx
xx
xx
x6.1.1.20
1
ATP
+L-Pr
oline+
tRNA(P
ro)<=>
AMP
+Py
roph
osph
ate
+L-Pr
olyl-
tRNA(P
ro)
xx
xx
xx
xx
xx
xx
x6.1.1.15
1
ATP
+L-Se
rine+
tRNA(Ser)<=>
AMP
+Py
roph
osph
ate
+L-Seryl-
tRNA(Ser)
xx
xx
xx
xx
xx
xx
x6.1.1.11
1
ATP
+L-Va
line+
tRNA(V
al)<=>
AMP
+Py
roph
osph
ate
+L-Va
lyl-
tRNA(V
al)
xx
xx
xx
xx
xx
xx
x6.1.1.9
1
Dolichy
ldiph
osph
oolig
osaccharide
+Pr
otein
aspa
ragine
<=>
Dolichy
ldiph
osph
ate
+Glycoprotein
with
the
oligosaccharide
chain
attached
byN-glycosyl
linka
geto
protein
L-aspa
ragine
xx
xx
xx
xx
xx
xx
x2.4.1.119
1
Con
tinue
don
next
page
108
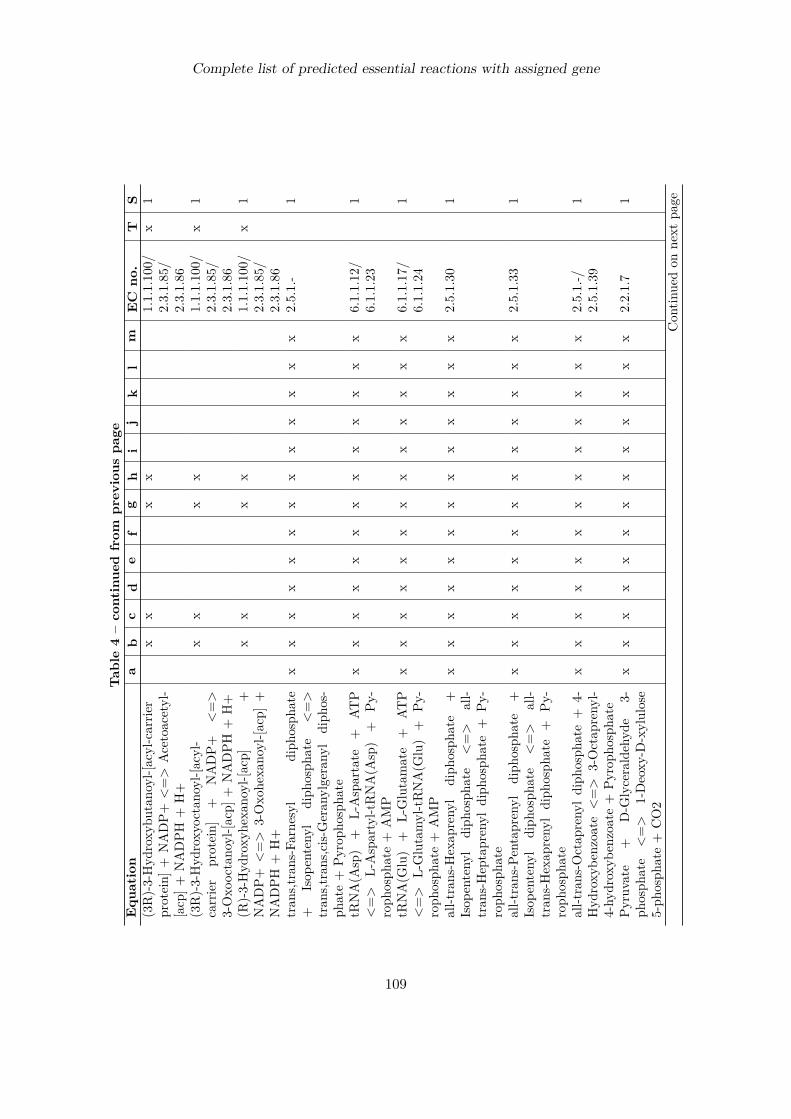
Complete list of predicted essential reactions with assigned gene
Tab
le4–continue
dfrom
previous
page
Equ
ation
ab
cd
ef
gh
ij
kl
mEC
no.
TS
(3R)-3-Hyd
roxy
butano
yl-[a
cyl-c
arrie
rprotein]
+NADP+
<=>
Acetoacetyl-
[acp
]+NADPH
+H+
xx
xx
1.1.1.100/
2.3.1.85/
2.3.1.86
x1
(3R)-3-Hyd
roxy
octano
yl-[a
cyl-
carrier
protein]
+NADP+
<=>
3-Oxo
octano
yl-[a
cp]+
NADPH
+H+
xx
xx
1.1.1.100/
2.3.1.85/
2.3.1.86
x1
(R)-3-Hyd
roxy
hexa
noyl-[a
cp]
+NADP+
<=>
3-Oxo
hexa
noyl-[a
cp]+
NADPH
+H+
xx
xx
1.1.1.100/
2.3.1.85/
2.3.1.86
x1
tran
s,trans-Farne
syl
diph
osph
ate
+Isop
enteny
ldiph
osph
ate
<=>
tran
s,trans,cis-
Geran
ylgerany
ldiph
os-
phate+
Pyroph
osph
ate
xx
xx
xx
xx
xx
xx
x2.5.1.-
1
tRNA(A
sp)
+L-Aspartate
+AT
P<=>
L-Aspartyl-tRNA(A
sp)
+Py
-roph
osph
ate+
AMP
xx
xx
xx
xx
xx
xx
x6.1.1.12/
6.1.1.23
1
tRNA(G
lu)
+L-Glutamate
+AT
P<=>
L-Glutamyl-tRNA(G
lu)
+Py
-roph
osph
ate+
AMP
xx
xx
xx
xx
xx
xx
x6.1.1.17/
6.1.1.24
1
all-trans-H
exap
reny
ldiph
osph
ate
+Isop
enteny
ldiph
osph
ate
<=>
all-
tran
s-Hep
taprenyl
diph
osph
ate+
Py-
roph
osph
ate
xx
xx
xx
xx
xx
xx
x2.5.1.30
1
all-trans-Pentaprenyl
diph
osph
ate
+Isop
enteny
ldiph
osph
ate
<=>
all-
tran
s-Hexap
reny
ldiph
osph
ate
+Py
-roph
osph
ate
xx
xx
xx
xx
xx
xx
x2.5.1.33
1
all-trans-O
ctap
reny
ldiph
osph
ate+
4-Hyd
roxy
benz
oate
<=>
3-Octap
reny
l-4-hy
droxyb
enzoate+
Pyroph
osph
ate
xx
xx
xx
xx
xx
xx
x2.5.1.-/
2.5.1.39
1
Pyruvate
+D-G
lyceraldehyd
e3-
phosph
ate
<=>
1-Deoxy
-D-xylulose
5-ph
osph
ate+
CO2
xx
xx
xx
xx
xx
xx
x2.2.1.7
1
Con
tinue
don
next
page
109

Complete list of predicted essential reactions with assigned gene
Tab
le4–continue
dfrom
previous
page
Equ
ation
ab
cd
ef
gh
ij
kl
mEC
no.
TS
G00144
+Pa
lmito
yl-C
oA<=>
G00145+
CoA
xx
xx
xx
xx
xx
xx
x2.3.-.-
1
Enzyme
N6-(dihyd
rolip
oyl)lysine
+NAD+
<=>
EnzymeN6-(lipo
yl)ly
sine
+NADH
+H+
xx
xx
xx
xx
xx
xx
x1.8.1.4
1
ATP+
Lipo
ate<=>
Pyroph
osph
ate+
Lipo
yl-A
MP
xx
xx
xx
xx
xx
xx
x2.7.7.63
1
Lipo
yl-A
MP
+Apo
protein<=>
Pro-
tein
N6-(lipo
yl)ly
sine+
AMP
xx
xx
xx
xx
xx
xx
x1.2.4.2/
2.7.7.63
1
(S)-Malate
+2-Oxo
glutarate[m]
–>(S)-Malate[m]+
2-Oxo
glutarate
xx
xx
xx
xx
xx
xx
x1
S-Ade
nosyl-L
-methion
ine
<–>
S-Ade
nosyl-L
-methion
ine[m]
xx
xx
xx
xx
xx
xx
x1
Fe-S-com
plex[m
]+AT
P+
H2O
–>Fe
-S-complex
+ADP
+Ortho
phosph
ate
xx
xx
xx
xx
xx
xx
x1
Fe2+
–>Fe
2+[m
]x
xx
xx
xx
xx
xx
xx
1L-Isoleu
cine
[out]<
–>L-Isoleu
cine
xx
xx
xx
xx
xx
xx
x1
ATP
+R-S-G
lutathione
–>ADP
+Ortho
phosph
ate
+R-S-
Glutathione
[out]
xx
xx
xx
xx
xx
xx
x1
Ferriprotopo
rphy
rin_IX
–>Hem
ozoin
xx
xx
xx
xx
x0
2-Ph
osph
o-D-glycerate
<=>
Phosph
o-en
olpy
ruvate
+H2O
xx
xx
xx
xx
xx
x4.2.1.11
0
ATP
+3-Ph
osph
o-D-glycerate
<=>
ADP
+3-Ph
osph
o-D-glyceroyl
phos-
phate
xx
xx
xx
xx
xx
x2.7.2.3
0
2-Ph
osph
o-D-glycerate
<=>
3-Ph
osph
o-D-glycerate
xx
xx
xx
xx
xx
x5.4.2.1
0
ATP
+dT
DP
<=>
ADP
+dT
TP
xx
xx
xx
xx
x2.7.4.6
0AT
P+
dTMP
<=>
ADP
+dT
DP
xx
xx
xx
xx
x2.7.4.12/
2.7.4.9
0
dUTP
+H2O
<=>
dUMP
+Py
-roph
osph
ate
xx
xx
xx
xx
3.6.1.19/
3.6.1.23
0
Con
tinue
don
next
page
110

Complete list of predicted essential reactions with assigned gene
Tab
le4–continue
dfrom
previous
page
Equ
ation
ab
cd
ef
gh
ij
kl
mEC
no.
TS
ATP
+dC
DP
<=>
ADP
+dC
TP
xx
xx
xx
xx
x2.7.4.6
0AT
P+
Holo-[carbo
xylase]+
HCO3-
<=>
ADP
+Ortho
phosph
ate
+Carbo
xybiotin-carbo
xyl-c
arrie
rprotein
xx
xx
xx
6.3.4.14
0
111

Bibliography[1] Alison Abbott. Pharmaceutical futures: a fiendish puzzle. Nature, 455(7217):1164–1167, Oct
2008. doi: 10.1038/4551164a. URL http://dx.doi.org/10.1038/4551164a.
[2] Fernán Agüero, Bissan Al-Lazikani, Martin Aslett, Matthew Berriman, Frederick S Buckner,Robert K Campbell, Santiago Carmona, Ian M Carruthers, A. W Edith Chan, Feng Chen,Gregory J Crowther, Maria A Doyle, Christiane Hertz-Fowler, Andrew L Hopkins, GreggMcAllister, Solomon Nwaka, John P Overington, Arnab Pain, Gaia V Paolini, Ursula Pieper,Stuart A Ralph, Aaron Riechers, David S Roos, Andrej Sali, Dhanasekaran Shanmugam,Takashi Suzuki, Wesley C Van Voorhis, and Christophe L M J Verlinde. Genomic-scale prior-itization of drug targets: the tdr targets database. Nat Rev Drug Discov, 7(11):900–907, Nov2008. doi: 10.1038/nrd2684. URL http://dx.doi.org/10.1038/nrd2684.
[3] H. Ahiboh, A. J. Djaman, F. H. Yapi, A. Edjeme-Aké, M. L. Hauhouot-Attoungbré, E. D. Yayo,and D. Monnet. Uptake and kinetic properties of choline and ethanolamine in plasmodiumfalciparum. Tropical Journal of Pharmaceutical Research, 7:953–959, 2008.
[4] Mats Akesson, Jochen Förster, and Jens Nielsen. Integration of gene expression data intogenome-scale metabolic models. Metab Eng, 6(4):285–293, Oct 2004. doi: 10.1016/j.ymben.2003.12.002. URL http://dx.doi.org/10.1016/j.ymben.2003.12.002.
[5] T. Akutsu, S. Miyano, and S. Kuhara. Algorithms for identifying boolean networks and relatedbiological networks based on matrix multiplication and fingerprint function. J Comput Biol, 7(3-4):331–343, 2000. doi: 10.1089/106652700750050817. URL http://dx.doi.org/10.1089/106652700750050817.
[6] T. Akutsu, S. Miyano, and S. Kuhara. Inferring qualitative relations in genetic networks andmetabolic pathways. Bioinformatics, 16(8):727–734, Aug 2000.
[7] W. K. Aldous, R. K. Martin, and D. E. Kyle. Stage specific detection and inhibition studiesof plasmodium falciparum telomerase. Mol Biochem Parasitol, 95(2):281–285, Sep 1998.
[8] Marina Allary, Jeff Zhiqiang Lu, Liqun Zhu, and Sean T Prigge. Scavenging of the co-factor lipoate is essential for the survival of the malaria parasite plasmodium falciparum.Mol Microbiol, 63(5):1331–1344, Mar 2007. doi: 10.1111/j.1365-2958.2007.05592.x. URLhttp://dx.doi.org/10.1111/j.1365-2958.2007.05592.x.
[9] Alberto Ambesi-Impiombato. Computational biology and drug discovery: From single-targetto network drugs. Current Bioinformatics, 2006.
[10] M. L. Ancelin and H. J. Vial. Quaternary ammonium compounds efficiently inhibit plasmodiumfalciparum growth in vitro by impairment of choline transport. Antimicrob Agents Chemother,29(5):814–820, May 1986.
[11] M. L. Ancelin, M. Calas, J. Bompart, G. Cordina, D. Martin, M. Ben Bari, T. Jei, P. Druilhe,and H. J. Vial. Antimalarial activity of 77 phospholipid polar head analogs: close correlationbetween inhibition of phospholipid metabolism and in vitro plasmodium falciparum growth.Blood, 91(4):1426–1437, Feb 1998.
112
BIBLIOGRAPHY
[12] Mikael Rørdam Andersen, Michael Lynge Nielsen, and Jens Nielsen. Metabolic model integra-tion of the bibliome, genome, metabolome and reactome of aspergillus niger. Mol Syst Biol, 4:178, 2008. doi: 10.1038/msb.2008.12. URL http://dx.doi.org/10.1038/msb.2008.12.
[13] B. B. Anderson, C. E. Fulford-Jones, J. A. Child, M. E. Beard, and C. J. Bateman. Conversionof vitamin b 6 compounds to active forms in the red blood cell. J Clin Invest, 50(9):1901–1909,Sep 1971. doi: 10.1172/JCI106682. URL http://dx.doi.org/10.1172/JCI106682.
[14] Tim Anderson. Mapping the spread of malaria drug resistance. PLoS Med, 6(4):e1000054,Apr 2009. doi: 10.1371/journal.pmed.1000054. URL http://dx.doi.org/10.1371/journal.pmed.1000054.
[15] A. C. Antony, M. A. Kane, S. R. Krishnan, R. S. Kincade, and R. S. Verma. Folate (pteroylglu-tamate) uptake in human red blood cells, erythroid precursors and kb cells at high extracellularfolate concentrations. evidence against a role for specific folate-binding and transport proteins.Biochem J, 260(2):401–411, Jun 1989.
[16] Alexander I Archakov, Vadim M Govorun, Alexander V Dubanov, Yuri D Ivanov, Alexander VVeselovsky, Paul Lewi, and Paul Janssen. Protein-protein interactions as a target for drugsin proteomics. Proteomics, 3(4):380–391, Apr 2003. doi: 10.1002/pmic.200390053. URLhttp://dx.doi.org/10.1002/pmic.200390053.
[17] Satya Nanda Vel Arjunan, editor. E-Cell System-Basic Concepts and Applications: Simulationof Human Erythrocyte Metabolism. Landes Bioscience and Springer Science+Business Media,2007.
[18] Hiroko Asahi, Tamotsu Kanazawa, Nakami Hirayama, and Yousei Kajihara. Investigatingserum factors promoting erythrocytic growth of plasmodium falciparum. Exp Parasitol, 109(1):7–15, Jan 2005. doi: 10.1016/j.exppara.2004.10.002. URL http://dx.doi.org/10.1016/j.exppara.2004.10.002.
[19] M. Ashburner, C. A. Ball, J. A. Blake, D. Botstein, H. Butler, J. M. Cherry, A. P. Davis,K. Dolinski, S. S. Dwight, J. T. Eppig, M. A. Harris, D. P. Hill, L. Issel-Tarver, A. Kasarskis,S. Lewis, J. C. Matese, J. E. Richardson, M. Ringwald, G. M. Rubin, and G. Sherlock. Geneontology: tool for the unification of biology. the gene ontology consortium. Nat Genet, 25(1):25–29, May 2000. doi: 10.1038/75556. URL http://dx.doi.org/10.1038/75556.
[20] Y. G. Assaraf, J. Golenser, D. T. Spira, and U. Bachrach. Polyamine levels and the activ-ity of their biosynthetic enzymes in human erythrocytes infected with the malarial parasite,plasmodium falciparum. Biochem J, 222(3):815–819, Sep 1984.
[21] F. I. Ataullakhanov, V. M. Vitvitsky, A. M. Zhabotinsky, A. V. Pichugin, O. V. Platonova,B. N. Kholodenko, and L. I. Ehrlich. The regulation of glycolysis in human erythrocytes. thedependence of the glycolytic flux on the atp concentration. Eur J Biochem, 115(2):359–365,Apr 1981.
[22] Cristina Aurrecoechea, John Brestelli, Brian P Brunk, Jennifer Dommer, Steve Fischer, BinduGajria, Xin Gao, Alan Gingle, Greg Grant, Omar S Harb, Mark Heiges, Frank Innamorato,John Iodice, Jessica C Kissinger, Eileen Kraemer, Wei Li, John A Miller, Vishal Nayak, CaryPennington, Deborah F Pinney, David S Roos, Chris Ross, Christian J Stoeckert, CharlesTreatman, and Haiming Wang. Plasmodb: a functional genomic database for malaria parasites.Nucleic Acids Res, 37(Database issue):D539–D543, Jan 2009. doi: 10.1093/nar/gkn814. URLhttp://dx.doi.org/10.1093/nar/gkn814.
113

BIBLIOGRAPHY
[23] Kerstin Baer, Christian Klotz, Stefan H I Kappe, Thomas Schnieder, and Ute Frevert. Releaseof hepatic plasmodium yoelii merozoites into the pulmonary microvasculature. PLoS Pathog, 3(11):e171, Nov 2007. doi: 10.1371/journal.ppat.0030171. URL http://dx.doi.org/10.1371/journal.ppat.0030171.
[24] E. Bailly, R. Jambou, J. Savel, and G. Jaureguiberry. Plasmodium falciparum: differentialsensitivity in vitro to e-64 (cysteine protease inhibitor) and pepstatin a (aspartyl proteaseinhibitor). J Protozool, 39(5):593–599, 1992.
[25] Tala M Bakheet and Andrew J Doig. Properties and identification of human protein drugtargets. Bioinformatics, 25(4):451–457, Feb 2009. doi: 10.1093/bioinformatics/btp002. URLhttp://dx.doi.org/10.1093/bioinformatics/btp002.
[26] B. M. Bakker, H. V. Westerhoff, F. R. Opperdoes, and P. A. Michels. Metabolic controlanalysis of glycolysis in trypanosomes as an approach to improve selectivity and effectivenessof drugs. Mol Biochem Parasitol, 106(1):1–10, Feb 2000.
[27] Jeffrey Baldwin, Carolyn H Michnoff, Nicholas A Malmquist, John White, Michael G Roth,Pradipsinh K Rathod, and Margaret A Phillips. High-throughput screening for potent andselective inhibitors of plasmodium falciparum dihydroorotate dehydrogenase. J Biol Chem,280(23):21847–21853, Jun 2005. doi: 10.1074/jbc.M501100200. URL http://dx.doi.org/10.1074/jbc.M501100200.
[28] M. Bali and S. R. Thomas. A modelling study of feedforward activation in human erythrocyteglycolysis. C R Acad Sci III, 324(3):185–199, Mar 2001.
[29] Bharath Balu and John H Adams. Advancements in transfection technologies for plasmodium.Int J Parasitol, 37(1):1–10, Jan 2007. doi: 10.1016/j.ijpara.2006.10.001. URL http://dx.doi.org/10.1016/j.ijpara.2006.10.001.
[30] Ritu Banerjee, Jun Liu, Wandy Beatty, Lorraine Pelosof, Michael Klemba, and Daniel EGoldberg. Four plasmepsins are active in the plasmodium falciparum food vacuole, includinga protease with an active-site histidine. Proc Natl Acad Sci U S A, 99(2):990–995, Jan 2002.doi: 10.1073/pnas.022630099. URL http://dx.doi.org/10.1073/pnas.022630099.
[31] Mary Lynn Baniecki, Dyann F Wirth, and Jon Clardy. High-throughput plasmodium falci-parum growth assay for malaria drug discovery. Antimicrob Agents Chemother, 51(2):716–723,Feb 2007. doi: 10.1128/AAC.01144-06. URL http://dx.doi.org/10.1128/AAC.01144-06.
[32] Nazneen Bano, Julia D Romano, Bamini Jayabalasingham, and Isabelle Coppens. Cellularinteractions of plasmodium liver stage with its host mammalian cell. Int J Parasitol, 37(12):1329–1341, Oct 2007. doi: 10.1016/j.ijpara.2007.04.005. URL http://dx.doi.org/10.1016/j.ijpara.2007.04.005.
[33] R. H. Barker, V. Metelev, E. Rapaport, and P. Zamecnik. Inhibition of plasmodium falciparummalaria using antisense oligodeoxynucleotides. Proc Natl Acad Sci U S A, 93(1):514–518, Jan1996.
[34] Rudi A Baron, Yuri K Peterson, James C Otto, Johannes Rudolph, and Patrick J Casey.Time-dependent inhibition of isoprenylcysteine carboxyl methyltransferase by indole-basedsmall molecules. Biochemistry, 46(2):554–560, Jan 2007. doi: 10.1021/bi060344n. URL http://dx.doi.org/10.1021/bi060344n.
[35] Tanya Barrett and Ron Edgar. Gene expression omnibus: microarray data storage, submission,retrieval, and analysis. Methods Enzymol, 411:352–369, 2006. doi: 10.1016/S0076-6879(06)11019-8. URL http://dx.doi.org/10.1016/S0076-6879(06)11019-8.
114

BIBLIOGRAPHY
[36] David Baulcombe. Rna silencing in plants. Nature, 431:356–363, 2004.
[37] Jake Baum, Anthony T Papenfuss, Gunnar R Mair, Chris J Janse, Dina Vlachou, Andrew PWaters, Alan F Cowman, Brendan S Crabb, and Tania F de Koning-Ward. Molecular geneticsand comparative genomics reveal rnai is not functional in malaria parasites. Nucleic AcidsRes, 37(11):3788–3798, Jun 2009. doi: 10.1093/nar/gkp239. URL http://dx.doi.org/10.1093/nar/gkp239.
[38] Scott A Becker and Bernhard O Palsson. Context-specific metabolic networks are consistentwith experiments. PLoS Comput Biol, 4(5):e1000082, May 2008. doi: 10.1371/journal.pcbi.1000082. URL http://dx.doi.org/10.1371/journal.pcbi.1000082.
[39] Scott A Becker, Adam M Feist, Monica L Mo, Gregory Hannum, Bernhard Ø Palsson, andMarkus J Herrgard. Quantitative prediction of cellular metabolism with constraint-basedmodels: the cobra toolbox. Nat Protoc, 2(3):727–738, 2007. doi: 10.1038/nprot.2007.99. URLhttp://dx.doi.org/10.1038/nprot.2007.99.
[40] J. C. Beier. Malaria parasite development in mosquitoes. Annu Rev Entomol, 43:519–543, 1998.doi: 10.1146/annurev.ento.43.1.519. URL http://dx.doi.org/10.1146/annurev.ento.43.1.519.
[41] Angelica M Bello, Ewa Poduch, Yan Liu, Lianhu Wei, Ian Crandall, Xiaoyang Wang, Christo-pher Dyanand, Kevin C Kain, Emil F Pai, and Lakshmi P Kotra. Structure-activity re-lationships of c6-uridine derivatives targeting plasmodia orotidine monophosphate decar-boxylase. J Med Chem, 51(3):439–448, Feb 2008. doi: 10.1021/jm7010673. URL http://dx.doi.org/10.1021/jm7010673.
[42] B. J. Berger. Antimalarial activities of aminooxy compounds. Antimicrob Agents Chemother,44(9):2540–2542, Sep 2000.
[43] P. Berman and E. Harley. Orotate uptake and metabolism by human erythrocytes. Adv ExpMed Biol, 165 Pt A:367–371, 1984.
[44] Andrew E Berry, Malcolm J Gardner, Gert-Jan Caspers, David S Roos, and Matthew Berri-man. Curation of the plasmodium falciparum genome. Trends Parasitol, 20(12):548–552, Dec2004. doi: 10.1016/j.pt.2004.09.003. URL http://dx.doi.org/10.1016/j.pt.2004.09.003.
[45] Helge Bertram. Bioinformatische Identifikation von Domänenunterschieden bei Parasit undWirt am Beispiel der Malaria. PhD thesis, Julius-Maximilians-Universität Würzburg, 2005.
[46] Purnima Bhanot, Kristine Schauer, Isabelle Coppens, and Victor Nussenzweig. A surfacephospholipase is involved in the migration of plasmodium sporozoites through cells. J BiolChem, 280(8):6752–6760, Feb 2005. doi: 10.1074/jbc.M411465200. URL http://dx.doi.org/10.1074/jbc.M411465200.
[47] Giancarlo A Biagini, Erica M Pasini, Ruth Hughes, Harry P De Koning, Henri J Vial, Paul MO’Neill, Stephen A Ward, and Patrick G Bray. Characterization of the choline carrier ofplasmodium falciparum: a route for the selective delivery of novel antimalarial drugs. Blood,104(10):3372–3377, Nov 2004. doi: 10.1182/blood-2004-03-1084. URL http://dx.doi.org/10.1182/blood-2004-03-1084.
[48] Christophe Biot, Holger Bauer, R. Heiner Schirmer, and Elisabeth Davioud-Charvet. 5-substituted tetrazoles as bioisosteres of carboxylic acids. bioisosterism and mechanistic studieson glutathione reductase inhibitors as antimalarials. J Med Chem, 47(24):5972–5983, Nov2004. doi: 10.1021/jm0497545. URL http://dx.doi.org/10.1021/jm0497545.
115

BIBLIOGRAPHY
[49] L. Birkholtz, A. C. van Brummelen, K. Clark, J. Niemand, E. Maréchal, M. Llinás, andA. I. Louw. Exploring functional genomics for drug target and therapeutics discovery inplasmodia. Acta Trop, 105(2):113–123, Feb 2008. doi: 10.1016/j.actatropica.2007.10.013.URL http://dx.doi.org/10.1016/j.actatropica.2007.10.013.
[50] A. J. Bitonti, J. A. Dumont, T. L. Bush, M. L. Edwards, D. M. Stemerick, P. P. McCann,and A. Sjoerdsma. Bis(benzyl)polyamine analogs inhibit the growth of chloroquine-resistanthuman malaria parasites (plasmodium falciparum) in vitro and in combination with alpha-difluoromethylornithine cure murine malaria. Proc Natl Acad Sci U S A, 86(2):651–655, Jan1989.
[51] Ian S Blagbrough and Chiara Zara. Animal models for target diseases in gene therapy–using dna and sirna delivery strategies. Pharm Res, 26(1):1–18, Jan 2009. doi: 10.1007/s11095-008-9646-8. URL http://dx.doi.org/10.1007/s11095-008-9646-8.
[52] Andrew N Boa, Shane P Canavan, Paul R Hirst, Christopher Ramsey, Andrew M WStead, and Glenn A McConkey. Synthesis of brequinar analogue inhibitors of malaria par-asite dihydroorotate dehydrogenase. Bioorg Med Chem, 13(6):1945–1967, Mar 2005. doi:10.1016/j.bmc.2005.01.017. URL http://dx.doi.org/10.1016/j.bmc.2005.01.017.
[53] A. L. Bodley, J. N. Cumming, and T. A. Shapiro. Effects of camptothecin, a topoisomerase iinhibitor, on plasmodium falciparum. Biochem Pharmacol, 55(5):709–711, Mar 1998.
[54] B. M. Bolstad, R. A. Irizarry, M. Astrand, and T. P. Speed. A comparison of normalizationmethods for high density oligonucleotide array data based on variance and bias. Bioinformatics,19(2):185–193, Jan 2003.
[55] Z. Q. Bonday, S. Dhanasekaran, P. N. Rangarajan, and G. Padmanaban. Import of host delta-aminolevulinate dehydratase into the malarial parasite: identification of a new drug target. NatMed, 6(8):898–903, Aug 2000. doi: 10.1038/78659. URL http://dx.doi.org/10.1038/78659.
[56] Hidemasa Bono and Yasushi Okazaki. The study of metabolic pathways in tumors based onthe transcriptome. Semin Cancer Biol, 15(4):290–299, Aug 2005. doi: 10.1016/j.semcancer.2005.04.008. URL http://dx.doi.org/10.1016/j.semcancer.2005.04.008.
[57] Irina Borodina and Jens Nielsen. From genomes to in silico cells via metabolic networks.Curr Opin Biotechnol, 16(3):350–355, Jun 2005. doi: 10.1016/j.copbio.2005.04.008. URLhttp://dx.doi.org/10.1016/j.copbio.2005.04.008.
[58] R. Boulieu, C. Bory, P. Baltassat, and C. Gonnet. Hypoxanthine and xanthine levels deter-mined by high-performance liquid chromatography in plasma, erythrocyte, and urine samplesfrom healthy subjects: the problem of hypoxanthine level evolution as a function of time. AnalBiochem, 129(2):398–404, Mar 1983.
[59] Zbynek Bozdech, Manuel Llinás, Brian Lee Pulliam, Edith D Wong, Jingchun Zhu, andJoseph L DeRisi. The transcriptome of the intraerythrocytic developmental cycle of plas-modium falciparum. PLoS Biol, 1(1):E5, Oct 2003. doi: 10.1371/journal.pbio.0000005. URLhttp://dx.doi.org/10.1371/journal.pbio.0000005.
[60] V. Bracchi-Ricard, K. T. Nguyen, Y. Zhou, P. T. Rajagopalan, D. Chakrabarti, and D. Pei.Characterization of an eukaryotic peptide deformylase from plasmodium falciparum. ArchBiochem Biophys, 396(2):162–170, Dec 2001. doi: 10.1006/abbi.2001.2631. URL http://dx.doi.org/10.1006/abbi.2001.2631.
116
BIBLIOGRAPHY
[61] R. F. Branda. Transport of 5-methyltetrahydrofolic acid in erythrocytes from various mam-malian species. J Nutr, 111(4):618–623, Apr 1981.
[62] Jacques Le Bras and Rémy Durand. The mechanisms of resistance to antimalarial drugs inplasmodium falciparum. Fundam Clin Pharmacol, 17(2):147–153, Apr 2003.
[63] Rainer Breitling, Dennis Vitkup, and Michael P Barrett. New surveyor tools for charting mi-crobial metabolic maps. Nat Rev Microbiol, 6(2):156–161, Feb 2008. doi: 10.1038/nrmicro1797.URL http://dx.doi.org/10.1038/nrmicro1797.
[64] Joel G Breman. Eradicating malaria. Sci Prog, 92(Pt 1):1–38, 2009.
[65] Brown. Biochemical composition of new yeasts and bacteria evaluated as food for bivalveaquaculture. Aquaculture, 143:341–360, 1996.
[66] Janusz M Bujnicki, Sean T Prigge, Diana Caridha, and Peter K Chiang. Structure, evolution,and inhibitor interaction of s-adenosyl-l-homocysteine hydrolase from plasmodium falciparum.Proteins, 52(4):624–632, Sep 2003. doi: 10.1002/prot.10446. URL http://dx.doi.org/10.1002/prot.10446.
[67] Anthony P Burgard, Evgeni V Nikolaev, Christophe H Schilling, and Costas D Maranas. Fluxcoupling analysis of genome-scale metabolic network reconstructions. Genome Res, 14(2):301–312, Feb 2004. doi: 10.1101/gr.1926504. URL http://dx.doi.org/10.1101/gr.1926504.
[68] Carlos A Buscaglia, Isabelle Coppens, Wim G J Hol, and Victor Nussenzweig. Sites ofinteraction between aldolase and thrombospondin-related anonymous protein in plasmod-ium. Mol Biol Cell, 14(12):4947–4957, Dec 2003. doi: 10.1091/mbc.E03-06-0355. URLhttp://dx.doi.org/10.1091/mbc.E03-06-0355.
[69] Carolina Bustamante, Camila Nunes Batista, and Mariano Zalis. Molecular and biologicalaspects of antimalarial resistance in plasmodium falciparum and plasmodium vivax. CurrDrug Targets, 10(3):279–290, Mar 2009.
[70] Eugene C Butcher, Ellen L Berg, and Eric J Kunkel. Systems biology in drug discovery. NatBiotechnol, 22(10):1253–1259, Oct 2004. doi: 10.1038/nbt1017. URL http://dx.doi.org/10.1038/nbt1017.
[71] Steven P Butcher. Target discovery and validation in the post-genomic era. Neurochem Res,28(2):367–371, Feb 2003.
[72] Isabelle Callebaut, Karine Prat, Edwige Meurice, Jean-Paul Mornon, and Stanislas Tomavo.Prediction of the general transcription factors associated with rna polymerase ii in plasmod-ium falciparum: conserved features and differences relative to other eukaryotes. BMC Ge-nomics, 6:100, 2005. doi: 10.1186/1471-2164-6-100. URL http://dx.doi.org/10.1186/1471-2164-6-100.
[73] Jane Calvert and Joan H Fujimura. Calculating life? a sociological perspective on systemsbiology. EMBO Rep, 10 Suppl 1:S46–S49, Aug 2009. doi: 10.1038/embor.2009.151. URLhttp://dx.doi.org/10.1038/embor.2009.151.
[74] Angus Cameron, Jon Read, Rebecca Tranter, Victoria J Winter, Richard B Sessions, R. LeoBrady, Livia Vivas, Anna Easton, Howard Kendrick, Simon L Croft, David Barros, Jose LuisLavandera, José Julio Martin, Felix Risco, Silvestre García-Ochoa, Fracisco Javier Gamo,Laura Sanz, Luisa Leon, Jose R Ruiz, Raquel Gabarró, Araceli Mallo, and Federico Gómezde las Heras. Identification and activity of a series of azole-based compounds with lactate
117

BIBLIOGRAPHY
dehydrogenase-directed anti-malarial activity. J Biol Chem, 279(30):31429–31439, Jul 2004.doi: 10.1074/jbc.M402433200. URL http://dx.doi.org/10.1074/jbc.M402433200.
[75] Jane M Carlton, John H Adams, Joana C Silva, Shelby L Bidwell, Hernan Lorenzi, Elis-abet Caler, Jonathan Crabtree, Samuel V Angiuoli, Emilio F Merino, Paolo Amedeo, QinCheng, Richard M R Coulson, Brendan S Crabb, Hernando A Del Portillo, Kobby Essien,Tamara V Feldblyum, Carmen Fernandez-Becerra, Paul R Gilson, Amy H Gueye, XiangGuo, Simon Kang’a, Taco W A Kooij, Michael Korsinczky, Esmeralda V-S Meyer, VishNene, Ian Paulsen, Owen White, Stuart A Ralph, Qinghu Ren, Tobias J Sargeant, Steven LSalzberg, Christian J Stoeckert, Steven A Sullivan, Marcio M Yamamoto, Stephen L Hoff-man, Jennifer R Wortman, Malcolm J Gardner, Mary R Galinski, John W Barnwell, andClaire M Fraser-Liggett. Comparative genomics of the neglected human malaria parasiteplasmodium vivax. Nature, 455(7214):757–763, Oct 2008. doi: 10.1038/nature07327. URLhttp://dx.doi.org/10.1038/nature07327.
[76] Marta Cascante, Laszlo G Boros, Begoña Comin-Anduix, Pedro de Atauri, Josep J Centelles,and Paul W-N Lee. Metabolic control analysis in drug discovery and disease. Nat Biotechnol,20(3):243–249, Mar 2002. doi: 10.1038/nbt0302-243. URL http://dx.doi.org/10.1038/nbt0302-243.
[77] María B Cassera, Fabio C Gozzo, Fabio L D’Alexandri, Emilio F Merino, Hernando A delPortillo, Valnice J Peres, Igor C Almeida, Marcos N Eberlin, Gerhard Wunderlich, JochenWiesner, Hassan Jomaa, Emilia A Kimura, and Alejandro M Katzin. The methylerythritolphosphate pathway is functionally active in all intraerythrocytic stages of plasmodium falci-parum. J Biol Chem, 279(50):51749–51759, Dec 2004. doi: 10.1074/jbc.M408360200. URLhttp://dx.doi.org/10.1074/jbc.M408360200.
[78] María B Cassera, Keith Z Hazleton, Paul M Riegelhaupt, Emilio F Merino, Minkui Luo,Myles H Akabas, and Vern L Schramm. Erythrocytic adenosine monophosphate as an alterna-tive purine source in plasmodium falciparum. J Biol Chem, 283(47):32889–32899, Nov 2008.doi: 10.1074/jbc.M804497200. URL http://dx.doi.org/10.1074/jbc.M804497200.
[79] D. Chakrabarti, S. M. Schuster, and R. Chakrabarti. Cloning and characterization of subunitgenes of ribonucleotide reductase, a cell-cycle-regulated enzyme, from plasmodium falciparum.Proc Natl Acad Sci U S A, 90(24):12020–12024, Dec 1993.
[80] Debopam Chakrabarti, Thiago Da Silva, Jennifer Barger, Steve Paquette, Hetal Patel,Shelley Patterson, and Charles M Allen. Protein farnesyltransferase and protein preny-lation in plasmodium falciparum. J Biol Chem, 277(44):42066–42073, Nov 2002. doi:10.1074/jbc.M202860200. URL http://dx.doi.org/10.1074/jbc.M202860200.
[81] Ipsita Chanda, Archana Pan, and Chitra Dutta. Proteome composition in plasmodium fal-ciparum: higher usage of gc-rich nonsynonymous codons in highly expressed genes. J MolEvol, 61(4):513–523, Oct 2005. doi: 10.1007/s00239-005-0023-5. URL http://dx.doi.org/10.1007/s00239-005-0023-5.
[82] Antje Chang, Maurice Scheer, Andreas Grote, Ida Schomburg, and Dietmar Schomburg.Brenda, amenda and frenda the enzyme information system: new content and tools in 2009.Nucleic Acids Res, 37(Database issue):D588–D592, Jan 2009. doi: 10.1093/nar/gkn820. URLhttp://dx.doi.org/10.1093/nar/gkn820.
[83] Claudine Chaouiya. Petri net modelling of biological networks. Brief Bioinform, 8(4):210–219,Jul 2007. doi: 10.1093/bib/bbm029. URL http://dx.doi.org/10.1093/bib/bbm029.
118

BIBLIOGRAPHY
[84] Arvind K Chavali, Jeffrey D Whittemore, James A Eddy, Kyle T Williams, and Jason APapin. Systems analysis of metabolism in the pathogenic trypanosomatid leishmania major.Mol Syst Biol, 4:177, 2008. doi: 10.1038/msb.2008.15. URL http://dx.doi.org/10.1038/msb.2008.15.
[85] P. Chavalitshewinkoon-Petmitr, G. Pongvilairat, S. Auparakkitanon, and P. Wilairat. Ga-metocytocidal activity of pyronaridine and dna topoisomerase ii inhibitors against multidrug-resistant plasmodium falciparum in vitro. Parasitol Int, 48(4):275–280, Feb 2000.
[86] Gal Chechik, Eugene Oh, Oliver Rando, Jonathan Weissman, Aviv Regev, and Daphne Koller.Activity motifs reveal principles of timing in transcriptional control of the yeast metabolicnetwork. Nat Biotechnol, 26(11):1251–1259, Nov 2008. doi: 10.1038/nbt.1499. URL http://dx.doi.org/10.1038/nbt.1499.
[87] Chieh-Chun Chen and Sheng Zhong. Inferring gene regulatory networks by thermodynamicmodeling. BMC Genomics, 9 Suppl 2:S19, 2008. doi: 10.1186/1471-2164-9-S2-S19. URLhttp://dx.doi.org/10.1186/1471-2164-9-S2-S19.
[88] X. Chen, Z. L. Ji, and Y. Z. Chen. Ttd: Therapeutic target database. Nucleic Acids Res, 30(1):412–415, Jan 2002.
[89] Alan C Cheng, Ryan G Coleman, Kathleen T Smyth, Qing Cao, Patricia Soulard, Daniel R Caf-frey, Anna C Salzberg, and Enoch S Huang. Structure-based maximal affinity model predictssmall-molecule druggability. Nat Biotechnol, 25(1):71–75, Jan 2007. doi: 10.1038/nbt1273.URL http://dx.doi.org/10.1038/nbt1273.
[90] Byung-Kwan Cho, Pep Charusanti, Markus J Herrgård, and Bernhard O Palsson. Microbialregulatory and metabolic networks. Curr Opin Biotechnol, 18(4):360–364, Aug 2007. doi:10.1016/j.copbio.2007.07.002. URL http://dx.doi.org/10.1016/j.copbio.2007.07.002.
[91] Seoung-Ryoung Choi, Prasenjit Mukherjee, and Mitchell A Avery. The fight against drug-resistant malaria: novel plasmodial targets and antimalarial drugs. Curr Med Chem, 15(2):161–171, 2008.
[92] Vinay Choubey, Pallab Maity, Mithu Guha, Sanjay Kumar, Kumkum Srivastava, Sunil Ku-mar Puri, and Uday Bandyopadhyay. Inhibition of plasmodium falciparum choline ki-nase by hexadecyltrimethylammonium bromide: a possible antimalarial mechanism. An-timicrob Agents Chemother, 51(2):696–706, Feb 2007. doi: 10.1128/AAC.00919-06. URLhttp://dx.doi.org/10.1128/AAC.00919-06.
[93] Hee-Joon Chung, Mingoo Kim, Chan Hee Park, Jihoon Kim, and Ju Han Kim. Arrayxpath:mapping and visualizing microarray gene-expression data with integrated biological pathwayresources using scalable vector graphics. Nucleic Acids Res, 32(Web Server issue):W460–W464,Jul 2004. doi: 10.1093/nar/gkh476. URL http://dx.doi.org/10.1093/nar/gkh476.
[94] J. E. Clements and B. B. Anderson. Glutathione reductase activity and pyridoxine (pyridox-amine) phosphate oxidase activity in the red cell. Biochim Biophys Acta, 632(2):159–163, Oct1980.
[95] Bradley I Coleman and Manoj T Duraisingh. Transcriptional control and gene silencing inplasmodium falciparum. Cell Microbiol, 10(10):1935–1946, Oct 2008. doi: 10.1111/j.1462-5822.2008.01203.x. URL http://dx.doi.org/10.1111/j.1462-5822.2008.01203.x.
119

BIBLIOGRAPHY
[96] Caroline Colijn, Aaron Brandes, Jeremy Zucker, Desmond S Lun, Brian Weiner, Maha RFarhat, Tan-Yun Cheng, D. Branch Moody, Megan Murray, and James E Galagan. Interpretingexpression data with metabolic flux models: predicting mycobacterium tuberculosis mycolicacid production. PLoS Comput Biol, 5(8):e1000489, Aug 2009. doi: 10.1371/journal.pcbi.1000489. URL http://dx.doi.org/10.1371/journal.pcbi.1000489.
[97] B. Comín-Anduix, J. Boren, S. Martinez, C. Moro, J. J. Centelles, R. Trebukhina, N. Petushok,W. N. Lee, L. G. Boros, and M. Cascante. The effect of thiamine supplementation on tumourproliferation. a metabolic control analysis study. Eur J Biochem, 268(15):4177–4182, Aug2001.
[98] R. A. Cooper and D. J. Carucci. Proteomic approaches to studying drug targets and resistancein plasmodium. Curr Drug Targets Infect Disord, 4(1):41–51, Mar 2004.
[99] ZD Solutions Societa Cooperativa. http://www.zdsolutions.it/dev/.
[100] Isabelle Coppens and Ole Vielemeyer. Insights into unique physiological features of neutrallipids in apicomplexa: from storage to potential mediation in parasite metabolic activities.Int J Parasitol, 35(6):597–615, May 2005. doi: 10.1016/j.ijpara.2005.01.009. URL http://dx.doi.org/10.1016/j.ijpara.2005.01.009.
[101] Athel Cornish-Bowden, editor. New beer in an old bottle: Eduard Buchner and the growth ofbiochemical knowledge. Universitat de València, 1997.
[102] Sophie Corvaisier, Valérie Bordeau, and Brice Felden. Inhibition of transfer messenger rnaaminoacylation and trans-translation by aminoglycoside antibiotics. J Biol Chem, 278(17):14788–14797, Apr 2003. doi: 10.1074/jbc.M212830200. URL http://dx.doi.org/10.1074/jbc.M212830200.
[103] Mohane Selvaraj Coumar, Chun Hei Antonio Cheung, Jang-Yang Chang, and Hsing-PangHsieh. Advances in aurora kinase inhibitor patents. Expert Opin Ther Pat, 19(3):321–356, Mar 2009. doi: 10.1517/13543770802646949. URL http://dx.doi.org/10.1517/13543770802646949.
[104] Virginie Coustou, Marc Biran, Marc Breton, Fabien Guegan, Loïc Rivière, Nicolas Plazolles,Derek Nolan, Michael P Barrett, Jean-Michel Franconi, and Frédéric Bringaud. Glucose-induced remodeling of intermediary and energy metabolism in procyclic trypanosoma brucei.J Biol Chem, 283(24):16342–16354, Jun 2008. doi: 10.1074/jbc.M709592200. URL http://dx.doi.org/10.1074/jbc.M709592200.
[105] A. S. Couto, E. A. Kimura, V. J. Peres, M. L. Uhrig, and A. M. Katzin. Active isoprenoidpathway in the intra-erythrocytic stages of plasmodium falciparum: presence of dolichols of11 and 12 isoprene units. Biochem J, 341 ( Pt 3):629–637, Aug 1999.
[106] M. W. Covert, C. H. Schilling, and B. Palsson. Regulation of gene expression in flux balancemodels of metabolism. J Theor Biol, 213(1):73–88, Nov 2001. doi: 10.1006/jtbi.2001.2405.URL http://dx.doi.org/10.1006/jtbi.2001.2405.
[107] Markus W Covert, Eric M Knight, Jennifer L Reed, Markus J Herrgard, and Bernhard OPalsson. Integrating high-throughput and computational data elucidates bacterial networks.Nature, 429(6987):92–96, May 2004. doi: 10.1038/nature02456. URL http://dx.doi.org/10.1038/nature02456.
[108] Alan F Cowman and Brendan S Crabb. Functional genomics: identifying drug targets forparasitic diseases. Trends Parasitol, 19(11):538–543, Nov 2003.
120

BIBLIOGRAPHY
[109] Christine M Crane, Johannes Kaiser, Nicola L Ramsden, Susan Lauw, Felix Rohdich, WolfgangEisenreich, William N Hunter, Adelbert Bacher, and François Diederich. Fluorescent inhibitorsfor ispf, an enzyme in the non-mevalonate pathway for isoprenoid biosynthesis and a potentialtarget for antimalarial therapy. Angew Chem Int Ed Engl, 45(7):1069–1074, Feb 2006. doi:10.1002/anie.200503003. URL http://dx.doi.org/10.1002/anie.200503003.
[110] Péter Csermely, Vilmos Agoston, and Sándor Pongor. The efficiency of multi-target drugs: thenetwork approach might help drug design. Trends Pharmacol Sci, 26(4):178–182, Apr 2005.doi: 10.1016/j.tips.2005.02.007. URL http://dx.doi.org/10.1016/j.tips.2005.02.007.
[111] Margarida Cunha-Rodrigues, Miguel Prudêncio, Maria M Mota, and Werner Haas. An-timalarial drugs - host targets (re)visited. Biotechnol J, 1(3):321–332, Mar 2006. doi:10.1002/biot.200500038. URL http://dx.doi.org/10.1002/biot.200500038.
[112] J. P. Daily, D. Scanfeld, N. Pochet, K. Le Roch, D. Plouffe, M. Kamal, O. Sarr, S. Mboup,O. Ndir, D. Wypij, K. Levasseur, E. Thomas, P. Tamayo, C. Dong, Y. Zhou, E. S. Lander,D. Ndiaye, D. Wirth, E. A. Winzeler, J. P. Mesirov, and A. Regev. Distinct physiologicalstates of plasmodium falciparum in malaria-infected patients. Nature, 450(7172):1091–1095,Dec 2007. doi: 10.1038/nature06311. URL http://dx.doi.org/10.1038/nature06311.
[113] O. Dar, M. S. Khan, and I. Adagu. The potential use of methotrexate in the treatment offalciparum malaria: in vitro assays against sensitive and multidrug-resistant falciparum strains.Jpn J Infect Dis, 61(3):210–211, May 2008.
[114] E. A. Davidson and D. C. Gowda. Glycobiology of plasmodium falciparum. Biochimie, 83(7):601–604, Jul 2001.
[115] P. A. Dawson, D. A. Cochran, B. T. Emmerson, and R. B. Gordon. Inhibition of plasmodiumfalciparum hypoxanthine-guanine phosphoribosyltransferase mrna by antisense oligodeoxynu-cleotide sequence. Mol Biochem Parasitol, 60(1):153–156, Jul 1993.
[116] Hidde de Jong. Modeling and simulation of genetic regulatory systems: a literature review.J Comput Biol, 9(1):67–103, 2002. doi: 10.1089/10665270252833208. URL http://dx.doi.org/10.1089/10665270252833208.
[117] Kirk Deitsch, Manoj Duraisingh, Ron Dzikowski, Anusha Gunasekera, Shahid Khan, Karine LeRoch, Manuel Llinás, Gunnar Mair, Victoria McGovern, David Roos, Jennifer Shock, JenniferSims, Roger Wiegand, and Elizabeth Winzeler. Mechanisms of gene regulation in plasmodium.Am J Trop Med Hyg, 77(2):201–208, Aug 2007.
[118] Marcel Deponte, Katja Becker, and Stefan Rahlfs. Plasmodium falciparum glutaredoxin-like proteins. Biol Chem, 386(1):33–40, Jan 2005. doi: 10.1515/BC.2005.005. URL http://dx.doi.org/10.1515/BC.2005.005.
[119] A. A. Divo, T. G. Geary, N. L. Davis, and J. B. Jensen. Nutritional requirements of plasmodiumfalciparum in culture. i. exogenously supplied dialyzable components necessary for continuousgrowth. J Protozool, 32(1):59–64, Feb 1985.
[120] Anton R Dluzewski, Irene T Ling, John M Hopkins, Munira Grainger, Gabriele Margos, Gra-ham H Mitchell, Anthony A Holder, and Lawrence H Bannister. Formation of the food vacuolein plasmodium falciparum: a potential role for the 19 kda fragment of merozoite surface pro-tein 1 (msp1(19)). PLoS One, 3(8):e3085, 2008. doi: 10.1371/journal.pone.0003085. URLhttp://dx.doi.org/10.1371/journal.pone.0003085.
121

BIBLIOGRAPHY
[121] Chuong B Do and Serafim Batzoglou. What is the expectation maximization algorithm? NatBiotechnol, 26(8):897–899, Aug 2008. doi: 10.1038/nbt1406. URL http://dx.doi.org/10.1038/nbt1406.
[122] Arjen M Dondorp, François Nosten, Poravuth Yi, Debashish Das, Aung Phae Phyo, JoelTarning, Khin Maung Lwin, Frederic Ariey, Warunee Hanpithakpong, Sue J Lee, Pascal Ring-wald, Kamolrat Silamut, Mallika Imwong, Kesinee Chotivanich, Pharath Lim, Trent Herdman,Sen Sam An, Shunmay Yeung, Pratap Singhasivanon, Nicholas P J Day, Niklas Lindegardh,Duong Socheat, and Nicholas J White. Artemisinin resistance in plasmodium falciparummalaria. N Engl J Med, 361(5):455–467, Jul 2009. doi: 10.1056/NEJMoa0808859. URLhttp://dx.doi.org/10.1056/NEJMoa0808859.
[123] Megan J Downie, Kiaran Kirk, and Choukri Ben Mamoun. Purine salvage pathways in theintraerythrocytic malaria parasite plasmodium falciparum. Eukaryot Cell, 7(8):1231–1237,Aug 2008. doi: 10.1128/EC.00159-08. URL http://dx.doi.org/10.1128/EC.00159-08.
[124] F. B. du Preez, R. Conradie, G. P. Penkler, K. Holm, F. L J van Dooren, and J. L. Snoep. Acomparative analysis of kinetic models of erythrocyte glycolysis. J Theor Biol, 252(3):488–496,Jun 2008. doi: 10.1016/j.jtbi.2007.10.006. URL http://dx.doi.org/10.1016/j.jtbi.2007.10.006.
[125] Natalie C Duarte, Scott A Becker, Neema Jamshidi, Ines Thiele, Monica L Mo, Thuy D Vo,Rohith Srivas, and Bernhard Palsson. Global reconstruction of the human metabolic networkbased on genomic and bibliomic data. Proc Natl Acad Sci U S A, 104(6):1777–1782, Feb 2007.doi: 10.1073/pnas.0610772104. URL http://dx.doi.org/10.1073/pnas.0610772104.
[126] W. Dudzinska, A. J. Hlynczak, E. Skotnicka, and M. Suska. The purine metabolism of humanerythrocytes. Biochemistry (Mosc), 71(5):467–475, May 2006.
[127] Maxime Durot, Pierre-Yves Bourguignon, and Vincent Schachter. Genome-scale models ofbacterial metabolism: reconstruction and applications. FEMS Microbiol Rev, 33(1):164–190,Jan 2009. doi: 10.1111/j.1574-6976.2008.00146.x. URL http://dx.doi.org/10.1111/j.1574-6976.2008.00146.x.
[128] P. Dutta. Enhanced uptake and metabolism of riboflavin in erythrocytes infected with plas-modium falciparum. J Protozool, 38(5):479–483, 1991.
[129] K. Eaazhisai, R. Jayalakshmi, P. Gayathri, R. P. Anand, K. Sumathy, H. Balaram, and M. R NMurthy. Crystal structure of fully ligated adenylosuccinate synthetase from plasmodium fal-ciparum. J Mol Biol, 335(5):1251–1264, Jan 2004.
[130] J. S. Edwards and B. O. Palsson. How will bioinformatics influence metabolic engineering?Biotechnol Bioeng, 58(2-3):162–169, 1998.
[131] J. S. Edwards and B. O. Palsson. The escherichia coli mg1655 in silico metabolic genotype:its definition, characteristics, and capabilities. Proc Natl Acad Sci U S A, 97(10):5528–5533,May 2000.
[132] Timothy J Egan, Jill M Combrinck, Joanne Egan, Giovanni R Hearne, Helder M Marques,Skhumbuzo Ntenteni, B. Trevor Sewell, Peter J Smith, Dale Taylor, Donelly A van Schalkwyk,and Jason C Walden. Fate of haem iron in the malaria parasite plasmodium falciparum.Biochem J, 365(Pt 2):343–347, Jul 2002. doi: 10.1042/BJ20020793. URL http://dx.doi.org/10.1042/BJ20020793.
122

BIBLIOGRAPHY
[133] David A Elliott, Michael T McIntosh, H. Dean Hosgood, Shuo Chen, Gina Zhang, PavlinaBaevova, and Keith A Joiner. Four distinct pathways of hemoglobin uptake in the malariaparasite plasmodium falciparum. Proc Natl Acad Sci U S A, 105(7):2463–2468, Feb 2008. doi:10.1073/pnas.0711067105. URL http://dx.doi.org/10.1073/pnas.0711067105.
[134] Iman Famili, Jochen Forster, Jens Nielsen, and Bernhard O Palsson. Saccharomyces cerevisiaephenotypes can be predicted by using constraint-based analysis of a genome-scale reconstructedmetabolic network. Proc Natl Acad Sci U S A, 100(23):13134–13139, Nov 2003. doi: 10.1073/pnas.2235812100. URL http://dx.doi.org/10.1073/pnas.2235812100.
[135] Xin Fang, Anders Wallqvist, and Jaques Reifman. A systems biology framework for modelingmetabolic enzyme inhibition of mycobacterium tuberculosis. BMC Syst Biol, 3:92, 2009. doi:10.1186/1752-0509-3-92. URL http://dx.doi.org/10.1186/1752-0509-3-92.
[136] Segun Fatumo, Kitiporn Plaimas, Jan-Philipp Mallm, Gunnar Schramm, Ezekiel Adebiyi,Marcus Oswald, Roland Eils, and Rainer König. Estimating novel potential drug targetsof plasmodium falciparum by analysing the metabolic network of knock-out strains in silico.Infect Genet Evol, 9(3):351–358, May 2009. doi: 10.1016/j.meegid.2008.01.007. URL http://dx.doi.org/10.1016/j.meegid.2008.01.007.
[137] Adam M Feist and Bernhard Palsson. The growing scope of applications of genome-scalemetabolic reconstructions using escherichia coli. Nat Biotechnol, 26(6):659–667, Jun 2008.doi: 10.1038/nbt1401. URL http://dx.doi.org/10.1038/nbt1401.
[138] Adam M Feist, Johannes C M Scholten, Bernhard Palsson, Fred J Brockman, and Trey Ideker.Modeling methanogenesis with a genome-scale metabolic reconstruction of methanosarcinabarkeri. Mol Syst Biol, 2:2006.0004, 2006. doi: 10.1038/msb4100046. URL http://dx.doi.org/10.1038/msb4100046.
[139] Adam M Feist, Christopher S Henry, Jennifer L Reed, Markus Krummenacker, Andrew RJoyce, Peter D Karp, Linda J Broadbelt, Vassily Hatzimanikatis, and Bernhard Palsson. Agenome-scale metabolic reconstruction for escherichia coli k-12 mg1655 that accounts for 1260orfs and thermodynamic information. Mol Syst Biol, 3:121, 2007. doi: 10.1038/msb4100155.URL http://dx.doi.org/10.1038/msb4100155.
[140] Adam M Feist, Markus J Herrgård, Ines Thiele, Jennie L Reed, and Bernhard Ø Palsson.Reconstruction of biochemical networks in microorganisms. Nat Rev Microbiol, 7(2):129–143,Feb 2009. doi: 10.1038/nrmicro1949. URL http://dx.doi.org/10.1038/nrmicro1949.
[141] David Fell. Understanding the Control of Metabolism. Ashgate Publishing, 1996.
[142] D. A. Fidock, T. Nomura, and T. E. Wellems. Cycloguanil and its parent compound proguanildemonstrate distinct activities against plasmodium falciparum malaria parasites transformedwith human dihydrofolate reductase. Mol Pharmacol, 54(6):1140–1147, Dec 1998.
[143] David A Fidock, Philip J Rosenthal, Simon L Croft, Reto Brun, and Solomon Nwaka. Anti-malarial drug discovery: efficacy models for compound screening. Nat Rev Drug Discov, 3(6):509–520, Jun 2004. doi: 10.1038/nrd1416. URL http://dx.doi.org/10.1038/nrd1416.
[144] L. F. Fieser and E. Berliner. Naphthoquinone antimalarials; general survey. J Am Chem Soc,70(10):3151–3155, Oct 1948.
[145] Steven Fletcher and Andrew D Hamilton. Protein-protein interaction inhibitors: smallmolecules from screening techniques. Curr Top Med Chem, 7(10):922–927, 2007.
123

BIBLIOGRAPHY
[146] Marian Flipo, Isabelle Florent, Philippe Grellier, Christian Sergheraert, and Rebecca Deprez-Poulain. Design, synthesis and antimalarial activity of novel, quinoline-based, zinc metallo-aminopeptidase inhibitors. Bioorg Med Chem Lett, 13(16):2659–2662, Aug 2003.
[147] Laurence Florens, Michael P Washburn, J. Dale Raine, Robert M Anthony, Munira Grainger,J. David Haynes, J. Kathleen Moch, Nemone Muster, John B Sacci, David L Tabb, Adam AWitney, Dirk Wolters, Yimin Wu, Malcolm J Gardner, Anthony A Holder, Robert E Sinden,John R Yates, and Daniel J Carucci. A proteomic view of the plasmodium falciparum lifecycle. Nature, 419(6906):520–526, Oct 2002. doi: 10.1038/nature01107. URL http://dx.doi.org/10.1038/nature01107.
[148] M. V. Flores, D. Atkins, D. Wade, W. J. O’Sullivan, and T. S. Stewart. Inhibition of plas-modium falciparum proliferation in vitro by ribozymes. J Biol Chem, 272(27):16940–16945,Jul 1997.
[149] Nicole Folchetti, Randi Rossignol, and Mary Louise Byrd, editors. An introduction to geneticanalysis. W. H. Freeman and Company, 2000.
[150] Albert Bonniers Forlag. National geographic: Malaria parasites amid red bloodcells. http://science.nationalgeographic.com/science/photos/malaria/#/malaria-parasites_1059_600x450.jpg.
[151] Christian V Forst. Host-pathogen systems biology. Drug Discov Today, 11(5-6):220–227, Mar 2006. doi: 10.1016/S1359-6446(05)03735-9. URL http://dx.doi.org/10.1016/S1359-6446(05)03735-9.
[152] Bernardo J Foth, Neng Zhang, Sachel Mok, Peter R Preiser, and Zbynek Bozdech. Quanti-tative protein expression profiling reveals extensive post-transcriptional regulation and post-translational modifications in schizont-stage malaria parasites. Genome Biol, 9(12):R177, 2008.doi: 10.1186/gb-2008-9-12-r177. URL http://dx.doi.org/10.1186/gb-2008-9-12-r177.
[153] F. Foussard, Y. Gallois, A. Girault, and J. F. Menez. Lipids and fatty acids of tachyzoites andpurified pellicles of toxoplasma gondii. Parasitol Res, 77(6):475–477, 1991.
[154] S. E. Francis, D. J. Sullivan, and D. E. Goldberg. Hemoglobin metabolism in the malariaparasite plasmodium falciparum. Annu Rev Microbiol, 51:97–123, 1997. doi: 10.1146/annurev.micro.51.1.97. URL http://dx.doi.org/10.1146/annurev.micro.51.1.97.
[155] Christof Francke, Roland J Siezen, and Bas Teusink. Reconstructing the metabolic networkof a bacterium from its genome. Trends Microbiol, 13(11):550–558, Nov 2005. doi: 10.1016/j.tim.2005.09.001. URL http://dx.doi.org/10.1016/j.tim.2005.09.001.
[156] Ute Frevert and Elizabeth Nardin. Cellular effector mechanisms against plasmodium liverstages. Cell Microbiol, 10(10):1956–1967, Oct 2008. doi: 10.1111/j.1462-5822.2008.01211.x.URL http://dx.doi.org/10.1111/j.1462-5822.2008.01211.x.
[157] Karin Fritz-Wolf, Andreas Becker, Stefan Rahlfs, Petra Harwaldt, R. Heiner Schirmer, Wolf-gang Kabsch, and Katja Becker. X-ray structure of glutathione s-transferase from the malarialparasite plasmodium falciparum. Proc Natl Acad Sci U S A, 100(24):13821–13826, Nov 2003.doi: 10.1073/pnas.2333763100. URL http://dx.doi.org/10.1073/pnas.2333763100.
[158] David C Fry. Protein-protein interactions as targets for small molecule drug discovery. Biopoly-mers, 84(6):535–552, 2006. doi: 10.1002/bip.20608. URL http://dx.doi.org/10.1002/bip.20608.
124

BIBLIOGRAPHY
[159] S. A. Gamage, N. Tepsiri, P. Wilairat, S. J. Wojcik, D. P. Figgitt, R. K. Ralph, and W. A.Denny. Synthesis and in vitro evaluation of 9-anilino-3,6-diaminoacridines active against amultidrug-resistant strain of the malaria parasite plasmodium falciparum. J Med Chem, 37(10):1486–1494, May 1994.
[160] Karthikeyan Ganesan, Napawan Ponmee, Lei Jiang, Joseph W Fowble, John White, SumaleeKamchonwongpaisan, Yongyuth Yuthavong, Prapon Wilairat, and Pradipsinh K Rathod.A genetically hard-wired metabolic transcriptome in plasmodium falciparum fails to mountprotective responses to lethal antifolates. PLoS Pathog, 4(11):e1000214, Nov 2008. doi:10.1371/journal.ppat.1000214. URL http://dx.doi.org/10.1371/journal.ppat.1000214.
[161] Malcolm J Gardner, Neil Hall, Eula Fung, Owen White, Matthew Berriman, Richard WHyman, Jane M Carlton, Arnab Pain, Karen E Nelson, Sharen Bowman, Ian T Paulsen,Keith James, Jonathan A Eisen, Kim Rutherford, Steven L Salzberg, Alister Craig, Sue Kyes,Man-Suen Chan, Vishvanath Nene, Shamira J Shallom, Bernard Suh, Jeremy Peterson, SamAngiuoli, Mihaela Pertea, Jonathan Allen, Jeremy Selengut, Daniel Haft, Michael W Mather,Akhil B Vaidya, David M A Martin, Alan H Fairlamb, Martin J Fraunholz, David S Roos,Stuart A Ralph, Geoffrey I McFadden, Leda M Cummings, G. Mani Subramanian, ChrisMungall, J. Craig Venter, Daniel J Carucci, Stephen L Hoffman, Chris Newbold, Ronald WDavis, Claire M Fraser, and Bart Barrell. Genome sequence of the human malaria parasiteplasmodium falciparum. Nature, 419(6906):498–511, Oct 2002. doi: 10.1038/nature01097.URL http://dx.doi.org/10.1038/nature01097.
[162] Reginald Garrett and Charles Grisham. Online book: Biochemistry by garrett & grisham,chapter 18. http://web.virginia.edu/Heidi/chapter18/chp18.htm, 1999.
[163] Audrey Gego, Olivier Silvie, Jean-Francois Franetich, Khemaïs Farhati, Laurent Hannoun,Adrian J. F. Luty, Robert W. Sauerwein, Claude Boucheix, Eric Rubinstein, and DominiqueMazier. New approach for high-throughput screening of drug activity on plasmodium liverstages. ANTIMICROBIAL AGENTS AND CHEMOTHERAPY,, 2006.
[164] Florian Geier, Jens Timmer, and Christian Fleck. Reconstructing gene-regulatory networksfrom time series, knock-out data, and prior knowledge. BMC Syst Biol, 1:11, 2007. doi:10.1186/1752-0509-1-11. URL http://dx.doi.org/10.1186/1752-0509-1-11.
[165] Annette M Gero, Catherine G Dunn, David M Brown, Kirupa Pulenthiran, Elena L Gorovits,Tomas Bakos, and Alexander L Weis. New malaria chemotherapy developed by utilization ofa unique parasite transport system. Curr Pharm Des, 9(11):867–877, 2003.
[166] P. Gerold and R. T. Schwarz. Biosynthesis of glycosphingolipids de-novo by the human malariaparasite plasmodium falciparum. Mol Biochem Parasitol, 112(1):29–37, Jan 2001.
[167] H. Ginsburg. Transport pathways in the malaria-infected erythrocyte. their characterizationand their use as potential targets for chemotherapy. Biochem Pharmacol, 48(10):1847–1856,Nov 1994.
[168] H. Ginsburg, O. Famin, J. Zhang, and M. Krugliak. Inhibition of glutathione-dependentdegradation of heme by chloroquine and amodiaquine as a possible basis for their antimalarialmode of action. Biochem Pharmacol, 56(10):1305–1313, Nov 1998.
[169] Hagai Ginsburg. Malaria parasite metabolic pathways. http://sites.huji.ac.il/malaria/.
[170] Hagai Ginsburg. Progress in in silico functional genomics: the malaria metabolic pathwaysdatabase. Trends Parasitol, 22(6):238–240, Jun 2006. doi: 10.1016/j.pt.2006.04.008. URLhttp://dx.doi.org/10.1016/j.pt.2006.04.008.
125

BIBLIOGRAPHY
[171] Hagai Ginsburg. Caveat emptor: limitations of the automated reconstruction of metabolicpathways in plasmodium. Trends Parasitol, 25(1):37–43, Jan 2009. doi: 10.1016/j.pt.2008.08.012. URL http://dx.doi.org/10.1016/j.pt.2008.08.012.
[172] Anne Goelzer, Fadia Bekkal Brikci, Isabelle Martin-Verstraete, Philippe Noirot, PhilippeBessières, Stéphane Aymerich, and Vincent Fromion. Reconstruction and analysis of the ge-netic and metabolic regulatory networks of the central metabolism of bacillus subtilis. BMCSyst Biol, 2:20, 2008. doi: 10.1186/1752-0509-2-20. URL http://dx.doi.org/10.1186/1752-0509-2-20.
[173] Jacob Golenser, Judith H Waknine, Miriam Krugliak, Nicholas H Hunt, and Georges E Grau.Current perspectives on the mechanism of action of artemisinins. Int J Parasitol, 36(14):1427–1441, Dec 2006. doi: 10.1016/j.ijpara.2006.07.011. URL http://dx.doi.org/10.1016/j.ijpara.2006.07.011.
[174] Orland Gonzalez, Susanne Gronau, Michaela Falb, Friedhelm Pfeiffer, Eduardo Mendoza, RalfZimmer, and Dieter Oesterhelt. Reconstruction, modeling & analysis of halobacterium sali-narum r-1 metabolism. Mol Biosyst, 4(2):148–159, Feb 2008. doi: 10.1039/b715203e. URLhttp://dx.doi.org/10.1039/b715203e.
[175] D. C. Gowda, P. Gupta, and E. A. Davidson. Glycosylphosphatidylinositol anchors repre-sent the major carbohydrate modification in proteins of intraerythrocytic stage plasmodiumfalciparum. J Biol Chem, 272(10):6428–6439, Mar 1997.
[176] Dov Greenbaum, Christopher Colangelo, Kenneth Williams, and Mark Gerstein. Comparingprotein abundance and mrna expression levels on a genomic scale. Genome Biol, 4(9):117,2003. doi: 10.1186/gb-2003-4-9-117. URL http://dx.doi.org/10.1186/gb-2003-4-9-117.
[177] Brian M Greenwood, Kalifa Bojang, Christopher J M Whitty, and Geoffrey A T Targett.Malaria. Lancet, 365(9469):1487–1498, 2005. doi: 10.1016/S0140-6736(05)66420-3. URLhttp://dx.doi.org/10.1016/S0140-6736(05)66420-3.
[178] Anne Charlotte Grüner, Stéphanie Hez-Deroubaix, Georges Snounou, Neil Hall, ChristianeBouchier, Frank Letourneur, Irène Landau, and Pierre Druilhe. Insights into the p. y. yoeliihepatic stage transcriptome reveal complex transcriptional patterns. Mol Biochem Parasitol,142(2):184–192, Aug 2005. doi: 10.1016/j.molbiopara.2005.03.019. URL http://dx.doi.org/10.1016/j.molbiopara.2005.03.019.
[179] Stefan Günther, Michael Kuhn, Mathias Dunkel, Monica Campillos, Christian Senger, Evan-gelia Petsalaki, Jessica Ahmed, Eduardo Garcia Urdiales, Andreas Gewiess, Lars Juhl Jensen,Reinhard Schneider, Roman Skoblo, Robert B Russell, Philip E Bourne, Peer Bork, and RobertPreissner. Supertarget and matador: resources for exploring drug-target relationships. Nu-cleic Acids Res, 36(Database issue):D919–D922, Jan 2008. doi: 10.1093/nar/gkm862. URLhttp://dx.doi.org/10.1093/nar/gkm862.
[180] Svenja Günther, Janet Storm, and Sylke Müller. Plasmodium falciparum: Organelle-specificacquisition of lipoic acid. Int J Biochem Cell Biol, 41(4):748–752, Apr 2009. doi: 10.1016/j.biocel.2008.10.028. URL http://dx.doi.org/10.1016/j.biocel.2008.10.028.
[181] S. P. Gygi, Y. Rochon, B. R. Franza, and R. Aebersold. Correlation between protein and mrnaabundance in yeast. Mol Cell Biol, 19(3):1720–1730, Mar 1999.
[182] Haefner. Can theoretical analysis of cellular regulatory networks improve drug target identifi-cation and validation? BUSINESS BRIEFING: Future Drug discovery, 2004.
126

BIBLIOGRAPHY
[183] Nashya Haider, Marie-Luise Eschbach, Suzana de Souza Dias, Tim-Wolf Gilberger, Rolf DWalter, and Kai Lüersen. The spermidine synthase of the malaria parasite plasmodium falci-parum: molecular and biochemical characterisation of the polyamine synthesis enzyme. MolBiochem Parasitol, 142(2):224–236, Aug 2005. doi: 10.1016/j.molbiopara.2005.04.004. URLhttp://dx.doi.org/10.1016/j.molbiopara.2005.04.004.
[184] K. Haldar, A. F. de Amorim, and G. A. Cross. Transport of fluorescent phospholipid analoguesfrom the erythrocyte membrane to the parasite in plasmodium falciparum-infected cells. J CellBiol, 108(6):2183–2192, Jun 1989.
[185] Neil Hall, Marianna Karras, J. Dale Raine, Jane M Carlton, Taco W A Kooij, MatthewBerriman, Laurence Florens, Christoph S Janssen, Arnab Pain, Georges K Christophides,Keith James, Kim Rutherford, Barbara Harris, David Harris, Carol Churcher, Michael AQuail, Doug Ormond, Jon Doggett, Holly E Trueman, Jacqui Mendoza, Shelby L Bidwell,Marie-Adele Rajandream, Daniel J Carucci, John R Yates, Fotis C Kafatos, Chris J Janse, BartBarrell, C. Michael R Turner, Andrew PWaters, and Robert E Sinden. A comprehensive surveyof the plasmodium life cycle by genomic, transcriptomic, and proteomic analyses. Science, 307(5706):82–86, Jan 2005. doi: 10.1126/science.1103717. URL http://dx.doi.org/10.1126/science.1103717.
[186] Kentaro Hanada, Nirianne Marie Q Palacpac, Pamela A Magistrado, Ken Kurokawa, GaneshRai, Daiji Sakata, Tomoko Hara, Toshihiro Horii, Masahiro Nishijima, and Toshihide Mi-tamura. Plasmodium falciparum phospholipase c hydrolyzing sphingomyelin and lyso-cholinephospholipids is a possible target for malaria chemotherapy. J Exp Med, 195(1):23–34,Jan 2002.
[187] Petra Harwaldt, Stefan Rahlfs, and Katja Becker. Glutathione s-transferase of the malarialparasite plasmodium falciparum: characterization of a potential drug target. Biol Chem, 383(5):821–830, May 2002. doi: 10.1515/BC.2002.086. URL http://dx.doi.org/10.1515/BC.2002.086.
[188] Samiul Hasan, Sabine Daugelat, P. S Srinivasa Rao, and Mark Schreiber. Prioritizing genomicdrug targets in pathogens: application to mycobacterium tuberculosis. PLoS Comput Biol, 2(6):e61, Jun 2006. doi: 10.1371/journal.pcbi.0020061. URL http://dx.doi.org/10.1371/journal.pcbi.0020061.
[189] Utz-Uwe Haus, Steffen Klamt, and Tamon Stephen. Computing knock-out strategies in meta-bolic networks. J Comput Biol, 15(3):259–268, Apr 2008. doi: 10.1089/cmb.2007.0229. URLhttp://dx.doi.org/10.1089/cmb.2007.0229.
[190] K. Hayton and X z Su. Genetic and biochemical aspects of drug resistance in malaria parasites.Curr Drug Targets Infect Disord, 4(1):1–10, Mar 2004.
[191] R. J. Heath and C. O. Rock. Enoyl-acyl carrier protein reductase (fabi) plays a determinantrole in completing cycles of fatty acid elongation in escherichia coli. J Biol Chem, 270(44):26538–26542, Nov 1995.
[192] Michael Hecker, Sandro Lambeck, Susanne Toepfer, Eugene van Someren, and ReinhardGuthke. Gene regulatory network inference: Data integration in dynamic models-a review.Biosystems, Dec 2008. doi: 10.1016/j.biosystems.2008.12.004. URL http://dx.doi.org/10.1016/j.biosystems.2008.12.004.
[193] Michael Hecker, Sandro Lambeck, Susanne Toepfer, Eugene van Someren, and ReinhardGuthke. Gene regulatory network inference: data integration in dynamic models-a re-view. Biosystems, 96(1):86–103, Apr 2009. doi: 10.1016/j.biosystems.2008.12.004. URLhttp://dx.doi.org/10.1016/j.biosystems.2008.12.004.
127

BIBLIOGRAPHY
[194] Timo Heikkilä, Srinath Thirumalairajan, Matthew Davies, Mark R Parsons, A. Glenn Mc-Conkey, Colin W G Fishwick, and A. Peter Johnson. The first de novo designed inhibitorsof plasmodium falciparum dihydroorotate dehydrogenase. Bioorg Med Chem Lett, 16(1):88–92, Jan 2006. doi: 10.1016/j.bmcl.2005.09.045. URL http://dx.doi.org/10.1016/j.bmcl.2005.09.045.
[195] R. Heinrich and T. A. Rapoport. A linear steady-state treatment of enzymatic chains. generalproperties, control and effector strength. Eur J Biochem, 42(1):89–95, Feb 1974.
[196] Ari Helenius and Markus Aebi. Roles of n-linked glycans in the endoplasmic reticulum. AnnuRev Biochem, 73:1019–1049, 2004. doi: 10.1146/annurev.biochem.73.011303.073752. URLhttp://dx.doi.org/10.1146/annurev.biochem.73.011303.073752.
[197] Marc K Hellerstein. A critique of the molecular target-based drug discovery paradigm basedon principles of metabolic control: advantages of pathway-based discovery. Metab Eng, 10(1):1–9, Jan 2008. doi: 10.1016/j.ymben.2007.09.003. URL http://dx.doi.org/10.1016/j.ymben.2007.09.003.
[198] Markus J Herrgård, Markus W Covert, and Bernhard O Palsson. Reconstruction of microbialtranscriptional regulatory networks. Curr Opin Biotechnol, 15(1):70–77, Feb 2004. doi: 10.1016/j.copbio.2003.11.002. URL http://dx.doi.org/10.1016/j.copbio.2003.11.002.
[199] Markus J Herrgård, Stephen S Fong, and Bernhard O Palsson. Identification of genome-scalemetabolic network models using experimentally measured flux profiles. PLoS Comput Biol,2(7):e72, Jul 2006. doi: 10.1371/journal.pcbi.0020072. URL http://dx.doi.org/10.1371/journal.pcbi.0020072.
[200] Hoffmann. Uncovering metabolic objectives pursued by changes of enzyme levels. Ann N YAcad Sci., 2008.
[201] Sabrina Hoffmann, Andreas Hoppe, and Hermann-Georg Holzhütter. Composition of metabolicflux distributions by functionally interpretable minimal flux modes (minmodes). GenomeInform, 17(1):195–207, 2006.
[202] G. G. Holz. Lipids and the malarial parasite. Bull World Health Organ, 55(2-3):237–248, 1977.
[203] Hermann-Georg Holzhütter. The principle of flux minimization and its application to estimatestationary fluxes in metabolic networks. Eur J Biochem, 271(14):2905–2922, Jul 2004. doi:10.1111/j.1432-1033.2004.04213.x. URL http://dx.doi.org/10.1111/j.1432-1033.2004.04213.x.
[204] Hermann-Georg Holzhütter. The generalized flux-minimization method and its application tometabolic networks affected by enzyme deficiencies. Biosystems, 83(2-3):98–107, 2006. doi:10.1016/j.biosystems.2005.04.008. URL http://dx.doi.org/10.1016/j.biosystems.2005.04.008.
[205] Scott Holzhütter and Hermann-Georg Holzhütter. Computational design of reduced metabolicnetworks. Chembiochem, 5(10):1401–1422, Oct 2004. doi: 10.1002/cbic.200400128. URLhttp://dx.doi.org/10.1002/cbic.200400128.
[206] Andrew L Hopkins. Network pharmacology. Nat Biotechnol, 25(10):1110–1111, Oct 2007. doi:10.1038/nbt1007-1110. URL http://dx.doi.org/10.1038/nbt1007-1110.
[207] Andrew L Hopkins. Network pharmacology: the next paradigm in drug discovery. Nat ChemBiol, 4(11):682–690, Nov 2008. doi: 10.1038/nchembio.118. URL http://dx.doi.org/10.1038/nchembio.118.
128

BIBLIOGRAPHY
[208] Andrew L Hopkins and Colin R Groom. The druggable genome. Nat Rev Drug Discov, 1(9):727–730, Sep 2002. doi: 10.1038/nrd892. URL http://dx.doi.org/10.1038/nrd892.
[209] Andreas Hoppe, Sabrina Hoffmann, and Hermann-Georg Holzhütter. Including metaboliteconcentrations into flux balance analysis: thermodynamic realizability as a constraint on fluxdistributions in metabolic networks. BMC Syst Biol, 1:23, 2007. doi: 10.1186/1752-0509-1-23.URL http://dx.doi.org/10.1186/1752-0509-1-23.
[210] Jorrit J Hornberg, Frank J Bruggeman, Bernd Binder, Christian R Geest, A. J Marjolein Bijde Vaate, Jan Lankelma, Reinhart Heinrich, and Hans V Westerhoff. Principles behindthe multifarious control of signal transduction. erk phosphorylation and kinase/phosphatasecontrol. FEBS J, 272(1):244–258, Jan 2005. doi: 10.1111/j.1432-1033.2004.04404.x. URLhttp://dx.doi.org/10.1111/j.1432-1033.2004.04404.x.
[211] Jorrit J Hornberg, Frank J Bruggeman, Barbara M Bakker, and Hans V Westerhoff. Metaboliccontrol analysis to identify optimal drug targets. Prog Drug Res, 64:171, 173–171, 189, 2007.
[212] L. L. Hsiao, R. J. Howard, M. Aikawa, and T. F. Taraschi. Modification of host cell membranelipid composition by the intra-erythrocytic human malaria parasite plasmodium falciparum.Biochem J, 274 ( Pt 1):121–132, Feb 1991.
[213] Lars Hviid and Lea Barfod. Malaria vaccines: immunity, models and monoclonal antibodies.Trends Parasitol, 24(9):392–395, Sep 2008. doi: 10.1016/j.pt.2008.05.007. URL http://dx.doi.org/10.1016/j.pt.2008.05.007.
[214] T. Ideker, V. Thorsson, J. A. Ranish, R. Christmas, J. Buhler, J. K. Eng, R. Bumgarner,D. R. Goodlett, R. Aebersold, and L. Hood. Integrated genomic and proteomic analyses ofa systematically perturbed metabolic network. Science, 292(5518):929–934, May 2001. doi:10.1126/science.292.5518.929. URL http://dx.doi.org/10.1126/science.292.5518.929.
[215] Nobuyoshi Ishii, Tomoyoshi Soga, Takaaki Nishioka, and Masaru Tomita. Metabolomeanalysis and metabolic simulation. Metabolomics, 1(1):29–37, March 2005. doi: 10.1007/s11306-005-1105-5. URL http://dx.doi.org/10.1007/s11306-005-1105-5.
[216] N. Jamshidi, J. S. Edwards, T. Fahland, G. M. Church, and B. O. Palsson. Dynamic simulationof the human red blood cell metabolic network. Bioinformatics, 17(3):286–287, Mar 2001.
[217] Neema Jamshidi and Bernhard Palsson. Systems biology of the human red blood cell. BloodCells Mol Dis, 36(2):239–247, 2006. doi: 10.1016/j.bcmd.2006.01.006. URL http://dx.doi.org/10.1016/j.bcmd.2006.01.006.
[218] Neema Jamshidi and Bernhard Palsson. Investigating the metabolic capabilities of my-cobacterium tuberculosis h37rv using the in silico strain inj661 and proposing alternativedrug targets. BMC Syst Biol, 1:26, 2007. doi: 10.1186/1752-0509-1-26. URL http://dx.doi.org/10.1186/1752-0509-1-26.
[219] Neema Jamshidi and Bernhard Palsson. Formulating genome-scale kinetic models in the post-genome era. Mol Syst Biol, 4:171, 2008. doi: 10.1038/msb.2008.8. URL http://dx.doi.org/10.1038/msb.2008.8.
[220] Snehasis Jana and Jyoti Paliwal. Novel molecular targets for antimalarial chemotherapy.Int J Antimicrob Agents, 30(1):4–10, Jul 2007. doi: 10.1016/j.ijantimicag.2007.01.002. URLhttp://dx.doi.org/10.1016/j.ijantimicag.2007.01.002.
129

BIBLIOGRAPHY
[221] Matthew D Jankowski, Christopher S Henry, Linda J Broadbelt, and Vassily Hatzimanikatis.Group contribution method for thermodynamic analysis of complex metabolic networks.Biophys J, 95(3):1487–1499, Aug 2008. doi: 10.1529/biophysj.107.124784. URL http://dx.doi.org/10.1529/biophysj.107.124784.
[222] M. L. Jennings and M. F. Adame. Characterization of oxalate transport by the human ery-throcyte band 3 protein. J Gen Physiol, 107(1):145–159, Jan 1996.
[223] Travis J Jewett and L. David Sibley. Aldolase forms a bridge between cell surface adhesinsand the actin cytoskeleton in apicomplexan parasites. Mol Cell, 11(4):885–894, Apr 2003.
[224] Jia Jia, Feng Zhu, Xiaohua Ma, Zhiwei W Cao, Yixue X Li, and Yu Zong Chen. Mechanisms ofdrug combinations: interaction and network perspectives. Nat Rev Drug Discov, 8(2):111–128,Feb 2009. doi: 10.1038/nrd2683. URL http://dx.doi.org/10.1038/nrd2683.
[225] L. Jiang, P. C. Lee, J. White, and P. K. Rathod. Potent and selective activity of a combinationof thymidine and 1843u89, a folate-based thymidylate synthase inhibitor, against plasmodiumfalciparum. Antimicrob Agents Chemother, 44(4):1047–1050, Apr 2000.
[226] Zhenran Jiang and Yanhong Zhou. Using gene networks to drug target identification. Journalof Integrative Bioinformatics, 2005.
[227] Zhenran Jiang and Yanhong Zhou. Using bioinformatics for drug target identification fromthe genome. Am J Pharmacogenomics, 5(6):387–396, 2005.
[228] Thierry Joët, Lennart Holterman, Timothy T Stedman, Clemens H M Kocken, AnnemarieVan Der Wel, Alan W Thomas, and Sanjeev Krishna. Comparative characterization of hexosetransporters of plasmodium knowlesi, plasmodium yoelii and toxoplasma gondii highlightsfunctional differences within the apicomplexan family. Biochem J, 368(Pt 3):923–929, Dec2002. doi: 10.1042/BJ20021189. URL http://dx.doi.org/10.1042/BJ20021189.
[229] Thierry Joet, Ursula Eckstein-Ludwig, Christophe Morin, and Sanjeev Krishna. Validation ofthe hexose transporter of plasmodium falciparum as a novel drug target. Proc Natl Acad SciU S A, 100(13):7476–7479, Jun 2003. doi: 10.1073/pnas.1330865100. URL http://dx.doi.org/10.1073/pnas.1330865100.
[230] H. Jomaa, J. Wiesner, S. Sanderbrand, B. Altincicek, C. Weidemeyer, M. Hintz, I. Türba-chova, M. Eberl, J. Zeidler, H. K. Lichtenthaler, D. Soldati, and E. Beck. Inhibitors of thenonmevalonate pathway of isoprenoid biosynthesis as antimalarial drugs. Science, 285(5433):1573–1576, Sep 1999.
[231] A. Joshi and B. O. Palsson. Metabolic dynamics in the human red cell. part i–a comprehensivekinetic model. J Theor Biol, 141(4):515–528, Dec 1989.
[232] Deirdre A Joy, Xiaorong Feng, Jianbing Mu, Tetsuya Furuya, Kesinee Chotivanich, Anto-niana U Krettli, May Ho, Alex Wang, Nicholas J White, Edward Suh, Peter Beerli, andXin zhuan Su. Early origin and recent expansion of plasmodium falciparum. Science, 300(5617):318–321, Apr 2003. doi: 10.1126/science.1081449. URL http://dx.doi.org/10.1126/science.1081449.
[233] Andrew R Joyce and Bernhard Palsson. Predicting gene essentiality using genome-scale insilico models. Methods Mol Biol, 416:433–457, 2008. doi: 10.1007/978-1-59745-321-9\_30.URL http://dx.doi.org/10.1007/978-1-59745-321-9_30.
130
BIBLIOGRAPHY
[234] Md Mohiuddin Kabir and Kazuyuki Shimizu. Gene expression patterns for metabolic pathwayin pgi knockout escherichia coli with and without phb genes based on rt-pcr. J Biotechnol, 105(1-2):11–31, Oct 2003.
[235] H. Kacser and J. A. Burns. The control of flux. Symp Soc Exp Biol, 27:65–104, 1973.
[236] A. Kaiser, D. Ulmer, T. Goebel, U. Holzgrabe, M. Saeftel, and A. Hoerauf. Inhibition ofhypusine biosynthesis in plasmodium: a possible, new strategy in prevention and therapy ofmalaria. Mini Rev Med Chem, 6(11):1231–1241, Nov 2006.
[237] J. Kanaani and H. Ginsburg. Metabolic interconnection between the human malarial parasiteplasmodium falciparum and its host erythrocyte. regulation of atp levels by means of anadenylate translocator and adenylate kinase. J Biol Chem, 264(6):3194–3199, Feb 1989.
[238] J. Kanaani and H. Ginsburg. Effects of cinnamic acid derivatives on in vitro growth of plas-modium falciparum and on the permeability of the membrane of malaria-infected erythrocytes.Antimicrob Agents Chemother, 36(5):1102–1108, May 1992.
[239] M. Kanehisa and S. Goto. Kegg: kyoto encyclopedia of genes and genomes. Nucleic AcidsRes, 28(1):27–30, Jan 2000.
[240] Minoru Kanehisa, Susumu Goto, Masahiro Hattori, Kiyoko F Aoki-Kinoshita, Masumi Itoh,Shuichi Kawashima, Toshiaki Katayama, Michihiro Araki, and Mika Hirakawa. From genomicsto chemical genomics: new developments in kegg. Nucleic Acids Res, 34(Database issue):D354–D357, Jan 2006. doi: 10.1093/nar/gkj102. URL http://dx.doi.org/10.1093/nar/gkj102.
[241] Minoru Kanehisa, Michihiro Araki, Susumu Goto, Masahiro Hattori, Mika Hirakawa, Ma-sumi Itoh, Toshiaki Katayama, Shuichi Kawashima, Shujiro Okuda, Toshiaki Tokimatsu,and Yoshihiro Yamanishi. Kegg for linking genomes to life and the environment. Nu-cleic Acids Res, 36(Database issue):D480–D484, Jan 2008. doi: 10.1093/nar/gkm882. URLhttp://dx.doi.org/10.1093/nar/gkm882.
[242] Minoru Kanehisa, Susumu Goto, Miho Furumichi, Mao Tanabe, and Mika Hirakawa. Keggfor representation and analysis of molecular networks involving diseases and drugs. NucleicAcids Res, 38(Database issue):D355–360, Oct 2009. doi: 10.1093/nar/gkp896. URL http://dx.doi.org/10.1093/nar/gkp896.
[243] Stefan H I Kappe, Carlos A Buscaglia, and Victor Nussenzweig. Plasmodium sporozoite molec-ular cell biology. Annu Rev Cell Dev Biol, 20:29–59, 2004. doi: 10.1146/annurev.cellbio.20.011603.150935. URL http://dx.doi.org/10.1146/annurev.cellbio.20.011603.150935.
[244] Peter D Karp, Christos A Ouzounis, Caroline Moore-Kochlacs, Leon Goldovsky, Pallavi Kaipa,Dag Ahrén, Sophia Tsoka, Nikos Darzentas, Victor Kunin, and Núria López-Bigas. Expansionof the biocyc collection of pathway/genome databases to 160 genomes. Nucleic Acids Res,33(19):6083–6089, 2005. doi: 10.1093/nar/gki892. URL http://dx.doi.org/10.1093/nar/gki892.
[245] Lev M Kats, Casilda G Black, Nicholas I Proellocks, and Ross L Coppel. Plasmodium rhoptries:how things went pear-shaped. Trends Parasitol, 22(6):269–276, Jun 2006. doi: 10.1016/j.pt.2006.04.001. URL http://dx.doi.org/10.1016/j.pt.2006.04.001.
[246] Douglas B Kell. Systems biology, metabolic modelling and metabolomics in drug discoveryand development. Drug Discov Today, 11(23-24):1085–1092, Dec 2006. doi: 10.1016/j.drudis.2006.10.004. URL http://dx.doi.org/10.1016/j.drudis.2006.10.004.
131
BIBLIOGRAPHY
[247] D. Keppler, I. Leier, and G. Jedlitschky. Transport of glutathione conjugates and glucuronidesby the multidrug resistance proteins mrp1 and mrp2. Biol Chem, 378(8):787–791, Aug 1997.
[248] Gregory A Kicska, Peter C Tyler, Gary B Evans, Richard H Furneaux, Vern L Schramm, andKami Kim. Purine-less death in plasmodium falciparum induced by immucillin-h, a transitionstate analogue of purine nucleoside phosphorylase. J Biol Chem, 277(5):3226–3231, Feb 2002.doi: 10.1074/jbc.M105906200. URL http://dx.doi.org/10.1074/jbc.M105906200.
[249] Claire Kidgell, Sarah K Volkman, Johanna Daily, Justin O Borevitz, David Plouffe, YingyaoZhou, Jeffrey R Johnson, Karine Le Roch, Ousmane Sarr, Omar Ndir, Soulyemane Mboup,Serge Batalov, Dyann F Wirth, and Elizabeth A Winzeler. A systematic map of geneticvariation in plasmodium falciparum. PLoS Pathog, 2(6):e57, Jun 2006. doi: 10.1371/journal.ppat.0020057. URL http://dx.doi.org/10.1371/journal.ppat.0020057.
[250] A. Kilejian. A unique histidine-rich polypeptide from the malaria parasite, plasmodium lo-phurae. J Biol Chem, 249(14):4650–4655, Jul 1974.
[251] Kiaran Kirk and Kevin J Saliba. Targeting nutrient uptake mechanisms in plasmodium. CurrDrug Targets, 8(1):75–88, Jan 2007.
[252] Kiaran Kirk, Susan M Howitt, Stefan Bröer, Kevin J Saliba, and Megan J Downie. Purineuptake in plasmodium: transport versus metabolism. Trends Parasitol, 25(6):246–249, Jun2009. doi: 10.1016/j.pt.2009.03.006. URL http://dx.doi.org/10.1016/j.pt.2009.03.006.
[253] Y. Kitade, A. Kozaki, T. Gotoh, T. Miwa, M. Nakanishi, and C. Yatome. Synthesis of s-adenosyl-l-homocysteine hydrolase inhibitors and their biological activities. Nucleic AcidsSymp Ser, 42:25–26, 1999.
[254] Kjeld Raunkjær Kjeldsen and Jens Nielsen. In silico genome-scale reconstruction and validationof the corynebacterium glutamicum metabolic network. Biotechnol Bioeng, Jul 2008. doi:10.1002/bit.22067. URL http://dx.doi.org/10.1002/bit.22067.
[255] Steffen Klamt. Generalized concept of minimal cut sets in biochemical networks. Biosystems,83(2-3):233–247, 2006. doi: 10.1016/j.biosystems.2005.04.009. URL http://dx.doi.org/10.1016/j.biosystems.2005.04.009.
[256] Steffen Klamt and Ernst Dieter Gilles. Minimal cut sets in biochemical reaction networks.Bioinformatics, 20(2):226–234, Jan 2004.
[257] A. M. Kleinfeld, S. Storms, and M. Watts. Transport of long-chain native fatty acids acrosshuman erythrocyte ghost membranes. Biochemistry, 37(22):8011–8019, Jun 1998. doi: 10.1021/bi980301+. URL http://dx.doi.org/10.1021/bi980301+.
[258] Michael Klemba, Ilya Gluzman, and Daniel E Goldberg. A plasmodium falciparum dipeptidylaminopeptidase i participates in vacuolar hemoglobin degradation. J Biol Chem, 279(41):43000–43007, Oct 2004. doi: 10.1074/jbc.M408123200. URL http://dx.doi.org/10.1074/jbc.M408123200.
[259] Marie Knockaert, Paul Greengard, and Laurent Meijer. Pharmacological inhibitors of cyclin-dependent kinases. Trends Pharmacol Sci, 23(9):417–425, Sep 2002.
[260] Z. Kopczyński, J. Chmiel, and R. Czarnecki. Investigations on riboflavin penetration acrosserythrocyte cell membrane in healthy subjects and patients with chronic renal failure. ActaPhysiol Pol, 31(2):209–215, 1980.
132
BIBLIOGRAPHY
[261] Tamás Korcsmáros, Máte Szalay, Csaba Böde, and István Kovás Péter Csermely. How todesign multi-target drugs: Target search options in cellular networks. Expert Opinion on DrugDiscovery, 2:1–10, 2007.
[262] S. Krishna and C. J. Woodrow. Expression of parasite transporters in xenopus oocytes. No-vartis Found Symp, 226:126–39; discussion 139–44, 1999.
[263] Gowdahalli Krishnegowda and D. Channe Gowda. Intraerythrocytic plasmodium falciparumincorporates extraneous fatty acids to its lipids without any structural modification. MolBiochem Parasitol, 132(1):55–58, Nov 2003.
[264] Zita Krnajski, Tim-Wolf Gilberger, Rolf D Walter, Alan F Cowman, and Sylke Müller.Thioredoxin reductase is essential for the survival of plasmodium falciparum erythrocyticstages. J Biol Chem, 277(29):25970–25975, Jul 2002. doi: 10.1074/jbc.M203539200. URLhttp://dx.doi.org/10.1074/jbc.M203539200.
[265] Miriam Krugliak, Jianmin Zhang, and Hagai Ginsburg. Intraerythrocytic plasmodium falci-parum utilizes only a fraction of the amino acids derived from the digestion of host cell cytosolfor the biosynthesis of its proteins. Mol Biochem Parasitol, 119(2):249–256, Feb 2002.
[266] J. Krungkrai, S. R. Krungkrai, and K. Phakanont. Antimalarial activity of orotate analogsthat inhibit dihydroorotase and dihydroorotate dehydrogenase. Biochem Pharmacol, 43(6):1295–1301, Mar 1992.
[267] Jerapan Krungkrai, Rachanok Kanchanarithisak, Sudaratana R Krungkrai, and SunantRochanakij. Mitochondrial nadh dehydrogenase from plasmodium falciparum and plasmod-ium berghei. Exp Parasitol, 100(1):54–61, Jan 2002. doi: 10.1006/expr.2001.4674. URLhttp://dx.doi.org/10.1006/expr.2001.4674.
[268] Sudaratana R Krungkrai, Brian J DelFraino, Jeffrey A Smiley, Phisit Prapunwattana, Toshi-hide Mitamura, Toshihiro Horii, and Jerapan Krungkrai. A novel enzyme complex oforotate phosphoribosyltransferase and orotidine 5’-monophosphate decarboxylase in humanmalaria parasite plasmodium falciparum: physical association, kinetics, and inhibition char-acterization. Biochemistry, 44(5):1643–1652, Feb 2005. doi: 10.1021/bi048439h. URLhttp://dx.doi.org/10.1021/bi048439h.
[269] Rajinder Kumar, Brian Adams, Anja Oldenburg, Alla Musiyenko, and Sailen Barik. Character-isation and expression of a pp1 serine/threonine protein phosphatase (pfpp1) from the malariaparasite, plasmodium falciparum: demonstration of its essential role using rna interference.Malar J, 1:5, Apr 2002.
[270] Vinay Satish Kumar, Madhukar S Dasika, and Costas D Maranas. Optimization basedautomated curation of metabolic reconstructions. BMC Bioinformatics, 8:212, 2007. doi:10.1186/1471-2105-8-212. URL http://dx.doi.org/10.1186/1471-2105-8-212.
[271] Sue Kyes, Zóe Christodoulou, Robert Pinches, Neline Kriek, Paul Horrocks, and Chris New-bold. Plasmodium falciparum var gene expression is developmentally controlled at the level ofrna polymerase ii-mediated transcription initiation. Mol Microbiol, 63(4):1237–1247, Feb 2007.doi: 10.1111/j.1365-2958.2007.05587.x. URL http://dx.doi.org/10.1111/j.1365-2958.2007.05587.x.
[272] Nikos Kyrpides. Genomes online database (gold). http://genomesonline.org/gold_statistics.htm.
133

BIBLIOGRAPHY
[273] Douglas J LaCount, Marissa Vignali, Rakesh Chettier, Amit Phansalkar, Russell Bell, Jay RHesselberth, Lori W Schoenfeld, Irene Ota, Sudhir Sahasrabudhe, Cornelia Kurschner, StanleyFields, and Robert E Hughes. A protein interaction network of the malaria parasite plasmod-ium falciparum. Nature, 438(7064):103–107, Nov 2005. doi: 10.1038/nature04104. URLhttp://dx.doi.org/10.1038/nature04104.
[274] N. Lang-Unnasch and A. D. Murphy. Metabolic changes of the malaria parasite during thetransition from the human to the mosquito host. Annu Rev Microbiol, 52:561–590, 1998. doi:10.1146/annurev.micro.52.1.561. URL http://dx.doi.org/10.1146/annurev.micro.52.1.561.
[275] Edwin Lasonder, Yasushi Ishihama, Jens S Andersen, Adriaan M W Vermunt, Arnab Pain,Robert W Sauerwein, Wijnand M C Eling, Neil Hall, Andrew P Waters, Hendrik G Stunnen-berg, and Matthias Mann. Analysis of the plasmodium falciparum proteome by high-accuracymass spectrometry. Nature, 419(6906):537–542, Oct 2002. doi: 10.1038/nature01111. URLhttp://dx.doi.org/10.1038/nature01111.
[276] Edwin Lasonder, Chris J Janse, Geert-Jan van Gemert, Gunnar R Mair, Adriaan M W Ver-munt, Bruno G Douradinha, Vera van Noort, Martijn A Huynen, Adrian J F Luty, HansKroeze, Shahid M Khan, Robert W Sauerwein, Andrew P Waters, Matthias Mann, and Hen-drik G Stunnenberg. Proteomic profiling of plasmodium sporozoite maturation identifies newproteins essential for parasite development and infectivity. PLoS Pathog, 4(10):e1000195, Oct2008. doi: 10.1371/journal.ppat.1000195. URL http://dx.doi.org/10.1371/journal.ppat.1000195.
[277] Charles Laverdant. [the contemporary scientific context of a. laveran’s discovery]. Bull AcadNatl Med, 191(7):1227–1234, Oct 2007.
[278] D-S. Lee, J. Park, K. A. Kay, N. A. Christakis, Z. N. Oltvai, and A-L. Barabási. The im-plications of human metabolic network topology for disease comorbidity. Proc Natl AcadSci U S A, 105(29):9880–9885, Jul 2008. doi: 10.1073/pnas.0802208105. URL http://dx.doi.org/10.1073/pnas.0802208105.
[279] Deok-Sun Lee, Henry Burd, Jiangxia Liu, Eivind Almaas, Olaf Wiest, Albert-László Barabási,Zoltán N Oltvai, and Vinayak Kapatral. Comparative genome-scale metabolic reconstructionand flux balance analysis of multiple staphylococcus aureus genomes identify novel antimicro-bial drug targets. J Bacteriol, 191(12):4015–4024, Jun 2009. doi: 10.1128/JB.01743-08. URLhttp://dx.doi.org/10.1128/JB.01743-08.
[280] Jong Min Lee, Erwin P Gianchandani, and Jason A Papin. Flux balance analysis in the eraof metabolomics. Brief Bioinform, 7(2):140–150, Jun 2006. doi: 10.1093/bib/bbl007. URLhttp://dx.doi.org/10.1093/bib/bbl007.
[281] Kwang Ho Lee, Jin Hwan Park, Tae Yong Kim, Hyun Uk Kim, and Sang Yup Lee. Systemsmetabolic engineering of escherichia coli for l-threonine production. Mol Syst Biol, 3:149, 2007.doi: 10.1038/msb4100196. URL http://dx.doi.org/10.1038/msb4100196.
[282] Adele M Lehane, Kevin J Saliba, Richard J W Allen, and Kiaran Kirk. Choline uptake into themalaria parasite is energized by the membrane potential. Biochem Biophys Res Commun, 320(2):311–317, Jul 2004. doi: 10.1016/j.bbrc.2004.05.164. URL http://dx.doi.org/10.1016/j.bbrc.2004.05.164.
[283] G. Lenz. The rna interference revolution. Braz J Med Biol Res, 38(12):1749–1757, Dec 2005.doi: /S0100-879X2005001200003. URL http://dx.doi.org//S0100-879X2005001200003.
134

BIBLIOGRAPHY
[284] Virgilio L Lew, Teresa Tiffert, and Hagai Ginsburg. Excess hemoglobin digestion and theosmotic stability of plasmodium falciparum-infected red blood cells. Blood, 101(10):4189–4194, May 2003. doi: 10.1182/blood-2002-08-2654. URL http://dx.doi.org/10.1182/blood-2002-08-2654.
[285] C. M. Li, P. C. Tyler, R. H. Furneaux, G. Kicska, Y. Xu, C. Grubmeyer, M. E. Girvin, and V. L.Schramm. Transition-state analogs as inhibitors of human and malarial hypoxanthine-guaninephosphoribosyltransferases. Nat Struct Biol, 6(6):582–587, Jun 1999. doi: 10.1038/9367. URLhttp://dx.doi.org/10.1038/9367.
[286] Chunquan Li, Xia Li, Yingbo Miao, Qianghu Wang, Wei Jiang, Chun Xu, Jing Li, Junwei Han,Fan Zhang, Binsheng Gong, and Liangde Xu. Subpathwayminer: a software package for flexibleidentification of pathways. Nucleic Acids Res, 37(19):e131, Oct 2009. doi: 10.1093/nar/gkp667.URL http://dx.doi.org/10.1093/nar/gkp667.
[287] Jia V Li, Yulan Wang, Jasmina Saric, Jeremy K Nicholson, Stephan Dirnhofer, Burton HSinger, Marcel Tanner, Sergio Wittlin, Elaine Holmes, and Jürg Utzinger. Global metabolicresponses of nmri mice to an experimental plasmodium berghei infection. J Proteome Res,7(9):3948–3956, Sep 2008. doi: 10.1021/pr800209d. URL http://dx.doi.org/10.1021/pr800209d.
[288] Eva Liebau, Bärbel Bergmann, Alison M Campbell, Paul Teesdale-Spittle, Peter M Brophy,Kai Lüersen, and Rolf D Walter. The glutathione s-transferase from plasmodium falciparum.Mol Biochem Parasitol, 124(1-2):85–90, 2002.
[289] Jun Liu, Eva S Istvan, Ilya Y Gluzman, Julia Gross, and Daniel E Goldberg. Plasmodiumfalciparum ensures its amino acid supply with multiple acquisition pathways and redundantproteolytic enzyme systems. Proc Natl Acad Sci U S A, 103(23):8840–8845, Jun 2006. doi:10.1073/pnas.0601876103. URL http://dx.doi.org/10.1073/pnas.0601876103.
[290] Carlos López-Estraño, Anusha M Gopalakrishnan, Jean-Philippe Semblat, M. Ross Fergus,Dominique Mazier, and Kasturi Haldar. An enhancer-like region regulates hrp3 promoterstage-specific gene expression in the human malaria parasite plasmodium falciparum. BiochimBiophys Acta, 1769(7-8):506–513, 2007. doi: 10.1016/j.bbaexp.2007.04.009. URL http://dx.doi.org/10.1016/j.bbaexp.2007.04.009.
[291] Carlos López-Estraño, Jean-Philippe Semblat, Anusha M Gopalakrishnan, Leah Turner, Do-minique Mazier, and Kasturi Haldar. Plasmodium falciparum: hrp3 promoter region is asso-ciated with stage-specificity and episomal recombination. Exp Parasitol, 116(3):327–333, Jul2007. doi: 10.1016/j.exppara.2007.01.020. URL http://dx.doi.org/10.1016/j.exppara.2007.01.020.
[292] P. Loria, S. Miller, M. Foley, and L. Tilley. Inhibition of the peroxidative degradation of haemas the basis of action of chloroquine and other quinoline antimalarials. Biochem J, 339 ( Pt2):363–370, Apr 1999.
[293] Jeff Zhiqiang Lu, Patricia J Lee, Norman C Waters, and Sean T Prigge. Fatty acid synthesisas a target for antimalarial drug discovery. Comb Chem High Throughput Screen, 8(1):15–26,Feb 2005.
[294] Carsten G K Lüder, Rebecca R Stanway, Marie Chaussepied, Gordon Langsley, and Volker THeussler. Intracellular survival of apicomplexan parasites and host cell modification. Int JParasitol, Oct 2008. doi: 10.1016/j.ijpara.2008.09.013. URL http://dx.doi.org/10.1016/j.ijpara.2008.09.013.
135

BIBLIOGRAPHY
[295] K. Lüersen, R. D. Walter, and S. Müller. Plasmodium falciparum-infected red blood cellsdepend on a functional glutathione de novo synthesis attributable to an enhanced loss ofglutathione. Biochem J, 346 Pt 2:545–552, Mar 2000.
[296] S. D. Lytton, B. Mester, J. Libman, A. Shanzer, and Z. I. Cabantchik. Mode of action of iron(iii) chelators as antimalarials: Ii. evidence for differential effects on parasite iron-dependentnucleic acid synthesis. Blood, 84(3):910–915, Aug 1994.
[297] Hongwu Ma and Igor Goryanin. Human metabolic network reconstruction and its impacton drug discovery and development. Drug Discov Today, 13(9-10):402–408, May 2008. doi:10.1016/j.drudis.2008.02.002. URL http://dx.doi.org/10.1016/j.drudis.2008.02.002.
[298] Hongwu Ma, Anatoly Sorokin, Alexander Mazein, Alex Selkov, Evgeni Selkov, Oleg Demin,and Igor Goryanin. The edinburgh human metabolic network reconstruction and its functionalanalysis. Mol Syst Biol, 3:135, 2007. doi: 10.1038/msb4100177. URL http://dx.doi.org/10.1038/msb4100177.
[299] Claire L Mackintosh, James G Beeson, and Kevin Marsh. Clinical features and pathogenesisof severe malaria. Trends Parasitol, 20(12):597–603, Dec 2004. doi: 10.1016/j.pt.2004.09.006.URL http://dx.doi.org/10.1016/j.pt.2004.09.006.
[300] R. Mahadevan and C. H. Schilling. The effects of alternate optimal solutions in constraint-based genome-scale metabolic models. Metab Eng, 5(4):264–276, Oct 2003.
[301] Brendan Maher. Malaria: the end of the beginning. Nature, 451(7182):1042–1046, Feb 2008.doi: 10.1038/4511042a. URL http://dx.doi.org/10.1038/4511042a.
[302] Nassira Mahmoudi, Ramon Garcia-Domenech, Jorge Galvez, Khemais Farhati, Jean-FrançoisFranetich, Robert Sauerwein, Laurent Hannoun, Francis Derouin, Martin Danis, and Do-minique Mazier. New active drugs against liver stages of plasmodium predicted by molecu-lar topology. Antimicrob Agents Chemother, Jan 2008. doi: 10.1128/AAC.01043-07. URLhttp://dx.doi.org/10.1128/AAC.01043-07.
[303] Antonello Mai, Ilaria Cerbara, Sergio Valente, Silvio Massa, Larry A Walker, and Babu LTekwani. Antimalarial and antileishmanial activities of aroyl-pyrrolyl-hydroxyamides, a newclass of histone deacetylase inhibitors. Antimicrob Agents Chemother, 48(4):1435–1436, Apr2004.
[304] Pawan Malhotra, Palakodeti V N Dasaradhi, Amit Kumar, Asif Mohmmed, Neema Agrawal,Raj K Bhatnagar, and Virander S Chauhan. Double-stranded rna-mediated gene silencingof cysteine proteases (falcipain-1 and -2) of plasmodium falciparum. Mol Microbiol, 45(5):1245–1254, Sep 2002.
[305] Joseph Marr. Molecular Medical Parasitology (electron transport). Academic Pr Inc, 2002.
[306] Rowena E Martin, Hagai Ginsburg, and Kiaran Kirk. Membrane transport proteins of themalaria parasite. Mol Microbiol, 74(3):519–528, Oct 2009. doi: 10.1111/j.1365-2958.2009.06863.x. URL http://dx.doi.org/10.1111/j.1365-2958.2009.06863.x.
[307] Jan Martinussen, Steen L L Wadskov-Hansen, and Karin Hammer. Two nucleoside uptakesystems in lactococcus lactis: competition between purine nucleosides and cytidine allows formodulation of intracellular nucleotide pools. J Bacteriol, 185(5):1503–1508, Mar 2003.
136
BIBLIOGRAPHY
[308] Kristen M Massimine, Michael T McIntosh, Lanxuan T Doan, Chloé E Atreya, StephanGromer, Worachart Sirawaraporn, David A Elliott, Keith A Joiner, R. Heiner Schirmer, andKaren S Anderson. Eosin b as a novel antimalarial agent for drug-resistant plasmodiumfalciparum. Antimicrob Agents Chemother, 50(9):3132–3141, Sep 2006. doi: 10.1128/AAC.00621-06. URL http://dx.doi.org/10.1128/AAC.00621-06.
[309] Lisa Matthews, Gopal Gopinath, Marc Gillespie, Michael Caudy, David Croft, Bernardde Bono, Phani Garapati, Jill Hemish, Henning Hermjakob, Bijay Jassal, Alex Kanapin,Suzanna Lewis, Shahana Mahajan, Bruce May, Esther Schmidt, Imre Vastrik, GuanmingWu, Ewan Birney, Lincoln Stein, and Peter D’Eustachio. Reactome knowledgebase of humanbiological pathways and processes. Nucleic Acids Res, 37(Database issue):D619–D622, Jan2009. doi: 10.1093/nar/gkn863. URL http://dx.doi.org/10.1093/nar/gkn863.
[310] K. Matuschewski. Hitting malaria before it hurts: attenuated plasmodium liver stages. CellMol Life Sci, 64(23):3007–3011, Dec 2007. doi: 10.1007/s00018-007-7263-z. URL http://dx.doi.org/10.1007/s00018-007-7263-z.
[311] M. L. Mavrovouniotis. Group contributions for estimating standard gibbs energies of formationof biochemical compounds in aqueous solution. Biotechnol Bioeng, 38(7):803–804, Oct 1991.doi: 10.1002/bit.260380716. URL http://dx.doi.org/10.1002/bit.260380716.
[312] M. L. Mavrovouniotis. Estimation of standard gibbs energy changes of biotransformations. JBiol Chem, 266(22):14440–14445, Aug 1991.
[313] G. A. McConkey. Targeting the shikimate pathway in the malaria parasite plasmodium falci-parum. Antimicrob Agents Chemother, 43(1):175–177, Jan 1999.
[314] G. A. McConkey. Plasmodium falciparum: isolation and characterisation of a gene encodingprotozoan gmp synthase. Exp Parasitol, 94(1):23–32, Jan 2000. doi: 10.1006/expr.1999.4467.URL http://dx.doi.org/10.1006/expr.1999.4467.
[315] Glenn A McConkey, John W Pinney, David R Westhead, Kirsten Plueckhahn, Teresa B Fitz-patrick, Peter Macheroux, and Barbara Kappes. Annotating the plasmodium genome and theenigma of the shikimate pathway. Trends Parasitol, 20(2):60–65, Feb 2004.
[316] J. L. McCullough and T. H. Maren. Dihydropteroate synthetase from plasmodium berghei:isolation, properties, and inhibition by dapsone and sulfadiazine. Mol Pharmacol, 10(1):140–145, Jan 1974.
[317] R. McLeod, S. P. Muench, J. B. Rafferty, D. E. Kyle, E. J. Mui, M. J. Kirisits, D. G. Mack,C. W. Roberts, B. U. Samuel, R. E. Lyons, M. Dorris, W. K. Milhous, and D. W. Rice.Triclosan inhibits the growth of plasmodium falciparum and toxoplasma gondii by inhibitionof apicomplexan fab i. Int J Parasitol, 31(2):109–113, Feb 2001.
[318] Louisa McRobert and Glenn A McConkey. Rna interference (rnai) inhibits growth of plas-modium falciparum. Mol Biochem Parasitol, 119(2):273–278, Feb 2002.
[319] Louisa McRobert, Shende Jiang, Andrew Stead, and Glenn A McConkey. Plasmodium fal-ciparum: interaction of shikimate analogues with antimalarial drugs. Exp Parasitol, 111(3):178–181, Nov 2005. doi: 10.1016/j.exppara.2005.07.002. URL http://dx.doi.org/10.1016/j.exppara.2005.07.002.
[320] Adam L Meadows, Rahi Karnik, Harry Lam, Sean Forestell, and Brad Snedecor. Applicationof dynamic flux balance analysis to an industrial escherichia coli fermentation. Metab Eng, 12:150–160, Jul 2009. doi: 10.1016/j.ymben.2009.07.006. URL http://dx.doi.org/10.1016/j.ymben.2009.07.006.
137
BIBLIOGRAPHY
[321] Rajeev Mehlotra, Cara Henry-Halldin, and Petter Zimmerman. Application of pharmacoge-nomics to malaria: a holistic approach for successful chemotherapy. Pharmacogenomics, 2009.
[322] Monika Mehta, Haripalsingh M Sonawat, and Shobhona Sharma. Glycolysis in plasmodiumfalciparum results in modulation of host enzyme activities. J Vector Borne Dis, 43(3):95–103,Sep 2006.
[323] Svenja Meierjohann, Rolf D Walter, and Sylke Müller. Regulation of intracellular glutathionelevels in erythrocytes infected with chloroquine-sensitive and chloroquine-resistant plasmodiumfalciparum. Biochem J, 368(Pt 3):761–768, Dec 2002. doi: 10.1042/BJ20020962. URL http://dx.doi.org/10.1042/BJ20020962.
[324] Craig C Mello and Darryl Conte. Revealing the world of rna interference. Nature, 431(7006):338–342, Sep 2004. doi: 10.1038/nature02872. URL http://dx.doi.org/10.1038/nature02872.
[325] Robert Ménard, Volker Heussler, Masao Yuda, and Victor Nussenzweig. Plasmodium pre-erythrocytic stages: what’s new? Trends Parasitol, 24(12):564–569, Dec 2008. doi: 10.1016/j.pt.2008.08.009. URL http://dx.doi.org/10.1016/j.pt.2008.08.009.
[326] E. Messika, J. Golenser, L. Abu-Elheiga, M. Robert-Gero, E. Lederer, and U. Bachrach. Effectof sinefungin on macromolecular biosynthesis and cell cycle of plasmodium falciparum. TropMed Parasitol, 41(3):273–278, Sep 1990.
[327] M. E. Meza-Avina, L. Wei, M. G. Buhendwa, E. Poduch, A. M. Bello, E. F. Pai, and L. P.Kotra. Inhibition of orotidine 5’-monophosphate decarboxylase and its therapeutic potential.Mini Rev Med Chem, 8(3):239–247, Mar 2008.
[328] V. Micheli, H. A. Simmonds, S. Sestini, and C. Ricci. Importance of nicotinamide as an nadprecursor in the human erythrocyte. Arch Biochem Biophys, 283(1):40–45, Nov 1990.
[329] Sebastian A Mikolajczak and Stefan H Kappe. A clash to conquer: the malaria parasite liverinfection. Mol Microbiol, 62(6):1499–1506, Dec 2006. doi: 10.1111/j.1365-2958.2006.05470.x.URL http://dx.doi.org/10.1111/j.1365-2958.2006.05470.x.
[330] Sebastian A Mikolajczak, Ahmed S I Aly, and Stefan H I Kappe. Preerythrocytic malariavaccine development. Curr Opin Infect Dis, 20(5):461–466, Oct 2007. doi: 10.1097/QCO.0b013e3282ef6172. URL http://dx.doi.org/10.1097/QCO.0b013e3282ef6172.
[331] Susanne K Miller, Robert T Good, Damien R Drew, Mauro Delorenzi, Paul R Sanders, An-thony N Hodder, Terence P Speed, Alan F Cowman, Tania F de Koning-Ward, and Brendan SCrabb. A subset of plasmodium falciparum sera genes are expressed and appear to play animportant role in the erythrocytic cycle. J Biol Chem, 277(49):47524–47532, Dec 2002. doi:10.1074/jbc.M206974200. URL http://dx.doi.org/10.1074/jbc.M206974200.
[332] Alka Mital. Recent advances in antimalarial compounds and their patents. Curr Med Chem,14(7):759–773, 2007.
[333] Toshihide Mitamura and Nirianne Marie Q Palacpac. Lipid metabolism in plasmodiumfalciparum-infected erythrocytes: possible new targets for malaria chemotherapy. MicrobesInfect, 5(6):545–552, May 2003.
[334] Bernhard Mlecnik, Marcel Scheideler, Hubert Hackl, Jürgen Hartler, Fatima Sanchez-Cabo,and Zlatko Trajanoski. Pathwayexplorer: web service for visualizing high-throughput expres-sion data on biological pathways. Nucleic Acids Res, 33(Web Server issue):W633–W637, Jul2005. doi: 10.1093/nar/gki391. URL http://dx.doi.org/10.1093/nar/gki391.
138
BIBLIOGRAPHY
[335] Monica L Mo and Bernhard Ø Palsson. Understanding human metabolic physiology: a genome-to-systems approach. Trends Biotechnol, Nov 2008. doi: 10.1016/j.tibtech.2008.09.007. URLhttp://dx.doi.org/10.1016/j.tibtech.2008.09.007.
[336] Monica L Mo, Neema Jamshidi, and Bernhard Ø Palsson. A genome-scale, constraint-basedapproach to systems biology of human metabolism. Mol Biosyst, 3(9):598–603, Sep 2007. doi:10.1039/b705597h. URL http://dx.doi.org/10.1039/b705597h.
[337] Monica L Mo, Bernhard O Palsson, and Markus J Herrgård. Connecting extracellularmetabolomic measurements to intracellular flux states in yeast. BMC Syst Biol, 3:37, 2009.doi: 10.1186/1752-0509-3-37. URL http://dx.doi.org/10.1186/1752-0509-3-37.
[338] José C M Mombach, Ney Lemke, Norma M da Silva, Rejane A Ferreira, Eduardo Isaia,and Cláudia K Barcellos. Bioinformatics analysis of mycoplasma metabolism: important en-zymes, metabolic similarities, and redundancy. Comput Biol Med, 36(5):542–552, May 2006.doi: 10.1016/j.compbiomed.2005.03.004. URL http://dx.doi.org/10.1016/j.compbiomed.2005.03.004.
[339] S. W. Moses, R. Chayoth, S. Levin, E. Lazarovitz, and D. Rubinstein. Glucose and glycogenmetabolism in erythrocytes from normal and glycogen storage disease type iii subjects. J ClinInvest, 47(6):1343–1348, Jun 1968. doi: 10.1172/JCI105826. URL http://dx.doi.org/10.1172/JCI105826.
[340] Maria MMota, Silvia Giordano, and Ana Rodriguez. Targeting plasmodium host cells: survivalwithin hepatocytes. Trends Mol Med, 10(10):487–492, Oct 2004. doi: 10.1016/j.molmed.2004.08.003. URL http://dx.doi.org/10.1016/j.molmed.2004.08.003.
[341] Tobias Mourier, Arnab Pain, Bart Barrell, and Sam Griffiths-Jones. A selenocysteine trna andsecis element in plasmodium falciparum. RNA, 11(2):119–122, Feb 2005. doi: 10.1261/rna.7185605. URL http://dx.doi.org/10.1261/rna.7185605.
[342] David K Muhia, Claire A Swales, Ursula Eckstein-Ludwig, Shweta Saran, Spencer D Polley,John M Kelly, Pauline Schaap, Sanjeev Krishna, and David A Baker. Multiple splice variantsencode a novel adenylyl cyclase of possible plastid origin expressed in the sexual stage of themalaria parasite plasmodium falciparum. J Biol Chem, 278(24):22014–22022, Jun 2003. doi:10.1074/jbc.M301639200. URL http://dx.doi.org/10.1074/jbc.M301639200.
[343] Ingrid B Müller, Fang Wu, Bärbel Bergmann, Julia Knöckel, Rolf D Walter, Heinz Gehring,and Carsten Wrenger. Poisoning pyridoxal 5-phosphate-dependent enzymes: a new strategyto target the malaria parasite plasmodium falciparum. PLoS One, 4(2):e4406, 2009. doi:10.1371/journal.pone.0004406. URL http://dx.doi.org/10.1371/journal.pone.0004406.
[344] Sylke Müller. Redox and antioxidant systems of the malaria parasite plasmodium falciparum.Mol Microbiol, 53(5):1291–1305, Sep 2004. doi: 10.1111/j.1365-2958.2004.04257.x. URL http://dx.doi.org/10.1111/j.1365-2958.2004.04257.x.
[345] Sylke Müller and Barbara Kappes. Vitamin and cofactor biosynthesis pathways in plasmodiumand other apicomplexan parasites. Trends Parasitol, 23(3):112–121, Mar 2007. doi: 10.1016/j.pt.2007.01.009. URL http://dx.doi.org/10.1016/j.pt.2007.01.009.
[346] P. J. Mulquiney and P. W. Kuchel. Model of 2,3-bisphosphoglycerate metabolism in the humanerythrocyte based on detailed enzyme kinetic equations: computer simulation and metaboliccontrol analysis. Biochem J, 342 Pt 3:597–604, Sep 1999.
139

BIBLIOGRAPHY
[347] Mary Julia Mycek, Richard A. Harvey, and Pamela C. Champe. Pharmacology. Mary JuliaMycek, 2000.
[348] Nagar-Legmann. A comparative study of the lipid composition of yeasts with different fer-mentative capacities. Applied Microbiology and Biotechnology, 1987.
[349] R. S. Naik, E. A. Davidson, and D. C. Gowda. Developmental stage-specific biosynthesisof glycosylphosphatidylinositol anchors in intraerythrocytic plasmodium falciparum and itsinhibition in a novel manner by mannosamine. J Biol Chem, 275(32):24506–24511, Aug 2000.doi: 10.1074/jbc.M002151200. URL http://dx.doi.org/10.1074/jbc.M002151200.
[350] Ramachandra S Naik, Gowdahalli Krishnegowda, and D. Channe Gowda. Glucosamine inhibitsinositol acylation of the glycosylphosphatidylinositol anchors in intraerythrocytic plasmodiumfalciparum. J Biol Chem, 278(3):2036–2042, Jan 2003. doi: 10.1074/jbc.M208976200. URLhttp://dx.doi.org/10.1074/jbc.M208976200.
[351] Yoichi Nakayama, Ayako Kinoshita, and Masaru Tomita. Dynamic simulation of red bloodcell metabolism and its application to the analysis of a pathological condition. Theor BiolMed Model, 2:18, 2005. doi: 10.1186/1742-4682-2-18. URL http://dx.doi.org/10.1186/1742-4682-2-18.
[352] M. F. Nankya-Kitaka, G. P. Curley, C. S. Gavigan, A. Bell, and J. P. Dalton. Plasmodiumchabaudi chabaudi and p. falciparum: inhibition of aminopeptidase and parasite growth bybestatin and nitrobestatin. Parasitol Res, 84(7):552–558, Jul 1998.
[353] Murad Nayal and Barry Honig. On the nature of cavities on protein surfaces: application tothe identification of drug-binding sites. Proteins, 63(4):892–906, Jun 2006. doi: 10.1002/prot.20897. URL http://dx.doi.org/10.1002/prot.20897.
[354] Eunice Nduati, Sonya Hunt, Eddy M Kamau, and Alexis Nzila. 2,4-diaminopteridine-basedcompounds as precursors for de novo synthesis of antifolates: a novel class of antimalarials.Antimicrob Agents Chemother, 49(9):3652–3657, Sep 2005. doi: 10.1128/AAC.49.9.3652-3657.2005. URL http://dx.doi.org/10.1128/AAC.49.9.3652-3657.2005.
[355] Jeremy K Nicholson and John C Lindon. Systems biology: Metabonomics. Nature, 455(7216):1054–1056, Oct 2008. doi: 10.1038/4551054a. URL http://dx.doi.org/10.1038/4551054a.
[356] Wilai Noonpakdee, Jinrapa Pothikasikorn, Wirat Nimitsantiwong, and Prapon Wilairat. In-hibition of plasmodium falciparum proliferation in vitro by antisense oligodeoxynucleotidesagainst malarial topoisomerase ii. Biochem Biophys Res Commun, 302(4):659–664, Mar 2003.
[357] Daniel Nöteberg, Elizabeth Hamelink, Johan Hultén, Mats Wahlgren, Lotta Vrang, BertilSamuelsson, and Anders Hallberg. Design and synthesis of plasmepsin i and plasmepsin iiinhibitors with activity in plasmodium falciparum-infected cultured human erythrocytes. JMed Chem, 46(5):734–746, Feb 2003. doi: 10.1021/jm020951i. URL http://dx.doi.org/10.1021/jm020951i.
[358] Solomon Nwaka and Robert G Ridley. Virtual drug discovery and development for neglecteddiseases through public-private partnerships. Nat Rev Drug Discov, 2(11):919–928, Nov 2003.doi: 10.1038/nrd1230. URL http://dx.doi.org/10.1038/nrd1230.
[359] Matthew A Oberhardt, Jacek Puchalka, Kimberly E Fryer, Vítor A P Martins Dos Santos,and Jason A Papin. Genome-scale metabolic network analysis of the opportunistic pathogenpseudomonas aeruginosa pao1. J Bacteriol, Jan 2008. doi: 10.1128/JB.01583-07. URL http://dx.doi.org/10.1128/JB.01583-07.
140

BIBLIOGRAPHY
[360] Matthew A Oberhardt, Arvind K Chavali, and Jason A Papin. Flux balance analysis: in-terrogating genome-scale metabolic networks. Methods Mol Biol, 500:61–80, 2009. doi:10.1007/978-1-59745-525-1\_3. URL http://dx.doi.org/10.1007/978-1-59745-525-1_3.
[361] Matthew A Oberhardt, Bernhard Palsson, and Jason A Papin. Applications of genome-scalemetabolic reconstructions. Mol Syst Biol, 5:320, 2009. doi: 10.1038/msb.2009.77. URL http://dx.doi.org/10.1038/msb.2009.77.
[362] U.S. Department of Agriculture. Agricultural research service (ars).http://www.ars.usda.gov/is/graphics/photos/aug00/k4705-9.htm.
[363] R. Ogwan’g, J. Mwangi, G. Gachihi, A. Nwachukwu, C. R. Roberts, and S. K. Martin. Use ofpharmacological agents to implicate a role for phosphoinositide hydrolysis products in malariagamete formation. Biochem Pharmacol, 46(9):1601–1606, Nov 1993.
[364] Mina Oh, Takuji Yamada, Masahiro Hattori, Susumu Goto, and Minoru Kanehisa. Systematicanalysis of enzyme-catalyzed reaction patterns and prediction of microbial biodegradationpathways. J Chem Inf Model, 47(4):1702–1712, 2007. doi: 10.1021/ci700006f. URL http://dx.doi.org/10.1021/ci700006f.
[365] You-Kwan Oh, Bernhard O Palsson, Sung M Park, Christophe H Schilling, and Radhakrish-nan Mahadevan. Genome-scale reconstruction of metabolic network in bacillus subtilis basedon high-throughput phenotyping and gene essentiality data. J Biol Chem, 282(39):28791–28799, Sep 2007. doi: 10.1074/jbc.M703759200. URL http://dx.doi.org/10.1074/jbc.M703759200.
[366] Kellen L Olszewski, Joanne M Morrisey, Daniel Wilinski, James M Burns, Akhil B Vaidya,Joshua D Rabinowitz, and Manuel Llinás. Host-parasite interactions revealed by plasmodiumfalciparum metabolomics. Cell Host Microbe, 5(2):191–199, Feb 2009. doi: 10.1016/j.chom.2009.01.004. URL http://dx.doi.org/10.1016/j.chom.2009.01.004.
[367] Takeshi Ono, Laura Cabrita-Santos, Ricardo Leitao, Esther Bettiol, Lisa A Purcell, Olga Diaz-Pulido, Lucy B Andrews, Takushi Tadakuma, Purnima Bhanot, Maria M Mota, and AnaRodriguez. Adenylyl cyclase alpha and camp signaling mediate plasmodium sporozoite apicalregulated exocytosis and hepatocyte infection. PLoS Pathog, 4(2):e1000008, Feb 2008. doi:10.1371/journal.ppat.1000008. URL http://dx.doi.org/10.1371/journal.ppat.1000008.
[368] World Health Organization. Guidelines for the treatment of malaria.http://www.who.int/malaria/publications/atoz/9241546948/en/index.html, 2006.
[369] Govindarajan Padmanaban, V. Arun Nagaraj, and Pundi N. Rangarajan. Drugs and drugtargets against malaria. CURRENT SCIENCE, 2007.
[370] A. Pain, U. Böhme, A. E. Berry, K. Mungall, R. D. Finn, A. P. Jackson, T. Mourier, J. Mistry,E. M. Pasini, M. A. Aslett, S. Balasubrammaniam, K. Borgwardt, K. Brooks, C. Carret, T. J.Carver, I. Cherevach, T. Chillingworth, T. G. Clark, M. R. Galinski, N. Hall, D. Harper,D. Harris, H. Hauser, A. Ivens, C. S. Janssen, T. Keane, N. Larke, S. Lapp, M. Marti,S. Moule, I. M. Meyer, D. Ormond, N. Peters, M. Sanders, S. Sanders, T. J. Sargeant, M. Sim-monds, F. Smith, R. Squares, S. Thurston, A. R. Tivey, D. Walker, B. White, E. Zuiderwijk,C. Churcher, M. A. Quail, A. F. Cowman, C. M R Turner, M. A. Rajandream, C. H M Kocken,A. W. Thomas, C. I. Newbold, B. G. Barrell, and M. Berriman. The genome of the simianand human malaria parasite plasmodium knowlesi. Nature, 455(7214):799–803, Oct 2008. doi:10.1038/nature07306. URL http://dx.doi.org/10.1038/nature07306.
141

BIBLIOGRAPHY
[371] Heather J Painter, Joanne M Morrisey, Michael W Mather, and Akhil B Vaidya. Specific role ofmitochondrial electron transport in blood-stage plasmodium falciparum. Nature, 446(7131):88–91, Mar 2007. doi: 10.1038/nature05572. URL http://dx.doi.org/10.1038/nature05572.
[372] Suzanne M Paley and Peter D Karp. Evaluation of computational metabolic-pathway predic-tions for helicobacter pylori. Bioinformatics, 18(5):715–724, May 2002.
[373] Bernhard Palsson. Systems Biology: Properties of reconstructed networks. Cambridge Univer-sity Press, 2006.
[374] Ritu Pandey, Raghavendra K Guru, and David W Mount. Pathway miner: extracting geneassociation networks from molecular pathways for predicting the biological significance ofgene expression microarray data. Bioinformatics, 20(13):2156–2158, Sep 2004. doi: 10.1093/bioinformatics/bth215. URL http://dx.doi.org/10.1093/bioinformatics/bth215.
[375] Pankova-Kholmyansky. Potential new antimalarial chemotherapeutics based on spingolipidmetabolism. Chemotherapy, 2006.
[376] Jason A Papin, Tony Hunter, Bernhard O Palsson, and Shankar Subramaniam. Reconstructionof cellular signalling networks and analysis of their properties. Nat Rev Mol Cell Biol, 6(2):99–111, Feb 2005. doi: 10.1038/nrm1570. URL http://dx.doi.org/10.1038/nrm1570.
[377] Balázs Papp, Csaba Pál, and Laurence D Hurst. Metabolic network analysis of the causesand evolution of enzyme dispensability in yeast. Nature, 429(6992):661–664, Jun 2004. doi:10.1038/nature02636. URL http://dx.doi.org/10.1038/nature02636.
[378] M. D. Parker, R. J. Hyde, S. Y. Yao, L. McRobert, C. E. Cass, J. D. Young, G. A. McConkey,and S. A. Baldwin. Identification of a nucleoside/nucleobase transporter from plasmodiumfalciparum, a novel target for anti-malarial chemotherapy. Biochem J, 349(Pt 1):67–75, Jul2000.
[379] Erica M Pasini, Morten Kirkegaard, Peter Mortensen, Hans U Lutz, Alan W Thomas, andMatthias Mann. In-depth analysis of the membrane and cytosolic proteome of red bloodcells. Blood, 108(3):791–801, Aug 2006. doi: 10.1182/blood-2005-11-007799. URL http://dx.doi.org/10.1182/blood-2005-11-007799.
[380] Asha Parbhu Patel, Henry M Staines, and Sanjeev Krishna. New antimalarial targets: theexample of glucose transport. Travel Med Infect Dis, 6(1-2):58–66, 2008. doi: 10.1016/j.tmaid.2008.01.005. URL http://dx.doi.org/10.1016/j.tmaid.2008.01.005.
[381] D. Pe’er, A. Regev, G. Elidan, and N. Friedman. Inferring subnetworks from perturbed ex-pression profiles. Bioinformatics, 17 Suppl 1:S215–S224, 2001.
[382] Mor Peleg, Iwei Yeh, and Russ B Altman. Modelling biological processes using workflow andpetri net models. Bioinformatics, 18(6):825–837, Jun 2002.
[383] Markus Perbandt, Cora Burmeister, Rolf D Walter, Christian Betzel, and Eva Liebau. Na-tive and inhibited structure of a mu class-related glutathione s-transferase from plasmodiumfalciparum. J Biol Chem, 279(2):1336–1342, Jan 2004. doi: 10.1074/jbc.M309663200. URLhttp://dx.doi.org/10.1074/jbc.M309663200.
[384] D. K. Perry and Y. A. Hannun. The role of ceramide in cell signaling. Biochim Biophys Acta,1436(1-2):233–243, Dec 1998.
142

BIBLIOGRAPHY
[385] Gabriella Pessi, Guillermo Kociubinski, and Choukri Ben Mamoun. A pathway for phos-phatidylcholine biosynthesis in plasmodium falciparum involving phosphoethanolamine methy-lation. Proc Natl Acad Sci U S A, 101(16):6206–6211, Apr 2004. doi: 10.1073/pnas.0307742101.URL http://dx.doi.org/10.1073/pnas.0307742101.
[386] Aidan Peterson, Andrew Kossenkov, and Michael Ochs. Linking gene expression patterns andtranscriptional regulation in plasmodium falciparum. In Patrick McConnell, Simon M. Lin,and Patrick Hurban, editors, Methods of Microarray Data Analysis V, pages 137–156. SpringerUS, 2007.
[387] Priti Pharkya and Costas D Maranas. An optimization framework for identifying reactionactivation/inhibition or elimination candidates for overproduction in microbial systems. MetabEng, 8(1):1–13, Jan 2006. doi: 10.1016/j.ymben.2005.08.003. URL http://dx.doi.org/10.1016/j.ymben.2005.08.003.
[388] J. W. Pinney, D. R. Westhead, and G. A. McConkey. Petri net representations in systemsbiology. Biochem Soc Trans, 31(Pt 6):1513–1515, Dec 2003. doi: 10.1042/. URL http://dx.doi.org/10.1042/.
[389] John W Pinney, Balázs Papp, Christopher Hyland, Lillian Wambua, David R Westhead, andGlenn A McConkey. Metabolic reconstruction and analysis for parasite genomes. TrendsParasitol, 23(11):548–554, Nov 2007. doi: 10.1016/j.pt.2007.08.013. URL http://dx.doi.org/10.1016/j.pt.2007.08.013.
[390] D. F. Platel, F. Mangou, and J. Tribouley-Duret. Role of glutathione in the detoxification offerriprotoporphyrin ix in chloroquine resistant plasmodium berghei. Mol Biochem Parasitol,98(2):215–223, Jan 1999.
[391] David Plouffe, Achim Brinker, Case McNamara, Kerstin Henson, Nobutaka Kato, Kelli Kuhen,Advait Nagle, Francisco Adrián, Jason T Matzen, Paul Anderson, Tae-Gyu Nam, Nathanael SGray, Arnab Chatterjee, Jeff Janes, S. Frank Yan, Richard Trager, Jeremy S Caldwell, Peter GSchultz, Yingyao Zhou, and Elizabeth A Winzeler. In silico activity profiling reveals themechanism of action of antimalarials discovered in a high-throughput screen. Proc Natl AcadSci U S A, 105(26):9059–9064, Jul 2008. doi: 10.1073/pnas.0802982105. URL http://dx.doi.org/10.1073/pnas.0802982105.
[392] M. G. Poolman, B. K. Bonde, A. Gevorgyan, H. H. Patel, and D. A. Fell. Challenges to befaced in the reconstruction of metabolic networks from public databases. Syst Biol (Stevenage),153(5):379–384, Sep 2006.
[393] Thomas Potthast. Paradigm shifts versus fashion shifts? systems and synthetic biology as newepistemic entities in understanding and making ’life’. EMBO Rep, 10 Suppl 1:S42–S45, Aug2009. doi: 10.1038/embor.2009.130. URL http://dx.doi.org/10.1038/embor.2009.130.
[394] Nathan D Price, Jennifer L Reed, and Bernhard Palsson. Genome-scale models of microbialcells: evaluating the consequences of constraints. Nat Rev Microbiol, 2(11):886–897, Nov 2004.doi: 10.1038/nrmicro1023. URL http://dx.doi.org/10.1038/nrmicro1023.
[395] Judith Helena Prieto, Sasa Koncarevic, Sung Kyu Park, John Yates, and Katja Becker. Large-scale differential proteome analysis in plasmodium falciparum under drug treatment. PLoSONE, 3(12):e4098, 2008. doi: 10.1371/journal.pone.0004098. URL http://dx.doi.org/10.1371/journal.pone.0004098.
143

BIBLIOGRAPHY
[396] Sean T Prigge, Xin He, Lucia Gerena, Norman C Waters, and Kevin A Reynolds. Theinitiating steps of a type ii fatty acid synthase in plasmodium falciparum are catalyzed bypfacp, pfmcat, and pfkasiii. Biochemistry, 42(4):1160–1169, Feb 2003. doi: 10.1021/bi026847k.URL http://dx.doi.org/10.1021/bi026847k.
[397] Miguel Prudêncio, Ana Rodriguez, and Maria M Mota. The silent path to thousands ofmerozoites: the plasmodium liver stage. Nat Rev Microbiol, 4(11):849–856, Nov 2006. doi:10.1038/nrmicro1529. URL http://dx.doi.org/10.1038/nrmicro1529.
[398] Jacek Puchałka, Matthew A Oberhardt, Miguel Godinho, Agata Bielecka, Daniela Regen-hardt, Kenneth N Timmis, Jason A Papin, and Vítor A P Martins dos Santos. Genome-scale reconstruction and analysis of the pseudomonas putida kt2440 metabolic network fa-cilitates applications in biotechnology. PLoS Comput Biol, 4(10):e1000210, Oct 2008. doi:10.1371/journal.pcbi.1000210. URL http://dx.doi.org/10.1371/journal.pcbi.1000210.
[399] Anu Raghunathan, Jennifer Reed, Sookil Shin, Bernhard Palsson, and Simon Daefler.Constraint-based analysis of metabolic capacity of salmonella typhimurium during host-pathogen interaction. BMC Syst Biol, 3:38, 2009. doi: 10.1186/1752-0509-3-38. URLhttp://dx.doi.org/10.1186/1752-0509-3-38.
[400] Syed Rahman, Pardha Jonnalagadda, Jyothi Padiadpu, Kai Hartmann, Rainer Schrader, andDietmar Schomburg. Metabolic network analysis: Implication and application. BMC Bioin-formatics, 6:S12, 2005. URL http://www.citebase.org/abstract?id=oai:biomedcentral.com:1471-2105-6-S3-S12.
[401] Syed Asad Rahman and Dietmar Schomburg. Observing local and global properties ofmetabolic pathways: ’load points’ and ’choke points’ in the metabolic networks. Bioin-formatics, 22(14):1767–1774, Jul 2006. doi: 10.1093/bioinformatics/btl181. URL http://dx.doi.org/10.1093/bioinformatics/btl181.
[402] Stuart A Ralph. Strange organelles–plasmodium mitochondria lack a pyruvate dehydrogenasecomplex. Mol Microbiol, 55(1):1–4, Jan 2005. doi: 10.1111/j.1365-2958.2004.04314.x. URLhttp://dx.doi.org/10.1111/j.1365-2958.2004.04314.x.
[403] Stuart A Ralph, Giel G van Dooren, Ross F Waller, Michael J Crawford, Martin J Fraunholz,Bernardo J Foth, Christopher J Tonkin, David S Roos, and Geoffrey I McFadden. Tropicalinfectious diseases: metabolic maps and functions of the plasmodium falciparum apicoplast.Nat Rev Microbiol, 2(3):203–216, Mar 2004. doi: 10.1038/nrmicro843. URL http://dx.doi.org/10.1038/nrmicro843.
[404] Karthik Raman and Nagasuma Chandra. Flux balance analysis of biological systems: appli-cations and challenges. Brief Bioinform, 10(4):435–449, Jul 2009. doi: 10.1093/bib/bbp011.URL http://dx.doi.org/10.1093/bib/bbp011.
[405] Adaikalavan Ramasamy, Adrian Mondry, Chris C Holmes, and Douglas G Altman. Key issuesin conducting a meta-analysis of gene expression microarray datasets. PLoS Med, 5(9):e184,Sep 2008. doi: 10.1371/journal.pmed.0050184. URL http://dx.doi.org/10.1371/journal.pmed.0050184.
[406] T. A. Rapoport, R. Heinrich, and S. M. Rapoport. The regulatory principles of glycolysis inerythrocytes in vivo and in vitro. a minimal comprehensive model describing steady states,quasi-steady states and time-dependent processes. Biochem J, 154(2):449–469, Feb 1976.
[407] Dharmendar Rathore, Dewal Jani, Rana Nagarkatti, and Sanjai Kumar. Heme detoxificationand antimalarial drugs – known mechanisms and future prospects. Drug Discovery Today:Therapeutic Strategies, 3:153–158, 2006.
144

BIBLIOGRAPHY
[408] L. K. Read and R. B. Mikkelsen. Plasmodium falciparum-infected erythrocytes contain anadenylate cyclase with properties which differ from those of the host enzyme. Mol BiochemParasitol, 45(1):109–119, Mar 1991.
[409] Jennifer L Reed, Iman Famili, Ines Thiele, and Bernhard O Palsson. Towards multidimensionalgenome annotation. Nat Rev Genet, 7(2):130–141, Feb 2006. doi: 10.1038/nrg1769. URLhttp://dx.doi.org/10.1038/nrg1769.
[410] Jennifer L Reed, Trina R Patel, Keri H Chen, Andrew R Joyce, Margaret K Applebee, Christo-pher D Herring, Olivia T Bui, Eric M Knight, Stephen S Fong, and Bernhard O Palsson.Systems approach to refining genome annotation. Proc Natl Acad Sci U S A, 103(46):17480–17484, Nov 2006. doi: 10.1073/pnas.0603364103. URL http://dx.doi.org/10.1073/pnas.0603364103.
[411] Sutarnthip Reungprapavut, Sudaratana R Krungkrai, and Jerapan Krungkrai. Plasmodiumfalciparum carbonic anhydrase is a possible target for malaria chemotherapy. J Enzyme InhibMed Chem, 19(3):249–256, Jun 2004. doi: 10.1080/14756360410001689577. URL http://dx.doi.org/10.1080/14756360410001689577.
[412] R. G. Ridley. Plasmodium: drug discovery and development–an industrial perspective. ExpParasitol, 87(3):293–304, Nov 1997. doi: 10.1006/expr.1997.4230. URL http://dx.doi.org/10.1006/expr.1997.4230.
[413] S. P. Riley, N. J. Talbot, M. J. Ahmed, K. Jouhal, and B. M. Hendry. Characterization ofhuman erythrocyte choline transport in chronic renal failure. Nephrol Dial Transplant, 12(9):1921–1927, Sep 1997.
[414] G. Rindi, C. Patrini, U. Laforenza, H. Mandel, M. Berant, M. B. Viana, V. Poggi, and A. N.Zarra. Further studies on erythrocyte thiamin transport and phosphorylation in seven patientswith thiamin-responsive megaloblastic anaemia. J Inherit Metab Dis, 17(6):667–677, 1994.
[415] F. Roberts, C. W. Roberts, J. J. Johnson, D. E. Kyle, T. Krell, J. R. Coggins, G. H. Coombs,W. K. Milhous, S. Tzipori, D. J. Ferguson, D. Chakrabarti, and R. McLeod. Evidence forthe shikimate pathway in apicomplexan parasites. Nature, 393(6687):801–805, Jun 1998. doi:10.1038/31723. URL http://dx.doi.org/10.1038/31723.
[416] Leslie Roberts and Martin Enserink. Malaria. did they really say ... eradication? Science, 318(5856):1544–1545, Dec 2007. doi: 10.1126/science.318.5856.1544. URL http://dx.doi.org/10.1126/science.318.5856.1544.
[417] Seth B Roberts, Jennifer L Robichaux, Arvind K Chavali, Patricio A Manque, Vladimir Lee,Ana M Lara, Jason A Papin, and Gregory A Buck. Proteomic and network analysis characterizestage-specific metabolism in trypanosoma cruzi. BMC Syst Biol, 3:52, 2009. doi: 10.1186/1752-0509-3-52. URL http://dx.doi.org/10.1186/1752-0509-3-52.
[418] James G Robertson. Mechanistic basis of enzyme-targeted drugs. Biochemistry, 44(15):5561–5571, Apr 2005. doi: 10.1021/bi050247e. URL http://dx.doi.org/10.1021/bi050247e.
[419] Karine G Le Roch, Yingyao Zhou, Peter L Blair, Muni Grainger, J. Kathleen Moch, J. DavidHaynes, Patricia De La Vega, Anthony A Holder, Serge Batalov, Daniel J Carucci, and Eliz-abeth A Winzeler. Discovery of gene function by expression profiling of the malaria para-site life cycle. Science, 301(5639):1503–1508, Sep 2003. doi: 10.1126/science.1087025. URLhttp://dx.doi.org/10.1126/science.1087025.
145
BIBLIOGRAPHY
[420] Karine G Le Roch, Jeffrey R Johnson, Laurence Florens, Yingyao Zhou, Andrey Santrosyan,Munira Grainger, S. Frank Yan, Kim C Williamson, Anthony A Holder, Daniel J Carucci,John R Yates, and Elizabeth A Winzeler. Global analysis of transcript and protein levelsacross the plasmodium falciparum life cycle. Genome Res, 14(11):2308–2318, Nov 2004. doi:10.1101/gr.2523904. URL http://dx.doi.org/10.1101/gr.2523904.
[421] Wilfred F M Röling, Boris M van Breukelen, Frank J Bruggeman, and Hans V Westerhoff.Ecological control analysis: being(s) in control of mass flux and metabolite concentrations inanaerobic degradation processes. Environ Microbiol, 9(2):500–511, Feb 2007. doi: 10.1111/j.1462-2920.2006.01167.x. URL http://dx.doi.org/10.1111/j.1462-2920.2006.01167.x.
[422] Sergio Romeo, Mario Dell’Agli, Silvia Parapini, Luca Rizzi, Germana Galli, Monica Mon-dani, Anna Sparatore, Donatella Taramelli, and Enrica Bosisio. Plasmepsin ii inhibition andantiplasmodial activity of primaquine-statine ’double-drugs’. Bioorg Med Chem Lett, 14(11):2931–2934, Jun 2004. doi: 10.1016/j.bmcl.2004.03.030. URL http://dx.doi.org/10.1016/j.bmcl.2004.03.030.
[423] P. J. Rosenthal, J. E. Olson, G. K. Lee, J. T. Palmer, J. L. Klaus, and D. Rasnick. Antimalarialeffects of vinyl sulfone cysteine proteinase inhibitors. Antimicrob Agents Chemother, 40(7):1600–1603, Jul 1996.
[424] Isabelle Rosinski-Chupin, Jérôme Briolay, Patrick Brouilly, Sylvie Perrot, Shawn M Gomez,Thomas Chertemps, Charles W Roth, Céline Keime, Olivier Gandrillon, Pierre Couble, andPaul T Brey. Sage analysis of mosquito salivary gland transcriptomes during plasmodiuminvasion. Cell Microbiol, 9(3):708–724, Mar 2007. doi: 10.1111/j.1462-5822.2006.00822.x.URL http://dx.doi.org/10.1111/j.1462-5822.2006.00822.x.
[425] Benfang Ruan, Michael L Bovee, Meik Sacher, Constantinos Stathopoulos, Karl Poralla,Christopher S Francklyn, and Dieter Söll. A unique hydrophobic cluster near the active sitecontributes to differences in borrelidin inhibition among threonyl-trna synthetases. J BiolChem, 280(1):571–577, Jan 2005. doi: 10.1074/jbc.M411039200. URL http://dx.doi.org/10.1074/jbc.M411039200.
[426] John B Sacci and Abdu F Azad. Gene expression analysis during liver stage development ofplasmodium. Int J Parasitol, 32(13):1551–1557, Dec 2002.
[427] John B Sacci, Jose M C Ribeiro, Fengying Huang, Uzma Alam, Joshua A Russell, Peter LBlair, Adam Witney, Daniel J Carucci, Abdu F Azad, and Joao C Aguiar. Transcriptionalanalysis of in vivo plasmodium yoelii liver stage gene expression. Mol Biochem Parasitol, 142(2):177–183, Aug 2005. doi: 10.1016/j.molbiopara.2005.03.018. URL http://dx.doi.org/10.1016/j.molbiopara.2005.03.018.
[428] Jeffrey Sachs and Pia Malaney. The economic and social burden of malaria. Nature, 415(6872):680–685, Feb 2002. doi: 10.1038/415680a. URL http://dx.doi.org/10.1038/415680a.
[429] Milton H Saier, Can V Tran, and Ravi D Barabote. Tcdb: the transporter classificationdatabase for membrane transport protein analyses and information. Nucleic Acids Res, 34(Database issue):D181–D186, Jan 2006. doi: 10.1093/nar/gkj001. URL http://dx.doi.org/10.1093/nar/gkj001.
[430] Milton H Saier, Ming Ren Yen, Keith Noto, Dorjee G Tamang, and Charles Elkan. Thetransporter classification database: recent advances. Nucleic Acids Res, 37(Database issue):D274–D278, Jan 2009. doi: 10.1093/nar/gkn862. URL http://dx.doi.org/10.1093/nar/gkn862.
146
BIBLIOGRAPHY
[431] Tomoyo Sakata and Elizabeth A Winzeler. Genomics, systems biology and drug developmentfor infectious diseases. Mol Biosyst, 3(12):841–848, Dec 2007. doi: 10.1039/b703924g. URLhttp://dx.doi.org/10.1039/b703924g.
[432] Sakharkar. Biocomputational strategies for microbial drug target identification. Methods MolMed, 2007.
[433] Costantino Salerno and Carlo Crifò. Diagnostic value of urinary orotic acid levels: applicableseparation methods. J Chromatogr B Analyt Technol Biomed Life Sci, 781(1-2):57–71, Dec2002.
[434] Kevin J Saliba, Sanjeev Krishna, and Kiaran Kirk. Inhibition of hexose transport andabrogation of ph homeostasis in the intraerythrocytic malaria parasite by an o-3-hexosederivative. FEBS Lett, 570(1-3):93–96, Jul 2004. doi: 10.1016/j.febslet.2004.06.032. URLhttp://dx.doi.org/10.1016/j.febslet.2004.06.032.
[435] Kevin J Saliba, Rowena E Martin, Angelika Bröer, Roselani I Henry, C. Siobhan McCarthy,Megan J Downie, Richard J W Allen, Kylie A Mullin, Geoffrey I McFadden, Stefan Bröer, andKiaran Kirk. Sodium-dependent uptake of inorganic phosphate by the intracellular malariaparasite. Nature, 443(7111):582–585, Oct 2006. doi: 10.1038/nature05149. URL http://dx.doi.org/10.1038/nature05149.
[436] Teresa C Santiago, Rachel Zufferey, Rajendra S Mehra, Rosalind A Coleman, and Choukri BenMamoun. The plasmodium falciparum pfgatp is an endoplasmic reticulum membrane proteinimportant for the initial step of malarial glycerolipid synthesis. J Biol Chem, 279(10):9222–9232, Mar 2004. doi: 10.1074/jbc.M310502200. URL http://dx.doi.org/10.1074/jbc.M310502200.
[437] Guillaume Sapriel, Michelle Quinet, Marc Heijde, Laurent Jourdren, Véronique Tanty,Guangzuo Luo, Stéphane Le Crom, and Pascal Jean Lopez. Genome-wide transcriptomeanalyses of silicon metabolism in phaeodactylum tricornutum reveal the multilevel regulationof silicic acid transporters. PLoS One, 4(10):e7458, 2009. doi: 10.1371/journal.pone.0007458.URL http://dx.doi.org/10.1371/journal.pone.0007458.
[438] P. S. Sarma and R. S. Kumar. Abdominal pain in a patient with falciparum malaria. PostgradMed J, 74(873):425–427, Jul 1998.
[439] P. S. Sarma, A. K. Mandal, and H. J. Khamis. Allopurinol as an additive to quinine in thetreatment of acute complicated falciparum malaria. Am J Trop Med Hyg, 58(4):454–457, Apr1998.
[440] Eric E Schadt, Stephen H Friend, and David A Shaywitz. A network view of disease andcompound screening. Nat Rev Drug Discov, 8(4):286–295, Apr 2009. doi: 10.1038/nrd2826.URL http://dx.doi.org/10.1038/nrd2826.
[441] C. H. Schilling and B. O. Palsson. The underlying pathway structure of biochemical reactionnetworks. Proc Natl Acad Sci U S A, 95(8):4193–4198, Apr 1998.
[442] C. H. Schilling, D. Letscher, and B. O. Palsson. Theory for the systemic definition of metabolicpathways and their use in interpreting metabolic function from a pathway-oriented perspective.J Theor Biol, 203(3):229–248, Apr 2000. doi: 10.1006/jtbi.2000.1073. URL http://dx.doi.org/10.1006/jtbi.2000.1073.
[443] Christophe H Schilling, Markus W Covert, Iman Famili, George M Church, Jeremy S Edwards,and Bernhard O Palsson. Genome-scale metabolic model of helicobacter pylori 26695. JBacteriol, 184(16):4582–4593, Aug 2002.
147
BIBLIOGRAPHY
[444] Louis Schofield and Georges E Grau. Immunological processes in malaria pathogenesis. NatRev Immunol, 5(9):722–735, Sep 2005. doi: 10.1038/nri1686. URL http://dx.doi.org/10.1038/nri1686.
[445] Robert Schuetz, Lars Kuepfer, and Uwe Sauer. Systematic evaluation of objective functionsfor predicting intracellular fluxes in escherichia coli. Mol Syst Biol, 3:119, 2007. doi: 10.1038/msb4100162. URL http://dx.doi.org/10.1038/msb4100162.
[446] R. Schuster and H. G. Holzhütter. Use of mathematical models for predicting the metaboliceffect of large-scale enzyme activity alterations. application to enzyme deficiencies of red bloodcells. Eur J Biochem, 229(2):403–418, Apr 1995.
[447] S. Schuster. Use and limitations of modular metabolic control analysis in medicine andbiotechnology. Metab Eng, 1(3):232–242, Jul 1999. doi: 10.1006/mben.1999.0119. URLhttp://dx.doi.org/10.1006/mben.1999.0119.
[448] S. Schuster, D. A. Fell, and T. Dandekar. A general definition of metabolic pathways usefulfor systematic organization and analysis of complex metabolic networks. Nat Biotechnol, 18(3):326–332, Mar 2000. doi: 10.1038/73786. URL http://dx.doi.org/10.1038/73786.
[449] S. Schuster, C. Hilgetag, J. H. Woods, and D. A. Fell. Reaction routes in biochemical reactionsystems: algebraic properties, validated calculation procedure and example from nucleotidemetabolism. J Math Biol, 45(2):153–181, Aug 2002. doi: 10.1007/s002850200143. URLhttp://dx.doi.org/10.1007/s002850200143.
[450] Stefan Schuster, Thomas Pfeiffer, and David A Fell. Is maximization of molar yield in metabolicnetworks favoured by evolution? J Theor Biol, 252(3):497–504, Jun 2008. doi: 10.1016/j.jtbi.2007.12.008. URL http://dx.doi.org/10.1016/j.jtbi.2007.12.008.
[451] H. V. Scott, A. M. Gero, and W. J. O’Sullivan. In vitro inhibition of plasmodium falciparumby pyrazofurin, an inhibitor of pyrimidine biosynthesis de novo. Mol Biochem Parasitol, 18(1):3–15, Jan 1986.
[452] Eran Segal, Michael Shapira, Aviv Regev, Dana Pe’er, David Botstein, Daphne Koller, andNir Friedman. Module networks: identifying regulatory modules and their condition-specificregulators from gene expression data. Nat Genet, 34(2):166–176, Jun 2003. doi: 10.1038/ng1165. URL http://dx.doi.org/10.1038/ng1165.
[453] Daniel Segrè, Dennis Vitkup, and George M Church. Analysis of optimality in natural andperturbed metabolic networks. Proc Natl Acad Sci U S A, 99(23):15112–15117, Nov 2002. doi:10.1073/pnas.232349399. URL http://dx.doi.org/10.1073/pnas.232349399.
[454] K. K. Seymour, S. D. Lyons, L. Phillips, K. H. Rieckmann, and R. I. Christopherson. Cy-totoxic effects of inhibitors of de novo pyrimidine biosynthesis upon plasmodium falciparum.Biochemistry, 33(17):5268–5274, May 1994.
[455] K. K. Seymour, A. E. Yeo, K. H. Rieckmann, and R. I. Christopherson. dctp levels aremaintained in plasmodium falciparum subjected to pyrimidine deficiency or excess. Ann TropMed Parasitol, 91(6):603–609, Sep 1997.
[456] J. J. Shah and R. Z. Orlowski. Proteasome inhibitors in the treatment of multiple myeloma.Leukemia, Sep 2009. doi: 10.1038/leu.2009.173. URL http://dx.doi.org/10.1038/leu.2009.173.
[457] R. Sharma, S. Awasthi, P. Zimniak, and Y. C. Awasthi. Transport of glutathione-conjugatesin human erythrocytes. Acta Biochim Pol, 47(3):751–762, 2000.
148

BIBLIOGRAPHY
[458] Shailendra Kumar Sharma, Mili Kapoor, T. N C Ramya, Sanjay Kumar, Gyanendra Kumar,Rahul Modak, Shilpi Sharma, Namita Surolia, and Avadhesha Surolia. Identification, charac-terization, and inhibition of plasmodium falciparum beta-hydroxyacyl-acyl carrier protein de-hydratase (fabz). J Biol Chem, 278(46):45661–45671, Nov 2003. doi: 10.1074/jbc.M304283200.URL http://dx.doi.org/10.1074/jbc.M304283200.
[459] Shilpi Sharma. Components of Fatty Acid Synthesis in Plasmodium falciparum. PhD the-sis, Molecular Biophysics Unit INDIAN INSTITUTE OF SCIENCE BANGALORE-560012,INDIA, 2006.
[460] B. S. Shastry. Genetic knockouts in mice: an update. Experientia, 51(11):1028–1039, Nov1995.
[461] I. W. Sherman. Biochemistry of plasmodium (malarial parasites). Microbiol Rev, 43(4):453–495, Dec 1979.
[462] I. W. Sherman and I. P. Ting. Carbon dioxide fixation in malaria. ii. plasmodium knowlesi(monkey malaria). Comp Biochem Physiol, 24(2):639–642, Feb 1968.
[463] Irwin W. Sherman, editor. Molecular Approaches to Malaria. ASM Press, 2005.
[464] Motomu Shimaoka. [sirna-based therapeutics]. Nippon Rinsho, 67(6):1185–1190, Jun 2009.
[465] Tomer Shlomi, Moran N Cabili, Markus J Herrgård, Bernhard Palsson, and Eytan Ruppin.Network-based prediction of human tissue-specific metabolism. Nat Biotechnol, 26(9):1003–1010, Sep 2008. doi: 10.1038/nbt.1487. URL http://dx.doi.org/10.1038/nbt.1487.
[466] Jennifer L Shock, Kael F Fischer, and Joseph L DeRisi. Whole-genome analysis of mrnadecay in plasmodium falciparum reveals a global lengthening of mrna half-life during theintra-erythrocytic development cycle. Genome Biol, 8(7):R134, 2007. doi: 10.1186/gb-2007-8-7-r134. URL http://dx.doi.org/10.1186/gb-2007-8-7-r134.
[467] D. G. Shoemaker, C. A. Bender, and R. B. Gunn. Sodium-phosphate cotransport in humanred blood cells. kinetics and role in membrane metabolism. J Gen Physiol, 92(4):449–474, Oct1988.
[468] Satoshi Shuto, Noriaki Minakawa, Satoshi Niizuma, Hye-Sook Kim, Yusuke Wataya, and AkiraMatsuda. New neplanocin analogues. 12. alternative synthesis and antimalarial effect of (6’r)-6’-c-methylneplanocin a, a potent adohcy hydrolase inhibitor. J Med Chem, 45(3):748–751,Jan 2002.
[469] Puran S Sijwali and Philip J Rosenthal. Gene disruption confirms a critical role for thecysteine protease falcipain-2 in hemoglobin hydrolysis by plasmodium falciparum. Proc NatlAcad Sci U S A, 101(13):4384–4389, Mar 2004. doi: 10.1073/pnas.0307720101. URL http://dx.doi.org/10.1073/pnas.0307720101.
[470] Singh. Replication of the plasmodium falciparum apicoplast dna initiates within the invertedrepeat region. Molecular and Biochemical Parasitology, 2002.
[471] Agam Prasad Singh, Carlos A Buscaglia, Qian Wang, Agata Levay, Daniel R Nussenzweig,John R Walker, Elizabeth A Winzeler, Hodaka Fujii, Beatriz M A Fontoura, and VictorNussenzweig. Plasmodium circumsporozoite protein promotes the development of the liverstages of the parasite. Cell, 131(3):492–504, Nov 2007. doi: 10.1016/j.cell.2007.09.013. URLhttp://dx.doi.org/10.1016/j.cell.2007.09.013.
149

BIBLIOGRAPHY
[472] Shailza Singh, Balwant Kishen Malik, and Durlabh Kumar Sharma. Choke point analysis ofmetabolic pathways in e.histolytica: A computational approach for drug target identification.Bioinformation, 2(2):68–72, 2007.
[473] Shailza Singh, Priyanka Joshi, and Balu Ananda Chopade. Choke point analysis of the meta-bolic pathways of acinetobacter baylyi: A genomics approach to assess potential drug targets.Journal of Bioinformatics and Sequence Analysis, 1:41–45, 2009.
[474] Mouldy Sioud. Target Discovery and Validation: Reviews and Protocols: Volume 1: EmergingStrategies for Targets and Biomarker Discovery (Methods in Molecular Biology). Springer,2007.
[475] T. S. Skinner-Adams, J. S. McCarthy, D. L. Gardiner, and K. T. Andrews. Hiv and malariaco-infection: interactions and consequences of chemotherapy. Trends Parasitol, 24(6):264–271,Jun 2008. doi: 10.1016/j.pt.2008.03.008. URL http://dx.doi.org/10.1016/j.pt.2008.03.008.
[476] Martin J Smilkstein, Isaac Forquer, Atsuko Kanazawa, Jane Xu Kelly, Rolf W Winter, David JHinrichs, David M Kramer, and Michael K Riscoe. A drug-selected plasmodium falciparumlacking the need for conventional electron transport. Mol Biochem Parasitol, 159(1):64–68,May 2008. doi: 10.1016/j.molbiopara.2008.01.002. URL http://dx.doi.org/10.1016/j.molbiopara.2008.01.002.
[477] Terry K Smith, Peter Gerold, Arthur Crossman, Michael J Paterson, Charles N Borissow,John S Brimacombe, Michael A J Ferguson, and Ralph T Schwarz. Substrate specificity ofthe plasmodium falciparum glycosylphosphatidylinositol biosynthetic pathway and inhibitionby species-specific suicide substrates. Biochemistry, 41(41):12395–12406, Oct 2002.
[478] Evan S Snitkin, Aimée M Dudley, Daniel M Janse, Kaisheen Wong, George M Church, andDaniel Segrè. Model-driven analysis of experimentally determined growth phenotypes for 465yeast gene deletion mutants under 16 different conditions. Genome Biol, 9(9):R140, 2008. doi:10.1186/gb-2008-9-9-r140. URL http://dx.doi.org/10.1186/gb-2008-9-9-r140.
[479] Sabrina Sonda and Adrian B Hehl. Lipid biology of apicomplexa: perspectives for new drugtargets, particularly for toxoplasma gondii. Trends Parasitol, 22(1):41–47, Jan 2006. doi:10.1016/j.pt.2005.11.001. URL http://dx.doi.org/10.1016/j.pt.2005.11.001.
[480] Laurent Soulère, Patrick Delplace, Elisabeth Davioud-Charvet, Sandrine Py, ChristianSergheraert, Jacques Périé, Isabelle Ricard, Pascal Hoffmann, and Daniel Dive. Screening ofplasmodium falciparum iron superoxide dismutase inhibitors and accuracy of the sod-assays.Bioorg Med Chem, 11(23):4941–4944, Nov 2003.
[481] Maroya D Spalding and Sean T Prigge. Malaria pulls a fast one. Cell Host Microbe, 4(6):509–511, Dec 2008. doi: 10.1016/j.chom.2008.11.006. URL http://dx.doi.org/10.1016/j.chom.2008.11.006.
[482] Christina Spry, Kiaran Kirk, and Kevin J Saliba. Coenzyme a biosynthesis: an antimicrobialdrug target. FEMS Microbiol Rev, 32(1):56–106, Jan 2008. doi: 10.1111/j.1574-6976.2007.00093.x. URL http://dx.doi.org/10.1111/j.1574-6976.2007.00093.x.
[483] I. K. Srivastava, M. Schmidt, M. Grall, U. Certa, A. M. Garcia, and L. H. Perrin. Identificationand purification of glucose phosphate isomerase of plasmodium falciparum. Mol BiochemParasitol, 54(2):153–164, Sep 1992.
150

BIBLIOGRAPHY
[484] N. Sriwilaijareon, S. Petmitr, A. Mutirangura, M. Ponglikitmongkol, and P. Wilairat. Stagespecificity of plasmodium falciparum telomerase and its inhibition by berberine. Parasitol Int,51(1):99–103, Mar 2002.
[485] Colin M Stack, Jonathan Lowther, Eithne Cunningham, Sheila Donnelly, Donald L Gardiner,Katharine R Trenholme, Tina S Skinner-Adams, Franka Teuscher, Jolanta Grembecka, ArturMucha, Pawel Kafarski, Linda Lua, Angus Bell, and John P Dalton. Characterization of theplasmodium falciparum m17 leucyl aminopeptidase. a protease involved in amino acid regu-lation with potential for antimalarial drug development. J Biol Chem, 282(3):2069–2080, Jan2007. doi: 10.1074/jbc.M609251200. URL http://dx.doi.org/10.1074/jbc.M609251200.
[486] Sergey Stolyar, Steve Van Dien, Kristina Linnea Hillesland, Nicolas Pinel, Thomas J Lie,John A Leigh, and David A Stahl. Metabolic modeling of a mutualistic microbial community.Mol Syst Biol, 3:92, 2007. doi: 10.1038/msb4100131. URL http://dx.doi.org/10.1038/msb4100131.
[487] Nicole S Struck, Suzana de Souza Dias, Christine Langer, Matthias Marti, J. Andrew Pearce,Alan F Cowman, and Tim W Gilberger. Re-defining the golgi complex in plasmodium falci-parum using the novel golgi marker pfgrasp. J Cell Sci, 118(Pt 23):5603–5613, Dec 2005. doi:10.1242/jcs.02673. URL http://dx.doi.org/10.1242/jcs.02673.
[488] Angelika Sturm and Volker Heussler. Live and let die: manipulation of host hepatocytes byexoerythrocytic plasmodium parasites. Med Microbiol Immunol, 196(3):127–133, Sep 2007.doi: 10.1007/s00430-007-0044-3. URL http://dx.doi.org/10.1007/s00430-007-0044-3.
[489] I. N. Subbayya, S. S. Ray, P. Balaram, and H. Balaram. Metabolic enzymes as potential drugtargets in plasmodium falciparum. Indian J Med Res, 106:79–94, Aug 1997.
[490] D. J. Sullivan, I. Y. Gluzman, D. G. Russell, and D. E. Goldberg. On the molecular mechanismof chloroquine’s antimalarial action. Proc Natl Acad Sci U S A, 93(21):11865–11870, Oct 1996.
[491] Sujatha Sunil, Manzar J Hossain, Gowthaman Ramasamy, and Pawan Malhotra. Transientsilencing of plasmodium falciparum tudor staphylococcal nuclease suggests an essential role forthe protein. Biochem Biophys Res Commun, 372(2):373–378, Jul 2008. doi: 10.1016/j.bbrc.2008.05.033. URL http://dx.doi.org/10.1016/j.bbrc.2008.05.033.
[492] N. Suraveratum, S. R. Krungkrai, P. Leangaramgul, P. Prapunwattana, and J. Krungkrai.Purification and characterization of plasmodium falciparum succinate dehydrogenase. MolBiochem Parasitol, 105(2):215–222, Feb 2000.
[493] N. Surolia and G. Padmanaban. de novo biosynthesis of heme offers a new chemotherapeutictarget in the human malarial parasite. Biochem Biophys Res Commun, 187(2):744–750, Sep1992.
[494] N. Surolia and A. Surolia. Triclosan offers protection against blood stages of malaria byinhibiting enoyl-acp reductase of plasmodium falciparum. Nat Med, 7(2):167–173, Feb 2001.doi: 10.1038/84612. URL http://dx.doi.org/10.1038/84612.
[495] A. Szkopińska. Ubiquinone. biosynthesis of quinone ring and its isoprenoid side chain. intra-cellular localization. Acta Biochim Pol, 47(2):469–480, 2000.
[496] Nao Taguchi, Toshimitsu Hatabu, Haruyasu Yamaguchi, Mamoru Suzuki, Kumiko Sato, andShigeyuki Kano. Plasmodium falciparum: selenium-induced cytotoxicity to p. falciparum. ExpParasitol, 106(1-2):50–55, 2004. doi: 10.1016/j.exppara.2004.01.005. URL http://dx.doi.org/10.1016/j.exppara.2004.01.005.
151
BIBLIOGRAPHY
[497] E. Takashima, S. Takamiya, S. Takeo, F. Mi-ichi, H. Amino, and K. Kita. Isolation of mito-chondria from plasmodium falciparum showing dihydroorotate dependent respiration. ParasitolInt, 50(4):273–278, Nov 2001.
[498] Yoshinori Tamada, SunYong Kim, Hideo Bannai, Seiya Imoto, Kousuke Tashiro, SatoruKuhara, and Satoru Miyano. Estimating gene networks from gene expression data by com-bining bayesian network model with promoter element detection. Bioinformatics, 19 Suppl 2:ii227–ii236, Oct 2003.
[499] Yoshinori Tamada, Seiya Imoto, Kousuke Tashiro, Satoru Kuhara, and Satoru Miyano. Iden-tifying drug active pathways from gene networks estimated by gene expression data. GenomeInform, 16(1):182–191, 2005.
[500] Isabelle Tardieux and Robert Ménard. Migration of apicomplexa across biological barriers: thetoxoplasma and plasmodium rides. Traffic, 9(5):627–635, May 2008. doi: 10.1111/j.1600-0854.2008.00703.x. URL http://dx.doi.org/10.1111/j.1600-0854.2008.00703.x.
[501] Alice S Tarun, Xinxia Peng, Ronald F Dumpit, Yuko Ogata, Hilda Silva-Rivera, Nelly Ca-margo, Thomas M Daly, Lawrence W Bergman, and Stefan H I Kappe. A combined transcrip-tome and proteome survey of malaria parasite liver stages. Proc Natl Acad Sci U S A, 105(1):305–310, Jan 2008. doi: 10.1073/pnas.0710780104. URL http://dx.doi.org/10.1073/pnas.0710780104.
[502] R. L. Tatusov, D. A. Natale, I. V. Garkavtsev, T. A. Tatusova, U. T. Shankavaram, B. S.Rao, B. Kiryutin, M. Y. Galperin, N. D. Fedorova, and E. V. Koonin. The cog database: newdevelopments in phylogenetic classification of proteins from complete genomes. Nucleic AcidsRes, 29(1):22–28, Jan 2001.
[503] Rongwei Teng, Pauline R Junankar, William A Bubb, Caroline Rae, Pascal Mercier, andKiaran Kirk. Metabolite profiling of the intraerythrocytic malaria parasite plasmodiumfalciparum by (1)h nmr spectroscopy. NMR Biomed, 22(3):292–302, Apr 2009. doi:10.1002/nbm.1323. URL http://dx.doi.org/10.1002/nbm.1323.
[504] B. H. ter Kuile and H. V. Westerhoff. Transcriptome meets metabolome: hierarchical andmetabolic regulation of the glycolytic pathway. FEBS Lett, 500(3):169–171, Jul 2001.
[505] P. J. Thornalley, M. Strath, and R. J. Wilson. Antimalarial activity in vitro of the glyoxalasei inhibitor diester, s-p-bromobenzylglutathione diethyl ester. Biochem Pharmacol, 47(2):418–420, Jan 1994.
[506] Isabel M Tienda-Luna, Yufang Yin, Maria C Carrion, Yufei Huang, Hong Cai, MaribelSanchez, and Yufeng Wang. Inferring the skeleton cell cycle regulatory network of malariaparasite using comparative genomic and variational bayesian approaches. Genetica, 132(2):131–142, Feb 2008. doi: 10.1007/s10709-007-9155-4. URL http://dx.doi.org/10.1007/s10709-007-9155-4.
[507] Stephen M Todryk and Adrian V S Hill. Malaria vaccines: the stage we are at. Nat RevMicrobiol, 5(7):487–489, Jul 2007. doi: 10.1038/nrmicro1712. URL http://dx.doi.org/10.1038/nrmicro1712.
[508] T. Triglia, J. G. Menting, C. Wilson, and A. F. Cowman. Mutations in dihydropteroatesynthase are responsible for sulfone and sulfonamide resistance in plasmodium falciparum.Proc Natl Acad Sci U S A, 94(25):13944–13949, Dec 1997.
152

BIBLIOGRAPHY
[509] Dilek Turgut-Balik, Ekrem Akbulut, Debbie K Shoemark, Venhar Celik, Kathleen M More-ton, Richard B Sessions, J. John Holbrook, and R. Leo Brady. Cloning, sequence and expres-sion of the lactate dehydrogenase gene from the human malaria parasite, plasmodium vivax.Biotechnol Lett, 26(13):1051–1055, Jul 2004. doi: 10.1023/B:BILE.0000032958.78158.10. URLhttp://dx.doi.org/10.1023/B:BILE.0000032958.78158.10.
[510] Renu Tuteja. Malaria - an overview. FEBS J, 274(18):4670–4679, Sep 2007. doi: 10.1111/j.1742-4658.2007.05997.x. URL http://dx.doi.org/10.1111/j.1742-4658.2007.05997.x.
[511] Peter C Tyler, Erika A Taylor, Richard F G Fröhlich, and Vern L Schramm. Synthesis of5’-methylthio coformycins: specific inhibitors for malarial adenosine deaminase. J Am ChemSoc, 129(21):6872–6879, May 2007. doi: 10.1021/ja0708363. URL http://dx.doi.org/10.1021/ja0708363.
[512] Pierrick Uzureau, Jean-Christophe Barale, Chris J Janse, Andrew P Waters, and Cather-ine Braun Breton. Gene targeting demonstrates that the plasmodium berghei subtilisin pbsub2is essential for red cell invasion and reveals spontaneous genetic recombination events. CellMicrobiol, 6(1):65–78, Jan 2004.
[513] Rajeev Vaidyanathan and Krishna Kodukula. Using a systems biology approach to dissectparasite–host interactions. DRUG DEVELOPMENT RESEARCH, 70:296–302, 2009.
[514] Anna C van Brummelen, Kellen L Olszewski, Daniel Wilinski, Manuel Llinás, Abraham I Louw,and Lyn-Marie Birkholtz. Co-inhibition of plasmodium falciparum s-adenosylmethionine de-carboxylase/ornithine decarboxylase reveals perturbation-specific compensatory mechanismsby transcriptome, proteome, and metabolome analyses. J Biol Chem, 284(7):4635–4646, Feb2009. doi: 10.1074/jbc.M807085200. URL http://dx.doi.org/10.1074/jbc.M807085200.
[515] Giel G van Dooren and Geoffrey I McFadden. Malaria: differential parasite drive. Nature,450(7172):955–956, Dec 2007. doi: 10.1038/450955a. URL http://dx.doi.org/10.1038/450955a.
[516] Giel G van Dooren, Matthias Marti, Christopher J Tonkin, Luciana M Stimmler, Alan FCowman, and Geoffrey I McFadden. Development of the endoplasmic reticulum, mito-chondrion and apicoplast during the asexual life cycle of plasmodium falciparum. MolMicrobiol, 57(2):405–419, Jul 2005. doi: 10.1111/j.1365-2958.2005.04699.x. URL http://dx.doi.org/10.1111/j.1365-2958.2005.04699.x.
[517] Giel G van Dooren, Luciana M Stimmler, and Geoffrey I McFadden. Metabolic maps and func-tions of the plasmodium mitochondrion. FEMS Microbiol Rev, 30(4):596–630, Jul 2006. doi:10.1111/j.1574-6976.2006.00027.x. URL http://dx.doi.org/10.1111/j.1574-6976.2006.00027.x.
[518] Vera van Noort and Martijn A Huynen. Combinatorial gene regulation in plasmodiumfalciparum. Trends Genet, 22(2):73–78, Feb 2006. doi: 10.1016/j.tig.2005.12.002. URLhttp://dx.doi.org/10.1016/j.tig.2005.12.002.
[519] Christiaan van Ooij. The fatty liver stage of malaria parasites. Nature Reviews Microbiology,2009.
[520] S. Varadharajan, S. Dhanasekaran, Z. Q. Bonday, P. N. Rangarajan, and G. Padmanaban.Involvement of delta-aminolaevulinate synthase encoded by the parasite gene in de novo haemsynthesis by plasmodium falciparum. Biochem J, 367(Pt 2):321–327, Oct 2002. doi: 10.1042/BJ20020834. URL http://dx.doi.org/10.1042/BJ20020834.
153

BIBLIOGRAPHY
[521] Varma. Metabolic flux balancing: basic concepts, scientific and practical use. Nat Biotech,1994.
[522] A. Varma and B. O. Palsson. Stoichiometric flux balance models quantitatively predict growthand metabolic by-product secretion in wild-type escherichia coli w3110. Appl Environ Micro-biol, 60(10):3724–3731, Oct 1994.
[523] A. Varma, B. W. Boesch, and B. O. Palsson. Biochemical production capabilities of escherichiacoli. Biotechnol Bioeng, 42(1):59–73, Jun 1993. doi: 10.1002/bit.260420109. URL http://dx.doi.org/10.1002/bit.260420109.
[524] Imre Vastrik, Peter D’Eustachio, Esther Schmidt, Geeta Joshi-Tope, Gopal Gopinath, DavidCroft, Bernard de Bono, Marc Gillespie, Bijay Jassal, Suzanna Lewis, Lisa Matthews, Guan-ming Wu, Ewan Birney, and Lincoln Stein. Reactome: a knowledge base of biologic path-ways and processes. Genome Biol, 8(3):R39, 2007. doi: 10.1186/gb-2007-8-3-r39. URLhttp://dx.doi.org/10.1186/gb-2007-8-3-r39.
[525] Imre Vastrik, Peter D’Eustachio, Esther Schmidt, Gopal Gopinath, David Croft, Bernardde Bono, Marc Gillespie, Bijay Jassal, Suzanna Lewis, Lisa Matthews, Guanming Wu, EwanBirney, and Lincoln Stein. Correction: Reactome: a knowledge base of biologic pathwaysand processes. Genome Biol, 10(2):402, Feb 2009. doi: 10.1186/gb-2009-10-2-402. URLhttp://dx.doi.org/10.1186/gb-2009-10-2-402.
[526] Ashley M Vaughan, Ahmed S I Aly, and Stefan H I Kappe. Malaria parasite pre-erythrocyticstage infection: gliding and hiding. Cell Host Microbe, 4(3):209–218, Sep 2008. doi: 10.1016/j.chom.2008.08.010. URL http://dx.doi.org/10.1016/j.chom.2008.08.010.
[527] Ashley M Vaughan, Matthew T O’Neill, Alice S Tarun, Nelly Camargo, Thuan M Phuong,Ahmed S I Aly, Alan F Cowman, and Stefan H I Kappe. Type ii fatty acid synthesis is essentialonly for malaria parasite late liver stage development. Cell Microbiol, Dec 2009. doi: 10.1111/j.1462-5822.2008.01270.x. URL http://dx.doi.org/10.1111/j.1462-5822.2008.01270.x.
[528] Joel Vega-Rodríguez, Blandine Franke-Fayard, Rhoel R Dinglasan, Chris J Janse, RebeccaPastrana-Mena, Andrew PWaters, Isabelle Coppens, José F Rodríguez-Orengo, Prakash Srini-vasan, Marcelo Jacobs-Lorena, and Adelfa E Serrano. The glutathione biosynthetic pathway ofplasmodium is essential for mosquito transmission. PLoS Pathog, 5(2):e1000302, Feb 2009. doi:10.1371/journal.ppat.1000302. URL http://dx.doi.org/10.1371/journal.ppat.1000302.
[529] H. J. Vial, J. R. Philippot, and D. F. Wallach. A reevaluation of the status of cholesterol inerythrocytes infected by plasmodium knowlesi and p. falciparum. Mol Biochem Parasitol, 13(1):53–65, Sep 1984.
[530] Henri J Vial, Patrick Eldin, Aloysius G M Tielens, and Jaap J van Hellemond. Phospholipidsin parasitic protozoa. Mol Biochem Parasitol, 126(2):143–154, Feb 2003.
[531] Henri J Vial, Sharon Wein, Christine Farenc, Clemens Kocken, Olivier Nicolas, Marie LaureAncelin, Francoise Bressolle, Alan Thomas, and Michèle Calas. Prodrugs of bisthiazolium saltsare orally potent antimalarials. Proc Natl Acad Sci U S A, 101(43):15458–15463, Oct 2004.doi: 10.1073/pnas.0404037101. URL http://dx.doi.org/10.1073/pnas.0404037101.
[532] Ole Vielemeyer, Michael T McIntosh, Keith A Joiner, and Isabelle Coppens. Neutral lipidsynthesis and storage in the intraerythrocytic stages of plasmodium falciparum. Mol BiochemParasitol, 135(2):197–209, Jun 2004. doi: 10.1016/j.molbiopara.2003.08.017. URL http://dx.doi.org/10.1016/j.molbiopara.2003.08.017.
154

BIBLIOGRAPHY
[533] Mark von Itzstein, Magdalena Plebanski, Brian M Cooke, and Ross L Coppel. Hot, sweetand sticky: the glycobiology of plasmodium falciparum. Trends Parasitol, 24(5):210–218, May2008. doi: 10.1016/j.pt.2008.02.007. URL http://dx.doi.org/10.1016/j.pt.2008.02.007.
[534] Renu Wadhwa, Sunil C Kaul, Makoto Miyagishi, and Kazunari Taira. Know-how of rna inter-ference and its applications in research and therapy. Mutat Res, 567(1):71–84, Sep 2004. doi:10.1016/j.mrrev.2004.06.002. URL http://dx.doi.org/10.1016/j.mrrev.2004.06.002.
[535] R. F. Waller, P. J. Keeling, R. G. Donald, B. Striepen, E. Handman, N. Lang-Unnasch, A. F.Cowman, G. S. Besra, D. S. Roos, and G. I. McFadden. Nuclear-encoded proteins target tothe plastid in toxoplasma gondii and plasmodium falciparum. Proc Natl Acad Sci U S A, 95(21):12352–12357, Oct 1998.
[536] Ross F Waller, Stuart A Ralph, Michael B Reed, Vanessa Su, James D Douglas, David EMinnikin, Alan F Cowman, Gurdyal S Besra, and Geoffrey I McFadden. A type ii pathwayfor fatty acid biosynthesis presents drug targets in plasmodium falciparum. Antimicrob AgentsChemother, 47(1):297–301, Jan 2003.
[537] Ping Wang, Qi Wang, Paul F G Sims, and John E Hyde. Characterisation of exogenous folatetransport in plasmodium falciparum. Mol Biochem Parasitol, 154(1):40–51, Jul 2007. doi:10.1016/j.molbiopara.2007.04.002. URL http://dx.doi.org/10.1016/j.molbiopara.2007.04.002.
[538] Qian Wang, Stuart Brown, David S Roos, Victor Nussenzweig, and Purnima Bhanot. Tran-scriptome of axenic liver stages of plasmodium yoelii. Mol Biochem Parasitol, 137(1):161–168, Sep 2004. doi: 10.1016/j.molbiopara.2004.06.001. URL http://dx.doi.org/10.1016/j.molbiopara.2004.06.001.
[539] Wei Wang, J. Michael Cherry, David Botstein, and Hao Li. A systematic approach to re-constructing transcription networks in saccharomycescerevisiae. Proc Natl Acad Sci U S A,99(26):16893–16898, Dec 2002. doi: 10.1073/pnas.252638199. URL http://dx.doi.org/10.1073/pnas.252638199.
[540] Ying Wang, Hongxing Hao, Zong-Wen Qiu, Wen-Yue Xu, Jian Zhang, Tao-Li Zhou, Xi-LinZhang, and Fu-Sheng Huang. Involvement of prophenoloxidases in the suppression of plas-modium yoelii development by anopheles dirus. Exp Parasitol, 123(1):6–10, Sep 2009. doi: 10.1016/j.exppara.2009.05.017. URL http://dx.doi.org/10.1016/j.exppara.2009.05.017.
[541] C. Wanidworanun, R. L. Nagel, and H. L. Shear. Antisense oligonucleotides targeting malar-ial aldolase inhibit the asexual erythrocytic stages of plasmodium falciparum. Mol BiochemParasitol, 102(1):91–101, Jul 1999.
[542] Norman C Waters and Jeanne A Geyer. Cyclin-dependent protein kinases as therapeutic drugtargets for antimalarial drug development. Expert Opin Ther Targets, 7(1):7–17, Feb 2003.doi: 10.1517/14728222.7.1.7. URL http://dx.doi.org/10.1517/14728222.7.1.7.
[543] H. K. Webster and J. M. Whaun. Antimalarial properties of bredinin. prediction based onidentification of differences in human host-parasite purine metabolism. J Clin Invest, 70(2):461–469, Aug 1982.
[544] Timothy N C Wells, Pedro L Alonso, and Winston E Gutteridge. New medicines to improvecontrol and contribute to the eradication of malaria. Nat Rev Drug Discov, 8(11):879–891,Nov 2009. doi: 10.1038/nrd2972. URL http://dx.doi.org/10.1038/nrd2972.
155

BIBLIOGRAPHY
[545] WHO. World malaria report 2008 http://apps.who.int/malaria/wmr2008/malaria 2008.pdf.Technical report, World Health Organization, 2008.
[546] J. Wiesner, A. Reichenberg, S. Heinrich, M. Schlitzer, and H. Jomaa. The plastid-like organelleof apicomplexan parasites as drug target. Curr Pharm Des, 14(9):855–871, 2008.
[547] Jochen Wiesner, Katja Kettler, Jacek Sakowski, Regina Ortmann, Alejandro M Katzin,Emília A Kimura, Katrin Silber, Gerhard Klebe, Hassan Jomaa, and Martin Schlitzer.Farnesyltransferase inhibitors inhibit the growth of malaria parasites in vitro and in vivo.Angew Chem Int Ed Engl, 43(2):251–254, Jan 2004. doi: 10.1002/anie.200351169. URLhttp://dx.doi.org/10.1002/anie.200351169.
[548] Ann M Winter-Vann, Rudi A Baron, Waihay Wong, June dela Cruz, John D York, David MGooden, Martin O Bergo, Stephen G Young, Eric J Toone, and Patrick J Casey. A small-molecule inhibitor of isoprenylcysteine carboxyl methyltransferase with antitumor activity incancer cells. Proc Natl Acad Sci U S A, 102(12):4336–4341, Mar 2005. doi: 10.1073/pnas.0408107102. URL http://dx.doi.org/10.1073/pnas.0408107102.
[549] Elizabeth A Winzeler. Applied systems biology and malaria. Nat Rev Microbiol, 4(2):145–151,Feb 2006. doi: 10.1038/nrmicro1327. URL http://dx.doi.org/10.1038/nrmicro1327.
[550] Elizabeth Ann Winzeler. Malaria research in the post-genomic era. Nature, 455(7214):751–756,Oct 2008. doi: 10.1038/nature07361. URL http://dx.doi.org/10.1038/nature07361.
[551] David S Wishart, Craig Knox, An Chi Guo, Dean Cheng, Savita Shrivastava, Dan Tzur,Bijaya Gautam, and Murtaza Hassanali. Drugbank: a knowledgebase for drugs, drug actionsand drug targets. Nucleic Acids Res, 36(Database issue):D901–D906, Jan 2008. doi: 10.1093/nar/gkm958. URL http://dx.doi.org/10.1093/nar/gkm958.
[552] Chrislaine Withers-Martinez, Létitia Jean, and Michael J Blackman. Subtilisin-like proteasesof the malaria parasite. Mol Microbiol, 53(1):55–63, Jul 2004. doi: 10.1111/j.1365-2958.2004.04144.x. URL http://dx.doi.org/10.1111/j.1365-2958.2004.04144.x.
[553] William Harold Witola, Kamal El Bissati, Gabriella Pessi, Changan Xie, Paul D Roepe,and Choukri Ben Mamoun. Disruption of the plasmodium falciparum pfpmt gene re-sults in a complete loss of phosphatidylcholine biosynthesis via the serine-decarboxylase-phosphoethanolamine-methyltransferase pathway and severe growth and survival defects. JBiol Chem, 283(41):27636–27643, Oct 2008. doi: 10.1074/jbc.M804360200. URL http://dx.doi.org/10.1074/jbc.M804360200.
[554] Paul Workman. The opportunities and challenges of personalized genome-based moleculartherapies for cancer: targets, technologies, and molecular chaperones. Cancer ChemotherPharmacol, 52 Suppl 1:S45–S56, Jul 2003. doi: 10.1007/s00280-003-0593-0. URL http://dx.doi.org/10.1007/s00280-003-0593-0.
[555] Carsten Wrenger, Marie-Luise Eschbach, Ingrid B Müller, Nathan P Laun, Tadhg P Be-gley, and Rolf D Walter. Vitamin b1 de novo synthesis in the human malaria para-site plasmodium falciparum depends on external provision of 4-amino-5-hydroxymethyl-2-methylpyrimidine. Biol Chem, 387(1):41–51, Jan 2006. doi: 10.1515/BC.2006.007. URLhttp://dx.doi.org/10.1515/BC.2006.007.
[556] P. S. Wright, T. L. Byers, D. E. Cross-Doersen, P. P. McCann, and A. J. Bitonti. Irreversibleinhibition of s-adenosylmethionine decarboxylase in plasmodium falciparum-infected erythro-cytes: growth inhibition in vitro. Biochem Pharmacol, 41(11):1713–1718, Jun 1991.
156

BIBLIOGRAPHY
[557] F. Wunderlich, S. Fiebig, H. Vial, and H. Kleinig. Distinct lipid compositions of parasite andhost cell plasma membranes from plasmodium chabaudi-infected erythrocytes. Mol BiochemParasitol, 44(2):271–277, Feb 1991.
[558] Xu-Gang Xia, Hongxia Zhou, and Zuoshang Xu. Transgenic rnai: Accelerating and ex-panding reverse genetics in mammals. Transgenic Res, 15(3):271–275, Jun 2006. doi:10.1007/s11248-006-0023-2. URL http://dx.doi.org/10.1007/s11248-006-0023-2.
[559] Han Xie, Vladimir A Valera, Maria J Merino, Angela M Amato, Sabina Signoretti, William MLinehan, Vikas P Sukhatme, and Pankaj Seth. Ldh-a inhibition, a therapeutic strategy fortreatment of hereditary leiomyomatosis and renal cell cancer. Mol Cancer Ther, 8(3):626–635, Mar 2009. doi: 10.1158/1535-7163.MCT-08-1049. URL http://dx.doi.org/10.1158/1535-7163.MCT-08-1049.
[560] Iwei Yeh and Russ B Altman. Drug targets for plasmodium falciparum: a post-genomicreview/survey. Mini Rev Med Chem, 6(2):177–202, Feb 2006.
[561] Iwei Yeh, Theodor Hanekamp, Sophia Tsoka, Peter D Karp, and Russ B Altman. Compu-tational analysis of plasmodium falciparum metabolism: organizing genomic information tofacilitate drug discovery. Genome Res, 14(5):917–924, May 2004. doi: 10.1101/gr.2050304.URL http://dx.doi.org/10.1101/gr.2050304.
[562] Pamela Yeh, Ariane I Tschumi, and Roy Kishony. Functional classification of drugs by proper-ties of their pairwise interactions. Nat Genet, 38(4):489–494, Apr 2006. doi: 10.1038/ng1755.URL http://dx.doi.org/10.1038/ng1755.
[563] Zili You, Jian Huang, Ye Zheng, and Dezhong Yao. [rna interference in functional genomicsand medical research]. Sheng Wu Yi Xue Gong Cheng Xue Za Zhi, 21(5):848–851, Oct 2004.
[564] Jason A Young, Jeffery R Johnson, Chris Benner, S. Frank Yan, Kaisheng Chen, Karine G LeRoch, Yingyao Zhou, and Elizabeth A Winzeler. In silico discovery of transcription regulatoryelements in plasmodium falciparum. BMC Genomics, 9:70, 2008. doi: 10.1186/1471-2164-9-70.URL http://dx.doi.org/10.1186/1471-2164-9-70.
[565] Min Yu, T. R Santha Kumar, Louis J Nkrumah, Alida Coppi, Silke Retzlaff, Celeste DLi, Brendan J Kelly, Pedro A Moura, Viswanathan Lakshmanan, Joel S Freundlich, Juan-Carlos Valderramos, Catherine Vilcheze, Mark Siedner, Jennifer H-C Tsai, Brie Falkard,Amar Bir Singh Sidhu, Lisa A Purcell, Paul Gratraud, Laurent Kremer, Andrew P Wa-ters, Guy Schiehser, David P Jacobus, Chris J Janse, Arba Ager, William R Jacobs,James C Sacchettini, Volker Heussler, Photini Sinnis, and David A Fidock. The fatty acidbiosynthesis enzyme fabi plays a key role in the development of liver-stage malarial para-sites. Cell Host Microbe, 4(6):567–578, Dec 2008. doi: 10.1016/j.chom.2008.11.001. URLhttp://dx.doi.org/10.1016/j.chom.2008.11.001.
[566] Keizo Yuasa, Fumika Mi-Ichi, Tamaki Kobayashi, Masaya Yamanouchi, Jun Kotera, KiyoshiKita, and Kenji Omori. Pfpde1, a novel cgmp-specific phosphodiesterase from the humanmalaria parasite plasmodium falciparum. Biochem J, 392(Pt 1):221–229, Nov 2005. doi:10.1042/BJ20050425. URL http://dx.doi.org/10.1042/BJ20050425.
[567] L. Yue and W. C. Reisdorf. Pathway and ontology analysis: emerging approaches connectingtranscriptome data and clinical endpoints. Curr Mol Med, 5(1):11–21, Feb 2005.
[568] Mattia Zampieri, Nicola Soranzo, Daniele Bianchini, and Claudio Altafini. Origin of co-expression patterns in e. coli and s. cerevisiae emerging from reverse engineering algo-rithms. PLoS ONE, 3(8):e2981, 2008. doi: 10.1371/journal.pone.0002981. URL http://dx.doi.org/10.1371/journal.pone.0002981.
157
BIBLIOGRAPHY
[569] S. Zarchin, M. Krugliak, and H. Ginsburg. Digestion of the host erythrocyte by malariaparasites is the primary target for quinoline-containing antimalarials. Biochem Pharmacol, 35(14):2435–2442, Jul 1986.
[570] Ionela Zevedei-Oancea and Stefan Schuster. Topological analysis of metabolic networks basedon petri net theory. In Silico Biol, 3(3):323–345, 2003.
[571] Shihua Zhang, Guangxu Jin, Xiang-Sun Zhang, and Luonan Chen. Discovering functions andrevealing mechanisms at molecular level from biological networks. Proteomics, 7(16):2856–2869, Aug 2007. doi: 10.1002/pmic.200700095. URL http://dx.doi.org/10.1002/pmic.200700095.
[572] Y. Zhang and S. R. Meshnick. Inhibition of plasmodium falciparum dihydropteroate synthetaseand growth in vitro by sulfa drugs. Antimicrob Agents Chemother, 35(2):267–271, Feb 1991.
[573] Y. Zhang, S. Merali, and S. R. Meshnick. p-aminobenzoic acid transport by normal andplasmodium falciparum-infected erythrocytes. Mol Biochem Parasitol, 52(2):185–194, Jun1992.
[574] Y. A. Zhang, E. Hempelmann, and R. H. Schirmer. Glutathione reductase inhibitors as po-tential antimalarial drugs. effects of nitrosoureas on plasmodium falciparum in vitro. BiochemPharmacol, 37(5):855–860, Mar 1988.
[575] C. J. Zheng, L. Y. Han, C. W. Yap, Z. L. Ji, Z. W. Cao, and Y. Z. Chen. Therapeutic targets:progress of their exploration and investigation of their characteristics. Pharmacol Rev, 58(2):259–279, Jun 2006. doi: 10.1124/pr.58.2.4. URL http://dx.doi.org/10.1124/pr.58.2.4.
[576] Yingyao Zhou, Vandana Ramachandran, Kota Arun Kumar, Scott Westenberger, PhillippeRefour, Bin Zhou, Fengwu Li, Jason A Young, Kaisheng Chen, David Plouffe, Kerstin Henson,Victor Nussenzweig, Jane Carlton, Joseph M Vinetz, Manoj T Duraisingh, and Elizabeth AWinzeler. Evidence-based annotation of the malaria parasite’s genome using comparativeexpression profiling. PLoS One, 3(2):e1570, 2008. doi: 10.1371/journal.pone.0001570. URLhttp://dx.doi.org/10.1371/journal.pone.0001570.
[577] R. Zidovetzki, I. W. Sherman, J. Prudhomme, and J. Crawford. Inhibition of plasmodiumfalciparum lysophospholipase by anti-malarial drugs and sulphydryl reagents. Parasitology,108 ( Pt 3):249–255, Apr 1994.
[578] Thomas Zoller, Torsten J Naucke, Jürgen May, Bodo Hoffmeister, Holger Flick, Christopher JWilliams, Christina Frank, Frank Bergmann, Norbert Suttorp, and Frank P Mockenhaupt.Malaria transmission in non-endemic areas: case report, review of the literature and implica-tions for public health management. Malar J, 8:71, 2009. doi: 10.1186/1475-2875-8-71. URLhttp://dx.doi.org/10.1186/1475-2875-8-71.
158
List of Figures
1.1 Malaria endemic countries . . . . . . . . . . . . . . . . . . . . . . . . . . . . . . . . . 11.2 Iterative cycle of systems biology . . . . . . . . . . . . . . . . . . . . . . . . . . . . . 4
2.1 Life cycle of P. falciparum . . . . . . . . . . . . . . . . . . . . . . . . . . . . . . . . . 72.2 Drug discovery pipeline . . . . . . . . . . . . . . . . . . . . . . . . . . . . . . . . . . 13
4.1 Illustration of flux balance analysis . . . . . . . . . . . . . . . . . . . . . . . . . . . . 214.2 MinMode illustration . . . . . . . . . . . . . . . . . . . . . . . . . . . . . . . . . . . . 224.3 GIMME algorithm illustration . . . . . . . . . . . . . . . . . . . . . . . . . . . . . . 244.4 Illustration of the approach by Shlomi et al. to calculate metabolic fluxes consistent
with gene expression data . . . . . . . . . . . . . . . . . . . . . . . . . . . . . . . . . 264.5 Illustration of the E-Flux method . . . . . . . . . . . . . . . . . . . . . . . . . . . . . 274.6 Flux control coefficients and concentration coefficients in metabolic control analysis . 284.7 Illustration of choke-points. . . . . . . . . . . . . . . . . . . . . . . . . . . . . . . . . 294.8 Illustration of minimal cut sets concept . . . . . . . . . . . . . . . . . . . . . . . . . 30
5.1 Metabolic network scheme . . . . . . . . . . . . . . . . . . . . . . . . . . . . . . . . . 335.2 Overview of metabolic pathways present in P. falciparum . . . . . . . . . . . . . . . 35
6.1 Normalized Hamming distance matrix for gene expression samples . . . . . . . . . . 436.2 Bozdech gene expression samples mapped onto metabolic pathways . . . . . . . . . . 446.3 Le Roch gene expression samples mapped onto metabolic pathways . . . . . . . . . . 456.4 Tarun gene expression samples mapped onto metabolic pathways . . . . . . . . . . . 466.5 Daily gene expression samples mapped onto metabolic pathways . . . . . . . . . . . 476.6 Illustration of developed flux balance approach to predict life cycle specific metabolism 516.7 Normalized Hamming distance matrix for calculated flux distributions . . . . . . . . 536.8 Predicted host parasite metabolite exchanges . . . . . . . . . . . . . . . . . . . . . . 546.9 Normalized Hamming distance matrix for calculated flux distributions using improved
algorithm . . . . . . . . . . . . . . . . . . . . . . . . . . . . . . . . . . . . . . . . . . 566.10 Predicted host parasite metabolite exchanges using improved algorithm . . . . . . . 576.11 Reaction distribution among stage-specific fluxes . . . . . . . . . . . . . . . . . . . . 586.12 Predicted metabolic fluxes consistent with Bozdech gene expression data mapped onto
metabolic pathways . . . . . . . . . . . . . . . . . . . . . . . . . . . . . . . . . . . . 626.13 Predicted metabolic fluxes consistent with Le Roch gene expression data mapped onto
metabolic pathways . . . . . . . . . . . . . . . . . . . . . . . . . . . . . . . . . . . . 636.14 Predicted metabolic fluxes consistent with Daily gene expression data mapped onto
metabolic pathways . . . . . . . . . . . . . . . . . . . . . . . . . . . . . . . . . . . . 646.15 Overlap of experimentally determined proteins with stage-specific sets of enzymes
predicted to be active . . . . . . . . . . . . . . . . . . . . . . . . . . . . . . . . . . . 656.16 Overlap of experimentally determined metabolites with stage-specific sets of meta-
bolites predicted to be present . . . . . . . . . . . . . . . . . . . . . . . . . . . . . . 666.17 Overview of pathway specific consensus reactions for different time points of intraery-
throcytic cycle . . . . . . . . . . . . . . . . . . . . . . . . . . . . . . . . . . . . . . . 67
159

LIST OF FIGURES
7.1 Evaluation of predicted drug targets . . . . . . . . . . . . . . . . . . . . . . . . . . . 78
160

List of Tables
2.1 Established and suggested targets for antimalarial drugs . . . . . . . . . . . . . . . . 10
5.1 Overview of assembled metabolic networks for P. falciparum and the human erythrocyte 345.2 Essential metabolites for parasite and erythrocyte . . . . . . . . . . . . . . . . . . . 37
6.1 Metabolite exchanges between parasite and host: prediction vs. experiment . . . . . 59
7.1 Gold standard set of essential enzymes . . . . . . . . . . . . . . . . . . . . . . . . . . 747.2 Top ranking predicted essential reactions . . . . . . . . . . . . . . . . . . . . . . . . . 81
1 Gene expression samples . . . . . . . . . . . . . . . . . . . . . . . . . . . . . . . . . . 872 Proteomics data sets . . . . . . . . . . . . . . . . . . . . . . . . . . . . . . . . . . . . 973 Metabolomics data sets . . . . . . . . . . . . . . . . . . . . . . . . . . . . . . . . . . 99
4 Ranked predicted essential reactions . . . . . . . . . . . . . . . . . . . . . . . . . . . 101
161

AbbreviationsAbbreviation ExplanationACT artemisinin-based combination therapyATP adenosine triphosphateBLAST Basic Local Alignment Search ToolBRENDA Braunschweig Enzyme DatabasecDNA complementary DNAChIP chromatin immunoprecipitationCoA Coenzyme ACSP circumsporozoite proteinDDT dichlorodiphenyltrichloroethaneDNA deoxyribonucleic acidEC enzyme commissionEM elementary modeFBA flux balance analysisGIMME Gene Inactivity Moderated by Metabolism and ExpressionGO Gene OntologyHTS high-throughput-screeningIDC intraerythrocytic developmental cycleKEGG Kyoto Encyclopedia of Genes and GenomesKO KEGG OrthologyMCA metabolic control analysisMCS minimal cut setMinMode minimal flux modeMPMP Malaria Parasite Metabolic PathwaysmRNA messenger RNAORF open reading framePCR polymerase chain reactionRNA ribonucleic acidWHO World Health Organization
162

AcknowledgementsAs with every larger project, multiple people contributed to reach the final goal, in this case thecompletion of my thesis. Therefore, I would like to express my gratitude to several people. Firstof all, I want to thank Prof. Hermann-Georg Holzhütter who supervised and supported this work.I’m very happy that he allowed me to change my thesis project. His doors were always open to me,and he provided me with valuable advice throughout the work. The second person who always hadan ear for all kinds of problems is my colleague Andreas Hoppe. He introduced me to the topicsof network reconstruction and flux balance analysis and provided the FASIMU tools to conductflux balance knock-out simulations. In addition, he was very helpful in the writing process of thisthesis. Furthermore, I would like to thank all former and actual members of the AG Holzhütter forcreating a friendly atmosphere and continual willingness to help and discuss problems. I enjoyedour non-work related get-togethers, especially during the final phase of this thesis. In particular,I want to give thanks to Sabrina Hoffmann for our inspiring talks, Sascha Bulik for helpful adviceand proof-reading the manuscript, Oliver Frey for proof-reading the manuscript and Iwona Wallachas well as Anja Karlstädt for helping me with organizational issues especially after moving awayfrom Berlin. Moreover, I’m grateful for the assistance I received from Nishith Gupta and HagaiGinsburg with respect to parasitology related questions. Last but not least, I want to thank myparents and Eugen Doce who helped me to finish this work with their patience and encouragement intimes of self-doubts. Finally, this thesis would not have been possible without the financial supportof the German Research Foundation (DFG), which additionally facilitated within the scope of theInternational Research Training Group (IRTG) interesting meetings with other PhD students fromGermany and abroad.
163

DeclarationHerewith, I declare that I prepared the present dissertation myself and without the use of illegitimateaids. I used no other but the indicated sources and accessories. Further, I insure that this dissertationhas not before been submitted to any other faculty for examination.
Berlin, Carola Huthmacher
164
Copyright © 2022 FDOKUMEN