strategies for amassing, characterizing, and applying
225
STRATEGIES FOR AMASSING, CHARACTERIZING, AND APPLYING THIRD-PARTY METADATA IN BIOINFORMATICS by BENJAMIN MCGEE GOOD B.Sc., The University of California at San Diego, 1998 M.Sc., The University of Sussex, 2000 A THESIS SUBMITTED IN PARTIAL FULFILMENT OF THE REQUIREMENTS FOR THE DEGREE OF DOCTOR OF PHILOSOPHY in THE FACULTY OF GRADUATE STUDIES (Bioinformatics) THE UNIVERSITY OF BRITISH COLUMBIA (Vancouver) April 2009 © Benjamin McGee Good, 2009
-
Upload
khangminh22 -
Category
Documents
-
view
1 -
download
0
Transcript of strategies for amassing, characterizing, and applying

STRATEGIES FOR AMASSING, CHARACTERIZING, AND APPLYINGTHIRD-PARTY METADATA IN BIOINFORMATICS
by
BENJAMIN MCGEE GOOD
B.Sc., The University of California at San Diego, 1998M.Sc., The University of Sussex, 2000
A THESIS SUBMITTED IN PARTIAL FULFILMENT OFTHE REQUIREMENTS FOR THE DEGREE OF
DOCTOR OF PHILOSOPHY
in
THE FACULTY OF GRADUATE STUDIES
(Bioinformatics)
THE UNIVERSITY OF BRITISH COLUMBIA
(Vancouver)
April 2009
© Benjamin McGee Good, 2009
ii
Abstract
Bioinformatics resources on the Web are proliferating rapidly. For biomedical
researchers, the vital data they contain is often difficult to locate and to integrate. The
semantic Web initiative is an emerging collection of standards for sharing and integrating
distributed information resources via the World Wide Web. In particular, these standards
define languages for the provision of the metadata that facilitates both discovery and
integration of distributed resources. This metadata takes the form of ontologies used to
annotate information resources on the Web. Bioinformatics researchers are now
considering how to apply these standards to enable a new generation of applications that
will provide more effective ways to make use of increasingly diverse and distributed
biological information. While the basic standards appear ready, the path to achieving the
potential they entail is muddy. How are we to create all of the needed ontologies? How
are we to use them to annotate increasingly large bodies of information? How are we to
judge the quality of these ontologies and these proliferating annotations? As new
metadata generating systems emerge on the Web, how are we to compare these to
previous systems? The research conducted for this dissertation seeks new answers to
these questions. Specifically, it investigates strategies for amassing, characterizing, and
applying metadata (the substance of the semantic Web) in the context of bioinformatics.
The strategies for amassing metadata orient around the design of systems that motivate
and guide the actions of many individual, third-party contributors in the formation of
collective metadata resources. The strategies for characterizing metadata focus on the
derivation of fully automated protocols for evaluating and comparing ontologies and
related metadata structures. New applications demonstrate how distributed information
sources can be dynamically integrated to facilitate both information visualization and
analysis. Brought together, these different lines of research converge towards the genesis
of systems that will allow the biomedical research community to both create and maintain
a semantic Web for the life sciences and to make use of the new capabilities for
knowledge sharing and discovery that it will enable.

iii
Table of Contents
Abstract .......................................................................................................................iiTable of Contents ...........................................................................................................iiiList of Tables ................................................................................................................viiList of Figures..............................................................................................................viiiGlossary ....................................................................................................................... x
References for glossary ............................................................................................xiiiPreface .................................................................................................................... xivAcknowledgements ....................................................................................................... xvCo-authorship statement..............................................................................................xvii1 Introduction............................................................................................................. 1
1.1 Dissertation overview ...................................................................................... 11.2 Informatics and bioinformatics ........................................................................ 21.3 Metadata.......................................................................................................... 31.4 Third-party metadata........................................................................................ 41.5 The World Wide Web...................................................................................... 4
1.5.1 Unique identification................................................................................ 61.6 The semantic Web ........................................................................................... 6
1.6.1 The Resource Description Framework...................................................... 71.6.2 Ontology.................................................................................................. 81.6.3 The Web ontology language..................................................................... 91.6.4 Ontologies in bioinformatics .................................................................... 9
1.7 Prospects for a semantic Web for the life sciences ......................................... 101.8 Background on crowdcasting for knowledge acquisition................................ 131.9 Passive distributed metadata generation via social tagging ............................. 151.10 Dissertation objectives and chapter summaries............................................... 16References................................................................................................................. 21
2 Fast, cheap and out of control: a zero-curation model for ontology development ... 242.1 Introduction ................................................................................................... 242.2 Experimental context and target application for the YI Ontology ................... 252.3 Motivation and novelty of conference-based knowledge capture.................... 252.4 Interface design ............................................................................................. 26
2.4.1 Specific challenges faced in the conference domain ............................... 272.5 Methods - introducing the iCAPTURer.......................................................... 27
2.5.1 Preprocessing......................................................................................... 272.5.2 Priming the knowledge acquisition templates - term selection ................ 272.5.3 Term evaluation ..................................................................................... 282.5.4 Relation acquisition................................................................................ 282.5.5 Volunteer recruitment and reward .......................................................... 29
2.6 Observations.................................................................................................. 292.7 Quantitative results ........................................................................................ 30
2.7.1 Volunteer contributions.......................................................................... 302.7.2 Composition of the YI Ontology ............................................................ 302.7.3 Relationships in the YI Ontology ........................................................... 31
2.8 Quality assessment ........................................................................................ 31

iv
2.9 Summary ....................................................................................................... 322.10 Discussion ..................................................................................................... 33References................................................................................................................. 37
3 Ontology engineering using volunteer labour......................................................... 383.1 Introduction ................................................................................................... 383.2 Creating an OWL version of MeSH ............................................................... 393.3 Experiment .................................................................................................... 39
3.3.1 Test data ................................................................................................ 393.4 Results........................................................................................................... 40
3.4.1 Performance of aggregated responses..................................................... 403.5 Discussion and future work............................................................................ 41References................................................................................................................. 43
4 OntoLoki: an automatic, instance-based method for the evaluation of biologicalontologies on the semantic Web .................................................................................... 44
4.1 Background ................................................................................................... 444.2 Results........................................................................................................... 45
4.2.1 OntoLoki method................................................................................... 454.2.2 Implementation ...................................................................................... 474.2.3 Testing................................................................................................... 524.2.4 Evaluating biological ontologies ............................................................ 58
4.3 Discussion ..................................................................................................... 674.3.1 Making use of OntoLoki ........................................................................ 674.3.2 Future work ........................................................................................... 684.3.3 Conclusions ........................................................................................... 69
References................................................................................................................. 815 Term based comparison metrics for controlled and uncontrolled indexing languages. 83
5.1 Introduction ................................................................................................... 835.2 Metrics for comparing term-sets .................................................................... 85
5.2.1 Intra-term-set measures .......................................................................... 865.2.2 Inter-term-set measures .......................................................................... 87
5.3 Demonstration and evaluation of proposed metrics ........................................ 905.3.1 Sample................................................................................................... 905.3.2 Data analysis.......................................................................................... 915.3.3 Findings – intra-set ................................................................................ 935.3.4 Findings – inter-set ................................................................................ 97
5.4 Discussion ................................................................................................... 1005.4.1 Comparative quality evaluation............................................................ 1015.4.2 Term-set warrant.................................................................................. 1015.4.3 Relationship of term-set shape to theoretical type................................. 102
5.5 Future work ................................................................................................. 1025.6 Conclusion................................................................................................... 103References............................................................................................................... 121
6 Social tagging in the life sciences: characterizing a new metadata resource.......... 1236.1 Background ................................................................................................. 1236.2 Results......................................................................................................... 126
6.2.1 Resource Coverage .............................................................................. 126

v
6.2.2 Density ................................................................................................ 1286.2.3 Inter-annotator agreement .................................................................... 1306.2.4 Agreement with MeSH indexing .......................................................... 1326.2.5 Improving agreement with MeSH through voting................................. 1336.2.6 An anecdotal example where many tags are present ............................. 134
6.3 Discussion ................................................................................................... 1366.4 Conclusions ................................................................................................. 1396.5 Methods....................................................................................................... 140
6.5.1 Data acquisition ................................................................................... 1406.5.2 Resource coverage ............................................................................... 1416.5.3 Tag density .......................................................................................... 1416.5.4 Calculation of Positive Specific Agreement (PSA)............................... 1416.5.5 String standardization for tag comparisons ........................................... 1426.5.6 Mapping tags and descriptors to UMLS concepts ................................. 143
References............................................................................................................... 1547 Open semantic annotation: an experiment with BioMoby Web services............... 157
7.1 Background ................................................................................................. 1577.1.1 BioMoby.............................................................................................. 160
7.2 Moby Annotator .......................................................................................... 1627.3 Evaluating semantic annotations .................................................................. 1647.4 Results......................................................................................................... 165
7.4.1 Users.................................................................................................... 1657.4.2 Services ............................................................................................... 1657.4.3 Taggings .............................................................................................. 1667.4.4 Tag density .......................................................................................... 1667.4.5 Inter-annotator agreement .................................................................... 1667.4.6 Agreement with standard...................................................................... 167
7.5 Discussion ................................................................................................... 1707.6 Conclusions ................................................................................................. 173References............................................................................................................... 180
8 iHOPerator: User-scripting a personalized bioinformatics Web, starting with theiHOP website .............................................................................................................. 183
8.1 Background ................................................................................................. 1838.1.1 iHOP.................................................................................................... 1848.1.2 Tag clouds ........................................................................................... 184
8.2 Implementation............................................................................................ 1858.2.1 GreaseMonkey..................................................................................... 1858.2.2 Generating tag clouds........................................................................... 1868.2.3 Integrating 3rd-party content ................................................................ 186
8.3 Related work ............................................................................................... 1878.4 Discussion ................................................................................................... 1878.5 Conclusions ................................................................................................. 189References............................................................................................................... 194
9 Conclusion .......................................................................................................... 1959.1 Summary ..................................................................................................... 1959.2 Conclusions ................................................................................................. 196

vi
9.3 Future work ................................................................................................. 1989.4 Closing remarks........................................................................................... 202References............................................................................................................... 205
Appendix 1. Data collection for chapter 5: assembly of term-sets ................................ 206

vii
List of Tables
Table 2.1. Captured terms ............................................................................................. 34Table 2.2. Hyponyms .................................................................................................... 34Table 2.3. Synonyms..................................................................................................... 34Table 2.4. Examples of assertions and associated votes ................................................. 34Table 3.1. Performance on subclass-assessment task using the different aggregation
methods................................................................................................................. 42Table 4.1. Phosphabase knowledge base statistics ......................................................... 70Table 4.2. PSORTb knowledge base statistics ............................................................... 70Table 4.3. Attributes of the Cellular Component ontology (Sept. 2007) ......................... 70Table 5.1. Examples of OLP term classifications......................................................... 104Table 5.2. Explanation of the OLP Flexibility measure................................................ 104Table 5.3. Parameters of term-sets............................................................................... 105Table 5.4. Term-sets.................................................................................................... 106Table 5.5. Size and composition of term-sets............................................................... 107Table 5.6. Modularity measurement ratios................................................................... 108Table 5.7. Measurements of term length...................................................................... 109Table 5.8. Factor loadings from maximum likelihood factor analysis using three factors
............................................................................................................................ 110Table 5.9. Term-set pairs with the highest F-measures ................................................ 110Table 5.10. Precision/Recall estimates of the similarity between MeSH and three
folksonomies ....................................................................................................... 111Table 5.11. F measures of the similarity between MeSH and three folksonomies......... 111Table 6.1. Tag density in Connotea, CiteULike and MEDLINE on PubMed citations.. 144Table 6.2. Examples of different levels of granularity.................................................. 144Table 6.3. Positive Specific Agreement among pairs of social taggers on PubMed
citations............................................................................................................... 145Table 6.4. Average agreement between social tagging aggregates and MeSH indexing.
............................................................................................................................ 145Table 7.1. Reported semantic annotation performance measured by positive specific
agreement............................................................................................................ 174Table 7.2. Density of tags associated with 872 taggings of web service input/output
objects................................................................................................................. 174Table 7.3. Density of tags associated with 400 taggings of web service operations ...... 174Table 7.4. Positive specific agreement, semantic and free tags for objects and operations
............................................................................................................................ 175Table 7.5. Average agreement between each user and standard ................................... 175
viii
List of Figures
Figure 1.1. Third-party metadata providers.................................................................... 20Figure 2.1. Hyponym collection .................................................................................... 35Figure 2.2. Distribution of participant contributions. ..................................................... 35Figure 2.3. Positive consensus agreement...................................................................... 36Figure 3.1. Volume of participation per volunteer ......................................................... 42Figure 4.1. The input and the output for the OntoLoki method ...................................... 71Figure 4.2. Sample RDF description of the UniProt protein P35829, an S-layer protein
precursor from Lactobacillus acidophilus .............................................................. 72Figure 4.3. The complete cycle of ontology evaluation using the OntoLoki method ...... 73Figure 4.4. The average performance of different learning algorithms on predicting the
classes in the Phosphabase knowledge base ........................................................... 74Figure 4.5. Results for the Chi25_JRip algorithm as increasing amounts of noise are
added to the Phosphabase knowledge base............................................................. 75Figure 4.6. Effects of increasing noise on the performance of Chi25_Jrip and ZeroR as
indicated by the average F measure for each evaluated class.................................. 76Figure 4.7. Average performance of different classifiers according to each reported
statistic for the PSORTb classes ............................................................................ 77Figure 4.8. Classification consistency for PSORTb classes using the JRip algorithm..... 78Figure 4.9. Inferred classification consistency for PSORTb classes ............................... 79Figure 4.10. Classification consistency of a sample of classes from the Cellular
Component branch of the Gene Ontology .............................................................. 80Figure 5.1. Set comparison operations ......................................................................... 112Figure 5.2. The effect of phase 2 normalization on the size of the term-set .................. 113Figure 5.3. %Uniterms verse OLP flexibility............................................................... 114Figure 5.4. Radar graph of the MeSH thesaurus........................................................... 115Figure 5.5. Radar graph of the Association for Computing Machinery (ACM) thesaurus
............................................................................................................................ 115Figure 5.6. Radar graph of the Connotea folksonomy.................................................. 115Figure 5.7. Radar graph of the Bibsonomy folksonomy............................................... 116Figure 5.8. Radar graph of the CiteULike folksonomy ................................................ 116Figure 5.9. Radar graph of term-set from Gene Ontology Biological Process (GO_BP)
............................................................................................................................ 117Figure 5.10. Radar graph of term-set from the Foundational Model of Anatomy (FMA)
............................................................................................................................ 117Figure 5.11. All against all comparison using the F-measure ....................................... 118Figure 5.12. All against all comparison using Precision/Recall.................................... 119Figure 5.13. Differences between the full Connotea term-set and the Connotea term-set
with batch uploaded bookmark posts removed..................................................... 120Figure 6.1. Data captured in tagging events (posts)...................................................... 146Figure 6.2. The increase in distinct new biomedical citations indexed per month by
CiteULike and by MEDLINE.............................................................................. 147Figure 6.3. The number of distinct tags assigned per PubMed citation......................... 148Figure 6.4. Relationship between number of PubMed citations and number of posts per
citation ................................................................................................................ 149

ix
Figure 6.5. Increase in tag density per PubMed citation with increase in number of postsper citation .......................................................................................................... 150
Figure 6.6. Precision increase and coverage decrease with voting in CiteULike........... 151Figure 6.7. Decrease in coverage as voting threshold increases.................................... 152Figure 6.8. Tags for a popular PubMed citation from Connotea and CiteULike ........... 153Figure 7.1. Structure of annotations in the Semantic Tagging ontology ....................... 176Figure 7.2. Screenshot of Moby Annotator .................................................................. 177Figure 7.3. Agreement with standard for aggregations created through different minimum
vote thresholds on service input/output object annotations................................... 178Figure 7.4. Agreement with standard for aggregations created through different minimum
vote thresholds on service operation annotations.................................................. 179Figure 8.1. Default iHOP page displaying the defining information for VEGF ............ 190Figure 8.2. A tag cloud built from MESH terms associated with Brca1 ....................... 191Figure 8.3. A tag cloud built from genes related to Brca1 ............................................ 191Figure 8.4. The iHOP webpage enhanced by the iHOPerator user-script...................... 192Figure 8.5. The iHOP webpage for IRF-3, enhanced with a tag cloud and a pathway
diagram using the iHOPerator user-script ............................................................ 193

x
Glossary
Many of the words defined here have a variety of different meanings. All of the provided
definitions are specific to the use of the defined word in the context of this dissertation.
Terms defined explicitly in the text of the introduction, such as ‘social tagging’, are not
included here. A list of references cited is included at the end of the glossary.
Aggregate: A mass, assemblage, or sum of particulars; something consisting of elements
but considered as a whole [1]. For example, the elements might constitute votes by
individuals in an election while the whole might represent the result of the election.
Annotation: The act of or the product of associating metadata with a particular resource.
The form of this metadata can vary from notes written in natural language to indexing
with a formal language. The most common usage within bioinformatics is likely in
the context of ‘genome annotation’ in which descriptive information representing
particular interpretations of experimental evidence are associated with regions of an
organism’s genetic sequence.
Artificial Intelligence (AI): The attempt to endow computers with human-like cognitive
abilities.
Assertion: A statement of knowledge such as ‘all mammals have hair’ or ‘Mark
Wilkinson is a human’. Usually used in the context of formalized knowledge – a
knowledge base is composed of a set of assertions.
Curation: The manual extraction of information, often from text, by a domain expert with
the aim to transform that information into structured knowledge [2]. For example, the
Gene Ontology is the product of the work of biologists who encode information
gathered from the scientific literature into statements that link precisely defined
concepts like ‘apoptosis’ and ‘programmed cell death’ together with the formal
relationships “is a” and “part of” [3].
Description Logic (DL) : A knowledge representation formalism, of which several
examples exist, which can be used to represent class descriptions such that efficient
algorithms for reasoning with those descriptions can be applied. One of the variants
of the OWL language, OWL DL, is an example of a description logic.

xi
F-measure: the harmonic mean of precision and recall (defined below). It provides a
single measurement with which to characterize the performance of class prediction
and information retrieval algorithms.
Folksonomy: A combination of the words ‘folk’ and ‘taxonomy’ usually used to describe
a collection of user-generated (hence the ‘folk’) free-text tags produced within the
context of a social classification (hence the ‘taxonomy’) system like Del.icio.us or
Connotea [4].
Indexing: Tennis (2006) defines indexing as ‘an act where an indexer in a particular
context, goes through a process of analyzing a document for its significant
characteristics, using some tools to represent those characteristics in an information
system for a user’ [5]. I use ‘indexing’, ‘annotation’, and ‘metadata provision’
interchangeably throughout this dissertation.
Indexing language: a set of terms used in an index to represent topics or features of the
items indexed. Notice that this definition spans both controlled languages and
uncontrolled languages. Examples of indexing languages thus include the Medical
Subject Headings (MeSH) thesaurus [6], the Gene Ontology [3], and the Connotea
folksonomy [7].
Knowledge: information that makes intelligent action possible.
Knowledge acquisition: The translation of knowledge from unstructured sources such as
human minds or texts into formulations useful for computation.
Knowledge base: A collection of knowledge represented in a machine-interpretable
form. In semantic Web applications, a distinction is often made between the ontology
that defines possible statements that can be made about Web resources and the
knowledge base that contains both the ontology and these assertions. This dichotomy
is analogous to the relationship between a database schema and a populated database.
Machine learning: a collection of algorithms used in programs that improve their
performance based on the results of their operations. There are many kinds of
machine learning. The main type used within this dissertation is known as
‘supervised learning’. In supervised learning, algorithms learn predictive functions
from labelled training data.
xii
Mass collaboration: large numbers of people coming together to create something or to
solve a problem.
Ontology evaluation: a process through which features of an ontology pertinent to its
improvement or comparison to other ontologies are identified.
Precision : in the context of binary class prediction, the precision of a predictor may be
estimated through the analysis of its performance on an evaluation set containing
correctly labelled true and false samples. It is equal to the number of true positives
divided by the total number of predicted positives. Precision is used to estimate the
likelihood that the predictor will be correct if it makes a ‘true’ prediction. In
information retrieval, the same measurement is used and true positives are denoted by
documents deemed to be relevant to a query with false positives deemed irrelevant. It
is used in combination with measures of recall.
Recall: recall for a binary class predictor is equal to the number of predicted positives
divided by the total number of positives in an evaluation set. It quantifies the
likelihood that the predictor will identify the true positives in the set, without regard
for how many false positives it generates in the process. It is used in combination
with precision.
Social Semantic Tagging: social tagging using controlled vocabularies [8].
Subsumption: The term “subsumption” defines a specific relationship between two
classes A and B such that, if A subsumes B, then all instances of B must also be
instances of A. In subsumption reasoning, an algorithm is used to determine which
classes are subsumed by which other classes. The inference of subsumption is
enabled by class definitions that incorporate logical constraints. This type of
reasoning can provide substantial benefits during the construction of very large
ontologies by ensuring that the ontology is semantically consistent [9], can be used
for classification of unidentified instances, and for query answering.
Tag: a keyword, often used to describe terms used by users of social tagging services to
label items in their collections.
Tag cloud: a collage-like visualization of a set of terms where the size of the terms and
sometimes their colour is used to indicate features such as the frequency of their
occurrence in a text.
xiii
Thesaurus: a controlled vocabulary that defines relationships between its terms such as
broader-than, narrower-than, synonym, and related.
User-script: a computer program that is installed within a Web browser to manipulate the
display of Web pages, for example, to remove advertisements or to add visual
enhancements.
URI: Uniform Resource Indicator. URIs are short strings of characters used to refer to
resources on the Web.
URL: Uniform Resource Locator. URLs are a subset of URIs that encode both a unique
identifier and a description of how to retrieve the identified resource. For example,
the URL ‘http://www.google.com’ indicates that the resource named
‘www.google.com’ can be retrieved using a request issued according to the HTTP
(hypertext transfer) protocol.
References for glossary
1. aggregate - Wiktionary [http://en.wiktionary.org/wiki/aggregate]2. BioCreative glossary
[http://biocreative.sourceforge.net/biocreative_glossary.html]3. Ashburner M, Ball CA, Blake JA, Botstein D, Butler H, Cherry JM, Davis AP,
Dolinski K, Dwight SS, Eppig JT et al: Gene ontology: tool for the unificationof biology. The Gene Ontology Consortium. Nature Genetics 2000, 25(1):25-29.
4. Hammond T, Hannay T, Lund B, Scott J: Social Bookmarking Tools (I): AGeneral Review. D-Lib Magazine 2005, 11(4).
5. Tennis JT: Social Tagging and the Next Steps for Indexing. In: 17th ASIS&TSIG/CR Classification Research Workshop: 2006; Austin, Texas; 2006.
6. Medical Subject Headings (MESH) Fact Sheet[http://www.nlm.nih.gov/pubs/factsheets/mesh.html]
7. Lund B, Hammond T, Flack M, Hannay T: Social Bookmarking Tools (II): ACase Study - Connotea. D-Lib Magazine 2005, 11(4).
8. Good BM, Kawas EA, Wilkinson MD: Bridging the gap between social taggingand semantic annotation: E.D. the Entity Describer. Available from NaturePrecedings. [http://hdl.handle.net/10101/npre.2007.945.2] 2007.
9. Rector A, Horrocks I: Experience building a large, re-usable medical ontologyusing a description logic with transitivity and concept inclusions. In: AAAI'97: 1997; Menlo Park, California: AAAI Press; 1997.
xiv
Preface
This dissertation has been prepared according to the guidelines for manuscript-based
theses set out by the University of British Columbia. Following these guidelines, the
relevant references, figures, and tables are included at the end of each chapter. Aside
from the introduction and the conclusion, each chapter represents a complete,
independent body of work suitable for publication. For the chapters that have already
been published, no changes other than minor reformatting have been made.

xv
Acknowledgements
During the long course of the explorations that led to this dissertation, I have been helped
along at many points by a variety of different people.
Mark Wilkinson has been a steadfast supporter throughout the process. I thank him for
standing by me in the face of adversity, for patiently putting up with my first (and second
and sixteenth) drafts, for his unrelenting attempts to ‘deflower’ my scientific writing, for
sending me all over the world to learn, and for always demonstrating a willingness to
help when called upon. Joe Tennis has also suffered through many of my rough drafts
and has opened up whole new realms of knowledge for me that I otherwise would never
have been aware. To my other committee members, Ryan, Francis, and Bruce, I thank
you for your patience, openness to perhaps unusual ideas, and your commitment to
improving the quality of my science.
In my travels, I have been lucky to find helpful advice from a number of excellent
scholars. In particular, I would like to thank Timothy Chklovski, Yolanda Gil, Marco
Roos, Andy Gibson, Carole Goble, Marijke Keet, Alex Garcia, Duncan Hull, Francois
Belleau and Robert Stevens for providing both inspiration and advice to which I should
have paid more attention. You have all helped to affirm my beliefs in the amazing
possibilities enabled by a truly global scientific community.
Locally, thanks go to fellow students for helping me through the many trials of graduate
school by providing both useful discussions, necessary commiserations, and vital
celebrations. Thanks in particular go to Carri-Lyn Mead who has marched along with me
from the very beginning, Perseus Missirlis, the Griffith brothers, Jens Wawerla, and
Morgan Langille. I am honoured to have been in your company and can’t wait to see
what you all become.
Many of the projects I’ve undertaken would not have been possible without the help of
the talented young software engineers that have come through our laboratory. Thanks
first of all go to Eddie Kawas who has grown beside me from a promising hacker into a

xvi
professional engineer – its been a pleasure to work with you Ed! Thanks also to the
gifted coop and rotation students that have taken part in my projects: Clarence Kwan, Chi
Kin-Ho, Gavin Ha, and Paul Lu.
Finally, thanks to my family. You are the foundation of all my strength. To my parents
and my sisters, thank you for your constant love and support, it is something that I have
always depended on without thinking and I would be nowhere without it. Finally, to
Oanh, you have given more to me than I could ever ask, thank you for riding along with
me through the storms and the doldrums of this journey and for reaching down and lifting
me back up every time I started to drift beneath the surface.

xvii
Co-authorship statement
I was primarily responsible for the identification and design of the research program
described in this dissertation as well as all research, data analyses, and manuscript
preparation. Portions of this dissertation were prepared as multi-author publications. The
contributions of the other authors are discussed here. I was the primary author on each
accepted publication (Ch. 2,3,5,8) and each of the included manuscripts-in-preparation
(Ch. 4,6,7). Mark Wilkinson contributed supervision, concepts, and editorial suggestions
for all chapters with the exception of Chapter 5. Joe Tennis contributed concepts and
editorial suggestions for Chapters 5 and 6. Erin Tranfield, Poh Tan, Marlene Shehata,
Gurpreet Singhera, and John Gosselink were included as authors on the manuscript
presented in Chapter 2 because of their extensive, volunteer contributions to the
construction and evaluation of the ontology described in that chapter. Gavin Ha and Chi
Kin Ho contributed software development and editorial suggestions for Chapter 4.
Edward Kawas contributed software development for Chapters 7 and 8. Paul Lu
contributed software development for Chapter 7. Byron Kuo contributed software
support and editorial comments for Chapter 8. All co-authors of each of the chapters of
this dissertation have read this statement and are in agreement with what I wrote.

1
1 Introduction
“Branche le monde”
François Belleau1, 2008
This dissertation is about new strategies for metadata provision and use in the context of
biological information systems. These strategies are guided by the philosophy of openness upon
which the World Wide Web was founded and the unprecedented opportunities for global-scale
collaboration that the ubiquity of the Web now enables. Through the development and
evaluation of these new approaches, I hope to help in the ongoing movement to bring about a
unified semantic Web of biological and medical information. Within this semantic Web, shared
metadata structures would be associated with widely distributed information resources – both
enhancing their value independently and offering new potential for automating the process of
integration.
1.1 Dissertation overview
In the research described in this dissertation, I investigate new strategies to support aspects of the
cycle of bioinformatics-driven research that involve the formation and use of metadata. In
particular, I focus on metadata generated by third-parties and represented and shared according
to the recently adopted standards of the World Wide Web Consortium’s (W3C) semantic Web
initiative. The focus on ‘third-party’ emphasizes the role of individual contributors as opposed
to centralized institutions in the formation of collective metadata resources. This shift from top-
down, authoritative control over the creation and maintenance of such resources towards more
bottom-up approaches in which everyone is encouraged to participate provides both new
opportunities and new challenges. As demonstrated best by Wikipedia, open processes can
sometimes engage large numbers of people in the formation of collectively useful resources at
relatively low costs. However, methodologies for designing such systems and evaluating their
products are still in their infancy. For example, little is known about what tasks open systems can
be used effectively to accomplish, how interface and incentive design affects the process, or how
to judge the quality of the products of such collective labour. Here, I investigate new third-party
1 ‘Branche le monde’ roughly translates to ‘connect the world’.

2
approaches designed for application in the domain of bioinformatics. Broadly, I introduce and
evaluate strategies for amassing metadata from volunteer contributions, for automatically
characterizing the products of different metadata generating systems, and for applying metadata
to problems in bioinformatics related to the presentation and analysis of distributed information.
The specific projects undertaken address the following questions:
(1) How might a volunteer-driven (‘crowdcasting’) model of knowledge acquisition work togather the components of a biological ontology?
(2) How can useful, objective assessments of ontology quality be generated automatically?
(3) How can diverse forms and instantiations of metadata structures ranging fromfolksonomies to ontologies be characterized and directly compared?
(4) How do the products of the open ‘social tagging systems’ emerging on the Web compareto the products of professional annotation systems in a biomedical context?
(5) How can open annotation systems be designed that move the annotation quality closer tothat of expert-curation systems without losing the utility of the open environment?
(6) When Web-based semantic metadata becomes widely accessible, how can we harness itto enable knowledge discovery?
In these studies, I attempt to strike a balance between a constructivist approach to information
systems research in which novel approaches are created for the purpose of evaluating them and a
more naturalistic approach which seeks a constantly updated understanding of the important
characteristics of the continuously expanding diversity of information systems emerging on the
Web. The remainder of this introduction provides background information on the key Web
technologies and underlying philosophies needed to understand the rest of the dissertation.
However, before beginning, it is important to define the scientific context of this contribution.
1.2 Informatics and bioinformatics
Princeton’s Wordnet equates the term ‘informatics’ with ‘information science’ and defines it as
“the sciences concerned with gathering, manipulating, storing, retrieving, and classifying
recorded information” [1]. Bioinformatics is a subdiscipline of information science that focuses
on the development of approaches for processing biological information with the ultimate aim of
answering biological questions. Many general approaches developed by information scientists

3
such as, databases, knowledge representation languages, search algorithms and communication
protocols are applied in bioinformatics. In addition to these approaches, bioinformatics
researchers develop highly specialized methods, such as algorithms that detect the presence of
genes in nucleotide sequences, that operate exclusively on biological information.
The strategies advanced in this dissertation were conceived out of needs originating in the
context of bioinformatics research and were evaluated using biological data; however, they are
certainly applicable in other domains. As a result, this research could either be classified as
bioinformatics, based on its motivations and the nature of the experimental data, or as
information science, based on the breadth of its applicability. Regardless, the ultimate goal
remains to produce methods that will eventually help to bring light to the mysteries of life by
enabling more effective use of the increasingly vast and diverse body of available biological and
medical information. The principal tool brought to bear on this challenge is the provision of
metadata.
1.3 Metadata
To manage large volumes of heterogeneous data, data is associated with descriptive features that
make it possible to group similar items together, to distinguish between the members of those
groups, and to reason about those items. At a fundamental level, this is the phenomenon of
language. As humans, we use natural language to deal with the complexity of the physical world
by associating words with its components such that items can be distinguished from one another
and assembled into cognitively useful groups. To do this, we assign both specific names, like
‘Mark Wilkinson’, and general categories, like ‘human’, to the entities that we interact with. The
specific names give us anchors with which to begin the more thorough description of each entity
through reference to more general categories; “Mark Wilkinson is a human”. At the same time,
the general categories, defined through their connections to other general categories, make it
possible to reason; “since Mark Wilkinson is a human and humans breathe air, Mark Wilkinson
breathes air”. In the context of digital information, the use of computational languages2 to
describe entities is called metadata provision; the creation and use of data about data. Metadata
2 By ‘computational languages’ I refer to structures used to represent symbolic knowledge in forms that enable theknowledge to be processed with computers
4
serves the same basic purposes as other forms of language. This is to distinguish between
different entities and to form descriptions of those entities that make it possible to group like
items together and to reason about the members of those groups. Because of the power of these
operations, metadata is a fundamental aspect of all large-scale information management efforts.
1.4 Third-party metadata
Third-party metadata refers to metadata created by a party other than the primary provider of the
data. As depicted in Figure 1.1, it can refer to metadata provided by an institution, for example
the indexing of journal articles by MEDLINE, or to metadata provided by individuals.
In the context of this dissertation, I focus on the metadata generated by individuals because,
though there are well-established patterns for institutional metadata provision, comparatively
little is known about how to make use of individual contributions. The reason for this state of
affairs is simply that the concept of decentralized content curation would have been difficult if
not impossible to implement or even to conceive of prior to the relatively recent emergence of
the Web as a medium for worldwide communication.
As they bear on both the implementations and the philosophical foundations of the strategies
outlined in this dissertation, I now provide a brief introduction to the core components of the
World Wide Web and its nascent descendent, the semantic Web.
1.5 The World Wide Web
At a basic level, the World Wide Web is the marriage of two fundamental ideas, the first is
hypertext and the second is that of a single, universal information space within which any digital
document can be stored and retrieved.
In 1965, Theodor Nelson defined ‘hypertext’ as “a body of written or pictorial material
interconnected in such a complex way that it could not conveniently be presented or represented
on paper” [2]. The interconnections within such a collection of materials are defined by
hyperlinks that make it possible to traverse directly from any document to any other, allowing a
manner of information organization foreshadowed by the ‘associative trails’ of Vanevar Bush’s

5
Memex [3], but impossible to realize before the advent of the computer. In an indirect way,
hyperlinks formed the first and thus far the most important third-party metadata on the Web.
Each link provides a statement, however loosely defined, about the content of its target; the
intelligent aggregation of many billions of these statements makes it possible for search engines
to successfully operate over the many billions of pages that now form the Web [4].
Tim Berners-Lee is widely renowned as the inventor of the World Wide Web because of his
many technical, philosophical, and political contributions to its initial creation and continued
development [5]. Each of these contributions emanate from the single profound idea, that “one
information space could include them all” - that the body of interlinked material Nelson referred
to might literally contain all of the information in the world [5] (p. 33). As the union of these
two ideas, enabled by computational languages like the Hypertext Markup Language (HTML)
and communication protocols like the Hypertext Transfer Protocol (HTTP), the Web has
fundamentally changed the way information is communicated across the globe.
Of these two ingredients, hypertext and universality, the latter is the more fundamental. As will
be shown, there are now many ways to interact with the Web that do not involve hypertext, but
all of them benefit technologically and philosophically from the fact that there is just one Web
and that anyone is allowed to both use it and contribute to it. In the words of Tim Berners-Lee,
Ora Lassila and James Hendler:
“The essential property of the World Wide Web is its universality. The power of a
hypertext link is that ‘anything can link to anything.’ Web technology, therefore,
must not discriminate between the scribbled draft and the polished performance,
between commercial and academic information, or among cultures, languages,
media and so on.” [6]
The simple idea that anyone should be able to participate is what has made the Web the most
crucial piece of communications infrastructure in the World. In the chapters of this dissertation,
I will be exploring how the basic stance that anyone can and should be allowed to contribute
their voice to the formation and management of knowledge resources can be applied to problems
surrounding metadata provision in bioinformatics.

6
The standards used in this work for representing and sharing metadata are drawn from the
emerging collection that forms the World Wide Web Consortium’s (W3C) semantic Web
initiative; however, before these can be introduced, it is important to touch briefly upon the most
fundamental component of the Web – unique identification.
1.5.1 Unique identification
Though a tremendous amount of lower-level network technology and standards were needed to
make the Web a reality, one of the most crucial was the advent and uptake of a globally unique
identifier system. To link documents produced all over the world together, each needs to be
associated with a unique address – in the same manner that mail could never be delivered
successfully without unique addresses for physical locations. On the World Wide Web, entities
are addressed with Uniform Resource Indicators (URI) [7]. URIs come in two dominant
varieties, Uniform Resource Names (URN) and Uniform Resource Locators (URL). In general,
a URN is used to refer to an entity without providing information about how to access it while
URLs encode both a unique identifier and a description of how to retrieve the identified resource.
Web browser’s typically make use of URLs of the form ‘http://www.google.com’, in which the
letters preceding the ‘:’ indicate what communications protocol should be used, in this case,
HTTP, and the rest indicate the specific address of the requested information on the network. A
key enabler of unique identification on the Web is the Domain Name Service (DNS) system, a
global registry that links domain names like ‘www.google.com’ to Internet Protocol (IP)
addresses (unique numeric addresses associated with particular machines) and – importantly –
keeps track of which party owns each domain [8]. The DNS service can be used with both URL
and URN schemes (for example, see [9]) but is much more consistently used in association with
URLs.
1.6 The semantic Web
“The Semantic Web is not a separate Web but an extension of the current one, in
which information is given well-defined meaning, better enabling computers and
people to work in cooperation” [6].

7
The World Wide Web can be envisioned as a graph with nodes and edges. In this graph the
nodes are documents identified by URLs and the unlabelled edges are hyperlinks. The semantic
Web can also be thought of as a graph. In the semantic Web the nodes are anything that can be
named with a URI (a concept, a document, a protein) and the labelled edges are meaningful
properties that describe the relationships between the nodes. While the World Wide Web is
primarily a web of documents, the semantic Web is meant to be a much more granular web of
data and knowledge.
Building on the original Web, particularly its communications protocols and its unique identifier
system, the semantic Web is an additional collection of standards for sharing machine-readable
data and metadata with the intention of facilitating integration across distributed sources [10].
The two key standards of the semantic Web initiative are both languages for representing
information on the Web, the Resource Descriptive Framework (RDF) and the Web Ontology
Language (OWL). (Because of the highly distributed nature of data in bioinformatics [11], much
attention has already been devoted to investigating ways to apply these standards in biological
and medical contexts [12].)
1.6.1 The Resource Description Framework
RDF is the base computer language for representing and sharing all information on the semantic
Web [13]. In contrast to HTML, its analogue on the original Web, RDF is fundamentally about
representing information such that it is computationally useful rather than representing
information such that it can be effectively visualized by humans. RDF represents information as
a set of directed graphs; URIs are assembled into triples composed of a subject URI, a predicate
URI, and an object URI. Each triple provides a description of its subject resource; for example,
the statement “Mark Wilkinson is a human” could be formulated by creating URIs for ‘Mark
Wilkinson’, ‘is a’, and ‘human’ and then linking them together into an RDF triple. The
predicates of RDF triples, for example ‘is a’ above, are similar to the hyperlinks of the Web.
The key advantage of RDF triples over hyperlinks is that the links are explicitly labelled – the
intent (semantics) of the relationship between the two entities is thus computationally accessible.
These triples of URIs are the most fundamental concept in the semantic Web infrastructure, but
alone, they are not sufficient to realize its vision.

8
RDF provides a way to express statements about resources on the Web that can be processed
effectively by computers, but the components of these statements, the actual terms used, need to
be shared across groups and applications in order for effective integration to be possible. If one
application uses a URI like ‘http://example.com#human’ to describe Mark Wilkinson and
another uses a URI like ‘http://another.example.com#homo_sapiens’ to describe Ben Good, then
it is difficult or impossible to compute that Ben and Mark should be grouped together and the
goal of global data integration is lost. Moreover, these terms, e.g. ‘human’, should be associated
with meaningful definitions such that additional clarity in descriptions and therefore additional
reasoning can be achieved. Computational ontologies are needed to define the vocabularies
needed to author RDF such that it can effectively serve its purpose of enabling distributed data
integration.
1.6.2 Ontology
An ontology is often defined as an “an explicit [machine readable] specification of a
conceptualization” [14]. A conceptualization is an abstract model of the entities that exist in a
particular domain and their relationships to one another. By making conceptualizations machine
readable, ontologies do two key things, they make it possible to execute algorithms that reason
with the encoded knowledge and they make it possible to share that knowledge across
applications.
The idea of automating reasoning with encoded knowledge is not new. Knowledge-based
systems have formed an important part of artificial intelligence applications for many years. One
of the first prominent examples was a rule-based expert system known as MYCIN, developed in
the early 1970’s, that was designed to help physicians identify the kinds of bacteria associated
with severe infections [15]. Since then, programs that compute with represented knowledge
have been applied in situations too numerous to list ranging from factory scheduling [16] to civil
engineering [17] to the distribution of guidelines in medical ethics [18].
The other function enabled by ontologies is more novel. The idea that knowledge represented by
one party can be re-used by other parties was the main reason for the initial investigations into
ontologies in computer science [19] and remains a primary driver for their expanding use in

9
biology and in other domains today. It should come as no surprise that the rise to prominence of
the term ‘ontology’, in the computer science sense, marked by the authorship of the term’s most
frequently-used definition [14], coincided with the emergence of the World Wide Web in the
early 1990’s. While the combination of Web technology and hypertext made it possible for
people to share their knowledge as never before, there was, at that time, no effective mechanism
to share knowledge across different software applications. The ontologies of computer science
and now of bioinformatics were conceived to make such computational knowledge sharing
possible.
1.6.3 The Web ontology language
Though ontologies have been in active use in computer science for nearly 20 years, ontology
languages specifically designed for the Web are relatively new. The first major attempt at
integration of ontology and Web standards was the DARPA Agent Markup Language (DAML)
instigated in the year 2000 [20]. DAML was followed by DAML+OIL (the ontology inference
layer) [21] and then finally by OWL [22]. Each of these ontology languages are represented
using RDF to provide computational concept definitions for application on the semantic Web.
1.6.4 Ontologies in bioinformatics
The dominant use of ontologies in bioinformatics is the task of integrating data stored in
multiple, distributed databases [23]. Somehow, the relationships between entities in different
databases (e.g. equivalency) must be identified if the data is to be integrated and thus made the
most useful. The paradigmatic solution to this problem, implemented many times in
bioinformatics applications, is the creation of a unifying ontology with which resources from
each participating database are described [11, 24-27]. Such ontologies give form to the
knowledge needed to align the entities in the different databases and thus enable successful
distributed data integration.
Ontologies composed with a variety of languages have been used in bioinformatics for many
years, enabling greater interoperability and integration between distributed computational
platforms. A few examples of relevant biological and medical ontologies include the Gene

10
Ontology (GO) [25], the Unified Medical Language Semantic Network [28], the National Cancer
Institute ontology [29], the Foundational Model of Anatomy [30], the BioPAX ontology of
molecular interactions [31], and the growing number of ontologies emerging under the umbrella
of the Open Biomedical Ontologies project [32, 33].
1.7 Prospects for a semantic Web for the life sciences
If applied broadly and faithfully, the semantic Web standards touched upon above offer the
promise of freeing bioinformatics researchers from many data integration problems and thus
enabling them to spend more of their time simply as computationally savvy biologists. This is
the ultimate, long-term goal driving the research presented in this dissertation. Before
proceeding to specifically outline the problems addressed and the approaches taken, I provide a
brief example of what such a world of information, called Bioinfotopia, might look like and use
this to highlight both the potential benefits and the enormity of the challenge of reaching this
vision.
In Bioinfotopia, researchers are concerned with the same problems as bioinformaticians are in
our world. They want to know how life works for the sake of advancing knowledge and for the
sake of improving the human condition through medicine. As a result, they ask similar
questions. For example, they -like their dystopian colleagues- often want to learn the
relationships between genes and disease. Bob, a prominent member of Bioinfotopia, might pose
the question:
“In heart tissue from mice infected with coxsackievirus B3, which genes in the
complement and coagulation cascade pathways are over or under expressed in
healthy mice versus those showing symptoms of myocarditis?”
To receive an answer to this question, Bob submits a request to a program that, unbeknownst to
him, uses computational representations of the components of the request, like ‘heart tissue’,
‘infected’, ‘mice’, and ‘myocarditis’, to retrieve the information from data sources distributed
across the Web that understand these representations. Once the data is gathered, it is
reassembled and presented in a visually intuitive fashion that enables Bob to rapidly understand

11
the results. All of the labour of identifying trustworthy information sources, understanding how
to query them, merging the results, and tracking the process is accomplished behind the scenes,
letting Bob focus his attention on the problem he is trying to solve.
To most people working in bioinformatics, this scenario must seem like a pipe dream. Given
that it is possible to publish papers in respected journals about effective methods for parsing one
file format used by one database [34] and there are literally thousands of databases that might
contain relevant data [35], the idea that the steps required to answer that query might somehow
be automated seems remote. However, under certain, very specific, circumstances it is already a
reality. For example, within the context of the caCORE (Cancer Common Ontologic
Representation Environment) software infrastructure, a product of the National Cancer Institute,
it is possible to receive responses to similar queries such as:
“In brain tissue from patients diagnosed with glioblastoma multiforme subtype of
astrocytoma, which genes in the p53 signaling pathway are over or under expressed
in cancerous versus normal tissue?” [36]
This power is achieved through the rigorous application of syntactic and semantic standards for
the representation, transmission, and description of all information provided by the distributed
services in the caCORE environment. As described in the detailed project documentation, rich
programmatic interfaces are defined for interacting with distributed databases and analytical
services and each data element in the system is associated with a particular semantic type from
an ontology. Thus the system achieves both syntactic and semantic interoperability across
bioinformatics resources that adhere to its rules [37].
Despite this demonstrated power, most resource providers in bioinformatics are not contained
within the bounds of caCORE and, as such, much of the relevant data (and operations that might
be performed on that data) are not accessible through the system. The reason that caCORE and
other similar initiatives have not yet generated Bioinfotopia is, perhaps, the same reason that
early hypertext systems did not generate the World Wide Web; they operate within closed worlds
that are difficult for external parties to participate in and contribute to. Though it is possible to
develop applications that share information with caCORE [38], the process is complex and

12
implementation dependent, requiring developers to make use of caCORE-specific development
tools and domain models. In addition, it is not possible for external parties to contribute their
own ontologies directly to the system.
The semantic Web initiative is trying to achieve the same kind of functionality as systems like
caCORE, but on a far broader scale. Once again, the W3C, still being led by Tim Berners-Lee,
is attempting to bring a universal information space into being. The difference is that this time
the space is intended for computers as well as people. The challenge of achieving this global-
scale vision is daunting. Consider the case described above; for a software agent to succeed in
answering Bob’s query within the open world of the Web, every entity relevant to the query
would not only need to be discoverable and retrievable on the Web, it would need to be
associated with detailed metadata constructed using shared languages that defined everything
known about it, including the context of its origin, its physiological state, its biological location,
and so on. Given the limitless dimensions with which entities might be described as well as the
profoundly large numbers of such entities on the Web, the potential for success seems small.
Additionally, as the amount of data resources in bioinformatics as well as the diversity of data
types expands, the challenge of providing the quantity of metadata needed to achieve global
interoperability, already massive, will only increase.
Despite the scale of the challenge, there is a growing and largely untapped resource that might
prove effective in addressing it. Just as the volume of data is increasing, the volume of people
that are contributing to the Web is also increasing. This dissertation thus introduces and
characterizes new ways to address the challenge of global semantic metadata provision in
bioinformatics that, like the PageRank algorithm [4], benefit from the aggregation of third-party
metadata generated through the collective action of unprecedented numbers of people.
Specifically, the approaches I investigate fall into two major categories, crowdcasting and social
tagging. Crowdcasting, in the sense with which it is used here, is the idea of proactively pushing
requests for structured knowledge out to large groups of volunteers and then pulling the captured
knowledge back together. Social tagging is a growing Web phenomenon in which users add
publicly accessible metadata in the form of keywords to resources on the Web to form their own
personal collections. In the context of this dissertation, two primary kinds of knowledge are

13
sought, the links between concepts that form ontologies (‘humans are mammals’) and the links
between concepts and instances that form semantic metadata for those instances (‘Mark
Wilkinson is a human’). Specifically, I investigate crowdcasting methods as potential sources of
both ontological knowledge and semantic metadata. In addition, I present comparative analyses
of metadata generated through social tagging in biomedical contexts. In support of these
investigations, I introduce methods to evaluate ontologies and to provide empirical comparisons
of the products of different metadata generating systems. In the following, I provide additional
background information to inform and motivate the specific discussions that ensue in the
chapters of the dissertation.
1.8 Background on crowdcasting for knowledge acquisition
A critical activity in the process of ontology construction is the acquisition of knowledge from
domain experts. One of the basic assumptions in designing strategies for knowledge acquisition
has long been that the knowledge is to be collected from a relatively small number of people.
This is one reason that, even as early as 1983, “the usual knowledge acquisition bottleneck” was
considered the most significant hurdle to overcome in the creation of knowledge based systems
[39]. That this is still the case today within the context of bioinformatics is made clear from
recent work that attempts to define a rigorous methodology for bio-ontology engineering [40].
As one stage of this proposed methodology, Garcia Castro et al. describe a process through
which ontological knowledge is elicited from domain experts in a series of face to face meetings
and teleconferences. As anyone that has ever been in a meeting or a teleconference understands,
this is not a process that more than a handful of people can contribute to effectively. This
process of face to face meetings, teleconferences and now lengthy email exchanges is
characteristic of most known efforts at ontology engineering, but recent work suggests there may
be other methods that could prove equally if not more effective.
In the domain of artificial intelligence, many potential applications require the assembly of very
large repositories of encoded knowledge. For example, for a program to effectively make correct
inferences regarding natural language, a vast amount of ‘common sense’ knowledge is required
to disambiguate between the many possible senses of words. Common sense knowledge makes
it possible, for example, to easily know the different meanings of the word ‘pen’ in the phrases
14
“the box is in the pen” and “the pen is in the box” [41]. To make programs that correctly reason
with phrases like these, the programs must be empowered with extensive background
knowledge; for example, that pens of the writing variety might fit in boxes while pens of the pig
variety might contain boxes. The problem is that there is an incredibly large amount of such
common sense knowledge to encode.
To meet the demands of common sense reasoning, both machine learning approaches [42] and
large-scale, long-term manual knowledge engineering efforts have been applied [41]. However,
other approaches are possible. What if we had not a few, but literally thousands or even millions
of people contributing to knowledge acquisition efforts? The first clear application of this idea
was in the formation of the Oxford English Dictionary, a project initiated in 1857 [43]. This
massive undertaking, eventually resulting in a dictionary containing precise definitions of more
than 400,000 words, was made possible largely through the contributions of hundreds of
volunteers who mailed in their knowledge about the earliest usages of English words. Now,
through the Web, it is possible to conduct similar knowledge acquisition efforts at unprecedented
scale and speed.
The idea of crowdcasting [44], suggests that seekers of computationally encoded knowledge and
other typical products of human labour ‘cast’ requests out to the ‘crowd’ via specifically targeted
Web interfaces. Pioneering efforts in this emerging field include Open Mind Common Sense
[45], Learner2 [46-48], Games With a Purpose (Gwap) [49], and a growing collection of projects
that make use of Amazon’s Mechanical Turk Web service [50, 51] such as Snow et al.’s use of it
to gather annotations of natural language documents [52]. Though interfaces, incentive
structures, and specific forms of knowledge requested vary, each of these efforts follows the
basic strategy of (1) deciding on the kind of knowledge sought, (2) implementing a Web
interface that can elicit knowledge of this form from volunteers, (3) making the interface
available on the open Web to anyone willing to contribute, (4) gathering knowledge from
volunteers, (5) applying algorithms to clean and aggregate the collected knowledge.
This pattern has proven remarkably successful in many of the domains where it has been tried.
Perhaps the most successful and certainly the most famous of these efforts was the ESP Game -
the original experiment that lead to the Gwap project at Carnegie Mellon University [49, 53].

15
The ESP game was designed to accumulate textual tags (metadata) for large numbers of images
in order to improve image search on the Web. In the game, players are paired with anonymous
partners and both partners are presented with a series of images to label. Players score points
when the terms they use to describe the image match up with those generated by their partner
(demonstrating their ‘extrasensory perception’). This game proved remarkably effective, rapidly
eliciting high quality image labels for tens of thousands of images from thousands of online
players. It proved so successful in fact, that is has been incorporated directly into the technology
stack of the world’s most successful Web search engine and is thus now known as the Google
Image Labeller [54].
Despite the impressive success of such crowdcasting initiatives for knowledge acquisition, the
field is still in its infancy. Little is known about the effects of different choices in interface
design, different incentive structures, or the kinds of knowledge that might successfully be
assembled through such approaches. The first two chapters of this dissertation investigate some
of these topics in the context of bioinformatics. Specifically, I ask if and how might a
crowdcasting model of knowledge acquisition work to gather the components of a biological or
medical ontology?
1.9 Passive distributed metadata generation via social tagging
In contrast to the active, goal-directed approach of crowdcasting, the Web offers other, more
passive mechanisms through which individuals contribute to the production of collectively useful
metadata while simultaneously solving their own personal problems. As alluded to earlier, the
first such mechanism was simply the hyperlink. By creating links from the Web documents they
own to other websites, people tacitly create computationally accessible descriptive information
about the targets of the links. The presence of the link alone indicates interest in the target site,
and the text both in and surrounding the link provides information about the nature of the other
site. Now, third-party metadata similar in form, but more precise in content is emerging through
the phenomenon known as social tagging.
Social tagging, as the term is used here, occurs when an individual assigns tags (keywords) to
items in an online resource collection. The most prominent example of social tagging is

16
provided by the website Del.icio.us which lets its users manage their Web bookmarks by
assigning each bookmarked URL a set of tags and making these tagged bookmark libraries
available online [55]. The principal personal advantages of using systems like this are that a
user’s bookmarks can be accessed from any machine with an Internet connection and can be
organized in many different ways using tags. In addition, these applications provide interesting
social features as they make it possible to see what other people are bookmarking and what tags
they are using.
From the perspective of knowledge acquisition, social tagging services form an interesting new
source of third-party metadata. Though individual users use these systems for their own personal
reasons [56], their collective efforts, available online, end up creating large amounts of useful
metadata. The tags added to the Web resources in these collections, when aggregated, have
already been shown to aid in the retrieval effectiveness of full Web search engines [57], but this
is a new and little-researched phenomenon. Though social tagging services began in the general
context of the Web, the last several years have seen them penetrate into a variety of more
specific applications. In the context of bioinformatics, social tagging services have emerged that
aid researchers in organizing and sharing their personal collections of academic citations [58-61].
This new activity and its recent penetration into the life sciences community introduces a variety
of new questions and new possibilities. I address some of these questions in several chapters of
this dissertation. Specifically, I ask how this new source of metadata compares to the products of
professional annotators in scientific contexts and how social tagging interfaces might be
improved to enhance the value of the products that they create.
1.10 Dissertation objectives and chapter summaries
I conducted the research described in this dissertation to identify how third-party strategies might
be applied to the problems of metadata generation in bioinformatics with the ultimate aim of
moving the field closer to the vision of a global semantic Web for life sciences research. The
specific objectives were to (1) design and test a system for bio-ontology engineering that did not
involve the bottleneck imposed by the requirement for expert knowledge engineers, (2) design
and test an open system for semantic annotation of bioinformatics resources that would marry the
benefits of open social tagging with those of semantic metadata, (3) establish empirical

17
approaches for use in the evaluation of ontologies and other metadata structures, (4) characterize
the differences that hold between the products of social tagging and of professional labour in a
relevant biomedical context, and (5) implement a demonstration of a bioinformatics Web
application made possible through the use of distributed semantic metadata.
In Chapters 2 and 3, I describe the design and evaluation of the iCAPTURer system for ontology
engineering. This system integrates pre-existing natural language processing technology with an
innovative volunteer-driven approach to knowledge engineering. Evaluated in the context of two
scientific meetings in which attendees, untrained in ontology engineering, volunteered to
contribute their knowledge, the system demonstrated that valid ontology components can be
acquired rapidly and inexpensively without the presumed requirement of expert manual labour.
In Chapter 4, I describe OntoLoki, a new data-driven method for automatic ontology evaluation.
Given the expanding need for ontologies and the expanding number of techniques for building
them, exemplified by the iCAPTURer system described in Chapter 2, there is a growing need for
methods to evaluate ontology quality. OntoLoki is one of the first programs to succeed at
automating the task of ontology evaluation. It achieves this through the application of simple,
longstanding philosophical principles, extensive use of semantic Web technology and machine
learning. In addition to a direct numeric assessment of quality, OntoLoki produces easily
interpretable classification rules for the classes in the evaluated ontology.
In Chapter 5, I present a new automated protocol for measuring terminological aspects of
controlled and uncontrolled indexing languages on the Web. As the diversity of different
sources and forms of Web-based metadata continues to expand, methods for comparing different
instantiations provide vital knowledge to those that seek to use and to understand these
structures. In this work, I focused specifically on characterizations of the sets of natural
language terms used within different indexing languages. The metrics proved sufficient to
differentiate between instances of different languages and to enable the identification of term-set
patterns associated with indexing languages produced by different kinds of information systems.
In particular, we found that distinct groups of term-set features can be used to distinguish the
tags produced by social tagging from other indexing languages.
18
In Chapter 6, I offer a broad empirical comparison of the metadata produced by academic social
tagging services and the Medical Subject Headings generated and applied by the United States
National Library of Medicine. To achieve this comparison I designed and implemented a
comparative protocol that defines key measurable indicators of annotation performance. This
included the coverage of the document space, the density of metadata associated with the
documents, the rates of inter-annotator agreement, and the rates of agreement with a gold
standard. The comparison demonstrated that annotations generated by social taggers are
generally of low quality, that quality could be improved through intelligent aggregation of
multiple user’s assertions, but that the overall sparseness of the data renders simple aggregation
techniques such as voting ineffective.
In Chapter 7, I present an evaluation of an experimental semantic annotation system that blends
the open, participatory nature of social tagging with the benefits of terminology control. An
implementation of this system was tested on the task of creating semantic annotations of
BioMoby Web services. Annotation quality was assessed based on levels of agreement between
volunteer annotations (inter-annotator agreement) and agreement with a manually constructed
standard. Though the annotations collected from different volunteer annotators varied widely,
simple algorithms for aggregating these assertions generated collective products of quality
approaching that to be expected from teams of expert annotators. This experiment demonstrated
that, given sufficient community involvement, open social classification appears to be a viable
strategy for accumulating semantic annotations for Web services in the domain of
bioinformatics.
In Chapter 8, I demonstrate how a user-script, a new kind of Web technology that allows third-
party developers to manipulate the display of Web pages, can be used to bring together third-
party metadata from distributed sources to enhance the visualization and navigation of the iHOP
(information Hyperlinked Over Proteins) website. The user-script augments the gene-centred
pages on iHOP by providing a compact, configurable visualization of the defining information
for each gene and by enabling additional data, such as biochemical pathway diagrams, to be
collected automatically from third-party resources and displayed in the same browsing context.
This open-source script provides an extension to the iHOP website, demonstrating how user-

19
scripts, a novel kind of third-party Web resource, can be used to personalize and enhance the
Web browsing experience in a relevant biological setting.
The strategies described in these chapters are broadly applicable to the design and evaluation of
new information systems that are intended for the semantic Web and that seek to benefit from
third-party contributions. The work specifically addresses the problem of the knowledge
acquisition bottleneck in the formation of semantic metadata, offering some of the first evidence
that emerging practices in mass collaborative knowledge capture may be effective in the expert
contexts characteristic of bioinformatics as well as new system designs tailored specifically for
knowledge capture in scientific settings. Since much of the work undertaken was new in both
process and product, a significant challenge throughout was defining effective evaluation
methods. The approaches identified to evaluate ontologies and to compare metadata produced
from different information systems thus form an additional, important contribution of this
dissertation - providing a framework for future research to build upon.
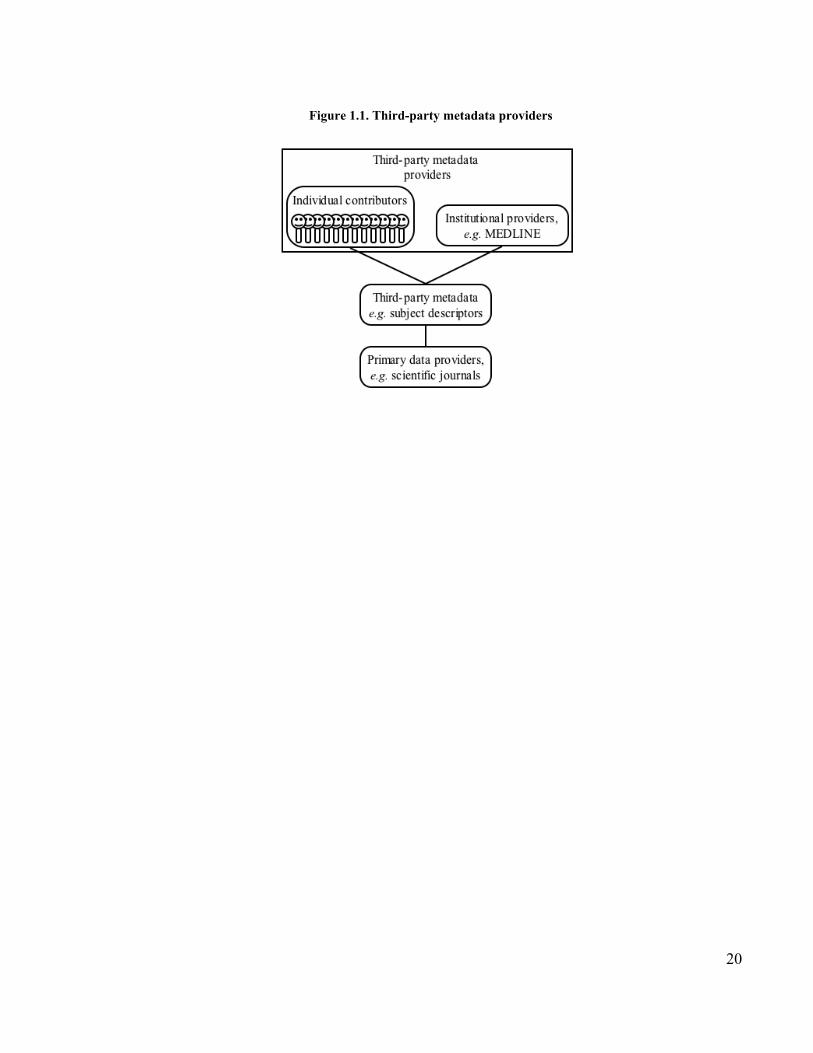
20
Figure 1.1. Third-party metadata providers

21
References
1. Wordnet [http://wordnetweb.princeton.edu/]2. Nelson TH: Complex information processing: a file structure for the complex, the
changing and the indeterminate. In: ACM Annual Conference/Annual Meeting: 1965;Cleveland, Ohio, United States: ACM; 1965: 84-100.
3. Bush V: As we may think. In: Atlantic Monthly. vol. July; 1945: 101-108.4. Brin S, Page L: Anatomy of a large-scale hypertextual Web search engine. In: 7th
International World Wide Web Conference: 1998; Brisbane, Australia; 1998: 107-117.5. Berners-Lee T, Fischetti M: Weaving the Web: the orginal design and ultimate
destiny of the World Wide Web, 1st edn. New York: HarperBusiness; 2000.6. Berners-Lee T, Hendler J, Lassila O: The semantic web. Scientific American 2001,
284(5):34-43.7. URIs, URLs, and URNs: Clarifications and Recommendations 1.0
[http://www.w3.org/TR/uri-clarification/]8. IANA - Internet Assigned Numbers Authority [http://www.iana.org/]9. Clark T, Martin S, Liefeld T: Globally distributed object identification for biological
knowledgebases. Briefings in bioinformatics 2004, 5(1):59-70.10. Cool URIs for the semantic Web [http://www.w3.org/TR/2007/WD-cooluris-
20071217/]11. Stein L: Integrating biological databases. Nature Reviews Genetics 2003, 4(5):337-345.12. Ruttenberg A, Clark T, Bug W, Samwald M, Bodenreider O, Chen H, Doherty D,
Forsberg K, Gao Y, Kashyap V et al: Advancing translational research with theSemantic Web. BMC Bioinformatics 2007, 8(Suppl 3):2-2.
13. RDF Primer [http://www.w3.org/TR/rdf-primer/ ]14. Gruber TR: A translation approach to portable ontologies. Knowledge Acquisition
1993, 5(2):199-220.15. Shortliffe EH: Mycin: a rule-based computer program for advising physicians
regarding antimicrobial therapy selection. Stanford: Stanford University; 1975.16. Fox MS, Smith SF: ISIS: a knowledge-based system for factory scheduling. Expert
Systems 1984, 1(1):25-49.17. Tommelein ID: Expert Systems for Civil Engineers, American Society of Civil
Engineers Expert Systems and Artificial Intelligence ASCE Publications; 1997.18. Shankar G, Simmons A: Understanding ethics guidelines using an internet-based
expert system. J Med Ethics 2009, 35(1):65-68.19. Gruber TR: The role of common ontology in achieving sharable, reusable knowledge
bases. In: Knowledge Representation and Reasoning (KR&R-91): 1991; San Mateo,California, USA: Morgan Kaufmann; 1991.
20. The DARPA Agent Markup Language [http://www.daml.org/]21. Horrocks I: DAML+OIL: a Description Logic for the Semantic Web. Data
Engineering 2002, 25(1):4-9.22. OWL Web Ontology Language Overview [http://www.w3.org/TR/owl-features/ ]23. Witold L, Leo M, Nick R: Interoperability of multiple autonomous databases. ACM
Comput Surv 1990, 22(3):267-293.
22
24. Schulze-Kremer S: Adding semantics to genome databases: towards an ontology formolecular biology. In: International Conference on Intelligent Systems for MolecularBiology: 1997; Halkidiki, Greece; 1997: 272-275.
25. Ashburner M, Ball CA, Blake JA, Botstein D, Butler H, Cherry JM, Davis AP, DolinskiK, Dwight SS, Eppig JT et al: Gene ontology: tool for the unification of biology. TheGene Ontology Consortium. Nature Genetics 2000, 25(1):25-29.
26. Sujansky W: Heterogeneous database integration in biomedicine. Journal ofbiomedical informatics 2001, 34(4):285-298.
27. Kohler J, Philippi S, Lange M: SEMEDA: ontology based semantic integration ofbiological databases. Bioinformatics 2003, 19(18):2420-2427.
28. Lindberg DA, Humphreys BL, McCray AT: The Unified Medical Language System.Methods Inf Med 1993, 32(4):281-291.
29. Hartel FW, de Coronado S, Dionne R, Fragoso G, Golbeck J: Modeling a descriptionlogic vocabulary for cancer research. J Biomed Inform 2005, 38(2):114-129.
30. Rosse C, Mejino JL: A reference ontology for bioinformatics: the foundational modelof anatomy. The Journal of Biomedical Informatics 2003, 36:478-500.
31. Luciano JS: PAX of mind for pathway researchers. Drug Discov Today 2005,10(13):937-942.
32. OBO: Open Biomedical Ontologies [http://obo.sourceforge.net]33. Smith B, Ashburner M, Rosse C, Bard J, Bug W, Ceusters W, Goldberg L, Eilbeck K,
Ireland A, Mungall C et al: The OBO Foundry: coordinated evolution of ontologies tosupport biomedical data integration. Nat Biotechnol 2007, 25(11):1251-1255.
34. D'Addabbo P, Lenzi L, Facchin F, Casadei R, Canaider S, Vitale L, Frabetti F, Carinci P,Zannotti M, Strippoli P: GeneRecords: a relational database for GenBank flat fileparsing and data manipulation in personal computers. Bioinformatics 2004,20(16):2883-2885.
35. Galperin MY, Cochrane GR: Nucleic Acids Research annual Database Issue and theNAR online Molecular Biology Database Collection in 2009. Nucleic Acids Res 2009,37(Database issue):D1-4.
36. Covitz PA, Hartel F, Schaefer C, De Coronado S, Fragoso G, Sahni H, Gustafson S,Buetow KH: caCORE: A common infrastructure for cancer informatics.Bioinformatics 2003, 19(18):2404-2412.
37. Komatsoulis GA, Warzel DB, Hartel FW, Shanbhag K, Chilukuri R, Fragoso G,Coronado S, Reeves DM, Hadfield JB, Ludet C et al: caCORE version 3:Implementation of a model driven, service-oriented architecture for semanticinteroperability. J Biomed Inform 2008, 41(1):106-123.
38. Phillips J, Chilukuri R, Fragoso G, Warzel D, Covitz PA: The caCORE SoftwareDevelopment Kit: streamlining construction of interoperable biomedicalinformation services. BMC Med Inform Decis Mak 2006, 6:2.
39. Stefik M, Bobrow DG, Mittal S, Conway L: Knowledge programming in loops: reporton an experimental course. In: The AI Magazine. vol. 4; 1983: 3-13.
40. Garcia Castro A, Rocca-Serra P, Stevens R, Taylor C, Nashar K, Ragan M, Sansone S-A:The use of concept maps during knowledge elicitation in ontology developmentprocesses. The nutrigenomics use case. BMC Bioinformatics 2006, 7(1):267.
41. Lenat DB: Cyc - A large scale investment in knowledge infrastructure.Communications of the ACM 1995, 38(11):33-38.

23
42. Etzioni O, Banko M, Soderland S, Weld DS: Open information extraction from theWeb. Communications of the ACM 2008, 51(12):68-74.
43. Winchester S: The Professor and the Madman: A Tale of Murder, Insanity, and theMaking of the Oxford English Dictionary: HarperPerennial; 1999.
44. Crowdcasting - Wikipedia, the free encyclopedia[http://en.wikipedia.org/wiki/Crowdcasting]
45. Singh P, Lin T, Mueller ET, Lim G, Perkins T, Zhu WL: Open Mind Common Sense:Knowledge Acquisition from the General Public. Lecture Notes in Computer Science2002, 2519:1223-1237.
46. Chklovski T, Gil Y: Towards managing knowledge collection from volunteercontributors. In: AAAI Spring Symposium on Knowledge Collection from VolunteerContributors: 2005: AAAI; 2005.
47. Chklovski T: Designing Interfaces for Guided Collection of Knowledge aboutEveryday Objects from Volunteers. In: Conference on Intelligent User Interfaces:2005; California, USA; 2005.
48. Chklovski T, Gil Y: Improving the Design of Intelligent Acquisition Interfaces forCollecting World Knowledge from Web Contributors. In: Third InternationalConference on Knowledge Capture: October 2-5, 2005 2005; Banff, Canada: ACM;2005.
49. Ahn Lv, Dabbish L: Designing games with a purpose. Communications of the ACM2008, 51(8):58-67.
50. Amazon Mechanical Turk [https://www.mturk.com/]51. Barr J, Cabrera LF: AI gets a brain. Queue 2006, 4(4):24-29.52. Snow R, O’Connor B, Jurafsky D, Ng AY: Cheap and Fast — But is it Good?
Evaluating Non-Expert Annotations for Natural Language Tasks. In: EmpiricalMethods in Natural Language Processing: 2008; Honolulu, Hawaii, USA; 2008.
53. Ahn Lv, Dabbish L: Labeling images with a computer game. In: SIGCHI conferenceon Human factors in computing systems: 2004; Vienna, Austria: ACM Press; 2004: 319-326
54. Google Image Labeler [http://images.google.com/imagelabeler/]55. Del.icio.us [http://del.icio.us/]56. Bokardo: The Del.icio.us Lesson [http://bokardo.com/archives/the-delicious-lesson/ ]57. Morrison PJ: Tagging and searching: Search retrieval effectiveness of folksonomies
on the World Wide Web. Information Processing and Management 2008, 4(4):1562-1579.
58. Lund B, Hammond T, Flack M, Hannay T: Social Bookmarking Tools (II): A CaseStudy - Connotea. D-Lib Magazine 2005, 11(4).
59. CiteULike: A free online service to organize your academic papers[http://www.citeulike.org/ ]
60. Hotho A, Jäschke R, Schmitz C, Stumme G: BibSonomy: A Social Bookmark andPublication Sharing System. In: Conceptual Structures Tool Interoperability Workshopat the 14th International Conference on Conceptual Structures: 2006; 2006.
61. Hull D, Pettifer SR, Kell DB: Defrosting the digital library: bibliographic tools forthe next generation web. PLoS Comput Biol 2008, 4(10):e1000204.

24
2 Fast, cheap and out of control: a zero-curation model for ontology development3
2.1 Introduction
Ontologies provide the mechanism through which the semantic Web promises to enable dramatic
improvements in the management and analysis of all forms of data [1]. Already, the importance
of these resources to the bio/medical sciences is made clear by the thousands of citations4 of the
original paper describing the Gene Ontology (GO) [2]. Because of the broad range of skills and
knowledge required to create an ontology, they are generally slow and expensive to build. To
illustrate, the cost of developing the GO has been estimated at upwards of $16M (Lewis, S,
personal communication). This bottleneck not only slows the initial development of such
systems but also makes them difficult to keep up to date as new knowledge becomes available.
Conversely, projects such as the Open Directory Project (ODP) [3] and BioMOBY [4] take a
more open approach. Rather than paying curators, ODP lets ‘net citizens’ build hierarchies (now
utilized by Google among many others) that organize the content of the World Wide Web.
BioMOBY, a web services-based interoperability framework, depends on an ontology of
biological data objects that can be extended by anyone. The successful, open, and ongoing
construction of the ODP directories and the BioMOBY ontology hints that the power of large
communities can be harnessed as a feasible alternative to centralized ontology design and
curation.
We describe here a protocol meant to overcome the knowledge-acquisition bottleneck to rapidly
and cheaply produce a useful ontology in the bio/medical domain. The key features of the
approach are the use of a web-accessible interface to facilitate collaborative ontology
development and the deployment of this interface at a targeted scientific conference. This
chapter describes the protocol and presents the results of a preliminary evaluation conducted at
the 2005 Forum for Young Investigators in Circulatory and Respiratory Health (YI forum) [5].
3 A version of this chapter has been published. Good BM, Tranfield EM, Tan PC, Shehata M, Singhera GK,Gosselink J, Wilkinson MD: Fast, cheap and out of control: A zero curation model for ontology development. In:Pacific Symposium on Biocomputing: January 3-7 2006; Hawaii, USA: World Scientific; 2006: 128-139.4 1064 Google Scholar citations retrieved from http://scholar.google.com, 8 September 2005
25
2.2 Experimental context and target application for the YI Ontology
The YI forum did not (outside of this study) include any research on knowledge capture or
artificial intelligence. The topics covered spanned aspects of circulatory and respiratory health
ranging from molecular to population-based studies, and analysis of quality of health-service
provision. Attendees included molecular biologists, health service administrators, statisticians,
cardio/pulmonary surgeons, and clinicians. The target task for the YI Ontology was to provide a
coherent framework within which to organize the abstracts submitted to this broadly-based yet
specialized conference. This framework would take the form of a simple subsumption hierarchy
composed of terms associated with individual abstracts, and/or added by individual experts
during the construction process. Such an ontology could be used to facilitate searches over the
set of abstracts by providing legitimate, semantically-based groupings.
2.3 Motivation and novelty of conference-based knowledge capture
Research in natural language processing and machine learning is yielding significant progress in
the automatic extraction of knowledge from unstructured documents and databases [6, 7];
however these technologies remain highly error-prone and, to our knowledge, no widely used
public ontology in the life sciences has ever been built without explicit, extensive expert
curation. Thus, given the costs of curation, it would be preferable to identify methodologies that
facilitate extraction of machine-usable knowledge directly from those who possess it. In order to
achieve this, several preliminary steps seem necessary:
1. Domain experts need to be identified
2. These experts need to be convinced to share their knowledge
3. These experts must then be presented with an interface capable of capturing their specific
knowledge
Scientific conferences seem to provide a situation uniquely suited to inexpensive, rapid,
specialized knowledge capture because the first two of these requirements are already met by
virtue of the setting; experts are identified based on their attendance and, at least in principle,
they attend with the intention of sharing knowledge. Clearly, the main challenge lies in the

26
generation of an interface that facilitates extremely rapid knowledge acquisition from expert
volunteers.
2.4 Interface design
The architecture chosen for this project borrows techniques from a new class of knowledge
acquisition systems that attempt to harness the power of the Internet to rapidly create large
knowledge bases. Projects in this domain are premised on the assumption that, by distributing
the burden of knowledge representation over a large number of people simultaneously, the
knowledge acquisition bottleneck can be avoided [8-11]. Two active projects in this domain
are Open Mind Common Sense [11], and Learner2 [12, 13]. Both of these efforts focus on
gathering ‘common sense’ knowledge from the general public with the aim of producing
knowledge-based systems with human-like capabilities in domains such as natural language
understanding and machine translation.
These large, open, Internet-based projects are premised on the idea that there is little or no
opportunity for explicit training of volunteers, and in principle no strong motivation to
participate. This is similarly true of the conference participants engaged in this study, and thus
based on these similarities, the interface developed for this knowledge capture experiment was
modeled after the template-based interface of the Learner2 knowledge acquisition platform [14].
Learner2 follows two basic design patterns:
1. Establish a system that allows the knowledge engineer to passively control knowledge
base structure, while allowing its content to be determined entirely by the subject matter
experts.
2. Use a web-enabled, template-based interface that allows all volunteers to contribute to
the same knowledge base simultaneously and synergistically in real-time.
The ‘iCAPTURer’ knowledge acquisition system presented here applies and adapts these
principles to the task of knowledge capture in the conference setting.

27
2.4.1 Specific challenges faced in the conference domain
The iCAPTURer experiment faced unique challenges by virtue of its expert target-audience.
Learner2 is designed to capture common sense knowledge, and operates by generating generic,
user-agnostic fill-in-the-blank templates. For example, in order to collect statements about
objects and their typical uses, a volunteer might be presented with “A [blank] is typically used to
smash something” and asked to fill in the blank. In order to capture specific, expert knowledge
however, it is necessary to adapt the contents of these templates to target each volunteer’s
specific domain of expertise. The following section details our adaptation of the Learner2
approach to meet this challenge.
2.5 Methods - introducing the iCAPTURer
2.5.1 Preprocessing
Prior to the conference, terms and phrases were automatically extracted from each abstract using
the TermExtractor tool from the TextToOnto ontology engineering workbench [6]. The
TermExtractor was tuned to select multi-word terms using the “C-value” method [15]. This
process produced a corpus of terms and phrases linked directly to the abstracts. This corpus
provided the first raw material for the construction of the ontology and provided a mechanism to
match the contents of the templates to the volunteer's area of expertise.
In addition, the nascent ontology was seeded with a concept hierarchy taken from the Unified
Medical Language System Semantic Network (UMLSsn) [16]. The UMLSsn was selected as the
‘upper ontology’ in order to provide a common semantic framework within which to anchor the
knowledge capture process [17].
2.5.2 Priming the knowledge acquisition templates - term selection
Two priming models were employed to ensure that relevant knowledge was captured and that
expert volunteers were presented with templates primed with concepts familiar to them. After
logging into the system, the volunteer first makes a choice between priming the system with a
28
keyword entered as free text, or priming the system through selection of a specific abstract
(preferably their own).
In the abstract-driven model, the term to be evaluated is randomly selected from the pre-
processed auto-extracted terms associated with the selected abstract. In this way, the expert is
preferentially asked about terms from an abstract that they are presumptively familiar with,
though there is nothing stopping them from selecting abstracts at random.
In the keyword-driven model, the system first checks the knowledge base for partial matches to
the keyed-in term, and if found, selects one at random. If no matches are found the term is added
to the knowledge base and is considered meaningful.
2.5.3 Term evaluation
After the volunteer chooses an abstract or enters a keyword, they are presented with the term-
evaluation page. This page presents them with a term and requests them to decide if it is
“meaningful”, “not-meaningful”, or if they do not understand it (‘X is a meaningful term or
phrase “True, False, I don’t know”’). If they are unable to make a judgment on the term, another
term is presented and the process repeats. If they indicate that the term is not valid, then the
term's ‘truth value’ is decremented in the knowledge base and another term is presented for
judgment. Only terms above a set truth value are presented. This allows for rapid pruning of
invalid entries from the active knowledge base without any permanent corpus loss.
Approximately 50% of the terms extracted using text mining were judged nonsensical, hence this
pruning was a critical step in the development of the ontology. If a term is rated as “meaningful”,
its truth value is raised and the term is considered selected.
2.5.4 Relation acquisition
Once a valid concept is selected, the system directs the volunteer to attach relations to the
concept that will determine its position in the ontology. Two types of relation were targeted in
this study, synonymy (same as) and hyponymy (is a). To capture synonyms, a simple fill-in-the-
blank template was presented. For example, if the term “muscle” was selected as valid, the
volunteer would then be invited to enter synonyms through a template like: The term or phrase

29
[blank] means the same thing as “muscle”. A different format was used for capturing the
hyponym relation. The hyponym template asks the volunteer to select a parent-term from a pre-
existing hierarchical vocabulary (initially seeded with the UMLSsn) rather than letting them type
one in freely. This approach was selected with the goal of producing a sensible taxonomic
structure. During the knowledge capture process, terms added to this hierarchy became new
classes that future terms could be classified under, thus allowing the ontology to grow in depth
and complexity.
As each task is completed, the volunteer is returned to a task selection screen and the completed
task's button is removed. When each of the tasks are completed for the select term, another term
is selected and the process repeats.
2.5.5 Volunteer recruitment and reward
To assist in volunteer-recruitment, conference attendees were motivated by a 5 minute
introductory speech at the welcome reception, by flyers included in the conference handouts, and
by the promise of mystery prizes for the most prolific contributors. Points were awarded to the
user for each piece of knowledge added to the system. A simple user management system
allowed the users to create accounts, log out, and log back in again while keeping track of their
cumulative score throughout all sessions. Anonymous logins were also allowed.
2.6 Observations
In this preliminary study, qualitative observation of volunteer response to the system was a
primary objective. As such, the enthusiastic response the project received from the organizers
and the participants in the conference was encouraging, and the willingness of the volunteers to
spend significant amounts of time entering their knowledge was unanticipated. From
conversations with the participants, it became clear that the competitive aspect of the
methodology was often their primary motivation, and this was especially true for the most
prolific contributors who indicated a clear determination to win. Some volunteers also indicated
a simple enjoyment in playing this ‘intellectual game’.

30
Another important observation was that the tree-based interface used to capture the hyponym
relation (see Figure 2.1) was not readily understood by the majority of participants. This
interface required the user to understand relatively arbitrary symbols and to click multiple times
in order to find the correct parent for the term under consideration. In contrast, the interface used
in the later qualitative evaluation (discussed in section 6) required just a single click for each
evaluation, resulting in no confusion or negative comments and more than 11,000 collected
assertions in just three days from a similar number and composition of volunteers.
2.7 Quantitative results
2.7.1 Volunteer contributions
During the 2 active days of the conference, 68 participants out of approximately 500 attendees
contributed to the YI Ontology. Predominantly, volunteers contributed their knowledge during
breaks between talks and during poster sessions at a booth with computer terminals set up for the
purpose; however several participated from Internet connections in their hotel rooms. As
illustrated by Figure 2.2, the quantity of contributions from the different participants was highly
non-uniform, with a single volunteer contributing 12% of the total knowledge added to the
system.
2.7.2 Composition of the YI Ontology
Table 2.1 describes the terms captured for the YI ontology. The pre-processing text mining step
yielded 6371 distinct terms associated with the 213 abstracts processed. These auto-extracted
terms were not added to the ontology until they had been judged meaningful by one of the
volunteers via the term-evaluation template. 464 auto-extracted terms were evaluated by the
conference volunteers. Of these, 232 were judged meaningful and 232 were judged not
meaningful. In addition, the 429 terms entered directly by volunteers (in the keyword
initialization) were all considered to be meaningful. Thus in total the potential corpus for the
ontology consisted of 661 validated terms.

31
2.7.3 Relationships in the YI Ontology
Tables 2.2 and 2.3 describe the numbers of hyponyms and synonyms captured for the YI
ontology. Of the 661 concepts, 207 were assigned parents in the UMLSsn rooted taxonomy. Of
these, 131 concepts came from the auto-extracted set and 76 came from the directly entered set.
As terms could be linked to different parents, 38 additional parental relationships were assigned
to terms within this set, bringing the total number of hyponym relations assigned up to 245. 219
of the accepted terms were associated with at least one synonym, with many linked to multiple
synonyms.
2.8 Quality assessment
The evaluation of the YI Ontology was conducted in similar fashion to the initial knowledge
capture experiment. Following the conference, the 68 participants in the conference study and
approximately 250 researchers at the James Hogg, iCAPTURE Centre for Cardiovascular and
Pulmonary Research were sent an email requesting their participation in the evaluation of the YI
ontology. The email invited them to log on to a website and answer some questions in exchange
for possible prizes. 65 people responded to the request. Upon logging into the website, the
evaluators were presented with templates that presented a term, a hyponym relation, or a
synonym relation from the YI Ontology. They were then asked to make a judgment about the
accuracy of the term or relation. For synonyms and hyponyms, they were asked to state whether
the relationship was a “universal truth”, “true sometimes”, “nonsense”, or “outside their
expertise”. For terms, they were asked whether the term was a “sensible concept”, “nonsense”,
or “outside their expertise”. After making their selection, another term or relation from the YI
ontology that they had not already evaluated was presented and the process repeated.
Again, participants were provided motivation through a contest based on the total number of
evaluations that they made (regardless of what the votes were and including equal points for
indicating “I don’t know”). Participation in the evaluation was excellent, with 5 responders
evaluating every term and every relation in the ontology. During the three days of the
evaluation, 11,545 votes were received, with 6060 on the terms, 2208 on the hyponyms, and

32
3277 on the synonyms. 93% of the terms, 54% of the synonyms and 49% of the hyponyms
enjoyed more positive than negative votes overall.
Figures 2.3a, 2.3b, and 2.3c display plots of the fraction of “true” votes received for each term,
synonym and hyponym in the ontology. These curves illustrate strong positive consensus for the
large majority of captured terms, but considerable disagreement regarding the quality of the
captured synonyms and hyponyms. To some extent this may have been caused by the exclusion
of the “sometimes” category from the term evaluations, but even when the “sometimes” votes
are merged with the “true” votes, there are still considerably fewer positive votes for the
hyponyms and synonyms and less agreement among the voters. This is illustrated for the
hyponyms in Figure 2.3d.
Table 2.4 gives some examples of the contents of the YI ontology. These examples illustrate that
the voting process successfully identified high quality components that should be kept, low
quality components that should be discarded, and questionable components in need of
refinement. These assessments could be used to improve the overall quality of the ontology
through immediate pruning of the obviously erroneous components and by guiding future
knowledge capture sessions meant to clarify those components lacking a strong positive or
negative consensus.
2.9 Summary
Between April 29th and April 30th 2005, 661 terms, 207 hyponym relations, and 340 synonym
relations were collected from 68 volunteers at the CIHR National Research Forum for Young
Investigators in Circulatory and Respiratory Health. In a subsequent community evaluation,
93% of the terms, 54% of the synonyms and 49% of the hyponyms enjoyed more positive than
negative votes overall. The rudimentary ontology constructed from these terms and
relationships was composed at a cost of the 4 t-shirts, 3 coffee mugs, and one chocolate moose
that were awarded as prizes to thank the volunteers.

33
2.10 Discussion
This work addresses the key bottleneck in the construction of semantic web resources for the life
sciences. Ontology construction to date has proven to be extremely, possibly impractically,
expensive given the wide number of expert knowledge domains that must be captured in detail.
Thus, it is critical that a rapid, accurate, inexpensive, facile, and enjoyable approach to
knowledge capture be created and ubiquitously deployed within the life science research
community. To achieve this, a paradigm shift in knowledge capture methodologies is required.
The open, parallel, decentralized, synergistic protocol presented in this study represents a
significant deviation from the centralized, highly curatorial model employed in the development
of all of the major bio/medical ontologies produced to date.
The positive consequences of this approach are that 1) knowledge can be captured directly from
domain experts with no additional training, 2) a far larger number and diversity of experts can be
recruited than would ever be feasible in a centralized effort and 3) because the approach involves
no paid curators, the overall cost of ontology development is very low.
The negative aspect of the approach is that the knowledge collected is “dirty”, requiring
subsequent cleaning to achieve high quality. Future versions of the iCAPTURer software will
attempt to improve on the quality of the captured knowledge by integrating the evaluation phase
directly with the knowledge capture phase. In this “active learning” approach, the questions will
be tuned on-the-fly to direct knowledge capture efforts to areas of uncertainty or contention
within the developing ontology and to quickly weed out assertions that are clearly false. The
present study describes just one step of such a multi-step process, with obvious opportunities for
immediate improvement in the next iteration based on the knowledge gathered during the
evaluation.
In comparison to existing methodologies, which tend to separate the biologists from the
ontologists, the iCAPTURer approach demonstrates dramatic improvements in terms of cost and
speed. If future work confirms that this approach can also produce high quality ontologies, the
emergence of a global semantic web for the life sciences may occur much sooner than expected.
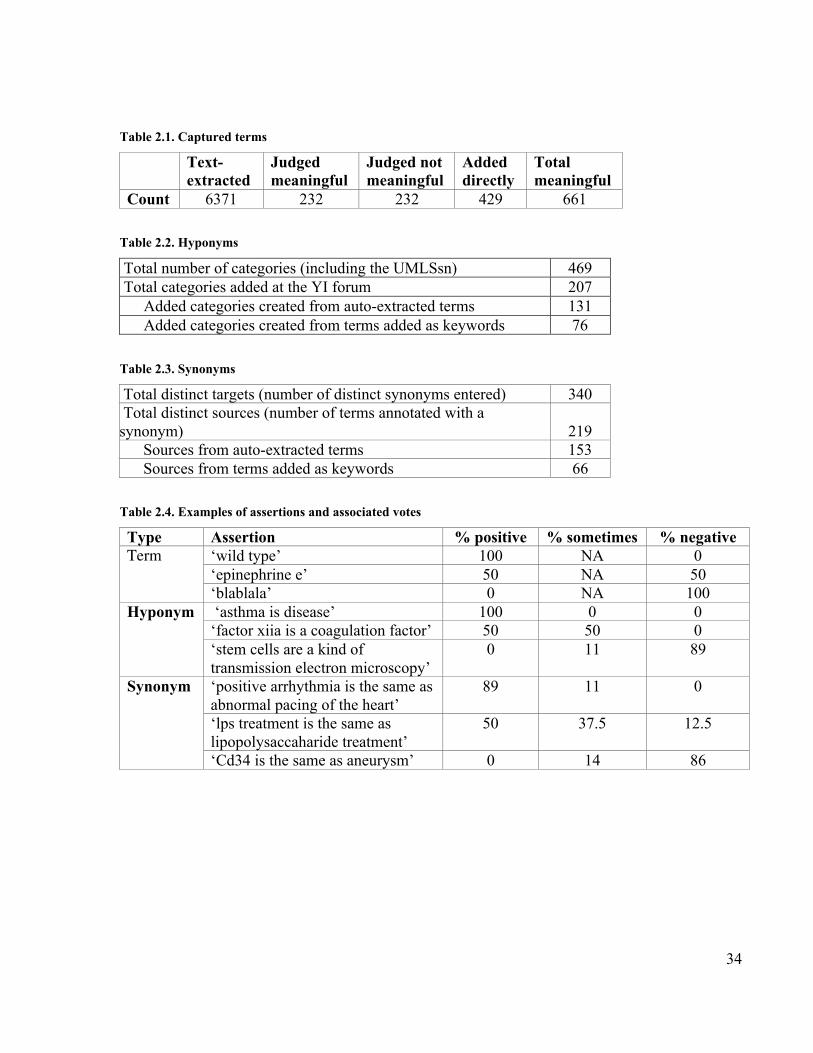
34
Table 2.1. Captured terms
Text-extracted
Judgedmeaningful
Judged notmeaningful
Addeddirectly
Totalmeaningful
Count 6371 232 232 429 661
Table 2.2. Hyponyms
Total number of categories (including the UMLSsn) 469 Total categories added at the YI forum 207 Added categories created from auto-extracted terms 131 Added categories created from terms added as keywords 76
Table 2.3. Synonyms
Total distinct targets (number of distinct synonyms entered) 340 Total distinct sources (number of terms annotated with asynonym) 219 Sources from auto-extracted terms 153 Sources from terms added as keywords 66
Table 2.4. Examples of assertions and associated votes
Type Assertion % positive % sometimes % negative‘wild type’ 100 NA 0‘epinephrine e’ 50 NA 50
Term
‘blablala’ 0 NA 100 ‘asthma is disease’ 100 0 0‘factor xiia is a coagulation factor’ 50 50 0
Hyponym
‘stem cells are a kind oftransmission electron microscopy’
0 11 89
‘positive arrhythmia is the same asabnormal pacing of the heart’
89 11 0
‘lps treatment is the same aslipopolysaccaharide treatment’
50 37.5 12.5
Synonym
‘Cd34 is the same as aneurysm’ 0 14 86

35
Figure 2.1. Hyponym collection
'Muscle' is being placed as a child of 'Anatomical Structure'.
Figure 2.2. Distribution of participant contributions.
The X axis denotes the participant number, the Y-axis the fraction of the knowledge basecontributed by that individual.
0
0.02
0.04
0.06
0.08
0.1
0.12
0.14
1 4 7 10 13 16 19 22 25 28 31 34 37 40 43 46 49 52 55 58 61 64
FractionKBauthored
Volunteer
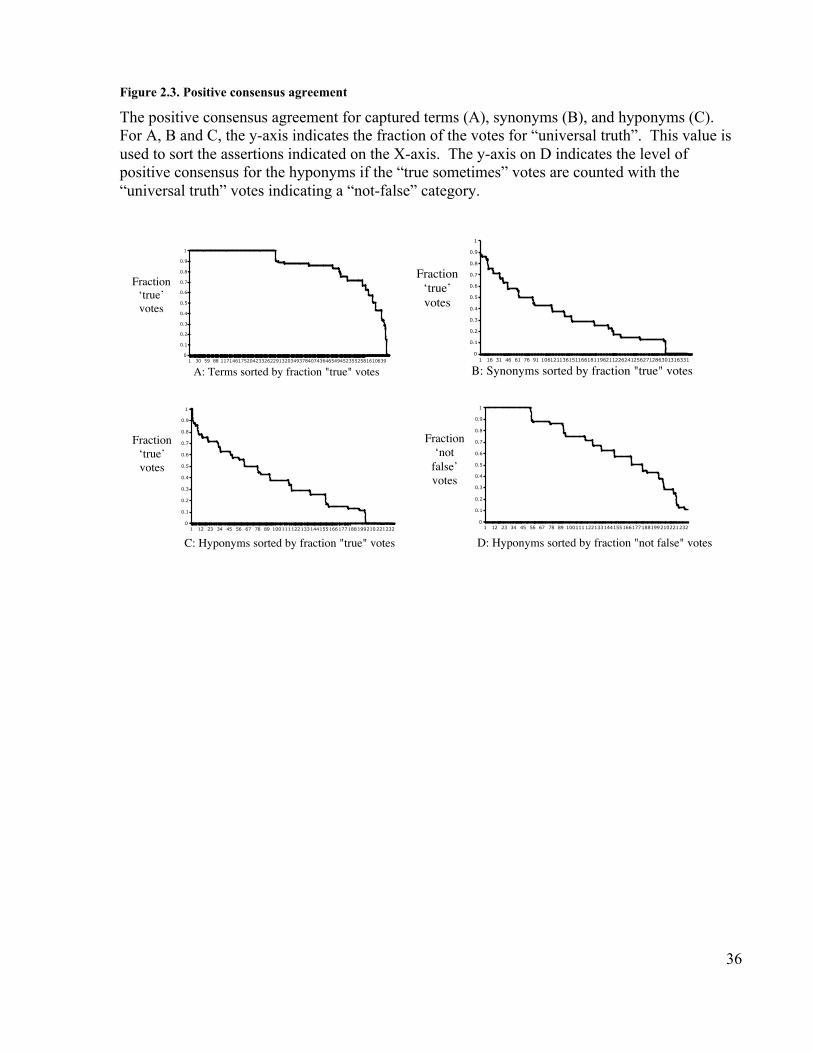
36
Figure 2.3. Positive consensus agreement
The positive consensus agreement for captured terms (A), synonyms (B), and hyponyms (C).For A, B and C, the y-axis indicates the fraction of the votes for “universal truth”. This value isused to sort the assertions indicated on the X-axis. The y-axis on D indicates the level ofpositive consensus for the hyponyms if the “true sometimes” votes are counted with the“universal truth” votes indicating a “not-false” category.
Fraction‘true’votes
A: Terms sorted by fraction "true" votes0
0.1
0.2
0.3
0.4
0.5
0.6
0.7
0.8
0.9
1
1 30 59 88 117146175204233262291320349378407436465494523552581610639
Fraction‘true’votes
B: Synonyms sorted by fraction "true" votes0
0.1
0.2
0.3
0.4
0.5
0.6
0.7
0.8
0.9
1
1 16 31 46 61 76 91 106121136151166181196211226241256271286301316331
Fraction‘true’votes
C: Hyponyms sorted by fraction "true" votes
0
0.1
0.2
0.3
0.4
0.5
0.6
0.7
0.8
0.9
1
1 12 23 34 45 56 67 78 89 100111122133144155166177188199210221232
Fraction‘not
false’votes
D: Hyponyms sorted by fraction "not false" votes
0
0.1
0.2
0.3
0.4
0.5
0.6
0.7
0.8
0.9
1
1 12 23 34 45 56 67 78 89 100111122133144155166177188199210221232
37
References
1. Berners-Lee T, Hendler J, Lassila O: The semantic web. Scientific American 2001,284(5):34-43.
2. Ashburner M, Ball CA, Blake JA, Botstein D, Butler H, Cherry JM, Davis AP, DolinskiK, Dwight SS, Eppig JT et al: Gene ontology: tool for the unification of biology. TheGene Ontology Consortium. Nature Genetics 2000, 25(1):25-29.
3. ODP - Open Directory Project [http://www.dmoz.org]4. Wilkinson MD, Links M: BioMOBY: an open source biological web services
proposal. Briefings in bioinformatics 2002, 3(4):331-341.5. Forum for Young Investigators in Circulatory and Respiratory Health
[http://www.yiforum.ca/]6. Maedche A, Staab S: Ontology learning for the semantic web. IEEE Intelligent Systems
2001:72-79.7. Cimiano P, Hotho A, Staab S: Learning concept hierarchies from text corpora using
formal concept analysis. Journal of Artificial Intelligence Research 2005, 24:305-339.8. Chklovski T: LEARNER: A system for acquiring commonsense knowledge by
analogy. In: K-CAP'03: October 23-26, 2003 2003; Florida, USA; 2003.9. Chklovski T: Using Analogy to Acquire Commonsense Knowledge from Human
Contributors. PhD. Boston: Massachusetts Institute of Technology; 2003.10. Richardson M, Domingos P: Building Large Knowledge Bases by Mass
Collaboration. In: K-CAP'03: 2003; Florida, USA; 2003.11. Singh P, Lin T, Mueller ET, Lim G, Perkins T, Zhu WL: Open Mind Common Sense:
Knowledge Acquisition from the General Public. Lecture Notes in Computer Science2002, 2519:1223-1237.
12. Chklovski T, Gil Y: Towards managing knowledge collection from volunteercontributors. In: AAAI Spring Symposium on Knowledge Collection from VolunteerContributors: 2005: AAAI; 2005.
13. Chklovski T: Designing Interfaces for Guided Collection of Knowledge aboutEveryday Objects from Volunteers. In: Conference on Intelligent User Interfaces:2005; California, USA; 2005.
14. Learner 2.5 -- a Game of Knowledge [http://seagull.isi.edu/learner2/]15. Frantzi KT, Ananiadou S, Tsujii J: The C-value/NC-value Method of Automatic
Recognition for Multi-word Terms. Lecture Notes in Computer Science 1998,1513:585-600.
16. McCray AT: An upper-level ontology for the biomedical domain. Comp FunctGenomics 2003, 4(1):80-84.
17. Niles I, Pease A: Towards a standard upper ontology. In: The international conferenceon Formal Ontology in Information Systems: 2001; Ogunquit, Maine, USA: ACM Press;2001: 2-9.

38
3 Ontology engineering using volunteer labour5
3.1 Introduction
Ontologies are a fundamental component of the incipient Semantic Web. To achieve its visions,
ontologies need to be written in Semantic Web compatible languages such as OWL and used to
annotate the resources of the Web. However, as with many previous efforts in the domain of
artificial intelligence, ontology development faces the problem of the knowledge acquisition
bottleneck. Given current approaches, ontology development is a slow, expertise-heavy, labor-
intensive, and thus costly enterprise. The work presented here is part of a larger project that
seeks to dramatically reduce the costs associated with ontology development by altering the
process of knowledge acquisition such that it may be distributed across a very large number of
volunteers simultaneously via the Internet.
The process starts with a seed ontology that may be generated automatically or semi-
automatically; for example, from text [1], or from a translation of an existing structured resource
such as a thesaurus [2]. The putative classes and relations in the inferred ontology are then
validated and refined based on answers to questions about them posed to a large pool of
volunteers. The simplest form of these questions is simply, to ask whether or not a given
ontological statement is ‘true’ or ‘false’. Each question is posed to multiple volunteers. To
make improvements to the ontology, the responses are combined using methods that attempt to
incorporate estimates of trust in each volunteer.
The goal of the work presented here is to estimate how well our system can detect errors in auto-
generated statements of the subsumption relationship without any training for the volunteers. The
relationships that we use are drawn from the biomedical domain. For example, how well can
volunteers (individually or in aggregate) answer questions such as “is a nipple a kind of breast”
or “is a lymphocyte a sub-class of a lymphatic system”?
5 A version of this chapter has been published. Good BM, Wilkinson MD: Ontology enginering using volunteerlabour. In: Proceedings of the World Wide Web Conference: 2007; Banff, Canada; 2007: 1243-1244.

39
3.2 Creating an OWL version of MeSH
MeSH, which stands for ‘Medical Subject Headings’, is the thesaurus used by the United States
National Library of Medicine to index the millions of biomedical journal articles described in the
Pubmed/MEDLINE database [3]. MeSH has been automatically converted to OWL using a
simple, but problematic, mapping from the ‘narrower than’ thesaural relation to the
rdfs:subClassOf relation [4]. By our estimation, about 40% of the predicted sub-class relations
are incorrect. Many are statements of meronymy, as in the nipple-breast example above, but
there are many more subtle problems in the mix as well [5]. The experiment described below
tests our volunteer-driven system’s ability to detect these errors.
3.3 Experiment
Following from previous work that utilized scientific conferences as settings for focused
knowledge capture efforts [6], this experiment took place at the annual meeting of a large
research project directed at identifying biomarkers of allograft rejection [7]. The setting of the
meeting made it easy to identify volunteers from the biomedical domain and to provide
motivation for their participation in the form of a small prize awarded to the most prolific
contributor at the end of the conference.
The volunteers were asked to login to a website and answer a series of questions about
subsumption relations from MeSH.owl. These questions were provided in one of two forms: “Is
it true that a ‘mast_cell’ is also a ‘connective_tissue_cell’?” or “Is it true that all instances of the
class ‘b-lymphocyte’ are also instances of the class ‘antibody_producing_cell’?”.
3.3.1 Test data
To measure the performance of the volunteer-system on this task, we used a sample of 130
MeSH.owl sub-class relations which we manually labeled as either true or false. The sample
relation set was generated by extracting the subgraph of the MeSH term ‘immune system’ which
included all of its parents, all of its subclasses and all of the parents of all of its subclasses. The
term ‘immune system’ was chosen because the topic of the meeting where the experiment was
conducted was closely related to immunology.

40
3.4 Results
Over the course of the 2 day experiment, responses from 25 volunteers were recorded. All but
two of these were from the 50 attendees of the Biomarkers annual meeting, the others were from
external IP addresses. As observed in previous experiments of this nature and displayed in
Figure 3.1, the amount of labor provided per volunteer exhibited a characteristic long-tail
distribution with a few volunteers contributing the large majority of the work. Overall, only 5 of
the volunteers responded to more than 25% of the questions and only one volunteer responded
with an assertion of ‘true’ or ‘false’ to more than 90% of the questions in the test set.
3.4.1 Performance of aggregated responses
Five methods were tested for combining the multiple volunteer assertions about each putative
MeSH sub-class relation. The simplest method was to take the majority vote for each potential
sub-class. The next method weighted each vote based on the time taken between it and the
previous vote. As they did not use any training, these were evaluated on the entire set of
samples.
The other three methods involved machine learning algorithms (1R, Support Vector Machines,
and Naive Bayes) that attempted to learn how best to combine the votes using the data collected.
If, for example, one voter consistently voted correctly, these algorithms should detect that voter
and weight their responses above others. Each row of training data for these methods consisted
of the target class (the true/false label for one sub-class relation), the votes for that relation from
each volunteer who voted on it (including assertions of ‘I don’t know’), and the ratio of the true
verse false votes gathered from all volunteers for that relation. These methods were evaluated
using 10-fold cross-validation over the whole set of samples. Table 3.1 provides a summary of
the results obtained for the various methods. It is problematic to directly compare the results of
the cross-validation evaluations to those from the non-learning based approaches, but there does
seem to be an advantage gained by the learning methods.

41
3.5 Discussion and future work
Due to the relatively small number of volunteers and number of test cases, the work presented
here should be considered as preliminary. However, it did re-iterate previous results indicating
that volunteers can be found, but that this kind of task and this kind of incentive strategy are
sufficient to keep the attention of only a small fraction of the recruits. It also suggested that
learning algorithms can aid in forming intelligent aggregates of multiple voters on ontology
evaluation tasks. Future experiments will test the effects of various training mechanisms for
improving individual volunteer performance and will continue to evaluate different approaches
to combining the assertions of multiple volunteers.

42
Table 3.1. Performance on subclass-assessment task using the different aggregation methods
The F-measure is the harmonic mean of precision P and recall R where P = tp/fp+tp), R =tp/fn+tp), F-measure = 2*P*R/(P+R)
AggregationMethod
%correct F-false F-true
A SingleVolunteer .62 .17 .75
Majority Vote(MV) .64 .23 .77
MV weighted bytime between
votes.63 .47 .71
1R .71 .56 .78SVM .75 .64 .78
Naive Bayes .75 .64 .81
Figure 3.1. Volume of participation per volunteer
For each volunteer listed on the X-axis, the Y-axis shows the fraction of the total number ofsubclass judgements that could have been made that the volunteer asserted. Note that a fewvolunteers completed nearly all of the statements while most contributed very little.
0
0.2
0.4
0.6
0.8
1
1.2
1 2 3 4 5 6 7 8 9 10 11 12 13 14 15 16 17 18 19 20 21 22 23 24 25
Volunteer
fract
ion
su
bcl
ass
ju
dg
men
ts m
ad
e

43
References
1. Cimiano P, Hotho A, Staab S: Learning concept hierarchies from text corpora usingformal concept analysis. Journal of Artificial Intelligence Research 2005, 24:305-339.
2. Van Assem M, Menken M, Schreiber G, Wielemaker J, Wielinga B: A Method forConverting Thesauri to RDF/OWL. In: International Semantic Web Conference:November 7-11 2004; 2004: 17-31.
3. The Basics of Medical Subject Headings (MeSH)[http://www.nlm.nih.gov/bsd/disted/mesh/index.html ]
4. OBO Download Matrix [http://www.fruitfly.org/~cjm/obo-download/ ]5. Nelson SJ, Johnston D, Humphreys BL: Relationships in Medical Subject Headings.
In: Relationships in the organization of knowledge. Edited by Bean CA, Green R. NewYork: Kluwer Academic Publishers; 2001: 171-184.
6. Good BM, Tranfield EM, Tan PC, Shehata M, Singhera GK, Gosselink J, WilkinsonMD: Fast, cheap and out of control: A zero curation model for ontologydevelopment. In: Pacific Symposium on Biocomputing: January 3-7 2006; Hawaii, USA:World Scientific; 2006: 128-139.
7. Biomarkers in Transplantation [http://www.allomark.ubc.ca/ ]

44
4 OntoLoki: an automatic, instance-based method for the evaluation of biological
ontologies on the semantic Web6
4.1 Background
In recent years, the explosive growth of data in the life sciences has produced the need for many
new biological and medical ontologies [1, 2]. To meet this need, the biomedical informatics
community has developed powerful tools for building ontologies such as Protégé [3, 4],
established institutions devoted to improving and expanding the practice of biomedical ontology
design [5], and produced an ever-increasing number of ontologies and ontology-based
applications [6]. Outside of the biomedical community, the broader W3C-lead semantic Web
initiative has produced new, standardized languages for sharing ontologies on the Web, such as
OWL [7], as well as efficient algorithms for automated, deductive reasoning over the knowledge
represented within them [8, 9]. These advances aid the processes of building, sharing, and using
biological and medical ontologies; however, one well-recognized, yet largely unmet need
remains the development of effective, objective methods for the evaluation of ontology quality
[10, 11]. As Jeremy Rogers points out,
“the medical and non-medical ontology engineering communities have yet to
define, much less to regularly practice, a comprehensive and systematic
methodology for assuring, or improving, the quality of their product” [12].
In much the same way that consistent standards for designing, building, and evaluating the
products of physical engineering efforts can contribute to the efficiency of the engineering
process and the reliability of the end-product, an effective, systematic methodology for ontology
design and evaluation would be a great benefit to the community. Though some attempts have
been made at comprehensive methodologies, such as Methontology [13], none has gained
widespread adoption. We suggest that before such a methodology can truly be successful, a
wealth of measurements of the characteristics of ontologies as well as a detailed understanding of
their implications is necessary.
6 A version of this chapter will be submitted for publication. Good BM, Ha G. Kin Ho C., Wilkinson MD:OntoLoki: an automatic, instance-based method for the evaluation of biological ontologies on the semantic Web.

45
To contribute to the eventual development of a comprehensive methodology for ontology design
and evaluation, we introduce a new way of automatically measuring one important ontology
characteristic that is currently inaccessible using existing methods. The delineation of precise
definitions for each class in an ontology and the consistent application of these definitions to the
assignment of instances to classes are well-accepted desiderata for ontologies. If ontologies are
defined with formal restrictions on class membership, then such consistency can be checked
automatically using existing technology. If no such logical restrictions are applied however, as is
the case with many current biological and medical ontologies, then there are currently no
automated methods for measuring the consistency of instance assignment for the purpose of
evaluation. The aim of this study is thus to identify, implement, and test a new method for
automatic, data-driven ontology evaluation that is suitable for the evaluation of the consistency
of ontologies with no formally defined restrictions on class membership.
4.2 Results
The results of this research comprise the OntoLoki method for ontology evaluation, its
implementation, and the empirical evaluation of the implementation. Each aspect is now
presented in turn.
4.2.1 OntoLoki method
4.2.1.1 Input and output
Figure 4.1 illustrates the basic process of ontology evaluation using the OntoLoki method. The
input is a knowledge base containing an ontology, instances assigned to the classes in that
ontology, and properties associated with those instances. The output is, for each class in the
ontology,
1) a rule that defines a pattern of properties that attempts to separate the instances of the
class from the instances of other classes,
2) a quantitative score, called ‘classification consistency’, based on the ability of the
identified rule to correctly predict class membership for the instances in the knowledge
base.

46
High classification consistency means that instances are assigned to classes based on strictly
followed rules expressed through specific patterns of properties evident in the instances. For
example, a classification rule could be used to assign all instances in a particular knowledge base
that displayed both the property of having blue feathers and the property of having a red beak to
a particular class. As long as the rule is applied reliably, such that all members of the class
exhibit this pattern of properties, the class should receive a high classification consistency score.
On the other hand, a low classification consistency score is an indication that – in the context of
the specific knowledge base used in the evaluation – no consistent pattern of properties could be
found to differentiate the members of the class in question from the other classes.
4.2.1.2 Processing
The classification consistency of an ontology, effectively the ability to identify patterns of
properties that can be used to correctly assign instances to its classes, may be computed as
follows:
1) Assemble a knowledge base composed of the ontology, instances of each of the classes
considered from the ontology, and the properties of interest for those instances.
2) For each class in the ontology,
a. Compose a dataset consisting of instances of that class (positive examples) and
instances that are not members of that class (negative examples). This data may
take the form of a simple table, where the rows correspond to instances and the
columns correspond to properties of those instances.
b. Use this data to build a classifier to distinguish between positive and negative
instances of the class in question
i. Generate scores for each class based on the ability of the classifier to
correctly predict the classes associated with the instances based on their
properties.
ii. Record the pattern identified by the classifier for each class.

47
To provide a single classification consistency score for the entire ontology, report the average
score across all the classes.
4.2.2 Implementation
The implementation presented here is designed for application to ontologies and knowledge
bases created according to the standards defined by the semantic Web working group(s) of the
World Wide Web Consortium. Ontologies are thus expected to be represented in the OWL
language [7] and knowledge bases are assembled by building or discovering RDF [14] graphs
containing instances of the ontology classes. The RDF predicates originating from each instance
of an ontology class to be evaluated provide the properties of those instances used for the
evaluation. Chains of such predicates and their objects can be combined to form arbitrarily
complex properties associated with each instance.
4.2.2.1 Step 1 – knowledge base discovery
The first step in the process of conducting an OntoLoki evaluation is the discovery of a
knowledge base containing instances of the ontology classes and their properties. Though we
would eventually like to include a discovery module in our implementation that assembles the
required knowledge bases dynamically by identifying suitable content on the semantic Web, for
example, through the automatic generation of queries issued to semantic repositories such as
Bio2RDF [15, 16] and DBpedia [17], the current implementation requires manual intervention
during the composition of the needed datasets. Once an OWL/RDF knowledge base is
assembled, the rest of the processing is completely automated. In the experiments presented
below, all the data is gathered through queries to the UniProt protein database [18]. This resource
was selected because the instances of the evaluated ontologies correspond to proteins and the
queries to this resource return RDF representations of the properties associated with proteins. To
clarify interpretation of the experimental results below and to illustrate the raw input to our
implementation, we provide a short description of the UniProt data.

48
4.2.2.2 UniProt beta RDF representation
The RDF versions of UniProt protein records are organized according to the UniProt core
ontology [19]. At the time of writing, this OWL ontology used 151 classes, 39 object properties,
65 data properties, and 59 individuals to form the descriptions of all of the UniProt proteins.
Each protein resource is represented as an instance of the class ‘Protein’. The two most
important predicates associated with proteins for present purposes are ‘annotation’ and
‘seeAlso’.
The UniProt ‘annotation’ object property is used to form relations between protein instances and
instances of the class ‘Annotation’. ‘Annotation’ is subdivided into many different kinds of
annotation, including 83 distinct subclasses. Examples of Annotation classes include
‘Transmembrane_Annotation’, ‘Helix_Annotation’, ‘Signal_Peptide_Annotation’,
‘Lipidation_Annotation’, and ‘Biotechnology_Annotation’. These classes are used in at least
two importantly different ways. In one, the class is specific enough to thoroughly encapsulate
the intended meaning of the annotation; in the other, the precise meaning must be inferred from
additional, often non-formal, statements. For example, consider the sample of UniProt RDF
statements about the protein P35829 depicted in Figure 4.2 [20].
In Figure 4.2, protein P35829 is described with three annotations. The first is a “Signal Peptide
Annotation”, the second a “Function Annotation”, and the third a “Post-translational
modification annotation”. The Signal Peptide annotation is quite specific, needing no more
additional clarification as to its meaning. On the other hand, the latter two of these annotations
are ambiguous and are thus enhanced in the record with textual comments that contain most of
their meaning (e.g. the Post-translational modification is ‘Glycosylated’).
This situation raises a problem for automated semantic processing in that it requires the
implementation to either ignore the information present in the comment fields, or incorporate
some manner of natural language understanding to extract the information. As the aim of the
implementation generated for this project is to take advantage of the structured data of the
semantic Web, the comments were not incorporated into the training data for the classifiers.

49
The other important property used to describe proteins in the UniProt data is rdfs:seeAlso. This
is used to form relations between the proteins in UniProt and records from other databases. For
example, P35829 is the subject of the following statement:
<rdfs:seeAlso rdf:resource="http://purl.uniprot.org/interpro/IPR004903"/>
Unfortunately, both the nature of these relationships and the nature of the external record is not
captured. From the standpoint of an agent processing this data, each of the above statements is
equally meaningless; each saying P35829 has some relationship to some other resource of
unknown type/nature. Though it goes against the goal of providing a completely generic
implementation that works according to the standards of the semantic Web, the information
about the InterPro domains was needed for this particular experiment. Thus, a specific block of
code was added to extract the InterPro annotations and add them to the training data. The other
seeAlso statements were not processed.
4.2.2.3 Step 2 – propositionalization of the RDF
Once an appropriate OWL/RDF knowledge base is assembled, our implementation maps the
relational structure of the RDF graph to the flat structure of the tables used by most current class
prediction algorithms in a process known as ‘propositionalization’ [21]. Each instance becomes
a row in a simple 2-dimensional table and each property becomes a column. To identify
properties, the RDF graph is traversed until either pre-defined endpoints or a specified maximum
depth is reached. For example, properties that would be extracted from the protein graph
represented in Figure 4.2 would be ‘annotation_Signal-Peptide’, ‘annotation_Function-
Annotation’, and ‘seeAlso-IPR004903’. More complex properties can be extracted by traversing
deeper into the graph and recording the path.
The following list delineates important choices made in our implementation that may or may not
be appropriate in others.
1) The extracted table represents a set of binary values. Each instance is assigned a true or a
false value for each identified property.

50
2) The table does not reflect the open-world assumption of the semantic Web. If a property
is not attached to an instance in the knowledge base, it is assumed not to exist and set to
false.
3) The table does represent the subsumption relationship. Instances are indicated as
members of both the class they are directly assigned to and all of the superclasses of that
class.
4.2.2.4 Step 3 – preparing the dataset for the evaluation of a single class
Once a table representing the knowledge base is constructed, subsections of it are extracted for
the evaluation of individual classes. To begin the evaluation of any particular class in the
ontology, a table of data is composed specifically for that class by:
1) Selecting only those rows that are instances of the direct parent of the class (where simple
subsumption reasoning ensures that this set will contain all of the instances of the class in
question).
2) Removing all of the class columns (is a) except for the class in question.
This results in a table with one class column corresponding to the class being evaluated where
all the rows correspond either to instances of that class (positive examples), or instances of its
parent or sibling classes that are not instances of it (negative examples). This formulation allows
for the detection of patterns that serve to discriminate classes from their parents and, through
subsumption, their hierarchical siblings. If such patterns are detected, the addition of the class in
question to that particular hierarchical location in the ontology is considered justified and the
reason for its inclusion denudated.
4.2.2.5 Step 4 – classifier training and testing
Once a table containing positive and negative instances of a particular class is created, the next
step is to find patterns of properties that can define the rules for membership in the class. In our
implementation, this inductive process is accomplished through the application of supervised
learning algorithms made available by the Waikato Environment for Knowledge Analysis
(WEKA)[22].
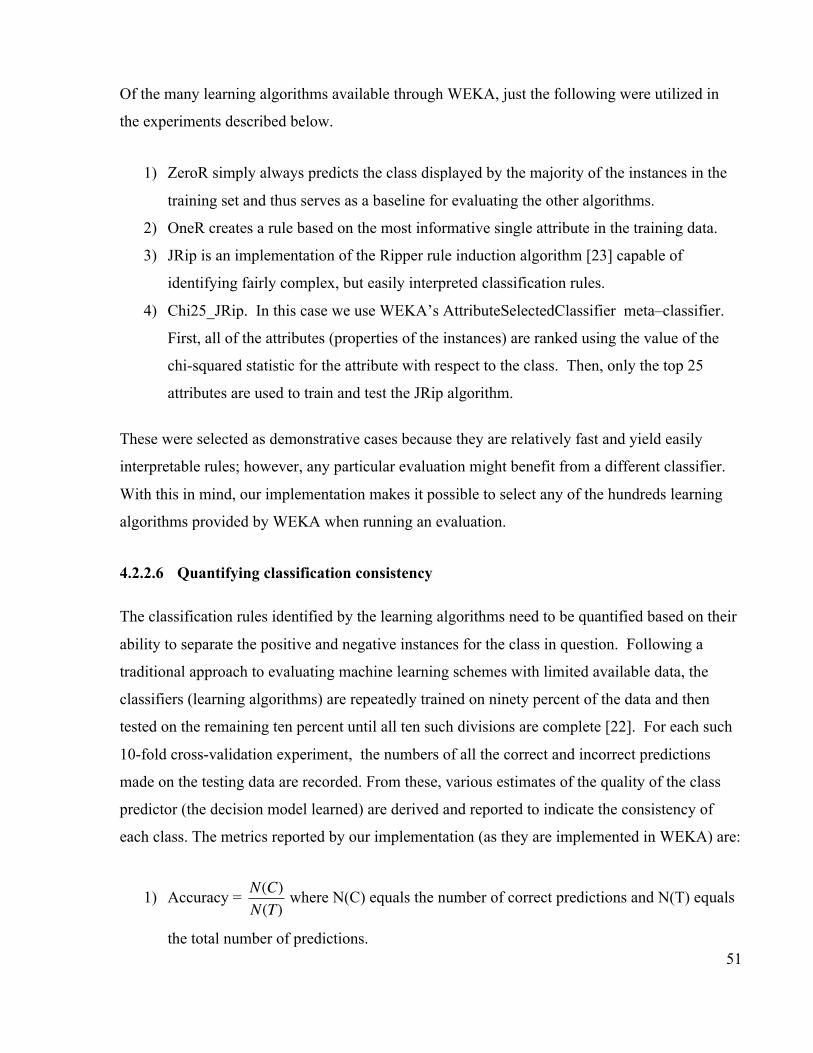
51
Of the many learning algorithms available through WEKA, just the following were utilized in
the experiments described below.
1) ZeroR simply always predicts the class displayed by the majority of the instances in the
training set and thus serves as a baseline for evaluating the other algorithms.
2) OneR creates a rule based on the most informative single attribute in the training data.
3) JRip is an implementation of the Ripper rule induction algorithm [23] capable of
identifying fairly complex, but easily interpreted classification rules.
4) Chi25_JRip. In this case we use WEKA’s AttributeSelectedClassifier meta–classifier.
First, all of the attributes (properties of the instances) are ranked using the value of the
chi-squared statistic for the attribute with respect to the class. Then, only the top 25
attributes are used to train and test the JRip algorithm.
These were selected as demonstrative cases because they are relatively fast and yield easily
interpretable rules; however, any particular evaluation might benefit from a different classifier.
With this in mind, our implementation makes it possible to select any of the hundreds learning
algorithms provided by WEKA when running an evaluation.
4.2.2.6 Quantifying classification consistency
The classification rules identified by the learning algorithms need to be quantified based on their
ability to separate the positive and negative instances for the class in question. Following a
traditional approach to evaluating machine learning schemes with limited available data, the
classifiers (learning algorithms) are repeatedly trained on ninety percent of the data and then
tested on the remaining ten percent until all ten such divisions are complete [22]. For each such
10-fold cross-validation experiment, the numbers of all the correct and incorrect predictions
made on the testing data are recorded. From these, various estimates of the quality of the class
predictor (the decision model learned) are derived and reported to indicate the consistency of
each class. The metrics reported by our implementation (as they are implemented in WEKA) are:
1) Accuracy =
€
N(C)N(T)
where N(C) equals the number of correct predictions and N(T) equals
the total number of predictions.

52
2) F-Measure for predicting the target class F(1) and for predicting not the target class F(0)
a. F(c) =
€
2(P(c) *R(c))P(c) + R(c)
where P(c) equals the precision of predicting the class c and
R(c) equals the recall for predicting class c.
i. P(c) =
€
TPTP + FP
where TP equals the number of true positive predictions
and FP equals the number of false positive predictions.
ii. R(c) =
€
TPTP + FN
where TP equals the number of true positive predictions
and FN equals the number of false negative predictions.
3) Kappa: K =
€
P(A) − P(E)1− P(E)
where P(A) equals the probability of correct prediction of the
learned classifier and P(E) equals the probability of correct prediction by chance.
4) Kononenko-Bratko information gain. See [24] for the derivation of this metric which is
generally similar in intent to the Kappa statistic.
These estimates of the quality of the induced decision models attempt to reflect the relative
existence of a consistent, unique pattern of properties associated with the class being evaluated.
4.2.3 Testing
Now that the method, illustrated in Figure 4.3, and our implementation have been described, we
turn to an assessment of the data that it produces. We assert that the OntoLoki metrics
quantitatively represent the quality for an ontology in a particular context and that the
classification rules learned in the process could be useful in both the process of ontology
engineering and in knowledge discovery. To provide evidence for these claims, we now present
the results of the evaluation of several ontologies. The evaluations begin with a control
experiment intended to show that the implementation is successful in producing the expected
results on artificially generated ontologies displaying known levels of quality. This is followed
by the evaluation of two real-world, biological ontologies, one very simple and one large and
structurally complex.

53
4.2.3.1 Experiment 1 – control: Phosphabase and its permutations
To evaluate the ability of the OntoLoki method, we began by identifying a gold standard with
regard to classification consistency. We sought an ontology and a knowledge base that, in
addition to displaying highly consistent classification, were representative of the biomedical
domain. A combination that met these criteria was provided by the Phosphabase ontology [25]
and an OWL/RDF knowledge base extracted from UniProt.
Phosphabase is an OWL ontology for describing protein phosphatases based on their domain
composition. For example, the class “classical Tyrosine Phosphatase” is defined to be equivalent
to the set of proteins that contain at least one InterPro domain IPR000242. Because class
definitions like this have been formalized with OWL DL restrictions, it is possible to use
reasoners, such as Pellet [9] and Fact++ [8], to automatically classify protein instances within the
ontology. For example, if a novel protein is discovered to have an IPR000242 domain, then a
reasoner can be used to infer that it is an instance of the class ‘classical Tyrosine Phosphatase’
[25].
Ontologies, like Phosphabase, that are constructed using DL class restrictions, form a
particularly interesting and useful case from the perspective of the quality evaluations suggested
here. The formal, computable restrictions on class membership that they encode can be used to
guarantee that the instances of each class demonstrate a perfectly specific pattern of properties.
The ability to rediscover the decision boundaries formed by these class restrictions and expressed
in the properties of instances assigned to the classes can thus serve as a positive control on our
implementation. If these straightforward, perfectly consistent patterns cannot be discovered,
then the implementation could not expect to identify more complex patterns in noisier, more
typical, data.
To create a control knowledge base using a DL ontology like Phosphabase, the following steps
are applied:
1) classify the instances of the knowledge base using a DL reasoner
2) strip the definitions from the classes

54
3) convert the classified knowledge base into a table as discussed above
This process results in a knowledge base where the properties of the instances are guaranteed to
contain the information required to identify the decision boundaries represented in the original
class definitions but where those definitions are unknown to the implementation.
To prepare the knowledge base for the Phosphabase experiment, instances in the form of proteins
annotated with InterPro domains were gathered by a query issued to UniProt beta [18]. The
query retrieved reviewed protein records where the term ‘phosphatase’ appeared in the
annotation of the protein in any of the fields: ‘domain’, ‘protein family’, ‘gene name’, ‘gene
ontology’, ‘keyword’, ‘protein name’, or ‘web resource’. This query, executed on November 6,
2007, produced 3169 protein instances, each with extensive annotation expressed in OWL/RDF.
For the control experiment, the only properties that were considered were the InterPro domains
and the presence of transmembrane regions because these were the only features used in the
Phosphabase class restrictions. Once the instances were retrieved and their annotations mapped
to the Phosphabase representation, they were submitted to the Pellet reasoner and thereby
classified within the ontology. Prior to presenting this knowledge base to the evaluation system,
the restrictions on class membership were removed from the ontology, but the computed class-
assignments for each instance were maintained, thus forming a simple hierarchy of classes with
instances consistently assigned according to the (now absent) class definitions. It is worth noting
that this final structure mimics that of many existing biomedical ontologies, such as the Gene
Ontology, where instances are assigned by curators to a class-hierarchy free of formal
definitions.
Table 4.1 describes the knowledge base constructed for the evaluation of the Phosphabase
ontology. The ontology contains a total of 82 classes, of which only 39 define phosphatase
classes. The other classes are used to represent things like protein domains and are not included
in this evaluation. The root of the classes evaluated was thus the class ‘Protein Phosphatase’. Of
the 39 phosphatase classes, only 27 had defined restrictions sufficient for inferring class
membership and of these only 19 had enough instances to attempt the evaluation. In some cases,
the Phosphatase classes used InterPro domains that have now been retired and thus no instances

55
with current annotation could be classified into them. In other cases, there were few instances of
that Phosphatase class. Only classes with at least 5 positive and 5 negative examples are
evaluated as this is the minimum number required to execute 10-fold cross-validation. In all,
only 19 classes (about half of the phosphatase classes) were evaluated.
4.2.3.1.1 Phosphabase results
As expected, the perfectly consistent rules for class membership present for the classes evaluated
in this control knowledge base were easily learned by the induction algorithms in nearly every
case.
JRip identified rules that accurately reflected the restrictions on class membership in the original
ontology for each evaluated class except one. The only class that contained any variance from
perfect in the cross-validation runs was the class PPP (phosphoprotein phosphatase). For PPP,
JRip learned the rule: “If the protein contains domain IPR004843 or IPR001440, then predict
PPP”. The original definition for this class corresponded to the rule “If the protein contains
domain IPR004843 or IPR006186, then predict PPP”. It identified the IPR001440 constraint
because the majority of the instances of PPP are actually instances of its subclass,
proteinPhosphataseType5 which is defined by a restriction on IPR001440. This results in 1
incorrectly classified instance out of 1462 examples (the instances of PPP’s parent
Protein_Phosphatase).
Chi25_JRip performed identically to JRip with the exception of the class R2A (Receptor
Tyrosine Type 2A). When using all of the data (not in cross-validation), it learned the same rule
that covered all of the examples in the database perfectly, “if the protein contains domain
IPR0008957 and IPR003599, then predict R2A”. However, in one round of 10-fold cross-
validation, it learned a different rule and misclassified one of the instances.
OneR, which can only learn one rule using one attribute, worked perfectly on all the classes
except PPP and R2A. For PPP, it learned the rule “if IPR004843 then PPP”, displaying its
inability to add the additional attribute (IPR006186) needed to complete the definition. For R2A,
it simply always predicted true in all of the cross-validation runs, thus misclassifying the 12

56
instances that were R1_R6 phosphatases (R2A’s superclass) but not R2As. When applied to all
of the training data, it learned the rule “if IPR000884 then R2A” which, though not part of the
formal definition of the class, correctly predicted 74 of the 82 instances in the R2A dataset.
Figure 4.4 shows the average performance of each learning algorithm across each of the 19
classes evaluated in terms of the average accuracy, Kappa statistic, F-measures, and mean
Kononenko-Bratko information gain measure as identified in one 10-fold cross-validation
experiment. With the exception of the ZeroR algorithm, there is very little difference between
the different induction algorithms along any of these metrics.
The ZeroR algorithm doesn’t learn from any of the features of the data, it simply makes all
predictions for the most frequently observed class in the training set. Hence, it does nothing to
expose any defining pattern for the class in question and is thus not useful in terms of assessing
the knowledge base. The actual quality of the knowledge base as indicated by any induction
algorithm is thus better determined by the difference between its quality and that generated using
ZeroR. Metrics that take the prior probability of the test classes into account, such as the Kappa
statistic, are thus more effective estimates of the quality of a knowledge base than those that do
not.
4.2.3.1.2 Experiment 1 – part 2, permutation-based evaluation
The next phase of the control experiment was designed to test whether or not the metrics
produced using the OntoLoki method are effectively quantifying the quality of the ontology in
the context of the selected knowledge base and to provide a preliminary estimate of the expected
range of values for the different metrics. Our approach to conducting this test relies on the
assumption that a randomly ordered knowledge base (which includes both the ontology and all of
the data) should generate lower scores than a non-random knowledge base. Based on this
assumption we applied a method similar in nature to that of Brank et al.(2006), in which
permutations of the assembled Phosphabase knowledge base were generated which contained
increasing numbers of random changes to the class assignments for each instance [26]. For each
permutation, the amount of noise added was quantified by counting the number of differences
between it and the original knowledge base and dividing this number by the total number of

57
instances. If the quality metrics do not correlate with the presence of this added noise, then they
clearly do not provide effective measurements of quality.
Figure 4.5 indicates the relationship between the amount of noise added to the Phosphabase
knowledge base and the score for each of the above metrics for the Chi25_JRip algorithm. It
shows that each reported metric displays a strong correlation with the amount of randomness
added to the ontology, however, the correlation was strongest for average accuracy (r-squared =
0.9994). Based on the trends observed in the chart, the other metrics that seemed to best indicate
the presence of the noise in the knowledge base were the Kappa statistic, which consistently
varied from a perfect score of 1 all the way down to below 0 (it can range from 1 to –1) and the
mean Kononenko-Bratko information-gain measurement which smoothly varied from
approximately 0.5 to 0.
When the amount of noise added to the ontology reached approximately 11 (which corresponds
to about 35,000 random changes), the scores for the f-measure for predicting the class under
evaluation (‘f_1’ on the chart) reversed their expected downwards trend and began to improve.
This correlates with the point at which the ability to predict the negative instances for a particular
class (instances of its parent that aren’t instances of it) begins to decrease rapidly. This somewhat
surprising behaviour highlights an influential characteristic of the simple approach to the
knowledge base destruction used here and an important weakness of the f-measure in this
context.
The simple algorithm to degrade a knowledge base repeatedly a) selects an instance at random,
b) selects a class attribute at random, c) checks whether that instance is labelled with that class; if
it is, removes the label and if not, adds it. It does not pay attention to the subsumption hierarchy.
After running it to saturation, as we did here, the probability for an instance to be labelled with
any class in the ontology approaches 0.5 and there is no longer any relationship between classes.
So, when creating the local training set for a particular class, the expectation is that 1/2 of the
instances in the entire knowledge base will be selected based on the chance of being an instance
of that class’s superclass and then, of these, 1/2 are likely to be instances of the class being
evaluated.

58
We suggest that the point where F(1) measures begin to increase indicates a threshold beyond
which no more information is held in the knowledge base. At this point, algorithms that simply
predict true half of the time, which is now near the prior probability in every case, can always get
approximately half the predictions correct. Figure 4.6 shows how the Chi25_JRip algorithm
begins to mirror the ZeroR algorithm according to the f-statistics as the noise reaches this
threshold. The same behaviour is observed for the OneR and the JRip algorithm without
attribute selection.
This behaviour indicates the susceptibility of the F-measures to incorrectly indicating knowledge
base quality. According to F(1), one knowledge base that is completely random can receive the
same score as one that clearly has some merit as reflected by the other statistics.
4.2.3.1.3 Summary of experiment 1 – control: Phosphabase and its permutations
The Phosphabase experiments, indicated that:
1) the induction algorithms used in this implementation do effectively learn rules that are
predictive of class membership when the information is clearly present in the knowledge
base
2) when the required information is removed from the knowledge base, this is reflected in
the relative performance of these algorithms
3) the most reliable quality metrics in this context appear to be the Kappa statistic, the
Kononenko-Bratko information measure, and the simple percent correct.
In the next section, we assess the implementation’s performance in a more typical situation,
where the rules for classification are not well known in advance and are not likely to be rigidly
defined.
4.2.4 Evaluating biological ontologies
In the control experiment we demonstrated that our implementation of the OntoLoki method
could successfully find patterns of properties associated with ontology class definitions where
they were clearly present. In addition, we showed that the system produced quantitative

59
estimates of classification consistency that correlated with varying levels of knowledge base
quality. Given those proofs of concept, we can now begin to explore how the method might be
applied to ‘real’ cases where it is unknown in advance whether the kinds of patterns sought are
present in the data. As a beginning in this exploration, we consider two ontologies, one very
simple and one fairly complex, that define classifications for the subcellular localizations of gene
products. In the first experiment, we conduct an evaluation of an ontology, composed of just six
classes in one single level, that represents the classes that can be predicted by the PSORTb
algorithm [27]. In the second we move on to the evaluation of the cellular component branch of
the Gene Ontology, an ontology composed of more than two thousand classes, arranged in a
polyhierachy that in some cases is as much as 11 levels deep.
4.2.4.1 Experiment 2 - PSORTb
PSORTb is a tool for predicting the subcellular localization of bacterial protein sequences [27].
Given a protein sequence, it makes predictions about the protein’s likelihood of appearing in one
of six locations: the cytoplasm, the cytoplasmic membrane, the outer membrane, the cell wall,
the periplasm, or the extracellular space. These classes, which correspond directly to terms from
the Gene Ontology, were brought together under the top class ‘subcellular localization’ to form
the very simple ontology used in this experiment.
The knowledge base used to evaluate this ontology, described in Table 4.2, was created as
follows:
1) Instances of proteins and their subcellular localizations were gathered from the hand-
curated PSORTb-exp database of experimentally validated subcellular localizations [28].
2) The ‘ID Mapping’ tool from UniProt beta was used to map the NCBI gi numbers used by
the PSORTb database to UniProt identifiers.
3) RDF annotations of these instances were gathered by querying UniProt beta with the
UniProt identifiers.
The ability of the PSORTb localization prediction system to accurately classify proteins
demonstrates that the classes of the generated PSORTb ontology can be predicted for protein

60
instances based on properties associated with those instances. As the algorithms used in
PSORTb are different (and much more highly optimized) than the generic rule learners
employed here and the features that they process (including the raw protein sequence) are
broader than the features used in the current, generic implementation (which does not process the
sequences for example), we do not expect to achieve the same high levels of classification
performance as the PSORTb implementation. However, there are clearly protein features, such
as Signal Peptides, that are captured in the UniProt annotations and are relevant to predicting
subcellular localization. From these, it should be possible to identify some predictive patterns
automatically and to thus provide this simple, but clearly useful ontology with a fairly good
classification consistency score.
The interpretation of what constitutes ‘a fairly good score’ is still somewhat arbitrary due to the
early stage of the development and characterization of the method, but the results indicated by
the second phase of the Phosphabase experiment do provide some guidance. Taking the Kappa
statistic as an example, Kappas above 0 indicate that the induction process yielded rules that
improved upon predictions based only on prior probability and thus the classification could be
judged to display at least some degree of property-based consistency. That being said, we expect
Kappa scores much higher than 0 in this particular case.
4.2.4.1.1 PSORTb results
The evaluation identified predictive patterns for each of the classes in the PSORTb ontology.
Figure 4.7 illustrates the average performance of the four learning algorithms tested in cross-
validation experiments as described in the previous section. As expected, the JRip algorithm had
the best performance across all of the different quality metrics, with the attribute selected version
(Chi25_JRip), following closely behind. Figure 4.8 shows the performance of JRip for each of
the classes in PSORTb.
The highest scoring class in terms of simple accuracy of the learned models in the cross-
validation runs was ‘Cell Wall’; however, this is clearly explained by the relative infrequency of
this class within the instances that compose this knowledge base as illustrated by the percentage
of positive instances for the class displayed in Figure 4.8. Since there were only 60 instances of
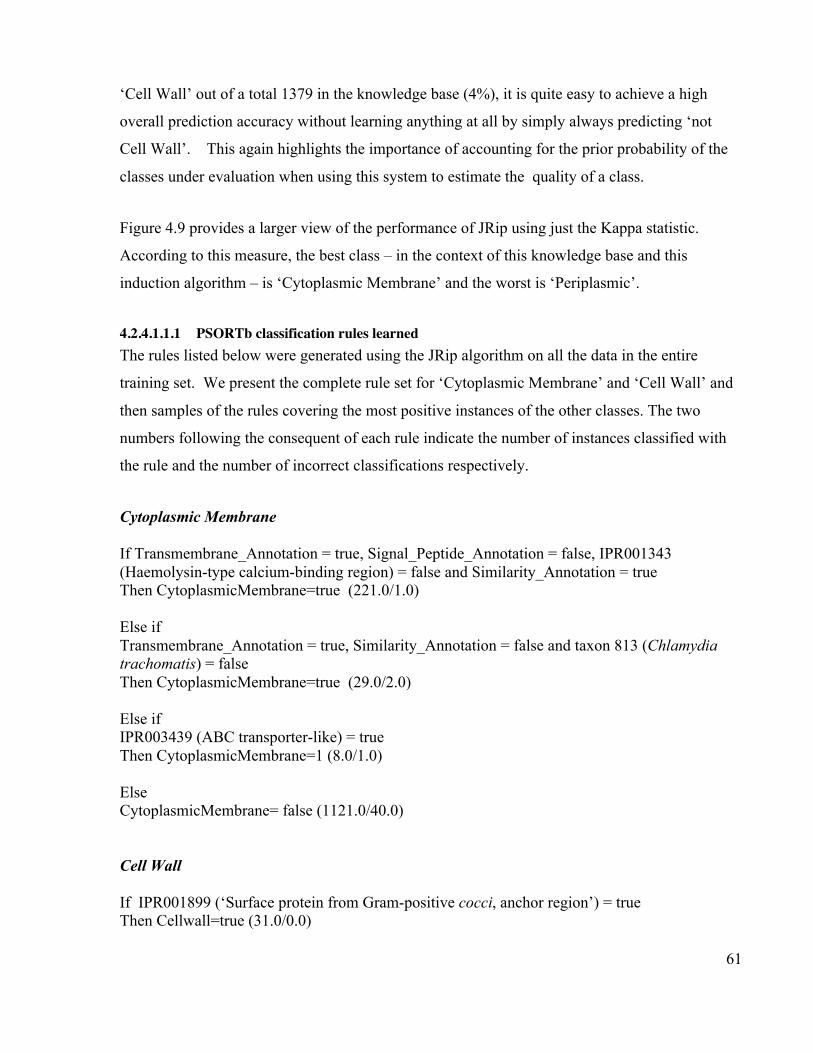
61
‘Cell Wall’ out of a total 1379 in the knowledge base (4%), it is quite easy to achieve a high
overall prediction accuracy without learning anything at all by simply always predicting ‘not
Cell Wall’. This again highlights the importance of accounting for the prior probability of the
classes under evaluation when using this system to estimate the quality of a class.
Figure 4.9 provides a larger view of the performance of JRip using just the Kappa statistic.
According to this measure, the best class – in the context of this knowledge base and this
induction algorithm – is ‘Cytoplasmic Membrane’ and the worst is ‘Periplasmic’.
4.2.4.1.1.1 PSORTb classification rules learnedThe rules listed below were generated using the JRip algorithm on all the data in the entire
training set. We present the complete rule set for ‘Cytoplasmic Membrane’ and ‘Cell Wall’ and
then samples of the rules covering the most positive instances of the other classes. The two
numbers following the consequent of each rule indicate the number of instances classified with
the rule and the number of incorrect classifications respectively.
Cytoplasmic Membrane
If Transmembrane_Annotation = true, Signal_Peptide_Annotation = false, IPR001343(Haemolysin-type calcium-binding region) = false and Similarity_Annotation = trueThen CytoplasmicMembrane=true (221.0/1.0)
Else ifTransmembrane_Annotation = true, Similarity_Annotation = false and taxon 813 (Chlamydiatrachomatis) = falseThen CytoplasmicMembrane=true (29.0/2.0)
Else ifIPR003439 (ABC transporter-like) = trueThen CytoplasmicMembrane=1 (8.0/1.0)
ElseCytoplasmicMembrane= false (1121.0/40.0)
Cell Wall
If IPR001899 (‘Surface protein from Gram-positive cocci, anchor region’) = trueThen Cellwall=true (31.0/0.0)

62
Else ifIPR001119 (‘S-layer homology region’) = trueThen Cellwall=true (3.0/0.0)
Else if taxon = 1423 (Bacillus subtilis) and Modification_Annotation = true andModified_Residue_Annotation = false and part of protein = falseThen Cellwall=1 (5.0/0.0)
Else ifIPR010435 (‘Peptidase S8A, DUF1034 C-terminal’) = trueThen Cellwall=true (2.0/0.0)
ElseCellwall=false (1338.0/19.0)
Periplasmic
If Signal_Peptide_Annotation = true and Metal_Binding_Annotation = true andActive_Site_Annotation = falseThen Periplasmic=1 (47.0/7.0)
OuterMembrane
If not part of protein and Signal_Peptide_Annotation = true and Similarity_Annotation = trueand Modification_Annotation = false and Site_Annotation = false and Subunit_Annotation = trueand IPR006059 (‘Bacterial extracellular solute-binding, family 1’) = false and IPR001782(‘Flagellar P-ring protein’) = falseThen OuterMembrane=true (46.0/1.0)
Extracellular
Propeptide_Annotation = true and IPR001899 (‘Surface protein from Gram-positive cocci,anchor region’) = falseThen Extracellular=true (110.0/12.0)
Cytoplasmic
If Signal_Peptide_Annotation = false and part of protein = true and Transmembrane_Annotation= false and Subunit_Annotation = true and Metal_Binding_Annotation = falseThen Cytoplasmic=true (109.0/2.0)

63
The first rule learned for predicting localization in the cytoplasmic membrane illustrates the
nature of the rest of the rules identified.
1) It describes a large fraction of the instances of cytoplasmic membrane very well,
correctly predicting 220 out of the 221 instances that it applies to.
2) It is composed of clearly relevant features such as transmembrane regions and signal
peptides, ambiguous features that may be indicators of more specific information not
processed by the system such as ‘similarity annotation’, and features of an uncertain, but
potential interesting nature such as IPR001343 (Hemolysin-type calcium-binding region).
4.2.4.1.2 Summary of PSORTb results
The results of the PSORTb experiment provide evidence that our implementation can identify
and quantify the consistency of classification of discriminatory patterns of properties associated
with the instances of different classes where those patterns are not known in advance. However,
though another useful control on the implementation, the PSORTb ontology is far simpler than
the great majority of ontologies in use in the biomedical domain. To characterize our
implementation in a realistic situation, we now present an evaluation of a large, well-used,
structurally complex, biological ontology.
4.2.4.2 Experiment 3 - Cellular Component ontology
The Cellular Component (CC) branch of the Gene Ontology (GO) provides a controlled
vocabulary for the description of the subcellular localizations of gene products [29]. Table 4.3
provides some basic statistics about the composition of the OWL version used for this
evaluation, gathered from the data offered by the experimental Open Biomedical Ontologies
(OBO) ontology Web page [30] and the Swoop ontology editor [31]. The version used for the
experiment was collected from the OBO Download matrix on Sept. 23, 2007 [32].
The CC ontology was selected for exploratory evaluation for the following reasons.
1) Physical properties, such as protein domains of gene products, are known to be predictive
of class membership within this ontology [33]. Thus, in principle, patterns of such
properties exist that consistently define membership in at least some of the classes.

64
2) It is a large and widely used ontology in the biomedical domain with many accessible
instances appropriate for the formation of test knowledge bases.
3) It is representative of the structure and basic intent of many other important biomedical
ontologies such as several of those being developed as part of the Open Biomedical
Ontologies (OBO) initiative [5].
For simplicity, we call the proteins instances of CC classes; however, a gene product is
obviously not an instance of a cytoplasmic membrane. Conceptually a gene product may be
considered an instance of the class of proteins that tend to localize in the cytoplasmic membrane.
These implied classes are what is being evaluated here.
To evaluate the CC, UniProt was once again queried to create an OWL/RDF knowledge base.
The query requested protein records that
1) had been annotated with a class from the CC ontology (a subclass of GO_0005575)
2) had been reviewed by UniProt curators
3) had evidence at the protein level (not the fragment level)
4) and had at least one domain annotation
This query resulted in a knowledge base containing 6586 distinct protein instances. Once the
knowledge base was assembled, the same evaluation was applied as in the preceding
experiments. A specific training/testing table was created for each subclass of the root
(GO_0005575) and, assuming it had more then 5 positive and 5 negative instances, was used to
train a Chi25_Jrip classifier to attempt to distinguish between the positive and negative
instances.
4.2.4.2.1 Cellular Component evaluation results
In all, only 361 classes (17%) from the CC ontology were evaluated because many classes did
not have enough instances in the particular knowledge base extracted from UniProt. The 361
classes had a mean of 1.7 direct (not inferred via subsumption) superclasses. (Recall that, as
each class-superclass pair is evaluated independently, per-class scores are averages across each

65
of these evaluations). Within the evaluated classes, a large variability in classification
consistency was observed, ranging from classes with perfect defining patterns of properties to
classes for which no defining pattern could be identified. The average Kappa score for the 10-
fold cross-validation runs across all of the evaluated classes was 0.30, as compared to 0.66 for
the PSORTb experiment and 1.0 for the Phosphabase control. Figure 4.10 provides an
illustration of the distribution of the scores observed for the evaluated classes based on the
Kappa statistic.
4.2.4.2.2 Cellular Component classification rules learned
The rules learned by the classifiers were often constructed from the taxon and the InterPro
domain properties. For example, the first (very simple) rule listed divides the GO class
GO_0000142 (‘contractile ring (sensu Saccharomyces)’) from its superclass GO_0005826
(‘contractile ring’) based on the property ‘taxon 4930’ (Saccharomyces). Below, we list
examples of rules identified for some of the highest scoring classes in the cross-validation
experiments.
If taxon 4930 (Saccharomyces) then GO_0000142 (‘contractile ring (sensu Saccharomyces)’) (7/0)Else GO_0005826 (‘contractile ring’) (13/0)
If not taxon 3701 (‘Arabidopsis’) then GO_0046658 (‘anchored to plasma membrane’) (10/0)Else GO_0031225 (‘anchored to membrane’) (13/0)
If not taxon 4932 (Saccharomyces cerevisiae) then GO_0005764 (‘lysosome’) (25/0)Else GO_0000323 (‘lytic vacuole’) (17/0)
If IPR001208 (‘MCM domain’) then GO_0042555 (‘MCM complex’) (24/2)Else GO_0044454 (‘nuclear chromosome part’) (92/0)
If IPR002290 (Serine/threonine protein kinase) and IPR015734 (‘Calcium/calmodulin-dependentprotein kinase 1’) then GO_0005954 (‘calcium- and calmodulin-dependent protein kinase complex’)(4/0)Else if IPR015742 (‘Calcium/calmodulin-dependent protein kinase II isoform’) then GO_0005954 (6/0)Else GO_0043234 (‘protein complex’) (1157/0)
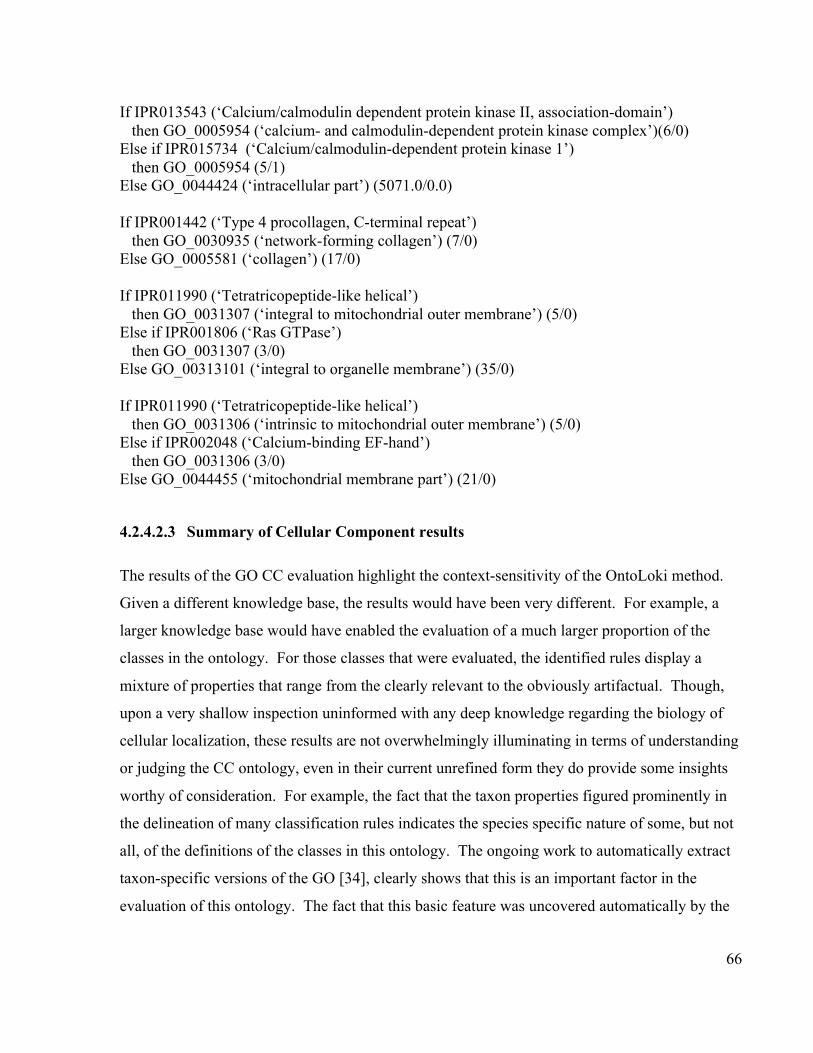
66
If IPR013543 (‘Calcium/calmodulin dependent protein kinase II, association-domain’) then GO_0005954 (‘calcium- and calmodulin-dependent protein kinase complex’)(6/0)Else if IPR015734 (‘Calcium/calmodulin-dependent protein kinase 1’) then GO_0005954 (5/1)Else GO_0044424 (‘intracellular part’) (5071.0/0.0)
If IPR001442 (‘Type 4 procollagen, C-terminal repeat’) then GO_0030935 (‘network-forming collagen’) (7/0)Else GO_0005581 (‘collagen’) (17/0)
If IPR011990 (‘Tetratricopeptide-like helical’) then GO_0031307 (‘integral to mitochondrial outer membrane’) (5/0)Else if IPR001806 (‘Ras GTPase’) then GO_0031307 (3/0)Else GO_00313101 (‘integral to organelle membrane’) (35/0)
If IPR011990 (‘Tetratricopeptide-like helical’) then GO_0031306 (‘intrinsic to mitochondrial outer membrane’) (5/0)Else if IPR002048 (‘Calcium-binding EF-hand’) then GO_0031306 (3/0)Else GO_0044455 (‘mitochondrial membrane part’) (21/0)
4.2.4.2.3 Summary of Cellular Component results
The results of the GO CC evaluation highlight the context-sensitivity of the OntoLoki method.
Given a different knowledge base, the results would have been very different. For example, a
larger knowledge base would have enabled the evaluation of a much larger proportion of the
classes in the ontology. For those classes that were evaluated, the identified rules display a
mixture of properties that range from the clearly relevant to the obviously artifactual. Though,
upon a very shallow inspection uninformed with any deep knowledge regarding the biology of
cellular localization, these results are not overwhelmingly illuminating in terms of understanding
or judging the CC ontology, even in their current unrefined form they do provide some insights
worthy of consideration. For example, the fact that the taxon properties figured prominently in
the delineation of many classification rules indicates the species specific nature of some, but not
all, of the definitions of the classes in this ontology. The ongoing work to automatically extract
taxon-specific versions of the GO [34], clearly shows that this is an important factor in the
evaluation of this ontology. The fact that this basic feature was uncovered automatically by the

67
OntoLoki method thus indicates that the rules discovered can be useful and that their
quantification is relevant.
4.3 Discussion
We presented the OntoLoki method, summarized in Figure 4.3, for the automatic evaluation of
the consistency of classification for ontology classes lacking formal, computable definitions. The
implementation begins with an ontology, builds an associated knowledge base, translates that
graphically structured knowledge base into a table, and then applies machine learning algorithms
to identify specific patterns of properties associated with the different classes. As the dashed
lines in Figure 4.3 indicate, the evaluation of the learned patterns can then be used to make
adaptations at each of the steps, starting with the actual ontology and finishing with the
algorithms used for induction. Before closing, we highlight some examples of how this method
could be applied in several different situations.
4.3.1 Making use of OntoLoki
The products of carrying out an OntoLoki evaluation are:
1) a set of rules for assigning instances to the classes in the ontology
2) an estimate of the performance of each inferred classification rule
3) through the rules identified, a direct, empirical assessment of the quality of each class
with respect to the implied presence and consistent application of a definition composed
of properties present within the knowledge base
4) through the aggregated class scores, an automatic, objective, reproducible quantification
of the quality of an ontology in the context of a specific knowledge base
How these products might be applied is highly dependent on the goals of the person conducting
the evaluation. We suggest a few ideas, but expect that there are many other possible
applications aside from those listed.
The numeric ratings associated with the different classes and whole ontologies could be used for
the purposes of,

68
1) organizing ontology maintenance efforts by identifying classes to attend to based on low
classification consistency
2) ordering the results retrieved from ontology search engines [35]
3) evaluating the success of different approaches to the ontology engineering problem
Though the ratings for the classes may be useful, the classification rules likely form the most
important product of the system. Such decision models could be used in a variety of different
ways, for example,
1) suggesting starting points for the construction of formal (e.g. OWL DL) class definitions
within ontologies initially implemented solely as “is a” hierarchies
2) as a means to classify novel instance data within the ontology automatically while
leaving the ontology itself unchanged [33].
Aside from improving the ontology or the knowledge base, the knowledge represented in the
identified rules could conceivably lead to novel discoveries useful for extending or adapting
scientific theory. Scientific ontologies and associated knowledge bases are representations of
what is known about the world. By representing knowledge in the form of these ‘computational
symbolic theories’, knowledge can be computed with (tested for internal consistency, integrated,
queried) to a much greater extent than would otherwise be possible [36]. The rules found to be
associated with class membership thus form both a means for evaluating the classification
consistency of an ontology and the opportunity to extend the body of knowledge that it
represents.
4.3.2 Future work
In the future, it would be useful to improve upon each of the three main phases of the prototype
utilized here - the creation of the knowledge base, its propositionalization, and the induction of
classification rules from it. The first step, in particular, is crucial. Though the processing of the
knowledge base is obviously important, its original creation has by far the most significant
effect on the end results of any evaluation. As such, the derivation of efficient methods to
dynamically assemble high quality, relevant knowledge bases is a top priority for future
investigation. The second step, the propositionalization of the RDF knowledge base, was the
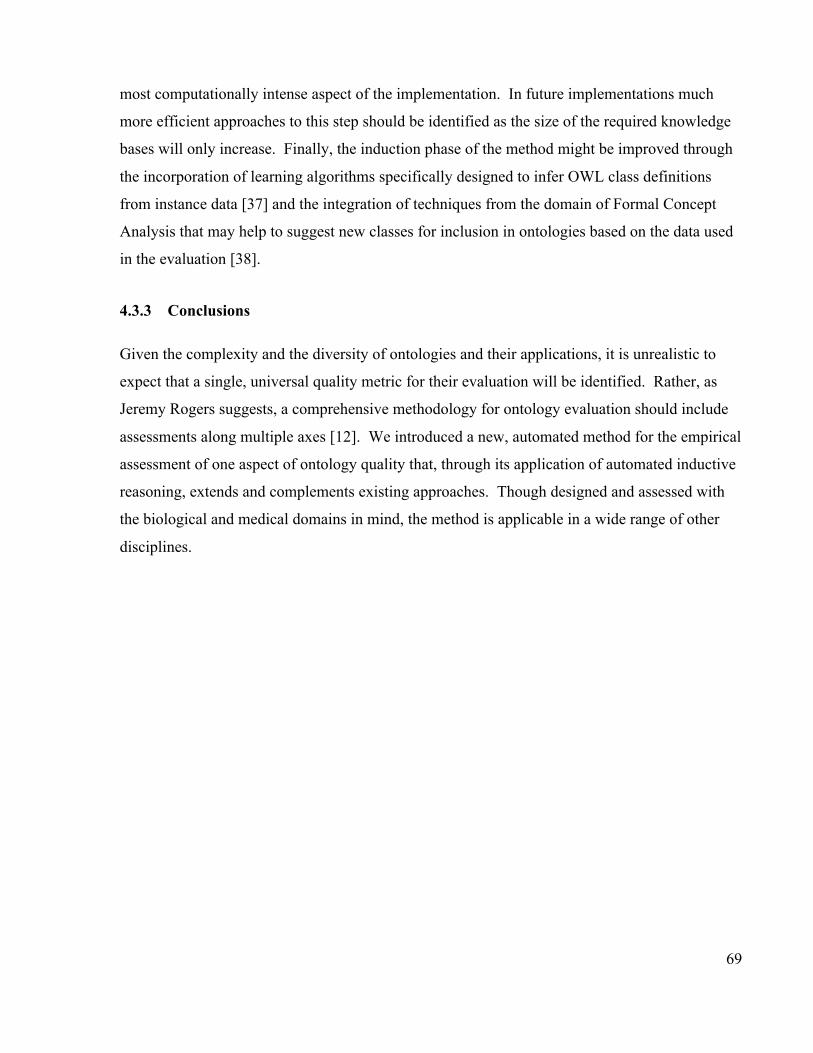
69
most computationally intense aspect of the implementation. In future implementations much
more efficient approaches to this step should be identified as the size of the required knowledge
bases will only increase. Finally, the induction phase of the method might be improved through
the incorporation of learning algorithms specifically designed to infer OWL class definitions
from instance data [37] and the integration of techniques from the domain of Formal Concept
Analysis that may help to suggest new classes for inclusion in ontologies based on the data used
in the evaluation [38].
4.3.3 Conclusions
Given the complexity and the diversity of ontologies and their applications, it is unrealistic to
expect that a single, universal quality metric for their evaluation will be identified. Rather, as
Jeremy Rogers suggests, a comprehensive methodology for ontology evaluation should include
assessments along multiple axes [12]. We introduced a new, automated method for the empirical
assessment of one aspect of ontology quality that, through its application of automated inductive
reasoning, extends and complements existing approaches. Though designed and assessed with
the biological and medical domains in mind, the method is applicable in a wide range of other
disciplines.

70
Table 4.1. Phosphabase knowledge base statistics
Total classes 82
Total Protein Phosphatase classes 39
Total Phosphatase classes with defined necessary and sufficient conditions
for class membership (allowing automatic classification)
27
Total instances 3169
Total classes with more than 5 positive and 5 negative instances 19
Fraction Phosphatase classes that could be evaluated based on their
instances
19/39
.49
Table 4.2. PSORTb knowledge base statistics
Total classes (excluding the top class) 6
Total instances gathered from PSORTb-exp database 2171
Total instances used in experiments. Each must have a UniProt identifier
and a minimum of at least one annotated InterPro domain or other UniProt
annotation property.
1379
Table 4.3. Attributes of the Cellular Component ontology (Sept. 2007)
Total classes 2127
Average number of direct superclasses per class 1.49925
Max depth of class tree 11
Average depth of class tree 5.9
Max branching factor of class tree (GO_0043234, ‘protein complex’ has
410 subclasses)
410
Average branching factor of class tree 4.4

71
Figure 4.1. The input and the output for the OntoLoki method
The properties assigned to each instance are used to learn classification rules whose performanceis quantified. The rule learned for the dark blue class correctly classifies two of its threeinstances based on the property indicated by the black diamonds. The rule learned for the yellowclass correctly predicts all of its instances based on the presence of the property indicated by thelight blue diamonds.

72
Figure 4.2. Sample RDF description of the UniProt protein P35829, an S-layer protein precursor fromLactobacillus acidophilus
Classes are indicated with ovals, instances with square boxes, predicates with arrows, and Stringsas ‘idea bubbles’. Some instances – for example, ‘#_B’ – are created to fill the place of theblank nodes needed to create the descriptions of the instance under consideration (‘P35829’).P35829 has three annotations: a signal peptide annotation, a function annotation, and a PTMannotation.
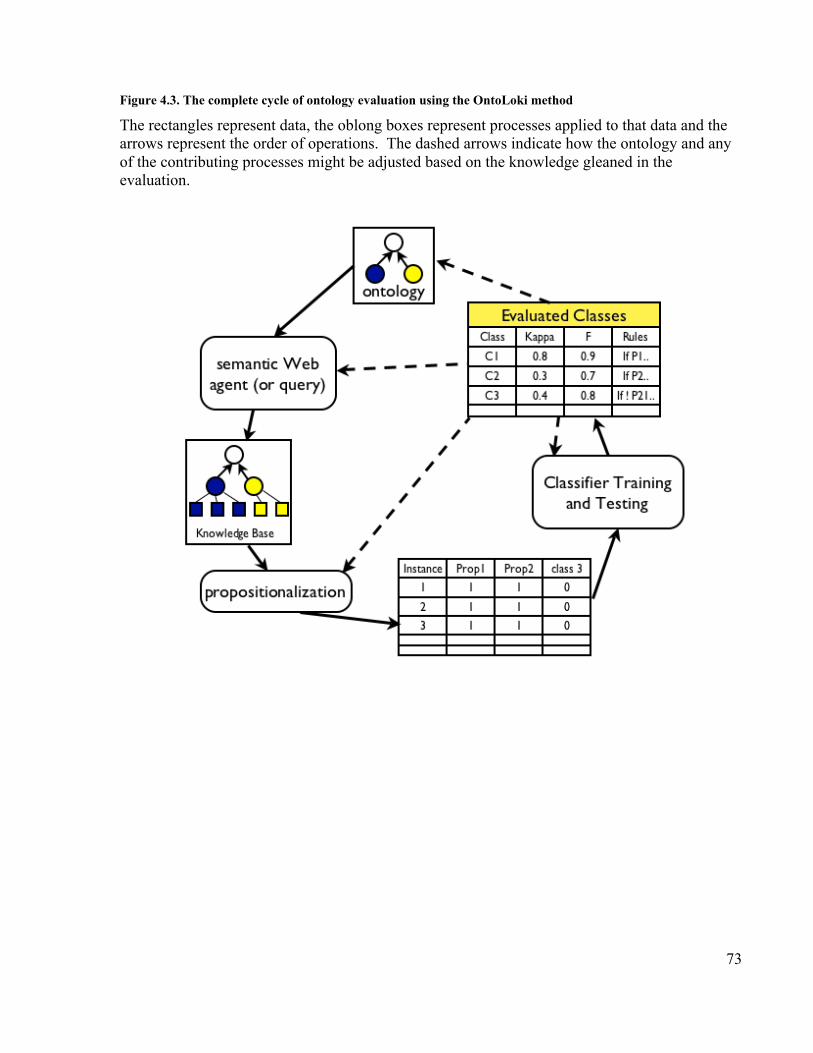
73
Figure 4.3. The complete cycle of ontology evaluation using the OntoLoki method
The rectangles represent data, the oblong boxes represent processes applied to that data and thearrows represent the order of operations. The dashed arrows indicate how the ontology and anyof the contributing processes might be adjusted based on the knowledge gleaned in theevaluation.
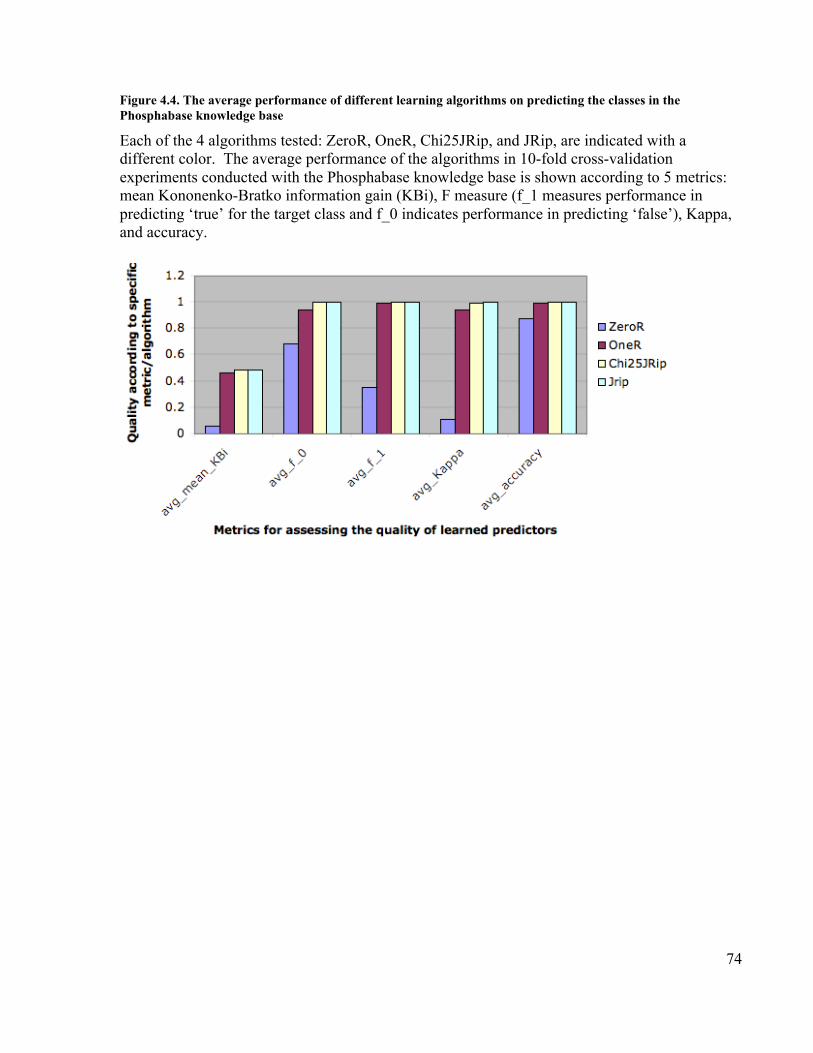
74
Figure 4.4. The average performance of different learning algorithms on predicting the classes in thePhosphabase knowledge base
Each of the 4 algorithms tested: ZeroR, OneR, Chi25JRip, and JRip, are indicated with adifferent color. The average performance of the algorithms in 10-fold cross-validationexperiments conducted with the Phosphabase knowledge base is shown according to 5 metrics:mean Kononenko-Bratko information gain (KBi), F measure (f_1 measures performance inpredicting ‘true’ for the target class and f_0 indicates performance in predicting ‘false’), Kappa,and accuracy.

75
Figure 4.5. Results for the Chi25_JRip algorithm as increasing amounts of noise are added to thePhosphabase knowledge base
Performance is again assessed according to the average F measures, Kappa, KBi, and accuracy.

76
Figure 4.6. Effects of increasing noise on the performance of Chi25_Jrip and ZeroR as indicated by theaverage F measure for each evaluated class
Note that the results from the sophisticated Chi25_Jrip algorithm eventually begin to mirrorthose from ZeroR – demonstrating the loss of information from the knowledge base caused bythe introduction of random changes.

77
Figure 4.7. Average performance of different classifiers according to each reported statistic for the PSORTbclasses
Each of the 4 algorithms tested: ZeroR, OneR, Chi25JRip, and JRip, are indicated with adifferent color. The average performance of the algorithms in 10-fold cross-validationexperiments conducted with the PSORTb knowledge base is shown according to 5 metrics: meanKononenko-Bratko information gain (KBi), F, Kappa, and accuracy.

78
Figure 4.8. Classification consistency for PSORTb classes using the JRip algorithm
Classification consistency is reported for each class using the metrics: accuracy, Kappa, F, andKononenko-Bratko information gain. In addition, the percentage of positive instances used foreach class is presented in blue to give an indication of the baseline frequencies of the differentclasses in the assembled knowledge base.
79
Figure 4.9. Inferred classification consistency for PSORTb classes
The evaluations were conducted using the JRip algorithm and the PSORTb knowledge base.The Kappa statistic was used for the quantification indicated on the X axis.

80
Figure 4.10. Classification consistency of a sample of classes from the Cellular Component branch of theGene Ontology
The X axis indicates individual classes in the Cellular Component ontology. The Y axisindicates the average Kappa statistic observed for the Chi25_JrRip classifier in 10-fold cross-validation for that class.

81
References
1. Yu AC: Methods in biomedical ontology. Journal of Biomedical Informatics 2006,39(3):252-266.
2. Bodenreider O, Stevens R: Bio-ontologies: current trends and future directions.Briefings in Bioinformatics 2006, 7(3):256-274.
3. Musen MA: Dimensions of Knowledge Sharing and Reuse. Computers and BiomedicalResearch 1991, 25:435-467.
4. Knublauch H, Ferguson RW, Noy NF, Musen MA: The Protégé OWL Plugin: AnOpen Development Environment for Semantic Web Applications. In: 3rdInternational Semantic Web Conference: 2004; Hiroshima, Japan; 2004.
5. Smith B, Ashburner M, Rosse C, Bard J, Bug W, Ceusters W, Goldberg L, Eilbeck K,Ireland A, Mungall C et al: The OBO Foundry: coordinated evolution of ontologies tosupport biomedical data integration. Nat Biotechnol 2007, 25(11):1251-1255.
6. Rubin DL, Lewis SE, Mungall CJ, Misra S, Westerfield M, Ashburner M, Sim I, ChuteCG, Solbrig H, Storey M-A et al: BioPortal: A Web Portal to Biomedical Ontologies:Advancing Biomedicine through Structured Organization of Scientific Knowledge.OMICS: A Journal of Integrative Biology 2006, 10(2):185-198.
7. OWL Web Ontology Language Overview [http://www.w3.org/TR/owl-features/ ]8. Tsarkov D, Horrocks I: FaCT++ Description Logic Reasoner: System Description. In:
Automated Reasoning. Berlin/Heidelberg: Springer; 2006: 292-297.9. Sirin E, Parsia B, Grau BC, Kalyanpur A, Katz Y: Pellet: A practical OWL-DL
reasoner. Web Semantics: Science, Services and Agents on the World Wide Web 2007,5(2):51-53.
10. Sure Y, Gómez-Pérez A, Daelemans W, Reinberger M-L, Guarino N, Noy NF: Whyevaluate ontologies? Because it works! IEEE Intelligent Systems 2004, 19(4):74-81.
11. Hartmann J, Spyns P, Giboin A, Maynard D, Cuel R, Suarez-Figueroa MC, Sure Y:Methods for ontology evaluation. In.: Knowledge Web Consortium; 2005.
12. Rogers J: Quality Assurance of medical ontologies. Methods of information in medicine2006, 45(3):267-274.
13. Fernández M, Gómez-Pérez A, Juristo N: METHONTOLOGY: From Ontological Arttowards Ontological Engineering. In: AAAI Spring Symposium Series: 1997; MenloPark, California: AAAI Press; 1997: 33-40.
14. RDF Primer [http://www.w3.org/TR/rdf-primer/ ]15. Belleau F, Nolin M-A, Tourigny N, Rigault P, Morissette J: Bio2RDF: Towards a
mashup to build bioinformatics knowledge system. In: World Wide Web Conference:May 08 2007; Beijing, China: Springer; 2007.
16. Belleau F, Tourigny N, Good BM, Morissette J: Bio2RDF: A Semantic Web Atlas ofpost genomic knowledge about Human and Mouse. In: Data Integration in the LifeSciences: 2008; Evry, France; 2008.
17. Auer S, Bizer C, Kobilaroc G, Lehman J, Cyganiak R, Oves Z: DBpedia: A Nucleus fora Web of Open Data. In: The Semantic Web. Berlin: Springer; 2008: 722-735.
18. UniProt beta [http://beta.uniprot.org]19. UniProt beta core ontology [http:/purl.uniprot.org/core/]20. UniProt protein record P35829 [http://beta.uniprot.org/uniprot/P35829.rdf]

82
21. Kramer S, Lavra N, Flach P: Propositionalization approaches to relational datamining. In: Relational Data Mining. New York: Springer-Verlag; 2001: 262-286.
22. Witten IH, Frank W: Data Mining: Practical Machine Learning Tools with JavaImplementations: Morgan Kaufmann; 2000.
23. Cohen WW: Fast Effective Rule Induction. In: 12th International Conference onMachine Learning: 1995; 1995.
24. Kononenko I, Bratko I: Information-Based Evaluation Criterion for Classifier'sPerformance. Machine Learning 1991, 6(1):67.
25. Wolstencroft K, Lord P, Tabernero L, Brass A, Stevens R: Protein classification usingontology classification. Bioinformatics (Oxford, England) 2006, 22(14):530-538.
26. Brank J, Mladenic D, Grobelnik M: Gold standard based ontology evaluation usinginstance assignment. In: EON workshop: 2006; 2006.
27. Gardy JL, Laird MR, Chen F, Rey S, Walsh CJ, Ester M, Brinkman FS: PSORTb v.2.0:expanded prediction of bacterial protein subcellular localization and insights gainedfrom comparative proteome analysis. Bioinformatics 2005, 21(5):617-623.
28. Rey S, Acab M, Gardy JL, Laird MR, deFays K, Lambert C, Brinkman FS: PSORTdb: aprotein subcellular localization database for bacteria. Nucleic Acids Res 2005,33(Database issue):D164-168.
29. Ashburner M, Ball CA, Blake JA, Botstein D, Butler H, Cherry JM, Davis AP, DolinskiK, Dwight SS, Eppig JT et al: Gene ontology: tool for the unification of biology. TheGene Ontology Consortium. Nature Genetics 2000, 25(1):25-29.
30. OBO statistics for the GO cellular component ontology[http://www.berkeleybop.org/ontologies/obo-all/cellular_component/cellular_component.stats]
31. Kalyanpur A, Parsia B, Sirin E, Grau BC, Hendler J: Swoop: A Web Ontology EditingBrowser. Journal of Web Semantics 2005, 4(2).
32. OBO Download Matrix [http://www.fruitfly.org/~cjm/obo-download/ ]33. Hayete B, Bienkowska JR: Gotrees: predicting go associations from protein domain
composition using decision trees. In: Pacific Symposium on Biocomputing: 2005; 2005:127-138.
34. Kunierczyk W: Taxonomy-based partitioning of the Gene Ontology. Journal ofBiomedical Informatics 2007, 41(2):282-292.
35. Sabou M, Lopez V, Motta E, Uren V: Ontology Selection: Ontology evaluation on thereal semantic web. In: Evaluation of Ontologies for the Web Workshop, 15thInternational World Wide Web Conference: 2006; Edinburgh, UK; 2006.
36. Karp PD: Pathway Databases: A Case Study in Computational Symbolic Theories.Science 2001, 293(5537):2040-2044.
37. Iannone L, Palmisano I, Fanizzi N: An algorithm based on counterfactuals for conceptlearning in the Semantic Web. Applied Intelligence 2007, 26(2):139-159.
38. Gessler D, Joslyn C, Verspoor K, Schmidt S: Deconstruction, Reconstruction, andOntogenesis for Large, Monolithic, Legacy Ontologies in Semantic Web ServiceApplications. In. Los Alamos: National Center for Genome Research; 2006.

83
5 Term based comparison metrics for controlled and uncontrolled indexing languages7
5.1 Introduction
We are in an era of a rapidly expanding number and diversity of systems for organizing
information. Wikis, collaborative tagging systems and semantic Web applications represent
broad categories of just a few emerging frameworks for storing, creating, and accessing
information. As each new kind of information system appears, it is important to understand how
it relates to other kinds of system. This understanding allows us to answer a variety of important
questions that will shape the way future systems are designed. Does the new system represent a
less expensive way to achieve the same functionality as another? Might it be fruitfully combined
with another approach? How similar is it to an exemplar in its domain?
In addition to deriving theoretical answers to questions at the level of the kind of system, such as
how does social tagging relate to professional indexing? [1, 2] or how do the ontologies of
computer science relate to the classifications of library and information science? [3], it is also
now of practical importance to find answers to specific instance-level questions as well. For
example, Al-Khalifa and Davis (2007) attempt to answer the question, how do the tags provided
by Del.icio.us [4] users relate to the terms extracted by the Yahoo indexing algorithm over the
same documents? and Morrison (2008) asks how do the results of searches performed on social
tagging systems compare to those performed on full web search engines? [5, 6]. Answers to
such questions provide vital knowledge to system designers because, in the age of the Web,
information systems do not operate in isolation from one another. It is both possible and
beneficial to integrate components of different systems to create symbiotic aggregates that meet
the needs of specific user groups better than any single system could and doing so depends upon
the knowledge of how the different systems relate. Would Yahoo automatic indexing be
improved through incorporation of indexes provided by Del.icio.us users? Comparative analyses
of the components of the two systems can help tell us.
7 A version of this chapter has been accepted for publication. Good BM, Tennis JT: Term based comparison metricsfor controlled and uncontrolled indexing languages. Information Research (accepted 22 October 2008)

84
Both comparative studies of information systems in the abstract and efforts to design specific
instances of new integrative systems can benefit from mechanisms that help to identify the
specific similarities and differences that obtain between different systems. One facet of this is
empirical, reproducible, quantitative methods of investigation. To inform both kinds of enquiry,
empirical protocols that allow for reproducible, quantitative comparison would be beneficial.
However, the term ‘information system’ covers a vast and ill-defined set of things, each of which
is composed of many complex components operating together in many different contexts to
achieve a variety of different purposes. To conduct useful empirical comparisons of such
systems, 1) hypotheses must be evaluated in light of the many contributing qualitative factors,
and 2) reproducible metrics must be devised that can be used to test assumptions. While
qualitative interpretations of the differences that hold between different kinds of information
system continue to advance, there are few practical, reproducible metrics defined for use in
empirical comparisons of system components.
Our broad goal in this work is to define a set of measurements that can be taken of information
systems that are meaningful, widely applicable, and reproducible. The specific set of metrics
introduced here do not intend nor pretend to be exhaustive nor definitive, in fact, we suggest that
is not an attainable goal given the complexity of the systems under scrutiny. Rather, we advance
them as an early set of candidates in what we expect will be a broad pool of metrics that will
continue to expand and be refined indefinitely. In light of these goals, the metrics defined here
are meant for the characterization of one key component common to the vast majority of
information systems in current operation - the language used to index the resources of interest
within the system.
Zhang (2006:121) defines an indexing language as “the set of terms used in an index to represent
topics or features of documents and the rules for combining or using those terms” [7]. As the
emphasis here is on empirical observation and many of the information systems under
consideration offer few rules for the application nor of the construction of the terms, we will
operate under the broader definition of indexing languages as “sets of terms used in an index to
represent topics or features”. Notice that this definition spans both controlled languages, such as
institutionally maintained thesauri, and uncontrolled languages, such as the sets of keywords
generated by social tagging systems. Examples of indexing languages, as defined here, thus
85
include the Medical Subject Headings (MeSH) thesaurus [8], the Gene Ontology [9], and the
Connotea folksonomy [10]. Each of these languages, though varying in relational structure,
purpose and application, is composed of a set of terms that represent aspects of the resources
within the information systems that utilize them. Through comparisons of the features of these
indexing languages, we hope to start work that will lead us to a better understanding of the
relations between the languages and of the relations between the systems that generate and use
them.
In this work, we advance an approach to the automated, quantitative characterization of indexing
languages via metrics based on the sets of terms used to represent their concepts. These metrics
are divided into two groups, intra-set and inter-set. The intra-set metrics provide views on the
shape of the sets of terms in aggregate. The inter-set metrics provide a coherent approach to the
direct comparison of the overlaps between different term-sets. The manuscript is divided into
two primary sections. The first section describes each of the metrics in detail and the second
presents the results from a quantitative comparison of twenty-two different indexing languages.
Results are provided for each language individually, using the intra-set metrics, and for each
language pair, using the inter-set metrics. In addition to the broad all-against-all comparison, we
present a more detailed exploration of the similarities and differences, revealed using the
proposed metrics, that hold between controlled and uncontrolled indexing languages.
5.2 Metrics for comparing term-sets
In this work we focus on the set of terms used to represent the concepts that compose indexing
languages. Relationships between the terms or the concepts that they represent are not analyzed
at this stage because some languages, such as many folksonomies, do not display the explicitly
defined relationship structures present in other forms, such as thesauri and ontologies. This view
allows us to produce metrics that are applicable to a broad array of different indexing languages
and can serve as the foundation for future efforts that expand the comparative methodology. In
the following section, we identify a group of specific, measurable characteristics of term-sets.
From these we can measure similarities and differences between indexing languages based on
quantifiable characteristics that they all share.
86
5.2.1 Intra-term-set measures
Measurements taken at the level of the set define what might be termed the shape of the term-set.
Such features of a term-set include its size, descriptive statistics regarding the lengths of its
terms, and the degree of apparent modularity present in the set. Measures of modularity expose
the structure of the term-set based on the proportions of multi-word terms and the degrees of
subterm re-use. These measures of modularity include two main categories, Observed Linguistic
Precoordination (OLP) and Compositionality.
OLP indicates whether a term appears to be a union of multiple terms based on syntactic
separators. For example, the MeSH term ‘Fibroblast Growth Factor’ would be observed to be a
linguistic precoordination of the terms ‘Fibroblast’, ‘Growth’, and ‘Factor’ based on the presence
of spaces between the terms. As explained in Tables 5.1 and 5.2, we categorize terms as uniterms
(one term), duplets (combinations of two terms), triplets (combinations of three terms) or
quadruplets or higher (combinations of four or more terms). Using these categorizations, we also
record the flexibility of a term-set as the fraction of subterms (the terms that are used to compose
duplets, triplets, and quadplus terms) that also appear as uniterms.
The OLP measurements described here were adapted from term-set characteristics, originally
identified by Van Slype (1976), for gauging the quantifiable features of a thesaurus [11]. Van
Slype developed and used these metrics in the process of suggesting revisions to the ISO
standard [12] based on comparisons of the attributes of a sample of thesauri to the prescriptions
of the standard. Our intent in using these and related metrics is to make it possible to explore
the consequences of adding a similar empirical aspect to studies of modern indexing languages.
The OLP measures were extended with related measures of compositionality as introduced by
Ogren et al. (2004) [13]. Compositionality measures include a) the number of terms that contain
another complete term as a proper substring, b) the number of terms that are contained by
another term as a proper substring, c) the number of different complements used in these
compositions, and d) the number of different compositions created with each contained term. A
complement is a subterm that is not itself an independent member of the set of terms. For
example, the term-set containing the two terms {‘macrophage’, ‘derived from macrophage’}

87
contains one complement – ‘derived from’. A composition is a combination of one term from the
term-set with another set of terms (forming the suffix and/or the prefix to this term) to form
another term in the set. For example, in the Academic Computing Machinery subject listing, the
term ‘software program verification’ contains three subterms that are also independent terms
(‘software’, ‘program’, and ‘verification’). According to our definition, this term would be
counted as three compositions – ‘software’+suffix, prefix+‘program’+suffix,
prefix+‘verification’. As another example, the term ‘denotational semantics’ would only result
in one composition because ‘semantics’ is an independent term while ‘denotational’ is not (and
thus is a complement as defined above).
Modularity is indicative of the factors that go into the semantics of a term-set, and shape its use.
Here we are guided by Soergel’s rubric from concept description and semantic factoring. He
tells us “we may note that often conceptual structure is reflected in linguistic structure; often
multi-word terms do designate a compound concept, and the single terms designate or very
nearly designate the semantic factors. Example: Steel pipes = steel:pipes [demonstrating the
factoring]” [14]. The relative presence or absence of modular structure within a term-set thus
provides some weak indication of its conceptual structure. For example, even though an
indexing language may not explicitly declare relationships between its terms, semantic
relationships may sometimes be inferred between terms that share, for example, common
subterms [13]. The potential to detect re-usable semantic factors that may be indicators of
semantic structure within a term-set makes modularity metrics important axes for the comparison
of different term-sets.
Together, these measurements combine to begin to form a descriptive picture of the shape of the
many diverse term-sets used in indexing languages. Table 5.3 lists and provides brief definitions
for all of the term-set measurements taken.
5.2.2 Inter-term-set measures
The descriptions of term-set shape described above are useful in that they can be applied to any
set of terms independently and because they provide detailed descriptions of the term-sets, but,
from the perspective of comparison, more direct methods are also applicable. To provide a more

88
exact comparison of the compositions of sets of terms used in different languages, we suggest
several simple measures of set similarity. Each of the measures is a view on the relation between
the size of the intersection of the two term-sets and the relative sizes of each set. The members
of the intersection are determined through exact string matches applied to the term-sets (after a
series of syntactic normalization operations). As depicted in Figure 5.1 and explained below,
these intersections are used to produce measures of Precision, Recall, and Overlap (the F-
measure).
5.2.2.1 Context considerations in inter-set comparisons
The equivalence function used when conducting direct set comparisons of the components of
different indexing languages is important. In this preliminary work, we rely on the simplistic
notion that a term in one indexing language is equivalent to a term in another language if and
only if, after syntactic normalization, the terms are identical. Synonymy, hyponymy and
polysemy are not considered and thus the measured overlaps are purely syntactic. When
considering indexing languages used in similar contexts - for example as might be indicated
when two different languages are used to index the same set of documents by similar groups of
people - this function provides useful information because the same words are likely to be used
for similar purposes. However, the greater the difference in context of application between the
indexing languages being compared, the greater the danger that this simple function will not
yield relevant data. Logical extensions of this work would thus be to make use of semantic
relations, for example of synonymy, present within the indexing languages as well as natural
language processing techniques to develop additional equivalence functions that operate on a
more semantic level. That being said, with or without such extensions, any empirical
comparison should always be interpreted in light of the contexts within which the different
indexing languages operate.
5.2.2.2 Quantifying set similarity
Once methods for assessing the equivalence relationship are established (here post-normalization
string matching), it is possible to quantify the relations between the resultant sets in several
different ways. For example, Al-Khalifa and Davis (2007) find what they term ‘percentage

89
overlap’ by dividing the size of the intersection of the two sets by the size of the union of the sets
and multiplying by 100 [5]. They use this metric to quantify the similarity of the sets of terms
used to index the same documents produced by different indexing systems. For example, to find
the percentage overlap between the set F {A,B,C} and the set K{A,G,K,L} , the size of the
intersection {A} is 1, the size of their union {A,B,C,G,K,L} is 6 and thus the percentage overlap
is 100(1/6) = 17%.
While a useful measurement, this equation misses key information regarding the relative sizes of
the two sets. To capture the size discrepancies and the asymmetry of the relationship, we employ
additional metrics typically used to evaluate class prediction algorithms.
Binary class prediction algorithms are often evaluated based on the relations between sets of true
and false positive and negative predictions [15]. These relations are quantified with measures of
Accuracy, Precision and Recall. Accuracy is the number of correct predictions divided by the
number of false predictions. Precision is the number of true positives divided by the number of
predicted positives. Recall is the number of true positives divided by the number of both true
and false positives. Precision and Recall are often summarized with the F-measure, which
equates to their harmonic mean.
Hripcsak and Rothschild (2005) showed that, by arbitrarily assigning one set as the ‘true
positives’ and the other as the ‘predicted positives’, the F-measure can be used to measure the
degree of agreement between any two sets [16]. Because it is commutative, the choice of which
set to assign as ‘true’ makes no difference to the outcome. Figure 5.1 illustrates the idea of using
Precision, Recall, and the F-measure as generic set comparison operators. The logic goes as
follows, if set A is conceptualized as an attempt to predict set B, the number of items in both sets
(the intersection) corresponds to the number of true positives for the predictor that produced A,
the number of items in A corresponds to the number of true positives plus the number of false
positives, and the number of items in B corresponds to the number of true positives plus the
number of false negatives. From this perspective, accuracy thus equates to percentage overlap as
described by Al-Khalifa and Davis (2007). In addition, Precision and Recall can be used for the
asymmetric quantification of the similarity of the two sets and the F-measure can be used to

90
provide a symmetric view of the overlap between the sets that takes into account their relative
sizes.
5.3 Demonstration and evaluation of proposed metrics
The metrics described above are intended to be useful in scientific enquiries regarding the
relationships that hold between different indexing languages. This information should then, in
turn, be useful in informing assumptions regarding the relationships between the information
systems that generate and use these languages. As such, it should be possible to use the metrics
to answer specific questions. We chose the following questions as demonstrative examples:
1) Are the intra-set characteristics of the folksonomies emerging from collaborative
tagging systems sufficient to distinguish them from term-sets associated with
indexing languages created using professional labour? (We assume that the
difference in kind between these groups will be expressed in a difference in shape
as expressed in the intra-set measures.)
2) How much direct overlap exists between terms from the Connotea, Bibsonomy,
and CiteULike folksonomies, and terms from MeSH? These folksonomies are
used to describe tens of thousands of the same resources as MeSH, hence we
expect some overlap in representation, but how much is there in reality?
To answer these questions and thus demonstrate example applications of the proposed set of
metrics, we implemented programs that calculate each intra and inter-set metric described above.
In the text that follows, we describe the application of these programs to the automated
characterization and comparison of 22 different indexing languages.
5.3.1 Sample
We gathered a sample of 22 different term-sets. The terms were extracted from folksonomies,
thesauri, and ontologies, all of which are currently in active use. Our domains span biology,
medicine, agriculture, and computer science; however, the sample set is biased towards biology
and medicine. Ontologies constitute the most common type of structure in the sample simply
91
because more of them were accessible than the other forms. Table 5.4 lists the subjects of the
study (note that there are more than 22 listed because multiple versions for some of the larger
term-sets were considered separately).
The indexing languages considered here were chosen for three general reasons: (1) they were
freely available on the Web, (2) most of the terms associated with the indexing languages had
representations in English and (3) we sought popular examples spanning both controlled and
uncontrolled indexing languages. Availability on the Web not only made data collection for the
present study easier, it increases the likelihood that the study could be repeated by others in the
future. By constraining the natural language of origin for the indexing languages under study, the
likelihood that the measured differences between term-sets were the results of factors aside from
differences in, for example, typical grammatical structure of the source languages, was
increased. Finally, by sampling from a broad range of the known types of indexing language, as
suggested, for example, in Douglas Tudhope’s typology [17], we hoped to show the generic
nature of the metrics introduced here and to offer some basic exploratory comparisons of the
broad groups of controlled and uncontrolled languages.
Though we provide results for all of the inter-term-set comparisons, the emphasis of the set
comparisons is on the relationship between MeSH and the uncontrolled indexing languages. To
partially decrease the problems, noted above, associated with conducting syntactic comparisons
of indexing languages operating in different contexts, uncontrolled languages were sought that
were used to index many of the same documents as MeSH. Folksonomies emanating from social
tagging services targeted towards academic audiences thus compose the set of uncontrolled
languages in the sample.
5.3.2 Data analysis
Once each of the term-sets was collected (see Appendix 1), two levels of term normalization
were applied corresponding to the intra-set analysis (phase 1) and the inter-set analysis (phase 2).
Both phases were designed based on the premise that most of the terms in the structures were
English words. Though there were certainly some non-English terms present in the folksonomy
92
data, notably German and Spanish, these terms constituted a relatively small minority of the
terms in the set and, as such, we do not believe they had any significant effect on the results.
5.3.2.1 Phase 1 term normalization
Phase 1 normalization was designed primarily to help consistently delineate the boundaries of
compound words, especially in the case of the folksonomies. The operations were:
1 All non-word characters (e.g. ‘ ‘,’;’,’_’,’-‘) were mapped to spaces using a regular
expression. So the term ‘automatic-ontology_evaluation’ would become ‘automatic ontology
evaluation’.
2 CamelCase compound words were mapped to space separated words - ‘camelCase’ becomes
‘camel case’.
3 All words were made all lower case (‘case-folded’).
4 Any redundant terms were removed such that, after operations 1-3, each term in a set
composed a string of characters that was unique within that set.
All of the intra-set measurements (for example, Size and Flexibility) were taken after Phase 1
normalization. Phase 2 normalization was applied before the set-intersection computations (for
the inter-set measurements).
5.3.2.2 Phase 2 term normalization
Phase 2 normalization was intended to reduce the effects of uninformative inconsistencies such
as ‘dolphins’ not matching ‘dolphin’ when estimating the intersections of the term-sets.
1) Phase 1 normalization was applied.
2) Porter stemming was applied to all terms and subterms [18].
3) All subterms were sorted alphabetically.
4) All terms and subterms with less than two characters were removed.
5) All terms and subterms matching words from a popular English stopword list were
removed [19].
93
These additional steps resulted in an average reduction in the total number of distinct terms per
term-set of 13% with the most substantial difference seen for the ‘MeSH all’ term-set, which
included both the preferred labels for each descriptor and all of the alternate labels, at 52%. The
set of just the preferred labels for the MeSH descriptors was only reduced by 3%. This
demonstrates that the normalization step was successful in reducing redundancy within the term-
sets because the ‘MeSH all’ set intentionally includes many variations of the same term while the
preferred labels are intended to be distinct. Figure 5.2 plots the reduction in the (non-redundant)
term-set size between phase 1 and phase 2 normalization for all the term-sets.
After normalization, the shape of each of the term-sets was first assessed individually using the
intra-set measures. Then each of the term-sets were compared directly to all the others using the
inter-set metrics.
5.3.3 Findings – intra-set
The intra-set measures displayed a broad range of diversity across all of the samples and
provided some preliminary evidence of the presence of distinct shapes associated with term-sets
originating from controlled versus uncontrolled information organization structures. The
collected measurements are provided in Tables 5.5-5.7 and discussed below.
Table 5.5 contains the non-ratio measurements of the size and the composition of the term-sets.
From it, we can see that there is a wide range in the size and degrees of modularity of the term-
sets under study. The largest term-set was the CiteULike [20] folksonomy at 234,223 terms and
the smallest was the Common Anatomy Reference ontology [21] at just 50 terms. There was
also substantial variation in the total number of OLP subterms per term, with the CHEBI
ontology [22] averaging 8.88 while the Bibsonomy [23, 24] folksonomy averaged just 0.63. This
is suggestive of differences in the relative compositionality of the different term-sets, with the
ontologies being much more modular in general than the folksonomies.
The subterms per term measurement highlights the uniqueness of the CHEBI ontology within the
context of our sample; its terms include both ‘normal’ language constructs like ‘tetracenomycin
94
F1 methyl ester’ and chemical codes like ‘methyl 3,8,10,12-tetrahydroxy-1-methyl-11-oxo-6,11-
dihydrotetracene-2-carboxylate’. Though both term structures are highly modular in this large
ontology, the latter are clearly driving the very high observed mean number of subterms per
term.
Table 5.6 focuses specifically on illustrating the amount of modularity apparent in these term-
sets. It displays the percentages of uniterms, duplets, triplets, and quadplus terms; the flexibility,
and the percentages of terms that contain other terms or are contained by other terms. The
CiteULike folksonomy has the highest percentage of uniterms at 75.8%, followed closely by the
Bibsonomy folksonomy at 72.7%, while the two lowest percentages are observed for the
Foundational Model of Anatomy (FMA) [25] (including synonyms) at 1.2% and the Biological
Process (BP) branch of the Gene Ontology [9] at 0.8%. This tendency towards increased
compositionality in these ontologies and decreased compositionality in these folksonomies is
also apparent in the percentage of their terms that contain other complete terms from the
structure, with more than 95% of the FMA terms containing other FMA terms and only 23.8% of
the Bibsonomy terms containing another Bibsonomy term. As might be expected, larger average
term lengths, as presented in Table 5.7, appear to correlate to some extent with some of the
measures indicating increased compositionality. The highest correlation for a compositionality
measure with average term length was observed for OLP Quad Plus (r-squared 0.86) while the
lowest was for containedByAnother (r-squared 0.13). The highest mean term length observed
was 40.35 characters for the preferred labels for the FMA and the lowest was 10.19 for the
Bibsonomy terms.
5.3.3.1 Factor analysis
Following the collection of the individual parameters described above, exploratory factor
analysis was applied to the data to deduce the major dimensions. Prior to executing the factor
analysis, the data was pruned manually to reduce the degree of correlation between the variables.
The features utilized in the factor analysis were thus limited to % uniterms, % duplets, %
quadplus, flexibility, %containsAnother, %containedByAnother, mean number of subterms per
term, mean term length, and the coefficient of variation for term length. Maximum likelihood
factor analysis, as implemented in the R statistical programming environment [26], was applied
95
using these variables for all of the sampled term-sets. Three tests were conducted with 1, 2, and
3 factors to be fitted respectively. In each of these tests, the dominant factor, which might be
labelled ‘term complexity’, was associated with the variables: %quadplus, mean term length,
and mean subterms per term. In the 2-factor test, the secondary factor was most associated with
the % uniterms and the flexibility. Finally, in the 3 factor analysis, the third factor was
associated with %containsAnother and %containedByAnother. Table 5.8 provides the factor
loadings for the 3-factor test.
5.3.3.2 Controlled versus uncontrolled term-sets
The data presented in Tables 5.5-5.7 provides evidence that the metrics captured here are
sufficient to distinguish between term-sets representing different indexing languages. To assess
their utility in quantifying differences between indexing languages emanating from different
kinds of information system we tested to see if they could be used to differentiate between the
languages produced by professional labour (the thesauri and the ontologies) and languages
generated by the masses (the folksonomies).
This examination was conducted using manual inspection of the data, multi-dimensional
visualization, and cluster analysis. At each step, we tested to see if the data suggested the
presence of a distinct constellation of intra-set parameters associated with the term-sets drawn
from the folksonomies. For some subsets of variables, the difference was obvious. For example,
as Figure 5.3 illustrates, both the %uniterms and the OLP flexibility measurements were
sufficient to separate the folksonomies from the other term-sets independently. For other subsets
of variables, the differences were less clear and, in some cases, the folksonomies did not group
together.
Figures 5.4-5.10 use radar-charts to illustrate the shapes associated with the three folksonomies
in the sample as well as representative ontologies and thesauri. Radar charts were chosen
because they make it possible to visualize large numbers of dimensions simultaneously. Though
it would be possible to reduce the number of features in the charts, for example using the results
from the factor analysis presented above, we chose to present all of the measurements taken.
These figures, which capture all of the features measured for a given term-set in a single image,
96
suggest fairly distinct patterns in the term-sets associated with the different kinds of information
system present in our sample. However, when utilizing all of the variables, the borders of the
various categories are not entirely clear. For example, the Bibsonomy and CiteULike
folksonomies appear to be nearly identical in these charts but, while similar, the Connotea
folksonomy shows substantial variations.
In various iterations of cluster analysis we repeatedly found that the Bibsonomy and the
CiteULike term-sets grouped tightly together and that Connotea was generally similar to them
but that this similarity was strongly influenced by the specific subset of the metrics used. In one
specific analysis, Ward’s method identified a distinct cluster containing just the folksonomies
using the following parameters: % of uniterms, % of duplets, flexibility, % contained by another,
standard deviation of term length, skewness of term length, and number of complements [27].
These results indicate that the answer to the first question, namely “are the terms from
folksonomies shaped differently than the terms from controlled vocabularies?” is, generally, yes.
Subsets of these metrics can be used to separate folksonomies from the controlled vocabularies
using a variety of methods. However, Bibsonomy and CiteULike are clearly much more similar
to each other than either is to Connotea. Without advancing a definitive answer as to why this is
the case, we offer several possible explanations. First, one clear technical difference between
Connotea and the other two systems is that it allows spaces in its tags. For example, it is
possible to use the tag ‘semantic web’ in Connotea, but, in Bibsonomy or CiteULike, one would
have to use a construct like ‘semanticWeb’, ‘semantic-web’, or ‘semanticweb’ to express the
same term. Though the syntactic normalization we utilized will equate ‘semantic-web’ with
‘semantic web’ (and detect the two-term composition), the term semanticweb would not match
and would be classified by the system as a uniterm. This difference suggests that there may be
more compound terms in Bibsonomy and CiteULike than our metrics indicate; however, this
aspect of the tagging system may also act to discourage the use of complex tags by the
Bibsonomy and CiteULike users. Aside from differences in the allowed syntax of these
uncontrolled indexing languages, this may also be an effect of the differing communities that use
these systems. While Connotea is clearly dominated by biomedical researchers, Bibsonomy is
much more influenced by computer scientists and CiteULike seems to have the broadest mixture.
Perhaps the biomedical tags are simply longer and more complex than in other fields. A final
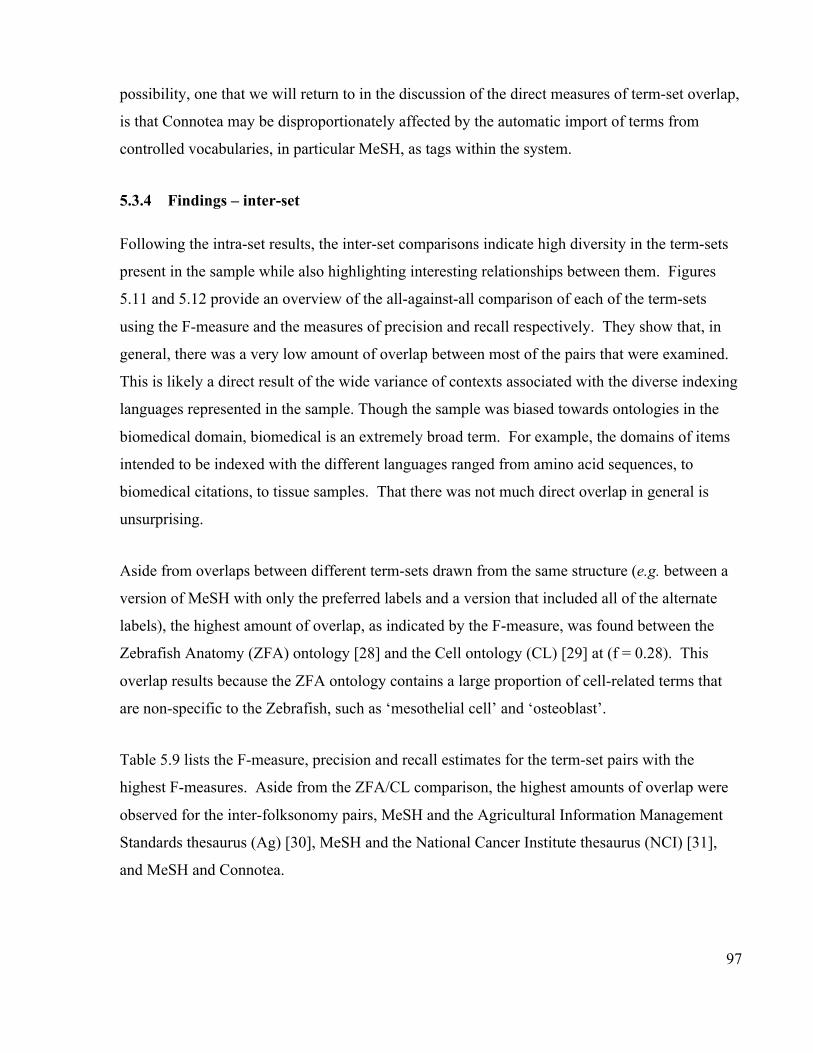
97
possibility, one that we will return to in the discussion of the direct measures of term-set overlap,
is that Connotea may be disproportionately affected by the automatic import of terms from
controlled vocabularies, in particular MeSH, as tags within the system.
5.3.4 Findings – inter-set
Following the intra-set results, the inter-set comparisons indicate high diversity in the term-sets
present in the sample while also highlighting interesting relationships between them. Figures
5.11 and 5.12 provide an overview of the all-against-all comparison of each of the term-sets
using the F-measure and the measures of precision and recall respectively. They show that, in
general, there was a very low amount of overlap between most of the pairs that were examined.
This is likely a direct result of the wide variance of contexts associated with the diverse indexing
languages represented in the sample. Though the sample was biased towards ontologies in the
biomedical domain, biomedical is an extremely broad term. For example, the domains of items
intended to be indexed with the different languages ranged from amino acid sequences, to
biomedical citations, to tissue samples. That there was not much direct overlap in general is
unsurprising.
Aside from overlaps between different term-sets drawn from the same structure (e.g. between a
version of MeSH with only the preferred labels and a version that included all of the alternate
labels), the highest amount of overlap, as indicated by the F-measure, was found between the
Zebrafish Anatomy (ZFA) ontology [28] and the Cell ontology (CL) [29] at (f = 0.28). This
overlap results because the ZFA ontology contains a large proportion of cell-related terms that
are non-specific to the Zebrafish, such as ‘mesothelial cell’ and ‘osteoblast’.
Table 5.9 lists the F-measure, precision and recall estimates for the term-set pairs with the
highest F-measures. Aside from the ZFA/CL comparison, the highest amounts of overlap were
observed for the inter-folksonomy pairs, MeSH and the Agricultural Information Management
Standards thesaurus (Ag) [30], MeSH and the National Cancer Institute thesaurus (NCI) [31],
and MeSH and Connotea.

98
5.3.4.1 MeSH versus the folksonomies
The second specific, demonstrative question put forward above, and one of the early motivators
for this project, was the question of how the terms from MeSH compare to the terms from
academic folksonomies. To answer this question, Tables 5.10 and 5.11 delineate the overlaps in
terms of precision, recall, and the F-measure that were observed between the three folksonomies
in our sample and the MeSH thesaurus (including one version with just the preferred labels and
another that included alternate terms). Of the three folksonomies, Connotea displayed the
greatest degree of overlap with MeSH in terms of the F-measure, precision, and recall for both
the preferred labels and the complete MeSH term-set. The precision of the Connotea terms with
respect to the MeSH preferred labels was 0.073, the recall 0.363, and the F-measure was 0.122.
The fact that the Connotea term-set contains nearly 9000 MeSH terms (36% of the entire set of
preferred labels) suggests a) that there are a number of biomedical researchers using Connotea
and b) that they have chosen, one way or another, to utilize MeSH terminology in the
organization of their publicly accessible resource collections. How these terms came to be used
in this manner is a more difficult question. In some cases, the Connotea users likely recreated
the MeSH terms when going about their normal tagging practices; however, the relatively high
level of overlap is suggestive of other underlying factors.
5.3.4.2 Batch import in folksonomies
Connotea, as well as the other social tagging systems in the study, offers a way to import data
from other sources automatically. For example, it is possible to export bibliographic information
from applications such as Endnote and then import these records as bookmarks within the
Connotea system. This opens up the possibility that tags generated outside of the Connotea
system, such as MeSH indexing by MEDLINE, can wind up in the mix of the tags contained
within the Connotea folksonomy.
To help assess the impact of imported tags on the contents of the Connotea folksonomy, we
identified and removed a subset of the Connotea tags that were highly likely to have been
imported through the use of additional information about the context of the creation of the tags,

99
and then recomputed all of the metrics defined above. In a social bookmarking system like
Connotea, tags are added to the system as descriptive annotations of Web resources. When a
bookmark is posted to the system by a particular user, the tags associated with it, as well as a
timestamp, are associated with the entry. Sets of bookmarks posted via batch import, for example
from the contents of an Endnote library, will all have nearly identical timestamps associated
with them. Thus, by pruning out tags originating only in posts submitted by the same user
during the same minute, we constructed a new Connotea term-set that should be more
representative of the terms actually typed in directly by the users.
Figure 13 shows the differences between the pruned Connotea term-set (Connotea_no_batch)
and the original dataset on both intra-set measures and measures of direct overlap with the MeSH
preferredLabel term-set. In every metric except for the skewness of the lengths of the terms, the
pruned Connotea term-set more closely resembled the other folksonomies. For example, in the
pruned set, the % uniterms increased by about 10%, the % quadplus decreased by more than 30%
and the flexibility increased by about 10%. The overlap with the MeSH prefLabels decreased
from 0.12 to 0.11 with respect to the F measure, the precision decreased from 0.363 to 0.266, and
the recall decreased from 0.073 to 0.069.
It appears the process of batch uploading bookmarks in Connotea, in cooperation with other
personal information management practices such as the use of Endnote, has influenced the
contents of the Connotea folksonomy. In particular, many MeSH terms appear to have been
incorporated into it. Since most other folksonomies, including the others evaluated here, also
have automated upload capabilities, it is highly likely that similar results may be observed within
them. While this phenomenon makes the interpretation of folksonomy datasets more complex by
obscuring the origins of the data, its illumination should provide new opportunities for
investigation. For example, perhaps it would be possible to track the migration of terms across
the boundaries of different systems through the addition of a temporal attribute to the inter-set
metrics suggested here. Such data might help to explain the origins of the terms utilized in
different indexing languages. One would assume for example, that many of the terms that now
overlap between MeSH and the folksonomies appeared first in MeSH and then migrated over
somehow; however, in the future, perhaps this process might be reversed as folksonomies are
mined for candidate extensions to controlled vocabularies.

100
5.4 Discussion
Robust, reproducible methods for comparing different information systems are vital tools for
scientists and system developers faced with what has been called “an unprecedented increase in
the number and variety of formal and informal systems for knowledge representation and
organization” [32]. Indeed, we are in a Cambrian Age of web-based indexing languages. Metrics
and tools such as the system for indexing language characterization described here can be used to
provide information about how the many emerging kinds of information systems relate to one
another. It can also be used in the design of new systems that incorporate ideas inspired by such
comparisons, as suggested by the University of California’s Bibliographic Services Task Force
[33], or, as demonstrated by Good et al. (2006) and Willighagen et al. (2007), explicitly combine
multiple extant systems to form novel hybrids [34, 35].
In the research presented above, we introduced metrics for the automatic characterization and
set-theoretic comparison of sets of terms from indexing languages. Using these metrics, we
provided a broad-spectrum analysis of 22 different languages. Within the data gathered in this
exploratory analysis, we identified suggestive patterns associated with the terms that compose
folksonomies versus the terms from controlled vocabularies as well as directly quantifying the
degree of overlap present across each of the sets in the sample. Of particular interest is the
apparent migration of terms across the boundaries of the different systems, in particular from
MeSH into the folksonomies. Though the results presented here are informative, the main
contribution of this work is the enumeration and implementation of the comparative protocol.
Future term-set analyses, particularly if they can be integrated with rich qualitative dimensions,
might be put to any number of novel uses. Given the definition of these metrics and the
provision of tools for their calculation, it would now be straightforward to test whether any of the
term-based measurements are related to other attributes of information systems. For example, it
might be interesting to test to see if any of these factors were predictive of system performance;
e.g., is the percentage of uniterms in the tags that compose a folksonomy correlated with the
performance of that folksonomy in the context of a retrieval task? If that answer turned out to be
yes, then it would offer an easy way to estimate the retrieval performance of different systems
and might suggest ways to improve performance, for example by adapting the tagging interface
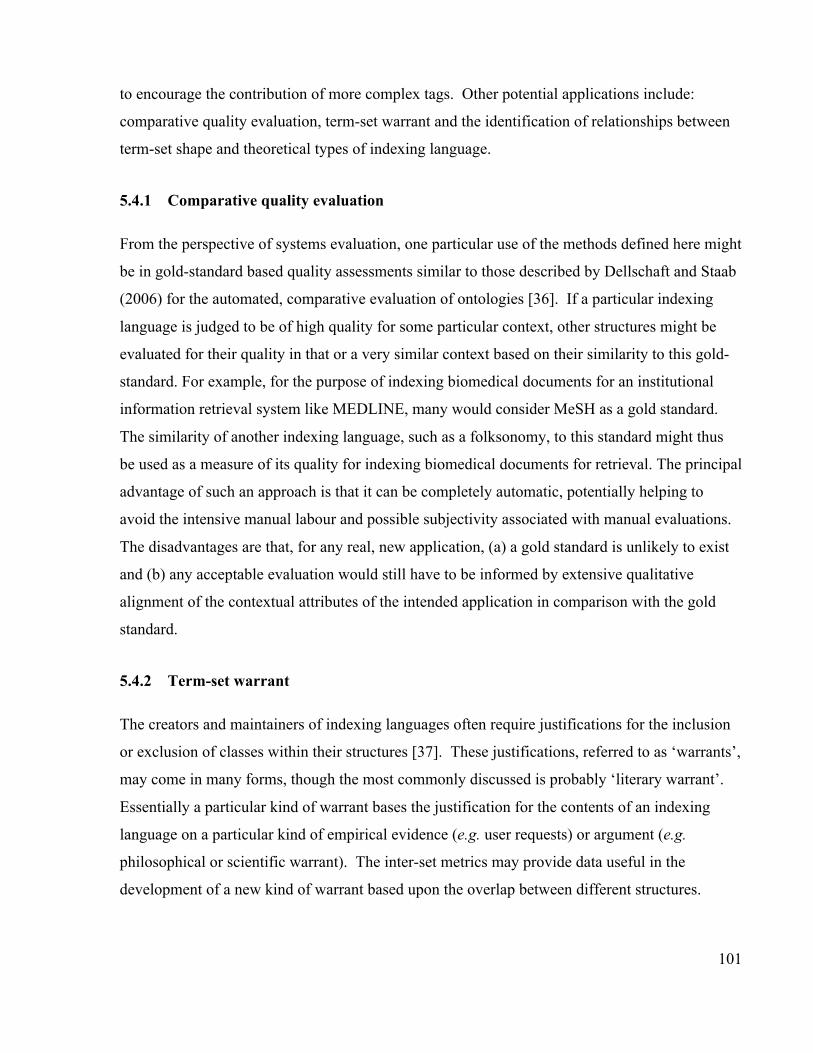
101
to encourage the contribution of more complex tags. Other potential applications include:
comparative quality evaluation, term-set warrant and the identification of relationships between
term-set shape and theoretical types of indexing language.
5.4.1 Comparative quality evaluation
From the perspective of systems evaluation, one particular use of the methods defined here might
be in gold-standard based quality assessments similar to those described by Dellschaft and Staab
(2006) for the automated, comparative evaluation of ontologies [36]. If a particular indexing
language is judged to be of high quality for some particular context, other structures might be
evaluated for their quality in that or a very similar context based on their similarity to this gold-
standard. For example, for the purpose of indexing biomedical documents for an institutional
information retrieval system like MEDLINE, many would consider MeSH as a gold standard.
The similarity of another indexing language, such as a folksonomy, to this standard might thus
be used as a measure of its quality for indexing biomedical documents for retrieval. The principal
advantage of such an approach is that it can be completely automatic, potentially helping to
avoid the intensive manual labour and possible subjectivity associated with manual evaluations.
The disadvantages are that, for any real, new application, (a) a gold standard is unlikely to exist
and (b) any acceptable evaluation would still have to be informed by extensive qualitative
alignment of the contextual attributes of the intended application in comparison with the gold
standard.
5.4.2 Term-set warrant
The creators and maintainers of indexing languages often require justifications for the inclusion
or exclusion of classes within their structures [37]. These justifications, referred to as ‘warrants’,
may come in many forms, though the most commonly discussed is probably ‘literary warrant’.
Essentially a particular kind of warrant bases the justification for the contents of an indexing
language on a particular kind of empirical evidence (e.g. user requests) or argument (e.g.
philosophical or scientific warrant). The inter-set metrics may provide data useful in the
development of a new kind of warrant based upon the overlap between different structures.

102
Essentially, such a ‘term-set warrant’ might be invoked to justify the inclusion of terms or the
concepts they represent based on the presence or absence of those terms in other structures.
5.4.3 Relationship of term-set shape to theoretical type
It is tempting to think that this approach, or some extension of it, could be used to describe
meaningful types of indexing languages, not from design requirements, but from the
actualization of those design requirements manifest in and observable to us in the shape of term-
sets. This could provide a weak empirical corroboration for types of indexing languages in use,
not only according to standard or theory, but based on empirical evidence of term corpus.
Defending and making use of such inferences would require a solid understanding of the
meaning of the different shapes. The work presented here is exploratory and future work will
have to substantiate any claim at deriving type from these empirical factors. However, we can
see that, in this sample, there were clear distinctions between the shapes of controlled and
uncontrolled vocabularies, demonstrating at this stage that we can hypothesize that folksonomies
have a particular shape in relation to both thesauri and ontologies. Future studies may take
advantage of the increasing number of different indexing languages to, for example, attempt to
define the relationship of term-set shape to the breakdown of theoretical type within the
controlled vocabularies.
5.5 Future work
The metrics derived and applied here operate at what amounts to a syntactic level – no specific
attempt, other than rudimentary term normalization, was made to identify the concepts present in
the different indexing languages. A natural extension of this work would be to apply natural
language processing technology to make this attempt. The rough indications of semantic
similarity provided by the inter-term-set comparisons could be made much more robust if the
comparisons were made at the level of concepts rather than terms, for example making it
possible to equate synonymous terms from different languages.
Aside from the incorporation of natural language processing technology for concept
identification, it would be useful to consider the analysis of predicate relationships between the

103
terms (e.g. the hierarchical structure) and the analysis of the relationships between terms and the
items they may be used to index. Metrics that captured these additional facets of information
systems, characteristic of their form and application, would provide the opportunity for much
more detailed comparisons, thus forming the raw materials for the derivation and testing of many
new hypotheses.
There remain many indexing languages, both controlled and uncontrolled, that are available
online that have not been characterized with the methods and from the naturalistic perspective
adopted here. In addition to improving and expanding methods, the majority of future work will
be the application of these tools to the analysis of other languages.
5.6 Conclusion
We are at the very beginning of a rapid expansion in the number and the diversity of different
frameworks for the organization of information. As more and more information systems come
into the world, the application of expository, reproducible protocols for their comparative
analysis, such as the one described in this article, will lead to ever increasing abilities to
illuminate and thus build upon this expanding diversity of form and content.

104
Table 5.1. Examples of OLP term classifications
Terms are divided into different OLP categories (uniterm, duplet, triplet, quadruplet or higher)based on the number of subterms detected.
Terms OLP SubtermNumber
Namingconvention
‘ontology’ 1 uniterm
‘ontology evaluation’ 2 duplet
‘Fibroblast Growth Factor’ 3 triplet
‘United States of America’ 4 quadruplet or
higher
‘Type 5 Fibroblast Growth Factor’ 5 quadruplet or
higher
Table 5.2. Explanation of the OLP Flexibility measure
The flexibility for the term-set listed in the first columns is equal to 0.17 (1 divided by 6)because there is one subterm ‘Web’ that is also a uniterm out of a total of 6 subterms.
Terms Uniterms Subterms Consolidatedsubterms
Both consolidatedand uniterms
Semantic Web Semantic Semantic
Web Web Web
Web Web
Social Web Social Social
Web
Planet Planet
Do Re Mi Do Do
Re Re
Mi Mi
Star Star
6 1

105
Table 5.3. Parameters of term-sets
Parameter Definition
Number distinct termsThe number of syntactically unique terms in the set.
Term length The length of the terms in the set. We report the mean,minimum, maximum, median, standard deviation, skewness,and coefficient of variation for the term lengths in a term-set.
OLP uniterms, duplets,triplets, quadplus
We report both the total number and the fraction of each ofthese categories in the whole term-set.
OLP flexibility The fraction of OLP subterms (the independent terms thatare used to compose precoordinated terms) that also appearas uniterms.
OLP number subtermsper term
The number of subterms per term is zero for a uniterm(’gene’), two for a duplet (‘gene ontology’), three for atriplet (‘cell biology class’), and so on. We report the mean,maximum, minimum, and median number of subterms perterm in a term-set.
contains another The terms that contain another term from the same set. Boththe total and the proportion of terms that contain another arereported.
contained by another The terms that are contained by another term from the sameset. Both the total and the proportion of terms that arecontained by another are reported
complements A complement is a subterm that is not itself an independentmember of the set of terms. The total number of distinctcomplements is reported.
compositions A composition is a combination of one term from the term-set with another set of terms (forming the suffix and/or theprefix to this term) to form another term in the set. The totalnumber of compositions is reported.

106
Table 5.4. Term-sets
Each of the term-sets evaluated in this study is described below.
Name Abbreviation Sourcesyntax
Type Domain
Academic ComputingMachinery subject listing
ACM 1997 OWL thesaurus computer science
Agriculture Informationand Standards ontology
AG OWL ontology agriculture
Bibsonomy Bibsonomy text folksonomy general/academicBioLinks BioLinks OWL thesaurus bioinformaticsBiological Process branchof the Gene Ontology
GO_BP OBO/OWL ontology biology
Cell Type Ontology CL OBO/OWL ontology biologyCellular Component branchof the Gene Ontology
GO_CC OBO/OWL ontology biology
Chemical Entities ofBiological Interest
CHEBI OBO/OWL ontology biology
CiteULike CiteULike text folksonomy general/academicCommon AnatomyReference Ontology
CARO OBO/OWL ontology biology
Connotea Connotea text folksonomy general/academicEnvironment Ontology ENVO OBO/OWL ontology biologyFoundational Model ofAnatomy (preferred labels+ synonyms)
FMA +synonyms
OWL ontology biology/medicine
Foundational Model ofAnatomy (preferred labels)
FMA PrefLabels OWL ontology biology/medicine
Medical Subject Headings(descriptors + entry terms)
MeSH With AllLabels
XML thesaurus biology/medicine
Medical Subject Headings(descriptors)
MeSHPrefLabels
XML thesaurus biology/medicine
Molecular Function branchof the Gene Ontology
GO_MF OBO/OWL ontology biology
National Cancer InstituteThesaurus (preferred labels+ synonyms)
NCI Thesaurus +synonyms
OWL thesaurus biology/medicine
National Cancer InstituteThesaurus (preferredlabels)
NCI ThesaurusPrefLabels
OWL thesaurus biology/medicine
Ontology for BiomedicalInvestigation
OBI OBO/OWL ontology biology/medicine
Phenotype Ontology PATO OBO/OWL ontology biologyProtein Ontology PRO OBO/OWL ontology biologySequence Ontology SO OBO/OWL ontology biologyThesaurus of EIONET, theEuropean, Environment,Information, andObservation Network
GEMET SKOS/RDF thesaurus environment
Zebrafish Anatomy ZFA OBO/OWL ontology biology

107
Table 5.5. Size and composition of term-sets
This table reports the size of the term-sets and parameters related to the degrees of modularityobserved in each. The term-sets are grouped into three types: folksonomies are indicated ingreen, thesauri in yellow, and ontologies in blue. The maximum and minimum values for eachcolumn are indicated by the uncolored cells.
Term-set Numberdistinctterms
OLP meannumbersub termsper term
OLPmaxnumbersubtermsper term
OLPmediannumbersubtermsper term
Complements Compositions
Bibsonomy 48120 0.63 21 0 16448 25881CiteULike 234223 0.56 14 0 62364 127118Connotea 133455 1.49 33 2 119486 183980ACM 1997 (OWLversion)
1194 2.47 15 2 583 654
AG (English terms) 28432 1.34 7 2 7146 10018BioLinks 90 1.87 6 2 9 9GEMET 5207 1.68 7 2 2201 3809MeSH PrefLabels 24766 1.67 20 2 8333 11162MeSH With AllLabels
167081 2.35 27 2 90032 163010
CARO 50 2.38 4 2 21 22CHEBI 73465 8.88 241 3 255506 289469CL 1268 2.57 9 2 1171 1529ENVO 2001 1.49 10 2 925 1452FMA plus synonyms 120243 5.81 18 6 255632 545648FMA Preflabels 75147 6.14 18 6 169042 352541GO_BP 42482 5.00 33 5 33667 79062GO_CC 3539 3.45 14 3 2493 3821GO_MF 30843 4.83 62 4 18941 26138NCI Thesaurus –preflabels
60980 3.38 31 3 107413 148151
NCI Thesaurus +synonyms
146770 3.81 73 3 391297 592554
OBI 764 2.20 8 2 288 315PATO 2162 1.57 7 2 1162 2780PRO 837 4.28 32 5 552 767SO 2104 2.86 18 3 2342 3183ZFA 3250 2.40 8 2 2255 3616

108
Table 5.6. Modularity measurement ratios.
This table reports on parameters related to the modularity of the term-sets. The term-sets aregrouped into three types: folksonomies are indicated in green, thesauri in yellow, and ontologiesin blue. The maximum and minimum values for each column are indicated by the uncoloredcells.
Term-set OLPuniterms
OLPduplets
OLPtriplets
OLPquadplus
OLPflexibility
Containsanother
Containedby another
Bibsonomy 72.7% 21.7% 4.2% 1.5% 56.6% 25.8% 13.7%CiteULike 75.8% 18.8% 4.3% 1.2% 68.2% 23.8% 9.6%Connotea 44.8% 35.1% 12.4% 7.7% 43.8% 51.7% 18.2%ACM 1997(OWLversion)
18.5% 40.9% 18.4% 22.2% 9.2% 40.3% 12.8%
AG (Englishterms)
34.3% 63.1% 2.2% 0.4% 15.6% 32.5% 11.0%
BioLinks 35.6% 31.1% 14.4% 18.9% 6.5% 8.9% 8.9%GEMET 27.5% 54.4% 13.9% 4.1% 26.6% 51.7% 16.0%MeSHPrefLabels
37.3% 37.1% 15.7% 9.8% 15.8% 35.1% 10.5%
MeSH WithAll Labels
16.4% 40.6% 28.1% 14.9% 23.1% 62.0% 10.4%
CARO 4.0% 54.0% 38.0% 4.0% 3.7% 44.0% 12.0%CHEBI 22.1% 18.8% 11.2% 47.9% 33.2% 73.7% 20.9%CL 15.3% 35.3% 28.0% 21.4% 6.3% 80.6% 13.4%ENVO 37.3% 47.6% 10.4% 4.6% 26.6% 51.6% 17.3%FMA plussynonyms
1.2% 6.9% 11.7% 80.2% 15.0% 95.1% 24.6%
FMAPreflabels
1.4% 5.2% 8.8% 84.6% 16.6% 95.5% 25.3%
GO_BP 0.8% 14.4% 18.1% 66.7% 3.7% 87.1% 20.7%GO_CC 9.1% 26.7% 22.3% 41.9% 7.0% 57.0% 19.5%GO_MF 4.0% 8.2% 20.4% 67.5% 2.3% 58.2% 11.0%NCIThesaurus -preflabels
14.8% 25.8% 22.5% 36.9% 22.3% 77.9% 17.2%
NCIThesaurus +synonyms
16.8% 20.1% 17.5% 45.6% 37.5% 81.3% 24.8%
OBI 19.5% 42.1% 25.1% 13.2% 7.7% 32.2% 13.6%PATO 36.6% 40.0% 17.7% 5.7% 42.8% 57.6% 32.2%PRO 11.1% 6.0% 11.8% 71.1% 12.1% 69.7% 17.6%SO 12.8% 29.8% 27.5% 30.0% 17.2% 76.4% 22.6%ZFA 17.4% 36.4% 26.0% 20.3% 13.7% 60.9% 14.7%

109
Table 5.7. Measurements of term length
This table reports on the sizes of the terms. The term-sets are grouped into three types:folksonomies are indicated in green, thesauri in yellow, and ontologies in blue. The maximumand minimum values for each column are indicated by the uncolored cells.
Term-set Mean Max Median StandardDeviation
Skewness Coefficient ofvariation
Bibsonomy 10.19 196.00 9.00 6.59 5.17 0.65CiteULike 12.38 80.00 11.00 7.35 1.83 0.59Connotea 15.29 268.00 13.00 14.14 7.56 0.92ACM 1997 (OWLversion)
21.70 94.00 20.00 10.96 1.48 0.51
AG (English terms) 15.29 48.00 15.00 5.67 0.12 0.37BioLinks 16.30 45.00 15.00 9.12 0.74 0.56GEMET 15.48 54.00 15.00 6.73 0.67 0.43MeSH PrefLabels 17.46 98.00 16.00 8.71 1.29 0.50MeSH With AllLabels
20.36 112.00 19.00 9.29 0.93 0.46
CARO 20.96 35.00 20.00 7.24 0.30 0.35CHEBI 36.12 831.00 21.00 45.44 4.01 1.26CL 19.35 72.00 18.00 9.59 1.07 0.50ENVO 12.43 73.00 11.00 7.80 2.32 0.63FMA plus synonyms 38.26 125.00 36.00 16.45 0.64 0.43FMA Preflabels 40.35 125.00 38.00 17.03 0.59 0.42GO_BP 39.71 160.00 37.00 18.63 1.38 0.47GO_CC 26.50 96.00 23.00 15.29 1.00 0.58GO_MF 39.82 322.00 38.00 19.61 1.45 0.49NCI Thesaurus -preflabels
25.87 208.00 22.00 17.36 1.86 0.67
NCI Thesaurus +synonyms
26.67 342.00 23.00 19.96 2.25 0.75
OBI 18.69 62.00 17.00 9.46 0.99 0.51PATO 14.96 46.00 14.00 7.33 0.67 0.49PRO 26.38 162.00 27.00 13.82 1.40 0.52SO 19.87 142.00 18.00 11.86 1.58 0.60ZFA 18.45 72.00 18.00 8.72 0.54 0.47
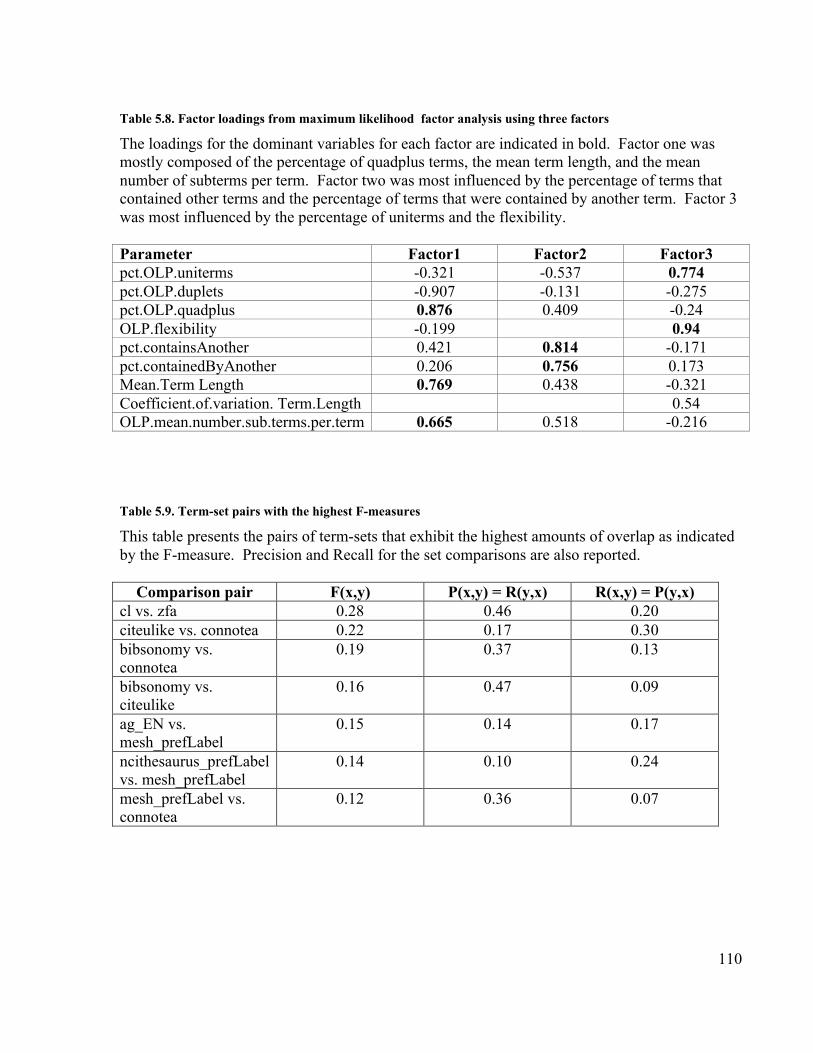
110
Table 5.8. Factor loadings from maximum likelihood factor analysis using three factors
The loadings for the dominant variables for each factor are indicated in bold. Factor one wasmostly composed of the percentage of quadplus terms, the mean term length, and the meannumber of subterms per term. Factor two was most influenced by the percentage of terms thatcontained other terms and the percentage of terms that were contained by another term. Factor 3was most influenced by the percentage of uniterms and the flexibility.
Parameter Factor1 Factor2 Factor3pct.OLP.uniterms -0.321 -0.537 0.774pct.OLP.duplets -0.907 -0.131 -0.275pct.OLP.quadplus 0.876 0.409 -0.24OLP.flexibility -0.199 0.94pct.containsAnother 0.421 0.814 -0.171pct.containedByAnother 0.206 0.756 0.173Mean.Term Length 0.769 0.438 -0.321Coefficient.of.variation. Term.Length 0.54OLP.mean.number.sub.terms.per.term 0.665 0.518 -0.216
Table 5.9. Term-set pairs with the highest F-measures
This table presents the pairs of term-sets that exhibit the highest amounts of overlap as indicatedby the F-measure. Precision and Recall for the set comparisons are also reported.
Comparison pair F(x,y) P(x,y) = R(y,x) R(x,y) = P(y,x)cl vs. zfa 0.28 0.46 0.20citeulike vs. connotea 0.22 0.17 0.30bibsonomy vs.connotea
0.19 0.37 0.13
bibsonomy vs.citeulike
0.16 0.47 0.09
ag_EN vs.mesh_prefLabel
0.15 0.14 0.17
ncithesaurus_prefLabelvs. mesh_prefLabel
0.14 0.10 0.24
mesh_prefLabel vs.connotea
0.12 0.36 0.07

111
Table 5.10. Precision/Recall estimates of the similarity between MeSH and three folksonomies
Each cell in the table may be read as either the precision of the term-set identified for the rowwith respect to the term-set identified by the column or the recall of the column with respect tothe row. For example, the first cell indicates that the precision of CiteULike with respect tomesh_all (including alternate term labels) and the recall of mesh_all with respect to CiteULike is0.047. The minima and maxima for each column are indicated in bold.
mesh_all mesh_prefLabel bibsonomy citeulike connoteaciteulike 0.047 0.030 0.094 1.000 0.170connotea 0.104 0.073 0.129 0.297 1.000bibsonomy 0.075 0.047 1.000 0.470 0.370mesh_all 1.000 0.301 0.039 0.122 0.155mesh_prefLabel 1.000 1.000 0.081 0.263 0.363
Table 5.11. F measures of the similarity between MeSH and three folksonomies.
This table presents the levels of overlap, quantified with the F measure, between thefolksonomies and MeSH
bibsonomy citeulike connotea mesh_all mesh_prefLabelbibsonomy 1.000 0.157 0.191 0.051 0.059citeulike 1.000 0.217 0.068 0.054connotea 1.000 0.124 0.122mesh_all 1.000 0.462mesh_prefLabel 1.000
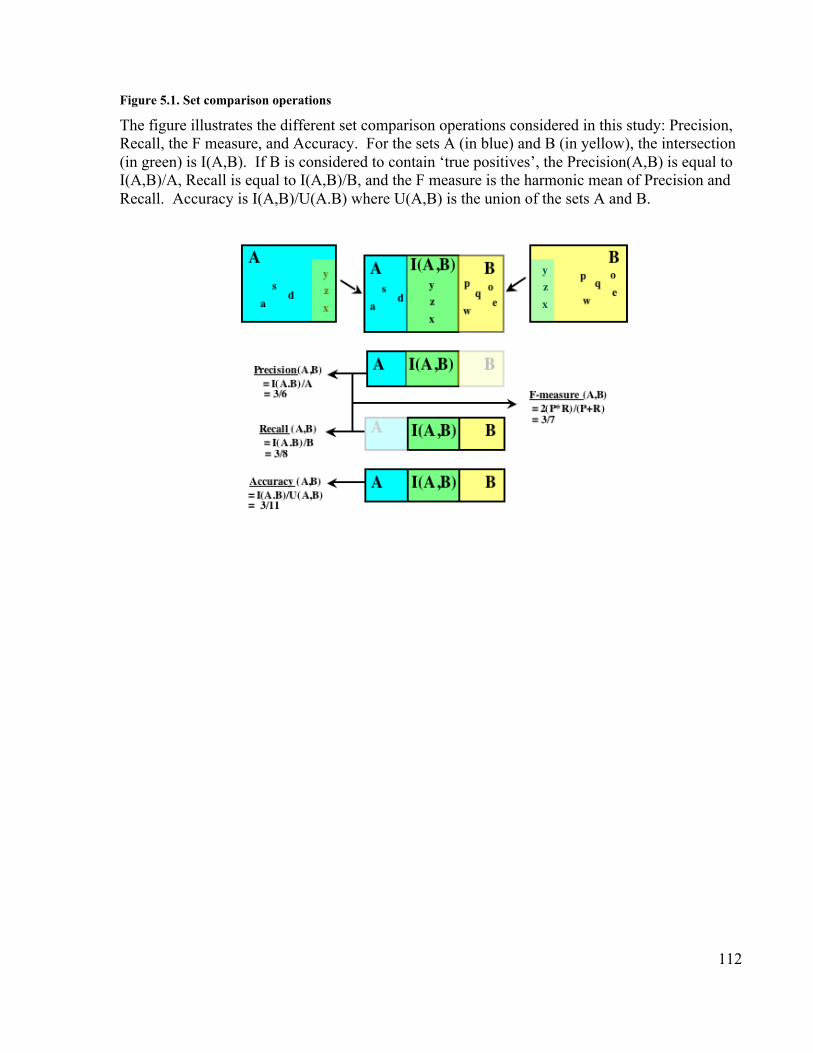
112
Figure 5.1. Set comparison operations
The figure illustrates the different set comparison operations considered in this study: Precision,Recall, the F measure, and Accuracy. For the sets A (in blue) and B (in yellow), the intersection(in green) is I(A,B). If B is considered to contain ‘true positives’, the Precision(A,B) is equal toI(A,B)/A, Recall is equal to I(A,B)/B, and the F measure is the harmonic mean of Precision andRecall. Accuracy is I(A,B)/U(A.B) where U(A,B) is the union of the sets A and B.

113
Figure 5.2. The effect of phase 2 normalization on the size of the term-set
For each term-set, the chart displays the ratio of its size after phase 2 normalization versus itssize after phase 1 normalization. Note that the greatest difference is observed for the ‘mesh_all’term set; this is expected because this set explicitly includes multiple syntactic forms of eachterm.

114
Figure 5.3. %Uniterms verse OLP flexibility
Both %Uniterms and OLP flexibility are independently sufficient to form a linear separator(indicated by the light vertical and horizontal lines) between the term-sets originating fromfolksonomies (the three in the upper right corner) and the controlled terms from the otherindexing languages.
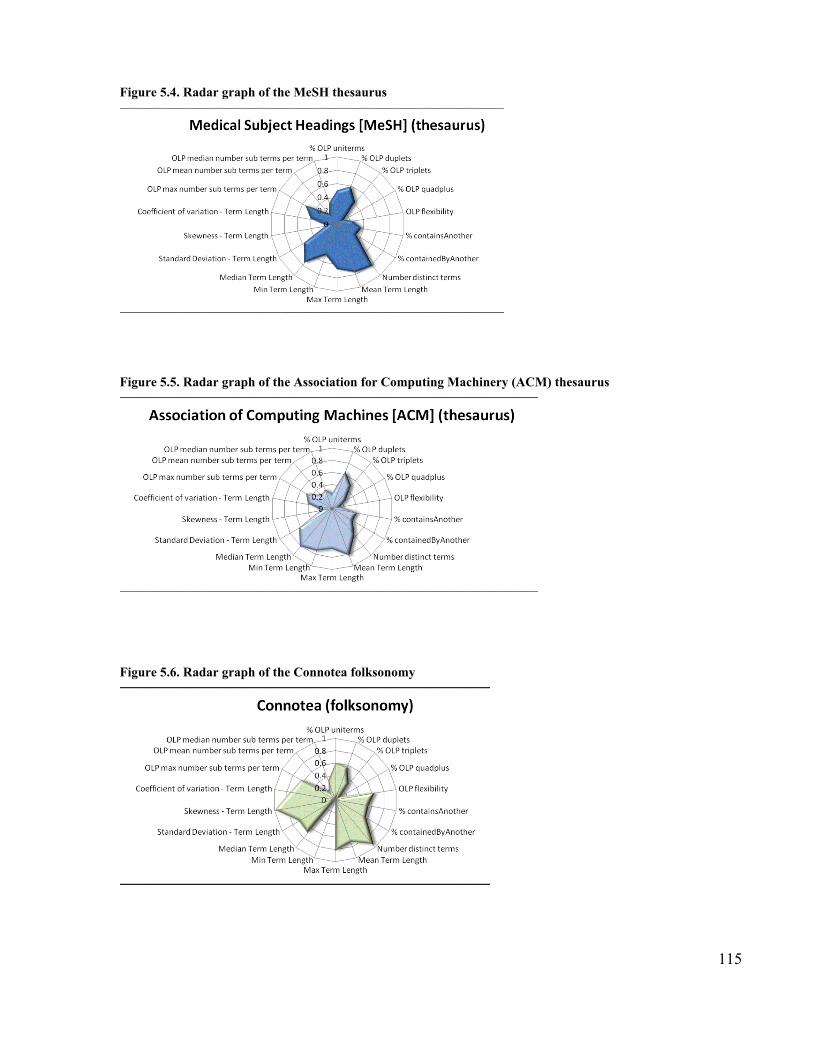
115
Figure 5.4. Radar graph of the MeSH thesaurus
Figure 5.5. Radar graph of the Association for Computing Machinery (ACM) thesaurus
Figure 5.6. Radar graph of the Connotea folksonomy

116
Figure 5.7. Radar graph of the Bibsonomy folksonomy
Figure 5.8. Radar graph of the CiteULike folksonomy

117
Figure 5.9. Radar graph of term-set from Gene Ontology Biological Process (GO_BP)
Figure 5.10. Radar graph of term-set from the Foundational Model of Anatomy (FMA)

118
Figure 5.11. All against all comparison using the F-measure
The white intensity of each cell (or anti-redness) is determined by the overlap (F-measure) of theterm-set indicated on the horizontal and vertical axes. The cells along the diagonal representself–against-self comparisons and thus are white – indicating exact overlap. The color key showsthe range of values (0-1) associated with the different colors.
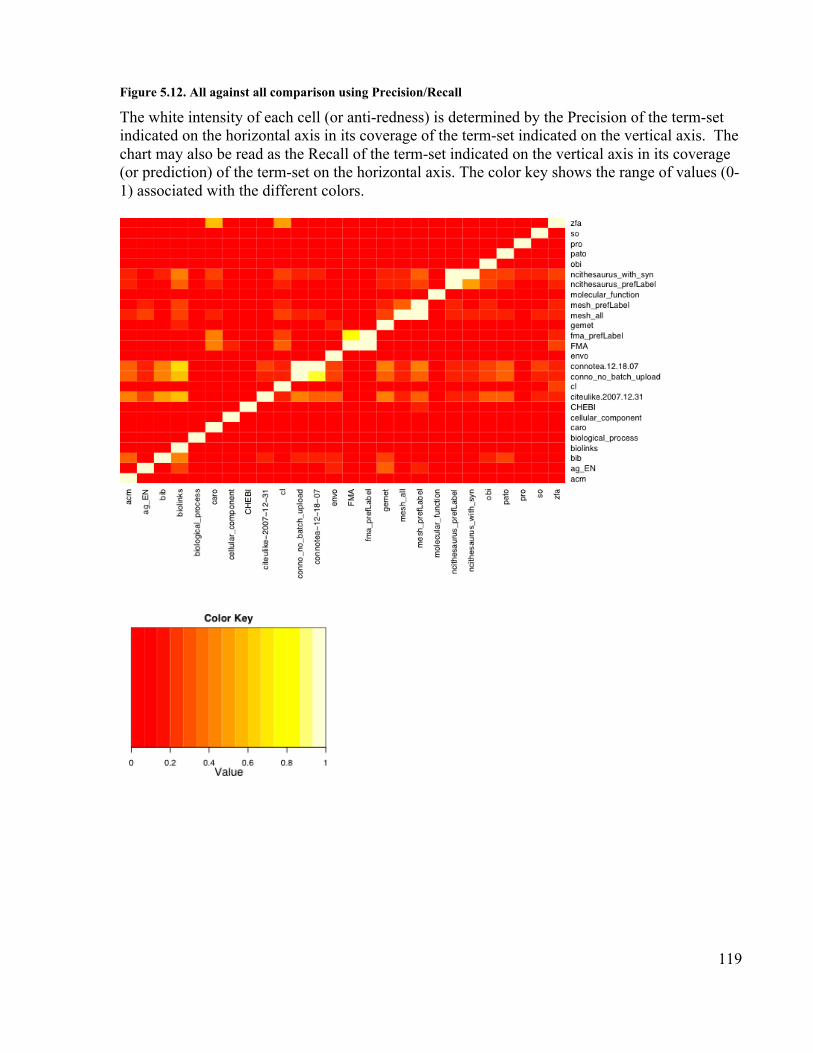
119
Figure 5.12. All against all comparison using Precision/Recall
The white intensity of each cell (or anti-redness) is determined by the Precision of the term-setindicated on the horizontal axis in its coverage of the term-set indicated on the vertical axis. Thechart may also be read as the Recall of the term-set indicated on the vertical axis in its coverage(or prediction) of the term-set on the horizontal axis. The color key shows the range of values (0-1) associated with the different colors.
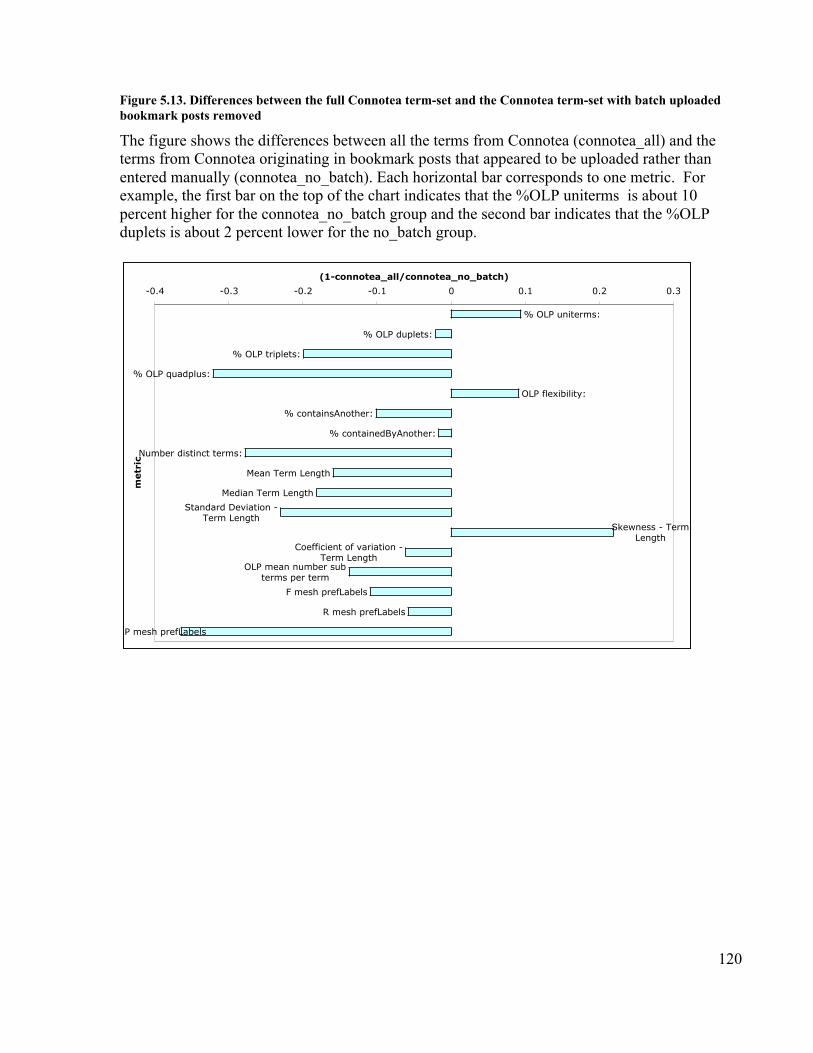
120
Figure 5.13. Differences between the full Connotea term-set and the Connotea term-set with batch uploadedbookmark posts removed
The figure shows the differences between all the terms from Connotea (connotea_all) and theterms from Connotea originating in bookmark posts that appeared to be uploaded rather thanentered manually (connotea_no_batch). Each horizontal bar corresponds to one metric. Forexample, the first bar on the top of the chart indicates that the %OLP uniterms is about 10percent higher for the connotea_no_batch group and the second bar indicates that the %OLPduplets is about 2 percent lower for the no_batch group.
% OLP uniterms:
% OLP duplets:
% OLP triplets:
% OLP quadplus:
OLP flexibility:
% containsAnother:
% containedByAnother:
Number distinct terms:
Mean Term Length
Median Term Length
Standard Deviation - Term Length
Skewness - Term Length
Coefficient of variation - Term Length
OLP mean number sub terms per term
F mesh prefLabels
R mesh prefLabels
P mesh prefLabels
-0.4 -0.3 -0.2 -0.1 0 0.1 0.2 0.3
metric
(1-connotea_all/connotea_no_batch)

121
References
1. Feinberg M: An Examination of Authority in Social Classification Systems. In:Proceedings 17th Workshop of the American Society for Information Science andTechnology Special Interest Group in Classification Research: January 01 2006; 2006.
2. Tennis JT: Social Tagging and the Next Steps for Indexing. In: 17th ASIS&T SIG/CRClassification Research Workshop: 2006; Austin, Texas; 2006.
3. Soergel D: The rise of ontologies or the reinvention of classification. Journal of TheAmerican Society for Information Science 1999, 50(12):1119-1120.
4. Del.icio.us [http://del.icio.us/]5. Al-Khalifa H, Davis H: Exploring The Value Of Folksonomies For Creating
Semantic Metadata. International Journal on Semantic Web and Information Systems2007, 3(1):13-39.
6. Morrison PJ: Tagging and searching: Search retrieval effectiveness of folksonomieson the World Wide Web. Information Processing and Management 2008, 4(4):1562-1579.
7. Zhang X: Concept integration of document databases using different indexinglanguages. Information Processing and Management 2006, 42(1):121-135.
8. The Basics of Medical Subject Headings (MeSH)[http://www.nlm.nih.gov/bsd/disted/mesh/index.html ]
9. Ashburner M, Ball CA, Blake JA, Botstein D, Butler H, Cherry JM, Davis AP, DolinskiK, Dwight SS, Eppig JT et al: Gene ontology: tool for the unification of biology. TheGene Ontology Consortium. Nature Genetics 2000, 25(1):25-29.
10. Lund B, Hammond T, Flack M, Hannay T: Social Bookmarking Tools (II): A CaseStudy - Connotea. D-Lib Magazine 2005, 11(4).
11. Bureau-Marcel-Van-Dijk: Definition of Thesauri Essential Characteristics. (studycarried out by G. Van Slype). In., vol. 2. Brussels; 1976.
12. International Organization for Standardization [http://www.iso.ch]13. Ogren PV, Cohen KB, Acquaah-Mensah GK, Eberlein J, Hunter L: The compositional
structure of Gene Ontology terms. In: Pacific Symposium on Biocomputing: xx xx2004; 2004: 214-225.
14. Soergel D: Indexing languages and thesauri: construction and maintenance. LosAngeles: Melville Pub. Co; 1974.
15. Witten IH, Frank W: Data Mining: Practical Machine Learning Tools with JavaImplementations: Morgan Kaufmann; 2000.
16. Hripcsak G, Rothschild AS: Agreement, the F-Measure, and Reliability inInformation Retrieval. Journal of the American Medical Informatics Association :JAMIA 2005, 12(3):296-298.
17. Tudhope D: A tentative typology of KOS: towards a KOS of KOS? In: The 5thEuropean NKOS Workshop: 2006; 2006.
18. Porter MF: An algorithm for suffix stripping. Program 1980, 14(3):130-137.19. Default English stopwords [http://www.ranks.nl/tools/stopwords.html]20. CiteULike: A free online service to organize your academic papers
[http://www.citeulike.org/ ]

122
21. Haendel MA, Neuhaus F, Osumi-Sutherland D, Mabee PM, Jr. JLVM, Mungall CJ,Smith B: CARO – The Common Anatomy Reference Ontology. In: AnatomyOntologies for Bioinformatics. Edited by Albert Burger DDaRB, vol. 6. London:Springer; 2008: 327-349.
22. Degtyarenko K, de Matos P, Ennis M, Hastings J, Zbinden M, McNaught A, Alcantara R,Darsow M, Guedj M, Ashburner M: ChEBI: a database and ontology for chemicalentities of biological interest. Nucleic Acids Res 2008, 36(Database issue):D344-350.
23. BibSonomy [http://www.bibsonomy.org/ ]24. Hotho A, Jäschke R, Schmitz C, Stumme G: BibSonomy: A Social Bookmark and
Publication Sharing System. In: Conceptual Structures Tool Interoperability Workshopat the 14th International Conference on Conceptual Structures: 2006; 2006.
25. Rosse C, Mejino JL: A reference ontology for bioinformatics: the foundational modelof anatomy. The Journal of Biomedical Informatics 2003, 36:478-500.
26. R development Core Team: R: A language and environment for statisticalcomputing. 2008.
27. Good BM, Tennis JT: Evidence of Term-Structure Differences among Folksonomiesand Controlled Indexing Languages. In: Annual Meeting of the American Society forfor Information Science and Technology: 2008; Columbus, OH, USA; 2008.
28. Sprague J, Bayraktaroglu L, Bradford Y, Conlin T, Dunn N, Fashena D, Frazer K,Haendel M, Howe DG, Knight J et al: The Zebrafish Information Network: thezebrafish model organism database provides expanded support for genotypes andphenotypes. Nucleic Acids Res 2008, 36(Database issue):D768-772.
29. Bard J, Rhee SY, Ashburner M: An ontology for cell types. Genome biology 2005,6(2):R21.
30. Food and Agriculture Organization of the United Nations [http://www.fao.org/]31. Sioutos N, de Coronado S, Haber MW, Hartel FW, Shaiu WL, Wright LW: NCI
Thesaurus: a semantic model integrating cancer-related clinical and molecularinformation. J Biomed Inform 2007, 40(1):30-43.
32. Tennis JT, Jacob EK: Toward a Theory of Structure in Information OrganizationFrameworks. In: International Society for Knowledge Organization (ISKO) Conference:2008; Montreal, Canada; 2008.
33. Rethinking How We Provide Bibliographic Services for the University of California[http://libraries.universityofcalifornia.edu/sopag/BSTF/Final.pdf]
34. Good BM, Kawas EA, Kuo BY, Wilkinson MD: iHOPerator: User-scripting apersonalized bioinformatics Web, starting with the iHOP website. BMCBioinformatics 2006, 7:534.
35. Willighagen E, O'Boyle N, Gopalakrishnan H, Jiao D, Guha R, Steinbeck C, Wild D:Userscripts for the Life Sciences. BMC Bioinformatics 2007, 8(1):487.
36. Dellschaft K, Staab S: On how to perform a gold standard based evaluation ofontology learning. In: International Semantic Web Conference: 2006: Springer; 2006:228-241.
37. Beghtol C: Semantic validity: Concepts of warrant in bibliographic classificationsystems. Library Resources & Technical Services 1986, 30(2):109-125.

123
6 Social tagging in the life sciences: characterizing a new metadata resource8
6.1 Background
As the volume of data in various forms continues to expand at rapid rates in the life sciences and
elsewhere, it is increasingly important to find mechanisms to generate high quality metadata
rapidly and inexpensively. This indexing information – the subjects assigned to documents, the
functions annotated for proteins, the characteristics identified in images, etc. – is what enables
effective search and integration to succeed at large scales over varying document types.
Current practices for generating metadata within the life sciences, though varying across
initiatives and often augmented by automated techniques, generally follow a process closely
resembling that long employed by practitioners in the library and information sciences [1, 2].
First, semantic structures, such as thesauri and ontologies, are created by teams of life scientists
working in cooperation with experts in knowledge representation or by individuals with expertise
in both areas. Next, annotation pipelines are created whereby professional annotators utilize the
relevant semantic structures to describe the entities in their domain. Those annotations are then
stored in a database that is made available to the public via websites and sometimes Web
services. As time goes on, the semantic structures and the annotations are updated based on
feedback from the community and from the annotators themselves.
This process yields useful results, but it is intensive in its utilization of an inherently limited
supply of professional annotators. As the technology to produce new information and the
capacity to derive new knowledge from that information increases, so to must the capacity for
metadata provision. Technologies that support this process by partially automating it, such as
workflows for genome annotation [3] and natural language indexing systems [4-6], provide
important help in this regard, but manual review of automated predictions remains critical in
most domains [7, 8]. There is clearly a need for an increase in the number of human annotators
that parallels the increase in the amount of data.
8 A version of this chapter will be submitted for publication. Good BM, Tennis JT, Wilkinson MD: Social tagging inthe life sciences: characterizing a new metadata resource

124
As the life sciences are not alone with respect to the recent introduction of large volumes of
relatively unstructured, but very valuable information, we may seek solutions to our metadata
generation problems in other domains. The World Wide Web is likely the largest and least well-
structured repository of information on the planet and thus provides an ideal space to observe
different approaches to the annotation problem. Of the many recent developments in the
evolution of the Web, one that is clearly relevant is the emergence of social tagging.
Social tagging systems let their users organize personal resource collections with tags. The kinds
of resources contained within them are essentially unlimited, with popular examples including
Web bookmarks [9], images [10], and even personal goals [11]. These resource collections are
made available to the social network of their creators and often to the general public. The tags
used to organize the collections are created by the owner of the collection (the tagger) and can
serve a variety of purposes [12]. The act of adding a resource to a social tagging collection is
referred to as a 'tagging event' or simply as a ‘post’ (as in “to post a bookmark”). Tagging events
are composed of a tagger, a thing tagged, a collection of applied tags, and a variety of other
factors that define the context of the event (time, type of resource tagged, software used, personal
purpose, etc.). Figure 6.1 illustrates the information captured in a record of a typical tagging
event in which JaneTagger tags an image retrieved from Wikipedia with the tags ‘hippocampus’,
‘image’, ‘mri’, and ‘wikipedia’. Academic social tagging systems, such as Connotea,
Bibsonomy and CiteULike, extend this basic functionality with the ability to identify and store
bibliographic information associated with scientific articles [13-16].
The tagline of Connotea, a prominent example in the academic domain, is “Organize, Share,
Discover”. Social tagging services help their users accomplish each of these purposes in relation
to scientific resources. Tags can be used to organize personal collections in a flexible, location
independent manner. The online nature of these services allows users to easily share these
collections with others – either within their circle of associates or with the general public.
Through the public sharing of these annotated references, it is possible for users to discover other
users with similar interests and references they may not otherwise have come across. These last
two aspects, sharing and discovery, are perhaps the newest and ‘warmest’ [17] features of these
systems and are the features most often touted by their proponents; however, the simple personal

125
information management needs satisfied by these systems likely provide the most powerful
incentives for their continued use [18].
As a side-effect of providing these individual benefits while hosting data in public, social tagging
services have the capacity to rapidly and inexpensively produce large concentrations of publicly
accessible, user-generated metadata. Based on the growing need for metadata in the life
sciences, it is natural to wonder how these emerging resources might be useful in scientifically
relevant settings. Might they somehow be used to extend traditional mechanisms for metadata
provision and thus enable the generation of better applications for finding and interacting with
scientific information?
In this investigation, we consider socially generated tags from the perspective of their potential
to function as subject descriptors in the context of search and retrieval applications. That is, can
tags linked to scientific documents help retrieval in a similar manner to index terms generated
via other processes? There may be many other possible applications of this data, but the
ubiquitous importance of search and the availability of many comparable, better understood
frameworks for supporting this activity makes it an appropriate place to begin.
One way to address this kind of question is through direct studies of the relevance of search
results produced using different systems. For example, Morrison (2008) applied this method in
the context of general purpose Web search [19]. He found that searches conducted using broadly
scoped social tagging services such as Del.icio.us [9] can produce results that are competitive
with full Web search engines, such as Google, and manually created Web directories, such as the
Yahoo directory [20]. In addition, he found that the most relevant search results overall could be
obtained by combining results from social tagging services with results from the search engines.
Another way to address this kind of question is through direct inspection of the indexes upon
which searches are conducted. Though Morrison’s study is suggestive of the potential value of
socially generated metadata in the context of search, it does little to answer questions of why it is
useful or how it might be improved because it does not distinguish between the contributions of
the underlying tagging data and the algorithms applied to search that data and rank the results.
To complement this kind of ‘black-box’ study of search retrieval effectiveness, it is important to

126
open up the box and consider the indexes upon which the searches are conducted. What do the
tags look like? How many are there? How do they vary from the terms that might be assigned
by other indexing processes? By answering such questions we can begin to understand how best
to make use of socially generated metadata in the context of applications that blend it with other
metadata sources, such as the integrated social search engines suggested by Morrison’s study that
are even now starting to appear (for example, worio.com [21]).
Here, we provide a characterization of the current products of social tagging in biomedical,
academic contexts through a direct, empirical assessment of the tags used to describe references
in PubMed by users of Connotea and CiteULike. We measure the coverage of the document
space, the number of tags assigned per document, the rates of agreement between different
taggers, and the relationship between tags and the MeSH descriptors associated with the same
documents. The measurements of agreement are conducted at multiple semantic levels using
tools from the Unified Medical Language System (UMLS) [22]. Through these investigations
we offer a quantitative snapshot of the metadata currently emerging from social tagging
applications within the life sciences. This snapshot illustrates the current state of these resources
– offering both a view into their potential and an empirical point of comparison to refer to as they
evolve over time.
6.2 Results
6.2.1 Resource Coverage
In the life science domain, the total number of items described by social tagging systems is
currently tiny in comparison to the number of resources described by institutions. To illustrate,
the MEDLINE bibliographic database contains over 16 million citations [23] while, as of
November 9, 2008, CiteULike, the largest of the academic social tagging services, contained
references to only about 203,314 of these documents. However, academic social tagging
systems are still in their infancy and thus the most interesting aspect is not their current state but
their future potential.

127
On November 10, 2008, Connotea reported more than 60,000 registered users (Ian Mulvaney,
personal communication) and it is likely that CiteULike has even more. Given such large
numbers of potential contributors, it seems possible that the resource coverage observed for
academic social tagging services might eventually meet or surpass that of fundamentally
resource-constrained institutional mechanisms. In 2007, the NLM (National Library of
Medicine) reported that it indexed 670,943 citations for the MEDLINE database which equates,
on average , to about 56,000 citations per month [23]. To estimate if social tagging services
might someday reach the same level of throughput as the NLM indexing service, we compared
the rates of growth, per month, for MEDLINE and for CiteULike on the number of distinct
PubMed citations indexed over the last several years and used this data to make some predictions
of future trends.
Figure 6.2 plots the numbers of new PubMed citations described by users of CiteULike and by
MEDLINE indexers each month and a rough extrapolation of the observed trends several years
into the future. The upper line, describing the PubMed/MEDLINE expansion, provides a clear
indication of the steadily increasing rate of information and knowledge pouring forth from and
for life scientists. The lower line describes the increasingly rapid growth of socially generated,
biomedically relevant metadata accumulating in the CiteULike database. If both of the observed
trends continue, CiteULike coverage per month would catch up with MEDLINE around the year
2016 - at which point both systems would be describing approximately 74,000 new biomedical
citations per month; however, as the rapidly expanding confidence intervals illustrate, there is
insufficient data to provide strong evidence for the precise point of intersection or even that
CiteULike will continue to grow. It is entirely possible that social tagging systems could either
fade away or that they will expand even more rapidly than they currently are. That being said,
the latter potentiality seems to be the more likely. Based on the trends suggested in current data
and the continuing popularity of social tagging in other domains, it seems plausible that
CiteULike and other scientifically oriented social tagging services will continue to expand in
their coverage of the life sciences. Since, as we will see, social tagging data presents substantial
differences from previous forms, it is important that we begin now to understand these
differences so that we can make the best use of the information as it comes available.

128
6.2.2 Density
Density refers simply to the number of metadata terms associated with each resource described.
Though providing no direct evidence of the quality of the metadata, it helps to form a descriptive
picture of the contents of metadata repositories that can serve as a starting point for exploratory
comparative analyses. To gain insight into the relative density of tags used to describe citations
in academic social tagging services, we conducted a comparison of the number of distinct tags
per PubMed citation for a set of 19,118 citations described by both Connotea and CiteULike.
This set represents the complete intersection of 203,314 PubMed citations identified in the
CiteULike data and 106,828 PubMed citations found in Connotea.
Table 1 provides an assessment of the density of distinct tags used to describe these citations by
individual users and by the aggregate of all users of the system. These numbers are contrasted
with the average numbers of MeSH subject descriptors (both major and minor subject headings
were included) used to index the same set of documents. Only the MeSH descriptors are
reported (ignoring large amounts of additional subject-related metadata such as descriptor
modifiers, supplementary concept records, and links to other databases such as NCBI Gene [24]).
In terms of tags per post, the users of CiteULike and Connotea were very similar. As Table 1
indicates, the mean number of tags added per biomedical document by individual users was 3.02
for Connotea and 2.51 for CiteULike, with a median of 2 tags/document for both systems. These
figures are consistent with tagging behaviour observed throughout both systems and with earlier
findings on a smaller sample from CiteULike which indicated that users typically employ 1-3
tags per resource [25, 26]. On independent samples of 500,000 posts (tagging events) for both
CiteULike and for Connotea, including posts on a wide variety of subjects, the medians for both
systems were again 2 tags/document and the means were 2.39 tags/document for CiteULike and
3.36 for Connotea. The difference in means is driven, to some extent, by the fact that CiteULike
allows users to post bookmarks to their collections without adding any tags while Connotea
requires a minimum of one tag per post. Other factors that could influence observed differences
are that the user populations for the two systems are not identical nor are the interfaces used to
author the tags. In fact, given the many potential differences, the observed similarity in tagging
behaviour across the two systems is striking.

129
As more individuals tag any given document, more distinct tags are assigned to it. After
aggregating all of the tags added to each of the citations in the sample by all of the different users
to tag each citation, the mean number of distinct tags/citation for Connotea was 4.15 and the
mean number for CiteULike was 5.10. This difference is a reflection of the larger number of
posts describing the citations under consideration by the CiteULike service. In total, 45,525
CiteULike tagging events produced tags for the citations under consideration while data from
just 28,236 Connotea tagging events were considered.
Overall, the subject descriptors from MEDLINE exhibited a much higher density, at a mean of
11.58 and median of 11 descriptors per citation, than the social tagging systems as well as a
lower coefficient of variation across citations. Figures 6.3a-c plot the distribution of tag densities
for Connotea, CiteULike, and MEDLINE respectively. From these figures we can see that even
after aggregating the tags produced by all of the users, most of the citations in the social tagging
systems are described with only a few tags. Note that the first bar in the charts shows the
fraction of citations with zero tags (none for Connotea).
One of the reasons for the low numbers of tags/citation, even in the aggregate sets, is that most
citations are tagged by just one person, though a few are tagged by very many. To illustrate,
Figures 6.4a-d plot the number of citations versus the number of users to post each citation in the
Connotea-CiteULike-MEDLINE intersection. Figures 6.4a and 6.4b show the data from
Connotea on both a linear (Figure 6.4a) and logarithmic scale (Figure 6.4b) and Figures 6.4c and
6.4d show the equivalent data from CiteULike. The plots clearly indicate exponential
relationships between the number of resources and the number of times each resource is tagged
that are consistent with previous studies of the structure of collaborative tagging systems [12].
As with resource coverage, current levels of tag density are indicative, but the rates of change
provide more important insights regarding the potential of these young systems. Figures 6.5a and
6.5b plot the increase in distinct tags/citation as more Connotea (Figure 6.5a) and CiteULike
(Figure 6.5b) users tag PubMed citations. These figures suggest that in order to reach the same
density of distinct tags per resource as MeSH descriptors per resource produced by MEDLINE
(median 11), roughly 5 to 7 social taggers would need to tag each citation. Since, at any given
time it appears that the vast majority of citations will be described by just one person, as
130
indicated in Figure 6.4, the data suggests that the density of socially generated tags used to
describe academic documents in the life sciences will remain substantially lower than the density
of institutionally created subject descriptors. This prediction is, of course, dependent on current
parameters used for the implementations of academic social tagging systems. As interfaces for
adding tags change, the density of tags per post as well as the level of agreement between the
different taggers regarding tag assignments may change.
6.2.3 Inter-annotator agreement
Measures of inter-annotator agreement quantify the level of consensus regarding annotations
created by multiple annotators. Where consensus is assumed to indicate quality or correctness, it
is used as measure of quality. The higher the agreement between multiple annotators, the higher
the perceived confidence in the annotations.
In a social tagging scenario, agreement regarding the tags assigned to particular resources can
serve as a rough estimate of the quality of those tags from the perspective of their likelihood to
be useful to people other than their authors. When the same tag is used by multiple people to
describe the same thing, it is more likely to directly pertain to the important characteristics of the
item tagged (e.g. ‘VEGF’ or ‘solid organ transplantation’) than to be of a personal or erroneous
nature (e.g. ‘BIOLS_101’, ‘todo’, or ‘**’). Rates of inter-annotator agreement can thus be used
as an approximation of the quality of tag assignments from the community perspective. Note
that, as [27] discusses, there may be interesting, community-level uses for other kinds of tags,
such as those bearing emotional content. For example, tags like ‘cool’ or ‘important’ may be
useful in the formation of recommendation systems as implicit positive ratings of content.
However, the focus of the present study is on the detection and assessment of tags from the
perspective of subject-based indexing. Note also that, as discussed in greater detail below, the
small numbers of tags per document in the systems under consideration here bring into question
the relationship between consensus and quality.
To gauge levels of inter-annotator agreement, we calculate the average level of positive specific
agreement (PSA) regarding tag assignments between different users [28]. PSA is a measure of
the degree of overlap between two sets – for example, the sets of tags used to describe the same

131
document by two different people. It ranges from 0, indicating no overlap, to 1, indicating
complete overlap. (See the Methods section for a complete description.) For this study, we
measured PSA for tag assignments at five different levels of granularity: string, standardized
string, UMLS concept, UMLS semantic type, and UMLS semantic group. At the first level, PSA
is a measurement of the average likelihood that two people will tag a document with exactly the
same string of characters. At the next level, we measure the likelihood that two people will tag
the same resource with strings of characters that, after syntactic standardization (described in the
Methods section), are again exactly the same. Moving up to the level of concepts, we assess the
chances that pairs of people will use tags that a) can be mapped automatically to concept
definitions in the UMLS and b) map to the same concepts. (Note that not all of the tags in the
sample were successfully mapped to UMLS concepts; only tagging events where at least one
UMLS concept was identified were considered for the concept, type, and group level
comparisons.) At the level of semantic types, we are measuring the degree to which pairs of
taggers are using the same basic kinds of concepts where these kinds are each one of the 135
semantic types that compose the nodes of the UMLS semantic network [22, 29]. At the
uppermost level, we again measure the agreement regarding the kinds of tags used, but here,
these kinds are drawn from just 15 top-level semantic groups designed to provide a coarse-
grained division of all of the concepts in the UMLS [30]. Table 2 provides examples from each
of these levels.
Table 3 captures the average levels of PSA observed for CiteULike and Connotea users on
taggings of PubMed citations. It shows that average PSA among CiteULike taggers ranged from
a minimum of 0.11 at the level of the String to a maximum of 0.52 at the level of the Semantic
Group with Connotea users following a very similar trajectory. Table 3 also again illustrates the
low numbers of tags per post in the social tagging data and the even lower number of UMLS
Concepts that could be confidently associated with the tags. The majority of the posts from both
social tagging services contained no tags that could be linked to UMLS concepts. For those
posts for which at least one Concept was identified, means of just 1.39 UMLS Concepts per post
were identified in CiteULike and 1.86 in Connotea.
One interpretation of the low levels of agreement is that some users are providing incorrect
descriptions of the citations. Another interpretation is that there are many concepts that could be

132
used to correctly describe each citation and that different users identified different, yet equally
valid, concepts. Given the complex nature of scientific documents and the low number of
concepts identified per post, the second interpretation is tempting. Perhaps the different social
taggers provide different, but generally valid views on the concepts of importance for the
description of these documents. If that is the case, then, for items tagged by many different
people, the aggregation of the many different views would provide a conceptually multi-faceted,
generally correct description of each tagged item. Furthermore, in cases where conceptual
overlap does occur, strength is potentially added to the assertion of the correctness of the
overlapping concepts.
To test both of these assumptions, some way of measuring ‘correctness’ regarding tag
assignments is required. In the next several sections, we offer comparisons between socially
generated tags and the MeSH subject descriptors used to describe the same documents. Where
MeSH annotation is considered to be correct, the provided levels of agreement can be taken as
estimates of tag quality; however, as will be shown in the anecdote that concludes the results
section and addressed further in the Discussion section, MeSH indexing is not and could not be
exhaustive in identifying relevant concepts nor perfect in assigning descriptors within the limits
of its controlled vocabulary. There are likely many tags that are relevant to the subject matter of
the documents they are linked to yet do not appear in the MeSH indexing; agreement with MeSH
indexing can not be taken as an absolute measure of quality – it is merely one of many potential
indicators.
6.2.4 Agreement with MeSH indexing
As both another approach to quality assessment and a means to precisely gauge the relationship
between socially generated and professionally generated metadata in this context, we compared
the tags added to PubMed citations to the MeSH descriptors added to the same documents. For
these comparisons, we again used PSA, but in addition, we report the precision and the recall of
the tags generated by the social tagging services with respect to the MeSH descriptors. (For
readers familiar with machine learning or information retrieval studies, in cases such as this
where one set is considered to contain true positives while the other is considered to contain

133
predicted positives, PSA is equivalent to the F measure - the harmonic mean of precision and
recall.)
For each of the PubMed citations in both CiteULike and Connotea, we assessed a) the PSA, b)
the precision, and c) the recall for tag assignments in comparison to MeSH terms at the same five
semantic levels used for measuring inter-annotator agreement. For each PubMed citation
investigated, we compared the aggregate of all the distinct tags added by users of the social
tagging service in question to describe that citation with its MeSH descriptors. Table 4 provides
the results for both systems at each level. It shows how the degree of agreement with MeSH
indexing increases as the semantic granularity at which the comparisons are made widens. As
should be expected based on the much lower numbers of UMLS Concepts associated with the
social tagging events, the recall is much lower than precision at each level.
Focusing specifically on precision, we see that approximately 80% of the concepts that could be
identified in both social tagging data sets fell into UMLS Semantic Groups represented by
Concepts linked to the MeSH descriptors for the same resources. At the level of the Semantic
Types, 59% and 56% of the kinds of concepts identified in the Connotea and CiteULike tags
respectively, were found in the MeSH annotations. Finally, at the level of UMLS Concepts, just
30% and 20% of the concepts identified in the Connotea and CiteULike tags matched Concepts
from the MeSH annotations.
6.2.5 Improving agreement with MeSH through voting
The data in Table 4 represents the conceptual relationships between MeSH indexing and the
complete, unfiltered collection of tagging events in CiteULike and Connotea. In certain
applications, it may be beneficial to identify tag assignments likely to bear a greater similarity to
a standard like this – for example, to filter out spam or to rank search result lists. One method
for generating such information in situations where many different opinions are present is voting.
Assuming that there is a greater tendency for tag assignments to agree with the standard than to
disagree – where multiple tag assignments for a particular document are present – then the more
times a tag is used to describe a particular document the more likely that tag is to match the
standard.

134
To test this assumption in this context, we investigated the effect of voting on the precision of the
concepts linked to tags in the CiteULike system with respect to MeSH indexing. (Once again
Connotea was very similar to CiteULike.) Figure 6.6 illustrates the improvements in precision
gained with the requirement of a minimum of 1 through 5 ‘votes’ for each Concept, Semantic
Type, or Semantic Group assignment. As the minimum number of required votes increases from
1 to 4, precision increases in each category. At a minimum of 5 votes, the precision of semantic
types and semantic groups continues to increase, but the precision of individual concepts drops
slightly from 0.335 to 0.332. We did not measure beyond five votes because, as the minimum
number of required votes per tag increases, the number of documents with any tags drops
precipitously. For documents with no tags, no measurements of agreement can be made. Figure
6.7 illustrates the decrease in citation coverage associated with increasing minimum numbers of
votes per tag assignment. Requiring just two votes per tag eliminates nearly 80% of the citations
in the CiteULike collection. By 5 votes, only 1.7% of the citations in the dataset can be
considered. This reiterates the phenomenon illustrated in Figure 6.4 – at present, most PubMed
citations within academic social tagging systems are only tagged by one or a few people.
6.2.6 An anecdotal example where many tags are present
Though the bulk of the socially generated metadata investigated above is sparse – with most
items receiving just a few tags from a few people – it is illuminating to investigate the properties
of this kind of metadata when larger amounts are available both because it makes it easier to
visualize the complex nature of the data and because it suggests potential future applications.
Aside from enabling voting processes that may increase confidence in certain tag assignments,
increasing numbers of tags also provide additional views on documents that may be used in
many other ways. Here, we show a demonstrative, though anecdotal example where several
different users tagged a particular document and use it to show some important aspects of
socially generated metadata – particularly in contrast to other forms of indexing.
Figure 6.8 illustrates the tags generated by users of Connotea and CiteULike to describe an
article that appeared in Science in June of 2008 [31]. In the figure, the different tags are sized
based on their frequency and divided into three differently coloured classes: ‘personal’, ‘non-
MeSH’, and ‘MeSH Overlap’. The MeSH descriptors for the document are also provided. The

135
figure shows a number of important characteristics of social tagging given current
implementations. There are personal tags like ‘kristina’ and ‘bob’ but the majority of the tags
are topical – like ‘neuro-computation’. There are spelling errors and simple phrasing differences
in the tags; for example, ‘astroctyes, ‘astrocytes’, ‘Astrocytes’, and ‘astrocyte’ are all present
(highlighting some of the difficulties in mapping tag strings to concepts). The more frequently
used tags (‘astrocytes’, ‘vision’, ‘methods’) are all of some relevance to the article (entitled
“Tuned responses of astrocytes and their influence on hemodynamic signals in the visual
cortex”). There is some overlap with MeSH indexing but many of the tags – such as ‘receptive-
field’, ‘V1’, and ‘neurovascular-coupling’ – that do not match directly with MeSH descriptors
also appear to be relevant to the article.
In some cases, the tags added by the users of the social tagging systems are more precise than the
terms used by the MeSH indexers. For example, the main experimental method used in the
article was two-photon microscopy – a tag used by two different social taggers (with the strings
‘two-photon’ and ‘twophoton’). The MeSH term used to describe the method in the manuscript
is ‘Microscopy, Confocal’.
Within the MeSH hierarchy, two-photon microscopy is most precisely described by the MeSH
heading ‘Microscopy, Fluorescence, Multiphoton’ which is narrower than ‘Microscopy,
Fluorescence’ and not directly linked to ‘Microscopy, Confocal’; hence it appears that the social
taggers exposed a minor error in the MeSH annotation. In other cases, the social taggers chose
more general categories – for example, ‘hemodynamics’ in place of the more specific ‘blood
volume’.
In another case, a social tagger used a tag that seems potentially relevant at a high level but does
not describe topics present in the article. A Connotea user used the term ‘BOLD’, which is an
acronym for Blood-Oxygen-Level-Dependent fMRI. The fMRI technique was not used or
discussed within the article yet it is an important method that might be used in similar studies of
brain activity.
Broadly speaking, the tags in Figure 6.8 show two important aspects of socially generated
metadata: diversity and emergent consensus formation. As increasing numbers of tags are

136
generated for a particular item, some tags are used repeatedly and these tend to be topically
relevant; for this article, we see ‘astrocytes’ and ‘vision’ emerging as dominant descriptors. In
addition to this emergent consensus formation (which might be encouraged through interface
design choices) other tags representing diverse user backgrounds and objectives also arise such
as ‘hemodynamic’. ‘neuroplasticity’, ‘two-photon’, and ‘WOW’. In considering applications of
such metadata – for example, in the context of search – both phenomenon have important
consequences. Precision of search might be enhanced by focusing query algorithms on high-
consensus tag assignments or by enabling Boolean combinations of many different tags. Recall
may be increased by incorporating the tags with lower levels of consensus.
While we assert that this anecdote is demonstrative, a sample of one is obviously not
authoritative. It is offered simply to expose common traits observed in the data where many tags
have been posted for a particular resource.
6.3 Discussion
The continuous increase in the volume of data present in the life sciences and elsewhere,
illustrated clearly in Figure 6.2 by the growth of PubMed, renders processes that produce value-
enhancing metadata increasingly important. It has been suggested by a number of sources that
social tagging services might generate useful metadata, functioning as an effective intermediate
between typically inexpensive, but low precision automated methods and expensive professional
indexing involving controlled vocabularies [14, 25, 26, 32]. Evidence in favour of this claim
comes from reported improvements in the relevance of Web search results gained by integrating
information from social tagging data into the retrieval process [19]. When viewed through the
anecdotal lens of Figure 6.8, the potential value of this metadata is apparent; however, the results
presented here suggest that much of this potential is as yet unavailable in the context of the life
sciences. This is primarily because the coverage of the domain is still very narrow and the
number of tags used to describe most of the documents is generally very low.
Aside from gross measures of the quantity of documents and tags in these systems, we made an
attempt to measure the reliability of socially generated metadata through measures of inter-
annotator agreement and agreement with a standard – in this case MeSH indexing. However, the

137
extremely small numbers of tags available for most documents and the extremely large numbers
of potentially relevant tags cast doubt over the utility of these metrics to predict annotation
quality in this context. When individuals generally use around two tags per document and there
are many more potentially relevant tags, it is possible that even if all of the taggers used ‘high
quality’ tags, the measures of inter-annotator agreement would remain very low. In the same
manner, MeSH indexing can only cover a subset of potentially relevant concepts in any given
article – many ‘good’ tags will likely not match with MeSH indexing. With these difficulties in
mind in reference to mapping agreement to ‘quality’, the measures of agreement applied here do
have value as automatic, reproducible ways to quantify levels of consensus. These measures are
likely most useful as a point of comparison between different implementations of tagging
systems that operate in the same context. For example, if Connotea desired to increase
agreement between users regarding tag assignments – for example, by implementing a tag
suggestion feature that displayed other user’s tags – the measures of inter-annotator agreement
would serve as a good benchmark of success for meeting that objective. Note that system
designers may not always want to increase agreement. Instead, they may prefer to increase the
diversity of captured opinions, in which case inter-annotator agreement would ideally be low.
The same could be said for agreement with MeSH or any other standard. Where the standard is
available for comparison, the tags that match it are of little value because they are redundant.
Regardless of how socially generated metadata is to be applied or its quality measured, one key
to its future value is through volume. If metadata from social tagging services is to be useful,
more documents need to be tagged and more tags need to be assigned per document. These
objectives can be approached by both expanding the number of users of these systems and
improving the interfaces that they interact with.
The numbers of users of current social tagging services are increasing and it is likely that the
owners of these services are working on methods to increase participation. Aside from waiting
for these private enterprises to advance, the bioinformatics community might consider the
construction of a not-for-profit, life-science focused social annotation and collaboration platform.
If, for example, the National Institute for Biotechnology (NCBI) created a social tagging service
that was directly incorporated into PubMed, it seems likely that it might attract a far larger
number of participants from the life sciences than other, more general purpose projects. In

138
addition, such a life-science-focused tagging service could provide a better user interface
because it could be tailored specifically to support biomedical researchers. Looking forward, the
increasing volume of contributors to social tagging services (either newly formed or continuing
applications) should help to increase resource coverage and, to some extent, tag density, yet both
the rich-get-richer nature of citation and the limited actual size of the various sub-communities of
science will likely continue to result in skewed numbers of posts per resource. To make
effective use of tagging data from social tagging applications in science, the metadata generated
by individual users needs to be improved in terms of density and relevance because, in most
cases, the number of users to tag any particular item will be extremely low.
It has already been shown that careful interface and interaction design can be used to guide
individual users towards tagging behaviours that produce more useful metadata at the collective
level [33, 34]. Future efforts will help to provide a better understanding of this process,
illuminating methods for guiding user contributions in particular directions, e.g. towards the use
of larger numbers of more topical tags, without reducing the individual benefits of using these
systems that provide the primary incentive for participation. Key among ongoing efforts of this
kind, within the general context of social bookmarking on the Web, are new systems that
incorporate controlled vocabularies into the tagging process by either simply letting users tag
with controlled terms [35, 36] or automatically extracting relevant keywords from text associated
with the documents and then suggesting the extracted concepts as potential tag candidates [37].
By providing the well-known benefits of vocabulary control, including effective recognition and
utilization of relationships such as synonymy and hyponymy between indexing terms and by
gently pressing users towards more convergent vocabulary choices and fewer simple spelling
errors, such systems seem likely to produce metadata that, from the collective sense, would
improve substantially on that analyzed here. In preliminary investigations of such ‘semantic
social tagging’ applications - including Faviki [36], the Entity Describer [38, 39], and ZigTag
[35] – the degrees of inter-tagger agreement do appear higher than for the free-text interfaces
however the number of tags per document remains about the same (data not shown). Systems
that aid the user in selecting tags – for example, by mining them from relevant text – may aid in
the expansion of the number of tags added per document.

139
In addition to recruiting more users and producing interfaces that guide them towards more
individually and collectively useful tagging behaviours, additional work is needed to better
understand other aspects of the metadata from social tagging systems that are both important and
completely distinct from previous forms of indexing. For example, one of the fundamental
differences between socially generated and institutionally generated indexes is the availability of
authorship information in the social data [40]. It is generally not possible to identify the person
responsible for creating the MeSH indexing for a particular PubMed citation, but (with the
exception of certain variants of tagging systems that do not record authorship nor allow multiple
people to add tags to the same resource such as early releases of Flickr [10]) it is possible to
identify the creator of a public post in a social tagging system. This opens up whole new
opportunities for finding information online whose consequences are little understood. For
example, it is now possible for users to search based on other users e.g. searching for items in
Connotea that have been tagged by ‘mwilkinson’ [41] or ‘bgood’ [42]. In addition to this simple
yet novel pattern of information interaction, research is already being conducted into ways to
incorporate user-related data into keyword-based retrieval algorithms [43]. It may turn out that
the primary benefit of social tagging data might not be found in the relationships between tags
and documents as explored here but instead in the information linking documents and tags to
users and users to each other.
6.4 Conclusions
Academic social tagging systems provide scientists with fundamentally new contexts for
collaboratively describing, finding, and integrating scientific information. In contrast to earlier
forms of personal information management, the public nature and open APIs characteristic of
social tagging services make the records of these important scientific activities accessible to the
community. These new metadata repositories provide a novel resource for system developers
who wish to improve the way scientists interact with information.
Based on the results presented above, it is clear that the information accumulating in the
metadata repositories generated through social tagging offers substantial differences from other
kinds of metadata often used in the process of information retrieval. In particular, both the
number of documents described by these systems in the context of the life sciences and the
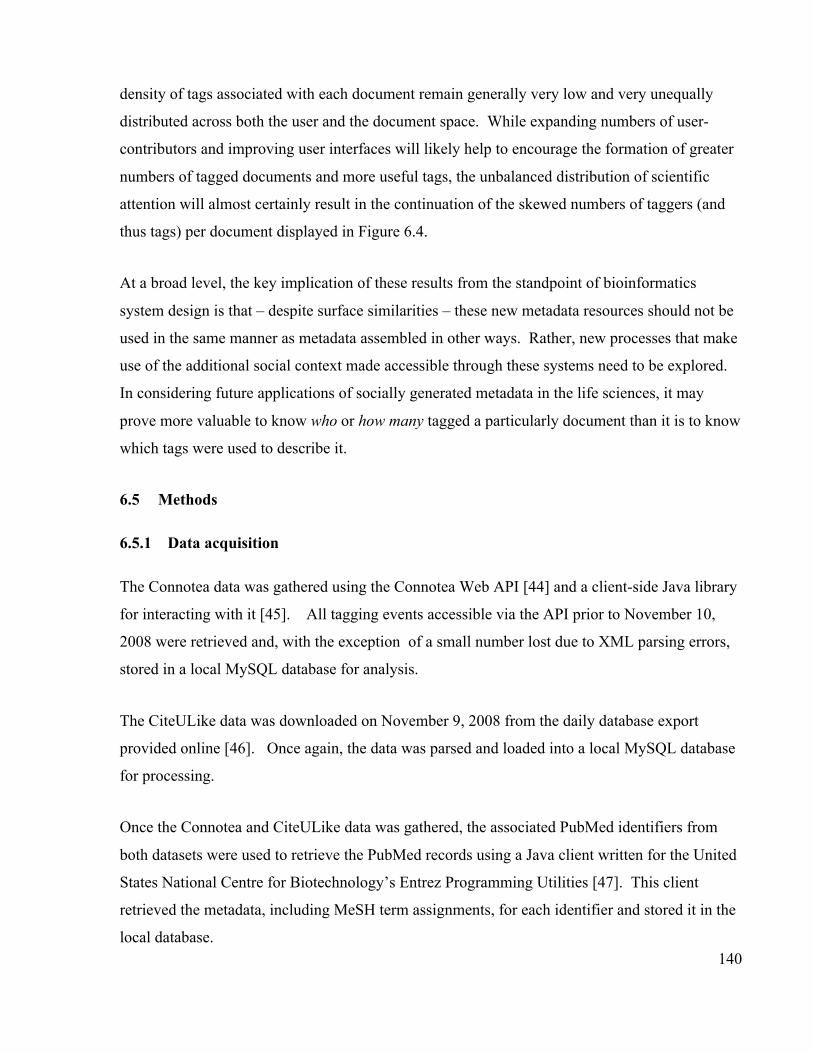
140
density of tags associated with each document remain generally very low and very unequally
distributed across both the user and the document space. While expanding numbers of user-
contributors and improving user interfaces will likely help to encourage the formation of greater
numbers of tagged documents and more useful tags, the unbalanced distribution of scientific
attention will almost certainly result in the continuation of the skewed numbers of taggers (and
thus tags) per document displayed in Figure 6.4.
At a broad level, the key implication of these results from the standpoint of bioinformatics
system design is that – despite surface similarities – these new metadata resources should not be
used in the same manner as metadata assembled in other ways. Rather, new processes that make
use of the additional social context made accessible through these systems need to be explored.
In considering future applications of socially generated metadata in the life sciences, it may
prove more valuable to know who or how many tagged a particularly document than it is to know
which tags were used to describe it.
6.5 Methods
6.5.1 Data acquisition
The Connotea data was gathered using the Connotea Web API [44] and a client-side Java library
for interacting with it [45]. All tagging events accessible via the API prior to November 10,
2008 were retrieved and, with the exception of a small number lost due to XML parsing errors,
stored in a local MySQL database for analysis.
The CiteULike data was downloaded on November 9, 2008 from the daily database export
provided online [46]. Once again, the data was parsed and loaded into a local MySQL database
for processing.
Once the Connotea and CiteULike data was gathered, the associated PubMed identifiers from
both datasets were used to retrieve the PubMed records using a Java client written for the United
States National Centre for Biotechnology’s Entrez Programming Utilities [47]. This client
retrieved the metadata, including MeSH term assignments, for each identifier and stored it in the
local database.

141
6.5.2 Resource coverage
The coverage of PubMed by Connotea and CiteULike was estimated through inspection of the
identifiers supplied for each posted citation in the downloaded data. Only posts that were linked
by the tagging systems to PubMed identifiers were counted. For Figure 6.2, the Wessa.net
online statistical calculator was used to generate the CiteULike forecast using exponential
smoothing [48, 49].
6.5.3 Tag density
The data generated for the tag density tables and figures was assembled from the local database
using Java programs. The figures were generated using R [50].
6.5.4 Calculation of Positive Specific Agreement (PSA)
In situations where there is no defined number of negative cases, as is generally the case for the
assignment of descriptive tags to documents, PSA has been shown to be an effective measure of
inter-annotator agreement [28]. PSA can be calculated for any pair of overlapping sets. Here it
is used to compare the degree of overlaps between sets of terms, concepts, semantic types, and
semantic groups. If one set is considered to be the standard against which the other set is being
measured, then PSA is equivalent to the F-statistic (the harmonic mean of precision and recall)
commonly used in the machine learning and information retrieval literature. For two sets S1 and
S2, consider the set a as the members of the intersection of A and B, b as the members of S1
outside of the intersection and c as the members of S2 outside of the intersection.
€
PSA(S1,S2) =2a
(2a + b + c)
Equation 6.1: Positive Specific Agreement for the members of sets S1, S2 whose intersection is
a and where b = S1 excluding a and c = S2 excluding a. For more information, see [28].

142
To provide an estimation for quality of tag assignments in academic social tagging systems, we
measure the levels of agreement between the sets of tags assigned to the same resource by
multiple users as follows:
- For resources associated with more than one tagging event
o For pairs of users to tag the resource
measure and record the positive specific agreement (PSA) between the
tags assigned to the resource between the pair
- Summarize by average PSA for each distinct (user-pair, resource) combination
6.5.5 String standardization for tag comparisons
As PSA is a metric designed for comparing sets, to use it, it is necessary to define a rigid
equivalence function to define the members of the sets. For comparisons between concepts,
types, and groups from the UMLS, unique identifiers for each item are used; however, for
comparisons between tags, only the strings representing the tag are available. For the results
presented at the level of standardized strings, operations were applied to the tags prior to the
comparisons as follows:
1. All non-word characters (for example, commas, semi-colons, underscores and
hyphens) were mapped to spaces using a regular expression. So the term
“automatic-ontology_evaluation” would become “automatic ontology
evaluation”.
2. CamelCase [50] compound words were mapped to space separated words -
“camelCase” becomes “camel case”.
3. All words were made all lower case (“case-folded”).
4. Any redundant terms were removed such that, after operations 1-3, each term in a
set composed a string of characters that was unique within that set.
5. Porter stemming was applied to all terms and sub-terms [51].
6. All sub-terms were sorted alphabetically.

143
6.5.6 Mapping tags and descriptors to UMLS concepts
For MeSH terms, associated UMLS concepts were identified within the information provided in
the 2008 version of the MeSH XML file provided by the NLM [52]. In a few cases, concepts
were missing from this file in which case they were retrieved using a Java client written to make
use of the Web services made available as part of the UMLS Knowledge Source Server
(UMLSKS) [53].
For the tags, the UMLSKS client program was designed to identify matching concepts with high
precision. For each tag, the UMLSKS web service method findCUIByExact was used to identify
concepts from any of the source vocabularies represented in the metathesaurus where at least one
of the names assigned to that concept matched the tag directly [54]. To further increase
precision, only concepts whose primary name (rather than one of the several possible alternate
names) matched the tag were included.
To assess the performance of this concept identification protocol, we tested it on its ability to
rediscover the concepts associated with MeSH descriptors using the text of the preferred label for
the descriptor (acting as a tag) as the input to the system. The concepts already associated with
each MeSH descriptor in the MeSH XML file provided by the NLM were used as true positive
concept calls for comparison. On a test of 500 MeSH descriptors, the concept calling protocol
used to generate the data presented above produced a precision of 0.97 and a recall of 0.91.
Without the requirement that the primary concept name match the query string, precision
decreases to 0.82 while the recall increases to 1.0 for the same query set. The reduction in the
precision is due to false positives such as ‘Meningeal disorder’ being identified for the query
term ‘Meninges’. Once a unique concept identifier was identified, the Java client was used to
extract its semantic type and semantic group and store this information in our local database.
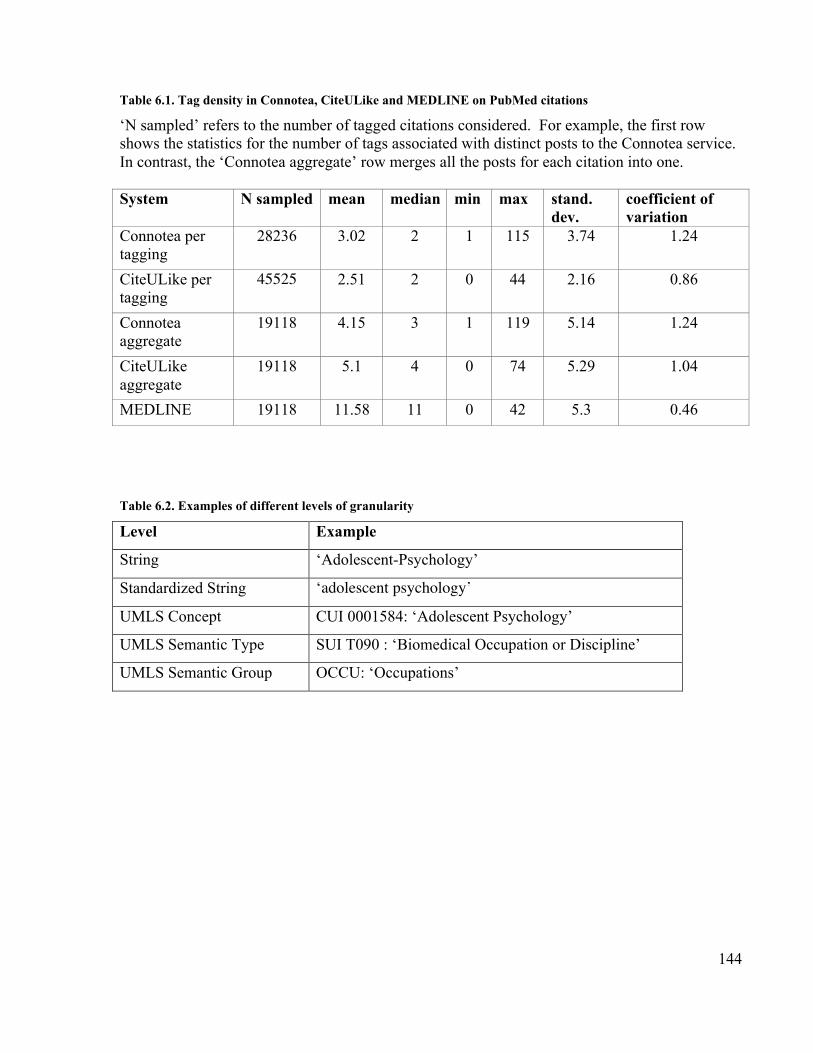
144
Table 6.1. Tag density in Connotea, CiteULike and MEDLINE on PubMed citations
‘N sampled’ refers to the number of tagged citations considered. For example, the first rowshows the statistics for the number of tags associated with distinct posts to the Connotea service.In contrast, the ‘Connotea aggregate’ row merges all the posts for each citation into one.
System N sampled mean median min max stand.dev.
coefficient ofvariation
Connotea pertagging
28236 3.02 2 1 115 3.74 1.24
CiteULike pertagging
45525 2.51 2 0 44 2.16 0.86
Connoteaaggregate
19118 4.15 3 1 119 5.14 1.24
CiteULikeaggregate
19118 5.1 4 0 74 5.29 1.04
MEDLINE 19118 11.58 11 0 42 5.3 0.46
Table 6.2. Examples of different levels of granularity
Level Example
String ‘Adolescent-Psychology’
Standardized String ‘adolescent psychology’
UMLS Concept CUI 0001584: ‘Adolescent Psychology’
UMLS Semantic Type SUI T090 : ‘Biomedical Occupation or Discipline’
UMLS Semantic Group OCCU: ‘Occupations’

145
Table 6.3. Positive Specific Agreement among pairs of social taggers on PubMed citations
Citeulike ConnoteaMeanPSA
N pairsmeasured
Meanterms per
post
MeanPSA
N pairsmeasured
Meanterms per
postString 0.11 19782 2.49 0.14 13156 3.06StandardizedString
0.13 19782 2.49 0.16 13156 3.06
Concepts 0.39 9128 1.39 0.31 4022 1.86Types 0.43 9128 1.36 0.38 4022 1.72Groups 0.52 9128 1.29 0.45 4022 1.56
Table 6.4. Average agreement between social tagging aggregates and MeSH indexing.
CiteULike verse MEDLINE Connotea verse MEDLINEN
CitationsMean
precisionMeanrecall
MeanPSA
NCitations
Meanprecision
Meanrecall
MeanPSA
String 19059 0 0 0 19118 0.03 0.02 0.02NormalizedString
19059 0.09 0.03 0.04 19118 0.10 0.04 0.05
Concepts 8933 0.20 0.02 0.03 9290 0.30 0.04 0.07Types 8933 0.56 0.07 0.12 9290 0.59 0.10 0.16Groups 8933 0.81 0.18 0.29 9290 0.81 0.22 0.32
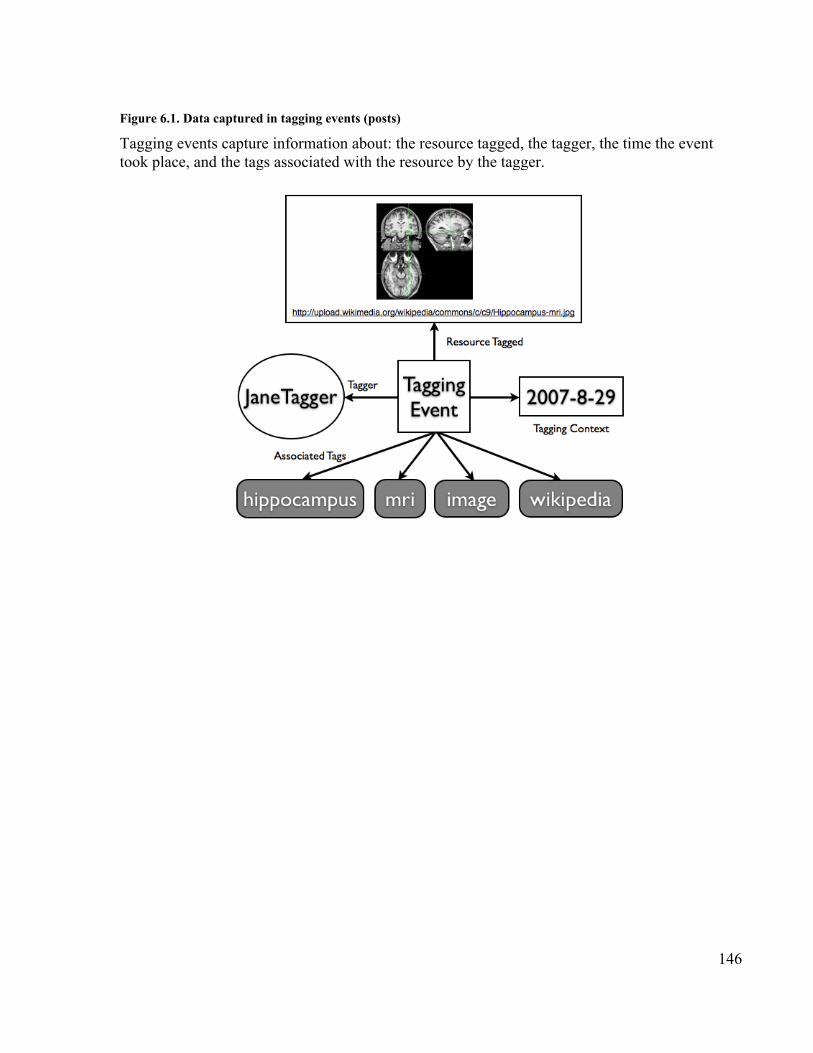
146
Figure 6.1. Data captured in tagging events (posts)
Tagging events capture information about: the resource tagged, the tagger, the time the eventtook place, and the tags associated with the resource by the tagger.
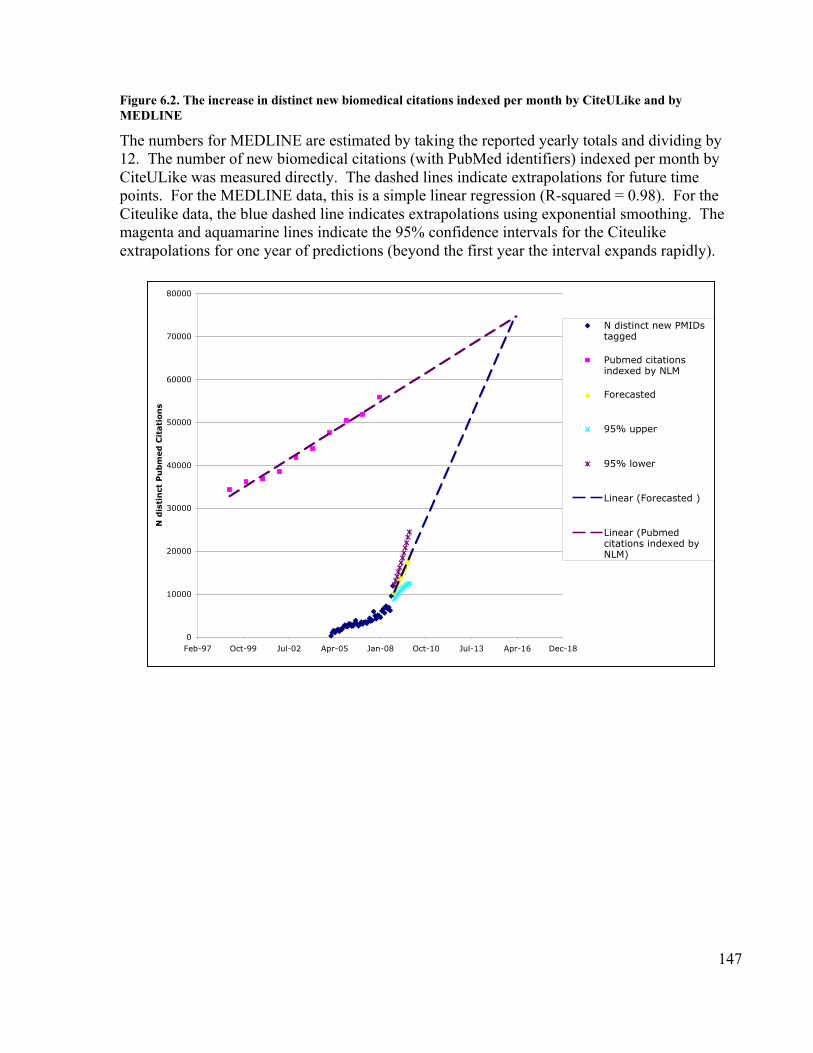
147
Figure 6.2. The increase in distinct new biomedical citations indexed per month by CiteULike and byMEDLINE
The numbers for MEDLINE are estimated by taking the reported yearly totals and dividing by12. The number of new biomedical citations (with PubMed identifiers) indexed per month byCiteULike was measured directly. The dashed lines indicate extrapolations for future timepoints. For the MEDLINE data, this is a simple linear regression (R-squared = 0.98). For theCiteulike data, the blue dashed line indicates extrapolations using exponential smoothing. Themagenta and aquamarine lines indicate the 95% confidence intervals for the Citeulikeextrapolations for one year of predictions (beyond the first year the interval expands rapidly).
0
10000
20000
30000
40000
50000
60000
70000
80000
Feb-97 Oct-99 Jul-02 Apr-05 Jan-08 Oct-10 Jul-13 Apr-16 Dec-18
N d
isti
nct
Pu
bm
ed
Cit
ati
on
s
N distinct new PMIDstagged
Pubmed citationsindexed by NLM
Forecasted
95% upper
95% lower
Linear (Forecasted )
Linear (Pubmedcitations indexed byNLM)
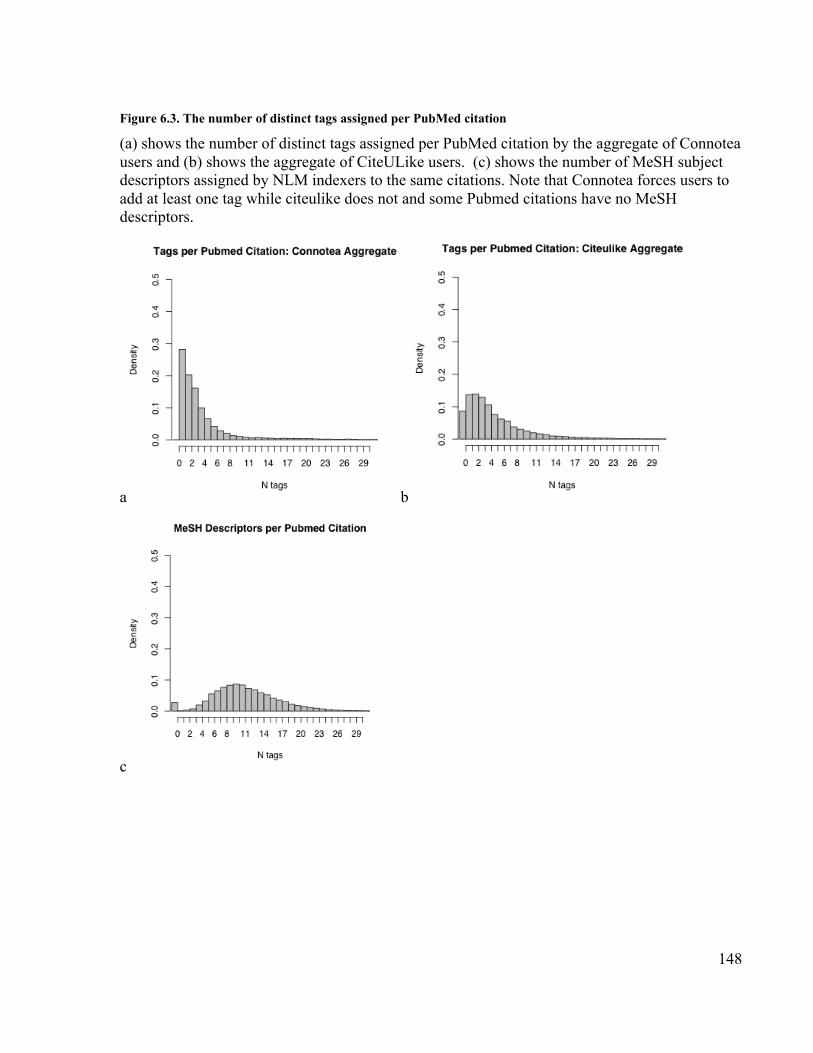
148
Figure 6.3. The number of distinct tags assigned per PubMed citation
(a) shows the number of distinct tags assigned per PubMed citation by the aggregate of Connoteausers and (b) shows the aggregate of CiteULike users. (c) shows the number of MeSH subjectdescriptors assigned by NLM indexers to the same citations. Note that Connotea forces users toadd at least one tag while citeulike does not and some Pubmed citations have no MeSHdescriptors.
a b
c

149
Figure 6.4. Relationship between number of PubMed citations and number of posts per citation
Relationship between number of PubMed citations and number of posts per citation in Connotea(a,b) and CiteULike (c,d). Most citations are only posted once while a few are posted manytimes (by many different users).
a b
c d

150
Figure 6.5. Increase in tag density per PubMed citation with increase in number of posts per citation
Increase in tag density per PubMed citation with increase in number of posts per citation forConnotea (a) and CiteULike (b). Each vertical box and whisker plot describes the distribution ofthe number of distinct tags associated with PubMed citations tagged by the number of peopleindicated on the X axis. For example, the first plot, at X = 1, describes the density of tags percitation assigned by just one person while the second plot, at X = 2, describes the density ofdistinct tags per citation assigned by the aggregated tags of 2 people and so forth. The median ofthe distribution is indicated by the horizontal line, the upper and lower boundaries of the boxindicate the medians of the first and third quartiles (such that 50% of the data lies within thoseboundaries), the whiskers extend either to the extremes of the observations or a maximum of 1.5times the interquartile range, and circles indicate outliers.
a b
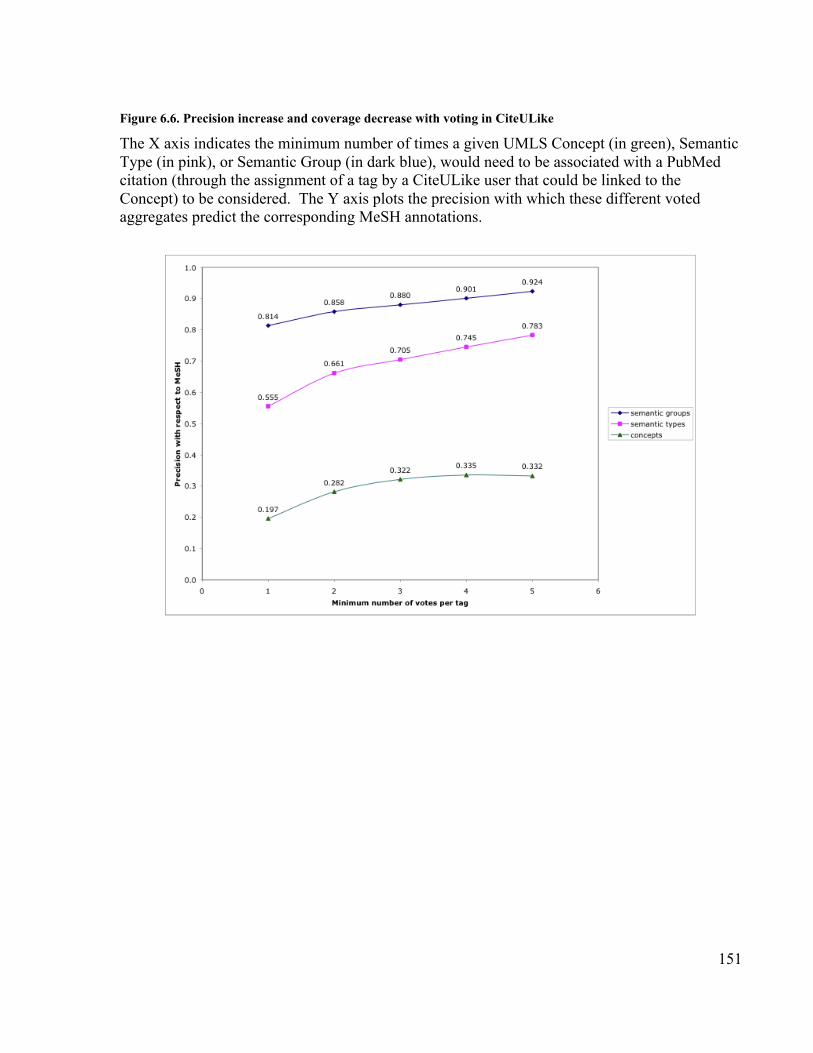
151
Figure 6.6. Precision increase and coverage decrease with voting in CiteULike
The X axis indicates the minimum number of times a given UMLS Concept (in green), SemanticType (in pink), or Semantic Group (in dark blue), would need to be associated with a PubMedcitation (through the assignment of a tag by a CiteULike user that could be linked to theConcept) to be considered. The Y axis plots the precision with which these different votedaggregates predict the corresponding MeSH annotations.

152
Figure 6.7. Decrease in coverage as voting threshold increases
The X axis indicates the minimum number of times a given UMLS Concept would need to beassociated with a PubMed citation (through the assignment of a tag by a CiteULike user thatcould be linked to the Concept) to be considered. If no concepts can be identified for a particulardocument at each threshold, the document is removed from consideration. The Y axis shows thefraction of PubMed citations associated with UMLS Concepts at each threshold. Only Conceptsare plotted as each Concept is linked to a Semantic Type and a Semantic Group hence the otherplots would be redundant.

153
Figure 6.8. Tags for a popular PubMed citation from Connotea and CiteULike
The tag cloud or “Wordle” at the top of the figure shows the tags from both CiteULike andConnotea for the Science article “Tuned responses of astrocytes and their influence onhemodynamic signals in the visual cortex” (PubMed id 18566287). As the frequency scale at thebottom left indicates, the tags are sized based on the number of times they were used to describethe article. As the colour key at middle-right shows, the tags are divided into three, manuallyassigned categories: ‘personal’, ‘non-MeSH’, and ‘MeSH overlap’. Personal tags are those, like‘kristina’, that do not appear topical, ‘non-MeSH’ tags appear topical but do not match directlywith any of the MeSH descriptors for the article (listed on the bottom-right), and the ‘MeSHoverlap’ tags have matches within the MeSH descriptors assigned to the article.

154
References
1. Use of MeSH in Indexing [http://www.nlm.nih.gov/mesh/intro_indexing2007.html]2. Bachrach C, Charen T: Selection of MEDLINE contents, the development of its
thesaurus, and the indexing process. Medical Informatics 1978, 3(3):237-254.3. Hubbard T, Aken B, Beal K, Ballester B, Caccamo M, Chen Y, Clarke L, Coates G,
Cunningham F, Cutts T et al: Ensembl 2007. Nucleic acids research 2007, 35(Databaseissue):610-617.
4. Ruch P: Automatic assignment of biomedical categories: toward a generic approach.Bioinformatics 2006, 22(6):658-658.
5. Aronson A, Bodenreider O, Chang H, Humphrey S, Mork J, Nelson S, Rindflesch T,Wilbur W: The NLM Indexing Initiative. Proceedings / AMIA Annual SymposiumAMIA Symposium 2000:17-21.
6. Kim W, Aronson A, Wilbur W: Automatic MeSH term assignment and qualityassessment. Proceedings / AMIA Annual Symposium AMIA Symposium 2001:319-323.
7. Gattiker A, Michoud K, Rivoire C, Auchincloss A, Coudert E, Lima T, Kersey P, PagniM, Sigrist C, Lachaize C et al: Automated annotation of microbial proteomes inSWISS-PROT. Computational biology and chemistry 2003, 27(1):49-58.
8. Kasukawa T, Furuno M, Nikaido I, Bono H, Hume D, Bult C, Hill D, Baldarelli R,Gough J, Kanapin A et al: Development and Evaluation of an Automated AnnotationPipeline and cDNA Annotation System. Genome Research 2003, 13(6b):1542-1551.
9. Del.icio.us [http://del.icio.us/]10. Flickr [http://www.flickr.com/]11. 23Things [http://www.23things.com]12. Golder SA, Huberman BA: Usage patterns of collaborative tagging systems. Journal
of Information Science 2006, 32(2):198-208.13. CiteULike: A free online service to organize your academic papers
[http://www.citeulike.org/ ]14. Hammond T, Hannay T, Lund B, Scott J: Social Bookmarking Tools (I): A General
Review. D-Lib Magazine 2005, 11(4).15. Lund B, Hammond T, Flack M, Hannay T: Social Bookmarking Tools (II): A Case
Study - Connotea. D-Lib Magazine 2005, 11(4).16. Hotho A, Jäschke R, Schmitz C, Stumme G: BibSonomy: A Social Bookmark and
Publication Sharing System. Proceedings of Conceptual Structures ToolInteroperability Workshop at the 14th International Conference on ConceptualStructures 2006:87-102.
17. Hull D, Pettifer SR, Kell DB: Defrosting the digital library: bibliographic tools forthe next generation web. PLoS Comput Biol 2008, 4(10):e1000204.
18. Bokardo: The Del.icio.us Lesson [http://bokardo.com/archives/the-delicious-lesson/ ]19. Morrison PJ: Tagging and searching: Search retrieval effectiveness of folksonomies
on the World Wide Web. Information Processing and Management 2008, 4(4):1562-1579.
20. Yahoo! Directory [http://dir.yahoo.com/]21. Worio Search [http://www.worio.com/]

155
22. Bodenreider O: The Unified Medical Language System (UMLS): integratingbiomedical terminology. Nucl Acids Res 2004, 32(90001):D267-270.
23. Key MEDLINE Indicators [http://www.nlm.nih.gov/bsd/bsd_key.html]24. Wheeler DL, Barrett T, Benson DA, Bryant SH, Canese K, Chetvernin V, Church DM,
Dicuccio M, Edgar R, Federhen S et al: Database resources of the National Center forBiotechnology Information. Nucleic acids research 2008, 36(Database issue):D13-21.
25. Kipp MEI: Tagging practices on research oriented social bookmarking sites. In:Canadian Association for Information Science. Edited by Arsenault C, Dalkir K.Montreal, Canada; 2007.
26. Kipp MEI: Tagging for health information organization and retrieval. In: NorthAmerican Symposium on Knowledge Organization. Toronto, Canada; 2007: 63-74.
27. Kipp MEI: @toread and Cool: Tagging for Time, Task and Emotion. In: InformationArchitecture Summit. Vancouver, Canada; 2006.
28. Hripcsak G, Rothschild AS: Agreement, the F-Measure, and Reliability inInformation Retrieval. Journal of the American Medical Informatics Association :JAMIA 2005, 12(3):296-298.
29. McCray AT: An upper-level ontology for the biomedical domain. Comp FunctGenomics 2003, 4(1):80-84.
30. McCray AT, Burgun A, Bodenreider O: Aggregating UMLS semantic types forreducing conceptual complexity. Stud Health Technol Inform 2001, 84(Pt 1):216-220.
31. Schummers J, Yu H, Sur M: Tuned responses of astrocytes and their influence onhemodynamic signals in the visual cortex. Science 2008, 320(5883):1638-1643.
32. Tagging, Folksonomy & Co - Renaissance of Manual Indexing?[http://arxiv.org/abs/cs/0701072v1 ]
33. Sen S, Lam SK, Rashid AM, Cosley D, Frankowski D, Osterhouse J, Harper FM, Riedl J:Tagging, communities, vocabulary, evolution. CSCW '06: Proceedings of the 200620th anniversary conference on Computer supported cooperative work 2006:181-190.
34. Drenner S, Sen S, Terveen L: Crafting the initial user experience to achievecommunity goals. ACM Conference On Recommender Systems, Lausanne, Switzerland2008:187-194.
35. Zigtag [http://www.zigtag.com]36. Faviki - Social bookmarking tool using smart semantic Wikipedia (DBpedia) tags
[http://www.faviki.com]37. Twine - Organize, Share, Discover Information Around Your Interests
[http://www.twine.com]38. The Entity Describer [http://www.entitydescriber.org]39. Good BM, Kawas EA, Wilkinson MD: Bridging the gap between social tagging and
semantic annotation: E.D. the Entity Describer. In: Nature Precedings. 2007.40. Tennis JT: Social Tagging and the Next Steps for Indexing. In: 17th ASIS&T SIG/CR
Classification Research Workshop. Austin, Texas; 2006.41. mwilkinson's bookmarks [http://www.connotea.org/user/mwilkinson]42. bgood's bookmarks [http://www.connotea.org/user/bgood]43. Abbasi R, Staab S: Introducing Triple Play for Improved Resource Retrieval in
Collaborative Tagging Systems. In: ECIR Workshop on Exploiting SemanticAnnotations in Information Retrieval(ESAIR'08). 2008.
44. Connotea Web API [http://www.connotea.org/wiki/WebAPI]45. Java Client for Connotea API.

156
46. Citeulike database export [http://www.citeulike.org/faq/data.adp]47. Sayers EW, Barrett T, Benson DA, Bryant SH, Canese K, Chetvernin V, Church DM,
Dicuccio M, Edgar R, Federhen S et al: Database resources of the National Center forBiotechnology Information. Nucleic Acids Res 2008.
48. Wessa P: Free Statistics Software, Office for Research Development and Education,version 1.1.23-r3. In.; 2008.
49. Statistical Computations at FreeStatistics.org. 'Growth of number of distinctPubMed documents tagged in Citeulike per month (2004-2008)'[http://www.freestatistics.org/blog/date/2008/Nov/16/t1226866506mfqeu7wwjf7jyl0.htm/]
50. R development Core Team: R: A language and environment for statisticalcomputing [http://www.R-project.org]
51. Porter MF: An algorithm for suffix stripping. Program 1980, 14(3):130-137.52. Medical Subject Headings - Files Available to Download
[http://www.nlm.nih.gov/mesh/filelist.html ]53. UMLS Knowledge Source Server [http://umlsks.nlm.nih.gov/]54. UMLSKS documentation
[http://umlsks.nlm.nih.gov/DocPortlet/html/dGuide/webservices/metaops/find/find1.html]
157
7 Open semantic annotation: an experiment with BioMoby Web services9
7.1 Background
Web services have many definitions, but for present purposes, we simply consider them as
computational functions that may be invoked remotely over the Internet [1]. The crucial
difference between Web services and websites is that Web services are designed for machine
access while websites are designed for human access via Web browsers. This difference means
that the data used as input and produced as output for Web services can be structured according
to standards designed to facilitate interoperability between distributed resources rather than
structured for presentation on Web pages. The key consequence of this difference is that the use
of Web services can, in principle, enhance our ability to produce software that integrates data
and resources from multiple distributed sources. As a result of the highly distributed nature of
computational resources in biology, much attention has been paid to developing bioinformatics
Web services [2].
While Web services offer the promise of improved interoperability, they do not do this on their
own. Web services need to be found, invoked, and the contents of the messages that they
communicate must be interpretable for the client programs that access them. Semantic Web
service frameworks attempt to meet these challenges by providing clear, computationally
accessible descriptions of Web service components using ontologies shared on the Web. For
example, the MyGrid project provides ontologies specifically designed for describing Web
services in the bioinformatics domain [3]. Such ontologies can be used to clarify, in a manner
that is computationally useful, the meaning of different service aspects, for example linking the
input to a service to a semantic type like ‘protein sequence’ rather than simply to a syntactic type
like ‘String’.
Semantic descriptions can be used for a number of key purposes, one of which is reasoning in the
context of service discovery. Given an ontology that defines for example, a subsumption
relationship between the classes ‘biological sequence’ and ‘protein sequence’, it is possible to
9 A version of this chapter will be submitted for publication. Good BM, Kawas EK, Lu P, Tennis JT, WilkinsonMD: Open semantic annotation: an experiment with BioMoby Web services

158
automatically infer that a service declared to consume ‘biological sequences’, should operate on
both protein sequences and nucleotide sequences. An example of this kind of service might be
one that generates a particular XML formatted file from a Fasta formatted text file. (Such
format conversion services are kinds of “shim” services and are indispensable in the multi-
format, multi-identifier domain of distributed bioinformatics [4, 5].)
While multiple Web service ontologies exist, most independent bioinformatics Web service
providers generally appear to have little interest, incentive, or time to use them to describe their
services. Furthermore, even in cases where there is interest, the task of making effective use of
ontologies (authoring the semantic annotations) in this context has proven difficult. Though the
value of semantic annotation for Web services seems clear, as Wolstencroft et al. point out, “the
cost and viability of obtaining the semantic annotations is the challenge” [6].
Automated approaches to generating semantic annotations may prove useful in this regard but
they suffer from the fact that for a program to succeed in generating semantic annotations,
sufficient information about the Web services must exist to start out with. It is possible to
generate candidate semantic annotations of Web services from, for example, textual annotations
of those services [7, 8] or from information extracted from known workflows that successfully
chain multiple Web services together [9]; however, there must be sufficient information present
to seed the process and even when such information does exist, such methods are intended to
support, not replace manual semantic annotation. As such, manual annotation processes are
required.
The three potential sources of manual semantic annotations for Web services are (1) the
providers of the services, (2) the users of the services, and (3) professional semantic Web service
annotators [6]. The benefit of (1) is that the providers know precisely what their services do.
Some Web service registries, such as those employed by the BioMoby interoperability initiative
[10], require service providers to include semantic annotation in order for services to be listed in
the registry. While this guarantees a modicum of semantics within these closed worlds, it does
not necessarily ensure that the annotations are correct or that they make the most effective use of
the available ontologies. Furthermore, there are thousands of services already available in the
bioinformatics domain such as those offered by the National Center for Biotechnology

159
Information (NCBI), that would be beneficial to have included in semantic Web service
frameworks but as yet have no semantic annotation. To make use of these key resources, the
second and/or third options must be considered.
In considering professional versus user-driven annotation, two facts are clear,
1) there are many more users of Web services than there are ever going to be professional
semantic Web service annotators
2) an untrained user with unknown amounts of skill and background knowledge is unlikely
to provide professional quality semantic annotations.
What is less well known is just how much worse amateur annotations are likely to be, how much
interfaces used to guide the annotation process might affect the results, how best to combine
multiple annotations of the same resource from different annotators, and how to motivate users
to provide annotations. Given the massive differences in the scale between the populations of
users and professional annotators and the success of open, collaborative knowledge construction
in other contexts, it seems prudent to address these questions forthright. Through a better
understanding of the consequences of different methods for generating and using third-party
manual semantic annotations, it should be possible to make more informed decisions about how
to successfully, sustainably produce open semantic Web service frameworks in bioinformatics
and other domains.
Here, we present an experiment in which semantic annotations for BioMoby Web services are
gathered from a diverse group of volunteers. We begin with a brief description of the BioMoby
framework that serves to provide the specific motivation for obtaining the semantic annotations.
Then, we describe the prototype semantic annotation system used by the volunteers to create the
annotations. The description of the prototype, including the user interface and the ontologies
used, is followed by an explanation of our approach to evaluation. Finally, we present the
results of the experiment and use these results to guide suggestions for future work.

160
7.1.1 BioMoby
Web services in the BioMoby registry, called ‘Moby Central’, gain their semantics from three
unique ontologies, the Object ontology, the Namespace ontology and the Service ontology [11].
Aside from their functions, the most unique aspect of these ontologies is that they are exclusively
produced by Web service providers. Anyone can edit them and there is no centralized curation
of the system.
The Object ontology defines the structure of the XML messages that are accepted as input and
produced as output by BioMoby services. It uses a simple structure composed of three
relationships, that can hold between any two Objects: “is a” (Objects inherit properties from their
parent and multiple inheritance is not allowed), “has a” (an Object may contain another Object),
and “has” (an Object may contain a set of other Objects). Each new Object is defined by
specifying these relationships to other Objects in the ontology and through this mechanism,
arbitrarily complex data structures can be created. Though its classes contain names like
“Amino Acid Sequence”[12], which provide suggestions regarding the nature of the data
represented by a serialization of the class, their purpose is fundamentally to represent syntax, not
semantics. Based on its definition in the Object ontology, an “Amino Acid Sequence” object
could be used to represent anything describable with a String (the sequence), and an Integer (its
length). Thus, the Object ontology achieves syntactic interoperability by providing predictable
message structures, but does not necessarily result in semantic interoperability.
The Namespace ontology consists of a simple flat list of terms, like ‘NCBI_gi’ and ‘KEGG_ID’,
that are used to disambiguate identifiers in the BioMoby space. Every BioMoby Object – every
component of a message sent or received from a BioMoby compatible Web service – may be
linked to a set of Namespace/identifier pairs. (A set, rather than a single item, is used because
the same piece of data may exist in multiple namespaces.) In this manner, data can be
unambiguously described such that naming conflicts are avoided. Though unique entity
identification is a key step, the meaning of data elements remains ambiguous because there are
no formal semantics associated with the Moby namespaces.

161
The Service ontology is distinct from the other two BioMoby ontologies in that it is a specific
attempt to describe semantics rather than to clarify syntax or to support unique identification.
This ontology is a straightforward, single inheritance, directed graph along the ‘is a’ relationship.
The concepts represented in the ontology describe the operations performed by the service, for
example ‘retrieval’ or ‘parsing’. A significant constraint imposed by the BioMoby specification
is that BioMoby services may be described by just one node from this ontology, severely limiting
the potential expressiveness of service annotations.
7.1.1.1 Some limitations of BioMoby 1.0
There are two key components of the interoperability problem, syntax and semantics [13].
BioMoby goes far in achieving syntactic interoperability between participating Web service
providers by its insistence that services within its registry state explicitly which Moby Objects
they use. Though this basic utility is sometimes undermined by service providers who register
services that, for example, consume the Moby object ‘String’ and then proceed to process only
Strings of a particular format, in practice, the process has largely been successful . However,
semantic interoperability is limited within the Moby framework. There is no way for a computer
to ‘know’ what kind of thing is represented by a particular Moby Object – for example ,an
‘iANT_entry_db-xml’ [14] – because the semantic type of objects is never explicitly defined.
Furthermore, the relationship between service inputs and outputs remains largely ambiguous due
to the lack of expressivity made possible by the service ontology and the single typing constraint
imposed by the current Moby specification.
To expand the semantic coverage of Web services in the BioMoby framework, additional
ontologies need to be identified and semantic annotations using those ontologies created.
Specifically, it would be useful to:
1) define the semantic types of the service inputs and outputs to complement the syntactic
types of the Object ontology
2) define the nature of the operations performed by each service more precisely by
specifying not just the kinds of task(s) performed, but also the algorithms and resources
used in the process [15].

162
In the following, we describe a prototype social annotation system intended to meet these
objectives. Through its evaluation, we hope to bring light to the questions raised earlier about
the realities of removing the knowledge acquisition bottleneck in the context of semantic
annotation.
7.2 Moby Annotator
Building on previous work in social semantic tagging [16, 17], the Moby Annotator is an open,
Web-based system for collecting semantic annotations of the inputs, outputs, and operations of
BioMoby Web services [18]. It provides a straightforward graphical user interface that allows
any user to contribute semantic annotations using concepts from a pre-defined set of ontologies.
These annotations are stored in an RDF [19] database accessible at an open SPARQL [20]
endpoint. Within this database, annotations are structured according to an OWL [21] ontology
[22] that provides minor extensions to Richard Newman’s tag ontology [23].
Figure 7.1 illustrates the basic structure of annotations represented using the ontology employed
by the Moby Annotator. In the figure, the user ‘JaneTagger’ has associated the semantic tag
‘retrieving’ and the free text tag ‘mutants’ with the operation performed by the BioMoby Service
‘getSeedGeneMutantImageByAGI’ . Each such annotation event in the knowledge base –
referred to as a ‘tagging’ following the terminology used in the ontology – captures the user-
author of the tagging, the resource tagged, the tags associated with that resource, and the time
when the tagging occurred. Links between semantic tags and associated external URIs, such as
ontology classes, are represented using the RDF Schema property ‘isDefinedBy’ [24].
When a user logs in and desires to annotate a service, the Moby Annotator gathers information
about the service via a SPARQL query to an RDF version of the Moby Central registry and
displays that information for the user. Figure 7.2 provides a screenshot of the Moby Annotator
interface as it appeared at the time of this study. It separates general information about the
service, including a textual description, from information about its inputs and outputs. This
separation is continued in the three distinct areas available for annotating the inputs, outputs, and
operations performed by the service.
163
Each annotation area consists of an autocomplete input text box linked to a pre-defined list of
terms such that, as the user starts typing, terms matching the input text are presented in a
dropdown list. When the users mouses over a term from the list, a definition is provided and
when the user clicks on a term, the term is added as a candidate semantic annotation. If the user
wants to make use of a term that can not be found in the pre-defined list, they are allowed to
create a tag and use it for annotation in the same way that free-text tags are used in social
bookmarking services like Del.icio.us and Connotea [25-27]. The terms used to populate the
autocomplete lists are drawn primarily from the RDF-S version of the MyGrid bioinformatics
Domain ontology [28], but also from a new source of structured knowledge called Freebase [29].
The MyGrid Domain ontology is divided into six main branches: ‘bioinformatics algorithm’,
‘bioinformatics data resource’, ‘bioinformatics task’, ‘bioinformatics file formats’,
‘bioinformatics data’, and ‘bioinformatics metadata’. Terms from the data and metadata
branches are included in the autocomplete lists for the service parameters while terms from the
algorithm, data resource (e.g. NCBI), and task branches are used for annotating the service
operations. When a service input or output is of the Moby Object ontology root type ‘Object,’ it,
by definition, can not contain any actual data and thus only metadata terms are presented in the
list. The ‘file format’ branch of the MyGrid ontology was not included here because the format
of an Object in the Moby system should be entirely determined by its definition in the Moby
Object ontology.
Freebase, developed by MetaWeb Technologies Inc., is an “open, shared database of the world’s
knowledge” [30]. Anyone can enter data into it and anyone can make use of that data, free of
charge, within their own applications. To make it possible to search for BioMoby services based
on organisms of relevance – for example, finding services related to information about
Arabidopsis – the Moby Annotator makes it possible to tag both service inputs/outputs and
operations with organism classifications drawn from Freebase. Though fascinating, discussion
of the Freebase data model and the implications of the genesis of such open, yet privately funded
platforms for Web-based knowledge representation are beyond the scope of this article. For the
purposes of this investigation, we simply treat the structured knowledge in Freebase in the same
way that we would treat an ontology represented in any other manner.
164
7.3 Evaluating semantic annotations
We approach the evaluation of the annotations gathered via the Moby Annotator from two
angles: agreement among pairs of annotators (users) and agreement between group aggregates
and a manually constructed standard. In both cases, we make use of a metric known as positive
specific agreement (PSA), shown in Equation 7.1, to assess the degree of overlap between tags
associated with the same resource by two different sources [31]. In the case of the standard-
based evaluation, measurements of PSA are accompanied by measurements of precision and
recall. (PSA equates to the F measure in this case, the harmonic mean of precision and recall.)
€
PSA(S1,S2) =2a
(2a + b + c)Equation 7.1: Positive Specific Agreement for the members of sets S1, S2 whose intersection is
a and where b = S1 excluding a and c = S2 excluding a.
To provide a scale with which to consider the results presented below, Table 7.1 lists average
levels of PSA observed among experts in several different semantic annotation tasks culled from
the literature. In each study described in the table, though the task varies, trained domain experts
use custom designed interfaces to associate items with concepts from ontologies. Results for
average inter-annotator agreement vary from 0.50 for the annotation of clinical patient problems
[32], to 0.54 for the annotation of proteins [33], to 0.73 for the annotation of clinical disorders in
physician-dictated notes [34]. Given that it was observed among “clinical data retrieval experts”,
each with a minimum of four years of experience and that high levels of agreement were a
primary objective of the reported research, the average inter-annotator agreement of 0.73
suggests a reasonable approximate upper bound for what to expect for semantic annotation in
professional, controlled settings [34].
In open systems, such as the Moby Annotator, that involve the collection of semantic annotations
from a potentially diverse group of contributors, we expect that average levels of inter-annotator
agreement will be lower than in more controlled professional settings. However, when the
annotators are not all domain experts, the interpretation of inter-annotator agreement becomes
more complex. In situations where the annotators are all assumed to be experts, agreement
between them provides a strong indication – based on this pre-defined authority – that the agreed
165
upon statements are of high quality. In cases where annotators are not considered authoritative
as a premise, estimates of inter-annotator agreement simply describe the level of consensus
within the group. In the results presented below, we take advantage of the additional point of
reference provided by the generated standard to explore the relationship between consensus and
quality in this context.
7.4 Results
The following experiment is an attempt to measure the performance of a new system for open,
semantic annotation in the bioinformatics domain. Though the focus here is on extending the
semantics associated with the BioMoby framework, these results should prove relevant in any
situation that calls for user-driven semantic annotation.
7.4.1 Users
We recruited users via email request to colleagues and to members of the BioMoby mailing list.
Upon registration, users were prompted with a simple form that asked them to label themselves
with ‘bioinformatician’, ‘biologist’, ‘moby_developer’, or ‘none of the above’ - the principal
user groups envisioned to have interest in the system. Each user was allowed to enter multiple
labels for themselves. 19 people volunteered to participate in the experiment, of which 12
declared themselves as bioinformaticians, 11 as moby developers, 5 as biologists and 4 as none
of the above. Out of these volunteers, 13 completed the annotation of all of the selected Web
Services.
7.4.2 Services
Of more then 1,400 Web Services listed in the BioMoby registry at the time of the study, 27
were selected for annotation. This comparatively small number was used to ensure that
redundant annotations could be collected such that inter-annotator agreement could be measured
and experiments in annotation aggregation conducted. The services were selected such that,
based on the semantic annotations already available in the registry, the sample contained
examples of Services that appeared to be identical, that appeared to bear no similarity to one
another, and that appeared to have some similarity. For example, two different services might

166
appear to be identical from the perspective of their registered semantic metadata if they both
produced and consumed ‘Objects’ that were not linked to particular Namespaces and were
registered as ‘retrieval’ services. This approach was motivated by the desire to reveal likely
hidden differences between the apparently identical and to identify similarities between the
apparently distinct. In addition, the sample was biased to favour services from authorities that
expressed interest in the study as a means of encouraging participation.
7.4.3 Taggings
As illustrated in Figure 7.1, each tagging links a set of tags (free-text and semantic) to a
particular resource and to the author of the tagging. In the results presented here, we distinguish
between two kinds of resources, Objects, which correspond to the inputs or outputs of Web
Services and Operations, which correspond to the actions performed by the Services. A total of
872 taggings were recorded for Objects and 400 were recorded for Operations.
7.4.4 Tag density
Each tagging act links a set of semantic and/or free-texts tags to a particular resource. Tag
density refers to the number of tags associated with each such assertion. As tables 7.2 and 7.3
indicate, users entered a median of 2 tags per item. A minimum of one tag, which could be
either free text or semantic, was enforced for each tagging event. Its interesting to note that, in
many other open social classification systems, such as the Connotea and CiteULike social
bookmarking services, very similar average numbers of tags per resource are observed despite
drastic differences in purpose, context, and interface. Note also that there is a clear difference
between the annotations of the Service operations and the annotations of the Objects; the
operations tended to have more tags overall and a higher proportion of semantic tags to free tags.
7.4.5 Inter-annotator agreement
Table 7.4 presents the average levels of agreement, measured with PSA, among all pairs of users
across all resources annotated by both members of the pair. To achieve a perfect agreement of
1.0, both users would have to add exactly the same tags to each resource they both annotated
while a score of 0 would be obtained if both users never used the same tag to describe the same

167
resource. For the Objects, the mean PSA for the semantic tags was 0.44 and for the free text tags
(compared following syntactic standardization) it was 0.09. For the Operations, the mean PSA
for both the semantic tags and the free tags was higher at 0.54 and 0.13 respectively.
The strong increase in agreement for the semantic tags in comparison to the free text tags in both
groups should be expected; even if the tags were assigned randomly, the much smaller pool of
terms available through the semantic tagging interface would result in somewhat higher levels of
agreement. At the same time, it is important to mark this difference as, prior to this study, we are
not aware of any direct evidence regarding what to expect in terms of the differences in
agreement levels between free-text and semantic annotation systems. In addition, this provides
an indication of one of the potential effects of introducing semantics into other social annotation
systems, most of which currently rely on free-text tags.
In comparison to other studies of inter-annotator agreement among either professional annotators
or domain experts, these results would be considered moderate at best, with a more desirable
average level of consensus closer to 0.7. However, given the diverse user population – ranging
from professional creators of semantic Web service frameworks to statisticians and students that
had never seen a Web service before – as well as the limited information provided for the
Services (some of which had very shallow descriptions), these results are, in our opinion,
surprisingly high. As stated above, without a pre-defined view on the level of authority to
attribute to each user, further analysis is required to assess whether the identified consensus is
indicative of quality within this population.
7.4.6 Agreement with standard
A standard set of annotations was assembled by the author for use in gauging the quality of the
collected annotations. Using the same annotation interface as the participants in the study (thus
ensuring that it would have been possible for the participants to create exactly the same
annotations) each object and service operation was annotated with at least one semantic tag
available through the autocomplete input boxes. In creating these annotations, an emphasis was
placed on precision. Where a potential annotation was questionable, it was omitted. This
standard might be improved through future collaborative decisions among knowledgeable parties
168
regarding exactly what the most detailed correct annotations are in each case; however, based on
discussions with other researchers in the semantic Web services community, this will clearly not
be a trivial task nor one that is likely to produce a completely definitive set of answers. As noted
earlier, even among professional annotators with years of experience, levels of agreement are
rarely higher than 80% and almost never perfect. One of the results of this study was the
surprisingly difficult nature of the task. Even professional annotators that had extensive prior
experience with the MyGrid ontology reported that they struggled to make decisions regarding
the annotations. Keeping in mind that it is likely that some experts would disagree with some
annotations in the standard used here, for present purposes, it serves as a useful point of
reference for assessing the collected annotations.
7.4.6.1 By volunteer
Table 7.5 presents the average results of comparing the semantic annotations authored by each
user with the standard. It indicates that, for the Objects, the average precision with which each
user reproduces the standard annotations is 0.54 and the average recall is 0.54 resulting in an
average PSA of 0.52. For the Operations, the levels of agreement with the standard are slightly
higher, with an average precision of 0.81, an average recall of 0.53, and an average PSA of
0.59. For both Objects and Operations, there is substantial variation across the different users.
Average PSA with the standard ranges from 0.32 for the lowest user to 0.71 for the highest user
for Objects and from 0.36 to 0.75 for the Operations.
The diversity of opinion represented by the user population, as indicated in Table 7.5, is to be
expected in any open system. Each user brings a different level of prior knowledge as well as a
different point of view. To make effective use of this kind of data in applications, strategies that
not only handle but actually benefit from this diversity needed to be implemented. In the next
section, we demonstrate an old and extremely simple, yet effective strategy for extracting
wisdom from the cacophony of the crowd.

169
7.4.6.2 Aggregations
It has been shown that merging assertions generated by multiple annotators can produce
significant improvements on the end products. Camon et al referred to this as the ‘superhuman
complex’ [33] and many annotation projects have taken advantage of it in different ways – e.g.
[34, 35]. For present purposes, we take a very simple approach to aggregation based on positive
voting. For each asserted association between an ontology term and a resource, we count the
number of users to make that assertion (to ‘vote’ for it) and then remove assertions below a
specified number of votes. Assuming that greater consensus is more reflective of the standard,
the more votes for a particular assertion, the more likely it is to be correct with respect to the
standard; however, the more votes required, the less assertions will be kept. Thus, if higher
consensus increases correctness, precision should be increased and recall decreased by raising
the threshold.
Figures 7.3 and 7.4 show that the assumption of consensus equating correctness seems to hold
for the collected annotations when judged according to the constructed standard for both the
Objects and the Operations. At a voting threshold of 1 (corresponding to the union of all
assertions), average recall of semantic tags for the Objects is 0.93 and precision is 0.36. As the
threshold is increased, recall is reduced while precision is increased. For the Objects, the
optimum value of 0.80 for average PSA was reached at a voting threshold of 5, at which point
precision was 0.93 and recall was 0.76.
For the semantic annotations of the Operations displayed in Figure 7.4, similar trends occur up to
another apparent optimum near 5 votes. Since comparisons are only made for resources that
have at least one tag assignment (because otherwise precision is meaningless), the number of
resources actually compared (called coverage) begins to fall for the Operations after the vote
threshold passes 3. (Coverage for the Objects begins to fall only after a threshold of 10 votes.)
Though higher levels of PSA occur at higher vote thresholds, the apparent optimum for the
Operations, including coverage, occurs at 5 votes where the average PSA is 0.74, precision is
0.77, recall is 0.75, and coverage is 0.86.

170
7.5 Discussion
In comparison to other studies of semantic annotation involving relatively homogeneous pools of
highly trained annotators, such as those described in Table 7.1, the results presented here are on
the low end of the spectrum for inter-annotator agreement. On the other hand, the performance
of aggregates of these annotations created through a simple voting mechanism, as judged with a
manually created standard, is encouragingly high. The implication is that, given sufficient user
engagement, high quality semantic annotations for bioinformatics Web services can be generated
using systems like the one presented above.
Looking forward, it is clear from related studies that more sophisticated aggregation algorithms
– for example, those that apply machine learning approaches to weight contributions from
different users differently by learning from comparisons of samples of their assertions to a
defined standard – could be used to improve on the results presented here [36, 37]. In addition, it
is likely that enhancements to the user interface could result in a higher level of performance for
individual assertions that, in turn, would result in better overall system performance [38]. For
example, one of the main challenges for users was to learn which ontology terms were available
and what each of them meant. The only way that the current interface allows for this is via the
type-ahead lists and the associated textual definitions. In the future, confusion might be avoided
by providing an additional mechanism for browsing and learning about the available terms.
There are many possibilities for improving both the annotation interface and the algorithms used
to aggregate the collected knowledge; however, the primary question that needs to be addressed
is that of incentive. Regardless of interfaces or algorithms, open social systems, like the Moby
Annotator and the Web itself, need users to function – generally the more users the better.
In 2006, it was observed that the basic technological ingredients needed to achieve the visions of
the semantic Web in the life sciences and elsewhere, of which the Web services discussed above
form a crucial component, had already been in place for several years but that the community
had yet to apply them to a sufficient extent to gain any substantive benefit [39]. This problem
has persisted to the present day, recently prompting the International Journal of Knowledge
Engineering and Data Mining to issue a call for articles for a special issue on "Incentives for
Semantic Content Creation" due to appear in the summer of 2009 [40]. In this call for papers,
171
the editors note the sharp contrast between the still comparatively minute and largely invisible
semantic Web and the recent successes of Web2.0 applications such as Wikipedia and
Del.icio.us which “generate huge amounts of data at comparatively low costs and impressively
high quality” [40]. In future work, we hope to take advantage of the prototype open semantic
annotation system introduced here to investigate the system-level effects of applying different
incentive strategies based on those that have been shown to be successful in other open Web
applications.
The design for the Moby Annotator and its more general-purpose predecessor, the Entity
Describer, was inspired by social bookmarking applications which, for incentive, rely
exclusively on what has been called “passive altruism” [11]. In social bookmarking systems,
users are provided with a means to satisfy a personal need, that of organizing online bookmark
collections, but, as they use the system to fulfill this need, their actions passively contribute to
the benefit of the community [41]. While the individual users don’t necessarily intend to help
the community or the creators of the tool that they use, the fact that the assertions they make
(that Web page X should be labelled with tags Y and Z) are available in a public information
space makes it possible to integrate them to form a valuable collective product. This is exactly
the same basic phenomenon that made search engines that take advantage of the link structure of
the Web possible; authors of hyperlinks in Web pages never intended to make it possible for
Google to exist, but because their collective actions were recorded in the public space of the
Web, they had exactly that effect. As it requires essentially no direct financial input, has been
shown to produce very successful products and because the Moby Annotator would require only
minor extensions to support the generation of personal collections of semantically tagged Web
services that could be used in the context of applications that aid in the discovery and use of Web
services like Taverna [42, 43], passive altruism is certainly an incentive mechanism we will be
attending to in the future. That being said, a serious potential problem with it is that it seems to
require a scale of users much larger than is likely to arise in the near future for the relatively
small niche of people interested in bioinformatics Web services.
Open annotation systems that do not invoke any active incentive structure often end up
producing a very large number of annotations for a very small number of items. In the context of
Web services, it is likely that NCBI’s extremely important BLAST (Basic Local Alignment and

172
Search Tool) services could garner hundreds or thousands of interested user-annotators but that
smaller niche services, such as those related to the parsing of the XML structure used by a
particular database devoted to the genome of the sunflower, would receive little, if any attention
and thus little annotation. Since the services in the smaller niches are often the most difficult to
find and integrate and are thus the ones that would benefit the most from effective semantic
annotation, this is a serious problem. To address it, other, more active incentive structures are
likely to be needed.
To produce active incentive, some form of payment must be utilized. The most obvious form is
simply cash; we could follow traditional principles and hire and train annotators. However, the
small number of professional annotators that most research projects can afford to pay is exactly
the bottleneck that open annotation systems hope to avoid. To make use of the power and scale
of collective intelligence while still engaging direct financial incentive, perhaps it would be
possible to use a system like Amazon’s Mechanical Turk (AMT) to gather many small,
inexpensive contributions from a large number of people [44]. In the context of human linguistic
annotation (marking up sentences to train machine learning algorithms for natural language
processing) the AMT has been used to achieve a remarkable volume and quality of manual
annotations for very little money and in extremely short amounts of time [37]. Whether or not
and how such approaches can be used in domains such as Web service annotation, that typically
seem to require more expert-level knowledge, is a key area for future research that would be
possible to address using the Moby Annotator framework.
Another form of payment that has been used effectively to generate large numbers of annotations
at almost no cost is, surprisingly, fun [35]. Luis Von Ahn and colleagues have created a highly
successful research platform called “Games With a Purpose” with which they are investigating
ways that knowledge of various forms can be collected from people through the actions they
perform in the context of specifically designed online games [45]. As with the AMT
experiments, the results of these investigations indicate that games can be highly effective in
contexts that do not involve expert knowledge, such as labelling images of pets, but, to the best
of our knowledge, these techniques have not been tried in more expert contexts. Once again, this
is a fascinating and important area for future research.

173
Before concluding, we introduce just one more important potential form of payment that could
have relevance to the problem of semantic annotation. Michael Nielsen has suggested that the
critical limiting resource in science today is not money or technology, but expert attention [46].
Perhaps it would be possible to trade directly in this commodity by setting up markets within
which tasks requiring expert knowledge, such as the semantic annotation of complex Web
services, could be traded between people with different skill sets. Such a structure might help to
address potential problems in other active incentive strategies; by trading directly in expertise,
not only might quality be increased, but the potential problems related to unscrupulous users
gaming the incentive systems would likely be eliminated. The complexities of how such a
system might be created and how it might be applied specifically to the semantic annotation
problem form yet another vast and important domain for future explorations.
7.6 Conclusions
In this study, we have demonstrated that, though individual user-generated semantic annotations
vary widely, even simple algorithms for merging these assertions can be used to generate
collective products of quality approaching that to be expected from teams of expert annotators.
Given sufficient community involvement, effective interface design, and the intelligent
integration of multiple user contributions, open social annotation appears to be a viable strategy
for accumulating semantic annotations for Web services in the domain of bioinformatics. Aside
from expected improvements in both interface design and algorithms for aggregating assertions,
the principal challenge ahead is in understanding the processes involved in motivating
participation.
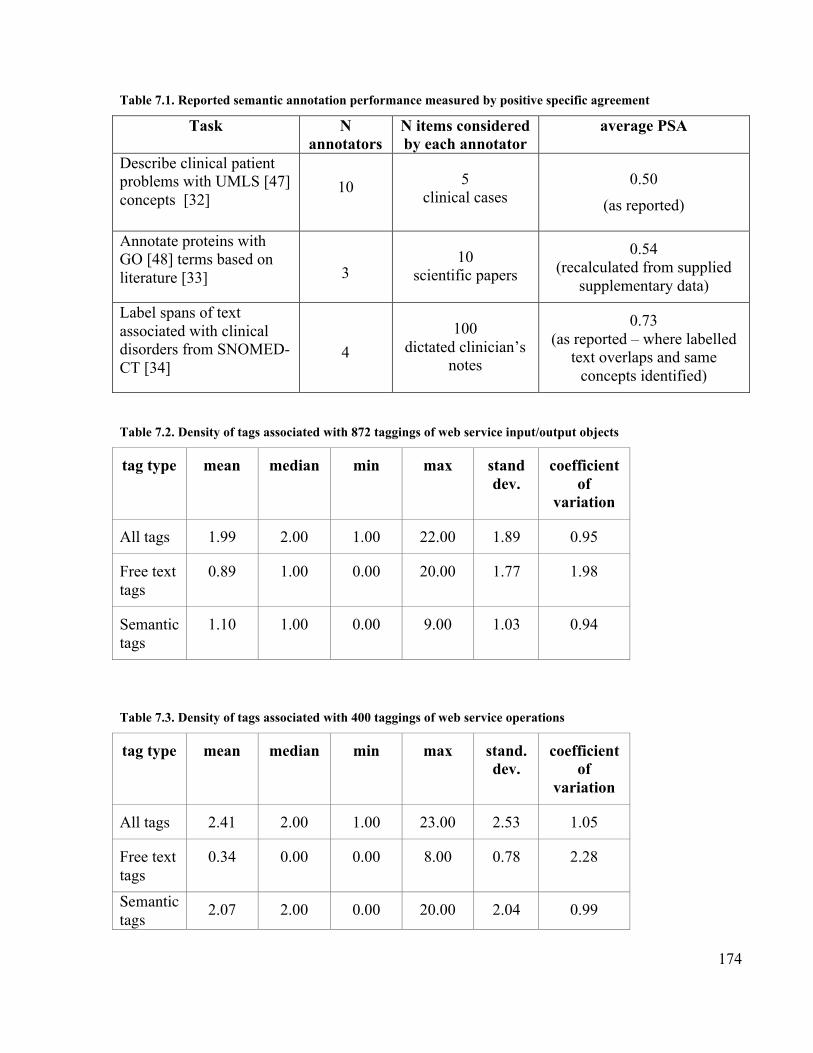
174
Table 7.1. Reported semantic annotation performance measured by positive specific agreement
Task Nannotators
N items consideredby each annotator
average PSA
Describe clinical patientproblems with UMLS [47]concepts [32]
10 5clinical cases
0.50(as reported)
Annotate proteins withGO [48] terms based onliterature [33] 3
10scientific papers
0.54(recalculated from supplied
supplementary data)
Label spans of textassociated with clinicaldisorders from SNOMED-CT [34]
4100
dictated clinician’snotes
0.73(as reported – where labelled
text overlaps and sameconcepts identified)
Table 7.2. Density of tags associated with 872 taggings of web service input/output objects
tag type mean median min max standdev.
coefficientof
variation
All tags 1.99 2.00 1.00 22.00 1.89 0.95
Free texttags
0.89 1.00 0.00 20.00 1.77 1.98
Semantictags
1.10 1.00 0.00 9.00 1.03 0.94
Table 7.3. Density of tags associated with 400 taggings of web service operations
tag type mean median min max stand.dev.
coefficientof
variation
All tags 2.41 2.00 1.00 23.00 2.53 1.05
Free texttags
0.34 0.00 0.00 8.00 0.78 2.28
Semantictags 2.07 2.00 0.00 20.00 2.04 0.99

175
Table 7.4. Positive specific agreement, semantic and free tags for objects and operations
N pairs mean median min max stand.dev.
coefficientof variation
Free,Object 1658.00 0.09 0.00 0.00 1.00 0.25 2.79
Semantic,Object 3482.00 0.44 0.40 0.00 1.00 0.43 0.98
Free,Operation 210.00 0.13 0.00 0.00 1.00 0.33 2.49
Semantic,Operation 2599.00 0.54 0.67 0.00 1.00 0.32 0.58
Table 7.5. Average agreement between each user and standard
subjecttype
measure mean median min max stand.dev.
coefficient ofvariation
PSA 0.52 0.51 0.32 0.71 0.11 0.22
Precision 0.54 0.53 0.33 0.74 0.13 0.24
Objects
Recall 0.54 0.54 0.30 0.71 0.12 0.21
PSA 0.59 0.60 0.36 0.75 0.10 0.18
Precision 0.81 0.79 0.52 1.0 0.13 0.16
Operations
Recall 0.53 0.50 0.26 0.77 0.15 0.28

176
Figure 7.1. Structure of annotations in the Semantic Tagging ontology
Each recorded annotation (Tagging Event) keeps track of the author, the item tagged, the timethe annotation took place, and the tags applied. Both free text and semantic tags can be used.Semantic tags are linked to ontology classes using the RDF-Schema annotation property‘isDefinedBy’.

177
Figure 7.2. Screenshot of Moby Annotator
The user has entered the semantic tags ‘keyword’ and ‘bioinformatics metadata’ to describe theservice input (in the leftmost input area) and is currently in the process of annotating its output.
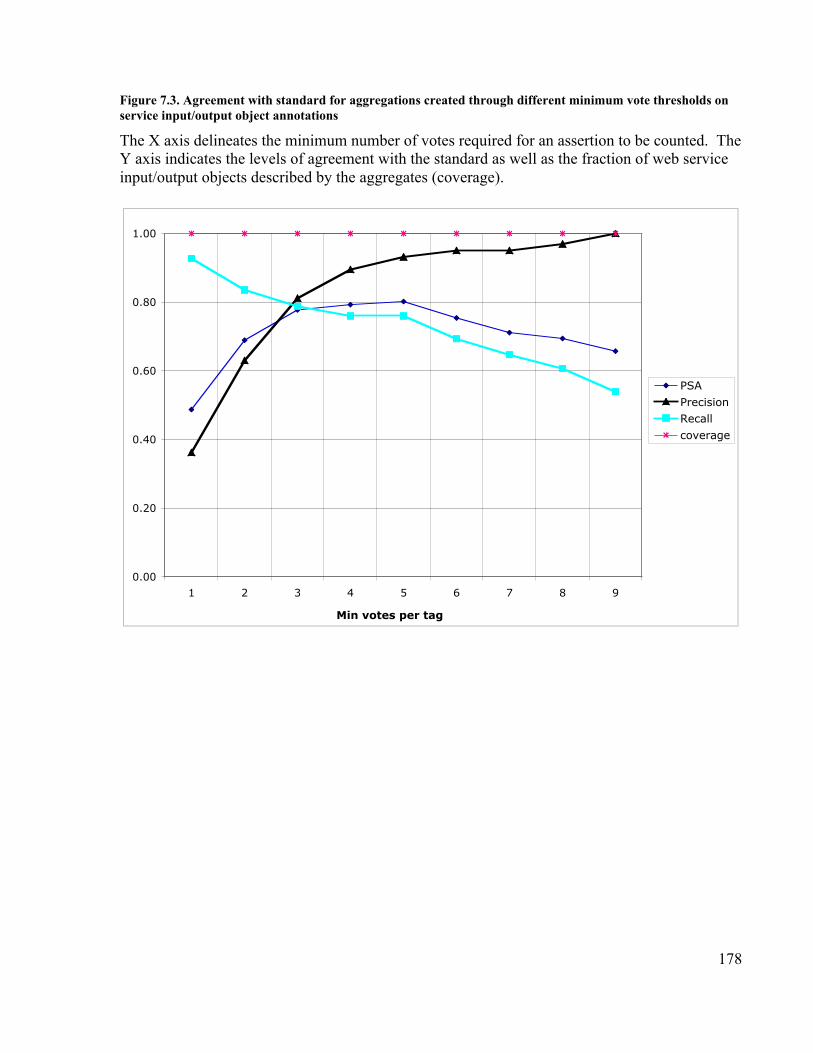
178
Figure 7.3. Agreement with standard for aggregations created through different minimum vote thresholds onservice input/output object annotations
The X axis delineates the minimum number of votes required for an assertion to be counted. TheY axis indicates the levels of agreement with the standard as well as the fraction of web serviceinput/output objects described by the aggregates (coverage).
0.00
0.20
0.40
0.60
0.80
1.00
1 2 3 4 5 6 7 8 9
Min votes per tag
PSA
PrecisionRecall
coverage

179
Figure 7.4. Agreement with standard for aggregations created through different minimum vote thresholds onservice operation annotations
The X axis delineates the minimum number of votes required for an assertion to be counted. TheY axis indicates the levels of agreement with the standard as well as the fraction of web serviceoperations described by the aggregates (coverage).
0.00
0.20
0.40
0.60
0.80
1.00
1 2 3 4 5 6 7 8 9
Min votes per tag
PSAPrecisionRecallcoverage

180
References
1. Halpin H, Thompson HS: One document to bind them: combining XML, webservices, and the semantic web. In: 15th International conference on the World WideWeb: 2006; Edinburgh, Scotland: ACM; 2006.
2. Stein L: Creating a bioinformatics nation. Nature 2002, 417(6885):119-120.3. Wroe C, Stevens R, Goble C, Roberts A, Greenwood M: A suite of DAML+OIL
ontologies to describe bioinformatics web services and data. Interational Journal ofCooperative Information Systems 2003, 2(2):197-224.
4. Hull D, Stevens R, Lord P, Wroe C, Goble C: Treating "shimantic web" syndromewith ontologies. In: Advanced Knowledge Technologies Semantic Web ServicesWorkshop: 2004; Milton Keynes, United Kingdom; 2004.
5. Radetzki U, Leser U, Schulze-Rauschenbach SC, Zimmermann J, Lassem J, Bode T,Cremers AB: Adapters, shims, and glue--service interoperability for in silicoexperiments. Bioinformatics 2006, 22(9):1137-1143.
6. Wolstencroft K, Alper P, Hull D, Wroe C, Lord PW, Stevens RD, Carole A G: The(my)Grid ontology: bioinformatics service discovery. International Journal ofBioinformatics Research and Applications 2007, 3(3):303-325.
7. Heß A, Johnston E, Kushmerick N: ASSAM: A tool for semi-automatically annotatingsemantic web services. In: International Semantic Web Conference: 2004; Hiroshima,Japan: Springer; 2004: 320-334.
8. Heß A, Kushmerick N: Learning to attach semantic metadata to web services. In:International Semantic Web Conference: 2003; Sanibel Island, Florida, USA: Springer;2003: 258-273.
9. Belhajjame K, Embury SM, Paton NW, Stevens R, Goble CA: Automatic annotation ofWeb services based on workflow definitions. ACM Transactions on the Web (TWEB)2008, 2(2):1-34.
10. Wilkinson M, Gessler D, Farmer A, Sten L: The BioMOBY Project Explores Open-Source, Simple, Extensible Protocols for Enabling Biological DatabaseInteroperability. In: The Virtual Conference on Genomics and Bioinformatics 2003;2003: 16-26.
11. Wilkinson MD, Senger M, Kawas E, Bruskiewich R, Gouzy J, Noirot C, Bardou P, NgA, Haase D, Saiz Ede A et al: Interoperability with Moby 1.0--it's better than sharingyour toothbrush! Brief Bioinform 2008, 9(3):220-231.
12. Amino Acid Sequence in BioMoby Object ontology[http://biomoby.org/RESOURCES/MOBY-S/Objects/AminoAcidSequence]
13. Covitz PA, Hartel F, Schaefer C, De Coronado S, Fragoso G, Sahni H, Gustafson S,Buetow KH: caCORE: A common infrastructure for cancer informatics.Bioinformatics 2003, 19(18):2404-2412.
14. iANT_entry_db-xml in BioMoby Object ontology[http://biomoby.org/RESOURCES/MOBY-S/Objects/iANT_entry_db-xml]
15. Hull D: Enabling Semantic Web Services in BioMOBY. Masters. Manchester:University of Manchester; 2003.
16. Good BM, Kawas EA, Wilkinson MD: Bridging the gap between social tagging andsemantic annotation: E.D. the Entity Describer. In: Nature Precedings. 2007.

181
17. The Entity Describer [http://www.entitydescriber.org]18. Moby Annotator: Interface used in Jamboree Phase 1 experiment
[http://www.entitydescriber.org/ed/annotator.html]19. RDF Primer [http://www.w3.org/TR/rdf-primer/ ]20. SPARQL Query Language for RDF [http://www.w3.org/TR/rdf-sparql-query/]21. OWL Web Ontology Language Overview [http://www.w3.org/TR/owl-features/ ]22. Semantic Tagging Ontology: used in the Entity Describer
[http://bioinfo.icapture.ubc.ca/Resources/SemanticTagging/]23. Tag ontology [http://www.holygoat.co.uk/projects/tags/ ]24. RDF Vocabulary Description Language 1.0: RDF Schema
[http://www.w3.org/TR/rdf-schema/]25. Del.icio.us [http://del.icio.us/]26. Hammond T, Hannay T, Lund B, Scott J: Social Bookmarking Tools (I): A General
Review. D-Lib Magazine 2005, 11(4).27. Lund B, Hammond T, Flack M, Hannay T: Social Bookmarking Tools (II): A Case
Study - Connotea. D-Lib Magazine 2005, 11(4).28. myGrid Domain Ontology, RDF-S version
[http://www.mygrid.org.uk/ontology/myGridDomainOntology.rdfs]29. Freebase [http://www.freebase.com]30. Metaweb Technologies, Inc. [http://www.metaweb.com/]31. Hripcsak G, Rothschild AS: Agreement, the F-Measure, and Reliability in
Information Retrieval. Journal of the American Medical Informatics Association :JAMIA 2005, 12(3):296-298.
32. Rothschild AS, Lehmann HP, Hripcsak G: Inter-rater agreement in physician-codedproblem lists. AMIA Annu Symp Proc 2005:644-648.
33. Camon E, Barrell D, Dimmer E, Lee V, Magrane M, Maslen J, Binns D, Apweiler R: Anevaluation of GO annotation retrieval for BioCreAtIvE and GOA. BMCBioinformatics 2005, 6(Suppl 1):S17.
34. Ogren PV, Savova G, Chute CG: Constructing Evaluation Corpora for AutomatedClinical Named Entity Recognition. In: 12th World Congress on Health (Medical)Informatics: 2007: IOS Press; 2007: 2325-2330.
35. Ahn Lv, Dabbish L: Labeling images with a computer game. In: SIGCHI conferenceon Human factors in computing systems: 2004; Vienna, Austria: ACM Press; 2004: 319-326
36. Good BM, Wilkinson MD: Ontology engineering using volunteer labor. In: WorldWide Web Conference: 2007; Banff, Canada; 2007: 1243-1244.
37. Snow R, O’Connor B, Jurafsky D, Ng AY: Cheap and Fast — But is it Good?Evaluating Non-Expert Annotations for Natural Language Tasks. In: EmpiricalMethods in Natural Language Processing: 2008; Honolulu, Hawaii, USA; 2008.
38. Sen S, Lam SK, Rashid AM, Cosley D, Frankowski D, Osterhouse J, Harper FM, Riedl J:tagging, communities, vocabulary, evolution. In: Computer Supported CollaborativeWork: 2006; Banff, Alberta, Canada; 2006.
39. Good BM, Wilkinson MD: The Life Sciences Semantic Web is Full of Creeps! BriefBioinform 2006, 7(3):275-286.
40. International Journal of Knowledge Engineering and Data Mining (IJKEDM) CallFor papers on: "Incentives for Semantic Content Creation", due 30 March, 2009[https://www.inderscience.com/browse/callpaper.php?callID=1066]

182
41. Bokardo: The Del.icio.us Lesson [http://bokardo.com/archives/the-delicious-lesson/ ]42. Oinn T, Addis M, Ferris J, Marvin D, Senger M, Greenwood M, Carver T, Glover K,
Pocock MR, Wipat A et al: Taverna: a tool for the composition and enactment ofbioinformatics workflows. Bioinformatics 2004, 20(17):3045-3054.
43. Kawas E, Senger M, Wilkinson M: BioMoby extensions to the Taverna workflowmanagement and enactment software. BMC Bioinformatics 2006, 7(1):523.
44. Amazon Mechanical Turk [https://www.mturk.com/]45. Ahn Lv, Dabbish L: Designing games with a purpose. Communications of the ACM
2008, 51(8):58-67.46. The economics of scientific collaboration [http://michaelnielsen.org/blog/?p=526]47. Bodenreider O: The Unified Medical Language System (UMLS): integrating
biomedical terminology. Nucl Acids Res 2004, 32(90001):D267-270.48. Ashburner M, Ball CA, Blake JA, Botstein D, Butler H, Cherry JM, Davis AP, Dolinski
K, Dwight SS, Eppig JT et al: Gene ontology: tool for the unification of biology. TheGene Ontology Consortium. Nature Genetics 2000, 25(1):25-29.

183
8 iHOPerator: User-scripting a personalized bioinformatics Web, starting with the iHOP
website10
8.1 Background
User-scripts are programs, typically written in JavaScript, that are installed inside web-browsers.
They manipulate the content of specified sets of Web pages prior to their display in the browser.
The name ‘user-script’ may be slightly misleading as a typical user of a Web browser will not
likely write user-scripts (but see [1] for work on making this more feasible). The name might
more appropriately be ‘user-side-scripts’ to convey the notion that the script operates within the
user’s browser and that its installation and activation is under the user’s control. For brevity and
to stay in alignment with common terminology, we will use ‘user-scripts’ throughout the rest of
the text.
User-scripts can be used to perform tasks including, but not limited to: automatically adjusting
style sheets, stripping unwanted advertisements, integrating the content of multiple Web
resources, or introducing novel visualizations. Anyone capable of writing JavaScript can write
and share user-scripts that alter the content displayed on any Web page. By writing or locating a
suitable user-script, for example in a public repository such as userscripts.org [2], and installing
it in their browser, users gain unprecedented control over the content that is ultimately displayed
in their browser window. User-scripts thus offer an immediate mechanism by which the Web
browsing experience can be shifted from its current resource-centred pattern of control towards a
more user-centred view.
Here we introduce the iHOPerator – a user-script designed to provide an enhanced, customized
view of the iHOP website, a key bioinformatics resource describing proteins, their properties,
and the relationships that hold between them. We describe how the iHOPerator script generates
and embeds a novel visualization of the contents of the iHOP Web pages and extends the content
of those pages with information gathered from related, external Web resources. We conclude
10 A version of this chapter has been published. Good BM, Kawas EK, Kuo BY, Wilkinson MD: iHOPerator: User-scripting a personalized bioinformatics Web, starting with the iHOP website. BMC Bioinformatics 2006, 7:534

184
with a discussion of the potential implications of user-scripts, describing their relationship with
the emerging Semantic Web in the life sciences.
8.1.1 iHOP
The iHOP database provides information about proteins that have been automatically associated
with PubMed abstracts [3-5]. Using the iHOP website [6], it is possible to browse through the
literature using hyperlinks that associate abstracts to one another using co-occurring genes. After
identifying a gene of interest, a user may navigate to a page that contains the “defining
information” for the gene. This information consists of the gene’s names in different databases,
its source organism, and a potentially very long list of snippets of text that have been extracted
from abstracts associated with the gene (Figure 8.1).
The purpose of the iHOPerator user-script is to enhance the user’s experience when visiting the
iHOP Web page. It does this by providing a new way to visualize some of the information
presented on the gene-information Web pages and by extending the content of these pages using
relevant third party resources such as PubMed[7] and the Kyoto Encyclopaedia of Genes and
Genomes (KEGG)[8].
8.1.2 Tag clouds
Tag clouds are visually-weighted renditions of collections of words (‘tags’) that are used to
describe something [9]. Tags in a cloud are sized, organized and coloured so as to illustrate
aspects of the relationship between each tag and the entity that it describes. Tag clouds have
recently gained popularity in ‘social-tagging’ applications such as Flickr [10], Connotea [11],
and Del.icio.us [12] because they provide a mechanism through which untrained users can
quickly visualize the dominant features of voluminous databases and because they provide a
visually based navigation paradigm that is complementary to text search and operates naturally
over non-hierarchically organized information systems.
The iHOPerator user-script provides tag clouds that display the defining information for a gene
by processing the contents of the iHOP abstract snippets. For example, (Figure 8.2) shows a tag
cloud generated using MESH terms gathered from abstracts associated with the gene Brca1. In

185
the cloud, the size of the term is used to display the frequency of occurrence of that term in the
context of abstracts associated with Brca1 and colour is used to highlight the impact factor of the
journals in which the terms appear.
8.2 Implementation
The iHOPerator is a user-script, a JavaScript that can be embedded in a Web browser such that it
processes the contents of visited Web pages prior to their presentation to the user. Though a user-
script may be instructed to process any set of Web pages, (e.g. those from a particular domain)
the iHOPerator is focused specifically on the gene-information pages of the iHOP website.
8.2.1 GreaseMonkey
At this time, most user-scripts require extensions to Web browsers such as GreaseMonkey [17]
for Mozilla’s Firefox, Creammonkey [18] for Apple’s Safari, and Turnabout [19] for Microsoft’s
Internet Explorer. Though user-scripts for each of these browsers are written in JavaScript, there
are no accepted standards for user-script extensions and thus scripts written for one browser may
or may not work in another browser. As user-scripts become more popular, standardization
efforts are likely to emerge that will improve script/browser interoperability; for the moment
however, the iHOPerator is built for Firefox and is thus dependent on the GreaseMonkey
extension for its operation.
The GreaseMonkey/Firefox combination was chosen for this project because both are cross-
platform, actively developed, open source, and because GreaseMonkey was the first and is still
the most widely used browser extension for housing user-scripts. We utilize GreaseMonkey to
add a tag cloud to pages describing genes on the iHOP website by processing the HTML and
JavaScript present on those pages prior to presentation in the browser. As well, we extend the
content of the website by utilizing the GreaseMonkey API to retrieve content from external
HTTP-accessible resources.
186
8.2.2 Generating tag clouds
The iHOPerator script produces tag clouds based either on MESH keywords from the abstracts
associated with a gene (Figure 8.2) or from other genes that iHOP identifies as interacting with
the gene (Figure 8.3). From the user’s perspective, these tag clouds appear to be embedded
directly within the iHOP Web page (Figure 8.4). The process of generating the tag cloud works
as follows:
1. Extract tags (MESH keywords or interacting genes) embedded in the HTML of the page.
(This is greatly facilitated by the presence of XML mark-up of these entities provided by
the iHOP website).
2. Count the number of occurrences of each tag
3. Calculate a score for the tag based on its relative frequency in the page.
4. Collect the impact factor assigned to each abstract and associate it with the appropriate
tag. (Once again, this is facilitated by XML mark-up in the iHOP page).
5. Find the average impact factor associated with each tag.
6. Produce the HTML for the cloud by
a. Assigning each tag to a predefined Cascading Style Sheet class that is associated
with a particular size and colour that is determined by the frequency of occurrence
of the tag in the page and the average impact factor of the journals associated with
the tag occurrences respectively.
b. Sorting the tags alphabetically.
The iHOPerator script also allows the user to customize the interface by selecting different
ranges for the font sizes in the cloud and by specifying whether iHOPerator-generated content
should be hidden, display in another window, or display within the iHOP Web page.
8.2.3 Integrating 3rd-party content
Aside from the tag-cloud based visualization (produced entirely using JavaScript operating
within the browser), a key feature of the iHOPerator script is its ability to acquire and display
third-party content related to the gene in the same browser-context. For example, the script

187
utilizes GreaseMonkey’s built in support for AJAX (Asynchronous JavaScript and XML) to
execute an asynchronous HTTP request that invokes a BioMoby [13] Web service workflow
stored as a Java servlet that, when possible, provides KEGG pathway diagrams containing the
gene of interest (Figure 8.5). The script also makes it possible for the user to access relevant
external websites using an embedded IFRAME element. This allows the user to view the
abstracts associated with the gene and/or MESH term of interest or to initialize a Web service
browsing session using the Gbrowse Moby [14] BioMoby client application that originates with
a gene selected from the cloud. Without the iHOPerator, each of these activities would require
that the user find the additional resources themselves, learn how to use them, cut and paste
search terms into them, and of course, navigate away from the iHOP website.
8.3 Related work
Within the bioinformatics domain, only a few examples of user-scripts appear to exist so far. At
the time of this writing, only two were listed at the primary global repository [2] and one was
identified via Web search [15]. Both scripts listed on [2] facilitate the addition of bookmarks to
articles listed in PubMed [7] to similar science-focused social bookmarking systems, Connotea
[11] and CiteULike [16]. In the other, Pierre Lindenbaum provides a script that generates a
TreeMap [17] visualization of Connotea reference collections [15].
8.4 Discussion
At present, Web browsers are the dominant technology used to satisfy the information gathering
and visualization needs of life scientists. In their current form, browsers provide users with the
ability to retrieve information from widely distributed sources, but essentially no means to
integrate information from multiple sources and only a very constrained set of operations for
manipulating the display of that information. Given the distributed nature of information on the
Web and the diversity of user requirements in interacting with that information, this situation is
unsatisfactory.
In most current implementations, Web browsers facilitate information transfer between only two
parties – the resource provider, who determines all information presented, all links to external

188
resources, and nearly all manner of visualizing that information; and the consumer, who
essentially can only control which page they choose to view next. The typical Web browsing
experience can thus be characterized as resource-centric because everything that the user sees on
a Web page is governed entirely by the resource provider.
By introducing an additional layer of processing that occurs only at the discretion of the user (by
choosing whether or not to install a given script), user-scripts offer a way to effect a transition
towards a user-centric browsing experience. Though it has always been possible for the
technically skilled to engineer their own software for processing Web content (e.g. the notorious
‘screen-scraping’ characteristic of early bioinformatics [18]), the arrival of popular browser
extensions such as GreaseMonkey marks the beginning of a fundamental change in the way end-
users can interact with the Web. Empowered with the ability to easily embed scripts directly into
their browser and to find such scripts in public repositories, Web users can now more actively
make decisions about what Web content they see and how that content is presented.
Despite its intriguing, paradigm-shifting nature, the user-script concept is not without its
problems. Because Web content is still primarily provided as HTML, user-scripts must process
HTML in order to function. This is problematic for two reasons: 1) HTML is not designed for
knowledge or data representation and hence is difficult to parse consistently and 2) HTML
representations may change frequently even when the underlying data does not. The former
makes it challenging to write effective user-scripts, particularly scripts that are intended to
operate over multiple Web pages. The latter makes these scripts brittle in the face of superficial
changes to their inputs and thus potentially unreliable [18]. Since information on the Web is
currently provided primarily as HTML, alterations to the structure of this content are frequent
and necessary results of the need to keep the browsable interfaces up to date. To alleviate these
problems, it would clearly be beneficial if the underlying data could be exposed in a manner that
was independent of its HTML representation
The potential value of separating content from presentation provides motivation for the Semantic
Web [19] initiative and the standards for the annotation of Web resources, such as the Resource
Description Framework (RDF)[20] and the Web Ontology Language (OWL)[21], that have
recently emerged from it. With these standards in place, content providers are encouraged to

189
provide a representation of their data for visualization (HTML) in parallel with an additional
representation of their data for machine-interpretation (RDF/OWL). This would enable those
who wish to utilize the content in novel ways to process the more stable, machine-readable
representations while remaining unaffected by visual modifications to the associated websites.
Though widespread adoption of Semantic Web standards by the community may, in principle,
enable the creation of powerful, user-centred applications that go beyond the capabilities of user-
script enabled browsers [22], this process is occurring very slowly [23] and the problems faced
by life scientists in gathering, integrating and interpreting information on the Web are pressing.
In their current form, user-scripts, such as the iHOPerator, provide an immediate means to
address these needs and thus should be more widely exploited to this end.
8.5 Conclusions
By adding the iHOPerator user-script to their browser, users gain access to 1) a novel method of
visualizing and navigating the defining information about genes on the iHOP website and 2)
enhancements to that information that are gathered automatically using external resources such
as PubMed and KEGG. The iHOPerator thus provides an extension to the iHOP website that
demonstrates how user-scripts can be used to personalize and to enhance the Web browsing
experience in a biological context.
User-scripts represent a small, but immediate and useful step in the direction of a user-centred
rather than a resource-centred Web browsing experience. In contrast to other proposed routes to
achieving this goal, they offer a mechanism that can be effected immediately using existing
resources and representations to provide end-users with a straightforward way to exert greater
control over what and how they see on the Web.
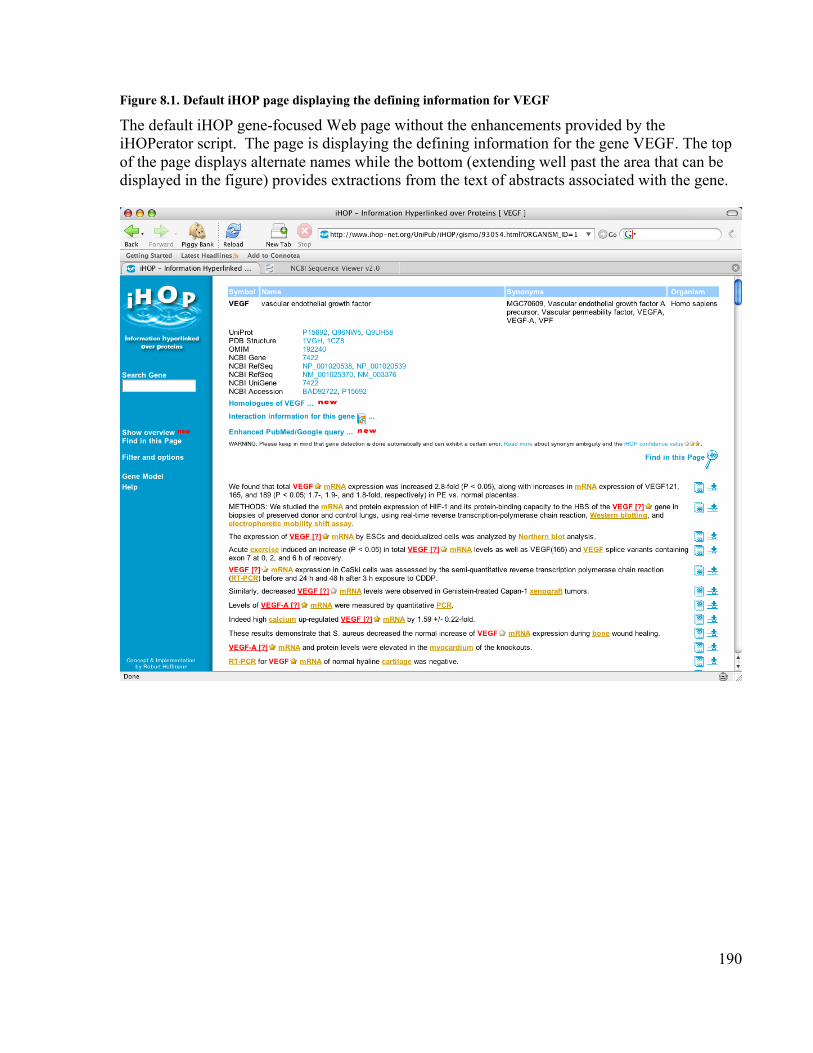
190
Figure 8.1. Default iHOP page displaying the defining information for VEGF
The default iHOP gene-focused Web page without the enhancements provided by theiHOPerator script. The page is displaying the defining information for the gene VEGF. The topof the page displays alternate names while the bottom (extending well past the area that can bedisplayed in the figure) provides extractions from the text of abstracts associated with the gene.

191
Figure 8.2. A tag cloud built from MESH terms associated with Brca1
This tag cloud was built automatically using the iHOPerator user-script. It is composed ofMESH terms extracted from abstracts associated with the gene Brca1 (in mouse). Colour(redness) correlates with the impact factor of the journals where the term occurs. Size correlateswith the number of times the term occurs in association with the gene – in this case Brca1.
Figure 8.3. A tag cloud built from genes related to Brca1
This tag cloud was built automatically using the iHOPerator user-script. It is composed of genenames extracted from abstracts associated with the gene Brca1 (in mouse). Colour (redness)correlates with the impact factor of the journals where the gene name occurs. Size correlateswith the number of times the related gene name occurs in association with the gene in question–in this case Brca1.

192
Figure 8.4. The iHOP webpage enhanced by the iHOPerator user-script
The iHOP webpage after it has been enhanced with the iHOPerator user-script. Compare withFigure 8.1. The Web page now includes a tag cloud composed of MeSH terms from abstractsassociated with the gene Brca1 in mouse as well as a panel of controls for manipulating the newvisualization. The number of terms used to build the cloud, the scale of the fonts used, thepresence or absence of the cloud on the page, and the actions taken when the user clicks on anelement of the cloud are all under the user's control.
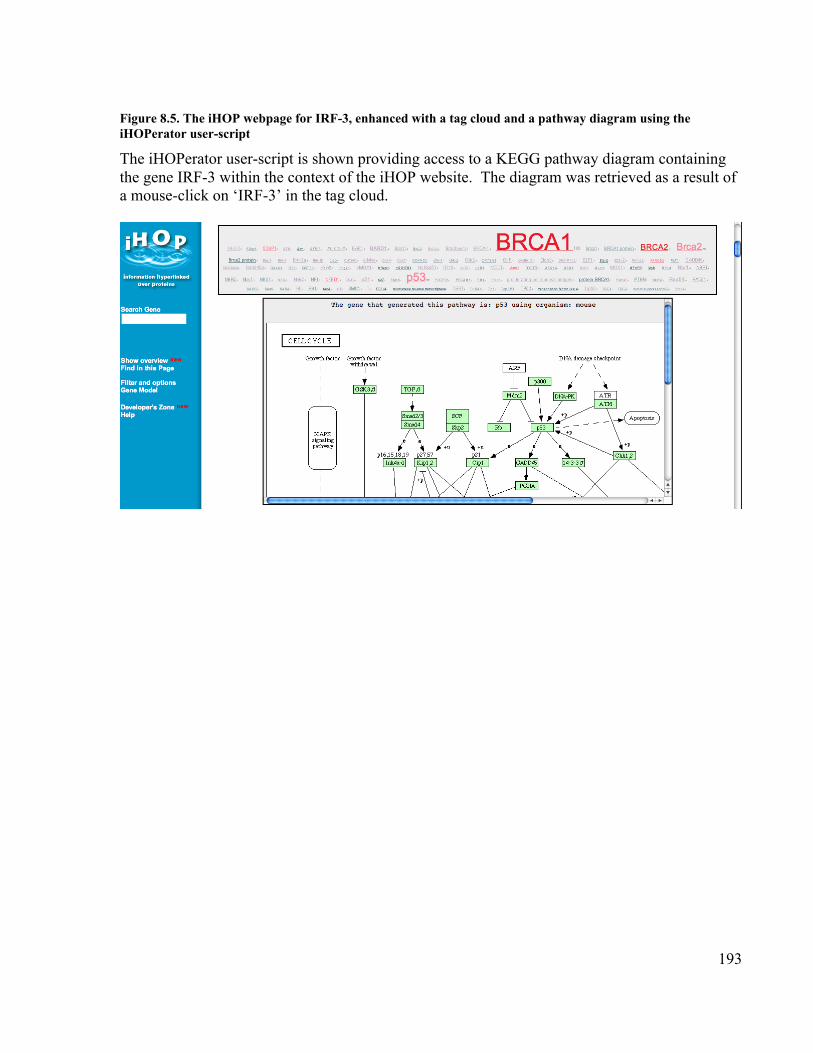
193
Figure 8.5. The iHOP webpage for IRF-3, enhanced with a tag cloud and a pathway diagram using theiHOPerator user-script
The iHOPerator user-script is shown providing access to a KEGG pathway diagram containingthe gene IRF-3 within the context of the iHOP website. The diagram was retrieved as a result ofa mouse-click on ‘IRF-3’ in the tag cloud.

194
References
1. Bolin M: End-User Programming for the Web. Masters Thesis in ElectricalEngineering and Computer Science. Boston: Massachusets Institute of Technology;2005.
2. Userscripts.org - Universal Repository [http://userscripts.org/ ]3. Hoffmann R, Krallinger M, Andres E, Tamames J, Blaschke C, Valencia A: Text mining
for metabolic pathways, signaling cascades, and protein networks. Sci STKE 2005,2005(283):e21.
4. Hoffmann R, Valencia A: Implementing the iHOP concept for navigation ofbiomedical literature. Bioinformatics 2005, 21 Suppl 2:252-258.
5. Hoffmann R, Valencia A: A gene network for navigating the literature. Nat Genet2004, 36(7):664.
6. iHOP - Information Hyperlinked over Proteins [http://www.ihop-net.org/UniPub/iHOP/ ]
7. Entrez PubMed [http://www.ncbi.nlm.nih.gov/entrez/query.fcgi?db=PubMed ]8. Kanehisa M, Goto S, Kawashima S, Okuno Y, Hattori M: The KEGG resource for
deciphering the genome. Nucleic acids research 2004, 32(Database issue):277-280.9. Tag cloud - Wikipedia, the free encyclopedia [http://en.wikipedia.org/wiki/Tag_cloud ]10. Flickr [http://www.flickr.com/explore/ ]11. Connotea: free online reference management for clinicians and scientists
[http://www.connotea.org/ ]12. Del.icio.us [http://del.icio.us/tag/ ]13. Wilkinson MD, Links M: BioMOBY: an open source biological web services
proposal. Briefings in bioinformatics 2002, 3(4):331-341.14. GBrowse: MOBY-S Web Service Browser [http://mobycentral.icapture.ubc.ca/cgi-
bin/gbrowse_moby ]15. A GreaseMonkey Script to Display SVG TreeMaps of Tags in Connotea
[http://www.urbigene.com/gmconnoteasvg/ ]16. CiteULike: A free online service to organize your academic papers
[http://www.citeulike.org/ ]17. Treemaps for space-constrained visualization of hierarchies
[http://www.cs.umd.edu/hcil/treemap-history/ ]18. Stein L: Creating a bioinformatics nation. Nature 2002, 417(6885):119-120.19. Berners-Lee T, Hendler J, Lassila O: The Semantic Web. Scientific American 2001,
284(5):34-43.20. W3C RDF Primer [http://www.w3.org/TR/rdf-primer/ ]21. OWL Web Ontology Language Overview [http://www.w3.org/TR/owl-features/ ]22. Quan D, Karger D: How to make a semantic web browser. In: International World
Wide Web Conference: 2004; New York, NY, USA: ACM Press; 2004: 255-265.23. Good BM, Wilkinson MD: The Life Sciences Semantic Web is Full of Creeps! Brief
Bioinform 2006.
195
9 Conclusion
9.1 Summary
The diverse topics discussed in this dissertation were united under the common goal of enabling
the formation of a globally distributed semantic Web for research in the life sciences – a
Bioinfotopia. Within the context of the life sciences, the purpose of the semantic Web is clear
–it is to make possible a new generation of applications that will provide effective ways to make
use of the rapidly expanding and diversifying pool of biological data and knowledge. However,
the path to achieving this vision remains murky. While isolated demonstrations illustrate
potential, the larger goals of a united Bioinfotopia can not be realized without the collaborative
formation of truly unprecedented amounts of high quality metadata. The research conducted for
this dissertation thus explored new social and technical processes involved in creating and
evaluating the needed metadata. Specifically, this dissertation described new strategies for
amassing, characterizing, and applying metadata in the context of bioinformatics.
The strategies presented for amassing metadata addressed two key problems in the formation of
the semantic Web – the creation of ontologies and the accumulation of annotations that use
concepts from ontologies to provide computationally accessible descriptions for data. These
problems were approached through the generation and evaluation of new methods that involve
the application of crowdcasting within the context of knowledge acquisition processes. The
evaluations of these strategies, described in Chapters 2, 3, and 7, provided some of the first
evidence of the potential of this emerging technique in an expert-knowledge domain – offering
new possibilities to generate the raw material needed to build the semantic Web.
The strategies for characterizing metadata also addressed two problems – the automatic
quantification of characteristics of ontologies pertinent to the assessment of their quality and the
problem of forming direct, meaningful, empirical comparisons of disparate metadata resources
ranging from ontologies to folksonomies. Chapter 4 addressed the first problem with OntoLoki,
a methodology that taps into the information present on the semantic Web to measure the
consistency with which the instances of different ontology classes exhibit distinguishing patterns
of properties. Chapter 5 addressed the second, more generic, metadata characterization problem.

196
It described how features related to the terms used in different metadata resources could be used
to form clear, quantitative comparisons between very different resources. In addition to these
novel strategies, Chapter 6 provided the results of a thorough comparison of the products of
uncontrolled social tagging versus professional annotation in a relevant biomedical context.
Chapters 8 and 4 introduced strategies for applying metadata to problems in bioinformatics
related to the presentation and analysis of distributed information. Chapter 8 provided a novel
demonstration of how distributed metadata can be dynamically brought together to create new
user-centric applications that replace the resource-centric views furnished by most current
bioinformatics providers. In addition to giving insights into ontology quality, the methods
introduced in Chapter 4 demonstrated the automation of the knowledge discovery process made
possible by the realization of the semantic Web – offering the roots of a general purpose
application that intersects powerful tools in machine learning with information gathered
automatically from distributed sources.
Weaved together, these diverse threads of research converge towards the creation of systems that
will allow the biomedical research community to create and maintain a semantic Web for the life
sciences that will provide unprecedented opportunities for knowledge sharing and discovery. In
the remainder of this chapter, I suggest some general conclusions that can be made from this
work, identify some key areas to investigate in future research and finish with some thoughts
regarding science in the age of the Web.
9.2 Conclusions
As the volume and diversity of relevant data in bioinformatics continues to increase, systems that
effectively enable widespread community participation in the creation and maintenance of the
metadata needed to make it useful are becoming increasingly vital. In considering designs for
such systems for amassing third-party metadata, a few general conclusions can be drawn from
the results presented here.
The first conclusion is suggested by the title of a recent paper in Nature Reviews Microbiology –
“If you build it, they might come” [1]. Incentives must be considered when designing any
197
system that is dependent on human labour. As [1] discusses, there are already many examples
of systems that attempt to use wikis and similar technologies to generate collective information
resources in bioinformatics, but few of them have enjoyed much success thus far. For example,
though the article that described WikiProteins [2] has been downloaded thousands of times, only
a tiny fraction of that number have contributed anything to the project (Barend Mons, personal
communication). Most current efforts seem to rely exclusively on the altruist impulse to
motivate contributions. It seems that this alone is generally not enough to motivate busy
scientists.
A second conclusion emerges from Chapters 3, 6 and 7; open systems for amassing third-party
metadata should track and make computationally accessible provenance information regarding
all collected statements. Without this information, approaches for aggregating collective
metadata can not take advantage of voting processes (as in Chapters 6 and 7) or other more
sophisticated methods for combining multiple opinions (Chapter 3). In addition, information
regarding the authorship of different contributions can be used for citation – a potentially critical
kind of currency for use in motivating scientists. The capture and use of such provenance
information represents a key difference between the third-party metadata considered in this
dissertation and the metadata provided by institutional sources. For example, there is no
authorship information associated with the MeSH terms assigned to a particular resource in
PubMed. This is because we assume from the outset that all such statements are correct. In
socially generated content however, assessments of quality must be made based on the data at
hand rather than on pre facto assumptions of institutional authority. The additional information
required to make these judgements of quality forms a crucial component of third-party metadata
and provides the opportunity to implement novel functions (e.g. “find related users”).
A final broad conclusion is that, for scientific purposes, the products of different metadata
generating systems can and should be measured using quantitative, reproducible metrics. While
the specific approaches described in Chapters 4 and 5 represent useful independent advances,
perhaps the most important contribution of this aspect of this dissertation was to show that it is
possible to define automatically producible metrics in these domains. The OntoLoki method
described in Chapter 4 is the first to demonstrate a fully automatic, quantitative way to measure

198
properties of an ontology related directly to its quality. The methodology described in Chapter 5
is the first to approach a generic package for characterizing and directly comparing metadata
structures of different types (including folksonomies, thesauri, and ontologies). These strategies
show that the metadata generated by different systems can be investigated using quantitative
approaches and a naturalistic11 perspective. This perspective, that species of information systems
can be investigated much like species of animals – through the identification of measurable,
defining characteristics – is one that will only expand in value as increasing numbers of new
metadata-generating strategies are invented and applied in increasingly diverse contexts.
9.3 Future work
The work presented in this dissertation produced more questions than it did answers. Each
chapter presents a starting point for a new domain of research. For example, Chapter 2
illustrated the possibility of volunteer-based ontology creation but leaves open a raft of questions
about elements of such processes ranging from incentive, to interface, to context, to effective
quality evaluation. For example, how much does the presentation of the high score list in the
interface impact the amount and quality of knowledge collected? This is just one relatively
simple question, but to answer it robustly will require the implementation of many more
experiments. As another example, we demonstrated the potential power of collaborative
semantic annotation of Web services in Chapter 7, but more experiments with many more
participants are needed to not only provide stronger evidence for the claims made in that chapter
but also to answer questions related to the sustainability of such efforts, the effects of alternate
interface designs, etc.. With so many new avenues to investigate, a major concern for the future
of all social Web research is how to accomplish all of the needed experiments.
Two primary research designs were applied in this dissertation – naturalistic enquiry (Ch. 5, 6)
and ad hoc prototyping for the purpose of experimentation (Ch. 2,3,7,8). Naturalistic approaches
are powerful, and will be increasingly powerful as time progresses, because they make it possible
to measure systems that have been operating over long periods of time and have succeeded in
attracting large numbers of users. However, this approach is not well-suited when the topic of
interest (e.g. social semantic tagging of Web services) is too new for any implementations to 11 Naturalistic: “representing what is real; not abstract or ideal”, Wordnet [http://tinyurl.com/cmyj2c]
199
exist to study. The other pattern – of ad hoc prototyping – makes it possible to investigate newer
ideas but has significant drawbacks. First, it can be slow and expensive to create the prototypes,
so each new experiment may pose a substantial cost on the implementer. Second, and more
importantly, experiments may require large numbers of people to spend substantial amounts of
time participating. Time and money spent recruiting could thus pose problems in terms of cost
and could limit the potential reproducibility of the experiments.
While both the naturalistic and ad hoc approaches have their place, another pattern that deserves
serious consideration in the future is in-context experimentation. In this methodology,
experiments are conducted directly within the context of functional applications with extant,
active user populations. By manipulating aspects of the application and measuring the effects,
specific questions can be addressed in a flexible manner without the problems associated with
the recruiting process in the ad hoc model. An excellent example of this technique is provided
by a series of experiments conducted by scientists at the University of Minnesota in the context
of the MovieLens Web application. In this case, the research group first produced a successful
application which attracted many users. Now that the system is operational, they perform
experiments in which individual parameters of the system – such as the signup process or the
algorithms used for recommending tags – are varied and the responses of the user community to
these changes measured. For example, Drenner et al. conducted an experiment that proved that
by altering the initial signup process, they could permanently change the subsequent behaviour
of users on the site such that their individual actions resulted in a more useful collective product
(in this case dramatically increasing the amount of tags used to describe movies within the
system) [3].
Within the context of bioinformatics, there are already many important applications with highly
active user populations. In considering future research in the areas of social metadata creation
touched upon in this dissertation, it would be useful to embed experimental efforts directly into
the context of such functional applications. To achieve this, it is vital that social Web
researchers work closely with the teams that are responsible for producing the applications that
the end users will ultimately be interacting with. These applications are the Petri dishes of the
social Web. Such in-context research approaches would not only help with respect to running
200
experiments as described above, but would also help to keep the research focused tightly around
problems of relevance to the community that it is ultimately intended to serve.
With those experimental approaches in mind, I now suggest three (of many potential) topics for
future study that are key in our attempts to reach Bioinfotopia: incentives, upper ontologies, and
information visualization.
While it is now known that there is little wisdom in the phrase “if you build it, they will come”,
results discussed in this dissertation and elsewhere suggest that “if they come, you can build it”.
Whenever efforts to amass third-party metadata and other knowledge resources have succeeded
in acquiring sufficient numbers of participants, they have succeeded in their objectives. In
considering strategies for amassing third-party metadata, critical questions relate to how to get
them to come. I suggest that this problem might be addressed through two parallel lines of
research. One direction would be to focus on defining incentive structures to encourage
scientists to spend time contributing to community resources while the other would focus on the
generation of novel software that lets researchers contribute to collective metadata resources
passively. The former would involve basic research in the economics of scientific labour [4].
Such research would help system designers know what to expect when scientists are encouraged
with incentives ranging across money [5, 6], recognition [1], competition (as applied in Chapters
2 and 3), and perhaps even fun [7]. The latter would focus on building software that would make
it just as easy for researchers to share their structured knowledge as it is now for them to hide it –
thus engaging the potential for passive altruism to take effect. An excellent example of the roots
of one system like this, called the Science Collaboration Framework (SCF), has recently been
published [8] and many more are likely to follow.
In terms of both characterizing and applying metadata the possibilities for future research are
limitless, but one area that is both vital and seems reachable is in the derivation and increased
application of upper ontologies [9]. One of the main challenges in producing the OntoLoki
implementation was in deciding which of the many properties associated with the instances in
different knowledge bases should be crawled by the knowledge gathering agent. This decision
could be automated to a large extent if the agent ‘knew’ the ontologies used by the information
providers well enough to encode rules along the lines of “follow predicates of type 1, but not
201
predicates of type 2”. This could be achieved if the ontologies that defined the RDF predicates
(the links of the semantic Web) encountered by the agent were rooted in a consistent upper level
ontology of which the agent was aware. Though there are multiple implementations of such
upper ontologies, most ontologies are still not rooted in any of them. One reason for this may be
that the philosophical complexity of most upper ontologies is often too high to interest task-
oriented ontology developers (for example, many developers are not interested in learning what a
‘situoid’12 is). I suggest that a first, very simple step be made with the introduction of an
ontology of just two upper-level classes and two upper-level predicates. This ontology would
divide the entities of the semantic Web into two basic classes – those that are ‘natural’ based on
their attempts to represent aspects of the natural world, such as proteins and cellular
localizations, and those that are ‘artificial’ that are used to keep track of provenance information
such as the dates when records are created. This simple division, if applied broadly, would do
much to enable agent-based collection and interpretation of biological knowledge from
distributed sources and might prove easier to propagate than previous, more sophisticated
attempts. The downside to such an approach would be the loss of the reasoning capabilities
made possible with more detailed divisions of the universe. Future research could attempt to
find a better balance between reasoning power and the ease of use needed for widespread uptake.
The crux of the continuous, iterative cycle of informatics-based research is the stage where
scientists interact with information. It is at this point where new insights are derived and plans
are made for future study. For example, one of the most interesting products of the work
described in Chapter 5 was the formation of visualizations used to provide holistic summaries of
the components of the different metadata sources under study. These subitizing illustrations
proved informative and interesting to many observers, suggesting that future work would profit
not only from expanding the number of parameters measured, but also from careful consideration
of and improvements in the way that this data is displayed. Given the critical importance of
visualization, the current state of interface design for scientists is generally lacking. With large
quantities of information increasingly pulled from multiple, distributed sources and increasingly
driving the scientific endeavour, better ways to visualize, summarize, and explore this
12 According to the Onto-Med group at the University of Leipzig, a situoid is a “a category of processes whoseboundaries are situations, and that satisfy certain principles of coherence, comprehensibility and continuity”. Theprovided example instance of a situoid is “John's kissing of Mary'' [http://tinyurl.com/ae5z5g].

202
information are fundamental. I suggest that bioinformatics as a discipline should expand its
focus to emphasize basic research on interface design to derive specific visualizations of
recurring kinds of biological data. Such visualizations might be enhanced by the levels of
granularity and of additional semantic properties made accessible by the kinds of metadata
discussed in the context of this dissertation. Given the enormous complexity of human factors,
such research should be exploratory – creating and implementing new approaches - but should
also be goal-directed and critically evaluated through user-testing.
As we seek to expand the use of open systems further into scientific contexts, it is important to
balance the healthy spirit of innovation needed for creativity with the scepticism of the science
that will help improve future creations. The work presented here provided examples of both
sides of this coin. It offered some of the first, demonstrations of open metadata-generating
systems specifically designed to encourage the formation of the semantic Web in the life
sciences and it introduced new ways of quantitatively measuring metadata. The demonstrations
should serve as proofs of principle that, like other surprisingly successful open systems, will help
to motivate and to inspire the additional research needed to define robust, consistently effective
design strategies. The approaches advanced for evaluation should aid this research by
contributing necessary components to the process of advancing open system design from its
current state as an abstract art guided by intuition into a science driven forward by measurement
and careful experimentation. Together, these new strategies should serve as useful points of
reference for many future investigations of the role of third-parties in the management of
biological and medical information.
9.4 Closing remarks
“Genome-era bioinformatics, we repeat, is absolutely dependent upon the web as
a global collaboration framework. This framework has the potential of unifying
and sharing all biological knowledge as it emerges, driving an increasingly
productive social organisation of science.”
Tim Clark, Sean Martin, and Ted Liefeld [10]

203
If we, as a society, are to realize the full potential of the Web and through it, the full potential of
global collaborative research in biology and in medicine, a number of steps need to be taken.
The first few steps are not unknown, they involve the creation of a unified system of unique
resource identification, the creation of interoperable interfaces for databases and analytical
services, and the provision of the metadata that will make it possible to not only discover
distributed resources but to integrate them automatically. Progress is being made by the
bioinformatics community at each of these levels. After years of philosophical, pragmatic, and
sometimes emotional debate, a consensus finally appears to be forming around the use and
recommended form of URIs for the identification of entities in bioinformatics [11]. Standards
designed for the sharing of information between machines, such as Web service interfaces, are
now increasingly accepted and applied by the community [12]. Perhaps more than any other
discipline, bioinformatics is embracing and making strong progress on the construction and
application of shared ontologies and other metadata structures for the annotation of its
information resources [13].
However, despite all of these advances, the scale of the work that remains is nearly
unimaginable. Even nine years ago, when PubMed had on the order of 5 million fewer references
[14] and GenBank 70 million fewer sequences [15, 16], it was accepted that it was “impossible
for a biologist to deal with all the knowledge within even one subdomain of their discipline”
[17]. As our capacity to measure the biological world continues to expand with the advent of
increasingly fast and inexpensive sequencing technologies and other high-throughput
instrumentation, the space of information of relevance to bioinformatics will inflate to reach
dimensions that will make the current ‘data deluge’ seem like the first few gentle drops of a
nascent monsoon. That this will happen is not a question, how we will deal with it is.
The research conducted for this dissertation was framed around the idea that, as suggested by
David Weinberger, “the solution to the overabundance of information is more information”
[18](p 13). To make effective use of large bodies of information, it simply must be enhanced
with additional information that makes it possible to group like with like, to assess quality, to
summarize, and to reason at multiple levels of abstraction. In assembling such metadata, we are
now presented with an expanding array of options. We can implement powerful, expensive
institutional mechanisms, such as MEDLINE, for the curation of the new digital libraries of

204
biology and medicine. We can look to individuals acting to satisfy their own needs, such as the
contributors to social tagging services, to generate metadata about the resources that matter to
them. We can design algorithms that extract the information automatically from primary data.
And we can design new methods that, like the ESP game, enable the centralized, institutionally
guided direction of mass collaborative action. Ultimately, aspects of all these approaches will
likely be needed.
Modern science is an intensely social process. While it is advanced by individual leaps of
intuition, the technology and compiled knowledge that enable these leaps are truly the products
of millions of minds working together. It is my hope that the work conducted for this
dissertation will serve to enable the more harmonious organization of this global collaboration
and that, by doing so, I will have contributed some small part to the realization of the larger
dreams of biology and medicine.
Branche le monde, indeed!

205
References
1. Welch R, Welch L: If you build it, they might come. Nature Reviews Microbiology2009, 7(2):90.
2. Mons B, Ashburner M, Chichester C, van Mulligen E, Weeber M, den Dunnen J, vanOmmen GJ, Musen M, Cockerill M, Hermjakob H et al: Calling on a million minds forcommunity annotation in WikiProteins. Genome Biol 2008, 9(5):R89.
3. Drenner S, Sen S, Terveen L: Crafting the initial user experience to achievecommunity goals. In: ACM Conference On Recommender Systems: 2008; Lausanne,Switzerland: ACM; 2008: 187-194.
4. The economics of scientific collaboration [http://michaelnielsen.org/blog/?p=526]5. Snow R, O’Connor B, Jurafsky D, Ng AY: Cheap and Fast — But is it Good?
Evaluating Non-Expert Annotations for Natural Language Tasks. In: EmpiricalMethods in Natural Language Processing: 2008; Honolulu, Hawaii, USA; 2008.
6. Amazon Mechanical Turk [https://www.mturk.com/]7. Ahn Lv, Dabbish L: Designing games with a purpose. Communications of the ACM
2008, 51(8):58-67.8. Das S, Girard L, Green T, Weitzman L, Lewis-Bowen A, Clark T: Building biomedical
web communities using a semantically aware content management system. BriefBioinform 2008.
9. Niles I, Pease A: Towards a standard upper ontology. In: The international conferenceon Formal Ontology in Information Systems: 2001; Ogunquit, Maine, USA: ACM Press;2001: 2-9.
10. Clark T, Martin S, Liefeld T: Globally distributed object identification for biologicalknowledgebases. Briefings in Bioinformatics 2004, 5(1):59-70.
11. URI-based Naming Systems for Science [http://sw.neurocommons.org/2007/uri-note/]12. Wilkinson MD, Senger M, Kawas E, Bruskiewich R, Gouzy J, Noirot C, Bardou P, Ng
A, Haase D, Saiz Ede A et al: Interoperability with Moby 1.0--it's better than sharingyour toothbrush! Brief Bioinform 2008, 9(3):220-231.
13. Bada M, Stevens R, Goble C, Gil Y, Ashburner M, Blake JA, Cherry JM, Harris M,Lewis S: A short study on the success of the gene ontology. Journal of Web Semantics2004, 1(2):235-240.
14. Key MEDLINE Indicators [http://www.nlm.nih.gov/bsd/bsd_key.html]15. Benson DA, Karsch-Mizrachi I, Lipman DJ, Ostell J, Rapp BA, Wheeler DL: GenBank.
Nucleic Acids Res 2000, 28(1):15-18.16. Benson DA, Karsch-Mizrachi I, Lipman DJ, Ostell J, Wheeler DL: GenBank. Nucleic
Acids Res 2008, 36(Database issue):D25-30.17. Stevens R, Goble CA, Bechhofer S: Ontology-based knowledge representation for
bioinformatics. Briefings in Bioinformatics 2000, 1(4):398-414.18. Weinberger D: Everything is miscellaneous: the power of the new digital disorder,
1st edn. New York: Henry Holt and Company, LLC; 2007.

206
Appendix 1. Data collection for chapter 5: assembly of term-sets
1. MeSH
a. Files representing the 2008 release of MeSH were downloaded from
http://www.nlm.nih.gov/mesh/filelist.html on Feb. 11, 2008.
b. The preferred labels for the terms were taken from the downloaded file
“mshd2008.txt”.
c. The union of the preferred labels and the synonyms (mesh all) was extracted from
the downloaded MeSH XML file “desc2008” using a Java program.
d. The MeSH terms with comma separated adjectives, like “Cells, Immobilized”
were programmatically re-ordered to reflect a more natural English language
usage of adjective noun, such as “Immobilized Cells”. This step was taken to
facilitate comparison with the other indexing languages that tended much more
towards this form.
2. OWL/RDF formatted thesauri and ontologies. Unless otherwise, noted, all the labels for
the concepts and their synonyms were extracted from the files using custom Java code
built with the Jena OWL/RDF API.
a. ACM – Association for Computing Machinery
i. An OWL-XML version of the 1998 ACM thesaurus was acquired from
Miguel Ferreira of the Department of Information Systems at the
University of Minho. See http://dspace-
dev.dsi.uminho.pt:8080/en/addon_acmccs98.jsp for more details.
b. AG – AGROVOC thesaurus from the Agricultural Information Management
Standards initiative
i. An OWL-XML file containing the thesaurus (“ag_2007020219.owl”) was
downloaded from http://www.fao.org/aims/ag_download.htm
c. BioLinks is a subject listing used to organize the bioinformatics links directory
(http://bioinformatics.ca/links_directory/). An OWL version of these subject
headings was composed by one of the authors in August of 2007, and is available
at (http://bioinfo.icapture.ubc.ca/bgood/ont/BioLinks.owl).

207
d. The daily OWL versions of the following ontologies from the OBO foundry
(http://obofoundry.org/) were downloaded from
(http://www.berkeleybop.org/ontologies/) on Feb. 11, 2008.
i. Gene Ontology (biological process, molecular function, cellular
component)
ii. CARO – common anatomy reference ontology
iii. CHEBI – chemical entities of biological interest
iv. CL – cell ontology
v. ENVO – environment ontology
vi. FMA – an OWL version of the Foundational Model of Anatomy
vii. NCI Thesaurus – National Cancer Institute thesaurus
viii. OBI – Ontology for Biomedical Investigations
ix. PATO – Phenotypic Quality ontology
x. PRO – Protein Ontology
xi. SO – Sequence Ontology
xii. ZFA – Zebrafish Anatomy and Development Ontology
e. GEMET – the thesaurus used by the European Environment Information and
Observation Network was downloaded from
http://www.eionet.europa.eu/gemet/rdf?langcode=en on Feb. 15, 2008. The
English terms were extracted from the provided HTML table.
3. Folksonomies (collections of tags created in social bookmarking systems)
a. Connotea
i. The Connotea folksonomy was extracted from 377885 posts to Connotea
collected prior to December 12, 2007. The Connotea Web API and the
Connotea Java library were used to gather and process the data.
b. Bibsonomy
i. The Bibsonomy tag set was extracted from the January 1, 2008 dump of
the Bibsonomy database. It is available for research upon request from
c. CiteULike

208
i. The CiteULike tag set was extracted from the December 31, 2007 dump of
the CiteULike database. Daily versions of this database are available for
research purposes from http://www.citeulike.org/faq/data.adp.