
Characterizing Overlay Multicast Networks
10
Characterizing Overlay Multicast Networks Sonia Fahmy and Minseok Kwon Department of Computer Sciences, Purdue University e-mail: fahmy,kwonm @cs.purdue.edu Abstract Overlay networks among cooperating hosts have re- cently emerged as a viable solution to several challenging problems, including multicasting, routing, content distribu- tion, and peer-to-peer services. Application-level overlays, however, incur a performance penalty over router-level so- lutions. This paper characterizes this performance penalty for overlay multicast trees via experimental data, simula- tions, and theoretical models. Experimental data and sim- ulations illustrate that (i) the average delay and the num- ber of hops between parent and child hosts in overlay trees generally decrease, and (ii) the degree of hosts generally de- creases, as the level of the host in the overlay tree increases. Overlay multicast routing strategies, together with power- law and small-world Internet topology characteristics, are causes of the observed phenomena. We compare three over- lay multicast protocols with respect to latency, bandwidth, router degrees, and host degrees. We also quantify the over- lay tree cost. Results reveal that for small , where is the total number of hops in all overlay links, is the average number of hops on the source to re- ceiver unicast paths, and is the number of members in the overlay multicast session. 1. Introduction Overlay networks have recently gained attention as mechanisms to overcome deployment barriers to router- level solutions of several networking problems. Overlay so- lutions for multicasting [7, 13, 15, 21, 16], inter-domain routing pathologies [3], content distribution and con- tent sharing [22] are being extensively studied. In this pa- per, we consider a number of overlay (application-layer) multicast approaches which have been proposed over the last three years. In overlay multicast, hosts participat- ing in a multicast session form an overlay network, and only This research has been sponsored in part by the Purdue Research Foundation, and the Schlumberger Foundation technical merit award. utilize unicasts among pairs of hosts (considered neigh- bors in the overlay tree) for data dissemination. The hosts in overlay multicast exclusively handle group manage- ment, routing, and tree construction, without any support from Internet routers. The key advantages overlays offer are flexibility, adap- tivity, and ease of deployment. Overlays, however, im- pose a performance penalty over router-level alternatives. While overlay multicast clearly consumes additional net- work bandwidth and increases latency over IP multicast, little attention has been paid to precisely quantifying this overlay performance penalty, either theoretically or exper- imentally. Moreover, to the best of our knowledge, there is no work on characterizing overlay multicast tree struc- ture. Such characterization is important to gain insight into overlay properties and their causes at both the application layer and the underlying network layer. It is also important to compare different overlay multicast strategies to deter- mine how to meet the goals of target applications (e.g., by balancing latency versus bandwidth tradeoffs). In this paper, we analyze overlay multicast trees via (i) real data integrated from End System Multi- cast (ESM)/Narada [7] experiments and traceroute servers, (ii) simulations of three representative classes of over- lay multicast strategies, and (iii) simple analytical models. We quantify several aspects of the performance penalty as- sociated with overlay multicast, with emphasis on the overlay cost (i.e., efficiency) at the network-layer. We de- rive and validate asymptotic forms of the overlay cost from two different tree models. Our results indicate that (i) the average delay and the number of hops between parent and child hosts generally decrease, and (ii) the degree of hosts generally decreases, as the level of the host in the overlay tree increases. We find that overlay multicast routing strategies, together with power-law and small-world Internet topology characteris- tics, are causes of these observed phenomena. We isolate the impact of each of these causes. Our results also reveal that for small , where is the total num- ber of hops in all overlay links (connections), is the average number of hops on the source to receiver unicast Proceedings of the 11th IEEE International Conference on Network Protocols (ICNP’03) 1092-1648/03 $17.00 © 2003 IEEE
-
Upload
independent -
Category
Documents
-
view
0 -
download
0
Transcript of Characterizing Overlay Multicast Networks

Characterizing Overlay Multicast Networks
Sonia Fahmy and Minseok KwonDepartment of Computer Sciences, Purdue University
e-mail: �fahmy,kwonm�@cs.purdue.edu �
Abstract
Overlay networks among cooperating hosts have re-cently emerged as a viable solution to several challengingproblems, including multicasting, routing, content distribu-tion, and peer-to-peer services. Application-level overlays,however, incur a performance penalty over router-level so-lutions. This paper characterizes this performance penaltyfor overlay multicast trees via experimental data, simula-tions, and theoretical models. Experimental data and sim-ulations illustrate that (i) the average delay and the num-ber of hops between parent and child hosts in overlay treesgenerally decrease, and (ii) the degree of hosts generally de-creases, as the level of the host in the overlay tree increases.Overlay multicast routing strategies, together with power-law and small-world Internet topology characteristics, arecauses of the observed phenomena. We compare three over-lay multicast protocols with respect to latency, bandwidth,router degrees, and host degrees. We also quantify the over-lay tree cost. Results reveal that ����
���� � ���� for small �,
where ���� is the total number of hops in all overlay links,���� is the average number of hops on the source to re-ceiver unicast paths, and � is the number of members in theoverlay multicast session.
1. Introduction
Overlay networks have recently gained attention asmechanisms to overcome deployment barriers to router-level solutions of several networking problems. Overlay so-lutions for multicasting [7, 13, 15, 21, 16], inter-domainrouting pathologies [3], content distribution and con-tent sharing [22] are being extensively studied. In this pa-per, we consider a number of overlay (application-layer)multicast approaches which have been proposed overthe last three years. In overlay multicast, hosts participat-ing in a multicast session form an overlay network, and only
� This research has been sponsored in part by the Purdue ResearchFoundation, and the Schlumberger Foundation technical merit award.
utilize unicasts among pairs of hosts (considered neigh-bors in the overlay tree) for data dissemination. The hostsin overlay multicast exclusively handle group manage-ment, routing, and tree construction, without any supportfrom Internet routers.
The key advantages overlays offer are flexibility, adap-tivity, and ease of deployment. Overlays, however, im-pose a performance penalty over router-level alternatives.While overlay multicast clearly consumes additional net-work bandwidth and increases latency over IP multicast,little attention has been paid to precisely quantifying thisoverlay performance penalty, either theoretically or exper-imentally. Moreover, to the best of our knowledge, thereis no work on characterizing overlay multicast tree struc-ture. Such characterization is important to gain insight intooverlay properties and their causes at both the applicationlayer and the underlying network layer. It is also importantto compare different overlay multicast strategies to deter-mine how to meet the goals of target applications (e.g., bybalancing latency versus bandwidth tradeoffs).
In this paper, we analyze overlay multicast treesvia (i) real data integrated from End System Multi-cast (ESM)/Narada [7] experiments and traceroute servers,(ii) simulations of three representative classes of over-lay multicast strategies, and (iii) simple analytical models.We quantify several aspects of the performance penalty as-sociated with overlay multicast, with emphasis on theoverlay cost (i.e., efficiency) at the network-layer. We de-rive and validate asymptotic forms of the overlay cost fromtwo different tree models.
Our results indicate that (i) the average delay and thenumber of hops between parent and child hosts generallydecrease, and (ii) the degree of hosts generally decreases,as the level of the host in the overlay tree increases. Wefind that overlay multicast routing strategies, together withpower-law and small-world Internet topology characteris-tics, are causes of these observed phenomena. We isolatethe impact of each of these causes. Our results also revealthat ����
���� � ���� for small �, where ���� is the total num-
ber of hops in all overlay links (connections), ���� is theaverage number of hops on the source to receiver unicast
Proceedings of the 11th IEEE International Conference on Network Protocols (ICNP’03)
1092-1648/03 $17.00 © 2003 IEEE

paths, and � is the number of members in the overlay mul-ticast session. This can be compared to an IP multicast costproportional to ���� to ���� [6, 8].
The remainder of this paper is organized as follows. InSection 2, we describe overlay networks and their perfor-mance metrics. In Section 3, we characterize overlay multi-cast networks via simulations and experimental data analy-sis. In Section 4, we propose and validate an overlay multi-cast model based on our observations. In Section 5, we dis-cuss related work. Finally, we summarize our conclusionsand future work in Section 6.
2. Overlay Networks: Definitions and Metrics
We consider the underlying network as a graph � ������, where� is a set of nodes, and� is a set of edges. Anode �� � � denotes a router, and an edge ���� ��� � � de-notes a bi-directional physical link in the underlying net-work. An overlay network superimposed on � is a tree� � �������� ���, where � is the source host, � is theset of receiver hosts, �� � � is the set of nodes in the un-derlying network � that are traversed by overlay links, and�� is the set of overlay links, defined below.
The set of hosts � consists of � and � in �, i.e.,� � ��� � �. The cardinality of set � is equal to �.An overlay link � � ���� ��� � � � � ���� ��� � �� comprisesa host �� � �, followed by a sequence of routers �� � ��,followed by a host �� � �. Each receiver � � appears ex-actly once at the end of any sequence denoting an overlaylink, but may appear multiple times at the beginning of se-quences for different overlay links. An overlay link is typi-cally a UDP or TCP connection established by the overlaymulticast protocol.
The number of hops in the router sequence ��� � � � � ���in an overlay link � � �� is denoted by �. For every tworouters ��� �� � �� that appear consecutively in an over-lay link � � ��, there must exist a link connecting them inthe underlying network, i.e., edge ���� ��� � � holds. Thesame router �� � �� can appear in multiple overlay links� � ��. Subsequences of routers ��� � � � � �� can also ap-pear in multiple overlay links � � ��. Figure 1 illustratesan example overlay network with 6 overlay links.
Given an overlay network �, we define the term overlaycost as the number of underlying hops traversed by everyoverlay link � � �� for an overlay �. More formally, theoverlay cost is: �� � ��, � ����, where ���� denotesthe number of router-to-router hops between ��� � � � � ��� forthe overlay link � (as defined above). We consider the firstand last hops to/from hosts separately. This is because wemust fairly compare the normalized overlay cost to the nor-malized IP multicast cost computed in [8, 18, 2], where thefirst and last hops are ignored. For example, the overlay costfor the overlay in Figure 1 is 2+3+1+1+4+2=13.
HostRouter
A
Source
Overlay link
Underlying link
Receiver
Figure 1. An example overlay multicast tree over an un-derlying network
We also use the term link stress to denote the total num-ber of identical copies of a packet over the same underly-ing link (as defined in [7]). For example, the stress of thelink from the source to � in Figure 1 is two. It is clearthat the overlay cost defined above can be represented as��,�
� �������� where � is any router-to-router link tra-versed by one or more overlay links � � ��, and ��������is the stress of link �. Prior work also used a “resource us-age” metric, defined as ��,
�� � ������ ��������, where
� is an underlying link traversed by one or more overlaylinks [7]. Our overlay cost metric is a special case of this re-source usage notion, when � ����� � �, ��. We opt to eval-uate delays separately from the overlay cost, in order to iso-late the delay and stress aspects of an overlay.
In addition to the overlay cost and link stress, we studythe following overlay tree metrics: (1) degree of hosts �
(equivalent to the host contribution to link stress of the host-to-first-router link), (2) degree of routers � ��, and hop-by-hop delays of underlying links traversed by overlay links� ��, (3) overlay tree height, (4) delays and number ofhops between parent and child hosts, (5) mean bottleneckbandwidth between the source � and receivers � �, and(6) mean latency, longest latency, and relative delay penalty(RDP) from the source to a receiver.
The latency �������� ��� from the source � to �� � �
is: � ����� ��� �����
��� � ������ ����� � � ������ ���,assuming � delivers data to �� via the sequence of hosts���� � � � � ���. Here, � ������ ����� denotes the end-to-enddelay of the overlay link from �� to ����, for �� � � and���� � �. Note that the RDP from � to �� (defined in [7]) isthe ratio ������� ���
������ ���. We compute the mean RDP of all re-
ceivers � �. We can also define the stretch as ������ ������� �����
where ������� ��� � ���� ��������
���� ����� ������ ��� ����� ��� � �. Stretch denotes the relative number of hopsinstead of the relative latency used in RDP. These metricscompare overlay multicast to unicast (or IP multicast usinga minimum delay tree). It is clear that there is a tradeoff be-tween the latency metrics and the stress/bandwidth metrics.Balancing this tradeoff is the key to effective overlay multi-cast protocol design.
Proceedings of the 11th IEEE International Conference on Network Protocols (ICNP’03)
1092-1648/03 $17.00 © 2003 IEEE
3. Overlay Multicast Tree Structure
Our primary goal in this section is to isolate the impactsof (i) the overlay protocol, (ii) the underlying network con-nectivity and routing, and (iii) the overlay host distribution,on the overlay tree structure. We first analyze experimen-tal data, and then conduct a set of simulations.
3.1. Experimental Data
In order to study the structure of real overlay networks inthe Internet, we analyze recent experimental results for theEnd System Multicast (ESM) protocol [7]. We recorded theoverlay trees constructed during experiments performed bythe ESM developers in November 2002. (Unfortunately, theESM developers have not released the overlay tree struc-ture in their later experiments.) Since the overlay trees didnot change significantly throughout the experiment lifetime,we selected one representative overlay tree. The tree com-prises 65 hosts. We are currently setting up ESM on thePlanetLab testbed [17] to collect more measurements.
We use traceroute to find the underlying path be-tween every two hosts on the overlay tree. We encoun-tered two problems using traceroute. First, some routersdo not generate ICMP Time-Exceeded packets when TTL(Time-To-Live) reaches zero. Second, many routers dis-able the source-route capability, primarily due to securityconcerns. Due to this, finding paths between two arbi-trary hosts via traceroute (without having accounts oneither of these hosts) becomes difficult. We utilize pub-licly available traceroute servers [1] and our own machinesto compute paths to all the hosts on the overlay tree. Thesepaths are then synthesized to approximate the paths be-tween any two overlay hosts. Our task was simplifiedbecause the hosts in the experiments, with a few excep-tions, are located at universities in the United States.Most university hosts are connected to the Internet2 back-bone network [12], and thus the routes typically intersectat points on Internet2. These points provide the synthe-sis junctions used for path extraction.
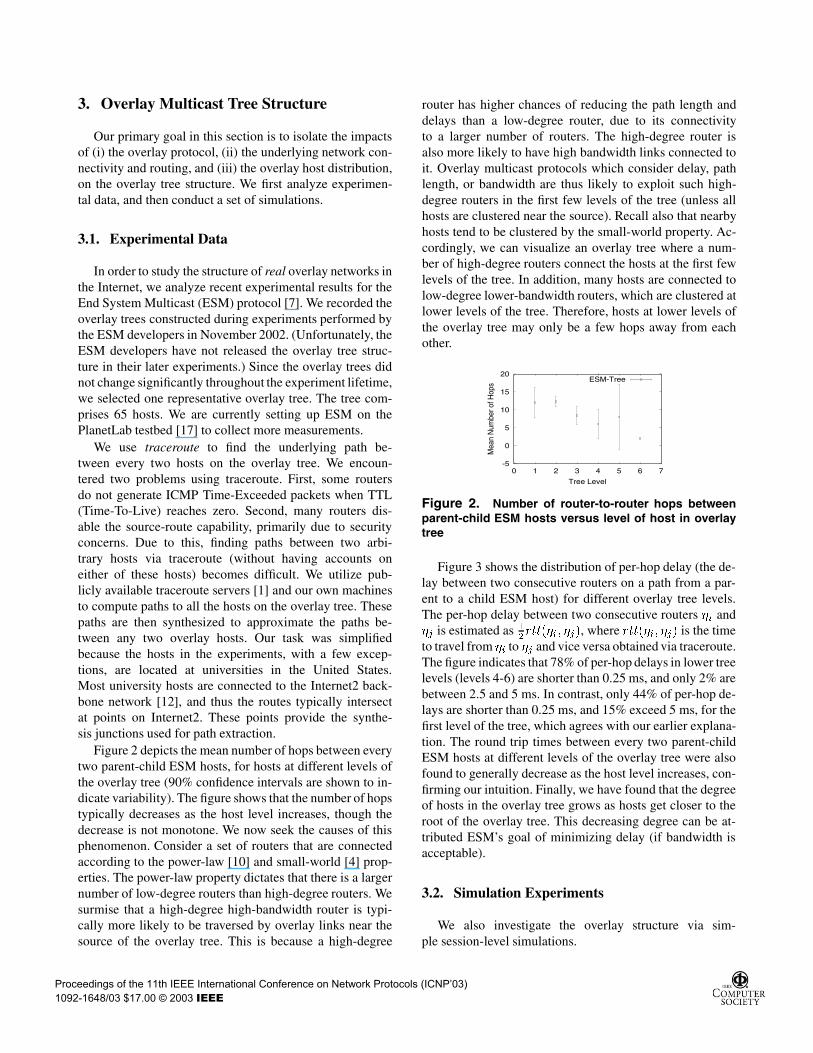
Figure 2 depicts the mean number of hops between everytwo parent-child ESM hosts, for hosts at different levels ofthe overlay tree (90% confidence intervals are shown to in-dicate variability). The figure shows that the number of hopstypically decreases as the host level increases, though thedecrease is not monotone. We now seek the causes of thisphenomenon. Consider a set of routers that are connectedaccording to the power-law [10] and small-world [4] prop-erties. The power-law property dictates that there is a largernumber of low-degree routers than high-degree routers. Wesurmise that a high-degree high-bandwidth router is typi-cally more likely to be traversed by overlay links near thesource of the overlay tree. This is because a high-degree
router has higher chances of reducing the path length anddelays than a low-degree router, due to its connectivityto a larger number of routers. The high-degree router isalso more likely to have high bandwidth links connected toit. Overlay multicast protocols which consider delay, pathlength, or bandwidth are thus likely to exploit such high-degree routers in the first few levels of the tree (unless allhosts are clustered near the source). Recall also that nearbyhosts tend to be clustered by the small-world property. Ac-cordingly, we can visualize an overlay tree where a num-ber of high-degree routers connect the hosts at the first fewlevels of the tree. In addition, many hosts are connected tolow-degree lower-bandwidth routers, which are clustered atlower levels of the tree. Therefore, hosts at lower levels ofthe overlay tree may only be a few hops away from eachother.
-5
0
5
10
15
20
0 1 2 3 4 5 6 7
Mea
n N
umbe
r of H
ops
Tree Level
ESM-Tree
Figure 2. Number of router-to-router hops betweenparent-child ESM hosts versus level of host in overlaytree
Figure 3 shows the distribution of per-hop delay (the de-lay between two consecutive routers on a path from a par-ent to a child ESM host) for different overlay tree levels.The per-hop delay between two consecutive routers �� and�� is estimated as �
�������� ���, where ������� ��� is the time
to travel from �� to �� and vice versa obtained via traceroute.The figure indicates that 78% of per-hop delays in lower treelevels (levels 4-6) are shorter than 0.25 ms, and only 2% arebetween 2.5 and 5 ms. In contrast, only 44% of per-hop de-lays are shorter than 0.25 ms, and 15% exceed 5 ms, for thefirst level of the tree, which agrees with our earlier explana-tion. The round trip times between every two parent-childESM hosts at different levels of the overlay tree were alsofound to generally decrease as the host level increases, con-firming our intuition. Finally, we have found that the degreeof hosts in the overlay tree grows as hosts get closer to theroot of the overlay tree. This decreasing degree can be at-tributed ESM’s goal of minimizing delay (if bandwidth isacceptable).
3.2. Simulation Experiments
We also investigate the overlay structure via sim-ple session-level simulations.
Proceedings of the 11th IEEE International Conference on Network Protocols (ICNP’03)
1092-1648/03 $17.00 © 2003 IEEE

11%15%
44%
(0.25,2.5) ms
30%
(2.5,5) ms> 5 ms
< 0.25 ms
(a) Tree level 1
20%2%
(0.25,2.5) ms
< 0.5 ms
78%
(2.5,5) ms
(b) Tree level 4-6
Figure 3. Distributions of per-hop delay for differentESM overlay tree levels
3.2.1. Simulation Setup Our simulation topology con-tains 4000 routers connected according to power-law andsmall-world properties. In a power-law graph, a comple-mentary cumulative distribution function ���� is used todenote the fraction of routers with degree greater than �,where � and � are constants [14]. We use � � � and� � ����. Groups of routers are clustered according tothe small-world property: a router connects to its closestneighbor routers with probability �, and to other routerswith probability � � �, according to router degree. We use� � ���. Routers are uniformly distributed on a 500 � 500plane, and the Euclidean distance between two routers ap-proximates the delay between the two routers (in ms). Hostsare connected to edge routers (which are defined as routerswith degree less than 10) uniformly at random. The band-width from edge routers to hosts is selected according tothe realistic distribution: 40% are 56 kbps, and 15% foreach of 1.5, 5, 10, 100 Mbps. All other links are assignedbandwidths ranging from 100 Mbps to 1 Gbps. The under-lying network routes are selected to optimize delays. It isalso worth mentioning that we have simulated smaller scaletopologies and the results were similar. Results for Transit-Stub topologies generated by the popular GT-ITM can befound in [9].
We simulate three representative overlay multicast pro-tocols on the two topologies: ESM [7], Topology-AwareGrouping (TAG) [15], and Minimum Diameter Degree-Bounded Spanning Tree (MDDBST) [21]. The reason weselect ESM is that it is the first overlay multicast protocolto be widely tested in the Internet. Each ESM host evalu-ates the utility of other hosts to determine its neighbors. Ahost has an upper degree bound (UDB) on the number of itsneighbors. We use a value of 6 for the upper degree bound.The ESM flavor used in our simulations has two discretizedbandwidth levels: � ��� kbps and� ��� kbps (same as theversion used for multicasting SIGCOMM 2002). The over-lay tree is first optimized for bandwidth, and then uses delayas a tie breaker among hosts at the same bandwidth level.
The second class of protocols we investigate istopology-aware overlay multicast protocols, which in-cludes Scribe [5], topology-aware Content-AddressableNetwork (CAN) [20], and TAG [15]. We select TAG as arepresentative of this group. TAG is a simple and faith-
ful representation of topology-based approaches, sinceit aligns overlay routes and underlying routes, if band-width constraints are met. A TAG host becomes the childof the host that most “matches” its path. Here, a path is de-fined as the sequence of routers from the source to the host.A’s path matches B’s path when the path from the sourceto A is a prefix of the path from the source to B. This fla-vor of TAG is called “complete path matching.” We usethe partial path matching version, which allows � un-matched routers at the end of the prefix. Partial path match-ing is activated when the bandwidth from a potential par-ent to a new member is less than a threshold ���� .We use � � � and ���� � �� kbps in our simula-tions.
The third class of protocols we investigate includes pro-tocols that seek to minimize overlay cost [16], or the longestpath in an overlay network [21] (with delay or bandwidthconstraints). We select MDDBST, given in [21], as a rep-resentative protocol in this class. MDDBST minimizes thenumber of hops in the longest path, and bounds the degreeof hosts. We use a degree bound of 20 in our simulations.Foreach protocol, we run five simulations with different ran-dom number generator seeds (for topology generation andfor selecting the multicast source and destinations) and av-erage the results.
0
1
2
3
4
5
0 2 4 6 8 10 12 14
Mea
n N
umbe
r of H
ops
Tree Level
ESM-2KTAG-2K
MDDBST-2KESM-4KTAG-4K
MDDBST-4K
Figure 4. Number of hops versus overlay tree level insimulations on the power-law and small-world topology
3.2.2. Simulation Results Figure 4 illustrates the meannumber of hops between parent and child hosts for differ-ent host levels in the overlay tree. The labels “ESM-2K”and “ESM-4K” denote ESM with 2000 or with 4000 mem-bers respectively, and so on. The figure reveals that the num-ber of hops between parent and child hosts tends to decreaseas the level in the overlay tree increases, for both ESM andTAG. MDDBST does not exhibit a clear trend. This is be-cause MDDBST does not seek the shortest path to individ-ual hosts, but minimizes the longest path. In general, the de-creases are more pronounced for TAG than for the other twoprotocols, since TAG aligns overlay and underlying routes,subject to bandwidth availability. The observed decrease inmean number of hops is consistent with our experimentaldata, and our intuition about the effects of Internet topol-ogy characteristics.
Proceedings of the 11th IEEE International Conference on Network Protocols (ICNP’03)
1092-1648/03 $17.00 © 2003 IEEE

In order to isolate the effects of the power-law propertyfrom the small-world property, we have run the same sim-ulations on only-power-law (but no clustering) and only-small-world (but equal degree routers) topologies. The re-sults revealed that both clustering among closely locatedrouters as dictated by the small-world property, and power-laws of router degrees, contribute to the observed decreasein number of hops with overlay tree level increase. How-ever, the effect of the power-law property is more domi-nant.
0
1
2
3
4
5
0 2 4 6 8 10 12 14
Mea
n N
umbe
r of H
ops
Tree Level
ESM-2KTAG-2K
MDDBST-2KESM-4KTAG-4K
MDDBST-4K
Figure 5. Number of hops versus overlay tree level insimulations on the power-law and small-world topologywith non-uniform host distribution
We also simulate the three protocols with a non-uniformhost distribution. In this case, we randomly select an edgerouter and then connect � hosts to this router and its neigh-boring routers (one host per router), where � is a randomnumber between � and ��. Figure 5 illustrates that the num-ber of hops between parent and child hosts decreases evenmore rapidly (though with some fluctuations) than uniformhost distribution case (Figure 4). The decrease was less pro-nounced when we repeated the same experiment on the GT-ITM topology. Therefore, the power-law and small-worldproperties, and the non-uniform host distribution are all fac-tors that exacerbate this phenomenon. The routing featuresof overlay multicast protocols, such as the utility for select-ing neighbors in ESM, or topology awareness in TAG, alsoplay an important role.
To validate our argument that high-degree routers tendto be traversed in upper levels of the overlay tree, we havealso studied the average router degree versus the overlaytree level. As expected, higher degree routers are traversedat upper overlay tree levels. We also investigated the fre-quency that routers with certain degrees are traversed byoverlay links. We found that all three protocol trees cross asignificant number of high-degree routers (50+), in order toexploit their high connectivity and high bandwidth.
In addition, we have investigated the host degree versusthe host overlay tree level. The host degree remains withina small range (� ��), except for the source host for theTAG protocol. This is because TAG attempts to send morecopies from the source to reduce delay when all receiversare far from each other. As a result, the ESM and MDDBSTtrees are typically longer than TAG trees. The tree height in-
creases as the number of members is increased, but the in-crease is slow beyond a certain number of members. Wehave also studied the total stress for all three protocols, andfound that ESM exhibits the lowest stress, followed by MD-DBST, then TAG.
Figure 6(a) depicts the relative delay penalty (RDP) (de-fined in Section 2) for the three protocols. ESM achievesthe lowest RDP, except when the number of members issmall. ESM, however, exhibits the highest longest latency(Figure 6(b)). The latencies and RDP for ESM decreaseas more hosts join (especially since they are randomly lo-cated), because lower latency paths become available. Incontrast, TAG RDP is high because partial path matchingwith bandwidth constraints increases latency when a largenumber of members join.
Finally, the mean bottleneck bandwidth between thesource and receivers for all three protocols is illustrated inFigure 6(c). The receivers in TAG obtain a higher band-width than the receivers in ESM because of the TAG partialpath matching. The bandwidth of MDDBST fluctuates sincethe degree bound of 20 does not depend on bandwidth, eventhough it should. Figures 6(a) and 6(c) together illustrate thelatency versus bandwidth tradeoff in overlay multicast pro-tocols. Note that these results vary with protocol parame-ters. For example, TAG gives lower RDPs and lower band-widths with a smaller � or a smaller ��������. MDDBSTcan also increase bandwidth with a lower degree bound, atthe expense of longer latencies and RDPs.
4. Overlay Multicast Tree Cost
In this section, we model overlay multicast trees basedon the overlay tree structure we have observed, and com-pute their costs.
4.1. Network Model
We model the underlying network as a graph ����� and the overlay tree as the tuple ������� ���,as defined in Section 2. To simplify our analysis, we trans-form into a complete �-ary tree � � ���� �� on which is constructed, where and � are the same as in , and� � is designated as the root router. � is the only hostconnected to �. Other hosts are connected to routers withequal probability in both and � to obtain �. The heightof � is �. To transform into �, any cycle in is bro-ken by eliminating the edge on the cycle which no overlaylink in traverses. Such an edge typically exists when theoverlay cost is minimized, which is the overlay we considerhere, as given in Definition 1 below. In addition, we movethe children of nodes whose degree is larger than �, alongwith the subtrees rooted at these nodes, to nodes which havedegree less than �. Such nodes are guaranteed to exist, e.g.,
Proceedings of the 11th IEEE International Conference on Network Protocols (ICNP’03)
1092-1648/03 $17.00 © 2003 IEEE

0
0.5
1
1.5
2
2.5
3
3.5
4
100 1000 10000
Mea
n R
elat
ive
Del
ay P
enal
ty
Number of Members (log scale)
ESMTAG
MDDBST
(a) Mean relative delay penalty
10001500200025003000350040004500500055006000
100 1000 10000
Long
est L
aten
cy (m
s)
Number of Members (log scale)
ESMTAG
MDDBST
(b) Longest latency
0
50
100
150
200
250
300
100 1000 10000
Mea
n B
andw
idth
(kbp
s)
Number of Members (log scale)
ESMTAG
MDDBST
(c) Mean bottleneck bandwidth
Figure 6. Mean relative delay penalty (RDP), longest latency, and mean bottleneck bandwidth tradeoffs in simula-tions on the power-law and small-world topology
leaf nodes. This simple transformation shows that we donot significantly lose generality by considering an under-lying tree. The overlay cost exhibited with an underlyingtree has also been shown to be more consistent with thatexhibited with real topologies, compared to meshes or ran-dom graphs [19]. We are, however, currently investigatingthe average costs for the set of trees covering a power-lawand small-world underlying network.
To incorporate the number-of-hops distribution proper-ties discussed in Section 3, routers with only one child(and no hosts to be connected) are added between branch-ing points in the underlying network model. Such routersare called unary nodes. We had observed that the numberof hops between parent and child hosts approximately de-creases, as the level of the host in the overlay tree increases.A similar modeling assumption to that in [2] (a self-similartree) can be used to represent this observation. This entailsthat �� � �����, � � � � �, where �� is the numberof concatenated links generated by unary nodes between anode at level � � � and a node at level � in the underlyingnetwork (the notions of levels and � do not consider unarynodes, which are counted separately). Therefore, ���������unary nodes are created between adjacent nodes at levels� � � and �. This implies that ������� links exist at level �from a branching node at level �� �. The tree has no unarynodes when � � �. Note that the number of hops on over-lay links will not be monotonically decreasing (but will beapproximately decreasing) for increasing levels of the over-lay tree, since data may be disseminated up �� in certainsegments, as discussed in the next 2 sections.
We assume that each receiver is connected to a routerin the network uniformly and independently of other re-ceivers. We use the term ����� �� � to denote overlay costfor an overlay tree and number of hosts ���� � (�and � are defined above). In [8], �, the number of distinctrouters to which hosts are connected, is used instead of in ����� �� �. We, however, believe that using the numberof hosts is intuitively appealing and makes analysis sim-pler. Note that� can be approximated by ������ �
����,
where is the total number of available routers to which
hosts can be connected. Therefore, � � when ��
�� [2].
Among all possible overlay networks that can be super-imposed on ��, we compute the least cost overlay networkdefined as follows.
Definition 1 Let � be the set of all possible overlays, con-necting a particular set of hosts, and superimposed on anetwork ��. Let �� ��� �� � be the overlay cost for � � �.Let be the least cost overlay on ��. Then, is the over-lay that satisfies ����� �� � � �� ��� �� � for all � � �.
We consider the least cost overlay network for three pri-mary reasons. First, modeling and analysis are simplifiedin this case. Second, many overlay multicast protocols op-timize a delay-related metric, which is typically also opti-mized by underlying (especially intra-domain) routing pro-tocols. Third, it gives a lower bound on the overlay tree costunder our assumptions.
4.2. Receivers at Leaf Nodes
We first consider a network in which receivers can onlybe connected to leaf nodes in the underlying network. Fig-ure 7(a) shows a model of such a network. One host, whichis the current source of the overlay multicast session, is con-nected to the root � of the tree. All other hosts are con-nected to leaf nodes, selected independently and uniformly.We define � to be the lowest level with branching nodesabove or at half of the tree height. Since
������� �
������
indicates the height from � to the lowest tree level, � canbe computed as: �
������� �
������ ���
��� �������. Thus,
� ���� �
����
������
�.
For ease of counting, we first consider a tree withoutunary nodes and then add the cost introduced by unarynodes. Figure 7(a) shows that the cost incurred when com-municating from a receiver to another receiver, both con-nected to descendants of node � at level ��� �, is boundedby �. Otherwise, the source would send another copy di-rectly to the receiver at cost �. For this reason, we group to-gether all receivers connected to descendants of � in a sub-
Proceedings of the 11th IEEE International Conference on Network Protocols (ICNP’03)
1092-1648/03 $17.00 © 2003 IEEE

α
. . .
k
(a)
Source
h/2
h/2
h
h
Root
(b)
A B
lα
. . . . . . .
k
l
k. . . . . . .σ
k
. . ....
α l+12α l+1
1
Overlay linkHost
Router
Figure 7. An overlay tree model with receivers locatedonly at leaf nodes (for simplicity, unary nodes are notshown)
tree rooted at �. Similar subtrees are created for every nodeat level ��� �.
We divide the computation of����� �� �� into two terms.The first term is the minimum cost to send to the subtreesrooted at �, and the second term is the minimum cost ofdata dissemination within the subtrees. To compute the firstterm, we observe that there are �� nodes at level � in thetree. The probability that a link connecting to level � is tra-versed by overlay � is ����������. Thus, the cost at level� is ����� ���������. Since ������� additional cost is in-curred by a node at level � if the tree is extended with unarynodes, the first term becomes:
��
���
������������ ��� ������ �
��� � �
�� � ������ ��� ������ (1)
To compute the second term, we consider a subtreerooted at �. This subtree and potential overlay links areshown in Figure 7(b). Consider a node � at level , where�� � � � in the subtree. Let���� and���� be two childrenof � at level ��. Suppose that� is a receiver connected toa descendant of ����, and is a receiver connected to a de-
scendant of ����. Since��
����� ������� � ��������� is in-
curred due to unary nodes, sending data from� to across(up and then down) � costs: ����������.
Since there are ���� links to level � � of the tree, theprobability that a particular link to level � � is used in� is � � �� � ���������. Since � has � children, the costfrom � to its children in � becomes ���� ��� ����������.An overlay link is created between a pair of children of�, so the cost across � is ��� � �� � ���������� � �.Therefore, for �, the cost at level in the subtree be-comes �������������� � �� � ���������� � ��. We, how-ever, note that there must be no link across � if the costfrom � to its children is less than one, that is, ��� � �� �
���������� � � � � ����� � �� � ����� ��� � �. There-
fore, the cost at level in the subtree ��� is defined as:��� � �������������� � �� � ���������� � ��, where
� � � ����� � �� � ����� ��� � �. ��� � � otherwise.
Consequently, the second term becomes:����
��� �����.����� �� �� is the sum of the first and second terms:
����� �� �� ���� � �
�� � ����������������
����
���
����� (2)
We prove that this tree is indeed the least cost overlay treeon this underlying network in [9]. Since the average num-ber of hops on the source to receiver unicast paths ��
� ���
is��
��� ������� � �����
���� , the normalized overlay cost be-
comes: ������ �� �� �
������������
.A power-law is observed in the normalized cost, where
the exponent of � is � � � (see [9] for details). Figure 8(a)depicts the normalized overlay cost ��
���� �� �� against thenumber of overlay group members �. The figure shows that������ �� �� � �����, for � � � � �. Saturation occurs as
��� (���).
4.3. Receivers at Leaf or Non-leaf Nodes
We now relax the restriction that receivers are only con-nected to leaf nodes in the underlying network, as illus-trated in Figure 9. A non-leaf node with receiver(s) con-nected receives data from an ancestor, and relays this data toits descendants. In contrast, descendants of a non-leaf nodewhich has no receivers connected must receive data fromother non-ancestor nodes.
kp
... ......
. . .
... ......
(a)
ν
νL (h−2,k,n)
L (h−3,k,n)
h
Source
Root
(b)
kp
kp
k(1−p)
k(1−p)
k(1−p)
L (h−1,k,n)ν
Router without hosts
. . .
kp k(1−p)
. . .
σπ ...kp
k(1−p)
Router with hosts
Figure 9. An overlay tree model with receivers locatedat leaf or non-leaf nodes (for simplicity, unary nodes arenot shown)
We use the same underlying network model as in Sec-tion 4.2. We now assume that receivers are uniformly andindependently distributed over the entire tree (with the ex-ception of unary nodes). This implies that the probabilitythat a node (other than the root) has at least one receiverconnected is: � � � � �� � �
��� for � receivers, where
� � � � � �� � ��������� .
On the average, among the � children of a non-leaf node,�� children have receivers connected, while ��� � �� chil-dren have no receivers connected. Let � ��� �� �� be the
Proceedings of the 11th IEEE International Conference on Network Protocols (ICNP’03)
1092-1648/03 $17.00 © 2003 IEEE

1
10
100
1000
10000
1 10 100 1000 10000 100000
Nor
mal
ized
Ove
rlay
Tree
Cos
t
Number of Members
x^0.92k=3,h=6k=3,h=7k=3,h=8k=4,h=5k=4,h=6k=5,h=5
(a) Receivers at leaf nodes
1
10
100
1000
10000
1 10 100 1000 10000 100000
Nor
mal
ized
Ove
rlay
Tree
Cos
t
Number of Members
x^0.83k=3,h=6k=3,h=7k=3,h=8k=4,h=5k=4,h=6k=5,h=5
(b) Receivers at leaf or non-leaf nodes
1
10
100
1 10 100 1000 10000
Nor
mal
ized
Ove
rlay
Tree
Cos
t
Number of Members
x^0.85RNG_seed=3RNG_seed=5RNG_seed=7RNG_seed=9
(c) Traceroute-based overlay multicastsimulations using minimum spanningtrees
Figure 8. Normalized overlay cost versus number of members from ����� �� �� for (a) and from ����� �� �� for (b)(� � ���) and from simulations for (c) (log-log scale)
overlay cost of an overlay network �. The computation of����� �� �� is split into two components: (i) cost for �� chil-dren of the root with receivers, and (ii) cost for ������ chil-dren of the root without receivers. Again, we first considera tree without unary nodes and then add the cost introducedby unary nodes. In the first component, one of the �� chil-dren incurs ������� from the root and ������� �� �� for itsdescendants. Thus, the cost for the �� children of the rootis: ���������� � ����� �� �� ���.
Now, consider one of the ��� � �� children of the rootwithout receivers. We again have �� children with con-nected receivers, and ��� � �� children without connectedreceivers. A recurrence relation based on this pattern com-putes the second part of ����� �� �� for the ��� � �� chil-dren of the root. Consider node � at level � which does nothave receivers connected (refer to Figure 9). There may bereceivers at the descendants of � that use the link from theparent of � to � with approximate probability:
��
��� ���
�� � ��
���� � �
��(3)
where ��� is the probability that a receiver is located below�, and �����
������is the probability that the receiver is con-
nected to a non-leaf node at level , � �. The lat-ter probability is based on the fact that the total number ofnodes except the root is ��� � ���� � ������
��� and the num-
ber of nodes at level is �����
��� . We use � � �� � ����� asan approximation of Equation (3) for large � values.
Let � ��� denote the cost required to deliver data to thedescendants of �. As illustrated in Figure 9, at least one ofthe �� children must receive data from nodes other than �
and the descendants of �. If we consider the additional costintroduced by unary nodes, a sibling node of � which hasreceivers (� in the figure) minimizes the cost to �������� ����������. An additional cost of ������������� � �� is re-quired to relay the data among the �� children of �. Thus, ������� � �������������������������������� isincurred for the �� children of �. Also, ����������� �� ��
is incurred by the descendants of the �� children of �. Forthe ������ children of � without receivers, ������� �����is incurred. Hence, � ��� can be computed as: ��������������� �� �� �� �� � ���� ��� ��� ��. This is equal to����
��� �������������� ����������������� �� ���.
The cost for the ���� �� children of the root at level � �� is ��� � ��� �� � �� �
������� �
��� � ��� � � �� � ��� � ������� � �� �� ���.
Therefore,
����� �� �� � ���������� � ����� �� �� ��� (4)
�
�������
����� ���� ��� � �� � ������� � �� �� ���
Lemma 1 Solving the recurrence relation in Equation (4)with a fixed ratio � � �
��� � �� (� is as defined in
section 4.3) yields:
����� �� �� � ����������� ��� � ����������
����������
� ������������ ������ � ���� ��
�������
�������
� ������� ������ � ���� ������� ��
����� (5)
where ����� �� ���
��� ������������
���
.
The proof of this lemma and the proof that ����� �� ��is the minimum cost overlay tree when receivers are lo-cated at any node except the root can be found in [9]. Notethat ��
� ��� ��, the average number of hops on the sourceto receiver unicast paths, is now computed as: ��
� ��� �� ���
��
��� ����
��� �������.
The normalized overlay cost ������ �� �� � ������
�������
does not exhibit a power-law [9]. However, Figure 8(b)demonstrates that ��
���� �� �� behaves asymptotically sim-ilar to a power-law when � � �. In the figure,������ �� �� � �����. The factor 0.83 is smaller than the
Proceedings of the 11th IEEE International Conference on Network Protocols (ICNP’03)
1092-1648/03 $17.00 © 2003 IEEE
0.92 for the case when hosts are only connected at leaves,since many additional hops can be saved in this case. It isalso important to note that our decreasing unary node dis-tribution leads to a lower tree cost (0.83 versus an 0.87 fac-tor for this same model with uniformly distributed unarynodes). The cost provides a useful notion for comparingand designing overlay multicast protocols to optimize loads.The 0.8 to 0.9 factor can be also compared to a factor� 0.7for IP multicast [6, 8].
4.4. Simulation and Experimental Validation
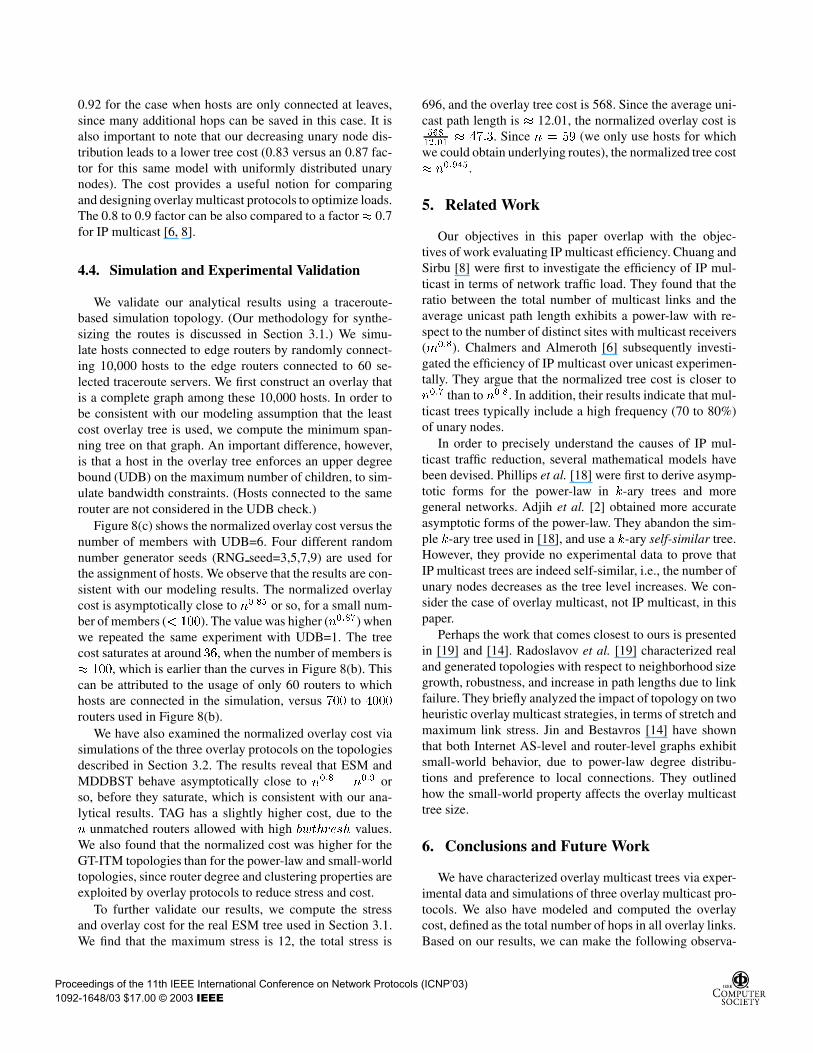
We validate our analytical results using a traceroute-based simulation topology. (Our methodology for synthe-sizing the routes is discussed in Section 3.1.) We simu-late hosts connected to edge routers by randomly connect-ing 10,000 hosts to the edge routers connected to 60 se-lected traceroute servers. We first construct an overlay thatis a complete graph among these 10,000 hosts. In order tobe consistent with our modeling assumption that the leastcost overlay tree is used, we compute the minimum span-ning tree on that graph. An important difference, however,is that a host in the overlay tree enforces an upper degreebound (UDB) on the maximum number of children, to sim-ulate bandwidth constraints. (Hosts connected to the samerouter are not considered in the UDB check.)
Figure 8(c) shows the normalized overlay cost versus thenumber of members with UDB=6. Four different randomnumber generator seeds (RNG seed=3,5,7,9) are used forthe assignment of hosts. We observe that the results are con-sistent with our modeling results. The normalized overlaycost is asymptotically close to �
���� or so, for a small num-ber of members (� ���). The value was higher (�����) whenwe repeated the same experiment with UDB=1. The treecost saturates at around ��, when the number of members is� ���, which is earlier than the curves in Figure 8(b). Thiscan be attributed to the usage of only 60 routers to whichhosts are connected in the simulation, versus ��� to ����
routers used in Figure 8(b).We have also examined the normalized overlay cost via
simulations of the three overlay protocols on the topologiesdescribed in Section 3.2. The results reveal that ESM andMDDBST behave asymptotically close to �
���� �
��� orso, before they saturate, which is consistent with our ana-lytical results. TAG has a slightly higher cost, due to the� unmatched routers allowed with high ������� values.We also found that the normalized cost was higher for theGT-ITM topologies than for the power-law and small-worldtopologies, since router degree and clustering properties areexploited by overlay protocols to reduce stress and cost.
To further validate our results, we compute the stressand overlay cost for the real ESM tree used in Section 3.1.We find that the maximum stress is 12, the total stress is
696, and the overlay tree cost is 568. Since the average uni-cast path length is � 12.01, the normalized overlay cost is���
������ ���. Since � � �� (we only use hosts for which
we could obtain underlying routes), the normalized tree cost� �
�����.
5. Related Work
Our objectives in this paper overlap with the objec-tives of work evaluating IP multicast efficiency. Chuang andSirbu [8] were first to investigate the efficiency of IP mul-ticast in terms of network traffic load. They found that theratio between the total number of multicast links and theaverage unicast path length exhibits a power-law with re-spect to the number of distinct sites with multicast receivers(����). Chalmers and Almeroth [6] subsequently investi-gated the efficiency of IP multicast over unicast experimen-tally. They argue that the normalized tree cost is closer to���� than to ����. In addition, their results indicate that mul-ticast trees typically include a high frequency (70 to 80%)of unary nodes.
In order to precisely understand the causes of IP mul-ticast traffic reduction, several mathematical models havebeen devised. Phillips et al. [18] were first to derive asymp-totic forms for the power-law in �-ary trees and moregeneral networks. Adjih et al. [2] obtained more accurateasymptotic forms of the power-law. They abandon the sim-ple �-ary tree used in [18], and use a �-ary self-similar tree.However, they provide no experimental data to prove thatIP multicast trees are indeed self-similar, i.e., the number ofunary nodes decreases as the tree level increases. We con-sider the case of overlay multicast, not IP multicast, in thispaper.
Perhaps the work that comes closest to ours is presentedin [19] and [14]. Radoslavov et al. [19] characterized realand generated topologies with respect to neighborhood sizegrowth, robustness, and increase in path lengths due to linkfailure. They briefly analyzed the impact of topology on twoheuristic overlay multicast strategies, in terms of stretch andmaximum link stress. Jin and Bestavros [14] have shownthat both Internet AS-level and router-level graphs exhibitsmall-world behavior, due to power-law degree distribu-tions and preference to local connections. They outlinedhow the small-world property affects the overlay multicasttree size.
6. Conclusions and Future Work
We have characterized overlay multicast trees via exper-imental data and simulations of three overlay multicast pro-tocols. We also have modeled and computed the overlaycost, defined as the total number of hops in all overlay links.Based on our results, we can make the following observa-
Proceedings of the 11th IEEE International Conference on Network Protocols (ICNP’03)
1092-1648/03 $17.00 © 2003 IEEE

tions. First, the experimental data and simulations illustratethat both the average delay and the number of hops betweenparent and child hosts tend to decrease as the level of thehost in the overlay tree increases. Our analysis suggests thatrouting features in overlay multicast protocols, along withpower-law and small-world topology characteristics, play akey role in explaining these phenomena. Non-uniform mul-ticast host distribution reinforces them. Second, our modelsbehave asymptotically close to power-laws, ranging from����� to ����� for � hosts. Simulations and experimental
data validate our models, and show the latency bandwidthtradeoffs in overlay trees constructed via three differentprotocols. We can quantify potential bandwidth savings ofoverlay multicast compared to unicast since ���� � �, andthe bandwidth penalty of overlay multicast compared to IPmulticast (���� � ����).
One limitation of our experiments is the synthe-sis of traceroute paths among hosts. Topology inferenceprojects [11] may help us obtain more accurate path in-formation for our future experiments and analysis. Weplan to conduct larger-scale simulations and experimen-tal data analysis to better understand overlay tree properties.We will also examine other types overlay protocols, and in-vestigate more dynamic characteristics and performancemetrics, including join-leave dynamics, protocol over-head, and delay and bandwidth changes. Finally, we planto precisely formulate the relationship between the struc-ture of overlay trees, overlay protocols, and Internet topol-ogy characteristics. This will ultimately shed more light onoverlay protocol design methodologies.
References
[1] Traceroute.org, 2003. http://www.traceroute.org.
[2] C. Adjih, L. Georgiadis, P. Jacquet, and W. Szpankowski.Multicast Tree Structure and the Power Law. In Proc. ofSODA, 2002.
[3] D. G. Andersen, H. Balakrishnan, M. F. Kaashoek, andR. Morris. Resilient Overlay Networks. In Proc. of ACMSOSP, pages 131–145, October 2001.
[4] A. Barabasi and R. Albert. Emergence of Scaling in RandomNetworks. Science, 286:509–512, 1999.
[5] M. Castro, P. Druschel, A.-M. Kermarrec, and A. Rowstron.Scribe: A Large-scale and Decentralized Application-levelMulticast Infrastructure. IEEE Journal on Selected Areas inCommunications, 20(8), October 2002.
[6] R. Chalmers and K. Almeroth. Modeling the BranchingCharacteristics and Efficiency Gains in Global MulticastTrees. In Proc. of IEEE INFOCOM, pages 449–458, April2001.
[7] Y. Chu, S. Rao, S. Seshan, and H. Zhang. Enabling Confer-encing Applications on the Internet using an Overlay Multi-cast Architecture. In Proc. of ACM SIGCOMM, pages 55–67,August 2001.
[8] J. Chuang and M. Sirbu. Pricing Multicast Communications:A Cost-Based Approach. In Proc. of Internet Society INET,July 1998.
[9] S. Fahmy and M. Kwon. Characterizing Overlay MulticastNetworks. Technical Report, August 2003. Available athttp://www.cs.purdue.edu/homes/fahmy/.
[10] M. Faloutsos, P. Faloutsos, and C. Faloutsos. On Power-LawRelationships of the Internet Topology. In Proc. of ACM SIG-COMM, pages 251–262, August 1999.
[11] P. Francis, S. Jamin, C. Jin, Y. Jin, D. Raz, Y. Shavitt, andL. Zhang. IDMaps: A Global Internet Host Distance Es-timation Service. IEEE/ACM Transactions on Networking,9(5):525–540, October 2001.
[12] D. V. Houweling. Internet 2, 2003. http://www.internet2.edu.[13] J. Jannotti, D. Gifford, K. Johnson, M. Kaashoek, and J. O.
Jr. Overcast: Reliable multicasting with an overlay network.In Proc. of OSDI, October 2000.
[14] S. Jin and A. Bestavros. Small-World Internet Topologies:Possible Causes and Implications on Scalability of End-System Multicast. Technical Report BUCS-TR-2002-004,Boston University, 2002.
[15] M. Kwon and S. Fahmy. Topology-Aware Overlay Networksfor Group Communication. In Proc. of ACM NOSSDAV,pages 127–136, May 2002.
[16] N. Malouch, Z. Liu, D. Rubenstein, and S. Sahu. A GraphTheoretic Approach to Bounding Delay in Proxy-Assisted,End-System Multicast. In Proc. of IWQoS, May 2002.
[17] L. Peterson, T. Anderson, D. Culler, and T. Roscoe. ABlueprint for Introducing Disruptive Technology into the In-ternet. In Proceedings of the HotNets-I, October 2002.
[18] G. Phillips, S. Shenker, and H. Tangmunarunkit. Scalingof Multicast Trees: Comments on the Chuang-Sirbu scalinglaw. In Proc. of ACM SIGCOMM, pages 41–51, 1999.
[19] P. Radoslavov, H. Tangmunarunkit, H. Yu, R. Govindan,S. Shenker, and D. Estrin. On Characterizing NetworkTopologies and Analyzing Their Impact on Protocol Design.Technical Report USC-CS-TR-00-731, Dept. of ComputerScience, University of Southern California, February 2000.
[20] S. Ratnasamy, M. Handley, R. Karp, and S. Shenker.Topologically-Aware Overlay Construction and Server Se-lection. In Proc. of IEEE INFOCOM, volume 3, pages 1190–1199, June 2002.
[21] S. Shi, J. Turner, and M. Waldvogel. Dimension Server Ac-cess Bandwidth and Multicast Routing in Overlay Networks.In Proc. of ACM NOSSDAV, pages 83–91, June 2001.
[22] I. Stoica, R. Morris, D. Liben-Nowell, D. R. Karger, M. F.Kaashoek, F. Dabek, and H. Balakrishnan. Chord: A Scal-able Peer-to-peer Lookup Protocol for Internet Applications.In Proc. of ACM SIGCOMM, pages 149–160, August 2001.
Proceedings of the 11th IEEE International Conference on Network Protocols (ICNP’03)
1092-1648/03 $17.00 © 2003 IEEE