
Scalable multicasting with network-aware geometric overlay
25
Scalable multicasting with network-aware geometric overlay Eng Keong Lua a,b, * , Xiaoming Zhou c,d , Jon Crowcroft a , Piet Van Mieghem c a University of Cambridge, Computer Laboratory, William Gates Building, 15 JJ Thomson Avenue, Cambridge CB3 0FD, United Kingdom b Nippon Telegraph and Telephone Corporation (NTT Corporation), NTT Service Integration Laboratories, 3-9-11 Midori-Cho, Musashino-Shi, Tokyo 180-8585, Japan c Delft University of Technology, Faculty of Electrical Engineering, Mathematics, and Computer Science, 2600 GA Delft, The Netherlands d Philips Research, High Tech Campus 34, 5656 AE Eindhoven, The Netherlands Available online 14 September 2007 Abstract It is crucial to design an efficient network-aware overlay network to enable multicast service to adjust under the dynamic underlying net- work conditions and node churn in a scalable manner without extensive network measurements. We propose an accurate and scalable Inter- net subspace geometry to embed the nodes onto a geometric plane by measuring delay latencies between some nodes and assign geometric coordinates to all nodes in such a way that the geometric distances between node coordinates closely approximate their delay latencies. We exploit this Internet subspace geometry to design a network-aware SuperPeers–Peers geometric overlay hierarchy. This is maintained locally in a distributed manner allowing lightweight self-organization. We then create shortest-path overlay multicast tree based on shortest geo- metric distances between SuperPeers at the SuperPeers layer for overlay multicasting. This low-latency and high-bandwidth multicast back- bone infrastructure will serve the Peers in the lower layer. We evaluate our proposals on the 10 massive scale networks each consisting of 100,000 nodes and in the PlanetLab. Our performance evaluation results show high efficiency and good scalability. Ó 2007 Elsevier B.V. All rights reserved. Keywords: Peer-to-Peer overlay networks; Overlay multicast networks; Application level multicast; Network embedding; Internet coordinate systems 1. Introduction Overlay multicast provides an attractive alternative to IP multicast which has limited wide scale deployment. Overlay multicast is a service that implements multicast on an overlay network, and it offers the benefit of not requiring any network support except the network unicast capabilities. This allows service diversity and accelerated service deployment with a greater flexibility because we do not need to rely on the restriction or availability of the underlying IP multicast’s network resources. That is, we are able to implement multicast service over the over- lays even though we have limited IP multicast deployment in the underlying network. The basic principle of building overlay multicast net- work is to organize nodes into multicast groups at a higher abstraction layer above the underlying network infrastruc- ture. One-to-many or many-to-many communication is performed by building data delivery trees on the overlays. Building an overlay network for multicasting on a random relationship relative to the underlying physical network topology could result in a loosely coupled connectivity between overlay nodes. The impact on the multicast service is that the delay latency could be high as data may pass through many overlay nodes that might be slow and have long physical paths in the underlying physical network. For multicast applications to experience better quality of service characteristics, short network paths are desirable in addition to good load and data distribution. Thus, it is important to mitigate multiple overlay edges from 0140-3664/$ - see front matter Ó 2007 Elsevier B.V. All rights reserved. doi:10.1016/j.comcom.2007.08.046 * Corresponding author. Address: Nippon Telegraph and Telephone Corporation (NTT Corporation), NTT Service Integration Laboratories, 3-9-11 Midori-Cho, Musashino-Shi, Tokyo 180-8585, Japan. Tel.: +81 422 59 3946; fax: +81 422 59 5671. E-mail addresses: [email protected], lua.engkeong @lab.ntt.co.jp (E.K. Lua), [email protected], xiaoming.zhou@ philips.com (X. Zhou), [email protected] (J. Crowcroft), [email protected] (P.V. Mieghem). www.elsevier.com/locate/comcom Available online at www.sciencedirect.com Computer Communications 31 (2008) 464–488
-
Upload
khangminh22 -
Category
Documents
-
view
0 -
download
0
Transcript of Scalable multicasting with network-aware geometric overlay

Available online at www.sciencedirect.com
www.elsevier.com/locate/comcom
Computer Communications 31 (2008) 464–488
Scalable multicasting with network-aware geometric overlay
Eng Keong Lua a,b,*, Xiaoming Zhou c,d, Jon Crowcroft a, Piet Van Mieghem c
a University of Cambridge, Computer Laboratory, William Gates Building, 15 JJ Thomson Avenue, Cambridge CB3 0FD, United Kingdomb Nippon Telegraph and Telephone Corporation (NTT Corporation), NTT Service Integration Laboratories,
3-9-11 Midori-Cho, Musashino-Shi, Tokyo 180-8585, Japanc Delft University of Technology, Faculty of Electrical Engineering, Mathematics, and Computer Science, 2600 GA Delft, The Netherlands
d Philips Research, High Tech Campus 34, 5656 AE Eindhoven, The Netherlands
Available online 14 September 2007
Abstract
It is crucial to design an efficient network-aware overlay network to enable multicast service to adjust under the dynamic underlying net-work conditions and node churn in a scalable manner without extensive network measurements. We propose an accurate and scalable Inter-net subspace geometry to embed the nodes onto a geometric plane by measuring delay latencies between some nodes and assign geometriccoordinates to all nodes in such a way that the geometric distances between node coordinates closely approximate their delay latencies. Weexploit this Internet subspace geometry to design a network-aware SuperPeers–Peers geometric overlay hierarchy. This is maintained locallyin a distributed manner allowing lightweight self-organization. We then create shortest-path overlay multicast tree based on shortest geo-metric distances between SuperPeers at the SuperPeers layer for overlay multicasting. This low-latency and high-bandwidth multicast back-bone infrastructure will serve the Peers in the lower layer. We evaluate our proposals on the 10 massive scale networks each consisting of100,000 nodes and in the PlanetLab. Our performance evaluation results show high efficiency and good scalability.� 2007 Elsevier B.V. All rights reserved.
Keywords: Peer-to-Peer overlay networks; Overlay multicast networks; Application level multicast; Network embedding; Internet coordinate systems
1. Introduction
Overlay multicast provides an attractive alternative toIP multicast which has limited wide scale deployment.Overlay multicast is a service that implements multicaston an overlay network, and it offers the benefit of notrequiring any network support except the network unicastcapabilities. This allows service diversity and acceleratedservice deployment with a greater flexibility because wedo not need to rely on the restriction or availability ofthe underlying IP multicast’s network resources. That is,
0140-3664/$ - see front matter � 2007 Elsevier B.V. All rights reserved.
doi:10.1016/j.comcom.2007.08.046
* Corresponding author. Address: Nippon Telegraph and TelephoneCorporation (NTT Corporation), NTT Service Integration Laboratories,3-9-11 Midori-Cho, Musashino-Shi, Tokyo 180-8585, Japan. Tel.: +81422 59 3946; fax: +81 422 59 5671.
E-mail addresses: [email protected], [email protected] (E.K. Lua), [email protected], [email protected] (X. Zhou), [email protected] (J. Crowcroft),[email protected] (P.V. Mieghem).
we are able to implement multicast service over the over-lays even though we have limited IP multicast deploymentin the underlying network.
The basic principle of building overlay multicast net-work is to organize nodes into multicast groups at a higherabstraction layer above the underlying network infrastruc-ture. One-to-many or many-to-many communication isperformed by building data delivery trees on the overlays.Building an overlay network for multicasting on a randomrelationship relative to the underlying physical networktopology could result in a loosely coupled connectivitybetween overlay nodes. The impact on the multicast serviceis that the delay latency could be high as data may passthrough many overlay nodes that might be slow and havelong physical paths in the underlying physical network.For multicast applications to experience better quality ofservice characteristics, short network paths are desirablein addition to good load and data distribution. Thus,it is important to mitigate multiple overlay edges from

E.K. Lua et al. / Computer Communications 31 (2008) 464–488 465
traversing the same underlying network links and multiplecommunications across many end systems that will pro-duce redundant traffic and increase latency.
To design scalable network-aware overlay network, wecould initiate multiple network measurements to determinenode-to-node latencies. However, such a exhaustivemethod will result in a large measurement overhead inoverlay operation and when node churn is high. If we per-form network measurements periodically, the resultingmeasurement is not related to the realistic usage of theoverlay network and thus leads to stale and inconsistentinformation. In addition, to construct efficient overlay mul-ticast streaming service, we cannot ignore the dynamicunderlying network behavior and incur unnecessary exten-sive measurements affecting the quality of the connectionsbetween network nodes that cause overheads. The overlaymulticast streaming network should not add extra com-plexity that results in scalability problem and complexmaintenance operation.
With all the above criteria in mind, we propose a net-work-aware geometric overlay multicast streaming net-work that efficiently exploit the underlying networklocality and proximity of nodes for overlay node placementstrategy, routing and multicasting. In our approach, weexploit our accurate and scalable network subspace embed-ding (Highways [1]) of network latencies between nodes,such as Round-Trip-Times (RTTs), into a low-dimensionalgeometric space. This is done by measuring the networklatencies between some nodes and assign geometric coordi-nates to all nodes in such a way that the geometric dis-tances between node coordinates closely approximatetheir RTTs. The measurement overhead is reduced becausenon-measurements are estimated. The node coordinatescan be maintained in a distributed manner with a smallnumber of network latency measurements. The networkembedding system adapts to dynamic network changes asthe overlay nodes update their node coordinates iteratively.Hence, network embedding provides a feasible and promis-ing approach to help in the scalable construction of net-work-aware geometric overlay network.
Of course, we require a reasonably good quality net-work embedding function to provide accurate mapping[2–4]. From the scalability meta-metric in [2], subspaceembedding (Euclidean space) in small clusters [1] consistingof closer nodes will achieve better embedding accuracy. Wedesign an overlay control plane service using this subspaceembedding (Highways) to compute node local geometriccoordinates in local geometric space and distances betweenthe nodes within each cluster and perform basis transfor-mation of local geometric coordinates to global geometriccoordinates in global geometric space for computation ofdistances between nodes in different clusters. The distanceranking of nodes determine the node locality in the under-lying network. Basically, the overlay network learns of theunderlying network delay latencies (RTTs) between nodesthrough their coordinates and distances computed fromtheir coordinates in the geometric plane. This information
allows efficient and selective placement of nodes in theoverlay topology.
A network-aware SuperPeers–Peers geometric overlayhierarchy is created to scale the overlay network communi-cation and management – Lightweight SuperPeers Topolo-gies (LST) [5–7]. The SuperPeers layer provides a low-latency and high-bandwidth backbone infrastructure forcommunications among all nodes in the network. ThePeers in the Peers layer are connected to their closestSuperPeers in terms of their shortest geometric distancesbetween them. We use Yao-graph [8] to build the Super-Peers’ connectivity – every SuperPeer is connected to six
closest SuperPeers (neighbors). The geometric structureof Yao-graph is maintained locally in a distributed mannerallowing lightweight self-organization and recovery fromnode churn. We then create source routed overlay multi-cast tree from the resulting optimal geometric routingpaths that are based on the shortest geometric distances(latencies) between SuperPeers at the SuperPeers layer.The optimal geometric routes are derived from the LST’sgeometric routing protocol (localized random compassrouting algorithm) at the SuperPeers layer for multicasting.As every SuperPeer has only six other connections at theSuperPeers layer, this means that the bandwidth consumedby each SuperPeer for multicasting is being reduced to cer-tain extent. This low-latency and high-bandwidth multicastbackbone infrastructure will serve the Peers in the lowerlayer (Bos) [9,10].
In order to examine the performance of LST’s and Bos,we conduct simulation experiments on the 10 massive scalenetworks each consisting of 100,000 nodes and carry outdeployment experiments in the PlanetLab [11]. The perfor-mance evaluation results show that our proposals have high
efficiency and good scalability.Outline. The rest of the paper is organized as follows.
Section 2 describes the design principles of our network-aware SuperPeers–Peers geometric overlay network (LST)using accurate and scalable Internet subspace geometry(Highways). We also discuss the overlay maintenance man-agement and robustness during node churn. Section 3 pre-sents our proposal of exploiting the network awareness andlocality of LST overlay network for overlay multicasting(Bos). Section 4 explains the setup of our simulation exper-iments using the same realistic massive scale networks thatwere used by Scribe [12,13] and SplitStream [14] from theMicrosoft Research Cambridge. We also discuss ourdeployment experiments in the PlanetLab’s real-worldInternet-scale environment. Section 5 discusses our perfor-mance evaluation results of LST and Bos on the 10 massivescale networks and in the PlanetLab. Section 6 describesrelated work and Section 7 concludes.
2. Network-aware geometric overlay network
The LST overlay network [5,6] is divided into two lay-ers: SuperPeers and Peers. The upper SuperPeers layer actsas a reliable low-latency and high-bandwidth backbone

Peers Layer
SuperPeers Layer
Peers Layer
SuperPeers Layer
Fig. 1. Network-aware SuperPeers–Peers geometric overlay hierarchy.
466 E.K. Lua et al. / Computer Communications 31 (2008) 464–488
network infrastructure for communications among allnodes. Every Peer in the Peers layer is connected to theirclosest SuperPeer in terms of the shortest geometric dis-tance between them for end-to-end overlay geometric rout-ing. Fig. 1 shows an example of the network-awareSuperPeers–Peers geometric overlay hierarchy of the LSToverlay network.
There are three key steps in the construction of the LSToverlay network which we will describe in the belowsubsections.
Global Geometric SpaceGlobal Geometric Space
2.1. SuperPeer election
When a new node joins the LST overlay network eitherduring bootstrap or normal overlay operation, the follow-ing criteria are evaluated to determine whether this nodewill be elected as a SuperPeer or normal Peer:
• The SuperPeer should have sufficient resources to serveother SuperPeers and Peers.
• The SuperPeer should be reliable and it is not joiningand leaving the LST overlay network very frequently.
With the above criteria imposed, the SuperPeers layerconsists of SuperPeers acting as low-latency and high-bandwidth backbone infrastructure for the Peers in thePeers layer. Trust, security and incentive schemes couldbe implemented in this election process, although this isout of scope for this work.
Peers
SuperPeers(Landmarks)
Peers
SuperPeers(Landmarks)
Fig. 2. Global geometric space for overlay nodes.
2.2. Internet geometry
Network embedding computes node coordinates andgeometric distances between nodes to estimate their under-lying network performance metrics such as latency in ascalable way. That is, nodes are mapped onto points in ageometric space and they are assigned geometric coordi-nates in such a way that the computed geometric distancesbetween node coordinates closely approximates the laten-
cies (i.e. RTTs) between nodes. These node coordinatesalso reflect their geometric position in the geometric space.RTT measurements from each node to some landmarks areperformed for embedding into a geometric space. So, itdoes not require full mesh N2 network measurements ofN nodes that will cause extensive overheads to deduce thequality of the network connection metric (RTTs) betweennodes.
Using these geometric distances, efficient and selectiveplacement of nodes in the geometric overlay network isdone. In other words, we are able to determine node local-ity from the node coordinates and geometric distancesbetween nodes. Basically, the LST overlay network learnsof the underlying network latencies (RTTs) between nodesthrough their coordinates and computed geometric dis-tances. Our Internet geometry provides the geometric loca-tion information for the construction of network-awaregeometric overlays. From the scalability meta-metricobservations in [2], subspace embedding (Euclidean space)in small partitioned clusters achieves better embeddingaccuracy. The nodes have closer landmarks within eachcluster.
We propose and develop Highways [1] as an overlay net-work control plane service providing geometric locationinformation for the LST overlay network. In Highways,superspace embedding [2] embeds the whole set of overlaynodes in the system as one large set into global geometricspace while subspace embedding embeds small partitionedclusters of overlay nodes into local geometric space. In thismanner, both the global and local geometric spaces areestablished to derive the global and local geometric posi-tions of all overlay nodes, respectively. We use Euclideanspace as the embedded geometric space in our Internetgeometry.
Fig. 2 shows the SuperPeers being classified as the list oflandmarks for network superspace embedding to computethe node global geometric coordinates in the global geo-metric space. Fig. 3 illustrates the subspace embedding

Cluster 1 Cluster 2 Cluster 3 PeersSuperPeers(Landmarks)
Local Geometric Space in each cluster
PeersSuperPeers(Landmarks)
PeersSuperPeers(Landmarks)
Fig. 3. Local geometric space for overlay nodes.
E.K. Lua et al. / Computer Communications 31 (2008) 464–488 467
(Euclidean space) in each of the small cluster consisting ofcloser nodes.
The local geometric position information helps to pro-vide an accurate geometric distance estimation betweenoverlay nodes within each of the clusters while the globalgeometric position information estimates the inter-clustergeometric distances between overlay nodes in different clus-ters. The overlay nodes in each cluster compute their localgeometric coordinates based on its local basis of the localgeometric space. Once the node local geometric coordi-nates are computed through subspace embedding, wemaintain a basis transformation matrix for the ease of con-verting the node local geometric coordinates from the localgeometric space to the global geometric space to derive thenode global geometric coordinates, without measuring anyproperty between itself and the landmarks that spans sucha space.
In our system, we first measure the RTTs among theSuperPeers and use this measured RTT matrix to partitionthe SuperPeers into smaller clusters by adopting a simpleapproach of the K-means method [15]. The algorithm sep-arates and combines nodes into clusters in the LST overlaynetwork by assigning each node to the cluster having thenearest centroid (mean) based on the geometric distances.We use K = 3 as the number of partitions due to the geo-graphical continents of the world, which comprises gener-ally of North/South America, Africa/Europe and AsiaPacific. After all the SuperPeers have been partitioned intosmaller clusters, all Peers measure their RTTs to all theSuperPeers and every Peer uses this information to findthe closest SuperPeer. The Peer then joins the clusterwhereby the closest SuperPeer belongs. These measuredRTTs between SuperPeer-to-SuperPeer and Peer-to-Super-Peer as a result of clustering are usable and required for thenetwork embedding. Thus there is no additional overheadand redundancy in measuring these raw RTT measure-ments and they are less than N2 measurements taken.
Subspace embedding into Euclidean space is performedstrictly in each of the partitioned clusters to compute nodelocal geometric coordinates in each cluster. To compute theinter-cluster geometric distances between all nodes residing
in different clusters, we make use of the basis transitionmatrix. We would be able to transform the node local geo-metric coordinates from its local geometric space to theglobal geometric space to derive the node global geometriccoordinates. Once the transformation is done, we are ableto compute the inter-cluster geometric distances betweenthese nodes residing in different clusters that spans the glo-bal geometric space. As a result, all overlay nodes will haveboth local and global geometric coordinates beingassigned.
Here we describe the landmark-based embedding andsingular value decomposition (SVD) technique that weuse to map the nodes into points in a low-dimensional geo-metric space. In our LST overlay network, the list ofelected SuperPeers are the landmarks for the subspaceembedding.
To calculate and assign coordinates of k-dimensionalgeometric space for all N nodes in X, at least k + 1landmarks [16,17] (SuperPeers) are selected. This is tosolve the possible problem that coordinate vectors ofthe landmarks could be linearly dependent in the geo-metric space which may cause the nodes to unable todifferentiate their distinct geometric locations from theselandmarks and hinder the computation of the nodecoordinates. That is, if the landmarks have their coordi-nate vectors as a multiple of the other i.e. the landmarksare in a straight vector line, then the nodes would notbe able to compute their distinct geometric locationsfrom these landmarks. As in [18], this framework relieson a set of landmarks from which the nodes may selectany set consisting of at least k + 1 landmarks out of alist of all landmarks for embedding into k-dimensionalgeometric space. This allows flexibility for a node todetermine its geometric coordinates in choosing its setof landmarks without the need to use a fixed infrastruc-ture of well-known landmarks. It solves the problems ofcommunication bottlenecks and single points-of-failurecaused by the use of well-known landmarks. However,note that the chosen set of landmarks must share atleast one common landmark in their selection so thatthe vector basis constructed spans the embedded geomet-ric space.
A symmetric measured network latency matrix D for theset of landmarks L = {l1, l2, . . . , lm} is derived asD = [d(i, j)]i,j=1, . . . , m, where m P k + 1 and d(i, j) is themeasured network latency (RTTs) between m landmarks.For i „ j, d(i, j) = d(j, i) and d(i, i) = 0. Dimensionalityreduction to k is done using SVD
D ¼ U � W � V T ð1Þ
where U and VT are orthogonal matrices, and W is a diag-onal matrix containing the singular values of D.
The RTT measurements of all overlay nodes i 2 X wherei = 1, . . . ,N to their sets of selected landmarksL = {l1, l2, . . . , lm} are made. This can be written using col-umn vector notation for a node i as below:

468 E.K. Lua et al. / Computer Communications 31 (2008) 464–488
/ðiÞ :¼
dði; l1Þdði; l2Þ
..
.
dði; lmÞ
0BBBB@
1CCCCA ð2Þ
This is simply the Lipschitz embedding of X using set oflandmarks L.
By using the first k columns of U denoted by Uk, weproject the m-dimensional space into a new k-dimensionalspace: where / 0(i) = UkT Æ /(i) is the coordinates of node i
after dimensionality reduction.To minimize the discrepancy between the distance repre-
sented in the coordinates system and the measured distancebetween m landmarks, we defined and used a scaling factor:
ak ¼Pm
i
Pm
jdði;jÞ:dði;jÞPm
i
Pm
jdði;jÞ2
where d(i, j) = L2(UkT Æ /(i), UkT Æ /
(j)), where L2 is the Euclidean norm since we use Euclideanspace.
In order for a node to know about the global geometricspace G and derive its coordinates in G, without measuringany property between itself and the nodes that form such avector basis, a basis changing technique is adopted and abasis transition matrix TG is maintained. That is, a basistransition matrix TG is computed for converting the nodelocal geometric coordinates between its local basis of thelocal geometric space C to global basis of the global geo-metric space G to derive its global geometric coordinates.The basic insight is that a randomly selected set of land-marks defines an embedding geometric space that can beeasily (linearly) mapped into another embedding spacederived from a different set of landmarks. We maintain abasis transformation matrix for the ease of converting nodelocal geometric coordinates from its local geometric spaceto the global geometric space to derive its global geometricspace, without measuring any property between itself andthe landmarks that spans such a space.
If we want to change the local basis of Rk from localgeometric space C to the global geometric space G, thebasis transition matrix TG is calculated by a selected arbi-trary set of nodes. This selected set of nodes measure coor-dinates to two landmark sets in the global geometric spaceG and local geometric space C. Then, the following equa-tion is solved using least squares to obtain TG
T G � P C ¼ P G
T G ¼ P G � P C�1
ð3Þ
where PG is the selected set of node global geometric coor-dinates in global geometric space G and PC is the selectedset of node local geometric coordinates in original localgeometric space C.
Once we have TG, then we can calculate the global geo-metric coordinates of the node i in the global geometricspace G from its local geometric coordinates in originallocal geometric space C:
/GðiÞ ¼ T G � UkTC � /CðiÞ ð4Þ
Therefore, the node global geometric coordinates in theglobal geometric space G can be obtained relative to the ba-sis transition matrix TG and its node local geometric coor-dinates in the original local geometric space C, withnothing more than the information it already has.
We expect nodes to recompute their coordinates fromtime to time due to node churn or topology changes. Suchchanges are captured by the network performance metrics(i.e. RTTs) between nodes. In this case, a node recomputesits coordinates following the above embedding steps. If forsome reasons, a landmark becomes unavailable during thisrecomputation process, the node then chooses other alter-native landmark to devise the basis transition matrix.
2.3. SuperPeers–Peers geometric overlay hierarchy
A brief description of Yao-graph [8] and its attractivegeometric properties are in Appendix.
The basic idea is that we construct Yao-graph [8] at theSuperPeers layer by cutting the two-dimensional Euclideanspace around each SuperPeer into six sectors, each withequal geometric angle of h ¼ p
3. Every SuperPeer in the
Yao-graph chooses the closest SuperPeer (neighbor) interms of the shortest geometric distance to other SuperPeerin each of the six sectors. So, every SuperPeer is connectedto six closest SuperPeer neighbors.
The Yao-graph is proven to exhibit the Euclidean mini-mum spanning tree (EMST) in [8]. From the Definition 6 ofEMST and Theorem 7 of Yao-graph as shown in Appen-dix, we can see that Yao-graph is a type of Euclidean geo-metric graph with lightweight maintenance characteristicand efficient spanning tree property.
Previous work [19,20] use Yao-graph in mobile wirelessnetworks and their good communication performanceresults motivate our usage of the Yao-graph geometricstructure. Such graph structure is able to minimize over-head during overlay maintenance management. Yao-graph
can be maintained locally in a distributed manner becauseeach node is connected to other six closest neighbors basedon the shortest geometric distances between nodes. That is,the local maintenance algorithm is confined to the affectednode and its immediate six closest neighbors. In this man-ner, this geometric graph structure allows efficient andlightweight local recovery from node churn. In addition,Yao-graph was the first technique to break the O(N2) timecomplexity barrier in the computation of the EMST in aconnected graph with N nodes [8].
Here we describe our self-stabilizing and distributedYao-graph construction protocol as shown in Fig. 4. Weconsider a connected graph G(V,E), where V correspondsto a set of points (nodes) in the Euclidean space R2, andE to the set of edges with weight corresponding to theEuclidean length of an edge. Suppose that every nodeu 2 V knows its neighborhood N(u) and the current posi-tions of the nodes in N(u) in the Euclidean space. Everynode aims at maintaining a connection to the closest node

Fig. 4. A distributed and self-stabilizing Yao-graph topology construction protocol.
E.K. Lua et al. / Computer Communications 31 (2008) 464–488 469
in every sector S (or cone). Let E(u) be the current set of theconnections of node u.
Theorem 1. When the Yao-graph distributed protocol self-
stabilizes in the stable state, the out-degree of every node is
at most s where the two-dimensional Euclidean space around
every node v 2 V is cut into s sectors with angle h ¼ 2ps .
Proof. Follows directly from the distributed and self-stabi-lizing protocol. In our two-dimensional Euclidean space,the out-degree of a node is 6 since every node connects to6 closest neighbors in the 6 sectors with angle h ¼ p
3. h
We use Yao-graph distributed protocol to build theoverlay network connectivity among the SuperPeers basedon their geometric coordinates and distances with otherSuperPeers. These SuperPeer–SuperPeer Yao-graph routes
serve as the reliable low-latency and high-bandwidth back-bone network connectivity for the overlay network. Thisarchitecture is illustrated in Fig. 5 which gives the flattwo-dimensional geometric view of the overlay network.
In the Peers layer, Peers are directly connected to theclosest SuperPeers that are capable of serving an addi-tional Peer and this connectivity is called the Peer-Super-
Peer 1-Hop route. Among the Peers being served by theirclosest SuperPeer, direct connectivity between these Peerscan be established if there exists a shortcut route betweenthe Peers. That is, a Peer–Peer Shortcut route is estab-lished between two Peers belonging to a SuperPeer, ifthe direct connectivity between these two Peers is shorter
SuperPeers ’ Yao - Graph Connectivity
Peer - SuperPeer 1 - Hop Route
Peer - Peer Shortcut Route
SuperPeers ’ Yao - Graph Connectivity
Peer - SuperPeer 1 - Hop Route
Peer - Peer Shortcut Route
Fig. 5. Architecture of the two-tier LST overlay network in two-dimensional view.
than their Peer-SuperPeer 1-Hop routes. All these routesare easily established in the overlay network using thegeometric location information. Examples of variousoverlay routes in the LST overlay network are illustratedin Fig. 6.
2.4. Geometric overlay routing
We use the localized geometric routing algorithm – ran-dom compass routing [21] – to route data from one Super-Peer to destination SuperPeer in the Yao-graph at theSuperPeers layer. For end-to-end routing, the Peer–PeerShortcut route and Peer–SuperPeer 1-Hop route are uti-lized to complete the routing process. That is, for end-to-end routing between Peers, if there exists a Peer–PeerShortcut route, then packet is delivered using this route.Otherwise, the Peer–SuperPeer 1-Hop route is used toroute the packet from the source Peer to the source Super-Peer at the SuperPeers layer serving the source Peer andlocalized random compass routing protocol is activatedto deliver the packet to the destination SuperPeer that servethe destination Peer which the Peer–SuperPeer 1-Hop routeis used to complete the routing process. The motivation forusing localized random compass routing algorithm atSuperPeer layer is that the results in [22] show that thedelivery rate of random compass routing in Yao-graph is100%.
Here we describe the localized random compass routingprotocol at the SuperPeers layer.
Peer1 to Peer2: If A + B > C, then C is established as Peer - Peer Shortcut Route betweenPeer1 and Peer2
C
AB
Peer1
Peer2
Peer3
D
E
F
Peer4
SuperPeer1SuperPeer2
SuperPeer1 to SuperPeer2: D Yao - Graph Route
Peer1 to Peer4:A - D - F Route
Peer3 to Peer4: E - F Peer - SuperPeer 1 - Hop Route
-
C
D
F-
F - -
Fig. 6. SuperPeers and Peers routes in the two-tier LST overlay network.

470 E.K. Lua et al. / Computer Communications 31 (2008) 464–488
Let node s be the source node, u be the current node andt be the destination node. In localized routing, the nextnode is selected to forward the packets based on the infor-mation in the header of the packet and the position of itslocal neighbors. The localized routing algorithm routes apacket from a source node s to a destination node twhereby each relaying node decides to which node to for-ward the packet only based on the following information:the source node s, the destination node t, the current nodeu and all the k-local nodes of node u. We use the case fork = 1. That is, a node uses only the information of the1-Hop neighbors.
Suppose a packet is currently at node u and the destina-tion node is t. The basic localized compass routing uses thelocal information of node u to route packets. That is, itfinds the next node v of node u. Basically, compass routingfinds the next relay node v such that the \vut is the smallestamong all neighbors of node u in the Yao-graph topology.For localized random compass routing: Let v1 be the nodeon the above of line ut such that \v1ut is the smallestamong all such neighbors of node u. Also, we define nodev2 to be the node below line ut that minimizes the angle\v2ut. Then node u randomly choose either node v1 ornode v2 to forward the packet, as illustrated in Fig. 7.
2.5. Geometric overlay maintenance
Our two-tier LST overlay network uses stable overlaynodes as SuperPeers to handle most of the heavy systemworkloads and reduce the network maintenance overhead.When an overlay node leaves the system or a failure occurs,the information that is related to the leaving overlay nodemust be updated among the other affected overlay nodes.Similarly, if a new overlay node joins the system, informa-tion relating to the new overlay node will also have to beupdated. For high node churn, network maintenance over-head can be heavy. The following cases describe the LSToverlay network maintenance operations during nodechurn which will invoke the local topology repairalgorithm.
2.5.1. New overlay nodes joining
A new overlay node will contact the bootstrap service
operating at the SuperPeers layer for a standard overlayJOIN procedure. Once the new overlay node is elected asa SuperPeer or normal Peer, the following operations areexecuted.
u t
v1
v2
u t
v1
v2
Fig. 7. Localized random compass routing protocol in Yao-graph
topology at SuperPeers layer of LST geometric overlay network.
2.5.1.1. A new normal Peer is joining the LST overlay
network. During the JOIN procedure, the new normal Peermeasures the RTTs to all existing SuperPeers. It uses thisinformation to join the cluster whereby the closest Super-Peer belongs. Then, the new normal Peer’s geometric coor-dinates within the cluster are computed by the Highwaysoverlay control plane service. Using the estimated geomet-ric distances, the Peer–SuperPeer 1-Hop route to the closestSuperPeer is established and all possible Peer–Peer Short-cut routes are setup and updated with the neighboringPeers within the cluster.
2.5.1.2. A new SuperPeer is joining the LST overlay
network. A new overlay node is elected as the new Super-Peer L and measures the RTTs to all existing SuperPeers.It uses this information to join the cluster whereby the clos-est SuperPeers belongs. Then, the new SuperPeer’s geomet-ric coordinates within the cluster are computed by theHighways overlay control plane service.
This new SuperPeer L starts to cut the space surround-ing itself into six sectors with equal angle of h ¼ p
3. Then
this new SuperPeer builds the Yao-graph connectivity byconnecting to other six closest SuperPeers in terms ofthe shortest geometric distance to other SuperPeers inits six sectors. It attempts to connect to the list of six clos-
est neighboring SuperPeers in each of its six sectors. Thatis, the local topology repair algorithm will be invoked toreconstruct the SuperPeers’ Yao-graph to include this newSuperPeer in the SuperPeers layer. The existing Peers thatare associated with the neighboring SuperPeers also reor-ganize and reestablish the Peer–SuperPeer 1-Hop routesto this new SuperPeer, if there exists shortest 1-Hoproutes.
The new SuperPeer L initializes its state by routingJoin messages to the list of closest neighboring SuperPeersfound in each of its six sectors. Once Join messages arerouted to this list of six closest neighboring SuperPeers,the new SuperPeer L will establish Yao-graph overlay con-nectivity in the six sectors. The new SuperPeer L learns ofthe IP addresses of these closest neighboring SuperPeersin the six sectors. The neighboring SuperPeers alsorequire to update their neighbor tables to eliminate thoseSuperPeers that are no longer neighbors as a result of thisnew inclusion of SuperPeer L. In addition, the existingPeers associated with the six closest neighboring Super-Peers reorganize and reestablish the Peer–SuperPeer1-Hop routes to this new SuperPeer if there exists shortestPeer–SuperPeer 1-Hop routes. The connection relation-ships of the affected Peers that change their Peer–Super-Peer 1-Hop routes to this new SuperPeer L will beupdated.
This update is done by broadcasting an Update messagecontaining the new topological information to all affectedSuperPeers and Peers, as illustrated in Fig. 8.
Once the Yao-graph overlay connectivity of this newSuperPeer L has been established, it will have a set of max-imum six neighboring SuperPeers N = {N1,N2, . . . ,N6} in

N1
N1
N2
N 3
LL,N3
N1 in out N1
L in L out
N ,N ,N 1 2 3 N ,N ,N 1 2 3
outN2N2 in
N3 in outN3
L,N3
L,N2 L,N2
L,N3 L,N3
N1
N1N1
N2N2
N 3N 3
LL,N3
N1 in out N1
L in L out
N ,N ,N 1 2 3 N ,N ,N 1 2 3
L in L out
N ,N ,N 1 2 3 N ,N ,N 1 2 3
outN2N2 in
N3 in outN3
L,N3
L,N2 L,N2
L,N3 L,N3
Fig. 8. Updates of neighbor tables in the Yao-graph at SuperPeers layerwhen a new SuperPeer joins.
E.K. Lua et al. / Computer Communications 31 (2008) 464–488 471
the SuperPeers layer. In this example, before SuperPeer L
joins the SuperPeers layer, SuperPeers N1, N2 and N3 areconnected directly to each other with Yao-graph overlayroutes, as shown in dashed lines. After the SuperPeer L
joins, the new SuperPeer L will connect to the neighboringSuperPeers N1, N2 and N3 with their Yao-graph overlayroutes, as shown in dotted lines. The SuperPeers N1, N2
and N3 have to adjust their Yao-graph overlay connectivityby updating their neighbor tables. As a result of thisupdate, the direct Yao-graph overlay route betweenSuperPeers N1 and N2 does not exist and new Yao-graph
overlay routes are established to the new SuperPeer L.The Update message is sent with a limited range of time-to-live (TTL). The expected number of hops in the TTLs,E[HopsN] is log6N (where N is the number of SuperPeersin the SuperPeer layer, and a SuperPeer has six neighbor-ing SuperPeers because of six sectors division in the Yao-
graph). In our case where N = 10,000, this gives about fiveTTLs. This Update procedure ensures that the affectedSuperPeers will quickly learn about the change and per-form necessary update on their own neighbor tablesaccordingly.
N1
N1
N 3
L
N1 in out N1
N3 in outN3
N ,N1 2 N ,N1 2
N ,N2 3 N ,N2 3
N1
N1N1
N 3N 3
L
N1 in out N1
N3 in outN3
N ,N1 2 N ,N1 2
N ,N2 3 N ,N2 3
2.5.2. Existing overlay nodes leaving
To be able to detect overlay nodes leaving the LST over-lay network or overlay node failures, a heartbeat approachis used. Every overlay node sends small alive messages toeach other periodically and maintenance operations areinvoked when heartbeats are lost. The following operationsare executed.
N2
L in L out
N ,N ,N 1 2 3 N ,N ,N 1 2 3
outN2N2 in
N ,N1 3N ,N1 3
N2N2
L in L out
N ,N ,N 1 2 3 N ,N ,N 1 2 3
L in L out
N ,N ,N 1 2 3 N ,N ,N 1 2 3
outN2N2 in
N ,N1 3N ,N1 3
Fig. 9. Updates of neighbor tables in the Yao-graph at SuperPeers layerwhen a SuperPeer leaves.
2.5.2.1. A normal Peer is leaving the LST overlay network.
The missing heartbeat will be detected from this normalPeer. The associated SuperPeer and Peers who have theirPeer–SuperPeer 1-Hop and Peer–Peer Shortcut routes withthis normal Peer will attempt to free their connectionresources. Only the affected SuperPeer and Peers are reor-
ganized locally and this minimizes global overheadmanagement.
2.5.2.2. A SuperPeer is leaving the LST overlay network.
The six neighboring SuperPeers that are connected to thisleaving SuperPeer will notice this failure through the miss-ing heartbeats and trigger the local topology repair algo-rithm. It will reconstruct the six neighboring SuperPeers’Yao-graph relationships and reorganize the Peer–SuperPeer1-Hop and Peer–Peer Shortcut routes of its connectingPeers.
The neighboring SuperPeers of this leaving SuperPeerare notified of this change and update their neighbor tables.This notification occurred because SuperPeers periodicallyexchange alive heartbeat messages. When this leavingSuperPeer leaves the overlay network and heartbeats stop,every neighboring SuperPeers will send a Discovery broad-cast message with a limited five TTLs to other neighboringSuperPeers. Each neighboring SuperPeer receiving the Dis-
covery broadcast message will respond with its geometricposition information and its IP addresses.
The Join and Update procedures as described above, willhelp to adjust its current topology state for the affectedSuperPeers and Peers as illustrated in Fig. 9.
This ensures that the SuperPeers’ Yao-graph connectiv-ity and Peers’ Peer–SuperPeer 1-Hop routes can be quicklyreconstructed locally as a result of this change. Due to thelightweight properties of Yao-graph, node churn causes lit-tle problem to the hierarchical layers of the LST overlaynetwork, as long as a SuperPeer does not become discon-nected by the loss of all its neighboring SuperPeers. Evenfor the drastic case of losing all neighboring SuperPeers,the affected SuperPeer can contact the bootstrap serviceto rejoin the network.
3. Network-aware geometric overlay multicasting
In Bos, we construct source rooted multicast treewhereby each sender (source or root) builds a separate tree

472 E.K. Lua et al. / Computer Communications 31 (2008) 464–488
rooted to itself at the LST’s SuperPeers layer. We adapt thereverse path forwarding (RPF) algorithm [23] to constructoptimal reverse path tree from the source to all receiverswith optimal geometric routing routes. Our adapted ver-sion of RPF algorithm relies on the SuperPeers’ knowledgeof the optimal routing routes from it to the source. So weuse the LST’s localized random compass routing algorithmbased on the shortest geometric distances between theSuperPeers to find this optimal geometric routing pathsat the SuperPeers layer. These resulting geometric routingpaths are in general different from the shortest path treefrom the source to all the other receivers. In our case, sincethe geometric overlay routes between a root and anotherSuperPeer group member is symmetrical, the optimal-pathtree and the optimal reverse path tree from the source areisomorphic.
Each SuperPeer group member has a simple forwardingbehavior as depicted in Fig. 10. The adapted RPF algo-rithm allows a SuperPeer group member to accept a multi-cast data only on the connection interface from which theSuperPeer group member would send a unicast data tothe root. The union of these source-receiver geometric
Fig. 10. Adapted reverse path forwarding algorithm.
Fig. 11. Algorithm for Bos’s multicast
routes forms the optimal reverse path tree for our overlaymulticasting. From the root to all other SuperPeer groupmembers, we build a multicast distribution tree rooted atthe SuperPeer root (source) such that each SuperPeergroup member has the optimal geometric overlay routeback to the SuperPeer root. The result of this grafting pro-cess creates the multicast distribution tree at the SuperPeerslayer. Since the Yao-graph topology is constructed at theLST’s SuperPeers layer which exhibits EMST characteris-tic, the multicast tree being formed also follows similarproperty. The forwarding tree may contain subtrees withno multicast group members and data need not be for-warded down the subtree. That is, if a neighboring Super-Peer does not belong to the multicast group and there is noother group members downstream, it sends a pruning mes-sage upstream. Then the subsequent multicast data wouldnot be forwarded to these group members who respondwith the pruning messages.
The SuperPeers keep track of the multicast tree stateusing their Children Tables. These tables are used in ourlocalized multicast group membership management proto-col (as illustrated in Fig. 11) to reduce the maintenanceoverheads and the impact of reconstructing the multicasttree due to node churn. When node churn occurred, we relyon the local topology maintenance control in the LST over-lay network to repair the overlay. We also invoke a local
ancestor-recovery protocol to localize repair and self-heal-ing of the multicast tree. In this manner, group member-ship operations are decentralized and managed efficiently.We describe our localized multicast group membershipmanagement as follows.
group membership management.

London, UK( SuperPeer )
Cambridge, UK( SuperPeer )
Oxford, UK( SuperPeer )
Ams , NL ( SuperPeer )
The Hague, NL( SuperPeer )
Delft, NL( SuperPeer )
Utrecht, NL( SuperPeer )
Rotterdam, NL( SuperPeer )
Joining Group Member
Rijswijk, NL(Peer)
London, UK( SuperPeer )
Cambridge, UK( SuperPeer )
Oxford, UK( SuperPeer )
Ams , NL ( SuperPeer )
The Hague, NL( SuperPeer )
Delft, NL( SuperPeer )
Utrecht, NL( SuperPeer )
Rotterdam, NL( SuperPeer )
Joining Group Member
Rijswijk, NL(Peer)
Fig. 12. A multicast group member is joining a multicast tree in Bos.
E.K. Lua et al. / Computer Communications 31 (2008) 464–488 473
1. To join the multicast tree (lines 2–7), a new joiningSuperPeer group member sends a Connect message tothe multicast group with the groupID. This new joiningSuperPeer group member will select the closest Super-Peer group member in the multicast tree to join. Theclosest SuperPeer group member will become the newparent and its Children Table is updated with this newSuperPeer group member’s IP address which will be usedfor multicast routing. The new joining SuperPeer groupmember will obtain and maintain a list of ancestors (withtheir IP addresses), from the root to its parent. In thisway, every group member will maintain this list of ances-tors from the root to its parent and this helps to reduceservice interruption probability. The geometric localityproperties of the LST overlay network enable the joininggroup member to select a parent with smaller geometricdistance cost. This ensures that the data reach all groupmembers within relatively few optimal geometric hopsand with reasonably small delay latency.
2. To leave a multicast group (lines 9–21), this leavingSuperPeer group member in the multicast tree sends aDisconnect message to its parent in the multicast tree.All the related multicast group membership informationof this leaving SuperPeer group member will be removedfrom its parent’s Children Table. This leaving SuperPeergroup member may have children in the multicast tree.These affected children will respond to this change bymaking a check on its list of ancestors. They will findtheir closest neighboring ancestors as obtained fromtheir lists of ancestors to rejoin the multicast tree. Theseclosest neighboring ancestors will provide the informa-tion of their children in their Children Table. With thegeometric position information of the ancestors andtheir children, the closest ones will be chosen as thenew parents to serve those affected children. These newlyidentified parents will update their Children Table withthese affected children in the multicast group and theseaffected children will update their lists of ancestorsaccordingly. Using this local ancestor-recovery protocol,the affected children will be able to find their respectivenew parents quickly and save recovery cost in a highlydynamic system with frequent node churn.
3. To detect node churn of the SuperPeer group member(lines 23–26), all parents in the multicast tree periodi-cally send heartbeat’s alive messages to their children.If a child does not respond to the heartbeat for a periodof time (timeout), the parent assumes that the child hasfailed. Then the parent will invoke local repair of thisfailed child in the multicast tree with the Disconnect
operation, and subsequently, the local ancestor-recoveryprotocol is executed.
The list of SuperPeer group members is periodicallyupdated. When the root detects a change occurred, updateis distributed across the SuperPeer group members alongthe tree. When fault detection (node churn) and recoveryoccurred, only a few Connect and Disconnect messages ever
reach all the way to the root. However, we keep track ofthe total number of Connect and Disconnect messages. Ifthis number exceeded a certain threshold, the multicast treerooted at the source is reconstructed using our adaptedRPF algorithm. This is because after some failure recover-ies, the multicast tree may not be optimal and some nodesmight stuck in unfair and unfavorable situations. We setthe threshold ¼ N
log10N for N SuperPeers. Our intuition for
setting this threshold is based on the fact that we want toensure that the total maintenance overhead messages ofConnect and Disconnect do not exceed the order ofO(logN). So, we divide the number of N SuperPeers N with
log10 N. In our case, we have threshold ¼ 10;000log1010;000
¼ 2500.
This would give us an estimate of the amount of mainte-nance overheads incurred in the multicast tree due to nodechurn. This justifies that reconstruction of the multicasttree is needed. That is, whenever this threshold is reached,the multicast tree rooted at the source is reconstructedusing our adapted RPF algorithm. New multicast treecan be constructed concurrently while existing tree are inuse. When the reconstruction is completed, the new multi-cast tree replaces the existing tree for the multicast datadelivery.
Bos builds a multicast tree per application group. Multi-ple multicast trees can be formed at the SuperPeers layer ofthe LST overlay network. The multicast tree constructed atthe SuperPeers layer provides the reliable low-latency andhigh-bandwidth backbone multicast connectivity for thelower layer’s Peers who basically connect to their Super-Peers using their direct Peer–SuperPeer 1-Hop routes duringmulticast streaming. The Peers in the Peers layer who havetheir own direct Peer–SuperPeer 1-Hop connectivities withtheir SuperPeers can join and become the group membersof the multicast tree by sending unicast messages to theirSuperPeers which will serve and provide overlay multicastservice for them. The SuperPeers serving the Peers will beresponsible to become the group members of the multicasttree at the SuperPeers layer. All multicast communications

474 E.K. Lua et al. / Computer Communications 31 (2008) 464–488
are done using standard transport control protocol (TCP)for the transport reliability.
Fig. 12 shows an example of the multicast group mem-bership management operation by multicast group mem-bers (SuperPeers at SuperPeers layer) in The Netherlands(NL) and United Kingdom (UK). For simplicity, we maketwo assumptions: first, the RTTs are proportional to thegeometric distances due to the network embedding on theRTTs between group members. The international linksbetween group members located in Amsterdam and Lon-don have a high bandwidth. Second, the group memberlocated in London acts as the root of the multicast treeand group members at The Hague and Rotterdam lie inthe same Internet service provider (ISP) network and areelected as SuperPeers. We have a normal Peer, Rijswijk,with Peer–SuperPeer 1-Hop connectivity to the SuperPeer,Delft. Delft is joining the multicast group and it sends aConnect message to the multicast group. Bos selects theclosest parent in the multicast tree and forwards the mes-sage to that parent (The Hague). The information of Delft(such as IP address and port number) is stored in its parent,The Hague’s Children Table. And, the Delft’s ancestor listis updated with the root to its parent, i.e. London (root)and Amsterdam (ancestor). The multicast links are shownby the solid arrows. In this way, the new group member,Delft, has joined the Bos multicast tree with London asits root. And, its normal Peer, Rijswijk, who requires mul-ticast service is served by its SuperPeer, Delft, in the multi-cast group.
If Delft detects that its parent, The Hague, has faileddue to missing heartbeats, then Delft initiates the local
ancestor-recovery protocol. Delft finds its closest neighbor-ing ancestor (Amsterdam) as obtained from its list ofancestor to rejoin the multicast tree. Amsterdam will pro-vide the information of its children in its Children Table
to Delft. With the geometric position information ofAmsterdam and its child (Rotterdam), the closest Rotter-dam is chosen as the new closest parent. The new closestparent, Rotterdam, will update its Children Table of thisnew SuperPeer child, Delft, in the multicast group. Thenew multicast links are shown by the dashed arrows. Wehave illustrated in this example the efficiency and scalabilityof the joining multicast group member to find its parentwith rich multicast resources within the same country withclose locality. Similarly, if Delft is leaving the multicastgroup, it sends a Disconnect message to its parent in themulticast tree, and its information will be removed fromits parents’ Children Table.
4. Implementation and experiments
This section describes the experimental setup and imple-mentation required to evaluate the performance of LST’sand Bos. We want to assess their scalability and effective-ness in both massive scale networks and real world Inter-net-scale environment. We use the same massive scalenetworks that were used by Scribe [12,13] and SplitStream
[14] from the Microsoft Research Cambridge. The first partof the experiment aims to evaluate the network-aware geo-metric overlay network (LST) performance in massive scalenetworks. The second part evaluates the performance ofBos overlay multicasting in massive scale networks. Sincewe are using the same massive scale networks, we discussthe impact of our performance results in Bos with theresults published by Scribe and SplitStream. Then, weimplement the multicast using IP unicast scheme, IP multi-cast and multicast in Gnutella-like random graph, to makeperformance evaluation and comparison with Bos overlaymulticasting. Finally, the third part of the experimentdeploys the LST overlay network and Bos overlay multi-cast streaming network in PlanetLab [11]. We use the sameexperimental performance metrics we have used in the mas-sive scale networks to evaluate the performance of LSToverlay network and Bos overlay multicast streaming net-work in the PlanetLab’s real world Internet-scaleenvironment.
4.1. Simulation experiments in massive scale networks
The first and second parts of the simulation experimentsare implemented using the massive scale networks thatwere used by the Scribe [12,13] and SplitStream [14] fromMicrosoft Research Cambridge. The massive scale net-works are generated by Georgia Tech [24] random graphgenerator. The hierarchical transit-stub model contains5050 routers. There are 10 transit domains at the top levelwith an average of five routers in each. Each transit routerhas an average of 10 stub domains attached, and each stubhas an average of 10 routers. There are 100,000 end-systemnodes that were randomly assigned to routers in the corewith uniform probability. Each end-system node is directlyattached by a local area network (LAN) link to its assignedrouter. There are 10 different networks using the sameparameters but different random seeds – we have 10 mas-sive scale networks with network model named as 0–9.
For such a massive scale network, it is more feasible todevelop a simulator for our experiments. The well-knownnetwork simulator such as ns-2, would not be able to han-dle this large size of the networks involved and the dynam-ics of the overlay networks. The simulator models thepropagation delay on the physical links as follows. Thedelay of each LAN link is set to 1 ms and the average delayof core links generated by the graph generator is 40.7 ms.Similar to the work of Scribe, the simulator does not modelqueuing delay, packet losses, or any cross network trafficbecause modeling of such parameters would prevent thesimulation of massive networks.
To examine whether LST overlay network and Bos over-lay multicasting are efficient overlays supporting multipleconcurrent applications with varying requirements, weuse the same environment as Scribe and SplitStream torun experiments using a large number of groups with awide range of group sizes. As in Scribe [13], since thereare no sources of real-world trace data to drive the

2
3
4567
102
2
3
4567
103
2
3
4567
104
Sup
erP
eers
Gro
up S
ize
12 3 4 5 6 7 8 9
102 3 4 5 6 7 8 9
100Group Rank
150
Fig. 13. Group size of SuperPeers versus group rank in massive scalenetworks.
2000 1800 1600 1400 1200 1000 800400
200
0
200
400
600
800
XCoordinate of SuperPeers
YC
oord
inat
e of
Sup
erP
eers
LSTbased Graph Consisting of 117 SuperPeers in Group Rank 35
Fig. 14. Yao-graph structure of 117 SuperPeers in group rank of 35.
E.K. Lua et al. / Computer Communications 31 (2008) 464–488 475
experiments, a Zipf-like distribution for the group sizes isadopted. Groups are ranked by its sizes. The size of agroup with rank r is given by gsize(r) = ºNr�1.25 + 0.5ß,where N is the total number of overlay nodes. In each net-work model, the total number of group ranks is fixed at 150(i.e. the total number of groups is 150 with group rank 1–150) and the number of overlay nodes (N) is fixed at100,000, which are the numbers being simulated. Fig. 13shows the group size of SuperPeers versus group rank inmassive scale networks.
In each group, we choose 10% of the total number ofoverlay nodes to be the SuperPeers based on the electioncriteria described in subsection 2.1. The reason for thechoice is derived from the recent study [25] which statesthat there are approximately 10% of the overlay nodes thathave high capacity, and they exhibit stability and reliableconnectivity in the overlay network. In each networkmodel, the maximum number of SuperPeers is 10,000 ingroup rank 1 which consists of 100,000 nodes. We runour simulation system on these 10 massive scale networksand the total number of groups is 1500. We generatetwo-dimensional geometric coordinates for all the nodesin the system. Since our performance results in all 10 net-works are similar, only the average values over the 10 mas-sive scale networks are shown. To visualize the SuperPeers’Yao-graph structure being constructed in the overlay net-work, Fig. 14 shows an example of the two-dimensionalgeometric Yao-graph for group rank 35 containing a totalof 117 SuperPeers.
For each group, we also implement the IP multicast,multicast using IP unicast scheme, and multicast in Gnutel-la-like random graph. This allows us to make performancecomparison of Bos and these overlay multicast networks.Similar to Scribe [13], we use the policy routing linkweights generated by Georgia Tech random graph genera-tor to perform IP unicast routing. That is, all links of thesame type such as intra-domain or inter-domain links,are assigned the same link weight. IP multicast routing uses
a shortest path tree formed by merging the unicast routesfrom the source to each receiver, similar to what could beobtained using protocols like Distance Vector MulticastRouting Protocol (DVMRP) [26] or Protocol IndependentMulticast (PIM) [27]. We ignore messages needed by theseprotocols to maintain the tress, so as to give a conservativecomparison. To implement multicast in Gnutella-like ran-dom graph, each node in that overlay multicast networkmaintains a neighbor table with network addresses of itsneighbors. Our design for multicast in Gnutella-like ran-dom graph bounds the number of neighbors to be at least4 and not more than 12 of neighbors. We use a genericflooding mechanism to discover and respond to multicastqueries in the random graph.
4.2. PlanetLab experiments
Our objective of this PlanetLab experimental setup is toevaluate the performance of LST overlay network and Bos
overlay multicast streaming network with differing groupsof elected SuperPeers in real world Internet-scale environ-ment. We implement and deploy Bos in the PlanetLab[11], and run overlay multicasting experiments to evaluatethe effectiveness and performance of the Bos overlay multi-casting. In this experiment, we select one node in each siteas a representation of the site because there may be manynodes (at least more than 5) that are very close by residingin each of these sites in the PlanetLab testbed. By usingPlanetLab sites instead of nodes, this would enable a closerreplica of Internet-scale environment – we have a total of230 sites. We choose differing groups of PlanetLab sites(in groups of 20, 40, 60 and 81 sites) that possess the crite-ria of SuperPeers to become the elected SuperPeers – thedistribution of the elected SuperPeers ranges from 9% to35% of the PlanetLab sites. The rest of the PlanetLab sitesare Peers in the Peers layer. We use planet-
lab2.ewi.tudelft.nl as the root (source) of the Bos
multicast tree, generating a 560 Kbits/s (70 Kbytes/s)

-140
-120
-100
-80
-60
-40
-20
0
20
-300 -250 -200 -150 -100 -50 0
y co
-ord
inat
e of
Sup
erP
eer
x co-ordinate of SuperPeer
Yao-Graph based SuperPeer topology
"PlanetLab Site"
Fig. 15. Yao-graph structure of 81 PlanetLab sites (SuperPeers).
1200
1000
800
600
400
200
0
Net
wor
k C
ost
500040003000200010000
Overlay Cost
1200
1000
800
600
400
200
Net
wor
k C
ost
476 E.K. Lua et al. / Computer Communications 31 (2008) 464–488
multicast stream in the multicast tree. The Round-Trip-Time (RTT) performance metrics are measured usingInternet control management protocol (ICMP) ‘ping’ with15-ping measurements between every two sites. We are inter-ested in the network distances between nodes and ignore asmuch as possible any network-related conditions. Therefore,we take the minimum of the site-to-site RTT metric to avoidbiases in the experimental results due to high variations inRTT measurements. We map the PlanetLab sites into two-dimensional Euclidean space for our Internet subspacegeometry. Fig. 15 visualize the two-dimensional geometricYao-graph structure for a group of 81 PlanetLab sites.
0500040003000200010000
Overlay Cost
1200
1000
5. Performance evaluation and results
5.1. Geometric overlay (LST) performance in massive scale
networks
The first simulation experiment evaluates the LST over-lay network performance in massive scale networks.
800
600
400
200
0
Net
wor
k C
ost
500040003000200010000
Overlay Cost
Fig. 16. LST overlay network cost versus underlay network cost for grouprank 72, 96 and 148 of the network model 0.
5.1.1. Overlay cost vs underlay cost
For each of the source-destination SuperPeers pair, wecompare the LST overlay network cost and underlay net-work cost on a path-by-path basis. That is, we measureand compare the network cost between two nodes fordirect IP communication utilizing the underlying networkand the cost of using the overlay network. Fig. 16 showsthe scatterplot performance of geometric SuperPeers-to-Peers overlay hierarchy for group rank 72, 96 and 148,respectively. The X-axis is the LST overlay network costand the Y-axis is the underlay network cost. The solid lin-ear line gives the indication of network cost being equal tothe overlay cost and its purpose is to show this boundary.The results show that for some cases, using the LST over-lay network for communications outperforms the direct IP-based communications in the underlying network. It alsoshows that the LST overlay network communications’latencies are reasonable in delivering messages relative to
their direct underlay communications. These results areexpected because all overlay communications usually suffera slightly higher communication cost than the direct

3
4
5
6
789
1
2
3
4
5
6
789
10
Nod
e D
egre
e
12 3 4 5 6 7 8 9
102 3 4 5 6 7 8 9
100
Group Rank
σ[In Degree]σ[Out Degree]
150
Fig. 18. Distribution of standard deviation of in-degree and out-degree inthe LST SuperPeers overlay.
E.K. Lua et al. / Computer Communications 31 (2008) 464–488 477
Internet communications. This is due to the overlaynetwork routing that is usually not as optimal as directcommunications in the underlying network – these resultsare consistent with performance seen in Resilient OverlayNetwork (RON) [28].
5.1.2. In-degree/out-degree of a SuperPeer
The in-degree/out-degree of a SuperPeer denotes thenumber of In/Out neighbors that are maintained by thatSuperPeer. For a SuperPeer to limit its outbound networkbandwidth, it must limit its out-degree in the overlay net-work, otherwise, its forwarding capacity can be exceeded.The out-degree of a node in our Yao-graph is bounded atmost s and its in-degree may be as high as N � 1 where sis the number of sectors and N is the total number ofnodes. In our LST overlay network, the out-degree of theSuperPeer is bounded at most 6, which is reasonably small.A SuperPeer with a high in-degree may easily becomeexhausted. It is interesting to find out the in-degree of theYao-graph in our LST overlay network using the massivescale networks.
For each network model and group, we compute the in-degree/out-degree of each SuperPeer. The distributions ofmean and maximum node degree for different group ranksare shown in Fig. 17. As expected, the maximum out-degree of a SuperPeer in our Yao-graph is 6. The experi-mental results show that the average in-degree is the same
as that of average out-degree, i.e. the average in-degree isequal to the average out-degree in our experiments. It isevident that the average in-degree of each group is rela-tively small, with a maximum of 6. A small average in-degree in our LST overlay network suggests a low link
stress (as defined in [29]) in the massive scale networks.The maximal in-degree of group rank 1 is 150, which is stillrealistic. The maximum out-degree is 6 due to the boundingcharacteristics of our Yao-graph structure in two-dimen-sional geometric space which has six sectors connectingsix closest neighbors.
5
6
789
10
2
3
4
5
6
789
100
Nod
e D
egre
e
12 3 4 5 6 7 8 9
102 3 4 5 6 7 8 9
100
Group Rank
E[Node Degree] max[In Degree]
150
Fig. 17. Distribution of mean node degree and maximum in-degree in theLST SuperPeers overlay.
Fig. 18 illustrates the standard deviation of in-degreeand out-degree for different group ranks. It is evident thatthe standard deviation of the SuperPeer’s out-degreedecreases as group rank decreases for 150–1. This indicatesthat the standard deviation of out-degree decreases as thegroup size increases. The standard deviation of out-degreeis small: the minimum standard deviation of out-degree is0.34 in group rank 2 and maximum standard deviation is1.22 in group rank 130, giving an average of 0.98 over allgroups. Again, this result is expected. For each group, allSuperPeers in our Yao-graph have their out-degreebounded at most 6.
However, the standard deviation of SuperPeer’s in-degree increases with the group size. The minimum stan-dard deviation of in-degree is 1.37 in group rank 138 andmaximum standard deviation of in-degree is 5.3 in grouprank 1, giving an average of 2.03 over all groups. Thisshows that the in-degree of the SuperPeer can be high. Thisis due to the possibility that this special neighbor is the onlynearest neighbor to many other SuperPeers. To overcomethe possibility of exhausting a SuperPeer’s in-degree, undi-rected sparsified Yao-graph can be considered. Basically, asparsified Yao-graph is a Yao-graph whereby only the short-est incoming edge is selected for incoming link if the in-degree of a sector exceeds one (see the Appendix).
5.2. Geometric overlay multicasting (Bos) performance in
massive scale networks
In the previous section, we have shown the efficiency ofthe LST overlay network in massive scale networks. Thissecond part of the experiment evaluates the performanceof Bos overlay multicast streaming in massive scale net-works. In each group, the elected SuperPeers send multi-cast messages to all other SuperPeers. We compare theresults of Bos overlay multicasting with the results pub-lished in Scribe and SplitStream and discuss the implica-tions. Then, we repeat the experiments with IP multicast,

478 E.K. Lua et al. / Computer Communications 31 (2008) 464–488
multicast using IP unicast scheme, and multicast in Gnutel-la-like random graph. We then compare their multicastperformance results with the overlay multicast perfor-mance of Bos.
5.2.1. Link stress
Link stress quantifies the load on the network which isequivalent to the number of packets sent over the link.Link stress [30] is measured as the number of duplicatepackets carried by each network physical link during theoverlay multicasting. A node with high link stress can beeasily exhausted. Fig. 19 shows the histogram distributionof the mean link stress for the Bos overlay multicast net-work, when a message is multicast in each group of thetotal 1500 groups (10 networks, 150 groups in each net-work), i.e. it shows histogram distribution of the mean linkstress for all the links in all groups.
Our results show that most links have low stress: themean link stress is 4.4, with standard deviation 5.6. Thismeans that the mean link stress induced by Bos is approx-imately 4.4 times higher than IP multicast on the sameexperiment. Our result is acceptable but moderately higherthan the result in Scribe, which generates 3.4 times highermean link stress than IP multicast. The mean link stressin SplitStream is 1.28 times higher than IP multicast –SplitStream has a lower link stress and this is because ofmultiple multicast trees created by SplitStream which dis-tribute the multicast load. As shown in the tail of the plotsin Fig. 19, only 1 link has a mean link stress of 100 and 52links have mean link stress of 20. In total, 2% (523 links outof a total of 25,391 links) of the links have mean link stressmore than or equal to 20. This is relatively small in number.
We examine the maximum link stress and notice thatBos has maximum link stress of 100 which is much smallerthan the maximum link stress of 4031 published in Scribe.However, the Scribe results are generated for 100,000nodes in the overlay network whereas our results arederived from 10,000 SuperPeers at the SuperPeers layerand the rest of 90,000 Peers are connected directly to the
100
101
102
103
104
Num
ber
of L
inks
12 3 4 5 6 7 8 9
102 3 4 5 6 7 8 9
100Link Stress
BosE[Link stress]= 4.4
σ[Link Stress]= 5.6
Fig. 19. Histogram distribution of mean link stress in Bos SuperPeersoverlay multicasting.
SuperPeers. In general, our comparisons show that Bos
has a lower maximum link stress due to its network-awareSuperPeers–Peers geometric overlay hierarchy and it hasacceptable mean link stress.
5.2.2. Node stress
Node stress quantifies the load on nodes which is equiv-alent to the number of messages that it receives. End nodesin the overlay multicast network are responsible for main-taining routing information and for forwarding and dupli-cating packets whereas routers perform these tasks in IPmulticast. We measure the node stress by counting thenumber of nodes in each node’s routing table and the num-ber of messages received by each node when members jointhe groups. Fig. 20 shows the distribution of mean andstandard deviation of node stress for each group in Bos.For all 1500 groups, the mean node stress are between4.81 in group rank 134 to 7.75 in group rank 1, giving anaverage of 7.08 over all groups. This average result (7.08)is close to the average node stress published in Scribe whichhas an average node stress of 6.2. It is also lower than theconfiguration in SplitStream whereby the desired in-degreeand node stress is typically set to 16. This suggests that Bos
overlay multicast streaming is efficient in spreading dataover all nodes. Our experimental results also show thatthe standard deviation of node stress are between 1.41 ingroup rank 109 to 2.76 in group rank 97, giving an averageof 2.25 over all groups. Among all the 1500 groups, themaximum node stress is 110. These results suggest that inBos, end nodes just need to forward multicast messagesonly to a small number of other nodes and this is helpfulto achieve scalability.
Scribe and SplitStream make use of some mechanisms tolimit a node’s out-degree, thus they may add extra com-plexity. Scribe uses a built-in mechanism (‘push-down’).When a node has reached its maximal out-degree and itreceives a request for connectivity from a new prospectivechild, it provides that new prospective child with a list of
8
7
6
5
4
3
2
1
Nod
e S
tres
s
12 3 4 5 6 7 8 9
102 3 4 5 6 7 8 9
100Group Rank
150
E[Node Stress]σ[Node Stress]
Fig. 20. Distribution of mean and standard deviation of node stress in Bos
SuperPeers overlay multicasting.

E.K. Lua et al. / Computer Communications 31 (2008) 464–488 479
its current children that are able to accept the request. Thisprospective child then seeks to be adopted by the childfrom the list with the lowest delay. This procedure contin-ues recursively down the tree until a node is found that cantake that prospective child. This is guaranteed to terminatesuccessfully with a single Scribe tree provided each node isrequired to take on at least one child. However, this proce-dure is not guaranteed to work in SplitStream [14] whichbuilds forest of multiple multicast trees. The reason is thata leaf node in one tree may be an interior node in anothertree, and it may have already reached its out-degree limitwith children in this other tree. SplitStream adds severalprocedures to limit its out-degree by introducing ‘‘Locatingparents’’ and ‘‘Spare capacity group’’ schemes. In the‘‘Location parents’’ scheme, the node first adopts the pro-spective child regardless of the out-degree limit. Then, itevaluates its new set of children to select a child to rejectas an orphan. This selection is made in an attempt to max-imize the efficiency of the SplitStream forest. If the orphanhas not found a parent, it sends an anycast message to aspecial Scribe group (‘‘Spare capacity group’’). The nodestress of each SplitStream node is published to be equalto its desired in-degree, and this enable nodes in Split-Stream with sufficient bandwidth to participate in the sys-tem. Depending on the configuration of the SplitStream,the desired in-degree is typically set to 16 which meansall nodes will have their in-degree and node stress of 16.
To evaluate the Bos’ underlay connectivity, we examinethe underlay physical node degree which measures thenode’s average number of underlay connectivity. The dis-tribution of mean and standard deviation of underlayphysical node degree for each group in Bos is shown inFig. 21. It reveals that the mean underlay node degree isrelatively small: between 2.8 in group rank 53–5.4 in grouprank 144, giving an average of 3.17 over all groups. Asshown, the standard deviation of the underlay node degreeis between 2.05 in group rank 110–4.2 in group rank 2, giv-
10
8
6
4
2
0
Nod
e D
egre
e
12 3 4 5 6 7 8 9
102 3 4 5 6 7 8 9
100Group Rank
E[Node Degree]σ[Node Degree]
150
Fig. 21. Distribution of mean and standard deviation of underlay nodedegree in Bos SuperPeers overlay multicasting.
ing an average of 2.74 over all groups. Over all the 1500groups, the maximum underlay node degree is 40, mini-mum underlay node degree is 1, giving an average of3.17. These results suggest that in the Bos overlay multicastservice, end underlay nodes just need to forward multicastmessages only to a small number of other nodes.
5.2.3. Relative Delay Penalty (RDP) and Relative Average
Delay Penalty (RAD)Overlay multicast adds some delays to messages and
delay penalty helps to quantify the goodness of an overlaymulticast. To evaluate this delay penalty in Bos, we mea-sure the delays to deliver a message to each member of agroup using both overlay and IP multicast. We evaluatethe delay penalty with two metrics: Relative Delay Penalty(RDP) and Relative Average Delay Penalty (RAD). Theaverage RDP computes the average of the ratio of overlaymulticast network delays between any a pair of SuperPeergroup members in Bos and their corresponding underlaynetwork shortest path delays; while Relative AverageDelay Penalty (RAD) computes a ratio between the aver-age overlay delays in a group using Bos and average delaysusing IP multicast. The RAD measurements may show therelative paths of each packet when sent over a multicasttree.
Fig. 22 shows average RDP distribution versus groupranks. Our results show that the maximum average RDPis 3.8 in rank 1 and minimum average RDP is 1.64 in grouprank 135, giving an overall mean of the average RDP is2.08 over all groups. In addition, 50% of the groups havean average RDP of at most 2.18. For all group membersin all the groups, we note that there are more than57.05% of the group members have RDP less than 2.25,and more than 62.7% of the group members have RDP lessthan 4. These results are relatively close but slightly higherthan the results published in Scribe: average RDP is 1.81 ingroup rank 1 consisting of 100,000 nodes and for all
4.0
3.5
3.0
2.5
2.0
1.5
1.0
RD
P
12 3 4 5 6 7 8 9
102 3 4 5 6 7 8 9
100 Group Rank
150
Fig. 22. Average Relative Delay Penalty (average RDP): average of theratio of delays between any two SuperPeers in Bos SuperPeers overlay andunderlay network.
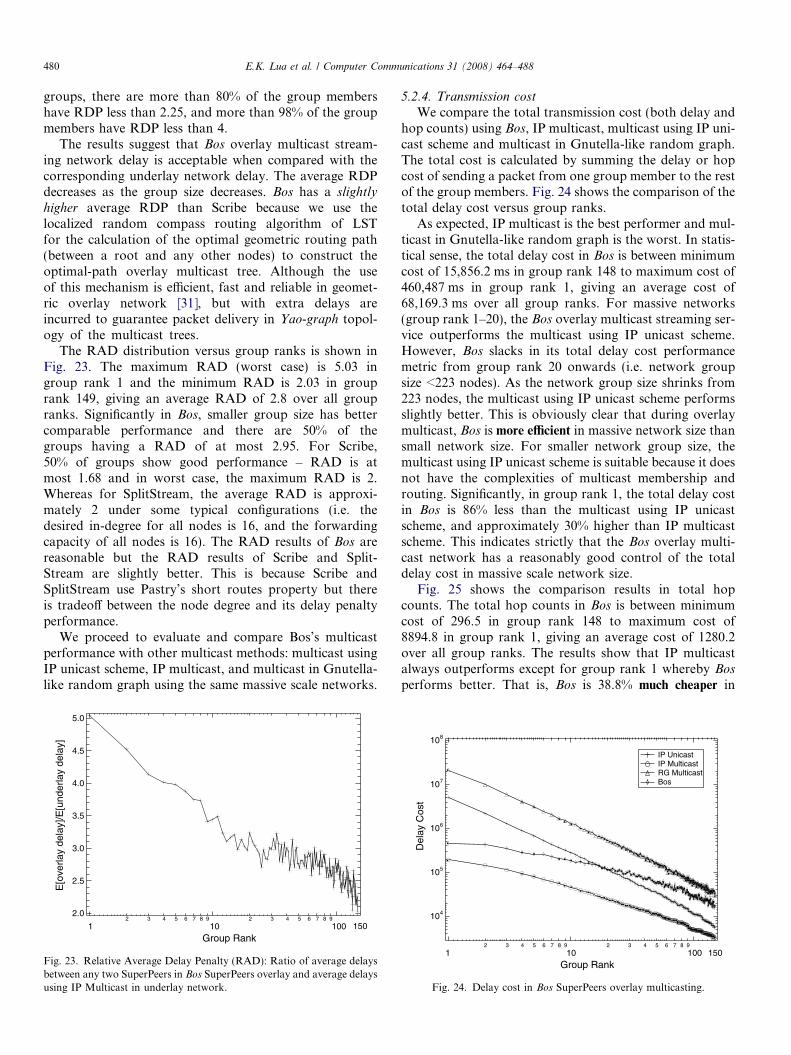
480 E.K. Lua et al. / Computer Communications 31 (2008) 464–488
groups, there are more than 80% of the group membershave RDP less than 2.25, and more than 98% of the groupmembers have RDP less than 4.
The results suggest that Bos overlay multicast stream-ing network delay is acceptable when compared with thecorresponding underlay network delay. The average RDPdecreases as the group size decreases. Bos has a slightly
higher average RDP than Scribe because we use thelocalized random compass routing algorithm of LSTfor the calculation of the optimal geometric routing path(between a root and any other nodes) to construct theoptimal-path overlay multicast tree. Although the useof this mechanism is efficient, fast and reliable in geomet-ric overlay network [31], but with extra delays areincurred to guarantee packet delivery in Yao-graph topol-ogy of the multicast trees.
The RAD distribution versus group ranks is shown inFig. 23. The maximum RAD (worst case) is 5.03 ingroup rank 1 and the minimum RAD is 2.03 in grouprank 149, giving an average RAD of 2.8 over all groupranks. Significantly in Bos, smaller group size has bettercomparable performance and there are 50% of thegroups having a RAD of at most 2.95. For Scribe,50% of groups show good performance – RAD is atmost 1.68 and in worst case, the maximum RAD is 2.Whereas for SplitStream, the average RAD is approxi-mately 2 under some typical configurations (i.e. thedesired in-degree for all nodes is 16, and the forwardingcapacity of all nodes is 16). The RAD results of Bos arereasonable but the RAD results of Scribe and Split-Stream are slightly better. This is because Scribe andSplitStream use Pastry’s short routes property but thereis tradeoff between the node degree and its delay penaltyperformance.
We proceed to evaluate and compare Bos’s multicastperformance with other multicast methods: multicast usingIP unicast scheme, IP multicast, and multicast in Gnutella-like random graph using the same massive scale networks.
5.0
4.5
4.0
3.5
3.0
2.5
2.0
E[o
verla
y de
lay]
/E[u
nder
lay
dela
y]
12 3 4 5 6 7 8 9
102 3 4 5 6 7 8 9
100Group Rank
150
Fig. 23. Relative Average Delay Penalty (RAD): Ratio of average delaysbetween any two SuperPeers in Bos SuperPeers overlay and average delaysusing IP Multicast in underlay network.
5.2.4. Transmission cost
We compare the total transmission cost (both delay andhop counts) using Bos, IP multicast, multicast using IP uni-cast scheme and multicast in Gnutella-like random graph.The total cost is calculated by summing the delay or hopcost of sending a packet from one group member to the restof the group members. Fig. 24 shows the comparison of thetotal delay cost versus group ranks.
As expected, IP multicast is the best performer and mul-ticast in Gnutella-like random graph is the worst. In statis-tical sense, the total delay cost in Bos is between minimumcost of 15,856.2 ms in group rank 148 to maximum cost of460,487 ms in group rank 1, giving an average cost of68,169.3 ms over all group ranks. For massive networks(group rank 1–20), the Bos overlay multicast streaming ser-vice outperforms the multicast using IP unicast scheme.However, Bos slacks in its total delay cost performancemetric from group rank 20 onwards (i.e. network groupsize <223 nodes). As the network group size shrinks from223 nodes, the multicast using IP unicast scheme performsslightly better. This is obviously clear that during overlaymulticast, Bos is more efficient in massive network size thansmall network size. For smaller network group size, themulticast using IP unicast scheme is suitable because it doesnot have the complexities of multicast membership androuting. Significantly, in group rank 1, the total delay costin Bos is 86% less than the multicast using IP unicastscheme, and approximately 30% higher than IP multicastscheme. This indicates strictly that the Bos overlay multi-cast network has a reasonably good control of the totaldelay cost in massive scale network size.
Fig. 25 shows the comparison results in total hopcounts. The total hop counts in Bos is between minimumcost of 296.5 in group rank 148 to maximum cost of8894.8 in group rank 1, giving an average cost of 1280.2over all group ranks. The results show that IP multicastalways outperforms except for group rank 1 whereby Bos
performs better. That is, Bos is 38.8% much cheaper in
104
105
106
107
108
Del
ay C
ost
12 3 4 5 6 7 8 9
102 3 4 5 6 7 8 9
100Group Rank
IP Unicast IP Multicast RG Multicast Bos
150
Fig. 24. Delay cost in Bos SuperPeers overlay multicasting.

10 1
10 2
10 3
10 4
10 5
Num
ber
of D
uplic
ate
Mes
sage
s
12 3 4 5 6 7 8 9
102 3 4 5 6 7 8 9
100 Group Rank
RG Multicast Bos
150
Fig. 26. Total duplicate messages overhead in Bos SuperPeers overlaymulticasting.
102
103
104
105
106
Hop
Cou
nts
12 3 4 5 6 7 8 9
102 3 4 5 6 7 8 9
100Group Rank
IP Unicast IP Multicast RG Multicast Bos
150
Fig. 25. Hop counts in Bos SuperPeers overlay multicasting.
E.K. Lua et al. / Computer Communications 31 (2008) 464–488 481
terms of total hop counts than IP multicast for group rank1 which consists of 100,000 nodes in the network. This con-firms that Bos is more cost-effective than IP multicast interms of hop counts during overlay multicasting in massivescale network. This is due to the fact that we have a two-tier architecture in Bos overlay multicast streaming net-work. This gives the flexibility of selecting efficient overlaypaths through the low-latency and high-bandwidth back-bone network connectivity of the SuperPeers at SuperPeerslayer. In addition, this allows a smaller number of hopcounts in the overlay multicast network as compared tothe underlay network.
We observe that multicast in Gnutella-like randomgraph is the worst performer in terms of hop counts. Thisis because random graph uses flooding to distribute data,therefore it generates lots of duplicate messages. For largenetwork size (i.e. group rank 1–17), the Bos overlay multi-cast streaming network outperforms the multicast using IPunicast scheme, whereby the cost reduction in terms of hopcounts reaches about 90% in group rank 1. Similar to theresults of the total delay cost metric observed in Fig. 24,the multicast using IP unicast scheme performs slightly bet-ter than Bos in small network group size. As shown inFig. 25, Bos slightly slacks in its hop counts’ performancemetric from group rank 17 onwards (i.e. network groupsize < 271 nodes). As the network group size shrinks from271 nodes, the multicast using IP unicast scheme performsslightly better. This is due to the lack of multicast member-ship and routing complexities in the multicast using IP uni-cast scheme for small network group size. In this aspect ofcomparison with multicast using IP unicast scheme, boththe results observed in total delay costs and hop countsare similar. We conclude that Bos is more efficient to per-form overlay multicasting in massive network size.
5.2.5. Duplicate messages
This second experiment measures the number of dupli-cate packets on a single group. Duplicate messages wastenetwork resources and increase the additional load on a
network link. Note that the duplicate message for anynative IP multicast tree is zero. So in this experiment, mea-surements are made for the total number of duplicate mes-sages received by end systems (IP layer) in Bos andmulticast in Gnutella-like random graph, as we have illus-trated in Fig. 26.
As expected, the number of duplicate increases withincreasing network group size. For multicast in Gnutella-like random graph, the average maximum number of dupli-cate messages is 35,376 in group rank 1, and the minimumnumber of duplicate messages is 60.5 in group rank 147,giving an average value of 846.2 over all groups. In con-trast, Bos gives much better results: the maximum numberof duplicate messages is 404.3 in group rank 1 and mini-mum number of duplicate messages is 10.5 in group rank132, giving an average maximum number of duplicate mes-sages of 49.4 over all groups. Bos overlay multicast stream-ing outperforms multicast in Gnutella-like random graph interms of the number of duplicate messages generated. Thehuge reduction in number of duplicate messages in com-parison is as much as it reaches 98% in group rank 1. Thisis because random graph scheme uses flooding algorithmwhich produces many duplicate messages duringmulticasting.
We also find that Bos has a small average percentage ofduplicate messages (less than 5%) received by end nodesover all the groups. Our result is better than Scribe whichhas published result of 16% if the overlay configurationparameter is 4. This results indicate that Bos gives a muchbetter overlay multicast performance as compared to mul-ticast in Gnutella-like random graph. This is because of thenetwork awareness of Bos during overlay multicast stream-ing that helps to scale and boost the multicast efficiencyand performance.
5.3. Geometric overlay (LST) performance in PlanetLab
We use the same performance metrics that we have usedin the massive networks’ experiments to quantify the per-

482 E.K. Lua et al. / Computer Communications 31 (2008) 464–488
formance of the LST overlay network and Bos overlaymulticast streaming network in real-world Internet-scaleenvironment (PlanetLab).
5.3.1. Overlay cost vs underlay cost
Similarly, we compare the LST overlay network andunderlay network cost on a path-by-path basis for eachof the source-destination PlanetLab sites (SuperPeers).Fig. 27 shows the scatterplot performance of the geometricSuperPeers-to-Peers overlay hierarchy for groups of 20, 40,60 and 81 SuperPeers, respectively. The X-axis is the LSToverlay network cost and the Y-axis is the underlay net-work cost. The solid linear line gives the indication of net-work cost being equal to the overlay cost and its purpose isto show this boundary. We confirm the observation of theLST overlay network performance in the massive scale net-works. For some cases in the PlanetLab experimentalresults, using the LST overlay network for communicationoutperforms the direct Internet communications in theunderlying network. The network awareness of the under-lying network latencies between nodes helps the construc-tion of the LST overlay network and contributes to thereasonably good overlay performance. Of course, in gen-eral, the LST overlay network suffer slightly higher com-munication cost than the direct Internet communications
400
300
200
100
0
cost
net
wor
k
6005004003002001000
cost overlay
400
300
200
100
0
cost
net
wor
k
8006004002000
cost overlay
Fig. 27. LST overlay network cost versus
because it is not possible to achieve the same optimal rout-ing performance as the underlying network.
5.3.2. In/Out-degree of a SuperPeerThe node degree in the overlay network represents the
number of overlay network connections to other nodes thatmust be maintained by that node. A small average nodedegree results in better load balancing in the overlay net-work and thus a low underlying network load. That is,when we have small average node degree in the overlay net-work, it means that there is no network connection in theunderlying network that will be significantly congested.Fig. 28 shows the average in-degree/out-degree of Planet-Lab sites (SuperPeers) for groups of 20, 40, 60 and 81SuperPeers. The X-axis is the node degree d, and the Y-axisis the probability density function (pdf) of the node degreein our PlanetLab experiments consisting of different groupsof SuperPeers. As expected, the Yao-graph in our LSToverlay network bounds the out-degree of the SuperPeerto at most 6 which is reasonably small. The average in-degree for every group of SuperPeers is equal to the aver-age out-degree which ranges from 3.7 to 5.2 – this is similarto our experimental results in massive scale networks.Overall, the in-degree results show a wider variance andhas lower pdf spread across the groups of SuperPeers. Sim-
400
300
200
100
0
cost
net
wor
k
5004003002001000
cost overlay
400
300
200
100
0
cost
net
wor
k
120010008006004002000
cost overlay
underlay network cost in PlanetLab.

0.5
0.4
0.3
0.2
0.1
0.0
Pr[
d]
1412108642
Node Degree (d)
E[in degreeN20]=3.7 E[out degreeN20]=3.7 E[in degreeN40]=4.4 E[out degreeN40]=4.4 E[in degreeN60]=4.8 E[out degreeN60]=4.8 E[in degreeN81]=5.2 E[out degreeN81]=5.2
Fig. 28. Distribution of average in-degree/out-degree in the LST SuperP-eers overlay.
E.K. Lua et al. / Computer Communications 31 (2008) 464–488 483
ilar to the experimental results in massive scale networks, asmall average in-degree in our LST overlay network sug-gests a low link stress in the PlanetLab.
5.4. Geometric overlay multicasting (Bos) performance in
PlanetLab
We use the performance metrics of link stress, node(site) stress and Relative Delay Penalty (RDP) to quantifythe network-aware geometric overlay multicasting (Bos)performance in the real-world Internet-scale environment(PlanetLab).
5.4.1. Link stress
We measure the link stress as the number of duplicatepackets carried by each network physical link incurredduring overlay multicasting in Bos. Fig. 29 shows the his-togram distribution of the mean link stress for the Bos
overlay multicast network in differing groups of Planet-
130
120
110
100
90
80
70
60
50
40
30
20
10
0
Num
ber
of L
inks
10987654321
Link Stress
Bos(PlanetLab)E[link stress]= 2.29 σ[link stress]= 3.14
Fig. 29. Average link stress for different SuperPeers group sizes inPlanetLab.
Lab sites as the elected SuperPeers in Bos. That is, itshows the histogram distribution of the mean link stressfor all the links in all groups. The results show that mostlinks have low stress in the Bos overlay multicast stream-ing network. The average link stress is 2.29, with stan-dard deviation 3.14. This means that the average linkstress induced by Bos is approximately 2.29 times higherthan that for an IP multicast on the same experiment.There are 63.5% (125 links out of 197 links in total) ofthe links having their mean link stress of 1. The signifi-cance lies in the tail of the plots in Fig. 29. In total,there are 20 links having their mean link stress of 5and above. That is, there are only 10% of the total num-ber of links have their mean link stress more than orequal to 5. This is relatively small in number. In general,this results confirm that Bos overlay multicast streamingnetwork has low average link stress and thus it has high
efficiency.
5.4.2. Node (site) stress
We measure the node stress by counting the number ofsites in each site’s routing table and the number of mes-sages received by each site. Fig. 30 shows the distributionof mean and standard deviation of node (site) stress foreach group of PlanetLab sites as the elected as the SuperP-eers in Bos. Table 1 shows the mean, standard deviationand maximum node stress for each group of PlanetLabsites.
All the results indicate that the mean node stress is small(<2). This suggests that Bos is able to spread data over allsites efficiently. In Bos, end sites just need to forward mul-ticast messages only to a small number of other sites. Thisresults confirm that Bos can achieve reasonably good scala-
bility by reducing the load imposed on the sites in the Bos
overlay multicast streaming network. We note that Bos
performs well in terms of node (site) stress when smallnumber of overlay sites (20 sites out of 230 sites) are electedas the SuperPeers.
4.0
3.5
3.0
2.5
2.0
1.5
1.0
0.5
0.0
Nod
e S
tres
s
3210
Bos (PlanetLab) E[Node Stress]
σ[Node Stress]
81Sites 60Sites 40Sites 20SitesGroups
Fig. 30. Average node stress for different SuperPeers group sizes inPlanetLab.

Table 1Distribution of node stress in PlanetLab
Groups Mean SD Max
81 SuperPeer Sites 1.98 2.01 1160 SuperPeer Sites 1.97 1.81 1140 SuperPeer Sites 1.95 1.88 1020 SuperPeer Sites 1.9 1.12 5
484 E.K. Lua et al. / Computer Communications 31 (2008) 464–488
5.4.3. Relative Delay Penalty (RDP)
We evaluate the delay penalty using the Relative DelayPenalty (RDP) performance metric which computes theratio of overlay multicast network delays between any pairsof SuperPeer group members in Bos and their correspond-ing underlay network delays. Fig. 31 and Table 2 show theaverage RDP distribution versus differing groups of Planet-Lab sites elected as SuperPeers in Bos. The average RDPsfor different groups are very small (61.18) and the overallmean of the average RDPs is 1.15. In addition, for allgroup members in all groups, more than 84% of the groupmembers have RDP less than 2, and more than 98.5% ofthe group members have RDP less than 4. All these resultsfurther confirm that Bos is able to deliver data efficiently tothe group members with reasonable overlay network delaywhen compared with its underlay network delay. Hence,we conclude that the overlay multicast streaming perfor-mance of Bos is acceptable when compared with directIP-based communication in the underlying network. We
81Sites 60Sites 40Sites 20Sites1
1.05
1.1
1.15
1.2
1.25
1.3
1.35
1.4
1.45
1.5
Groups
Ave
rage
RD
P
Bos (PlanetLab)
Fig. 31. Average Relative Delay Penalty (RDP) for different SuperPeersgroup sizes in PlanetLab.
Table 2Distribution of Average Relative Delay Penalty (RDP) in PlanetLab
Groups Mean SD Max
81 SuperPeer Sites 1.18 1.29 56.9960 SuperPeer Sites 1.16 0.31 15.7440 SuperPeer Sites 1.17 0.34 8.9520 SuperPeer Sites 1.11 0.05 1.96
also note that Bos performs well in terms of RDP whensmall number of overlay sites are elected as the SuperPeers.
6. Related work
Scribe [12,13] is a scalable application-level multicastbuilt on Pastry [32]. Multicast overlay maintenance andoptimization can be handled locally. The Scribe tree opti-mization uses a bottleneck remover whereby a parent canrequest a child to switch its role to a sibling. SplitStream[14] is a high-bandwidth and low-latency multicast servicefor cooperative environments that is also built on Pastry.It splits the content into multiple stripes and multicast.Each stripe using a separate tree. In this way, the systemload will be spread evenly across Peers and it increasesresilience and robustness.
Bayeux [33] is a source-specific, application-level multi-cast scheme that is built on top of Tapestry (which has sim-ilar prefix-based routing as Pastry) routing infrastructure.Bayeux trees are source-specific, since the source acts as acentralized management function. Bayeux uses forward-path algorithm in building multicast trees, while Scribe usesreverse path forwarding scheme. Both schemes providescomparable routing delay behaviors. However, Scribe hasa lower link stress performance than Bayeux. Bayeux pro-poses a scheme to scale to a larger numbers of receivers byrestricting the service model to a single traffic source andare not well suited for applications such as multi-playergames, massive scale distributed collaborative applications.
CAN-Multicast [34] is built on top of Content Address-able Network (CAN), by creating a separate CAN overlayfor each multicast group, and then perform flooding ofmulticast messages to all nodes. CAN-Multicast is capableto scale large group size in a distributed way by exploitingthe CAN topologies (i.e. virtual coordinate space) andeliminate the requirement of having multicast routing algo-rithms to construct distribution trees. Any group membercan be a source, and only group members forward themulticast.
Bayeux and CAN-based multicast are similar in thatthey achieve scalability by leveraging the scalable routinginfrastructure provided by CAN and Tapestry. Fundamen-tally, Bayeux supports only source-specific multicast whilstCAN-based multicast allows any group member to act as atraffic source. Bayeux uses an explicit protocol to set upand tear down a distribution tree from the source to theset of receiver nodes. On the other hand, CAN-based mul-ticast exploits the CAN structure and does not require arouting protocol to explicitly construct distribution trees.Castro et al. [12] show that tree-based overlay multicastbuilt on top of Pastry provides better performance thantrees built on top of CAN by making a comparative studyof building overlay multicast on these two overlaynetworks.
Our work (Bos) differs from previous research becausewe exploit accurate and scalable Internet geometry todesign a network-aware SuperPeers–Peers geometric

E.K. Lua et al. / Computer Communications 31 (2008) 464–488 485
overlay hierarchy. We propose the use of Yao-graph at theSuperPeers layers to provide a low-latency and high-band-width backbone infrastructure to serve the Peers in Peerslayer. Optimal-path overlay multicast tree is created atthe SuperPeers layer for efficient and scalable overlay mul-ticasting. Yao-graph has been used to build power efficientwireless ad hoc networks [19] because of its lightweightlocal topology maintenance structure.
There are several key advantages in Bos overlay multi-cast streaming network:
• The Yao-graph structure enables a new multicast groupmember to join the group and find the group memberwith the optimal geometric routes between the multicastmembers. This also means that the new group memberwould be able to locate the group member with the bestperformance metric (i.e. RTTs) between them using thenode-to-node geometric distances that are computed ina scalable manner. So, the overlay multicast infrastruc-ture is built with optimized network metric and the mul-ticast group will achieve much better performance as themulticast group grows.
• The multicast tree is an optimal tree structure to ensurethat there is no multicast routing loops formed – Yao-
graph has EMST characteristic. On the other hand,overlay multicast service built on mesh overlay is morecomplex in eradicating multicast routing loops.
• The LST overlay network has efficient local overlaytopology maintenance management and it has less over-head messages between the group members to managethe multicast overlay. This is because multicast member-ship management is restricted to the immediate six clos-est neighbors. This will help to reduce the overlaymulticast service interruption probability from nodechurn.
• The Yao-graph created at the SuperPeers layer is able tobound their number of outgoing links to at most 6. Thiswill help to limit the number of multicast forwardingmessages in the outgoing links (i.e. out-degree) of everymulticast group member in the multicast tree. So, theoutbound network bandwidth of each multicast groupmember is being controlled to reduce overloading dur-ing overlay multicasting. In addition, the network-awareSuperPeers–Peers geometric overlay hierarchy helps toscale the overlay multicasting.
Yao-graph is also used to construct efficient networktopology for small mobile ad hoc networks to minimizeoverhead traffic management. To the best of our knowl-edge, Yao-graph has not been previously studied for thedesign of network-aware geometric overlay network toprovide Internet-scale multicasting.
7. Conclusion
Since we cannot ignore the underlying network metricsuch as delay latency (RTTs) between nodes to construct
efficient overlay network for multicasting, we proposeand design a network-aware geometric overlay network.We leverage on the observation in our scalability meta-metric [2] that subspace embedding (Euclidean space) insmall partitioned clusters consisting of closer nodes willachieve better embedding accuracy. We exploit this resultin our Internet geometry (Highways) to compute nodecoordinates in local and global geometric spaces and pro-vide accurate geometric distances between nodes in Euclid-ean space. Once the locality of nodes in the underlyingnetwork has been determined in a scalable manner, theselective placement of nodes in the geometric overlay isdone efficiently.
A network-aware SuperPeers–Peers geometric overlayhierarchy is proposed and designed to scale the overlay net-work communication and management – LightweightSuperPeers Topology (LST). The SuperPeers layer providesa low-latency and high-bandwidth backbone infrastructurefor the Peers in the lower Peers layer. Yao-graph is con-structed at the SuperPeers layer whereby every SuperPeeris connected to six closest neighbors in two-dimensionalEuclidean space. We propose to create geometric overlaymulticast service (Bos) at the LST SuperPeers overlay. Opti-mal-path overlay multicast tree is built on the Yao-graph
structure at the SuperPeers layer based on optimal geomet-ric routing paths between SuperPeers derived from theLST’s localized random compass routing algorithm.
To evaluate the effectiveness and scalability of our pro-posals, we conduct simulation experiments on 10 massivescale networks each consisting of 100,000 nodes, and carryout deployment experiments in PlanetLab’s real worldInternet-scale environment. Our performance evaluationresults show that overlay multicasting using network-awaregeometric overlay hierarchy approach achieves high effi-
ciency and good scalability in massive scale and wide-areanetworks. This is due to the scalable design of networkawareness and node locality properties in our geometricoverlay multicast streaming network (Bos) that help toscale and boost the multicast efficiency, quality andperformance.
Acknowledgments
The authors thank Miguel Castro and Manuel Costa(Microsoft Research, Cambridge, UK) for their discussionand providing the massive scale network models, MichaelKleis (Fraunhofer Institute FOKUS) for his contributionto the initial phase of this research project and MichaelSmirnov (Fraunhofer Institute FOKUS) for his valuablecomments. Xiaoming Zhou and Michael Kleis visited theUniversity of Cambridge Computer Laboratory for 3weeks with the support from the European Union underthe E-NEXT NoE FP6 – 506869. Eng Keong Lua wassponsored by Microsoft Research Fellowship and EPSRCe-Science FutureGrid, and Xiaoming Zhou was supportedby the NWO SAID Project, for their Ph.D. researchstudies.

486 E.K. Lua et al. / Computer Communications 31 (2008) 464–488
Appendix. The Yao-graph
We consider a fully meshed connected graph G(V,E),where V corresponds to a set of points in the Euclideanspace R2, and E to the set of edges with weight correspond-ing to the Euclidean length of an edge.
Definition 2. Given any finite V � R2 and let s 2 IN is aninteger. For any pair of nodes u, v, let Su,v denote the sector(or cone) of u containing node v. Suppose that the spacearound every node v 2 V is cut into s sectors with angleh ¼ 2p
s . Then the Yao-graph YGh(V) of V consists of thefollowing set of links (see Fig. 32):
E ¼ðu; vÞju; v 2 V and there is now 2 V
with w 2 Su;v and kuwk < kuvk
� �
Lemma 3. Let p 2 R2 be a point and S be a sector originat-
ing at p. Furthermore, let q and r be two points in S with
ipqi 6 ipri. Then kqrk 6 kprk � 1� 2sin h2
� �� �kpqk.
Proof. Consider Fig. 33. In this figure, q 0 represents thepoint on the line from p to r with the same distance to p
as q. Applying the triangle inequality to q, q 0, and r, we get
kqrk 6 kqq0k þ kq0rkiqq 0i is certainly maximized if q and q 0 are on opposite sidesof the sector. Hence,
kqq0k 6 2 sinh2
� �� kpqk
Moreover,
kq0rk ¼ kprk � kpq0k ¼ kprk � kpqkSubstituting above yields
Fig. 32. An example of a Yao-graph.
p
q
q’r
Fig. 33. The sector of p that contains r.
kqrk 6 2 sinh2
� �� kpqk þ kprk � kpqk
¼ kprk � 1� 2 sinh2
� �� �kpqk �
The drawback of the Yao-graph is that, although its out-degree is at most s, its in-degree may be as high as N � 1for N nodes. Various subgraphs of the Yao-graph havebeen suggested to remove this drawback. We will presenttwo of them here.
Definition 4. The sparsified Yao-graph SpYGh(V) is asubgraph of YGh(V) with link set
E ¼½c�cðu; vÞ 2 EðYGhðV ÞÞj for all w 2 V
with ðw; vÞ 2 EðYGhðV ÞÞand w 2 Su;v : kvwk > kuvk
8><>:
9>=>;
In words, for every sector of every node v, the sparsifiedYao-graph only keeps the shortest of all links into v. Hence,the sparsified Yao-graph has an in-degree of at most s andan out-degree of at most s, and therefore a degree of atmost 2s.
Definition 5. The symmetric Yao-graph SyYGh(V) is a sub-graph of YGh(V) with link set
E ¼ fðu; vÞ 2 EðYGhðV ÞÞjðu; vÞ 2 EðYGhðV ÞÞgIn words, the symmetric Yao-graph only keeps a link(u,v) if not only v is the nearest neighbor of u in Su,v
but also u is the nearest neighbor of v in Sv,u. Hence,the symmetric Yao-graph has a degree of at most s.Obviously,
SyYGhðV Þ � SpYGhðV Þ � YGhðV ÞFig. 34 shows that there are cases in which the edge sets ofthe different graphs are proper subsets of each other. Thus,it suffices to prove connectivity for SyYGh(V) in order toprove connectivity for both variants of the Yao-graph.
Definition 6. A Minimum Spanning Tree (MST) of a con-nected weighted graph with N nodes and W edges, isdefined as the tree connecting all the nodes that minimizesthe sum of the link weights. That is, a MST is a tree with-out any loops which connects all the nodes with the lowestcost (weights) among all the candidate trees. A EuclideanMST (EMST) is an MST where weight of a link is itsEuclidean distance in the Euclidean space of R2. UsingKruskal’s algorithm [35], the computation of the MST ofthe connected weighted graph requires O(W log N). Inthe case of a geometric graph in two-dimensional geometricspace, the calculation of the EMST can be done in O(NlogN)[36].
Theorem 7. Consider any finite V � R2, then the Euclidean
Minimum Spanning Tree of V is a subgraph of the Yao-
graph.

Fig. 34. The Yao-graph, the sparsified Yao-graph, and the symmetric Yao-graph of a point set.
E.K. Lua et al. / Computer Communications 31 (2008) 464–488 487
Proof. See A. C.-C. Yao, On constructing minimum span-ning trees in k-dimensional spaces and related problem.[8]. h
References
[1] E.K. Lua, J. Crowcroft, M. Pias, Highways: proximity clustering forscalable peer-to-peer network, in: Proceedings of the 4th IEEEInternational Conference on Peer-to-Peer Computing (IEEE P2P2004), 2004, pp. 266–267.
[2] E.K. Lua, T. Griffin, M. Pias, H. Zheng, J. Crowcroft, On theaccuracy of embeddings for internet coordinate systems, in: Proceed-ings of the ACM SIGCOMM-Usenix Internet Measurement Confer-ence 2005 (IMC 2005), 2005.
[3] H. Zheng, E.K. Lua, M. Pias, T.G. Griffin, Internet routing policiesand round-trip-times, in: Proceedings of the Passive Active Measure-ment Workshop 2005 (PAM 2005), 2005.
[4] E.K. Lua, T.G. Griffin, Embeddable overlay networks, in: 12th IEEESymposium on Computers and Communications (IEEE ISCC 2007),Aveiro, Portugal, 2007.
[5] M. Kleis, E.K. Lua, X. Zhou, A case for lightweight SuperPeertopologies, in: KiVS Kurzbeitrage und Workshop, Germany, 2005,pp. 185–188.
[6] M. Kleis, E.K. Lua, X. Zhou, Hierarchical peer-to-peer networksusing lightweight SuperPeer topologies, in: Proceedings of the10th IEEE Symposium on Computers and Communications(IEEE ISCC 2005), La Manga del Mar Menor, Cartagena,Spain, 2005.
[7] E.K. Lua, X. Zhou, Network-aware SuperPeers-peers geometricoverlay network, in: 16th IEEE ICCCN 2007 P2P and GridNetworking Track, Honolulu, Hawaii, USA, 2007.
[8] A.C.-C. Yao, On constructing minimum spanning trees in k-dimen-sional space and related problems, SIAM Journal on Computing 11(1982) 721–736.
[9] E.K. Lua, X. Zhou, J. Crowcroft, P.V. Miegham, Hierachicalgeometric overlay multicast network, in: 25th IEEE INFOCOMConference 2006 Posters and Demo, Barcelona, Spain, 2006.
[10] E.K. Lua, X. Zhou, Bos: massive scale network-aware geometricoverlay multicast streaming network, in: IEEE Globecom 2007 P2PNetworking Track, Washington, DC, USA, 2007.
[11] PlanetLab home page, Available from: <http://www.planetlab.org>,URL <http://www.planetlab.org>.
[12] M. Castro, M.B. Jones, A.-M. Kermarrec, A. Rowstron, M. Theimer,H. Wang, A. Wolman, An evaluation of scalable application-levelmulticast built using peer-to-peer overlays, in: IEEE INFOCOM2003, 2003.
[13] M. Castro, P. Druschel, A.-M. Kermarrec, A. Rowstron, Scribe: alarge-scale and decentralized application-level multicast infrastruc-ture, IEEE Journal on Selected Areas in Communication (JSAC) 20(8).
[14] M. Castro, P. Druschel, A.-M. Kermarrec, A. Nandi, A. Rowstron,A. Singh, Splitstream: High-bandwidth multicast in a cooperativeenvironment, in: ACM Symposium on Operating Systems Principles(ACM SOSP 2003), 2003.
[15] J.B. MacQueen, Some methods for classification and analysis ofmultivariate observations, in: 5th Berkeley Symposium on Mathe-matical Statistics and Probability, vol. 1, 1967, pp. 281–297.
[16] E.K. Lua, The structure of internet latency, Ph.D. thesis, Universityof Cambridge Computer Laboratory, Cambridge, United Kingdom(August 2006).
[17] P.V. Mieghem, Data Communications Networking, Techne press,Amsterdam, The Netherlands, 2006.
[18] M. Pias, J. Crowcroft, S. Wilbur, T. Harris, S. Bhatti, Lighthouses forscalable distributed location, in: 2nd International Workshop onPeer-to-Peer Systems, 2003.
[19] X.-Y. Li, P.-J. Wan, Y. Wang, O. Frieder, Sparse power efficienttopology for wireless networks, in: Hawaii International Conferenceon System Sciences (HICSS 2002), 2002, p. 296.
[20] A. Czumaj, F. Ergun, L. Fortnow, A. Magen, I. Newman, R.Rubinfeld, C. Sohler, Sublinear-time approximation of euclideanminimum spanning tree, in: 14th Annual ACM-SIAM Symposium onDiscrete Algorithms, 2003, pp. 813–822.
[21] E. Kranakis, H. Singh, J. Urrutia, Compass routing on geometricnetworks, in: 11th Canadian Conference on Computational Geom-etry, Vancouver, Canada, 1999, pp. 51–54.
[22] X.-Y. Li, G. Calinescu, P.-J. Wan, Distributed construction of aplanar spanner and routing for ad hoc wireless networks, in:Proceedings of IEEE INFOCOM 2002, vol. 3, New York, USA,2002, pp. 1268–1277.
[23] Y.K. Dalal, R.M. Metcalfe, Reverse path forwarding of broadcastpackets, Communication of the ACM 21 (12) (1978) 1040–1048.
[24] E.W. Zegura, K.L. Calvert, S. Bhattacharjee, How to model aninternetwork, in: IEEE INFOCOM 1996, vol. 2, San Francisco, CA,USA, 1996, pp. 594–602.
[25] L. Plissonneau, J.-L. Costeux, P. Brown, Analysis of peer-to-peertraffic on adsl, in: Passive and Active Measurement Workshop 2005(PAM 2005), 2005.
[26] S. Deering, D. Cheriton, Multicast routing in datagram internetworksand extended lans, ACM Transactions on Computer Systems 8 (2).
[27] S. Deering, D. Estrin, D. Farinacci, V. Jacobson, C. Liu, L. Wei, Thepim architecture for wide-area multicast routing, IEEE/ACM Trans-actions on Networking 4 (2).
[28] D.G. Andersen, H. Balakrishnan, M.F. Kaashoek, R. Morris,Resilient overlay networks, in: ACM Symposium on Operating

488 E.K. Lua et al. / Computer Communications 31 (2008) 464–488
Systems Principles (ACM SOSP 2001), Banff, Canada, 2001, pp. 131–145.
[29] Y.-H. Chu, S.G. Rao, H. Zhang, A case for end system multicast, in:ACM SIGMETRICS, 2000, pp. 1–12.
[30] Y. Chawathe, S. McCanne, E.A. Brewer, RMX: Reliable multicastfor heterogeneous networks, in: IEEE INFOCOM 2000, Tel Aviv,Israel, 2000, pp. 795–804.
[31] J. Urrutia, Handbook of Wireless Networks and Mobile Computing,John Wiley & Sons, 2002, Ch. 18: Routing with guaranteed delivery ingeometric and wireless networks, pp. 393–406.
[32] P. Druschel, A. Rowstron, Pastry: scalable distributed object locationand routing for large-scale peer to peer systems, in: Proceedings of the18th IFIP/ACM Middleware 2001, 2001.
[33] S.Q. Zhuang, B.Y. Zhao, A.D. Joseph, R.H. Katz, J.D.Kubiatowicz, Bayeux: an architecture for scalable and fault-tolerant wide-area data dissemination, in: ACM NOSSDAV,2001, pp. 11–20.
[34] S. Ratnasamy, M. Handley, R.M. Karp, S. Shenker, Application-level multicast using content-addressable networks, in: NetworkedGroup Communication, 2001, pp. 14–29.
[35] T.H. Cormen, C.E. Leiserson, R.L. Rivest, C. Stein, Introduc-tion to Algorithms, second ed., MIT Press and McGraw-Hill,2001.
[36] M.I. Shamos, D. Hoey, Closest-point problems, in: 16th IEEESymposium on Foundations of Computer Science, 1975, pp.151–162.
Eng Keong Lua is currently a Researcher in theNTT Service Integration Laboratories, NipponTelegraph and Telephone Corporation at Tokyo,Japan, since November 2006. In 2006, heobtained his Ph.D. degree in Computer Sciencefrom the University of Cambridge ComputerLaboratory, United Kingdom. From 2003 to2006, his research studies were sponsored byMicrosoft Research Fellowship and EPSRCe-Science FutureGrid. In 2004, he had alsocompleted a 6-month research internship as a
Researcher at the Intel Research Laboratory, Cambridge, UK. He was theinaugural recipient of the prestigious Australia-Asia Award in 2003, pre-
sented by the Australian Government to promising research scholars inAsia for support of research activities in Australia. He received his M.Sc.in Telecommunications with Distinction from the Department of Elec-tronic and Electrical Engineering, University College London, UnitedKingdom, in 1997, and both Postgraduate Diploma of Teaching in HigherEducation and B.A.Sc in Computer Engineering with Merit from theNanyang Technological University (NTU), Singapore, in 1995 and 1993respectively. His current research areas are telecommunications, net-working and distributed systems. His main research interests includeoverlay networking, Peer-to-Peer (P2P) overlay systems, network-aware(locality-aware) overlay multicast streaming network, meta-routingframework (network routing algebra) for the design of network routingprotocols in Internet and wireless networks, network security and ubiq-uitous networking. He is a Member of the IEEE Computer and Com-munications Societies, ACM, IET, and IES. He holds Cisco CertifiedAcademic Instructor (CCAI), Cisco Certified Network Professional(CCNP) and Cisco Certified Network Associate (CCNA) professionalcertifications.Xiaoming Zhou received M.Sc. degree in electricalengineering in Sep. 2002 from Delft University ofTechnology, the Netherlands. After that he did aresearch topic on Internet performance analysisfunded by a DELTA scholarship. In January2003 he began his Ph.D. work at NetworkArchitectures and Services (NAS) group at TUDelft. His research project was mainly focused onInternet performance measurement and analysisat both application and IP layers. Such as Peer-to-Peer system, overlay multicast system, and the
users perceived quality of Voice-over-IP applications. He obtained hisPhD degree in November 2006. Since January 2007, he has been working
as a research scientist in Philips Research, Eindhoven. His current researchareas focus on the convergence of different networks (e.g. Internet,Mobile, TV).Jon Crowcroft is the Marconi Professor of Net-worked Systems in the Computer Laboratory,University of Cambridge. Prior to that, he wasProfessor of networked systems at UCL in theComputer Science Department. He is a Fellow ofthe ACM, a Fellow of the British ComputerSociety and a Fellow of the IEE and a Fellow ofthe Royal Academy of Engineering, as well as aFellow of the IEEE. He was a member of theIAB; was general chair for the ACM SIGCOMM95–99. He has published 5 books–the latest is the
Linux TCP/IP Implementation, published by Wiley in 2001. He is thePrinciple Investigator in the Computer Laboratory for the EU Haggle
Project in DTN, the EPSRC TINA project on location sensors andwireless networking of airports, and for the ITA project in next generationwireless networks.Piet F.A. Van Mieghem is professor at the DelftUniversity of Technology with a chair in tele-communication networks and chairman of thebasic unit Network Architectures and Services(NAS). His main research interests lie in newInternet-like architectures for future, broadbandand QoS-aware networks and in the modellingand performance analysis of network behaviorand complex infrastructures. Professor VanMieghem received a Master’s and Ph. D. inElectrical Engineering from the K.U.Leuven
(Belgium) in 1987 and 1991, respectively. Before joining Delft, he workedat the Interuniversity Micro Electronic Center (IMEC) from 1987 to 1991.
During 1993 to 1998, he was a member of the Alcatel Corporate ResearchCenter in Antwerp where he was engaged in performance analysis of ATMsystems and in network architectural concepts of both ATM networks(PNNI) and the Internet. He was a visiting scientist at MIT (Departmentof Electrical Engineering, 1992–1993) and, in 2005, he was visiting pro-fessor at ULCA (Department of Electrical Engineering). He was memberof the editorial board of the journal Computer Networks from 2005–2006.He is the author of two books: Performance Analysis of CommunicationsNetworks and Systems, Cambridge University Press, 2006 and DataCommunications Networking, Techne Press, Amsterdam, 2006.