Characterizing EMG Data using Machine- Learning Tools
13
Characterizing EMG data using machine-learning tools Jamileh Yousefi a , Andrew Hamilton-Wright b,a,n a School of Computer Science, University of Guelph, Guelph, ON, Canada b Mathematics and Computer Science, Mount Allison University, Sackville, NB, Canada article info Article history: Received 11 January 2014 Accepted 24 April 2014 Keywords: EMG electromyography EMG characterization Machine learning Classification Neuromuscular disease Myopathy Neuropathy abstract Effective electromyographic (EMG) signal characterization is critical in the diagnosis of neuromuscular disorders. Machine-learning based pattern classification algorithms are commonly used to produce such characterizations. Several classifiers have been investigated to develop accurate and computationally efficient strategies for EMG signal characterization. This paper provides a critical review of some of the classification methodologies used in EMG characterization, and presents the state-of-the-art accomplishments in this field, emphasizing neuro- muscular pathology. The techniques studied are grouped by their methodology, and a summary of the salient findings associated with each method is presented. & 2014 Elsevier Ltd. All rights reserved. Contents 1. Introduction .......................................................................................................... 2 2. EMG signal analysis .................................................................................................... 3 2.1. EMG signal structure ............................................................................................. 3 2.2. Signal decomposition ............................................................................................ 3 2.3. Decomposed MUP features ........................................................................................ 3 3. EMG classification approaches ........................................................................................... 4 3.1. Artificial neural networks approach ................................................................................. 4 3.1.1. SOFM models ............................................................................................ 4 3.1.2. RBN and decision trees .................................................................................... 5 3.1.3. Wavelets ................................................................................................ 5 3.1.4. Other ANN approaches .................................................................................... 6 3.2. Fuzzy systems .................................................................................................. 6 3.3. Hybrid systems ................................................................................................. 7 3.3.1. Neuro-fuzzy systems ...................................................................................... 7 3.3.2. Fusing classifiers ......................................................................................... 7 3.3.3. Other hybrids ............................................................................................ 7 3.4. Support vector machine (SVM) ..................................................................................... 8 3.5. Other methodologies used ....................................................................................... 10 4. Discussion .......................................................................................................... 10 5. Conclusions ......................................................................................................... 11 Conflict of interest statement ............................................................................................... 11 Acknowledgements ....................................................................................................... 12 References .............................................................................................................. 12 Contents lists available at ScienceDirect journal homepage: www.elsevier.com/locate/cbm Computers in Biology and Medicine http://dx.doi.org/10.1016/j.compbiomed.2014.04.018 0010-4825/& 2014 Elsevier Ltd. All rights reserved. n Corresponding author. E-mail addresses: jyousefi@uoguelph.ca (J. Yousefi), [email protected] (A. Hamilton-Wright). Computers in Biology and Medicine 51 (2014) 1–13
Transcript of Characterizing EMG Data using Machine- Learning Tools

Characterizing EMG data using machine-learning tools
Jamileh Yousefi a, Andrew Hamilton-Wright b,a,n
a School of Computer Science, University of Guelph, Guelph, ON, Canadab Mathematics and Computer Science, Mount Allison University, Sackville, NB, Canada
a r t i c l e i n f o
Article history:Received 11 January 2014Accepted 24 April 2014
Keywords:EMG electromyographyEMG characterizationMachine learningClassificationNeuromuscular diseaseMyopathyNeuropathy
a b s t r a c t
Effective electromyographic (EMG) signal characterization is critical in the diagnosis of neuromusculardisorders. Machine-learning based pattern classification algorithms are commonly used to produce suchcharacterizations.
Several classifiers have been investigated to develop accurate and computationally efficient strategiesfor EMG signal characterization.
This paper provides a critical review of some of the classification methodologies used in EMGcharacterization, and presents the state-of-the-art accomplishments in this field, emphasizing neuro-muscular pathology.
The techniques studied are grouped by their methodology, and a summary of the salient findingsassociated with each method is presented.
& 2014 Elsevier Ltd. All rights reserved.
Contents
1. Introduction . . . . . . . . . . . . . . . . . . . . . . . . . . . . . . . . . . . . . . . . . . . . . . . . . . . . . . . . . . . . . . . . . . . . . . . . . . . . . . . . . . . . . . . . . . . . . . . . . . . . . . . . . . 22. EMG signal analysis . . . . . . . . . . . . . . . . . . . . . . . . . . . . . . . . . . . . . . . . . . . . . . . . . . . . . . . . . . . . . . . . . . . . . . . . . . . . . . . . . . . . . . . . . . . . . . . . . . . . 3
2.1. EMG signal structure . . . . . . . . . . . . . . . . . . . . . . . . . . . . . . . . . . . . . . . . . . . . . . . . . . . . . . . . . . . . . . . . . . . . . . . . . . . . . . . . . . . . . . . . . . . . . 32.2. Signal decomposition . . . . . . . . . . . . . . . . . . . . . . . . . . . . . . . . . . . . . . . . . . . . . . . . . . . . . . . . . . . . . . . . . . . . . . . . . . . . . . . . . . . . . . . . . . . . 32.3. Decomposed MUP features . . . . . . . . . . . . . . . . . . . . . . . . . . . . . . . . . . . . . . . . . . . . . . . . . . . . . . . . . . . . . . . . . . . . . . . . . . . . . . . . . . . . . . . . 3
3. EMG classification approaches . . . . . . . . . . . . . . . . . . . . . . . . . . . . . . . . . . . . . . . . . . . . . . . . . . . . . . . . . . . . . . . . . . . . . . . . . . . . . . . . . . . . . . . . . . . 43.1. Artificial neural networks approach . . . . . . . . . . . . . . . . . . . . . . . . . . . . . . . . . . . . . . . . . . . . . . . . . . . . . . . . . . . . . . . . . . . . . . . . . . . . . . . . . 4
3.1.1. SOFM models . . . . . . . . . . . . . . . . . . . . . . . . . . . . . . . . . . . . . . . . . . . . . . . . . . . . . . . . . . . . . . . . . . . . . . . . . . . . . . . . . . . . . . . . . . . . 43.1.2. RBN and decision trees . . . . . . . . . . . . . . . . . . . . . . . . . . . . . . . . . . . . . . . . . . . . . . . . . . . . . . . . . . . . . . . . . . . . . . . . . . . . . . . . . . . . 53.1.3. Wavelets. . . . . . . . . . . . . . . . . . . . . . . . . . . . . . . . . . . . . . . . . . . . . . . . . . . . . . . . . . . . . . . . . . . . . . . . . . . . . . . . . . . . . . . . . . . . . . . . 53.1.4. Other ANN approaches . . . . . . . . . . . . . . . . . . . . . . . . . . . . . . . . . . . . . . . . . . . . . . . . . . . . . . . . . . . . . . . . . . . . . . . . . . . . . . . . . . . . 6
3.2. Fuzzy systems . . . . . . . . . . . . . . . . . . . . . . . . . . . . . . . . . . . . . . . . . . . . . . . . . . . . . . . . . . . . . . . . . . . . . . . . . . . . . . . . . . . . . . . . . . . . . . . . . . 63.3. Hybrid systems . . . . . . . . . . . . . . . . . . . . . . . . . . . . . . . . . . . . . . . . . . . . . . . . . . . . . . . . . . . . . . . . . . . . . . . . . . . . . . . . . . . . . . . . . . . . . . . . . 7
3.3.1. Neuro-fuzzy systems . . . . . . . . . . . . . . . . . . . . . . . . . . . . . . . . . . . . . . . . . . . . . . . . . . . . . . . . . . . . . . . . . . . . . . . . . . . . . . . . . . . . . . 73.3.2. Fusing classifiers . . . . . . . . . . . . . . . . . . . . . . . . . . . . . . . . . . . . . . . . . . . . . . . . . . . . . . . . . . . . . . . . . . . . . . . . . . . . . . . . . . . . . . . . . 73.3.3. Other hybrids . . . . . . . . . . . . . . . . . . . . . . . . . . . . . . . . . . . . . . . . . . . . . . . . . . . . . . . . . . . . . . . . . . . . . . . . . . . . . . . . . . . . . . . . . . . . 7
3.4. Support vector machine (SVM) . . . . . . . . . . . . . . . . . . . . . . . . . . . . . . . . . . . . . . . . . . . . . . . . . . . . . . . . . . . . . . . . . . . . . . . . . . . . . . . . . . . . . 83.5. Other methodologies used . . . . . . . . . . . . . . . . . . . . . . . . . . . . . . . . . . . . . . . . . . . . . . . . . . . . . . . . . . . . . . . . . . . . . . . . . . . . . . . . . . . . . . . 10
4. Discussion . . . . . . . . . . . . . . . . . . . . . . . . . . . . . . . . . . . . . . . . . . . . . . . . . . . . . . . . . . . . . . . . . . . . . . . . . . . . . . . . . . . . . . . . . . . . . . . . . . . . . . . . . . 105. Conclusions . . . . . . . . . . . . . . . . . . . . . . . . . . . . . . . . . . . . . . . . . . . . . . . . . . . . . . . . . . . . . . . . . . . . . . . . . . . . . . . . . . . . . . . . . . . . . . . . . . . . . . . . . 11Conflict of interest statement . . . . . . . . . . . . . . . . . . . . . . . . . . . . . . . . . . . . . . . . . . . . . . . . . . . . . . . . . . . . . . . . . . . . . . . . . . . . . . . . . . . . . . . . . . . . . . . 11Acknowledgements . . . . . . . . . . . . . . . . . . . . . . . . . . . . . . . . . . . . . . . . . . . . . . . . . . . . . . . . . . . . . . . . . . . . . . . . . . . . . . . . . . . . . . . . . . . . . . . . . . . . . . . 12References . . . . . . . . . . . . . . . . . . . . . . . . . . . . . . . . . . . . . . . . . . . . . . . . . . . . . . . . . . . . . . . . . . . . . . . . . . . . . . . . . . . . . . . . . . . . . . . . . . . . . . . . . . . . . . 12
Contents lists available at ScienceDirect
journal homepage: www.elsevier.com/locate/cbm
Computers in Biology and Medicine
http://dx.doi.org/10.1016/j.compbiomed.2014.04.0180010-4825/& 2014 Elsevier Ltd. All rights reserved.
n Corresponding author.E-mail addresses: [email protected] (J. Yousefi), [email protected] (A. Hamilton-Wright).
Computers in Biology and Medicine 51 (2014) 1–13
1. Introduction
Electromyography, the study of the electrical currents generatedin a muscle during its contraction, provides data describing bothneuromuscular activity, as well as muscular morphology [1,2].
Over the last twenty years, electromyography (EMG) has beenwidely used by researchers and clinicians as a valuable tool for anaccurate diagnosis of neuromuscular disorders [3,4]. Neuromusculardisorder is a general term that refers to diseases that affect any partof the nerve or muscle including motor neurons, neuromuscularjunctions, and muscle tissue. Myopathy and neuropathy are twocritical neuromuscular disease types, and discerning between these,as well as between a disease and non-disease state, are typicalobjectives of a classifier based EMG characterization systems.
Myopathy describes a group of diseases that affect skeletalmuscle tissue directly, and are independent from any disorder ofthe nervous system. Neuropathy, conversely, refers to any of anumber of diseases that cause damage to the nerves involved in
muscular control, or in sensation [2,4,5]. Accurate and correctcharacterization of these two types of diseases becomes animportant first step in the diagnostic process.
While historically EMG data has been approached qualitatively[3,4], in recent years a great deal of interest has been found inquantitative EMG analysis, called QEMG [6–11], in which a seriesof quantitative measures of the EMG signal are analyzed for theirdiagnostic information, as described in Section 2.3.
To characterize a muscle using QEMG data, the acquired signalsmust be analyzed, decomposed and classified. In diagnosingneuromuscular disorders, the classification of EMG signal intodifferent groups is used in the detection of abnormalities. Thispaper presents several classification techniques used for EMGsignal classification for diagnosis of neuromuscular disorders, inparticular, myopathy and neuropathy types.
In Section 2, we briefly review EMG signals and their attributes.In Section 3, we present a review of EMG classification methods.Discussion is presented in Section 4.
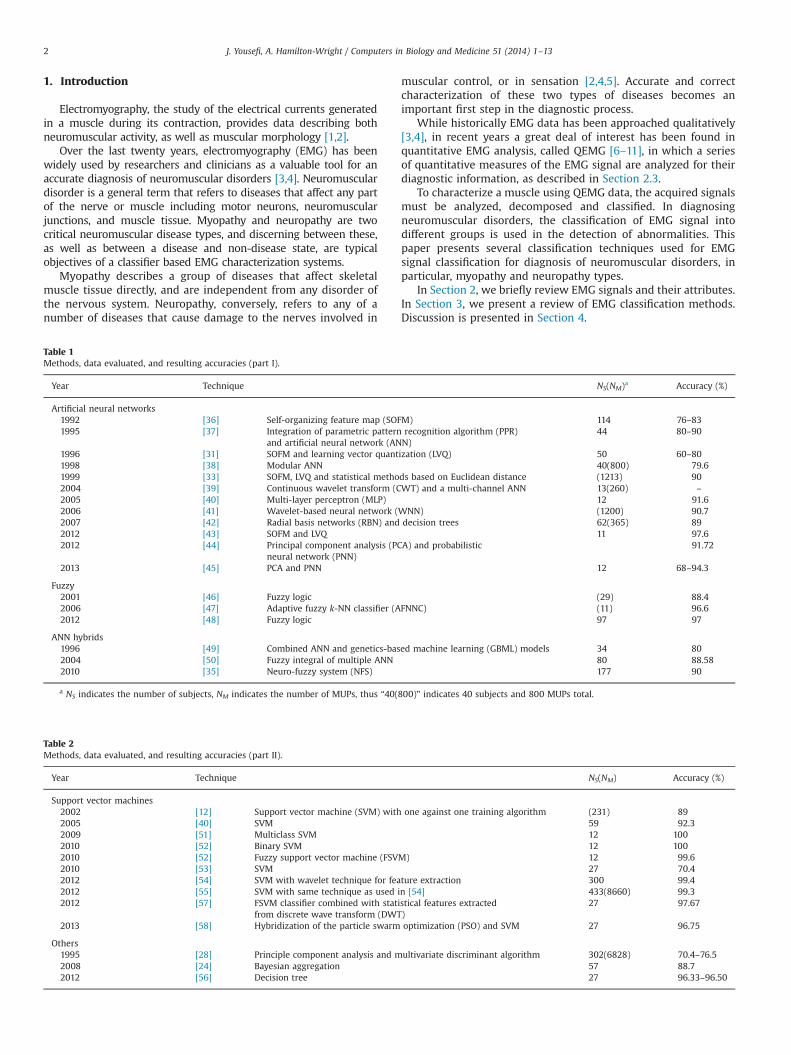
Table 2Methods, data evaluated, and resulting accuracies (part II).
Year Technique NS(NM) Accuracy (%)
Support vector machines2002 [12] Support vector machine (SVM) with one against one training algorithm (231) 892005 [40] SVM 59 92.32009 [51] Multiclass SVM 12 1002010 [52] Binary SVM 12 1002010 [52] Fuzzy support vector machine (FSVM) 12 99.62010 [53] SVM 27 70.42012 [54] SVM with wavelet technique for feature extraction 300 99.42012 [55] SVM with same technique as used in [54] 433(8660) 99.32012 [57] FSVM classifier combined with statistical features extracted
from discrete wave transform (DWT)27 97.67
2013 [58] Hybridization of the particle swarm optimization (PSO) and SVM 27 96.75
Others1995 [28] Principle component analysis and multivariate discriminant algorithm 302(6828) 70.4–76.52008 [24] Bayesian aggregation 57 88.72012 [56] Decision tree 27 96.33–96.50
Table 1Methods, data evaluated, and resulting accuracies (part I).
Year Technique NS(NM)a Accuracy (%)
Artificial neural networks1992 [36] Self-organizing feature map (SOFM) 114 76–831995 [37] Integration of parametric pattern recognition algorithm (PPR)
and artificial neural network (ANN)44 80–90
1996 [31] SOFM and learning vector quantization (LVQ) 50 60–801998 [38] Modular ANN 40(800) 79.61999 [33] SOFM, LVQ and statistical methods based on Euclidean distance (1213) 902004 [39] Continuous wavelet transform (CWT) and a multi-channel ANN 13(260) –
2005 [40] Multi-layer perceptron (MLP) 12 91.62006 [41] Wavelet-based neural network (WNN) (1200) 90.72007 [42] Radial basis networks (RBN) and decision trees 62(365) 892012 [43] SOFM and LVQ 11 97.62012 [44] Principal component analysis (PCA) and probabilistic
neural network (PNN)91.72
2013 [45] PCA and PNN 12 68–94.3
Fuzzy2001 [46] Fuzzy logic (29) 88.42006 [47] Adaptive fuzzy k-NN classifier (AFNNC) (11) 96.62012 [48] Fuzzy logic 97 97
ANN hybrids1996 [49] Combined ANN and genetics-based machine learning (GBML) models 34 802004 [50] Fuzzy integral of multiple ANN 80 88.582010 [35] Neuro-fuzzy system (NFS) 177 90
a NS indicates the number of subjects, NM indicates the number of MUPs, thus “40(800)” indicates 40 subjects and 800 MUPs total.
J. Yousefi, A. Hamilton-Wright / Computers in Biology and Medicine 51 (2014) 1–132
Tables 1 and 2 provide a summary of all the techniques discussed,broken down by the type of classifier used. This is divided into twotables due to page size constraints. Through these tables and theaccompanying discussion, both newer results and important histor-ical context are provided, in order to better understand recent trendsin EMG classification.
2. EMG signal analysis
An EMG signal is a biological signal obtained by measuringvoltages associated with the electrical currents generated in amuscle during its contraction, providing a measure of neuromus-cular activity [1].
2.1. EMG signal structure
The collection of muscle fibres innervated by a single α-motorneuron is referred to as a motor unit (MU), and this is the smallestfunctional unit of a muscle that can be activated by neural control[4,12,13]. Muscular force production within an MU is achievedthrough activation of the α-motor neuron, causing tension to beproduced in the associated muscle fibres as the action potentialpropagates along the length of these attached fibres. Relaxationoccurs as the α-motor neuron ceases activity.
A motor unit potential (MUP) is the summation of the actionpotentials of these contraction of the muscle fibers in an MU, andis measured either by inserting an electrode into the muscle tissue,or, in the case of surface electromyography (sEMG), by placingan electrode array on the overlying skin surface. The voltagesdetected by the electrode represent the summation of the activityof all of the active MUs (the sum of the contributions of all MUPs).MUPs fromMUs whose territories are close to the electrode will bethe most easily discerned, due to the spatial filtering effects arisingfrom the dissipation of energy from distant MUP sources [14].
Signals recorded in this fashion will unavoidably contain noise,both from other biological sources within the body, as well asequipment noise [1,4,14]. Mathematically, the signal using a singleelectrode gathered from a single contraction can therefore be repre-sented as follows:
EMGt ¼ ∑N
m ¼ 1MUPTmðtÞþnðtÞ; ð1Þ
where MUPTm refers to the function describing the voltage con-tribution, as measured over the time of the contraction, of a singleMUP m of a total of N MUPs. As this function represents thecontribution from potentially many MUPs produced by the sameMU over time, this is referred to as a MUP train (MUPT). Thefunction n(t) represents all components of the signal not associatedwith the MUPs, understood to be the contributions of biological andenvironmental noise in the recorded signal. Both of these functionsare parameterized by time (t) [1].
2.2. Signal decomposition
EMG signal decomposition is a method for studying thestructure, organization and function of individual motor units.The objective of decomposition is to identify the contributions ofeach MU within the overall acquired signal [15–17].
EMG signal decomposition involves five steps: signal acquisi-tion; segmentation; feature extraction; clustering of detectedMUPs; and MUP assignment.
Before it can be characterized computationally, a signal, EMGt ,must be decomposed into the contributions from each active MUPT;once this is accomplished, the firing behaviour of each MU, alongwith the shape of the associated MUPs, can be determined. A typical
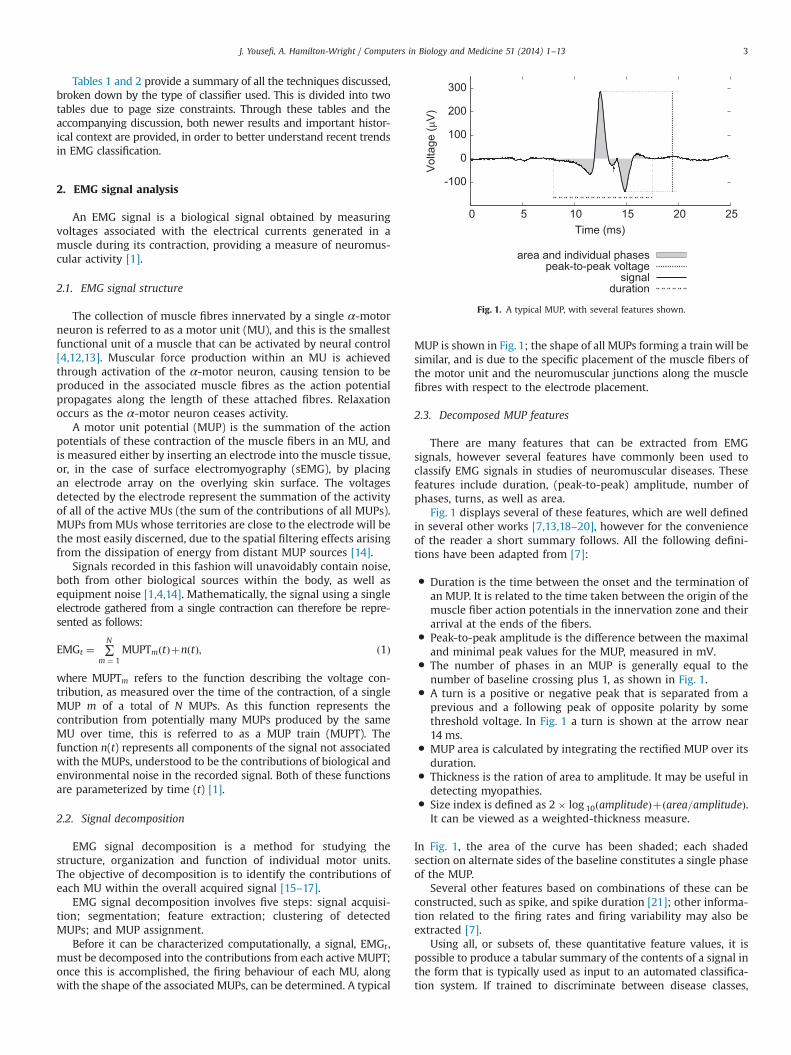
MUP is shown in Fig. 1; the shape of all MUPs forming a train will besimilar, and is due to the specific placement of the muscle fibers ofthe motor unit and the neuromuscular junctions along the musclefibres with respect to the electrode placement.
2.3. Decomposed MUP features
There are many features that can be extracted from EMGsignals, however several features have commonly been used toclassify EMG signals in studies of neuromuscular diseases. Thesefeatures include duration, (peak-to-peak) amplitude, number ofphases, turns, as well as area.
Fig. 1 displays several of these features, which are well definedin several other works [7,13,18–20], however for the convenienceof the reader a short summary follows. All the following defini-tions have been adapted from [7]:
� Duration is the time between the onset and the termination ofan MUP. It is related to the time taken between the origin of themuscle fiber action potentials in the innervation zone and theirarrival at the ends of the fibers.
� Peak-to-peak amplitude is the difference between the maximaland minimal peak values for the MUP, measured in mV.
� The number of phases in an MUP is generally equal to thenumber of baseline crossing plus 1, as shown in Fig. 1.
� A turn is a positive or negative peak that is separated from aprevious and a following peak of opposite polarity by somethreshold voltage. In Fig. 1 a turn is shown at the arrow near14 ms.
� MUP area is calculated by integrating the rectified MUP over itsduration.
� Thickness is the ration of area to amplitude. It may be useful indetecting myopathies.
� Size index is defined as 2� log 10ðamplitudeÞþðarea=amplitudeÞ.It can be viewed as a weighted-thickness measure.
In Fig. 1, the area of the curve has been shaded; each shadedsection on alternate sides of the baseline constitutes a single phaseof the MUP.
Several other features based on combinations of these can beconstructed, such as spike, and spike duration [21]; other informa-tion related to the firing rates and firing variability may also beextracted [7].
Using all, or subsets of, these quantitative feature values, it ispossible to produce a tabular summary of the contents of a signal inthe form that is typically used as input to an automated classifica-tion system. If trained to discriminate between disease classes,
-100
0
100
200
300
0 5 10 15 20 25
Vol
tage
( µV
)
Time (ms)
area and individual phasespeak-to-peak voltage
signalduration
Fig. 1. A typical MUP, with several features shown.
J. Yousefi, A. Hamilton-Wright / Computers in Biology and Medicine 51 (2014) 1–13 3
typically between neuropathies and myopathies, then such aclassifier can be used as the basis for a decision support system,and may then be used to assist physicians and researchers with thediagnosis, treatment and management of neuromuscular disorders[22–25].
In practice, ambiguity in the interpretation of MUPs detectedfrom a muscle makes discrimination between these two types ofdisease a challenging task [7].
3. EMG classification approaches
Several studies have employed classification methods includingBayesian techniques [26–30], neural networks [31,32], multilayerperceptrons [33], fuzzy approaches [34], support vector machines[12], and neuro-fuzzy systems [35]. In the following section, wediscuss some of the works which explore the EMG classificationproblem in the domain of neuromuscular pathology.
All of the techniques discussed in this and later sections aresummarized in Tables 1 and 2 which provides a breakdown byclassifier type, and year of publication.
3.1. Artificial neural networks approach
In the last decade, artificial neural network (ANN) tools havebeen of interest to many researchers in the field of EMG classifica-tion. ANNs have several advantages such as their ability to learnfrom examples and their tolerance for vagueness and uncertainty,which are significant characteristics of EMG signals. ANNs are alsowell known for their generalization ability, which is importantwhen working in high dimensional input spaces. The learningcapability of an ANN is its strength, but this is limited by theirinability to explain the reasons for conclusions reached [59]. Thisissue aside, their ability to learn directly from large data sets thathave high feature variability is a strong advantage for EMGclassification, and therefore many researchers have successfullyapplied ANNs to the diagnosis of neuromuscular disorders.
Pattichis et al. [37] used an integrated system composed of aparametric pattern recognition algorithm (PPR) and an ANN modelto classify EMG signals for the diagnosis of neuromuscular dis-orders. This system employed ANNs under both supervised andunsupervised training paradigms. Back-propagation (BP) [60] wasutilized in Pattichis’ work for supervised learning, and the Koho-nen self-organizing feature maps (SOFM) algorithm [61] were usedfor unsupervised learning. SOFM, also known as vector quantiza-tion, is an unsupervised learning technique based on competitivelearning. It is a dimensionality reduction technique which trans-forms a high-dimensional data set into a low dimensional space. Insuch a projection, SOFM techniques have been shown to preservethe topological properties of the training set [61].
Different ANN architectures were investigated in Pattichis' work.EMG signals were acquired from biceps brachii muscle duringa voluntary contraction. The classifiers were trained on MUPsobtained from 44 subjects (14 healthy patients, 16 neuropathic and14 myopathic patients). The means and standard deviations of7 features (duration, spike duration, amplitude, area, spike area,number of phases and number of turns) were used as input.
The resulting classification performances were comparedagainst a k-means cluster analysis classifier. Kohonen SOFM modeland the k-means cluster analysis algorithm achieved the samelevel of accuracy: between 80% and 85%. The ANN models trainedwith the BP algorithm, with an accuracy of 80–90%, appeared to bemore accurate than the two other models.
The results from BP models are also tend to be more consistent,meaning that in different training sessions, different MUP may be
classified incorrectly even when the overall classification accuracyis reported to be the same.
This paper discovered the (now well-understood) patternwherein myopathic muscles frequently have MUPs with shortduration, low amplitude and small number of phases, whileneuropathic patients have MUPs with long duration, high ampli-tude, and a large number of phases. This study also showed that noclear boundaries for each group can be suggested.
The SOFM model, as contrasted to the BP model, has twoadvantageous properties [37]: the first advantage is its comparisonability, allowing comparison between the data of one patient andanother, or between two studies of the same patient; the secondadvantage claimed for the SOFM model is the lower number ofepochs required for adequate training of a neural network.
The main disadvantage of ANN models is the difficulty theyhave in achieving generalization, and associated problems of over-fitting the training data.
Pattichis’ results show that training with the combination of themean and the standard deviation of the EMG parameters significantlyimproves the learning process. The advantages of this approach are asfollows: the minimization of observer bias and the provision ofinformation for physicians to reach an accurate diagnosis.
3.1.1. SOFM modelsAbel et al. [31] examined the use of different ANN architectures
and learning algorithms in the EMG diagnosis of neuromusculardisorders. They investigated the performance of three supervisedand one unsupervised neural networks using combinations ofparameters including turns analysis, small segments, and fre-quency analysis. EMG inference patterns (IP) were acquired fromthe biceps muscle during maximum voluntary contraction from atotal of 50 subjects (12 healthy, 18 myopathy, 15 neuropathy and5 both myopathy and neuropathy). Supervised networks includingthe Levenberg–Marquardt optimized back-propagation network(LBPN) [62], radial basis network (RBN) [63], learning vectorquantization network (LVQ) [64] and unsupervised Kohonen SOFMwere compared. LVQ is a supervised version of vector quantization,similar to SOFM. LVQ performs its classification based on thedistance between input vectors [64] .
Tan-sigmoid, radial basis, and competitive algorithms wereused to train the hidden layer of LBPN, RBN, and LVQ respectively.
Using different parameter combinations, LBPN, RBN and LVQgave diagnostic yields of 75–80%, 50–80%, and 70–80% respec-tively. The results of this study did not show that any of the neuralnetworks were superior to any other in terms of accuracy.However, it has been noted that the LBPN and RBN networkstrained faster than their counterparts.
All parameters were weighted equally in this study. Someparameter combinations produced lower scores than using asingle parameter, however this study found that closely interre-lated parameters (i.e., those that are functions of amplitude andfrequency) could produce a comparable diagnostic accuracy.
Two years later, Christodoulou and Pattichis [38] proposed amodular ANN for the same problem. This system was designed tomimic the decisionmaking process an expert neurophysiologist wouldinvoke when analyzing MUP features. Six different feature sets,including time domain parameters, frequency domain parameters,cepstral coefficients and three different wavelet coefficients, werecomputed and used as inputs to multiple SOFM classifiers. The resultsfrom all individual classifiers were then combined through majorityvoting. The contribution of each of the feature sets and classifier to thefinal diagnosis was weighted according to its confidence measure. Asnoted in the paper [38], the confidence measure “is calculated basedon the number of input patterns assigned per class to the nearestneighbours on the self-organizing map during the training phase.”
J. Yousefi, A. Hamilton-Wright / Computers in Biology and Medicine 51 (2014) 1–134

Experiments were carried out on a total of 40 subjects (12healthy, 13 myopathy, and 15 neuropathy) where 20 MUPs wererecorded from each subject. The success rate observed for theindividual feature sets was 69.1%, whereas when combining thesix classifications using a confidence measure, the success raterose to 76.9% for an improvement of “approximately 3%” reported.This study proved that the use of a combination of multiple ANNclassifiers in conjunction with a confidence measure significantlyincreases the overall classification performance. Time domainparameters yielded better results than other parameters. Thisapproach additionally increases the reliability and robustness ofthe system by reducing the error variance of the final result.
Another notable attempt using SOFM for the classification of EMGsignals for diagnosis of neuropathies is presented in [36]. Experi-ments were conducted on a total of 114 subjects of which the data of84 subjects was used for training and that of 30 subjects for testing.Results were then compared with the doctors’ interpretation whereaccuracy and kappa coefficients were computed for each case. (Thekappa coefficient [65] measures the agreement between the categor-izations produced by two different classifiers.)
The classification accuracy varied with the size of the map. Theoptimal map size was between 10�10 and 12�12. Classifierswith lower size achieved accuracy between 70% and 76%, whileclassifiers with higher map size achieved higher accuracy between76% and 83%. This work reported that network control parameters,such as the number of iterations, and neighbour parameters do notimpact classifier accuracy. Conversely it also demonstrated thatadding further input variables increases classifier performance.This study proved that an SOFM neural network is an efficientapplicable model for EMG classification tasks.
Christodoulou and Pattichis [33] proposed two different pat-tern recognition techniques for the classification of EMG signals todiagnose neuromuscular diseases. An unsupervised ANN trainedwith a modified version of the SOFM algorithm and LVQ and astatistical classifier based on the Euclidean distance were devel-oped in this application. Experiments were carried out on a total of1213 MUPs, and 97.6% accuracy was achieved using the ANN, whilethe statistical approach achieved 95.3% accuracy.
The additional use of LVQ improved the classification perfor-mance by defining the class borders. Each input was presented to anetwork only once. Using one learning epoch for training increasedthe performance and speed of the learning process and makes thisalgorithm appropriate for most real-time applications [33].
The statistical approach used Euclidean distance within thefeature space in order to identify and group similar MUPs using aconstant threshold. They also used baseline and slide correction toimprove the accuracy of the statistical classifiers. Baseline and slidecorrection is a technique that measures the significant changes ofthe system compared to the previous states. The threshold valueswere determined heuristically.
Using a constant threshold for classification is one of the draw-backs of the statistical method because it is not flexible enough forEMG signals with high variability. Another disadvantage found withthis statistical approach was that the computational time geome-trically increased with the size of data set. These two disadvantagesresult in a lowering of both speed and accuracy rates for thisapproach compared to using an ANN. This study shows that ANNtechniques are more appropriate for the classification of MUPsbecause of their ability to model complex decision boundaries.
3.1.2. RBN and decision treesKatsis et al. [42] used the combination of RBN and Decision
Trees (DTs) to classify MUP template for the diagnosis of neuro-muscular disorders.
EMG signals were acquired from the biceps brachii muscleunder constant isometric conditions and up to 30% of the Max-imum Voluntary Contraction (MVC) level. The classifiers weretrained on 365 template MUPs obtained from 62 subjects (20healthy patients, 22 neuropathic and 20 myopathic patients).
This approach used a minimal number of tuned parameters,and was able to provide interpretable decisions. This classificationprocess was implemented in two stages. In the first stage, a radialbasis function was employed to classify MUPs into healthy andpathological classes. In the second stage, a decision tree was usedto classify the pathological MUPs into myopathy and neuropathyclasses.
For the first stage, a multilayered probabilistic neural network(PNN, a class of RBN) was trained with heuristically selectedtraining vectors (143 MUP templates) following an iterative trial-and-error method. The input to the first hidden layer was theEuclidean distance between a connection weight w and the inputvalue v, multiplied by a bias b. The second hidden layer presentsthe classification probabilities computed through the summationof the outputs of the previous hidden layer. The final output wasproduced by applying a compete transfer function on the secondhidden layer. This transfer function identifies the labelling withthe maximum probability. Using RBN usually requires a moreneurons than standard feed-forward neural networks (FFNNs) forthe same classification problem. RBN techniques do, however,provide better speed and the performance, when used with asmaller training set.
In the second stage, a decision tree was used to classify thepathological MUPs into myopathy and neuropathy classes. Decisiontrees are able to provide decision interpretation, especially whendealing with the structure of decision rules. Information gain is used asa measure of the effectiveness of the features used. Five feature sets(amplitude, duration, rise-time, area, and number of phases) extractedfrom pathological MUPs were employed as inputs for the training ofthe radial basis function (RBF) network and were used to build thedecision tree. The discrete valued features were dynamically definedbased on continuous feature values. A pessimistic post pruningmethod was then applied on the induced decision tree to avoidover-fitting. In the testing phase, the inputs to the decision tree werethe pathological MUPs classified by the RBN classifier. Thus, thedecision tree classified the pathological MUPs into myopathic orneuropathic. This approach was able to provide interpretable deci-sions. The authors report that this technique achieved 89% accuracy.Decision trees can greatly increase transparency in diagnostic systems,but this approach performs well only when the available features havea high information content. By increasing the number of features, theaccuracy of the decision tree decreased. Also, the greedy characteristicof decision tree construction leads to over-sensitivity to noise and thepossibility of over-fitting the training data.
3.1.3. WaveletsGazzoni et al. [39] proposed an automatic system for the
classification of surface EMG signals to diagnose neuromusculardisorders. Their experiments were performed on MUPs recordedfrom “healthy” and “pathological” subjects.
They used continuous wavelet transform (CWT) for the seg-mentation and a multi-channel ANN that was a modified versionof a multi-channel adaptive resonance theory network (MART) forclassification. MART is an ART-based neural network which com-monly is used as an unsupervised network. The ART2 neuralnetworks use the first example pattern as the template for thefirst cluster. This template then changes when new examples areintroduced to the neural network. Each time a new example is notmatched by any of the stored patterns, a new cluster will becreated. The advantage of a MART neural network is that it reduces
J. Yousefi, A. Hamilton-Wright / Computers in Biology and Medicine 51 (2014) 1–13 5
the influence of noisy channels. One of the limitations of thisapproach is that superimposed MUPs are not classified correctlybecause MUPs are assumed to be non-overlapping.
Subasi et al. [41] developed a wavelet-based neural network(WNN) and compared it against a custom MLP with a back-propagation based learning method for the classification of MUPsto diagnose neuromuscular disorders. AWNN combines advantageof the time–frequency localization characteristic of wavelets andthe learning ability of an ANN into a single unit. They are well-known for their ability to provide fast training through heuristicsand also their capability of handling non-stationary signals [66].Because MUP features have the properties of large variability andlack stationarity, the WNN seems to be an interesting and appro-priate choice compared to other neural network types for MUPclassification.
For the MLP, Subasi used a three layer feed-forward neuralnetwork (FFNN), where the hidden layer employs a dyadic discreteMorlet wavelet basis function as an activation function. They usedthe linear discriminant portion to improve the function approx-imation and train the WNN to approximate only the wave-likecomponents in the function. The input provided to the WNN wasan autoregressive (AR) model of MUPs, and the output nodesrepresented healthy, myopathic and neurogenic disorders.
The FFNN was designed with three layers, and to avoid over-fitting, they used the same number of nodes which were used inthe hidden layer of the WNN. Experiments were carried out on atotal of 1200 MUPs, and 90.7% accuracy was achieved by WNN,while a simple feed-forward back-propagation neural networkachieved 88% accuracy. Therefore, we come to the conclusion thata WNN is a more robust classifier, which can add weight toneuromuscular diagnosis with the use of MUPs. Further, it wassuggested by Subasi that a WNN can handle waveform variabilitybetter than other classifiers.
3.1.4. Other ANN approachesKaur et al. [67] used an ANN model to classify MUPs for the
diagnosis of neuromuscular diseases.The MUPs were extracted using an algorithm that automati-
cally detects and eliminates the areas of EMG signal with lowactivity and possible noise. The candidate MUPs were clusteredusing a statistical pattern recognition technique, where the Eucli-dean distance is used to identify and group similar MUP wave-forms. Then the group average was calculated and used for theclassification of MUPs using a constant threshold. Time domainand auto-regressive features were extracted from the MUP clus-ters. A back-propagation neural network classifier was used toclassify the time domain and AR features of the MUP clusters.Experiments were carried out using 12 subjects: 3 healthy, 5 myo-pathic, and 4 neuropathic. The success rate for the clusteringmethod was 93.13%, while that of the ANN was 66.72% when usingtime domain parameters and 75.06% with AR parameters. Theauthors of the study conclude that the classification accuracy issignificantly higher with the AR features compared to the timedomain features, which is interesting in the context of the WNNsetup used in Subasi et al., above [41].
Bhardwaj et al. [43] proposed an ANN technique based on theSOFM algorithm with LVQ to classify MUPs for the diagnosis ofneuromuscular disorders. This method is implemented in threephases. In the first phase SOFM is used. Then in the second phaseLVQ is applied to increase the performance of the ANN. The actualclassification takes place in the third step. Experiments werecarried out on a data set consisting of 11 subjects (2 healthy,4 myopathic, 5 neuropathic). The success rate for this techniquewas 97.6%.
Shaw and Bagha [44] proposed using principal componentanalysis (PCA) a technique for feature extraction, followed by aprobabilistic neural network (PNN) technique for classification ofMUPs for the diagnosis of neuromuscular disorders. PCA is a usefulstatistical technique for pattern recognition in high dimensionaldata spaces. PCA can be used as a nonlinear dimensionalityreduction technique, because it can reduce a large set of correlatedvariables into a smaller set of uncorrelated variables [68].
PNN is a supervised ANN that implements a Bayesian decisionstrategy for classification, called kernel discriminant analysis. InShaw and Bagha's work, a four-layer PNN was employed. The PNNtraining process is faster than the back propagation method, andthe convergence to an optimal classifier is guaranteed as the sizeof training set grows. Additionally, a PNN can overcome the localminima issue. An average accuracy of 91.72% was achieved using aPNN. This study shows that the selection of network inputparameters is an important factor in classification performance.
Acevedo and Mogollon [45] used a PCA method for featureextraction and a PNN for classification of a set of MUPs of patientswith foot drop. The results were then compared to those of anMLP. The experiments were carried on a set of MUPs extractedfrom EMG signals acquired during isometric contractions in thetibial anterior muscles. In total 60 EMG signals recorded from 12subjects were used for experiments. PCA and PNN each achieved ahigher degree of accuracy for classification of healthy (94.3%) andinjured cases (68%) compared to MLP with the accuracy of (60%)for healthy and (64%) for injured. However this work showspromising results from both neural networks, but the author doesnot mention what features extracted from MUPs have been used.
ANN models are not transparent because they do not revealhow they reach their conclusions. The large number of neuronsmeans that a large number of arithmetic operations are used totransform the features making ANNs essentially black box classi-fiers. Studying a large number of models proved that the learningof a training set does not guarantee successful diagnostic beha-viour when using an evaluation set.
3.2. Fuzzy systems
Since the early 1990s, more attention has been given to fuzzysystems. Fuzzy systems can be used for both function approxima-tion and pattern classification applications. Fuzzy rule-basedclassification systems have been successfully applied in both thesedomains, providing high explanation ability for the input/outputdata behaviour [69].
Chauvet et al. [46] proposed a fuzzy logic method for decom-posing an EMG signal into its constituent MUPs (72.4%). Thealgorithm was evaluated on both sEMG and needle EMG data.The rate of successfully classified MUP for EMG signals was 88.4%and for sEMG, the algorithm identified correctly 21 out of 29 MUPstested.
Rasheed et al. [47] proposed an adaptive fuzzy k-NN classifier(AFNNC) for EMG signal classification for neuromuscular diagno-sis. The results for the AFNNC classifier were compared with itsadaptive certainty classifier (ACC) counterpart. The AFNNC classi-fier generalizes the k-NN classifier, assigning a fuzzy membershipfunction to each input pattern. The AFNNC uses fuzzy nearestneighbours to estimate the membership function. The combina-tion of MUP shapes and two modes of MU firing patterns (passiveand active) is used to determine the similarity criterion forgrouping MUPs.
The AFNNC has the advantage of dealing with vagueness anduncertainty, as well as providing a confidence measure with respectto the classification results. The mean performance for AFNNC was96.6% and for the ACC it was 86.9%. Increasing data set size resultedin higher classification accuracy for AFNNC. This study shows that
J. Yousefi, A. Hamilton-Wright / Computers in Biology and Medicine 51 (2014) 1–136
the AFNNC model performs better than the ACC when the varia-bility of MUP shapes within MUP trains was high. It also shows thatthe k-NN assignment model has the ability to improve the classi-fication accuracy for unstable MUPs.
Disselhorst-Klug [48] used a fuzzy approach for classification ofhigh-spatial-resolution-EMG (HSR-EMG) signals for the diagnosisof neuromuscular disorders. Seven features extracted from HSR-EMG signals were used for classification. These features aredivided into three groups regarding the excitation spread, theentire signal course in time as well as the shape of isolated peakswithin the signal.
Different weighting factors were used, each with a range of½0⋯50� to control the contribution of each feature to the classifica-tion result. The weighting factors were then optimized by classify-ing a training data set generated with a specially developedmuscle model. The training data set consisted of different HSR-EMG signals simulated using muscle structures with no patholo-gical changes, muscle structures where a loss of muscle fibres hadoccurred (muscular disorders or myopathies), and muscle struc-tures where a loss of entire MUs had occurred (neuronal disorders– neuropathies).
As part of the performance of the fuzzy classification process,all parameter values are initialized to a mean of zero and a unitvariance. Starting the classification process, three clusters repre-senting the groups “neuronal disorder,” “muscular disorder” and“healthy” are defined using a hierarchical clustering process suchas the nearest-neighbour algorithm. Each HSR-EMG signal isassigned to the cluster with the highest membership-value. Thetraining data set was classified with all possible combinations ofweighting factors.
The optimal combination of weighting factors was selectedwhen the classifier achieved the highest classification accuracy.
Disselhorst-Klug's fuzzy approach correctly classified 100% ofall healthy subjects, 100% of all subjects with muscular disorders,and 87% of all subjects with neuronal disorders. On average, in 97%of all investigated children the diagnosis by means of the non-invasive HSR-EMG was correct, however there is a strong bias inerrors toward neuromuscular disorders.
This study shows that the diagnostic selectivity of HSR-EMGsignals falls into the same range as, and could even exceed theselectivity of, commonly used needle EMG techniques, though theHSR-EMG methodology is limited to superficial muscles and MUs.Clearly, this approach has achieved promising results.
3.3. Hybrid systems
EMG signals have the properties of non-stationary and largevariability of features within each class [70]. The variability of thesignal is in part due to the existence of redundancy in theneuromuscular system, which cause many combinations of muscleactivity to produce the same movements. Hence whether the EMGsignals are recorded from one subject for different tasks, or fromdifferent subjects within the same task, this variability will beobserved [71]. It is difficult for a single network to learn non-stationary data such as EMG signals, because of local minimaproblems, and vagueness within the data and its classification.
3.3.1. Neuro-fuzzy systemsA neuro-fuzzy system (NFS) is a combination of a fuzzy system
and an ANN that incorporates the advantages of both methods.Both ANNs and fuzzy systems have some disadvantages, howevertheir combination can overcome drawbacks present in eachapproach.
An NFS takes the advantage of the “learnability” of the ANNand the capability of fuzzy reasoning in dealing with imprecise
information. One of the most important advantages of a NFS is thatthe knowledge of experts can be incorporated in the fuzzylinguistic rules of the system. This advantage is a significant oneover the ANN. Classifiers based on fuzzy logic can potentially bemore robust in comparison with ANNs. Recently, using NFSapproaches for EMG classification has been of interest for manyresearchers.
Koçer [35] used an NFS classifier to classify EMG signalsobtained from 177 subjects. The main characteristic of thisapproach is including AR analysis coefficients of an EMG signal.A special three layer MLP was employed. The rule learningalgorithm was fed by an initial fuzzy sets for each input node. Asimple heuristic method was used for tuning the membershipfunctions. Rule pruning and variable pruning methods wereapplied to the rule base in order to improve the accuracy of theclassifier. Experiments were carried on for a group of 177 subjectsincluding 60 myopathic, 60 neuropathic, and 57 healthy subjects.An accuracy of 90% was achieved. This study shows that classifica-tion accuracy is highly dependent on the number of rules. Theexperiments showed that pruning fuzzy rules and variables sig-nificantly improve the accuracy of the classifier. This study con-firmed that the application of AR coefficients of EMG signals inneuro-fuzzy systems produce a new and reliable classificationsystem for neuromuscular diagnosis.
3.3.2. Fusing classifiersIt has been proven that a combination of the outputs of many
different neural networks can be a powerful technique to improveclassification accuracy [72]. The reason this occurs is because eachnetwork makes generalization errors on different subsets of theinput space, and these errors cancel out in aggregation with otherclassifiers. There are different techniques of combining severalneural network outputs into an aggregate output, such as majorityvote or fuzzy integrals.
Xie et al. [50] have used a hybrid decision support system basedon fusing multiple ANN outputs to utilize multiple feature sets toimprove the accuracy of neuromuscular diagnosis.
The fuzzy integral approach was used to combine the outputsof three back propagation neural networks. Experiments werecarried out on a group of 80 subjects consisting of 20 healthy, 30myopathic, and 30 neuropathic participants. The fuzzy integralmethod, with 88.58% accuracy, outperformed majority voting by8.58%. Also it outperformed all the individual classifiers by 14.29%,34.29% and 25.72% for time domain features, AR coefficients, andcepstral coefficients, respectively. This study proved that applyinga hybrid method to multiple feature set can produce more accurateand reliable diagnosis results compared to the use of an individualclassifier and a single feature set. The study also reported that thefuzzy integral method can achieve higher accuracy compared tomajority voting. An important practical question in the design of thefuzzy integral classifier is the selection of the fuzzy measures, whichis an integral part of the classifier, so performance is directly relatedto this choice.
3.3.3. Other hybridsIn [49], Pattichis and Schizas proposed a hybrid approach
which combines an ANN and a genetics-based machine learning(GBML) algorithm for classification of EMG signals for diagnosingneuromuscular disorders.
Several GBML control parameters including message length size,number of classifiers, “lifetax”, the period of genetic algorithm (GA),crossover probability, and mutation probability were used to buildthe GBML model. The period of GA is expressed in iterations,showing how often the classifier system calls the genetic algorithm.More than a thousand GBML models were developed using different
J. Yousefi, A. Hamilton-Wright / Computers in Biology and Medicine 51 (2014) 1–13 7
combinations of all parameters. A total of 28 models were selectedthat achieved a diagnostic yield better than 95% and 70% for thetraining and evaluation sets, respectively.
This study showed that a GBML model is a promising classifica-tion method in a clinical study.
Pattichis and Schizas also investigated the effect of differentfactors such as architecture, gain, and momentum on the perfor-mance of a back propagation neural network [49].
Experiments were performed on 680 MUPs collected from 12healthy participants, 11 with motorneuron disease, and 11 myo-pathic subjects. Each subject was described by a 14-elementfeature vector consisting of the mean and the standard deviationof each of the following MUP parameters: duration, spike duration,amplitude, area, spike area, phases, and turns. GBML models, backpropagation neural networks, and the SOFM achieved similardiagnostic performance of the order of 80%. Pattichis reports thatmodels with small architectures require more epochs duringtraining, and thus more computation cost, while for models withbigger architectures, the number of epochs and training time arereduced. The SOFM model had the lowest computational costcompared to the back propagation and the GBML algorithms. Thediagnostic performance of the neural network and GBML models isenhanced by the hybrid system, hence using two learning princi-ples together makes this model more robust and reliable fordiagnostic tasks.
3.4. Support vector machine (SVM)
SVMs are a remarkably robust classification method in diseasediagnosis. Katsis et al. [73] suggested a SVM classifier for theclassification of individual MUPs from intramuscular EMG signals.
A one-against-one method was used to train the classifier, inorder to deal with the problems with more than two classes. Itconstructs kðk�1Þ=2 classifiers (where k is the number of classes)and each classifier is trained using data from two classes. Para-meters were chosen heuristically.
An experiment on 231 MUPs led to an accuracy of 86.14%. Thiswas 9% higher than the closest other classifier tested. Results showthat SVM improves classification accuracy. Two advantages ofthese works were that tuned parameters and data driven calcula-tion were minimized. Advantages of using SVMs include the lowtraining time required and also their comparable performance.
Koçer and Guler [40] proposed using the MLPs and SVMs toclassify EMG signals into healthy, myopathic, and neuropathic. Theresults for the SVM classifier were compared with its MLPcounterpart. The SVM classifier with 92.3% accuracy outperformedthe counterpart MLP classifier with an accuracy of 91.6%. It wasshown that the SVM accuracy is high in comparison with the MLP.Some drawbacks for SVMs are the complexity of the selection ofthe kernel function, and the speed and size of the classifiers bothduring training and testing [74].
In addition, the extensive memory requirements during thelearning process when trained with large data set is a major issuewith SVMs [75], however once training is completed, SVMsoperate in a very efficient manner.
Reducing the dimensionality of the data while retaining themaximum amount of variability present in the date set can help todevelop more accurate classification methods. The fast Fouriertransform (FFT) and principal component analysis (PCA) are twocommon methods for producing the frequency spectrum of EMGsignals [40]. In several EMG signal studies, FFT parameters havebeen used as feature sets. The FFT parameters are ranked based ontheir variance, hence they reflect the importance of each featurewith respect to their ability to capture variations of the originaldata set [40].
PCA extracts the features with reduced dimensionality bycomputing the eigenvalues and eigenvectors of the covariancematrix. Hence PCA with its ability to reduce dimensionality of thedata is widely used in pattern recognition applications.
Guler and Koçer [40] investigated using FFTs and PCA forclassification of EMG signals. The EMG signals were recorded frombiceps and hypothenar muscles of 59 subjects (19 healthy, 20neuropathic, and 20 myopathic). The FFT analysis was applied toeach EMG signal in order to break down a signal into differentsegments and estimate the spectrum of each segment. FFTproduced a large number of coefficients, which were then reducedby PCA. PCA coefficients were then used as input parameters totrain and test SVM and MLP classifiers. Using PCA parametersreduced the computing expense and improved the performanceand speed of the classifiers.
The results of both classifiers were very similar. The SVMclassifier obtained an 82.45% accuracy, showing a higher perfor-mance in the diagnosis of neuromuscular disorders compared tothe MLP. This study shows that SVMs can have significantadvantages over MLPs. Regardless of initial conditions or dataset, the SVM algorithmwill converge to a solution that is not proneto overfitting problems; moreover, SVMs can handle classes withcomplex nonlinear decision boundaries.
Kaur et al. [51] developed a multi-class SVM classifier to classifyEMG signals for the diagnosis of neuromuscular disorders. Theyused a statistical pattern recognition technique for clusteringMUPs and the one-against-all strategy to adapt the SVM for themulti-class problem. A number of SVM models were constructedequal to the number of classes.
The experiments were run on 12 EMG signals collected from5 myopathic, 4 neuropathic and 3 healthy subjects. The highestsuccess rate, 96.07%, was reported for clustering MUPs with thestatistical approach and an accuracy of 100% was reported for theSVM classifier.
In [52], Kaur et al. developed a binary SVM classifier to classifyEMG signals to diagnose neuromuscular disorders. First, a binarySVM classifier was used to classify the healthy subjects and thesubjects with disease. If the signal was classified as diseased, thenanother binary classifier was used to classify myopathic andneuropathic signals. The analysis was completed using 12 EMGsignals obtained from 3 healthy, 5 myopathic and 4 motor neurondiseased subjects. The means and standard deviations of thefeature values of each subject were computed as the input featurevector of the binary classifier. Using autoregressive features hasthe advantage of reducing the amount of data needed and totalprocessing time. The accuracy reported for this model was 100%.
Although a 100% accuracy is reported in this work, the smalldata set size (12 signals, used for both training and testing)indicates that further evaluation of these techniques may be inorder, and raises the question of whether over-fitting has occurredthat was not identified by the testing procedure.
Subasi [57] compared six machine learning classification meth-ods to classify EMG signals into healthy, myopathic, and neuro-pathic. They suggested using a fuzzy support vector machine(FSVM) classifier combined with statistical features extractedusing discrete wave transforms (DWTs). The results were com-pared with those of linear discriminant analysis (LDA), MLP, RBN,C4.5 decision tree, and SVM classifiers.
In order to decrease the dimensionality of the input space, fourstatistical features calculated over the set of the wavelet coeffi-cients were used. A FSVM is an extension to a SVM with a fuzzymembership function [76]. The theory behind FSVMs is that everyinput point can contribute to the decision making task. The mainadvantage of FSVMs is using membership functions instead offixed weights, which produce narrower margins, thereby betterrepresenting noisy data.
J. Yousefi, A. Hamilton-Wright / Computers in Biology and Medicine 51 (2014) 1–138
This study was conducted using EMG signals from 27 subjects,including 7 healthy, 7 myopathic, and 13 neuropathic subjects. Theresults for the FSVM classifier were 3% better than the othermethods. This study confirms the importance of the selectedfeatures with regard to the EMG classification accuracy, as statis-tical analysis was performed during training to evaluate theprovided features in order to compensate for noisy data.
The results show that FSVMs can provide superior performancecompared to all of the other classifiers tested with regard to atleast three points: classification accuracy, reliability, and insensi-tivity to over-fitting. Internal cross validation based on AUC,defined as the area under the received operating characteristic(ROC) curve, was used to assess the accuracy of the classificationmethods. A FSVM using DWT features achieved a higher classifica-tion success rate for internal cross validation with AUC andaccuracy equal to 99.6% and 97.67%, respectively. This study showsthat a FSVM using DWT features has the potential to become apromising classification method for EMG signals in neuromuscularpathology.
Istenic et al. [53] proposed a SVM classification approach toclassify surface electromyograms (sEMGs) for the diagnosis ofneuromuscular disorders. The sEMGs were recorded from bicepsbrachii muscle of 9 healthy, 9 myopathic, and 9 neuropathicsubjects.
40-dimensional vector of entropies were extracted from eachEMG signal and used as input to the classifier. Leave-one-outcross-validation was used for binary classification (healthy/patient) and three-class classification (healthy/myopathic/neuro-pathic). The accuracy for binary classification was 81.5% (77.8%sensitivity at 83.3% specificity). For three-class classification, theaccuracy decreased to 70.4% (myopathies were recognized with asensitivity of 55.6% and a specificity of 88.9%, neuropathies with asensitivity of 66.7% and a specificity of 83.3%). This method issuitable for distinguishing between healthy and neuromuscularpatient, but it fails to classify the type of neuromuscular pathology.
Tomczykiewicz, Dobrowolski and Wierzbowski have proposed anSVM based technique based on wavelets used for feature extractionand SVMs for the classification of neuromuscular disorders. Thistechnique has been evaluated on two pools of data [54,55]. Theanalysis of scalograms determined by the Symlet 4 wavelet techniquewas used for feature extraction. For feature extraction, first thescalograms in 5 selected scales were calculated for each individualMUP. Then a single 5-dimensional feature vector per subject wascalculated by taking the maximum values of the scalograms in the5 selected scales, and averaging across the MUPs. The 5-dimensionalfeature vector per subject then will be used as a data set for the SVMclassifier. Because a single SVM classifier is able to distinguishbetween only two classes, two SVM classifiers were used to dealwith the three-class problem. The first classifier separated themyogenic cases from other cases (i.e., neurogenic and healthy), whilethe second one separated the neurogenic cases from other cases (i.e.,myogenic and healthy). The third (healthy) case was to be distin-guished based on negative outputs of the two classifiers. In a rarecase identified by the authors, both classifiers might produce positivevalues for a case, when that case belongs to both myogenic andneurogenic classes at once.
One set of experiments used training data consisting of 800EMG signals collected from deltoid muscle of 300 subjects. Threefeatures including duration, amplitude, and area were extractedfrom each MUP. For validation, they used MUPs acquired fromthree other muscles including the 1st dorsal interosseous, vastuslateralis and tibialis anterior from the same subjects. This methodyielded the accuracy of 99.4%. The sensitivity at 100% of specificityamounts to 98.4% for myogenic cases and to 98.7% for neurogenicones. The results demonstrated high accuracy in discriminationbetween pathological and non-pathological cases.
This group performed another set of experiments on a varietyof muscles [55] using 1015 EMG signals obtained from deltoid, firstdorsal interosseous, vastus laterals, and anterior tibial, gatheredfrom a total of 433 subjects including 362 neurogenic and 71myogenic cases. A total of 8660 MUPs were obtained from theEMG signals used in this set of experiments. The same threefeatures used above (duration, amplitude, and area) were againused here. The average value of each set of the features over allMUPs for an individual muscle was calculated and compared withthe exemplary feature value ranges to classify the muscle asnormal, myogenic, or neurogenic. This study yielded 99.3% diag-nostic accuracy, specificity of 100% and sensitivity of 98.6% formyogenic muscles and 98.4% for neurogenic muscles.
The authors noted that the greatest advantage of this method ishigh accuracy and simplified diagnostic process. The other advan-tages of this method are its capability in dealing with large datasets, as well as its flexibility and adaptability to new information.This method easily can be adjusted and retrained with new, up-to-date clinical data and EMG signals obtained from other muscles. Itcan also be effectively used in analysis of difficult boundary cases.The author suggested considering other features such as thenumber of turns, number of phases, spike duration, thickness,and size index in uncertain cases.
The use of SVMs generally provides strong generalization withoutunder-fitting or over-fitting. Despite exhibiting high classificationaccuracy, this method has some disadvantages such as a highcomputational complexity and a general lack of transparency.
Subasi [58] proposed a novel particle swarm optimization andSVM (PSO-SVM) model to classify EMG signals into healthy,neurogenic or myopathic. They used a hybridization of PSO andSVM to improve the classification accuracy. The experiments wereconducted on EMG signals acquired from 27 subjects. Data wererecorded from 7 healthy subjects, 7 myopathic subjects and 13subjects suffering from a neurogenic disorder. They achieved96.75% accuracy for the SVM classifier, based on the RBF kernel,94.08% for the RBN classifier, and 95.17% for the k-NN classifier.The results for the SVM based on the RBF kernel were better thanthose achieved by the RBN and the k-NN classifiers. Theseexperiments confirmed that a SVM based on the RBF kernel issuperior, when compared to RBN and k-NN, with respect tostatistical features of EMG signals.
Kamali et al. [77] proposed a novel approach using a serial/parallel hybrid architecture of multiple SVMs classifiers for classi-fication of MUPs into myopathic, neuropathic, and normal classes.This model consists of several base classifiers which take nine timedomain features including rise time, duration, spike duration,peak-to-peak amplitude, area, phases, turns, thickness, peak-to-peak samples number, and time–frequency domain features ofMUPs extracted from EMG signals. Three different classifiersincluding single classifier (SC), multiple classifiers multiple fea-tures best voting (MCMFBV) and multiple classifiers multiplefeatures all voting (MCMFAV) were used. The base classifiers havebeen arranged in a novel efficient way. The classification accuracyof those three classifiers was compared to a support vectormachine (SVM) classifier with Gaussian radial basis function(RBF) kernel, developed by Vladimir [78]. Multi-classifiers areextension of standard SVM classifiers trained with a sigmoidfunction. The multi-classifier uses class label of each MUP andmaps the SVM outputs to the class posterior probabilities. In aMCMFAV classifier system, a modified majority voting and aweighted majority voting were used. For majority voting all ofthe base classifiers are contributed in the decision making processabout a given MUP but the final decision made using a modifiedmajority voting. For the weighted majority voting, the morecompetent/confident classifiers are given more power in makingthe final decision [77].
J. Yousefi, A. Hamilton-Wright / Computers in Biology and Medicine 51 (2014) 1–13 9

Kamali et al.'s study [77] showed that multi-classifiers with anaverage accuracy of 97% achieve significantly higher accuracy com-pared to a single SVM-based classifier with 88% accuracy. The aim ofthe author is the production of a model that will be appropriate forother pattern recognition applications through its ability to divide acomplex decision into several detailed decisions where the input ofeach decision node can be separately optimized.
Using a SVM is one of the most accurate classification models,but it has some drawbacks. The main challenge in using SVMs isthe selection of an appropriate kernel, and this is of greatimportance in the performance of the classifier. Another drawbackis the selection of the speed and size of the classifiers both intraining and testing [74]. Further, the high algorithmic complexity,extensive memory requirements [75], and lack of transparency areother major issues of SVM.
3.5. Other methodologies used
Keleş and Subaşi [56] implemented a decision tree classifier forclassification of EMG signals for the diagnosis of neuromusculardisorders. The “consistency subset evaluator” and “principal com-ponent” feature selection methods were used to increase themodel performance, speed, transparency, and to avoid over-fitting problems. Four decision tree algorithms, namely CART,C4.5, random forest and random tree, were analyzed for theclassification task. The data set of 129 features extracted fromEMG signals was used to evaluate the model. The analysis wasapplied to MUPs collected from 27 subjects (including 7 healthy,7 myopathic, 13 neuropathic).
The random forest decision tree classification algorithm, com-bined with the “consistency subset evaluator,” provided 99.25%accuracy and was the most successful classifier. The C4.5, randomtree and the simple CART classification algorithms applied withoutusing feature selection obtained similar accuracies between89.82% and 96.25%. This study showed that the random forestclassification algorithm using the “consistency subset evaluator”feature selection method gave the best accuracy. Other algorithmsachieved better accuracy when used without any feature selectionmethod. This study also suggests that the “principal component”method was the worst option for feature selection evaluated, as itdecreases the accuracy of classifiers by 7%.
Pfeiffer and Kunze [28] used a multivariate discriminant algo-rithm for classification and the principal component analysismethod for feature extraction to characterize MUPs. The resultswere compared with a bivariate discriminant algorithm. In thismethod MUPs are classified by their discriminant scores in twophases. At first, a 2-group discriminant with one discriminantscore was used to determine whether a muscle was diseased ornot. Then a 3-group discriminant with two discriminant scores perMUP was used to distinguish myopathic, neuropathic, and healthycases. The conditional probability of a MUP was calculated basedon the Euclidean distance of the MUP to the centroids of therespective discriminant score distributions. A MUP belongs to thedisease type with the highest conditional probability. Two meth-ods were used to predict muscle classification: the class containingmost MUPs and the class with highest mean or median posteriorprobability.
The analysis was applied to 2323 MUPS collected from 108biceps brachii, 2961 MUPS from 128 tibialis anterior musclesand 1544 MUPs from 66 rectus femoris muscles. Five featuresextracted from MUPs including duration, amplitude, area, turnscount and centre frequency. This study showed that multivariatediscriminant analysis with an accuracy of 74.4% achieves signifi-cantly higher accuracy compared to bivariate discriminant func-tion with 60.9% accuracy. One of the disadvantages of this method
is the bias caused by the equal prior probability assumption forthree cases.
Kaur and Singh [79] proposed a statistical technique forclassification of the real time recordings from myopathic, motorneuron disease and healthy cases. A statistical pattern recognitiontechnique also based on Euclidean distance was used for classifi-cation MUPs into three different classes. The author mentionedthat the results were found to be satisfactory as comparedwith the available literature, however the accuracy has not beenreported.
Pino and Stashuk [80] used four methods to characterize a setof MUPs into normal, myopathic, and neuropathic cases. The fourmethods include pattern discovery (PD), linear discriminant ana-lysis with minimum Euclidean distance (LDA MED), LDA withgeneralized Euclidean distance (LDA GED) and naïve Bayes (NB).They measured the correlation between muscle characterizationand the corresponding level of involvement of a disorder. Tomeasure this relationship, EMG signals acquired through variouscontractions of several different muscles with different levels ofinvolvement , and decomposed using QEMG into MUP templates.Seven features including amplitude, duration, area, number ofphases, number of turns, size index (SI), and thickness wereextracted from MUP templates. Mean and standard deviation offeatures were used as inputs to the classifiers.
Experiments were conducted using 1500 MUPS including 500MUPs from normal muscle, 500 from myopathic muscle and 500from neuropathic muscle with 25%, 50% and 75% disease involve-ment. PD, NB and LDA GED achieved a similar accuracy of 96%. LDAMED with 93% achieved lowest accuracy. LDA that exhibitedinconsistent behaviour across different feature sets was deemednot appropriate to determine the level of disease involvement.This study showed a direct relationship between the characteriza-tion measure and the level of disease involvement.
Hamilton-Wright et al. [24] used a Bayesian aggregationclassifier to characterize a set of MUPs collected together fromthe same muscle. They assumed that MUP parameters haveGaussian distribution. The study was applied to MUPS collectedfrom 57 subjects including (17 with symptoms of non-specific armpain and 40 healthy). Each subject was described by featurevectors consisting of the mean and the standard deviation of eachof the MUP parameters: amplitude, duration, phases, turns, area/amplitude ratio, inter-discharge rate, firing rate, and mean MUvoltage. Three classifiers were implemented and compared. First,each individual MUP was classified independently using a Baye-sian normal density discriminant function classifier, and theresults were used as the baseline. In the second stage, MUPs fromthe same muscle were classified using a Bayesian probabilisticaggregation model to produce muscle-level characterizationresults. In the third stage, a majority voting was used to aggregateresults for the set of MUPs collected from the same muscle. Theresults show that the Bayesian aggregation and voting classifica-tion of MUPs achieves quite similar accuracy. The author alsonoted that the distribution underlying EMG data may be signifi-cantly different from a Gaussian normal distribution [24].
4. Discussion
In this paper, a detailed review of the common methods ofclassifying EMG signals for the diagnosis of neuromuscular dis-orders have been presented. All of the papers cited are presentedin Tables 1 and 2, grouped by classifier type, and annotated bytheir classification performance and year of publication.
The survey shows that using an ANN is the most popularclassification method (measured by the number of implementations),for the classification of EMG signals [12,31,33,36–39,41,43,44].
J. Yousefi, A. Hamilton-Wright / Computers in Biology and Medicine 51 (2014) 1–1310
There are several different models of ANN that were usedincluding multi-layer perceptron NN (MLP), feed forward NN(FFNN), modular NN (Mod NN), recurrent neural network, self-organizing feature maps (SOFMs), and probabilistic NN (PNN).Applying an appropriate learning algorithm is very importantfactor to achieve higher accuracy. For example, back-propagationsuffers from long learning times, especially when the data set islarge, and it also suffers from poor learning-discrimination per-formance in EMG classification due to the high variability in theEMG data. SOFM can overcome these drawbacks.
As a consequence of this review it can be realized that theaccuracy of the ANN models can be enhanced by using the SOFMlearning method combined with LVQ [31,33,43], for example theSOFM combined with LVQ [43] can yield 97.6% accuracy. Theadditional use of LVQ improves the classification accuracy bydefining the class borders [33]. Also, the SOFM model has thelowest computational cost compared to the back propagation andthe GBML algorithms [49].
Results obtained by Abel et al. [31] and Katsis et al. [12]demonstrate that using RBF networks usually requires moreneurons than required by the standard FFNN for the sameclassification problem. Although, RBN increases the speed of theclassifier with a smaller training set, the reported classificationaccuracy in most studies is higher when using standard FFNNs.
Furthermore, a WNN [41] with sufficient accuracy (90.7%) andspeed was found to be one of the strongest techniques amongANNs to provide clinically useful information. Also a WNN canhandle waveform variability better than other classifiers. To date,however, not enough research employing WNNs for EMG classi-fication in neuromuscular pathology has been completed to allowa general statement to be made.
Based on the accuracy reported by Pattichis et al. [37], Pattichisand Schizas [49], and Kaur et al. [52] using mean and standarddeviation values of EMG parameters as input to a neural networkcontributes significantly to the learning process.
Using fuzzy logic for EMG classification [46–48] can greatlyimprove transparency of the system. The main weakness of thisapproach lies in the relatively weak learning capabilities of fuzzysystems. Hence the rules must be built using existing domainknowledge.
Constructing fuzzy rules directly from domain knowledge isa very difficult task for human experts if it involves high-dimensional feature spaces, because humans have difficulty inprocessing data problems based on more than three-dimensions.This is of interest in QEMG data, as machine-generated rules cansupplement and extend the expert domain knowledge available.
Decision trees [42,56,57] can greatly increase transparency of adiagnostic system, but this approach performed well only with afew highly relevant feature sets. By increasing the number offeatures the accuracy of a decision tree will be decreased. Also thegreedy characteristic of a decision trees leads to oversensitivity tothe training set and to noise.
In all studies examined [42,44,45], PNNs achieved higheraccuracy compared to the standard neural networks. The PNNtraining process is faster than the back propagation method, andconvergence to an optimal classifier is guaranteed as the trainingset size increases. PNN design can additionally overcome the localminima issue. PNN models are derived from a Bayesian networkand therefore they require unrealistic simplifying assumptions.Also PNNs are slower than a multilayer perceptron in classifyingnew cases. The other disadvantage of a PNN is that it requires alarge amount of memory space to store its model.
Using a SVM is the second most popular model for classifyingEMG signals for neuromuscular pathology [12,40,51–53,57,58].The ability to generalize beyond the training examples is the mainadvantage of SVM classifiers [74]. Applying a SVM method assures
the best generalization capabilities based on the given trainingdata set and generally results in classifiers that are insensitive toover-fitting problems.
The highest accuracy reported using a SVM was 99.4%, obtainedusing a wavelet-SVM classifier [54,55]. The average accuracy rateusing a SVM approach was 93%. The recent novel approach bySubasi [58] obtained a 96.75% accuracy rate by using PSO com-bined with SVM.
The highest level of accuracy among all the papers reviewedwas 100% reported by Kaur et al. [51,52] using a SVM classifier.This success rate is impressive, however the small size of the dataset used in this work is insufficient to be representative of the realworld problem. Also, training on such a small size data set issubject to over-fitting.
Despite their high degree of accuracy, the ANN and SVM modelssuffer from lack of transparency which is an important factor in thesuccess and acceptance of a clinical decision support system.
A FSVM classifier using DWT features [57] has the potential tobecome a promising approach for classification of EMG signals.This approach is superior to its counterparts including multilayerneural networks, radial bases function NN, decision trees and SVMclassifiers in respect to classification accuracy, reliability, andinsensitivity to over-fitting. The main advantage of a FSVM is theuse of a membership function instead of fixed weights, whichproduces narrower margins, thereby removing noisy data.
Hybrid systems such as the fuzzy integral combination of theoutputs of multiple ANNs [50] and neuro-fuzzy system [35] withaccuracy rates between 95% and 98% were found by the authorscited here to be the most efficient methods in terms of accuracyand transparency for EMG classification.
Hybrid systems not only may yield high accuracy, but also canprovide transparency which is an important requirement fordiagnostic clinical decision support systems [33,81–83].
Some drawbacks of neuro-fuzzy systems are over-fitting, inter-pretability and time complexity. Neuro-fuzzy systems generate alarge number of rules with relatively low significance levels whichlead to over-fitting. The large number of rules additionally leads topoor knowledge interpretation. Hybrid systems may potentiallyprovide a promising classification method if they combine with arule selection method that can select the most representativefuzzy rules.
5. Conclusions
The review demonstrates that ANNs and hybrid neural net-works play important roles in EMG classification and yield highaccuracy results. Back-propagation generally leads to high accu-racy results, but it suffers from poor learning-discriminationperformance in EMG classification due to the various noise signals.WNNs with sufficient accuracy and speed were found to be one ofthe most ideal techniques to provide clinically useful information.
Onemay also note, based on the materials reviewed, that a SVM isan appropriate model for multi-class classification and, therefore, is astrong candidate for neuromuscular diagnosis, however there remainsignificant challenges. While selecting a kernel for a SVM is a difficulttask, the main disadvantage of the SVM, ANN and WNN approachesis the near-total lack of transparency.
A NFS approach has the potential to become a promisingclassification method if it is combined with a rule selection methodthat can select the most representative fuzzy rules. In addition, thistechnique has very promising transparency possibilities.
Conflict of interest statement
None declared.
J. Yousefi, A. Hamilton-Wright / Computers in Biology and Medicine 51 (2014) 1–13 11
Acknowledgements
The authors gratefully acknowledge the support of NSERC, theNational Sciences and Engineering Research Council of Canada, forsupport through grant 341486.
References
[1] M.H.Y. Raez, Techniques of EMG signal analysis: detection, classification andapplications, Biol. Proced. Online 8 (2006) 11–35.
[2] W.F. Brown, C.F. Bolton, M.J. Aminoff (Eds.), Neuromuscular Function andDisease, W.B. Saunders, Philadelphia, 2002.
[3] M.J. Aminoff, Electromyography in Clinical Practice: Electrodiagnostic Aspectsof Neuromuscular Disease, 2nd edition, Churchill Livingstone, New York, 1987.
[4] J.V. Basmajian, C.J. De Luca, Muscles Alive: Their Functions Revealed byElectromyography, 5th edition, William & Wilkins, Baltimore, 1985.
[5] E.R. Kandel, J.H. Schwartz, T.M. Jessell, Principles of Neural Science, 4th edition,McGraw-Hill, New York, 2000.
[6] T.J. Doherty, D.W. Stashuk, Decomposition-based quantitative electromyogra-phy: methods and initial normative data in five muscles, Muscle Nerve 28 (2)(2003) 204–211.
[7] D.W. Stashuk, W.F. Brown, Quantitative electromyography, in: W.F. Brown, C.F.Bolton, M.J. Aminoff (Eds.), Neuromuscular Function and Disease, W.B.Saunders, Philadelphia, 2002, pp. 311–348.
[8] D.W. Stashuk, L. Pino, A. Hamilton-Wright, T. Doherty, S. Boe, Interpretation ofQEMG data, in: Proceedings of the 2007 General Meeting of the AmericanAssociation of Neuromuscular and Electrodiagnostic Medicine, AANEM '07,AANEM, Phoenix, 2007.
[9] K. Akaboshi, Y. Masakado, N. Chino, Quantitative EMG and motor unitrecruitment threshold using a concentric needle with quadrifilar electrode,Muscle Nerve 23 (2000) 361–367.
[10] C. Bischoff, K. Bett, B. Conrad, Comparison of reliability of different algorithmsused for quantitative computer assisted motor unit action potential analysis,Electroencephalogr. Clin. Neurophysiol. 103 (1) (1997) 220, http://dx.doi.org/10.1016/S0013-4694(97)89065-0 220(1).
[11] S. Boe, D.W. Stashuk, T. Doherty, Within-subject reliability of motor unitnumber estimates and quantitative motor unit analysis in a distal andproximal upper limb muscle, Clin. Neurophysiol. 117 (3) (2006) 596–603,http://dx.doi.org/10.1016/j.clinph.2005.10.021.
[12] C.D. Katsis, D.I. Fotiadis, A. Likas, I. Sarmas, A novel EMG decompositionmethod that discovers the number of MUAP clusters, in: Proceedings of the2nd European Medical and Biological Engineering Conference EMBEC 2002,Vienna, Austria, 2002, pp. 400–401.
[13] D.W. Stashuk, T.J. Doherty, The normal motor unit action potential, in: W.F.Brown, C.F. Bolton, M.J. Aminoff (Eds.), Neuromuscular Function and Disease,W.B. Saunders, Philadelphia, 2002, pp. 291–310.
[14] J. Malmivuo, R. Plonsey, Bioelectromagnetism, Oxford University Press, NewYork, 1995.
[15] J.R. Florestal, P.A. Matheiu, K.C. McGill, Automatic decomposition of multi-channel intramuscular EMG signals, J. Electromyogr. Kinesiol. 19 (1) (2009)1–9, http://dx.doi.org/10.1016/j.jelekin.2007.04.001.
[16] D.W. Stashuk, EMG signal decomposition: how can it be accomplished andused? J. Electromyogr. Kinesiol. 11 (3) (2001) 151–173.
[17] D.W. Stashuk, Decomposition and quantitative analysis of clinical electromyo-graphic signals, Med. Eng. Phys. 21 (6) (1999) 389–404, http://dx.doi.org/10.1016/S1350-4533(99)00064-8.
[18] E. Stålberg, J. Chu, V. Bril, S.D. Nandedkar, M. Stålberg, S. Ericsson, Automaticanalysis of the EMG interference pattern, Electroencephalogr. Clin. Neurophy-siol. 56 (1983) 672–681.
[19] S.D. Nandedkar, D.B. Sanders, E.V. Stålberg, Automatic analysis of the electro-myographic interference pattern. Part I. Development of quantitative features,Muscle Nerve 9 (1986) 431–439.
[20] S.D. Nandedkar, D.B. Sanders, E.V. Stålberg, Automatic analysis of the electro-myographic interference pattern. Part II: findings in control subjects and insome neuromuscular diseases, Muscle Nerve 9 (1986) 491–500.
[21] M. Sonoo, New attempts to quantify concentric needle electromyography,Muscle Nerve 11 (2002) S98–S102.
[22] L.J. Pino, Neuromuscular clinical decision support using motor unit potentialscharacterized by ‘pattern discovery’, Ph.D. Dissertation, University of Water-loo, Department of Biomedical Engineering, 2009.
[23] A. Hamilton-Wright, D.W. Stashuk, Clinical decision support using hybridfuzzy analysis of quantitative EMG data, in: Proceedings of the XVth Interna-tional Society of Electromyography and Kinesiology Congress, ISEK '04,Boston, 2004.
[24] A. Hamilton-Wright, L. McLean, D.W. Stashuk, K. Calder, Bayesian aggregationfor non-specific arm pain classification, in: Proceedings of the XVIIth Inter-national Society of Electromyography and Kinesiology Congress, ISEK '08,Niagara Falls, 2008, http://dx.doi.org/10.1186/1743-0003-7-8.
[25] A. Hamilton-Wright, D.W. Stashuk, Clinical characterization of electromyo-graphic data using computational tools, in: Proceedings of the 2006 Sympo-sium on Computational Intelligence in Bioinformatics and ComputationalBiology, CIBCB, Toronto, 2006, pp. 1–7, http://dx.doi.org/10.1109/CIBCB.2006.330949.
[26] G. Pfeiffer, The diagnostic power of motor unit potential analysis: an objectiveBayesian approach, Muscle Nerve 22 (5) (1999) 584–591, http://dx.doi.org/10.1002/(SICI)1097-4598(199905)22:5o584::AID-MUS643.0.CO;2-0.
[27] G. Pfeiffer, Sequential diagnostic decisions in quantitative motor-unit-potential analysis: a Bayesian approach, in: Electroencephalogr. Clin. Neuro-physiol. 99 (1996) 306 (poster abstracts from conference proceedings), http://dx.doi.org/10.1016/0013-4694(96)88250-2.
[28] G. Pfeiffer, K. Kunze, Discriminant classification of motor unit potentials(MUPs) successfully separates neurogenic and myopathic conditions, Electro-encephalogr. Clin. Neurophysiol. 97 (5) (1995) 191–207.
[29] Z. Barutcuoglu, C. DeCoro, Hierarchical shape classification using Bayesianaggregation, in: Hierarchical Shape Classification Using Bayesian Aggregation,2006, pp. 44–48, http://dx.doi.org/10.1109/SMI.2006.15.
[30] Y. Xiang, B. Pant, A. Eisen, M.P. Beddoes, D. Poole, Multiply sectioned Bayesiannetworks for neuromuscular diagnosis, Artif. Intell. Med. 5 (1993) 293–314.
[31] E. Abel, P. Zacharia, A. Forster, T. Farrow, Neural network analysis of the EMGinterference pattern, Med. Eng. Phys. 18 (1) (1996) 12–17, http://dx.doi.org/10.1016/1350-4533(95)00032-1.
[32] B. Pandey, R.B. Mishra, An integrated intelligent computing model for theinterpretation of EMG based neuromuscular diseases, Expert Syst. Appl. 36 (5)(2009) 9201–9213, http://dx.doi.org/10.1016/j.eswa.2008.12.023.
[33] C.I. Christodoulou, C.S. Pattichis, Unsupervised pattern recognition for theclassification of EMG signals, IEEE Trans. Biomed. Eng. 46 (1999) 169–178.
[34] A. Hamilton-Wright, D.W. Stashuk, H.R. Tizhoosh, Fuzzy classification usingpattern discovery, IEEE Trans. Fuzzy Syst. 15 (5) (2007) 772–783, http://dx.doi.org/10.1109/TFUZZ.2006.889930.
[35] S. Koçer, Classification of EMG signals using neuro-fuzzy system and diagnosisof neuromuscular diseases, J. Neurosci. Methods 34 (2010) 321–329, http://dx.doi.org/10.1007/s10916-008-9244-7.
[36] I. Iordanova, V. Rialle, A. Vila, Use of unsupervised neural networks for classifica-tion tasks in electromyography, in: Engineering in Medicine and Biology Society,14th Annual International Conference of the IEEE, vol. 3, 1992, pp. 1014–1015.
[37] C.S. Pattichis, C.N. Schizas, L.T. Middleton, Neural network models in EMGdiagnosis, IEEE Trans. Biomed. Eng. 42 (5) (1995) 486–496.
[38] C.I. Christodoulou, C.S. Pattichis, Combining neural classifiers in EMG diag-nosis, in: Proceedings of the 6th European Congress on Intelligent Techniquesand Soft Computing, EUFIT98, Aachen, Germany, 1998, pp. 1837–1841.
[39] M. Gazzoni, D. Farina, R. Merletti, A new method for the extraction andclassification of single motor unit action potentials from surface EMG signals,J. Neurosci. Methods 136 (2004) 165–177.
[40] N.F. Guler, S. Koçer, Classification of EMG signals using PCA and FFT, J.Neurosci. Methods 29 (3) (2005) 241–250, http://dx.doi.org/10.1007/s10916-005-5184-7.
[41] A. Subasi, M. Yilmaz, H.R. Ozcalik, Classification of EMG signals using waveletneural network, J. Neurosci. Methods 156 (1–2) (2006) 360–367, http://dx.doi.org/10.1016/j.jneumeth.2006.03.004.
[42] C.D. Katsis, T.P. Exarchosa, C. Papaloukas, Y. Goletsis, D.I. Fotiadis, A. Likas,I. Sarmas, A two-stage method for MUAP classification based on EMGdecomposition, Comput. Biol. Med. 37 (2007) 1232–1240.
[43] A. Bhardwaj, A. Manish, K. Arora, Classification of MUAPs by using ANN patternrecognition technique, Int. J. Sci. Res. Eng. Technol. (IJSRET) 1 (2012) 10–14.
[44] L. Shaw, S. Bagha, Online EMG signal analysis for diagnosis of neuromusculardiseases by using PCA and PNN, Int. J. Eng. Sci. Technol. 4 (2012) 25–36.
[45] C.M.D. Acevedo, A.L.J. Mogollon, Optimization and classification of EMGsignals through pattern recognition methods, in: Eleventh LACCEI LatinAmerican and Caribbean Conference for Engineering and Technology (LAC-CEI2013), 2013, pp. 1–2.
[46] E. Chauvet, O. Fokapu, J.Y. Hogrel, D. Gamet, J. Duchêne, A method of EMGdecomposition based on fuzzy logic, in: Proceedings of the 23rd Annual EMBSInternational Conference, 2001, pp. 1948–1950.
[47] S. Rasheed, D. Stashuk, M. Kamel, Adaptive fuzzy k-NN classifier for EMGsignal decomposition, Med. Eng. Phys. 28 (2006) 694–709.
[48] C. Disselhorst-Klug, Non-invasive diagnosis of neuromuscular disorders byhigh-spatial-resolution-EMG, in: M. Schwartz (Ed.), EMG Methods for Evalu-ating Muscle and Nerve Function, InTech, Rijeka, Croatia, 2012, pp. 227–240,http://dx.doi.org/10.5772/25379 (Chapter 12).
[49] C.S. Pattichis, C.N. Schizas, Genetics-based machine learning for the assess-ment of certain neuromuscular disorders, IEEE Trans. Neural Netw. 1 (2)(1996) 427–439.
[50] H. Xie, H. Huang, Z. Wang, A hybrid neuro-fuzzy system for neuromusculardiagnosis, in: Proceedings of the IEEE International Workshop on BiomedicalCircuits and Systems, 2004, pp. s2/5–s5-8, http://dx.doi.org/10.1109/BIOCAS.2004.1454148.
[51] G. Kaur, A.S. Arora, V.K. Jain, Multi-class support vector machine classifier inEMG diagnosis, WSEAS Trans. Signal Process. 2 (2009) 379–389.
[52] G. Kaur, A.S. Arora, V.K. Jain, EMG diagnosis via modelling and binary supportvector machine classification, Int. J. Eng. Sci. Technol. 2 (2010) 1767–1772.
[53] R. Istenic, P.A. Kaplanis, C.S. Pattichis, D. Zazula, Multiscale entropy-basedapproach to automated surface EMG classification of neuromuscular disor-ders, Med. Biol. Eng. Comput. 48 (2010) 773–778.
[54] A.P. Dobrowolski, M. Wierzbowski, K. Tomczykiewicz, Multiresolution MUAPsdecomposition and SVM-based analysis in the classification of neuromusculardisorders, Comput. Methods Prog. Biomed. 107 (3) (2012) 393–403, http://dx.doi.org/10.1016/j.cmpb.2010.12.006.
[55] K. Tomczykiewicz, A.P. Dobrowolski, M. Wierzbowski, Evaluation of motorunit potential wavelet analysis in the electrodiagnosis of neuromuscular
J. Yousefi, A. Hamilton-Wright / Computers in Biology and Medicine 51 (2014) 1–1312

disorders, Muscle Nerve 46 (1) (2012) 63–69, http://dx.doi.org/10.1002/mus.23286.
[56] S. Keleş, A. Subaşi, Classification of EMG signals using decision tree methods,in: 3rd International Symposium on Sustainable Development, InternationalBurch University, Sarajevo, 2013, pp. 354–366.
[57] A. Subasi, Medical decision support system for diagnosis of neuromusculardisorders using DWT and fuzzy support vector machines, Comput. Biol. Med.42 (2012) 806–815.
[58] A. Subasi, Classification of EMG signals using PSO optimized SVM for diagnosisof neuromuscular disorders, Comput. Biol. Med. 43 (2013) 576–586.
[59] D. Rutkowska, Neuro-Fuzzy Architectures and Hybrid Learning, Physica-Verlag, New York, 2002.
[60] D.E. Rumelhart, G.E. Hinton, R.J. Williams, Learning representations by back-propagating errors, Nature 323 (1986) 533–536.
[61] T. Kohonen, Adaptive, associative, and self-organizing functions in neuralcomputing, Appl. Opt. 26 (23) (1987) 4910–4918.
[62] D. Marquardt, An algorithm for least-squares estimation of nonlinear para-meters, SIAM J. Appl. Math. (1963) 431–441.
[63] J. Park, I.W. Sandberg, Universal approximation using radial-basis-functionnetworks, Neural Comput. 3 (2) (1991) 246–257.
[64] M. Hagan, H. Demuth, M. Beale, Neural Network Design, PWS, Boston, MA,1996.
[65] J. Carletta, Assessing agreement on classification tasks: the kappa statistic,Comput. Ling. 22 (2) (1996) 249–254.
[66] I. Daubechies, Ten Lectures on Wavelets, vol. 61, SIAM, Philadelphia, 1992.[67] G. Kaur, A.S. Arora, V. Kumar, EMG diagnosis using neural network classifier
with time domain and AR features, Int. J. Recent Trends Eng. Technol. 3 (2010)30–34.
[68] D. Johnson, Applied Multivariate Methods for Data Analysis, 1st ed., DuxburyPress, Brooks/Cole Publishing Company, CA, USA, 1998.
[69] S.L. Chiu, Extracting fuzzy rules from data for function approximation andpattern classification, in: Fuzzy Information Engineering: A Guided Tour ofApplications, John Wiley and Sons, Hoboken, New Jersey, 1997, pp. 1–10.
[70] S. Sharma, G. Kumar, Wavelet analysis based feature extraction for patternclassification from single channel acquired EMG signal, Control Eng. 50 (2012)10320–10324.
[71] G.S. Rash, P.M. Quesada, Electromyography: Fundamentals, CRC Press, BocaRaton, Florida, 2006.
[72] L. Lam, C.Y. Suen, Application of majority voting to pattern recognition: ananalysis of its behavior and performance, IEEE Trans. Syst., Man, Cybern. A 27(5) (1997) 553–568, http://dx.doi.org/10.1109/3468.618255.
[73] C. Katsis, A.L.Y. Goletsis, D. Fotiadis, I. Sarmas, A two-stage method for MUAPclassification based on EMG decomposition, Artif. Intell. Med. 37 (2006)55–64.
[74] C.J.C. Burges, A tutorial on support vector machines for pattern recognition,Data Min. Knowl. Discov. 2 (1998) 121–167.
[75] G. Horvath, J. Suykens, S. Basu, Advances in Learning Theory: Methods ModelsAnd Applications, IOS Press, Amsterdam, 2003.
[76] C. Lin, S. Wang, Fuzzy support vector machines with automatic membershipsetting, Support Vector Mach.: Theory Appl. (2005) 233–254.
[77] T. Kamali, R. Boostani, H. Parsaei, A multi-classifier approach to MUAPclassification for diagnosis of neuromuscular disorders, IEEE Trans. NeuralSyst. Rehabil. Eng. 22 (1) (2014) 191–200.
[78] N.V. Vladimir (Ed.), The Nature of Statistical Learning Theory, 2nd edition,Springer-Verlag, York, 2008.
[79] N. Kaur, T. Singh, Statistical technique for classification of MUAPs forneuromuscular disease, Int. J. Comput. Appl. 1 (2010) 8–11.
[80] L.J. Pino, D.W. Stashuk, Using motor unit potential characterizations toestimate neuromuscular disorder level of involvement, in: 30th AnnualInternational IEEE EMBS Conference, Vancouver, British Columbia, Canada,2008, pp. 4138–4141, http://dx.doi.org/10.1109/IEMBS.2008.4650120.
[81] P. Bonissone, W. Cheetham, Fuzzy case-based reasoning for decision making,in: Proceedings of the 10th IEEE International Conference on Fuzzy Systems,vol. 3, 2001, pp. 995–998.
[82] P. Fortier, S. Jagannathan, H. Michel, N. Dluhy, E. Oneill, Development of ahand-held real-time decision support aid for critical care nursing, in: Proceed-ings of the 36th Annual Hawaii International Conference on System Sciences,2003, p. 160.2, http://dx.doi.org/10.1109/HICSS.2003.1174355.
[83] J. DeLeo, J. Dayhoff, Medical applications of neural networks: measures ofcertainty and statistical tradeoffs, in: Proceedings of the International JointConference on Neural Networks, vol. 4, 2001, pp. 3009–3014, http://dx.doi.org/10.1109/IJCNN.2001.938857.
J. Yousefi, A. Hamilton-Wright / Computers in Biology and Medicine 51 (2014) 1–13 13