Electromyogram (EMG) Activity and Muscle Strength - iWorx
15
Experiment MP-1: Electromyogram (EMG) Activity and Muscle Strength Background A motor unit is composed of a motor neuron and all the muscle fibers that are innervated by that motor neuron. In a persistent muscle contraction, multiple motor units are firing repetitively throughout the contraction of the muscle. The strength of a muscle contraction is related to the number of motor units in the muscle that are activated during the same time period. The electromyogram (EMG) recorded during the muscle contraction is seen as a burst of spike-like signals, and the duration of the burst is about equal to the duration of the muscle contraction. The strength of a striated muscle contraction is directly proportional to the amount of electrical activity in the muscle. However, it is difficult to quantify the amount of electrical activity in a muscle unless the raw EMG data is mathematically transformed. One of the most common transformations used is the integration of the absolute values of the amplitudes of the EMG spikes. Through this transformation, it has been found that the area under the graph of the absolute integral of the EMG is linearly proportional to the strength of the muscle contraction. In this experiment, students will use a hand dynamometer to measure a subject’s grip strength as the EMG activity of the forearm muscles used to generate the subject’s grip are recorded. The EMG activity will be related to the grip strength by plotting the maximum grip strength as a function the area under the absolute integral of the EMG activity during the muscle contraction. Data recordings will be made from the subject’s dominant and non-dominant forearms, and the relative strength and electrical activity of each forearm will be compared to its diameter. Recordings of prolonged grip strength and forearm EMG activity will also be made to determine the rate of fatigue in the dominant and non- dominant forearms. Equipment Required PC or Macintosh Computer IX-ELVIS USB cable Power supply Red, black, and green EMG leads Disposable electrodes FT-220 Hand dynamometer A-BT-220 Tubing GPSN-100 Pressure transducer Alcohol swabs Bathroom scale 5 or 6 textbooks or a 5-10 kg barbell weight String Metric ruler Muscle Physiology-EMG-MuscleStrength MP-1-1
-
Upload
khangminh22 -
Category
Documents
-
view
1 -
download
0
Transcript of Electromyogram (EMG) Activity and Muscle Strength - iWorx
Experiment MP-1: Electromyogram (EMG) Activity and Muscle Strength
Background
A motor unit is composed of a motor neuron and all the muscle fibers that are innervated by that motor neuron. In a persistent muscle contraction, multiple motor units are firing repetitively throughout the contraction of the muscle. The strength of a muscle contraction is related to the number of motor units in the muscle that are activated during the same time period. The electromyogram (EMG) recorded during the muscle contraction is seen as a burst of spike-like signals, and the duration of the burst is about equal to the duration of the muscle contraction.
The strength of a striated muscle contraction is directly proportional to the amount of electrical activity in the muscle. However, it is difficult to quantify the amount of electrical activity in a muscle unless theraw EMG data is mathematically transformed. One of the most common transformations used is the integration of the absolute values of the amplitudes of the EMG spikes. Through this transformation, it has been found that the area under the graph of the absolute integral of the EMG is linearly proportional to the strength of the muscle contraction.
In this experiment, students will use a hand dynamometer to measure a subject’s grip strength as the EMG activity of the forearm muscles used to generate the subject’s grip are recorded. The EMG activity will be related to the grip strength by plotting the maximum grip strength as a function the area under the absolute integral of the EMG activity during the muscle contraction. Data recordings will be made from the subject’s dominant and non-dominant forearms, and the relative strength and electrical activity of each forearm will be compared to its diameter. Recordings of prolonged grip strength and forearm EMG activity will also be made to determine the rate of fatigue in the dominant and non-dominant forearms.
Equipment Required
PC or Macintosh Computer
IX-ELVIS
USB cable
Power supply
Red, black, and green EMG leads
Disposable electrodes
FT-220 Hand dynamometer
A-BT-220 Tubing
GPSN-100 Pressure transducer
Alcohol swabs
Bathroom scale
5 or 6 textbooks or a 5-10 kg barbell weight
String
Metric ruler
Muscle Physiology-EMG-MuscleStrength MP-1-1

IX-ELVIS Setup
1. Place the IX-ELVIS unit on the bench, close to the computer.
2. Connect the IX-ELVIS to the computer with the supplied USB cable.
3. Insert the power plug into the rear of the IX-ELVIS and plug the transformer into the electrical outlet. Turn on the power switches on the rear and on the upper right side of the top of the unit and confirm that the LEDs are illuminated.
Start the Software
1. Click on the LabScribe shortcut on the computer’s desktop to open the program. If a shortcut is not available, click on the Windows Start menu, move the cursor to All Programs and then to the listing for iWorx. Select LabScribe from the iWorx submenu. The LabScribe Main window will appear as the program opens.
2. On the Main window, pull down the Settings menu and select Load Group.
3. Locate the folder that contains the settings group, ELVISNI.iwxgrp. Select this group and click Open.
4. Pull down the Settings menu again. Select the EMG-MuscleStrength-LS2 settings file.
5. After a short time, LabScribe will appear on the computer screen as configured by the EMG-MuscleStrength-LS2 settings.
6. The settings used to configure the LabScribe software and the IX-ELVIS unit for this experiment are programmed on the Preferences Dialog window which can be viewed by selecting Preferences from the Edit menu on the LabScribe Main window.
EMG Cable and Hand Dynamometer Setup
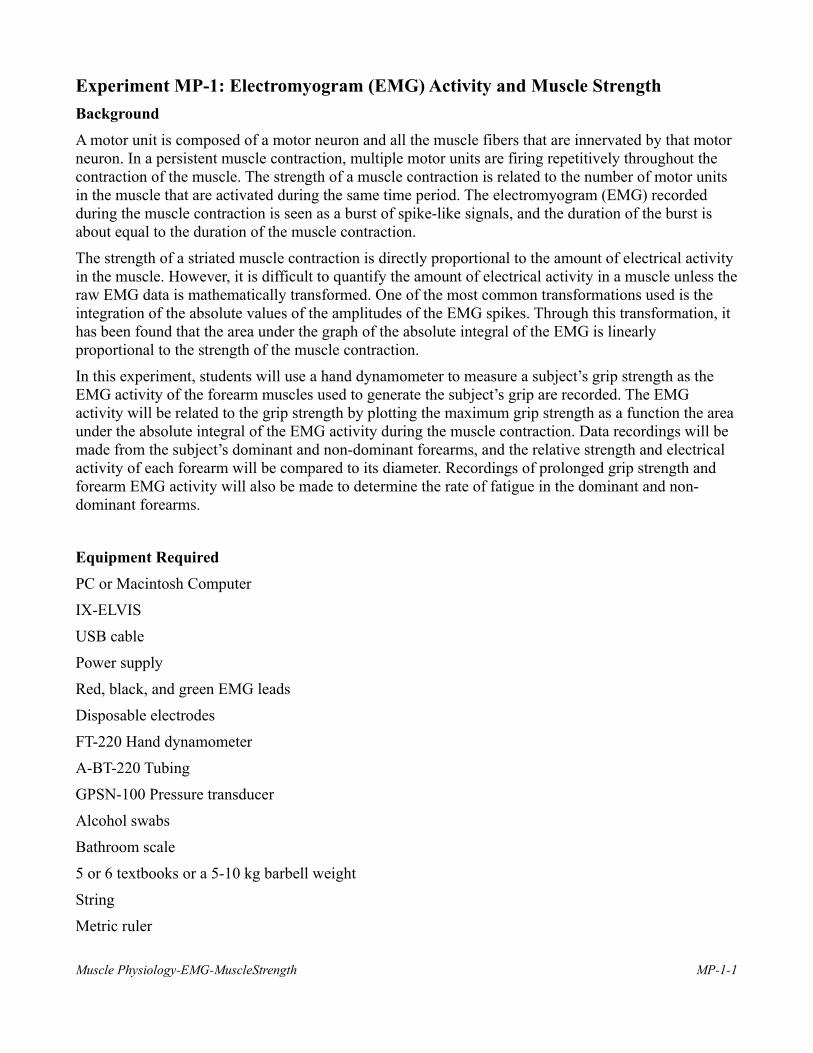
1. Locate the red, black, and green electrode lead wires (Figure MP-1-S1).
2. Locate the FT-220 hand dynamometer, the A-BT-220 tubing, and the GPSN-100 pressure sensor, and assemble them as illustrated in Figure MP-1-S2.
Muscle Physiology-EMG-MuscleStrength MP-1-2
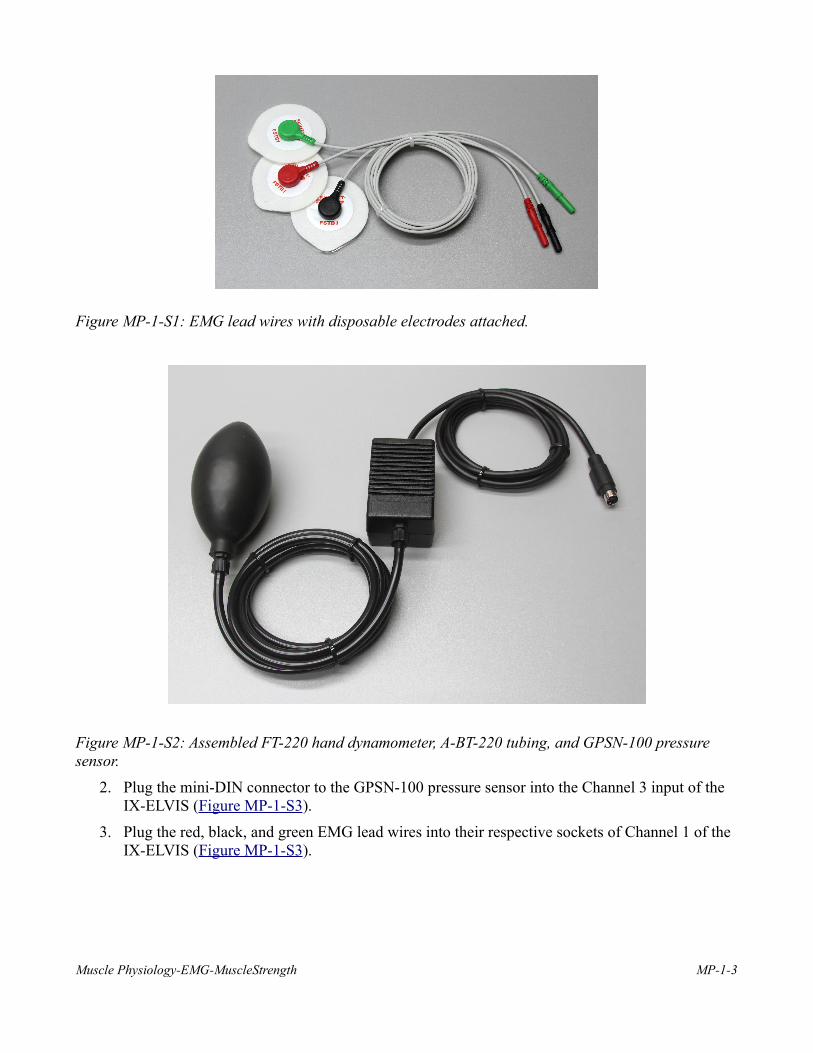
Figure MP-1-S1: EMG lead wires with disposable electrodes attached.
Figure MP-1-S2: Assembled FT-220 hand dynamometer, A-BT-220 tubing, and GPSN-100 pressure sensor.
2. Plug the mini-DIN connector to the GPSN-100 pressure sensor into the Channel 3 input of the IX-ELVIS (Figure MP-1-S3).
3. Plug the red, black, and green EMG lead wires into their respective sockets of Channel 1 of the IX-ELVIS (Figure MP-1-S3).
Muscle Physiology-EMG-MuscleStrength MP-1-3
Figure MP-1-S3: The EMG lead wires and the hand dynamometer assembly connected to an ETH/256.
4. The subject should remove all jewelry from their wrists. For the first exercises in this lab, record EMGs and muscle forces from the subject’s dominant arm, the arm used most often.
5. Use an alcohol swab to clean and scrub three regions on the inside of the subject’s dominant forearm where the electrodes will be placed (Figure MP-1-S4). One area is near the wrist, the second is in the middle of the forearm, and the third area is about 2 inches from the elbow.
6. Let the areas dry before attaching the electrodes.
7. Remove the plastic disk from a disposable electrode and apply it to a scrubbed area. Repeat for the other two areas.
Muscle Physiology-EMG-MuscleStrength MP-1-4
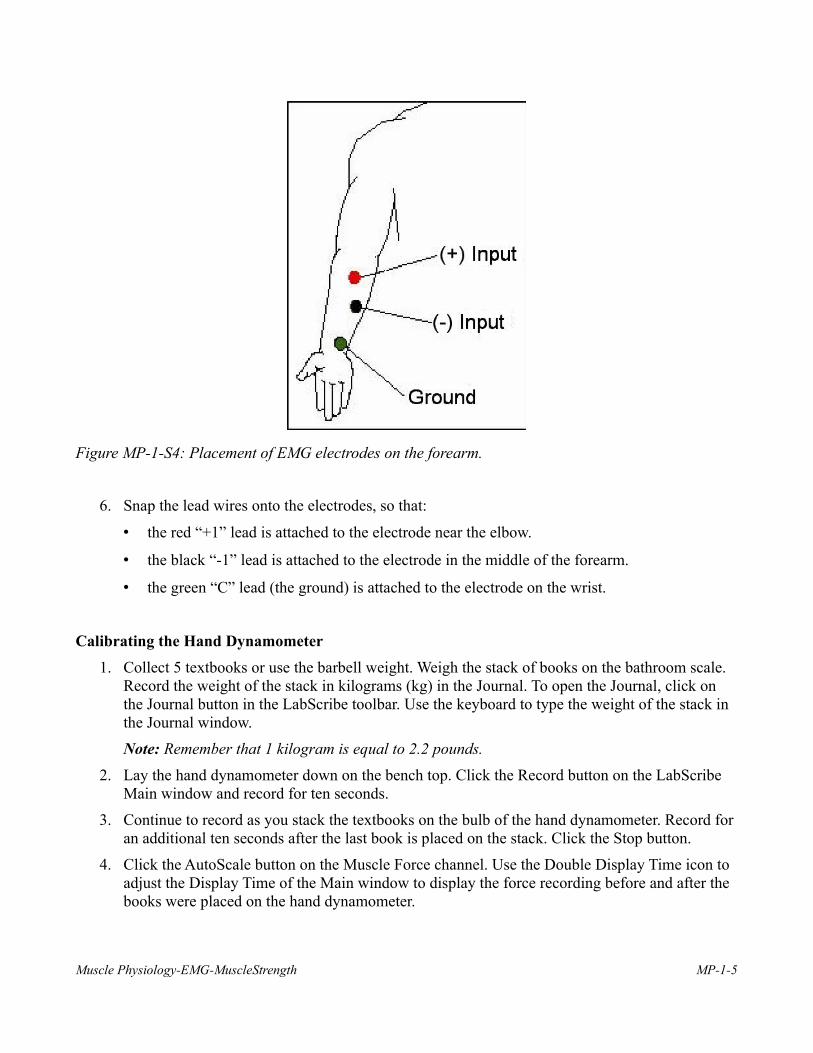
Figure MP-1-S4: Placement of EMG electrodes on the forearm.
6. Snap the lead wires onto the electrodes, so that:
• the red “+1” lead is attached to the electrode near the elbow.
• the black “-1” lead is attached to the electrode in the middle of the forearm.
• the green “C” lead (the ground) is attached to the electrode on the wrist.
Calibrating the Hand Dynamometer
1. Collect 5 textbooks or use the barbell weight. Weigh the stack of books on the bathroom scale. Record the weight of the stack in kilograms (kg) in the Journal. To open the Journal, click on the Journal button in the LabScribe toolbar. Use the keyboard to type the weight of the stack in the Journal window.
Note: Remember that 1 kilogram is equal to 2.2 pounds.
2. Lay the hand dynamometer down on the bench top. Click the Record button on the LabScribe Main window and record for ten seconds.
3. Continue to record as you stack the textbooks on the bulb of the hand dynamometer. Record for an additional ten seconds after the last book is placed on the stack. Click the Stop button.
4. Click the AutoScale button on the Muscle Force channel. Use the Double Display Time icon to adjust the Display Time of the Main window to display the force recording before and after the books were placed on the hand dynamometer.
Muscle Physiology-EMG-MuscleStrength MP-1-5
5. Click on the Double Cursors button on the LabScribe toolbar. Place one cursor on the force recording made before the books were placed on the bulb. Place the other cursor on the recording after the books were placed on the bulb.
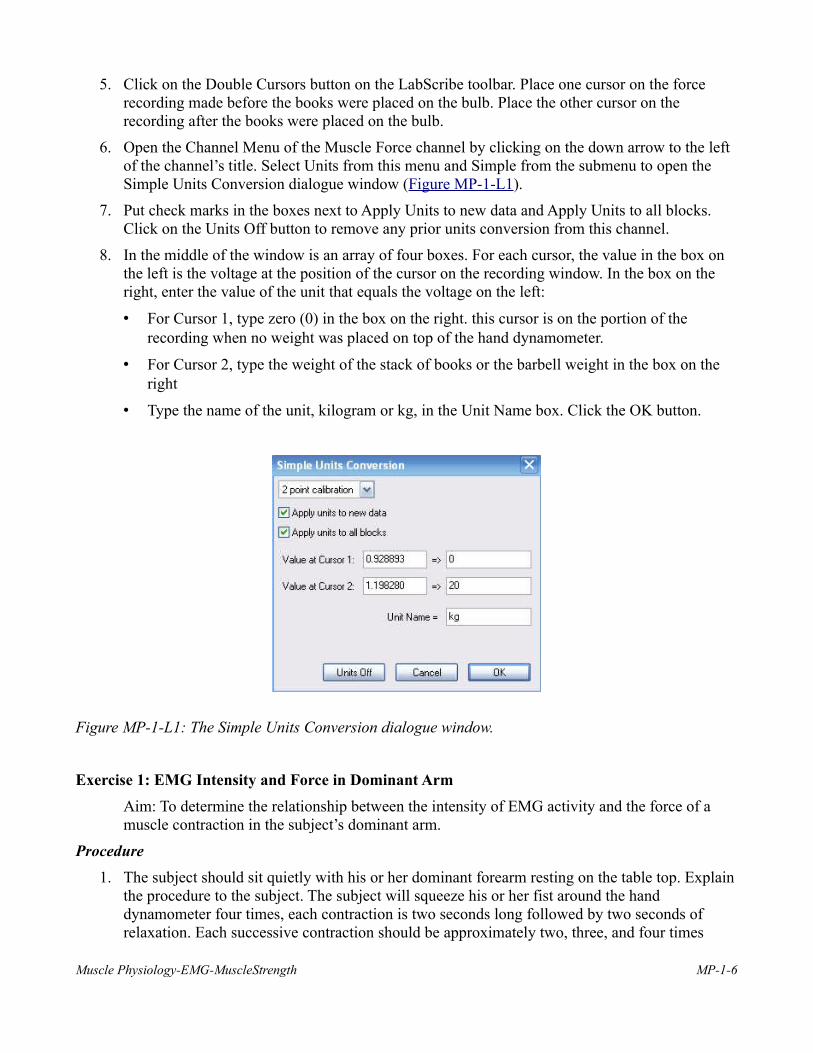
6. Open the Channel Menu of the Muscle Force channel by clicking on the down arrow to the left of the channel’s title. Select Units from this menu and Simple from the submenu to open the Simple Units Conversion dialogue window (Figure MP-1-L1).
7. Put check marks in the boxes next to Apply Units to new data and Apply Units to all blocks. Click on the Units Off button to remove any prior units conversion from this channel.
8. In the middle of the window is an array of four boxes. For each cursor, the value in the box on the left is the voltage at the position of the cursor on the recording window. In the box on the right, enter the value of the unit that equals the voltage on the left:
• For Cursor 1, type zero (0) in the box on the right. this cursor is on the portion of the recording when no weight was placed on top of the hand dynamometer.
• For Cursor 2, type the weight of the stack of books or the barbell weight in the box on the right
• Type the name of the unit, kilogram or kg, in the Unit Name box. Click the OK button.
Figure MP-1-L1: The Simple Units Conversion dialogue window.
Exercise 1: EMG Intensity and Force in Dominant Arm
Aim: To determine the relationship between the intensity of EMG activity and the force of a muscle contraction in the subject’s dominant arm.
Procedure
1. The subject should sit quietly with his or her dominant forearm resting on the table top. Explain the procedure to the subject. The subject will squeeze his or her fist around the hand dynamometer four times, each contraction is two seconds long followed by two seconds of relaxation. Each successive contraction should be approximately two, three, and four times
Muscle Physiology-EMG-MuscleStrength MP-1-6
stronger than the first contraction.
2. Type Increasing Grip Force-Dominant in the Mark box to the right of the Mark button. Click the Record button to begin the recording; then, press the Enter key on the keyboard to mark the beginning of the recording. After the recording is marked, tell the subject to begin squeezing thehand dynamometer following the procedure outlined in the step above.
3. In the relaxation period after the last contraction, click the Stop button.
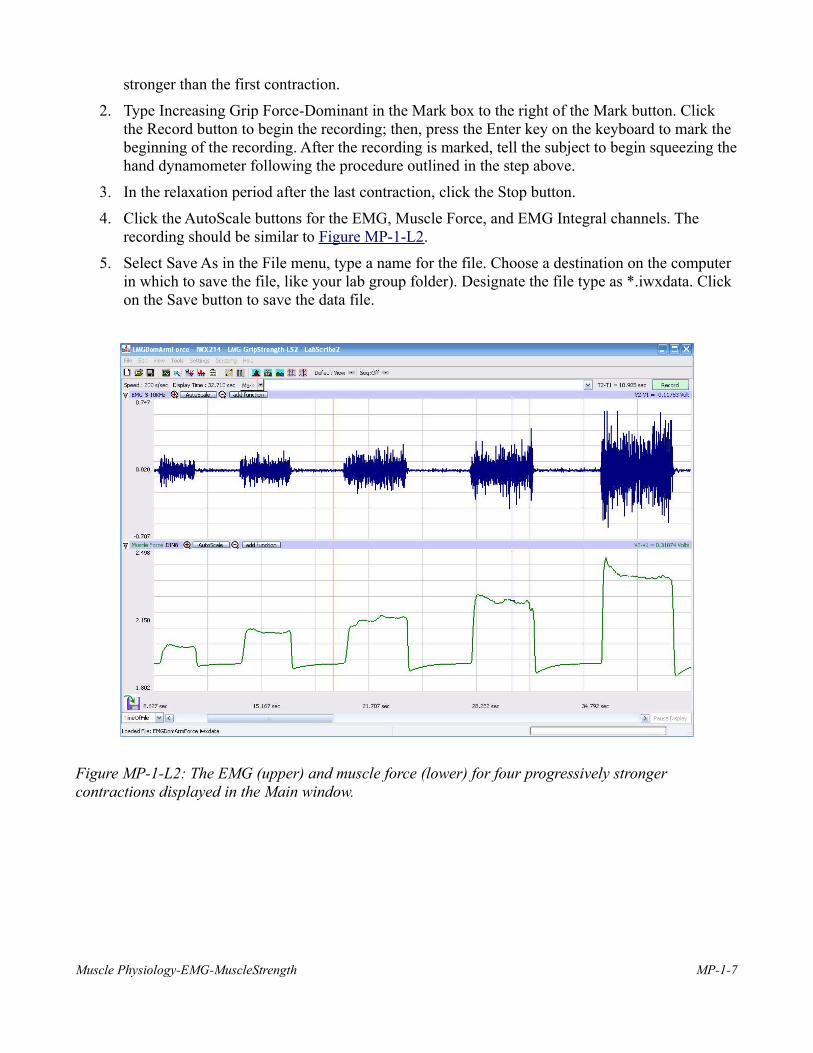
4. Click the AutoScale buttons for the EMG, Muscle Force, and EMG Integral channels. The recording should be similar to Figure MP-1-L2.
5. Select Save As in the File menu, type a name for the file. Choose a destination on the computer in which to save the file, like your lab group folder). Designate the file type as *.iwxdata. Click on the Save button to save the data file.
Figure MP-1-L2: The EMG (upper) and muscle force (lower) for four progressively stronger contractions displayed in the Main window.
Muscle Physiology-EMG-MuscleStrength MP-1-7

Data Analysis
1. Use the Display Time icons to adjust the Display Time of the Main window to show the four progressive muscle contractions on the Main window. The four contractions can also be selected by:
• Placing the cursors on either side of a group of four contractions; and
• Clicking the Zoom between Cursors button on the LabScribe toolbar to expand the segment with the four contractions to the width of the Main window.
2. Click on the Analysis window icon in the toolbar (Figure MP-1-L3) or select Analysis from the Windows menu to transfer the data displayed in the Main window to the Analysis window (Figure MP-1-L4).
Figure MP-1-L3: The LabScribe toolbar.
3. Look at the Function Table that is above the uppermost channel displayed in the Analysis window. The mathematical functions, Abs. Area, V2-V1, and T2-T1 should appear in this table. The values for Abs. Area, V2-V1, and T2-T1 on each channel are seen in the table across the top margin of each channel.
4. Once the cursors are placed in the correct positions for measuring the absolute areas under the muscle contraction and the corresponding EMG activity, the values for the areas can be recorded in the on-line notebook of LabScribe by typing the names and values directly into the Journal.
5. The functions in the channel pull-down menus of the Analysis window can also be used to enterthe names and values of the absolute areas to the Journal. To use these functions:
• Place the cursors at the locations used to measure the absolute areas.
• Transfer the name of the mathematical function used to determine the absolute areas to the Journal using the Add Title to Journal function in the EMG channel pull-down menu.
• Transfer the values for the absolute areas to the Journal using the Add All Data to Journal function in the EMG channel pull-down menu.
6. Use the mouse to click on and drag the cursors to the beginning and end of the first muscle contraction (Figure MP-1-L4). The values for Abs. Area on the EMG and Muscle channels are the relative amount of the electrical activity causing the contraction and relative strength of the muscle, respectively. Record the values for these areas in the Journal using the one of the techniques described earlier in this exercise, and on Table MP-1-L1.
Muscle Physiology-EMG-MuscleStrength MP-1-8
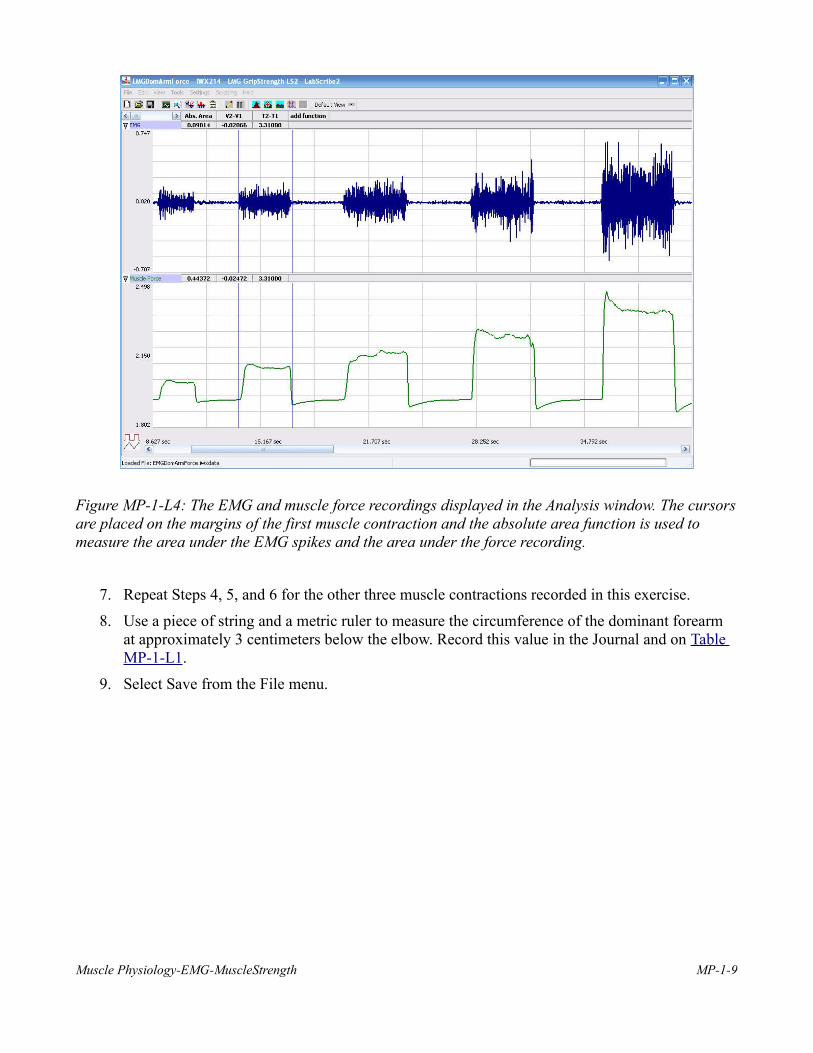
Figure MP-1-L4: The EMG and muscle force recordings displayed in the Analysis window. The cursorsare placed on the margins of the first muscle contraction and the absolute area function is used to measure the area under the EMG spikes and the area under the force recording.
7. Repeat Steps 4, 5, and 6 for the other three muscle contractions recorded in this exercise.
8. Use a piece of string and a metric ruler to measure the circumference of the dominant forearm at approximately 3 centimeters below the elbow. Record this value in the Journal and on Table MP-1-L1.
9. Select Save from the File menu.
Muscle Physiology-EMG-MuscleStrength MP-1-9

Table MP-1-L1: The Effect of EMG Activity on the Relative Muscle Strength in the Dominant Forearm.
Dominant Forearm Diameter (mm):______
Relative Grip Strength Absolute Area of EMG Activity Absolute Area under Force Curve
Lowest
Higher 1
Higher 2
Highest
Questions
1. Plot the absolute area of muscle contraction as a function of the absolute area of the EMG signals for each muscle clinch.
2. Is there a linear relationship between the absolute area under EMG signals and the absolute areaunder the muscle contraction?
3. Do muscle fibers have a refractory period like nerve fibers?
4. Does the amplitude of the EMG signal and the force of contraction, as measured by the absoluteareas, increase because a finite number of fibers are firing more often, or because more fibers are recruited to fire as the intensity of signals in the motor neurons increases, or a combination of these two?
Exercise 2: EMG Intensity and Fatigue in Dominant Arm
Aim: To observe the relationship between the length and strength of a muscle contraction and EMG activity in the dominant forearm.
Procedure
1. The subject should sit quietly with his or her dominant forearm on the table top.
2. Explain the experimental procedure of this exercise to the subject:
• The subject will squeeze the bulb of the hand dynamometer as tightly and as long as possible in an attempt to fatigue the muscles of the forearm.
Muscle Physiology-EMG-MuscleStrength MP-1-10
• As time passes, the subject’s muscle force will decrease, but at a rate that is dependent on the fitness of the subject.
• When the subject’s muscle strength drops to a level that is below half of the subject’s maximum muscle force at the beginning of the recording, the recording will be stopped. This could take as little as 20 or as long as a few minutes
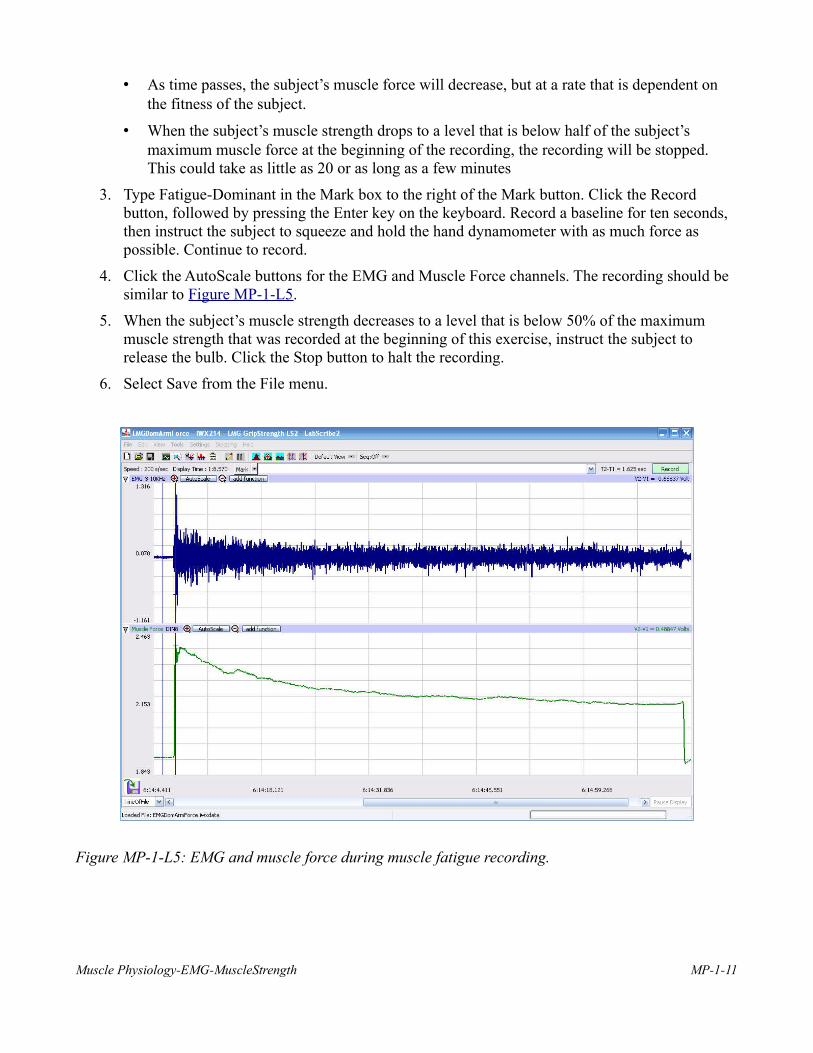
3. Type Fatigue-Dominant in the Mark box to the right of the Mark button. Click the Record button, followed by pressing the Enter key on the keyboard. Record a baseline for ten seconds, then instruct the subject to squeeze and hold the hand dynamometer with as much force as possible. Continue to record.
4. Click the AutoScale buttons for the EMG and Muscle Force channels. The recording should be similar to Figure MP-1-L5.
5. When the subject’s muscle strength decreases to a level that is below 50% of the maximum muscle strength that was recorded at the beginning of this exercise, instruct the subject to release the bulb. Click the Stop button to halt the recording.
6. Select Save from the File menu.
Figure MP-1-L5: EMG and muscle force during muscle fatigue recording.
Muscle Physiology-EMG-MuscleStrength MP-1-11

Data Analysis
1. Use the Display Time icons to adjust the Display Time of the Main window to show the complete muscle fatigue recording on the Main window. The complete recording can also be selected by:
• Placing one cursor on the relaxation period just before the contraction and the other cursor on the relaxation period just after the subject releases the hand dynamometer; and
• Clicking the Zoom between Cursors button on the LabScribe toolbar to expand the muscle fatigue recording to the width of the Main window.
2. Click on the Analysis window icon in the toolbar (Figure MP-1-L3) or select Analysis from the Windows menu to transfer the data displayed in the Main window to the Analysis window.
3. Look at the Function Table that is above the uppermost channel displayed in the Analysis window. The mathematical functions, Abs. Area, V2-V1, and T2-T1 should appear in this table. The values for Abs. Area, V2-V1, and T2-T1 on each channel are seen in the table across the top margin of each channel.
4. Use either of the two techniques described in Exercise 1 to record the names and values of parameters in the Journal.
5. On the Muscle Force channel, use the mouse to click on and drag the cursors to specific points on the recording to measure the following:
• The maximum muscle force. To measure this force, place one cursor on the baseline before the muscle contraction and the second cursor on the peak muscle force near the beginning ofthe contraction. The value for V2-V1 on the Muscle Force channel is this amplitude.
• The half-max muscle force. Divide the maximum muscle force by 2.
• The half-max fatigue time, which is the time it takes the muscle force to decrease to 50% of the maximum during the fatigue experiment. Place one cursor on the peak muscle force. Move the second cursor to the right of the peak muscle force until the absolute value for V2-V1, seen on the Muscle Force channel, is equal to the half-max muscle force (Figure MP-1-L6).
Muscle Physiology-EMG-MuscleStrength MP-1-12
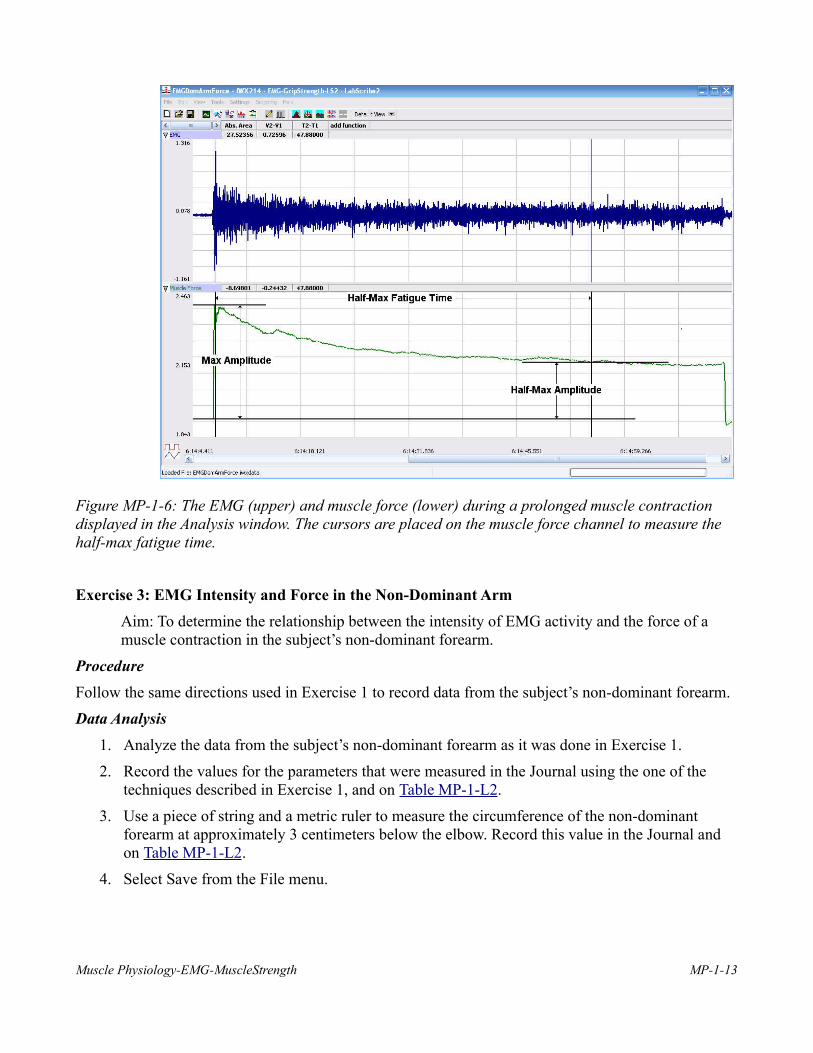
Figure MP-1-6: The EMG (upper) and muscle force (lower) during a prolonged muscle contraction displayed in the Analysis window. The cursors are placed on the muscle force channel to measure the half-max fatigue time.
Exercise 3: EMG Intensity and Force in the Non-Dominant Arm
Aim: To determine the relationship between the intensity of EMG activity and the force of a muscle contraction in the subject’s non-dominant forearm.
Procedure
Follow the same directions used in Exercise 1 to record data from the subject’s non-dominant forearm.
Data Analysis
1. Analyze the data from the subject’s non-dominant forearm as it was done in Exercise 1.
2. Record the values for the parameters that were measured in the Journal using the one of the techniques described in Exercise 1, and on Table MP-1-L2.
3. Use a piece of string and a metric ruler to measure the circumference of the non-dominant forearm at approximately 3 centimeters below the elbow. Record this value in the Journal and on Table MP-1-L2.
4. Select Save from the File menu.
Muscle Physiology-EMG-MuscleStrength MP-1-13

Table MP-1-L2:The Effect of EMG Activity on the Relative Muscle Strength in the Non-Dominant Forearm.
Non-Dominant Forearm Diameter (mm):______
Relative Grip Strength Absolute Area of EMG Activity Absolute Area under Force Curve
Lowest
Higher 1
Higher 2
Highest
Questions
Use the information from Exercises 1 and 3 to answer the following questions.
1. Is one of the subject’s forearms stronger than the other? Use the maximum grip strength from each arm to determine this answer. Calculate the percent difference in maximum grip strength from each arm.
2. Does the stronger forearm have a higher ratio of average maximum grip strength to the area of the EMG absolute integral than the weaker forearm? Use the slopes of the force-EMG activity graphs for each forearm to determine this answer. Calculate the percent difference in the slope of the force-EMG activity graph from each arm.
Exercise 4: EMG Intensity and Fatigue in Non-Dominant Arm
Aim: To observe the relationship between the length and strength of a muscle contraction and EMG activity in the non-dominant forearm.
Procedure
Follow the same directions used in Exercise 2 to record fatigue data from the subject’s non-dominant forearm.
Data Analysis
Analyze the fatigue data from the subject’s non-dominant forearm as it was done in Exercise 2. Use theinformation from Exercises 2 and 4 to answer the following questions.
Muscle Physiology-EMG-MuscleStrength MP-1-14

Questions
1. Is there a difference in the maximum forces generated by the dominant and the non-dominant forearms? Calculate the percent difference between the forces.
2. Is there a difference between the circumference of the dominant and non-dominant forearms? Calculate the percent difference between the circumferences.
3. Is there a relationship between the circumference of the forearm and the maximum force developed? If there is, what is it?
4. If there is a difference in the circumference of the forearms is it caused by a difference in the number of muscle fibers in the forearm or the diameter of each muscle fiber in the forearm? Explain.
5. How does the time to fatigue to half-strength in the dominant forearm compare to the same parameter for the non-dominant forearm?
Muscle Physiology-EMG-MuscleStrength MP-1-15