Effects of EMG processing on biomechanical models of muscle joint systems: Sensitivity of trunk...
10
Journal of Biomechanics 40 (2007) 900–909 Effects of EMG processing on biomechanical models of muscle joint systems: Sensitivity of trunk muscle moments, spinal forces, and stability Didier Staudenmann a , Jim R. Potvin b , Idsart Kingma a , Dick F. Stegeman a,c , Jaap H. van Diee¨n a, a Institute for Fundamental and Clinical Human Movement Sciences, Faculty of Human Movement Sciences, Vrije Universiteit, Amsterdam, The Netherlands b Department of Kinesiology, University of Windsor, Ont., Canada N9B 3 P4 c Department of Clinical Neurophysiology, Institute of Neurology, University Medical Centre, Nijmegen, The Netherlands Accepted 7 March 2006 Abstract Biomechanical models are in use to estimate parameters such as contact forces and stability at various joints. In one class of these models, surface electromyography (EMG) is used to address the problem of mechanical indeterminacy such that individual muscle activation patterns are accounted for. Unfortunately, because of the stochastical properties of EMG signals, EMG based estimates of muscle force suffer from substantial estimation errors. Recent studies have shown that improvements in muscle force estimation can be achieved through adequate EMG processing, specifically whitening and high-pass (HP) filtering of the signals. The aim of this paper is to determine the effect of such processing on outcomes of a biomechanical model of the lumbosacral joint and surrounding musculature. Goodness of fit of estimated muscle moments to net moments and also estimated joint stability significantly increased with increasing cut-off frequencies in HP filtering, whereas no effect on joint contact forces was found. Whitening resulted in moment estimations comparable to those obtained from optimal HP filtering with cut-off frequencies over 250 Hz. Moreover, compared to HP filtering, whitening led to a further increase in estimated joint-stability. Based on theoretical models and on our experimental results, we hypothesize that the processing leads to an increase in pick-up area. This then would explain the improvements from a better balance between deep and superficial motor unit contributions to the signal. r 2006 Elsevier Ltd. All rights reserved. Keywords: Human; Trunk model; EMG filtering; Surface electromyography; Force and moment estimation; Stability; Volume conduction; Cross-talk 1. Introduction Biomechanical models of muscle joint systems have been used to estimate joint forces or to unravel how the central nervous system (CNS) controls the musculoske- letal system. Because the number of muscles spanning a joint usually exceeds the number of degrees of freedom of the joint, these models are mechanically undeter- mined. To address this problem, optimization has been used to predict forces in individual muscles. This approach is based on assumptions regarding strategies the CNS may deploy to control muscle force (Bean et al., 1988; Stokes and Gardner-Morse, 2001; van Dieen, 1997; van Dieen and Kingma, 2005; Wynarsky and Schultz, 1991; Yettram and Jackman, 1982). In addi- tion, surface electromyography (EMG) has been used in many models of human muscle joint systems including ARTICLE IN PRESS www.elsevier.com/locate/jbiomech www.JBiomech.com 0021-9290/$ - see front matter r 2006 Elsevier Ltd. All rights reserved. doi:10.1016/j.jbiomech.2006.03.021 Corresponding author. Tel.: +31 20 5988501; fax: +31 20 5988529. E-mail address: [email protected] (J.H. van Diee¨n).
Transcript of Effects of EMG processing on biomechanical models of muscle joint systems: Sensitivity of trunk...
ARTICLE IN PRESS
0021-9290/$ - se
doi:10.1016/j.jb
�Correspond
E-mail addr
Journal of Biomechanics 40 (2007) 900–909
www.elsevier.com/locate/jbiomech
www.JBiomech.com
Effects of EMG processing on biomechanical models ofmuscle joint systems: Sensitivity of trunk muscle moments,
spinal forces, and stability
Didier Staudenmanna, Jim R. Potvinb, Idsart Kingmaa,Dick F. Stegemana,c, Jaap H. van Dieena,�
aInstitute for Fundamental and Clinical Human Movement Sciences, Faculty of Human Movement Sciences,
Vrije Universiteit, Amsterdam, The NetherlandsbDepartment of Kinesiology, University of Windsor, Ont., Canada N9B 3 P4
cDepartment of Clinical Neurophysiology, Institute of Neurology, University Medical Centre, Nijmegen, The Netherlands
Accepted 7 March 2006
Abstract
Biomechanical models are in use to estimate parameters such as contact forces and stability at various joints. In one class of these
models, surface electromyography (EMG) is used to address the problem of mechanical indeterminacy such that individual muscle
activation patterns are accounted for. Unfortunately, because of the stochastical properties of EMG signals, EMG based estimates
of muscle force suffer from substantial estimation errors. Recent studies have shown that improvements in muscle force estimation
can be achieved through adequate EMG processing, specifically whitening and high-pass (HP) filtering of the signals. The aim of this
paper is to determine the effect of such processing on outcomes of a biomechanical model of the lumbosacral joint and surrounding
musculature. Goodness of fit of estimated muscle moments to net moments and also estimated joint stability significantly increased
with increasing cut-off frequencies in HP filtering, whereas no effect on joint contact forces was found. Whitening resulted in
moment estimations comparable to those obtained from optimal HP filtering with cut-off frequencies over 250 Hz. Moreover,
compared to HP filtering, whitening led to a further increase in estimated joint-stability. Based on theoretical models and on our
experimental results, we hypothesize that the processing leads to an increase in pick-up area. This then would explain the
improvements from a better balance between deep and superficial motor unit contributions to the signal.
r 2006 Elsevier Ltd. All rights reserved.
Keywords: Human; Trunk model; EMG filtering; Surface electromyography; Force and moment estimation; Stability; Volume conduction;
Cross-talk
1. Introduction
Biomechanical models of muscle joint systems havebeen used to estimate joint forces or to unravel how thecentral nervous system (CNS) controls the musculoske-letal system. Because the number of muscles spanning ajoint usually exceeds the number of degrees of freedom
e front matter r 2006 Elsevier Ltd. All rights reserved.
iomech.2006.03.021
ing author. Tel.: +31 20 5988501; fax: +31 20 5988529.
ess: [email protected] (J.H. van Dieen).
of the joint, these models are mechanically undeter-mined. To address this problem, optimization has beenused to predict forces in individual muscles. Thisapproach is based on assumptions regarding strategiesthe CNS may deploy to control muscle force (Bean etal., 1988; Stokes and Gardner-Morse, 2001; van Dieen,1997; van Dieen and Kingma, 2005; Wynarsky andSchultz, 1991; Yettram and Jackman, 1982). In addi-tion, surface electromyography (EMG) has been used inmany models of human muscle joint systems including
ARTICLE IN PRESSD. Staudenmann et al. / Journal of Biomechanics 40 (2007) 900–909 901
the lower back (Cholewicki and McGill, 1994; Granataand Marras, 1995; McGill, 1992; Nussbaum andChaffin, 1998; Sparto et al., 1998; van Dieen andKingma, 2005), the elbow (Soechting and Flanders,1997), the shoulder (Buchanan et al., 1998; Laursenet al., 1998), the knee (Lloyd and Besier, 2003; Piazzaand Delp, 1996; White and Winter, 1992), and the ankle(Hof and van den Berg, 1981). EMG-based models offerthe advantage of accounting for individual or situationaldifferences in muscle activation patterns. Unfortunately,EMG-based estimates of muscle force may suffer fromsubstantial bias and estimation errors. However, recentstudies have shown improvements in muscle forceestimation from surface EMG after high-pass (HP)filtering (Potvin and Brown, 2004) and whitening(Clancy and Farry, 2000; Potvin and Brown, 2004) ofthe EMG signals.
The aim of the present study was to determine howEMG processing (i.e., HP filtering and whitening)affects outcomes of a biomechanical model of a multi-ple-muscle joint system, consisting of the lumbosacraljoint and surrounding musculature. The model out-comes comprise the estimated muscle moment, compres-sion and shear forces acting on the lumbosacral joint,and an indicator of the joint’s stability. In addition, wepresent results of analyses of the data suggesting thatHP filtering and whitening affect the relative contribu-tion of deep and superficial motor units to the EMGsignal, which could account for some of the effects onmodel outcomes.
2. Methods
2.1. Subjects and procedure
Nine healthy male subjects (age 29:2 � 7:0 years,weight 73:8 � 9:1 kg, and height 1:80 � 0:10 m) partici-pated in the experiment after signing an informedconsent. The experiment had been approved by theethics committee of the faculty of human movementsciences. Prior to the actual experiment, subjectsperformed three times seven attempted maximumisometric voluntary contractions (MVC) of the trunkmuscles as described by McGill (1991). The experimentconsisted of three consecutive isometric trunk extensionsin an upright standing position with the feet on theground, and the pelvis strapped to a frame. A cableconnected with a force transducer was attached perpen-dicular to the chest via a harness. Subjects had toperform pyramidal-shaped extension efforts, starting atrest till maximum and back to rest again. To assurecontrolled contractions, online visual feedback of theforce magnitude was provided to the subjects on acomputer screen.
2.2. Data collection
Surface EMG and force were measured simulta-neously. The force was measured with a one-dimen-sional force transducer (FUTEK L2353, advancedsensor technology, Irvine, USA), A/D converted witha sample frequency of 1000 samples/s. EMG wasrecorded using pairs of disposable Ag/AgCl surface-electrodes (Blue Sensor; 25 mm2 square active area).After abrading and cleaning the skin with alcohol, theelectrode pairs were attached with an inter-electrodedistance of 2.5 cm, unilaterally at the right side over themuscle bellies of four dorsal muscles: erector spinae (ES:T10 level), longissimus (LO: L1 level), iliocostalis (IL:L2 level), multifidus (MF: L5 level), and five ventralmuscles: external oblique lateral part (EOL: at the axialline half way between the last rib and the anterior iliacspine), anterior part (EOA: just above the anterior iliacspine), internal oblique lateral part (IOL: at thetrigonum lumbale), anterior part (IOA: above theinguinal ligament), rectus abdominus (RA: umbilicuslevel). The EMG signals were band-pass filtered between10 and 400 Hz, amplified 20 times and stored on diskwith a sample rate of 1000 samples/s (input impedance41012 O, CMRR 490 dB, 22 bits A/D conversion; Porti17, TMS, Enschede, The Netherlands).
2.3. Data analysis
The data analysis was performed in Matlab 6.5 (TheMathworks, Inc., Natick MA, USA) and consisted oftwo steps: EMG processing and mechanical modeling.
EMG processing consisted of five stages: (1a) HPfiltering using different cut-off frequencies (HPfrequency):10, 50, 100, 150, 200, 250, 300 and 400 Hz (bidirectionalfirst-order Butterworth) or (1b) adaptive whitening(fifth-order autoregressive moving average filter)(Clancy and Farry, 2000); (2) rectifying; (3) low passfiltering at 2 Hz (bidirectional first-order Butterworth);(4) subtracting noise (amplitude was estimated for asilent contraction in lying position) and (5) normal-ization to the MVC. MVC and noise trials wereprocessed using the same filter settings as with theEMG from the contraction trials.
Normalized EMG data were used as input to a trunkmuscle model assuming symmetry between right (mea-sured) and left (not measured) muscles. This assumptionwas considered reasonable, because subjects maintaineda symmetric posture, while asymmetric exertions wouldnot be resisted by the setup. When producing pureextension moments, asymmetry in normalized EMGamplitudes between left and right trunk muscles hasbeen shown to be negligible (van Dieen, 1996). Thetrunk model, that has been described in detail elsewhere(van Dieen, 1997; van Dieen and Kingma, 2005),predicted a muscle moment about the lumbosacral joint
ARTICLE IN PRESSD. Staudenmann et al. / Journal of Biomechanics 40 (2007) 900–909902
(Mmusc). To this end, muscle forces were estimated as afunction of muscle length, muscle cross-sectional area,and muscle activation as estimated by the normalizedEMG, yielding a moment estimate in arbitrary units.This allowed estimation of the phase lead betweenMmusc and the external moment due to the reactionforce in the cable (Mext) resulting from the electro-mechanical delay. Phase lead adjustment was made onthe basis of cross-correlation. Subsequently, a commongain for the estimation of forces in all muscles(representative of the maximum muscle tension) wasestimated as that which minimized the root meansquared difference (RMSD) between Mmusc and Mext.
The model assumed a linear relationship betweenEMG and muscle force, because there is no way ofestimating any deviations from non-linearity withoutmaking a priori assumptions on force sharing betweenmuscles. Therefore, we quantified goodness of fit of themodel both based on a linear and non-linear descriptionof the relationship between Mmusc and Mext. First, theRMSD between Mmusc and Mext was calculated.Second, the coefficient of correlation between Mmuscand Mext was considered. Finally, to take a potentialnon-linear relationship between Mmusc and Mext intoaccount, the RMSD between Mmusc and a second-order polynomial fit of Mmusc to Mext was calculated(delta).
The force at the L5S1-joint was calculated bysumming forces of all muscle fascicles, the gravitationalforces of all segments above L5S1, and the force in thecable. The resultant force was decomposed into ananterior shear and a compression component, based onthe inclination angle of the L5S1-joint in the sagittalplane, estimated to be 30� forward relative to the pelvisaxis system for all subjects.
L5S1-joint stability was estimated about the flexion/extension axis using procedures described by Potvin andBrown (2005), assuming a near infinite stiffness of thesteel cable, ignoring passive joint stiffness and assuminga rigid spine above L5S1. The constant of proportion-ality between muscle force and muscle stiffness (q) thatyielded stability throughout the trial was calculated asthe critical q (CQ).
The power spectral density of the ‘raw’ EMG signal(filtered at HP10) was estimated using Welch’s averagedperiodogram method (250 samples window length usinga Hanning window, 240 samples overlap).
2.4. Statistics
The statistical analysis was performed in SPSS 11.5(SPSS, Inc., Chicago Ill, USA). Repeated measures one-way ANOVA was used with HP (and muscle) as fixedfactor and RMSD, coefficient of correlation (afterFisher transformation), delta, gain, compression and
shear forces and CQ, respectively as dependent vari-ables. The significance level was set at 5%.
3. Results
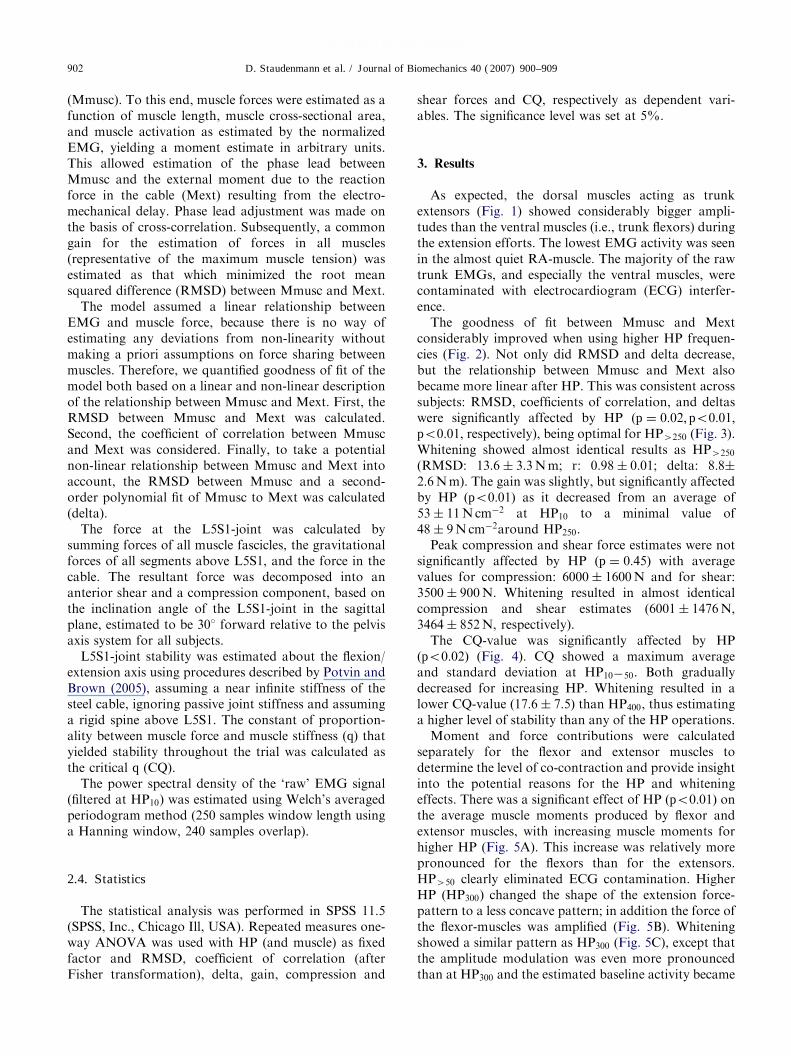
As expected, the dorsal muscles acting as trunkextensors (Fig. 1) showed considerably bigger ampli-tudes than the ventral muscles (i.e., trunk flexors) duringthe extension efforts. The lowest EMG activity was seenin the almost quiet RA-muscle. The majority of the rawtrunk EMGs, and especially the ventral muscles, werecontaminated with electrocardiogram (ECG) interfer-ence.
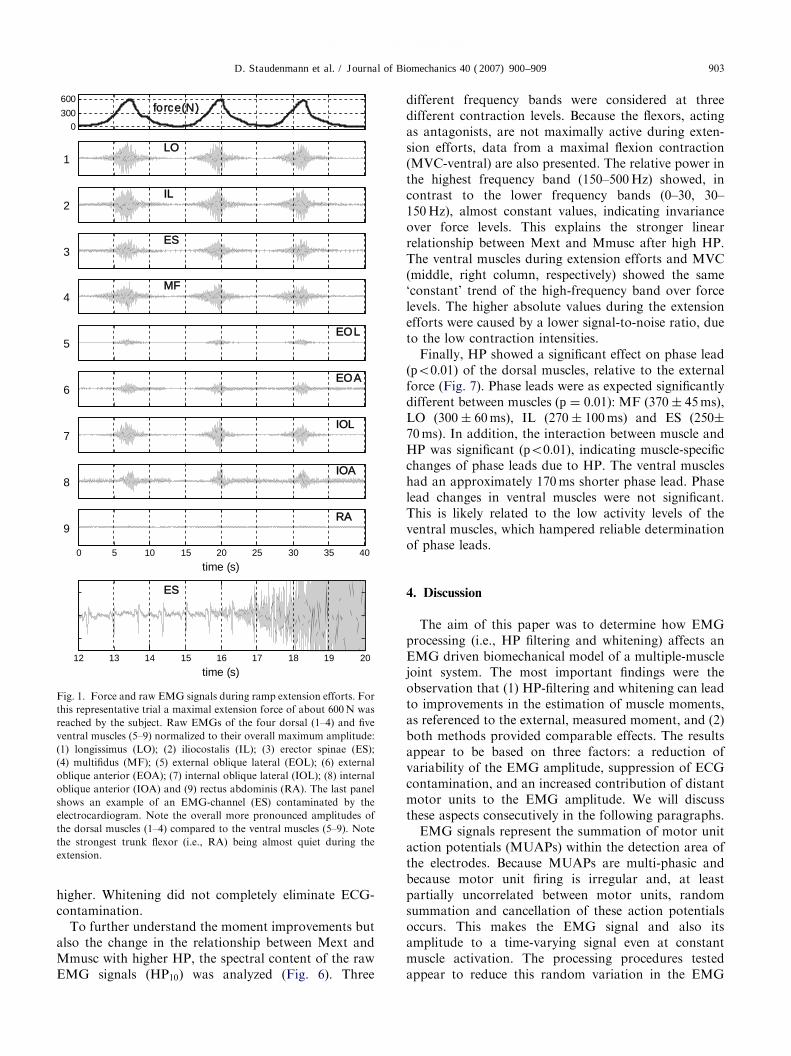
The goodness of fit between Mmusc and Mextconsiderably improved when using higher HP frequen-cies (Fig. 2). Not only did RMSD and delta decrease,but the relationship between Mmusc and Mext alsobecame more linear after HP. This was consistent acrosssubjects: RMSD, coefficients of correlation, and deltaswere significantly affected by HP (p ¼ 0:02; po0:01;po0:01, respectively), being optimal for HP4250 (Fig. 3).Whitening showed almost identical results as HP4250
(RMSD: 13:6 � 3:3 N m; r: 0:98 � 0:01; delta: 8:8�2:6 N m). The gain was slightly, but significantly affectedby HP ðpo0:01Þ as it decreased from an average of53 � 11 N cm�2 at HP10 to a minimal value of48 � 9 N cm�2around HP250.
Peak compression and shear force estimates were notsignificantly affected by HP ðp ¼ 0:45Þ with averagevalues for compression: 6000 � 1600 N and for shear:3500 � 900 N. Whitening resulted in almost identicalcompression and shear estimates (6001 � 1476 N,3464 � 852 N, respectively).
The CQ-value was significantly affected by HPðpo0:02Þ (Fig. 4). CQ showed a maximum averageand standard deviation at HP10250. Both graduallydecreased for increasing HP. Whitening resulted in alower CQ-value ð17:6 � 7:5Þ than HP400, thus estimatinga higher level of stability than any of the HP operations.
Moment and force contributions were calculatedseparately for the flexor and extensor muscles todetermine the level of co-contraction and provide insightinto the potential reasons for the HP and whiteningeffects. There was a significant effect of HP ðpo0:01Þ onthe average muscle moments produced by flexor andextensor muscles, with increasing muscle moments forhigher HP (Fig. 5A). This increase was relatively morepronounced for the flexors than for the extensors.HP450 clearly eliminated ECG contamination. HigherHP (HP300) changed the shape of the extension force-pattern to a less concave pattern; in addition the force ofthe flexor-muscles was amplified (Fig. 5B). Whiteningshowed a similar pattern as HP300 (Fig. 5C), except thatthe amplitude modulation was even more pronouncedthan at HP300 and the estimated baseline activity became
ARTICLE IN PRESS
0
300
600foforcrce(N)
1LOLO
2ILIL
3ES ES
4MFMF
5EOEOL
6EOEOA
7IOLIOL
8IOAIOA
0 5 10 15 20 25 30 35 40
9RARA
time (s)
12 13 14 15 16 17 18 19 20
time (s)
ES ES
Fig. 1. Force and raw EMG signals during ramp extension efforts. For
this representative trial a maximal extension force of about 600 N was
reached by the subject. Raw EMGs of the four dorsal (1–4) and five
ventral muscles (5–9) normalized to their overall maximum amplitude:
(1) longissimus (LO); (2) iliocostalis (IL); (3) erector spinae (ES);
(4) multifidus (MF); (5) external oblique lateral (EOL); (6) external
oblique anterior (EOA); (7) internal oblique lateral (IOL); (8) internal
oblique anterior (IOA) and (9) rectus abdominis (RA). The last panel
shows an example of an EMG-channel (ES) contaminated by the
electrocardiogram. Note the overall more pronounced amplitudes of
the dorsal muscles (1–4) compared to the ventral muscles (5–9). Note
the strongest trunk flexor (i.e., RA) being almost quiet during the
extension.
D. Staudenmann et al. / Journal of Biomechanics 40 (2007) 900–909 903
higher. Whitening did not completely eliminate ECG-contamination.
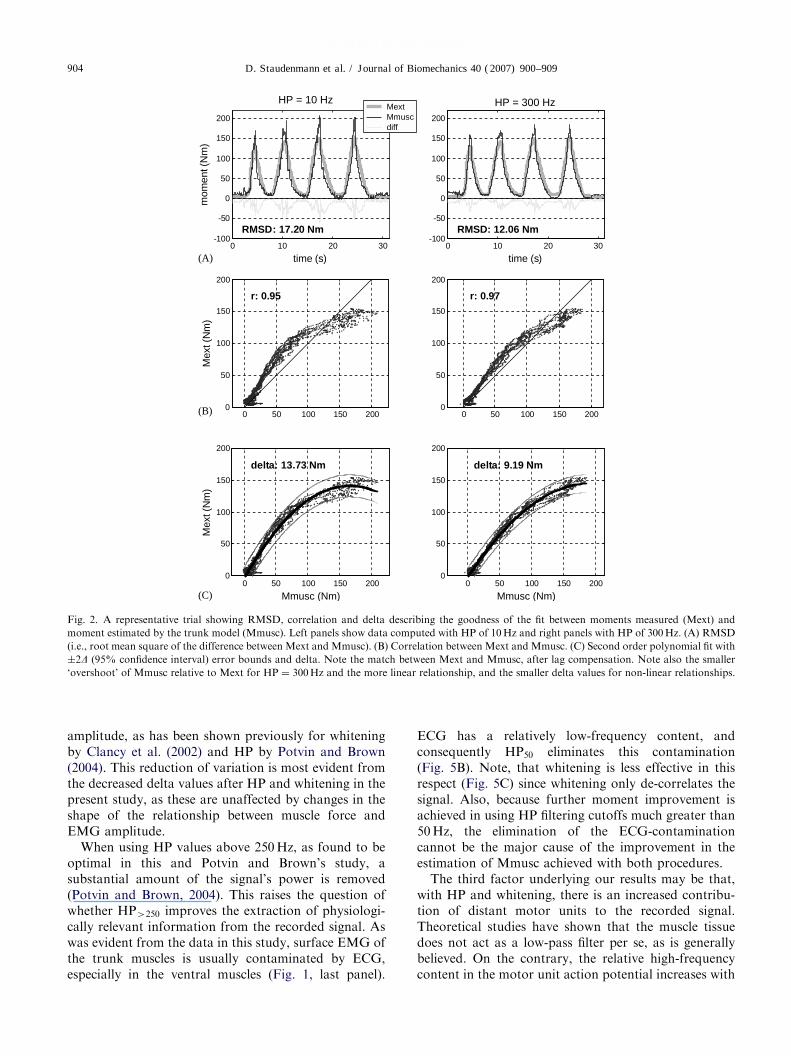
To further understand the moment improvements butalso the change in the relationship between Mext andMmusc with higher HP, the spectral content of the rawEMG signals (HP10) was analyzed (Fig. 6). Three
different frequency bands were considered at threedifferent contraction levels. Because the flexors, actingas antagonists, are not maximally active during exten-sion efforts, data from a maximal flexion contraction(MVC-ventral) are also presented. The relative power inthe highest frequency band (150–500 Hz) showed, incontrast to the lower frequency bands (0–30, 30–150 Hz), almost constant values, indicating invarianceover force levels. This explains the stronger linearrelationship between Mext and Mmusc after high HP.The ventral muscles during extension efforts and MVC(middle, right column, respectively) showed the same‘constant’ trend of the high-frequency band over forcelevels. The higher absolute values during the extensionefforts were caused by a lower signal-to-noise ratio, dueto the low contraction intensities.
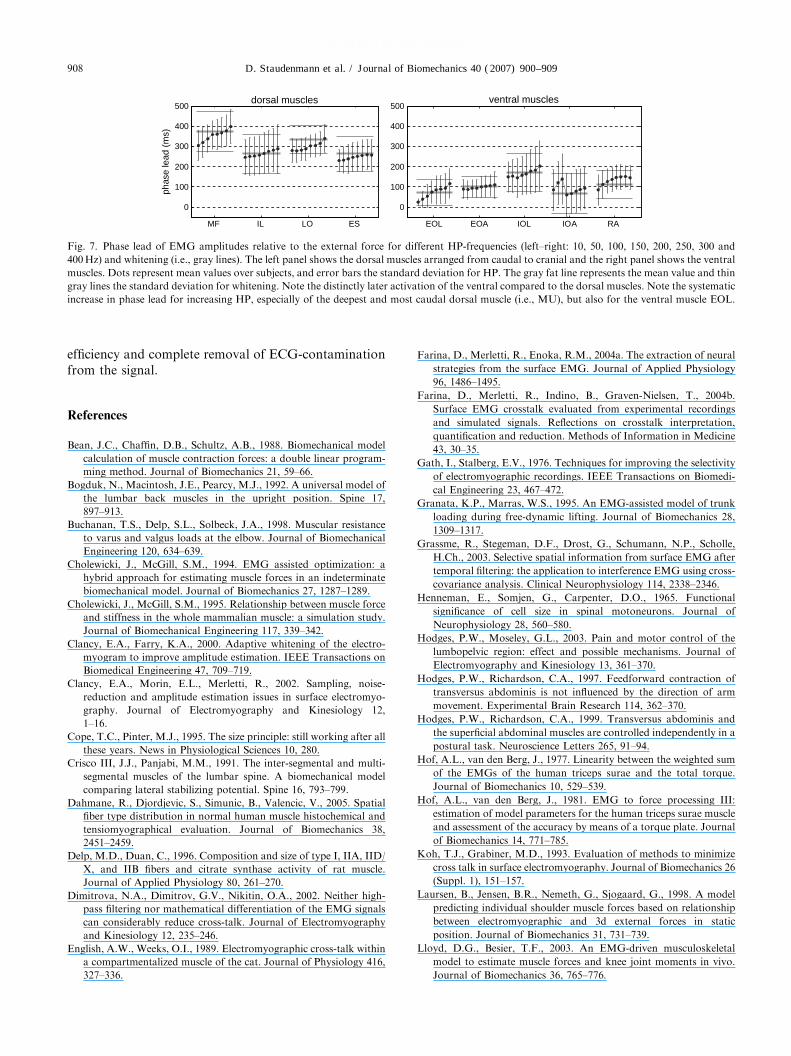
Finally, HP showed a significant effect on phase leadðpo0:01Þ of the dorsal muscles, relative to the externalforce (Fig. 7). Phase leads were as expected significantlydifferent between muscles ðp ¼ 0:01Þ: MF ð370 � 45 msÞ,LO ð300 � 60 msÞ, IL ð270 � 100 msÞ and ES ð250�70 msÞ. In addition, the interaction between muscle andHP was significant ðpo0:01Þ, indicating muscle-specificchanges of phase leads due to HP. The ventral muscleshad an approximately 170 ms shorter phase lead. Phaselead changes in ventral muscles were not significant.This is likely related to the low activity levels of theventral muscles, which hampered reliable determinationof phase leads.
4. Discussion
The aim of this paper was to determine how EMGprocessing (i.e., HP filtering and whitening) affects anEMG driven biomechanical model of a multiple-musclejoint system. The most important findings were theobservation that (1) HP-filtering and whitening can leadto improvements in the estimation of muscle moments,as referenced to the external, measured moment, and (2)both methods provided comparable effects. The resultsappear to be based on three factors: a reduction ofvariability of the EMG amplitude, suppression of ECGcontamination, and an increased contribution of distantmotor units to the EMG amplitude. We will discussthese aspects consecutively in the following paragraphs.
EMG signals represent the summation of motor unitaction potentials (MUAPs) within the detection area ofthe electrodes. Because MUAPs are multi-phasic andbecause motor unit firing is irregular and, at leastpartially uncorrelated between motor units, randomsummation and cancellation of these action potentialsoccurs. This makes the EMG signal and also itsamplitude to a time-varying signal even at constantmuscle activation. The processing procedures testedappear to reduce this random variation in the EMG
ARTICLE IN PRESS
0 10 20 30-100
-50
0
50
100
150
200
mom
ent(
Nm
)
time (s)
RMSD: 17.20 Nm
HP = 10 Hz
0 50 100 150 2000
50
100
150
200
r: 0.95
Mex
t (N
m)
0 50 100 150 2000
50
100
150
200
Mmusc (Nm)
Mex
t (N
m)
delta: 13.73 Nm
0 10 20 30-100
-50
0
50
100
150
200
time (s)
RMSD: 12.06 Nm
HP = 300 Hz
0 50 100 150 2000
50
100
150
200
r: 0.97
0 50 100 150 2000
50
100
150
200
Mmusc (Nm)
delta: 9.19 Nm
MextMmuscdiff
(A)
(B)
(C)
Fig. 2. A representative trial showing RMSD, correlation and delta describing the goodness of the fit between moments measured (Mext) and
moment estimated by the trunk model (Mmusc). Left panels show data computed with HP of 10 Hz and right panels with HP of 300 Hz. (A) RMSD
(i.e., root mean square of the difference between Mext and Mmusc). (B) Correlation between Mext and Mmusc. (C) Second order polynomial fit with
�2D (95% confidence interval) error bounds and delta. Note the match between Mext and Mmusc, after lag compensation. Note also the smaller
‘overshoot’ of Mmusc relative to Mext for HP ¼ 300 Hz and the more linear relationship, and the smaller delta values for non-linear relationships.
D. Staudenmann et al. / Journal of Biomechanics 40 (2007) 900–909904
amplitude, as has been shown previously for whiteningby Clancy et al. (2002) and HP by Potvin and Brown(2004). This reduction of variation is most evident fromthe decreased delta values after HP and whitening in thepresent study, as these are unaffected by changes in theshape of the relationship between muscle force andEMG amplitude.
When using HP values above 250 Hz, as found to beoptimal in this and Potvin and Brown’s study, asubstantial amount of the signal’s power is removed(Potvin and Brown, 2004). This raises the question ofwhether HP4250 improves the extraction of physiologi-cally relevant information from the recorded signal. Aswas evident from the data in this study, surface EMG ofthe trunk muscles is usually contaminated by ECG,especially in the ventral muscles (Fig. 1, last panel).
ECG has a relatively low-frequency content, andconsequently HP50 eliminates this contamination(Fig. 5B). Note, that whitening is less effective in thisrespect (Fig. 5C) since whitening only de-correlates thesignal. Also, because further moment improvement isachieved in using HP filtering cutoffs much greater than50 Hz, the elimination of the ECG-contaminationcannot be the major cause of the improvement in theestimation of Mmusc achieved with both procedures.
The third factor underlying our results may be that,with HP and whitening, there is an increased contribu-tion of distant motor units to the recorded signal.Theoretical studies have shown that the muscle tissuedoes not act as a low-pass filter per se, as is generallybelieved. On the contrary, the relative high-frequencycontent in the motor unit action potential increases with

ARTICLE IN PRESS
10 50 100 150 200 250 300 4005
10
15
20
25RMSD (Nm)
10 50 100 150 200 250 300 4000.9
0.92
0.94
0.96
0.98
1correlation (r)
HP (Hz)10 50 100 150 200 250 300 400
0
5
10
15
20delta (Nm)
Fig. 3. Estimates of the quality of trunk model moment estimation with different EMG-processing procedures (i.e., HP and whitening). The left
panel shows the RMSD, the middle panel the correlation and the right panel the delta between measured moment (Mext) and predicted moment
(Mmusc). Squares represent mean values over subjects and error bars represent the standard deviation for HP. The gray fat line represents the mean
value and thin gray lines the standard deviation for whitening. Note the Y-axis scaling was adapted to illustrate the effect, being marginal for the
correlations.
10 50 100 150 200 250 300 4000
10
20
30
40
50
60stability
CQ
HP (Hz)
Fig. 4. Critical q (CQ) of the stability index with different EMG-
processing procedures (i.e., HP and whitening). Squares represent
mean values over subjects and error bars represent the standard
deviation for HP. The gray fat line represents the mean value and thin
gray lines the standard deviation for whitening. Note the decrease in
CQ and the reduction of the standard deviation for increasing HP
frequencies, higher than 50 Hz.
D. Staudenmann et al. / Journal of Biomechanics 40 (2007) 900–909 905
the depth of the signal source (Dimitrova et al., 2002).This is due to the fact that the power of the non-propagating part of action potentials does not decreasewith distance as much as the power of the traveling waveand is reflected in the higher bandwidth of the totalEMG power, irrespective of the spatial filter (electrodeconfiguration) used (Dimitrova et al., 2002; Farinaet al., 2004a; Grassme et al., 2003). Therefore, byeliminating low-frequency power, HP and whiteningmight enhance the relative contribution of distant motorunits to the recorded signal. This can lead to unwanted
cross-talk on one hand (Dimitrova et al., 2002; Englishand Weeks, 1989; Farina et al., 2004b; Gath andStalberg, 1976; Koh and Grabiner, 1993; Matthews,1934; van Vugt and van Dijk, 2001; Winter et al., 1994),but also to a more balanced representation of deep andsuperficial motor units on the other hand. The latterwould be relevant only if the motor units located atdifferent depths are recruited, to some extent, indepen-dently.
Enhancement of the contribution of distant motorunits by HP and whitening could also explain the findingof an increased phase lead of the EMG of back muscles,relative to the measured force signal (Fig. 7). In animalstudies, it has been shown that small motor units, withslow and oxidative fibers, are more abundant atincreasing depth (Dahmane et al., 2005; Delp andDuan, 1996). Based on the ‘size principle’ (Cope andPinter, 1995; Henneman et al., 1965), these deeper, slowmotor units would be activated earlier than superficialfast motor units. A deep to superficial order ofrecruitment of trunk muscles has been found duringvoluntary contractions. At the dorsal side, the deepestmotor units of the MF-muscle contracted prior tosuperficial ones (Moseley et al., 2003) and on the ventralside, deeper abdominal muscles contracted prior super-ficial muscles (Hodges and Richardson, 1997). Thisfinding is consistent with the present study (Fig. 7). If adeep-to-superficial recruitment order exists in the trunkextensor muscles, this may also account for the increasein linearity of the relationship between the measuredexternal moment and the predicted muscle moment. Thenon-linearity in the reference condition (Fig. 2B, left)would reflect a disproportionate representation ofsuperficial motor units that are activated relatively late.Similarly, a weighted sum of the EMG signals of a

ARTICLE IN PRESS
10 50 100 150 200 250 300 4000
20
40
60
80
100
HP (Hz) HP (Hz)
HP (Hz) HP (Hz)
mom
ent (
Nm
)
extensor-muscles
10 50 100 150 200 250 300 4000
2
4
6
8
10flexor-muscles
15 20 25 300
1000
2000
3000
4000
5000
mF: 1006
→ →
→ →
→
→ → →
mF: 1082
forc
e (N
)fo
rce
(N)
1050300
15 20 25 300
100
200
300
400
500
mF: 82mF: 111
15 20 25 300
1000
2000
3000
4000
5000
mF: 1009
mF: 1143
time(s) time(s)
50white
15 20 25 300
100
200
300
400
500
mF: 81
mF: 152
(A)
(B)
(C)
Fig. 5. Moment and force predictions of the trunk model in one representative trial with different EMG-processing procedures (i.e., HP and
whitening). The left and right panels show results of the extensor- and flexor-muscles, respectively. (A) Mean moment estimation (squares) over all
subjects (error bars: standard deviation). (B) Muscle forces for three HP (10, 50 and 300 Hz) and (C) Muscle force for HP50 and whitening (white).
Horizontal lines represent the corresponding mean force (mF). Note the less concave extensor force pattern (B, C) for high HP (300 Hz) and
whitening. Note the prediction of higher maximal co-contraction (flexors) for high HP and whitening. Note the ECG-contamination at low HP
(10 Hz) and whitening.
D. Staudenmann et al. / Journal of Biomechanics 40 (2007) 900–909906
group of synergists yielded a more linear relationship toexternal force than the relationship for each of thesynergists considered independently (Hof and van denBerg, 1977).
The proportionality constant between muscle forceand stiffness (q) has been estimated to be between 0.5and 50 (Cholewicki and McGill, 1995; Crisco andPanjabi, 1991; Stokes and Gardner-Morse, 2003) andour results fell within this wide range (Fig. 4). Predictedjoint stability increased with HP, as reflected bydecreasing CQ values. This effect was due to predictionof an increased activity of muscles in the low-intensitypart of the contractions (between the ramps). This mightagain be accounted for by enhanced representation inthe EMG signals from deeper muscles, which have beenshown to be active earlier and more tonically (Hodges
and Moseley, 2003; Hodges and Richardson, 1999).Whitening predicted even higher stability than HPfiltering. This may be due to the limitations of thistechnique in low-intensity contractions, where whiteningmay overestimate muscle activity due to the low signal-to-noise ratio (Clancy et al., 2002), although weattempted to correct for this by the subtraction ofnoise-levels.
A limitation of the present study is that there may notbe one optimal EMG processing parameter for allmuscles of the human body. Depending on theanatomical structure underlying the electrodes, crosstalkmay be more or less problematic. For instance, thedeepest extensor muscle (i.e., MF) having an substantialphysiological cross-section (Bogduk et al., 1992) hasbeen shown to be measured inaccurately when using
ARTICLE IN PRESS
13 13 10
17 10 6LO
10 9 7
18 11 7
IL
11 11 9
2111 6
ES
low med high low med high low med high
20 21 17
10 7 4
MF
7 10 11
48
16 10
extension efforts
EO
L
5 8 9
45
2011
EO
A9 8 6
2611 7
IOL
19 14 13
13 9 8
IOA
12 14 1457
3516
force level (%)
RA
4 2 2
3726 20
EO
L
MVC-ventral
2 3 2
2918 14
EO
A
6 4 4
4730
19
IOL
10 3 4
21 19 13
IOA
3 3 2
2811 6
RA
0 - 3030 - 150150 - 500
Fig. 6. Spectral content of the raw EMG signals (filtered at HP10) during extension efforts (left and middle column) and during MVC of the ventral
muscles (right column). The left row shows the four dorsal muscles and the middle/right rows show the five ventral muscles. Stacked bars represent
the proportional relative power for three frequency bands (i.e., 0–30, 30–150 and 150–500 Hz) distributed over the measured frequency bandwidth.
White and black numbers indicate the percentage of the power at the corresponding frequency interval (0–30 and 150–500 Hz, respectively). Left to
the right bars show the spectral content at three contraction levels: low ðo30%Þ, medium ð30%omedo70%Þ and high ð470%Þ, respectively, of
maximal extension (left and middle column) and ventral (right column) force. Note the high power at 0–30 Hz for low contraction levels (white bar),
especially for the ventral muscles that showed strong electrocardiogram contamination and the almost constant power between contraction levels of
the high-frequency content (black bar). Note also the considerably smaller power for the ventral muscles at 150–500 Hz (black bar) during MVC
(right row) compared to the co-contraction during the extension efforts (middle row).
D. Staudenmann et al. / Journal of Biomechanics 40 (2007) 900–909 907
surface EMG (Stokes et al., 2003). Our results suggestthat HP filtering or whitening the EMG signalsmight provide more accurate measurements for thisparticular muscle. On the other hand, for instance onthe ventral side, where the abdominal muscles (e.g.,EOL, IOA, RA) are super-imposed in relatively thinlayers (Urquhart et al., 2005), the detection depthshould preferably be minimized. However, it shouldbe acknowledged that when using a biomechanicalmodel, the predictions can only be validated at thelevel of an overall output (the predicted moment) thatmay not be very sensitive to cross-talk of a particularmuscle. In addition, the effect of enhancing depthwith higher HP, showed consistent positive effects(e.g., improvement of moment estimations) in staticconditions, but might not be extendable to dynamicconditions.
5. Conclusion
HP filtering and whitening of surface EMG signals,used as inputs to a model of muscle joint systems, canhave substantial effects on EMG-based model out-comes. With a sensible choice of processing parameters,model validity can be enhanced. In the present study,using HP4250 improved the estimates of joint moments.Peak joint forces were not affected by EMG processing,but joint stability predictions increased, whereas thevariability of this prediction decreased. Whiteningshowed similar results to HP4250 for all model out-comes, except for predicted stability, which was higherafter whitening. The results suggest that HP filtering andwhitening enhance the relative contribution of deepermotor units to the surface EMG signal, with HP-filtering having the additional benefits of computational
ARTICLE IN PRESS
MF IL LO ES
0
100
200
300
400
500
phas
ele
ad (
ms)
dorsal muscles
EOL EOA IOL IOA RA
0
100
200
300
400
500ventral muscles
Fig. 7. Phase lead of EMG amplitudes relative to the external force for different HP-frequencies (left–right: 10, 50, 100, 150, 200, 250, 300 and
400 Hz) and whitening (i.e., gray lines). The left panel shows the dorsal muscles arranged from caudal to cranial and the right panel shows the ventral
muscles. Dots represent mean values over subjects, and error bars the standard deviation for HP. The gray fat line represents the mean value and thin
gray lines the standard deviation for whitening. Note the distinctly later activation of the ventral compared to the dorsal muscles. Note the systematic
increase in phase lead for increasing HP, especially of the deepest and most caudal dorsal muscle (i.e., MU), but also for the ventral muscle EOL.
D. Staudenmann et al. / Journal of Biomechanics 40 (2007) 900–909908
efficiency and complete removal of ECG-contaminationfrom the signal.
References
Bean, J.C., Chaffin, D.B., Schultz, A.B., 1988. Biomechanical model
calculation of muscle contraction forces: a double linear program-
ming method. Journal of Biomechanics 21, 59–66.
Bogduk, N., Macintosh, J.E., Pearcy, M.J., 1992. A universal model of
the lumbar back muscles in the upright position. Spine 17,
897–913.
Buchanan, T.S., Delp, S.L., Solbeck, J.A., 1998. Muscular resistance
to varus and valgus loads at the elbow. Journal of Biomechanical
Engineering 120, 634–639.
Cholewicki, J., McGill, S.M., 1994. EMG assisted optimization: a
hybrid approach for estimating muscle forces in an indeterminate
biomechanical model. Journal of Biomechanics 27, 1287–1289.
Cholewicki, J., McGill, S.M., 1995. Relationship between muscle force
and stiffness in the whole mammalian muscle: a simulation study.
Journal of Biomechanical Engineering 117, 339–342.
Clancy, E.A., Farry, K.A., 2000. Adaptive whitening of the electro-
myogram to improve amplitude estimation. IEEE Transactions on
Biomedical Engineering 47, 709–719.
Clancy, E.A., Morin, E.L., Merletti, R., 2002. Sampling, noise-
reduction and amplitude estimation issues in surface electromyo-
graphy. Journal of Electromyography and Kinesiology 12,
1–16.
Cope, T.C., Pinter, M.J., 1995. The size principle: still working after all
these years. News in Physiological Sciences 10, 280.
Crisco III, J.J., Panjabi, M.M., 1991. The inter-segmental and multi-
segmental muscles of the lumbar spine. A biomechanical model
comparing lateral stabilizing potential. Spine 16, 793–799.
Dahmane, R., Djordjevic, S., Simunic, B., Valencic, V., 2005. Spatial
fiber type distribution in normal human muscle histochemical and
tensiomyographical evaluation. Journal of Biomechanics 38,
2451–2459.
Delp, M.D., Duan, C., 1996. Composition and size of type I, IIA, IID/
X, and IIB fibers and citrate synthase activity of rat muscle.
Journal of Applied Physiology 80, 261–270.
Dimitrova, N.A., Dimitrov, G.V., Nikitin, O.A., 2002. Neither high-
pass filtering nor mathematical differentiation of the EMG signals
can considerably reduce cross-talk. Journal of Electromyography
and Kinesiology 12, 235–246.
English, A.W., Weeks, O.I., 1989. Electromyographic cross-talk within
a compartmentalized muscle of the cat. Journal of Physiology 416,
327–336.
Farina, D., Merletti, R., Enoka, R.M., 2004a. The extraction of neural
strategies from the surface EMG. Journal of Applied Physiology
96, 1486–1495.
Farina, D., Merletti, R., Indino, B., Graven-Nielsen, T., 2004b.
Surface EMG crosstalk evaluated from experimental recordings
and simulated signals. Reflections on crosstalk interpretation,
quantification and reduction. Methods of Information in Medicine
43, 30–35.
Gath, I., Stalberg, E.V., 1976. Techniques for improving the selectivity
of electromyographic recordings. IEEE Transactions on Biomedi-
cal Engineering 23, 467–472.
Granata, K.P., Marras, W.S., 1995. An EMG-assisted model of trunk
loading during free-dynamic lifting. Journal of Biomechanics 28,
1309–1317.
Grassme, R., Stegeman, D.F., Drost, G., Schumann, N.P., Scholle,
H.Ch., 2003. Selective spatial information from surface EMG after
temporal filtering: the application to interference EMG using cross-
covariance analysis. Clinical Neurophysiology 114, 2338–2346.
Henneman, E., Somjen, G., Carpenter, D.O., 1965. Functional
significance of cell size in spinal motoneurons. Journal of
Neurophysiology 28, 560–580.
Hodges, P.W., Moseley, G.L., 2003. Pain and motor control of the
lumbopelvic region: effect and possible mechanisms. Journal of
Electromyography and Kinesiology 13, 361–370.
Hodges, P.W., Richardson, C.A., 1997. Feedforward contraction of
transversus abdominis is not influenced by the direction of arm
movement. Experimental Brain Research 114, 362–370.
Hodges, P.W., Richardson, C.A., 1999. Transversus abdominis and
the superficial abdominal muscles are controlled independently in a
postural task. Neuroscience Letters 265, 91–94.
Hof, A.L., van den Berg, J., 1977. Linearity between the weighted sum
of the EMGs of the human triceps surae and the total torque.
Journal of Biomechanics 10, 529–539.
Hof, A.L., van den Berg, J., 1981. EMG to force processing III:
estimation of model parameters for the human triceps surae muscle
and assessment of the accuracy by means of a torque plate. Journal
of Biomechanics 14, 771–785.
Koh, T.J., Grabiner, M.D., 1993. Evaluation of methods to minimize
cross talk in surface electromyography. Journal of Biomechanics 26
(Suppl. 1), 151–157.
Laursen, B., Jensen, B.R., Nemeth, G., Sjogaard, G., 1998. A model
predicting individual shoulder muscle forces based on relationship
between electromyographic and 3d external forces in static
position. Journal of Biomechanics 31, 731–739.
Lloyd, D.G., Besier, T.F., 2003. An EMG-driven musculoskeletal
model to estimate muscle forces and knee joint moments in vivo.
Journal of Biomechanics 36, 765–776.
ARTICLE IN PRESSD. Staudenmann et al. / Journal of Biomechanics 40 (2007) 900–909 909
Matthews, B.H.C., 1934. A special purpose amplifier. Journal of
Physiology 60, 435–443.
McGill, S.M., 1991. Electromyographic activity of the abdominal and
low back musculature during the generation of isometric and
dynamic axial trunk torque: implications for lumbar mechanics.
Journal of Orthopaedic Research 9, 91–103.
McGill, S.M., 1992. A myoelectrically based dynamic three-dimen-
sional model to predict loads on lumbar spine tissues during lateral
bending. Journal of Biomechanics 25, 395–414.
Moseley, G.L., Hodges, P.W., Gandevia, S.C., 2003. External
perturbation of the trunk in standing humans differentially
activates components of the medial back muscles. Journal of
Physiology 547, 581–587.
Nussbaum, M.A., Chaffin, D.B., 1998. Lumbar muscle force estima-
tion using a subject-invariant 5-parameter EMG-based model.
Journal of Biomechanics 31, 667–672.
Piazza, S.J., Delp, S.L., 1996. The influence of muscles on knee flexion
during the swing phase of gait. Journal of Biomechanics 29, 723–
733.
Potvin, J.R., Brown, S.H., 2004. Less is more: high pass filtering, to
remove up to 99% of the surface EMG signal power, improves
EMG-based biceps brachii muscle force estimates. Journal of
Electromyography and Kinesiology 14, 389–399.
Potvin, J.R., Brown, S.H., 2005. An equation to calculate individual
muscle contributions to joint stability. Journal of Biomechanics 38,
973–980.
Soechting, J.F., Flanders, M., 1997. Evaluating an integrated
musculoskeletal model of the human arm. Journal of Biomecha-
nical Engineering 119, 93–102.
Sparto, P.J., Parnianpour, M., Marras, W.S., Granata, K.P., Reinsel,
T.E., Simon, S., 1998. Effect of electromyogram-force relationships
and method of gain estimation on the predictions of an
electromyogram-driven model of spinal loading. Spine 23, 423–429.
Stokes, I.A., Gardner-Morse, M., 2001. Lumbar spinal muscle
activation synergies predicted by multi-criteria cost function.
Journal of Biomechanics 34, 733–740.
Stokes, I.A., Gardner-Morse, M., 2003. Spinal stiffness increases
with axial load: another stabilizing consequence of muscle
action. Journal of Electromyography Kinesiology 13,
397–402.
Stokes, I.A., Henry, S.M., Single, R.M., 2003. Surface EMG electrodes
do not accurately record from lumbar multifidus muscles. Clinical
Biomechanics (Bristol, Avon) 18, 9–13.
Urquhart, D.M., Barker, P.J., Hodges, P.W., Story, I.H., Briggs, C.A.,
2005. Regional morphology of the transversus abdominis and
obliquus internus and externus abdominis muscles. Clinical
Biomechanics (Bristol, Avon) 20, 233–241.
van Dieen, J.H., 1996. Asymmetry of erector spinae muscle activity in
twisted postures and consistency of muscle activation patterns
across subjects. Spine 21, 2651–2661.
van Dieen, J.H., 1997. Are recruitment patterns of the trunk
musculature compatible with a synergy based on the maximization
of endurance? Journal of Biomechanics 30, 1095–1100.
van Dieen, J.H., Kingma, I., 2005. Effects of antagonistic co-
contraction on differences between electromyography based and
optimization based estimates of spinal forces. Ergonomics 48, 411–
426.
van Vugt, J.P., van Dijk, J.G., 2001. A convenient method to reduce
crosstalk in surface. EMG. Cobb award-winning article, 2001.
Clinical Neurophysiology 112, 583–592.
White, S.C., Winter, D.A., 1992. Predicting muscle forces in gait from
EMG signals and musculotendon kinematics. Journal of Electro-
myography and Kinesiology 2, 217–231.
Winter, D.A., Fuglevand, A.J., Archer, S.E., 1994. Crosstalk in surface
electromyography: theoretical and practical estimates. Journal of
Electromyography and Kinesiology 4, 15–26.
Wynarsky, G.T., Schultz, A.B., 1991. Optimization of skeletal
configuration: studies of scoliosis correction biomechanics. Journal
of Biomechanics 24, 721–732.
Yettram, A.L., Jackman, M.J., 1982. Structural analysis for the forces
in the human spinal column and its musculature. Journal of
Biomedical Engineering 4, 118–124.