Effects of chronic low back pain on trunk coordination and back muscle activity during walking:...
18
Claudine J. C. Lamoth Onno G. Meijer Andreas Daffertshofer Paul I. J. M. Wuisman Peter J. Beek Effects of chronic low back pain on trunk coordination and back muscle activity during walking: changes in motor control Received: 8 June 2004 Accepted: 15 September 2004 Published online: 29 April 2005 Ó Springer-Verlag 2005 Abstract Low back pain (LBP) is often accompanied by changes in gait, such as a decreased (preferred) walking velocity. Previous studies have shown that LBP diminishes the normal velocity-induced transverse counter-rotation between thorax and pelvis, and that it globally af- fects mean erector spinae (ES) activity. The exact nature and cau- sation of these effects, however, are not well understood. The aim of the present study was to examine in de- tail the effect of walking velocity on global trunk coordination and ES activity as well as their variability to gain further insights into the effects of non-specific LBP on gait. The study included 19 individuals with non-specific LBP and 14 healthy controls. Gait kinematics and ES activity were recorded during tread- mill walking at (1) a self-selected (comfortable) velocity, and (2) sequentially increased velocities from 1.4 up to maximally 7.0 km/h. Pain intensity, fear of movement and disability were measured before the experiment. The angular movements of thorax, lumbar and pelvis were recorded in three dimensions. ES activity was recorded with pairs of surface electrodes. Trunk–pelvis coordination and mean amplitude of ES activity were analyzed. In addi- tion, invariant and variant proper- ties of trunk kinematics and ES activity were studied using principal component analysis (PCA). Com- fortable walking velocity was signif- icantly lower in the LBP participants. In the transverse plane, the normal velocity-induced change in pelvis–thorax coordination from more in-phase to more antiphase was diminished in the LBP partici- pants, while lumbar and pelvis rotations were more in-phase com- pared to the control group. In the frontal plane, intersegmental timing was more variable in the LBP than in the control participants, with additional irregular movements of the thorax. Rotational amplitudes were not significantly different be- tween the LBP and control partici- pants. In the LBP participants, the pattern of ES activity was affected in terms of increased (residual) vari- ability, timing deficits, amplitude modifications and frequency chan- ges. The gait of the LBP participants was characterized by a more rigid and less variable kinematic coordi- nation in the transverse plane, and a less tight and more variable coordi- nation in the frontal plane, accom- panied by poorly coordinated activity of the lumbar ES. Pain intensity, fear of movement and disability were all unrelated to the observed changes in coordination, suggesting that the observed changes in trunk coordination and ES activ- Eur Spine J (2006) 15: 23–40 DOI 10.1007/s00586-004-0825-y ORIGINAL ARTICLE C. J. C. Lamoth O. G. Meijer A. Daffertshofer P. J. Beek Institute for Fundamental and Clinical Human Movement Sciences, Faculty of Human Movement Sciences, Vrije Universiteit, Van der Boechorststraat 9, 1081 BT Amsterdam, The Netherlands C. J. C. Lamoth (&) P. I. J. M. Wuisman Department of Orthopaedic Surgery, Medical Center Vrije Universiteit, Amsterdam, The Netherlands E-mail: [email protected] Tel.: +31-20-5988522 Fax: +31-20-5988529
Transcript of Effects of chronic low back pain on trunk coordination and back muscle activity during walking:...

Claudine J. C. Lamoth
Onno G. Meijer
Andreas Daffertshofer
Paul I. J. M. Wuisman
Peter J. Beek
Effects of chronic low back pain on trunkcoordination and back muscle activity duringwalking: changes in motor control
Received: 8 June 2004Accepted: 15 September 2004Published online: 29 April 2005� Springer-Verlag 2005
Abstract Low back pain (LBP) isoften accompanied by changes ingait, such as a decreased (preferred)walking velocity. Previous studieshave shown that LBP diminishes thenormal velocity-induced transversecounter-rotation between thoraxand pelvis, and that it globally af-fects mean erector spinae (ES)activity. The exact nature and cau-sation of these effects, however, arenot well understood. The aim of thepresent study was to examine in de-tail the effect of walking velocity onglobal trunk coordination and ESactivity as well as their variability togain further insights into the effectsof non-specific LBP on gait. Thestudy included 19 individuals withnon-specific LBP and 14 healthycontrols. Gait kinematics and ESactivity were recorded during tread-mill walking at (1) a self-selected(comfortable) velocity, and (2)sequentially increased velocitiesfrom 1.4 up to maximally 7.0 km/h.Pain intensity, fear of movement anddisability were measured before theexperiment. The angular movementsof thorax, lumbar and pelvis wererecorded in three dimensions. ESactivity was recorded with pairs ofsurface electrodes. Trunk–pelviscoordination and mean amplitude ofES activity were analyzed. In addi-tion, invariant and variant proper-ties of trunk kinematics and ES
activity were studied using principalcomponent analysis (PCA). Com-fortable walking velocity was signif-icantly lower in the LBPparticipants. In the transverse plane,the normal velocity-induced changein pelvis–thorax coordination frommore in-phase to more antiphasewas diminished in the LBP partici-pants, while lumbar and pelvisrotations were more in-phase com-pared to the control group. In thefrontal plane, intersegmental timingwas more variable in the LBP thanin the control participants, withadditional irregular movements ofthe thorax. Rotational amplitudeswere not significantly different be-tween the LBP and control partici-pants. In the LBP participants, thepattern of ES activity was affected interms of increased (residual) vari-ability, timing deficits, amplitudemodifications and frequency chan-ges. The gait of the LBP participantswas characterized by a more rigidand less variable kinematic coordi-nation in the transverse plane, and aless tight and more variable coordi-nation in the frontal plane, accom-panied by poorly coordinatedactivity of the lumbar ES. Painintensity, fear of movement anddisability were all unrelated to theobserved changes in coordination,suggesting that the observed changesin trunk coordination and ES activ-
Eur Spine J (2006) 15: 23–40DOI 10.1007/s00586-004-0825-y ORIGINAL ARTICLE
C. J. C. Lamoth Æ O. G. MeijerA. Daffertshofer Æ P. J. BeekInstitute for Fundamental and ClinicalHuman Movement Sciences,Faculty of Human Movement Sciences,Vrije Universiteit,Van der Boechorststraat 9, 1081 BTAmsterdam, The Netherlands
C. J. C. Lamoth (&) Æ P. I. J. M. WuismanDepartment of Orthopaedic Surgery,Medical Center Vrije Universiteit,Amsterdam, The NetherlandsE-mail: [email protected].: +31-20-5988522Fax: +31-20-5988529

Introduction
In individuals with low back pain (LBP), gait is oftendisordered. Although it appears to be a consistentfinding that individuals with LBP walk more slowly thanpain-free individuals [23, 24, 27, 47], it is at present notclear why LBP is accompanied by slower walking sincethe effects of LBP on gait are not well understood. It hasbeen suggested that slower walking is a reflection of thepresence of pain and/or fear-avoidance behavior asso-ciated with pain and may reflect an attempt to reducepain by restricting movements of the spine [1, 57, 63].Individuals with acute induced pain as well as those withchronic LBP show increased activity levels of the lumbarerector spinae (LES) during the swing phase of gait,when this muscle is normally hardly active [3]. Thesechanges in muscle activity are often assumed to ‘‘guard’’or ‘‘splint’’ the spine in individuals with LBP [3, 29, 59].Nevertheless, individuals with LBP exhibit a normalrange of movement during walking despite the presenceof pain [27] and walking for about 10 min has beenfound to actually decrease the pain during acute LBP[50].
Apart from changes in mean muscle activity, LBPappears to be accompanied by various task-specificchanges in muscular control which become manifest asaltered patterns of muscle recruitment [16, 18, 20, 53]. Ina previous study on the impact of induced acute pain inhealthy individuals, we found that acute pain does notalter the trunk coordination during walking at differentvelocities [26]. However, acute pain affects muscularcontrol in terms of increased (residual) variability,reflecting timing deficits and changes in the frequencycontent while leaving the global pattern of LES activityintact. In contrast, fear induced in healthy individualshas no effect at all on gait coordination.
These findings appear to contradict the assumptionthat individuals with LBP alter motor control by way ofprotective guarding or splinting [3, 32, 59]. Alternatively,one may hypothesize that individuals with LBP havedifficulty in adequately controlling their movements, andhence in dealing with perturbations, and therefore adapta slower walking velocity allowing more precise control.Under normal circumstances, walking is a highly flexibleand adaptive activity that is continuously altered so as tomeet both environmental and internal requirements. Innormal walking, coordinated patterns of trunk andpelvis rotations and trunk muscle activity are importantfor the maintenance of dynamic equilibrium, to reduce
the energy cost and to effectively deal with perturbationsduring locomotion [48, 52, 62, 64].
In unimpaired gait, transverse thorax–pelvis coor-dination evolves from more or less in-phase (synchro-nous pelvis and thorax rotation in the same direction)towards more antiphase coordination (synchronouscounter-rotation) as walking velocity increases [25].Previous studies on the effect of LBP on thorax–pelviscoordination during gait have shown that individualswith LBP are able to walk faster than their self-selectedcomfortable walking velocity but encounter problems inadjusting thorax–pelvis coordination with increasingwalking velocity from more in-phase toward more an-tiphase coordination [27].
At present, it is not clear if changes in trunk coor-dination in chronic LBP are a direct effect of LBP assuch or are mediated by pain, fear of movement ordisability. Little is known about the relationship be-tween changes in trunk coordination and changes inmuscle activity during gait in LBP. The only study (asfar as we know) that examined recruitment patterns ofES muscles during gait in LBP [59] showed an earlieronset of the LES in individuals with LBP, with identicalprofiles to those observed in the healthy control group.However, in this study, data were averaged over stridesand subjects within each group yielding a mean pictureof the EMG profiles for LBP and control participants.In this coarse-grained analysis, information about vari-ability may have been lost.
Variability of movement patterns in LBP has receivedlittle attention, with only a few studies addressing theissue of variability [16, 20, 60], despite its potential as awindow into motor control. Most studies on movementdisorders inherently assume that motor variability (e.g.,in kinematics, strides and muscle activity) is a purelyrandom phenomenon, and therefore typically focus onmean values and ensemble averages, which may maskeventual structures in the variability of motor data.Within the field of motor control, however, it is by nowwell recognized that motor variability is not simply areflection of random noise but often contains (hidden)features and regularities that may provide insight intoboth healthy and pathological motor control [8, 10, 11,14, 17, 33, 43].
The aim of the present study was to examine in detailthe consequences of LBP on trunk–pelvis coordinationand ES muscle activity when walking at a self-selectedvelocity and at a wide range of prescribed velocities bothlower and higher than the self-selected velocity. The
ity were a direct consequence of LBPper se. Clinically, the results implythat conservative therapy shouldconsider gait training as well as
exercises aimed at improving bothintersegmental and muscle coordi-nation.
Keywords Chronic low back pain ÆWalking Æ Trunk coordination ÆMuscle coordination Æ Variability
24

analysis focused on coordination and variability ofmovement patterns, in addition to using more conven-tional measures such as amplitudes and stride length.Gaining more insight into how motor control is changedin LBP may be useful for diagnostic purposes and mayhelp to quantify pathological movement patterns inassessing the efficacy of treatment strategies.
Materials and methods
Participants
Data were collected from 22 individuals with chronicnon-specific LBP (13 women, 9 men) and 17 healthyindividuals (8 women, 9 men). Due to storage failure, theEMG data of three of the LBP group (two women, oneman) and three of the healthy group (all women) werelost, as a result of which the data had to be restricted to33 individuals. LBP participants had a mean age of38 years (range 21–52 years), a mean weight of 74.4 kg(range 49–97 kg), a mean height of 1.73 m (range 1.54–1.88 m), and the controls had a mean age of 31 years(range 20–46 years), a mean weight of 72.5 kg (range52–105 kg) and a mean height of 1.80 m (range 1.58–1.98 m). Weight and height were not significantly dif-ferent between the two groups. Age differed significantlybetween the two groups (t=2.0, P<0.02); however, noeffect of age (or gender) was found on any of the de-pendent variables.
Individuals with LBP were recruited from cooperat-ing exercise therapy practices. At the time of enrolmentin the study, the treatment had not yet started. None ofthe individuals with low back pain received disabilitypayment because of LBP, 14 participants with LBP hadpaid work, 3 were housewives and 2 were students. Theaverage duration of the back pain was 1.2 years (range3.5 months to 3 years).
The procedure was approved by the Ethics Com-mittee of the Medical Centre of the Free University. Allparticipants gave their written informed consent toparticipate in the study. The inclusion criteria for theLBP participants were: (1) medical diagnosis of non-specific LBP with pain and symptoms persisting forlonger than 3 months for which medical treatment hadbeen sought, (2) age between 18 and 65 years, and (3)ambulation without a walking aid. Participants wereexcluded if they had: (1) LBP of traumatic or structuralorigin, (2) LBP with neurological symptoms or painradiation in the lower leg(s), (3) previous back surgery,(4) spinal tumors or infections, or (5) neurological and/or musculoskeletal disorders unrelated to LBP. All LBPparticipants underwent standard neurological andorthopedic physical examinations, including an assess-ment of range of movement of the trunk and lowerextremities, of possible neurological symptoms and of
Waddell’s non-organic signs [61]. An orthopedic sur-geon performed the examination. Four LBP participantsreported pain radiation in the buttock region and upperleg (three at the right side).
The healthy participants were recruited fromemployees of the university and of the Medical Centre ofthe Free University and had no history of LBP or anyother musculoskeletal disorders.
Procedure
Prior to the experiment, the LBP participants completedthe Tampa scale for kinesiophobia (TSK) to assess pain-related fear of movement [56] (scores <37 within normallimits), the Roland disability questionnaire (RDQ) [44](0=no disabilities, 24=severe disabilities) and visualanalogue scales (VAS) for actual pain intensity ratingsand anticipated pain (0=no pain, 10=most severepain). VAS for measuring actual pain intensity were alsoadministered immediately after the experimental walk-ing trial.
The experiment was performed on a treadmill. Beforethe recording began, participants walked for a fewminutes on the treadmill at different velocities to becomefamiliar with the treadmill and the experimental setup.Participants were instructed to walk as naturally aspossible in the middle of the belt. First, recordings wereperformed at a self-selected (comfortable) walkingvelocity. Subsequently, treadmill velocity was increasedsequentially with increments of 0.8 km/h from 1.4 km/hto a maximally attainable walking velocity of up to7.0 km/h, allowing the participants to accustom them-selves to each higher velocity level in a smooth anduniform manner. Participants indicated when the walk-ing velocity was too high, at which point the experimentwas stopped; the preceding velocity level was then des-ignated as their ‘‘maximally attainable velocity’’.
Recording
Angular rotations of the trunk segments were recordedusing a 3D active marker movement registration system(Optotrak 3020, Northern Digital, Ontario, Canada).Clusters of three markers were fixed on a light platemounted on rigid fixtures and attached to the trunk atthe level of Th3, L2 (spinous processes), and the sacrumbetween posterior superior iliac spine using neoprenebands. The marker clusters defined the thoracic, lumbarand pelvic segments, respectively. The fixtures at thelevel of Th3 and L2 were designed to span the ES muscleand the spinous process. To be able to detect charac-teristic moments of the gait cycle, infrared light-emittingmarkers were placed on the heels and the fifth meta-tarsophalangeal joint.
25

In the area of electrode placement the skin wasshaved and cleaned with alcohol. EMG activity from theES muscle (mainly m. longissimus) left and right at thelevel of Th12, L2 and L4 process, was recorded withpairs of surface electrodes (Blue sensor N-00-S; Med-icotest, Denmark; AG/AgCl discs, 1 cm diameter, 2 cminterelectrode distance). Electrodes were placed at adistance of 3 cm lateral from the vertebral column [55].
At each walking velocity, kinematic data were sam-pled at 100 Hz and EMG data at 1 kHz (Porti5; TMS-international, Enschede, The Netherlands), both for30 s. The recordings of kinematic and EMG data weresynchronized by means of a single trigger pulse startingboth. All raw data were exported for analysis usingMatlab 6.50 (Mathworks, Natic, Mass.). Before eachcondition a reference measurement was taken with theparticipant standing quietly upright (anatomical posi-tion).
Data processing
Kinematic data were analyzed in a global referenceframe in the form of fixed xyz-Euclidian coordinateswith the x-axis corresponding to the line of progression,the y-axis perpendicular to the x-axis and parallel to theground and the z-axis pointing vertically upwards. Thecluster markers represented the motion of the trunksegments. From each marker cluster a segment referenceframe was defined and transformed to a new coordinatesystem oriented as in the global coordinate system.Based on the reference measurement, the segment axeswere aligned with the global system of reference.Angular rotations of trunk segments were obtained fromsegment angles with respect to the axial in the transverse(axial rotation of the trunk and pelvis) and the frontal(trunk lateral flexion and pelvic list) plane of motion,and calculated as (four quadrant) arctangent, specifiedby the xyz-coordinates of the segment coordinate sys-tem. Heel strikes were estimated by means of the mini-mum in the vertical velocity of the toe marker, and toe-off at the maximum in the vertical velocity of the heelmarker [40]. A stride cycle was defined as the distancebetween adjacent heel strikes of the same leg.
The EMG data were first rectified using the Hilberttransform [13]. Kinematic and EMG data were low-passfiltered using a fourth-order bidirectional Butterworthfilter with cut-off frequencies of 10 and 20 Hz, respec-tively.
Using the stride intervals, kinematic and EMG datawere split into sequential time series each containing asingle stride cycle. Subsequently, each of these timeseries was time-normalized and resampled using a cubicspline interpolation to 0–100% of the stride cycle. Foreach kinematic or EMG recording per velocity at least12 ‘‘individual’’ time series of equal length were gener-
ated, each containing a stride cycle (e.g., at 1.4 km/h thenumber of strides was seven).
Rotational amplitudes and trunk coordination
Rotational amplitudes of the thoracic (RAth), lumbar(RAlu) and pelvic (RApe) segments in the transverse andfrontal plane, defined as the absolute angular differencefrom maximum to minimum rotation within a stride,were calculated from the respective time series andaveraged per participant and velocity.
The coordination between trunk and pelvis segmentsin the transverse and frontal plane was expressed interms of the continuous relative Fourier phase (RP). Forthis purpose, the Fourier phase was computed for eachindividual time series. To cope with time-dependentchanges of the phases, we performed the Fourier trans-form within a finite frame size and shifted that frame intime (see Appendix). Phases for each signal were ob-tained at the fundamental movement frequency of theproximal segment by which the frame size was fixed attwice the corresponding period length [25]. Hence, thecontinuous RP between two signals x(t) and y(t) wascalculated as RPxy=RPx(t))RPy(t), with x, y represent-ing the RP of thoracic and pelvic (RPthpe) or lumbar andpelvic (RPlupe) segment rotations in the transverse orfrontal plane. For each RP, the corresponding SD wascalculated providing a measure of the stability (in thesense of Lyapunov) of the coordination of interest.Continuous RPs were averaged for each participant andeach velocity. In general, a phase difference of 180�indicates antiphase coordination and 0� in-phase coor-dination.
To evaluate the degree of coupling between thoracicand pelvic rotations as well as between lumbar andpelvic rotations in the transverse and frontal planes, thecorresponding power spectra were correlated usingweighted coherence (WC) statistics. WC summarizes theproportion of shared variances over a specified fre-quency band [41]. First, spectral densities were estimatedusing Welch’s periodogram method. The length of thechosen Hanning window was based on a 0.95% confi-dence interval with error bounds not exceeding 25% ofthe estimated spectral power. WC was calculated at thefrequency band of the fundamental frequency ±0.2 Hz,indicating the strength of coupling normalized to valuesbetween 0 and 1.
Erector spinae activity
Double stance and swing phase ipsi- and contralateral tothe right and left heel strikes were detected using the footcontact data. For each participant and each velocity, therectified time- and amplitude-normalized EMG time
26

series [65] were averaged over strides per muscle.Thereafter, the mean EMG activities of left and rightTh12, L2 and L4 recordings of the ES muscles, duringipsi- and contralateral swing and between heel strike ofone leg and toe-off of the other leg (double stance), werecalculated.
Invariant and variant patterns of trunk coordinationand muscle activity
Principal component analysis (PCA) was applied to de-tect similarities and deviations between LBP and controlparticipants in trunk coordination and EMG activitypatterns and to examine the relationship between LBPand variability. In general, this method allows detectionof time-varying coherent patterns of activity (e.g., kine-matic and EMG) vs more variant aspects within a dataset. For a detailed description of this method we refer to arecent tutorial [10] and a clinical study in which it wasapplied [26]. To examine the consistency of patterns overstride cycles, kinematic and EMG recordings obtained ateach walking velocity were split into sequential stridecycles. Every timeseries was rescaled to unit variance toeliminate overall amplitude effects. First, PCA was ap-plied separately to the data of the LBP and control groupsin order to evaluate eventual differences in the number ofrelevant principal modes (approximate ‘‘dimensional-ity’’) between groups. Second, PCA was applied to thecombined data set of LBP and control participants toexamine deviations from normal pattern and, moreinterestingly, to analyze differences in variability.
In general, one distinguishes between global andresidual patterns. Hence differences in variability can bequantified in terms of variations of those patterns(kinematic or EMG data for each walking velocity). Torelate the variability of LBP participants to that of thecontrol participants, we computed for each LBP par-ticipant the ratio of the variability of kinematic or EMGpatterns divided by the respective ones of the entirecontrol group. The individual ratios so obtained werethen averaged over the LBP group. In other words, forthe LBP group per velocity an averaged ratio was ob-tained indexing variability for segment rotations and ESpatterns (see reference 26 for further details). Deviationsin the global pattern of muscle activation between LBPparticipants and the control group were further exam-ined by calculating the cross-correlation between theglobal patterns of muscles of LBP participants and thatof the entire control group resulting in a maximal cor-relation at specific times.
Statistical analysis
Mean and SD of the RPs were calculated using circularstatistics to account for phase wrapping [4]. The
dependent variables were: transverse and frontal RAth,RAlu, RApe, RArlu, stride length, the mean and SD ofRPthpe, RPlupe, WCthpe and WClupe, the averaged ESactivity during ipsi- and contralateral swing and doublestance of left and right Th12, L2 and L4, and the vari-ance of the global and residual pattern of segmentrotations and EMG activity.
Independent t-tests were performed on the dependentvariables to compare the LBP and control groups atcomfortable walking velocity. The effects of walkingvelocity, health status (LBP vs control) and their inter-action on the dependent variables were tested usinggeneralized estimating equations (GEE), which treat themeasurements within participants as repeated measures.In contrast to other statistical methods for the analysisof repeated measures, GEE allows the analysis ofunbalanced designs and designs with missing values.Standard errors (SE) and the corresponding confidenceintervals (CI) are reported for significant effects of healthstatus. The interaction effect was removed from themodel if it proved not to be significant. Gender and agewere entered as covariates. Paired t-tests were used toassess the differences in pain before and after walking inLBP participants. Spearman correlations (rs) were ap-plied to examine the relationships between pain inten-sity, TSK and RDQ scores. Controlling for themaximally attained walking velocity, partial correlationswere applied to assess the relationship between painratings, TSK and RDQ and the dependent variables.P<0.05 (two-sided) was taken as the level of sig-nificance.
Results
Averaged comfortable walking velocity was significantlylower (t=1.7, P<0.001) in the LBP group (mean3.3 km/h, SD 1.1 km/h) than in the control group (mean4.7 km/h, SD 0.7 km/h). All control participants wereable to walk at all prescribed walking velocities. All 19LBP participants could walk at velocities from 1.4 to3.8 km/h, and 17 LBP participants walked up at veloc-ities up to 4.6 km/h, 15 up to 5.4 km/h, 13 up to 6.2 km/h and 5 up to the maximum velocity of 7.0 km/h.
In the LBP group, pain intensity ratings did not differsignificantly before and after walking (5.6±3 and4.9±3, respectively). RDQ scores suggested moderatelimitations in activities of daily living. The average TSKscore indicated that pain-related fear-avoidance beliefswere present in the LBP group; 11 participants had ascore higher than 37 with a mean of 44±5 (Table 1).Fear-avoidance belief correlated highly with the dis-ability score. Pain levels correlated with TSK and RDQscores, and RDQ also correlated with anticipated pain.Comfortable velocity and the maximally attained
27

velocity were only significantly related to the RDQ(Table 1).
Rotational amplitudes and stride length
At all walking velocities, stride length was shorter in theLBP group than in the control group, and significantlyshorter at velocities of 1.4, 2.2, 3.0 and 6.2 km/h (t=2.5,t=2.8, t=2.3 and t=2.9, respectively; P<0.05). Neitherat the comfortable velocity, nor at the prescribed velo-cities, were significant differences between the LBP andcontrol group found for RAth, RAlu and RApe in thetransverse and frontal plane (Table 2).
Invariant and variant patterns of trunk coordination
At the comfortable velocity and at all prescribed veloc-ities, the first two principal modes covered about 84% ofthe spread of the data in the LBP group(52±6%+32±6%), the control group(50±6%+34±5%) and both groups together(51±6%+33±5%). The corresponding two patternsrepresented the coherent features of trunk and pelvisrotations in the transverse and frontal plane at allwalking velocities, and captured the rotations thatoscillated at the stride frequency. Analysis of the coef-ficients of the eigenvectors revealed an almost equalcontribution of the LBP and control group to the twomodes, suggesting that LBP had no effect on the globalkinematic walking pattern. However, marked differencesin the relative timing between the segment rotations werepresent. In particular, the transverse counter-rotation athigher walking velocities was less in the LBP group (seeFig. 1 for an example of one LBP and one controlparticipant). To quantify differences in the timing be-tween segments, the relative Fourier phase was calcu-lated. The difference between the pattern of the first andsecond mode represented a phase shift of about 90�, andnot so much between segments as between plane ofrotation (i.e., transverse and frontal).
The global pattern of thoracic, lumbar and pelvicrotations was highly consistent across all participantsand velocities. The variability of the global patterns ofthe thoracic, lumbar and pelvic rotations in the trans-
Table 1 Mean scores for fear of movement (TSK), disability(RDQ), anticipated pain and actual pain and Spearman correla-tions (rs) in the LBP group
TSK RDQ Anticipatedpain
Actualpain
Mean (SD) 39 (6.8) 10 (6) 4.6 (3) 5.6 (3)Correlations (rs)TSKRDQ 0.85**Anticipated pain 0.30 0.60**Actual pain 0.58** 0.68** 0.50*Comfortable velocity )0.46 )0.52* )0.45 )0.44Maximal velocity )0.46 )0.55* )0.48 )0.39
*P<0.05**P<0.01
Table 2 Rotational amplitudes in the transverse and frontal plane of the thoracic (RAth), lumbar (RAlu) and pelvic (RApe) segments (indegrees) for the LBP and control groups at the comfortable and the prescribed walking velocities. Values are given as means with SDs inparentheses
Velocity (km/h) NLBPa RAth RAlu RApe
LBP Control LBP Control LBP Control
Transverse plane rotationsComfortable 19 9.4 (3.6) 7.2 (2.9) 8.7 (3.9) 6.4 (2.1) 5.5 (2.7) 6.3 (2.3)1.4 19 12.1 (4.8) 9 (2.4) 12.9 (4.8) 10.0 (3.2) 10.5 (5.0) 8.4 (2.6)2.2 19 11.8 (4.8) 9.3 (3.4) 12.0 (4.5) 9.7 (3.5) 9.5 (4.3) 8.0 (3.4)3.0 19 10.5 (4.2) 9.1 (3.5) 9.9 (3.8) 8.7 (3.6) 8.3 (4.2) 7.4 (3.5)3.8 19 8.9 (3.2) 7.9 (2.9) 8.0 (2.7) 7.7 (3.2) 7.7 (4.2) 7.4 (3.3)4.6 17 7.2 (2.0) 6.9 (2.3) 7.0 (2.5) 6.3 (2.6) 9.1 (4.9) 7.4 (2.3)5.4 15 6.5 (2.5) 6.5 (2.4) 7.5 (2.6) 6.6 (2.5) 11.0 (5.5) 9.8 (3.0)6.2 13 6.8 (3.6) 6.7 (3.0) 8.8 (3.0) 7.7 (2.9) 12.6 (6.3) 12.6 (4.3)7.0 5 5.5 (1.2) 7 (3.4) 10.0 (3.3) 8.3 (3.2) 17.5 (7.5) 14.7 (5.3)
Frontal plane rotationsComfortable 19 3.8 (2.1) 4.7 (1.6) 3.3 (1.1) 3.4 (1.2) 4.6 (3.1) 5.9 (2.8)1.4 19 3.3 (1.6) 4.8 (3.5) 3.3 (1.4) 3.9 (1.6) 4.0 (2.4) 4.6 (2.2)2.2 19 3.7 (1.9) 3.8 (1.6) 3.0 (1.1) 3.4 (1.0) 4.5 (2.0) 4.9 (2.5)3.0 19 3.7 (1.9) 3.6 (1.3) 3.2 (1.6) 3.3 (1.2) 5.2 (2.1) 5.6 (1.9)3.8 19 4.0 (2.1) 3.9 (1.6) 3.4 (1.9) 3.3 (1.3) 6.1 (2.2) 6.4 (1.8)4.6 17 4.1 (2.2) 4.2 (1.3) 3.6 (2.2) 3.6 (1.2) 7.0 (2.4) 7.5 (2.2)5.4 15 4.1 (2.2) 4.8 (1.5) 3.8 (2.1) 4.2 (1.2) 8.2 (2.6) 8.5 (3.0)6.2 13 5.0 (2.4) 5.6 (2.2)) 3.7 (1.3) 4.7 (1.4) 9.2 (2.5) 9.1 (3.4)7.0 5 4.8 (1.1) 6.3 (3.9) 4.3 (1.7) 5.2 (1.7) 10.2 (3.0) 9.9 (3.9)
aNumber of LBP participants who could attain this velocity; for control participants N=14 at all velocities
28

verse and frontal planes was not significantly affected byhealth status, while the mean ratios of the global pat-terns were almost 1 at all walking velocities (Fig. 2,upper panel).
At the comfortable velocity, the variability of theresidual patterns of transverse thoracic and lumbarrotations was significantly smaller in the LBP partici-pants than in the healthy controls (t=2.12, P=0.04 andt=2.35, P=0.03, for the thoracic and lumbar segments,respectively).
At the prescribed walking velocities, the variabilityof transverse lumbar rotations was significantly smallerin the LBP participants than in the healthy controls(P=0.04; SE=0.025, CI=0.020–0.033), particularly atvelocities higher than 4.6 km/h. The most pronouncedeffect of LBP was the larger variability of the residualpattern of frontal thoracic rotations (P<0.01;SE=0.03, CI=0.024–0.039) for walking velocities of
3.8 km/h and higher. This was also evidenced by theconcomitant ratio, which, at some of the highervelocities, was even larger than 2 (see Fig. 2, lowerpanel).
Relative timing between segment rotations
Comfortable walking velocity
At the comfortable velocity, mean RPthpe in the trans-verse plane was significantly smaller in the LBP than inthe control group (71� vs 111�, t=2.5, P=0.02), whereasin the frontal plane mean RPthpe and RPlupe did notdiffer significantly between the LBP group and thecon-trol group. As regards the variability of relative timing,the SD of RPthpe in the frontal plane was significantlylarger in the LBP group than in the control group(t=2.6, P=0.01; see Table 3). In accordance, the cou-pling between frontal thoracic and pelvic rotations wassignificantly weaker in the LBP group than in the con-trol group (t=3.2, P<0.01, means 0.7±0.2 and0.9±0.1, respectively).
Fig. 1 Average time series of the global pattern of segmentrotations in the transverse (left two panels) and frontal (right twopanels) planes are shown for one control and one LBP participant.The dotted lines represent the SD
29
Effect of walking velocity
Figure 3 shows the effect of walking velocity on themean relative phases and the coupling between thesegment pairs. The SDs of the RPs are presented inTable 3. As can be appreciated from Fig. 3, meanRPthpe increased significantly with increasing velocity
Fig. 2 The variability of the global (upper panels) and residual(lower panels) patterns of segment rotations in the transverse andfrontal plane quantified as the ratio between the average varianceover stride cycles of each segment for each LBP participant andthat of the control group (ratio). Error bars indicate SD
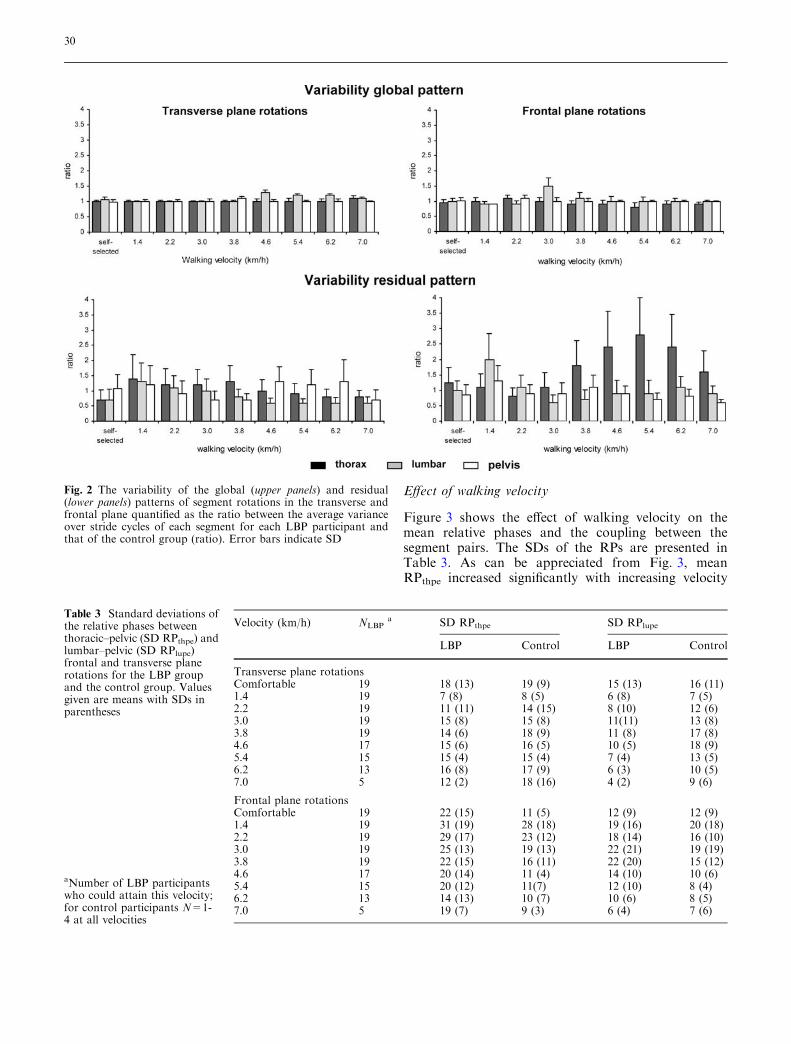
Table 3 Standard deviations ofthe relative phases betweenthoracic–pelvic (SD RPthpe) andlumbar–pelvic (SD RPlupe)frontal and transverse planerotations for the LBP groupand the control group. Valuesgiven are means with SDs inparentheses
aNumber of LBP participantswho could attain this velocity;for control participants N=1-4 at all velocities
Velocity (km/h) NLBPa SD RPthpe SD RPlupe
LBP Control LBP Control
Transverse plane rotationsComfortable 19 18 (13) 19 (9) 15 (13) 16 (11)1.4 19 7 (8) 8 (5) 6 (8) 7 (5)2.2 19 11 (11) 14 (15) 8 (10) 12 (6)3.0 19 15 (8) 15 (8) 11(11) 13 (8)3.8 19 14 (6) 18 (9) 11 (8) 17 (8)4.6 17 15 (6) 16 (5) 10 (5) 18 (9)5.4 15 15 (4) 15 (4) 7 (4) 13 (5)6.2 13 16 (8) 17 (9) 6 (3) 10 (5)7.0 5 12 (2) 18 (16) 4 (2) 9 (6)
Frontal plane rotationsComfortable 19 22 (15) 11 (5) 12 (9) 12 (9)1.4 19 31 (19) 28 (18) 19 (16) 20 (18)2.2 19 29 (17) 23 (12) 18 (14) 16 (10)3.0 19 25 (13) 19 (13) 22 (21) 19 (19)3.8 19 22 (15) 16 (11) 22 (20) 15 (12)4.6 17 20 (14) 11 (4) 14 (10) 10 (6)5.4 15 20 (12) 11(7) 12 (10) 8 (4)6.2 13 14 (13) 10 (7) 10 (6) 8 (5)7.0 5 19 (7) 9 (3) 6 (4) 7 (6)
30
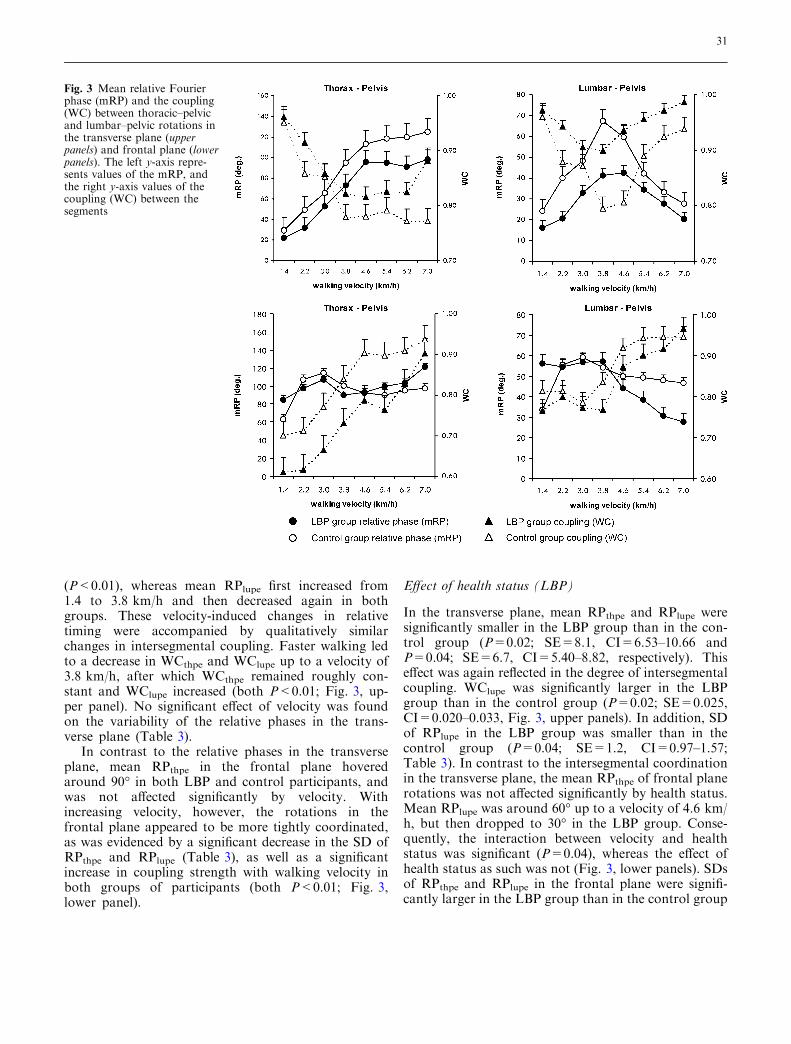
(P<0.01), whereas mean RPlupe first increased from1.4 to 3.8 km/h and then decreased again in bothgroups. These velocity-induced changes in relativetiming were accompanied by qualitatively similarchanges in intersegmental coupling. Faster walking ledto a decrease in WCthpe and WClupe up to a velocity of3.8 km/h, after which WCthpe remained roughly con-stant and WClupe increased (both P<0.01; Fig. 3, up-per panel). No significant effect of velocity was foundon the variability of the relative phases in the trans-verse plane (Table 3).
In contrast to the relative phases in the transverseplane, mean RPthpe in the frontal plane hoveredaround 90� in both LBP and control participants, andwas not affected significantly by velocity. Withincreasing velocity, however, the rotations in thefrontal plane appeared to be more tightly coordinated,as was evidenced by a significant decrease in the SD ofRPthpe and RPlupe (Table 3), as well as a significantincrease in coupling strength with walking velocity inboth groups of participants (both P<0.01; Fig. 3,lower panel).
Effect of health status (LBP)
In the transverse plane, mean RPthpe and RPlupe weresignificantly smaller in the LBP group than in the con-trol group (P=0.02; SE=8.1, CI=6.53–10.66 andP=0.04; SE=6.7, CI=5.40–8.82, respectively). Thiseffect was again reflected in the degree of intersegmentalcoupling. WClupe was significantly larger in the LBPgroup than in the control group (P=0.02; SE=0.025,CI=0.020–0.033, Fig. 3, upper panels). In addition, SDof RPlupe in the LBP group was smaller than in thecontrol group (P=0.04; SE=1.2, CI=0.97–1.57;Table 3). In contrast to the intersegmental coordinationin the transverse plane, the mean RPthpe of frontal planerotations was not affected significantly by health status.Mean RPlupe was around 60� up to a velocity of 4.6 km/h, but then dropped to 30� in the LBP group. Conse-quently, the interaction between velocity and healthstatus was significant (P=0.04), whereas the effect ofhealth status as such was not (Fig. 3, lower panels). SDsof RPthpe and RPlupe in the frontal plane were signifi-cantly larger in the LBP group than in the control group
Fig. 3 Mean relative Fourierphase (mRP) and the coupling(WC) between thoracic–pelvicand lumbar–pelvic rotations inthe transverse plane (upperpanels) and frontal plane (lowerpanels). The left y-axis repre-sents values of the mRP, andthe right y-axis values of thecoupling (WC) between thesegments
31

(P<0.05; SE=3.1, CI=2.50–4.08 and P<0.01;SE=2.1, CI=1.69–2.76, respectively; Table 3). Fur-thermore, whereas intersegmental coupling increasedwith walking velocity in both groups of participants, itremained weaker in the LBP group. Specifically, WCthpe
ranged from 0.6 to 0.9 in the LBP group and from 0.7 to0.95 in the control group (P=0.03; SE=0.031,CI=0.023–0.051; Fig. 3, lower panels). Interactions be-tween health status and velocity were not significant foreither the SDs or the WCs.
Mean EMG amplitude
Comfortable walking velocity
At the comfortable velocity, averaged lumbar ES (LES)amplitudes increased significantly in the LBP groupduring the ipsilateral swing phase in left and right L2(t=2.2, P=0.03; t=3.6, P<0.01) and L4 (t=2.9;P<0.01; t=3.0, P<0.01). In the contralateral swingphase, mean LES activity was significantly higher for leftL4 (t=2.5, P=0.02), right L4 (t=2.8, P<0.01) andright L2 (t=2.3, P<0.03), whereas left L2 approachedsignificance (P=0.07). Expressed as percentage increasein mean amplitude with respect to the control group[(LBP)control)/control)], LES activity was on average51% elevated in the ipsilateral and 68% in the contra-lateral swing phases. Mean thoracic ES (TES) activitywas increased (by 48%) only in the ipsilateral swingphase (t=2.6, P=0.02 and t=2.56, P=0.01 for left andright thorax, respectively).
Effect of walking velocity and health status (LBP)
As walking velocity increased, mean LES amplitudedecreased during the swing phase up to a velocity of4.6 km/h and then increased (P<0.01) in both groups ofparticipants. Moreover, amplitudes of both L2 and L4ES were significantly larger during the swing phase inthe LBP than in the control group (P<0.05). On aver-age, mean LES activity increased by 8, 21, 25, 39, 45, 32and 48% for velocities from 1.4 to 7.0 km/h, respec-tively. The velocity by health status interactions were notsignificant. During double stance, no significant effect ofhealth status or velocity was found on ES activity. Sinceneither health status nor velocity significantly affectedmean TES activity during the swing phase, the TESmuscles were excluded from the PCA analysis (see be-low).
Visual inspection of the EMG time series revealedclear changes in LES activity patterns in the LBP par-ticipants over consecutive strides. Muscle activity ap-peared to be more variable both within and betweenstrides in a variety of ways including larger phase shifts,additional frequencies and prolonged activity around
heel strike. Within the LBP group marked individualdifferences were present (see Fig. 4).
Invariant and variant patterns of muscle activity
In both the LBP and control group, PCA revealed that,at the walking velocities of 1.4 and 2.2 km/h, theeigenvalue spectra did not show a clear gap betweensuccessive principal modes, but rather an exponentialdecrease in the spread. In other words, at these lowwalking velocities the activation pattern of the LESmuscle was quite erratic, lacking consistent features. Forvelocities higher than 2.2 km/h, the first three principalmodes, averaged over velocities, covered about 46% ofthe spread (25±3%+12±2%+10±2%) in the LBPgroup and 56% (35±6%+12±1%+8±1%) in thecontrol group. As can be appreciated from Fig. 5, thefirst mode was smaller in the LBP group than in thecontrol group and the gap between successive modesbecame successively smaller with increasing velocities,implying larger modifications of the normal basic EMGpattern in the LBP group.
The number of relevant principal modes remained thesame when PCA was applied to the data of both groupsof participants collapsed together. At the comfortablevelocity, and for the prescribed velocities in the range3.8–7 km/h, the first three principal modes, again aver-aged over velocities, covered about 50%(29±4%+11±2+9±1%) of the spread. As an exam-ple, Fig. 6 shows the results of the PCA of EMG data ofboth groups combined for the walking velocity of5.4 km/h. The distinctively biphasic activity pattern ofLES muscles during the stride cycle at walking velocitieshigher than 2.2 km/h was captured by the first mode.The second mode represented modulations superim-posed on the step frequency, that is, just after heel strikeand around the double support phase, homolateral LES(with respect to toe off) increased and contralateralactivity decreased. Adding a third mode to the first twoshifted the peak activity to the left in the LBP group,implying that peak activation occurred earlier than inthe control group. Similar patterns were observed for allvelocities from 3.0 km/h and above.
Systematic differences were found for left and rightLES activity but not for L2 and L4 recordings. There-fore, the results of each side were collapsed. Althoughthe global pattern was present in the LBP group as awhole, the eigenvector coefficients indicated that forwalking velocities of 3.0 km/h and higher their contri-bution to the first mode was smaller than in the controlgroup. Hence, the variability of the global pattern wassmaller in the LBP group than in the control group atthe comfortable velocity (left LES t=3.9, P<0.01, andright LES t=3.3, P<0.01) as well as at the prescribedvelocities (left and right LES, P=0.04; SE=0.034,
32

CI=0.027–0.045 and SE=0.029, CI=0.023–0.029,respectively; Fig. 7, upper panel). In addition, theresidual variability of left and right ES was larger in theLBP group than in the control group, both at thecomfortable velocity (both t=4.2, P<0.01) and at theprescribed velocities (both Ps=0.03; SE=0.037,CI=0.030–0.049 and SE=0.038, CI=0.031–0.051,respectively; Fig. 7, lower panel). In the LBP partici-pants, the residual pattern consisted of rather irregulardeviations of the global pattern (phase shifts, amplitudemodifications and additional bursts). The contributionof the LBP participants to the global pattern was notonly smaller than that of the control participants, buttheir patterns also showed marked deviations from thenormal LES activity pattern. This is also reflected in themaximal cross-correlation values and their correspond-ing time lags, as given in Table 4.
Pain intensity, fear of movement and disability
At the comfortable velocity, pain levels were correlatednegatively with RPthpe (rs=0.46; P=0.048) and SDRPthpe (rs=0.45, P=0.05). At the prescribed velocities,when corrected for the maximally attained velocity,
there were no significant correlations between the VAS,TSK or QDR scores with any of the dependent vari-ables.
Discussion
The aim of the present study was to deepen current in-sights into the consequences of LBP for walking. Weperformed detailed analyses of the effect of walkingvelocity on both kinematics and ES activity, focusing on(1) the global coordination of the timing between trunkand pelvis segments in the frontal and transverse planeand the average amplitude of ES activity during differentphases of the stride cycle, and (2) invariant and variantproperties of trunk kinematics and muscle activity.
Walking velocity was found to affect the relativetiming between segment rotations in both LBP andcontrol participants. In line with previous studies [25, 26,54], thoracic–pelvic rotations in the transverse planeevolved from more or less in-phase in the direction ofantiphase coordination with increasing walking velocity.In contrast, the intersegmental coordination in thefrontal plane did not change with walking velocity, al-though the segment pairs became more tightly coordi-nated with increasing walking velocity, as was evidencedby smaller standard deviations of the relative phases andhigher coupling strengths.
Fig. 4 Individual time series of superimposed stride cycles of theleft ES recorded at the level of L4 for one control and three LBPparticipants at walking velocities of 2.2, 3.8, 4.6 and 6.2 km/h
33

As regards the kinematics, mainly the intersegmentalcoordination was disturbed in the LBP participants.Rotational amplitudes were not different between LBPand control participants. However, stride length wasshorter, although not significantly so, at all velocities.The normal velocity-induced transverse counter-rota-tion between thorax and pelvis at higher walkingvelocities was less pronounced in the LBP participants.In addition, the LBP participants tended to move thelumbar and pelvic segments more synchronously andrigidly in the same direction. Both phase relations, i.e.,thoracic–pelvic and lumbar–pelvic coordination, werecharacterized by a higher degree of coupling in the LBPgroup. These results are consistent with those of earlierstudies on transverse plane coordination during gait inLBP [27, 46]. In contrast to the transverse plane, theintersegmental coordination in the frontal plane was
more variable and less tightly coupled in the LBP than inthe control participants. In addition, PCA revealed thatafter subtracting the common invariant features of thekinematic time series, in the LBP participants, the vari-ability of the residual pattern was reduced in the trans-verse plane for lumbar rotations and was largelyconfined to thoracic rotations in the frontal plane, par-ticularly at walking velocities higher than the averagecomfortable velocity. These additional frontal planemovements may be a strategy to compensate for themore rigid coordination in the transverse plane.
An overall effect of walking velocity was also found onthe mean amplitude of LES during the swing phases. Theaverage level of EMG activity decreased with walkingvelocity up to 4.6 km/h, which corresponds to the com-fortable walking velocity of healthy individuals. Theaveraged LES activity during the swing phases was sig-nificantly greater in the LBP participants than in thecontrol participants, whereas health status had no effecton lumbar or thoracic ES activity during doublestance.Besides overall changes in mean LES amplitudes, theresults of the PCA indicated thatmuscular control in LBPwas affected in terms of both alterations of the global
Fig. 5 Eigenvalue spectra (kj) of the LBP group and control groupplotted on a logarithmic scale. At walking velocities of 3.8 km/hand higher, the amount of variance explained by the first principalcomponent is smaller in the LBP group than in the control group.Note that at velocities of 1.4 and 2.2 km/h no clear gap betweensuccessive modes is present in either group
34

pattern and a marked increase in variability of theresidual pattern, both at the comfortable walking velocityand at the prescribed walking velocities. Compared to thecontrol group, the first principal mode in the LBP groupcovered a smaller amount of the data’s spread, reducingits ‘distance’ relative to subsequent modes, especially athigher walking velocities. Hence, variability was spreadout over subsequentmodes, implyingmodifications of thenormal biphasic LES pattern in the form of the appear-ance of phase shifts, (seemingly random) amplitudemodifications and additional bursts.
When applied to the combined data set, PCA con-firmed that the modifications of LES activity in the LBPparticipants affected the overall LES activity, i.e., LESactivity was coordinated less than in healthy persons.Note that the observed increase in mean LES activityduring the swing phase may in fact have resulted fromthese modifications, rather than being purely an ampli-tude effect. Our findings contradict those of Vogt et al.
Fig. 6 PCA of EMG data obtained at a walking velocity of5.4 km/h. The first column shows the eigenvalue spectra (kk); notethe decrease in eigenvalues after mode 3. The second column showsthe time series (n1..n3) corresponding to the first three modes, whichtogether formed the global pattern of LES activity. The eigenvectorcoefficients (mk) are averaged over strides of LBP and control (Con)participants and represent the contribution of each muscle pergroup to the pattern (column 3)
Fig. 7 Variability of the global (upper panel) and residual pattern(lower panel) of left and right LES activity quantified by calculatingthe average variance over stride cycles for LBP participants overthat of the control group (ratio). Error bars indicate SD
35

[59], who reported identical ES curves in LBP andhealthy individuals. This discrepancy may be explainedby the fact that we performed a more fine-grainedanalysis by examining the consistency of activity pat-terns over a finite bout of walking. Furthermore, in ouranalysis, the global pattern was based on the dominantprincipal modes, so that the resulting filter characteris-tics depended on the data themselves [10].
At very slow walking velocities (1.4 and 2.2 km/h), noconsistent pattern of LES activity was observed in con-trol and LBP participants alike. At these very lowwalking velocities, the duration of the double stancephase is relatively long, and the swing phase relativelyshort. Thus, presumably, the more erratic LES patternsat low velocities reflect ‘randomness’ due to balanceproblems in both groups of participants.
Actual pain intensity, anticipated pain, disability andfear-avoidance were all uncorrelated with the observedchanges in the dependent kinematic and EMG variables.Only the level of disability was related significantly towalking velocity. When invited to walk at a comfortablevelocity, individuals with LBP selected lower walkingvelocities than healthy individuals. Nevertheless, all LBPparticipants were able to walk faster than their preferredvelocity, which raises the question: Why did the indi-viduals with LBP walk with a lower velocity? In order toanswer this question, it is important to recognize thatspinal instability due to dysfunction of spinal structuresor impaired control over trunk muscles is a major sourceof complaints in individuals with LBP [37, 38]. In prin-ciple, spinal stability may be regained through changesin muscle activity, but such changes may also lead tomicrotrauma and subsequent chronic pain and changesin sensory input, amplifying the spinal instability andreducing the ability to effectively deal with perturba-tions. When healthy individuals anticipate a perturba-tion, they contract trunk muscles to prevent balance
loss. In individuals with LBP, however, such anticipa-tory behavior is diminished. They also have slowerreaction times and less forceful corrections of ES activityto experimental perturbations than healthy individuals[19, 31, 42]. It is therefore conceivable that individualswith LBP attempt to enhance the control over theirmovements by walking slowly and more carefully, thuscreating a greater margin of safety to deal withupcoming perturbations [50]. Similarly, it is conceivablethat the observed changes in LES activity reflect an at-tempt to stabilize the spine by increasing its stiffness andto prevent the occurrence of unexpected perturbations towhich the patient cannot adequately respond. In par-ticular, the increased coupling between lumbar andpelvic rotations points to an increased stiffness of thespine. Accordingly, the avoidance of antiphase thorax–pelvis coordination by choosing a slow preferred walk-ing velocity that does not require counter-rotation and/or increasing the intersegmental coupling strength canbe interpreted as a strategy to minimize the probabilityof rotational perturbations of the spine that the indi-vidual with low back pain cannot adequately handle.
Besides changes in muscle recruitment, propriocep-tion is also often affected in chronic low back pain, asevidenced by the fact that individuals with chronic LBPhave reduced lumbar position sense [5, 15] and poorbalance while standing [2, 30, 35]. In general, modula-tion and fine tuning of neuromuscular control on thebasis of peripheral feedback play an important role inthe control of walking. When this feedback is affected,the precise timing of trunk and pelvis rotations duringwalking may be hampered. Impaired motor control maypromote chronicity or recurrent LBP and even be a riskfactor for LBP [37, 38]. From this perspective, it hasbeen suggested that people with mild deficits of thecentral nervous system [21], such as an imbalance inrecruitment of agonist and antagonist trunk muscles
Table 4 Cross-correlationvalues (Cr) and timelags (Lag)between the averaged globalpattern of the control groupand LBP participants of leftand right ES activity. Thevalues given are means withSDs in parentheses. Lags areexpressed as percentage ofstride cycle and negative signs(lower panel) indicate later peakactivation
aNumber of LBP participantswith positive or negative timedelaybAveraged over all prescribedwalking velocities
Velocity (km/h) left ES Right ES
Na Cr Lag % Na Cr Lag %
Comfortable 11 0.81 (0.20) +2.3 (2.9) 11 0.55 (0.25) +2.5 (2.6)3.0 14 0.66 (0.29) +3.1 (2.9) 13 0.66 (0.30) +1.6 (2.8)3.8 15 0.76 (0.23) +2.5 (2.6) 15 0.57 (0.34) +3.3 (4.0)4.6 14 0.80 (0.21) +1.8 (2.2) 13 0.56 (0.35) +3.2 (4.7)5.4 9 0.69 (0.23) +3.5 (2.0) 9 0.71 (0.24) +1.0 (1.8)6.2 9 0.62 (0.34) +4.3 (5.5) 9 0.67 (0.33) +2.8 (5.0)7.0 4 0.74 (0.19) +1.2 (1.2) 3 0.68 (0.31) +2.4 (4.9)Averageb 0.71 +2.7 0.64 +2.4Comfortable 8 0.76 (0.10) )4.3 (4.2) 8 0.72 (0.17) )5.3 (4.8)3.0 5 0.72 (0.32) )2.7 (3.2) 6 0.39 (0.36) )3.7 (3.5)3.8 4 0.56 (0.32) )4.0 (3.2) 4 0.51 (0.36) )2.3 (2.2)4.6 3 0.54 (0.39) )5.3 (4.3) 5 0.73 (0.15) )1.5 (0.9)5.4 6 0.75 (0.29) )4.6 (4.3) 6 0.54 (0.23) )5.7 (2.9)6.2 4 0.48 (0.33) )5.6 (5.1) 4 0.43 (0.27) )7.2 (3.9)7.0 1 0.56 (0.50) )7.0 (8.3) 2 0.49 (0.29) )4.9 (6.0)Averageb 0.60 )4.9 0.52 )4.2
36

[28, 36], slow reaction times [49] or poor proprioception[39], are at risk of developing musculoskeletal disorders.
The motor functioning of individuals with LBP iscomplicated further by the fact that, whereas walkingmore quickly with impaired coordination may enhancethe mechanical instability of the spine, walking moreslowly may have considerable disadvantages. Callaghanet al. [6] have shown that walking slowly without motionin the transverse plane increases static loading of thespine, whereas faster walking promotes more cyclicloading patterns. From the perspective of activities ofdaily living, normal walking in every day situationsrequires continuous adaptations to changes in circum-stances and to potentially destabilizing factors in theenvironment—e.g., the ability to respond to sudden slipsand trips.
In closing, some limitations of the present studyshould be discussed. First of all, the number of subjectsthat participated in the experiment was relatively small.In spite of the small sample size, however, numeroussignificant differences between the LBP and controlgroup were found. The effect sizes for the main effectsof group on the kinematic data (relative phase andvariability) ranged from 0.86 to 0.93, with an associ-ated estimated power ranging from 66 to 79%. Thelowest power was obtained for the measures of vari-ability of the global and filtered patterns of the EMGdata, which ranged from 59 to 68%. In all likelihood,these lower values were due to the fact that there wasconsiderable variability in LES activity among indi-viduals with low back pain (see Fig. 4). These differ-ences between participants reflect the non-homogeneityof the LBP population and show that a variety ofneuromuscular strategies may be used to cope with theconsequences of LBP. Pinpointing these strategies in astatistical sense, however, would require the assessmentof a much larger number of LBP participants thanincluded in the present study. To obtain a power of80% with about the same effect sizes as found in thepresent study would require a sample size in the orderof 28 subjects in each group. To identify differentsubgroups between the LBP patients, however, wouldrequire a group of about 140 LBP subjects in order todetect effect sizes between 0.3 and 0.5 [7].
Second, to be able to control walking velocity, thepresent experiment was performed on a treadmill.Treadmill walking, however, may be quite different fromnormal walking. Some researchers have indicated re-duced amplitudes of thorax and pelvis rotations duringtreadmill walking as compared to level walking [58],whereas others have reported similar kinematics of thelumbar spine and pelvis [45]. Third, LBP participantswere on average 7 years older than the controls andthere were more females in the LBP group than in thecontrol group. In principle, this could have affected theresults, although post-hoc analysis did not reveal any
significant effects of age or gender on the dependentmeasures. Note that age-dependency of gait parametershas been reported for much older adults than the par-ticipants in the present study [22, 34], while pelvis–tho-rax coordination appears to be unaffected by gender [9,27]. Finally, in order to make the task demands severe,we used a wide range of walking velocities from 1.2 up to7.0 km/h, a velocity just below the transition to running.Consequently, not all LBP participants were able towalk at all velocities. At velocities up to 6.2 km/h, thegroup sizes only differed marginally, but only five LBPparticipants could walk at 7.0 km/h.
Clinical implications
Although the study of variability may provide importantinsights into changes in motor control, changes in vari-ability are often not easily measurable in a clinical set-ting. Indeed, the global patterns of coordination as beingdescribed by the relative phase between two movingsegments is closely related to the level at which cliniciansevaluate movement patterns. Studies on gait in LBPusually focus on measures such as walking velocity,stride length and amplitudes. The present study suggeststhat measures of intersegmental trunk coordination maybe more informative about changes in gait and thus themotor functioning of individuals with LBP.
Nowadays, gait training or ‘speed’ walking in LBP isoften part of rehabilitation programs and tests [12, 51,66]. The results of the present study suggest that somecaution should be applied in this respect. All LBPparticipants could walk at velocities higher than theircomfortable velocity, but at these velocities they showedclear adaptations in movement coordination duringwhich the spine may have been subjected to non-optimalloading. This implies that conservative therapy shouldinclude methods aimed at improving intersegmental andmuscle coordination rather than walking velocity assuch.
Conclusion
Collectively, the results of the kinematic analysis re-vealed that, in LBP participants, the coordination be-tween transverse thoracic and pelvic rotations andlumbar and pelvic rotations was more rigid and lessvariable than in healthy controls, whereas the coordi-nation between the segments in the frontal plane was lesstight and more variable, particularly at walking veloci-ties higher than the comfortable velocity. These changesin coordination were not accompanied by changes inrotational amplitudes.
Statistical analysis of the invariant and variantproperties of kinematics and EMG revealed that the
37

global pattern of segment rotations remained unaffectedin the LPB participants, whereas the variability of thethoracic rotations in the frontal plane exhibited markedirregularities. The global pattern of LES activity devi-ated markedly from the normal pattern and the vari-ability of the LES was significantly elevated, indicatingpoor coordination in the activation of the LES muscles.The slower walking of the LBP participants appeared tobe a functional adaptation to altered motor control,which could not be related to actual pain, fear ofmovement/(re)injury or level of disability. The assess-ment of gait patterns in terms of coordination may helpclinicians to quantify (the consequences of) movementimpairments and may provide suggestions for interven-tions aimed at facilitating the emergence of desiredtruncoordination patterns.
Acknowledgements This study was supported by grants from theDutch Organization for Scientific Research # 904-65-090 (MW-NWO), the Dutch Association for Exercise Therapy Mensendieck(NVOM) and the Mensendieck Development Foundation (SOM).The authors thank Caroline van der Stok for her assistance withthe data recording.
Appendix
For each time series, the Fourier phase was computed.To cope with time-dependent changes of the phases weperformed the Fourier transform within a finite framesize e, and shifted that frame in time. Phases wereobtained at the fundamental movement frequency x0
of the proximal segment by which the frame size wasfixed at twice the corresponding period lengthe=2T0=4p/x0. In detail, we computed for a timeseries x(t), as follows:
x tð Þ7!xe x; sð Þ ¼Z1
�1
x tð ÞWe t � sð Þe�ix t�sð Þdt
with We tð Þ ¼ 1 for 06t\e0 otherwise
� ð1Þ
and defined the phase as
ue x; sð Þ ¼ arctanIm xe x; sð Þf gRe xe x; sð Þf g
� �ð2Þ
References
1. Ahern DK, Follick MJ, Council JR,Laser-Wolson N, Litchman H (1988)Comparison of chronic low back painpatients and non-patient controls. Pain34:153–160
2. Alexander KM, LaPier TL (1998) Dif-ferences in static balance and weightdistribution between normal subjectsand subjects with chronic unilateral lowback pain. J Orthop Sports Phys Ther28:378–383
3. Arendt-Nielsen L, Graven-Nielsen T,Svarrer H, Svensson P (1996) Theinfluence of low back pain on muscleactivity and coordination during gait: aclinical and experimental study. Pain64:231–240
4. Batschelet E (1981) Circular statistics inbiology. Academic, London
5. Brumagne S, Cordo P, Lysens R, Ver-schueren S, Swinnen S (2000) The roleof paraspinal muscle spindles in lum-bosacral position sense in individualswith and without low back pain. Spine25:989–994
6. Callaghan JP, Patla AE, McGill SM(1999) Low back three-dimensionaljoint forces, kinematics, and kineticsduring walking. Clin Biomech 14:203–216
7. Cohen J (1988) Statistical power analy-sis for the behavioral sciences, 2nd edn.Lawrence Earlbaum Associates, Hills-dale, NJ
8. Collins JJ, De Luca CJ (1994) Randomwalking during quiet standing. PhysRev Lett 73:764–767
9. Crosbie J, Vachalathiti R, Smith R(1997) Age, gender and speed effects onspinal kinematics during walking. GaitPosture 5:13–20
10. Daffertshofer A, Lamoth CJC, MeijerOG, Beek PJ (2004) PCA in studyingcoordination and variability: a tutorial.Clin Biomech 19:415–428
11. Dingwell JB, Ulbrecht JS, Boch J, Bec-ker MB, O’Gorman JT, Cavanagh PR(1999) Neuropathic gait shows onlytrends towards increased variability ofsagittal plane kinematics during tread-mill locomotion. Gait Posture 10:21–29
12. Fordyce WE (1976) Behavioral methodsin chronic pain and illness. Mosby, StLouis
13. Gabor D (1946) Theory of communi-cation. IEE J Commun Eng 93:429–457
14. Giakas G, Baltzopoulos V (1997) Timeand frequency domain analysis ofground reaction forces during walking:an investigation of variability and sym-metry. Gait Posture 5:189–197
15. Gill KP, Callaghan MJ (1998) Themeasurement of lumbar proprioceptionin individuals with and without lowback pain. Spine 23:371–377
16. Grabiner MD, Koh TJ, el Ghazawi A(1992) Decoupling of bilateral paraspi-nal excitation in subjects with low backpain. Spine 17:1219–1223
17. Hausdorff JM, Mitchell SL, Firtion R,Peng CK, Cudkowicz ME, Wei JY,Goldberger AL (1997) Altered fractaldynamics of gait: reduced stride-intervalcorrelations with aging and Hunting-ton’s disease. J Appl Physiol 82:262–269
18. Hodges PW (2001) Changes in motorplanning of feedforward postural re-sponses of the trunk muscles in lowback pain. Exp Brain Res 141:261–266
19. Hodges PW, Richardson CA (1999)Altered trunk muscle recruitment inpeople with low back pain with upperlimb movement at different speeds.Arch Phys Med Rehabil 80:1005–1012
20. Hubley-Kozey CL, Vezina MJ (2002)Differentiating temporal electromyo-graphic waveforms between those withchronic low back pain and healthycontrols. Clin Biomech 17:621–629
21. Janda V (1978) Muscles, central ner-vous motor regulation and back prob-lems. In: Korr IM (ed) Theneurobiologic mechanisms in manipu-lative therapy. Plenum, New York, pp27–41
22. Judge JO, Ounpuu S, Davis RB (1996)Effects of age on the biomechanics andphysiology of gait. Clin Geriatr Med12:659–678
38

23. Keefe FJ, Hill RW (1985) An objectiveapproach to quantifying pain behaviorand gait patterns in low back pain pa-tients. Pain 12:153–161
24. Khodadadeh S, Eisenstein SM, Sum-mers B, Patrick J (1988) Gait asymme-try in patients with chronic low backpain. Neuroorthopedics 6:24–27
25. Lamoth CJC, Beek PJ, Meijer OG(2002) Pelvis-thorax coordination in thetransverse plane during gait. Gait Pos-ture 16:101–114
26. Lamoth CJC, Daffertshofer A, MeijerOG, Moseley GL, Wuisman PIJM,Beek PJ (2004) Effects of experimentallyinduced pain and fear of pain on trunkcoordination and back muscle activityduring walking. Clin Biomech 19:551–563
27. Lamoth CJC, Meijer OG, WuismanPIJM, van Dieen J, Levin MF, Beek PJ(2002) Pelvis–thorax coordination in thetransverse plane during walking in per-sons with nonspecific low back pain.Spine 27:E92–E99
28. Lee J, Hoshino Y, Nakamura k, KariyaY, Saita K, Ito K (1999) Trunk muscleweakness as a risk factor for low backpain. Spine 24:54–57
29. Lund JP, Donga R, Widmer CG,Stohler CS (1991) The pain-adaptationmodel: a discussion of the relationshipbetween chronic musculoskeletal painand motor activity. Can J PhysiolPharmacol 69:683–694
30. Luoto S, Aalto H, Taimela S, Hurri H,Pyykko I, Alaranta H (1998) One-foo-ted and externally disturbed two-footedpostural control in patients with chroniclow back pain and healthy controlsubjects. A controlled study with fol-low-up. Spine 23:2081–2090
31. Magnusson ML, Aleksiev AR, WilderDG, Pope MH, Spratt KF, Lee SH,Goel VK, Weinstein JN (1996) Unex-pected load and asymmetric posture asetiologic factors in low back pain. EurSpine J 5:23–25
32. Main CJ, Watson PJ (1996) Guardedmovements: development of chronicity.J Musculoskel Pain 4:163–170
33. Maki BE (1997) Gait changes in olderadults: predictors of falls or indicatorsof fear. J Am Geriatr Soc 45:313–320
34. McGibbon CA, Krebs DE (2001) Age-related changes in lower trunk coordi-nation and energy transfer during gait.J Neurophysiol 85:1923–1931
35. Mientjes MI, Frank JS (1999) Balancein chronic low back pain patients com-pared to healthy people under variousconditions in upright standing. ClinBiomech 14:710–716
36. O’Sullivan P, Twomey L, Allison G(1998) Altered abdominal musclerecruitment in low back pain patientsfollowing specific exercise intervention.J Orthop Sports Phys Ther 27:114–124
37. Panjabi MM (1992) The stabilizingsystem of the spine. Part I: Function,dysfunction and enhancement. J SpinalDisord 5:383–389
38. Panjabi MM (1992) The stabilizingsystem of the spine. Part II: Neutralzone and instability hypothesis. J SpinalDisord 5:390–397
39. Parkhurst TM, Burnett CN (1994) In-jury and proprioception in the lowerback. J Orthop Sports Phys Ther19:282–295
40. Pijnappels M, Bobbert MF, van DieenJH (2001) Changes in walking patterncaused by the possibility of a trippingreaction. Gait Posture 14:11–18
41. Porges SW, Bohrer RE, Cheung MN,Drasgow F, McCabe PM, Keren G(1980) New time-series statistic fordetecting rhythmic co-occurrence in thefrequency domain: the weighted coher-ence and its application to psycho-physiological research. Psychol Bull88:580–587
42. Radebold A, Cholewicki J, PanjabiMM, Patel TC (2000) Muscle responsepattern to sudden trunk loading inhealthy individuals and in patients withchronic low back pain. Spine 25:947–954
43. Riley MA, Turvey MT (2002) Vari-ability of determinism in motor behav-ior. J Mot Behav 34:99–125
44. Roland M, Morris R (1983) A study ofthe natural history of back pain. Part I:Development of a reliable and sensitivemeasure of disability in low back pain.Spine 8:141–144
45. Schache AG, Blanch PD, Rath DA,Wrigley TV, Starr R, Bennell KL (2001)A comparison of overground andtreadmill running for measuring thethree-dimensional kinematics of thelumbo-pelvic-hip complex. Clin Bio-mech 16:667–680
46. Selles RW, Wagenaar RC, Smit TH,Wuisman PIJM (2001) Disorders intrunk rotation during walking in pa-tients with low back pain: a dynamicalsystems approach. Clin Biomech16:175–181
47. Spenkelink CD, Hutten MM, HermensHJ, Greitemann BO (2002) Assessmentof activities of daily living with anambulatory monitoring system: a com-parative study in patients with chroniclow back pain and nonsymptomaticcontrols. Clin Rehabil 16:16–26
48. Stokes VP, Andersson CA, Forssberg H(1989) Rotational and translationalmovement features of the pelvis andthorax during adult human locomotion.J Biomech 22:43–50
49. Taimela S, Kujala UM (1992) Reactiontimes with reference to musculoskeletalcomplaints in adolescence. Percept MotSkills 75:1075–1082
50. Taylor NF, Evans OM, Goldie PA(2003) The effect of walking faster onpeople with acute low back pain. EurSpine J 12:166–172
51. Thomas LK, Hislop HJ, Waters RL(1980) Physiological work performancein chronic low back disability: effects ofa progressive activity program. PhysTher 60:407–411
52. Thorstensson A, Roberthson H (1987)Adaptations to changing speed in hu-man locomotion: speed of transitionbetween walking and running. ActaPhysiol Scand 131:211–214
53. van Dieen JH, Selen LP, Cholewicki J(2003) Trunk muscle activation in low-back pain patients, an analysis of theliterature. J Electromyogr Kinesiol13:333–351
54. van Emmerik REA, Wagenaar RC(1996) Effects of walking velocity onrelative phase dynamics in the trunk inhuman walking. J Biomech 29:1175–1184
55. Vink P, Daanen HAM, Verbout AJ(1989) Specificity of surface-EMG onthe intrinsic lumbar back muscles. HumMov Sci 8:67–78
56. Vlaeyen JWS, Kole-Snijders AMJ, Bo-eren RGB, Goenman NH, Eek van H(1995) Fear of movement/(re)injury inchronic low back pain and its relation tobehavioral performance. Pain 62:363–372
57. Vlaeyen JWS, Linton SJ (2000) Fear-avoidance and its consequences inchronic musculoskeletal pain: a state ofthe art. Pain 85:317–332
58. Vogt L, Pfeifer K, Banzer W (2002)Comparison of angular lumbar spineand pelvis kinematics during treadmilland overground locomotion. Clin Bio-mech 17:162–165
59. Vogt L, Pfeifer K, Banzer W (2003)Neuromuscular control of walking withchronic low-back pain. Man Ther 8:21–28
60. Vogt L, Pfeifer K, Portscher M, BanzerW (2001) Influences of nonspecific lowback pain on three-dimensional lumbarspine kinematics in locomotion. Spine26:1910–1919
61. Waddell G (1987) A new clinical modelfor the treatment of low back pain.Spine 12:632–644
62. Waters RL, Morris JM (1972) Electricalactivity of muscles of the trunk duringwalking. J Anat 111:191–199
39

63. Watson P, Booker C, Main CJ (1997)Evidence for the role of psychologicalfactors in abnormal paraspinal activityin patients with chronic low back pain(CLBP). J Musculoskel Med 5:41–56
64. White SG, McNair PJ (2002) Abdomi-nal and erector spinae muscle activityduring gait: the use of cluster analysis toidentify patterns of activity. Clin Bio-mech 17:177–184
65. Winter DA, Yack HJ (1987) EMGprofiles during normal walking: stride-to-stride and inter-subject variability.Electroencephalogr Clin Neurophysiol67:402–411
66. Wittink H, Rogers W, Gascon C, Suk-iennik A, Cynn D, Carr DB (2001)Relative contribution of mental healthand exercise-related pain increment totreadmill test intolerance in patientswith chronic low back pain. Spine26:2368–2374
40