Respiratory muscle strength in pregnancy
7
Respiratory muscle strength in pregnancy Andrea Lemos a,b, *, Ariani Impieri de Souza a , Jose ´ Natal Figueiroa a , Jose ´ Eula ´lio Cabral-Filho a , Armele Dornelas de Andrade b a Instituto de Medicina Integral Prof., Fernando Figueira, Recife, Pernambuco, Brazil b Department of Physical Therapy, Universidade Federal de Pernambuco, Recife, Pernambuco, Brazil Received 26 February 2010; accepted 27 May 2010 Available online 23 June 2010 KEYWORDS Respiratory muscle strength; Inspiratory pressure; Expiratory pressures; Pregnancy Summary Background: Muscle respiratory strength studies during pregnancy are very scarce. The aim of this paper is to describe maximum inspiratory (PImax) and expiratory (PEmax) mean pressure values in women during their first pregnancy and to determine the relationship between the anthropometric, morphologic and physiologic variables of these pressures. Methods: One hundred and twenty women (120) primigravidas were studied from the 5th to 40th gestational week, ages ranging from 20 to 29 years old, euthrophic and with low risk preg- nancies. Results: PImax and PEmax mean values were 88.5 16.52 cmH 2 O and 99.76 18.19 cmH 2 O respectively. There was no association between gestational age and PImax (r Z 0.06; p Z 0.49) or PEmax (r Z 0.11; p Z 0.22). There was also no difference between PImax and PEmax during pregnancy trimesters and no correlation between pregnancy age and the pressures in each trimester. Height was the only anthropometric variable indicating a signifi- cant PImax (r Z 0.20; p Z 0.02) association. Fundal uterus height and inter-recti abdominis distance were not associated to respiratory pressure values. PEmax is not associated with the group of predictor variables (p Z 0.127) and PImax demonstrated an independent associ- ation with height and dyspnea during physical exertion reflected by the following equation: PImax Z 0.6 þ 57.9 height e 1.68 dyspnea under effort. The present study suggests that inspi- ratory and expiratory maximum pressure values are not altered during different stages of preg- nancy, however longitudinal studies are needed to assess changes over time. ª 2010 Elsevier Ltd. All rights reserved. * Corresponding author. Depto Fisioterapia, Av Prof. Moraes Rego, 1235 Cidade, Universita ´ria, Recife 50670-901, Pernambuco, Brazil. Tel.: þ55 81 3328 6797; fax: þ55 81 3721 1847. E-mail address: [email protected] (A. Lemos). available at www.sciencedirect.com journal homepage: www.elsevier.com/locate/rmed Respiratory Medicine (2010) 104, 1638e1644 0954-6111/$ - see front matter ª 2010 Elsevier Ltd. All rights reserved. doi:10.1016/j.rmed.2010.05.020
-
Upload
independent -
Category
Documents
-
view
1 -
download
0
Transcript of Respiratory muscle strength in pregnancy

Respiratory Medicine (2010) 104, 1638e1644
ava i lab le at www.sc iencedi rect .com
journal homepage : www.e lsev ie r . com/ loca te / rmed
Respiratory muscle strength in pregnancy
Andrea Lemos a,b,*, Ariani Impieri de Souza a, Jose Natal Figueiroa a,Jose Eulalio Cabral-Filho a, Armele Dornelas de Andrade b
a Instituto de Medicina Integral Prof., Fernando Figueira, Recife, Pernambuco, BrazilbDepartment of Physical Therapy, Universidade Federal de Pernambuco, Recife, Pernambuco, Brazil
Received 26 February 2010; accepted 27 May 2010Available online 23 June 2010
KEYWORDSRespiratory musclestrength;Inspiratory pressure;Expiratory pressures;Pregnancy
* Corresponding author. Depto FisioTel.: þ55 81 3328 6797; fax: þ55 81 3
E-mail address: lemosandrea@bol.
0954-6111/$ - see front matter ª 201doi:10.1016/j.rmed.2010.05.020
Summary
Background: Muscle respiratory strength studies during pregnancy are very scarce. The aim ofthis paper is to describe maximum inspiratory (PImax) and expiratory (PEmax) mean pressurevalues in women during their first pregnancy and to determine the relationship between theanthropometric, morphologic and physiologic variables of these pressures.Methods: One hundred and twenty women (120) primigravidas were studied from the 5th to40th gestational week, ages ranging from 20 to 29 years old, euthrophic and with low risk preg-nancies.Results: PImax and PEmax mean values were 88.5 � 16.52 cmH2O and 99.76 � 18.19 cmH2Orespectively. There was no association between gestational age and PImax (r Z �0.06;p Z 0.49) or PEmax (r Z �0.11; p Z 0.22). There was also no difference between PImaxand PEmax during pregnancy trimesters and no correlation between pregnancy age and thepressures in each trimester. Height was the only anthropometric variable indicating a signifi-cant PImax (r Z 0.20; p Z 0.02) association. Fundal uterus height and inter-recti abdominisdistance were not associated to respiratory pressure values. PEmax is not associated withthe group of predictor variables (p Z 0.127) and PImax demonstrated an independent associ-ation with height and dyspnea during physical exertion reflected by the following equation:PImax Z 0.6 þ 57.9 height e 1.68 dyspnea under effort. The present study suggests that inspi-ratory and expiratory maximum pressure values are not altered during different stages of preg-nancy, however longitudinal studies are needed to assess changes over time.ª 2010 Elsevier Ltd. All rights reserved.
terapia, Av Prof. Moraes Rego, 1235 Cidade, Universitaria, Recife 50670-901, Pernambuco, Brazil.721 1847.com.br (A. Lemos).
0 Elsevier Ltd. All rights reserved.

Pregnancy respiratory muscle strength 1639
Introduction
Pregnancy induced hormonal and anatomical effects on therespiratory system have been well documented in theliterature since the 30’s.1 Uterus growth is followed bya 4e5 cm diaphragm elevation and thoracic circumferenceincrease of 5e7 cm with a resulting 34� increase of thesubcostal angle.2,3
During pregnancy there is a progressive decrease of theexpiratory reserve volume (ERV) of 15e20% and of 20e25%of the residual volume (RV) resulting in a functional residualcapacity reduction (FRC) of 17e21%. A discrete inspiratorycapacity (IC) augmentation of 300 ml in average is deter-mined, compensating the FRC reduction and maintainingvital capacity (VC).3,4
Tidal volume (VT) increases by 30e50% due to theprogesterone stimulus in the hypothalamus and is the mainfactor causing the minute volume (MV) increase, sincerespiratory frequency (fR) increases by 2 incursions perminute and this does not cause a significant alteration.5 Asa result of this hyperventilation, dyspnea complaints arepresent in 60e70% of pregnant women.6
Notwithstanding the above mentioned reports onanatomic, volume and pulmonary capacities during preg-nancy, the behavior of respiratory muscular strength duringthis period remains uncertain. Respiratory strength assess-ment, reflected by inspiratory and expiratory pressures, hasbeen the topic of study in different populations includingthe elderly,7,8 young adults,9 teenages,10 children11 andpatients with respiratory12 and neurologic diseases.13
However, when relating to the pregnant population,studies found3,6,14 are scarce, not conclusive; involveinsufficient sampling in addition to being lacking in refer-ence values for this specific population.
Considering the need to understand respiratoryanatomic and functional alterations on inspiratory (PImax)and expiratory pressures (PEmax) during pregnancy, due tothe lack of studies in the researched literature investigatingsuch interactions, the objects of the present study weretwofold: (1) to describe the mean PImax and PEmax valuesin primigravidas, (2) to determine the correlation betweenage, gestational age, height, weight, body mass index(BMI), respiratory frequency (fR), uterus fundal height(UFH), inter-recti abdominal distance and dyspnea uponPImax and PEmax.
Methods
This is a cross-sectional study performed from January 2008to March 2009 in a public prenatal care clinic in the city ofRecife-Brazil.
The sample size was calculated based on Vittinghoff’s15
recommendation concerning the number of predictors to beincluded in regression models. According to this recommen-dationthenumber requiredshouldbeaminimumof10subjectsper predictor. This study consisted of 12 predictors in theregression models, totaling a sample of 120 pregnant women.
The sample selected sequentially and by convenienceincluded primigravidas between the 5th and 40th week withthe following eligibility criteria: age range between 20 and29 years old, not practicing physical exercises, euthrophic
and with low obstetrical risk pregnancies. Pregnant womenwith spinal and/or thoracic deformities, smoking history,pulmonary or neuromuscular pathologies, unable tounderstand and/or accomplish the procedure wereexcluded. The presence of flu or common cold as well asany clinical event capable of placing pregnancy at risk werealso excluding factors.
Institutional Approval of the Ethics and ResearchCommittee was secured under the registration number 986/2007 and the pregnant women who agreed to participatesigned an Informed and Independent Consent Form.
Procedure
All pregnant women underwent a prior evaluation for theobtainment of personal and anthropometric data. Gesta-tional age was calculated based on the last menstruationdate (LMD) confirmed by the first trimester ultrasoundwhen LMD was uncertain.
According to the eligibility criteria all pregnant womenexhibited an adequate BMI when related to pregnancy age,consistent with the Atalah16 method.
Physical activity level was measured by the InternationalPhysical Activity Questionnaire e IPAQ,17 version 8, in theshort form, and classified in three levels: low, moderateand high.
PImax and PEmax
PImax and PEmax values were obtained by the use ofa digital pressure transducer e range: 450 cmH2O e (G-MED�; MVD300) with systematic calibration. The 2 mmopening in the mouthpiece was used to prevent oral pres-sure and the protocol used was in accordance with the ATS/ERS Statement on Respiratory Muscle Testing.18
Before introducing the study’s protocol, each volunteerreceived the same explanation and demonstration on thepressure transducer use to obtain accurate measurement ofmaximum respiratory pressures. As a test, three priormaneuvers were performed before PImax and PEmaxcollection.
PImax was obtained based on the RV with the pregnantsoriented to exhale and then inhale deeply into the pressuretransducer. PEmax was obtained based on TPC (Total Pul-monar Capacity) with the women oriented to inhale tomaximum capacity and then to exhale deeply into thepressure transducer. During the expiratory effort, thewomen were instructed to place one of their hands overthe cheeks to avoid enlargement and the resulting pres-sure. Plateau pressures sustained for 1 s was used19 anda 1 min interval was made between maneuvers.
All measurements were accomplished with the volun-teers seated on a chair with backrest, feet resting on thefloor, hips and knees at 90� using a nasal clip.
Similar verbal encouragement was equally provided toeach of the women, as well as visual feedback through thedevice monitor to achieve maximum effort when measuringtook place.
Each parameter of every measured volume was accom-plished by at least 3 maneuvers, with only the technicallyacceptable ones being registered, that is to say the ones

1640 A. Lemos et al.
maintained stable for at least 1 s, with no air leak and a 10%variation between values. The highest positive and negativepressure values measured by the manovacuemeter wereselected for final analysis.
Inter-recti abdominis distance
The inter-recti abdominis muscle distance was measured bya digital caliper (STARRET�; 779) with a 0.002 mm accuracy.The pregnant woman were placed on a dorsal decubitusposition with hips and knees bent, feet resting on the bedand arms extended alongside the body. Three points werethen marked: 4.5 cm above the umbilicus, at the level ofthe umbilicus and 4.5 cm below the umbilicus according tothe Boissonnault and Blaschak20 protocol. The pregnantperformed a frontal flexion of the trunk until the inferiorborders of the scapulas were out of the bed. At each flexionthe medial distance between the two recti was palpatedand marked with a demographic pencil and followingmeasurements were taken with a caliper.
Uterine fundal height
Uterine fundal height was measured with the pregnantwoman in the dorsal decubitus position with extended hipsand knees and uncovered abdomen by use of a flexible, notextendable metric tape. The tape was held by its initialextremity in the superior border of the pubic symphysispassing through the index and middle fingers until thecubital border of the hand reached the uterus fundus.21
Dyspnea
To assess dyspnea degree the pregnant women were askedwhether they felt any respiratory difficulty at rest andunder physical exertion (climbing stairs, rough terrain, fast
Table 1 Sample description related to anthropometric data andand independent variables.
Independent Variables Dependent variables
Mean � standard deviation
Age (years) 23.34 � 2.7GA (weeks) 27.3 � 8.79Height (m) 1.59 � 0.06Weight (Kg) 63.43 � 6.9BMI (Kg/m2) 24.83 � 1.91fR (rpm) 18.18 � 2.68FUH (cm) 24.64 � 10.12IR-SUD (mm) 20.07 � 7.66IR-UD (mm) 25.03 � 8.64IR-IUD (mm) 18.23 � 7.5Rest dyspneaa 0.00 (0.00)Effort dyspneaa 3.00 (2.00)a Median (QR).b Pearson correlation coefficient. Maximum inspiratory Pressure (PIm
gestational age (GA), body mass index (BMI), respiratory frequency (fR(IR-SUD), inter-rectis umbilical distance (IR-UD), inter-rectis infra-um
walking, for example) the information was then classifiedaccording to the Borg modified dyspnea perception scalewhere 0 indicates no difficulty and 10 maximumdifficulties.22
Statistical analysis
Data indicate Gaussian distribution by the Kolmogor-oveSmirnov normality test. PImax and PEmax were consid-ered dependent variables and age, gestational age, inter-recti distance, height, weight, BMI, uterus fundal height,respiratory frequency and dyspnea degree were consideredindependent variables. The Pearson correlation was used totest the association between respiratory pressures andindependent variables. The ANOVA test was used to comparepressures’ means between pregnancy trimesters.
Multiple regression analysis was utilized to assess theimpact of independent variables on PImax and PEmax.Multiple linear regression equations were separatelydeveloped for PImax and PEmax. In the initial models,variables presenting a significance level <0.20 in thebivariate analysis were included. The final models wereobtained through the backward procedure with mainte-nance of the significance level of 0.05 only. For statisticalanalysis the MINITAB 14.0 software was utilized.
Results
From the 120 pregnant women studied, 12 of them were inthe first trimester, 50 in the second and 50 in the third one.In the first trimester it was observed that one women was inthe 5th gestational week, another in the 9th week, whilethe remaining (83%) were from the 11th to 13th gestationalweek. In the second and third trimester the distribution ofthe women was equitative along the weeks. The mean ageof the women was of 23.34 � 2.7 and pregnancy time was
correlation between respiratory pressures (PImax and PEmax)
PImax (cmH2O) PEmax (cmH2O)
rb p-value rb p-value
�0.03 0.75 0.08 0.41�0.06 0.49 �0.11 0.220.20 0.02 0.00 0.940.13 0.16 �0.06 0.48
�0.00 0.82 �0.09 0.31�0.17 0.06 �0.11 0.21�0.04 0.66 �0.09 0.300.05 0.57 �0.06 0.520.02 0.81 �0.02 0.87
�0.02 0.80 �0.08 0.41�0.14 0.11 �0.14 0.12�0.17 0.07 �0.16 0.08
ax) and expiratory pressure (PEmax) and independent variables:), fundal uterus height (FUH), inter-rectis supra-umbilical distancebilical distance (IR-IUD).
Assessed for eligibility
( n= 1920 )
Total recruited
(n= 131)
LOST (n= 11)
Unable to understand or do the test Unable to be measure for inter-recti abdominis distance Refuse to finish the test
EXCLUDED (TOTAL= 1789)
INELIGIBLE (n=1777)
• • • • •
• • •
• •
•
Inadequate body mass index Age < 20 - > 29 Multiparity High risk pregnancy Smoker
ELIGIBLE BUT NOT RECRUITED (n=12)
Refused to participate Presence of flu, cold or cough Fasting
Data available for analysis
(n = 120)
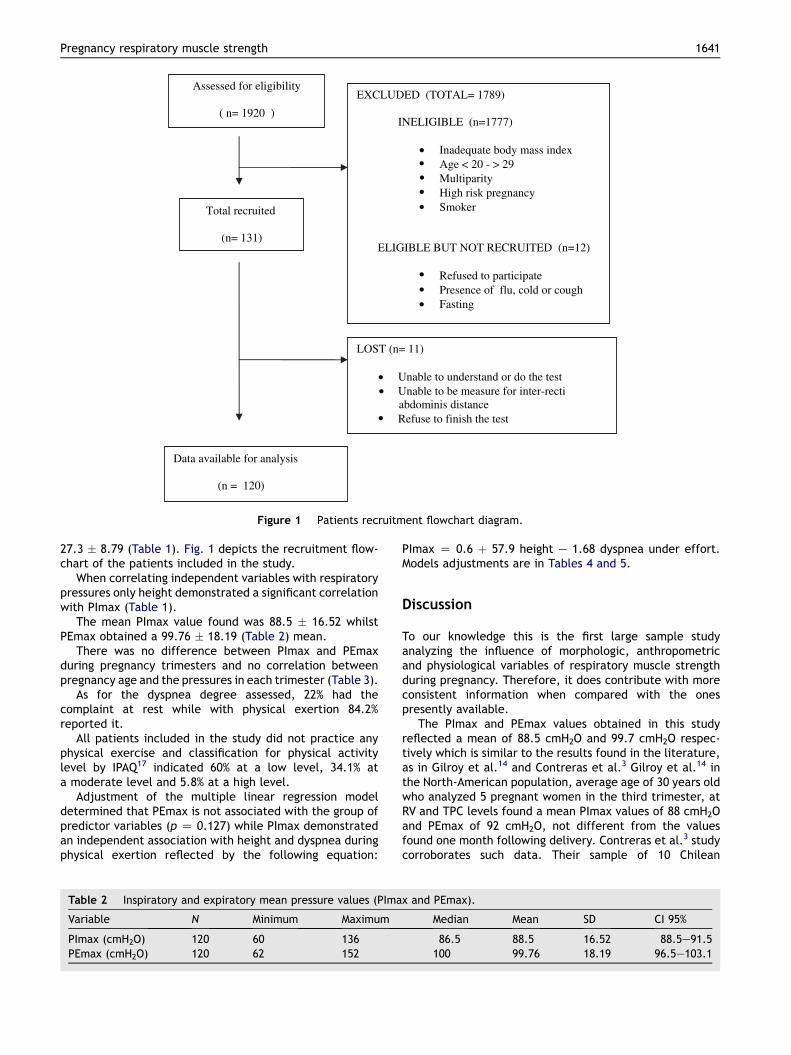
Figure 1 Patients recruitment flowchart diagram.
Pregnancy respiratory muscle strength 1641
27.3 � 8.79 (Table 1). Fig. 1 depicts the recruitment flow-chart of the patients included in the study.
When correlating independent variables with respiratorypressures only height demonstrated a significant correlationwith PImax (Table 1).
The mean PImax value found was 88.5 � 16.52 whilstPEmax obtained a 99.76 � 18.19 (Table 2) mean.
There was no difference between PImax and PEmaxduring pregnancy trimesters and no correlation betweenpregnancy age and the pressures in each trimester (Table 3).
As for the dyspnea degree assessed, 22% had thecomplaint at rest while with physical exertion 84.2%reported it.
All patients included in the study did not practice anyphysical exercise and classification for physical activitylevel by IPAQ17 indicated 60% at a low level, 34.1% ata moderate level and 5.8% at a high level.
Adjustment of the multiple linear regression modeldetermined that PEmax is not associated with the group ofpredictor variables (p Z 0.127) while PImax demonstratedan independent association with height and dyspnea duringphysical exertion reflected by the following equation:
Table 2 Inspiratory and expiratory mean pressure values (PIma
Variable N Minimum Maximum
PImax (cmH2O) 120 60 136PEmax (cmH2O) 120 62 152
PImax Z 0.6 þ 57.9 height e 1.68 dyspnea under effort.Models adjustments are in Tables 4 and 5.
Discussion
To our knowledge this is the first large sample studyanalyzing the influence of morphologic, anthropometricand physiological variables of respiratory muscle strengthduring pregnancy. Therefore, it does contribute with moreconsistent information when compared with the onespresently available.
The PImax and PEmax values obtained in this studyreflected a mean of 88.5 cmH2O and 99.7 cmH2O respec-tively which is similar to the results found in the literature,as in Gilroy et al.14 and Contreras et al.3 Gilroy et al.14 inthe North-American population, average age of 30 years oldwho analyzed 5 pregnant women in the third trimester, atRV and TPC levels found a mean PImax values of 88 cmH2Oand PEmax of 92 cmH2O, not different from the valuesfound one month following delivery. Contreras et al.3 studycorroborates such data. Their sample of 10 Chilean
x and PEmax).
Median Mean SD CI 95%
86.5 88.5 16.52 88.5e91.5100 99.76 18.19 96.5e103.1

Table 3 Comparison of respiratory pressures means and correlation with gestational age between pregnancy trimesters.
Trimesters n (%) PImax(cmH2O)(mean � SD)
r (p)b PEmax(cmH2O)(mean � SD)
r (p)b
1st (5the13th gestational week) 12 (10.0) 88.2 � 14.39 0.07(0.816) 102.5 � 27.19 �0.56 (0.056)2nd (14th �27th gestational week) 52 (43.3) 90.4 � 17.05 0.17 (0.221) 102.17 � 18.6 0.17 (0.214)3rd (28the40th gestational week) 56 (46.7) 86.8 � 16.52 �0.13 (0.343) 96.94 � 15.2 0.017 (0.905)pa 0.500 0.285a p-value for comparisons among gestational trimesters (ANOVA).b p-value for Pearson’s correlation coefficients.
1642 A. Lemos et al.
primiparous and multiparous women, with mean age of 28years old, obtained their values at functional residualcapacity (FRC) and found a mean PImax of 86 cmH2O and93 cmH2O for PEmax throughout pregnancy, which did notsuffer any alteration 6 months following delivery. However,Jensen23 observed a smaller value for PImax, 76.0, anda higher one for PEmax of 104 in 15 pregnant women, 30years old in the third trimester with measures on FRC andTPC respectively.
It is difficult to compare the results of this study with theones in the literature, once there are no reference valuesfor the pregnant population and the prediction equationsfor the adult population comprise a relatively broad agegroup.11,24e26
Respiratory muscular strength was maintained stablethroughout pregnancy suggesting the lack of impact ofpregnancy on the values of respiratory pressures. Althoughthese findings are consistent with the ones in otherstudies3,14 equally not showing significant change indifferent pregnancy trimesters, this fact is outstandingbecause of the differences demonstrated in the behavior ofpulmonary capacities and volumes indicating significantchanges throughout pregnancy.4,27
The fact that in the first trimester a tendency tostatistical significance occurred for the PEmax correlationwith the gestational week could be explained because oneof the women was in a very early gestational stage (5thweek), so, distant enough from the high concentration ofthe sample in the end of this trimester. This case, by itself,caused a considerable effect in the final result.
Respiratory pressure values were maintained stablewhen related to age. This result was expected because ofthe established age group determined to avoid the 30 yearold age, where significant pulmonary function decreasebegins interfering with pressure values.28,29
Weight and BMI reflected very low magnitude or nocorrelations therefore, they were not associated to PImax
Table 4 Linear regression model result for maximum expirator
Variables e PEmax (cmH2O) Initial model
Coefficient
Rest dyspnea �1.62Effort dyspnea �1.28n 120R2 3.5%a ANOVA test for both variables: p Z 0.127.
and PEmax and Height was the only anthropometric vari-able demonstrating a significant association, but only toPImax. This finding could be explained by its influence overribcage conformation affecting pulmonary volume.30
However, prior studies9,11,25,26,29,31 have shown conflictingresults concerning the interference of the anthropogeneticdata on respiratory pressures and theses variables havebeen shown to explain only very little of the variancefound. Looking at different studies different regressionequations appear to be even contradictory19 and in additionthere is a natural variability between subjects in the orderof 7e10% that according to Hautmann32 it could reflectindividual muscular differences.
Univariate analysis in the occurrence of dyspnea at restand under physical exertion did not reflect association withrespiratory pressures. Such findings corroborate the Garcia-Rio et al.6 study when comparing respiratory pressures of 11dyspneic and 12 non-dyspneic pregnant women and notfinding any difference between the two groups demon-strating that muscular strength is not the cause of preg-nancy dyspnea but the association stemming from theinspiratory drive increase resulting from progesteronestimulation. Nevertheless, in the final linear regressionmodel for PImax, dyspnea under effort indicated a signifi-cant negative association, demonstrating interference inthe generation of inspiratory strength. Thus this associa-tion: highest complaint of effort dyspnea and lower inspi-ratory strength value could reflect a mechanicaladjustment shortcoming caused by the respiratory driveincrease during pregnancy and an inadequate recruitmentof the inspiratory capacity.33 In spite of the fact that theGarcia-Rio et al.6 study did not determine any differencebetween the two groups, numerically the dyspneic groupdepicted a PImax mean inferior (78.0 cmH2O) to the non-dyspneic group (82 cmH2O and 106 cmH2O).
Notwithstanding the fact that regression analysis showsthe effect of height and effort dyspnea on respiratory
y pressure (PEmax).
Final model
p-value Coefficient p-value
0.364 a
0.231 a
120

Table 5 Linear regression model result for maximum inspiratory pressure (PImax).
Variables e Pimax (cmH2O) Initial model Final model
Coefficient p-value Coefficient p-value
Height 48.6 0.194 57.9 0.022Weight 0.05 0.866 a
fR �0.93 0.101 a
Rest dyspnea �1.07 0.504 a
Effort dyspnea �1.32 0.175 �1.68 0.046n 120 120R2 9.6% 7.1%a non significative.
Pregnancy respiratory muscle strength 1643
strength, the low determination coefficient (R2) makes itdifficult to improve PImax predictability once they onlyaccount for 7% of PImax variation.
Respiratory frequency was another parameter notinterfering in the PImax and PEmax values. During preg-nancy this parameter does not suffer significant alteration,does not contribute to minute volume increase and isdevoid of any association to dyspnea perception.5,33
Respiratory pressures were maintained regardless ofuterine height and inter-rectis distance. Such was anunexpected finding considering that with the abdominaldistention progression resulting from uterus growth there isan adjustment of the coronal and sagital planes of theabdominis rectis that could interfere in the generation ofmuscular strength.34 This result, therefore, confronts theassumption that major abdominal distention and theabdominis rectis opening could interfere with respiratorystrength during pregnancy. However, it should be empha-size that the inter-rectis distance mean found in this studywere between 18.23 and 25.03 mm what difficult extrapo-lation beyond these values.
One explanation for major morphological alterations inthe abdominal muscle not interfering in the respiratorystrength generation could be provided by muscular plas-ticity. Studies35,36 have demonstrated a significant additionof sarcomeres in skeletal muscle fibers when submitted toprolonged tension. As a result there is an adequate super-position of actin and myosin filaments with the resultingincrease of the maximum tension by the muscle in its newextended position.
In addition, diaphragmatic elevation associated to FRCreduction causes the expansion of the apposition zone ofthe diaphragm related to the ribcage facilitating the abilityto generate tension, therefore contributing to maintain thePImax values.3,14 Futhermore it is important to emphasizethat PImax addresses the global inspiratory musclestrength, so more specific information would be desirablefor diaphragmatic function during pregnancy once itsconfiguration changes during this period. Therefore trans-diaphragmatic pressures would be needed for this purpose.
The measurement of respiratory muscle strengththrough PImax and PEmax tests are simple, quick and highvalues exclude clinically significant weakness. Howeversome disadvantages should be pointed out (difficulty ofnormal value calculation, volitional maneuver) and morethan one test of respiratory muscle function is necessary toreliably judge on this specific muscle strength.37
Alternatively, non-volitional test could have theoreticallybeen used, like the transdiaphragmatic pressure, but theyare more complex and invasive and this appears to be notappropriate to this specific population. It is well known thatpulmonary volume, incentive and technique learninginterfere in respiratory pressures measurement.24,25 Thisstudy sought to minimize such interference by the obtain-ment of pressures’ values from RV and TPC to get moremuscle tension according to muscle tensionelength rela-tionship.38 All volunteers were encouraged the same wayand oriented to perform inspiration or expiration prior tothe maximum fast manner because this interferes with thevalues reached.39 This way, evaluating the volunteers onlyonce, the learning effect was minimized. In addition,because the physical activity level can interfere withpressure values, this parameter was controlled by includingpregnant women who did not practice physical exercises.
Conclusions
The present study suggests that inspiratory and expiratorymaximum pressure values are not altered during differentstages of pregnancy, however, longitudinal studies areneeded to assess changes over time. Height and effortdyspnea have a minor influence in the inspiratory strength,while the distension and separation of the abdominalmuscle, the rest dyspnea, as well as other anthropometricvariables do not influence respiratory strength values inpregnant women.
This result conveys new information suggesting thatincreased dyspnea during pregnancy can be the result ofthe muscle mechanical restriction in the face of theincreased tidal volume resulting from thoracic compliancereduction without the involvement of the abdominalcompartment.
Considering the literature scarce data related to respi-ratory strength reference values for pregnancy, it isa requirement, in terms of continuity, that a longitudinalstudy involving all of the pregnancy and puerperal cycle beperformed to add more data to this analysis.
Conflict of interest statement
We, the authors (Andrea Lemos, Ariani Impieri de Souza,Armele Dornelas de Andrade, Jose Natal Figueiroa, JoseEulalio Cabral-Filho) Certify that there is no conflict of

1644 A. Lemos et al.
interest with any financial organization or any kind of otherpersonal relationship that could inappropriately influencethe work regarding the material discussed in the manu-script: Respiratory muscle strength in pregnancy.
References
1. McGinty AP. The comparative effects of pregnancy and phrenicnerve interruption on the diaphragm and their relation topulmonary tuberculosis. Am J Obstet Gynecol 1938;35:237e48;Am J Respir Crit Care Med 2002;166:518e624.
2. Thomson KJ, Cohen ME. Studies in the circulation in pregnancyII. Vital capacity observations in normal pregnant women. SurgGynecol Obstet 1938;66:591e603.
3. ContrerasG,GutierrezM,BeroızaT,FantınA,OddoH,VillarroelL,CruzE,LisboaC.Ventilatorydriveand respiratorymuscle functionin pregnancy. Am Rev Respir Dis 1991;144:837e41.
4. Cugell DW, Frank NR, Gaensler EA, Badger TL. Pulmonaryfunction in pregnancy. Am Rev Tub 1953;67:568e97.
5. Kolarzyk E, Szot WM, Lyszczarz J. Lung function and breathingregulation parameters during pregnancy. Arch Gynecol Obstet2005;272:53e8.
6. Garcia-Rio F, Pino JM, Gomez L, Alvarez-Sala R, Villasante C,Villamor J. Regulation of breathing and perception of dyspneain healthy pregnant women. Chest 1996;110:446e53.
7. McElvaney G, Blackie S, Morrison NJ, Wilcox PG, Fairbarn MS,Pardy RL. Maximal static respiratory pressures in the normalelderly. Am Rev Respir Dis 1989;139:277e81.
8. Enright PL, Kronmal RA, Manolio TA, Schenker MB, Hyatt RE.Respiratory muscle strength in the elderly. Correlates andreference values. Cardiovascular Health Study Research Group.Am J Respir Crit Care Med 1994;149:430e8.
9. Leech JA, Ghezzo H, Stevens D, Becklake M. Respiratorypressures and function in young adults. Am Rev Respir Dis 1983;128:17e23.
10. Smyth RJ, Chapman KR, Ribuck AS. Maximal inspiratory andexpiratory pressures in adolescents: normal values. Chest1984;86:568e72.
11. Wilson SH, Cooke NT, Edwards RHT, Piro SG. Predicted normalvalues for maximal respiratory pressures in Caucasian adultsand children. Thorax 1984;39:535e8.
12. Rochester DF, Arora NS, Braun NM. The respiratory muscles inchronic obstructive pulmonary disease (COPD). Bull Eur Phys-iopathol Respir 1979;15:951e75.
13. Gounden P. Static respiratory pressures in patients with post-traumatic tetraplegia. Spinal Cord 1997;35:43e7.
14. Gilroy RJ, Mangura BT, Lavietes MH. Rib cage and abdominalvolume displacements during breathing in pregnancy. Am RevRespir Dis 1988;137:668e72.
15. Vittinghoff E, Glidden DV, Stephen C. Regression methods inbiostatistics: linear logistic, survival and repeated measuresmodel. Springer: Verlag; 2004.
16. Atalah S, Castillo LC, Castro SR, Aldea PA. Propuesta de umnuevo estandar de evaluacion nutricional em embarazadas.Rev Med Chile 1997;125:1429e36.
17. IPAQ. Guidelines for data processing and analysis of theinternational physical activity questionnaire (IPAQ) e short andlong forms, www.ipaq.ki.se/ipaq.htm; November 2005.
18. ATS/ERS. Statement on respiratory muscle testing. Am J RespirCrit Care Med 2002;166:518e624.
19. Windisch W, Hennings E, Sorichter S, Hamm H, Criee CP. Peakor plateau maximal inspiratory inspiratory mouth pressure:which is best? Eur Respir J 2004;23:708e13.
20. Boissonnault JS, Blaschak M. Incidence of diastasis rectiabdominis during the childbearing year. Phys Ther 1988;68:1082e6.
21. Cunningham FG, Gant NF, Leveno KJ, Gilstrap LC, Hauth JC,Wenstrom KD. Willians obstetrics. 21st ed. McGraw-HillProfessional; 2001.
22. Borg G. Borg�s perceived exertion and pain scales. Champaign:Human Kinetics Publishers; 1998.
23. Jensen D, Webb K, Davies GAL, ODonnell DE. Mechanicalventilatory constraints during incremental cycle exercise inhuman pregnancy: implications for respiratory sensation. JPhysiol 2008;586:4735e50.
24. Black LF, Hyatt RE. Maximal respiratory pressures: normalvalues and relationship to age and sex. Am Rev Respir Dis 1969;99:696e702.
25. Bruschi C, Cerveri I, Zoia M, Fanfulla F, Fiorentini M, Casali L.Reference values of maximal respiratory mouth pressures:a population-based study. Am Rev Respir Dis 1992;146:790e3.
26. Johan A, Chan CC, Chia HP, Chan OY, Wang YT. Maximalrespiratory pressures in adult Chinese, Malays and Indians. EurRespir J 1997;10:2825e8.
27. McAuliffe F, Kametas N, Espinoza J, Greenough A, Nicolaides K.Respiratory function in pregnancy at sea level and at highaltitude. Br J Obstet Gynaecol 2004;111:311e5.
28. Rea H, Becklake MR, Ghezzo H. Lung function changes asa reflection of tissue aging in young adults. Bull Eur Physi-opathol Respir 1983;185:5e19.
29. Vincken W, Ghezzo H, Cosio MG. Maximal static respiratorypressures in adults: normal values and their relationship todeterminants of respiratory function. Bull Eur PhysiopatholRespir 1987;23:435e9.
30. Tan MP, Wynn NN, Umerow M, Henderson A, Gillham A,Junejo S, Bansal SK. Arm Span to height ratio is related toseverity of dyspnea, reduced spirometry volumes, and rightheart strain. Chest 2009;135:448e54.
31. Harik-Khan R, Wise RA, Fozard JL. Determinants of maximalinspiratory pressure. The Baltimore longitudinal study of aging.Am J Respir Cri. Care Med 1998;158:1459e64.
32. Hautmann H, Hefele S, Schotten K, Huber RM. Maximal inspi-ratory mouth pressures (PIMAX) in healthy subjects- what is thelower limit of normal? Respir Med 2000;94:689e93.
33. Jensen D, Ofir D, ODonnell DE. Effects of pregnancy, obesityand aging on the intensity of perceived breathlessness duringexercise in healthy humans. Resp Physiol Neurobiol 2009;167:87e100.
34. Gilleard WL, Brown JM. Structure and function of the abdom-inal muscles in primigravid subjects during pregnancy and theimmediate postbirth period. Phys Ther 1996;76:750e62.
35. De Deyne PG. Application of passive stretch and its implica-tions for muscle fibers. Phys Ther 2001;81:819e27.
36. Lindsey CA, Makarov MR, Shoemaker S, Birch JG, Buschang PH,Cherkashin AM, et al. The effect of the amount of limblengthening on skeletal muscle. Clin Orthop Rel Res 2002;402:278e87.
37. Steir J, Kaul S, Seymour J, Jolley C, Rafferty G, Man W, et al.The value of multiple tests of respiratory muscle strength.Thorax 2007;62:975e80.
38. Kera T, Maruyama H. Study of influence factor on maximalmouth pressure part I- Influence of posture. J. Phys. Ther. Sci.2001;13:153e60.
39. Zakynthinos S, Vassilakopoulos T, Mavrommatis A, Roussos C,Tzelepis G. Effects of different expiratory maneuvers oninspiratory muscle force output. Am J Respir Crit Care Med1999;159:892e5.