Distribution strength - Juhayna
52
DISTRIBUTION STRENGTH 2012 ANNUAL REPORT
-
Upload
khangminh22 -
Category
Documents
-
view
1 -
download
0
Transcript of Distribution strength - Juhayna
Distribution strength
2012ANNUAL REPORT

Kafr el sheikhAlexandria
bringing our ProDucts to the consumer sAfely AnD efficiently
Zagazig (Al sharqia)
mansoura
Qalyoubia
cairogiza
Port said
suez
Aswan
luxor
sohag
Assiut
ismailia
hurghadael tour
(south sinai)
beheira
monofia
minya
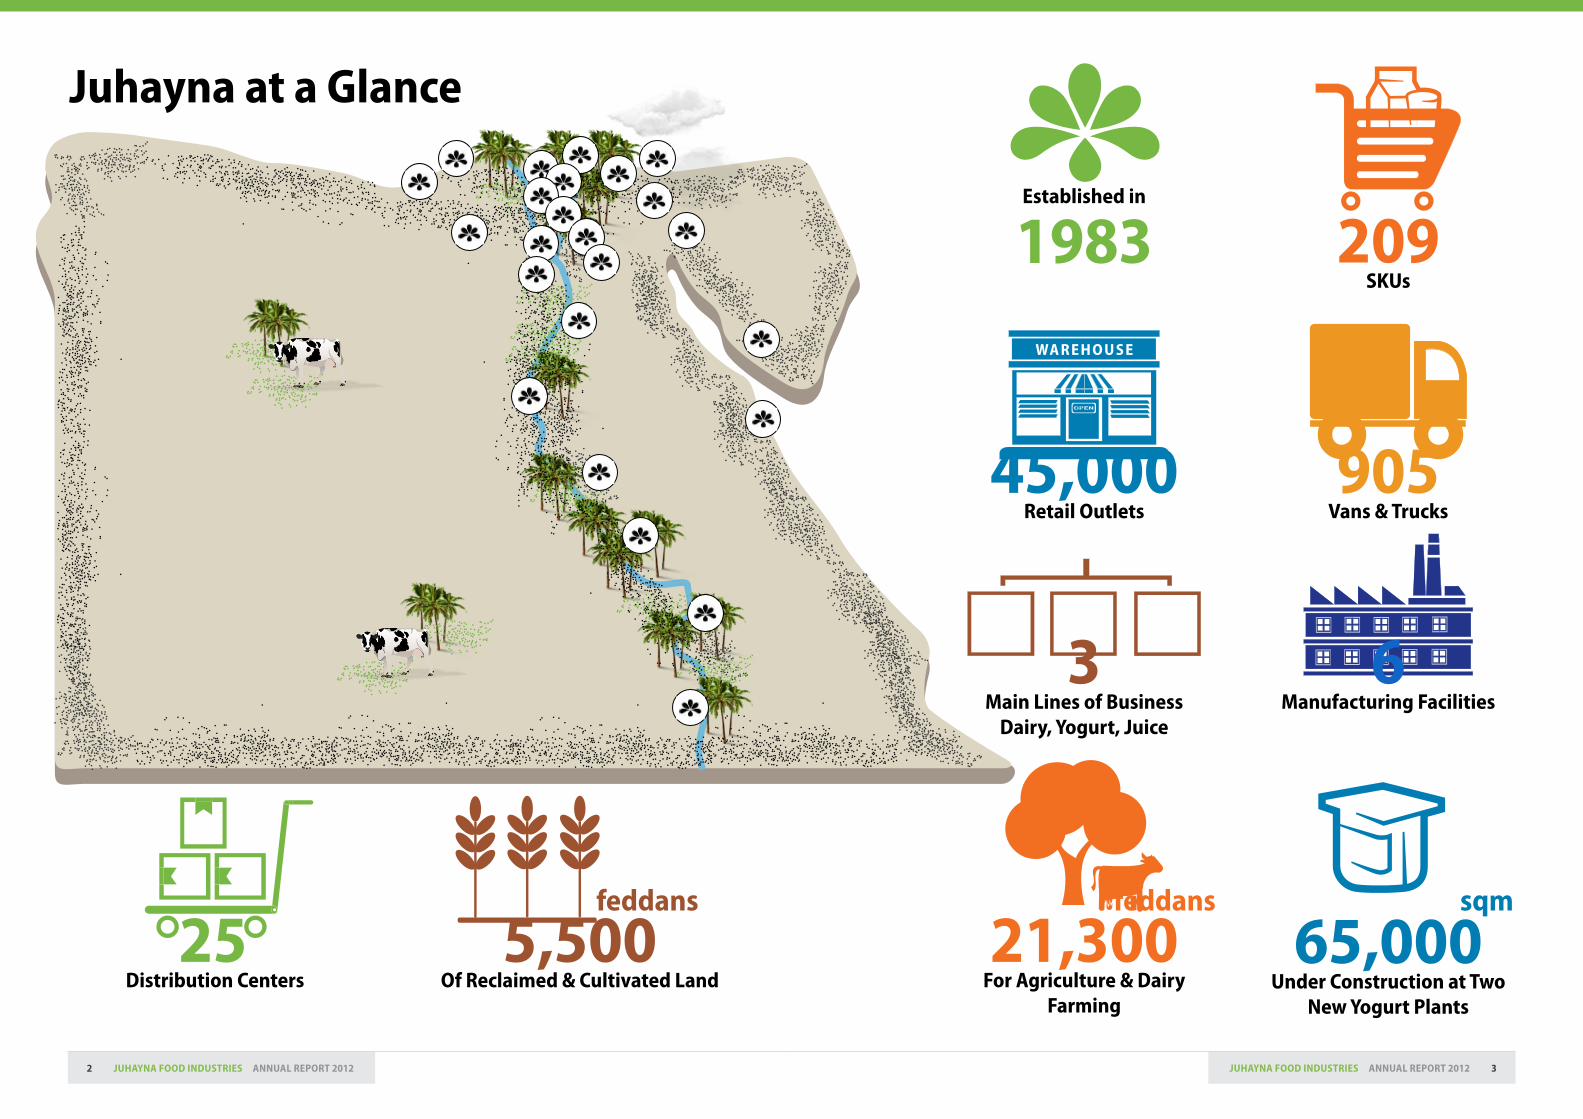
beni suefJuhayna has built an unparalleled nationwide network that includes 25 modern, automated distribution centers. The network is supported by a fleet of 905 vans and trucks to ensure safe and timely delivery of our products to 45,000 retail outlets throughout Egypt.
6 manufacturing facilities Producing top-of-the-line dairy, yogurt and juice products
25 Distribution centersReaching millions of customers throughout Egypt
5 new Distribution centersInaugurated in 5 governorates in 2012
45,000 retail outletsServing millions of customers across 27 governorates
905 Vans and trucksDelivering fresh, healthy products
2 new yogurt PlantsUnder construction in Assiut and Sixth of October City to help meet growing consumer demand
tanta (Al gharbia)
contentsJuhayna at a Glance ����������������������������������������������������������� 2
2012 Highlights ������������������������������������������������������������������ 4
A Word from Our Chairman ��������������������������������������������� 6
Management Discussion and Analysis ����������������������������� 8
Our History ���������������������������������������������������������������������� 14
Lines of Business Review ������������������������������������������������ 18
Our Industry �������������������������������������������������������������������� 38
Strategy ���������������������������������������������������������������������������� 42
Management Overview ��������������������������������������������������� 46
Governance ���������������������������������������������������������������������� 52
Financial Statements ������������������������������������������������������� 58
3JuhAynA fooD inDustries AnnuAl rePort 20122 JuhAynA fooD inDustries AnnuAl rePort 2012
5,500 of reclaimed & cultivated land
feddans
Juhayna at a glance
25 Distribution centers
established in
1983 209sKus
65,000under construction at two
new yogurt Plants
sqmfeddans
3 main lines of business
Dairy, yogurt, Juice
45,000 retail outlets
905Vans & trucks
6manufacturing facilities
21,300for Agriculture & Dairy
farming
WA r e h o u s e
5JuhAynA fooD inDustries AnnuAl rePort 20124 JuhAynA fooD inDustries AnnuAl rePort 2012
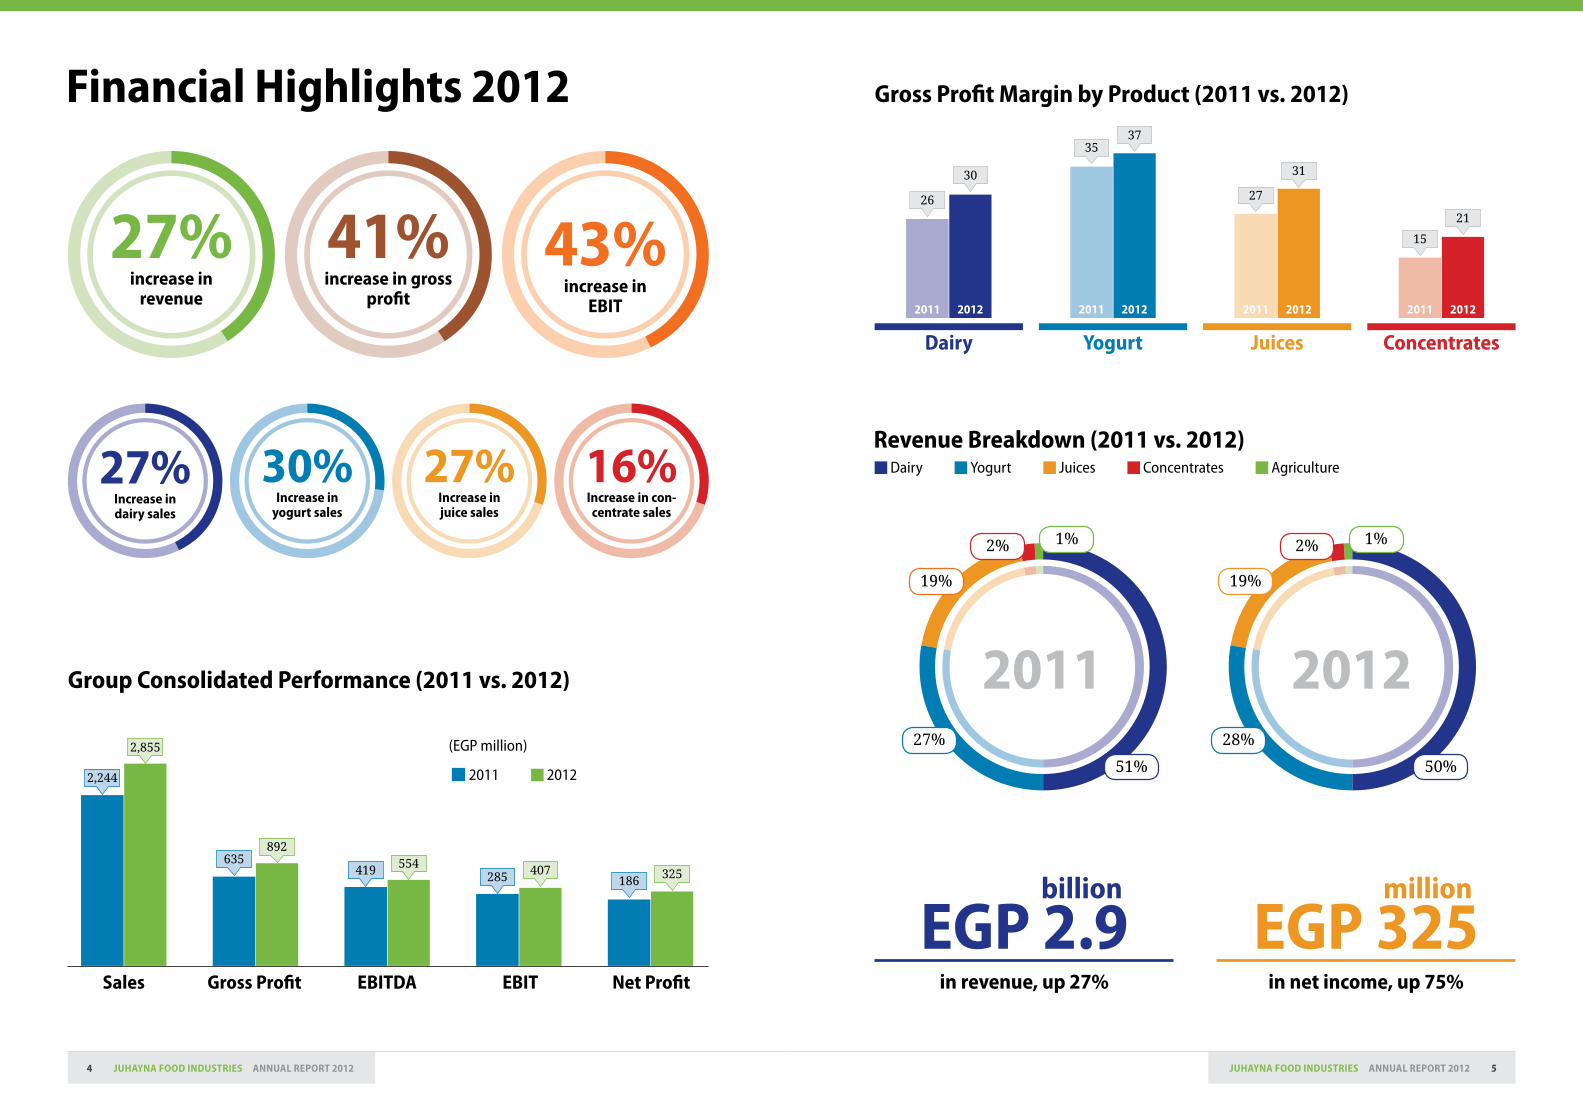
financial highlights 2012
revenue breakdown (2011 vs. 2012)
gross Profit margin by Product (2011 vs. 2012)
41%increase in gross
profit
27%increase in
revenue
43%increase in
ebit
27%increase in dairy sales
27%increase in juice sales
30%increase in
yogurt sales
16%increase in con-centrate sales
50%
28%
19%
2% 1%
201251%
27%
19%
2% 1%
2011
billion
egP 2.9in revenue, up 27%
million
egP 325in net income, up 75%
Dairy Yogurt Juices Concentrates Agriculture
21
15
concentrates
20122011
31
27
Juices
20122011
3735
yogurt
20122011
30
26
Dairy
20122011
group consolidated Performance (2011 vs. 2012)
sales gross Profit ebitDA ebit net Profit
2,855
2,244
892635 554419 407285 325186
2011 2012
(EGP million)
7JuhAynA fooD inDustries AnnuAl rePort 20126 JuhAynA fooD inDustries AnnuAl rePort 2012
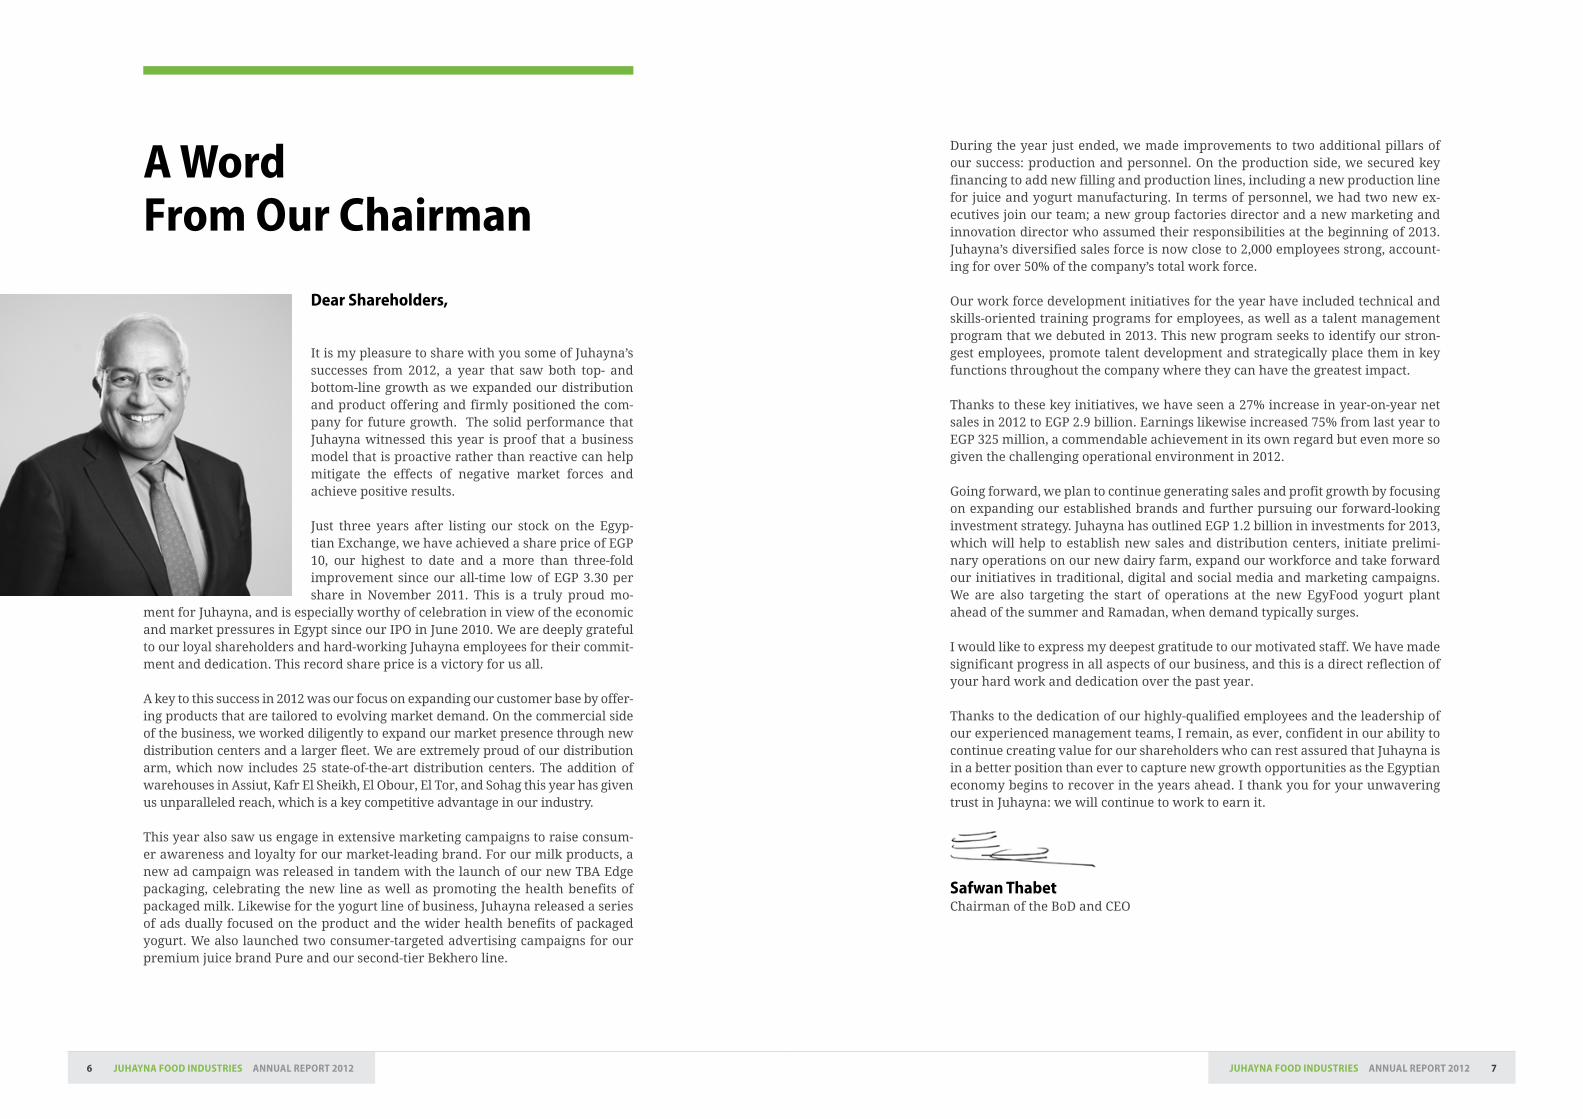
Dear shareholders,
It is my pleasure to share with you some of Juhayna’s successes from 2012, a year that saw both top- and bottom-line growth as we expanded our distribution and product offering and firmly positioned the com-pany for future growth� The solid performance that Juhayna witnessed this year is proof that a business model that is proactive rather than reactive can help mitigate the effects of negative market forces and achieve positive results�
Just three years after listing our stock on the Egyp-tian Exchange, we have achieved a share price of EGP 10, our highest to date and a more than three-fold improvement since our all-time low of EGP 3�30 per share in November 2011� This is a truly proud mo-
ment for Juhayna, and is especially worthy of celebration in view of the economic and market pressures in Egypt since our IPO in June 2010� We are deeply grateful to our loyal shareholders and hard-working Juhayna employees for their commit-ment and dedication� This record share price is a victory for us all�
A key to this success in 2012 was our focus on expanding our customer base by offer-ing products that are tailored to evolving market demand� On the commercial side of the business, we worked diligently to expand our market presence through new distribution centers and a larger fleet� We are extremely proud of our distribution arm, which now includes 25 state-of-the-art distribution centers� The addition of warehouses in Assiut, Kafr El Sheikh, El Obour, El Tor, and Sohag this year has given us unparalleled reach, which is a key competitive advantage in our industry�
This year also saw us engage in extensive marketing campaigns to raise consum-er awareness and loyalty for our market-leading brand� For our milk products, a new ad campaign was released in tandem with the launch of our new TBA Edge packaging, celebrating the new line as well as promoting the health benefits of packaged milk� Likewise for the yogurt line of business, Juhayna released a series of ads dually focused on the product and the wider health benefits of packaged yogurt� We also launched two consumer-targeted advertising campaigns for our premium juice brand Pure and our second-tier Bekhero line�
A Word from our chairman
During the year just ended, we made improvements to two additional pillars of our success: production and personnel� On the production side, we secured key financing to add new filling and production lines, including a new production line for juice and yogurt manufacturing� In terms of personnel, we had two new ex-ecutives join our team; a new group factories director and a new marketing and innovation director who assumed their responsibilities at the beginning of 2013� Juhayna’s diversified sales force is now close to 2,000 employees strong, account-ing for over 50% of the company’s total work force�
Our work force development initiatives for the year have included technical and skills-oriented training programs for employees, as well as a talent management program that we debuted in 2013� This new program seeks to identify our stron-gest employees, promote talent development and strategically place them in key functions throughout the company where they can have the greatest impact�
Thanks to these key initiatives, we have seen a 27% increase in year-on-year net sales in 2012 to EGP 2�9 billion� Earnings likewise increased 75% from last year to EGP 325 million, a commendable achievement in its own regard but even more so given the challenging operational environment in 2012�
Going forward, we plan to continue generating sales and profit growth by focusing on expanding our established brands and further pursuing our forward-looking investment strategy� Juhayna has outlined EGP 1�2 billion in investments for 2013, which will help to establish new sales and distribution centers, initiate prelimi-nary operations on our new dairy farm, expand our workforce and take forward our initiatives in traditional, digital and social media and marketing campaigns� We are also targeting the start of operations at the new EgyFood yogurt plant ahead of the summer and Ramadan, when demand typically surges�
I would like to express my deepest gratitude to our motivated staff� We have made significant progress in all aspects of our business, and this is a direct reflection of your hard work and dedication over the past year�
Thanks to the dedication of our highly-qualified employees and the leadership of our experienced management teams, I remain, as ever, confident in our ability to continue creating value for our shareholders who can rest assured that Juhayna is in a better position than ever to capture new growth opportunities as the Egyptian economy begins to recover in the years ahead� I thank you for your unwavering trust in Juhayna: we will continue to work to earn it�
safwan thabetChairman of the BoD and CEO

9JuhAynA fooD inDustries AnnuAl rePort 20128 JuhAynA fooD inDustries AnnuAl rePort 2012
managementDiscussion and Analysis
Our ability to interpret and respond to evolv-ing consumer habits and changing market trends in a timely and efficient manner has been key to our success.
1110 JuhAynA fooD inDustries AnnuAl rePort 2012JuhAynA fooD inDustries AnnuAl rePort 2012
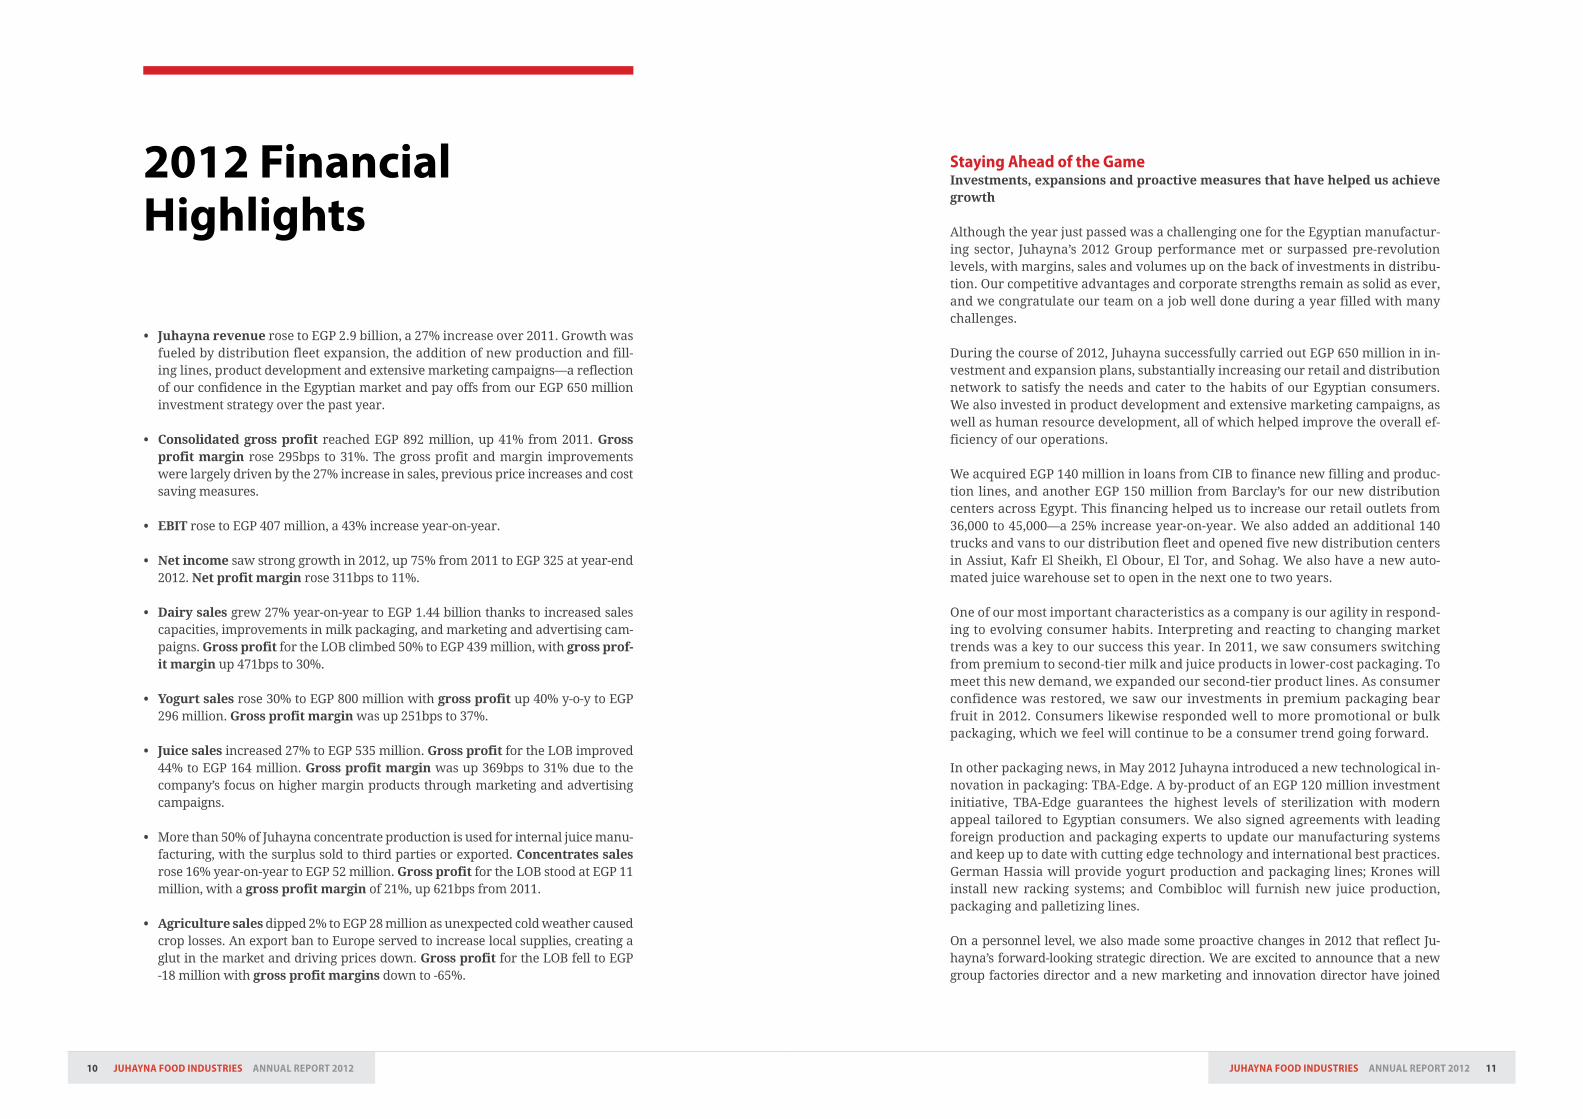
• Juhaynarevenuerose to EGP 2�9 billion, a 27% increase over 2011� Growth was fueled by distribution fleet expansion, the addition of new production and fill-ing lines, product development and extensive marketing campaigns—a reflection of our confidence in the Egyptian market and pay offs from our EGP 650 million investment strategy over the past year�
• Consolidatedgrossprofitreached EGP 892 million, up 41% from 2011� Gross profit margin rose 295bps to 31%� The gross profit and margin improvements were largely driven by the 27% increase in sales, previous price increases and cost saving measures�
• EBITrose to EGP 407 million, a 43% increase year-on-year�
• Netincomesaw strong growth in 2012, up 75% from 2011 to EGP 325 at year-end 2012� Netprofitmarginrose 311bps to 11%�
• Dairysalesgrew 27% year-on-year to EGP 1�44 billion thanks to increased sales capacities, improvements in milk packaging, and marketing and advertising cam-paigns� Gross profit for the LOB climbed 50% to EGP 439 million, with gross prof-it margin up 471bps to 30%�
• Yogurtsalesrose 30% to EGP 800 million with gross profit up 40% y-o-y to EGP 296 million� Gross profit margin was up 251bps to 37%�
• Juicesales increased 27% to EGP 535 million� Gross profit for the LOB improved 44% to EGP 164 million� Gross profit margin was up 369bps to 31% due to the company’s focus on higher margin products through marketing and advertising campaigns�
• More than 50% of Juhayna concentrate production is used for internal juice manu-facturing, with the surplus sold to third parties or exported� Concentratessalesrose 16% year-on-year to EGP 52 million� Gross profit for the LOB stood at EGP 11 million, with a gross profit margin of 21%, up 621bps from 2011�
• Agriculturesalesdipped 2% to EGP 28 million as unexpected cold weather caused crop losses� An export ban to Europe served to increase local supplies, creating a glut in the market and driving prices down� Gross profit for the LOB fell to EGP -18 million with gross profit margins down to -65%�
2012 Financial Highlights
staying Ahead of the gameInvestments,expansionsandproactivemeasuresthathavehelpedusachievegrowth
Although the year just passed was a challenging one for the Egyptian manufactur-ing sector, Juhayna’s 2012 Group performance met or surpassed pre-revolution levels, with margins, sales and volumes up on the back of investments in distribu-tion� Our competitive advantages and corporate strengths remain as solid as ever, and we congratulate our team on a job well done during a year filled with many challenges�
During the course of 2012, Juhayna successfully carried out EGP 650 million in in-vestment and expansion plans, substantially increasing our retail and distribution network to satisfy the needs and cater to the habits of our Egyptian consumers� We also invested in product development and extensive marketing campaigns, as well as human resource development, all of which helped improve the overall ef-ficiency of our operations�
We acquired EGP 140 million in loans from CIB to finance new filling and produc-tion lines, and another EGP 150 million from Barclay’s for our new distribution centers across Egypt� This financing helped us to increase our retail outlets from 36,000 to 45,000—a 25% increase year-on-year� We also added an additional 140 trucks and vans to our distribution fleet and opened five new distribution centers in Assiut, Kafr El Sheikh, El Obour, El Tor, and Sohag� We also have a new auto-mated juice warehouse set to open in the next one to two years�
One of our most important characteristics as a company is our agility in respond-ing to evolving consumer habits� Interpreting and reacting to changing market trends was a key to our success this year� In 2011, we saw consumers switching from premium to second-tier milk and juice products in lower-cost packaging� To meet this new demand, we expanded our second-tier product lines� As consumer confidence was restored, we saw our investments in premium packaging bear fruit in 2012� Consumers likewise responded well to more promotional or bulk packaging, which we feel will continue to be a consumer trend going forward�
In other packaging news, in May 2012 Juhayna introduced a new technological in-novation in packaging: TBA-Edge� A by-product of an EGP 120 million investment initiative, TBA-Edge guarantees the highest levels of sterilization with modern appeal tailored to Egyptian consumers� We also signed agreements with leading foreign production and packaging experts to update our manufacturing systems and keep up to date with cutting edge technology and international best practices� German Hassia will provide yogurt production and packaging lines; Krones will install new racking systems; and Combibloc will furnish new juice production, packaging and palletizing lines�
On a personnel level, we also made some proactive changes in 2012 that reflect Ju-hayna’s forward-looking strategic direction� We are excited to announce that a new group factories director and a new marketing and innovation director have joined
1312 JuhAynA fooD inDustries AnnuAl rePort 2012JuhAynA fooD inDustries AnnuAl rePort 2012
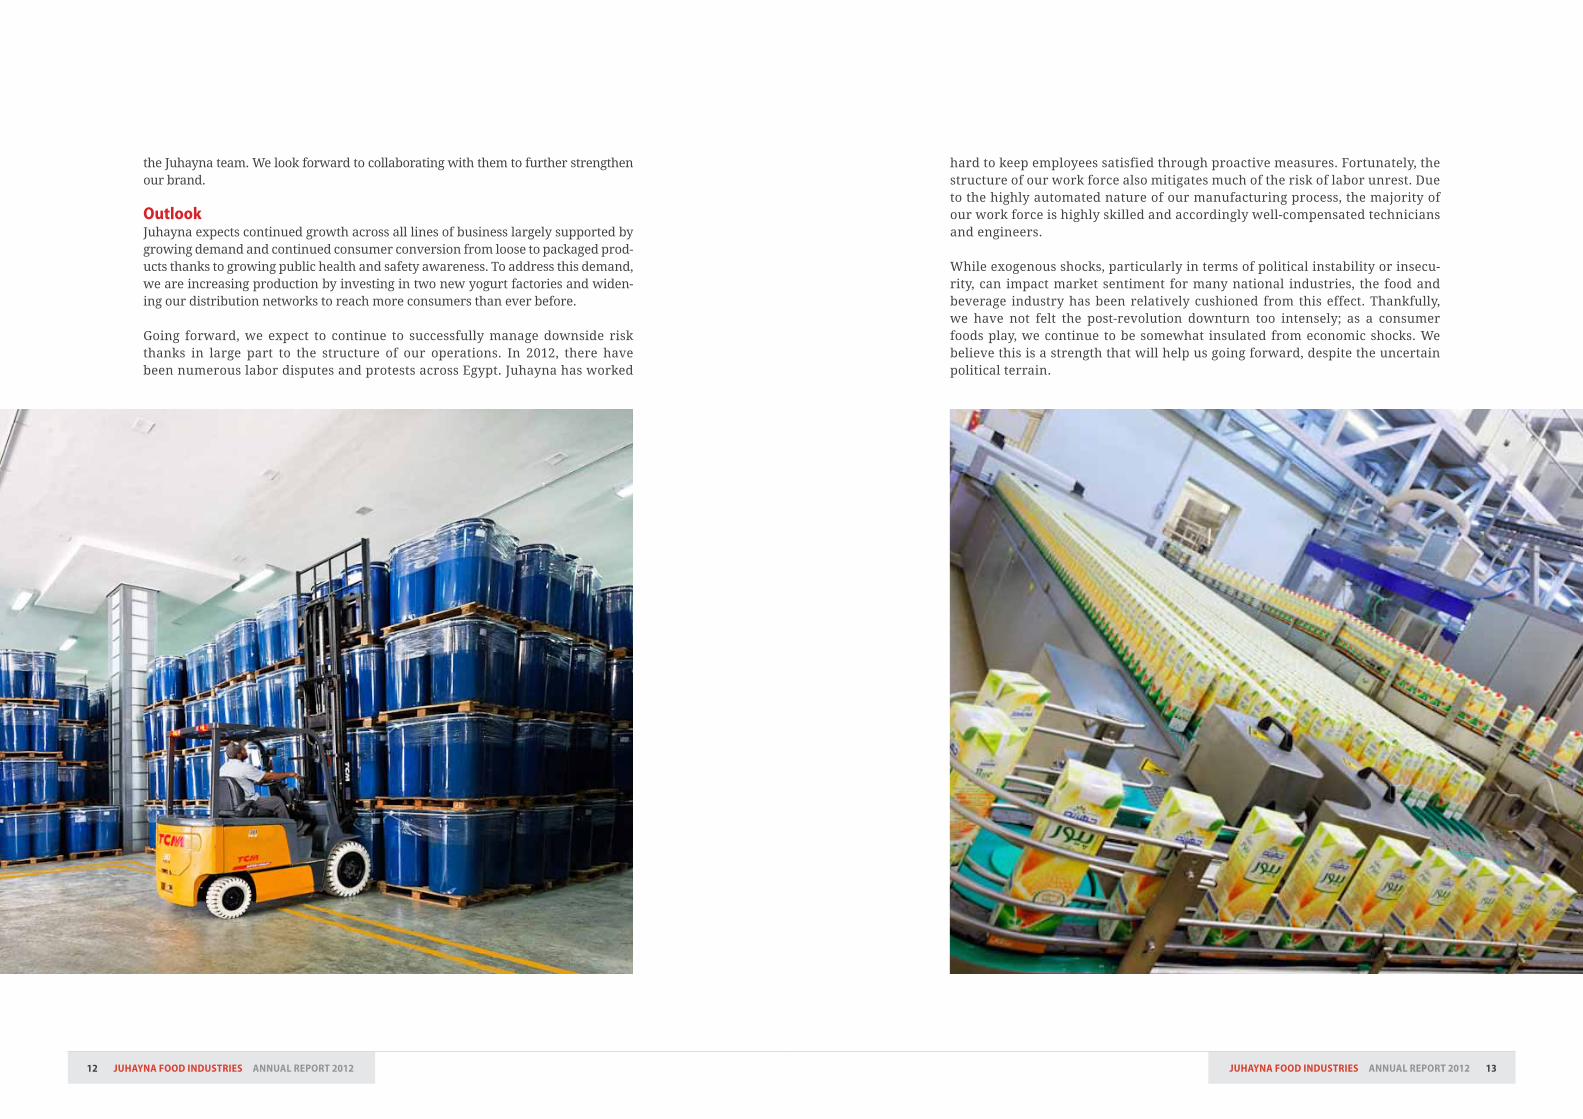
the Juhayna team� We look forward to collaborating with them to further strengthen our brand�
outlookJuhayna expects continued growth across all lines of business largely supported by growing demand and continued consumer conversion from loose to packaged prod-ucts thanks to growing public health and safety awareness� To address this demand, we are increasing production by investing in two new yogurt factories and widen-ing our distribution networks to reach more consumers than ever before�
Going forward, we expect to continue to successfully manage downside risk thanks in large part to the structure of our operations� In 2012, there have been numerous labor disputes and protests across Egypt� Juhayna has worked
hard to keep employees satisfied through proactive measures� Fortunately, the structure of our work force also mitigates much of the risk of labor unrest� Due to the highly automated nature of our manufacturing process, the majority of our work force is highly skilled and accordingly well-compensated technicians and engineers�
While exogenous shocks, particularly in terms of political instability or insecu-rity, can impact market sentiment for many national industries, the food and beverage industry has been relatively cushioned from this effect� Thankfully, we have not felt the post-revolution downturn too intensely; as a consumer foods play, we continue to be somewhat insulated from economic shocks� We believe this is a strength that will help us going forward, despite the uncertain political terrain�
15JuhAynA fooD inDustries AnnuAl rePort 201214 JuhAynA fooD inDustries AnnuAl rePort 2012
our historyPioneering the production of dairy and juice products foralmost3decades, Juhaynahasset a new benchmark for excellence in theEgyptianfoodmanufacturingsector.
17JuhAynA fooD inDustries AnnuAl rePort 201216 JuhAynA fooD inDustries AnnuAl rePort 2012
1983
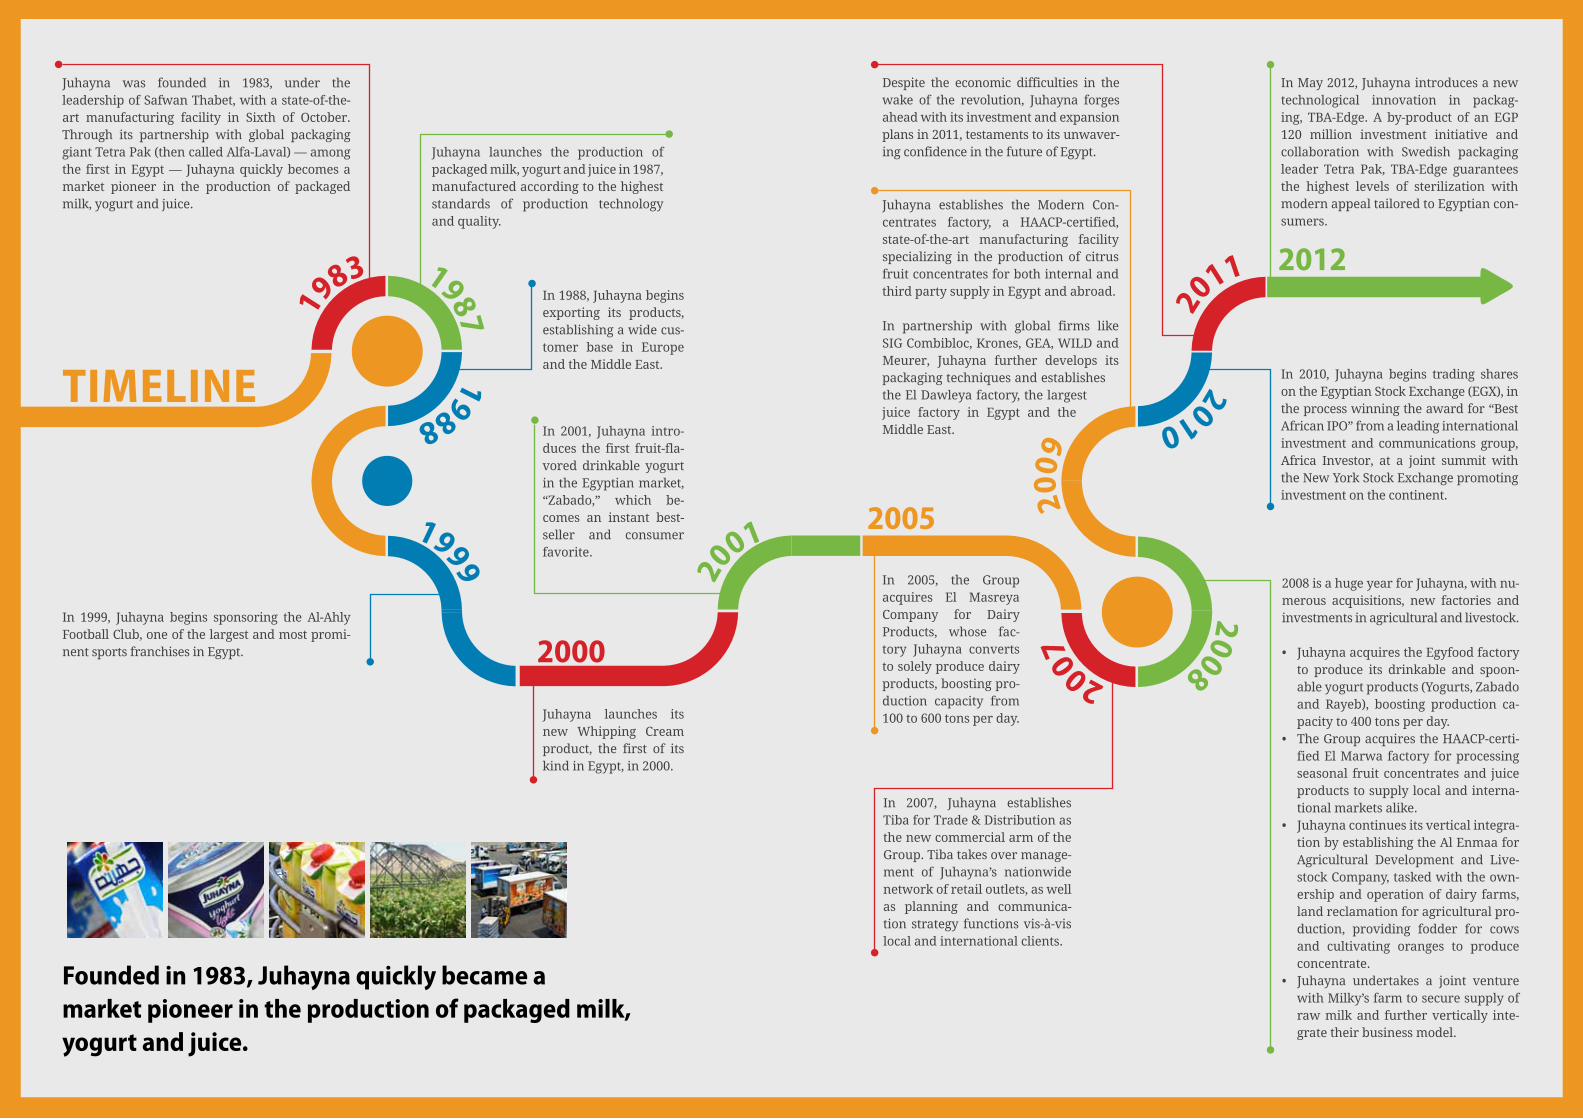
In 1999, Juhayna begins sponsoring the Al-Ahly Football Club, one of the largest and most promi-nent sports franchises in Egypt�
In 2007, Juhayna establishes Tiba for Trade & Distribution as the new commercial arm of the Group� Tiba takes over manage-ment of Juhayna’s nationwide network of retail outlets, as well as planning and communica-tion strategy functions vis-à-vis local and international clients�
2008 is a huge year for Juhayna, with nu-merous acquisitions, new factories and investments in agricultural and livestock�
• Juhayna acquires the Egyfood factory to produce its drinkable and spoon-able yogurt products (Yogurts, Zabado and Rayeb), boosting production ca-pacity to 400 tons per day�
• The Group acquires the HAACP-certi-fied El Marwa factory for processing seasonal fruit concentrates and juice products to supply local and interna-tional markets alike�
• Juhayna continues its vertical integra-tion by establishing the Al Enmaa for Agricultural Development and Live-stock Company, tasked with the own-ership and operation of dairy farms, land reclamation for agricultural pro-duction, providing fodder for cows and cultivating oranges to produce concentrate�
• Juhayna undertakes a joint venture with Milky’s farm to secure supply of raw milk and further vertically inte-grate their business model�
2005
2012
Juhayna launches the production of packaged milk, yogurt and juice in 1987, manufactured according to the highest standards of production technology and quality�
In 2001, Juhayna intro-duces the first fruit-fla-vored drinkable yogurt in the Egyptian market, “Zabado,” which be-comes an instant best-seller and consumer favorite�
In 2005, the Group acquires El Masreya Company for Dairy Products, whose fac-tory Juhayna converts to solely produce dairy products, boosting pro-duction capacity from 100 to 600 tons per day�
In 1988, Juhayna begins exporting its products, establishing a wide cus-tomer base in Europe and the Middle East�
Juhayna launches its new Whipping Cream product, the first of its kind in Egypt, in 2000�
In May 2012, Juhayna introduces a new technological innovation in packag-ing, TBA-Edge� A by-product of an EGP 120 million investment initiative and collaboration with Swedish packaging leader Tetra Pak, TBA-Edge guarantees the highest levels of sterilization with modern appeal tailored to Egyptian con-sumers�
In 2010, Juhayna begins trading shares on the Egyptian Stock Exchange (EGX), in the process winning the award for “Best African IPO” from a leading international investment and communications group, Africa Investor, at a joint summit with the New York Stock Exchange promoting investment on the continent�
Despite the economic difficulties in the wake of the revolution, Juhayna forges ahead with its investment and expansion plans in 2011, testaments to its unwaver-ing confidence in the future of Egypt�
timeline
Juhayna was founded in 1983, under the leadership of Safwan Thabet, with a state-of-the-art manufacturing facility in Sixth of October� Through its partnership with global packaging giant Tetra Pak (then called Alfa-Laval) — among the first in Egypt — Juhayna quickly becomes a market pioneer in the production of packaged milk, yogurt and juice�
19871988
2009
1999
200020
01
2007
2010
Juhayna establishes the Modern Con-centrates factory, a HAACP-certified, state-of-the-art manufacturing facility specializing in the production of citrus fruit concentrates for both internal and third party supply in Egypt and abroad�
In partnership with global firms like SIG Combibloc, Krones, GEA, WILD and Meurer, Juhayna further develops its packaging techniques and establishes the El Dawleya factory, the largest juice factory in Egypt and the Middle East�
founded in 1983, Juhayna quickly became a market pioneer in the production of packaged milk, yogurt and juice.
2011
2008
19JuhAynA fooD inDustries AnnuAl rePort 201218 JuhAynA fooD inDustries AnnuAl rePort 2012
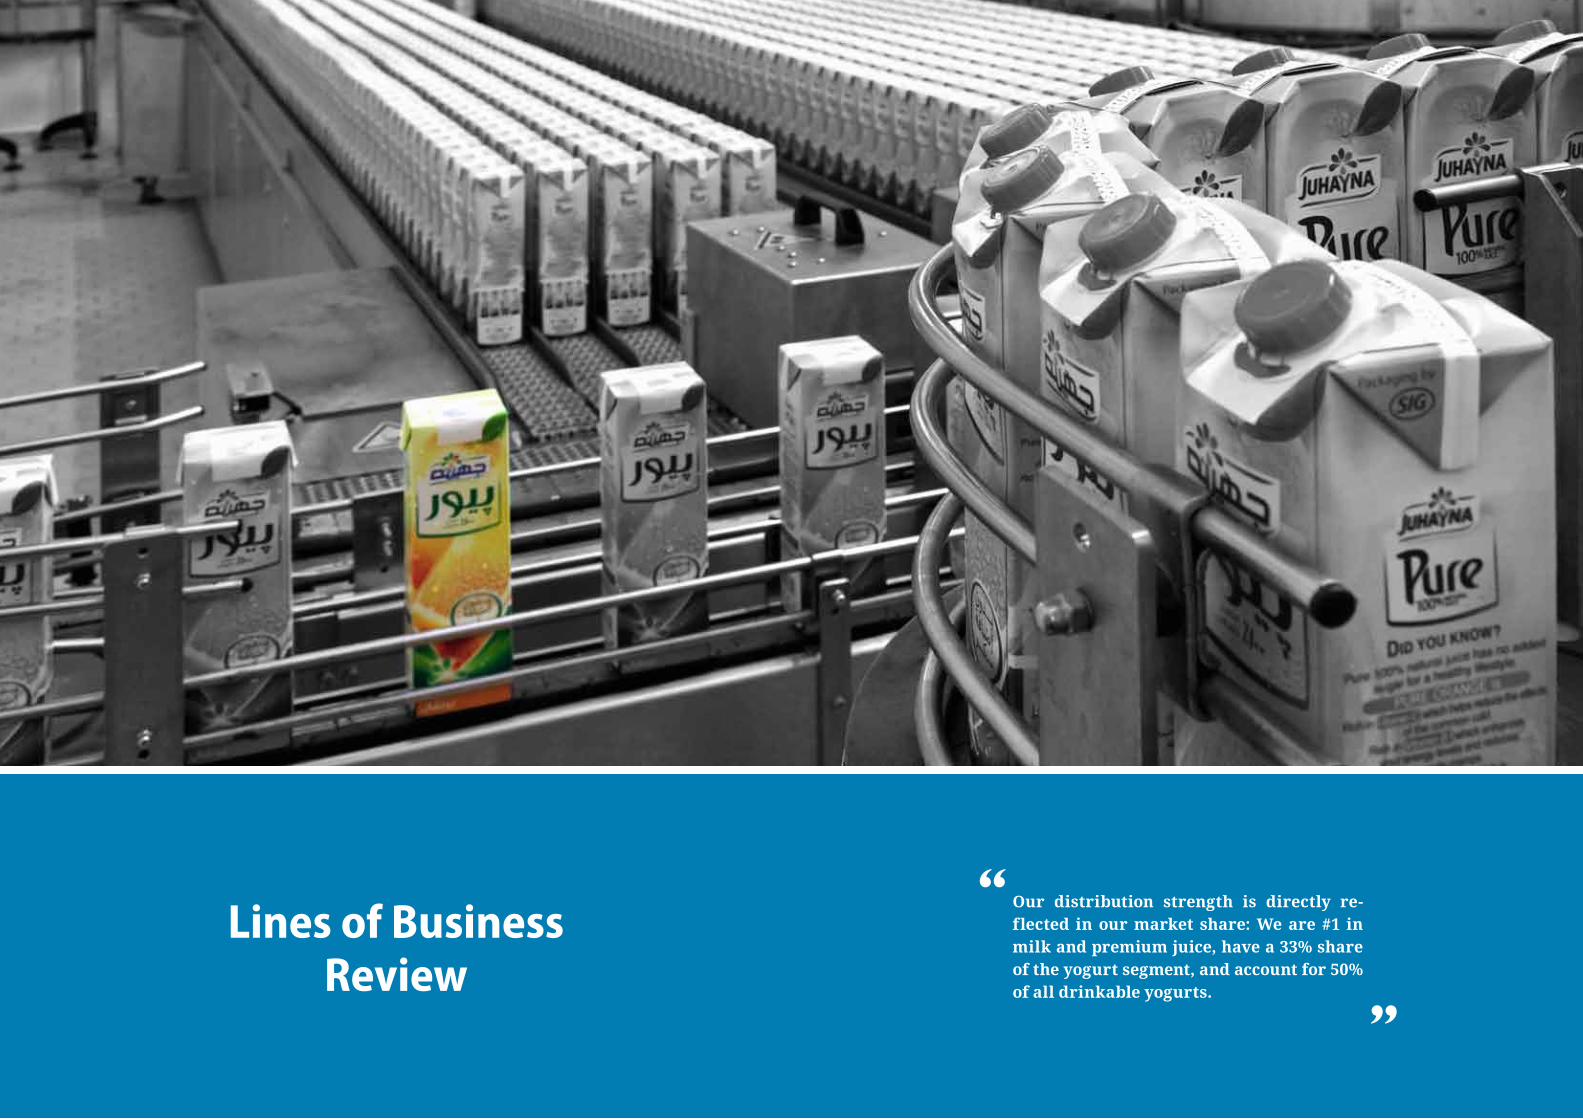
lines of businessreview
Our distribution strength is directly re-flected in our market share: We are #1 in milkandpremiumjuice,havea33%shareoftheyogurtsegment,andaccountfor50%of all drinkable yogurts.

2120
Business Segments and Legal Structure
Yogurt SEGmEnt
Agriculture &FArming SEGmEnt
Juice SEGmEnt
commerciAl Arm
DAirY SEGmEnt
concentrAtes SEGmEnt
Juhayna foodindustries
100%
egyptian food industries (egyfood)
99.9%
international co. for modern food industries
(el Dawleya)
99.9%
el marwa food industries co.
99.9%
Al enmaa for Agricultural Development & livestock
99.9%
tiba for trade and Distribution
99.9%
Cartonnectar - Pure - bekhero
Bottletingo
Spoonable yogurtPlain - light -
Actilife - mix - fruit
Drinkable yogurtrayeb - Zabado
masreya Dairy co.(99.9%)
Plain milkJuhayna - bekhero -
foam milk
Flavored milkmix - Jino
White cheesefeta - istanbouli
CreamWhipping -
cooking - sour - ice cream mix
enmaa for reclamation & Agriculture
(99.9%)
enmaa for livestock(99.9%)
milky's Dairy co.(40%)
JuhAynA fooD inDustries AnnuAl rePort 2012JuhAynA fooD inDustries AnnuAl rePort 2012
modern concentrate co.
(99.9%)
2322 JuhAynA fooD inDustries AnnuAl rePort 2012 JuhAynA fooD inDustries AnnuAl rePort 2012
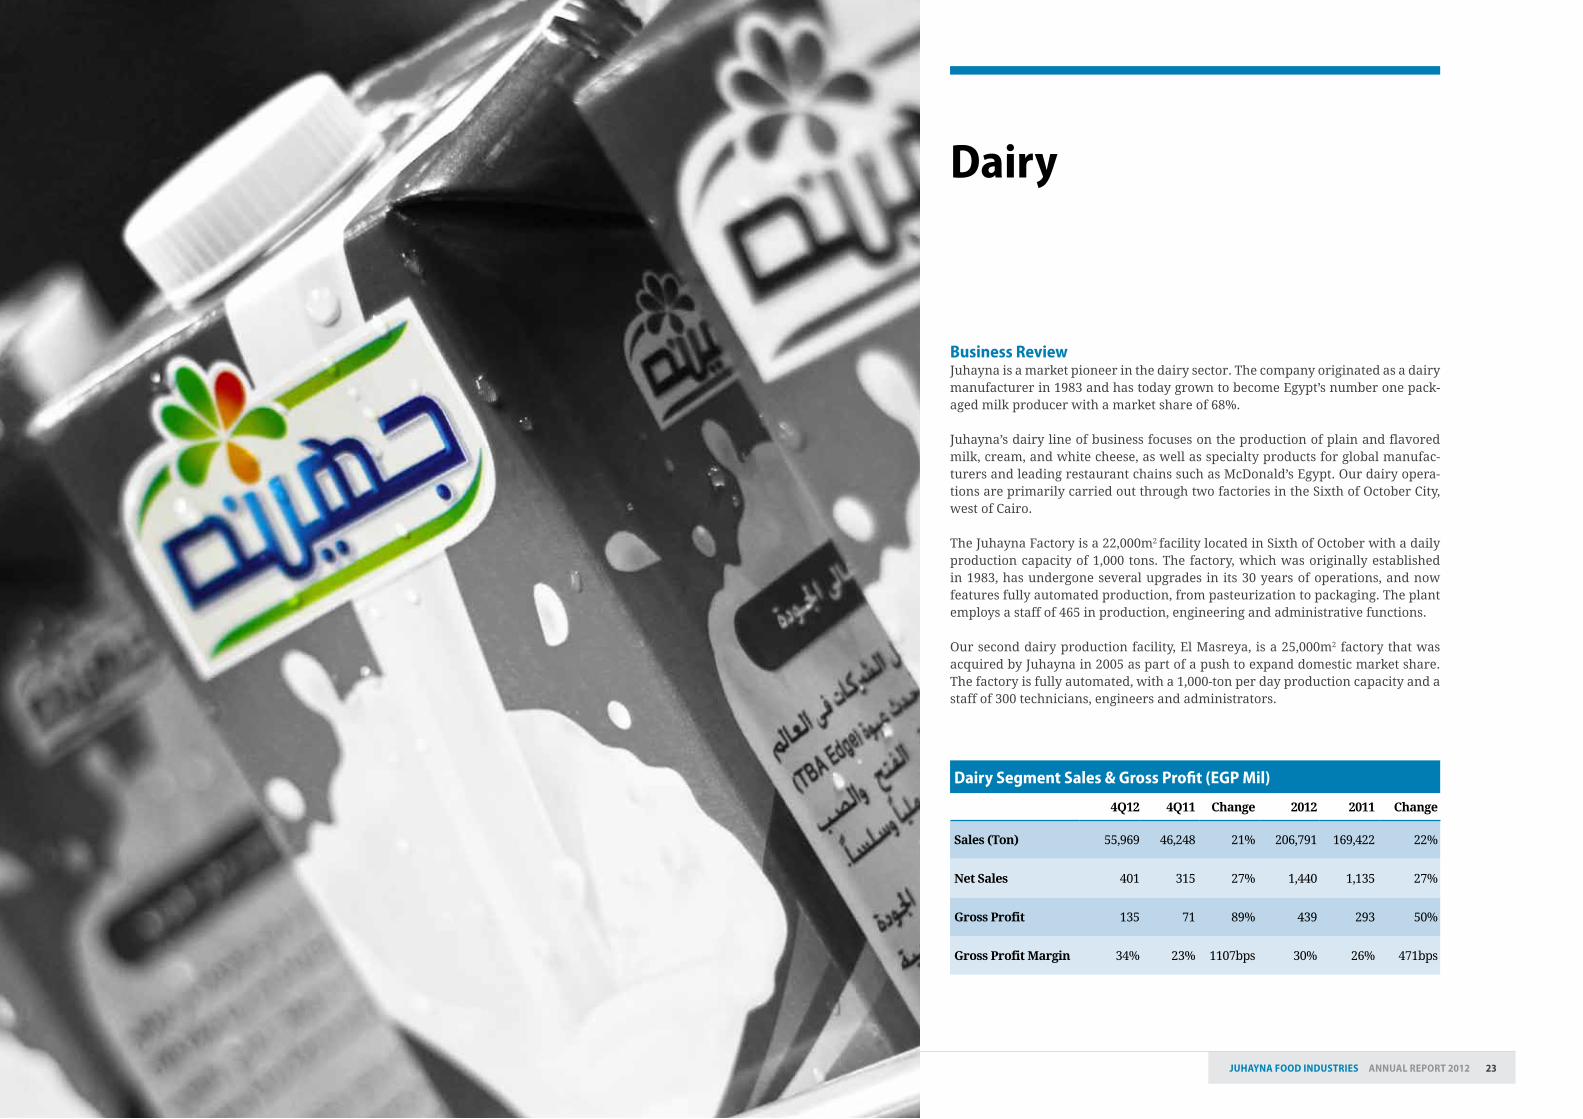
business reviewJuhayna is a market pioneer in the dairy sector� The company originated as a dairy manufacturer in 1983 and has today grown to become Egypt’s number one pack-aged milk producer with a market share of 68%�
Juhayna’s dairy line of business focuses on the production of plain and flavored milk, cream, and white cheese, as well as specialty products for global manufac-turers and leading restaurant chains such as McDonald’s Egypt� Our dairy opera-tions are primarily carried out through two factories in the Sixth of October City, west of Cairo�
The Juhayna Factory is a 22,000m2 facility located in Sixth of October with a daily production capacity of 1,000 tons� The factory, which was originally established in 1983, has undergone several upgrades in its 30 years of operations, and now features fully automated production, from pasteurization to packaging� The plant employs a staff of 465 in production, engineering and administrative functions�
Our second dairy production facility, El Masreya, is a 25,000m2 factory that was acquired by Juhayna in 2005 as part of a push to expand domestic market share� The factory is fully automated, with a 1,000-ton per day production capacity and a staff of 300 technicians, engineers and administrators�
Dairy
Dairy segment sales & gross Profit (egP mil)
4Q12 4Q11 Change 2012 2011 Change
Sales(Ton) 55,969 46,248 21% 206,791 169,422 22%
NetSales 401 315 27% 1,440 1,135 27%
Gross Profit 135 71 89% 439 293 50%
Gross Profit Margin 34% 23% 1107bps 30% 26% 471bps
2524 JuhAynA fooD inDustries AnnuAl rePort 2012JuhAynA fooD inDustries AnnuAl rePort 2012
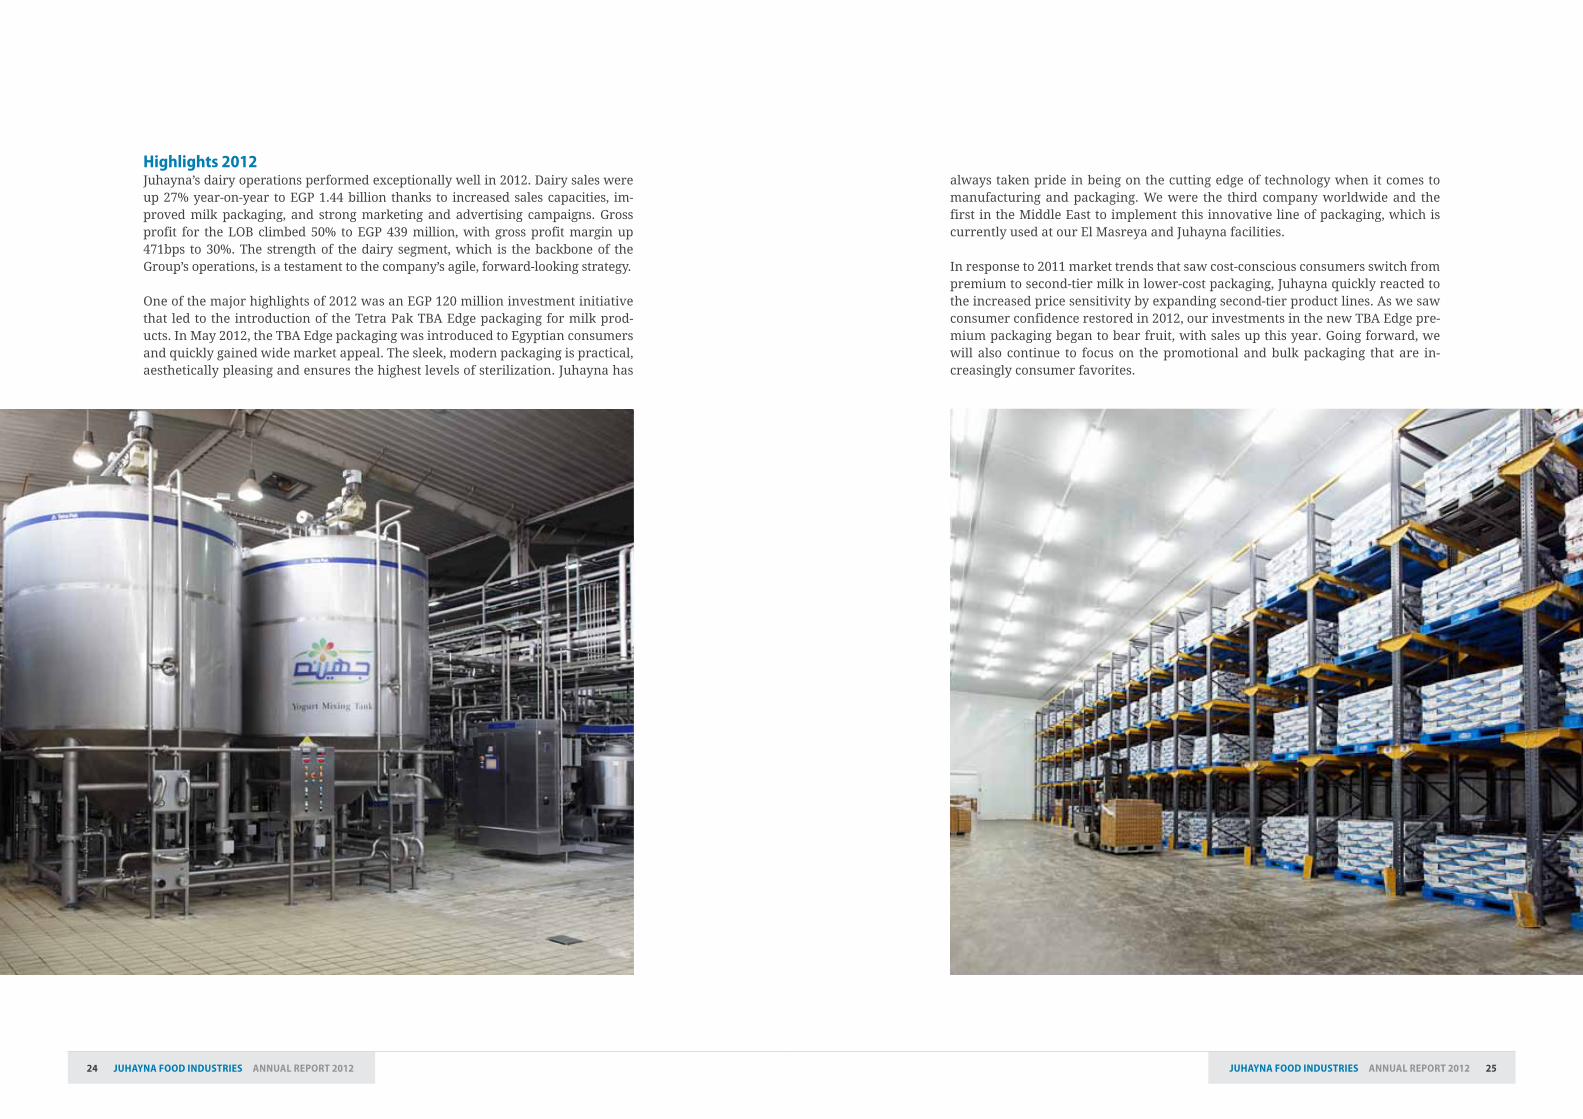
highlights 2012Juhayna’s dairy operations performed exceptionally well in 2012� Dairy sales were up 27% year-on-year to EGP 1�44 billion thanks to increased sales capacities, im-proved milk packaging, and strong marketing and advertising campaigns� Gross profit for the LOB climbed 50% to EGP 439 million, with gross profit margin up 471bps to 30%� The strength of the dairy segment, which is the backbone of the Group’s operations, is a testament to the company’s agile, forward-looking strategy�
One of the major highlights of 2012 was an EGP 120 million investment initiative that led to the introduction of the Tetra Pak TBA Edge packaging for milk prod-ucts� In May 2012, the TBA Edge packaging was introduced to Egyptian consumers and quickly gained wide market appeal� The sleek, modern packaging is practical, aesthetically pleasing and ensures the highest levels of sterilization� Juhayna has
always taken pride in being on the cutting edge of technology when it comes to manufacturing and packaging� We were the third company worldwide and the first in the Middle East to implement this innovative line of packaging, which is currently used at our El Masreya and Juhayna facilities�
In response to 2011 market trends that saw cost-conscious consumers switch from premium to second-tier milk in lower-cost packaging, Juhayna quickly reacted to the increased price sensitivity by expanding second-tier product lines� As we saw consumer confidence restored in 2012, our investments in the new TBA Edge pre-mium packaging began to bear fruit, with sales up this year� Going forward, we will also continue to focus on the promotional and bulk packaging that are in-creasingly consumer favorites�
2726 JuhAynA fooD inDustries AnnuAl rePort 2012 JuhAynA fooD inDustries AnnuAl rePort 2012
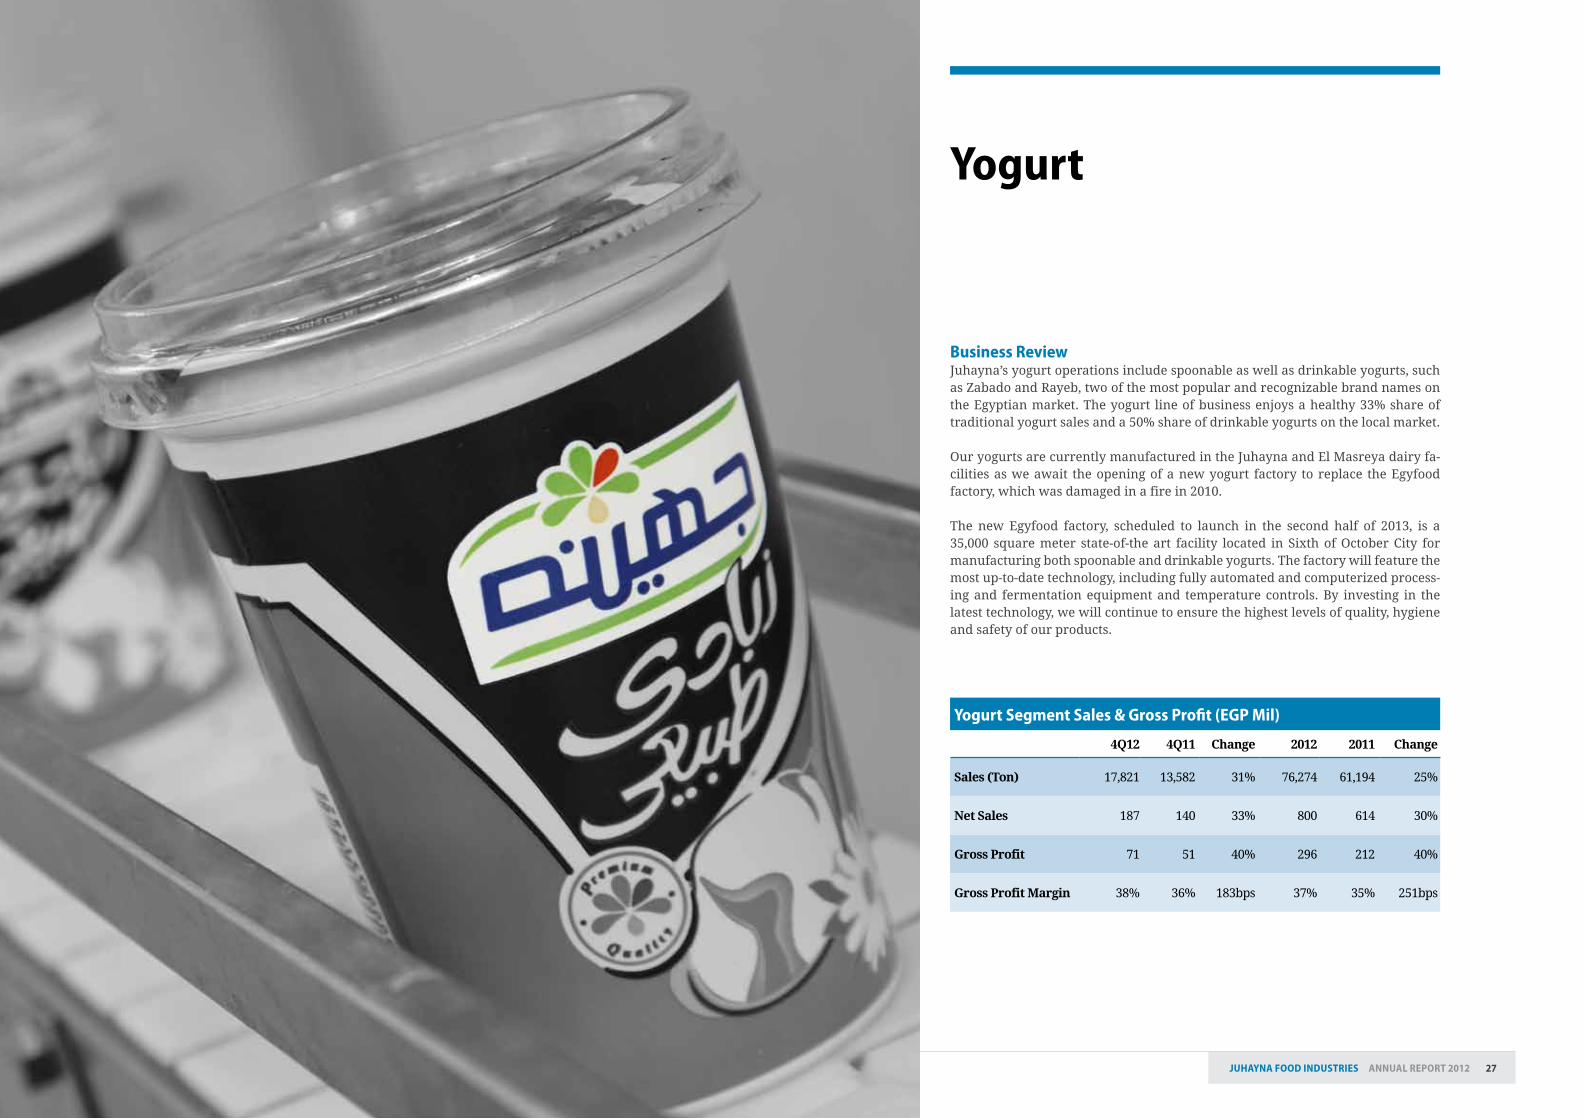
business reviewJuhayna’s yogurt operations include spoonable as well as drinkable yogurts, such as Zabado and Rayeb, two of the most popular and recognizable brand names on the Egyptian market� The yogurt line of business enjoys a healthy 33% share of traditional yogurt sales and a 50% share of drinkable yogurts on the local market� Our yogurts are currently manufactured in the Juhayna and El Masreya dairy fa-cilities as we await the opening of a new yogurt factory to replace the Egyfood factory, which was damaged in a fire in 2010�
The new Egyfood factory, scheduled to launch in the second half of 2013, is a 35,000 square meter state-of-the art facility located in Sixth of October City for manufacturing both spoonable and drinkable yogurts� The factory will feature the most up-to-date technology, including fully automated and computerized process-ing and fermentation equipment and temperature controls� By investing in the latest technology, we will continue to ensure the highest levels of quality, hygiene and safety of our products�
yogurt segment sales & gross Profit (egP mil)
4Q12 4Q11 Change 2012 2011 Change
Sales(Ton) 17,821 13,582 31% 76,274 61,194 25%
NetSales 187 140 33% 800 614 30%
Gross Profit 71 51 40% 296 212 40%
Gross Profit Margin 38% 36% 183bps 37% 35% 251bps
yogurt
2928 JuhAynA fooD inDustries AnnuAl rePort 2012JuhAynA fooD inDustries AnnuAl rePort 2012
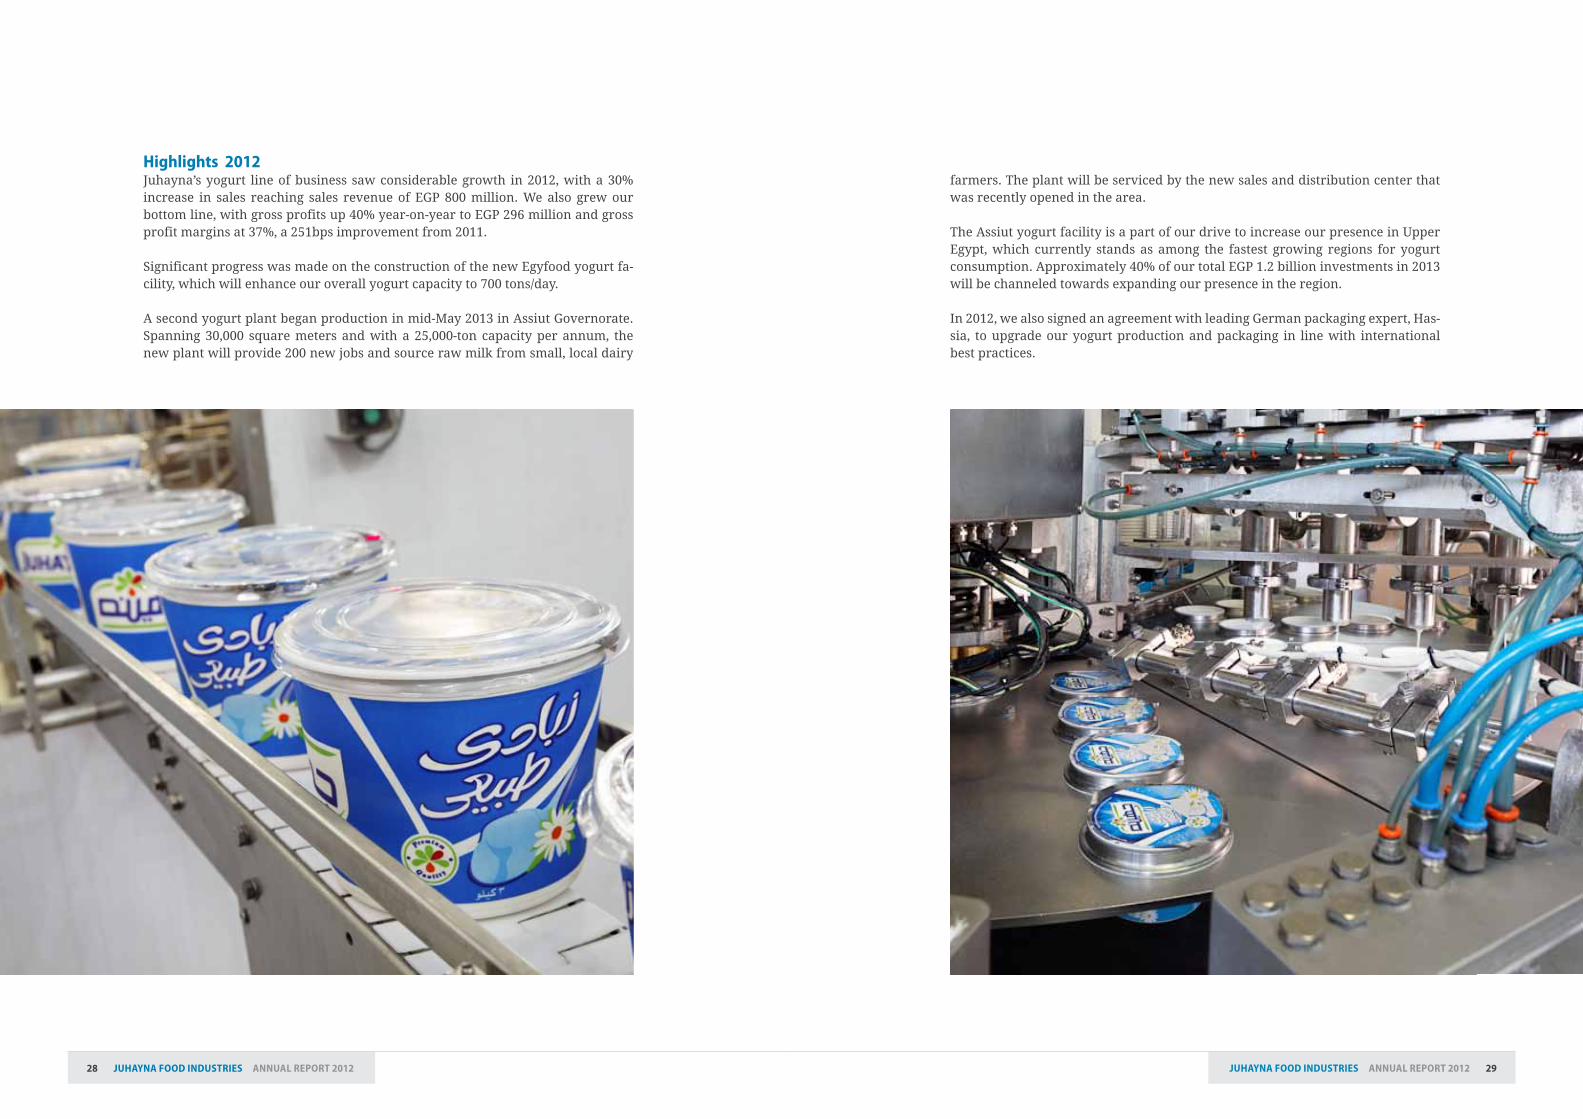
highlights 2012Juhayna’s yogurt line of business saw considerable growth in 2012, with a 30% increase in sales reaching sales revenue of EGP 800 million� We also grew our bottom line, with gross profits up 40% year-on-year to EGP 296 million and gross profit margins at 37%, a 251bps improvement from 2011�
Significant progress was made on the construction of the new Egyfood yogurt fa-cility, which will enhance our overall yogurt capacity to 700 tons/day�
A second yogurt plant began production in mid-May 2013 in Assiut Governorate� Spanning 30,000 square meters and with a 25,000-ton capacity per annum, the new plant will provide 200 new jobs and source raw milk from small, local dairy
farmers� The plant will be serviced by the new sales and distribution center that was recently opened in the area�
The Assiut yogurt facility is a part of our drive to increase our presence in Upper Egypt, which currently stands as among the fastest growing regions for yogurt consumption� Approximately 40% of our total EGP 1�2 billion investments in 2013 will be channeled towards expanding our presence in the region�
In 2012, we also signed an agreement with leading German packaging expert, Has-sia, to upgrade our yogurt production and packaging in line with international best practices�
3130 JuhAynA fooD inDustries AnnuAl rePort 2012 JuhAynA fooD inDustries AnnuAl rePort 2012
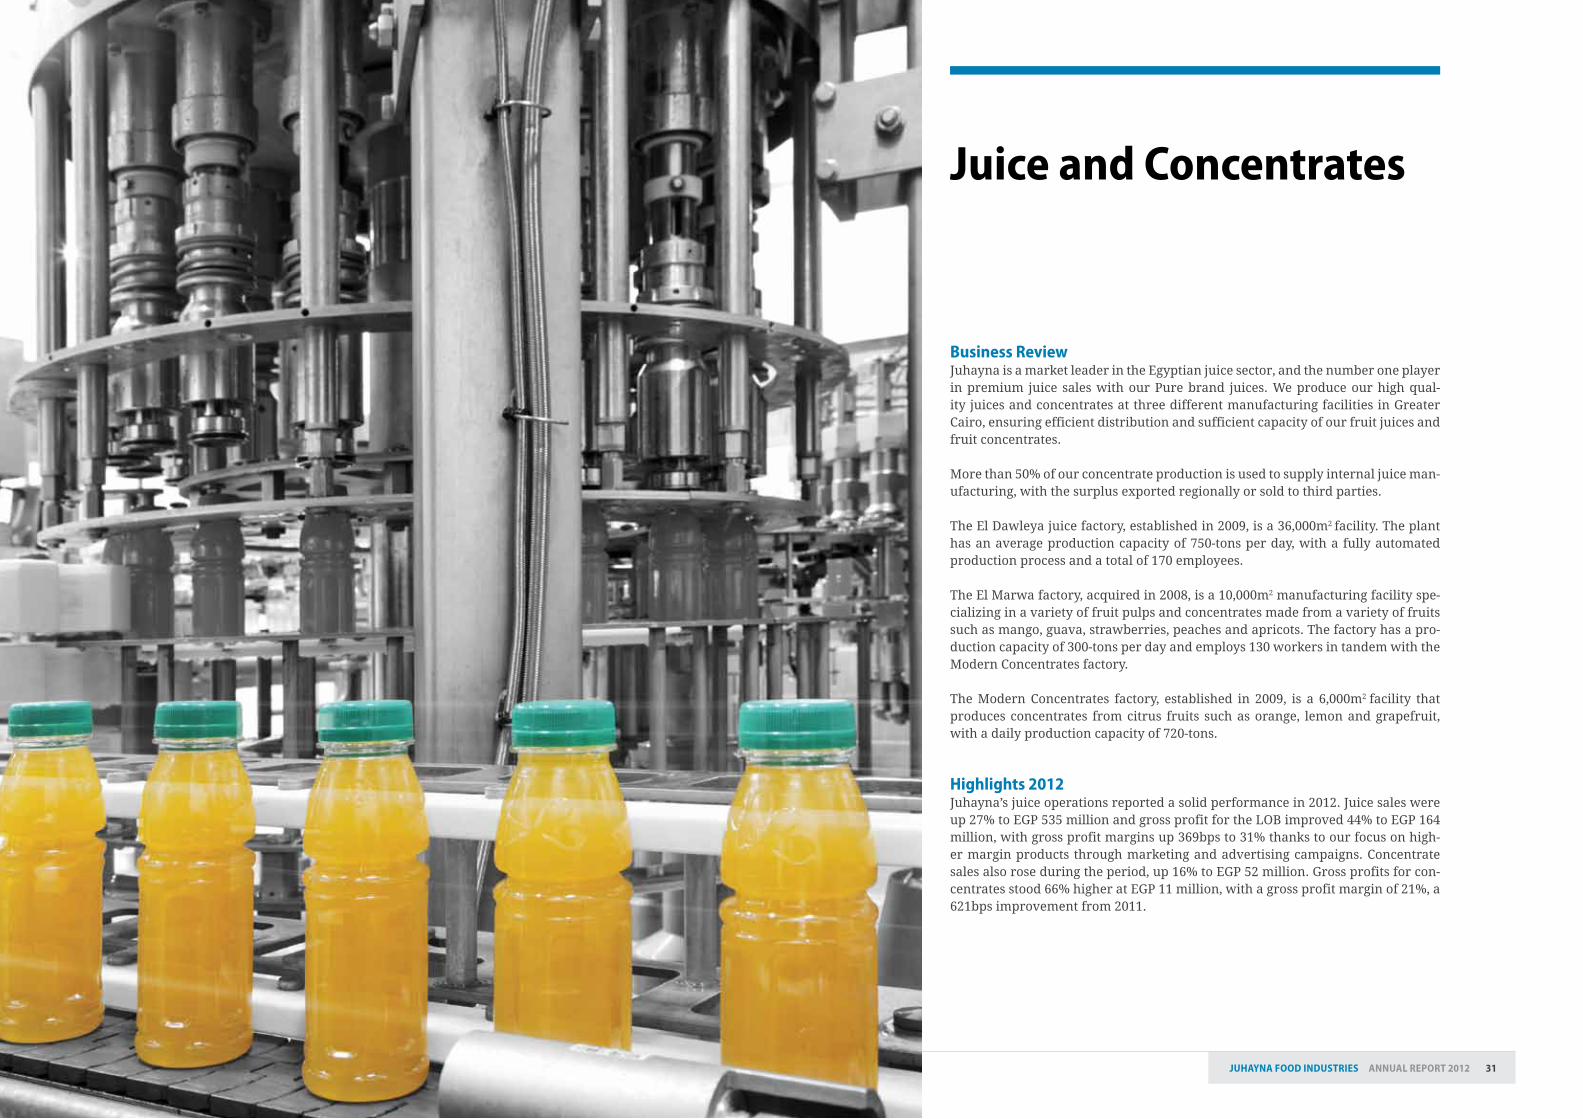
business reviewJuhayna is a market leader in the Egyptian juice sector, and the number one player in premium juice sales with our Pure brand juices� We produce our high qual-ity juices and concentrates at three different manufacturing facilities in Greater Cairo, ensuring efficient distribution and sufficient capacity of our fruit juices and fruit concentrates�
More than 50% of our concentrate production is used to supply internal juice man-ufacturing, with the surplus exported regionally or sold to third parties�
The El Dawleya juice factory, established in 2009, is a 36,000m2 facility� The plant has an average production capacity of 750-tons per day, with a fully automated production process and a total of 170 employees�
The El Marwa factory, acquired in 2008, is a 10,000m2 manufacturing facility spe-cializing in a variety of fruit pulps and concentrates made from a variety of fruits such as mango, guava, strawberries, peaches and apricots� The factory has a pro-duction capacity of 300-tons per day and employs 130 workers in tandem with the Modern Concentrates factory�
The Modern Concentrates factory, established in 2009, is a 6,000m2 facility that produces concentrates from citrus fruits such as orange, lemon and grapefruit, with a daily production capacity of 720-tons�
highlights 2012Juhayna’s juice operations reported a solid performance in 2012� Juice sales were up 27% to EGP 535 million and gross profit for the LOB improved 44% to EGP 164 million, with gross profit margins up 369bps to 31% thanks to our focus on high-er margin products through marketing and advertising campaigns� Concentrate sales also rose during the period, up 16% to EGP 52 million� Gross profits for con-centrates stood 66% higher at EGP 11 million, with a gross profit margin of 21%, a 621bps improvement from 2011�
Juice and concentrates
3332 JuhAynA fooD inDustries AnnuAl rePort 2012JuhAynA fooD inDustries AnnuAl rePort 2012
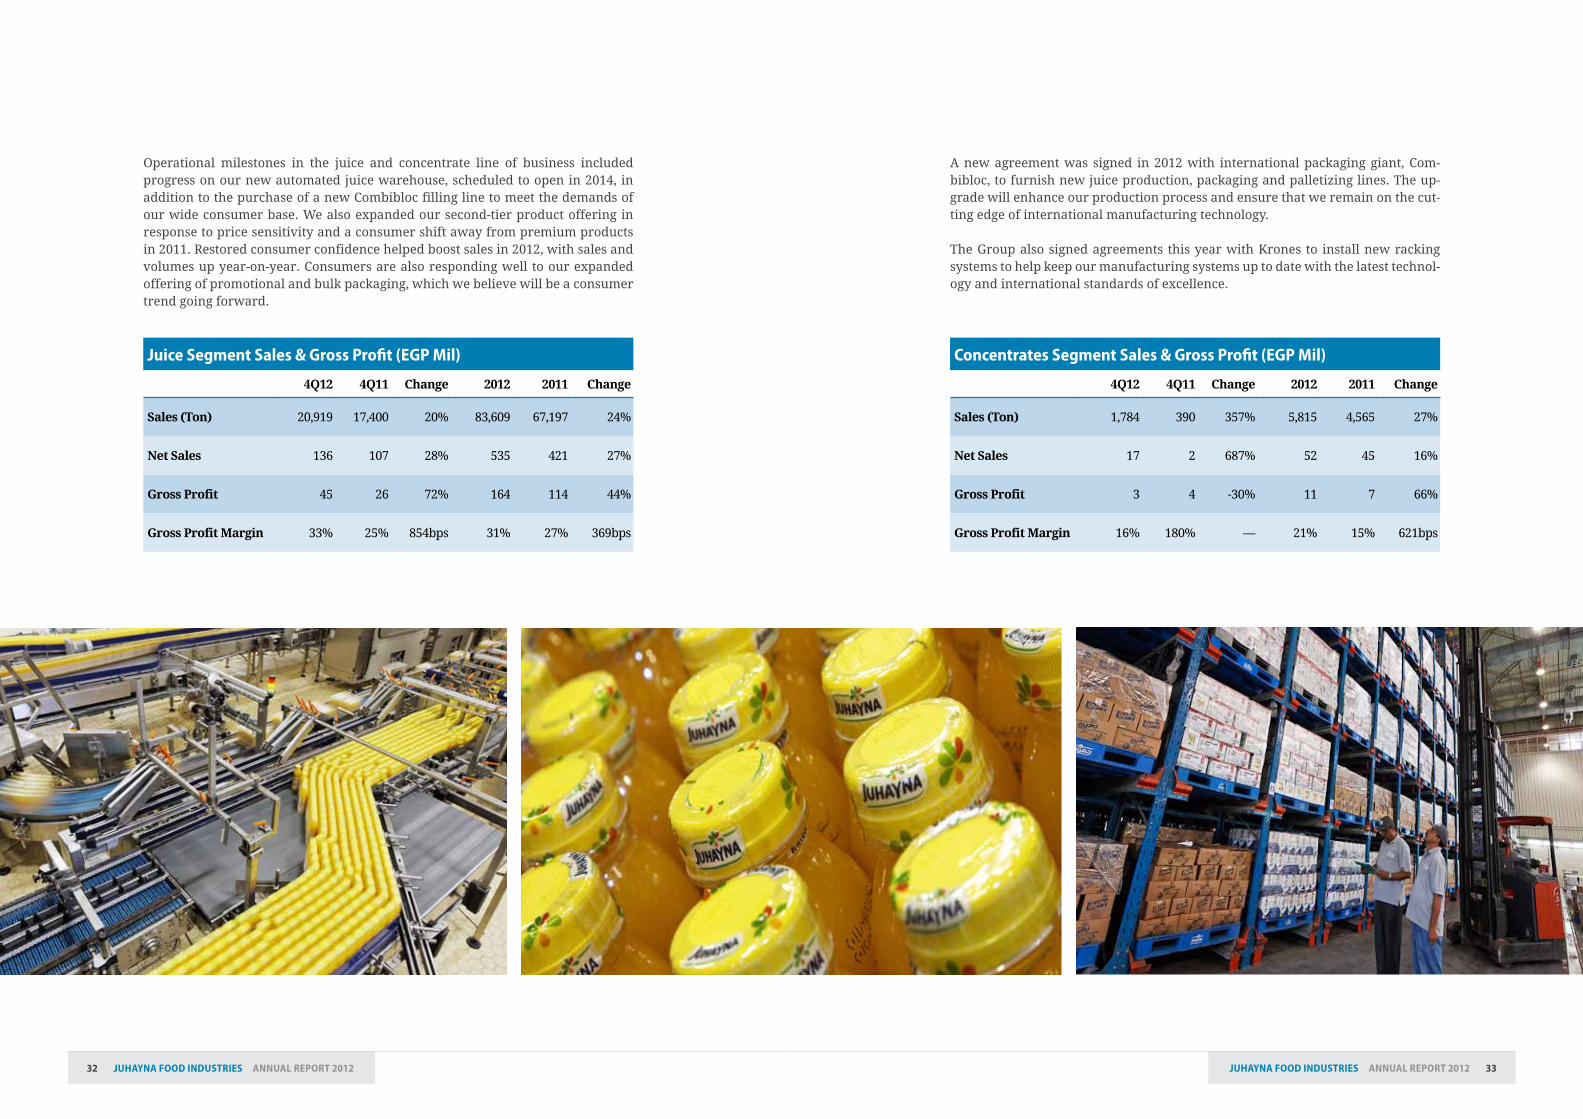
Operational milestones in the juice and concentrate line of business included progress on our new automated juice warehouse, scheduled to open in 2014, in addition to the purchase of a new Combibloc filling line to meet the demands of our wide consumer base� We also expanded our second-tier product offering in response to price sensitivity and a consumer shift away from premium products in 2011� Restored consumer confidence helped boost sales in 2012, with sales and volumes up year-on-year� Consumers are also responding well to our expanded offering of promotional and bulk packaging, which we believe will be a consumer trend going forward�
Juice segment sales & gross Profit (egP mil)
4Q12 4Q11 Change 2012 2011 Change
Sales(Ton) 20,919 17,400 20% 83,609 67,197 24%
NetSales 136 107 28% 535 421 27%
Gross Profit 45 26 72% 164 114 44%
Gross Profit Margin 33% 25% 854bps 31% 27% 369bps
concentrates segment sales & gross Profit (egP mil)
4Q12 4Q11 Change 2012 2011 Change
Sales(Ton) 1,784 390 357% 5,815 4,565 27%
NetSales 17 2 687% 52 45 16%
Gross Profit 3 4 -30% 11 7 66%
Gross Profit Margin 16% 180% — 21% 15% 621bps
A new agreement was signed in 2012 with international packaging giant, Com-bibloc, to furnish new juice production, packaging and palletizing lines� The up-grade will enhance our production process and ensure that we remain on the cut-ting edge of international manufacturing technology�
The Group also signed agreements this year with Krones to install new racking systems to help keep our manufacturing systems up to date with the latest technol-ogy and international standards of excellence�
3534 JuhAynA fooD inDustries AnnuAl rePort 2012 JuhAynA fooD inDustries AnnuAl rePort 2012
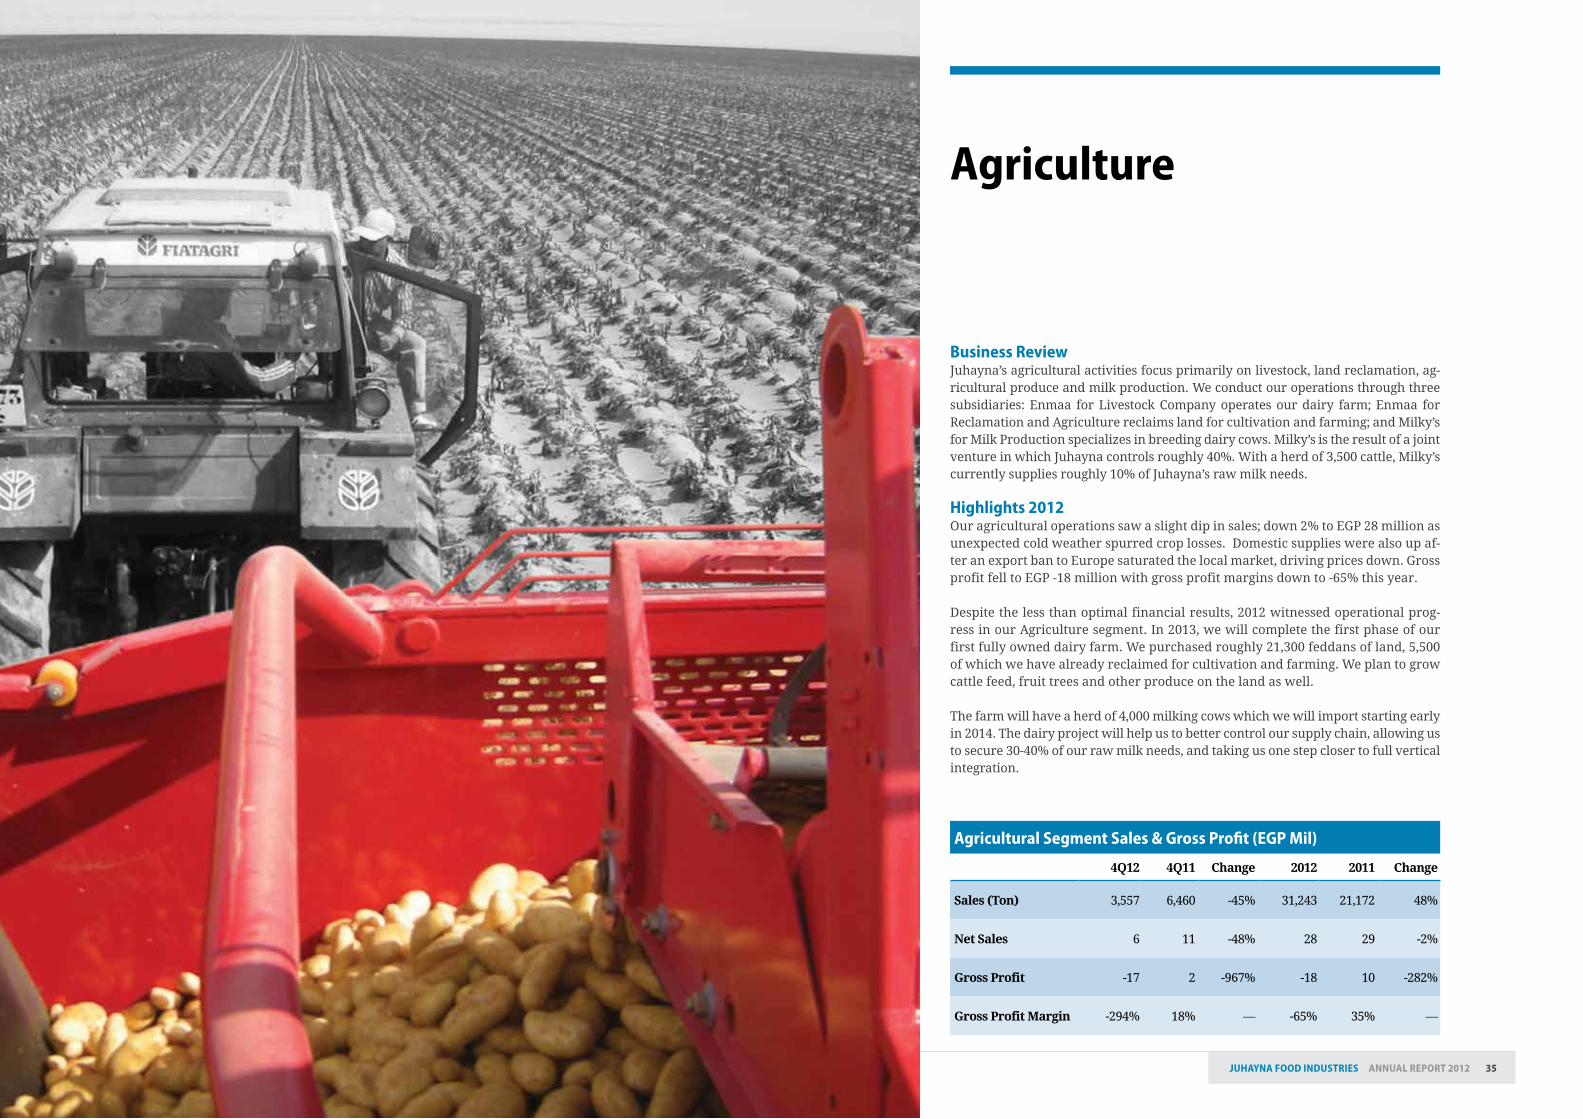
business reviewJuhayna’s agricultural activities focus primarily on livestock, land reclamation, ag-ricultural produce and milk production� We conduct our operations through three subsidiaries: Enmaa for Livestock Company operates our dairy farm; Enmaa for Reclamation and Agriculture reclaims land for cultivation and farming; and Milky’s for Milk Production specializes in breeding dairy cows� Milky’s is the result of a joint venture in which Juhayna controls roughly 40%� With a herd of 3,500 cattle, Milky’s currently supplies roughly 10% of Juhayna’s raw milk needs�
highlights 2012Our agricultural operations saw a slight dip in sales; down 2% to EGP 28 million as unexpected cold weather spurred crop losses� Domestic supplies were also up af-ter an export ban to Europe saturated the local market, driving prices down� Gross profit fell to EGP -18 million with gross profit margins down to -65% this year�
Despite the less than optimal financial results, 2012 witnessed operational prog-ress in our Agriculture segment� In 2013, we will complete the first phase of our first fully owned dairy farm� We purchased roughly 21,300 feddans of land, 5,500 of which we have already reclaimed for cultivation and farming� We plan to grow cattle feed, fruit trees and other produce on the land as well�
The farm will have a herd of 4,000 milking cows which we will import starting early in 2014� The dairy project will help us to better control our supply chain, allowing us to secure 30-40% of our raw milk needs, and taking us one step closer to full vertical integration�
Agriculture
Agricultural segment sales & gross Profit (egP mil)
4Q12 4Q11 Change 2012 2011 Change
Sales(Ton) 3,557 6,460 -45% 31,243 21,172 48%
NetSales 6 11 -48% 28 29 -2%
Gross Profit -17 2 -967% -18 10 -282%
Gross Profit Margin -294% 18% — -65% 35% —
3736 JuhAynA fooD inDustries AnnuAl rePort 2012 JuhAynA fooD inDustries AnnuAl rePort 2012
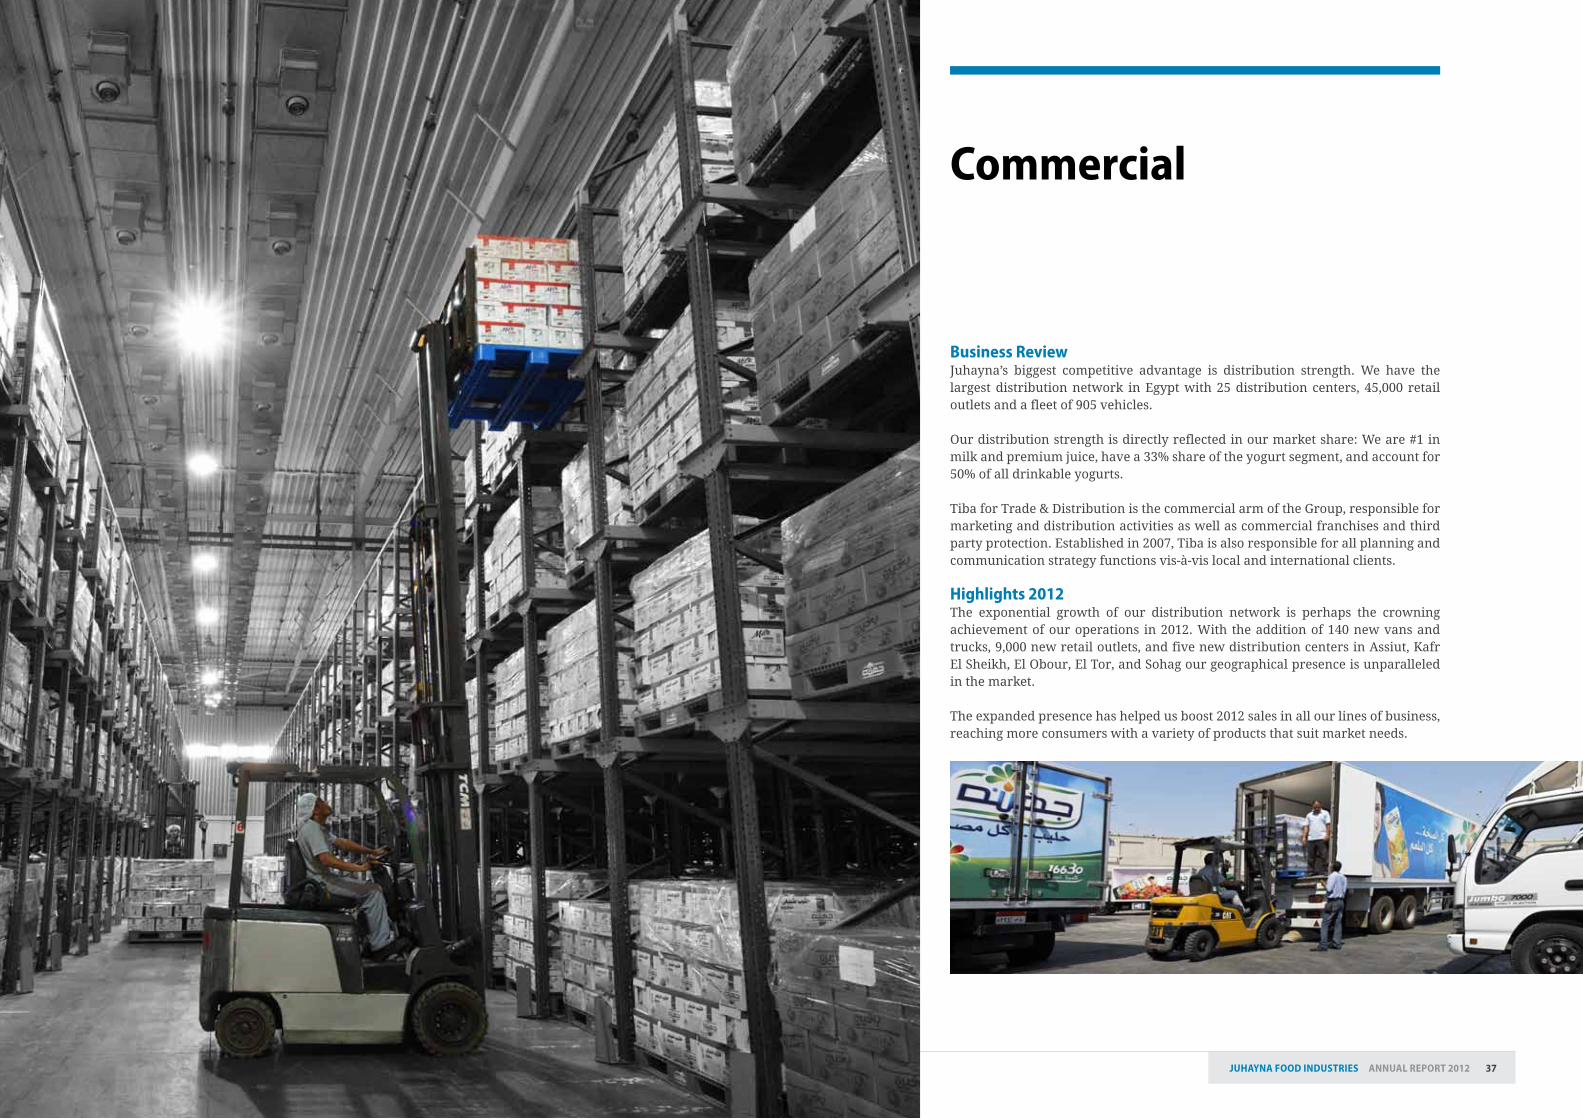
business reviewJuhayna’s biggest competitive advantage is distribution strength� We have the largest distribution network in Egypt with 25 distribution centers, 45,000 retail outlets and a fleet of 905 vehicles�
Our distribution strength is directly reflected in our market share: We are #1 in milk and premium juice, have a 33% share of the yogurt segment, and account for 50% of all drinkable yogurts�
Tiba for Trade & Distribution is the commercial arm of the Group, responsible for marketing and distribution activities as well as commercial franchises and third party protection� Established in 2007, Tiba is also responsible for all planning and communication strategy functions vis-à-vis local and international clients�
highlights 2012The exponential growth of our distribution network is perhaps the crowning achievement of our operations in 2012� With the addition of 140 new vans and trucks, 9,000 new retail outlets, and five new distribution centers in Assiut, Kafr El Sheikh, El Obour, El Tor, and Sohag our geographical presence is unparalleled in the market� The expanded presence has helped us boost 2012 sales in all our lines of business, reaching more consumers with a variety of products that suit market needs�
commercial
39JuhAynA fooD inDustries AnnuAl rePort 201238 JuhAynA fooD inDustries AnnuAl rePort 2012
our industry
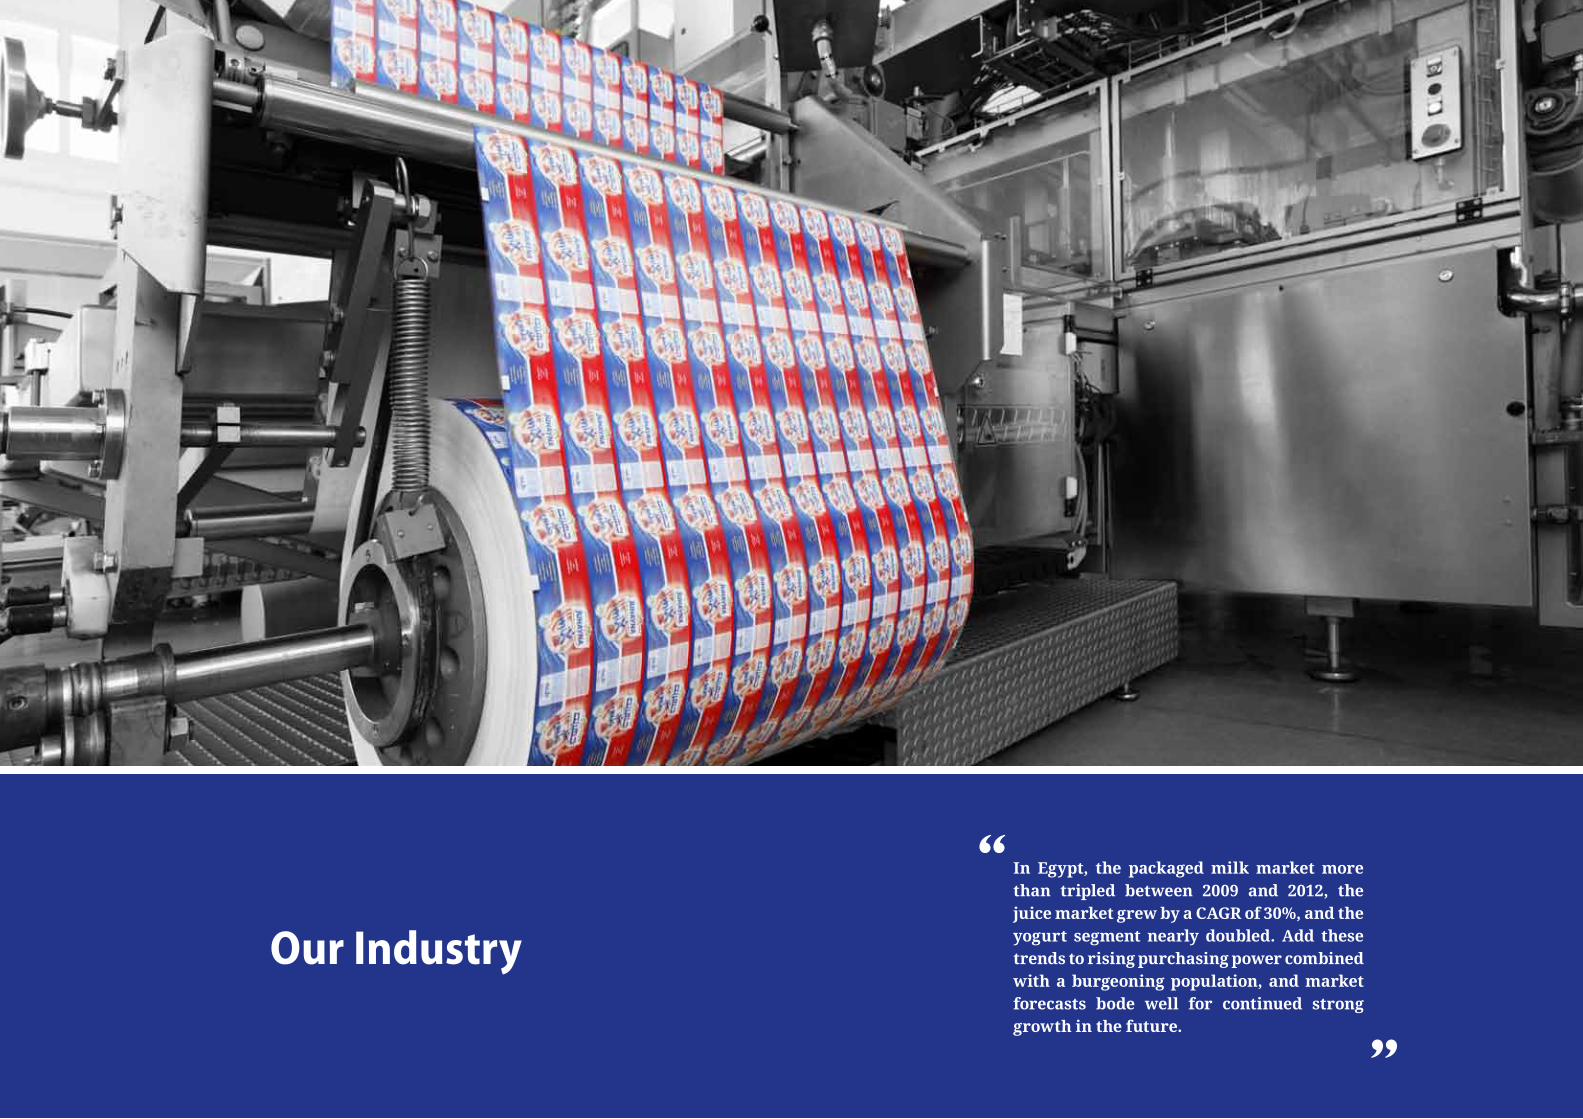
In Egypt, the packagedmilkmarketmorethan tripled between 2009 and 2012, thejuicemarketgrewbyaCAGRof30%,andtheyogurt segment nearly doubled. Add thesetrends to rising purchasing power combined withaburgeoningpopulation,andmarketforecasts bode well for continued strong growth in the future.
4140
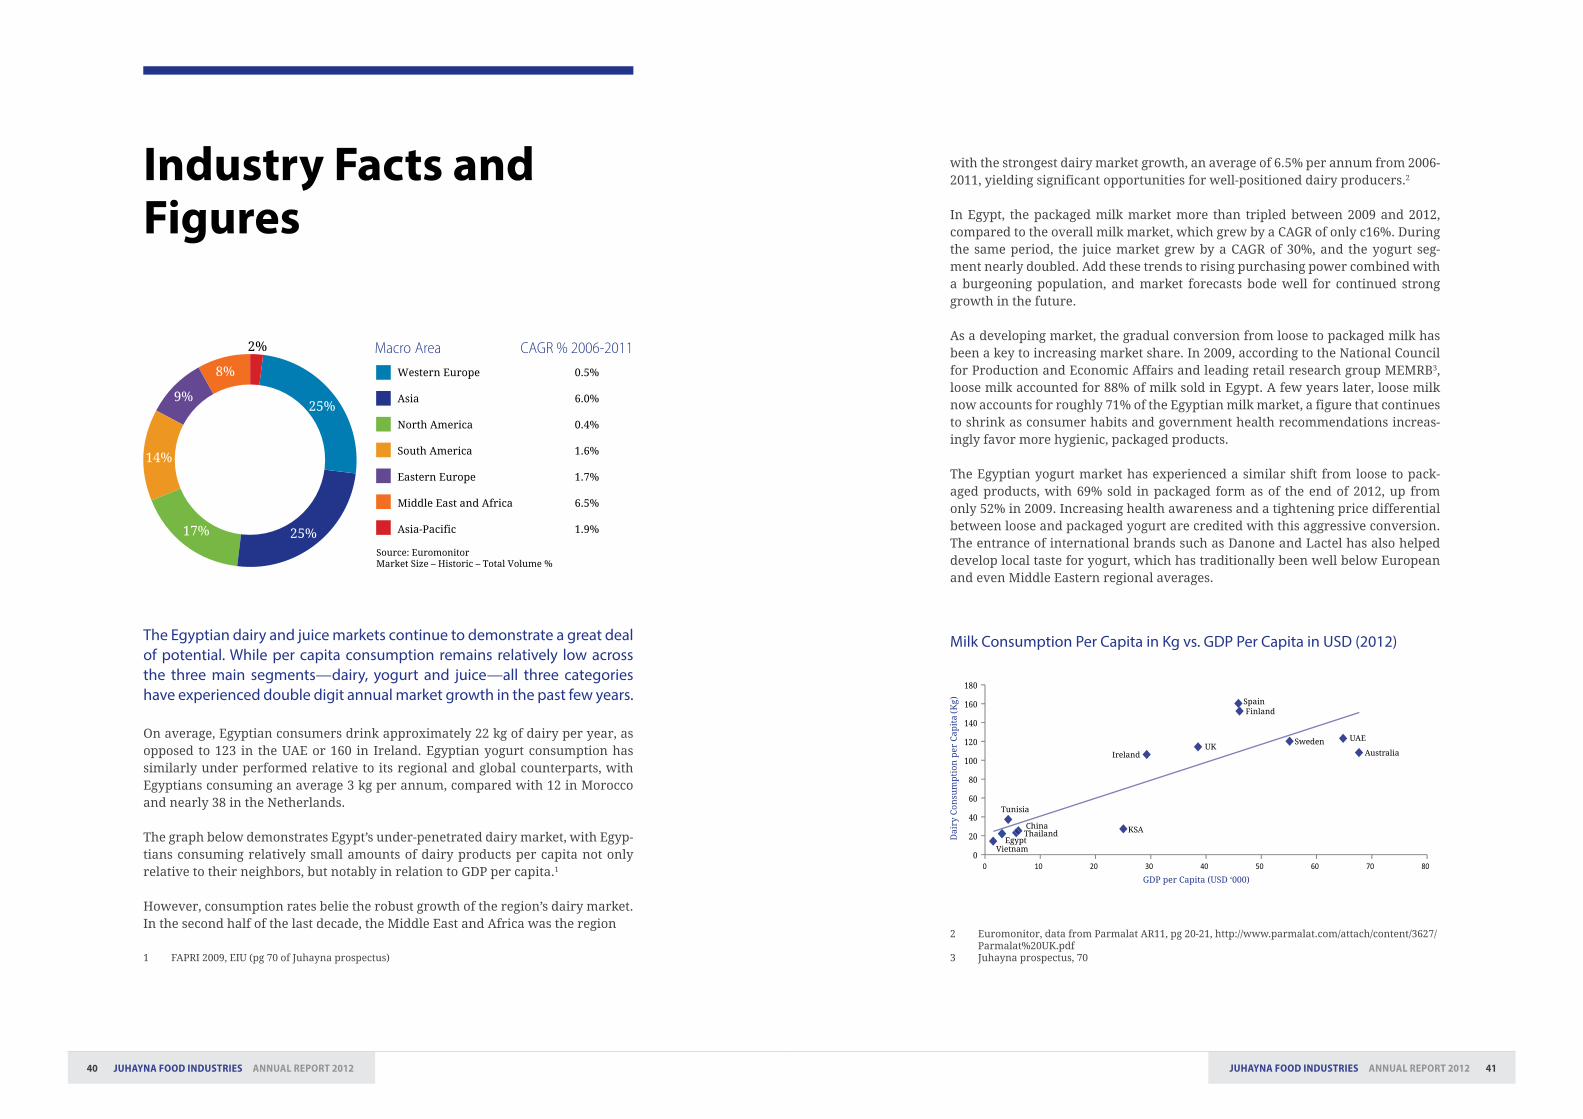
with the strongest dairy market growth, an average of 6�5% per annum from 2006-2011, yielding significant opportunities for well-positioned dairy producers�2
In Egypt, the packaged milk market more than tripled between 2009 and 2012, compared to the overall milk market, which grew by a CAGR of only c16%� During the same period, the juice market grew by a CAGR of 30%, and the yogurt seg-ment nearly doubled� Add these trends to rising purchasing power combined with a burgeoning population, and market forecasts bode well for continued strong growth in the future�
As a developing market, the gradual conversion from loose to packaged milk has been a key to increasing market share� In 2009, according to the National Council for Production and Economic Affairs and leading retail research group MEMRB3, loose milk accounted for 88% of milk sold in Egypt� A few years later, loose milk now accounts for roughly 71% of the Egyptian milk market, a figure that continues to shrink as consumer habits and government health recommendations increas-ingly favor more hygienic, packaged products�
The Egyptian yogurt market has experienced a similar shift from loose to pack-aged products, with 69% sold in packaged form as of the end of 2012, up from only 52% in 2009� Increasing health awareness and a tightening price differential between loose and packaged yogurt are credited with this aggressive conversion� The entrance of international brands such as Danone and Lactel has also helped develop local taste for yogurt, which has traditionally been well below European and even Middle Eastern regional averages�
2 Euromonitor, data from Parmalat AR11, pg 20-21, http://www�parmalat�com/attach/content/3627/Parmalat%20UK�pdf
3 Juhayna prospectus, 70
JuhAynA fooD inDustries AnnuAl rePort 2012JuhAynA fooD inDustries AnnuAl rePort 2012
The Egyptian dairy and juice markets continue to demonstrate a great deal of potential. While per capita consumption remains relatively low across the three main segments—dairy, yogurt and juice—all three categories have experienced double digit annual market growth in the past few years.
On average, Egyptian consumers drink approximately 22 kg of dairy per year, as opposed to 123 in the UAE or 160 in Ireland� Egyptian yogurt consumption has similarly under performed relative to its regional and global counterparts, with Egyptians consuming an average 3 kg per annum, compared with 12 in Morocco and nearly 38 in the Netherlands�
The graph below demonstrates Egypt’s under-penetrated dairy market, with Egyp-tians consuming relatively small amounts of dairy products per capita not only relative to their neighbors, but notably in relation to GDP per capita�1
However, consumption rates belie the robust growth of the region’s dairy market� In the second half of the last decade, the Middle East and Africa was the region
1 FAPRI 2009, EIU (pg 70 of Juhayna prospectus)
Industry Facts and Figures
VietnamEgypt
ThailandChina
Tunisia
KSA
IrelandUK
SpainFinland
Sweden UAE
Australia
Milk Consumption Per Capita in Kg vs. GDP Per Capita in USD (2012)

43JuhAynA fooD inDustries AnnuAl rePort 201242 JuhAynA fooD inDustries AnnuAl rePort 2012
strategyTheinvestmentinexpandingdistributionbegan to truly bear fruit in 2012withimproved margins, sales and volumesacross the board.
4544 JuhAynA fooD inDustries AnnuAl rePort 2012JuhAynA fooD inDustries AnnuAl rePort 2012
Our forward-looking strategy has allowed us to maintain growth and prof-itability despite volatile market conditions. Coming out of a difficult first year post-revolution that saw increasing commodity prices, a deteriorat-ing security situation and shifting consumer patterns away from premium products towards more economical second tier categories, Juhayna had to react quickly.
The company’s successful results in 2012 can be largely attributed to the abil-ity to react and predict market trends� We were quick to respond to changing consumer patterns in 2011, which saw a shift towards smaller, less expensive products� Juhayna responded accordingly by expanding second tier product lines in 2012 to meet new demand� As consumers shifted back to premium brands and promotional bulk packaging throughout the course of 2012, we were also ready�
With the export and tourism markets in decline post-revolution, we made a deci-sion in 2011 to invest and expand our distribution facilities� This strategic move had an immediate impact on our growth with a 21% year-on-year increase in sales in 2011� The investment in expanding distribution began to truly bear fruit in 2012 with improved margins, sales and volumes across the board�
Juhayna remains committed to its strategy of investment and expansion through-out Egypt with a particular emphasis on continuing to maximize the strength of our distribution network, and progressing towards a more vertically integrated business model� We are taking major steps to expand our production and distribu-tion coverage, investing EGP 1�2 billion in 2013—40% of which we are directing towards Upper Egypt, an area of fast-growing consumption and demand�
In 2013 we will complete the first phase of our first fully owned dairy farm� We currently rely on almost 90 different farms to supply us with 80-90% of our raw milk needs, with the remaining 10% coming from our joint venture with Milky’s Dairy Farm� As the new farm becomes operational, we will increase our control of raw milk supplies to 30-40% thanks to 4,000 milking cows imported beginning in early 2014� This will help us to ensure supply and quality, as well as control costs and maximize margins over time�
strategy We purchased 21,300 feddans, 5,500 of which have already been reclaimed and cultivated� We also plan to grow cattle feed, fruit trees, and other produce on the land�
With the launch of our new Egyfood yogurt factory in 2013, we will be able to resume the production that had been moved to two of our dairy factories after the Egyfood factory fire in 2010� The plant is being built on 35,000m2 of land, and is scheduled to begin operations towards the end of 2013�
We have also decided to expand our yogurt production to Upper Egypt, a market that accounts for 15% of yogurt sales and has one of the highest and fastest grow-ing yogurt consumption rates in the country, making it an excellent location for both the new distribution center that opened in 2012, and the new manufacturing facility� The EGP 200 million plant has a 25,000-ton per year production capacity, providing 200 new jobs and giving small, local dairy farmers the much-needed op-portunity to sell their raw milk to the plant for profit�
47JuhAynA fooD inDustries AnnuAl rePort 201246 JuhAynA fooD inDustries AnnuAl rePort 2012
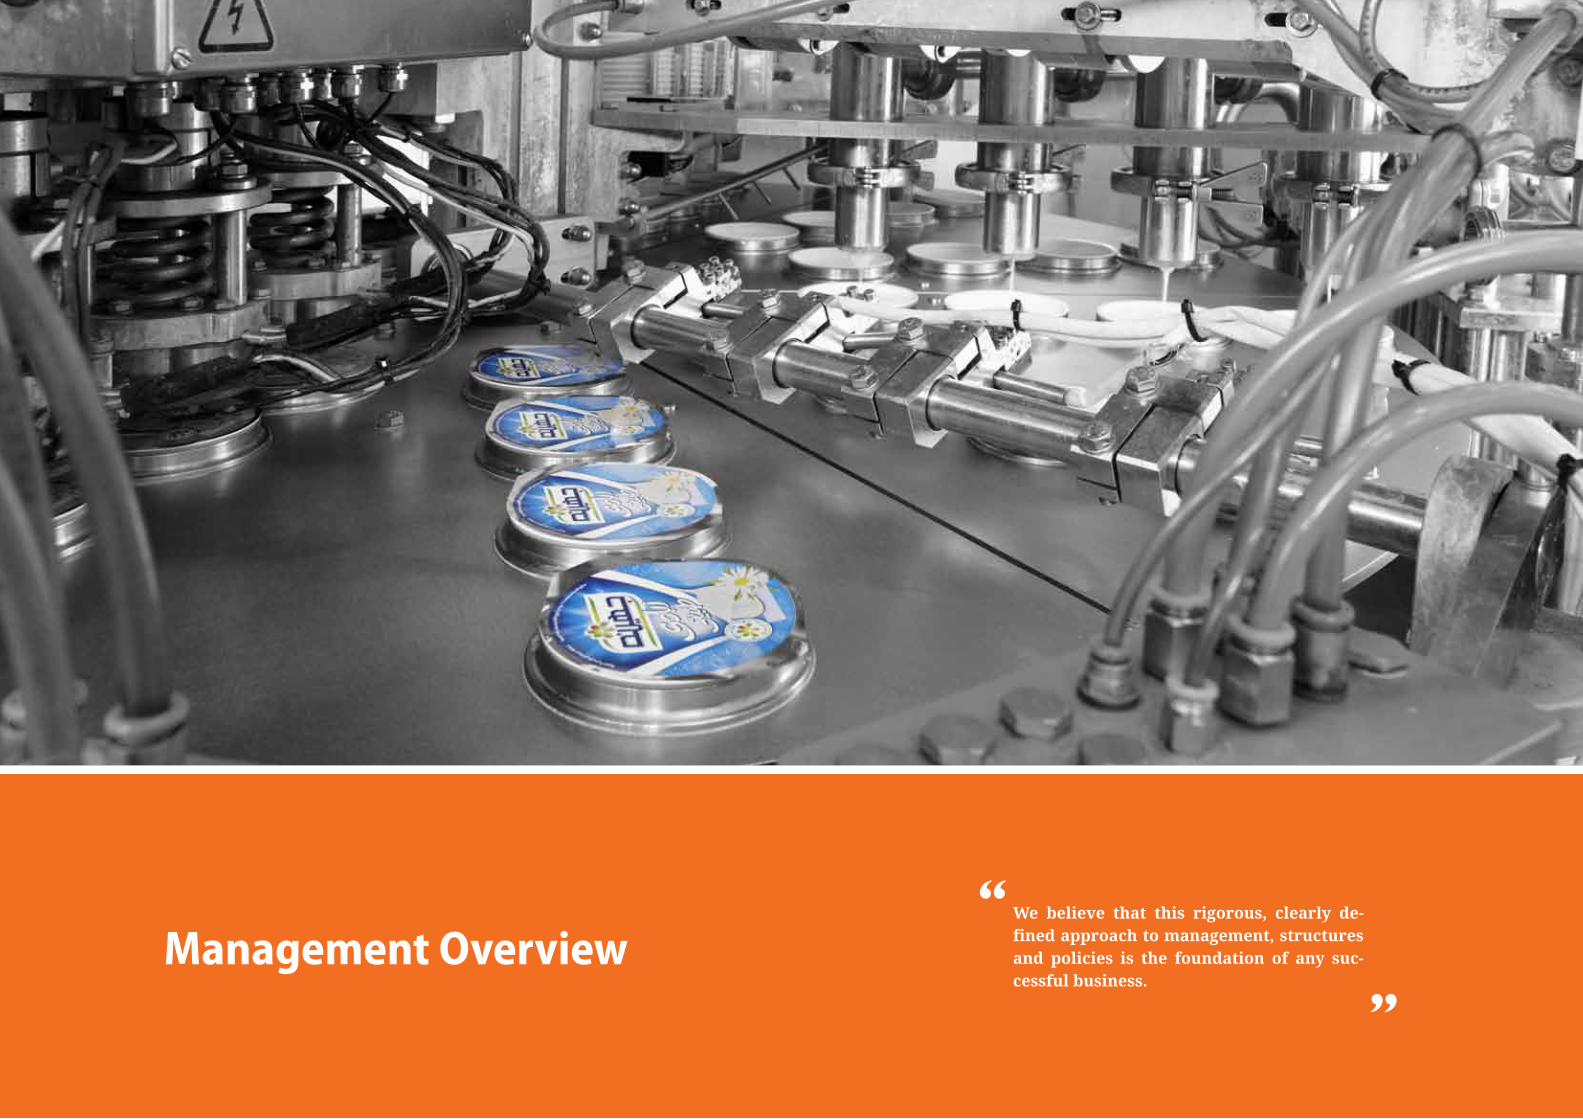
management overviewWe believe that this rigorous, clearly de-finedapproachtomanagement,structuresand policies is the foundation of any suc-cessful business.

4948 JuhAynA fooD inDustries AnnuAl rePort 2012JuhAynA fooD inDustries AnnuAl rePort 2012
executive management
Mr� Thabet has been Chairman of the Board of Directors and Chief Ex-ecutive Officer of Juhayna since founding the Group in 1983� He has played a central role in the development of the Egyptian food sector for more than 30 years through various appointments and positions, including: Member of the Board of the Federation of Egyptian Industries (FEI), Member of the Board of the Chamber of Food Industries, Chair-man of the Board of the Sixth of October Investors’ Association (OIA), and Member of the Board of the Sixth of October Development & Invest-ment Company (SODIC)�
Mr� Harbo has been with Juhayna for 14 years, first assuming the role of General Manager of Factories� Before joining Juhayna, he held the posi-tion of General Manager at some of the most prominent dairy companies in Denmark, including Bornholm, Denmark Protein and Dairy Denmark, in addition to MD Foods, which later merged with Arla Foods�
Mr� Wuellner joined Juhayna in 2013� Before joining the Group, he held managerial positions in the foods and pharmaceutical industry for 25 years, gaining wide experience in branded and private label products and broad expertise in running large-scale production and packaging op-erations� He began his career at Unilever, serving in various positions during his 14 years with the company, including Project Engineer, Chief Engineer and Factory Manager at Unilever’s Foods business� After Unile-ver, he worked as Managing Director for several family-owned compa-nies in the foods and pharmaceutical sector�
Mr� Ghazaly joined Juhayna in 2011 as General Manager for its sub-sidiary company Tiba for Trade & Distribution� Prior to joining Ju-hayna, Mr� Ghazaly spent seven years at Coca-Cola Egypt (1995-2002) as a General Manager of Sales Development and General Manager of Factories in North Upper Egypt� He was also appointed Re-gional Sales Manager at Coca-Cola Saudi Arabia (2002-2007) and Gen-eral Manager of the Commercial Sector at Coca-Cola Libya (2009-2011)�
safwan thabetChairman of the BoD and CEO
hugo harbo Projects Director
Achim WuellnerGroup Factories Director
Amr ghazalyGeneral manager of tiba for trade & Distribution
Mr� El Hodaiby is currently Director of Financial Affairs at Juhayna, hav-ing begun his tenure with the Group in 2006 as Chief Financial Officer of one of Juhayna’s factories, and later becoming Chief Financial Officer and Financial Controller for Juhayna in 2008� Before joining Juhayna, he was Accounts Manager at SODIC and an Auditor at Grant Thornton in Cairo� He is a member of the Accountants and Auditors Register�
Mr� Pedersen joined Juhayna in February 2013 with 18 years of consumer goods marketing experience� He spent six years (2001-2007) as Global Marketing Manager for Arla Food Ingredients, and most recently served as General Manager for Arla Foods in Vietnam, where he was responsible for setting up the company and launching a range of nutritional products for children�
Mr� Abdelkader, Marketing Director, joined Juhayna in January 2013 He has more than 17 years of marketing experience� Mr� Abdelkader pre-viously headed Juhayna’s marketing department from 2003 to 2009� He spent 7 years at Unilever Egypt (1995-2002) as a marketing manager and has also served as a chief marketing officer at Gozour dairy (Citadel) (2009-2011)� For a year he assumed a regional marketing role with Aujan Beverages in Dubai (2011-2012), heading the brand Rani in the Middle East�
Mr� Kamel has occupied the position of Managing Director of Milky’s since its founding in 2008, on the back of a partnership and cooperation agree-ment between Juhayna and the Kamel family� He is also General Manager of El Enmaa for Agricultural Development & Livestock and Founder and Managing Director of Organic Foods�
Mr� Zaki has been Administrative Affairs and Government Relations Di-rector at Juhayna since 2006� He began his career with Juhayna in 1982, taking on a variety of positions including Sales Manager for Juhayna (1999-2001) and General Manager for both Tiba for Trade & Distribution and El Masreya for Dairy and Juice Company (El Masreya)�
Mr� Zakaria was appointed as Group Supply Chain Director in May 2012� Prior to joining Juhayna, he spent 14 years at Procter & Gamble (Middle East and Africa)� He occupied a number of positions, including Head of Produc-tion, Operations and Packaging in Saudi Arabia and Manager of one of the firm’s factories in Morocco� He also worked as Head of Planning at P&G’s Headquarters in Geneva, where he was responsible for allocating production at the firm’s factories and for the distribution of the firm’s Nappy brand in the Middle East and Africa� From 2006-2012, Mr� Zakaria was Vice President of Manufacturing and Technology at Savola Foods�
sameh el hodaibyFinancial Affairs Director
claus Pedersenmarketing and Innovation Director
sherif Abdelkadermarketing Director
hany Kamelmanaging Director of milky’s and General manager of El Enmaa for Agricultural Development & Livestock
hisham ZakiAdministrative Affairs and Government Relations Director
Wael ZakariaSupply Chain Director

5150 JuhAynA fooD inDustries AnnuAl rePort 2012JuhAynA fooD inDustries AnnuAl rePort 2012
board of Directors
Mr� Thabet has been Chairman of the Board of Directors and Chief Execu-tive Officer of Juhayna since founding the Group in 1983� He has played a central role in the development of the Egyptian food sector for more than 30 years through various appointments and positions, including: Member of the Board of the Federation of Egyptian Industries (FEI), Member of the Board of the Chamber of Food Industries, Chairman of the Board of the Sixth of October Investors’ Association (OIA), and Member of the Board of the Sixth of October Development & Investment Company (SODIC)�
Mr� Bisheer has been a Non-Executive Member of the Board since 2010� Prior to joining Juhayna, he held top managerial positions at Telecom Egypt for over a decade, acting as Chairman and CEO (2000-2009) and Chairman of the Board of Directors (2009-2012)� He previously worked as General Manager and Managing Director at Giza Systems Engineering (1978-2000) and also acted as Vice Chairman of Al Ahly Computer Equip-ment and Vice President of Misria Computer Systems�
Mr� El Abin has been a Non-Executive Member of the Board since 1985� He has also been a Member of the Board of Directors of the Scientific Cen-ter of Documents and Information at Cairo University since 2009� Mr� El Abin is the founder of the Academic Library in Cairo and Co-Founder of Mars Publishing House in Riyadh, Saudi Arabia� He was also responsible for the foreign language books department at the Al Ahram Institute�
Mr� Thabet was admitted to the Board of Directors in February 2006� He is currently Operations Director at Juhayna, and previously worked as Hu-man Resources Director� Mr� Thabet began his career at Juhayna in 2004, holding a number of managerial positions, including Sales and Marketing Manager and Project Manager� He previously held positions at German-based Muller Dairy� He was appointed as the first Plant Manager for Ju-hayna’s Juice Factory, El Dawleya; and is currently Vice President of the Dairy Division at the Chamber of Food Industries and former Treasurer at the Food Export Council�
safwan thabetChairman of the BoD and CEO
Akil bisheer non-Executive member
Ahmed el Abinnon-Executive member
seif el-Din thabetnon-Executive member
Mr� El Dogheim has been a Non-Executive Member of the Board since 1983� He is also a member of the Saudi Egyptian Business Council and the Chamber of Commerce of El Dawadmi Governorate in Saudi Arabia� Mr� El Dogheim previously held a variety of positions in Saudi Arabia at the Ministry of Finance in Dammam, the Ministry of Transport and the Ministry of Islamic Affairs and Endowments in Riyadh� He also worked as a Financial Controller, Financial Director and Budget Director at the Ministry of Water and Electricity in Riyadh�
Mr� El Mallawany has been a Non-Executive Member of the Board since 2000� He has acted as CEO of EFG Hermes Holding Company SAE since 2008 and Vice President of the Board of Trustees of the EFG Hermes Foun-dation since 2006� He was also appointed as the Chairman of the Board of EFG Hermes Private Equity and as a Non-Executive Chairman at ACE In-surance Company� Mr� El Mallawany has also served as Vice Chairman of the Commercial International Investment Company (CIIC) since 2003 and spent 16 years at Commercial International Bank (CIB) as General Man-ager of the Corporate Banking Division� He is a member of the Advisory Council of the Emerging Markets Private Equity Association (EMPEA)�
Mr� Ismail has been a Non-Executive Member of the Board since January 2010� Before joining the board, Mr� Ismail spent two years as partner, chairman and CEO of Dar Al Mimar Group (DMG), an engineering con-tracting company� He has 26 years of senior management experience at Procter & Gamble and Pepsi Co�
Ms� Thabet has been a Non-Executive Member of the Board since February 2006 and is currently Associate Director of Marketing for the Juice Divi-sion� She previously held the title of Associate Director of External Affairs, where she was responsible for the Group’s media and public relations ac-tivities� Ms� Thabet has worked in the Marketing Department for the Fresh Produce Division since joining Juhayna in 2001� She is also a member of the Business Advisory Board for SIFE Egypt, the International Public Rela-tions Association (IPRA), and the Committee for Social Responsibility at the American Chamber of Commerce in Egypt�
Ms� Thabet has been a Non-Executive Member of the Board since 2010 and currently focuses on Strategic Planning for the Group, where she works to develop production divisions at Juhayna� She previously held the title of Assistant Procurement Manager for the Group�
mohammed el Dogheimnon-Executive member
yasser el mallawanynon-Executive member
Ayman ismailnon-Executive member
heba thabetnon-Executive member
mariam thabetnon-Executive member
53JuhAynA fooD inDustries AnnuAl rePort 201252 JuhAynA fooD inDustries AnnuAl rePort 2012
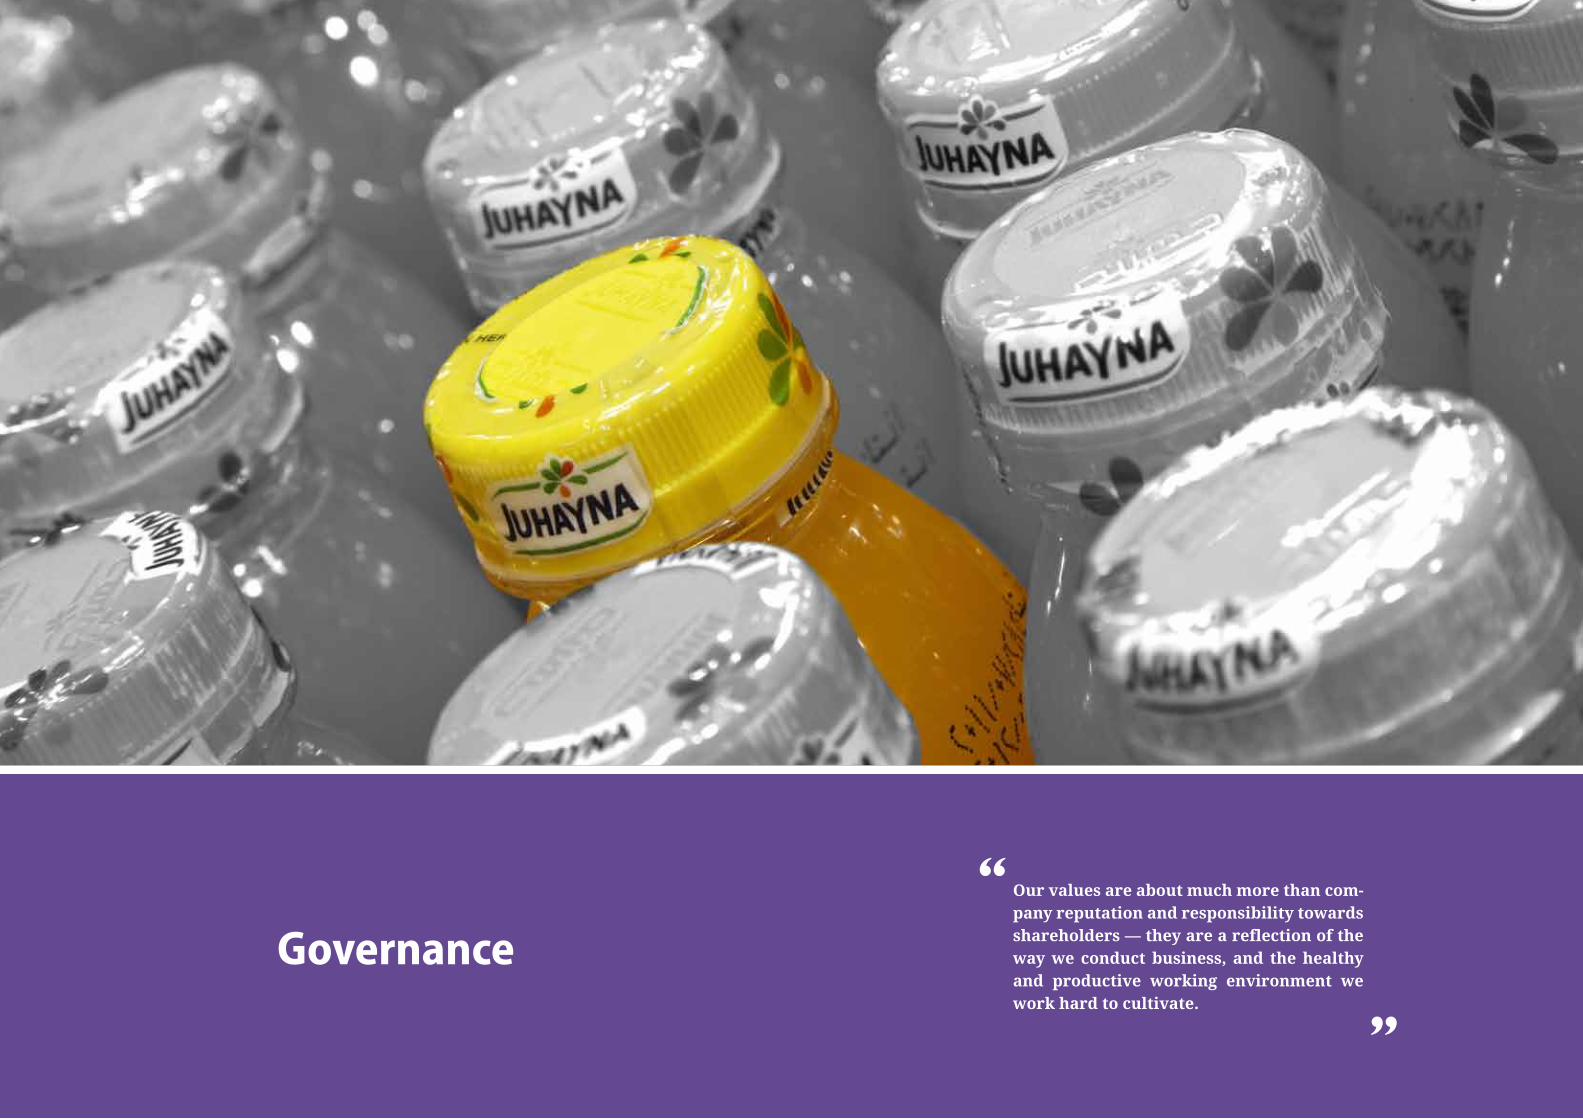
governanceOur values are about much more than com-pany reputation and responsibility towards shareholders — they are a reflection of the waywe conductbusiness, and thehealthyand productive working environment we work hard to cultivate.

5554 JuhAynA fooD inDustries AnnuAl rePort 2012JuhAynA fooD inDustries AnnuAl rePort 2012
leadership, excellence and integrityAt Juhayna, we are committed to maintaining a business that is led by decisive leadership, the pursuit of excellence, and operational integrity� These principles are an integral component of our corporate culture as evidenced by our long-standing history and reputation as an ethical and transparent industry player� We are held accountable by all our stakeholders be they customers, clients, partners, suppliers, or shareholders�
executive management & board of DirectorsWhile Juhayna is a family-owned business, we adhere to international best practices in corporate governance� Everyone from the Chairman to lines of business managers to factory employees are required to operate in a transparent, impartial and accountable manner� We believe that this rigorous, clearly defined approach to management, structures and policies is the foundation of any successful business� It not only provides channels for appropriate decision-making and accountability, but reassures shareholders that their investments are in safe hands and customers that the products that they have come to trust from Juhayna are manufactured in a world class operation that is committed to providing the market with safe and healthy products�
All of our Board Members except one are non-executives, and the majority of the Board is comprised of non-family members� Directors hold office until such time as a qualified successor is elected�
Audit committeeIn accordance with the EGX Listing Rules, the Board has constituted an Audit Committee, comprised of three Non-Executive Directors� The Audit Committee is chaired by Mr� Yasser El Mallawany and also includes Mr� Ahmed Amin El Abin and Mr� Mohammed El Dogheim, all of whom were appointed on 13 April 2010� The Audit Committee reports to and is accountable to the Board�
The primary functions delegated by the Board to the Audit Committee are to assist the Board in fulfilling its oversight responsibilities in connection with:
• TheinspectionandreviewoftheinternalauditproceduresoftheGroup
• TheinspectionandreviewoftheaccountingstandardsappliedintheGroupand any changes resulting from the application of new accounting standards
• Theinspectionandreviewofinternalauditprocedures,plansandresults
• The inspection and review of the periodic administrative information thatis presented to the different levels of management and the methods of such preparation and timing of submission
• Ensuringtheimplementationofappropriatesupervisoryproceduresinorderto protect the assets of the Group
• EnsuringthattheGroupadherestotherecommendationsoftheauditorsandEFSA
• Theinspectionoftheprocedurescarriedoutinpreparingandreviewingthefinancial statements, offerings relating to securities and estimated budgets, cash flow and income statements
• Advisingon theappointmentofauditors toperformservicesother than thepreparation of the financial statements
• The inspection and review of the auditors report regarding the financialstatements and discussing the comments included, in addition to working on resolving any misunderstandings between the Board and the auditors
• Ensuring the preparation by an independent financial advisor of a reportregarding any related party transactions before being ratified
• EnsuringtheapplicationofthenecessarysupervisorymethodstomaintaintheGroup assets, conduct periodic evaluation of administrative procedures and prepare reports to the Board
The Board is required to adopt the Audit Committee’s recommendations within fifteen days of receiving notice of such recommendations� If the Board does not follow the recommendations, the chairman of the Audit Committee must notify both the EFSA and EGX�
corporate governance

5756 JuhAynA fooD inDustries AnnuAl rePort 2012JuhAynA fooD inDustries AnnuAl rePort 2012
Juhayna is an Active Participant in the local communityGiving back to the community is a core commitment at Juhayna� We strive to pro-vide education and support to those most in need and work with purpose-driven or-ganizations striving to make a difference in the country we are proud to call home�
Juhayna supports healthy schoolsAs a leading producer of healthy foods and beverages, Juhayna is committed to im-proving the overall health awareness in Egyptian society� To achieve this goal, in coop-eration with the Minister of Education, we launched a nutrition awareness campaign at public schools in Upper Egypt and helped upgrade school facilities, touching the lives of approximately 16,000 students across different governorates� We also orga-nized numerous recreational activities that were well attended by students who dis-played an eager desire to learn about health and nutrition� The community at large was given seminars on proper dietary nutrition and the health risks associated with malnutrition� Going forward, Juhayna plans to extend its platform to educate others about the importance of nutrition for mental and physical development and health�
Juhayna “gold sponsor” of the children’s cancer hospital nutrition conference Juhayna has been a proud sponsor of the Children’s Cancer Hospital (57357) since its inception� The company participated in the hospital’s original fund-raising cam-paign “Donate: Even if it’s a Pound” and has been heavily involved with various ini-tiatives in the hospital such as “Milk Day” when volunteers from Juhayna joined hos-pital staff to plan activities and awareness campaigns on the hazards of loose milk�
The company recently sponsored the Nutrition Conference at the Children’s Cancer Hospital to focus on spreading awareness about nutrition and cancer
corporate socialresponsibility
prevention� Held under the auspices of the Egyptian Council for Healthy Nutri-tion, the conference honored 25 Egyptian scientists for their work in the field of nutrition and was attended by prominent members of Egypt’s scientific commu-nity such as Minister of Scientific Research, Dr� Nadia Zacharia� Dr� Morsy Al Soda, Professor of Dairy Microbiology at Alexandria University, also took part in the con-ference, detailing the health benefits of packaged milk versus the risks of loose or bulk milk in her speech entitled, “Milk: Elixir of Life or Food Pathogen?”
Juhayna celebrates national orphan’s DayJuhayna organized a Ramadan iftar for 100 orphans at the Smart Village to co-incide with National Orphan’s Day in 2012� The Celebration included children’s entertainment and activities, such as magic shows and face painting� Our staff distributed gifts and Juhayna products to the children during this fun-filled and festive event�
Juhayna also participated in the annual “Orphan Day” event held at the Maadi British School� The event was attended by 1,500 orphans who participated in vari-ous educational and sports activities organized by Juhayna to promote good men-tal and physical health�
Juhayna and sife launch the “Drink healthy, stay healthy” initiativeJuhayna, in conjunction with SIFE (Students in Free Enterprise), an international non-profit organization that works with business and university students, orga-nized a competition among 11 Egyptian universities aimed at raising awareness on the general benefits of milk and the health dangers of loose milk, with the top three universities awarded prizes� This year’s competition featured student rep-resentatives from Upper and Central Egypt, including the French University, Cairo University, Assiut University and Fayoum University�
The panel judges at the competition included industry experts such as Dr� Morsy Al Soda, professor of Dairy Microbiology at Alexandria University’s Faculty of Agriculture�
Juhayna has sponsored SIFE since 2008, helping make possible its annual national student competition geared towards identifying the top community development projects, which are then presented at the international level�
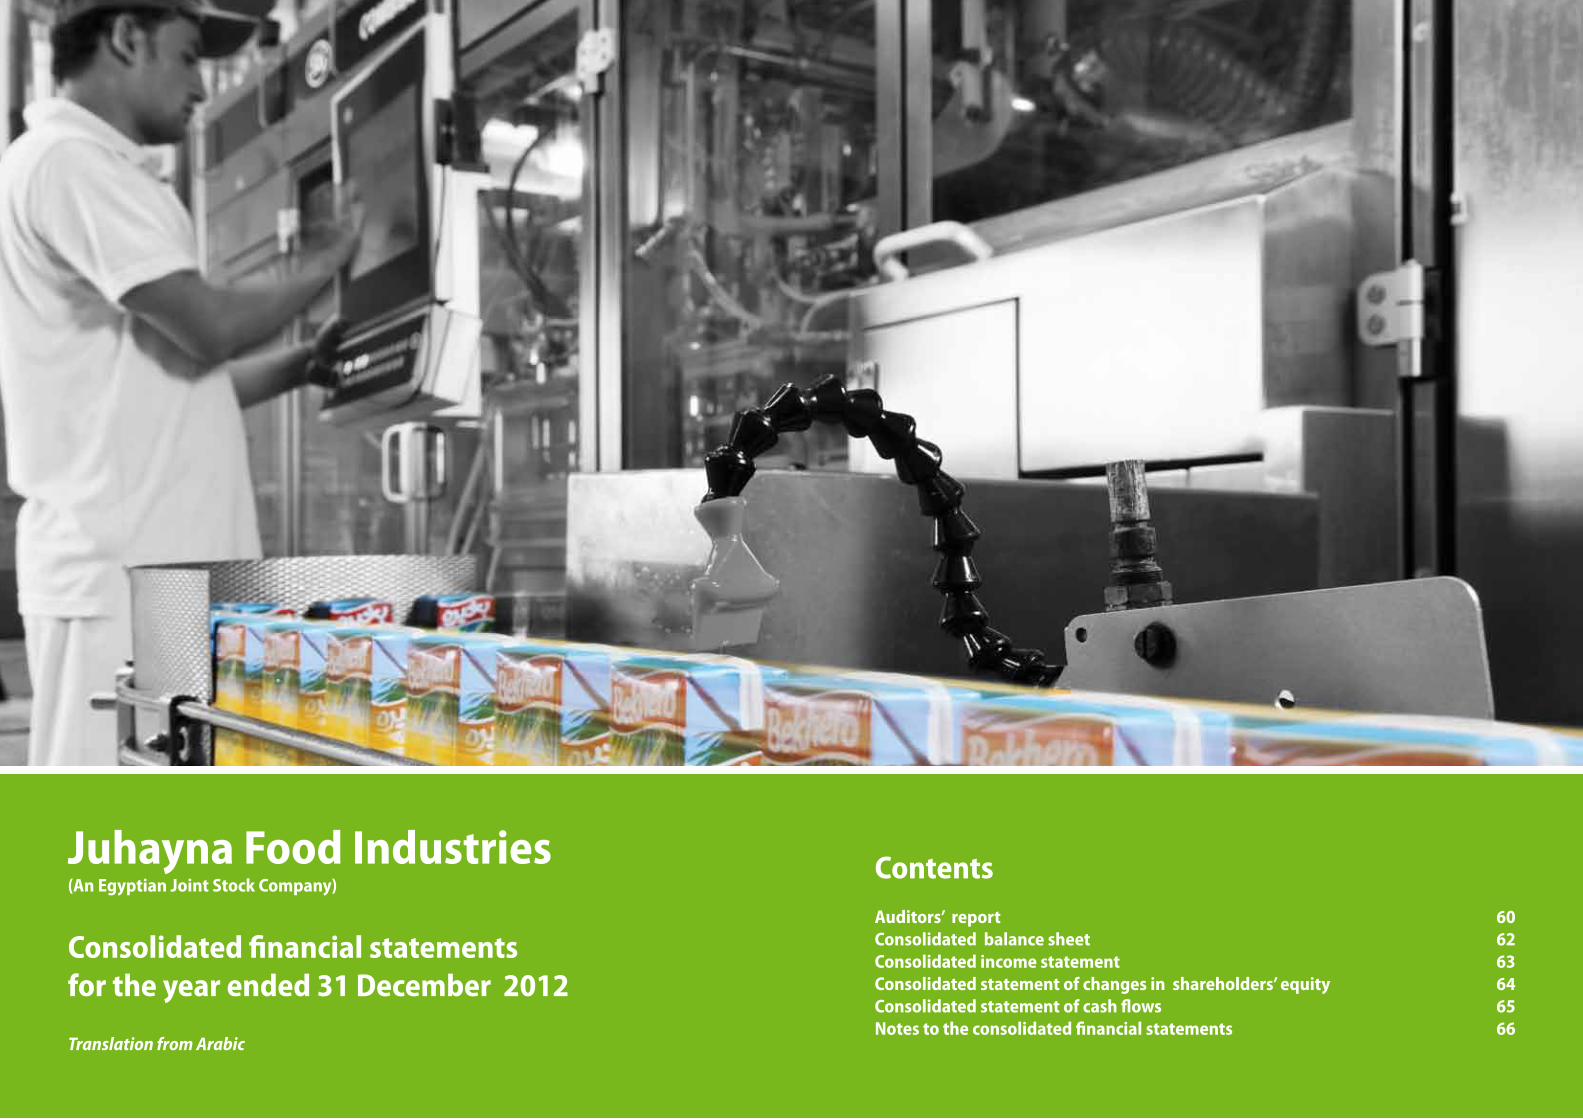
Juhayna Food Industries (An Egyptian Joint Stock Company)
Consolidated financial statementsfor the year ended 31 December 2012
Contents Auditors’ report 60Consolidated balance sheet 62Consolidated income statement 63Consolidated statement of changes in shareholders’ equity 64Consolidated statement of cash flows 65Notes to the consolidated financial statements 66
Translation from Arabic

61JuhAyNA FooD INDuStrIES ANNuAL rEPort 201260 JuhAyNA FooD INDuStrIES ANNuAL rEPort 2012
Report on the consolidated financial statementsWe have audited the accompanying consolidated financial statements of Juhayna Food Industries Company “An Egyptian Joint Stock Company”, which comprise the consolidated balance sheet as at 31 December 2012 and the consolidated statements of income, changes in shareholders’ equity, and cash flows for the financial year then ended, and a summary of significant accounting policies and other explanatory notes.
Management’s responsibility for the consolidated financial statementsThese consolidated financial statements are the responsibility of Company’s management. Management is responsible for the preparation and fair presenta-tion of these consolidated financial statements in accordance with the Egyptian Accounting Standards and in the light of the prevailing Egyptian laws, manage-ment responsibility includes: designing, implementing and maintaining internal control relevant to the preparation and fair presentation of the consolidated financial statements that are free from material misstatement, whether due to fraud or error; management responsibility also includes selecting and applying appropriate accounting policies; and making accounting estimates that are rea-sonable in the circumstances.
Auditor’s responsibilityOur responsibility is to express an opinion on these consolidated financial statements based on our audit. We conducted our audit in accordance with the Egyptian Standards on Auditing and in the light of the prevailing Egyptian laws. Those standards require that we comply with ethical requirements and plan and perform the audit to obtain reasonable assurance whether the financial state-ments are free from material misstatement.
An audit involves performing procedures to obtain audit evidence about the amounts and disclosures in the financial statements. The procedures selected depend on the auditor’s judgment, including the assessment of the risks of mate-rial misstatement of the financial statements, whether due to fraud or error. In making those risk assessments, the auditor considers internal control relevant to the entity’s preparation and fair presentation of the financial statements in order to design audit procedures that are appropriate in the circumstances, but not for the purpose of expressing an opinion on the effectiveness of the entity’s internal control. An audit also includes evaluating the appropriateness of accounting poli-cies used and the reasonableness of accounting estimates made by management, as well as evaluating the overall presentation of the financial statements.
We believe that the audit evidence we have obtained is sufficient and appropri-ate to provide a basis for our audit opinion on the consolidated financial state-ments.
OpinionIn our opinion, the consolidated financial statements referred to above present fairly, in all material respects, the consolidated financial position of Juhayna Food Industries Company as at 31 December 2012, and of its financial perfor-mance and its cash flows for the year then ended in accordance with the Egyp-tian Accounting Standards and the Egyptian laws and regulations relating to the preparation of these consolidated financial statements.
Salah EL MessaryCapital Authority Controller
Register N0.(364)KPMG Hazem Hassan
Hossam HelalCapital Authority Controller
Register N0.(147)Mohamed Helal – Grant Thornton
Cairo 14 February , 2013
AuDItorS’ rEPort Translation from Arabic
63JuhAyNA FooD INDuStrIES ANNuAL rEPort 201262 JuhAyNA FooD INDuStrIES ANNuAL rEPort 2012
Note no.31/12/2012
L.E.31/12/2011
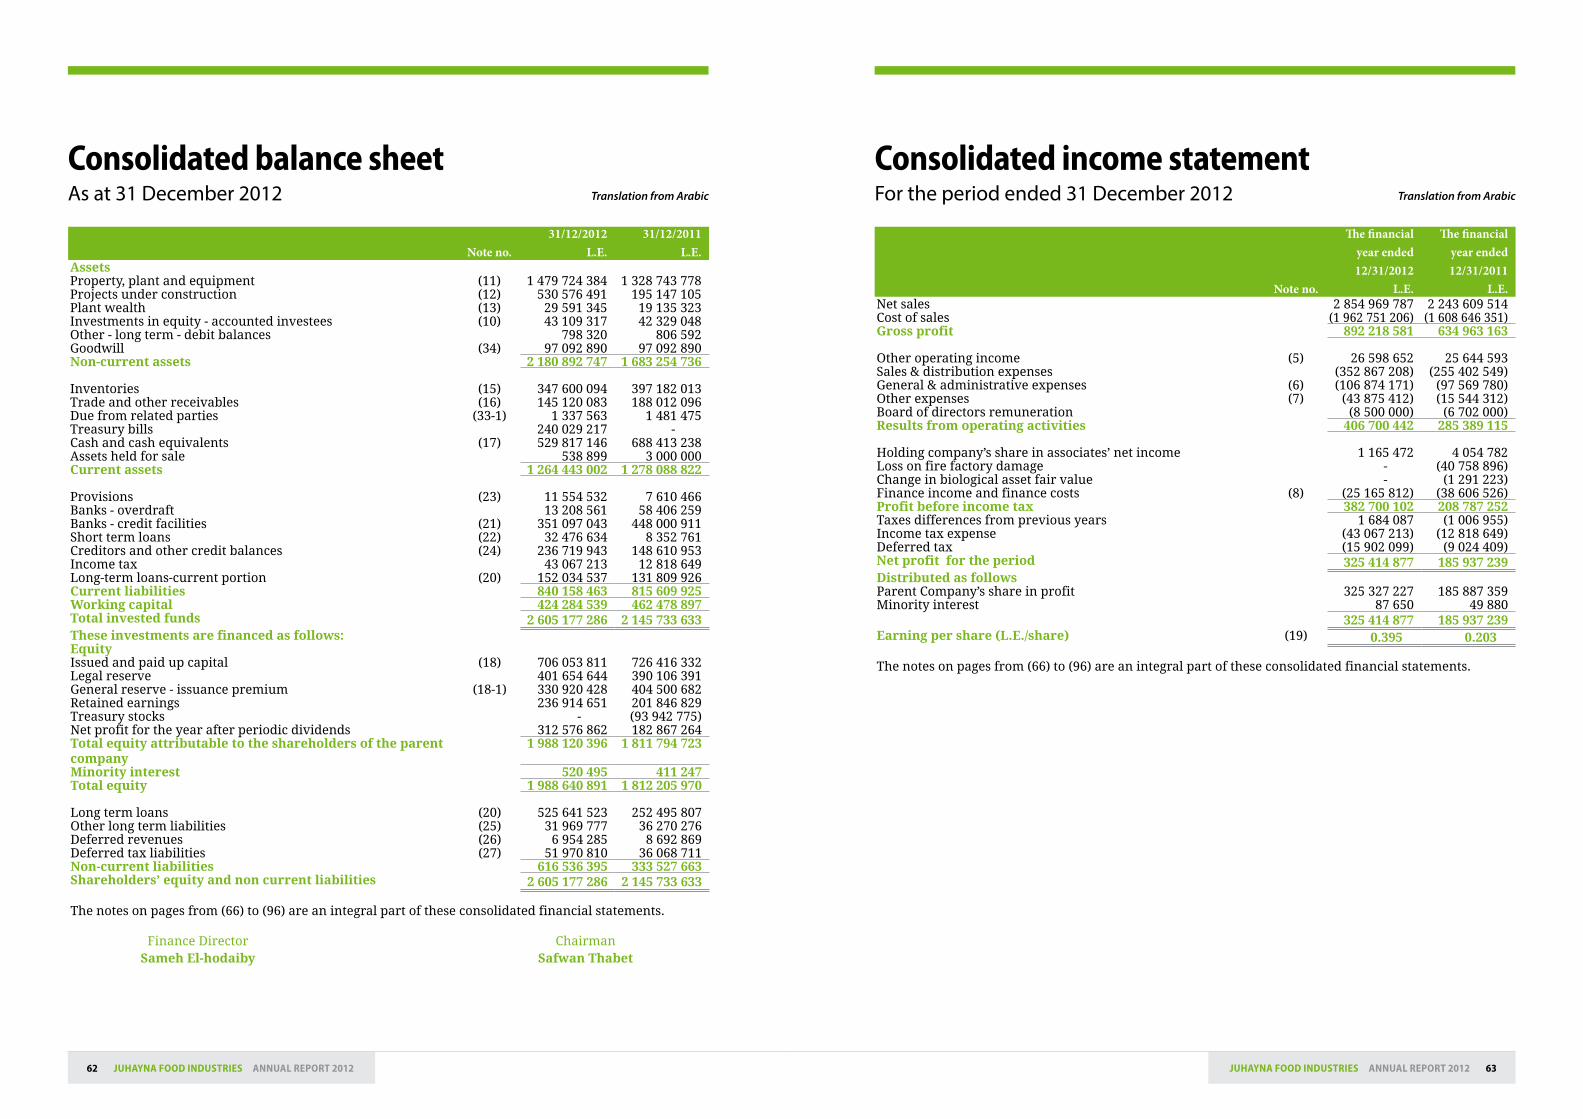
L.E.AssetsProperty, plant and equipment (11) 1 479 724 384 1 328 743 778Projects under construction (12) 530 576 491 195 147 105Plant wealth (13) 29 591 345 19 135 323Investments in equity - accounted investees (10) 43 109 317 42 329 048Other - long term - debit balances 798 320 806 592Goodwill (34) 97 092 890 97 092 890Non-current assets 2 180 892 747 1 683 254 736
Inventories (15) 347 600 094 397 182 013Trade and other receivables (16) 145 120 083 188 012 096Due from related parties (33-1) 1 337 563 1 481 475Treasury bills 240 029 217 -Cash and cash equivalents (17) 529 817 146 688 413 238Assets held for sale 538 899 3 000 000Current assets 1 264 443 002 1 278 088 822
Provisions (23) 11 554 532 7 610 466Banks - overdraft 13 208 561 58 406 259Banks - credit facilities (21) 351 097 043 448 000 911Short term loans (22) 32 476 634 8 352 761Creditors and other credit balances (24) 236 719 943 148 610 953Income tax 43 067 213 12 818 649Long-term loans-current portion (20) 152 034 537 131 809 926Current liabilities 840 158 463 815 609 925Working capital 424 284 539 462 478 897Total invested funds 2 605 177 286 2 145 733 633These investments are financed as follows:EquityIssued and paid up capital (18) 706 053 811 726 416 332Legal reserve 401 654 644 390 106 391General reserve - issuance premium (18-1) 330 920 428 404 500 682Retained earnings 236 914 651 201 846 829Treasury stocks - (93 942 775)Net profit for the year after periodic dividends 312 576 862 182 867 264Total equity attributable to the shareholders of the parent company
1 988 120 396 1 811 794 723
Minority interest 520 495 411 247Total equity 1 988 640 891 1 812 205 970
Long term loans (20) 525 641 523 252 495 807Other long term liabilities (25) 31 969 777 36 270 276Deferred revenues (26) 6 954 285 8 692 869Deferred tax liabilities (27) 51 970 810 36 068 711Non-current liabilities 616 536 395 333 527 663Shareholders’ equity and non current liabilities 2 605 177 286 2 145 733 633
The notes on pages from (66) to (96) are an integral part of these consolidated financial statements.
Consolidated balance sheet Consolidated income statementAs at 31 December 2012 For the period ended 31 December 2012 Translation from Arabic Translation from Arabic
Finance DirectorSameh El-hodaiby
ChairmanSafwan Thabet
Note no.
The financial year ended12/31/2012
L.E.
The financial year ended12/31/2011
L.E.Net sales 2 854 969 787 2 243 609 514Cost of sales (1 962 751 206) (1 608 646 351)Gross profit 892 218 581 634 963 163
Other operating income (5) 26 598 652 25 644 593Sales & distribution expenses (352 867 208) (255 402 549)General & administrative expenses (6) (106 874 171) (97 569 780)Other expenses (7) (43 875 412) (15 544 312)Board of directors remuneration (8 500 000) (6 702 000)Results from operating activities 406 700 442 285 389 115
Holding company’s share in associates’ net income 1 165 472 4 054 782 Loss on fire factory damage - (40 758 896)Change in biological asset fair value - (1 291 223)Finance income and finance costs (8) (25 165 812) (38 606 526)Profit before income tax 382 700 102 208 787 252 Taxes differences from previous years 1 684 087 (1 006 955)Income tax expense (43 067 213) (12 818 649)Deferred tax (15 902 099) (9 024 409)Net profit for the period 325 414 877 185 937 239 Distributed as followsParent Company’s share in profit 325 327 227 185 887 359Minority interest 87 650 49 880
325 414 877 185 937 239 Earning per share (L.E./share) (19) 0.395 0.203
The notes on pages from (66) to (96) are an integral part of these consolidated financial statements.
65JuhAyNA FooD INDuStrIES ANNuAL rEPort 201264 JuhAyNA FooD INDuStrIES ANNuAL rEPort 2012
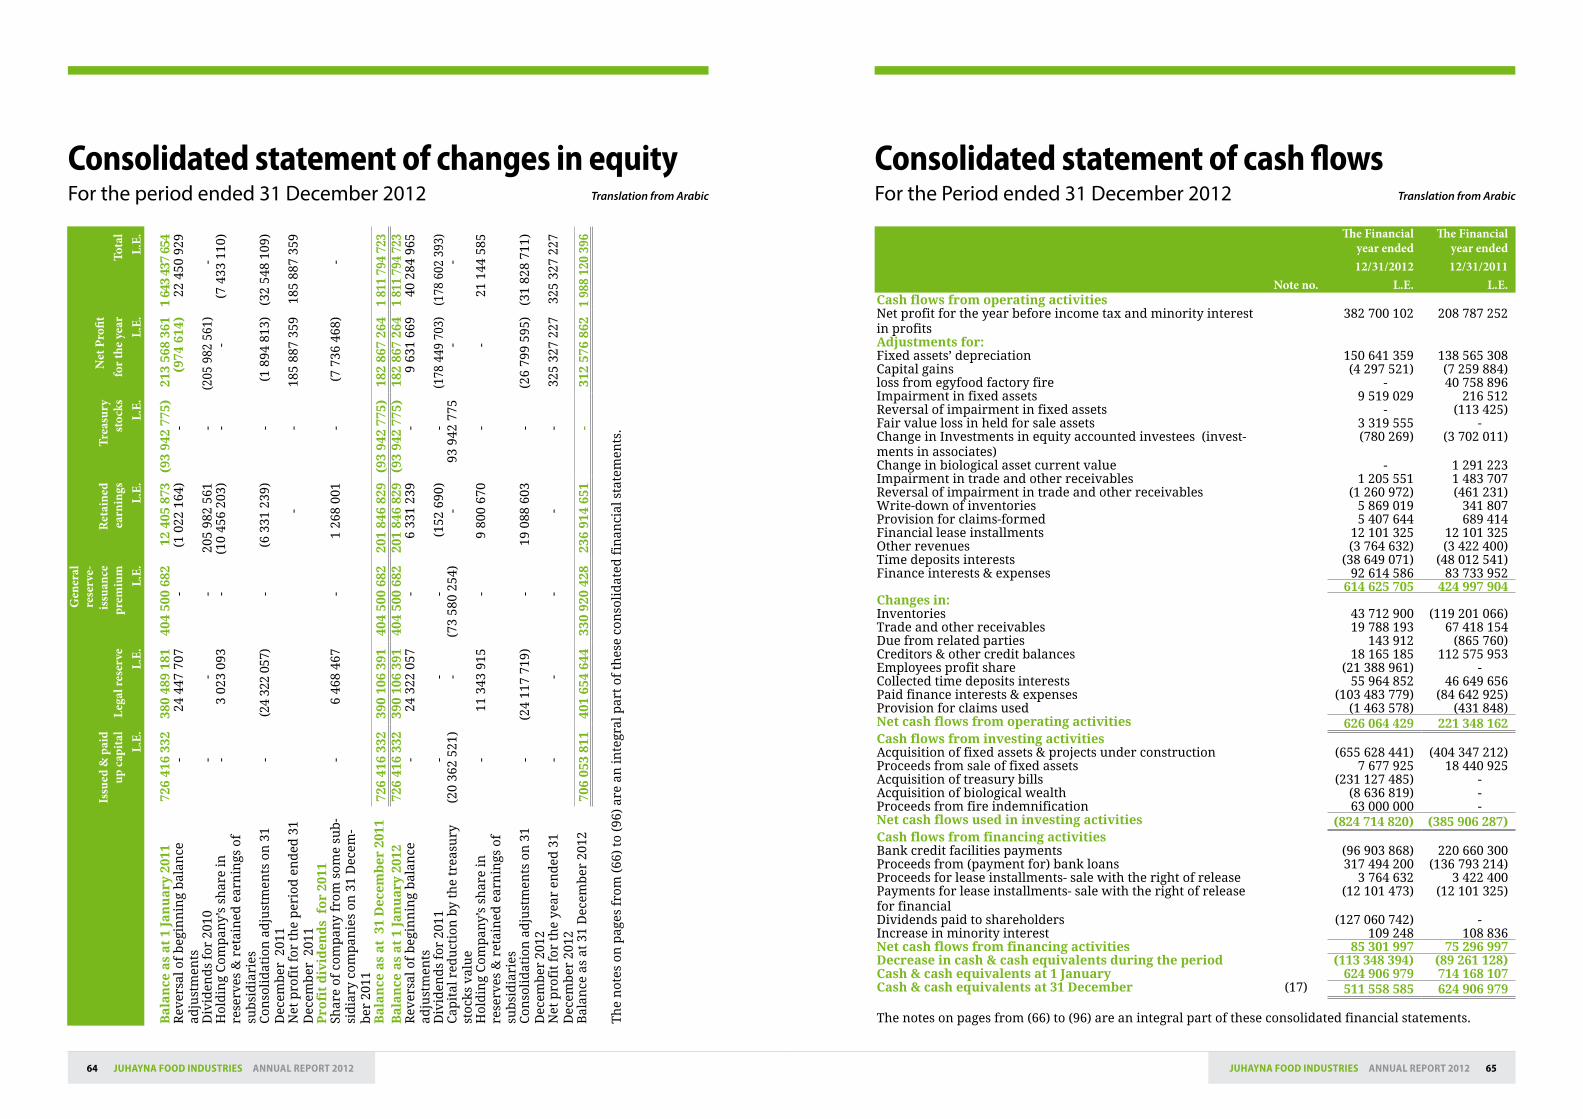
Consolidated statement of changes in equity Consolidated statement of cash flows For the period ended 31 December 2012 For the Period ended 31 December 2012Translation from Arabic Translation from Arabic
Issu
ed &
pai
d up
cap
ital
L.E.
Lega
l res
erve
L.E.
Gen
eral
re
serv
e-is
suan
ce
prem
ium
L.E.
Ret
aine
d ea
rnin
gsL.
E.
Trea
sury
st
ocks
L.E.
Net
Pro
fitfo
r the
yea
rL.
E.To
tal
L.E.
Ba
lan
ce a
s a
t 1
Jan
ua
ry 2
011
726
416
332
380
489
181
404
500
682
12 4
05 8
73(9
3 94
2 77
5)21
3 56
8 36
11
643
437
654
Rev
ersa
l of
beg
inn
ing
bal
ance
ad
just
men
ts-
24 4
47 7
07-
(1 0
22 1
64)
-(9
74 6
14)
22 4
50 9
29
Div
iden
ds
for
2010
--
-20
5 98
2 56
1-
(205
982
561
)-
Hol
din
g C
omp
any’
s sh
are
in
rese
rves
& r
etai
ned
ear
nin
gs o
f su
bsi
dia
ries
-3
023
093
-(1
0 45
6 20
3)-
-(7
433
110
)
Con
soli
dat
ion
ad
just
men
ts o
n 3
1 D
ecem
ber
201
1-
(24
322
057)
- (
6 33
1 23
9)-
(1
894
813)
(32
548
109)
Net
pro
fit
for
the
per
iod
en
ded
31
Dec
emb
er 2
011
--
185
887
359
185
887
359
Pro
fit
div
iden
ds
fo
r 20
11Sh
are
of c
omp
any
from
som
e su
b-
sid
iary
com
pan
ies
on 3
1 D
ecem
-b
er 2
011
-6
468
467
-1
268
001
- (
7 73
6 46
8)-
Ba
lan
ce a
s a
t 3
1 D
ecem
ber
201
172
6 41
6 33
239
0 10
6 39
140
4 50
0 68
220
1 84
6 82
9(9
3 94
2 77
5)18
2 86
7 26
41
811
794
723
Ba
lan
ce a
s a
t 1
Jan
ua
ry 2
012
726
416
332
390
106
391
404
500
682
201
846
829
(93
942
775)
182
867
264
1 81
1 79
4 72
3R
ever
sal o
f b
egin
nin
g b
alan
ce
adju
stm
ents
- 2
4 32
2 05
7-
6 33
1 23
9-
9 63
1 66
940
284
965
Div
iden
ds
for
2011
--
-(1
52 6
90)
-(1
78 4
49 7
03)
(178
602
393
)C
apit
al r
edu
ctio
n b
y th
e tr
easu
ry
stoc
ks v
alu
e(2
0 36
2 52
1)-
(73
580
254)
-93
942
775
--
Hol
din
g C
omp
any’
s sh
are
in
rese
rves
& r
etai
ned
ear
nin
gs o
f su
bsi
dia
ries
-11
343
915
-9
800
670
--
21 1
44 5
85
Con
soli
dat
ion
ad
just
men
ts o
n 3
1 D
ecem
ber
201
2-
(24
117
719)
-19
088
603
-(2
6 79
9 59
5)(3
1 82
8 71
1)
Net
pro
fit
for
the
year
en
ded
31
Dec
emb
er 2
012
--
--
-32
5 32
7 22
732
5 32
7 22
7
Bal
ance
as
at 3
1 D
ecem
ber
201
270
6 05
3 81
140
1 65
4 64
433
0 92
0 42
823
6 91
4 65
1-
312
576
862
1 98
8 12
0 39
6
Th
e n
otes
on
pag
es f
rom
(66
) to
(96
) ar
e an
inte
gral
par
t of
th
ese
con
soli
dat
ed f
inan
cial
sta
tem
ents
.
Note no.
The Financial year ended12/31/2012
L.E.
The Financial year ended12/31/2011
L.E.Cash flows from operating activitiesNet profit for the year before income tax and minority interest in profits
382 700 102 208 787 252
Adjustments for:Fixed assets’ depreciation 150 641 359 138 565 308Capital gains (4 297 521) (7 259 884)loss from egyfood factory fire - 40 758 896Impairment in fixed assets 9 519 029 216 512Reversal of impairment in fixed assets - (113 425)Fair value loss in held for sale assets 3 319 555 -Change in Investments in equity accounted investees (invest-ments in associates)
(780 269) (3 702 011)
Change in biological asset current value - 1 291 223Impairment in trade and other receivables 1 205 551 1 483 707Reversal of impairment in trade and other receivables (1 260 972) (461 231)Write-down of inventories 5 869 019 341 807Provision for claims-formed 5 407 644 689 414Financial lease installments 12 101 325 12 101 325Other revenues (3 764 632) (3 422 400)Time deposits interests (38 649 071) (48 012 541)Finance interests & expenses 92 614 586 83 733 952
614 625 705 424 997 904Changes in:Inventories 43 712 900 (119 201 066)Trade and other receivables 19 788 193 67 418 154Due from related parties 143 912 (865 760)Creditors & other credit balances 18 165 185 112 575 953Employees profit share (21 388 961) -Collected time deposits interests 55 964 852 46 649 656Paid finance interests & expenses (103 483 779) (84 642 925)Provision for claims used (1 463 578) (431 848)Net cash flows from operating activities 626 064 429 221 348 162Cash flows from investing activitiesAcquisition of fixed assets & projects under construction (655 628 441) (404 347 212)Proceeds from sale of fixed assets 7 677 925 18 440 925Acquisition of treasury bills (231 127 485) -Acquisition of biological wealth (8 636 819) -Proceeds from fire indemnification 63 000 000 -Net cash flows used in investing activities (824 714 820) (385 906 287)Cash flows from financing activitiesBank credit facilities payments (96 903 868) 220 660 300Proceeds from (payment for) bank loans 317 494 200 (136 793 214)Proceeds for lease installments- sale with the right of release 3 764 632 3 422 400Payments for lease installments- sale with the right of release for financial
(12 101 473) (12 101 325)
Dividends paid to shareholders (127 060 742) -Increase in minority interest 109 248 108 836Net cash flows from financing activities 85 301 997 75 296 997Decrease in cash & cash equivalents during the period (113 348 394) (89 261 128)Cash & cash equivalents at 1 January 624 906 979 714 168 107Cash & cash equivalents at 31 December (17) 511 558 585 624 906 979
The notes on pages from (66) to (96) are an integral part of these consolidated financial statements.
67JuhAyNA FooD INDuStrIES ANNuAL rEPort 201266 JuhAyNA FooD INDuStrIES ANNuAL rEPort 2012
Notes to the consolidated financial statementsFor the financial year ended 31 December 2012 Translation from Arabic
2-4 Use of estimates and judgmentsThe preparation of financial statements in conformity with Egyptian Accounting Standards re-quires management to make judgments, estimates and assumptions that affect the application of accounting policies and the reported amounts of assets, liabilities, income and expenses. Actual results may differ from these estimates.
Estimates and underlying assumptions are reviewed on an ongoing basis. Revisions to accounting estimates are recognized in the year in which the estimate is revised and in any future periods af-fected.
Information about critical judgments in applying accounting policies that have the most significant effect on the amounts recognized in the financial statements is included in the following notes:• Note(3-9):leaseclassification.Information about assumptions and estimation uncertainties that have a significant risk of result-ing in a material adjustment within the next financial statements are included in the following notes:• Note(15):writedownofinventories.• Note(16):impairmentoftradeandnotesreceivable.• Note(23):provisions&contingentliabilities• Note(27):deferredtax.
3 Significant accounting policiesThe accounting policies set out below have been applied consistently to all periods presented in these interim consolidated financial statements.
3-1 Basis of consolidation
SubsidiariesSubsidiaries are entities controlled by the Company. The financial statement of subsidiaries are included in the consolidated financial statements from the date that control commences until the date that control ceases.
Investments in equity accounted investees (associates)Associates are those entities in which the Company has significant influence, but not control, over the financial and operating policies. Investments in associates is accounted for using the equity method and is recognized initially at cost . The cost of the investment include transaction costs . The consolidated financial statements include the Company’s share of the income and expenses of equity accounted investees, after adjustments to align the accounting policies with those of the Company, from the date that significant influence commences until the date that significant influence ceases. When the Company’s share of losses exceeds its interest in an eq-uity accounted investee, the carrying amount of that interest including any long-term interests that from part thereof is reduced to zero, and the recognition of further losses is discontinued except to the extent that the Company has an obligation or has made payments on behalf of the investee.
Transactions eliminated on consolidation Intra-group balances, and any unrealized income and expenses arising from intra-group transac-
1 Reporting the entityThe Company was established in 1995 according to the Investment Law No.(230) of 1989 as replaced by the investment incentives and guarantees law No. (8) of 1997 and the decree of the Minister of Economic and Foreign Trade No. 636 of 1994 approving the Company’s establishment.
The Company was registered in the commercial registry under No. 100994 on 10/1/1995. Company’s period is 25 years starting from the date of registration in the commercial registry.
The address of the Company’s registered office is 11 Aljihad Street- Lebanon Square- Almohandessien. The address of the company’s factories is 6 of October city- First Industrial Zone- piece no. 39 and 40, Mr. Safwan Thabet is the Chairman of the Board of Directors. The Company is considered a holding Company.
The Company’s purposeThe Company primarily is involved in the production, manufacture, packaging and packing of all types of dairy, products and all its derivatives, all types of cheeses, fruit juices, drinks and frozen material, prepar-ing, manufacturing, packaging and packing all types of food materials and in general manufacturing of agriculture products.
Registration in the Stock ExchangeThe Company is listed in [1] of Egyptian Stock Exchanges.
2 Basis of preparation
2-1 Statement of complianceThe financial statements have been prepared in accordance with Egyptian Accounting Standards (“EAS”), and in the light of prevailing Egyptian laws.
The financial statements were authorized for issue by the Board of Directors on 13/02/2013.
2-2 Basis of measurementThe consolidated financial statements have been prepared on the historical cost basis except for the following material items in the balance sheet.- Derivative financial instrument measured at fair value - Non-derivative financial liabilities at fair less costs to sell. (note 4-1).- Biological assets and Agricultural crops at fair value after reduce the cost of sale (note 4-2).The methods used to measure fair values are discussed further in note (4).
2-3 Functional and presentation currencyThese consolidated financial statements are presented in Egyptian pound, which is the Company’s functional currency.
69JuhAyNA FooD INDuStrIES ANNuAL rEPort 201268 JuhAyNA FooD INDuStrIES ANNuAL rEPort 2012
ReceivablesReceivables are financial assets with fixed or determinable payments that are not quoted in an ac-tive market. Such assets are recognized initially at fair value plus any directly attributable transac-tion costs.
Generally, short-duration trade and other receivables with no stated interest rate are stated at their nominal value ( original invoice amount) less an allowance for any doubtful debts.
Receivables comprise cash and cash equivalents, and trade and other receivables.
Cash and cash equivalents Cash and cash equivalents comprise cash balances and call deposits with original maturities of three months or less from the acquisition date that are subject to an insignificant risk of changes in their fair value, and are used by the Company in the management of its short-term commitments.
Available-for-sale financial assetsAvailable-for-sale financial assets are non-derivative financial assets that are designated as avail-able-for-sale or are not classified in any of the above categories of financial assets. Available –for-sale financial assets are recognized initially at fair value plus any directly attributable transaction costs.
Subsequent to initial recognition, they are measured at fair value and changes therein, other than impairment losses and foreign currency differences on available-for sale debt instruments, pre-sented in fair value reserve in equity. When an investment is derecognized, the gain or loss accu-mulated in equity is reclassified to profit or loss.
Available-for-sale financial assets comprise equity securities and debt securities.
Non-derivative financial liabilitiesThe Company initially recognizes debt securities issued and subordinated liabilities on the date that they are originated. All other financial liabilities ( including liabilities designated as at fair value through profit or loss) are recognized initially on the trade date, which is the date that the Company becomes a party to the contractual provisions of the instrument.
The Company derecognizes a financial liability when its contractual obligations are discharged, cancelled or expire.
The Company classifies non – derivative financial liabilities into the other financial liabilities cat-egory. Such financial liabilities are recognized initially at the fair value plus any directly attribut-able transaction costs. Subsequent to initial recognition, these financial liabilities are measured at amortized cost using the effective interest method.
Other financial liabilities comprise loans and borrowings , bank overdrafts, and trade and other payables. Generally, trade payables are recorded at their nominal value.
Bank overdrafts that are repayable on demand and form an integral part of the Company’s cash management are included as a component of cash and cash equivalents for the purpose of the statement of cash flows.
tions, are eliminated in preparing the consolidated financial statements. Unrealized gains arising from transactions with equity accounted investees are eliminated against the investment to the extent of the Company’s interest in the investee. Unrealized losses are eliminated in the same way as unrealized gains, but only to the extent that there is no evidence of impairment.
3-2 Foreign currency
Foreign currency transactionsTransactions in foreign currencies are translated to the respective functional currency at exchange rates at the dates of the transactions. Monetary assets and liabilities denominated in foreign cur-rencies at the reporting date are retranslated to the functional currency at the exchange rate at that date.
Non-monetary assets and liabilities that are measured at fair value in a foreign currency are retranslated to the functional currency at the exchange rate at the date that the fair value was de-termined. Non-monetary items that are measured based on historical cost in a foreign currency are translated using the exchange rate at the date of the transaction.
3-3 Financial instruments
Non-derivative financial assetsThe Company initially recognizes loans and receivables and deposits on the date that they are origi-nated. All other financial assets (including assets designated at fair value through profit or loss) are recognized initially on the trade date, which is date that the Company becomes a party to the contractual provisions of the instrument.
The Company derecognizes a financial asset when the contractual rights to the cash flows from the asset expire, or it transfers the rights to receive the contractual cash flows on the financial asset in a transaction in which substantially all the risks and rewards of ownership of the financial asset are transferred. Any interest in transferred financial assets that is created or retained by the Com-pany is recognized as a separate asset or liability.
Financial assets and liabilities are offset and the net amount presented in the balance sheet when, and only when, the Company has a legal right to offset the amounts and intends either to settle on a net basis or to realise the asset and settle the liability simultaneously.
The Company classifies non – derivative financial assets into the following categories: financial as-sets at fair value through profit or loss, held-to-maturity financial assets, loans and receivables and available-for sale financial assets.
Held - to - maturity financial assetsIf the Company has the positive intent and ability to hold debt securities to maturity, then such financial assets are classified as held-to-maturity. Held-to-maturity financial assets are recog-nized initially at fair value plus any directly attributable transaction costs. Subsequent to initial recognition held-to-maturity financial assets are measured at amortized cost using the effective interest method, less any impairment losses, Held – to – maturity financial assets comprise deben-tures.
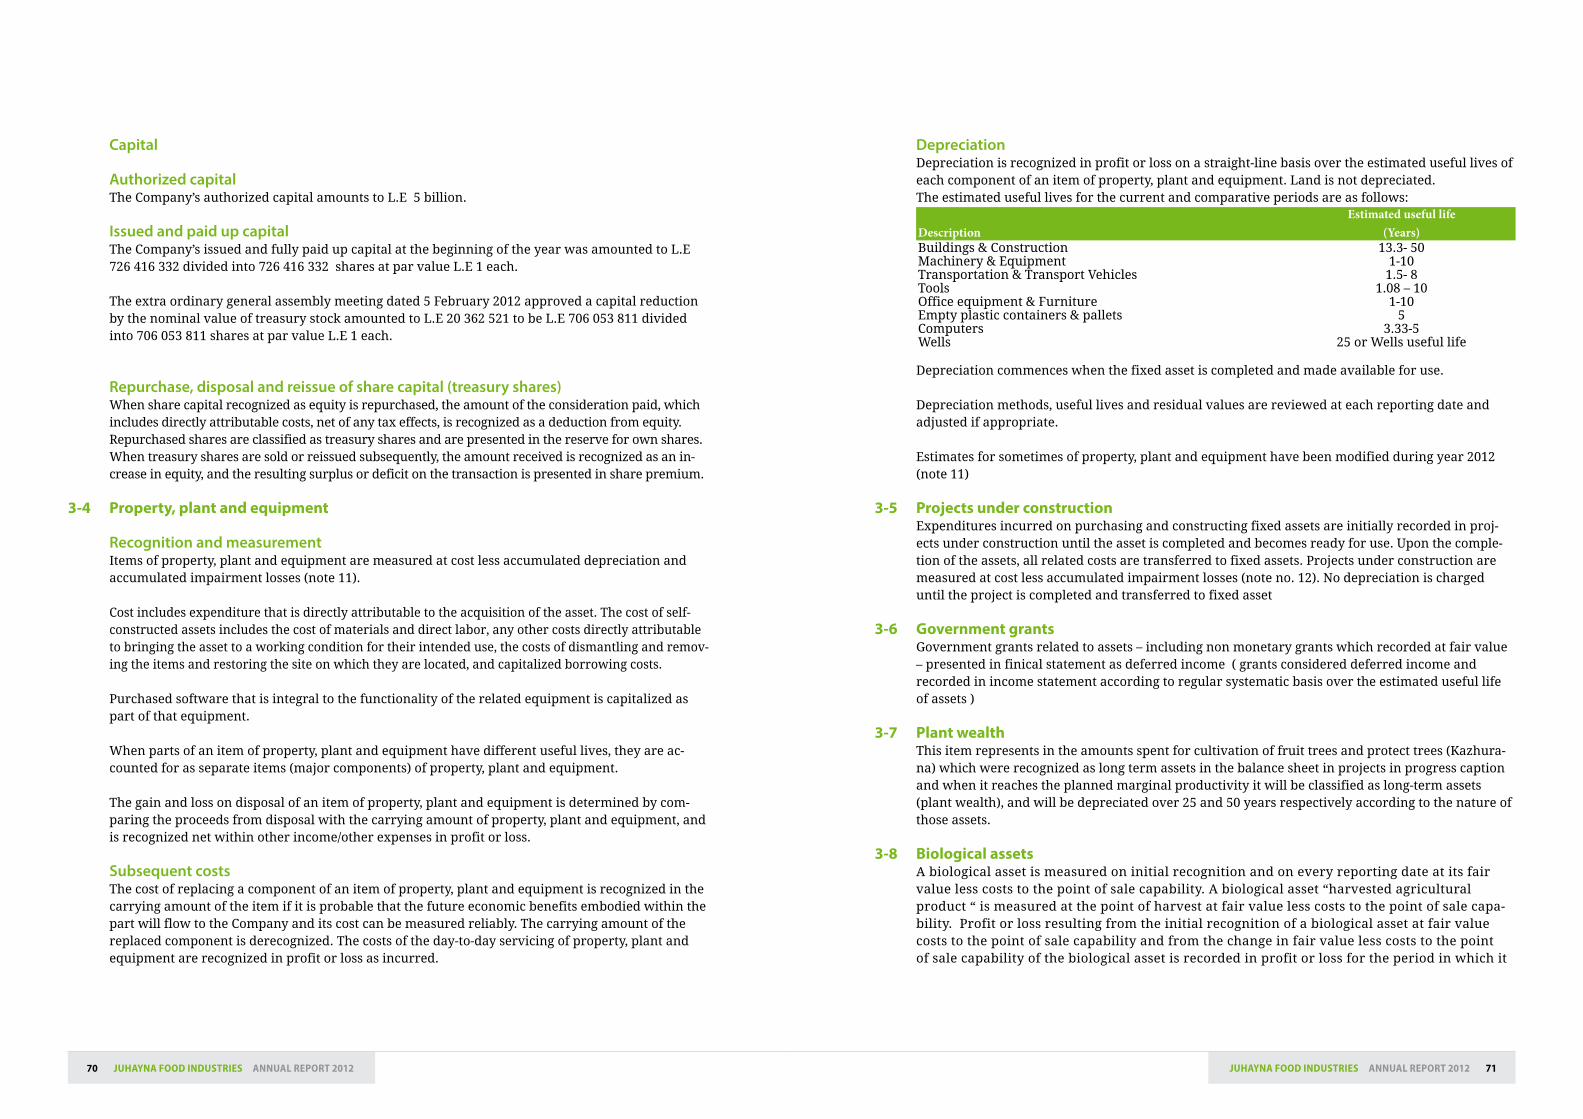
71JuhAyNA FooD INDuStrIES ANNuAL rEPort 201270 JuhAyNA FooD INDuStrIES ANNuAL rEPort 2012
DepreciationDepreciation is recognized in profit or loss on a straight-line basis over the estimated useful lives of each component of an item of property, plant and equipment. Land is not depreciated. The estimated useful lives for the current and comparative periods are as follows:
DescriptionEstimated useful life
(Years)Buildings & Construction 13.3- 50Machinery & Equipment 1-10Transportation & Transport Vehicles 1.5- 8Tools 1.08 – 10Office equipment & Furniture 1-10Empty plastic containers & pallets 5Computers 3.33-5Wells 25 or Wells useful life
Depreciation commences when the fixed asset is completed and made available for use.
Depreciation methods, useful lives and residual values are reviewed at each reporting date and adjusted if appropriate.
Estimates for sometimes of property, plant and equipment have been modified during year 2012 (note 11)
3-5 Projects under constructionExpenditures incurred on purchasing and constructing fixed assets are initially recorded in proj-ects under construction until the asset is completed and becomes ready for use. Upon the comple-tion of the assets, all related costs are transferred to fixed assets. Projects under construction are measured at cost less accumulated impairment losses (note no. 12). No depreciation is charged until the project is completed and transferred to fixed asset
3-6 Government grants Government grants related to assets – including non monetary grants which recorded at fair value – presented in finical statement as deferred income ( grants considered deferred income and recorded in income statement according to regular systematic basis over the estimated useful life of assets )
3-7 Plant wealthThis item represents in the amounts spent for cultivation of fruit trees and protect trees (Kazhura-na) which were recognized as long term assets in the balance sheet in projects in progress caption and when it reaches the planned marginal productivity it will be classified as long-term assets (plant wealth), and will be depreciated over 25 and 50 years respectively according to the nature of those assets.
3-8 Biological assetsA biological asset is measured on initial recognition and on every reporting date at its fair value less costs to the point of sale capability. A biological asset “harvested agricultural product “ is measured at the point of harvest at fair value less costs to the point of sale capa-bility. Profit or loss resulting from the initial recognition of a biological asset at fair value costs to the point of sale capability and from the change in fair value less costs to the point of sale capability of the biological asset is recorded in profit or loss for the period in which it
Capital
Authorized capitalThe Company’s authorized capital amounts to L.E 5 billion.
Issued and paid up capitalThe Company’s issued and fully paid up capital at the beginning of the year was amounted to L.E 726 416 332 divided into 726 416 332 shares at par value L.E 1 each.
The extra ordinary general assembly meeting dated 5 February 2012 approved a capital reduction by the nominal value of treasury stock amounted to L.E 20 362 521 to be L.E 706 053 811 divided into 706 053 811 shares at par value L.E 1 each.
Repurchase, disposal and reissue of share capital (treasury shares)When share capital recognized as equity is repurchased, the amount of the consideration paid, which includes directly attributable costs, net of any tax effects, is recognized as a deduction from equity. Repurchased shares are classified as treasury shares and are presented in the reserve for own shares. When treasury shares are sold or reissued subsequently, the amount received is recognized as an in-crease in equity, and the resulting surplus or deficit on the transaction is presented in share premium.
3-4 Property, plant and equipment
Recognition and measurement Items of property, plant and equipment are measured at cost less accumulated depreciation and accumulated impairment losses (note 11).
Cost includes expenditure that is directly attributable to the acquisition of the asset. The cost of self-constructed assets includes the cost of materials and direct labor, any other costs directly attributable to bringing the asset to a working condition for their intended use, the costs of dismantling and remov-ing the items and restoring the site on which they are located, and capitalized borrowing costs.
Purchased software that is integral to the functionality of the related equipment is capitalized as part of that equipment. When parts of an item of property, plant and equipment have different useful lives, they are ac-counted for as separate items (major components) of property, plant and equipment.
The gain and loss on disposal of an item of property, plant and equipment is determined by com-paring the proceeds from disposal with the carrying amount of property, plant and equipment, and is recognized net within other income/other expenses in profit or loss.
Subsequent costsThe cost of replacing a component of an item of property, plant and equipment is recognized in the carrying amount of the item if it is probable that the future economic benefits embodied within the part will flow to the Company and its cost can be measured reliably. The carrying amount of the replaced component is derecognized. The costs of the day-to-day servicing of property, plant and equipment are recognized in profit or loss as incurred.
73JuhAyNA FooD INDuStrIES ANNuAL rEPort 201272 JuhAyNA FooD INDuStrIES ANNuAL rEPort 2012
Financial assets measured at amortized costThe Company considers evidence of impairment for financial assets measured at amortized cost (loans and receivables and held –to-maturity investment securities) at both a specific asset and collective level. All individually significant assets are assessed for specific impairment. Those found not to be specifically impaired are then collectively assessed for any impairment that has been incurred but not yet identified. Assets that are not individually significant are collectively assessed for impairment by grouping together assets with similar risk charac-teristics.
In assessing collective impairment, the Company uses historical trends of the probability of default, the timing of recoveries and the amount of loss incurred, adjusted for management’s judgement as to whether current economic and credit conditions are such that the actual losses are likely to be greater or less than suggested by historical trends.
An impairment loss in respect of a financial asset measured at amortized cost is calculated as the difference between its carrying amount and the present value of the estimated future cash flows discounted at the asset’s original effective interest rate. Losses are recognized in profit or loss and reflected in an allowance account against loans and receivables or held – to – matu-rity investment securities. Interest on the impaired asset continues to be recognized. When an event occurring after the impairment was recognized causes the amount of impairment loss to decrease, the decrease in impairment loss is reversed through profit or loss.
Non-financial assetsThe carrying amounts of the Company’s non-financial assets, other than biological assets, investment property, inventories and deferred tax assets, are reviewed at each reporting date to determine whether there is any indication of impairment. If any such indication exists, then the asset’s recoverable amount is estimated. For intangible assets that have indefinite useful lives, the recoverable amount is tested annually for impairment.
An impairment loss is recognized if the carrying amount of an asset or cash – generating unit (CGU) exceeds its recoverable amount.
The recoverable amount of an asset or CGU is the greater of its value in use and its fair value less costs to sell. In assessing value in use, the estimated future cash flows are discounted to their present value using a pre-tax discount rate that reflects current market assessments of the time value of money and the risks specific to the asset or CGU. For the purpose of impair-ment testing, assets are grouped together into the smallest group of assets that generates cash inflows from continuing use that are largely independent of the cash inflows of other assets or CGU.
Impairment losses are recognized in profit or loss. For other assets, an impairment loss is re-versed only to the extent that the asset’s carrying amount does not exceed the carrying amount that would have been determined, net of depreciation or amortization, if no impairment loss had been recognized.
3-13 Defined contribution plansThe Company contributes to the government social insurance system for the benefits of its person-nel in accordance with according to the social insurance Law No. 79 of 1975 and its amendments.
arises, profit or loss resulting from the initial recognition of agricultural product at fair value less costs to the point of sale capability is recorded in profit or loss for the period in which it arises.
When there is no market available to determine prices and values, which the alternative estimates of fair value have shown clearly that it cannot be relied upon, in this case the bio-logical asset is measured at its cost less any accumulated amortization and any accumulated impairment of value. Once the possibility of measuring the fair value of these assets are reliably established, the Company measures it at it’s fair value less costs to the point of sale capability.
3-9 Leases
Company is the lessee:Leases are classified as operating leases. The costs in respect of operating leases are charged on a straight-line basis over the lease term. The value of any lease incentive received to take on an oper-ating lease (for example, rent-free periods) is recognized as deferred income and is released over the life of the lease.
3-10 GoodwillGoodwill is initially measured at its cost, being the excess of the cost of the business combination over the Group’s interest in the net fair value of identifiable assets, liabilities and contingent liabili-ties. After initial recognition, the group measures acquired goodwill at cost less impairment losses. Recognized goodwill impairment losses are not subsequently reversed.
3-11 InventoriesInventories of raw materials, supplies, packaging & packing materials and spare parts are mea-sured at the lower of cost or net realizable value. The cost of inventories is based on the weighted average principle, and includes expenditure incurred in acquiring the inventories, production or conversion costs and other costs incurred in bringing them to their existing location and condition. Net realizable value is the estimated selling price, in the ordinary course of business, less estimated costs of the completion and selling expenses.
The inventory of work in process is measured at the lower of cost, which is determined based on the lower of the cost last process the work in process reached, or net realizable value.
Finished production is measured at the lower of manufacturing cost or net realizable value. The manufacturing cost comprises raw materials, direct labor, and cost includes an appropriate share of overheads based on normal operating capacity.
3-12 Impairment
Non –derivative financial assetsA financial asset not carried at fair value through profit or loss is assessed at each reporting date to determine whether there is objective evidence that it is impaired. A financial asset is impaired if objective evidence indicates that a loss event has occurred after the initial recognition of the asset, and that the loss event had a negative effect on the estimated future cash flows of that asset that can be estimated reliably.
75JuhAyNA FooD INDuStrIES ANNuAL rEPort 201274 JuhAyNA FooD INDuStrIES ANNuAL rEPort 2012
3-18 Income taxIncome tax on profit or loss for the year comprises current and deferred tax. Income tax is recog-nized in the income statement except to the extent that it relates to items recognized directly on eq-uity, in which case it is recognized in equity. Current tax is the expected tax payable on the taxable income for the year, using tax rates enacted or substantially enacted at the balance sheet date, and any adjustment to tax payable in respect of previous years.
3-19 Deferred taxDeferred tax is recognized in respect of temporary differences between the carrying amounts of assets and liabilities for financial reporting purposes and the amounts used for taxation purposes. Deferred tax is measured based on the expected manner of realization or settlement of the carrying amount of assets and liabilities, using tax rates enacted or substantively enacted at the reporting date.
A deferred tax asset is recognized for unused tax losses, tax credits and deductible tempo-rary differences, to the extent that it is probable that future taxable profits will be available against which they can be utilized. Deferred tax assets are reviewed at each reporting date and are reduced to the extent that it is no longer probable that the related tax benefit will be realized.
3-20 Assets held for sale or held for distributionNon-current assets, or disposal groups comprising assets and liabilities, are classified as held-for-sale or held-for-distribution if it is highly probable that they will be recovered primarily through sale or distribution rather than through continuing use.
Immediately before classification as held-for-sale or held-for-distribution, the assets, or components of a disposal group, are remeasured in accordance with the Company’s other accounting policies. Thereafter, generally the assets, or disposal group, are measured at the lower of their carrying amount and fair value less costs to sell. Any impairment loss on a dis-posal group is allocated to the remaining assets and liabilities on a pro rata basis, except that no loss is allocated to inventories, financial assets, deferred tax assets, employee benefit as-sets, investment property or biological assets, which continue to be measured in accordance with the Company's other accounting policies. Impairment losses on initial classification as held-for-sale or held-for-distribution and subsequent gains and losses on remeasurement are recognized in profit or loss. Gains are not recognized in excess of any cumulative impairment loss.
Once classified as held-for-sale or held-for-distribution, intangible assets and property, plant and equipment are no longer amortized or depreciated, and any equity-accounted investee is no longer equity accounted.
3-21 Legal reserveAccording to the Companies Law requirements and the statutes of the Company, 5% of the annual net profit shall be transferred to a legal reserve until the accumulated reserve reaches 50% of the issued share capital. The reserve is un-distributable; however, it can be used to increase the share capital or to offset losses. If the reserve falls below the defined level (50% of the issued share capi-tal), than the Company is required to resume setting aside 5% of the annual profit until it reaches 50% of the issued share capital.
Under this Law the employees and the employers contribute into the system on a fixed percent-age – of- salaries basis. The Company’s contributions are recognized in income statement using the accrual basis of accounting. The company’s obligation in respect of employees’ pensions is confined to the amount of aforementioned contributions.
3-14 ProvisionsA provision is recognized if, as a result of a past event, the Company has a present legal or construc-tive obligation that can be estimated reliably, and it is probable that an outflow of economic ben-efits will be required to settle the obligation.
3-15 Revenue
Goods soldRevenue from the sale of goods in the course of ordinary activities is measured at the fair value of the consideration received or receivable, net of returns, trade discounts and volume rebates.
Revenue is recognized when persuasive evidence exists, usually in the form of an executed sales agreement, that the significant risks and rewards of ownership have been transferred to the cus-tomer, recovery of the consideration is probable, the associated costs and possible return of goods can be estimated reliably, there is no continuing management involvement with the goods, and the amount of revenue can be measured reliably. If it is probable that discounts will be granted and the amount can be measured reliably, then the discount is recognized as a reduction of revenue as the sales are recognized.
3-16 Rental incomeRental income is recognized in profit or loss on a straight-line basis over the term of the lease. Lease incentives granted are recognized as an integral part of the total rental income, over the term of the lease.
3-17 Finance income and finance costsFinance income comprises interest income on funds invested (including available-for-sale financial assets), dividend income, gains on the disposal of available-for-sale financial as-sets, fair value gains on financial assets at fair value through profit or loss. Interest income is recognized as it accrues in profit or loss, using the effective interest method. Dividend income received from investments is recognized in profit or loss on the date of collection.
Finance costs comprise interest expense on borrowings, fair value losses on financial assets at fair value through profit or loss, impairment losses recognized on financial assets.
Borrowing costs that are not directly attributable to the acquisition, construction or production of a qualifying asset are recognized in profit or loss using the effective interest method.
Foreign currency gains and losses are reported on a net basis as either finance income or finance cost depending on whether foreign currency movements are in a net gain or net loss position.
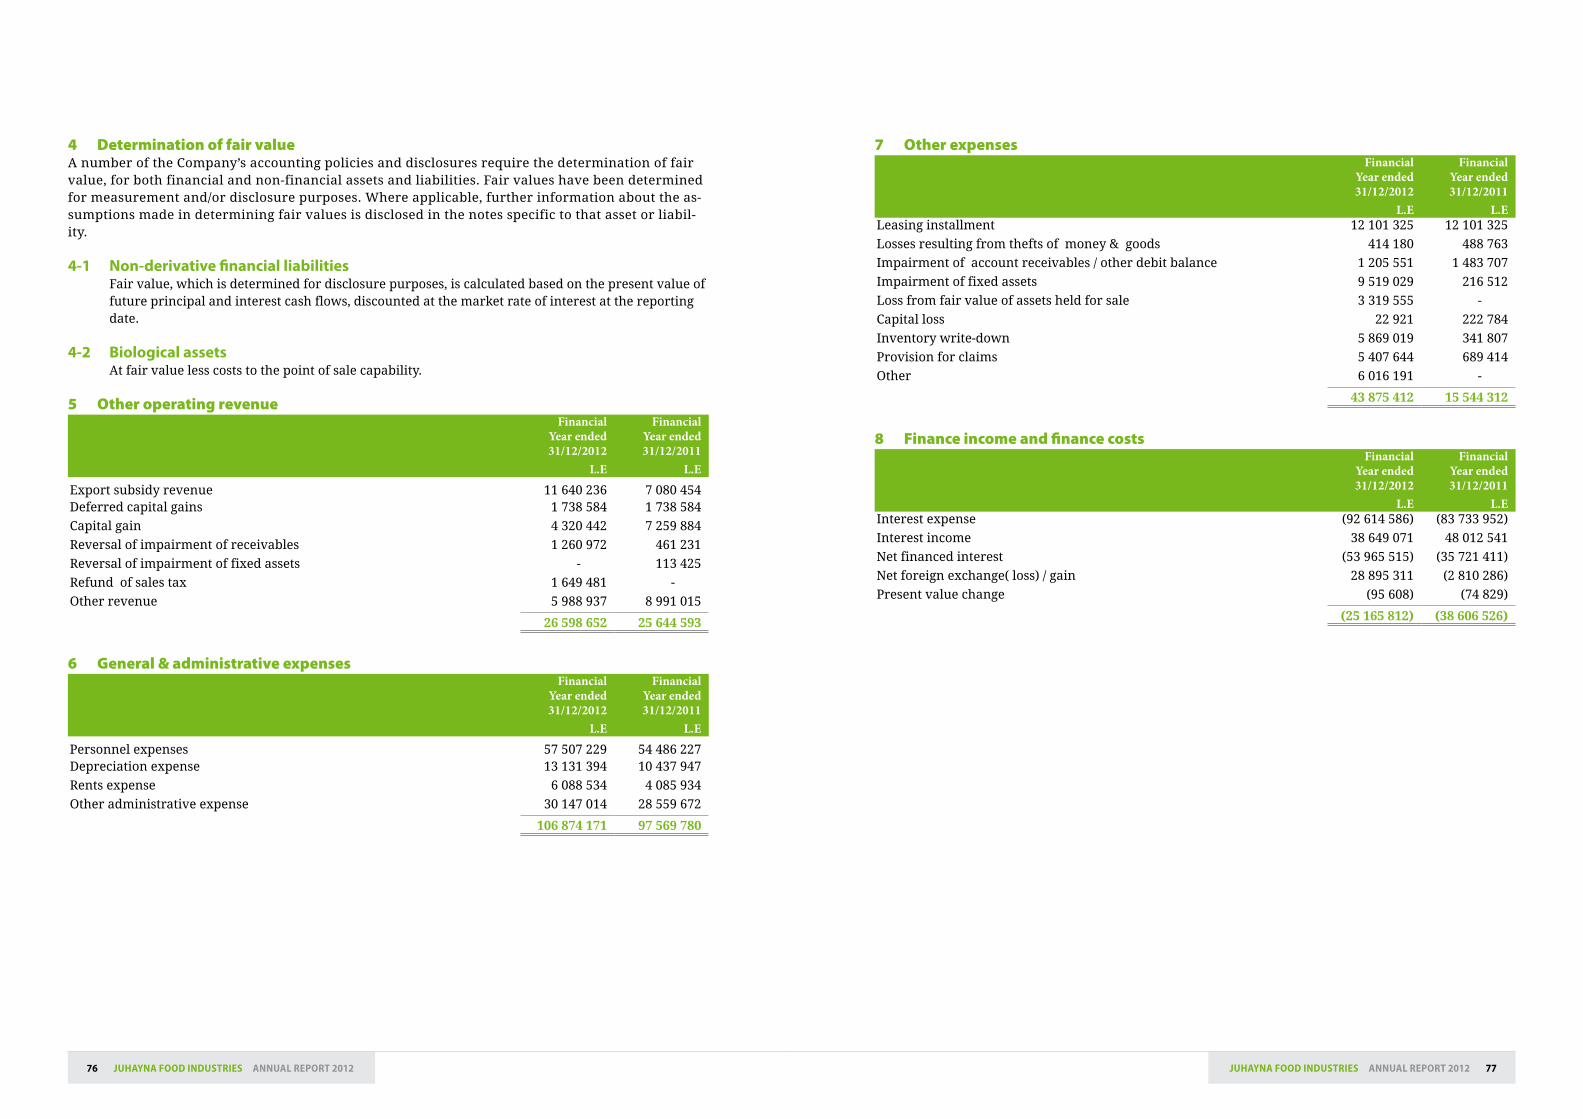
77JuhAyNA FooD INDuStrIES ANNuAL rEPort 201276 JuhAyNA FooD INDuStrIES ANNuAL rEPort 2012
7 Other expensesFinancial
Year ended 31/12/2012
L.E
Financial Year ended 31/12/2011
L.ELeasing installment 12 101 325 12 101 325
Losses resulting from thefts of money & goods 414 180 488 763
Impairment of account receivables / other debit balance 1 205 551 1 483 707
Impairment of fixed assets 9 519 029 216 512
Loss from fair value of assets held for sale 3 319 555 -
Capital loss 22 921 222 784
Inventory write-down 5 869 019 341 807
Provision for claims 5 407 644 689 414
Other 6 016 191 -
43 875 412 15 544 312
8 Finance income and finance costsFinancial
Year ended 31/12/2012
L.E
Financial Year ended 31/12/2011
L.EInterest expense (92 614 586) (83 733 952)
Interest income 38 649 071 48 012 541
Net financed interest (53 965 515) (35 721 411)
Net foreign exchange( loss) / gain 28 895 311 (2 810 286)
Present value change (95 608) (74 829)
(25 165 812) (38 606 526)
4 Determination of fair valueA number of the Company’s accounting policies and disclosures require the determination of fair value, for both financial and non-financial assets and liabilities. Fair values have been determined for measurement and/or disclosure purposes. Where applicable, further information about the as-sumptions made in determining fair values is disclosed in the notes specific to that asset or liabil-ity.
4-1 Non-derivative financial liabilitiesFair value, which is determined for disclosure purposes, is calculated based on the present value of future principal and interest cash flows, discounted at the market rate of interest at the reporting date.
4-2 Biological assetsAt fair value less costs to the point of sale capability.
5 Other operating revenue Financial
Year ended 31/12/2012
L.E
Financial Year ended 31/12/2011
L.E
Export subsidy revenue 11 640 236 7 080 454Deferred capital gains 1 738 584 1 738 584
Capital gain 4 320 442 7 259 884
Reversal of impairment of receivables 1 260 972 461 231
Reversal of impairment of fixed assets - 113 425
Refund of sales tax 1 649 481 -
Other revenue 5 988 937 8 991 015
26 598 652 25 644 593
6 General & administrative expensesFinancial
Year ended 31/12/2012
L.E
Financial Year ended 31/12/2011
L.E
Personnel expenses 57 507 229 54 486 227Depreciation expense 13 131 394 10 437 947
Rents expense 6 088 534 4 085 934
Other administrative expense 30 147 014 28 559 672
106 874 171 97 569 780
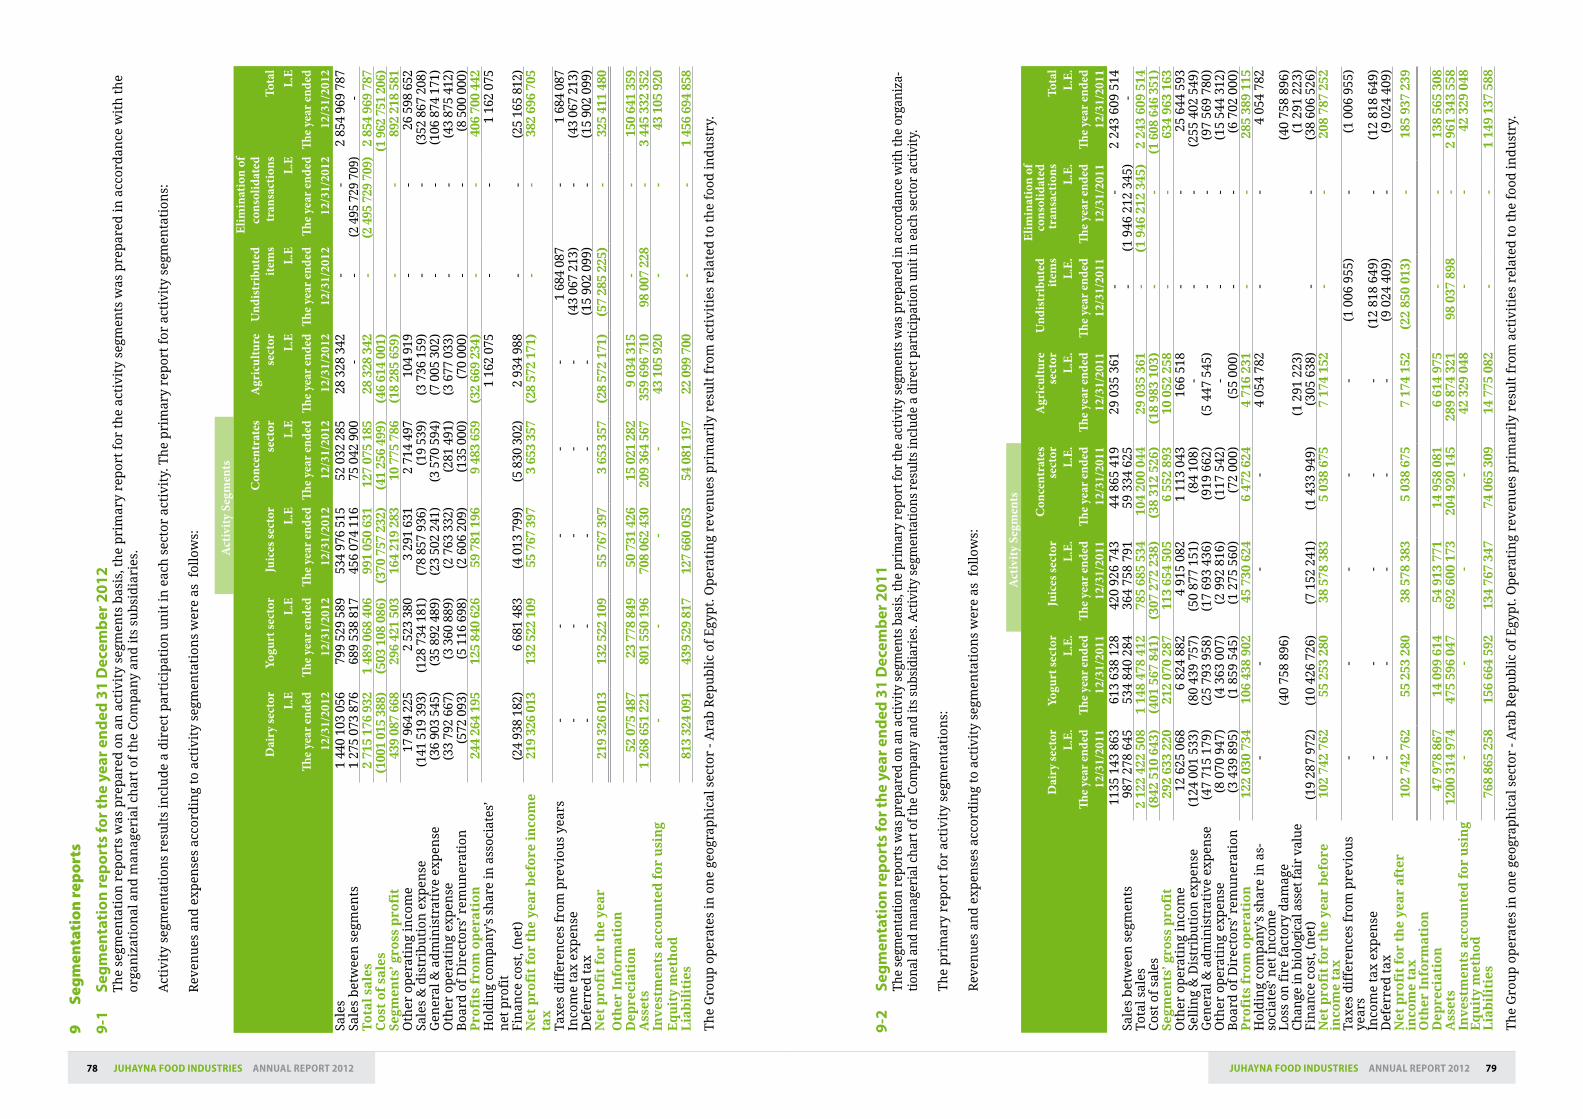
79JuhAyNA FooD INDuStrIES ANNuAL rEPort 201278 JuhAyNA FooD INDuStrIES ANNuAL rEPort 2012
Act
ivity
Seg
men
ts
Dai
ry se
ctor L.E
The
year
ende
d12
/31/
2012
Yogu
rt se
ctor L.E
The
year
ende
d12
/31/
2012
Juic
es se
ctor L.E
The
year
ende
d12
/31/
2012
Con
cent
rate
s se
ctor L.E
The
year
ende
d12
/31/
2012
Agr
icul
ture
se
ctor L.E
The
year
ende
d12
/31/
2012
Und
istr
ibut
ed
item
sL.
ETh
e ye
ar en
ded
12/3
1/20
12
Elim
inat
ion
of
cons
olid
ated
tr
ansa
ctio
ns L.E
The
year
ende
d12
/31/
2012
Tota
lL.
ETh
e ye
ar en
ded
12/3
1/20
12Sa
les
1 44
0 10
3 05
6 7
99 5
29 5
89 5
34 9
76 5
15 5
2 03
2 28
528
328
342
--
2 85
4 96
9 78
7Sa
les
bet
wee
n s
egm
ents
1 27
5 07
3 87
6 6
89 5
38 8
17 4
56 0
74 1
16 7
5 04
2 90
0-
-(2
495
729
709
)-
To
tal
sale
s2
715
176
932
1 4
89 0
68 4
0699
1 05
0 63
112
7 07
5 18
528
328
342
-(2
495
729
709
)2
854
969
787
Co
st o
f sa
les
(100
1 01
5 38
8)(5
03 1
08 0
86)
(370
757
232
)(4
1 25
6 49
9)(4
6 61
4 00
1)(1
962
751
206
)S
egm
ents
’ gro
ss p
rofi
t43
9 08
7 66
829
6 42
1 50
316
4 21
9 28
310
775
786
(18
285
659)
--
892
218
581
Oth
er o
per
atin
g in
com
e17
964
225
2 52
3 38
03
291
631
2 71
4 49
7 1
04 9
19-
-26
598
652
Sale
s &
dis
trib
uti
on e
xpen
se (1
41 5
19 3
93)
(128
734
181
) (7
8 85
7 93
6) (1
9 53
9) (3
736
159
)-
-(3
52 8
67 2
08)
Gen
eral
& a
dm
inis
trat
ive
exp
ense
(36
903
545)
(35
892
489)
(23
502
241)
(3 5
70 5
94)
(7 0
05 3
02)
--
(106
874
171
)O
ther
op
erat
ing
exp
ense
(33
792
667)
(3 3
60 8
89)
(2 7
63 3
32)
(281
491
)(3
677
033
)-
-(4
3 87
5 41
2)B
oard
of
Dir
ecto
rs’ r
emu
ner
atio
n(5
72 0
93)
(5 1
16 6
98)
(2 6
06 2
09)
(135
000
)(7
0 00
0)-
-(8
500
000
)P
rofi
ts f
rom
op
era
tio
n 2
44 2
64 1
9512
5 84
0 62
659
781
196
9 48
3 65
9(3
2 66
9 23
4)-
-40
6 70
0 44
2H
old
ing
com
pan
y’s
shar
e in
ass
ocia
tes’
n
et p
rofi
t1
162
075
--
1 16
2 07
5
Fin
ance
cos
t, (
net
)(2
4 93
8 18
2)6
681
483
(4 0
13 7
99)
(5 8
30 3
02)
2 93
4 98
8-
-(2
5 16
5 81
2)N
et p
rofi
t fo
r th
e ye
ar
bef
ore
in
com
e ta
x
219
326
013
132
522
109
55 7
67 3
973
653
357
(28
572
171)
--
382
696
705
Taxe
s d
iffe
ren
ces
from
pre
viou
s ye
ars
--
--
-1
684
087
-1
684
087
Inco
me
tax
exp
ense
--
--
-(4
3 06
7 21
3)-
(43
067
213)
Def
erre
d t
ax-
--
--
(15
902
099)
-(1
5 90
2 09
9)N
et p
rofi
t fo
r th
e ye
ar
219
326
013
132
522
109
55 7
67 3
973
653
357
(28
572
171)
(57
285
225)
-32
5 41
1 48
0O
ther
In
form
ati
on
Dep
reci
ati
on
52 0
75 4
8723
778
849
50 7
31 4
2615
021
282
9 03
4 31
5-
-15
0 64
1 35
9A
sset
s1
268
651
221
801
550
196
708
062
430
209
364
567
359
696
710
98 0
07 2
28-
3 44
5 33
2 35
2In
ves
tmen
ts a
cco
un
ted
fo
r u
sin
g E
qu
ity
met
ho
d-
--
-43
105
920
--
43 1
05 9
20
Lia
bil
itie
s81
3 32
4 09
143
9 52
9 81
712
7 66
0 05
354
081
197
22 0
99 7
00-
-1
456
694
858
Th
e G
rou
p o
per
ates
in o
ne
geog
rap
hic
al s
ecto
r - A
rab
Rep
ub
lic
of E
gyp
t. O
per
atin
g re
ven
ues
pri
mar
ily
resu
lt f
rom
act
ivit
ies
rela
ted
to
the
food
ind
ust
ry.
9 Se
gmen
tati
on re
port
s
9-1
Segm
enta
tion
repo
rts
for t
he y
ear e
nded
31
Dec
embe
r 201
2T
he
segm
enta
tion
rep
orts
was
pre
par
ed o
n a
n a
ctiv
ity
segm
ents
bas
is, t
he
pri
mar
y re
por
t fo
r th
e ac
tivi
ty s
egm
ents
was
pre
par
ed in
acc
ord
ance
wit
h t
he
orga
niz
atio
nal
an
d m
anag
eria
l ch
art
of t
he
Com
pan
y an
d it
s su
bsi
dia
ries
.
Act
ivit
y se
gmen
tati
ons
resu
lts
incl
ud
e a
dir
ect
par
tici
pat
ion
un
it in
eac
h s
ecto
r ac
tivi
ty. T
he
pri
mar
y re
por
t fo
r ac
tivi
ty s
egm
enta
tion
s:
Rev
enu
es a
nd
exp
ense
s ac
cord
ing
to a
ctiv
ity
segm
enta
tion
s w
ere
as f
ollo
ws:
Act
ivity
Seg
men
ts
Dai
ry se
ctor
L.E.
The
year
ende
d12
/31/
2011
Yogu
rt se
ctor
L.E.
The
year
ende
d12
/31/
2011
Juic
es se
ctor
L.E.
The
year
ende
d12
/31/
2011
Con
cent
rate
s se
ctor
L.E.
The
year
ende
d12
/31/
2011
Agr
icul
ture
se
ctor
L.E.
The
year
ende
d12
/31/
2011
Und
istr
ibut
ed
item
sL.
E.Th
e ye
ar en
ded
12/3
1/20
11
Elim
inat
ion
of
cons
olid
ated
tr
ansa
ctio
nsL.
E.Th
e ye
ar en
ded
12/3
1/20
11
Tota
lL.
E.Th
e ye
ar en
ded
12/3
1/20
11Sa
les
1135
143
863
613
638
128
420
926
743
44 8
65 4
1929
035
361
--
2 24
3 60
9 51
4Sa
les
bet
wee
n s
egm
ents
987
278
645
534
840
284
364
758
791
59 3
34 6
25-
(1 9
46 2
12 3
45)
-To
tal s
ales
2 12
2 42
2 50
81
148
478
412
785
685
534
104
200
044
29 0
35 3
61-
(1 9
46 2
12 3
45)
2 2
43 6
09 5
14C
ost
of s
ales
(8
42 5
10 6
43)
(401
567
841
)(3
07 2
72 2
38)
(38
312
526)
(18
983
103)
--
(1 6
08 6
46 3
51)
Seg
men
ts’ g
ross
pro
fit
292
633
220
212
070
287
113
654
505
6 55
2 89
310
052
258
--
634
963
163
Oth
er o
per
atin
g in
com
e12
625
068
6 82
4 88
24
915
082
1 11
3 04
316
6 51
8-
-25
644
593
Sell
ing
& D
istr
ibu
tion
exp
ense
(124
001
533
)(8
0 43
9 75
7)(5
0 87
7 15
1)(8
4 10
8)-
--
(255
402
549
)G
ener
al &
ad
min
istr
ativ
e ex
pen
se(4
7 71
5 17
9)(2
5 79
3 95
8)(1
7 69
3 43
6)(9
19 6
62)
(5 4
47 5
45)
--
(97
569
780)
Oth
er o
per
atin
g ex
pen
se(8
070
947
)(4
363
007
)(2
992
816
)(1
17 5
42)
--
-(1
5 54
4 31
2)B
oard
of
Dir
ecto
rs’ r
emu
ner
atio
n(3
439
895
)(1
859
545
)(1
275
560
)(7
2 00
0)(5
5 00
0)-
-(6
702
000
)P
rofi
ts f
rom
op
era
tio
n12
2 03
0 73
410
6 43
8 90
245
730
624
6 47
2 62
44
716
231
--
285
389
115
Hol
din
g co
mp
any’
s sh
are
in a
s-so
ciat
es’ n
et in
com
e -
--
-4
054
782
--
4 05
4 78
2
Los
s on
fir
e fa
ctor
y d
amag
e (4
0 75
8 89
6)(4
0 75
8 89
6)C
han
ge in
bio
logi
cal a
sset
fai
r va
lue
(1 2
91 2
23)
(1 2
91 2
23)
Fin
ance
cos
t, (
net
)(1
9 28
7 97
2)(1
0 42
6 72
6)(7
152
241
)(1
433
949
)(3
05 6
38)
--
(38
606
526)
Net
pro
fit
for
the
yea
r b
efo
re
inco
me
tax
10
2 74
2 76
255
253
280
38 5
78 3
835
038
675
7 17
4 15
2-
-20
8 78
7 25
2
Taxe
s d
iffe
ren
ces
from
pre
viou
s ye
ars
--
--
-(1
006
955
)-
(1 0
06 9
55)
Inco
me
tax
exp
ense
--
--
-(1
2 81
8 64
9)-
(12
818
649)
Def
erre
d t
ax-
--
--
(9 0
24 4
09)
-(9
024
409
)N
et p
rofi
t fo
r th
e ye
ar
aft
er
inco
me
tax
10
2 74
2 76
255
253
280
38 5
78 3
835
038
675
7 17
4 15
2(2
2 85
0 01
3)-
185
937
239
Oth
er I
nfo
rma
tio
nD
epre
cia
tio
n47
978
867
14 0
99 6
1454
913
771
14 9
58 0
816
614
975
--
138
565
308
Ass
ets
1200
314
974
475
596
047
692
600
173
204
920
145
289
874
321
98 0
37 8
98-
2 96
1 34
3 55
8In
ves
tmen
ts a
cco
un
ted
fo
r u
sin
g E
qu
ity
met
ho
d-
--
-42
329
048
--
42 3
29 0
48
Lia
bil
itie
s76
8 86
5 25
815
6 66
4 59
213
4 76
7 34
774
065
309
14 7
75 0
82-
-1
149
137
588
Th
e G
rou
p o
per
ates
in o
ne
geog
rap
hic
al s
ecto
r - A
rab
Rep
ub
lic
of E
gyp
t. O
per
atin
g re
ven
ues
pri
mar
ily
resu
lt f
rom
act
ivit
ies
rela
ted
to
the
food
ind
ust
ry.
9-2
Segm
enta
tion
repo
rts
for t
he y
ear e
nded
31
Dec
embe
r 201
1Th
e se
gmen
tati
on r
epor
ts w
as p
repa
red
on a
n a
ctiv
ity
segm
ents
bas
is, t
he
prim
ary
repo
rt fo
r th
e ac
tivi
ty s
egm
ents
was
pre
pare
d in
acc
orda
nce
wit
h th
e or
gan
iza-
tion
al a
nd
man
ager
ial c
har
t of t
he
Com
pan
y an
d it
s su
bsid
iari
es. A
ctiv
ity
segm
enta
tion
s re
sult
s in
clu
de a
dir
ect p
arti
cipa
tion
un
it in
eac
h s
ecto
r ac
tivi
ty.
Th
e p
rim
ary
rep
ort
for
acti
vity
seg
men
tati
ons:
Rev
enu
es a
nd
exp
ense
s ac
cord
ing
to a
ctiv
ity
segm
enta
tion
s w
ere
as f
ollo
ws:
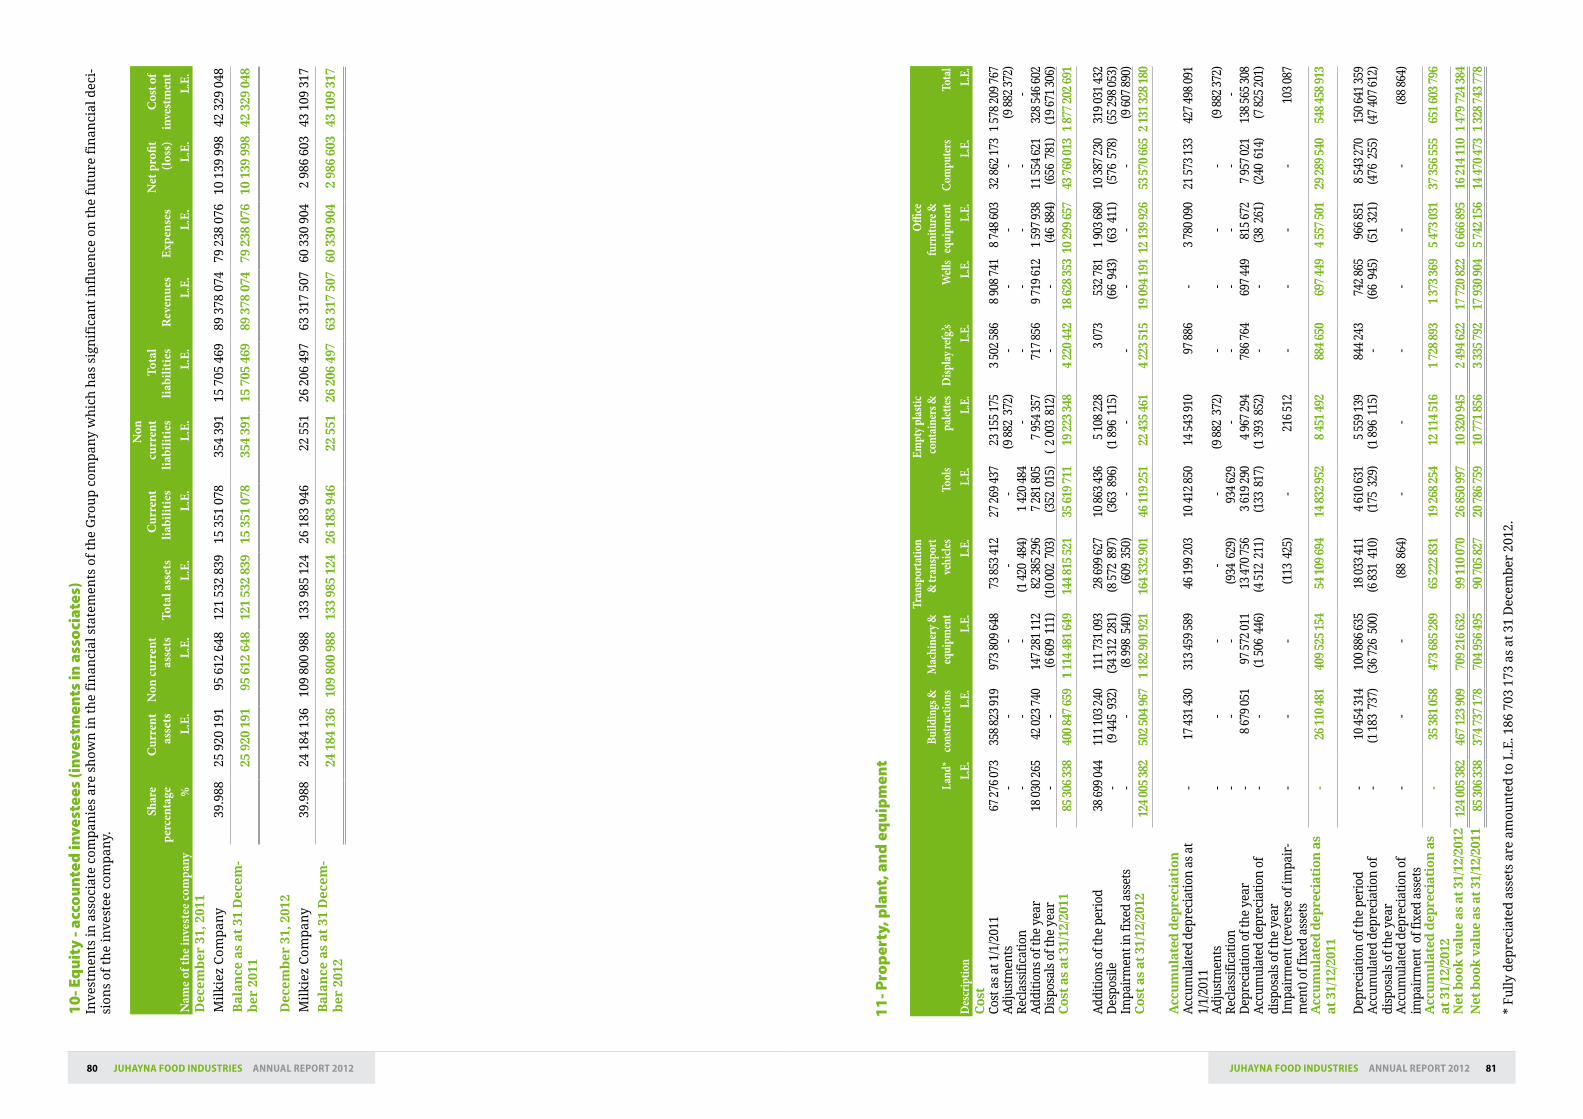
81JuhAyNA FooD INDuStrIES ANNuAL rEPort 201280 JuhAyNA FooD INDuStrIES ANNuAL rEPort 2012
Nam
e of
the
inve
stee
com
pany
Shar
e pe
rcen
tage %
Cur
rent
as
sets
L.E.
Non
curr
ent
asse
tsL.
E.To
tal a
sset
sL.
E.
Cur
rent
lia
bilit
ies
L.E.
Non
cu
rren
t lia
bilit
ies
L.E.
Tota
l lia
bilit
ies
L.E.
Rev
enue
sL.
E.Ex
pens
esL.
E.
Net
pro
fit
(loss
)L.
E.
Cos
t of
inve
stm
ent
L.E.
Dec
emb
er 3
1, 2
011
Mil
kiez
Com
pan
y39
.988
25 9
20 1
9195
612
648
121
532
839
15 3
51 0
7835
4 39
115
705
469
89 3
78 0
7479
238
076
10 1
39 9
9842
329
048
Ba
lan
ce a
s a
t 31
Dec
em-
ber
201
125
920
191
95 6
12 6
4812
1 53
2 83
915
351
078
354
391
15 7
05 4
6989
378
074
79 2
38 0
7610
139
998
42 3
29 0
48
Dec
emb
er 3
1, 2
012
Mil
kiez
Com
pan
y39
.988
24 1
84 1
3610
9 80
0 98
813
3 98
5 12
426
183
946
22 5
5126
206
497
63 3
17 5
0760
330
904
2 98
6 60
343
109
317
Ba
lan
ce a
s a
t 31
Dec
em-
ber
201
224
184
136
109
800
988
133
985
124
26 1
83 9
4622
551
26 2
06 4
9763
317
507
60 3
30 9
042
986
603
43 1
09 3
17
10- E
quit
y - a
ccou
nted
inve
stee
s (in
vest
men
ts in
ass
ocia
tes)
In
vest
men
ts in
ass
ocia
te c
omp
anie
s ar
e sh
own
in t
he
fin
anci
al s
tate
men
ts o
f th
e G
rou
p c
omp
any
wh
ich
has
sig
nif
ican
t in
flu
ence
on
th
e fu
ture
fin
anci
al d
eci-
sion
s of
th
e in
vest
ee c
omp
any.
Des
crip
tion
Land
*L.
E.
Build
ings
&
cons
tructi
ons
L.E.
Mac
hine
ry &
eq
uipm
ent
L.E.
Tran
spor
tatio
n &
trans
port
ve
hicle
s L.
E.To
ols
L.E.
Empt
y plas
tic
cont
ainer
s &
palet
tes
L.E.
Disp
lay re
fg.’s
L.E.
Well
sL.
E.
Offi
ce
furn
iture
&
equi
pmen
t L.
E.Co
mpu
ters
L.E.
Tota
lL.
E.C
ost
Cost
as
at 1
/1/2
011
67 2
76 0
73
358
823
919
973
809
648
73 8
53 4
12
27 2
69 4
37
23 1
55 1
75
3 50
2 58
6 8
908
741
8 74
8 60
3 32
862
173
1 5
78 2
09 7
67A
djus
tmen
ts-
--
--
(9 8
82 3
72)
--
--
(9 8
82 3
72)
Rec
lass
ific
atio
n-
--
(1 4
20 4
84)
1 42
0 48
4 -
--
--
-A
ddit
ion
s of
the
year
18 0
30 2
65
42 0
23 7
40
147
281
112
82 3
85 2
96
7 28
1 80
5 7
954
357
717
856
9 71
9 61
2 1
597
938
11 5
54 6
21
328
546
602
Dis
posa
ls o
f the
yea
r -
-(6
609
111
)(1
0 00
2 7
03)
(352
015
)(
2 00
3 8
12)
--
(46
884
)(6
56 7
81)
(19
671
306)
Co
st a
s at
31/
12/2
011
85 3
06 3
3840
0 84
7 65
91
114
481
649
144
815
521
35 6
19 7
1119
223
348
4 22
0 44
218
628
353
10 2
99 6
57 4
3 76
0 01
31
877
202
691
Add
itio
ns
of th
e pe
riod
38 6
99 0
44
111
103
240
111
731
093
28 6
99 6
27
10 8
63 4
36
5 10
8 22
8 3
073
532
781
1 90
3 68
0 10
387
230
31
9 03
1 43
2D
espo
sile
-
(9 4
45 9
32)
(34
312
281
)(8
572
897
)(3
63 8
96)
(1 8
96 1
15)
(66
943
)(6
3 4
11)
(576
578
)(5
5 29
8 05
3)Im
pair
men
t in
fixe
d as
sets
--
(8 9
98 5
40)
(609
350
)-
--
--
-(9
607
890
)C
ost
as
at 3
1/12
/201
212
4 00
5 38
250
2 50
4 96
71
182
901
921
164
332
901
46 1
19 2
5122
435
461
4 22
3 51
519
094
191
12 1
39 9
2653
570
665
2 13
1 32
8 18
0
Acc
um
ula
ted
dep
reci
atio
nA
ccum
ulat
ed d
epre
ciat
ion
as
at
1/1/
2011
-17
431
430
31
3 45
9 58
9 46
199
203
10
412
850
14
543
910
97
886
-
3 78
0 09
0 21
573
133
42
7 49
8 09
1
Adj
ustm
ents
--
--
-(9
882
372
)-
--
- (9
882
372
)R
ecla
ssif
icat
ion
--
-(9
34 6
29)
934
629
--
--
--
Dep
reci
atio
n o
f the
yea
r
-8
679
051
97 5
72 0
11
13 4
70 7
56
3 61
9 29
0 4
967
294
786
764
697
449
815
672
7 95
7 02
1 13
8 56
5 30
8A
ccum
ulat
ed d
epre
ciat
ion
of
disp
osal
s of
the
year
-
-(1
506
446
)(4
512
211
)(1
33 8
17)
(1 3
93 8
52)
--
(38
261
)(2
40 6
14)
(7 8
25 2
01)
Impa
irm
ent (
reve
rse
of im
pair
-m
ent)
of f
ixed
ass
ets
--
-(1
13 4
25)
-21
6 51
2 -
--
-10
3 08
7
Acc
um
ula
ted
dep
reci
atio
n a
s at
31/
12/2
011
-26
110
481
409
525
154
54 1
09 6
9414
832
952
8 45
1 49
288
4 65
0 6
97 4
49 4
557
501
29
289
540
548
458
913
Dep
reci
atio
n o
f the
per
iod
-10
454
314
10
0 88
6 63
5 18
033
411
4
610
631
5 55
9 13
9 84
4 24
3 74
2 86
5 96
6 85
1 8
543
270
150
641
359
Acc
umul
ated
dep
reci
atio
n o
f di
spos
als
of th
e ye
ar-
(1 1
83 7
37)
(36
726
500
)(6
831
410
)(1
75 3
29)
(1 8
96 1
15)
-(6
6 9
45)
(51
321
)(4
76 2
55)
(47
407
612)
Acc
umul
ated
dep
reci
atio
n o
f im
pair
men
t of
fixe
d as
sets
--
-(8
8 8
64)
--
--
--
(88
864)
Acc
um
ula
ted
dep
reci
atio
n a
s at
31/
12/2
012
-35
381
058
473
685
289
65 2
22 8
3119
268
254
12 1
14 5
161
728
893
1 37
3 36
95
473
031
37 3
56 5
5565
1 60
3 79
6
Net
bo
ok
val
ue
as a
t 31
/12/
2012
124
005
382
467
123
909
709
216
632
99 1
10 0
7026
850
997
10 3
20 9
452
494
622
17 7
20 8
226
666
895
16 2
14 1
101
479
724
384
Net
bo
ok
val
ue
as a
t 31
/12/
2011
85 3
06 3
3837
4 73
7 17
870
4 95
6 49
590
705
827
20 7
86 7
5910
771
856
3 33
5 79
217
930
904
5 74
2 15
614
470
473
1 32
8 74
3 77
8
* Fu
lly
dep
reci
ated
ass
ets
are
amou
nte
d t
o L
.E. 1
86 7
03 1
73 a
s at
31
Dec
emb
er 2
012.
11- P
rope
rty,
pla
nt, a
nd e
quip
men
t

83JuhAyNA FooD INDuStrIES ANNuAL rEPort 201282 JuhAyNA FooD INDuStrIES ANNuAL rEPort 2012
• Areaof7500AcresonFarafrazoneamountedtoL.E3750000withpurpose–only-ofcultiva-tion with the virtue of bank cheque no. 1472844 dated September 14, 2009 for the beneficiary the head of the centre office of Farafra city. The necessary legal procedures for convey of land are in progress.
11-8 land of Inmaa for Biological Wealth• Areaof550AcresamountedtoL.E550000inthevirtueofacontractwiththesquatterdatedMay
4, 2010. The necessary legal procedures with government for legal convey of land are in progress.
11-9 Land of Inmaa for Agriculture Development• Areaof1450AcresamountedtoL.E1450000inthevirtueofacontractwiththesquatterdated
May 4, 2010. The necessary legal procedures with government for legal convey of land are in progress.
• Areaof2000AcresamountedtoL.E1200000inthevirtueofacontractwiththesquatterdatedMay 5, 2010. The necessary legal procedures with government for legal convey of land are in progress.
• Areaof3146AcresamountedtoL.E4719000inthevirtueofacontractwiththesquatterdatedSeptember 5, 2010. The necessary legal procedures with government for legal convey of land are in progress.
• Areaof980AcresamounttoL.E870000inthevirtueofacontractwiththesquatterdatedJanu-ary 27, 2011. The necessary legal procedures with government for legal convey of land are in progress.
• Areaof700AcresamounttoL.E1269750inthevirtueofacontractwiththesquatterdatedJanuary 3, 2012. The necessary legal procedures with government for legal convey of land are in progress.
11-10 Changes in Accounting estimated for Fixed Assets (cars) Enma company for agriculture development & biological wealth (subsidiary company) held a test on the ending period 30 June 2012 for operating assets where the company owned this test result on change the useful life and economic benefits that estimated for this type of assets and became expected that it will going to produce for a period more than the determined period before which lead to increase the useful life for this assets
Confirmation done by the effect of this changes during the current period & further period on the depreciation expense which stated in the income statement as an expense
2012225 219(Decrease) in depreciation expense
Tiba company for trade and distribution (subsidiary company ) held attest for operating the cars where the company owned on 31 December 2011 this test result on change the useful life and economic benefits that estimated for this type of assets which board of directors are going to sell it after 5 years and became estimated that its going to produce for 8 years from date of purchased which lead to increase useful life for the cars.
Confirmation done by the effect of this changes during the year 2011 and 2012 on the depreciation expense which stated in the income statement as an expense
201120127 543 8635 464 529(Decrease) in depreciation expense
The land item amounted to L.E 124 005 382 on 31/12/2012 includes an amount of L.E 107 611 779 representing the not registered land thus procedures of registering the land are in progress.
11-1 Land of Juhayna Food Industries Co.
DescriptionAmount
L.EInstrumentof possess
Service koridor No.1 1 072 585 Registration document
Service koridor No.2 803 205 Registration document
Marsa Allam 1 367 244 Preliminary contract
Other 1 005 171
4 248 205
11-2 Land of Tiba for Trad. & Distr. Co.
DescriptionAmount
L.EInstrumentof possess
New Mansheya (Alex.) Land 25 715 403 Preliminary contract
Baleares land 15 495 080 Preliminary contract
Olaykat Arab land 2 589 300 Auction
Other 21 963 839
65 763 622
11-3 Land of Aldawlia for Modern Industries Co.
DescriptionAmount
L.EInstrumentof possess
Pc. 112:118 m3 6th of October 11 060 593 Registration document
11-4 Land of Almarwa for Food Industries Co.
DescriptionAmount
L.EInstrumentof possess
Pc. 43 m4 6th of October 2 117 918 Deed
11-5 Land of Almasrya Co. (Egyfood)
DescriptionAmount
L.EInstrumentof possess
Pc. 19 A, 9 B m3 6th of October 2 241 861 Registration document
Alsada Land 2 611 004 Registration document
4 852 865
11-6 Land of Modern Concentration Co.
DescriptionAmount
L.EInstrumentof possess
Pc. 42 m4 6th of October 4 333 446 Deed
11-7 Land of Inmaa for Agriculture Development & Biological wealth
The Land item includes as follows:• Areaof2500AcresonFarafrazoneamountedtoL.E1426380withthevirtueofpreliminary
contract from Alwadi Algadeed governorate with purpose – only - of reclamation and cultivation.
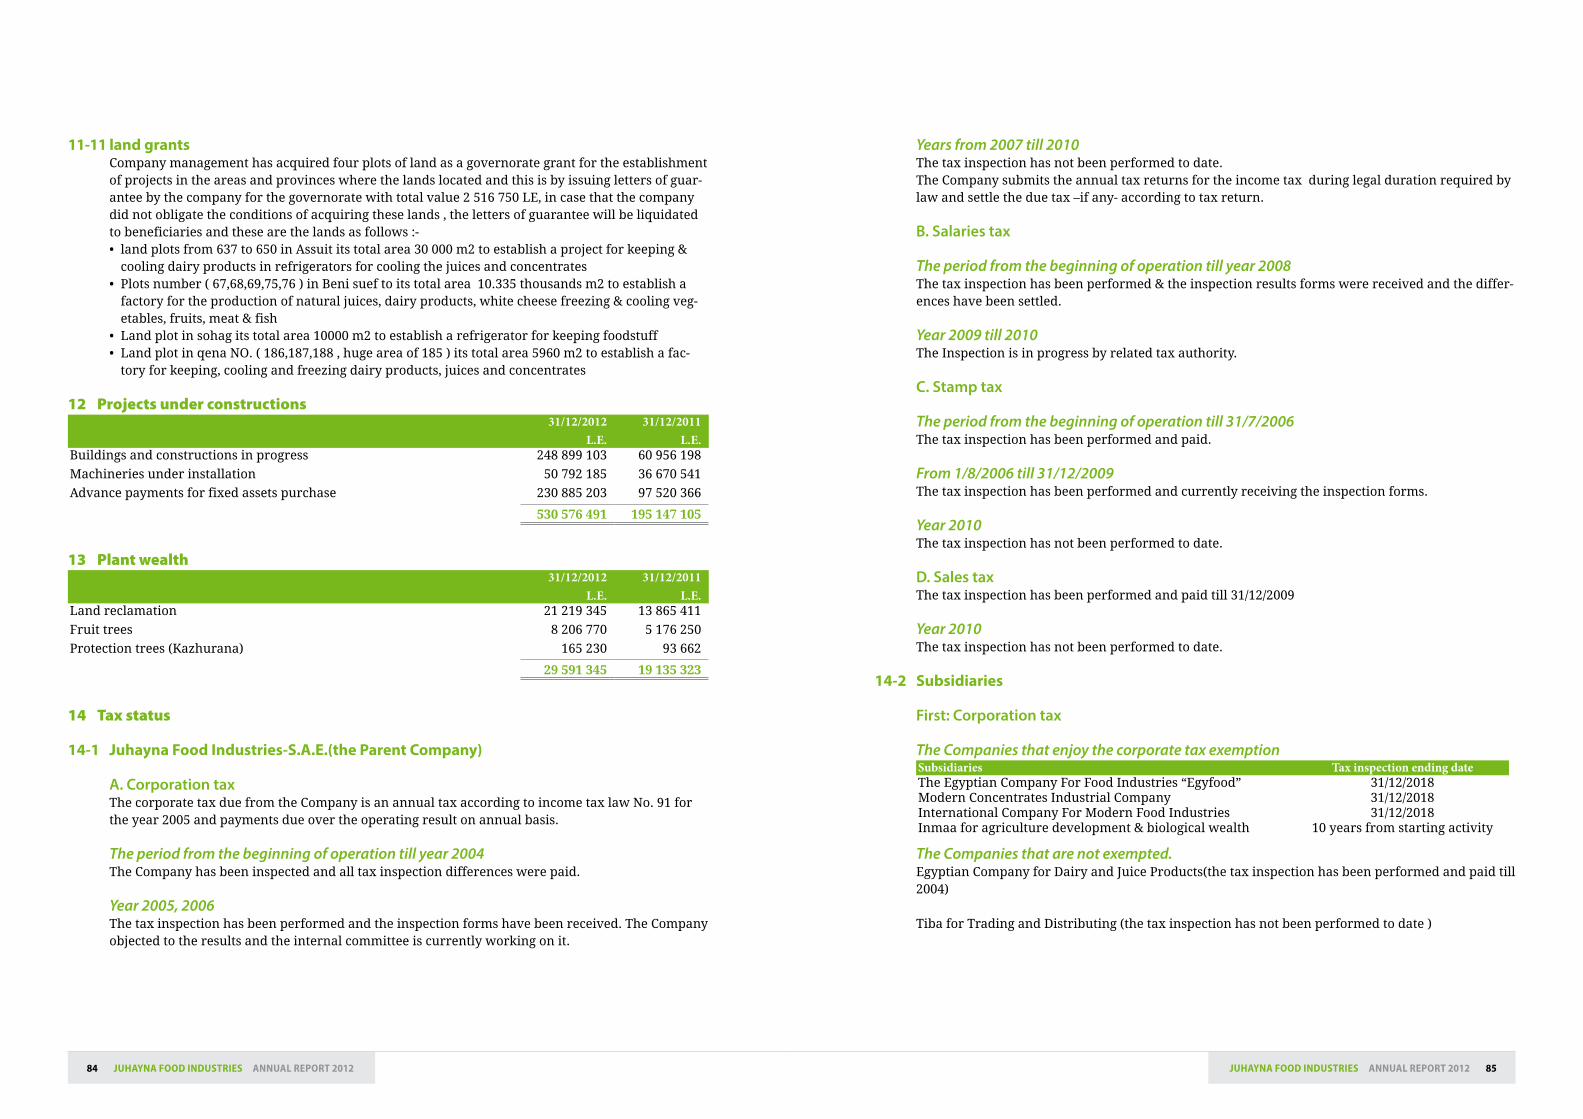
85JuhAyNA FooD INDuStrIES ANNuAL rEPort 201284 JuhAyNA FooD INDuStrIES ANNuAL rEPort 2012
Years from 2007 till 2010 The tax inspection has not been performed to date.The Company submits the annual tax returns for the income tax during legal duration required by law and settle the due tax –if any- according to tax return.
B. Salaries tax
The period from the beginning of operation till year 2008The tax inspection has been performed & the inspection results forms were received and the differ-ences have been settled.
Year 2009 till 2010The Inspection is in progress by related tax authority.
C. Stamp tax
The period from the beginning of operation till 31/7/2006The tax inspection has been performed and paid.
From 1/8/2006 till 31/12/2009The tax inspection has been performed and currently receiving the inspection forms.
Year 2010The tax inspection has not been performed to date.
D. Sales taxThe tax inspection has been performed and paid till 31/12/2009
Year 2010The tax inspection has not been performed to date.
14-2 Subsidiaries
First: Corporation tax
The Companies that enjoy the corporate tax exemptionSubsidiaries Tax inspection ending dateThe Egyptian Company For Food Industries “Egyfood” 31/12/2018Modern Concentrates Industrial Company 31/12/2018International Company For Modern Food Industries 31/12/2018Inmaa for agriculture development & biological wealth 10 years from starting activity
The Companies that are not exempted.Egyptian Company for Dairy and Juice Products(the tax inspection has been performed and paid till 2004)
Tiba for Trading and Distributing (the tax inspection has not been performed to date )
11-11 land grantsCompany management has acquired four plots of land as a governorate grant for the establishment of projects in the areas and provinces where the lands located and this is by issuing letters of guar-antee by the company for the governorate with total value 2 516 750 LE, in case that the company did not obligate the conditions of acquiring these lands , the letters of guarantee will be liquidated to beneficiaries and these are the lands as follows :- • landplotsfrom637to650inAssuititstotalarea30000m2toestablishaprojectforkeeping&
cooling dairy products in refrigerators for cooling the juices and concentrates • Plotsnumber(67,68,69,75,76)inBenisueftoitstotalarea10.335thousandsm2toestablisha
factory for the production of natural juices, dairy products, white cheese freezing & cooling veg-etables, fruits, meat & fish
• Landplotinsohagitstotalarea10000m2toestablisharefrigeratorforkeepingfoodstuff• LandplotinqenaNO.(186,187,188,hugeareaof185)itstotalarea5960m2toestablishafac-
tory for keeping, cooling and freezing dairy products, juices and concentrates
12 Projects under constructions31/12/2012
L.E.31/12/2011
L.E.Buildings and constructions in progress 248 899 103 60 956 198
Machineries under installation 50 792 185 36 670 541
Advance payments for fixed assets purchase 230 885 203 97 520 366
530 576 491 195 147 105
13 Plant wealth31/12/2012
L.E.31/12/2011
L.E.Land reclamation 21 219 345 13 865 411
Fruit trees 8 206 770 5 176 250
Protection trees (Kazhurana) 165 230 93 662
29 591 345 19 135 323
14 Tax status
14-1 Juhayna Food Industries-S.A.E.(the Parent Company)
A. Corporation taxThe corporate tax due from the Company is an annual tax according to income tax law No. 91 for the year 2005 and payments due over the operating result on annual basis.
The period from the beginning of operation till year 2004The Company has been inspected and all tax inspection differences were paid.
Year 2005, 2006The tax inspection has been performed and the inspection forms have been received. The Company objected to the results and the internal committee is currently working on it.
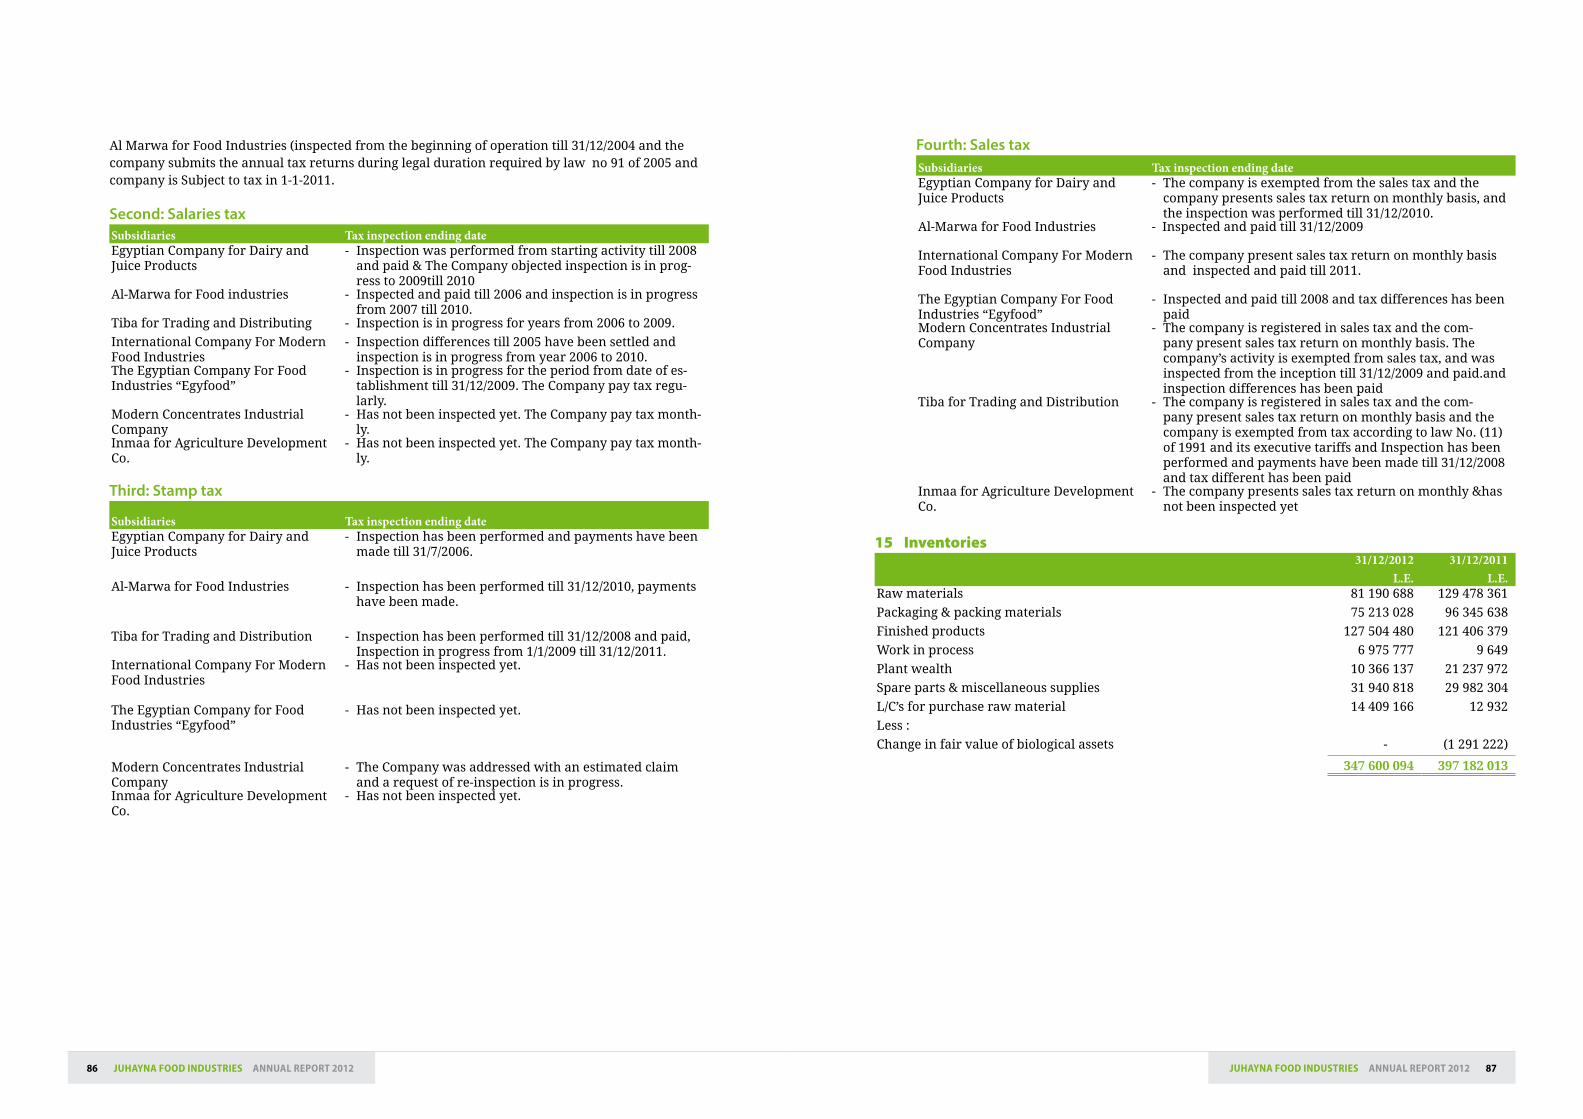
87JuhAyNA FooD INDuStrIES ANNuAL rEPort 201286 JuhAyNA FooD INDuStrIES ANNuAL rEPort 2012
Fourth: Sales taxSubsidiaries Tax inspection ending dateEgyptian Company for Dairy and Juice Products
- The company is exempted from the sales tax and the company presents sales tax return on monthly basis, and the inspection was performed till 31/12/2010.
Al-Marwa for Food Industries - Inspected and paid till 31/12/2009
International Company For Modern Food Industries
- The company present sales tax return on monthly basis and inspected and paid till 2011.
The Egyptian Company For Food Industries “Egyfood”
- Inspected and paid till 2008 and tax differences has been paid
Modern Concentrates Industrial Company
- The company is registered in sales tax and the com-pany present sales tax return on monthly basis. The company’s activity is exempted from sales tax, and was inspected from the inception till 31/12/2009 and paid.and inspection differences has been paid
Tiba for Trading and Distribution - The company is registered in sales tax and the com-pany present sales tax return on monthly basis and the company is exempted from tax according to law No. (11) of 1991 and its executive tariffs and Inspection has been performed and payments have been made till 31/12/2008 and tax different has been paid
Inmaa for Agriculture Development Co.
- The company presents sales tax return on monthly &has not been inspected yet
15 Inventories
31/12/2012
L.E.31/12/2011
L.E.Raw materials 81 190 688 129 478 361
Packaging & packing materials 75 213 028 96 345 638
Finished products 127 504 480 121 406 379
Work in process 6 975 777 9 649
Plant wealth 10 366 137 21 237 972
Spare parts & miscellaneous supplies 31 940 818 29 982 304
L/C’s for purchase raw material 14 409 166 12 932
Less :
Change in fair value of biological assets - (1 291 222)
347 600 094 397 182 013
Al Marwa for Food Industries (inspected from the beginning of operation till 31/12/2004 and the company submits the annual tax returns during legal duration required by law no 91 of 2005 and company is Subject to tax in 1-1-2011.
Second: Salaries taxSubsidiaries Tax inspection ending dateEgyptian Company for Dairy and Juice Products
- Inspection was performed from starting activity till 2008 and paid & The Company objected inspection is in prog-ress to 2009till 2010
Al-Marwa for Food industries - Inspected and paid till 2006 and inspection is in progress from 2007 till 2010.
Tiba for Trading and Distributing - Inspection is in progress for years from 2006 to 2009.
International Company For Modern Food Industries
- Inspection differences till 2005 have been settled and inspection is in progress from year 2006 to 2010.
The Egyptian Company For Food Industries “Egyfood”
- Inspection is in progress for the period from date of es-tablishment till 31/12/2009. The Company pay tax regu-larly.
Modern Concentrates Industrial Company
- Has not been inspected yet. The Company pay tax month-ly.
Inmaa for Agriculture Development Co.
- Has not been inspected yet. The Company pay tax month-ly.
Third: Stamp tax
Subsidiaries Tax inspection ending dateEgyptian Company for Dairy and Juice Products
- Inspection has been performed and payments have been made till 31/7/2006.
Al-Marwa for Food Industries - Inspection has been performed till 31/12/2010, payments have been made.
Tiba for Trading and Distribution - Inspection has been performed till 31/12/2008 and paid, Inspection in progress from 1/1/2009 till 31/12/2011.
International Company For Modern Food Industries
- Has not been inspected yet.
The Egyptian Company for Food Industries “Egyfood”
- Has not been inspected yet.
Modern Concentrates Industrial Company
- The Company was addressed with an estimated claim and a request of re-inspection is in progress.
Inmaa for Agriculture Development Co.
- Has not been inspected yet.
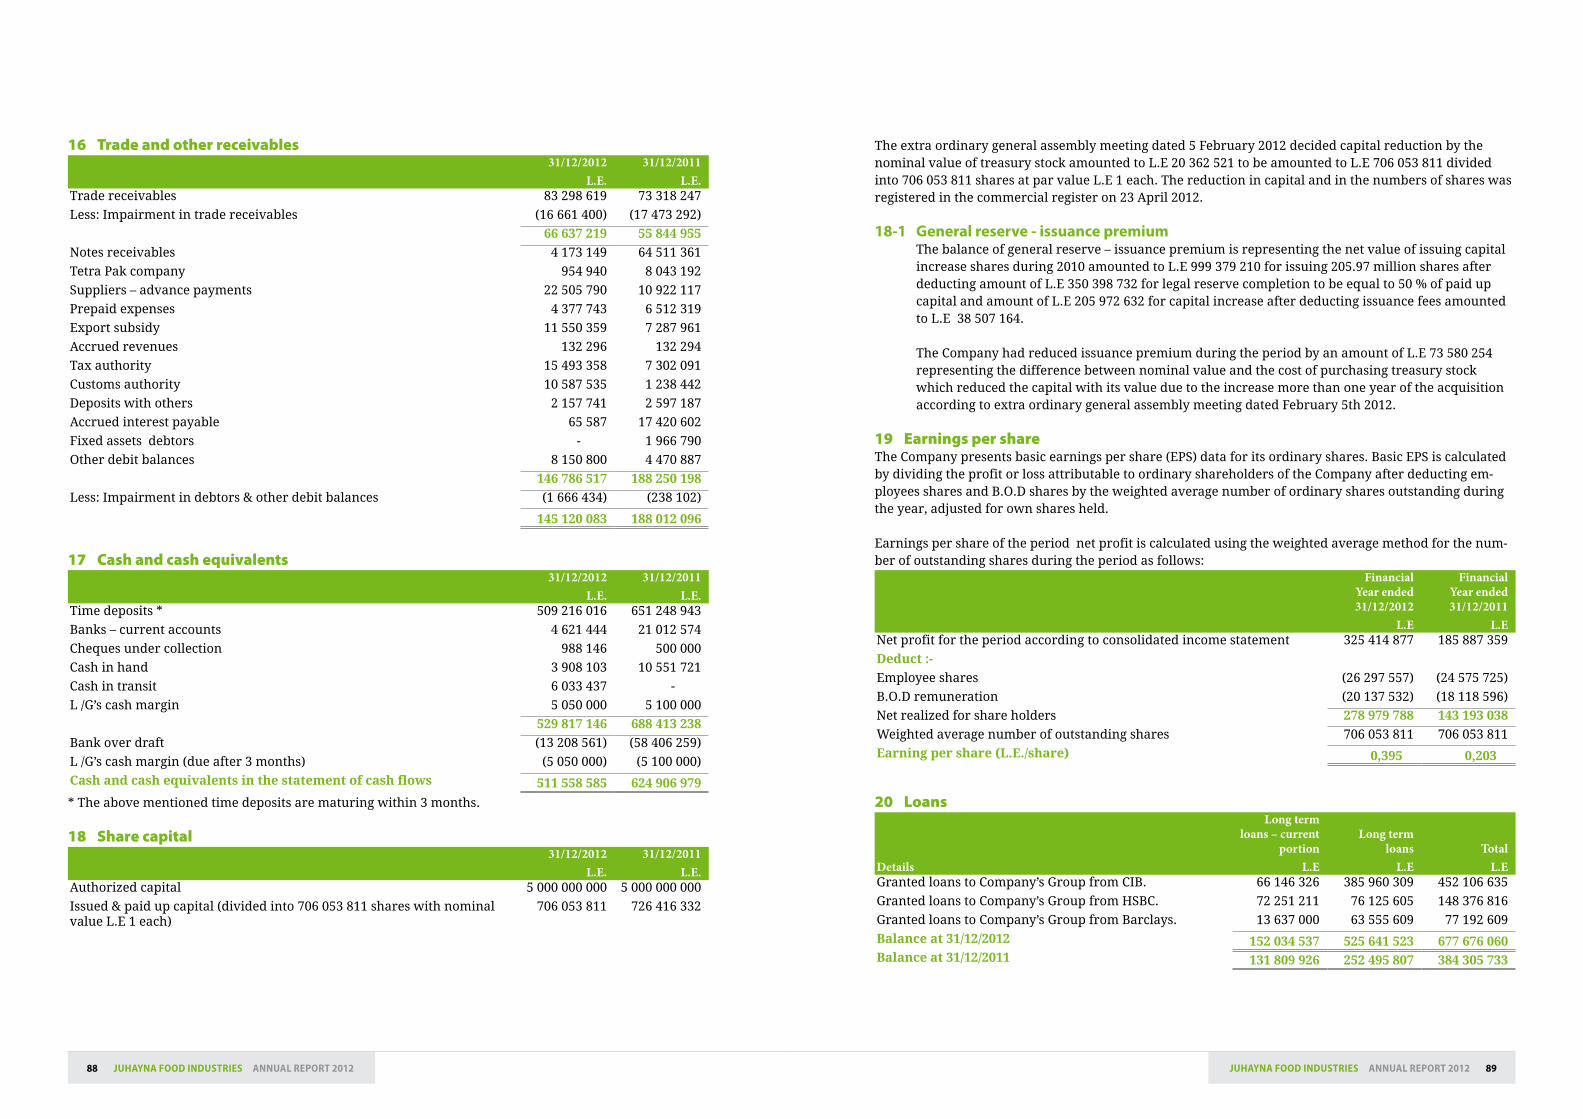
89JuhAyNA FooD INDuStrIES ANNuAL rEPort 201288 JuhAyNA FooD INDuStrIES ANNuAL rEPort 2012
The extra ordinary general assembly meeting dated 5 February 2012 decided capital reduction by the nominal value of treasury stock amounted to L.E 20 362 521 to be amounted to L.E 706 053 811 divided into 706 053 811 shares at par value L.E 1 each. The reduction in capital and in the numbers of shares was registered in the commercial register on 23 April 2012.
18-1 General reserve - issuance premiumThe balance of general reserve – issuance premium is representing the net value of issuing capital increase shares during 2010 amounted to L.E 999 379 210 for issuing 205.97 million shares after deducting amount of L.E 350 398 732 for legal reserve completion to be equal to 50 % of paid up capital and amount of L.E 205 972 632 for capital increase after deducting issuance fees amounted to L.E 38 507 164.
The Company had reduced issuance premium during the period by an amount of L.E 73 580 254 representing the difference between nominal value and the cost of purchasing treasury stock which reduced the capital with its value due to the increase more than one year of the acquisition according to extra ordinary general assembly meeting dated February 5th 2012.
19 Earnings per share The Company presents basic earnings per share (EPS) data for its ordinary shares. Basic EPS is calculated by dividing the profit or loss attributable to ordinary shareholders of the Company after deducting em-ployees shares and B.O.D shares by the weighted average number of ordinary shares outstanding during the year, adjusted for own shares held.
Earnings per share of the period net profit is calculated using the weighted average method for the num-ber of outstanding shares during the period as follows:
Financial Year ended 31/12/2012
L.E
Financial Year ended 31/12/2011
L.ENet profit for the period according to consolidated income statement 325 414 877 185 887 359
Deduct :-
Employee shares (26 297 557) (24 575 725)
B.O.D remuneration (20 137 532) (18 118 596)
Net realized for share holders 278 979 788 143 193 038
Weighted average number of outstanding shares 706 053 811 706 053 811
Earning per share (L.E./share) 0,395 0,203
20 Loans
Details
Long term loans – current
portionL.E
Long term loans
L.ETotal
L.EGranted loans to Company’s Group from CIB. 66 146 326 385 960 309 452 106 635
Granted loans to Company’s Group from HSBC. 72 251 211 76 125 605 148 376 816
Granted loans to Company’s Group from Barclays. 13 637 000 63 555 609 77 192 609
Balance at 31/12/2012 152 034 537 525 641 523 677 676 060Balance at 31/12/2011 131 809 926 252 495 807 384 305 733
16 Trade and other receivables 31/12/2012
L.E.31/12/2011
L.E.Trade receivables 83 298 619 73 318 247
Less: Impairment in trade receivables (16 661 400) (17 473 292)
66 637 219 55 844 955
Notes receivables 4 173 149 64 511 361
Tetra Pak company 954 940 8 043 192
Suppliers – advance payments 22 505 790 10 922 117
Prepaid expenses 4 377 743 6 512 319
Export subsidy 11 550 359 7 287 961
Accrued revenues 132 296 132 294
Tax authority 15 493 358 7 302 091
Customs authority 10 587 535 1 238 442
Deposits with others 2 157 741 2 597 187
Accrued interest payable 65 587 17 420 602
Fixed assets debtors - 1 966 790
Other debit balances 8 150 800 4 470 887
146 786 517 188 250 198
Less: Impairment in debtors & other debit balances (1 666 434) (238 102)
145 120 083 188 012 096
17 Cash and cash equivalents31/12/2012
L.E.31/12/2011
L.E.Time deposits * 509 216 016 651 248 943
Banks – current accounts 4 621 444 21 012 574
Cheques under collection 988 146 500 000
Cash in hand 3 908 103 10 551 721
Cash in transit 6 033 437 -
L /G’s cash margin 5 050 000 5 100 000
529 817 146 688 413 238
Bank over draft (13 208 561) (58 406 259)
L /G’s cash margin (due after 3 months) (5 050 000) (5 100 000)
Cash and cash equivalents in the statement of cash flows 511 558 585 624 906 979
* The above mentioned time deposits are maturing within 3 months.
18 Share capital31/12/2012
L.E.31/12/2011
L.E.Authorized capital 5 000 000 000 5 000 000 000
Issued & paid up capital (divided into 706 053 811 shares with nominal value L.E 1 each)
706 053 811 726 416 332
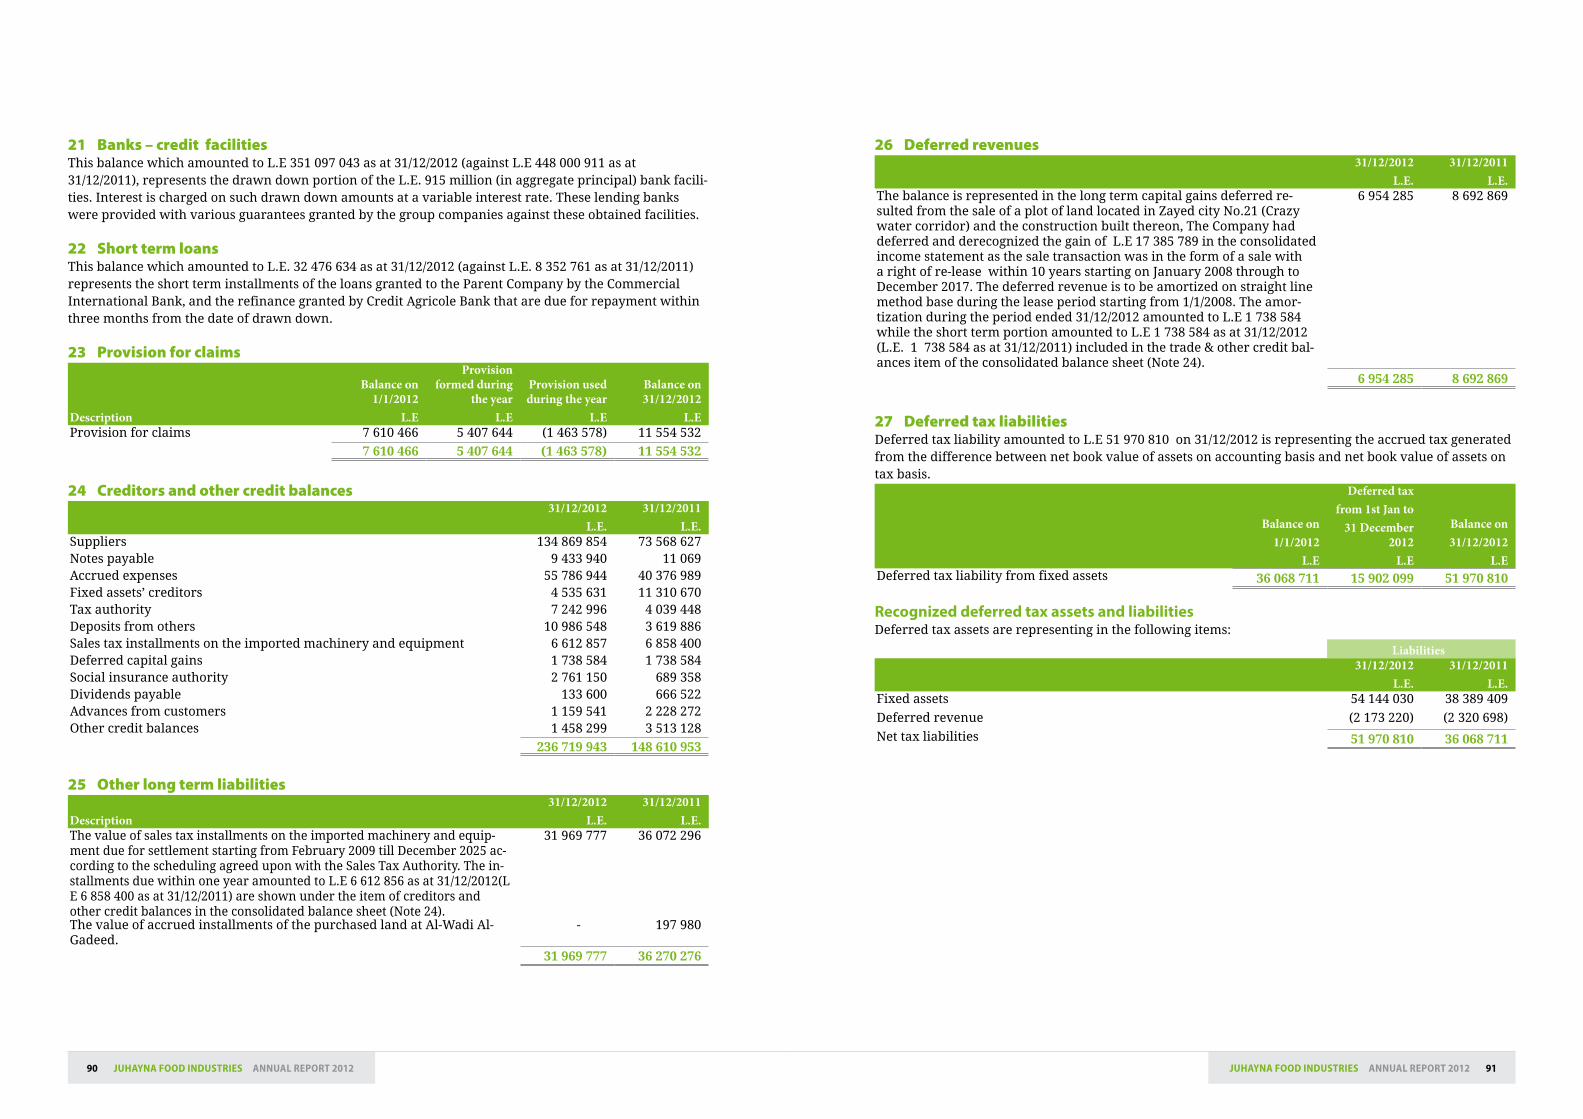
91JuhAyNA FooD INDuStrIES ANNuAL rEPort 201290 JuhAyNA FooD INDuStrIES ANNuAL rEPort 2012
26 Deferred revenues31/12/2012
L.E.31/12/2011
L.E.The balance is represented in the long term capital gains deferred re-sulted from the sale of a plot of land located in Zayed city No.21 (Crazy water corridor) and the construction built thereon, The Company had deferred and derecognized the gain of L.E 17 385 789 in the consolidated income statement as the sale transaction was in the form of a sale with a right of re-lease within 10 years starting on January 2008 through to December 2017. The deferred revenue is to be amortized on straight line method base during the lease period starting from 1/1/2008. The amor-tization during the period ended 31/12/2012 amounted to L.E 1 738 584 while the short term portion amounted to L.E 1 738 584 as at 31/12/2012 (L.E. 1 738 584 as at 31/12/2011) included in the trade & other credit bal-ances item of the consolidated balance sheet (Note 24).
6 954 285 8 692 869
6 954 285 8 692 869
27 Deferred tax liabilitiesDeferred tax liability amounted to L.E 51 970 810 on 31/12/2012 is representing the accrued tax generated from the difference between net book value of assets on accounting basis and net book value of assets on tax basis.
Balance on1/1/2012
L.E
Deferred taxfrom 1st Jan to
31 December 2012
L.E
Balance on31/12/2012
L.EDeferred tax liability from fixed assets 36 068 711 15 902 099 51 970 810
Recognized deferred tax assets and liabilitiesDeferred tax assets are representing in the following items:
Liabilities31/12/2012
L.E.31/12/2011
L.E.Fixed assets 54 144 030 38 389 409
Deferred revenue (2 173 220) (2 320 698)
Net tax liabilities 51 970 810 36 068 711
21 Banks – credit facilitiesThis balance which amounted to L.E 351 097 043 as at 31/12/2012 (against L.E 448 000 911 as at 31/12/2011), represents the drawn down portion of the L.E. 915 million (in aggregate principal) bank facili-ties. Interest is charged on such drawn down amounts at a variable interest rate. These lending banks were provided with various guarantees granted by the group companies against these obtained facilities.
22 Short term loansThis balance which amounted to L.E. 32 476 634 as at 31/12/2012 (against L.E. 8 352 761 as at 31/12/2011) represents the short term installments of the loans granted to the Parent Company by the Commercial International Bank, and the refinance granted by Credit Agricole Bank that are due for repayment within three months from the date of drawn down.
23 Provision for claims
Description
Balance on 1/1/2012
L.E
Provision formed during
the yearL.E
Provision used during the year
L.E
Balance on 31/12/2012
L.EProvision for claims 7 610 466 5 407 644 (1 463 578) 11 554 532
7 610 466 5 407 644 (1 463 578) 11 554 532
24 Creditors and other credit balances31/12/2012
L.E.31/12/2011
L.E.Suppliers 134 869 854 73 568 627Notes payable 9 433 940 11 069Accrued expenses 55 786 944 40 376 989Fixed assets’ creditors 4 535 631 11 310 670Tax authority 7 242 996 4 039 448Deposits from others 10 986 548 3 619 886Sales tax installments on the imported machinery and equipment 6 612 857 6 858 400Deferred capital gains 1 738 584 1 738 584Social insurance authority 2 761 150 689 358Dividends payable 133 600 666 522Advances from customers 1 159 541 2 228 272Other credit balances 1 458 299 3 513 128
236 719 943 148 610 953
25 Other long term liabilities
Description31/12/2012
L.E.31/12/2011
L.E.The value of sales tax installments on the imported machinery and equip-ment due for settlement starting from February 2009 till December 2025 ac-cording to the scheduling agreed upon with the Sales Tax Authority. The in-stallments due within one year amounted to L.E 6 612 856 as at 31/12/2012(L E 6 858 400 as at 31/12/2011) are shown under the item of creditors and other credit balances in the consolidated balance sheet (Note 24).
31 969 777 36 072 296
The value of accrued installments of the purchased land at Al-Wadi Al-Gadeed.
- 197 980
31 969 777 36 270 276
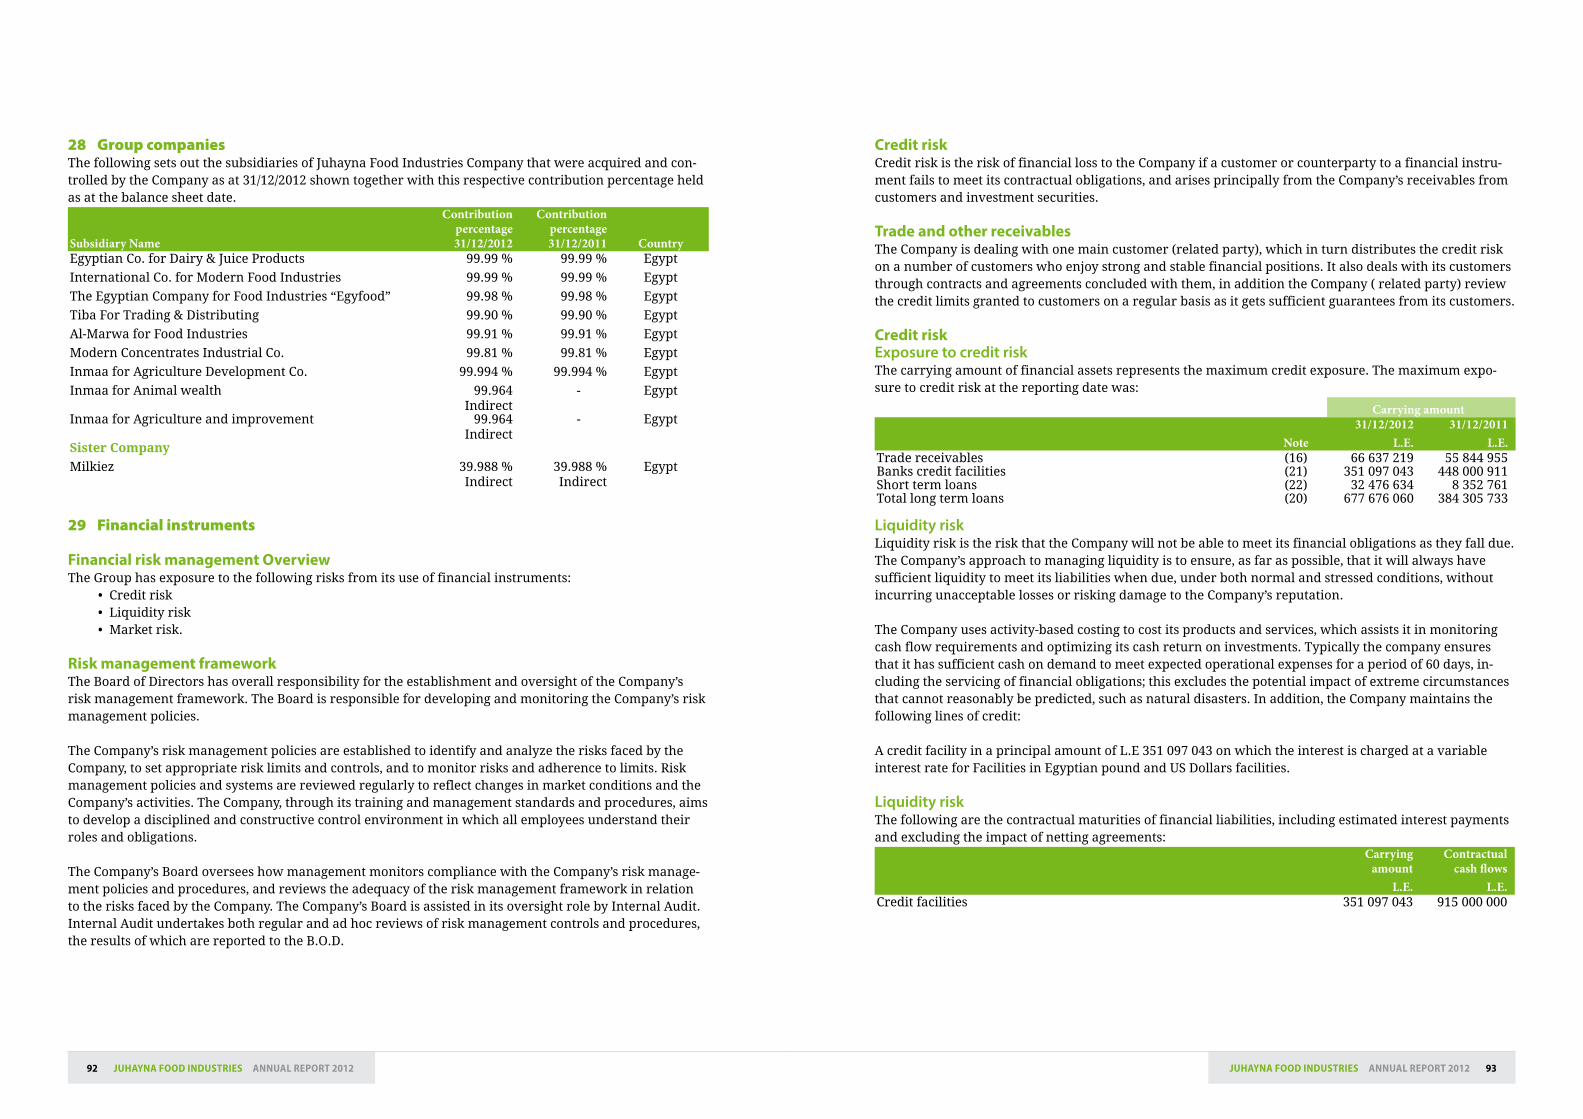
93JuhAyNA FooD INDuStrIES ANNuAL rEPort 201292 JuhAyNA FooD INDuStrIES ANNuAL rEPort 2012
Credit risk Credit risk is the risk of financial loss to the Company if a customer or counterparty to a financial instru-ment fails to meet its contractual obligations, and arises principally from the Company’s receivables from customers and investment securities.
Trade and other receivablesThe Company is dealing with one main customer (related party), which in turn distributes the credit risk on a number of customers who enjoy strong and stable financial positions. It also deals with its customers through contracts and agreements concluded with them, in addition the Company ( related party) review the credit limits granted to customers on a regular basis as it gets sufficient guarantees from its customers.
Credit riskExposure to credit riskThe carrying amount of financial assets represents the maximum credit exposure. The maximum expo-sure to credit risk at the reporting date was:
Carrying amount
Note31/12/2012
L.E.31/12/2011
L.E.Trade receivables (16) 66 637 219 55 844 955Banks credit facilities (21) 351 097 043 448 000 911Short term loans (22) 32 476 634 8 352 761Total long term loans (20) 677 676 060 384 305 733
Liquidity riskLiquidity risk is the risk that the Company will not be able to meet its financial obligations as they fall due. The Company’s approach to managing liquidity is to ensure, as far as possible, that it will always have sufficient liquidity to meet its liabilities when due, under both normal and stressed conditions, without incurring unacceptable losses or risking damage to the Company’s reputation.
The Company uses activity-based costing to cost its products and services, which assists it in monitoring cash flow requirements and optimizing its cash return on investments. Typically the company ensures that it has sufficient cash on demand to meet expected operational expenses for a period of 60 days, in-cluding the servicing of financial obligations; this excludes the potential impact of extreme circumstances that cannot reasonably be predicted, such as natural disasters. In addition, the Company maintains the following lines of credit:
A credit facility in a principal amount of L.E 351 097 043 on which the interest is charged at a variable interest rate for Facilities in Egyptian pound and US Dollars facilities.
Liquidity riskThe following are the contractual maturities of financial liabilities, including estimated interest payments and excluding the impact of netting agreements:
Carrying amount
L.E.
Contractual cash flows
L.E.Credit facilities 351 097 043 915 000 000
28 Group companiesThe following sets out the subsidiaries of Juhayna Food Industries Company that were acquired and con-trolled by the Company as at 31/12/2012 shown together with this respective contribution percentage held as at the balance sheet date.
Subsidiary Name
Contribution percentage 31/12/2012
Contribution percentage 31/12/2011 Country
Egyptian Co. for Dairy & Juice Products 99.99 % 99.99 % Egypt
International Co. for Modern Food Industries 99.99 % 99.99 % Egypt
The Egyptian Company for Food Industries “Egyfood” 99.98 % 99.98 % Egypt
Tiba For Trading & Distributing 99.90 % 99.90 % Egypt
Al-Marwa for Food Industries 99.91 % 99.91 % Egypt
Modern Concentrates Industrial Co. 99.81 % 99.81 % Egypt
Inmaa for Agriculture Development Co. 99.994 % 99.994 % Egypt
Inmaa for Animal wealth 99.964Indirect
- Egypt
Inmaa for Agriculture and improvement 99.964Indirect
- Egypt
Sister Company
Milkiez 39.988 % Indirect
39.988 % Indirect
Egypt
29 Financial instruments
Financial risk management OverviewThe Group has exposure to the following risks from its use of financial instruments:
• Creditrisk• Liquidityrisk• Marketrisk.
Risk management frameworkThe Board of Directors has overall responsibility for the establishment and oversight of the Company’s risk management framework. The Board is responsible for developing and monitoring the Company’s risk management policies.
The Company’s risk management policies are established to identify and analyze the risks faced by the Company, to set appropriate risk limits and controls, and to monitor risks and adherence to limits. Risk management policies and systems are reviewed regularly to reflect changes in market conditions and the Company’s activities. The Company, through its training and management standards and procedures, aims to develop a disciplined and constructive control environment in which all employees understand their roles and obligations.
The Company’s Board oversees how management monitors compliance with the Company’s risk manage-ment policies and procedures, and reviews the adequacy of the risk management framework in relation to the risks faced by the Company. The Company’s Board is assisted in its oversight role by Internal Audit. Internal Audit undertakes both regular and ad hoc reviews of risk management controls and procedures, the results of which are reported to the B.O.D.
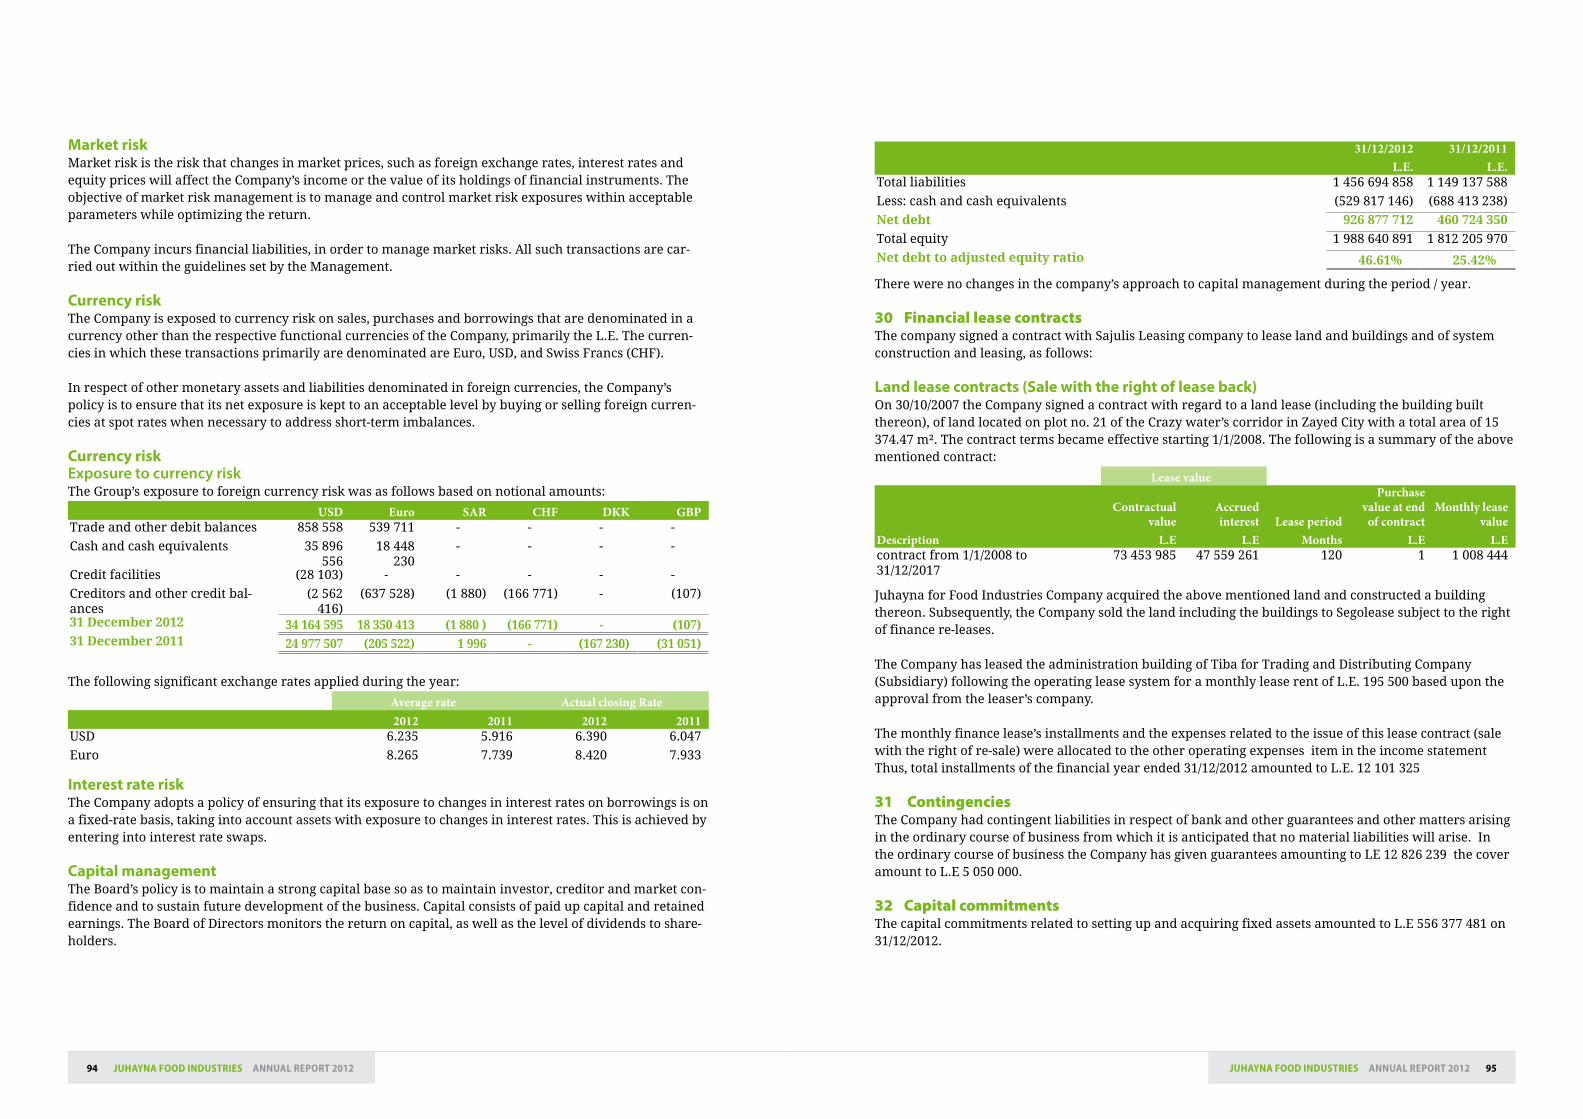
95JuhAyNA FooD INDuStrIES ANNuAL rEPort 201294 JuhAyNA FooD INDuStrIES ANNuAL rEPort 2012
31/12/2012L.E.
31/12/2011L.E.
Total liabilities 1 456 694 858 1 149 137 588
Less: cash and cash equivalents (529 817 146) (688 413 238)
Net debt 926 877 712 460 724 350
Total equity 1 988 640 891 1 812 205 970
Net debt to adjusted equity ratio 46.61% 25.42%
There were no changes in the company’s approach to capital management during the period / year.
30 Financial lease contractsThe company signed a contract with Sajulis Leasing company to lease land and buildings and of system construction and leasing, as follows:
Land lease contracts (Sale with the right of lease back)On 30/10/2007 the Company signed a contract with regard to a land lease (including the building built thereon), of land located on plot no. 21 of the Crazy water’s corridor in Zayed City with a total area of 15 374.47 m². The contract terms became effective starting 1/1/2008. The following is a summary of the above mentioned contract:
Lease value
Description
Contractual value
L.E
Accrued interest
L.ELease period
Months
Purchase value at end
of contractL.E
Monthly lease value
L.Econtract from 1/1/2008 to 31/12/2017
73 453 985 47 559 261 120 1 1 008 444
Juhayna for Food Industries Company acquired the above mentioned land and constructed a building thereon. Subsequently, the Company sold the land including the buildings to Segolease subject to the right of finance re-leases.
The Company has leased the administration building of Tiba for Trading and Distributing Company (Subsidiary) following the operating lease system for a monthly lease rent of L.E. 195 500 based upon the approval from the leaser’s company.
The monthly finance lease’s installments and the expenses related to the issue of this lease contract (sale with the right of re-sale) were allocated to the other operating expenses item in the income statement Thus, total installments of the financial year ended 31/12/2012 amounted to L.E. 12 101 325
31 ContingenciesThe Company had contingent liabilities in respect of bank and other guarantees and other matters arising in the ordinary course of business from which it is anticipated that no material liabilities will arise. In the ordinary course of business the Company has given guarantees amounting to LE 12 826 239 the cover amount to L.E 5 050 000.
32 Capital commitments The capital commitments related to setting up and acquiring fixed assets amounted to L.E 556 377 481 on 31/12/2012.
Market riskMarket risk is the risk that changes in market prices, such as foreign exchange rates, interest rates and equity prices will affect the Company’s income or the value of its holdings of financial instruments. The objective of market risk management is to manage and control market risk exposures within acceptable parameters while optimizing the return.
The Company incurs financial liabilities, in order to manage market risks. All such transactions are car-ried out within the guidelines set by the Management.
Currency riskThe Company is exposed to currency risk on sales, purchases and borrowings that are denominated in a currency other than the respective functional currencies of the Company, primarily the L.E. The curren-cies in which these transactions primarily are denominated are Euro, USD, and Swiss Francs (CHF).
In respect of other monetary assets and liabilities denominated in foreign currencies, the Company’s policy is to ensure that its net exposure is kept to an acceptable level by buying or selling foreign curren-cies at spot rates when necessary to address short-term imbalances.
Currency riskExposure to currency riskThe Group’s exposure to foreign currency risk was as follows based on notional amounts:
USD Euro SAR CHF DKK GBPTrade and other debit balances 858 558 539 711 - - - -
Cash and cash equivalents 35 896 556
18 448 230
- - - -
Credit facilities (28 103) - - - - -
Creditors and other credit bal-ances
(2 562 416)
(637 528) (1 880) (166 771) - (107)
31 December 2012 34 164 595 18 350 413 (1 880 ) (166 771) - (107)31 December 2011 24 977 507 (205 522) 1 996 - (167 230) (31 051)
The following significant exchange rates applied during the year:
Average rate Actual closing Rate2012 2011 2012 2011
USD 6.235 5.916 6.390 6.047
Euro 8.265 7.739 8.420 7.933
Interest rate riskThe Company adopts a policy of ensuring that its exposure to changes in interest rates on borrowings is on a fixed-rate basis, taking into account assets with exposure to changes in interest rates. This is achieved by entering into interest rate swaps.
Capital managementThe Board’s policy is to maintain a strong capital base so as to maintain investor, creditor and market con-fidence and to sustain future development of the business. Capital consists of paid up capital and retained earnings. The Board of Directors monitors the return on capital, as well as the level of dividends to share-holders.

96 JuhAyNA FooD INDuStrIES ANNuAL rEPort 2012
33 Related party transactionsThe related parties are represented in the Company’s shareholders and companies in which they own directly or indirectly shares giving them significant influence or controls over these companies.
The following is a summary of significant transactions concluded, during the current year, between the Company and its related parties.
33-1 Due from related partiesTotal value of transactions Balance as at
Company’s nameNature of transaction
31/12/2012L.E.
31/12/2011L.E.
31/12/2012L.E.
31/12/2011L.E.
Bonian for Development & Investment
Current account (294 863 ) (500 000) - 294 863
Milkiez Customer 927 582 1 516 543 1 337 563 1 186 612Vendor 185 652 299 1491 337 563 1 481 475
34 Goodwill31/12/2012
L.E.31/12/2011
L.E.Goodwill resulting from acquiring the Egyptian Company for Dairy & Juice Products
46 433 934 46 433 934
Goodwill resulting from acquiring Al-Marwa for Food Industries Company 50 658 956 50 658 956
97 092 890 97 092 890
35 Political and economical eventsThe Arab Republic of Egypt has encountered certain events that have a significant impact on the economic sectors in general, a matter which may lead to a substantial decline in the economic activities in the fore-seeable future.
Therefore, there is a possibility that the above mentioned events will have a significant impact on the Company’s assets, liabilities, their recoverable/settlement amounts and the results of operations in the foreseeable future.
At the present, it is not possible to quantify the effect on the Company’s assets and liabilities included in the company’s financial statements, since quantifying the effect of these events relies on the expected extent and the time frame, when these events and their consequences, are expected to be finished.
36 Other events during the yearSeveral resolutions were issued to amend some income tax laws articles and were published in the Of-ficial newspaper on December 6, 2012 that shall come into effect as from the day following the date of publication. These amendments are as follows:•Amendingsomearticlesofincometaxlawissuedbythelawno.91fortheyear2005.•Amendingsomearticlesofgeneralsalestaxlawissuedbythelawno.11fortheyear1991.•Amendingsomearticlesofrealestatetaxlawissuedbythelawno.196fortheyear2008.•Amendingsomearticlesofstamptaxlawissuedbythelawno.111fortheyear1980.
Officials’ statements about freezing those decisions have been released so the financial statements were not affected by those amendments, in the case of availability of reliable information about the validity of those decisions and the date of activation it is probable that the mentioned amendments will have an effect on the tax bases and related assets and liabilities, as well as business results and the resulting net profit available for distribution during the fiscal year.

www.juhayna.com