EEG–fMRI of epileptic spikes: Concordance with EEG source localization and intracranial EEG
Upload
khangminh22Category
view
1download
0
University of New Hampshire University of New Hampshire
University of New Hampshire Scholars' Repository University of New Hampshire Scholars' Repository
Master's Theses and Capstones Student Scholarship
Spring 2019
EEG AND EMG SENSORIMOTOR MEASUREMENTS TO ASSESS EEG AND EMG SENSORIMOTOR MEASUREMENTS TO ASSESS
PROPRIOCEPTION FOLLOWING ACL RECONSTRUCTION PROPRIOCEPTION FOLLOWING ACL RECONSTRUCTION
Teagan Frances Northrup University of New Hampshire, Durham
Follow this and additional works at: https://scholars.unh.edu/thesis
Recommended Citation Recommended Citation Northrup, Teagan Frances, "EEG AND EMG SENSORIMOTOR MEASUREMENTS TO ASSESS PROPRIOCEPTION FOLLOWING ACL RECONSTRUCTION" (2019). Master's Theses and Capstones. 1280. https://scholars.unh.edu/thesis/1280
This Thesis is brought to you for free and open access by the Student Scholarship at University of New Hampshire Scholars' Repository. It has been accepted for inclusion in Master's Theses and Capstones by an authorized administrator of University of New Hampshire Scholars' Repository. For more information, please contact [email protected].

EEG AND EMG SENSORIMOTOR MEASUREMENTS TO ASSESS PROPRIOCEPTION
FOLLOWING ACL RECONSTRUCTION
BY
TEAGAN FRANCES NORTHRUP
Bachelor of Science in Electrical Engineering, University of New Hampshire, 2018
THESIS
Submitted to the University of New Hampshire
In Partial Fulfillment of
The Requirements for the Degree of
Master of Science
in
Electrical Engineering
May 2019

ii
This thesis was examined and approved in partial fulfillment of the requirements for the degree
of Master of Science in Electrical Engineering by:
Thesis Director, John R. LaCourse, Ph.D.
Professor of Electrical and Computer Engineering
Wayne J. Smith II, Ph.D.
Senior Lecturer of Electrical and Computer Engineering
Ronald V. Croce, Ph.D.
Professor of Kinesiology
On [Date of Defense]
Approval signatures are on file with the University of New Hampshire Graduate School.

iii
TABLE OF CONTENTS
LIST OF TABLES .......................................................................................................................... v
LIST OF FIGURES ....................................................................................................................... vi
ABSTRACT ................................................................................................................................... ix
INTRODUCTION .......................................................................................................................... 1
1. BACKGROUND ........................................................................................................................ 5
1.1. Fundamental Knee Anatomy ................................................................................................ 5
1.2. ACL Injuries ......................................................................................................................... 6
1.3. Proprioception and the ACL ................................................................................................ 7
1.4. Existing Techniques to Measure Proprioception ............................................................... 10
1.5. Prior research involving EEG and EMG in ACL reconstruction subjects ......................... 12
2. METHODS ............................................................................................................................... 14
2.1. Participants ......................................................................................................................... 14
2.2. Equipment .......................................................................................................................... 14
2.2.a. Platform Perturbator .................................................................................................... 14
2.2.b. Electroencephalogram (EEG) ...................................................................................... 16
2.2.c. Electromyogram (EMG) .............................................................................................. 18
2.3. Measures............................................................................................................................. 20
2.4. Procedure ............................................................................................................................ 23
2.5. Analysis .............................................................................................................................. 28
3. RESULTS ................................................................................................................................. 33

iv
3.1 ACL group vs Healthy group .............................................................................................. 34
3.1.a. Reflex Response ......................................................................................................... 34
3.1.b. Cognitive Reflex Response ........................................................................................ 37
3.1.c. Efferent Signals from the Motor Cortex ..................................................................... 40
3.1.d. Afferent Signals to the Motor Cortex ......................................................................... 41
3.1.e. Cognitive Processing Time .......................................................................................... 43
3.2 ACL leg vs Healthy leg within ACL participant................................................................. 45
3.2.a. Reflex Response within ACL Participants .................................................................. 45
3.2.b. Cognitive Reflex Response within ACL Participants ................................................. 48
3.2.c. Efferent signals from the Motor Cortex ....................................................................... 52
3.2.d. Afferent Signals to the Motor Cortex .......................................................................... 54
3.2.e. Cognitive Processing Time .......................................................................................... 55
4. DISCUSSION ........................................................................................................................... 57
LIST OF REFERENCES .............................................................................................................. 60
APPENDICES .............................................................................................................................. 63
A – Screening Tests................................................................................................................... 63
B – Consent Form ..................................................................................................................... 69
C – Recruitment Flyer ............................................................................................................... 73
D – IRB Approval ..................................................................................................................... 74
E – Average Cz electrode and CSD Maps ................................................................................ 76

v
LIST OF TABLES
Table 1 Reflex Response of Individuals matched by BMI and leg dominance ............................ 35
Table 2 Cognitive Reflex Response of Individuals matched by BMI and leg dominance ........... 37
Table 3 Efferent Signal Time from Motor Cortex of Individuals matched by BMI and leg
dominance ..................................................................................................................................... 40
Table 4 Afferent Signal Time to Motor Cortex ............................................................................ 42
Table 5 Cognitive Processing Time in Motor Cortex of Individuals............................................ 43
Table 6 Reflex Response of ACL Participants ............................................................................. 45
Table 7 Cognitive Reflex Response of ACL Participants ............................................................ 48
Table 8 Efferent Signals from the Motor Cortex for ACL Participants ....................................... 52
Table 9 Mean Afferent Signal Time to Motor Cortex of ACL Group.......................................... 54
Table 10 Mean Cognitive Processing Time in Motor Cortex of ACL Group .............................. 55

vi
LIST OF FIGURES
Figure 1 Structure of ACL connecting Femur and Tibia ................................................................ 1
Figure 2 Ligaments and Bones of the Knee .................................................................................... 6
Figure 3 Typical Joint Position Sense Test Set-up ....................................................................... 11
Figure 4 Event Related Potential .................................................................................................. 13
Figure 5 Platform Perturbator ....................................................................................................... 15
Figure 6 H-Bridge Switch Circuit ................................................................................................. 16
Figure 7 Layout of 64 Channel EEG Cap ..................................................................................... 17
Figure 8 Areas of the Brain ........................................................................................................... 17
Figure 9 Pre-Amplifier EEG electrode ......................................................................................... 18
Figure 10 Four muscles used for EMG signals and the respective electrode locations ................ 19
Figure 11 Spinal Reflex Response vs Cortical Response ............................................................. 21
Figure 12 Block Diagram of Test Set-up ...................................................................................... 22
Figure 13 64 Channel EEG cap .................................................................................................... 24
Figure 14 Platform Perturbator Stance ......................................................................................... 25
Figure 15 Filtered EEG and EMG Signals ................................................................................... 28
Figure 16 EEG signals averaged over all trials ............................................................................. 29
Figure 17 Averaged EEG at Cz along with CSD maps to show cortical activity ......................... 30
Figure 18 Initial and Secondary muscle contractions ................................................................... 31
Figure 19 Timing of Each Response with EEG and EMG data ................................................... 32
Figure 20 Mean Reflex Response Time for ACL Group compared to Healthy Controls ............ 36
Figure 21 Difference between Peak and Onset Reflex Response Time for ACL Group compared
to Healthy Controls ....................................................................................................................... 37

vii
Figure 22 Mean Cognitive Reflex Response comparing ACL Group to Healthy Control Group 38
Figure 23 Difference between Peak and Onset Cognitive Reflex Response Time for ACL Group
compared to Healthy Controls ...................................................................................................... 39
Figure 24 Difference between Cognitive and Reflex Response for ACL group and Healthy
Group ............................................................................................................................................ 40
Figure 25 Aggregate Mean Efferent Signals from Motor Cortex for ACL Group and Healthy
Controls ......................................................................................................................................... 41
Figure 26 Mean Afferent Signal Time to Motor Cortex ............................................................... 42
Figure 27 Mean Cognitive Processing Time in the Motor Cortex................................................ 44
Figure 28 Mean Reflex Response Times within ACL Participants .............................................. 46
Figure 29 Difference between Peak and Onset Reflex Response Times within ACL Participants
....................................................................................................................................................... 47
Figure 30 Reflex Response Differences within ACL Participants ............................................... 48
Figure 31 Aggregate Mean Cognitive Reflex Response for ACL Participants ............................ 49
Figure 32 Difference between Peak and Onset Cognitive Reflex Response Times within ACL
Participants .................................................................................................................................... 50
Figure 33 Difference between Cognitive and Reflex Response for ACL Leg and Healthy Leg .. 51
Figure 34 Cognitive Reflex Response Differences within ACL Participants............................... 52
Figure 35 Aggregate Efferent Signal Time from the Motor Cortex for ACL Participants ........... 53
Figure 36 Efferent Signal Time Difference between Healthy and ACL Reconstructed legs ....... 54
Figure 37 Mean Afferent Signal Time to Motor Cortex ............................................................... 55
Figure 38 Mean Cognitive Processing Time in Motor Cortex of ACL Group ............................. 56
Figure 39 Subject 1 ....................................................................................................................... 76

viii
Figure 40 Subject 2 ....................................................................................................................... 76
Figure 41 Subject 6 ....................................................................................................................... 77
Figure 42 Subject 7 ....................................................................................................................... 77
Figure 43 Subject 8 ....................................................................................................................... 78
Figure 44 Subject 3 ....................................................................................................................... 79
Figure 45 Subject 4 ....................................................................................................................... 79
Figure 46 Subject 5 ....................................................................................................................... 80
Figure 47 Subject 9 ....................................................................................................................... 80
Figure 48 Subject 10 ..................................................................................................................... 81
Figure 49 Subject 3 ....................................................................................................................... 81
Figure 50 Subject 4 ....................................................................................................................... 82
Figure 51 Subject 5 ....................................................................................................................... 82
Figure 52 Subject 9 ....................................................................................................................... 83
Figure 53 Subject 10 ..................................................................................................................... 83

ix
ABSTRACT
EEG AND EMG SENSORIMOTOR MEASUREMENTS TO ASSESS PROPRIOCEPTION
FOLLOWING ACL RECONSTRUCTION
By
Teagan Frances Northrup
University of New Hampshire
The Anterior Cruciate Ligament (ACL) is the primary source of rotational stability in the
knee. When the ACL is torn, it typically must be repaired through reconstructive surgery, however,
surgery may result in proprioceptive deficiencies in the knee. Proprioception plays an important
role in spatial awareness, sensing movement and reacting accordingly. Existing methods of
measuring proprioception are limited because they rely only on the error between the knee angles,
a single biomechanical parameter, and neglects timing of neural communication. This study
examines an alternative method of measuring proprioceptive responses to a stimulus (motion) by
using electromyogram (EMG) and electroencephalogram (EEG) signals to observe muscle and
cortical brain activity. Data was analyzed to detect event-related-potentials in the EEG data
associated with the platform perturbation stimulus along with the response time of muscle
contraction to regain balance. This study compares proprioceptive measurements between 5
participants who have had an ACL reconstruction within the past 8 to 18 months and 5 participants
without knee injuries. This measurement strategy has the potential to help physicians and physical
therapists determine when a person can return to normal or strenuous activity as well as provide
insight into whether uninjured patients have a proprioceptive deficit which may indicate an
increased risk of injury.

1
INTRODUCTION
The Anterior Cruciate Ligament (ACL) is the primary source of anterior, posterior, and
rotational stability in the knee; its role is to prevent the tibia from sliding in front of the femur
which provides rotational stability [1] shown in Figure 1[2]. When the ACL is torn, it must be
repaired through reconstructive surgery.
Figure 1 Structure of ACL connecting Femur and Tibia
Studies have shown that an ACL injury is more than just a simple mechanical impairment [3]. After
an ACL reconstruction it has been widely documented that patients suffer from proprioceptive
deficiencies in the knee. Proprioception is defined as “the specialized variation of the sensory
modality of touch that encompasses the sensation of joint movement and joint position” [4].
Essentially, proprioception is very important in helping an individual understand where their knee

2
is in space and sensing movement. For example, when an individual senses a change in their
balance there is a communication exchange between muscles and the peripheral and central
nervous system. The sensory receptors in the knee send signals through the spine to the brain,
indicating that there has been motion. The immediate involuntary response instructs the muscles
to return the knee to its original position of stability. A secondary response incorporates the motor
cortex of the brain to interpret the sensation and involuntary response, then instructs the muscles
on how to respond with further precision. This two-step proprioceptive process allows individuals
to adjust to changing situations and maintain balance while standing, walking or running.
Therefore, effective proprioception is an important indicator of recovery for an individual with an
ACL reconstruction. While there is a third step in the triphasic muscle pattern, this study will only
be looking at the first two responses.
Currently, one problem physicians and physical therapists face in working with individuals
who have ACL reconstructions is that they do not have adequate tools to assess recovery progress
to help determine when a person can return to normal or strenuous activity. Many factors have
been suggested to impact recovery including proprioception and the surgical procedure [5].
Proprioception can affect static awareness of joint position leading to an altered gait affecting
recovery. There are different recovery paths depending upon a number of variables associated
with the surgical process such as graft type, co-occurring injuries, and body composition. In
addition, due to the lack of effective measurement tools, there is not a clear understanding of how
proprioception changes after ACL reconstruction surgery. What has been documented pertaining
to proprioception and ACL reconstructions is that the surgical process disrupts important
communication mechanisms in the proprioceptive process.
3
Seventy percent of ACL injuries are a result of non-contact movements. The risk factors
for non-contact ACL injuries fall into four distinct categories: environmental, anatomic, hormonal,
and biomechanical. Electroencephalogram (EEG) and electromyogram (EMG) measurements can
provide insight into anatomical and biomechanical communication within the body [6]. The goal of
this research is to develop an improved method to measure proprioception using EEG and EMG
to observe differences in proprioception after an ACL reconstruction. This research compared the
proprioception of individuals who had a recent ACL reconstruction with individuals with no knee
injuries. In addition, for individuals with an ACL reconstruction, EEG and EMG data from the
reconstructed knee was compared to the healthy knee.
For the purpose of this study, proprioceptive awareness and movement responses were
measured using EEG and EMG. The procedure used a platform perturbator to serve as the stimulus.
An individual stood on the platform perturbator and the platform was controlled to move the
subject slightly forward or backward. The individual had EEG and EMG sensors to measure the
individual’s response each time the perturbator moved.
The EEG monitored the activity in the cortex of the brain and the EMG monitored the
activity of the muscles that support the knee including the anterior tibialis, gastrocnemius,
quadricep, and gluteus maximus. The EMG allowed two different muscle responses to be
observed: the muscle activation from the reflex response and muscle activation from the cognitive
reflex response. Within each muscle response there is both a muscle onset time and a peak time.
Muscle onset is when the muscles initially contracts, and muscle peak is the maximum magnitude
of the contraction. The reflex response corresponds with the involuntary reflexive response from
the spinal cord. When the platform moved the sensory cells around the knee started the
communication through the central nervous system by sending a signal through the spinal cord to

4
the brain. There was an initial response signal that returned directly to the knee from the spine, this
resulted in an EMG onset and peak contraction for the reflex response. The cognitive reflex
response originated from the second signal sent back to the knee, this is the signal that continued
up the spinal cord to the brain, specifically the motor cortex. The motor cortex interprets how to
respond to the sensation and sends a signal back to the muscles around the knee with instructions,
this muscle response resulted in another EMG onset and peak contraction corresponding with the
cognitive reflex response. By comparing the timing of the EMG responses, the time it takes for the
spinal response and the processing response from the brain to get back to the knee was determined.
The afferent and efferent signal timing were determined respectively by the time between the
platform stimulus to the maximum EEG activation at the motor cortex and the time from maximum
EEG activation to muscle peak contraction corresponding to the cognitive reflex response.
Along with the EMG timing, EEG data was used to observe cortical brain activity during
this process. By specifically looking at the electrodes over the sensorimotor cortex, primarily Cz
(See Figures 7 and 8), it was determined when information was entering or exiting that particular
cortical area. By using both EEG and EMG measurements, the timing of responses were tracked
from the movement of the perturbator in relationship to the neural and muscular response. This
combined approach allowed the entire proprioceptive response to be measured through signal
processing and data analysis.
The hypothesis was that there would be differences in response timing related to
proprioception in the following responses: reflex response, cognitive reflex response and, efferent
and afferent motor cortex signals cognitive processing time (See Section 2.5 for further
explanation). Differences were expected to be observed for ACL participants compared with
healthy participants as well as ACL knee compared with healthy knee within ACL participants.

5
1. BACKGROUND
1.1. Fundamental Knee Anatomy
The knee is a complex joint that is a combination of different structures including bones,
ligaments, and tendons. The main ligaments and bones of the knee are shown in Figure 2 [1]. Three
bones converge in the knee including the femur (thigh bone), the tibia (shin bone), and the patella
(knee cap). The four ligaments in the knee connect the bones and provide stability within the knee.
There are two collateral ligaments which lie along the sides of the knee and provide side-to-side
stability and two cruciate ligaments on the interior of the knee joint. The medial collateral ligament
is on the inside and connects the femur to tibia; the lateral collateral ligament is on the outside of
the knee and connects the femur to the fibula. The cruciate ligaments cross diagonally connecting
the femur to the tibia and provide front to back stability. The anterior cruciate ligament is in front
of the posterior cruciate ligament and prevents the tibia from sliding in front of the femur [1].
The primary focus of this study is the role of the ACL in proprioception, particularly after
an ACL reconstruction. An ACL reconstruction increases the risk for a subsequent ACL injury
due to the proprioceptive deficits in the knee. Identification of proprioceptive deficits could assist
in recovery as well as preventing subsequent injury.

6
Figure 2 Ligaments and Bones of the Knee
1.2. ACL Injuries
There are two ways to obtain an ACL injury, a contact injury or a non-contact injury.
Seventy percent of ACL injuries occur from non-contact injuries and commonly occur when
someone is decelerating, landing, or pivoting [6]. A contact injury occurs from a direct hit to the
knee. Most ACL injuries result in complete or near complete tears meaning the ACL is split into
two pieces leaving the knee unstable [1]. Due to the higher number of males participating in sport
related activities there are more ACL injuries in men [6]. It has been widely documented, however,
that women have a significantly higher risk of ACL injuries. There has been extensive research
examining a number of potential factors. According to the American Academy of Orthopedic
Surgeons some of the risk factors for women include muscle strength, neuromuscular control,

7
pelvis to knee angles, ligaments laxity, and fluctuation of estrogen levels [6].
Irrespective of gender, partial and complete tears are repaired through surgical
reconstruction. The traditional ACL reconstruction surgery consists of removing the injured ACL
and replacing it with a graft which is attached to the femur and the tibia. There are two types of
ACL grafts which include allografts (from a cadaver) and autografts (from the patient). Grafts are
most commonly from the patella tendon or the hamstring but are occasionally harvested from the
quadriceps. There is a 90% success rate for ACL reconstruction surgery related to knee stability,
patient satisfaction, and return to activity [7]. While the surgery is very successful, the risk of a
subsequent ACL injury on either leg increases from 1 in 3,000 (prior to injury) to 1 in 50 (after the
initial injury).
1.3. Proprioception and the ACL
One of the suggested reasons for the increased risk for ACL re-injury is the proprioceptive
deficits that result from ACL reconstructive surgery. Proprioception is defined as “the specialized
variation of the sensory modality of touch that encompasses the sensation of joint movement and
joint position” [5]. There have been many studies looking at the relationship between participants
with ACL reconstructions and proprioceptive deficits. Studies have documented that ACL
reconstructed knees have deficits not only in proprioception, but also in muscle strength, explosive
strength, and gait [8], [9], [10], [11], [5]. One implication of proprioceptive deficits is an altered gait after
surgery due to the ACL “relearning” its function. Proprioception plays a large part in the stability
of the knee and knowing the position of the joint, which is critical to replicating one’s pre-injury
gait.
With a goal of returning to regular activities, proprioception has been emphasized in

8
recovery, but other researchers have suggested that the reconstructive surgical procedure and
ligament tension are important as well. However, Barrett’s research suggests that an athlete’s
return to activity is more dependent on proprioception than the ligament tension in a clinically
successful reconstruction [12]. Godinho et al. found that there are proprioceptive deficits after ACL
injuries by looking at patients with complete ACL tears [11]. Lephart et al. also documented
proprioceptive deficiencies in injured knees after an ACL reconstruction performed with allografts
and autografts suggesting that the type of graft used in surgery does not differentially affect
proprioception post-surgery [13]. Newer reconstructive techniques have considered incorporating
regenerated ACLs. At this time, eighty six percent of orthopedic surgeons would consider
incorporating regenerated ACL into the reconstruction if it demonstrated biological and
mechanical success, but until its success matches that of the autograft method, patients and
surgeons are likely to prefer the autograft [14]. While there is no specific graft that can be selected
to guarantee better proprioception after surgery for every person. Each patient will have different
circumstances that lead to a graft selection, each graft should have biomechanical properties like
the original ACL and have rapid biological incorporation[7].
Proprioception plays a significant role in the stability of the knee and specifying the
position of the joint, which is critical to replicating one’s pre-injury gait. Proprioception is also
necessary to detect movement and acceleration. Proprioception is part of a closed-loop activity
between the knee and brain (via the central nervous system) that starts the reflex response and
regulates the muscles.
Some studies have investigated neural and muscle activity to determine the reasons for
proprioceptive differences in ACL reconstructed knees [8], [15], [16]. Nyland et al. states that even
fully reconstructed ACL grafts never restore their native neurosensory characteristics because the

9
reconstructed ACL no longer transmits information in the same way it did prior to its injured state.
This lack of communication may account for proprioceptive deficits that are seen after a
reconstruction [15]. The ACL contains sensory receptors called mechanoreceptors that are used as
a communicator within the central nervous system. The central nervous system is responsible for
controlling the reflexive response and the cognitive reflex response from the motor cortex of the
brain. There are three different types of mechanoreceptors in an ACL: Pacinian capsules, Ruffini
nerve endings, and Golgi tendon organs. Pacinian capsules detect changes in acceleration; Ruffini
nerve endings and Golgi tendon organs detect changes in joint position when the joint is under
stress [6 & 7 as cited in 5]. The majority of mechanoreceptors in an ACL reside at the ends of the ligament
near the femur and tibia and make up 2.5% of the ligament [3]. Adachi et al. suggests that
proprioceptive function of the ACL is related to the number of mechanoreceptors [16]. They found
a positive correlation between the number of mechanoreceptors and proprioception based on the
accuracy of the Joint Position Sense (JPS, See Section 1.4) test. Adachi determined the number of
mechanoreceptors by staining ACL remnant cross sections with “Gairns gold chloride method, as
modified by Zemny et al.”, then flash frozen in liquid nitrogen. Using a light microscope, the total
number of mechanoreceptors (Ruffini receptors, Pacini receptors, and Golgi tendons) were
counted in each serial section. Dhillon et al. documented that intact ACLs have significant
mechanoreceptors, however, reconstructed ACLs do not have similar receptors after surgery [10].
However, the mechanoreceptors may develop over time through use of the ACL or the movement
of the knee through daily activities or rehabilitation. After the ACL reconstruction surgery, when
the original mechanoreceptors are no longer present, the neural communication system must be
reestablished with the new graft. For example, when the ACL experiences a force that displaces
the tibia, a message is sent to the hamstring to contract to prevent hyperextension. Without the

10
mechanoreceptors the communication is compromised, and the hamstring would not contract, and
the knee would not stabilize. Over time, neural communication improves but it may never recover
to the pre-injury state; this differential leads to proprioceptive deficits. To thoroughly understand
proprioception, this communication loop must be examined.
1.4. Existing Techniques to Measure Proprioception
Existing research documenting the deficit in proprioception after ACL reconstruction has
methodological challenges pertaining to the measurement of proprioception and the comparison
used in designs. Based on the existing literature, proprioception is typically measured using either
the Joint Position Sense (JPS) test or the Time Threshold to Detection of Passive Motion (TTDPM)
test. A 2014 publication by Relph at al. focused on ACL injuries and the effect on proprioception
were only able to identify studies using JPS and TTDPM techniques to measure proprioception[5].
JPS is defined as passively moving a joint to a specific angle and then the participant actively
reproduces the same angle. The difference in position can then be measured as the error, which is
the measure of a proprioceptive deficit. A typical JPS setup is shown in Figure 3 [21]. TTDPM is
defined as a measurement of the passive movement angle before the movement can be detected by
the participant [10], essentially how much movement is there before the participant notices the
movement. TTDPM is used much less than JPS, and when it is used it is typically in conjunction
with JPS.

11
Figure 3 Typical Joint Position Sense Test Set-up
While the results of both measures quantify proprioception, they don’t reflect the sense of
force or movement [8]. In addition, both methods are artificial and not applicable to real world
circumstances which have many more factors that influence an individual’s response and reaction.
JPS is also limited in the sense that it relies only on the error between the knee angles, a single
biomechanical parameter, [8] and neglects timing. There are even fewer studies that use TTDPM
and many of those studies also use JPS. Beyond the measurement of proprioception, few research
designs have incorporated an actual stimulus to which participants must respond so test conditions
tend to be artificial. The most commonly used measures of proprioception have challenges. Many
designs have been based on a single assessment many months post reconstruction that compares
the reconstructed knee to individual’s uninjured knee raising concerns about additional factors that
might influence results including type, leg dominance, severity of ACL injury, and muscle strength
differences among others. So, while the research indicates ACL reconstructions have limitations
with reestablishing proprioception to its pre-surgical state, the methods could be improved to gain
more detailed information about the proprioceptive process and where the challenges arise so that
information could be used more effectively in the recovery process.

12
1.5. Prior research involving EEG and EMG in ACL reconstruction subjects
Little is known about the role of the brain in proprioception. Baumeister et al. suggest EEG may
provide insight into the altered brain activity after an ACL reconstruction which may improve the
design of rehabilitation programs. He found a significantly higher frontal theta power in the ACL
group and higher Alpha-2 power in the ACL reconstructed limb, suggesting differences in focus
and attention as well as differences in sensory processing in the somatosensory cortex [17].
Baumeister et al. performed another study that uses background EEG in addition to the JPS test.
Baumeister suggested that if the afferent information from the knee are altered after reconstruction
surgery (proprioceptive deficits), then one can assume the cortical information processing has also
changed and may be detectable [8].
In related work, Arnfred et al. examined the processing in the temporal domain from a
stimulus and determined that event-related-potentials (ERPs) are very important for the
investigation of cognitive processing in the somatosensory cortex [18]. ERPs signify cognitive
activity in response to a stimulus, or event, which are typically quantified by onset latency and
amplitude. ERPs allow the transient cortical activity of the brain to be observed and recorded. The
recorded EEG data is segmented into “trials”, then the data is averaged over all the trials to get an
overall view of the transient EEG activity. Specific ERPs can then be found by polarity and timing,
as in Figure 4 [19]. The first ERP, N1, signifies negative polarity around 100 ms typically measured
between 70 and 200 ms. N70 represents the actual time that the signal is the most negative in the
time frame and where the ERP N1 actually occurs. P1 and N2 represent the polarity and what time
to look for that specific ERP and the P100 and N140 show the actual time of the specific ERP.

13
Figure 4 Event Related Potential
ERPs are sorted into two groups: early wave and cognitive. The early wave is typically within the
first 100 milliseconds after a stimulus and are denoted “sensory” while the “cognitive” EPRs
reflect how a person evaluates the current stimulus [20]. Differences in ERPs will be informative
when comparing ACL reconstructed legs with uninjured legs.
With regard to muscular activity, Solomonow et al. reviewed studies using EMG to observe
the muscle activity after an ACL reconstruction when force was exerted on the knee and observed
no muscle activity in the hamstrings. They suggest that just after surgery the communication
between the new graft and the muscles may not have been established [4]. By using an EMG to
monitor muscle activity, it allowed researchers to observe the timing of muscle contractions and
the strength of those contractions while using the Joint Position Sense (JPS) test to measure
proprioception.

14
2. METHODS
2.1. Participants
Participants were between the ages of 18 and 30 and categorized themselves as physically
active. There was a total of 10 participants (only females) in this study. Five of the participants
had an ACL reconstruction within the past 8-18 months and five of the participants had no history
of knee injuries. The study procedure was approved by the Institutional Review Board (IRB) and
all the participants signed a consent form that laid out the testing procedure and participation
expectations, as well as a questionnaire. Participants could stop at any point during the testing.
2.2. Equipment
Testing and data collection took place in the Biomechanics & Motor Control Lab in New
Hampshire Hall at the University of New Hampshire. This study used BrainProductsTM EEG and
EMG instrumentation (actiCHamp, actiPOWER, SplitterBox BP-04242-32, TriggerBox BP-245-
1550, BIP2AUX adaptor) in the lab. In addition, a platform perturbator provided forward and
backward movement as a stimulus to which participants reacted. More detailed discussion of the
equipment used follows.
2.2.a. Platform Perturbator
A platform perturbator was used to offset one's balance by quickly moving the platform
forward and backward on which the subject stands. There was no side to side (lateral) movement.

15
Figure 5 Platform Perturbator
An electric linear actuator was attached to the base and was used to shift the platform. A DC
voltage supply powered the actuator while high power metal-oxide-semiconductor field-effect
transistors (MOSFET, IRL520 and IRL9540) were used in an H-Bridge configuration for control.
A trigger was generated by the researcher that sent a signal to the gate leads of the diagonal
MOSFETs to turn them on, which then turned on the actuator. Rollers were placed below the
platform and used as linear motion guides to reduce the frictional force added from the weight of
the subject [22]. The platform perturbator moved one inch per second for a duration no longer than
one second. As the subject regained their balance, the perturbator remained idle until it received
another signal to perturbate the subject backwards. The platform perturbator was controlled using
an H-bridge circuit, shown in Figure 6, which allowed the researcher to use a controller to move
the platform forward and backwards.

16
Figure 6 H-Bridge Switch Circuit
2.2.b. Electroencephalogram (EEG)
The EEG was used to measure the cortical activity of the brain using surface electrodes on
the scalp. EEG is typically used in two ways, to observe background EEG or ERPs. There are 4
frequency bands that are usually measured with background EEG: delta (<4 Hz), theta (4-7 Hz),
alpha (8-13 Hz), and beta (14-50 Hz). Delta frequencies are generally seen during sleep, theta
frequencies are seen during disappointment, frustration, and meditation, alpha frequencies are
prominent during a resting period with eyes closed, and beta frequencies are seen during intense
mental activity with eyes open [23]. For this study, background EEG was not investigated. EEG
signals were measured using the BrainVisionTM software (BrainVision Recorder Version
1.21.0004 and BrainVision Analyzer Version 2..1.327) and a 64 channel EEG cap (see Figure 7
[24]) to extract event related potentials corresponding to the stimulus. An ERP is the measured brain
response directly related to a specific sensory, cognitive, or motor event. The specific ERPs

17
investigated were the N100 and P300. The N100 is observed between 90-200 ms after an
unexpected stimulus is presented. The P300 is observed 200-400 ms after the stimulus and is
elicited in the decision-making process and a person’s reaction to the stimulus [20]. For this study,
the EEG was recorded with a frequency range from 0.1 to 50 Hz and a sampling rate of 1000 Hz.
The EEG was recorded in a unipolar manner with reference electrode FCz and ground electrode
FPz.
Figure 7 Layout of 64 Channel EEG Cap
Figure 8 Areas of the Brain
The areas of the brain that were monitored included the motor cortex and the
somatosensory cortex. The motor and somatosensory cortices are near the middle of the brain as

18
shown in Figure 8 [25]. These areas were monitored using a 64 channel EEG cap as shown in Figure
7 to look at specific ERPs. While all 64 channels were recorded, only 44 channels were used for
data analysis (green in Figure 7). The remaining channels were left un-prepped and removed
during analysis (red in Figure 7). The EEG cap used preamplified electrodes (See Figure 9) [26] for
each channel that attached to an amplifier with the BrainVisionTM system.
Figure 9 Pre-Amplifier EEG electrode
2.2.c. Electromyogram (EMG)
The EMG was used to assess the health of muscles and the motor neurons that control
them. The motor neuron sends an electrical signal to the muscle resulting in muscle contraction
[27]. An electromyogram uses surface or invasive electrodes to detect the summated electrical
activity of muscle cells. The signals obtained from the EMG were used to determine timing of
muscle reactions to the perturbator [2]. To best determine the reaction, EMG signals were obtained
from four different leg muscles: rectus femoris, gluteus maximus, tibialis anterior and
gastrocnemius. Figure 10 displays each of these muscles and the electrode placement. These four
muscles play key roles in postural stability. These muscles allowed researchers to observe synergy
patterns of the leg muscles. For this study, the EMG was recorded with a frequency range from 20
to 450 Hz and a sampling rate of 1000 Hz.

19
10a. Tibialis Anterior Muscle 10b. Gastrocnemius Muscle
10c. Rectus Femoris Muscle 10d. Gluteus Maximus Muscle
Figure 10 Four muscles used for EMG signals and the respective electrode locations

20
2.3. Measures
Proprioceptive responses were measured using EEG and EMG. The procedure used a
platform perturbator to serve as the stimulus. An individual stood on the platform perturbator and
the platform was controlled to move slightly forward or backward. The individual had EEG and
EMG sensors to measure the individual’s response each time the perturbator moved.
The EEG monitored the cortical brain activity and the EMG monitored the activity of the
muscles that assist in re-stabilizing the body post-perturbation. The EMG allowed two different
muscle responses to be observed, the reflex response and the cognitive reflex response. Each
muscle response had an onset time and peak time, the onset corresponded to the first sign of muscle
activity and the peak corresponded to the maximum contraction. The reflex response is a result of
the involuntary response from the spinal cord. When the platform moved, a spinal-level motor
reflex response was initiated resulting in a muscle contraction of the muscles stabilizing the knee.
Simultaneously, the cognitive reflex response was continues up the spinal cord to the sensorimotor
cortex. The motor cortex transmitted signals through the spinal cord to the muscles around the
knee to contract and re-stabilize the body, this muscle response corresponded with the cognitive
reflex response. The comparison of responses is illustrated in Figure 11[28] where the reflex
response (purple) is the involuntary response from the spinal cord directly back to the knee
musculature. The blue and red paths shown is the collective cortical response that originates from
the knee to the brain, which then sends signals back to the muscles through the spinal cord.

21
Figure 11 Spinal Reflex Response vs Cortical Response
Along with recording muscle responses from the platform perturbator, EEG data was used
to observe the cortical brain activity during this process. By specifically looking at the electrodes
over the sensorimotor cortex it was determined when information was received by a certain area
of the brain and when information was being sent out from that area. By using both EEG and EMG
measurements, the timing of responses could be tracked from the movement of the perturbator in
relationship to the neural and muscular response. This combined approach allowed the entire
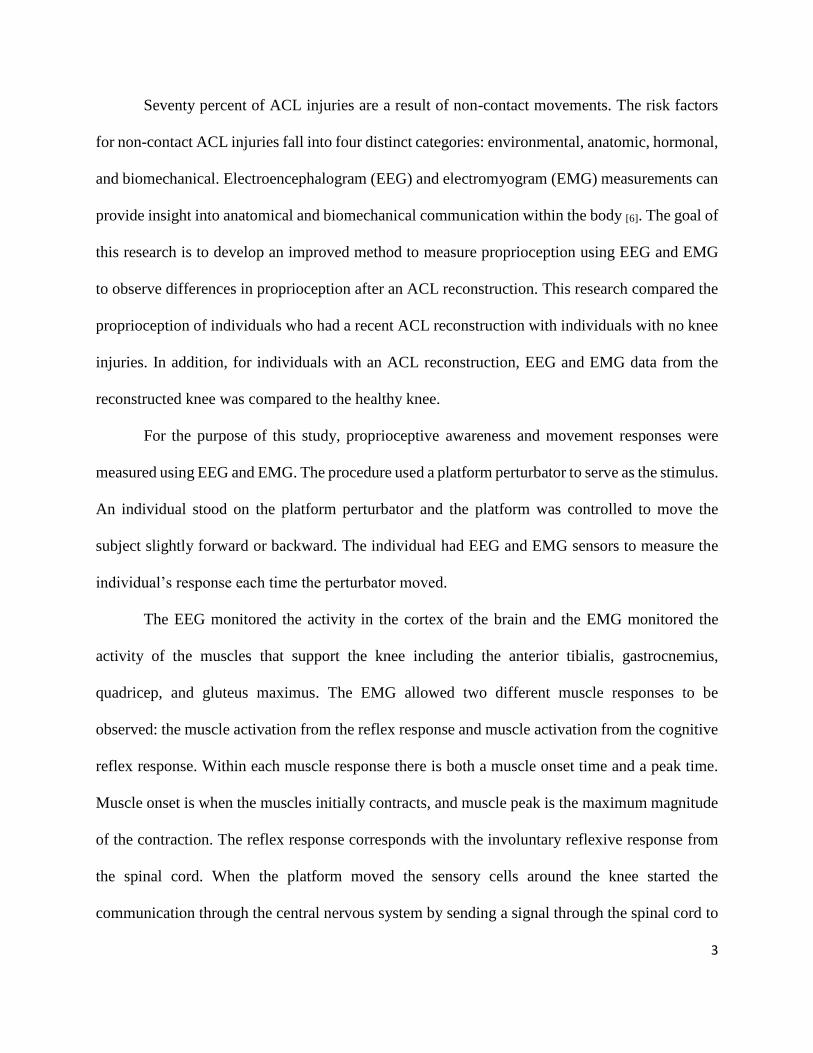
proprioceptive response to be measured through signal processing and data analysis. Figure 12
shows a block diagram of the test set-up.
22
Figure 12 Block Diagram of Test Set-up

23
2.4. Procedure
Participants were tested at the Biomechanics & Motor Control Lab in New Hampshire Hall
at a mutually convenient time. Participants were given a thorough explanation of the study and
read and signed the informed consent. Participants were given a brief questionnaire asking
questions about any injuries, dominant leg, demographic questions, and questions related to other
risk factors for ACL injuries. A copy of the questionnaire and consent form are included in the
Appendix. When participants arrived at the Biomechanics & Motor Control Lab, there was soft
piano music playing until the participant stepped onto the platform to begin testing. The testing
space was an environmentally comfortable room.
The EMG was used to measure the level of muscle electrical activity of the Anterior
Tibialis (AT), Medial Gastrocnemius (MG), Quadricep (Q), and Gluteus Maximus (GM).
Silver/silver chloride pre-gelled surface electrodes were placed 2.5 cm apart and parallel to the
muscle fibers over the longitudinal midline between the motor point and the tendon. Thorough
skin preparation for electrode placement included removal of dead epithelial cells with a razor,
isopropyl alcohol, and an abrasive pre-gel (Nuprep abrasive preparation gel). The skin was cleaned
and abraded to reduce the skin impedance for a better signal. EMG was recorded with a frequency
range from 20 to 450 Hz and a sampling rate of 1000 Hz.
For the EEG, the participants head circumference was measured to best fit a 64-channel
EEG cap. An example of the 64-channel EEG cap that was used is shown in Figure 13[26].

24
Figure 13 64 Channel EEG cap
Gel was applied to each electrode site with a blunt needle (which additionally slightly abrades the
scalp to reduce contact impedance) until an impedance of less than 25-kΩ was reached to improve
the quality of the signals. EEG was recorded with a frequency range from 0.1 to 50 Hz and a
sampling rate of 1000 Hz.
Each participant stood with no shoes on the platform perturbator. Earbuds were worn to
drown out the motor actuator prior to the platform perturbator moving so that the participant could
not anticipate the movement. To allow each leg to be individually tested, the leg tested had the
foot firmly planted on the platform while only the toe of the other foot was touching to help with
balance as shown in Figure 14.

25
Figure 14 Platform Perturbator Stance
EMG and EEG data collection was synchronized with perturbator data via auxiliary inputs
into the EEG system hardware. EEG and EMG data were recorded and analyzed using the
BrainVisionTM Recorder and Analyzer Software.
One trial consisted of the participant being perturbated forward at a speed of one inch per
second for a random duration (400 to 1000 ms), and then moved backwards once balance had been
regained. Perturbation timing was randomized between 0.5 and 5 seconds to reduce the
participant’s anticipation of the platform movement. The platform never moved more than one
inch for a single trial. Generally, participants maintained balance, but if the participant lost balance
during a trial, the next trial did not progress until they had comfortably regained balance. For each
participant, 100 accurate responses were taken with either two-minute standing or sitting breaks
after every 25 trials to prevent muscle fatigue. The heart rate of the participants was observed at 3

26
times during the testing period to help determine changes in the participant heart rate: before
starting the perturbation on the first leg, before starting perturbation on the second leg and after
the second leg was finished.
The procedure for recording measurements:
1. Measure and record heart rate
2. Start recording on the BrainVisionTM Recorder software
3. Save file for new subject with the leg being tested and the testing date
4. Participant stands on the one leg being tested with the other leg just for balance
5. Remain standing for 25 trials forwards and 25 trials backwards
6. 2 minute break so the participants legs don’t get fatigued
7. 25 trials forward/25 trials backwards
8. 2 minute break
9. 25 trials forward/25 trials backwards
10. 2 minute break
11. 25 trials forward/25 trials backwards
12. Stop recording
13. Remove EMG from tested leg
14. Set up EMG electrodes on other leg
15. Reevaluate EEG impedances
16. Reapply gel to EEG electrodes if necessary
17. Measure and record heart rate
18. Start recording on the BrainVisionTM Recorder software for other leg
19. Save file for new subject with the leg being tested and the testing date

27
20. 100 trials forward and 100 trials back with 2 minute break every 25 trials
21. Stop recording
22. Measure and record heart rate
23. Remove EEG cap
24. Remove EMG electrodes

28
2.5. Analysis
Data analysis was performed using BrainVisionTM Analyzer on the raw data recorded from
the BrainVisionTM Recorder. The unused channels were removed: TP9, TP7, F7, F8, FT9, T7, P7,
P5, P6, P8, PO7, PO3, POz, PO4, PO8, O1, O2, Oz, TP8, TP10, T8, and FT10 (See Figure 7).
These channels were not prepped with the EEG cap; therefore, no analysis was necessary. All
remaining EEG signals were bandpass filtered from 0.1 to 50 Hz and the EMG signals were filtered
from 70 to 200 Hz.
Figure 15 Filtered EEG and EMG Signals
Ocular correction used independent component analysis (ICA) to detect and remove artifacts
created by blinks. The occular correction used FP1 as the reference for eye artifacts.
The data was then segmented into 600 ms epochs, 200ms pre-stimulus to 400ms post
stimulus. The platform perturbation served as the stimulus which was connected through the H-
Bridge circuit to the trigger box. For each movement of the platform, a stimulus marker was
recorded on the BrainVisionTM recorder to be synchronized with the data. The pre-stimulus time
was used for baseline correction.

29
Figure 16 EEG signals averaged over all trials
Each EEG channel was then averaged over all trials, allowing for detection of ERPs. Figure 16
shows the averaged EEG data over each epoch. The averaged data had the same timing as the
segmented epoch, where the beginning of the signal was at 200 ms before the stimulus and the end
was 400ms after the stimulus. The stimulus marker was recorded as “time 0” which is shown by
the vertical line across ever channel. The BrainVisionTM peak detection algorithm was used to
search for the N100 and P300. The N100 is the most negative component between 90 and 200 ms
post stimulus and the P300 is the most positive component between 200 and 400 ms post stimulus.
The axis in Figure 17 are flipped, so positive polarity is the bottom and negative polarity is towards
the top of the figure. Figure 17 also provides a typical current source density (CSD) map at 0 ms
(stimulus), N100 peak time, P300 peak time, and 400 ms post stimulus.

30
Figure 17 Averaged EEG at Cz along with CSD maps to show cortical activity
The built in CSD function performed the spatial second derivative for each electrode
relative to the surrounding electrodes. This shows the areas of the brain that has the most activity
along with the polarity: red denotes a positive polarity and blue denotes negative polarity. While
not all electrode sites were prepped, the sites surrounding the motor cortex and somatosensory
cortex were, so the CSD maps can accurately show what occured in those areas. Averaged Cz data
and CSD maps are provided for every participant in Appendix E.
Two separate EMG searches were computed to find the muscle contraction corresponding
with the reflex and cognitive reflex response. The reflex response search was limited from the time
of the stimulus to the time of the N100 potential, while the cognitive reflex response search was
from the N100 potential to the end of the epoch (400ms). The ERP data and both EMG data sets
were exported to be analyzed outside of the BrainVisionTM software to determine the timing of
each response. The two distinct muscle contractions are shown in Figure 18.
N100
P300
-200 ms 200 ms 0 ms 400 ms

31
Figure 18 Initial and Secondary muscle contractions
For this study, five different processes were examined as measures of proprioception
including the reflex response, cognitive processing, cognitive reflex response, afferent signal to
the motor cortex, and efferent signal from the motor cortex. Each process is shown in Figure 19.
The reflex response is the time from the movement of the platform perturbator (stimulus) to each
muscle’s initial peak contraction. The cognitive processing time is defined as the time from the
N100 ERP at Cz to the P300 ERP at Cz. The cognitive reflex response is the time from the
movement of the platform perturbator (stimulus) to each muscle’s secondary peak contraction. The
afferent signal to the motor cortex is the time from the movement of the platform to the N100 ERP
at Cz and the efferent signal is from the N100 ERP at Cz to the secondary peak contraction of each
muscle. The timing of all responses was calculated using the peak EMG time.
Second
Muscle
Contraction
Initial
Muscle
Contraction
-200 ms 200 ms 0 ms 400 ms

32
Figure 19 Timing of Each Response with EEG and EMG data
Stimulus
N100
P300
Initial
Muscle
Contraction
Second
Muscle
Contraction
Reflex Response
Cognitive Reflex Response
Cognitive Processing
Time
Afferent Signal
Efferent Signal
-200 ms 200 ms 0 ms 400 ms

33
3. RESULTS
The results presented compare the muscle activity and cognitive activity as participants
engaged in the proprioceptive process. Participants with an ACL reconstruction are compared to
two different control conditions: one between subjects and one within subjects. In Section 3.1, the
first set of comparisons examines aggregated data from the ACL reconstructed participants and
aggregated data from an independent group of healthy participants. In selecting the comparison
leg for the healthy controls, four of five participants were right leg dominant and had left leg with
ACL reconstructions. Thus, the control group mirrored the ACL group by including four left, non-
dominant legs, and one right, dominant leg used in the comparison group. In Section 3.2, the
second comparison was within subjects and examined five participants’ ACL reconstructed leg
with their other healthy leg. Results are presented in aggregate as well as pairing the ACL leg to
the healthy leg.
Results are presented with regard to the following hypotheses informed by prior research.
While results are displayed and were tested using statistical procedures, given the very small
sample size, statistically significant results are unlikely, but trends may indicate directions for
future research.
It was hypothesized that:
1) Participants with ACL reconstructions will have different response timing related to
proprioception than participants with healthy knees across the following measures:
a. Reflex response
b. Cognitive reflex response

34
c. Efferent signals from the motor cortex
d. Afferent signals to the motor cortex
e. Cognitive processing time
2) Participants with ACL reconstructions will have different response timing related to
proprioception in their ACL reconstructed knees as compared with their healthy knees
across the following measures:
a. Reflex response
b. Cognitive reflex response
c. Efferent signals from the motor cortex
d. Afferent signals to the motor cortex
e. Cognitive processing time
3.1 ACL group vs Healthy group
This comparison addresses whether on average there is a difference in processing time required
for proprioception between individuals who had a reconstructed ACL as compared to individuals
who never had a similar injury.
3.1.a. Reflex Response
The mean reflex response time (Time from the perturbation stimulus to the first peak contraction)
is shown for each participant in Table 1.

35
Participant Anterior
Tibialis
Gastrocnemius Quadricep Gluteus
Maximus
*3 52.96 53.14 na 54.86
8 53.71 51.33 54.11 58.67
*4 73.34 96.87 79.41 84.30
7 74.38 88.57 71.48 80.00
*5 73.70 70.11 72.07 66.41
1 74.23 80.62 76.75 80.99
*9 62.70 59.47 62.72 65.86
2 76.65 78.40 77.82 81.47
*10 109.15 109.12 108.29 101.30
6 59.00 85.59 78.58 73.51
*Represents ACL participant
Table 1 Reflex Response of Individuals matched by BMI and leg dominance
Aggregated Mean Reflex Response times for all participants in the ACL Group compared to the
healthy control group across all four muscles is shown in Figure 20. The ACL group had a longer
mean reflex time across three of the four muscles, though the differences were not statistically
significant using independent samples t-tests (Anterior Tibialis: t(8)=.640, p=.540;
Gastrocnemius: t(8)=.066, p=.949; Quadricep: t(7)=.880, p=.408; Gluteus Maximus: t(8)=-.041,
p=.968)

36
Figure 20 Mean Reflex Response Time for ACL Group compared to Healthy Controls
Independent samples t-tests were conducted to compare the difference between onset and peak in
the reflex response for participants with an ACL reconstruction as compared to participants with
healthy knees, shown in Figure 21. The results were not statistically significant between groups
for the difference between onset and peak for the reflex response across all four muscles (Anterior
Tibialis: t(8)=.753, p=473; Gastrocnemius: t(8)=-.218, p=.833; Quadricep: t(7)=1.084, p=.314;
Gluteus Maximus: t(8)=-.296, p= .795).
Anterior
TibialisGastrocnemius Quadricep
Gluteus
Maximus
ACL Group 74.37 77.74 80.62 74.55
Control Group 67.60 76.90 71.75 74.93
0102030405060708090
ms
Mean Reflex Response Time comparing ACL Group to Healthy
Control Group
ACL Group Control Group

37
Figure 21 Difference between Peak and Onset Reflex Response Time for ACL Group compared
to Healthy Controls
3.1.b. Cognitive Reflex Response
The mean cognitive reflex response time (Time from the perturbation stimulus to the second peak
contraction) is shown for each participant in Table 2.
Participant Anterior
Tibialis Gastrocnemius Quadricep
Gluteus
Maximus
*3 249.20 245.69 na 253.25
8 238.99 215.26 248.97 237.95
*4 258.66 250.62 251.13 255.28
7 261.24 220.18 263.67 274.89
*5 227.01 187.21 246.70 247.49
1 275.39 267.17 275.67 277.89
*9 241.71 233.19 242.08 230.35
2 262.11 250.52 264.48 265.60
*10 300.88 297.24 301.41 301.38
6 176.88 193.93 204.70 213.41
*Represents ACL participant
Table 2 Cognitive Reflex Response of Individuals matched by BMI and leg dominance
Anterior
TibialisGastrocnemius Quadricep
Gluteus
Maximus
ACL Leg 45.72 44.34 51.14 45.32
Healthy Leg 37.79 47.67 41.02 47.86
0.00
10.00
20.00
30.00
40.00
50.00
60.00
ms
Difference between Peak and Onset for Reflex Response
comparing ACL Group to Healthy Control Group
ACL Leg Healthy Leg

38
Aggregated Mean Cognitive Reflex Response times for all participants in the ACL Group in
comparison to the Healthy Control Group across all four muscles is shown in Figure 22. The ACL
group had slightly longer mean Cognitive Reflex Response time across four muscles, though the
difference was not statistically significant using independent samples t-tests (Anterior Tibialis:
t(8)=.585, p=.575; Gastrocnemius: t(8)=.610, p=.559; Quadricep: t(7)=.475, p=.650; Gluteus
Maximus: t(8)=.211, p=.838).
Figure 22 Mean Cognitive Reflex Response comparing ACL Group to Healthy Control Group
Independent samples t-tests were conducted to compare the difference between onset and peak in
the cognitive reflex response for participants with an ACL reconstruction as compared to
participants with healthy knees, shown in Figure 23. The results were not statistically significant
between groups for the difference between onset and peak for the cognitive reflex response across
Anterior
TibialisGastrocnemius Quadricep
Gluteus
Maximus
ACL Group 255.49 242.79 260.33 257.55
Control Group 242.92 229.41 251.50 253.95
0
50
100
150
200
250
300
ms
Mean Cognitive Reflex Response comparing ACL Group to
Healthy Control Group
ACL Group Control Group

39
all four muscles (Anterior Tibialis: t(8)=-.321, p=.756; Gastrocnemius: t(8)=-.645, p=.537;
Quadricep: t(8)=-1.410, p=.196; Gluteus Maximus: t(8)=-1.118 , p=.296). The difference in
timing between the reflex response and cognitive reflex response is shown in Figure 24.
Figure 23 Difference between Peak and Onset Cognitive Reflex Response Time for ACL Group
compared to Healthy Controls
Anterior
TibialisGastrocnemius Quadricep
Gluteus
Maximus
ACL Leg 79.27 60.95 80.93 77.20
Healthy Leg 84.48 72.44 90.84 90.91
0.00
20.00
40.00
60.00
80.00
100.00
ms
Difference between Peak and Onset for Cognitive Reflex
Response comparing ACL Group to Healthy Control Group
ACL Leg Healthy Leg

40
Figure 24 Difference between Cognitive and Reflex Response for ACL group and Healthy Group
3.1.c. Efferent Signals from the Motor Cortex
The mean efferent signal times from the motor cortex (Time from P100 at Cz to second peak EMG
contraction) are shown for each participant in Table 3.
Participant Anterior
Tibialis Gastrocnemius Quadricep
Gluteus
Maximus
*3 138.20 134.69 na 142.25
8 128.99 105.26 138.97 127.95
*4 104.66 96.62 97.13 101.28
7 108.24 67.18 110.67 121.89
*5 91.01 51.21 110.70 111.49
1 117.39 109.17 117.67 119.89
*9 133.71 125.19 134.08 122.35
2 107.11 95.52 109.48 110.60
*10 196.88 193.24 197.41 197.38
6 53.88 70.93 81.70 90.41
*Represents ACL participant
Table 3 Efferent Signal Time from Motor Cortex of Individuals matched by BMI and leg
dominance
Anterior
TibialisGastrocnemius Quadricep
Gluteus
Maximus
ACL Group 181.12 165.05 179.71 183.00
Healthy Group 175.33 152.51 179.75 179.02
0
50
100
150
200
ms
Difference between Cognitive and Reflex Response for ACL
group and Healthy Group
ACL Group Healthy Group

41
Aggregated Mean Efferent Response times for all participants in the ACL Group in comparison to
the Healthy Control Group across all four muscles is shown in Figure 25. The ACL group had a
longer mean efferent signal time from the motor cortex to three of the four muscles, though the
difference was not statistically significant using independent samples t-tests (Anterior Tibialis:
t(8)=1.330, p=.220; Gastrocnemius: t(8)=1.228, p=.254; Quadricep: t(7)=1.046, p=.330; Gluteus
Maximus: t(8)=1.14, p=.287).
Figure 25 Aggregate Mean Efferent Signals from Motor Cortex for ACL Group and Healthy
Controls
3.1.d. Afferent Signals to the Motor Cortex
The mean afferent signal times to the motor cortex (Time from platform stimulus to N100 at Cz)
are shown for each participant in Table 4.
Anterior
TibialisGastrocnemius Quadricep
Gluteus
Maximus
ACL Group 132.89 120.19 134.83 134.95
Control Group 103.12 89.61 111.70 114.15
020406080
100120140160
ms
Mean Efferent Signal Time from Motor Cortex comparing ACL
Group to Healthy Control Group
ACL Group Control Group

42
Participant Average Time
3* 111
8 110
4* 154
7 153
5* 136
1 158
9* 108
2 155
10* 104
6 123
*Represents ACL participant
Table 4 Afferent Signal Time to Motor Cortex
The ACL group had slightly faster afferent signal time to the motor cortex as shown in Figure 26,
however, the difference was not statistically significant using independent samples t-test (t(8)=-
1.253, p=.245).
Figure 26 Mean Afferent Signal Time to Motor Cortex
Average Time
ACL Group 122.60
Healthy Group 139.80
0
20
40
60
80
100
120
140
160
ms
Mean Afferent Signal Time to Motor Cortex comparing ACL
Group to Healthy Control Group

43
3.1.e. Cognitive Processing Time
The mean cognitive processing time (time from N100 at Cz to P300 at Cz) for each participant is
presented in Table 5.
Participant Average Time
3* 147
8 122
4* 124
7 69
5* 83
1 164
9* 148
2 79
10* 147
6 141
*Represents ACL participant
Table 5 Cognitive Processing Time in Motor Cortex of Individuals
The ACL group had longer mean cognitive processing time as compared to the healthy control
group, however, the difference was not statistically significant using independent samples t-test
(t(8)=.673, p=.250).

44
Figure 27 Mean Cognitive Processing Time in the Motor Cortex
Average Time
ACL Group 129.80
Healthy Group 115.00
0
20
40
60
80
100
120
140
ms
Mean Cognitive Processing Time in the Motor Cortex
comparing ACL Group to Healthy Control Group

45
3.2 ACL leg vs Healthy leg within ACL participant
In this set of analyses, only participants who had a reconstructed ACL were included. Analyses
were done comparing ACL Reconstructed legs and the same participants’ healthy legs both in
aggregate as well as using a within subjects’ analysis. Both results are presented.
3.2.a. Reflex Response within ACL Participants
The mean reflex response time (Time from the perturbation stimulus to the first peak contraction)
is shown for each participant and each leg in Table 6.
Participant Leg Anterior
Tibialis
Gastrocnemius Quadriceps Gluteus
Maximus
3
ACL 52.96 53.14 na 54.86
Healthy 54.60 65.00 51.28 56.43
4 ACL 73.34 96.87 79.41 84.30
Healthy 74.66 70.03 81.27 75.49
5 ACL 73.70 70.11 72.07 66.41
Healthy 99.17 73.97 74.85 83.28
9 ACL 62.70 59.47 62.72 65.86
Healthy 68.72 83.62 73.13 71.56
10 ACL 109.15 109.12 108.29 101.30
Healthy 105.33 103.74 96.08 90.04
Table 6 Reflex Response of ACL Participants
Figure 28 displays the aggregate Mean Reflex Response time comparing healthy and ACL
reconstructed legs from ACL Participants. There is variability across muscles, but the data suggests
that the ACL legs may be slightly faster on average than the healthy legs for three of the four
muscles. Paired t-tests were not statistically significant (Anterior Tibialis: t(4)=-1.206; p=.294;
Gastrocnemius: t(4)=-.178; p=.867; Quadricep: t(3)=-.151; p=.890; Gluteus Maximus: t(4)=-.160;
p=.881).

46
Figure 28 Mean Reflex Response Times within ACL Participants
Paired samples t-tests were conducted to examine the difference between onset and peak for the
reflex response within ACL participants comparing their ACL leg and healthy leg, shown in Figure
29. Statistically significant differences were not detected for the reflex response between onset and
peak across all four muscles (Anterior Tibialis: t(4)=-.307, p=.774 ; Gastrocnemius: t(4)=-.122,
p=.909; Quadricep: t(3)=.632, p=.572; Gluteus Maximus: t(4)=.117, p=.912 ).
Anterior
TibialisGastrocnemius Quadricep
Gluteus
Maximus
ACL Leg 74.37 77.74 80.62 74.55
Healthy Leg 80.49 79.27 75.32 75.36
0102030405060708090
ms
Mean Reflex Response Time for ACL Group comparing ACL
and Healthy Leg
ACL Leg Healthy Leg

47
Figure 29 Difference between Peak and Onset Reflex Response Times within ACL Participants
In a pair-wise comparison, differences were calculated in reflex response time between each
participant’s healthy leg and ACL leg. The results are shown in Figure 30. Differences that are
positive indicate that that ACL leg is faster and those that are negative suggest the healthy leg is
faster. It is apparent that there is a fair amount of consistency within participants across muscles.
Three participants had a faster reflex response in their ACL leg and two had faster reflex response
in their healthy leg.
Anterior
TibialisGastrocnemius Quadricep
Gluteus
Maximus
ACL Leg 45.72 44.34 52.05 45.32
Healthy Leg 46.93 45.72 43.66 44.71
0.00
10.00
20.00
30.00
40.00
50.00
60.00
ms
Difference between Peak and Onset for Reflex Response
comparing ACL and Healthy Leg
ACL Leg Healthy Leg
48
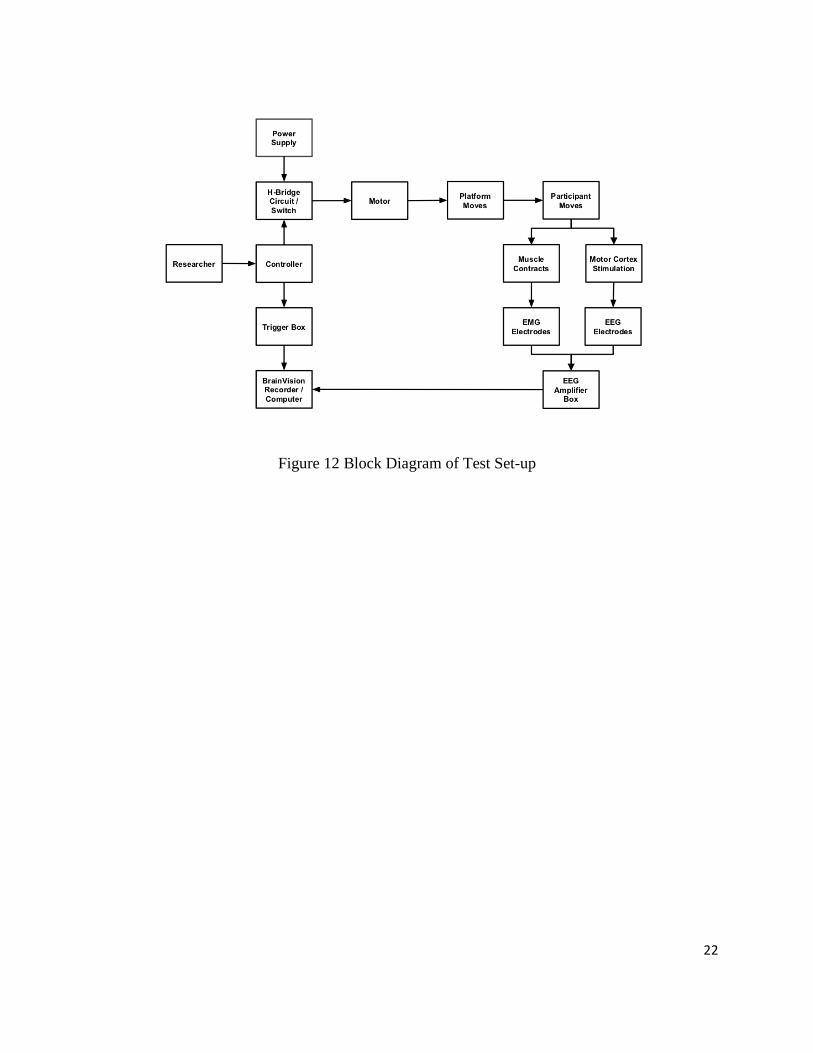
Figure 30 Reflex Response Differences within ACL Participants
3.2.b. Cognitive Reflex Response within ACL Participants
The mean cognitive reflex response time (Time from the perturbation stimulus to the second peak
contraction) is shown for each leg for each ACL participant from in Table 7.
Participant Leg Anterior
Tibialis Gastrocnemius Quadricep
Gluteus
Maximus
3 ACL 249.20 245.69 na 253.25
Healthy 247.32 181.59 242.57 230.03
4 ACL 258.66 250.62 251.13 255.28
Healthy 273.19 254.10 272.81 264.96
5 ACL 227.01 187.21 246.70 247.49
Healthy 245.72 277.81 274.17 263.15
9 ACL 241.71 233.19 242.08 230.35
Healthy 255.55 222.07 243.43 251.30
10 ACL 300.88 297.24 301.41 301.38
Healthy 302.26 300.73 293.63 303.23
Table 7 Cognitive Reflex Response of ACL Participants
3 4 5 9 10
Gluteus Maximus 1.57 -8.81 16.87 5.70 -11.27
Quadricep 0.00 1.86 2.78 10.42 -12.21
Gastrocnemius 11.86 -26.84 3.86 24.15 -5.37
Anterior Tibialis 1.64 1.31 25.46 6.02 -3.83
-40
-20
0
20
40
60ACL is faster
(+)
(ms)
Healthy is faster
(-)
Reflex Response Difference between Healthy and ACL
Constructed Knees
Anterior Tibialis Gastrocnemius Quadricep Gluteus Maximus
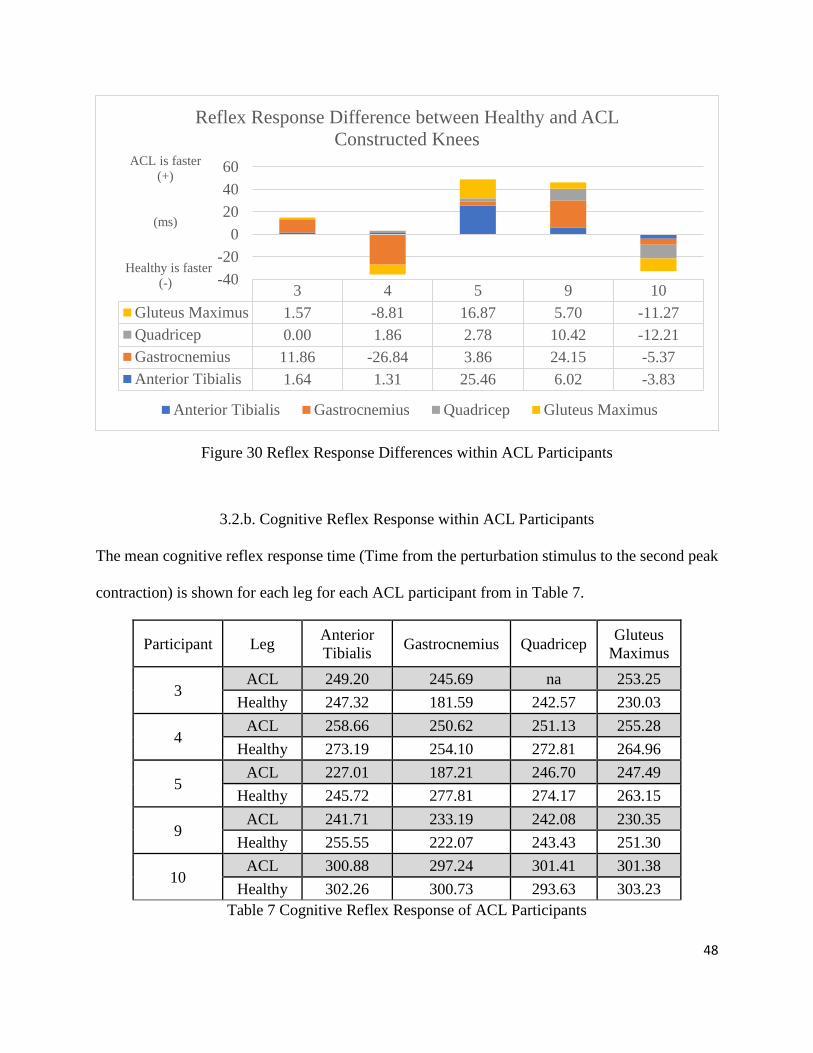
49
Examining ACL participants’ ACL reconstructed and healthy knees in aggregate shows a slight
difference between legs with ACL legs displaying faster cognitive reflex response times as
compared to healthy legs as shown in Figure 31. Paired t-tests were not statistically significant
(Anterior Tibialis: t(4)=-2.314, p=.082; Gastrocnemius: t(4)=-.180, p=.866; Quadricep: t(3)=-
1.284, p=.289; Gluteus Maximus: t(4)=-.645, p=.554).
Figure 31 Aggregate Mean Cognitive Reflex Response for ACL Participants
Anterior
TibialisGastrocnemius Quadricep
Gluteus
Maximus
ACL Leg 255.49 242.79 260.33 257.55
Healthy Leg 264.81 247.26 271.01 262.53
0
50
100
150
200
250
300
ms
Aggregate Mean Cognitive Reflex Response for ACL
Participants comparing ACL Reconstructed Leg to Healthy
Leg
ACL Leg Healthy Leg

50
Paired samples t-tests were conducted to examine the difference between onset and peak for the
cognitive reflex response within ACL participants comparing their ACL leg and healthy leg,
shown in Figure 32. Statistically significant differences were not detected for the cognitive reflex
response between onset and peak across all four muscles (Anterior Tibialis: t(4)=-1.840, p=.140;
Gastrocnemius: t(4)=-.659, p=.546; Quadricep: t(3)=-1.310, p=.260; Gluteus Maximus: t(4)=-
1.117, p=.327). The difference in timing between the reflex response and cognitive reflex response
is shown in Figure 33.
Figure 32 Difference between Peak and Onset Cognitive Reflex Response Times within ACL
Participants
Anterior
TibialisGastrocnemius Quadricep
Gluteus
Maximus
ACL Leg 79.27 60.95 71.38 77.20
Healthy Leg 96.66 79.03 129.90 93.22
0.00
20.00
40.00
60.00
80.00
100.00
120.00
140.00
Ax
is T
itle
Difference between Peak and Onset for Cognitive Reflex
Response comparing ACL and Healthy Leg
ACL Leg Healthy Leg

51
Figure 33 Difference between Cognitive and Reflex Response for ACL Leg and Healthy Leg
In a pair-wise comparison, differences were calculated in cognitive reflex response time between
each participant’s healthy leg and ACL leg. The results are shown in Figure 34. Differences that
are positive indicate that that ACL leg is faster and those that are negative suggest the healthy leg
is faster. There was only one participant for whom the ACL leg was much faster.
Anterior
TibialisGastrocnemius Quadricep
Gluteus
Maximus
ACL Leg 181.12 165.05 179.71 183.00
Healthy Leg 184.31 167.99 195.69 187.17
0
50
100
150
200
250
ms
Difference between Cognitive and Reflex Response for ACL
Leg and Healthy Leg
ACL Leg Healthy Leg

52
Figure 34 Cognitive Reflex Response Differences within ACL Participants
3.2.c. Efferent signals from the Motor Cortex
The mean efferent signal times from the motor cortex(Time from P100 at Cz to second peak EMG
contraction) are shown for each leg of each ACL participant in Table 8.
Participant Leg Anterior
Tibialis Gastrocnemius Quadricep
Gluteus
Maximus
3 ACL 138.20 134.69 na 142.25
Healthy 138.32 72.59 133.57 121.03
4 ACL 104.66 96.62 97.13 101.28
Healthy 110.19 91.10 109.81 101.96
5 ACL 91.01 51.21 110.70 111.49
Healthy 88.72 120.81 117.17 106.15
9 ACL 133.71 125.19 134.08 122.35
Healthy 119.55 86.07 107.43 115.30
10 ACL 196.88 193.24 197.41 197.38
Healthy 187.26 185.73 178.63 188.23
Table 8 Efferent Signals from the Motor Cortex for ACL Participants
3 4 5 9 10
Gluteus Maximus -23.21 9.68 15.66 20.95 1.85
Quadricep 0.00 21.68 27.47 1.35 -7.78
Gastrocnemius -64.10 3.49 90.60 -11.13 3.49
Anterior Tibialis -1.88 14.53 18.71 13.84 1.38
-150-100-50
050
100150200ACL is faster
(+)
ms
Healthy is faster
(-)
Cognitive Reflex Response Difference between Healthy and
ACL Reconstructed Legs
Anterior Tibialis Gastrocnemius Quadricep Gluteus Maximus
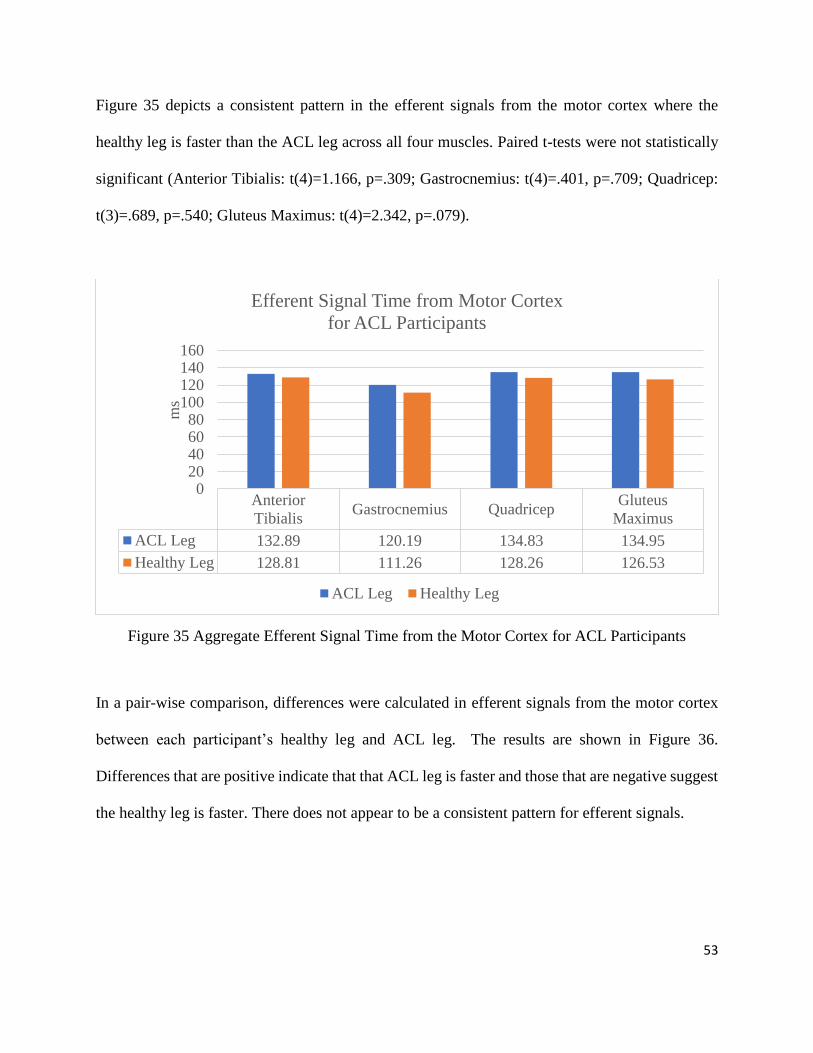
53
Figure 35 depicts a consistent pattern in the efferent signals from the motor cortex where the
healthy leg is faster than the ACL leg across all four muscles. Paired t-tests were not statistically
significant (Anterior Tibialis: t(4)=1.166, p=.309; Gastrocnemius: t(4)=.401, p=.709; Quadricep:
t(3)=.689, p=.540; Gluteus Maximus: t(4)=2.342, p=.079).
Figure 35 Aggregate Efferent Signal Time from the Motor Cortex for ACL Participants
In a pair-wise comparison, differences were calculated in efferent signals from the motor cortex
between each participant’s healthy leg and ACL leg. The results are shown in Figure 36.
Differences that are positive indicate that that ACL leg is faster and those that are negative suggest
the healthy leg is faster. There does not appear to be a consistent pattern for efferent signals.
Anterior
TibialisGastrocnemius Quadricep
Gluteus
Maximus
ACL Leg 132.89 120.19 134.83 134.95
Healthy Leg 128.81 111.26 128.26 126.53
020406080
100120140160
ms
Efferent Signal Time from Motor Cortex
for ACL Participants
ACL Leg Healthy Leg

54
Figure 36 Efferent Signal Time Difference between Healthy and ACL Reconstructed legs
3.2.d. Afferent Signals to the Motor Cortex
The mean afferent signal times to the motor cortex (Time from platform stimulus to N100 at Cz)
are shown for each ACL participant in Table 9.
Leg Average Time
ACL Leg 122.6
Healthy Leg 136
Table 9 Mean Afferent Signal Time to Motor Cortex of ACL Group
When comparing the ACL leg to the healthy leg for ACL participants, the afferent signal time to
the motor cortex is faster for the ACL leg as opposed to the healthy leg. Despite the difference, it
was not statistically significant using a paired samples t-test (t(4)=-2.595, p=.060).
3 4 5 9 10
Gluteus Maximus -21.21 0.68 -5.34 -7.05 -9.15
Quadricep 0.00 12.68 6.47 -26.65 -18.78
Gastrocnemius -62.10 -5.51 69.60 -39.13 -7.51
Anterior Tibialis 0.12 5.53 -2.29 -14.16 -9.62
-100-80-60-40-20
020406080
100ACL
is faster
(+)
ms
Healthy
is faster
(-)
Efferent Signal Time Difference between Healthy and ACL
Reconstructed legs
Anterior Tibialis Gastrocnemius Quadricep Gluteus Maximus

55
Figure 37 Mean Afferent Signal Time to Motor Cortex
3.2.e. Cognitive Processing Time
The mean cognitive processing time (time from N100 at Cz to P300 at Cz) for each ACL
participant is presented in Table 10.
Leg Average Time
ACL Leg 129.8
Healthy Leg 96.2
Table 10 Mean Cognitive Processing Time in Motor Cortex of ACL Group
When comparing the ACL reconstructed leg to the healthy leg for the ACL group, the ACL leg
was associated with slower cognitive processing time in the motor cortex, however, the difference
was not statistically significant using a paired samples t-test (t(4)=1.855, p=.137).
P3 P4 P5 P9 P10
ACL Leg 111 154 136 108 104
Healthy Leg 109 163 157 136 115
0
20
40
60
80
100
120
140
160
180
ms
Mean Afferent Signal Time to Motor Cortex for ACL Group
comparing ACL and Healthy Leg
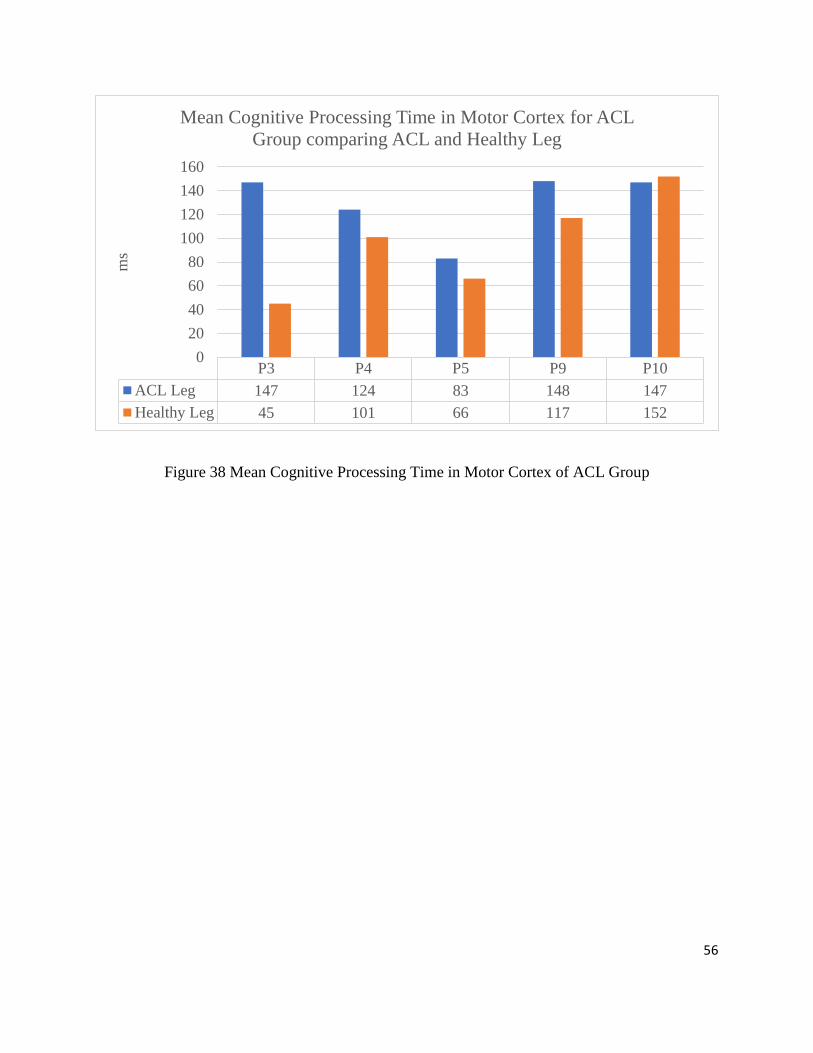
56
Figure 38 Mean Cognitive Processing Time in Motor Cortex of ACL Group
P3 P4 P5 P9 P10
ACL Leg 147 124 83 148 147
Healthy Leg 45 101 66 117 152
0
20
40
60
80
100
120
140
160
ms
Mean Cognitive Processing Time in Motor Cortex for ACL
Group comparing ACL and Healthy Leg

57
4. DISCUSSION
When comparing the ACL group to the healthy group, timing deficits for the ACL group
were seen in the reflex response, cognitive reflex response, the efferent signals from the motor
cortex, and the cognitive processing time. When comparing the ACL and healthy leg within the
ACL participants, timing deficits were seen in the ACL leg for cognitive processing time and the
efferent signals from the motor cortex.
This study demonstrated a new method of measuring proprioception that allows the timing
of responses to be examined using EMG and EEG signals. Using this method, proprioceptive
deficits were found in the ACL reconstructed participant’s knee compared to healthy controls as
well as when compared to the ACL reconstructed participant’s own healthy knee as a second
control. These deficits were found in the cognitive processing time and the efferent signals from
the motor cortex. Both are after the motor cortex has received information that the leg has moved.
This indicates that participants who have had an ACL reconstruction take longer for a muscle
response from the brain. This may lead to an increased risk of injury because there is a slower
response from the brain to the muscles as well as a longer time for the brain to process and decide
what to do with that information.
The EEG was an effective tool in observing the ERPs and understanding when information
was received and sent from the motor cortex. EMG measurements allowed the timing of muscle
responses to be observed after the stimulus. The EMG initial peak contraction time corresponds to
the muscle response from the involuntary reflex of the spinal cord and the EMG secondary peak
contraction time corresponds to the muscle response from the brain. By using both the EEG and

58
the EMG simultaneously, it allowed for the comparison of responses from the muscles and brain
after the stimulus.
Existing research has previously demonstrated proprioceptive deficits after an ACL
reconstruction [6], [18], [5], [3], [7]. The results of this study help to validate this technique of measuring
proprioception given similar results to past research. In addition, this method accounts for the
timing of signals through the nervous system that may detect communication latencies that can
expose an individual at increased risk of subsequent injury. These latencies can be explained by
the removal of mechanoreceptors from the injured ACL during reconstructive surgery. With no
mechanoreceptors, there is less information being provided to the motor cortex. After surgery the
body must compensate with the remaining sensory cells to provide the sensory information from
the mechanoreceptors since they are no longer a part of the new ACL graft.
Despite the favorable results from this study, there are some design elements and
limitations to consider. A significant challenge throughout this study was finding volunteers for
this study who have had an ACL reconstruction in the past 8-18 months. This resulted in a low
sample size limiting the power of statistical comparisons. Another consideration in the results of
this study was that the volunteers were primarily (9/10) Division I athletes who actively condition
every day and/or have engaged in intensive rehabilitation protocols. With this sample group, there
may be smaller difference between the groups than one might see with individuals who are less
active or older. One suggestion of why there were not ACL deficits or slower times seen in some
responses was that through rehabilitation protocols and exercises, muscles began to compensate
for the deficits of the ACL, relying mainly on the muscle spindle reactions. Division I athletes
rehab more than the average person having an ACL reconstruction, which may account for faster
responses within the ACL participants and ACL leg.

59
This new method of measuring proprioception can be beneficial in the rehabilitation
process, but it could also be used as injury prevention. If individuals were aware that they had a
proprioceptive deficit, exercises could be done to improve proprioception and reduce risk of an
injury. The recurrence of ACL injuries are 60 times more likely than original injuries. Thus,
monitoring proprioceptive deficits for those who have had an ACL injury is critical given that they
are at a much higher risk of subsequent injury.
In future research, investigators might consider observing proprioception over the course
of ACL rehabilitation to track improvements in recovery over time as well as to help determine
whether participants are ready to return to activity. In the recovery process, it would be beneficial
to know how these deficits improve over time and if there is a certain point at which the
improvement stops or changes trajectory. Researchers could observe differences using different
speeds of a platform perturbation. This study used a slow perturbation, but it was not explored how
changes in perturbation speed effected proprioceptive responses. Another suggestion for further
research using this technique is comparing the different rehabilitation protocols to see if there are
changes in proprioceptive responses. Additional research could be done on how to make this
method more accessible for ACL rehabilitation. This current setup is expensive, time consuming,
and doesn’t provide immediate feedback for use in a clinical setting. However, all these areas can
be improved for implementation by physicians and physical therapists. Capitalizing on the growth
of biosensors, products such as Bluetooth EEG and EMG sensors paired with a mobile application
could analyze the signals instantly, making this method more accessible to users in real time.

60
LIST OF REFERENCES
[1] "Anterior Cruciate Ligament (ACL) Injuries - OrthoInfo - AAOS", Orthoinfo.aaos.org, 2019.
[Online]. Available: http://orthoinfo.aaos.org/topic.cfm?topic=A00549. [Accessed: 18- Mar-
2018].
[2] "ACL injury - Symptoms and causes", Mayo Clinic, 2019. [Online]. Available:
https://www.mayoclinic.org/diseases-conditions/acl-injury/symptoms-causes/syc-20350738.
[Accessed: 14- Mar- 2019].
[3] M. Dhillon, K. Bali and S. Prabhakar, "Differences among mechanoreceptors in healthy and
injured anterior cruciate ligaments and their clinical importance", Muscles, Ligaments, and
Tendons Journal, vol. 2, no. 1, pp. 38-43, 2012.
[4] M. Solomonow and M. Krogsgaard, "Sensorimotor control of knee stability. A review",
Scandinavian Journal of Medicine and Science in Sports, vol. 11, no. 2, pp. 64-80, 2001.
Available: 10.1034/j.1600-0838.2001.011002064.x.
[5] N. Relph, L. Herrington and S. Tyson, "The effects of ACL injury on knee proprioception: a
meta-analysis", Physiotherapy, vol. 100, no. 3, pp. 187-195, 2014. Available:
10.1016/j.physio.2013.11.002.
[6] L. Y. Griffin, J. Agel, M. J. Albohm, E. A, Arendt, R. W. Dick, W. E. Garrett, J. G. Garrick,
T. E. Hewett, L. Huston, M. L. Ireland, R. J. Johnson, W. B. Kibler, S. Lephart, J. L. Lewis,
T. N. Lindenfeld, B. R. Mandelboum, P. Marchak, C. C. Teitz, E. M. Wojtys, “Noncontact
Anterior Cruciate Ligament Injuries: Risk Factors and Prevention Strategies”, Journal of the
American Academy of Orthopaedic Surgeons, vol. 8, pp. 141-150, 2000
[7] R. West and C. Harner, "Graft Selection in Anterior Cruciate Ligament Reconstruction",
Journal of the American Academy of Orthopaedic Surgeons, vol. 13, no. 3, pp. 197-207,
2005. Available: 10.5435/00124635-200505000-00006.
[8] J. Baumeister, K. Reinecke and M. Weiss, "Changed cortical activity after anterior cruciate
ligament reconstruction in a joint position paradigm: an EEG study", Scandinavian Journal
of Medicine & Science in Sports, vol. 18, no. 4, pp. 473-484, 2007. Available:
10.1111/j.1600-0838.2007.00702.x..
[9] O. Knezevic, D. Mirkov, M. Kadija, A. Nedeljkovic and S. Jaric, "Asymmetries in explosive
strength following anterior cruciate ligament reconstruction", The Knee, vol. 21, no. 6, pp.
1039-1045, 2014. Available: 10.1016/j.knee.2014.07.021.
[10] K. Bali, S. Prabhakar and M. Dhillon, "Proprioception in anterior cruciate ligament deficient
knees and its relevance in anterior cruciate ligament reconstruction", Indian Journal of
Orthopaedics, vol. 45, no. 4, p. 294, 2011. Available: 10.4103/0019-5413.80320.
[11] P. Godinho, E. Nicoliche, V. Cossich, E. de Sousa, B. Velasques and J. Salles,
"Proprioceptive deficit in patients with complete tearing of the anterior cruciate ligament",
Revista Brasileira de Ortopedia (English Edition), vol. 49, no. 6, pp. 613-618, 2014.
Available: 10.1016/j.rboe.2014.10.007.

61
[12] D. Barrett, "Proprioception and function after anterior cruciate reconstruction", The Journal
of Bone and Joint Surgery. British volume, vol. 73-, no. 5, pp. 833-837, 1991. Available:
10.1302/0301-620x.73b5.1894677.
[13] S. Lephart, M. Kocher, F. Fu, P. Borsa and C. Harner, "Proprioception following anterior
cruciate ligament reconstruction", Journal of Sports Rehabilitation, vol. 1, pp. 188-196,
1992. [Accessed 24 March 2019].
[14] T. Nau, "Regeneration of the anterior cruciate ligament: Current strategies in tissue
engineering", World Journal of Orthopedics, vol. 6, no. 1, p. 127, 2015. Available:
10.5312/wjo.v6.i1.127.
[15] J. Nyland, C. Gamble, T. Franklin and D. Caborn, "Permanent knee sensorimotor system
changes following ACL injury and surgery", Knee Surgery, Sports Traumatology,
Arthroscopy, vol. 25, no. 5, pp. 1461-1474, 2017. Available: 10.1007/s00167-017-4432-y.
[16] N. Adachi, M. Ochi, Y. Uchio, J. Iwasa, K. Ryoke and M. Kuriwaka, "Mechanoreceptors in
the anterior cruciate ligament contribute to the joint position sense", Acta Orthopaedica
Scandinavica, vol. 73, no. 3, pp. 330-334, 2002. Available: 10.1080/000164702320155356.
[17] J. Baumeister, K. Reinecke, M. Schubert and M. Weiß, "Altered electrocortical brain
activity after ACL reconstruction during force control", Journal of Orthopaedic Research,
vol. 29, no. 9, pp. 1383-1389, 2011. Available: 10.1002/jor.21380.
[18] S. Arnfred, A. Chen, D. Eder, B. Glenthøj and R. Hemmingsen, "Proprioceptive evoked
potentials in man: cerebral responses to changing weight loads on the hand", Brain and
Cognition, vol. 47, pp. 54-57, 2001.
[19] D. J. Creel, “Visually Evoked Potentials,” Webvision. [Online]. Available:
https://webvision.med.utah.edu/book/electrophysiology/visually-evoked-potentials/.
[Accessed: 15-Apr-2019].
[20] S. Sur and V. K. Sinha, “Event-related potential: An overview,” Industrial psychiatry
journal, 2009. [Online]. Available:
https://www.ncbi.nlm.nih.gov/pmc/articles/PMC3016705/. [Accessed: 09-Apr-2019].
[21] N. Relph and L. Herrington, “Knee joint position sense ability in elite athletes who have
returned to international level play following ACL reconstruction: A cross-sectional study,”
The Knee, vol. 23, no. 6, pp. 1029–1034, 2016.
[22] L. Turner, “Development and Testing of a Balance Platform Perturbator for Research in
Neuromuscular Physiology and Biomechanics”, UNH Senior Project (ECE791/792), 2016
[23] A. Ritter, S. Reisman and B. Michniak, Biomedical Engineering Principles. Boca Raton:
Taylor & Francis, 2005.
[24] A. DigitalOne, "EEG fMRI Brainlatam", EEG fMRI Brainlatam, 2019. [Online]. Available:
https://www.brainlatam.com/manufacturers/easycap. [Accessed: 14- Mar- 2019].
[25] "Areas of the brain and functions illustration.", 123RF, 2019. [Online]. Available:
https://www.123rf.com/photo_83022411_stock-vector-areas-of-the-brain-and-functions-
illustration-.html. [Accessed: 14- Mar- 2019].

62
[26] “actiCAP slim / actiCAP snap,” Brain Products GmbH / Products & Applications /
actiCAP slim / actiCAP snap. [Online]. Available:
https://www.brainproducts.com/productdetails.php?id=68. [Accessed: 07-Apr-2019].
[27]"Electromyography (EMG) - Mayo Clinic", Mayoclinic.org, 2019. [Online]. Available:
http://www.mayoclinic.org/tests-procedures/emg/basics/definition/prc-20014183. [Accessed:
20- Apr- 2018].
[28] M. R. Tucker, J. Olivier, A. Pagel, H. Bleuler, M. Bouri, O. Lambercy, J. D. R. Millán, R.
Riener, H. Vallery, and R. Gassert, “Control strategies for active lower extremity prosthetics
and orthotics: a review,” Journal of NeuroEngineering and Rehabilitation, vol. 12, no. 1, p.
1, 2015.

63
APPENDICES
A – Screening Tests
University of New Hampshire Proprioception After ACL Reconstruction Screening Questionnaire
Teagan Northrup
Name: Gender:
Age:
Height: Weight:
Dominate Leg: (Circle one) R / L
Have you torn your Anterior Cruciate Ligament (ACL)? (Circle one) Yes / No
If so:
Date of Surgery: (Month/Year)
Which leg? (Circle one) R/L
What graft was used? (Circle all that apply)
Hamstring Patella Quadriceps Cadaver N/A
If relevant, when was your last menstrual cycle?
How often do you exercise?
Have you had any other leg injuries? (Circle one) Yes / No
If so, please explain

64

65

66

67

68

69
B – Consent Form
THE UNIVERSITY OF NEW HAMPSHIRE
Informed Consent for Research Involving Human Subjects
CONSENT FOR PARTICIPATION IN RESEARCH
PROJECT TITLE: EEG and EMG Sensorimotor Measurements to Assess Proprioception
Following ACL Reconstruction
Principal Investigator: Teagan Northrup, Student, Electrical Engineering Major,
Department of Electrical and Computer Engineering, UNH
Dr. Wayne J. Smith, Faculty Mentor, Department of Electrical
and Computer Engineering, UNH
Dr. Ron V. Croce, Faculty Mentor, Department of Kinesiology,
UNH
Please read this document carefully and completely. Please ask the research assistant any
questions, particularly if you do not understand something. Please do not agree to participate
until all your questions have been answered, or until you are sure that you want to participate.
*****************************
I understand that I must be 18 years of age to participate in this study. I understand that I have
been invited with no obligation to participate in a research study being conducted by Ms. Teagan
Northrup, Dr. Wayne Smith of the Department of Electrical and Computer Engineering and Dr.
Ron Croce of the Department of Kinesiology. I understand that the UNH Institutional Review
Board for the Protection of Human Subjects in Research has approved the use of human subjects
in this project.
Purpose:
For the purpose of this study, we will be using an EEG and an EMG to compare proprioception
in ACL reconstructed knees and healthy controls. We believe that participants with ACL
reconstructions will have challenges detecting where one’s knee or leg is in space during
movement requiring more cognitive and muscular effort to react effectively to stimuli and
maintain balance. These challenges are known as proprioceptive deficits and can be observed
through the signals between the knee, the muscles and the brain. Using the EEG, we will be
looking at signals from the brain (event related potentials from the sensory cortex and parietal

70
cortex along with the lateral readiness potentials). The EMG will be used to measure muscle
activity.
Description of Study:
Forty participants will be fitted with an EEG cap and EMG electrodes on the midpoint of four
different leg muscles: tibialis anterior, gastrocnemius, rectus femoris, and gluteus maximus. The
participant will stand barefoot on the platform perturbator with feet hip width apart. Earbuds will
be worn to drown out the motor actuator prior to the platform perturbator moving. To allow each
leg to be individually tested, the leg tested will have the foot firmly planted on the platform while
only the toe of the other foot is touching to help with balance. A handrail will be placed next to
the platform perturbator in the off chance the participant loses balance.
The participant will participate in a series of trials (a minimum of 100) until 100 valid
responses have been conducted. A single trial consists of the participant being perturbated
forward at two inches per second for no more than half a second, then perturbated backwards
once balance has been regained. Perturbation timing will be randomized between one to five
seconds to reduce the anticipated movement. After each set of 25 trials, participants will have
two minutes for a sitting or standing break to prevent muscle fatigue. A trial will be invalid if
the participant steps or losses balance during the perturbation. Upon completion of 100
responses that are valid the participant will have completed their participation. It is anticipated
that the experimental portion will not take any longer than two hours.
Dr. Smith, Dr. Croce, and Ms. Northrup will all have access to data stored on Dr. Croce’s
UNH Box account. Each participant will be given a study identification number that all data will
be saved with. All data will be presented in aggregate and individuals will not be identified in
analysis and manuscripts. A hard copy sheet will exist that links each participant with their
corresponding code in case participants, IRB or UNH administrators need to review the data
under special circumstances. The copy will be in a locked file cabinet in Dr. Croce’s office. Any
data taken may be used for the senior capstone report, presentation for the Interdisciplinary
Science and Engineering Symposium at UNH, future research publications, and Ms. Northrup’s
master’s thesis.
RISKS AND BENEFITS
There is minimal risk associated with this study. To ensure the best experience for
participants, a two-minute sitting or standing break every 25 trials will be given to prevent
muscle fatigue. While unlikely, it is possible that the participant could lose balance when the
platform perturbator moves. To minimize any risk, the participant’s hand will be gently touching
a hand rail so that can be used to help regain balance if needed. In addition, the platform
perturbator is surrounded by padded floor mats. Occasionally, minor skin irritation could occur
from the stick-on EMG electrodes and from the gel used in the EEG electrodes. Although the
participant is not anticipated to receive any direct benefits by participating, the study can provide
the participants and others with ACL injuries an in-depth analysis of the participant’s balance
response time and whether their proprioception differs between legs. As a benefit to the
orthopedic community this study could lead to a new way for orthopedics to measure
proprioception and help prevent athletes from reinjuring their knee.

71
PLEASE READ THE FOLLOWING STATEMENTS AND RESPOND AS TO
WHETHER OR NOT YOU ARE WILLING TO PARTICIPATE:
1. I understand that the UNH Institutional Review Board has approved the use of human
subjects in this project for a study on the role of the anterior cruciate ligament in
proprioception.
2. The experiment has been fully explained to me and all questions have been answered to
my complete satisfaction. Furthermore, I understand the scope, aims, and purposes of
this research project; the procedures to be followed; and, the expected duration of my
participation.
3. Although I understand that the study is not specifically designed to benefit me personally,
through this study, scientists may learn more about how sensorimotor systems and
anterior cruciate ligament (ACL) are affected after reconstructive surgery.
4. I have received a description of any reasonable foreseeable risks or discomforts
associated with me being a subject in this research, have had them explained to me, and
understand them. Though injury of any kind is unlikely, I understand that there are
minimal risks associated with my participation, however, the researchers will take all
necessary precautions to avoid these problems.
5. I have been cleared by a doctor to engage in physical activity
6. I understand that if I am injured or if I require medical treatment, it will be my
responsibility to obtain this care and that UNH is not responsible for paying for this care.
7. I understand that my consent to participate is completely voluntary and that I am free to
withdraw from the study at any time without penalty. I understand that information that is
derived from this study will be treated as confidential, but the researchers cannot
guarantee complete confidentiality as there are rare circumstances under which other
(such as UNH or regulatory officials) may have access to study data
8. I confirm that no coercion of any kind was used in seeking my consent for participation
in this research project.
9. I understand that if I have any questions pertaining to the research, or any research related
injury, I have the right to call Dr. Ron Croce at 603-862-2080 ([email protected]) and/or
Teagan Northrup at 413-883-9726 ([email protected]) and be given the
opportunity to discuss them in confidence. If you have questions about your rights as a
research subject you can contact Melissa McGee in UNH Research Integrity
Services at 603-862-2005 or [email protected] to discuss them.

72
10. I understand that any information gained about me as a result of participation will be
provided to me at the conclusion of the research project, if I request such information.
11. I certify that I have read and fully understand the purpose of this research project and its
risks and benefits for me as stated above.
I, _________________________________________ CONSENT/DO AGREE to
participate in this research project.
I, __________________________________________ REFUSE/DO NOT AGREE to
participate in this research project.
_________________________________ __________________
Signature of participant Date
I hereby certify that I have given an explanation to the above individual of the study and its risks
and potential benefits
_________________________________ __________________
Signature of Researcher
Date

73
C – Recruitment Flyer

74
D – IRB Approval

75

76
E – Average Cz electrode and CSD Maps
Healthy Participants:
Figure 39 Subject 1
Figure 40 Subject 2
Cz
N100
P300
5 µV
-17.03 µV/m² 0 µV/m² 17.03 µV/m²
0 ms-32.22 µV/m² 0 µV/m² 32.22 µV/m²
158 ms
-39.39 µV/m² 0 µV/m² 39.39 µV/m²
323 ms
-112.60 µV/m² 0 µV/m² 112.60 µV/m²
399 ms
-200 ms 200 ms 0 ms 400 ms
Cz
N100
P300
5 µV
-9.71 µV/m² 0 µV/m² 9.71 µV/m²
0 ms
-28.12 µV/m² 0 µV/m² 28.12 µV/m²
152 ms
-33.26 µV/m² 0 µV/m² 33.26 µV/m²
278 ms
-31.01 µV/m² 0 µV/m² 31.01 µV/m²
399 ms
-200 ms 200 ms 0 ms 400 ms

77
Figure 41 Subject 6
Figure 42 Subject 7
Cz
N100
P300
10 µV
-19.31 µV/m² 0 µV/m² 19.31 µV/m²
0 ms
-96.27 µV/m² 0 µV/m² 96.27 µV/m²
123 ms
-38.33 µV/m² 0 µV/m² 38.33 µV/m²
234 ms
-51.47 µV/m² 0 µV/m² 51.47 µV/m²
399 ms
-200 ms 200 ms 0 ms 400 ms
Cz
N100
P300
5 µV
-27.35 µV/m² 0 µV/m² 27.35 µV/m²
0 ms -23.40 µV/m² 0 µV/m² 23.40 µV/m²
152 ms
-16.32 µV/m² 0 µV/m² 16.32 µV/m²
227 ms -44.36 µV/m² 0 µV/m² 44.36 µV/m²
399 ms
-200 ms 200 ms 0 ms 400 ms
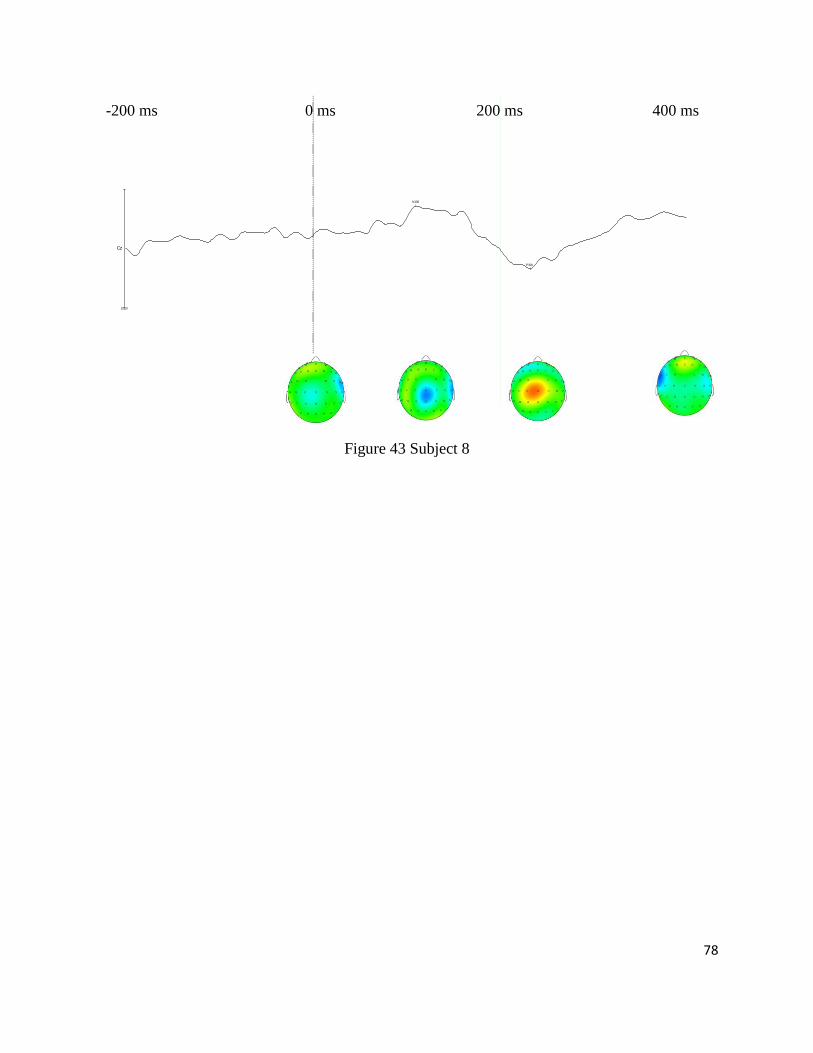
78
Figure 43 Subject 8
Cz
N100
P300
10 µV
-13.95 µV/m² 0 µV/m² 13.95 µV/m²
0 ms -28.54 µV/m² 0 µV/m² 28.54 µV/m²
112 ms
-33.21 µV/m² 0 µV/m² 33.21 µV/m²
233 ms
-25.51 µV/m² 0 µV/m² 25.51 µV/m²
399 ms
-200 ms 200 ms 0 ms 400 ms

79
ACL Participants, ACL Leg:
Figure 44 Subject 3
Figure 45 Subject 4
Cz
N100
P300
10 µV
-4.67 µV/m² 0 µV/m² 4.67 µV/m²
0 ms
-18.77 µV/m² 0 µV/m² 18.77 µV/m²
113 ms
-21.64 µV/m² 0 µV/m² 21.64 µV/m²
248 ms-18.81 µV/m² 0 µV/m² 18.81 µV/m²
399 ms
-200 ms 200 ms 0 ms 400 ms
Cz
N100
P300
10 µV
-10.58 µV/m² 0 µV/m² 10.58 µV/m²
0 ms
-26.54 µV/m² 0 µV/m² 26.54 µV/m²
164 ms
-14.86 µV/m² 0 µV/m² 14.86 µV/m²
264 ms
-18.83 µV/m² 0 µV/m² 18.83 µV/m²
399 ms
-200 ms 200 ms 0 ms 400 ms

80
Figure 46 Subject 5
Figure 47 Subject 9
Cz
N100
P300
10 µV
-49.45 µV/m² 0 µV/m² 49.45 µV/m²
0 ms
-69.41 µV/m² 0 µV/m² 69.41 µV/m²
137 ms
-16.59 µV/m² 0 µV/m² 16.59 µV/m²
212 ms
-14.50 µV/m² 0 µV/m² 14.50 µV/m²
399 ms
-200 ms 200 ms 0 ms 400 ms
Cz
N100
P300
10 µV
-14.25 µV/m² 0 µV/m² 14.25 µV/m²
0 ms
-20.34 µV/m² 0 µV/m² 20.34 µV/m²
133 ms-15.90 µV/m² 0 µV/m² 15.90 µV/m²
255 ms
-13.96 µV/m² 0 µV/m² 13.96 µV/m²
399 ms
-200 ms 200 ms 0 ms 400 ms
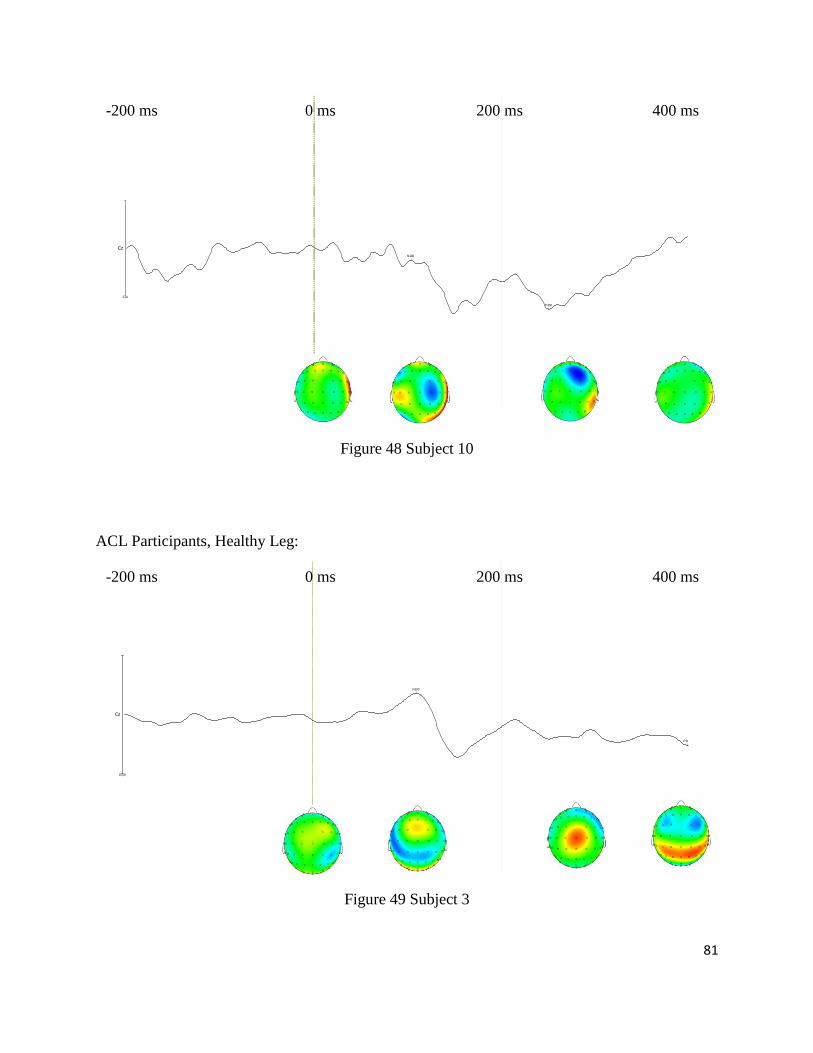
81
Figure 48 Subject 10
ACL Participants, Healthy Leg:
Figure 49 Subject 3
Cz
N100
P300
2 µV
-14.68 µV/m² 0 µV/m² 14.68 µV/m²
0 ms
-15.34 µV/m² 0 µV/m² 15.34 µV/m²
104 ms-20.94 µV/m² 0 µV/m² 20.94 µV/m²
252 ms
-37.49 µV/m² 0 µV/m² 37.49 µV/m²
399 ms
-200 ms 200 ms 0 ms 400 ms
Cz
N100
P300
10 µV
-12.23 µV/m² 0 µV/m² 12.23 µV/m²
0 ms -31.24 µV/m² 0 µV/m² 31.24 µV/m²
110 ms-27.52 µV/m² 0 µV/m² 27.52 µV/m²
250 ms-35.54 µV/m² 0 µV/m² 35.54 µV/m²
399 ms
-200 ms 200 ms 0 ms 400 ms

82
Figure 50 Subject 4
Figure 51 Subject 5
Cz
N100
P300
10 µV
-9.10 µV/m² 0 µV/m² 9.10 µV/m²
0 ms -31.29 µV/m² 0 µV/m² 31.29 µV/m²
156 ms
-24.43 µV/m² 0 µV/m² 24.43 µV/m²
252 ms
-20.25 µV/m² 0 µV/m² 20.25 µV/m²
399 ms
-200 ms 200 ms 0 ms 400 ms
Cz
N100
P300
10 µV
-22.37 µV/m² 0 µV/m² 22.37 µV/m²
0 ms
-45.87 µV/m² 0 µV/m² 45.87 µV/m²
158 ms
-12.59 µV/m² 0 µV/m² 12.59 µV/m²
326 ms
-18.23 µV/m² 0 µV/m² 18.23 µV/m²
399 ms
-200 ms 200 ms 0 ms 400 ms

83
Figure 52 Subject 9
Figure 53 Subject 10
Cz
N100
P300
10 µV
-9.67 µV/m² 0 µV/m² 9.67 µV/m²
0 ms
-26.29 µV/m² 0 µV/m² 26.29 µV/m²
140 ms
-21.73 µV/m² 0 µV/m² 21.73 µV/m²
230 ms
-30.21 µV/m² 0 µV/m² 30.21 µV/m²
399 ms
-200 ms 200 ms 0 ms 400 ms
Cz
N100
P300
2 µV
-23.01 µV/m² 0 µV/m² 23.01 µV/m²
0 ms
-45.32 µV/m² 0 µV/m² 45.32 µV/m²
176 ms
-34.17 µV/m² 0 µV/m² 34.17 µV/m²
270 ms
-56.47 µV/m² 0 µV/m² 56.47 µV/m²
399 ms
-200 ms 200 ms 0 ms 400 ms
Copyright © 2022 FDOKUMEN