
Surface EMG measurements during fMRI at 3T: Accurate EMG recordings after artifact correction
14
& , -" " "#$.! -" )& *+,& #$%&’(& ))$,& G .,& !""+!%&!/"!/#
Transcript of Surface EMG measurements during fMRI at 3T: Accurate EMG recordings after artifact correction

����
�
&�
,�����-"��"������������������
�"#����$�.�!�����-"��
������������������������������
�
�
)&����*���+,&��� �#�$��%&'��(&�� �)����)��$�,&� �G���� ��.�,�&���
�
�
� ��������!""+��!%&�!/"�!/#�
����
!������
In this experiment we have measured surface EMG of the first dorsal interosseus during
predefined submaximal isometric contractions (5, 15, 30, 50, and 70% of maximal force)
of the index finger simultaneously with fMRI measurements. Since we have used sparse
sampling fMRI (3 seconds scanning; 2 seconds non-scanning), we were able to
compare the mean amplitude of the undisturbed EMG (non-scanning) intervals with the
mean amplitude of the EMG intervals during scanning, after MRI-artifact correction. The
agreement between the mean amplitudes of the corrected and the undisturbed EMG
was excellent and the mean difference between the two amplitudes was not significantly
different. Furthermore, there was no significant difference between the corrected and
undisturbed amplitude at different force levels. In conclusion, we have shown that it is
feasible to record surface-EMG during scanning and that, after MRI artifact correction,
the EMG recordings can be used to quantify isometric muscle activity, even at very low
activation intensities.
Acknowledgements: This work was supported in the framework of the NWO
Cognition Program with financial aid from the Netherlands Organization for Scientific
Research (NWO).
We would like to thank Anita Kuiper and Remco J. Renken for operation of the scanner,
and Koen Vaartjes for the development of the force transducers.
����
������������
Functional magnetic resonance imaging (fMRI) is a non-invasive method to study human
brain function. Measuring muscle force and electromyography (EMG) concurrently with
brain activity allows for a direct comparison of brain activity in motor areas and motor
output. However, recording force and EMG in the MR-scanner is challenging. Ferro-
metals are attracted to the scanner. In addition, these metals disturb the magnetic field
and can cause artifacts in the MR-images. Furthermore, the static magnetic field, the
changing gradient, and the radio frequency pulses can cause artifacts in force and EMG-
signals. Some studies have resolved this problem by repeating the experiment outside
the scanner in combination with EMG recordings (e.g., Ehrsson et al., 2001; MacIntosh
et al., 2004), expecting that the muscle activation patterns inside and outside the
scanner are similar. A few studies have recorded EMG simultaneously with fMRI.
However, because of the problems described above, the EMG-signals were only
analyzed during the short inter-scan-intervals (varying between 100 and 200ms; Dai et
al., 2001; Liu et al., 2000, 2002a, 2002b, 2003, 2004) or EMG recordings were only used
to determine the end of muscle activity and no quantitative measurements were made
(Oga et al., 2002; Toma et al., 1999).
Recently, techniques have been developed to study electroencephalography
(EEG) and fMRI simultaneously. In those studies, the EEG recordings contain large MRI
scanning artifacts. However, since the MRI artifact is almost constant over time, it is
possible to subtract the mean artifact from the EEG signal. This results in reasonably
clean EEG recordings after further pulse artifact correction (e.g., Allen et al., 2000;
Anami et al., 2003). EEG and surface EMG recordings are based on similar principles;
however, we expected more problems because of the relatively long EMG wires that will
unavoidably move with muscle contraction. It has been shown that artifact correction can
be applied to EMG measured simultaneously with fMRI (Moosmann et al., 2004).
However, in that study, the EMG recordings were only used to separate periods of rest
from periods of muscle activation. Quantitative data of the EMG recordings have not yet
been published, nor was EMG activity quantified at different force levels in combination
with scanning experiments.
Therefore, it was the aim of our study to evaluate the quantitative accuracy of the
EMG signal at different force levels during scanning, after artifact correction according to
Allen and colleagues (2000). For this reason, we have recorded EMG during a sparse
sampling fMRI protocol. In this protocol scanning periods are alternated with non-
scanning periods, which enabled us to compare the EMG recordings of sustained

����
muscle contractions at predefined force levels during scanning and non-scanning
periods.
"��������
������� ��������
We used sintered silver/silver-chloride EMG-electrodes (Falk Minow Services) in
combination with the BrainAmp MR plus system of Brain Products GmbH (Munich,
Germany) for the EMG-recordings. This system is normally used for EEG-recordings in
the MRI, but a special electrode input box made it possible to connect EMG-electrodes.
Current-limiting resistors (2kOhm) were attached to the EMG-electrodes in order to
prevent possible warming of the electrodes (see Lemieux, 1997).
Muscle activity of first dorsal interosseus (FDI) of both hands was measured.
Therefore, the skin above the FDI was cleaned with alcohol and scrubbed. One
electrode was placed on the belly of the FDI and a second electrode on the
metacarpophalangeal joint. A reference electrode was positioned on the processus
styloideus radius of the right arm, and a ground electrode was placed on the processus
styloideus radius of the left arm. The two electrode wires per muscle were twisted to
maximally equalize the effect of the magnetic field on the EMG-recordings.
All electrodes were attached to the electrode input box, which was placed as far
away from the scanner as possible (i.e., between the legs of the subject). The electrode
input box was connected to the BrainAmp amplifier. The amplifier converted the
neurophysiological signals to digital signals, which were transmitted via an optical cable
to a PC outside the MR-room. The PC was equipped with Brain Vision Recorder
software; the sampling rate of the signals was 5000 Hz/channel. The MRI-scanner sent
a marker to Brain Vision Recorder every time a scan was started.
Offline, we used Brain Vision Analyzer software (version 1.05.0001) to correct
the data for scanner artifacts according to the method described by Allen (Allen et al.,
2000). In the MRI-Artifact Correction a low-pass filter and down sampling were included.
Since we studied EMG recordings we used a low-pass filter of 400Hz, which implied that
less of the scanner artifact was filtered out of the signal. The data was down sampled to
2500 Hz and, after artifact correction, bipolar derivations were calculated for each
muscle. Thereafter, a high-pass filter of 10Hz was applied to remove possible movement
artifacts. Finally, the data was exported (ASCII-format) and imported in Spike2 for
Windows (version 5.08; Cambridge Electronic Design, Cambridge, UK) for further
analysis.
���
�����������������
The index finger abduction force was measured with a custom-made force transducer.
This force transducer made it possible to measure force in the MRI-environment.
Magnetic-compensated strain gauges (TML® MFLA-5.350-1L; Tokyo Sokki Kenkyujo
Co., Japan), were placed in a full bridge configuration on an epoxy glass laminate bar
(Tufnol® 10G/40 20mm diameter; RS-components number: 771-314), and registered the
force applied to the bar. This resulted in electrical signals of a few millivolts, which were
amplified and converted to digital signals. The digital signals left the scanner room via an
optical cable. The optical cable was connected to a receiver in the operator room, by
which the digital signals were adapted to voltage signals. These signals were sampled
by a PC equipped with a data-acquisition interface and the accompanying software
(1401 micro and Spike 2 version 5.08, Cambridge Electronic Design, Cambridge, UK).
The sampling rate was 500 Hz.
����
Functional images were acquired using a 3T Philips MRI scanner (Best, the
Netherlands), equipped with echo planar imaging (EPI) capability and a standard
transient/receive (TR) head coil. The following pulse sequence parameters were used:
FFE single shot EPI; 46 slices; slice thickness 3.5 mm; no gap; field of view 224 mm;
scanning matrix 64x64; transverse slice orientation; repetition time (TR) = 5 s; echo time
(TE) = 35 ms; minimal temporal slice timing (2884 ms); flip angle 90°.
In addition, T1-weighted anatomical images of the entire brain were obtained with
the following pulse sequence parameters: field of view 256 mm; scanning matrix
256x256; 160 slices; slice thickness 1 mm; transverse slice orientation; TE = 4.6 ms; TR
= 25 ms; flip angle 30°.
Additional data were acquired to compare the fMRI images with and without the
presence of the EMG equipment. The pulse sequence parameters were the same as
above (functional images), except that the repetition time was 3 seconds instead of 5
seconds.
)����
Before the experiment started, all subjects had practiced the tasks in the lab. The tasks
consisted of several isometric index finger abductions. First, all subjects had to perform
three maximal voluntary isometric contractions (MVCs) for ten seconds; each contraction
was followed by 50 seconds rest. The contractions were performed for both left and right
����
hand separately. The highest force was determined to be the ‘control MVC level’ (cMVC;
for left and right separately).Thereafter, subjects performed sub-maximal isometric
contractions for 20 seconds at levels of 5, 15, 30, 50, and 70% cMVC; each contraction
was followed by 40 seconds rest. All contractions were repeated three times in a semi-
random order. To investigate the effect of the EMG recording on the fMRI images,
additional scanning experiments were performed in which this series of contractions was
repeated without EMG-recording. In this experiment, the first three series of contractions
were performed with the EMG electrodes placed on the muscle, followed by three series
of contractions without EMG montage. During all contractions subjects got visual
feedback of the force that was projected by a beamer at the back-end of the scanner.
Subjects were able to see this screen via a mirror on the head coil. During scanning the
lights in the MR-room were off.
*���������
To evaluate the accuracy of the EMG recordings after MRI-Artifact Correction, we
determined the mean rectified EMG over 2 seconds during scanning (corrected-EMG)
and non-scanning intervals (undisturbed-EMG) within a contraction. To correct for the
physiological variation in EMG amplitudes during prolonged contractions, we calculated
the average of the mean EMG amplitudes of the undisturbed EMG intervals preceding
(see Fig. 1: B&D) and following (see Fig. 1: D&F) the corrected EMG interval (see Fig. 1:
C&E). To analyze the difference between the corrected and undisturbed EMG values,
we plotted the mean EMG of the corrected interval against the average of the
undisturbed EMG intervals (see Fig. 1: C versus [(B+D)/2], and E versus [(D+F)/2]). As a
measure of the physiological variation in EMG, we have calculated the mean value of
the first (B) and third (F) undisturbed EMG-interval, and we have compared this mean to
the second (D) undisturbed EMG-interval (see Fig. 1: D versus [(B+F)/2]). For the
comparison between the undisturbed and corrected EMG, we have used the Bland and
Altman method (1986). This method is based on a graphical analysis of the mean of the
corrected and undisturbed EMG versus the difference between the corrected and
undisturbed EMG. Limits of agreement (mean difference ± 2 standard deviations of the
difference; Bland and Altman, 1986) were calculated for the comparison of corrected
versus undisturbed EMG and also for the repeated measurements of undisturbed EMG
within a contraction. Furthermore, the differences between corrected and undisturbed
EMG values were determined by using an ANOVA for repeated measurements. Within-

���
subject factors were EMG (2 levels: corrected and undisturbed) and force (5 levels: 5,
15, 30, 50, and 70% cMVC).
In addition, we have performed a power-spectrum analysis of the corrected and
undisturbed EMG. Therefore, we first segmented the data for the different force-levels in
segments of 2048 data points, starting 500 ms (corrected) and 3500 ms (undisturbed)
after the scanner marker. We used the Fast Fourier Transform to estimate the power
(�V2) of the segments (full spectrum used; Hanning window 10%). The spectra were
stabilized by averaging over 10-12 segments per force level. Then, we calculated the
median power for the different force levels.
A B C D FE
Scanner marker
rs EMG
�
������� ��� 9� ����&�� &��,�����&��� �5� ����&5&��� ���� ����� ��� �.1� ����.1"� �,�&�$� ��
�,���2&���� &������&�� ��������&���� � �� �������� �������� � �(� � �� ������ �5� � ��
��/,&�&�&����5������&��*��,����� ��� &����&�����5�� ����������&����4 �7 ��"���3�������
�.1:������ ���&�������������,�&�$�.-:�����&�$�����" �( &���� ��� &���&�����= �+ �E"�
��3��������.1:������ ���&�������������,�&�$����:�����&�$�&����*��������"��� ���.1:
����� �,�&�$� �����&�$� &�� �55:�&��� ���������� 5��� � �� �������� ���&5����� +,�� ��� �,�����
5��&$��&�&�� � � �� ����� ��3�&�,��� �5� � �� �.1� &��������� (&� � �&���� ��� ���3����
����������(&� �,��&��,������.1�*��,���(�� �*� �� ���5��� �����,������� ��������5�
&����*����3�����&�$����$��="�����5����(&�$��+"�������������&����*����������3������ &��
*��,��(&� �� ������������������.1��7"��
�
In addition, we have estimated the overall variance of the EMG by taking the average of
the undisturbed intervals B & F and compared this average with the EMG value during
the undisturbed interval D (see “Methods” for further details).
To account for the effect of the EMG equipment on the EPI-slices, we compared
slices that were obtained in the presence and absence of EMG equipment for structural
artifacts (Fig. 6) and functional artifacts (signal-to-noise-ratio). The signal-to-noise-ratio
was determined on realigned data; the images were masked and within the mask the
mean standard deviation over time (arbitrary units) was determined.
����
#��������
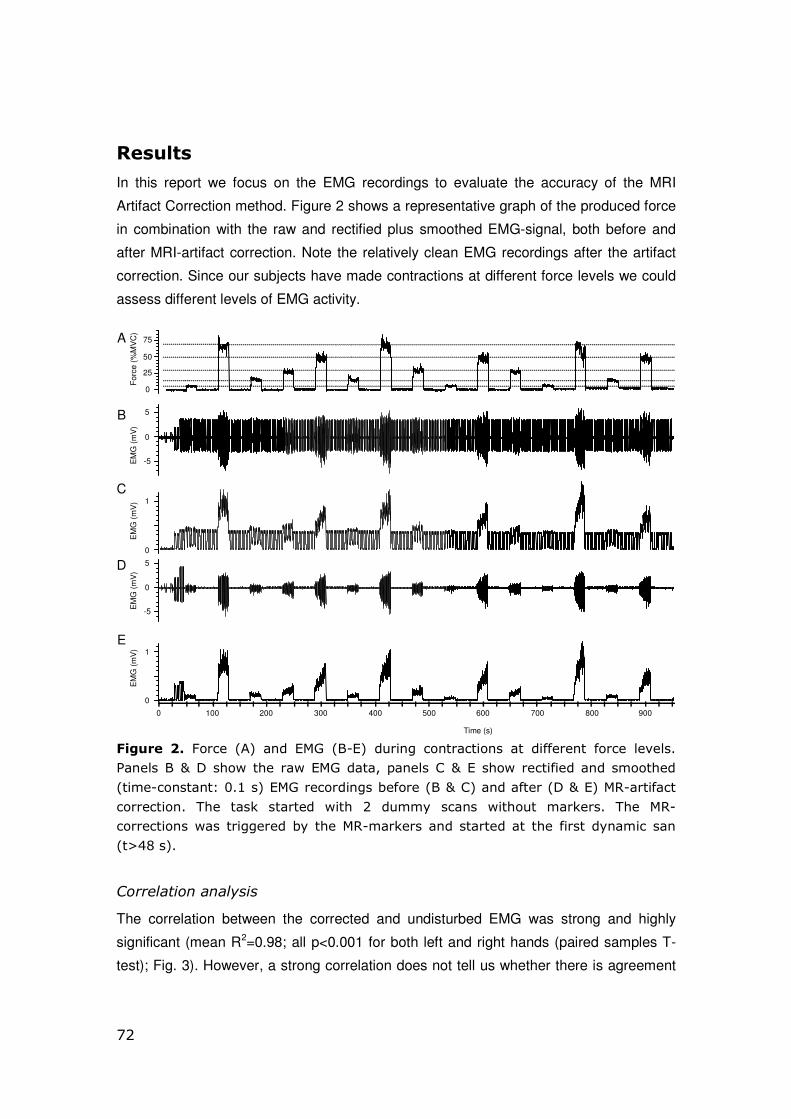
In this report we focus on the EMG recordings to evaluate the accuracy of the MRI
Artifact Correction method. Figure 2 shows a representative graph of the produced force
in combination with the raw and rectified plus smoothed EMG-signal, both before and
after MRI-artifact correction. Note the relatively clean EMG recordings after the artifact
correction. Since our subjects have made contractions at different force levels we could
assess different levels of EMG activity.
A
B
C
D
E
For
ce (
%M
VC
)E
MG
(m
V)
EM
G (
mV
)E
MG
(m
V)
EM
G (
mV
)
0
0
0
0
0
0
1
5
-5
25
50
75
Time (s)
1
-5
5
100 200 300 400 500 600 700 800 900
������� �� E����� �4"� ���� �.1� �=:�"� �,�&�$� ��������&���� ��� �&55������ 5����� ��*�����
B������=�O�+� � �(�� ����(��.1����� �3������7�O��� � �(�����&5&������� ����� ���
��&��:��������������"��.1�������&�$����5�����=�O�7"������5�����+�O��"�.-:���&5����
�������&���� � �� ����� �������� (&� � �� �,���� ������ (&� �,�� ��������� � �� .-:
�������&����(�����&$$����� ���� ��.-:������������ ������������ ��5&���������&������
��P����"���
������������������
The correlation between the corrected and undisturbed EMG was strong and highly
significant (mean R2=0.98; all p<0.001 for both left and right hands (paired samples T-
test); Fig. 3). However, a strong correlation does not tell us whether there is agreement
����
between the EMG values. There is only agreement when the slopes are close to 1 and
the intercept close to 0. For the right hand the correlation is associated with slopes close
to 1 (range: 0.97 to 1.03) and small intercept values (-0.0031 to +0.0067). For the left
hand, the slopes are rather close to 1 (range: 1.06 to 1.13); the intercepts are more
variable (range: -0.0797 to -0.0046).
To test whether the strong correlations also implied a good agreement, we
visualized the agreement according to Bland and Altman (1986). Therefore, the average
of the corrected and undisturbed EMG values was plotted against their difference (Fig.
4). A strong agreement is indicated by a mean difference that is close to 0. In our data
the difference between the corrected and undisturbed EMG values did not deviate from
0 (one-sample T-test, t(5)=0.953, n.s.). Thus, corrected and undisturbed EMG values
showed a strong similarity. Furthermore, the ANOVA for repeated measurements
revealed that there was no significant difference between the corrected and undisturbed
EMG (F(1,5)=0.78, n.s). As expected, EMG values were significantly different for the
different force levels (F(4,20)=41.62, p=0.001).
������4��������� ��
The data of the power spectrum analysis showed no significant difference in total power
between the corrected and undisturbed segments of EMG (F(1,2)=3.63, n.s.). An example
of the calculated power spectra for one force level (30% MVC) is shown in Fig. 5. In
addition, no significant difference between the median power frequency of the corrected
(68.1 ± 0.7) and undisturbed (66.1 ± 1.5) segments of EMG was found (F(1,2)=4.92, n.s.).
2�������0����
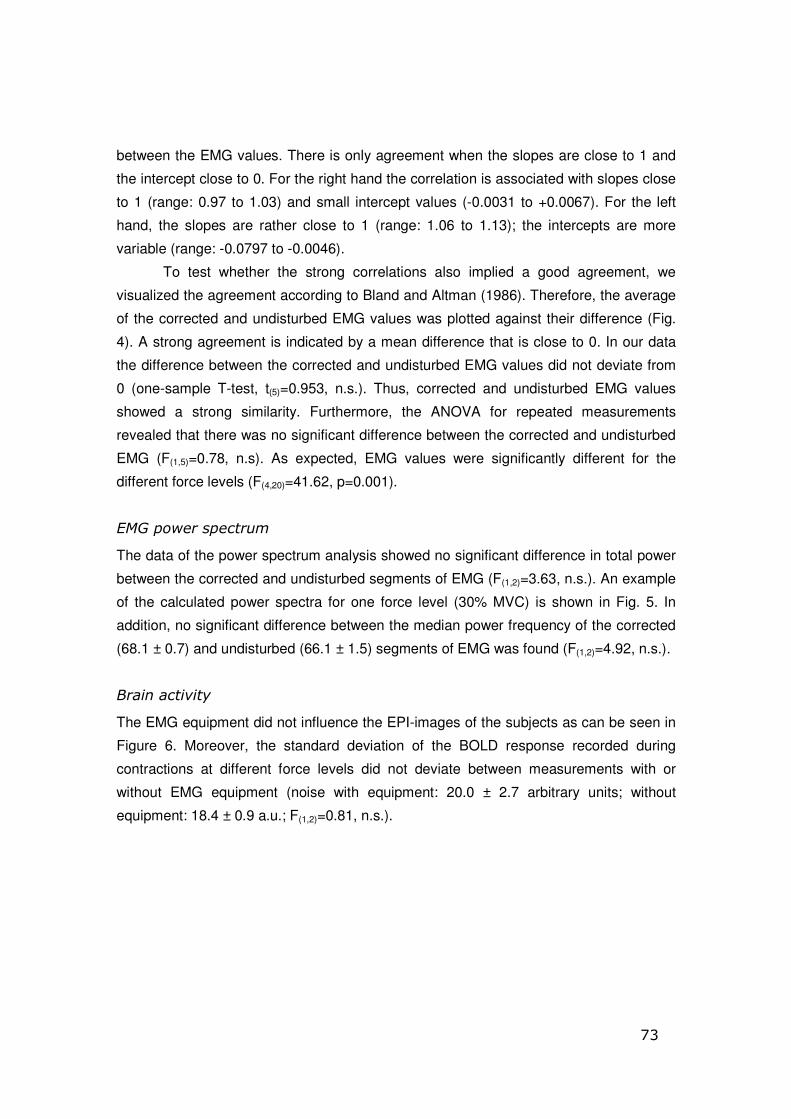
The EMG equipment did not influence the EPI-images of the subjects as can be seen in
Figure 6. Moreover, the standard deviation of the BOLD response recorded during
contractions at different force levels did not deviate between measurements with or
without EMG equipment (noise with equipment: 20.0 ± 2.7 arbitrary units; without
equipment: 18.4 ± 0.9 a.u.; F(1,2)=0.81, n.s.).

����
0.8
0
0.1
0.2
0.3
0.4
0.5
0.6
0.7
0.8
0 0.2 0.4 0.6 0.8
0
0.1
0.2
0.3
0.4
0 0.1 0.2 0.3 0.4
0
0.2
0.4
0.6
0.8
1
1.2
0 0.4 0.8 1.2
y = 0.9714x + 0 .0067
R2 = 0.995y = 1.0677x - 0.024 3
R2
= 0.99550
0.1
0.2
0.3
0.4
0.5
0.6
0.7
0.8
0.9
0 0.2 0.4 0.6 0.8
y = 1.0302x - 0.003 1
R2 = 0.98550
0.1
0.2
0.3
0.4
0.5
0.6
0 0.1 0.2 0.3 0.4 0.5 0.6
y = 1.055x - 0 .0046
R2 = 0.9775
y = 1.0152x - 0.0009
R2 = 0.989
y = 1.1262x - 0.0797
R2 = 0.97 930
0.1
0.2
0.3
0.4
0.5
0.6
0.7
0.8
0.9
0 0.2 0.4 0.6 0.8
Und
istu
rbed
EM
G (m
V)
Und
istu
rbed
EM
G (m
V)
H098 right H098 left
H104 left
H107 left
H104 right
H107 right
Und
istu
rbed
EM
G (m
V)
Corrected EMG (mV) Corrected EMG (mV) �������$��-����&��� &3�����(������������������,��&��,������.1�������&�$���5�� ����
�,�'�����5������&$ ��������5�� �����,������E+#"��� ���������3�&�,����5�����&5&����.1�
(��� ������&���� 5��� �(�� ������� &����*���� �5� ���������� �.1� ���� ,��&��,����� �.1�
&����*���<�����Q.�� ���R�����E&$���5�������&���������&3�&����5�� ������,���&����5�� ��
�����*��,����#��� ��$��3 ��� ���&�������$����&����&�������&���&��"������ ��&����&����&���
���� ����&��"�����3���������

����
�
H098 left
H104 rig ht
H107 rig ht
H104 left
H107 left
Cor
r.-U
ndis
. EM
G (m
V)
Mean EMG (mV) Mean EMG (mV)
H098 right
-0 .16
-0 .12
-0 .08
-0 .04
0
0.04
0.08
0.12
0.16
0 0.2 0.4 0.6 0.8
-0.16
-0.12
-0.08
-0.04
0
0.0 4
0.0 8
0.1 2
0.1 6
0 0.2 0.4 0.6 0.8
-0 .08
-0 .06
-0 .04
-0 .02
0
0.02
0.04
0.06
0.08
0 0.1 0.2 0.3 0.4
-0.08
-0.06
-0.04
-0.02
0
0.0 2
0.0 4
0.0 6
0.0 8
0 0.2 0.4 0.6
-0 .15
-0.1
-0 .05
0
0.05
0.1
0.15
0 0.2 0.4 0.6 0.8 1 1.2-0.15
-0.1
-0.05
0
0.0 5
0.1
0.1 5
0 0.2 0 .4 0.6 0.8
Cor
r.-U
ndis
. EM
G (m
V)
Cor
r.-U
ndis
. EM
G (m
V)
*
�������%��� �������;��9+��5���������������,��&��,������.1�3��������$�&����� ��
�&55����������(������������������,��&��,������.1�5������ � �����5�� �����,�'�����
��������������������&�����,3�����&���"��� �������;��9+��5�� ��,��&��,������.1�&��
3��������$�&����� ���&55����������(����� ��5&��������� &���*���,��� ���������&����*���
�5� ,��&��,����� �.1� ��3��� �������� ���� � &�� ���&�� �&���"�� � �� � &��� ���&�� �&����
��3�������� ��������5�� ���&55�����������(����� ����������������,��&��,������.1��
� �������&���&��3�������������&5��� ���� ��� &���&���&����*��������� ��� &����&����

����
0
20
400
600
800
1000
120
140
1600
undisturbedcorrected
Frequency (Hz)
Pow
er(
V2 )
20050 100 150 250
�������&����3&�����2��3����5���3�(���3����,���S6�"�5���� ��,��&��,���������&���&��"�
���� ���������� ���� ��� �&��"� �.1�� � �� ����� (���� ����&���� �,�&�$� ��8� .67�
��������&��������(�����*���$����*���� ������&�����
�
����������
Our data showed that it was feasible to perform surface EMG recordings during fMRI
measurements. The EMG recordings were not free of MRI artifacts; however, it was
possible to eliminate the MRI artifacts by using the Allen method (Allen et al., 2000)
implemented in the Brain Vision Analyzer software. Moreover, our data showed that the
corrected EMG recordings reflected muscle activity accurately during relatively weak
contractions (5% cMVC) as well as during strong contractions (>70% cMVC).
The correlation between the corrected and the undisturbed EMG signals was
excellent. In addition, the analysis according to Brand and Altman (1986) showed that
the difference between the corrected and undisturbed EMG was smaller than the
physiological variance in EMG amplitude. During prolonged contractions the central
nervous system has to increase its drive to the spinal motoneurons to counteract a
decline in force due to muscle fatigability (Bigland-Ritchie et al., 1986a, 1986b). This
increased drive is shown in the EMG recordings as an increase in amplitude. Thus,
during the production of a constant force a progressive increase in the EMG-amplitude
����
can be observed. Despite averaging EMG values of intervals preceding and following
another interval, still variability was seen during a contraction. This physiological
variance –determined by the EMG values of the undisturbed intervals – was larger than
the variance induced by the artifact correction. Furthermore, the power spectra of the
corrected and undisturbed EMG signals were in good agreement, and no effects on
multiples of the slice frequency (16Hz) were found.
�������'���B#:��&������:��"��5������,�'��������&����(&� ��,33���3����"�����(&� �,��
��&�����3����"�� �������$���5�� ���.1��/,&3������� �������(�������&$�������� ��
*����5&������&����������*����*���������&5������#��� ��$����3���������( �� ���&55�������
���(����� ���B#:��&����&��� �(���
The association between the mean EMG values obtained during the scanning
and the non-scanning intervals showed that the slopes and intercept were closer to the
identity-line for the right FDI than for the left FDI. Also, the variability of the difference
between the corrected and undisturbed EMG versus the mean of the corrected and
undisturbed EMG was larger for the left FDI. The dissimilarity between the recordings of
the right and left FDI is probably caused by a difference in the distance between the
reference and the recording electrodes. In an ideal situation, the noise from the MR-
scanner that is recorded by the EMG electrodes is identical to the noise that is picked-up
by the reference electrode. However, the static magnetic field and the changing fields
are not distributed homogeneously and, therefore, electrodes will be influenced
����
differently. Since the reference electrode in this experiment was placed on the processus
styloidius radius of the right arm, which was closer to the right FDI, this resulted in a
“cleaner” signal of the right FDI than of the left FDI. Thus, it is recommended to position
the reference-electrode close to the recording-electrodes. However, in future
experiments we want to record activity of several muscles on different sides of the body
simultaneously. A pilot study, in which we systematically changed the location of the
reference electrode, showed that positioning the reference-electrode on the ankle gives
an optimal solution for recording activity of several muscles. In this case the MR-artifact
is similar for all our EMG recordings; for individual EMG recordings, however, it is still
advisable to position the reference electrode close to the recording electrodes.
The average artifact is equal to the actual artifact plus a standard deviation due
to noise and a small EMG component. Movement of the wires results in movement
artifacts due to changes of the position of the wire in the magnetic field, thereby
increasing the noise component of the average artifact. This could impose problems
during dynamic contractions. However, the influence of the movement artifact can be
reduced by calculating the mean artifact of the bipolar EMG recordings, instead of
unipolar EMG recordings. In the current study, movement of the wires was virtually non-
existent. Hence, MRI artifact correction was applied to unipolar EMG recordings only.
Unlike the studies that combined EEG with fMRI (e.g. Krakow et al., 2000;
Lazeyras et al., 2001), we did not find artifacts in the MR images or a difference in signal
to noise ratio. The images obtained during EEG recording showed that the artifacts
induced by the EEG equipment were local and since the electrodes during EMG
measurements are not placed in the vicinity of the TR head coil no disturbing effects of
the EMG equipment were expected.
In conclusion, our data showed that after MRI artifact correction accurate EMG
recordings of isometric contractions can be obtained during fMRI scanning, both at high
and low force levels. Simultaneous recordings of fMRI and EMG are expected to provide
new insights in the functioning of the healthy motor system and the pathopohysiology of
movement disorders.


![3T[WXaX^cbPX\TSc^VPX] U^aTXV]\TSXPPccT]cX^]](https://static.fdokumen.com/doc/165x107/633431d762e2e08d49028554/3twxaxcbpxtscvpx-uatxvtsxppcctcx.jpg)

