![3T[WXaX^cbPX\TSc^VPX] U^aTXV]\TSXPPccT]cX^]](https://static.fdokumen.com/doc/165x107/633431d762e2e08d49028554/3twxaxcbpxtscvpx-uatxvtsxppcctcx.jpg)
Clinical fMRI: Evidence for a 7T benefit over 3T
17
Clinical fMRI: Evidence for a 7 T benefit over 3 T R. Beisteiner a,c,⁎ , S. Robinson b,c , M. Wurnig a,c , M. Hilbert a,c , K. Merksa a,c , J. Rath a,c , I. Höllinger a,c , N. Klinger a,c , Ch. Marosi d , S. Trattnig b,c , and A. Geißler a,c a Study Group Clinical fMRI, Department of Neurology, Medical University of Vienna, Austria b Department of Radiology, Medical University of Vienna, Austria, Währinger Gürtel 18-20, 1090 Vienna, Austria c MR Center of Excellence, Medical University of Vienna, Austria, Währinger Gürtel 18-20, 1090 Vienna, Austria d Department of Medicine I, Medical University of Vienna, Austria, Währinger Gürtel 18-20, 1090 Vienna, Austria Abstract Despite there being an increasing number of installations of ultra high field MR systems (> 3 T) in clinical environments, no functional patient investigations have yet examined possible benefits for functional diagnostics. Here we performed presurgical localization of the primary motor hand area on 3 T and 7 T Siemens scanners with identical investigational procedures and comparable system specific sequence optimizations. Results from 17 patients showed significantly higher functional sensitivity of the 7 T system measured via percent signal change, mean t-values, number of suprathreshold voxels and contrast to noise ratio. On the other hand, 7 T data suffered from a significant increase of artifacts (ghosting, head motion). We conclude that ultra high field systems provide a clinically relevant increase of functional sensitivity for patient investigations. Highlights ► Comparison of 3 T and 7 T fMRI in functional diagnostics. ► Differences in presurgical localization of the primary motor hand area were examined. ► Results from 17 patients showed higher functional sensitivity for 7 T measurements. Keywords fMRI; Ultra high field; Patient; Motor; Sensitivity Introduction The number of ultra high field MR systems, mostly 7 T systems, installed in environments with clinical connections is steadily increasing. Based on a higher signal to noise ratio, expectations are that 7 T systems will improve clinical diagnostics. This also includes © 2011 Elsevier Inc. ⁎ Corresponding author at: Study Group Clinical fMRI, Department of Neurology, Medical University of Vienna, Währinger Gürtel 18-20, 1090 Vienna, Austria. Fax: + 43 1 40400 3459. [email protected]. This document was posted here by permission of the publisher. At the time of deposit, it included all changes made during peer review, copyediting, and publishing. The U.S. National Library of Medicine is responsible for all links within the document and for incorporating any publisher-supplied amendments or retractions issued subsequently. The published journal article, guaranteed to be such by Elsevier, is available for free, on ScienceDirect. Sponsored document from Neuroimage Published as: Neuroimage. 2011 August 01; 57(3): 1015–1021. Sponsored Document Sponsored Document Sponsored Document
-
Upload
independent -
Category
Documents
-
view
0 -
download
0
Transcript of Clinical fMRI: Evidence for a 7T benefit over 3T

Clinical fMRI: Evidence for a 7 T benefit over 3 T
R. Beisteinera,c,⁎, S. Robinsonb,c, M. Wurniga,c, M. Hilberta,c, K. Merksaa,c, J. Ratha,c, I.Höllingera,c, N. Klingera,c, Ch. Marosid, S. Trattnigb,c, and A. Geißlera,c
aStudy Group Clinical fMRI, Department of Neurology, Medical University of Vienna, AustriabDepartment of Radiology, Medical University of Vienna, Austria, Währinger Gürtel 18-20, 1090Vienna, AustriacMR Center of Excellence, Medical University of Vienna, Austria, Währinger Gürtel 18-20, 1090Vienna, AustriadDepartment of Medicine I, Medical University of Vienna, Austria, Währinger Gürtel 18-20, 1090Vienna, Austria
AbstractDespite there being an increasing number of installations of ultra high field MR systems (> 3 T) inclinical environments, no functional patient investigations have yet examined possible benefits forfunctional diagnostics. Here we performed presurgical localization of the primary motor hand areaon 3 T and 7 T Siemens scanners with identical investigational procedures and comparable systemspecific sequence optimizations. Results from 17 patients showed significantly higher functionalsensitivity of the 7 T system measured via percent signal change, mean t-values, number ofsuprathreshold voxels and contrast to noise ratio. On the other hand, 7 T data suffered from asignificant increase of artifacts (ghosting, head motion). We conclude that ultra high field systemsprovide a clinically relevant increase of functional sensitivity for patient investigations.
Highlights► Comparison of 3 T and 7 T fMRI in functional diagnostics. ► Differences in presurgicallocalization of the primary motor hand area were examined. ► Results from 17 patients showedhigher functional sensitivity for 7 T measurements.
KeywordsfMRI; Ultra high field; Patient; Motor; Sensitivity
IntroductionThe number of ultra high field MR systems, mostly 7 T systems, installed in environmentswith clinical connections is steadily increasing. Based on a higher signal to noise ratio,expectations are that 7 T systems will improve clinical diagnostics. This also includes
© 2011 Elsevier Inc.⁎Corresponding author at: Study Group Clinical fMRI, Department of Neurology, Medical University of Vienna, Währinger Gürtel18-20, 1090 Vienna, Austria. Fax: + 43 1 40400 3459. [email protected] document was posted here by permission of the publisher. At the time of deposit, it included all changes made during peerreview, copyediting, and publishing. The U.S. National Library of Medicine is responsible for all links within the document and forincorporating any publisher-supplied amendments or retractions issued subsequently. The published journal article, guaranteed to besuch by Elsevier, is available for free, on ScienceDirect.
Sponsored document fromNeuroimage
Published as: Neuroimage. 2011 August 01; 57(3): 1015–1021.
Sponsored Docum
ent Sponsored D
ocument
Sponsored Docum
ent

functional diagnostics, which relies on increased sensitivity to the BOLD (BloodOxygenation Level Dependent) effect (Olman et al., 2010; van der Zwaag et al., 2009).
Despite this background, results from 7 T patient studies are yet scarce. A small number ofinitial patient investigations and feasibility studies have compared 7 T data with data from3 T, 1.5 T or data from literature. They have indicated 7 T benefits for morphologicaldiagnostics, including improved detection of multiple sclerosis plaques (Kollia et al., 2009;Metcalf et al., 2010), improved detection of pathologies in Alzheimer's disease (Nakada etal., 2008) and improved classification of brain lesions (Moenninghoff et al., 2010;Tallantyre et al., 2009). Benefits have also been described for angiographic detection ofsmall vessel changes in hypertensive patients (Kang et al., 2009) and spectroscopicinvestigations of brain tumors (Avdievich et al., 2009). However, to date, no functionalpatient investigations have been performed at 7 T to examine possible benefits for functionaldiagnostics (e.g. presurgical localization of essential cortical areas using fMRI).
Clinical fMRI offers considerable potential to reduce invasive diagnostic procedures and isalready routinely applied in specialized diagnostic centers (for a recent review see Prayer etal., 2010). A recent fMRI study of healthy subjects comparing functional results at 1.5, 3and 7 T showed several 7 T benefits based on an increased ΔR2*/R2* ratio (van der Zwaaget al., 2009). However, there are also several drawbacks of high field systems which maycounteract improved BOLD sensitivity, in particular in patients with pathological brains.The most important issues are increased susceptibility artifacts, reduced homogeneity of thetransmitted radiofrequency field and potentially larger motion artifacts. Due to brainpathology and the patients’ limited abilities to cooperate, these issues may result inincreased image distortions, local artifacts and signal dropouts compared to healthy subjects.As a consequence, it is currently not clear whether advantages or disadvantages of ultra highfield systems prevail for functional clinical diagnostics.
Given the fact that clinical 3 T high field systems are now widely available, this studyinvestigated whether there are diagnostic benefits for a standardized fMRI investigationwhen progressing from 3 T to 7 T in a clinical setting. A frequently requested presurgicallocalization of the primary motor hand area was chosen as clinically relevant task. Weconcentrated on results achievable with identical investigational procedures and comparablesystem-specific sequence optimizations performed according to the current state of the art.Important clinical image parameters such as matrix size and field of view were keptconstant, as was the analysis approach. Evaluation concentrated on key parameters forassessing functional sensitivity, including percentage signal change, contrast to noise ratioand statistical parameters within functional regions of interest (ROIs). Our hypothesis wasthat a clinically relevant benefit, evidenced through functional sensitivity, would be presentfor fMRI studies in brains affected by pathology at 7 T.
Materials and methodsPatients
Seventeen patients (6 females, mean age 40.5 years old and 11 males, mean age 25.3 yearsold; age range 9–70 years of age), consecutively referred for presurgical diagnostics,participated in the study (see Table 1 for demographic and clinical details). For all patients, afunctional localization of the motor hand area for the clinically affected hand had beenrequested by physicians, for a number of reasons. No exclusion criterions were applied. Atthe time of measurement, all patients were of good general constitution, could move therelevant hand against resistance and could perform the motor task well. The study wasapproved by the ethics committee of the Medical University of Vienna. All patients gavewritten informed consent.
Beisteiner et al. Page 2
Published as: Neuroimage. 2011 August 01; 57(3): 1015–1021.
Sponsored Docum
ent Sponsored D
ocument
Sponsored Docum
ent

TaskThe functional paradigm was a simple motor task: repetitive opening and closing of theaffected hand with eyes open. The healthy hand was investigated in peripheral nerve patientP8 due to exceptional paresis (see Table 1). One run consisted of four rest (A) and threemovement phases (B) of 20 s each presented in a blocked ABABABA design. Depending onthe patient's tolerance, between four and eight runs were accomplished. Instructions – whento begin and when to stop the action – were communicated to the patients via headphones.Patients were requested to perform the task at a rate of 1 Hz (for each cycle of opening andclosing the hand) and were assisted in achieving this via a visually presented indicator; acircle, which was cyan for 0.5 s, then red for 0.5 s. The visual input during rest phases wasidentical.
Image acquisitionPatients were examined with both a 3 T Siemens MAGNETOM TIM TRIO scanner and a7 T Siemens MAGNETOM scanner (Siemens, Erlangen, Germany). Measurements at thetwo field strengths were typically carried out within 10 days. However, for clinical reasons,for 2 patients this interval had to be increased (to 37 days for P11, to 62 days for P12). Tominimize head motion artifacts, individually constructed plaster cast helmets (Edward et al.,2000) were used on both systems. A 32 channel Siemens head coil (Siemens, Erlangen,Germany) was used for 3 T measurements. For 7 T measurements, a 24 channel head coilwas applied for P1–P15, while – due to a system upgrade involving a coil exchange – P16and P17 were measured with a 32 channel head coil (both manufactured by Nova Medical,Wilmington, Massachusetts, USA). On both systems, functional MRI data were acquiredwith a 2D single-shot gradient echo (GE) EPI sequence, with slices aligned parallel to theAC-PC plane and whole brain coverage. Simple system-specific sequence optimizationswere performed according to requirements for whole brain coverage and recommendationsin the literature.
Common sequence parameters—FOV 230 mm, matrix size 128 × 128 × 34, 56repetitions, slice thickness 3 mm, TR: 2500 ms, parallel imaging with GRAPPA-iPAT factor2, fat suppression by a chemical shift selective saturation pulse prior to every slice, 10 s ofdummy scans.
Differing sequence parameters—
3 T: TE 28 ms, bandwidth 2220 Hz, flip angle 90°, full Fourier encoding, no gapbetween slices. Vendor provided fat saturation module with a preset flip angle of 110°.
7 T: TE 22 ms, bandwidth 1445 Hz (P1 1220 Hz, P4 1395 Hz to reduce ghosting), flipangle 80°, 6/8 partial Fourier factor (omitting the first 25% of k-space phase-encodinglines), 10% gap between slices. The effective echo time at 7 T was optimized viaassessment of T2* for this resolution. Flip angles of the vendor-provided fat saturationmodule were reduced to 90° due to specific absorption rate (SAR) limitations.
At each field strength, high-resolution sagittal T1-weighted MR images were acquired usinga 3D MPRAGE sequence for visualizing anatomical details. However, these images did notenter data analysis in the current study.
fMRI data analysisFunctional data were pre-processed and statistical analysis was performed using SPM8(Wellcome Department of Imaging Neuroscience, London, UK;http://www.fil.ucl.ac.uk/spm). To reduce residual small-scale motion, all runs wereregistered to the first scan using default settings except for the factors “Quality: 0.95” and
Beisteiner et al. Page 3
Published as: Neuroimage. 2011 August 01; 57(3): 1015–1021.
Sponsored Docum
ent Sponsored D
ocument
Sponsored Docum
ent

“Separation: 2”, both chosen to improve correction quality. No slice timing correction orspatial normalization was carried out. Functional images were smoothed with a4 × 4 × 6 mm full width at half maximum (FWHM) Gaussian kernel. First level statisticalanalysis was performed with a mixed effects analysis (default settings, no additionaltemporal filtering or averaging) with inclusion of motion parameters in the design matrix asnuisance variables. BOLD responses were modeled by a fixed response boxcar functionconvolved with the canonical hemodynamic response. Activation was established for eachpatient via voxel-wise t-tests to generate individual SPM t-maps. The same number of 3 Tand 7 T runs were analyzed for each patient. All superfluous runs were excluded (byacquisition order, to avoid bias).
Definition of functional ROIsFirst, individual neuroanatomical ROIs comprising the inverted omega structure around thecentral sulcus (the primary motor hand area) were manually defined by a neurologist (Figs. 1and 2). The ROI definitions were carried out separately for each field strength. All activatedvoxels (p < = 0.05, family-wise error (FWE) — corrected, (Nichols and Hayasaka, 2003))within the predefined ROI formed the resulting functional ROI. The validity of thefunctional ROIs was verified by visually inspecting individual SPM t-maps superposed onan individual EPI image (mean image after realignment). Given that the size of regionsidentified as being active may increase with the field strength, this procedure assuredinclusion of all relevant primary motor activations and reduced the influence of non-primarycortex activity on final results.
Data quantificationTo assess effects related to the two field strengths, we analyzed only significant voxels inthe functional ROIs and compared six measures relevant to functional activation: (1) voxelcount (number of supra-threshold voxels), (2) mean t-value, (3) peak t-value, (4) percentagesignal change, (5) contrast to noise ratio (CNR) (Geissler et al., 2007) and (6) peak CNR. Toevaluate relevant sources of artifacts, a metric for head motion and a ghost to signal ratiowere also calculated.
Quantification of functional activationMeasures (1) Voxel count, (2) Mean t-value and (3) Peak t-value: For each patient, allvoxels included in the functional ROIs (fROIs) were separately analyzed for the 3 T and 7 Texperiments. The voxel count (the number of voxels in the fROI), the mean t-value of allfROI voxels and the highest t-value of all fROI voxels were determined.
Measure (4) Percentage signal change: Percentage signal change, ΔS/ SOFF, wascalculated according to the definition of van der Zwaag et al. (2009, c.f. section “Analysis”).In brief ΔS = (SON-SOFF), where SON is the mean absolute signal of all time points within“ON” phases and SOFF is the mean of all time points within “OFF” phases (arithmethicmean, voxel-wise calculation). For the definition of ON and OFF phases the underlyingblock design of the paradigm was shifted by five seconds to accord with the delayed BOLDresponse. This calculation was performed for all voxels within the fROI separately for everyrun of each patient followed by arithmetic averaging to achieve one representative figure perpatient and field strength.
Measures (5) Contrast to noise ratio (CNR) and (6) Peak contrast to noise ratio: CNRwas calculated from ΔSCNR/σt-noise, as defined in Geissler et al. (2007), paragraph “CNRCalculation Using Savitzky-Golay (SG) Filters (CNR_SG)”. Essentially, the contrast ΔSCNRis the averaged voxel-wise signal change in the temporally smoothed original signal: (meanvalue of all time points within the “ON” phase) – (mean value of all time points within the
Beisteiner et al. Page 4
Published as: Neuroimage. 2011 August 01; 57(3): 1015–1021.
Sponsored Docum
ent Sponsored D
ocument
Sponsored Docum
ent

“OFF” phase). ON/OFF definitions were the same as for the percentage signal changeanalysis (measure 4, see above). Smoothing was performed using a Savitzky–Golay filterwith a polynomial order of 2 and length 5. σt-noise is the non-task-related variability overtime — in this case the standard deviation of the difference between the original andsmoothed signals. Again, this calculation was done for all voxels within the functional ROIand every run of each patient, followed by arithmetic averaging to achieve onerepresentative number per patient and field strength. The patient's peak CNR wasdetermined by analyzing the mean CNR values of all ROI voxels separately for the 3 T and7 T experiments to detect the voxels with the largest 3 T / 7 T CNR.
Calculation of motion indicator for head motion quantification—Head motionwas quantified at both field strengths using the parameters resulting from the motioncorrection procedure of SPM8. It was hypothesized that head motion may differ betweenMR systems due to the different dimensions of the magnet (3 T/7 T = 2.13 m/4 m length),head coils and head fixation helmets (Edward et al., 2000). To evaluate head motion, aglobal parameter was calculated separately for translation and rotation. Translation:integrating x-, y-, and z-axis values, the Euclidian distance (in mm) between successivevolumes was determined for every run. The median of these between-volume distances wastaken used as a single-parameter metric for motion. Rotation: for each angle (pitch, roll,yaw) between-volume rotations were assessed and the median between-volume rotation (inrad) was determined over all volumes of all runs per patient and axis.
Calculation of ghost to signal ratio for quantification of ghosting artifacts—Parallel imaging (PI) allows phase-encoding steps to be omitted, enabling resolution to beincreased (while achieving the same effective echo time) and distortion to be decreased. Inthis study, generalized auto-calibrating parallel acquisition (GRAPPA) factor 2 was used atboth field strengths (Griswold et al., 2002). With acceleration, image quality is reduced bypatient motion, which affects the applicability of reference lines and leads to ghost-likeartifacts (Skare et al., 2007). To determine the magnitude of these artifacts we defined aghost to signal ratio similar to that defined in the EU COMAC-BME II project (Lerski andde Certaines, 1993). Two types of ROIs were defined (Fig. 3): a central reference ROI — ina homogenous region of white matter within the brain and one anterior and one posteriorghosting ROI — comprising ghosting artifacts occurring in the phase-encode direction. ROIselection was performed within three slices adjacent to the central slice of the EPI dataset.For every patient, the ghost to signal ratio was calculated as the ratio between the meanabsolute signal within the ghosting ROIs to the mean signal in the central reference ROI.
Statistical evaluation of 3 T–7 T differencesAfter testing for normal distribution, paired t-tests comparing 3 T and 7 T values werecalculated over all patients for voxel count, mean t-value, peak t-value, percentage signalchange, CNR, peak CNR, motion indicator and ghost to signal ratio.
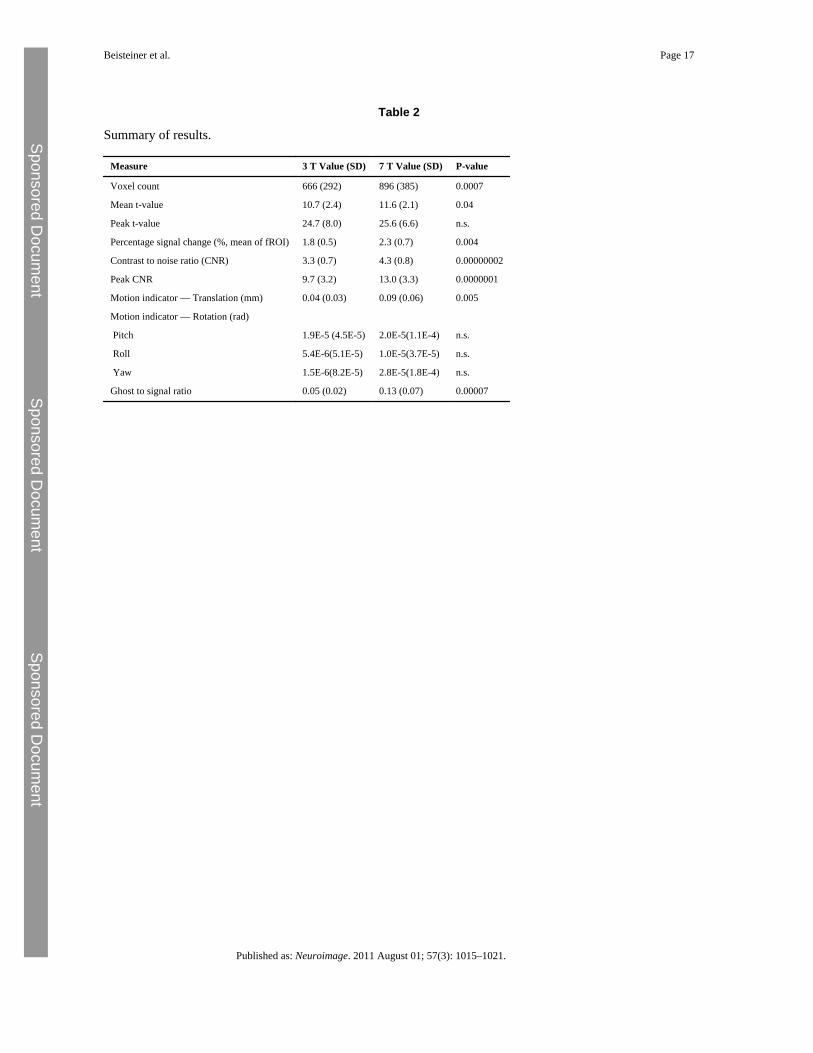
ResultsThe primary metrics described in “Data quantification” are summarized in Table 2 for 3 Tand 7 T measurements. All measures of functional activation showed a statisticallysignificant benefit for the 7 T system, except for peak t-value, which showed no significantdifference between 3 T and 7 T data. None of the measures indicated advantage for the 3 Tsystem. Figs. 1 and 2 show typical activation changes from 3 T to 7 T. Fig. 4 illustrates themean signal and CNR increase with the 7 T system.
Beisteiner et al. Page 5
Published as: Neuroimage. 2011 August 01; 57(3): 1015–1021.
Sponsored Docum
ent Sponsored D
ocument
Sponsored Docum
ent
While functional signal changes were greater, 7 T measurements suffered from a significantincrease in artifacts: translational head motions were significantly larger (c.f. Fig. 5, rotationn.s.) and ghosting was substantially increased (see Fig. 6).
As part of a hardware upgrade the 24-channel coil which was used for the study of patientsP1-15 was replaced by a 32-channel coil, which was used for measurement of P16 and P17.The main results – significant improvement in all performance metrics other than peak t-value – hold if P16 and P17 are excluded from the analysis.
DiscussionThis study provides first data on the possible benefit of ultra high field systems for clinicalfMRI. It is well known that imaging problems such as geometric distortions, signal dropoutsand B1 inhomogeneity increase at very high field. The deleterious effects on functionalimages of pathological brains are not known. Correspondingly, it is not clear whether thepotential benefits of 7 T systems may be realized in practice in clinical fMRI.
Previous ultra high field studies performed with healthy subjects typically used limited fieldof views (FOV) and, other than Gizewski et al. (2007) no functional whole brain coveragee.g. (Duong et al., 2003; Olman et al., 2010; van der Zwaag et al., 2009; Yacoub et al.,2001). This was due to technical limitations in some first-generation scanners and also toSAR limitations. However, the typical demand for a clinical application is whole braincoverage, since shifts of essential cortical areas due to pathology and functionalreorganization are not predictable prior to the functional investigation. Another importantproblem with pathological brains concerns errors introduced by registration/normalizationprocedures or atlas-based region of interest definitions (Beisteiner et al., 2010; Gartus et al.,2007). To account for these issues, we performed whole brain coverage with a multichannelcoil and a sub-maximal but clinically typical spatial resolution and data analysis on non-transformed individual functional images. The application of multichannel coils in this studyenabled parallel imaging to be applied, which effectively reduced image distortions. Ourmotor task was standardized by visual triggering and represented a typical clinical paradigmwhich assured similar performance in both MR systems.
We performed a standard SPM8 data analysis with all individual data sets (FWE < 0.05,motion parameters included as covariates of no interest, independent analysis of 3 T and 7 Tdata) and defined functional ROIs (fROIs) for primary motor hand activation. With thegiven task and an adequate amount of functional data, fROI definitions are possible withhigh reliability in pathological brains (Roessler et al., 2005). Our data analysis approachreduces the influence of non-primary cortex activity on the final results and minimizeseffects related to postprocessing data transformations. To allow a comprehensiveinterpretation of 3 T–7 T differences and common grounds with previous studies (e.g. vander Zwaag et al., 2009), several measures were extracted from the functional ROIs: voxelcount, mean t-value, peak t-value, percentage signal change, contrast to noise ratio (CNR)and peak CNR. The CNR analysis allows investigation of the data with minimal modelassumptions, since it is not dependent on the shape of the hemodynamic response functionbut only on the mean signal increase during the “ON” phase (Geissler et al., 2007). As withevery fMRI study such measures depend on the statistical thresholds used. However, forevery clinical report a threshold needs to be defined (see discussion in (Beisteiner et al.,2010)). Here we used identical statistical models for 3 T and 7 T data and a well establishedthreshold (FWE p < 0.05) often used for clinical reports. Therefore, we consider it justifiedto regard these results as being relevant for patient investigations. Since our focus was onevaluating final fMRI results typically used for generating clinical reports – andcorresponding to most previous studies investigating BOLD signal changes as a function of
Beisteiner et al. Page 6
Published as: Neuroimage. 2011 August 01; 57(3): 1015–1021.
Sponsored Docum
ent Sponsored D
ocument
Sponsored Docum
ent

field strength – we did not directly measure the effect of changes of relaxation rates onactivation. However, we evaluated the possible influence of typical sources of artifacts byquantifying the amount of ghosting and head motion.
The results demonstrate a significant 7 T benefit for all functional measures apart from peakt-value. The latter finding might be related to the increased artifact contamination of the 7 Tdata which might have more impact when comparing individual voxels instead of clusters.Patients showed significantly more head motion in the 7 T system, most probably due to theinferior head fixation (due to space restrictions in the 7 T head coil) and inferior comfortcompared to the clinical 3 T system (space, noise, light…). In addition, ghosting artifactswere significantly larger in our 7 T images. Given the 3 T/7 T experimental standardizationsand application of standard thresholds, increase of activation sensitivity and activationvolume should be a direct consequence of better SNR/CNR at 7 T. This corresponds toprevious literature e.g. (Logothetis et al., 2001) which indicates that the fMRI signals„underestimate a great deal of actual neural activity“. Further, investigations concerned withsensitivity for tissue/draining veins indicate that there should also be a benefit for reducedsensitivity to larger and draining veins (relative to sensitivity for tissue signals) at 7 T(Duong et al., 2003; Gati et al., 1997; Ogawa et al., 1998; Yacoub et al., 2001). The patientsinvestigated in this study represent a typical clinical population. Inclusion was based solelyon requests for motor localizations that were not influenced by the authors. It is also notablethat we limited our procedures to system-specific setup and simple sequence optimizationsperformed according to the literature (e.g. Speck et al., 2008) — an approach feasible inevery clinical context. The measurements were clinically standardized (including identicalspatial resolution and whole brain coverage) and both MR systems were from the samemanufacturer and current technical state of the art (including identical gradients andcommercially available multi-channel head coils with a similar basic design and number ofchannels). Our results therefore represent realistic clinical outcome conditions and indicatethat a functional 7 T benefit is not limited to special application conditions such aspreselected patients or atypical coils and fMRI sequences. Interestingly, our findings arequite similar to previously reported results in healthy subjects, where significant 7 T benefitswere established for voxel count, mean t-value and percentage signal change (van derZwaag et al., 2009, CNR analysis was not performed). Therefore the benefit for patientsaccords well with that established with normal subjects. Of course, our results cannot beextrapolated to other fMRI paradigms or areas of the brain more prone to artifacts (inferiorfrontal cortex, basal temporal cortex). Such investigations have yet to be undertaken.
It is evident that comparisons of fMRI results from different MR systems may be influencedby numerous factors including hardware specifications, hardware quality, coils, softwarespecifications, MR sequence details and differing patient states due to differing systemenvironments. For example, it has been shown that high-field benefits are greatest at highresolution, a regime in which physiological noise is smallest relative to the thermal noise(Triantafyllou et al., 2005). However, Triantafyllou et al. also show that the tSNR gain for7 T over 3 T reaches a maximum for voxel sizes of about 2 × 2 × 3 (at ratio ofapproximately 1.32). Further reductions in voxel size bring no additional increase in theratio of tSNR measured at 7 T compared to 3 T. The resolution used here was close to that atwhich Triantafyllou et al. observed the greatest increase in time-series SNR at 7 T over 3 T,so at most only a modest benefit is to be expected for comparison studies carried out athigher spatial resolution.
The MR environment may influence the general arousal state, which may also haveconsequences for the fMRI results (Nagai et al., 2004). Although we were able to establishcomparability of final results for a clinical context (for instance, by applying a spatialstandard resolution and matched measurement times), it is evident that the full potential of
Beisteiner et al. Page 7
Published as: Neuroimage. 2011 August 01; 57(3): 1015–1021.
Sponsored Docum
ent Sponsored D
ocument
Sponsored Docum
ent

7 T systems has not yet been exhausted with our setup. In fact, many factors differingbetween the 3 T and 7 T measurement in this study benefit the 3 T measurements. In the 3 Tstudy we used a 32-channel coil (whereas most 7 T measurements were made with a 24–channel coil), full Fourier encoding, better head fixation and a more comfortableenvironment. The latter two factors led to markedly less head motion. The single (andmodest) advantage in the 7 T study was the 10% gap allocation. Quite obviously, it is notpossible to establish “identical” hardware setups and exact replications of sequenceparameters or carry out a functional study with systematic variation of all relevantparameters. Additional investigations are required to clarify which parameter optimizationsare most promising for a further increase of 7 T functional signal benefits in a clinicalcontext.
Despite these qualifications, we conclude that 7 T systems enable a clinically relevantincrease in functional sensitivity for patient investigations.
ReferencesAvdievich N.I. Pan J.W. Baehring J.M. Spencer D.D. Hetherington H.P. Short echo spectroscopic
imaging of the human brain at 7 T using transceiver arrays. Magn. Reson. Med.. 2009; 62:17–25.[PubMed: 19365851]
Beisteiner R. Klinger N. Hollinger I. Rath J. Gruber S. Steinkellner T. Foki T. Geissler A. How muchare clinical fMRI reports influenced by standard postprocessing methods? An investigation ofnormalization and region of interest effects in the medial temporal lobe. Hum. Brain Mapp.. 2010;31:1951–1966. [PubMed: 20205247]
Duong T.Q. Yacoub E. Adriany G. Hu X. Ugurbil K. Kim S.G. Microvascular BOLD contribution at 4and 7 T in the human brain: gradient-echo and spin-echo fMRI with suppression of blood effects.Magn. Reson. Med.. 2003; 49:1019–1027. [PubMed: 12768579]
Edward V. Windischberger C. Cunnington R. Erdler M. Lanzenberger R. Mayer D. Endl W. BeisteinerR. Quantification of fMRI artifact reduction by a novel plaster cast head holder. Hum. Brain Mapp..2000; 11:207–213. [PubMed: 11098798]
Gartus A. Geissler A. Foki T. Tahamtan A.R. Pahs G. Barth M. Pinker K. Trattnig S. Beisteiner R.Comparison of fMRI coregistration results between human experts and software solutions inpatients and healthy subjects. Eur. Radiol.. 2007; 17:1634–1643. [PubMed: 17036153]
Gati J.S. Menon R.S. Ugurbil K. Rutt B.K. Experimental determination of the BOLD field strengthdependence in vessels and tissue. Magn. Reson. Med.. 1997; 38:296–302. [PubMed: 9256111]
Geissler A. Gartus A. Foki T. Tahamtan A.R. Beisteiner R. Barth M. Contrast-to-noise ratio (CNR) asa quality parameter in fMRI. J. Magn. Reson. Imaging. 2007; 25:1263–1270. [PubMed: 17520733]
Gizewski E.R. de Greiff A. Maderwald S. Timmann D. Forsting M. Ladd M.E. fMRI at 7 T: whole-brain coverage and signal advantages even infratentorially? Neuroimage. 2007; 37:761–768.[PubMed: 17644414]
Griswold M.A. Jakob P.M. Heidemann R.M. Nittka M. Jellus V. Wang J. Kiefer B. Haase A.Generalized autocalibrating partially parallel acquisitions (GRAPPA). Magn. Reson. Med.. 2002;47:1202–1210. [PubMed: 12111967]
Kang C.K. Park C.A. Lee H. Kim S.H. Park C.W. Kim Y.B. Cho Z.H. Hypertension correlates withlenticulostriate arteries visualized by 7 T magnetic resonance angiography. Hypertension. 2009;54:1050–1056. [PubMed: 19805635]
Kollia K. Maderwald S. Putzki N. Schlamann M. Theysohn J.M. Kraff O. Ladd M.E. Forsting M.Wanke I. First clinical study on ultra-high-field MR imaging in patients with multiple sclerosis:comparison of 1.5 T and 7 T. AJNR Am. J. Neuroradiol.. 2009; 30:699–702. [PubMed: 19147714]
Lerski R.A. de Certaines J.D. Performance assessment and quality control in MRI by Eurospin testobjects and protocols. Magn. Reson. Imaging. 1993; 11:817–833. [PubMed: 8371637]
Logothetis N.K. Pauls J. Augath M. Trinath T. Oeltermann A. Neurophysiological investigation of thebasis of the fMRI signal. Nature. 2001; 412:150–157. [PubMed: 11449264]
Beisteiner et al. Page 8
Published as: Neuroimage. 2011 August 01; 57(3): 1015–1021.
Sponsored Docum
ent Sponsored D
ocument
Sponsored Docum
ent

Metcalf M. Xu D. Okuda D.T. Carvajal L. Srinivasan R. Kelley D.A. Mukherjee P. Nelson S.J.Vigneron D.B. Pelletier D. High-resolution phased-array MRI of the human brain at 7 tesla: initialexperience in multiple sclerosis patients. J. Neuroimaging. 2010; 20:141–147. [PubMed:19187478]
Moenninghoff C. Kraff O. Schlamann M. Ladd M.E. Katsarava Z. Gizewski E.R. Assessing adysplastic cerebellar gangliocytoma (Lhermitte-Duclos disease) with 7 T MR imaging. Korean J.Radiol.. 2010; 11:244–248. [PubMed: 20191074]
Nagai Y. Critchley H.D. Featherstone E. Fenwick P.B. Trimble M.R. Dolan R.J. Brain activity relatingto the contingent negative variation: an fMRI investigation. Neuroimage. 2004; 21:1232–1241.[PubMed: 15050551]
Nakada T. Matsuzawa H. Igarashi H. Fujii Y. Kwee I.L. In vivo visualization of senile-plaque-likepathology in Alzheimer's disease patients by MR microscopy on a 7 T system. J. Neuroimaging.2008; 18:125–129. [PubMed: 18298677]
Nichols T. Hayasaka S. Controlling the familywise error rate in functional neuroimaging: acomparative review. Stat. Methods Med. Res.. 2003; 12:419–446. [PubMed: 14599004]
Ogawa S. Menon R.S. Kim S.G. Ugurbil K. On the characteristics of functional magnetic resonanceimaging of the brain. Annu. Rev. Biophys. Biomol. Struct.. 1998; 27:447–474. [PubMed:9646874]
Olman C.A. Van de Moortele P.F. Schumacher J.F. Guy J.R. Ugurbil K. Yacoub E. Retinotopicmapping with spin echo BOLD at 7 T. Magn. Reson. Imaging. 2010; 28:1258–1269. [PubMed:20656431]
Prayer D. Foki T. Beisteiner R. Stippich C. Woermann F.G. Labudda K. Furtner J. Sachs G. KasprianG. Seidel S. Windischberger C. Fischmeister F.P.S. Schöpf V. Sladky R. Moser E. FunktionelleMRT im klinischen Einsatz. Radiologe. 2010; 50(2):103–151. Feb.
Roessler K. Donat M. Lanzenberger R. Novak K. Geissler A. Gartus A. Tahamtan A.R. Milakara D.Czech T. Barth M. Knosp E. Beisteiner R. Evaluation of preoperative high magnetic field motorfunctional MRI (3 Tesla) in glioma patients by navigated electrocortical stimulation andpostoperative outcome. J. Neurol. Neurosurg. Psychiatry. 2005; 76:1152–1157. [PubMed:16024896]
Skare S. Newbould R.D. Clayton D.B. Albers G.W. Nagle S. Bammer R. Clinical multishot DW-EPIthrough parallel imaging with considerations of susceptibility, motion, and noise. Magn. Reson.Med.. 2007; 57:881–890. [PubMed: 17457876]
Speck O. Stadler J. Zaitsev M. High resolution single-shot EPI at 7 T. MAGMA. 2008; 21:73–86.[PubMed: 17973132]
Tallantyre E.C. Morgan P.S. Dixon J.E. Al-Radaideh A. Brookes M.J. Evangelou N. Morris P.G. Acomparison of 3 T and 7 T in the detection of small parenchymal veins within MS lesions. Invest.Radiol.. 2009; 44:491–494. [PubMed: 19652606]
Triantafyllou C. Hoge R.D. Krueger G. Wiggins C.J. Potthast A. Wiggins G.C. Wald L.L. Comparisonof physiological noise at 1.5 T, 3 T and 7 T and optimization of fMRI acquisition parameters.Neuroimage. 2005; 26:243–250. [PubMed: 15862224]
van der Zwaag W. Francis S. Head K. Peters A. Gowland P. Morris P. Bowtell R. fMRI at 1.5, 3 and7 T: characterising BOLD signal changes. Neuroimage. 2009; 47:1425–1434. [PubMed:19446641]
Yacoub E. Shmuel A. Pfeuffer J. Van De Moortele P.F. Adriany G. Andersen P. Vaughan J.T. MerkleH. Ugurbil K. Hu X. Imaging brain function in humans at 7 Tesla. Magn. Reson. Med.. 2001;45:588–594. [PubMed: 11283986]
AcknowledgmentsThis study was supported by the Austrian Science Fund (P18057-B13) and the Vienna Spots of ExcellenceProgramme „VIACLIC“. We are grateful to FPS Fischmeister for critical input into the manuscript.
Beisteiner et al. Page 9
Published as: Neuroimage. 2011 August 01; 57(3): 1015–1021.
Sponsored Docum
ent Sponsored D
ocument
Sponsored Docum
ent

Fig. 1.Patient P6. A: Functional EPI slices covering central parts of the primary motor hand area at3 T and 7 T. B: Same as A with neuroanatomical ROIs depicting the primary motor handarea (light green). C: Same as B with depiction of all suprathreshold voxels (p < = 0.05,FWE — corrected) within the neuroanatomical ROIs. Only these voxels entered statisticalanalysis and formed the functional ROI. Color bar indicates t-values of active voxels (3 Tmaximum = 22.3, 7 T maximum = 25.3).
Beisteiner et al. Page 10
Published as: Neuroimage. 2011 August 01; 57(3): 1015–1021.
Sponsored Docum
ent Sponsored D
ocument
Sponsored Docum
ent

Fig. 2.Patient P13. Same es Fig. 1. 3 T t-value maximum = 11.8, 7 T t-value maximum = 15.2).
Beisteiner et al. Page 11
Published as: Neuroimage. 2011 August 01; 57(3): 1015–1021.
Sponsored Docum
ent Sponsored D
ocument
Sponsored Docum
ent

Fig. 3.Position of ROIs for quantification of ghosting artifacts (P6, 3 T data). Blue: ROIs fordetection of ghosting signals, Green: central reference ROI. The relation between the meanabsolute signals within the ghosting ROIs to the reference ROIs was calculated.
Beisteiner et al. Page 12
Published as: Neuroimage. 2011 August 01; 57(3): 1015–1021.
Sponsored Docum
ent Sponsored D
ocument
Sponsored Docum
ent

Fig. 4.Signal time course differences averaged over all peak CNR voxels of all patients.
Beisteiner et al. Page 13
Published as: Neuroimage. 2011 August 01; 57(3): 1015–1021.
Sponsored Docum
ent Sponsored D
ocument
Sponsored Docum
ent

Fig. 5.Quantification of head motion. Translational head movements between two consecutivelyrecorded brain volumes are larger with the 7 T system. Data show mean and standarddeviation of the patient specific motion indicators.
Beisteiner et al. Page 14
Published as: Neuroimage. 2011 August 01; 57(3): 1015–1021.
Sponsored Docum
ent Sponsored D
ocument
Sponsored Docum
ent

Fig. 6.Quantification of ghosting signals. The ghost to signal ratio is significantly larger with the7 T system. Data show mean and standard deviation of the patient specific ghost to signalratios.
Beisteiner et al. Page 15
Published as: Neuroimage. 2011 August 01; 57(3): 1015–1021.
Sponsored Docum
ent Sponsored D
ocument
Sponsored Docum
ent

Sponsored Docum
ent Sponsored D
ocument
Sponsored Docum
ent
Beisteiner et al. Page 16
Table 1
Demographic and clinical details of the patients studied.
Patient Sex Age Side of pathology Pathological diagnosis at the time of fMRI
P1 f 34 Right Frontal tumor, unknown origin
P2 m 28 Right Frontal tumor, unknown origin
P3 m 16 Right Parietooccipital malformations (Sturge Weber)
P4 m 70 Left Central recurring glioblastoma
P5 m 21 Right Temporal astrocytoma (II°)
P6 m 38 Left Frontal low grade glioma
P7 f 32 Left Temporal glioblastoma
P8 f 31 Right End to side coaptation right phrenic nerve to right musculocutaneous nerve after completebrachial plexus lesion right. fMRI data from the healthy left hand.
P9 m 11 Right Fronto-central focal cortical dysplasia
P10 m 14 Right Cryptogenic temporal lobe epilepsy
P11 m 9 Left Central focal cortical dysplasia
P12 f 38 Left Opercular oligoastrocytoma (II°)
P13 f 55 Left Left pre-central tumor, unknown origin
P14 m 21 Right Central low grade glioma
P15 m 21 Left Post-central polycystic astrocytoma
P16 m 29 Right Postcentral tumor, unknown origin
P17 F 53 Left Parietal tumor, unknown origin
Published as: Neuroimage. 2011 August 01; 57(3): 1015–1021.
Sponsored Docum
ent Sponsored D
ocument
Sponsored Docum
ent
Beisteiner et al. Page 17
Table 2
Summary of results.
Measure 3 T Value (SD) 7 T Value (SD) P-value
Voxel count 666 (292) 896 (385) 0.0007
Mean t-value 10.7 (2.4) 11.6 (2.1) 0.04
Peak t-value 24.7 (8.0) 25.6 (6.6) n.s.
Percentage signal change (%, mean of fROI) 1.8 (0.5) 2.3 (0.7) 0.004
Contrast to noise ratio (CNR) 3.3 (0.7) 4.3 (0.8) 0.00000002
Peak CNR 9.7 (3.2) 13.0 (3.3) 0.0000001
Motion indicator — Translation (mm) 0.04 (0.03) 0.09 (0.06) 0.005
Motion indicator — Rotation (rad)
Pitch 1.9E-5 (4.5E-5) 2.0E-5(1.1E-4) n.s.
Roll 5.4E-6(5.1E-5) 1.0E-5(3.7E-5) n.s.
Yaw 1.5E-6(8.2E-5) 2.8E-5(1.8E-4) n.s.
Ghost to signal ratio 0.05 (0.02) 0.13 (0.07) 0.00007
Published as: Neuroimage. 2011 August 01; 57(3): 1015–1021.


![[Presentation Title] - United Benefit Advisors](https://static.fdokumen.com/doc/165x107/631fddf59353b08ff5016551/presentation-title-united-benefit-advisors.jpg)