Active learning for sensorimotor coordinations of autonomous robots

RESEARCH ARTICLE
O. Ciccarelli Æ A. T. Toosy Æ J. F. Marsden
C. M. Wheeler-Kingshott Æ C. SahyounP. M. Matthews Æ D. H. Miller Æ A. J. Thompson
Identifying brain regions for integrative sensorimotor processingwith ankle movements
Received: 25 October 2004 / Accepted: 22 February 2005 / Published online: 21 July 2005� Springer-Verlag 2005
Abstract The objective of this study was to define cor-tical and subcortical structures activated during bothactive and passive movements of the ankle, which have afundamental role in the physiology of locomotion, toimprove our understanding of brain sensorimotor inte-gration. Sixteen healthy subjects, all right-foot domi-nant, performed a dorsi-plantar flexion task of the footusing a custom-made wooden manipulandum, whichenabled measurements of the movement amplitude. Allsubjects underwent a training session, which includedsurface electromyography, and were able to relax com-pletely during passive movements. Patterns of activationduring active and passive movements and differencesbetween functional MRI (fMRI) responses for the twotypes of movement were assessed. Regions of commonactivation during the active and passive movements wereidentified by conjunction analysis. We found that pas-sive movements activated cortical regions that wereusually similar in location to those activated by activemovements, although the extent of the activations wasmore limited with passive movements. Active move-ments of both feet generated greater activation thanpassive movements in some regions (such as the ipsi-
lateral primary motor cortex) identified in previousstudies as being important for motor planning. Commonactivations during active and passive movements werefound not only in the contralateral primary motor andsensory cortices, but also in the premotor cortical re-gions (such as the bilateral rolandic operculum andcontralateral supplementary motor area), and in thesubcortical regions (such as the ipsilateral cerebellumand contralateral putamen), suggesting that these re-gions participate in sensorimotor integration for anklemovements. In future, similar fMRI studies using pas-sive movements have potential to elucidate abnormali-ties of sensorimotor integration in central nervoussystem diseases that affect motor function.
Key words Functional MRI Æ Motor system Æ Activemovement Æ Passive movement Æ Sensorimotorintegration
Introduction
Volitional movement is associated with activation of awidespread cortical and subcortical network (Kandelet al. 2000). In an attempt to define the contribution ofafferent feedback to this activation, comparisons havebeen made between active and passive movements.Positron emission tomography (PET) (Mima et al. 1999;Weiller et al. 1996; Yetkin et al. 1995) and functionalMRI (fMRI) studies (Reddy et al. 2001; Yetkin et al.1995) have consistently demonstrated that both activeand passive hand movements activate the contralateralprimary somatosensory and motor areas. Studies havealso shown that premotor areas, supplementary motorcortex, and subcortical structures are similarly activatedduring both types of movement (Jueptner et al. 1997;Reddy et al. 2001; Thickbroom et al. 2003; Weiller et al.1996). This supports the hypothesis that the basal gan-glia and the cerebellum play a role in sensorimotorprocessing. Other authors, however, have not found
O. Ciccarelli (&) Æ A. T. Toosy Æ A. J. ThompsonDepartment of Headache, Brain Injury and Rehabilitation,Institute of Neurology, University College London,Queen Square, London, WC1N 3BG, UKE-mail: [email protected].: +44 207 8373611 ext 4152Fax: + 44 207 8136505
O. Ciccarelli Æ C. Sahyoun Æ P. M. MatthewsCentre for Functional Magnetic Resonance Imaging of the Brain,John Radcliffe Hospital, Headington, Oxford, OX3 DU, UK
J. F. MarsdenMRC Human Movement Group, Sobell Department for MotorNeurophysiology and Movement Disorders,Institute of Neurology, University College London,Queen Square, London, WC1N 3BG, UK
C. M. Wheeler-Kingshott Æ D. H. MillerDepartment of Neuroinflammation, Institute of Neurology,University College London, Queen Square,London, WC1N 3BG, UK
Exp Brain Res (2005) 166: 31–42DOI 10.1007/s00221-005-2335-5

activation in premotor and supplementary motor cor-tices, or in subcortical areas (cerebellum and basalganglia) (Mima et al. 1999; Sahyoun et al. 2004) withpassive movements, suggesting that the contribution ofthe sensory (proprioceptive) input to the activation ofthese structures, if any, is small.
To investigate this issue further, we compared thefMRI response to identical active and passive move-ments of the ankle. While previous studies have focussedmainly on upper limb joints, we assessed the ankle, be-cause it is rhythmically activated during locomotion in asimilar way to that seen in the present study. Activeankle dorsi-flexion has important clinical applicationsand has been shown to be useful for assessing motorcontrol for walking during rehabilitation (Dobkin et al.2004). The fMRI paradigm that we used included pas-sive movements, which do not depend on volitionalplanning and execution, and therefore might be used infuture to assess brain functional changes associated withmotor recovery in patients with brain injury.
Our objective was to statistically determine brain re-gions that were commonly activated by active and passiveankle movements and, thus, may be involved in sensori-motor processing, using the technique of conjunctionanalysis (Price and Friston 1997). We also wished to ex-tend the results of a previous fMRI study (Sahyoun et al.2004) by introducing careful control of the movementcharacteristics, i.e. movement amplitude during activeand passive tasks, and EMG measurements.
Methods
Subjects
Eighteen healthy subjects without any neurological ororthopaedic impairment were studied (mean age 36.22,SD 11.7, 12 men and 6 women). As will be discussedlater, two subjects were excluded from the analysis,leaving a total of 16 subjects (mean age 37.3, SD 11.9, 10men and 6 women). All subjects were right-foot domi-nant and gave informed, written consent to the studythat had been approved by the local research ethicscommittee.
Motor paradigm
The motor task involved repetitive dorsi- and plantar-flexion of the foot. Subjects were studied supine withboth feet (without shoes) strapped into a custom-madewooden manipulandum with the rotation axes alignedwith the ankle joints. This manipulandum lifted thecalves and feet approximately 10 inches above the MRItable; subjects’ knees were flexed and their thighs sup-ported, to ensure the spine was relaxed and minimumamount of movement was transferred to the head duringthe motor task. The paradigm consisted of a pseudo-randomly interleaved block design of 20 s periods of
active and passive movements. Each active and eachpassive period was followed by 20 s of rest. For eachsession, a total of 11 blocks of active and 11 blocks ofpassive movements were performed. Each side was as-sessed separately. The active task was auditory-cued bya metronome at 1.25 Hz. This rate cued the movementfrom dorsi- to plantar-flexion (or vice versa). Therefore,the rate of the whole cycle was approximately 0.6 Hz.All subjects were free to choose the amplitude of theiractive movements to limit the occurrence of fatigue.Passive movements were elicited by an operator (O.C.),via the manipulandum, at the same rate, and at anamplitude matched to that observed during the firstactive movement. The operator visually monitored theexecution of the active task to ensure accurate perfor-mance throughout both sessions. During the rest andpassive periods subjects were instructed to relax as muchas possible without mentally rehearsing the movement.To avoid activation in the visual cortex, subjects weretold to keep their eyes closed throughout.
Assessment of muscular activity
All subjects underwent a training session, which used thesame device, before the fMRI, to ensure they relaxedfully during the passive movements and to enablesimultaneous recording of surface electromyography(EMG) from tibialis anterior and soleus. Subjects firstperformed a maximum voluntary contraction of tibialisanterior and soleus for 5 s. They then performed uni-lateral active and passive ankle movements for twoperiods of 20 s each. Movements were paced by a met-ronome at 1.25 Hz.
The EMG was sampled at 2 kHz, filtered (30–1,000 Hz) and amplified ·2,000 (D360; Digitimer, Wel-wyn Garden City, UK). Data were AD-converted (1410-plus; CED, Cambridge, UK) and recorded using theSpike program (version 4; CED).
The EMG analysis was performed for active andpassive movements separately for each subject. First, themaximum EMG signal was obtained by averaging thesignal from the 1-s period of maximum contraction.After this the average EMG signal, recorded over tendorsi- and plantar-flexion cycles, was calculated, andthen expressed as a percentage of the maximum EMGsignal (EMG-percentage) for each subject.
To investigate differences between EMG-percentageduring active and passive sessions for the left foot andthe right foot, a Wilcoxon signed ranks test was used.
Ankle joint angle measurement
The position of each foot at the start of the task of ankledorsi-plantar flexion was neutral. The angular range ofthe whole movement (from dorsi- to plantar-flexion)during active periods was marked during the trainingsession for each foot, after subjects were asked to move
32

the foot in the most comfortable way. The same anglewas maintained by the operator during passive move-ments. Although each subject was told to maintain thesame angle during the fMRI experiments, the ankle jointangle was re-measured during the first active movement,and this new angle was maintained by the operatorthroughout the subsequent passive periods.
To investigate differences between ankle joint anglemeasured during the fMRI experiments for the left footand the right foot, aWilcoxon signed ranks test was used.
MRI procedure
All imaging was performed with a 1.5 T Signa Echo-speed MRI system (GE Medical System, Milwaukee,WI, USA). For all subjects axial brain dual-echo fast-spin echo (FSE) imaging was acquired before the fMRIexperiment, providing proton-density and T2-weightedimages (TR 2,000 ms, TE 30/120 ms, field of view(FOV) 24 cm·24 cm, matrix 256·256, 28 contiguousaxial slices, 5 mm slice thickness). The functional pro-cedure consisted of 27 interleaved ascending slices cov-ering the whole brain using a single shot gradient-echoEPI (slice thickness 4.6 mm, slice gap 0.4 mm, in-planeresolution 3 mm·3 mm, TR 4 s, matrix 128·64, 220scans acquired over 14 min 40 s).
fMRI analysis
The analysis was performed using Statistical ParametricMapping (SPM99; Wellcome Department of ImagingNeuroscience, London, UK) (Friston et al. 1995;Worsley and Friston 1995). The images were realignedto the first image of each experiment to correct for inter-scan movement. Realignment parameters were checkedfor all subjects, and it was noted that for two subjectsthey were higher than 2 mm in at least one direction;these two subjects were excluded from the study. Theimages were normalized into a standardized space forthe remaining 16 subjects (as defined by the MontrealNeurological Institute, MNI) and smoothed using a full-width half-maximum Gaussian filter of 8 mm. By thecentral limit theorem, smoothing renders the errors morenormal in their distribution, thereby validating the useof standard parametric statistics. Smoothing also helpsto compensate for inter-subject neuroanatomical vari-ability. For each subject a fixed-effects approach wasadopted where the individual smoothed images werethen entered into a design matrix in which the realign-ment parameters were included as covariates of nointerest. Contrasts of parameters estimates for active,passive, active greater than passive, and passive greaterthan active were generated for each subject. One-samplet-tests were then performed for each of these four groupsof contrasts using a random-effects approach (Fristonet al. 1999; Worsley et al. 1996). Statistical SPM(T)images were thresholded at P<0.05 corrected at voxel
level for multiple comparisons across the whole brain todetermine the significant main effects. As a ‘‘step down’’analysis, to investigate whether there were clusters ofsignificant activation that did not contain any significantvoxels at the chosen threshold (Friston et al. 1996), a Pvalue <0.05 corrected at cluster level for multiplecomparisons across the whole brain was also used (Po-line et al. 1997). Activation maps were spatially identi-fied using MRIcro (Rorden and Brett 2000).
Effect of muscular activity and ankle joint angleon the fMRI response
We were interested in assessing the main effects of mus-cular activity and ankle joint angle on the fMRI re-sponse. Three separate linear regression analyses usingSPM99 were performed. In the first analysis the EMG-percentage of the tibialis anterior and soleus during theactive periods of each subject were included as regressors,and age as a covariate of no interest. Both negative andpositive correlations between the fMRI response to ac-tive movements (one contrast per subject was enteredinto the model) and EMG-percentage were investigated.In the second regression analysis, the ankle joint angle ofeach subject maintained during the fMRI experimentswas used as a regressor, and age as a covariate of nointerest. Both negative and positive correlations betweenthe fMRI responses to active movements and ankle jointangle maintained during the fMRI experiments weretested. The third regression analysis was the same as thesecond except that the passive movements-related con-trasts were substituted for the active ones. Statisticalinferences were performed by using a P value <0.05corrected at voxel level for multiple comparisons acrossthe whole brain.
Conjunction of active and passive movements
To identify the areas of common activation during theactive and passive movements a conjunction analysis(Price and Friston 1997) was performed using SPM2(Wellcome Department of Imaging Neuroscience)(Friston et al. 2002). The conjunction analysis tests thenull hypothesis that there is no ‘‘conjoint’’ effect of theactive and passive movements on the fMRI response. Todo this it was necessary to obtain in each fMRI experi-ment two baselines, i.e. rest periods, one for activemovements and one for passive movements. Therefore,the rest periods were divided into two groups: the restscans acquired after the active periods were consideredas baseline for active movements (baseline[active])whereas the rest scans after the passive periods were usedas baseline for passive movements (baseline[passive]).Thus, the following four conditions were considered:active, baseline[active], passive, and baseline[passive].For each subject, at the first level, a new design matrixwas generated and the following four contrasts were
33

created: active (1 0 0 0), baseline[active] (0 1 0 0), pas-sive (0 0 1 0), and baseline[passive] (0 0 0 1). Thesecontrast images were taken to a second level analysisusing a multi-subject conditions and covariates model.This model enabled us to perform a conjunction analysis(which requires all four contrasts in the same designmatrix) of two new contrasts, that were active greaterthan baseline[active] (1 �1 0 0), and passive greater thanbaseline[passive] (0 0 1 �1). Because more than onecontrast per subject was entered in the model at thesecond level, there was a potential risk of violatingassumptions about non-sphericity (independently andequally distributed error terms (Friston 1995)). There-fore, a non-sphericity correction was implemented(Friston et al. 2002). The SPM(T) maps generated by theconjunction analysis were thresholded at a P value<0.05 corrected at voxel level for multiple comparisonsacross the whole brain.
Results
Effect of muscular activity and movement amplitude onthe fMRI response
The EMG-percentages calculated for the tibialis anteriorand soleus during both active and passive periods aresummarized in Table 1. All subjects were able to relaxcompletely during passive movements. The apparentlyhigher EMG-percentage of the soleus muscle duringpassive movement was because of movement-relatednoise in two subjects, and no stretch-evoked activity wasobserved. There were no significant differences betweenthe EMG-percentages during active and passive sessionsfor the dominant and non-dominant foot. Also, therewas no correlation between either tibialis anterior orsoleus EMG-percentage during active movements andthe fMRI response to active movements.
The mean amplitudes of the whole movement ofdorsi- and plantar-flexion were 29.3� on the right side(range 17–70, SD 12.2) and 33.3� on the left side (range15–70, SD 14.9) during the training session, and 28.9� onthe right side (range 10–55, SD 12.8) and 33.4� on the leftside (range 14–63, SD 13.8) during the fMRI experiment.Therefore, the amplitude of the dorsi-flexion alone dur-ing the fMRI experiments was approximately 14.4� onthe right side and 16.7� on the left side. There were nosignificant differences between these joint angles on thetwo sides or for the EMG training and the fMRIexperiments. Further, no correlation was found between
the ankle joint angles maintained during the fMRIexperiments and the fMRI responses to either active orpassive movements.
Brain activation
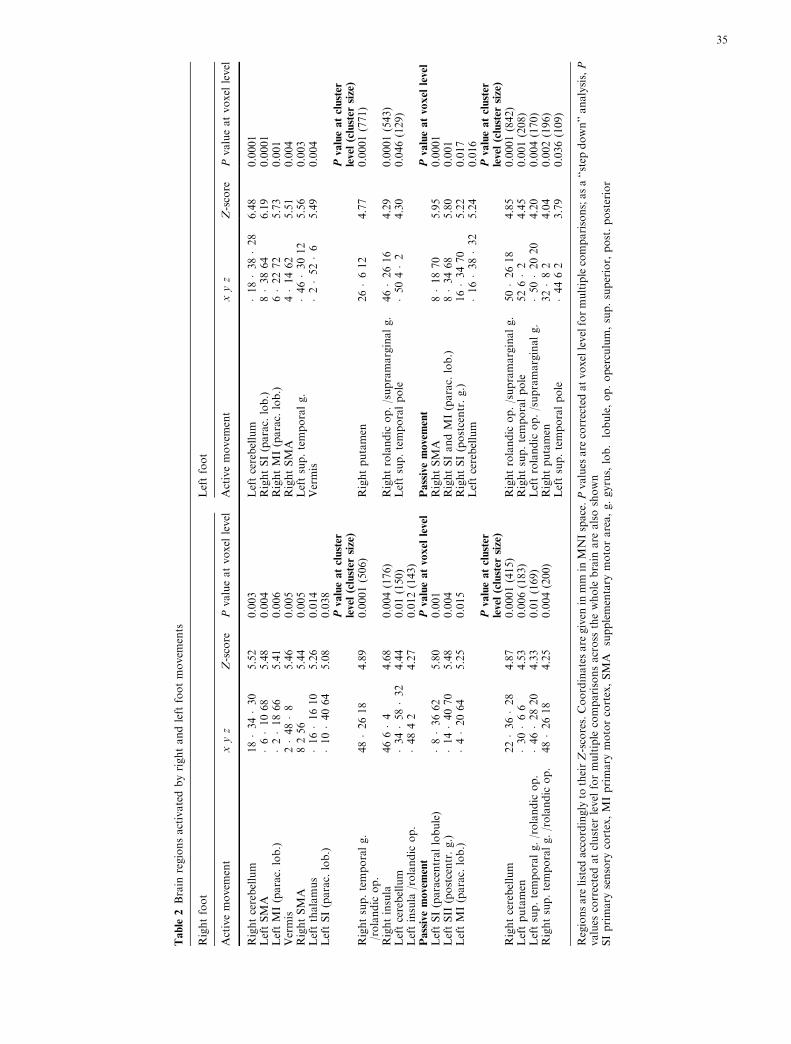
The cortical and subcortical regions significantly acti-vated during active and passive movement of the rightand left ankle are listed in Table 2. Figure 1 shows thecorresponding SPM(T) maps.
Cortical activation during active movements
Both right and left ankle active movements were asso-ciated with activation of the contralateral primary motorcortex (MI) and primary somatosensory cortex (SI) inthe paracentral lobule. Activation was also found in thecontralateral supplementary motor area (SMA) andipsilateral superior temporal gyrus. Additionally, activemovement of the right ankle activated the ipsilateralSMA and the bilateral insula and rolandic operculum.In contrast, active movement of the left ankle activatedthe contralateral rolandic operculum and supramarginalgyrus, and ipsilateral superior temporal pole. Thus, theright SMA was significantly activated by both right andleft active movements.
Subcortical activation during active movements
Active movement of either foot activated the ipsilateralcerebellum in lobules III, IV, and V and the rostralvermis. Active movement of the right ankle additionallyactivated the contralateral thalamus and cerebellum,while active movement of the left ankle additionallyactivated the contralateral posterior and superior puta-men.
Cortical activation during passive movements
Both right and left ankle passive movements wereassociated with activation of the contralateral SI and MIin the paracentral lobule, with extension to the post-central gyrus for the left foot. Right ankle movementalso activated the contralateral SII (Brodmann areas 5and 7) more posteriorly and laterally in the post-centralgyrus. Bilateral activation of the rolandic operculum,with extension to the supramarginal gyrus or to thesuperior temporal gyrus in either foot, was also found.
Table 1 EMG-percentage recorded during the training session
Right foot Left foot
Tibialis anterior Soleus Tibialis anterior Soleus
Mean EMG-percentage of active movements (SD) 12.3 (7.5) 17 (11.7) 15.1 (10.9) 14.2 (10.8)Mean EMG-percentage of passive movements (SD) 0.8 (0.9) 2.6 (3.1) 0.6 (0.6) 2.5 (2.6)
34
Table
2Brain
regionsactivatedbyrightandleft
footmovem
ents
Rightfoot
Leftfoot
Activemovem
ent
xyz
Z-score
Pvalueatvoxel
level
Activemovem
ent
xyz
Z-score
Pvalueatvoxel
level
Rightcerebellum
18�34�30
5.52
0.003
Leftcerebellum
�18�38�28
6.48
0.0001
LeftSMA
�6�1068
5.48
0.004
RightSI(parac.
lob.)
8�3864
6.19
0.0001
LeftMI(parac.
lob.)
�2�1866
5.41
0.006
RightMI(parac.
lob.)
6�2272
5.73
0.001
Vermis
2�48�8
5.46
0.005
RightSMA
4�1462
5.51
0.004
RightSMA
8256
5.44
0.005
Leftsup.temporalg.
�46�3012
5.56
0.003
Leftthalamus
�16�1610
5.26
0.014
Vermis
�2�52�6
5.49
0.004
LeftSI(parac.
lob.)
�10�4064
5.08
0.038
Pvalueatcluster
level(cluster
size)
Pvalueatcluster
level(cluster
size)
Rightsup.temporalg.
/rolandic
op.
48�2618
4.89
0.0001(506)
Rightputamen
26�612
4.77
0.0001(771)
Rightinsula
466�4
4.68
0.004(176)
Rightrolandic
op./supramarginalg.
46�2616
4.29
0.0001(543)
Leftcerebellum
�34�58�32
4.44
0.01(150)
Leftsup.temporalpole
�504�2
4.30
0.046(129)
Leftinsula
/rolandic
op.
�4842
4.27
0.012(143)
Passivemovement
Pvalueatvoxel
level
Passivemovement
Pvalueatvoxel
level
LeftSI(paracentrallobule)
�8�3662
5.80
0.001
RightSMA
8�1870
5.95
0.0001
LeftSII
(postcentr.g.)
�14�4070
5.48
0.004
RightSIandMI(parac.
lob.)
8�3468
5.80
0.001
LeftMI(parac.
lob.)
�4�2064
5.25
0.015
RightSI(postcentr.g.)
16�3470
5.22
0.017
Leftcerebellum
�16�38�32
5.24
0.016
Pvalueatcluster
level(cluster
size)
Pvalueatcluster
level(cluster
size)
Rightcerebellum
22�36�28
4.87
0.0001(415)
Rightrolandic
op./supramarginalg.
50�2618
4.85
0.0001(842)
Leftputamen
�30�66
4.53
0.006(183)
Rightsup.temporalpole
526�2
4.45
0.001(208)
Leftsup.temporalg./rolandic
op.
�46�2820
4.33
0.01(169)
Leftrolandic
op./supramarginalg.
�50�2020
4.20
0.004(170)
Rightsup.temporalg./rolandic
op.
48�2618
4.25
0.004(200)
Rightputamen
32�82
4.04
0.002(196)
Leftsup.temporalpole
�4462
3.79
0.036(109)
Regionsare
listed
accordingly
totheirZ-scores.Coordinatesare
given
inmm
inMNIspace.Pvalues
are
correctedatvoxellevelformultiplecomparisons;asa‘‘step
down’’analysis,P
values
correctedatcluster
level
formultiple
comparisonsacross
thewhole
brain
are
alsoshown
SIprimary
sensory
cortex,MIprimary
motorcortex,SMA
supplementary
motorarea,g.gyrus,lob.lobule,op.operculum,sup.superior,post.posterior
35

Passive movement of the left ankle additionally acti-vated the contralateral SMA and the bilateral superiortemporal pole.
Subcortical activation during passive movements
Passive movements of either ankle were associated withactivation of the ipsilateral cerebellum and contralateralposterior putamen.
Differences in brain activation between activeand passive movements
A list of all regions which showed a greater activationduring active than passive movements is given in Ta-ble 3. Figure 2 shows three of these regions.
Active movements of either foot generated greateractivation than passive movements in the ipsilateral MI
in the paracentral lobule, contralateral SMA and SI,ipsilateral cerebellum, and ipsilateral superior temporalgyrus. Also, active movements of the right ankle wereassociated with greater activation in the ipsilateral SMAand inferior parietal lobe, and in the superior vermis andcontralateral superior temporal gyrus, while activemovements of the left ankle generated a greater fMRIresponse in the contralateral posterior and superiorputamen.
Passive movement of either foot did not generategreater activation in any region compared with activemovement.
Common activation between active and passivemovements
The conjunction analysis of the active and passive con-trasts revealed that several regions were commonly
Fig. 1 Brain activation during(a) active movement of the rightankle, (b) passive movement ofthe right ankle, (c) activemovement of the left ankle, and(d) passive movement of the leftankle. The SPM(T) maps werethresholded at P<0.05corrected at voxel level formultiple comparisons across thewhole brain and overlaid on toglass brain
36
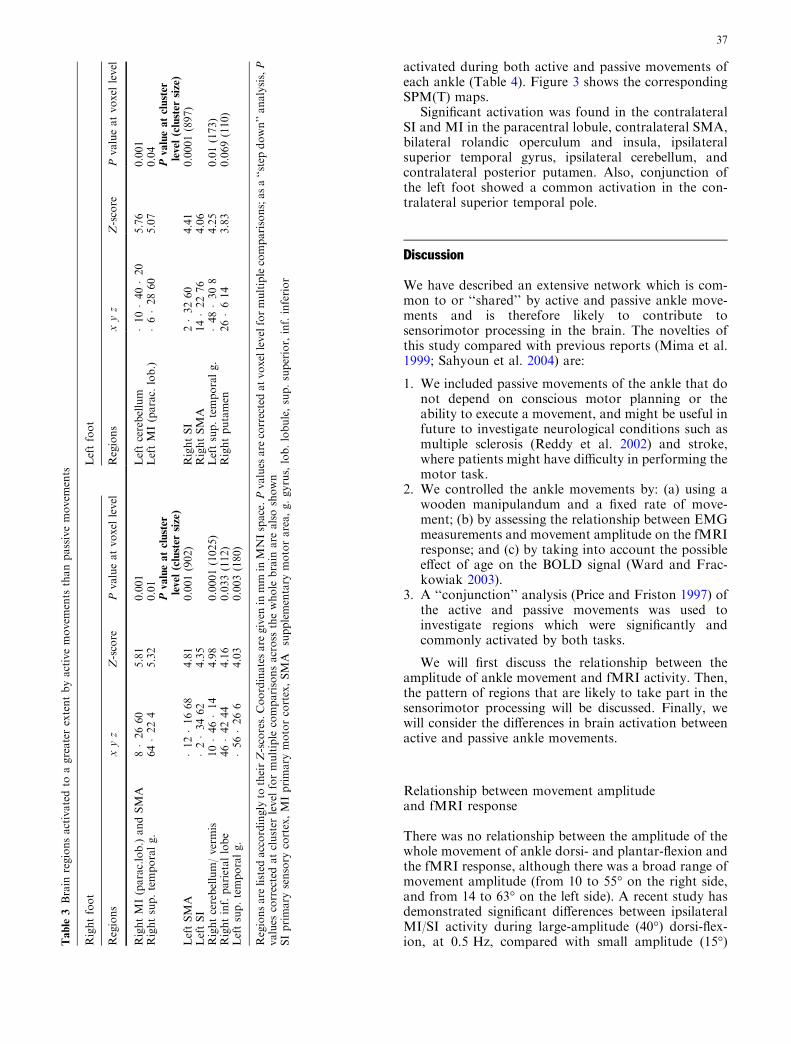
activated during both active and passive movements ofeach ankle (Table 4). Figure 3 shows the correspondingSPM(T) maps.
Significant activation was found in the contralateralSI and MI in the paracentral lobule, contralateral SMA,bilateral rolandic operculum and insula, ipsilateralsuperior temporal gyrus, ipsilateral cerebellum, andcontralateral posterior putamen. Also, conjunction ofthe left foot showed a common activation in the con-tralateral superior temporal pole.
Discussion
We have described an extensive network which is com-mon to or ‘‘shared’’ by active and passive ankle move-ments and is therefore likely to contribute tosensorimotor processing in the brain. The novelties ofthis study compared with previous reports (Mima et al.1999; Sahyoun et al. 2004) are:
1. We included passive movements of the ankle that donot depend on conscious motor planning or theability to execute a movement, and might be useful infuture to investigate neurological conditions such asmultiple sclerosis (Reddy et al. 2002) and stroke,where patients might have difficulty in performing themotor task.
2. We controlled the ankle movements by: (a) using awooden manipulandum and a fixed rate of move-ment; (b) by assessing the relationship between EMGmeasurements and movement amplitude on the fMRIresponse; and (c) by taking into account the possibleeffect of age on the BOLD signal (Ward and Frac-kowiak 2003).
3. A ‘‘conjunction’’ analysis (Price and Friston 1997) ofthe active and passive movements was used toinvestigate regions which were significantly andcommonly activated by both tasks.
We will first discuss the relationship between theamplitude of ankle movement and fMRI activity. Then,the pattern of regions that are likely to take part in thesensorimotor processing will be discussed. Finally, wewill consider the differences in brain activation betweenactive and passive ankle movements.
Relationship between movement amplitudeand fMRI response
There was no relationship between the amplitude of thewhole movement of ankle dorsi- and plantar-flexion andthe fMRI response, although there was a broad range ofmovement amplitude (from 10 to 55� on the right side,and from 14 to 63� on the left side). A recent study hasdemonstrated significant differences between ipsilateralMI/SI activity during large-amplitude (40�) dorsi-flex-ion, at 0.5 Hz, compared with small amplitude (15�)T
able
3Brain
regionsactivatedto
agreaterextentbyactivemovem
ents
thanpassivemovem
ents
Rightfoot
Leftfoot
Regions
xyz
Z-score
Pvalueatvoxel
level
Regions
xyz
Z-score
Pvalueatvoxel
level
RightMI(parac.lob.)andSMA
8�2660
5.81
0.001
Leftcerebellum
�10�40�20
5.76
0.001
Rightsup.temporalg.
64�224
5.32
0.01
LeftMI(parac.
lob.)
�6�2860
5.07
0.04
Pvalueatcluster
level(cluster
size)
Pvalueatcluster
level(cluster
size)
LeftSMA
�12�1668
4.81
0.001(902)
RightSI
2�3260
4.41
0.0001(897)
LeftSI
�2�3462
4.35
RightSMA
14�2276
4.06
Rightcerebellum/vermis
10�46�14
4.98
0.0001(1025)
Leftsup.temporalg.
�48�308
4.25
0.01(173)
Rightinf.parietallobe
46�4244
4.16
0.033(112)
Rightputamen
26�614
3.83
0.069(110)
Leftsup.temporalg.
�56�266
4.03
0.003(180)
Regionsare
listed
accordingly
totheirZ-scores.Coordinatesare
given
inmm
inMNIspace.Pvalues
are
correctedatvoxellevelformultiplecomparisons;asa‘‘step
down’’analysis,P
values
correctedatcluster
level
formultiple
comparisonsacross
thewhole
brain
are
alsoshown
SIprimary
sensory
cortex,MIprimary
motorcortex,SMA
supplementary
motorarea,g.gyrus,lob.lobule,sup.superior,inf.inferior
37

dorsi-flexion, suggesting that larger amplitude dorsi-flexion is a more difficult task (MacIntosh et al. 2004). Inour study, subjects were told to perform the foot dorsiand plantar-flexion in the most comfortable way, and,therefore, were likely to perform movements of a similarlevel of difficulty. Considering our findings, togetherwith the results of other recent studies of foot dorsi-flexion (Dobkin et al. 2004; MacIntosh et al. 2004), atask of 10–20� of dorsi-flexion, at a rate of 0.3–0.6 Hz,might be employed in future studies of normal and im-paired subjects.
Common activation between active and passivemovements
We demonstrated that the network of ‘‘common’’ acti-vation includes:
1. the contralateral primary motor and sensory cortex(MI and SI);
2. the premotor cortex, including the bilateral rolandicoperculum and the contralateral SMA;
3. subcortical regions, including the ipsilateral cerebel-lum and the contralateral putamen; and
4. other cortical associative areas, such as the bilateralinsula and the ipsilateral temporal gyrus.
These data are in agreement with previous studies,which have found that cortical and subcortical struc-tures activate during passive finger (Alary et al. 1998;Reddy et al. 2001; Thickbroom et al. 2003), wrist (Carelet al. 2000) or elbow movements (Weiller et al. 1996).However, in a recent study Sahyoun et al. (2004) did notidentify significant subcortical activation with passiveankle movements, although activation in the premotorareas was reported. Further, Mima et al. (1999) have
Table 4 Brain regions commonly activated during active and passive movements detected by the conjunction analysis
Right foot Left foot
Regions x y z Z-score P value Regions x y z Z-score P value
Left SI (parac. lob.) �10 �40 64 7.83 0.0001 Right SI (parac. lob.) 10 �38 66 Inf 0.0001Left SMA and MI (parac. lob.) �4 �20 62 7.00 0.0001 Right MI (parac. lob.) 8 �20 72 Inf 0.0001Right rolandic operculum 42 �28 22 6.57 0.0001 Right SMA 6 �14 64 Inf 0.0001Right sup. temporal g. 54 �32 24 5.57 0.003 Left cerebellum �16 �38 �30 Inf 0.0001Right cerebellum 18 �34 �26 6.24 0.0001 Right rolandic operculum 42 �28 18 Inf 0.0001Left rolandic operculum �48 �26 20 5.75 0.001 Left insula/rolandic operc. �50 6 �2 6.36 0.0001Left putamen �30 �2 8 5.45 0.005 Left sup. temporal g. �48 �26 16 6.07 0.0001Left insula �48 2 2 5.27 0.012 Right sup. temporal pole 56 6 0 6.02 0.0001Right insula 52 6 0 5.21 0.016 Right putamen 32 �8 4 5.78 0.001
Right insula 44 6 4 5.02 0.038
Regions are listed accordingly to their Z-scores. Coordinates are given in mm in MNI space. All the P values listed are corrected at voxellevel for multiple comparisons across the whole brainSI primary sensory cortex, MI primary motor cortex, SMA supplementary motor area, g. gyrus, lob. lobule, sup. superior.
Fig. 2 (a) Activation of theright MI and SMA was greaterduring active movements of theright ankle than passivemovements (MNI coordinates:8, �26, 60). (b) Activation ofthe left cerebellum was greaterduring active movements of theleft ankle than passivemovements (MNI coordinates:�10, �40, �20). The SPM(T)maps were thresholded atP<0.05 corrected at voxel levelfor multiple comparisons acrossthe whole brain and overlaid onto single-subject T1 template
38
previously reported that only the contralateral primaryand sensory somatosensory areas were activated by thepassive movements of the right middle finger. There arepossible reasons for these different findings. Most likely,there are differences in the sensitivity of the imagingexperiments and statistical analyses performed. Differentfindings could also arise from differences in the experi-mental design and devices used for passive movements.For example, although Sahyoun and colleagues used amanipulandum very similar to that used in this study,subjects had a slightly different position of their feet,kept their shoes on, and the amplitude of the passivemovements did not match that of the active movementsin each subject. In addition, the differences in jointsexamined or in types of afferent stimulation used in ourstudy and in that of Mima and colleagues might alsocontribute to the different findings. In particular, Mimaet al. (1999) avoided cutaneous afferent stimulation ofthe middle finger, whilst our task involved a continuouscutaneous stimulation of the plantar aspect of the foot.Thus, differences in the pattern and context of afferentstimulation may result in different activation patterns.For example, the cerebellum is notable for showingcontext-specific responses to afferent input (Prochazka1989). Neurons within the inferior olive, which projectsto the cerebellum and within the cerebellum itself, mayshow different responses to afferent stimulationdepending on whether it is actively or passively gener-ated, and depending on whether or not the stimulus isnormally associated with a particular movement (Gell-man et al. 1985; Hartmann and Bower 2001; Houk andWise 1995). The relationship between the nature ofafferent stimulation and patterns of subcortical brainactivation deserves further study.
Thus, the activation in premotor and subcorticalregions, which is ‘‘shared’’ by the active and passivemovements, might reflect the contribution of these
structures in processing sensory information. Indeed, itis known that proprioceptive discrimination may beimpaired after cerebellar (Grill et al. 1994; Shimanskyet al. 1997) and basal ganglia lesions (Demirci et al.1997). Furthermore, it is known that abnormalities inthese regions of sensorimotor integration have a rolein the aetiology of movement disorders, such as Par-kinson’s disease and dystonia (Abbruzzese and Ber-ardelli 2003; Hallett 1995; Middleton and Strick 2000).Also, a dysfunction in the sensory input or centralsensorimotor integration may help to explain thecomplex clinical characteristics of these movementdisorders, such as the patterns of muscle activationand stimulus sensitivity in focal dystonia (Abbruzzeseand Berardelli 2003).
Regions activated to a greater extent by activemovements than passive movements
We demonstrated that active movements induced agreater fMRI activity than passive movements in motorcontrol regions, such as the ipsilateral MI with eitherankle movement, and the ipsilateral SMA with rightankle movement. This suggests greater relative involve-ment of the ipsilateral motor and premotor cortices inthe motor planning of ankle movements than for similarhand movements (Reddy et al. 2001; Weiller et al. 1996).Luft et al. (2002) found that knee movements showed alesser degree of lateralization within the primary motorcortex when compared with other upper limb tasks,suggesting that the ipsilateral cortex has a more signifi-cant role in the motor processing of lower limb move-ments.
We also found that the contralateral SI and SMA andthe ipsilateral cerebellum (with either ankle movement)and the contralateral posterior putamen (with left ankle
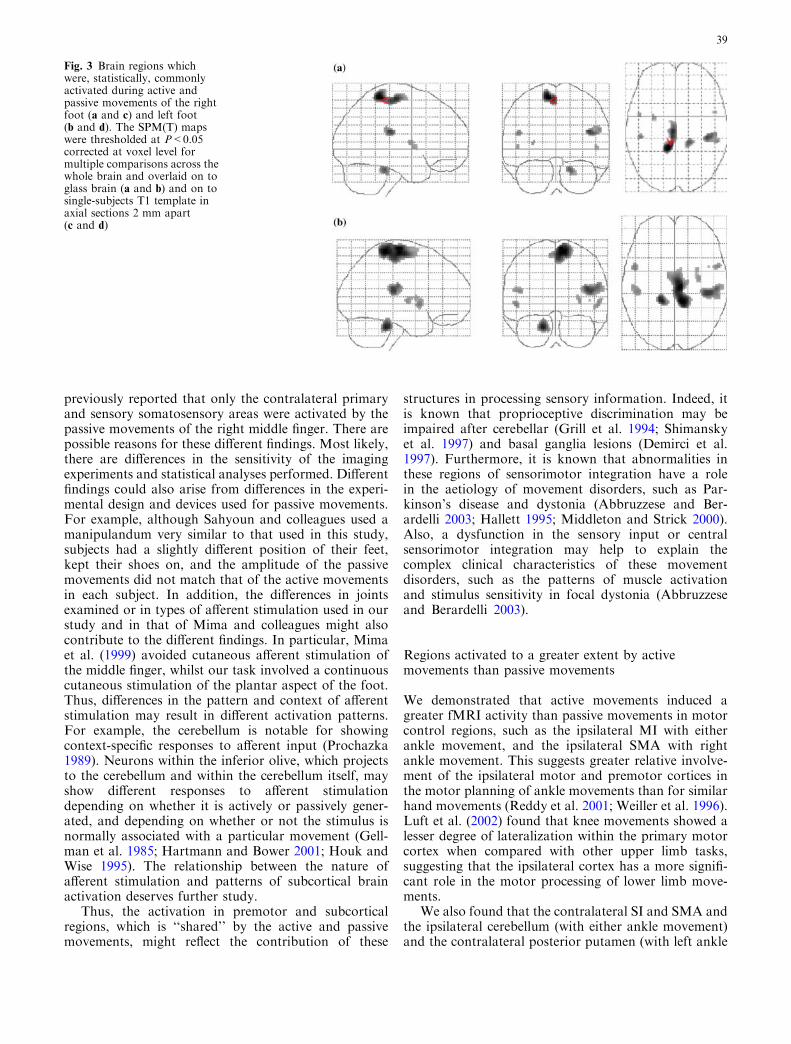
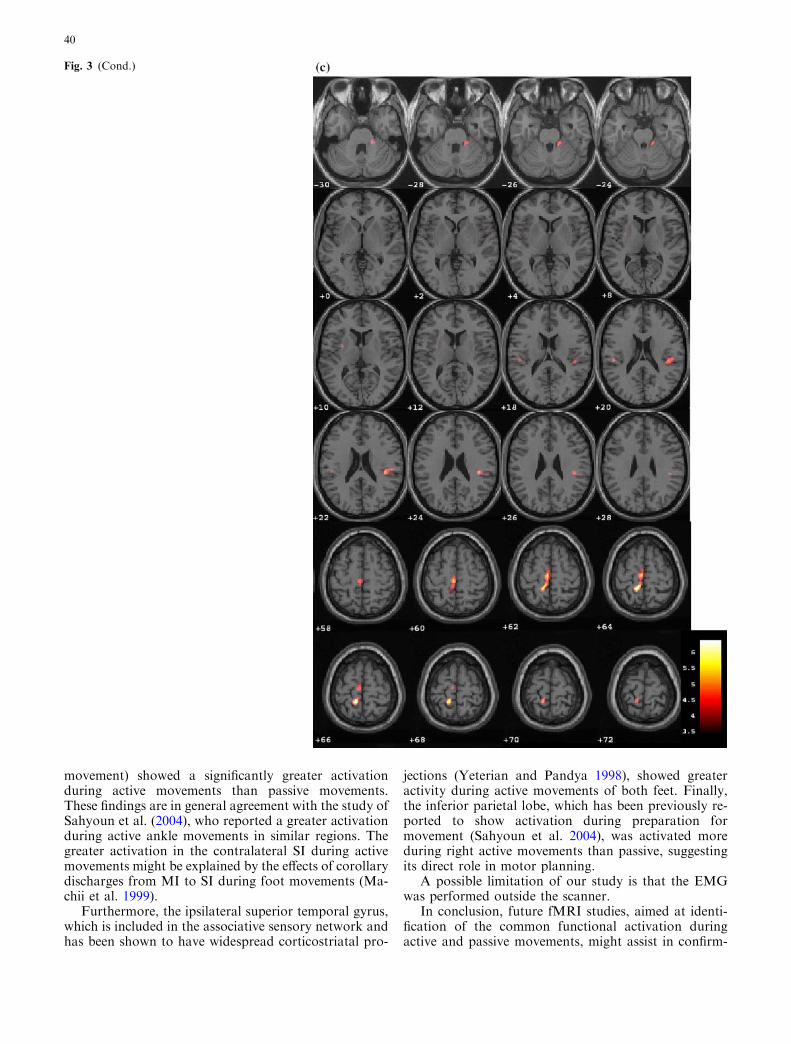
Fig. 3 Brain regions whichwere, statistically, commonlyactivated during active andpassive movements of the rightfoot (a and c) and left foot(b and d). The SPM(T) mapswere thresholded at P<0.05corrected at voxel level formultiple comparisons across thewhole brain and overlaid on toglass brain (a and b) and on tosingle-subjects T1 template inaxial sections 2 mm apart(c and d)
39
movement) showed a significantly greater activationduring active movements than passive movements.These findings are in general agreement with the study ofSahyoun et al. (2004), who reported a greater activationduring active ankle movements in similar regions. Thegreater activation in the contralateral SI during activemovements might be explained by the effects of corollarydischarges from MI to SI during foot movements (Ma-chii et al. 1999).
Furthermore, the ipsilateral superior temporal gyrus,which is included in the associative sensory network andhas been shown to have widespread corticostriatal pro-
jections (Yeterian and Pandya 1998), showed greateractivity during active movements of both feet. Finally,the inferior parietal lobe, which has been previously re-ported to show activation during preparation formovement (Sahyoun et al. 2004), was activated moreduring right active movements than passive, suggestingits direct role in motor planning.
A possible limitation of our study is that the EMGwas performed outside the scanner.
In conclusion, future fMRI studies, aimed at identi-fication of the common functional activation duringactive and passive movements, might assist in confirm-
Fig. 3 (Cond.)
40

ing the wide distribution of brain regions involved insensorimotor integration and in understanding thecomplex pathophysiology of movement disorders.
Acknowledgments We are very grateful to Dr Karl Friston and theresearchers participating in the SPM meetings at the FunctionalImaging Laboratory, Wellcome Department of Cognitive Neurol-ogy, London, for advice on the SPM analysis. We also thank Dr.G. Barker and D. MacManus for suggestions about the manipu-landum, R. Gordon and C. Benton for technical assistance with thefMRI scans, and the subjects for kindly agreeing to take part in thisstudy. Dr O. Ciccarelli and Dr C. Wheeler-Kingshott are supportedby the Wellcome Trust. The NMR unit is supported by a generousgrant from the Multiple Sclerosis Society of Great Britain and
Northern Ireland. P. Matthews and C. Sahyoun acknowledge thegenerous support of the UK Medical Research Council and theMultiple Sclerosis Society of Great Britain and Northern Ireland.
References
Abbruzzese G, Berardelli A (2003) Sensorimotor integration inmovement disorders. Mov Disord 18:231–240
Alary F, Doyon B, Loubinoux I, Carel C, Boulanouar K, RanjevaJP, Celsis P, Chollet F (1998) Event-related potentials elicitedby passive movements in humans: characterization, sourceanalysis, and comparison to fMRI. Neuroimage 8:377–390
Fig. 3 (Cond.)
41

Carel C, Loubinoux I, Boulanouar K, Manelfe C, Rascol O, CelsisP, Chollet F (2000) Neural substrate for the effects of passivetraining on sensorimotor cortical representation: a study withfunctional magnetic resonance imaging in healthy subjects.J Cereb Blood Flow Metab 20:478–484
Demirci M, Grill S, McShane L, Hallett M (1997) A mismatchbetween kinesthetic and visual perception in Parkinson’s dis-ease. Ann Neurol 41:781–788
Dobkin BH, Firestine A, West M, Saremi K, Woods R (2004)Ankle dorsiflexion as an fMRI paradigm to assay motor controlfor walking during rehabilitation. Neuroimage 23:370–381
Friston KJ (1995) Commentary and opinion: II. Statistical para-metric mapping: ontology and current issues. J Cereb BloodFlow Metab 15:361–370
Friston KJ, Holmes AP, Worsley KJ, Poline JB, Frith CD, Frac-kowiak RSJ (1995) Statistical parametric maps in functionalimaging: a general linear approach. Hum BrainMapp 2:189–210
Friston KJ, Holmes A, Poline JB, Price CJ, Frith CD (1996)Detecting activations in PET and fMRI: levels of inference andpower. Neuroimage 4:223–235
Friston KJ, Holmes AP, Worsley KJ (1999) How many subjectsconstitute a study?. Neuroimage 10:1–5
Friston KJ, Glaser DE, Henson RN, Kiebel S, Phillips C, Ash-burner J (2002) Classical and Bayesian inference in neuroi-maging: applications. Neuroimage 16:484–512
Gellman R, Gibson AR, Houk JC (1985) Inferior olivary neuronsin the awake cat: detection of contact and passive body dis-placement. J Neurophysiol 54:40–60
Grill SE, Hallett M, Marcus C, McShane L (1994) Disturbances ofkinaesthesia in patients with cerebellar disorders. Brain 117(Pt6):1433–1447
Hallett M (1995) Is dystonia a sensory disorder?. Ann Neurol38:139–140
Hartmann MJ, Bower JM (2001) Tactile responses in the granulecell layer of cerebellar folium crus IIa of freely behaving rats.J Neurosci 21:3549–3563
Houk JC, Wise SP (1995) Distributed modular architectures link-ing basal ganglia, cerebellum, and cerebral cortex: their role inplanning and controlling action. Cereb Cortex 5:95–110
Jueptner M, Ottinger S, Fellows SJ, Adamschewski J, Flerich L,Muller SP, Diener HC, Thilmann AF, Weiller C (1997) Therelevance of sensory input for the cerebellar control of move-ments. Neuroimage 5:41–48
Kandel ER, Schwarts JH, Jessell TM (2000) Voluntary movement.In: Kandel ER, Schwarts JH, Jessell TM (eds) Principle ofneural science. McGraw Hill, New York, pp 756–779
Luft AR, Smith GV, Forrester L, Whitall J, Macko RF, HauserTK, Goldberg AP, Hanley DF (2002) Comparing brain acti-vation associated with isolated upper and lower limb movementacross corresponding joints. Hum Brain Mapp 17:131–140
Machii K, Ugawa Y, Terao Y, Hanajima R, Furubayashi T,Mochizuki H, Shiio Y, Enomoto H, Uesugi H, Kuzuhara S,Kanazawa I (1999) Input–output organization of the foot mo-tor area in humans. Clin Neurophysiol 110:1315–1320
MacIntosh BJ, Mraz R, Baker N, Tam F, Staines WR, Graham SJ(2004) Optimizing the experimental design for ankle dorsiflex-ion fMRI. Neuroimage 22:1619–1627
Middleton FA, Strick PL (2000) Basal ganglia output and cogni-tion: evidence from anatomical, behavioral, and clinical studies.Brain Cogn 42:183–200
Mima T, Sadato N, Yazawa S, Hanakawa T, Fukuyama H,Yonekura Y, Shibasaki H (1999) Brain structures related toactive and passive finger movements in man. Brain 122(Pt10):1989–1997
Poline JB, Worsley KJ, Evans AC, Friston KJ (1997) Combiningspatial extent and peak intensity to test for activations infunctional imaging. Neuroimage 5:83–96
Price CJ, Friston KJ (1997) Cognitive conjunction: a new approachto brain activation experiments. Neuroimage 5:261–270
Prochazka A (1989) Sensorimotor gain control: a basic strategy ofmotor systems? Prog Neurobiol 33:281–307
Reddy H, Floyer A, Donaghy M, Matthews PM (2001) Alteredcortical activation with finger movement after peripheraldenervation: comparison of active and passive tasks. Exp BrainRes 138:484–491
Reddy H, Narayanan S, Woolrich M, Mitsumori T, Lapierre Y,Arnold DL, Matthews PM (2002) Functional brain reorgani-zation for hand movement in patients with multiple sclerosis:defining distinct effects of injury and disability. Brain 125:2646–2657
Rorden C, Brett M (2000) Stereotaxic display of brain lesions.Behav Neurol 12:191–200
Sahyoun C, Floyer-Lea A, Johansen-Berg H, Matthews PM (2004)Towards an understanding of gait control: brain activationduring the anticipation, preparation and execution of footmovements. Neuroimage 21:568–575
Shimansky Y, Saling M, Wunderlich DA, Bracha V, Stelmach GE,Bloedel JR (1997) Impaired capacity of cerebellar patients toperceive and learn two-dimensional shapes based on kinestheticcues. Learn Mem 4:36–48
Thickbroom GW, Byrnes ML, Mastaglia FL (2003) Dual repre-sentation of the hand in the cerebellum: activation with vol-untary and passive finger movement. Neuroimage 18:670–674
Ward NS, Frackowiak RS (2003) Age-related changes in the neuralcorrelates of motor performance. Brain 126:873–888
Weiller C, Juptner M, Fellows S, Rijntjes M, Leonhardt G, KiebelS, Muller S, Diener HC, Thilmann AF (1996) Brain represen-tation of active and passive movements. Neuroimage 4:105–110
Worsley KJ, Friston KJ (1995) Analysis of fMRI time-seriesrevisited—again. Neuroimage 2:173–181
Worsley KJ, Marrett S, Neelin P, Vandal AC, Friston KJ, EvansAC (1996) A unified statistical approach for determining sig-nificant signals in images of cerebral activation. Hum BrainMapp 4:58–73
Yeterian EH, Pandya DN (1998) Corticostriatal connections of thesuperior temporal region in rhesus monkeys. J Comp Neurol399:384–402
Yetkin FZ, Mueller WM, Hammeke TA, Morris GL III, HaughtonVM (1995) Functional magnetic resonance imaging mapping ofthe sensorimotor cortex with tactile stimulation. Neurosurgery36:921–925
42
Copyright © 2022 FDOKUMEN