impact on foot and ankle biomechanics
181
HAL Id: tel-02441932 https://tel.archives-ouvertes.fr/tel-02441932v2 Submitted on 4 Feb 2020 HAL is a multi-disciplinary open access archive for the deposit and dissemination of sci- entific research documents, whether they are pub- lished or not. The documents may come from teaching and research institutions in France or abroad, or from public or private research centers. L’archive ouverte pluridisciplinaire HAL, est destinée au dépôt et à la diffusion de documents scientifiques de niveau recherche, publiés ou non, émanant des établissements d’enseignement et de recherche français ou étrangers, des laboratoires publics ou privés. Ankle osteoarthritis and its treatments : impact on foot and ankle biomechanics Paul-Andre Deleu To cite this version: Paul-Andre Deleu. Ankle osteoarthritis and its treatments : impact on foot and ankle biomechanics. Biomechanics [physics.med-ph]. Université de Lyon, 2019. English. NNT : 2019LYSE1274. tel- 02441932v2
-
Upload
khangminh22 -
Category
Documents
-
view
1 -
download
0
Transcript of impact on foot and ankle biomechanics
HAL Id: tel-02441932https://tel.archives-ouvertes.fr/tel-02441932v2
Submitted on 4 Feb 2020
HAL is a multi-disciplinary open accessarchive for the deposit and dissemination of sci-entific research documents, whether they are pub-lished or not. The documents may come fromteaching and research institutions in France orabroad, or from public or private research centers.
L’archive ouverte pluridisciplinaire HAL, estdestinée au dépôt et à la diffusion de documentsscientifiques de niveau recherche, publiés ou non,émanant des établissements d’enseignement et derecherche français ou étrangers, des laboratoirespublics ou privés.
Ankle osteoarthritis and its treatments : impact on footand ankle biomechanics
Paul-Andre Deleu
To cite this version:Paul-Andre Deleu. Ankle osteoarthritis and its treatments : impact on foot and ankle biomechanics.Biomechanics [physics.med-ph]. Université de Lyon, 2019. English. �NNT : 2019LYSE1274�. �tel-02441932v2�

I
N°d’ordre NNT : 2019LYSE1274
THESE de DOCTORAT DE L’UNIVERSITE DE LYON
opérée au sein de
l’Université Claude Bernard Lyon 1
Ecole Doctorale MEGA N° 162
Mécanique, Energétique, Génie Civil et Acoustique
Spécialité de doctorat :
Discipline : Biomécanique
Soutenue publiquement le 09/12/2019, par :
Paul-André Deleu
Arthrose de cheville et ses traitements :
impact sur la biomécanique du pied et de la cheville
Devant le jury composé de :
Crevoisier, Xavier Rapporteur / Examinateur
Professeur, Centre Hospitalier Universitaire Vaudois, Lausanne
Sancisi, Nicola Rapporteur / Examinateur
Professeur Associé, Université de Bologne, Bologna
Duprey, Sonia Examinatrice
Professeure Associée, Université Claude Bernard Lyon 1, Lyon
Feipel, Véronique Examinatrice / Présidente
Professeure, Université Libre de Bruxelles, Bruxelles
Leemrijse, Thibaut Examinateur
Praticien Hospitalier, Foot & Ankle Institute, Bruxelles
Marin, Frédéric Examinateur
Professeur des Universités, Université de Technologie de Compiègne, Compiègne
Besse, Jean-Luc Directeur de thèse
Practicien Hospitalier, Hospices Civils de Lyon, Centre Hospitalier Lyon-Sud, Lyon
Chèze, Laurence Co-directrice de thèse
Professeure des Universités, Université Claude Bernard Lyon 1, Lyon

i
Acknowledgements
During the past 3 years, I had the pleasure to work with numerous people without whose
invaluable help, this doctoral project would not have been possible.
This project was only possible thanks to the members of the Foot & Ankle Institute
(Brussels), to Dr. Jean-Luc Besse (Centre Hospitalier Lyon-Sud) and to Prof. Laurence Chèze
(Université Claude Bernard Lyon 1).
Words fail to describe the contribution that Dr. Thibaut Leemrijse made to my personal
development, my professional career, my doctoral project as well as to my well-being at the
institute. His scientific background, rigour and expertise stimulated everyday my research
interest tremendously. He saw things from different perspectives and taught me to question
everything. Thanks for all the opportunities you gave me and your trust in me.
I would like to express my sincere appreciation to my research supervisor to Dr. Jean-Luc
Besse for his priceless advice and encouragement on every aspect of my study and research.
Our discussions were always very instructive and inspiring for me. I very much appreciated
your support, your time and contribution to my scientific work.
Also, I would like to thank my co-supervisor Prof. Laurence Chèze. It was my please to
have a co-supervisor like you with your friendly features and your brilliant experience in
research and biomechanics. Thank you very much for your advice, your time and your support,
but also the kindness shown when the journey became tough.
I would like also to thank Alexandre Naaim for being my partner in this multi-center study
and for developing the PODO code used in this doctoral project. Thank you very much for your
patience, support, coffee breaks and kindness through this intense doctoral journey.
Warm thanks go to Dr. Bernhard Devos Bevernage of the Foot & Ankle Institutes (Brussels,
Belgium). Words fail to describe the contribution that Dr. Bernhard Devos Bevernage made to
my personal development as well as to my well-being at the institute. He was always there to
change thoughts with.
I would like to thank Gabrielle Leemrijse for her support and her enthusiasm through this
intense doctoral journey.
I would like to thank Ivan Birch for his continuous support, advice and suggestions during
my research and writing up. Our discussions during the BSc (Hons) and MSc modules at the
University of Brighton were always very instructive and inspiring for me.

ii
I would like to thank Dr. Vincent Gombault, Dr. Pierre Maldague and Dr. Laurent Goubau
(Foot & Ankle Institute, Brussels) for their support during this intense doctoral journey.
I would like to thank all my colleagues of the Foot & Ankle Institute for their support
through this intense doctoral journey.
I would like to thank Sebastien Demoiny for reviewing a part of this manuscript.
I also like to thank Prof. Raphaël Dumas for his scientific view in this project. Thanks for
your insightful suggestions.
A special thanks goes to Mr. Vincent Ballesio, for his contribution to the project.
I would like thank also Prof. David Mitton, director of the Biomechanics and Impact
Mechanics Laboratory, and Prof Michel Fessy, head of the Orthopaedic Surgery Department,
for their support in this doctoral project.
I finally like to thank my parents, Séverine’s parents and friends. Although that you were
not physically involved in this project, I like to thank you for your mental support. Thanks for
your companionship and for your enjoyable moments that we shared.
I specially like to thank my parents. Without your love, trust and care support, I would never
have been able to fulfill this doctoral project.
An especially large thank you to Séverine, for putting up with all the late nights I worked,
and for helping me to cope when things just didn’t work, most of all for just being there when
I really needed her.
To everybody, thank you very much!
Paul-André Deleu

iii
Résumé court
L'arthrose de cheville est une dégénérescence progressive du cartilage caractérisée par
une douleur et une incapacité fonctionnelle importante. Cependant, bien que la marche soit
améliorée suite à une arthrodèse ou à une prothèse totale de cheville, les patients présentent
toujours une altération de la fonction du membre inférieur. Afin d'améliorer notre
compréhension des déficiences fonctionnelles associées à cette pathologie et à ces traitements
chirurgicaux connexes, une revue systématique de la littérature a été réalisée. Celle-ci démontre
un manque de caractérisation de cette pathologie dans les études d'analyse de marche. Cela
signifie que les conséquences fonctionnelles sont difficiles à définir sans tenir compte des
changements morphologiques et structurels du pied liés à l’arthrose. Par conséquent, des
groupes homogènes de patients ont été recrutés sur base de l’étiologie de l’arthrose et de la
présence de déformations concomittantes. L’analyse cinétique des articulations intrinsèques du
pied chez ces patients a montré que les altérations de la fonction n’étaient pas limitées à la
cheville douloureuse, mais affectaient également les articulations adjacentes du pied. De plus,
les déformations du pied associées à l’arthrose de cheville influencent la mécanique du pied
durant la marche. Enfin, une étude pilote a été réalisée pour donner une première évaluation de
la prothèse totale de cheville sur la performance biomécanique des patients souffrant d'arthrose.
Nos résultats ont révélé que la mécanique de la cheville après prothèse ressemble à celle des
chevilles saines mais que leurs performances biomécaniques restent diminuées par rapport à
des sujets asymptomatiques.
Mot clés :
Biomécanique ; Arthrose de cheville ; Marche ; Prothèse totale de cheville
Laboratoire :
Laboratoire de Biomécanique et Mécanique des Chocs (LBMC)
IFSTTAR Site de Lyon-Bron Case 24
25 Avenue François Mitterand
69675 Bron Cedex

iv
Résumé long
L'arthrose de cheville est une maladie chronique caractérisée par une dégénérescence
progressive des articulations, une douleur et une incapacité importante. Ainsi, environ 1 % de
la population adulte au monde vit avec une arthrose symptomatique de la cheville.1,4,7
L'objectif de ce projet de doctorat est d'étudier la biomécanique du pied chez des patients
souffrant d'arthrose de cheville à l'aide d'une plateforme d'examen clinique avancée composée
d'un système d’analyse du mouvement, de mesures de forces et des pressions plantaires.
En complément, une première évaluation a été fournie sur la façon dont la mise en place
d’une prothèse totale de cheville est bénéfique pour la performance biomécanique des patients
souffrant d'arthrose post-traumatique de la cheville.
La fonction physique évaluée chez les patients souffrant d'arthrose de cheville à l'aide
du questionnaire SF-36 rempli par les patients était équivalente ou supérieure à celle des
patients atteints d'insuffisance rénale terminale, d'insuffisance cardiaque congestive ou de
douleurs au niveau des vertèbres cervicales.1,4,7 A noter que les patients souffrant d'arthrose de
cheville sont généralement plus jeunes que ceux qui souffrent d'arthrose du genou ou de la
hanche.1,7 L'allongement probable de la durée de vie, associé à la diminution importante de la
qualité de vie, majore l'effet profondément néfaste de l'arthrose de cheville sur l'incapacité
fonctionnelle des patients.4 Cependant, bien que la marche soit améliorée suite à une arthrodèse
ou à une prothèse totale de cheville par rapport à leur situation préopératoire, les patients
présentent toujours une altération de la fonction du membre inférieur.2,3,5,8
Mesurer et documenter les résultats de ces interventions chirurgicales est un processus
complexe : la première question est de savoir quel point de vue des résultats, patient ou
chirurgien, doit être exploré. En effet, de nos jours, il existe de plus en plus de données
probantes utilisant des mesures rapportées par les patients pour évaluer les résultats de prothèse
totale de la cheville ou d’arthrodèses tibio-talo-calcanéennes et tibio-taliennes, reconnaissant
l'importance d’appréhender le ressenti du patient à l'égard de sa chirurgie. Toutefois,
l’évaluation des résultats déclarés par les patients n’est pas suffisamment affinée pour rendre
compte de leur état de rétablissement et de leur capacité à s’adapter aux limitations
fonctionnelles prévues ou imprévues suite à leur chirurgie.

v
Par conséquent, la première partie du présent projet de doctorat vise à présenter une
première tentative d'évaluation et à comparer des résultats chirurgicaux après une prothèse
totale de la cheville, une arthrodèse tibio-talo-calcanéenne et une arthrodèse tibio-talienne en
analysant la perception du patient sur son sentiment de rétablissement (Chapitre 2).
Ainsi, les données probantes ont montré que près de la moitié des patients ont fait état
de meilleurs résultats postopératoires, sans symptômes résiduels, quel que soit le type de
chirurgie pratiquée. Cela signifie également que la seconde moitié des patients souffrent encore
de déficiences fonctionnelles et de limitations dans leurs activités de la vie quotidienne.
Afin d'améliorer notre compréhension des déficiences fonctionnelles associées à
l'arthrose de cheville et aux traitements chirurgicaux connexes, la deuxième partie de ce projet
de doctorat consiste à présenter une analyse quantitative de la crédibilité scientifique et de
l'utilité clinique des connaissances actuelles concernant l'évaluation de l'effet biomécanique lors
de la mise en place d’une prothèse totale de la cheville et des arthrodèses de cheville sur les
patients atteints d'arthrose de cheville au stade terminal (Chapitre 3).
Par ailleurs, même si l'arthrose de cheville est, dans une large mesure, liée à une
altération de la marche,6 la revue systématique de la littérature et la méta-analyse effectuées
dans le cadre de ce projet de doctorat ont montré que le nombre d'études qualitatives et
prospectives sur l’analyse de la marche chez cette population est limité. En effet, il semble que
l'évaluation objective de la marche ne soit pas suffisamment intégrée dans l'évaluation et la
prise en charge de l'arthrose de cheville. Par conséquent, les informations sur le comportement
du pied chez ces patients avant et après traitement chirurgical font défaut. Cependant, nous
avons également constaté qu'il existe un manque de caractérisation de l'arthrose de cheville
dans les études d'analyse de la marche. Cela signifie que les conséquences fonctionnelles sont
difficiles à définir sans tenir compte des changements morphologiques et structurels du pied
associés à l'arthrose de cheville.
Par conséquent, le présent projet de doctorat a mis au point une plateforme d'examen
clinique avancée qui englobe certains défis et avantages liés à la combinaison d'un système de
capture de mouvement, d'une plateforme de force et d'une plateforme de pression plantaire. Dès
lors, l'intégration de ces dispositifs nous a permis de créer un modèle cinétique du pied à quatre
segments permettant d’estimer la génération ou l’absorption des puissances articulaires au
niveau du pied et de la cheville durant la marche.

vi
Le présent projet a complété la distribution intrinsèque de la puissance des articulations
du pied par une variable "simple" qui encapsule une relation angulaire 3D entre les vecteurs du
moment et les vecteurs de la vitesse angulaire d’une même articulation, dans le but de traduire
les données cinétiques en une mesure "simple" de la fonction des articulations du pied pendant
la marche (Chapitre 4). Cette première estimation du comportement cinétique des multiples
articulations du pied a révélé qu'elles adoptent une configuration stalibilized-resistive pendant
la majeure partie de la phase d’appui de la marche.
À notre connaissance, aucune recherche antérieure n'a été effectuée chez des patients
souffrant d'arthrose de cheville à l'aide d'un modèle cinématique et cinétique de pied à quatre
segments. Cette approche a le potentiel de montrer des comportements cinématiques et
cinétiques qu'un modèle du pied représenté par un seul segment rigide masquerait ainsi que de
donner des informations supplémentaires sur la fonction de l'avant-pied en mesurant la
cinématique et la cinétique des articulations de Chopart et de Lisfranc (Chapitres 5 et 6).
De plus, le présent projet s'est intéressé au manque de caractérisation de l'arthrose de
cheville et des déformations ostéoarticulaires associées, identifiées grâce à notre revue
systématique de la littérature, et a incorporé des variables radiologiques statiques et
dynamiques. Par conséquent, l'un des premiers objectifs du projet était de classer les patients
en différents groupes en fonction de l'étiologie de leur arthrose de cheville. Ainsi, l'étiologie la
plus courante observée chez les patients recrutés était l'arthrose post-traumatique de cheville.
Ce sous-type d'arthrose de cheville survient le plus souvent suite aux fractures et à l’instabilité
chronique de cheville. Comme la nature du traumatisme est différente pour ces deux étiologies,
on peut s'attendre à ce que les deux sous-types d'arthrose post-traumatique de cheville
présentent une mécanique du pied différente pendant la marche. Étonnamment, nous n'avons
trouvé aucune différence significative dans les angles et les moments articulaires du pied entre
les deux groupes pathologiques.
Cependant, l’exploration de la cinétique des articulations intrinsèques du pied des deux
sous-groupes par rapport aux sujets asymptomatiques a révélé que l'altération de la mécanique
du pied n'était pas limitée à la cheville douloureuse, mais touchait également les articulations
voisines du pied, comme les articulations de Lisfranc et la première métatarso-phalangienne.
Nous pensons également que l'absence de différences observées dans les angles et les
moments articulaires du pied entre les deux groupes pathologiques pourrait s'expliquer par la
présence de déformations concomitantes du pied et de la cheville associées à l'arthrose de
cheville pouvant affecter la mécanique intrinsèque du pied et de l'articulation de la cheville
pendant la marche. Par conséquent, le présent projet a étudié l'effet des déformations

vii
ostéoarticulaires du pied et de la cheville mesurées radiologiquement sur la cinématique et la
cinétique des articulations du pied et de la cheville chez des patients souffrant d'arthrose post-
traumatique de cheville.
Ainsi, d'après les radiographies standards dites « en charge », les patients ont été classés
en trois groupes de déformation ostéoarticulaire du pied et de la cheville (cavus, planus et
neutre). Cette nouvelle approche du profilage des patients a alors révélé trois résultats clés :
1) nos données semblent fournir d'autres preuves de l'interrelation entre la structure du
pied et les modifications de la mécanique du pied ;
2) le groupe d’arthrose de cheville présentant une déformation ostéoarticulaire de type
cavus tente de réduire la déformation varisante intra-articulaire de la cheville au
niveau des articulations du Chopart et du Lisfranc ;
3) aucune différence significative des angles et des moments articulaires n'a été
observée entre le groupe atteint d'arthrose ayant des déformations ostéoarticulaires
de type pied plat et le groupe atteint d'arthrose sur pied normo axé.
Dès lors, ces résultats indiquent que la désaxation de l'arrière-pied et de la cheville, tel
qu’évalué sur un plan radiographique, influence la mécanique du pied pendant la marche chez
les patients souffrant d'arthrose post-traumatique de la cheville.
Enfin, une étude pilote (Chapitre 7) a été réalisée pour donner une première évaluation de
la façon dont la prothèse totale de cheville est bénéfique pour la performance biomécanique des
patients souffrant d'arthrose post-traumatique de la cheville. Nous avons donc étudié l'effet de
la prothèse totale de cheville sur les angles, les moments et la puissance de l'articulation de la
cheville à l'aide d'un modèle cinématique et cinétique de pied à un et plusieurs segments. Nos
résultats ont révélé que la mécanique de la cheville après prothèse totale ressemble à celle des
chevilles saines, mais que leur performance biomécanique en termes d'angles et de moments
articulaires reste réduite par rapport aux sujets témoins asymptomatiques.
De plus, nous avons constaté que le choix de modèle du pied peut modifier l'interprétation
clinique pour évaluer si une intervention chirurgicale comme la prothèse totale de cheville est
bénéfique ou non à la performance biomécanique d'un patient. Par conséquent, il est important
sur le plan clinique d'évaluer la cinématique et la cinétique de l'articulation de la cheville à l'aide
d'une approche de modélisation multi-segments du pied.

viii
En conclusion, ce projet de doctorat vise à contribuer à une meilleure compréhension de la
(patho) mécanique de l'arthrose de cheville par le développement d’une plateforme d'examen
clinique avancée. L'intégration de tous les dispositifs composant cette dernière nous a permis
de créer un modèle cinématique et cinétique du pied à quatre segments, fournissant des
informations précieuses pour le raisonnement et l'interprétation cliniques futurs. Nous sommes
convaincus que la combinaison d'une telle plateforme d'examen clinique avancée en association
avec des informations cliniques et radiographiques nous aidera à mieux comprendre le
complexe biomécanique du pied et de la cheville.
ix
Références
1. Agel J, Coetzee JC, Sangeorzan BJ, Roberts MM, Hansen ST. Functional Limitations of
Patients with End-Stage Ankle Arthrosis. Foot Ankle Int. 2005;26(7):537-539.
2. Cenni F, Leardini A, Pieri M, et al. Functional performance of a total ankle replacement:
thorough assessment by combining gait and fluoroscopic analyses. Clin Biomech.
2013;28(1):79-87.
3. Doets HC, Vergouw D, Veeger HEJ, Houdijk H. Metabolic cost and mechanical work
for the step-to-step transition in walking after successful total ankle arthroplasty. Hum
Mov Sci. 2009;28(6):786-797.
4. Glazebrook M, Daniels T, Younger A, et al. Comparison of health-related quality of life
between patients with end-stage ankle and hip arthrosis. J Bone Jt Surg - Ser A.
2008;90(3):499-505.
5. Haddad SL. Intermediate and Long-Term Outcomes of Total Ankle Arthroplasty and
Ankle Arthrodesis<sbt aid="1210679">A Systematic Review of the Literature</sbt>. J
Bone Jt Surg. 2007;89(9):1899.
6. McKinley TO, Rudert MJ, Koos DC, Brown TD. Incongruity versus Instability in the
Etiology of Posttraumatic Arthritis. Clin Orthop Relat Res. 2004;423:44-51.
7. Saltzman CL, Zimmerman B, O’Rrourke M, Brown T, Buckwalter J, Johnston R. Impact
of comorbidities on the management of Health in Patients with Ankle Osteoarthritis. J
Bone Jt Surg. 2006;88(11):2366-2372.
8. Valderrabano V, Nigg BM, von Tscharner V, Stefanyshyn DJ, Goepfert B, Hintermann
B. Gait analysis in ankle osteoarthritis and total ankle replacement. Clin Biomech.
2007;22(8):894-904.
x
Ankle osteoarthritis and its
treatments : impact on foot and ankle biomechanics

xi
Abstract
Ankle osteoarthritis is a degenerative joint disease characterized by significant pain and
disability. Although gait is improved after surgery, patients still experience impaired lower limb
function. Therefore, this doctoral project compared outcomes following common surgical
procedures for ankle osteoarthritis by analyzing patients’ perception of recovery. Evidence
showed that half of the patients were still experiencing functional impairments after surgery.
To increase our understanding of functional impairment experienced by these patients, a meta-
analysis was performed to assess the biomechanical effects of total ankle replacement and ankle
arthrodesis during gait. It showed that characterization of ankle osteoarthritis is lacking in gait
studies and that functional consequences are difficult to define without considering the
morphological and structural changes associated with this pathology. Therefore, homogenous
study groups of patients were recruited based on the aetiology of ankle osteoarthritis and the
presence of concomitant foot deformities. Analyzing the kinetics of the intrinsic foot joints of
ankle osteoarthritis patients revealed that the impairment in foot mechanics was not restricted
to the painful ankle joint, but also affected neighboring foot joints. Further evidence showed
that malalignment of the hindfoot and the ankle does indeed influence foot mechanics during
gait. Finally, a pilot study providing a first estimation of how total ankle replacement benefits
the biomechanical performance of patients, revealed that ankle mechanics after surgery
resembles that of unaffected ankles, but remain impaired compared to control subjects.
Keywords :
Biomechanics ; Ankle osteoarthritis; Walking ; Total ankle replacement
Laboratory :
Laboratoire de Biomécanique et Mécanique des Chocs (LBMC)
IFSTTAR Site de Lyon-Bron Case 24
25 Avenue François Mitterand
69675 Bron Cedex

xii
Table of contents
Acknowledgements .................................................................................................................................. i
Résumé court .......................................................................................................................................... iii
Résumé long ............................................................................................................................................ iv
Références .................................................................................................................................... ix
Abstract ................................................................................................................................................... xi
Table of contents .................................................................................................................................... xii
Foreword ................................................................................................................................................. 1
General introduction ............................................................................................................................... 2
REFERENCES .................................................................................................................................. 5
Aim of the doctoral project ..................................................................................................................... 8
Chapter 1 : “Notions d’anatomie du pied et de la cheville”.................................................................. 10
INTRODUCTION ........................................................................................................................... 11
ANATOMIE GENERALE ................................................................................................................ 12
MOUVEMENT DU PIED ET DE LA CHEVILLE ................................................................................ 12
CONCLUSION ............................................................................................................................... 17
REFERENCES ................................................................................................................................ 17
Chapter 2 : Long-term patient’s perceived recovery and satisfaction after total ankle replacement, tibio-talar, and tibio-talo-calcaneal arthrodesis .................................................................................... 18
ABSTRACT .................................................................................................................................... 19
BACKGROUND ............................................................................................................................. 20
MATERIALS & METHODS............................................................................................................. 21
Study Design and Sampling ..................................................................................................... 21
Survey Content........................................................................................................................ 22
Statistical Analysis ................................................................................................................... 23
RESULTS ...................................................................................................................................... 23
Sample Description ................................................................................................................. 23
Difference in Health-Related Outcome Measures Across Recovery Groups .......................... 26
Difference in Health-Related Outcome Measures Across Surgical Procedure Groups .......... 27
Association between Surgical Procedures and Recovery Groups .......................................... 29
DISCUSSION ................................................................................................................................ 29
CONCLUSION ............................................................................................................................... 32
REFERENCES ................................................................................................................................ 33
Chapter 3 : Change in gait biomechanics after total ankle replacement and ankle arthrodesis: a systematic review and meta-analysis .................................................................................................... 36
ABSTRACT .................................................................................................................................... 37

xiii
INTRODUCTION ........................................................................................................................... 38
METHODS .................................................................................................................................... 38
Search strategy ....................................................................................................................... 39
Eligibility criteria ..................................................................................................................... 39
Methodological quality assessment ....................................................................................... 41
Outcome measures and data extraction ................................................................................ 41
Data synthesis and analysis .................................................................................................... 42
Evidence-based recommendations......................................................................................... 42
RESULTS ...................................................................................................................................... 43
Review selection and identification ........................................................................................ 43
Quality assessment ................................................................................................................. 43
Sample selection, composition and description ..................................................................... 47
Study procedures related to gait specific measurement protocol ......................................... 47
Outcome measures ................................................................................................................. 47
DISCUSSION ................................................................................................................................ 57
CONCLUSION ............................................................................................................................... 60
Supplementary Materials Description ........................................................................................ 60
REFERENCES ................................................................................................................................ 61
Chapter 4 : Intrinsic foot joints adapt a stabilized-resistive configuration during the stance phase ... 66
ABSTRACT .................................................................................................................................... 67
BACKGROUND ............................................................................................................................. 68
METHODS .................................................................................................................................... 69
Subjects ................................................................................................................................... 69
Protocol ................................................................................................................................... 70
Data analysis ........................................................................................................................... 70
RESULTS ...................................................................................................................................... 73
Ankle versus Shank-Calcaneus joints ...................................................................................... 73
Calcaneus-Midfoot (Chopart) ................................................................................................. 74
Midfoot-Metatarsus (Lisfranc) ................................................................................................ 75
First metatarso-phalangeal ..................................................................................................... 75
DISCUSSION ................................................................................................................................ 79
CONCLUSION ............................................................................................................................... 82
REFERENCES ................................................................................................................................ 83
Chapter 5 : Post-sprain versus post-fracture post-traumatic ankle osteoarthritis : impact on foot and ankle kinematics and kinetics ................................................................................................................ 87
ABSTRACT .................................................................................................................................... 88
INTRODUCTION ........................................................................................................................... 89
METHODS .................................................................................................................................... 90

xiv
Participants ............................................................................................................................. 90
Data collection ........................................................................................................................ 90
Data analysis ........................................................................................................................... 91
Statistical analysis ................................................................................................................... 93
RESULTS ...................................................................................................................................... 93
Demographic and spatio-temporal data ................................................................................. 93
SPM analysis............................................................................................................................ 95
DISCUSSION .............................................................................................................................. 100
CONCLUSION ............................................................................................................................. 102
REFERENCES .............................................................................................................................. 103
Chapter 6 : The effect of ankle and hindfoot malalignment on foot mechanics in patients suffering from post-traumatic ankle osteoarthritis ............................................................................................ 106
ABSTRACT .................................................................................................................................. 107
INTRODUCTION ......................................................................................................................... 108
METHODS .................................................................................................................................. 109
Participants ........................................................................................................................... 109
Radiographic assessment ...................................................................................................... 109
Data collection ...................................................................................................................... 111
Data analysis ......................................................................................................................... 113
Statistical analysis ................................................................................................................. 114
RESULTS .................................................................................................................................... 114
Demographic, spatiotemporal and radiographic data .......................................................... 114
SPM analysis.......................................................................................................................... 114
DISCUSSION .............................................................................................................................. 119
CONCLUSION ............................................................................................................................. 121
REFERENCES .............................................................................................................................. 122
Chapter 7 : Quantifying the effect of total ankle replacement using a 1-segment versus a multi-segment foot modeling approach: a pilot study ................................................................................. 124
ABSTRACT .................................................................................................................................. 125
INTRODUCTION ......................................................................................................................... 126
METHODS .................................................................................................................................. 127
Participants ........................................................................................................................... 127
Data collection ...................................................................................................................... 128
Data analysis ......................................................................................................................... 128
Statistics ................................................................................................................................ 129
RESULTS .................................................................................................................................... 130
Demographic and spatiotemporal data ................................................................................ 130
Pre- versus post-operative condition ................................................................................... 130

xv
Control subjects versus patients after total ankle replacement .......................................... 133
Outcome differences between ankle joint and shank-calcaneus joint ................................ 133
DISCUSSION .............................................................................................................................. 135
CONCLUSION ............................................................................................................................. 136
REFERENCES .............................................................................................................................. 137
Additional reflections and future directions ....................................................................................... 140
Methodological considerations ................................................................................................ 140
Clinical considerations .............................................................................................................. 143
REFERENCES ......................................................................................................................... 145
General conclusion .............................................................................................................................. 147
List of Figures ....................................................................................................................................... 148
List of tables ........................................................................................................................................ 151
Appendix .............................................................................................................................................. 153
Appendix 1 : Chapter 3 : Supplementary material 1 : Results of modified Downs and Black scale ......................................................................................................................................................... 154
Appendix 2 : Chapter 3 : Supplementary material 2 : The change in gait parameters (Ankle Dorsiflexion RoM, Ankle Plantarflexion RoM) following total ankle replacement (TAR global, Mobile-bearing prosthesis and Fixed-bearing prosthesis) compared to pre-operative status ...... 160
Appendix 3 : Chapter 3 : Supplementary material 3 : The change in gait parameters (Knee and Hip RoM) following total ankle replacement (TAR global, Mobile-bearing prosthesis and Fixed-bearing prosthesis) compared to pre-operative status .................................................................. 161
Appendix 4 : Chapter 3 : Supplementary material 4 : The change in spatio-temporal parameters (Cadence, Stance Duration, Step Length) following total ankle replacement (TAR global, Mobile-bearing prosthesis and Fixed-bearing prosthesis) compared to pre-operative status ................... 162
Appendix 5 : Chapter 3 : Supplementary material 5 : The change in all gait parameters (Ankle Dorsiflexion RoM, Ankle Plantarflexion RoM, Knee and Hip RoM) following ankle arthrodesis compared to pre-operative status. ................................................................................................. 163
Appendix 6 : Chapter 3 : Supplementary material 6 : The change in spatio-temporal parameters (Cadence, Stance Duration, Step Length) ) following ankle arthrodesis compared to pre-operative status ............................................................................................................................................... 164

1
Foreword
This doctoral project was initiated by Dr. Thibaut Leemrijse, Dr. Jean-Luc Besse, Prof.
Laurence Chèze and Paul-André Deleu with a view to achieving a broader and more meaningful
picture of the functional health of patients that are treated surgically for foot and ankle
pathologies. For many years, the orthopaedic foot and ankle surgeons of the Foot & Ankle
Institute (Brussels) and Dr. Jean-Luc Besse (Hospices Civils de Lyon) have had a strong
commitment to clinical and translational research. One of the main research interests of both
research groups is the surgical management of ankle osteoarthritis. Currently the two most
common surgical procedures for ankle osteoarthritis are total ankle replacement and ankle
arthrodesis. Although both procedures show good short- and mid-term outcome results, several
complications have been reported in long-term studies. Therefore, to improve patient care, both
research teams proposed the present research project. This project fits within the work of a
larger interdisciplinary and multi-centric research group on foot and ankle biomechanics.
During the last three years, as a part-time PhD student, I had the privilege to initiate the
present multicenter study in two foot and ankle research centers (Lyon and Brussels). This PhD
manuscript presents the preliminary results of this long-term on-going interdisciplinary and
multi-center project. It represents also the successful collaboration of multiple disciplines (i.e.,
podiatrist, orthopaedic surgeons, engineers) required to grasp the complexity of ankle
osteoarthritis.
This thesis dissertation is written in English. However, in accordance to the internal rules
and regulations of the Doctoral School, a thesis written in English requires a short and a long
summary in French in the preliminary pages. In addition, the first chapter of this thesis
dissertation describing the anatomy of the foot and ankle was also written in French.

2
General introduction
Osteoarthritis of the ankle is a common chronic disorder characterized by progressive
joint degeneration, significant pain and disability, affecting approximately 1% of the world’s
adult population living with symptomatic ankle osteoarthritis.1,10,16,23,30 Post-traumatic ankle
osteoarthritis accounts for up to 79.5% of all cases of ankle osteoarthritis.7,31 This fraction with
post-traumatic aetiology is far greater in the ankle compared to the knee or the hip.7 Numerous
clinical and epidemiologic studies of patients suffering from ankle osteoarthritis have identified
previous trauma as the most common aetiology.31,36 Post-traumatic ankle osteoarthritis may be
secondary to ankle-related fractures (post-fracture) and to chronic ankle instability (post-
sprain).31 Evidence suggests that post-fracture ankle osteoarthritis results either from
irreversible cartilage damage which occurs at the time of the fracture, or from chronic cartilage
overloading which occurs as a result of post-fracture articular incongruity. The evidence also
suggests that post-sprain ankle osteoarthritis results from pathological cartilage overloading due
to chronic joint instability.22 Less common causes of ankle osteoarthritis are rheumatoid
arthritis, hemochromatosis, haemophilia, neuropathic arthropathy, primary osteoarthritis, post-
infectious arthritis, clubfoot deformity and avascular necrosis of the talus.35,36
The degree of self-reported physical impairment in patients with isolated ankle joint
osteoarthritis using the SF-36 questionnaire was equivalent to or worse than that of patients
with end-stage hip osteoarthritis, end-stage kidney disease or congestive heart failure.1,16,30 The
disability related to end-stage ankle osteoarthritis can represent a considerable economic burden
for both society and the individual patient.15 Recently, a Canadian study reported an
employment rate of 56% in patients, younger than 55 years affected by end-stage ankle
osteoarthritis, much lower than the expected employment rate of 79.2% of an age-matched
population.
Significant biomechanical impairment of the entire foot and lower limb has been
reported in patients suffering from post-traumatic ankle osteoarthritis.32,37 Their gait is
asymmetric and characterized by a decreased walking speed, a decreased stride length and a
reduced mobility of the ankle joint complex.38 They also seem to adopt an antalgic walking
strategy to prevent shear loading through their painful joint.38

3
The surgical management of ankle osteoarthritis is generally reserved for failed medical
management (i.e. assistive devices, physiotherapy, orthotics, viscosupplementation) where
functional disability affects a patient’s quality of life.29 Currently, the “gold standard” surgical
treatment is ankle arthrodesis, which provides good pain relief and a relatively well-
documented long-term survivalship.11,13,18,34,35 However, ankle arthrodesis leads to deficits in
work and leisure activities and to adjacent joint degeneration,4,9,14,24,39 thought to be a
consequence of altered mechanical loads as a result of the change in function of the ankle.4,5,9,14
These disadvantages have encouraged the use of motion-sparing procedures such as total ankle
replacement, the potential benefits of which are conserving the existing pre-operative ankle
range of motion, improving gait and protecting the adjacent joints6,8,20, although the last of these
has not yet been proven.26 Despite these persuasive arguments in favour of a total ankle
replacement rather than an ankle arthrodesis, long-term clinical and radiological results of total
ankle replacement are not as satisfactory as those of total hip and knee replacements.8
Although the biomechanical performance was improved after successful total ankle
replacement and ankle arthrodesis compared to their pre-operative situation, patients are still
experienced impaired lower leg function.8,12,18,24,26 Recently, Pinsker and colleagues (2016)
used advancing patient-reported outcome measures to assess if patients who had undergone a
total ankle replacement and ankle arthrodesis could cope with ongoing residual deficits.24 Even
though most patients reported positive post-operative outcomes, only 15% perceived
themselves as having no residual deficits.24 This means that 85% of these patients have to make
compensatory functional adaptations to remain capable of performing basic activities of daily
living. These compensations are known as accessory offending motion hypermobility, which
takes the path of least resistance of motion and is an underlying characteristic of degenerative
joint disease.17 Studies showed secondary postoperative arthritic changes in the ipsilateral
adjacent joints, with most degeneration occurring in the subtalar joint, followed by the midtarsal
joints.9,33 This is the result of tissue trauma caused by repeated compensatory movements during
activities of daily living. When these arthritic changes become symptomatic, additional surgical
procedures will be required, exacerbating the functional deficiencies.19 Unfortunately, these
secondary functional limitations and compensatory adaptations and their impact on structures
of neighboring joints during activities of daily living have been little studied.
Nowadays, there exists a growing body of evidence using patient-reported outcome
measures to evaluate the outcome of total ankle replacement and ankle arthrodesis and
describing levels of function from the patient’s perspective.3,25,27 However, they largely neglect
whether patients are coping with ongoing limitations.25 In contrast, three-dimensional gait

4
analysis is the state of the art for measuring simultaneously lower limb joint kinematics and
kinetics during activities of the daily living. Two narrative reviews of the literature show that
three-dimensional gait analysis has a great potential for assessing the biomechanical
performance of a surgical intervention such as total ankle replacement and ankle arthrodesis
aimed at improving function in the foot and lower limb.2,21
To provide a more detailed and objective description of foot and lower limb function
during activities of daily living, quantitative measurements are needed. Quantitative evaluations
such as three-dimensional movement analysis during gait have been used to functionally
evaluate patients before and after a total ankle replacement and ankle arthrodesis in the
literature.2,21,28 A major drawback, however, is the oversimplification of foot mechanics
neglecting the complex interaction between forefoot, midfoot, hindfoot and ankle. The
simplified representation of the foot as a single functional segment is still widely used to assess
the impact of ankle osteoarthritis and the effect of total ankle replacement and ankle arthrodesis.
This could lead potentially to clinical misinterpretations of how a therapeutic intervention
benefits or degrades the biomechanical performance of patients as the estimated changes simply
reflect methodological errors inherent in modelling the foot as a single conventional rigid
segment.40 Consequently, information on foot behavior in patients suffering from ankle
osteoarthritis before and after their surgical treatment is lacking. However, it may also be argued
that characterization of ankle osteoarthritis is lacking in gait analysis studies. This means that
functional consequences are difficult to define without considering the morphological and
structural changes associated with the ankle osteoarthritis.
Therefore, the present doctoral project aims at enhancing the clinical understanding of
ankle osteoarthritis (foot dynamics) by integrating three tools (three dimensional multi-segment
foot model, ground reaction force and plantar pressure measurements). The integration of these
tools makes it possible to enhance interpretation of a clinical complex phenomenon such as
ankle osteoarthritis. It allowed us to create a four-segment kinematic and kinetic foot model to
better characterize the functional consequences of ankle osteoarthritis on the multiple joint of
the foot. This doctoral project, in our opinion, enables detection of complex pathomechanical
pathways associated with ankle osteoarthritis which, once determined, may become important
diagnostic and treatment tools to improve patient care.

5
REFERENCES
1. Agel J, Coetzee JC, Sangeorzan BJ, Roberts MM, Hansen ST. Functional Limitations of
Patients with End-Stage Ankle Arthrosis. Foot Ankle Int. 2005;26(7):537-539.
2. Barton T, Lintz F, Winson I. Biomechanical changes associated with the osteoarthritic,
arthrodesed, and prosthetic ankle joint. Foot Ankle Surg. 2011;17(2):52-57.
3. Beaton DE, Tarasuk V, Katz JN, Wright JG. “ Are You Better ?” A Qualitative Study of
the Meaning of Recovery. 2001:270-279.
4. Beyaert C, Sirveaux F, Paysant J, Molé D, André J-M. The effect of tibio-talar
arthrodesis on foot kinematics and ground reaction force progression during walking.
Gait Posture. 2004;20(1):84-91.
5. Brodsky JW, Kane JM, Coleman S, Bariteau J, Tenenbaum S. Abnormalities of gait
caused by ankle arthritis are improved by ankle arthrodesis. 2016;98(10):1369-1375.
6. Brodsky JW, Polo FE, Coleman SC, Bruck N. Changes in Gait Following the
Scandinavian Total Ankle Replacement. J Bone Joint Surg. 2011;93(20):1890-1896.
7. Brown TD, Johnston RC, Saltzman CL, Marsh JL, Buckwalter JA. Posttraumatic
Osteoarthritis: A First Estimate of Incidence, Prevalence, and Burden of Disease. J
Orthop Trauma. 2006;20(10):739-744.
8. Cenni F, Leardini a, Pieri M, et al. Clinical Biomechanics Functional performance of a
total ankle replacement : thorough assessment by combining gait and fl uoroscopic
analyses. Jclb. 2012;28(1):79-87.
9. Coester LM, Saltzman CL, Leupold J, Pontarelli W. Long-Term Results Following
Ankle Arthrodesis for Post-Traumatic Arthritis. J Bone Joint Surg. 2001;83(2):219-228.
10. Cunningham LS, Kelsey JL. Epidemiology of musculoskeletal impairments and
associated disability. Am J Public Health. 1984;74(6):574-579.
11. Demetriades L, Strauss E, Gallina J. Osteoarthritis of the ankle. Clin Orthop Relat Res.
1998;(349):28-42.
12. Doets HC, Vergouw D, Veeger HEJ (Dirkjan., Houdijk H. Metabolic cost and
mechanical work for the step-to-step transition in walking after successful total ankle
arthroplasty. Hum Mov Sci. 2009;28(6):786-797.
13. Donatto KC. Arthritis and Arthrodesis of the Hindfoot. Clin Orthop Relat Res.
1998;349(349):81-92.

6
14. Fuchs S, Sandmann C, Skwara A, Chylarecki C. Quality of life 20 years after arthrodesis
of the ankle. J Bone Joint Surg Br. 2003;85-B(7):994-998.
15. Gagné OJ, Veljkovic A, Glazebrook M, et al. Prospective Cohort Study on the
Employment Status of Working Age Patients After Recovery From Ankle Arthritis
Surgery. Foot Ankle Int. 2018;39(6):657-663.
16. Glazebrook M, Daniels T, Younger A, et al. Comparison of Health-Related Quality of
Life Between Patients with End-Stage Ankle and Hip Arthrosis. J Bone Joint Surg.
2008;90(3):499-505.
17. Guilak F, Fermor B, Keefe FJ, et al. The role of biomechanics and inflammation in
cartilage injury and repair. Clin Orthop Relat Res. 2004;(423):17-26.
18. Haddad SL. Intermediate and Long-Term Outcomes of Total Ankle Arthroplasty and
Ankle Arthrodesis : A Systematic Review of the Literature</sbt>. J Bone Joint Surg.
2007;89(9):1899.
19. Hintermann B, Barg A, Knupp M, Valderrabano V. Conversion of painful ankle
arthrodesis to total ankle arthroplasty. J Bone Joint Surg. 2009;91(4):850-858.
20. Ingrosso S, Benedetti MG, Leardini A, Casanelli S, Sforza T, Giannini S. GAIT analysis
in patients operated with a novel total ankle prosthesis. Gait Posture. 2009;30(2):132-
137.
21. Leardini A, O’Connor JJ, Giannini S. Biomechanics of the natural, arthritic, and replaced
human ankle joint. J Foot Ankle Res. 2014;7(1):8.
22. McKinley TO, Rudert MJ, Koos DC, Brown TD. Incongruity versus Instability in the
Etiology of Posttraumatic Arthritis. Clin Orthop Relat Res. 2004;423:44-51. d
23. Peyron J. The epidemiology of osteoarthritis. In: Moskowitz M, Goldberg V, Mankin H,
eds. Osteoarthritis: Diagnosis and Treatment. Philadelphia: WB Saunders; 1984:9–27.
24. Pinsker E, Inrig T, Daniels TR, Warmington K, Beaton DE. Symptom Resolution and
Patient-Perceived Recovery Following Ankle Arthroplasty and Arthrodesis. Foot Ankle
Int. 2016;37(12):1269-1276.
25. Pinsker E, Inrig T, Daniels TR, Warmington K, Beaton DE. Symptom Resolution and
Patient-Perceived Recovery Following Ankle Arthroplasty and Arthrodesis. Foot Ankle
Int. 2016;37(12):1269-1276.
26. Piriou P, Culpan P, Mullins M, Cardon J-N, Pozzi D, Judet T. Ankle replacement versus
arthrodesis: a comparative gait analysis study. Foot Ankle Int. 2008;29:3-9.

7
27. Poolman RW, Swiontkowski MF, Fairbank JC, Schemitsch EH, Sprague S, de Vet HC.
Outcome Instruments: Rationale for Their Use. J Bone Joint Surg. 2009;91(Suppl 3):41-
49.
28. Queen R. Directing clinical care using lower extremity biomechanics in patients with
ankle osteoarthritis and ankle arthroplasty. J Orthop Res. 2017;35(11):2345-2355.
29. Rao S, Ellis SJ, Deland JT, Hillstrom H. Nonmedicinal therapy in the management of
ankle arthritis. Curr Opin Rheumatol. 2010;22(2):223-228.
30. Saltzman CL. Impact of Comorbidities on the Measurement of Health in Patients with
Ankle Osteoarthritis. J Bone Jt Surg. 2006;88(11):2366.
31. Saltzman CL, Salamon ML, Blanchard GM, et al. Epidemiology of ankle arthritis: report
of a consecutive series of 639 patients from a tertiary orthopaedic center. Iowa Orthop
J. 2005;25:44-46.
32. Segal AD, Shofer J, Hahn ME, Orendurff MS, Ledoux WR, Sangeorzan BJ. Functional
Limitations Associated with End-Stage Ankle Arthritis. J Bone Joint Surg.
2012;94(9):777-783.
33. Thomas R. Gait Analysis and Functional Outcomes Following Ankle Arthrodesis for
Isolated Ankle Arthritis. J Bone Joint Surg. 2006;88(3):526.
34. Thomas R, Daniels TR, Parker K. Gait analysis and functional outcomes following ankle
arthrodesis for isolated ankle arthritis. J Bone Joint Surg. 2006;88(3):526-535.
35. Thomas RH, Daniels TR. Ankle arthritis. J Bone Joint Surg. 2003;85(5):923-936.
36. Valderrabano V, Horisberger M, Russell I, Dougall H, Hintermann B. Etiology of Ankle
Osteoarthritis. Clin Orthop Relat Res. 2009;467(7):1800-1806.
37. Valderrabano V, Nigg BM, Hintermann B, et al. Muscular lower leg asymmetry in
middle-aged people. Foot ankle Int. 2007;28(2):242-249.
38. Valderrabano V, Nigg BM, von Tscharner V, Stefanyshyn DJ, Goepfert B, Hintermann
B. Gait analysis in ankle osteoarthritis and total ankle replacement. Clin Biomech.
2007;22(8):894-904.
39. Wu WL, Su FC, Cheng YM, Huang PJ, Chou YL, Chou CK. Gait analysis after ankle
arthrodesis. Gait Posture. 2000;11:54-61.
40. Zelik KE, Honert EC. Ankle and foot power in gait analysis: Implications for science,
technology and clinical assessment. J Biomech. 2018;75(June):1-12.
8
Aim of the doctoral project
The combined assessment of intrinsic foot joint angles, moments and power during
walking in patients suffering from ankle osteoarthritis is assumed to be of clinical interest,
however, this is not yet clearly defined and originates mainly from the anecdotal experience.
The aim of this doctoral project was to combine different methodologies in an advanced clinical
examination platform and to explore the potential clinical usefulness. Interpretation of the
results provided by the platform, should always consider the morphological and structural
changes associated with the ankle osteoarthritis. It is hypothesized that the use of the platform
will contribute to a better understanding of foot and ankle biomechanics in patients suffering
from ankle osteoarthritis. This was investigated in a survey study, a critical analysis of the
literature and clinical studies.
The aim of the survey study was to provide a first assessment and comparison of surgical
outcomes following total ankle replacement, tibio-talo-calcaneal, and tibiotalar arthrodeses by
capturing patients’ perception of their feeling of recovery. The question “Are you better ?” is
of primary importance for a clinician, giving the patient’s a critical appraisal of the patient on
the effect of their surgical treatment.
The critical analysis of the literature addressed a number of methodological
considerations associated with the development of the advanced clinical examination platform.
The specific objectives and questions of this critical analysis of the literature were:
1) To explore the existing literature on ankle osteoarthritis and its surgical treatments
2) To explore how inclusion criteria were defined for ankle osteoarthritis
3) To explore how concomitant foot and ankle deformities associated with ankle
osteoarthritis were assessed
4) To investigate if a single rigid foot model or a multi-segment foot model was used
5) To determine whether total ankle replacement patients maintain or improve their pre-
operative dorsi-/plantarflexion ankle motion during gait?
6) Do total ankle replacement and ankle arthrodesis patients improve their foot mechanics
relative to their pre-operative state?

9
Subsequently, the development of the advanced clinical examination platform to assess the
foot and ankle biomechanics of patients suffering from ankle osteoarthritis was initiated. The
specific objectives of the development of the platform were:
1) The integration and synchronization in time and in space of a motion capture system, a
force plate and a plantar pressure plate, identical in 2 different locations (Lyon &
Brussels) to initiate a multi-center study
2) The development of an in-house made Matlab© program. Due to the multi-dimensional
feature of the integrated measurement protocol, a program that allows handling of the
crucial clinical parameters was developed. An innovative step in our in-house made
Matlab© program was the development of a multi-segment kinematic and kinetic foot
model.
Finally, the possible value of the advanced clinical examination platform in increasing the
clinical insight in foot biomechanics of patients suffering from ankle osteoarthritis was
assessed. The specific objectives and hypotheses of this clinical part were :
1) To estimate the intrinsic foot joint kinematics and kinetics using a four-segment foot
model as well as characterizing the three-dimensional angular relationship between the
joint moment and the joint angular velocity vectors, in an attempt to provide a “simple”
measure of the function of intrinsic foot joints during gait
2) To compare the foot kinematics and kinetics of patients suffering from post-fracture
ankle osteoarthritis to patients suffering from post-sprain ankle osteoarthritis. In
supplement, each pathologic group was individually compared to an asymptomatic
group of peer-matched control subjects.
3) To investigate the effect of ankle and hindfoot malalignment on the gait kinematics and
kinetics of multiple joints of the foot and ankle complex in patients suffering from post-
traumatic ankle osteoarthritis
4) To investigate the effect of total ankle replacement on the ankle joint angles, moments
and power assessed with a one-segment and multi-segment kinematic and kinetic foot
models
5) To compare the outcome difference in ankle joint angles, moments and power from
preoperative to postoperative condition between the two modelling approaches in
patients treated surgically by a total ankle replacement.

10
Chapter 1 : “Notions d’anatomie du pied et de la cheville”
Paul-André Deleu,1,2 Thibaut Leemrijse2
1Univ Lyon, Université Claude Bernard Lyon 1, IFSTTAR, LBMC UMR_T9406,F69622, Lyon, France
2Foot & Ankle Institute, Brussels, Belgium

11
INTRODUCTION
Nous avons naturellement tendance à envisager les choses que nous ne connaissons pas en
faisant des analogies avec celles que nous connaissons et que nous comprenons.
Il est logique de penser que la roue tourne autour d’un axe ; comme il semble facile de
comprendre que la cheville permet un mouvement de flexion extension et l’image d’une
charnière nous vient alors à l’esprit. Cependant, les forces axiales que subit la région talonnière
lors de chaque pas doivent se transformer en énergie, sans aucune lésion tissulaire, pour nous
permettre de quitter l’avant pied et les orteils sous une forme propulsive.
Il est donc utile d’avoir une bonne représentation de l’anatomie du pied et de la cheville
afin de mieux en comprendre les notions biomécaniques et ses explorations décrites dans ce
projet de doctorat.
Sous le terme « anatomie » nous évoquerons successivement et très succinctement les
structures osseuses, ligamentaires et tendineuses. Nous mettrons volontairement de côté des
éléments aussi essentiels que les structures vasculaires, artérielles ou veineuses, la peau et son
tissu sous-cutané. De même, la description des éléments neurologiques ne sera pas abordée.
Les structures articulaires sont recouvertes par des zones cartilagineuses qui représentent
des surfaces de glissement. Le cartilage est donc soumis à des contraintes et tout excès risque
d’entraîner une détérioration de cette surface de glissement et finalement, voir apparaître
l’arthrose.
Quant à elles, les structures ligamentaires réunissent entres elles les différentes pièces
osseuses et donnent passivement la rigidité et la stabilité à notre structure anatomique. Là aussi,
tout excès de contrainte, par défaut d’axe ou d’alignement, peut être à l’origine d’une faillite du
système et sera révélé par une laxité articulaire. Ce mécanisme de laxité peut expliquer lui aussi
les phénomènes d’arthrose par perte de congruence des surfaces articulaires.
Les structures tendineuses sont actives et permettent d’animer le pied et la cheville, elles
génèrent donc le mouvement. Les muscles à l’origine de chaque tendon sont définis comme
extrinsèques lorsque leur corps est situé en dehors du pied c’est à dire dans la jambe et sont
principalement propulseurs. Les intrinsèques sont situés à l’intérieur du pied entre le calcanéus
et leur point d’insertion tendineuse ; ils sont alors plutôt stabilisateurs. Les forces qui animent
les tendons doivent idéalement être synchronisées et harmonieuses lors du déroulement du pas
au risque de provoquer un déséquilibre.

12
ANATOMIE GENERALE
Globalement, on définit différentes régions au niveau du pied et de la cheville. On considère
comme « cheville », la région tibio-talienne caractérisée par l’extrémité distale du tibia et de la
malléole fibulaire (malléole externe) et le talus (anciennement appelé astragale). Cette région
est privée de toutes insertions tendineuses. Cette véritable pince s’appuie sur la surface
articulaire du talus, qui lui-même s’assoie sur le calcanéus, os de la région talonnière.
Entre ces os, talien et calcanéen, existe deux zones articulaires ; la postérieure est appelée
articulation sous talienne proprement dite et l’antérieure se prolonge au niveau de l’articulation
dite de Chopart à laquelle participe l’os naviculaire situé plus antérieurement. L’ensemble de
ces structures osseuses sont reliées par un système ligamentaire complexe et forment les
structures osseuses de la région de l’arrière-pied.
La partie du « médio-pied » est caractérisée par la présence osseuse de l’os naviculaire situé
en avant de la tête talienne. Le cuboïde est comme son nom l’indique, de forme cubique situé à
la partie antérieure du calcanéus et en relation latérale et plantaire par rapport à l’os naviculaire.
Les trois cunéiformes sont situés à la partie antérieure du naviculaire. Le 3e cunéiforme a
lui aussi une relation articulaire latérale avec la partie supérieure du cuboïde.
L’articulation transverse dite de « Lisfranc » délimite antérieurement le médio-pied à
« l’avant pied » qui est formé de cinq métatarsiens relativement parallèles à la suite desquels se
prolongent les orteils composés de deux phalanges au niveau du premier rayon et de trois
phalanges au niveau des petits orteils.
MOUVEMENT DU PIED ET DE LA CHEVILLE
La forme de chaque os détermine la création de mouvements complexes qui ne sont jamais
des rotations ou des translations pures mais toujours une combinaison des deux.
Le mouvement de la cheville pourrait être considéré comme un des plus simples au niveau
de l’arrière-pied. Cependant, il semble difficile de le définir comme un cylindre autour d’un
axe de rotation comme on peut le retrouver au niveau d’une charnière. En effet, l'articulation
de la cheville, d'un point de vue ostéologique et syndesmologique, est une articulation
essentielle pour la fonction de flexion dorsale et plantaire du pied par rapport à la jambe. Le
talus est un os clé de la jonction entre le pilon tibial et les articulations de l'arrière-pied.
L’extrémité distale du tibia appelée également pilon tibial comprend une surface articulaire
supérieure et une surface sur la malléole médiale. Cette surface articulaire est complétée
latéralement par la malléole fibulaire pour former la pince bi-malléolaire qui est une structure

13
dynamique. Elle s’appuie sur l’os talien, dont on peut différencier le corps et le col, et est
caractérisée par la présence de surfaces articulaires multiples que ce soit sur sa partie supérieure
en rapport avec la pince bi-malléolaire ou sur sa partie inférieure en rapport avec la surface
articulaire du calcanéus. Cette région représente le corps. La partie antérieure de l’os considérée
comme le col se termine par une tête elle aussi recouverte d’une surface articulaire en relation
avec la concavité de l’os naviculaire.
Les relations articulaires de la cheville entre le pilon tibial et le talus ne sont pas cylindriques
mais variables et l’analogie doit plutôt être faite par rapport à un segment tronconique
définissant cependant un mouvement dont le centre rotatoire n’est pas fixe. De plus, la forme
antéro-postérieure de la surface articulaire du talus n’est pas parallèle et se trouve plus large
dans la partie antérieure que postérieure. Ceci oblige la pince bi-malléolaire à s’ouvrir lors des
mouvements de flexion dorsale et de se refermer lors des mouvements de flexion plantaire. Ce
jeu dynamique de la pince bi-malléolaire est autorisé par les mouvements complexes de
l’articulation syndesmotique située entre le tibia et la malléole fibulaire qui est elle-même
stabilisée par les ligaments syndesmotiques qui autorisent de fins mouvements de rotation-
ascension de la malléole fibulaire lors des mouvements de flexion-extension de la cheville.
L’anatomie de l’articulation sous talienne est elle aussi complexe à évoquer. Comme
souligné précédemment, il existe des surfaces articulaires situées entre le talus et le calcanéus
délimitées par un puissant ligament inter-osseux qui a été comparé à une haie élevée entre les
deux secteurs articulaires. Le calcanéus, au niveau de sa structure osseuse, est lui-même défini
par la tubérosité que représente la partie postérieure saillante du talon, et le site d’insertion du
puissant tendon calcanéen (Achille). L’os se prolonge ensuite par son apophyse antérieure en
relation avec le cuboïde et médialement une apophyse de soutien asymétrique appelé
sustentaculum tali, région qui participe au soutien de la tête talienne. Cette morphologie,
totalement asymétrique, présente de multiples variantes morphologiques qui expliquent
parfaitement le polymorphisme que l’on peut retrouver au niveau des formes de l’arrière-pied.
Une région talonnière déformée latéralement, ou en dehors, caractérisera ce qu’on appelle un
valgus de l’arrière-pied et à l’inverse, une déformation médiale ou en dedans, caractérisera le
varus de l’arrière-pied. Ces déformations relatives de l’arrière-pied accentueront ou pas le
porte-à-faux qui caractérise la structure architecturale de l’arrière-pied. Il est probable que les
formes de rayon de courbure articulaire favorisent une stabilité ou une instabilité rotatoire plus
ou moins importante entre le talus et le calcanéus. Une insuffisance de soutien au niveau du
sustentaculum tali favorisera l’instabilité de la tête talienne qui aura tendance à caractériser un
pied plat et inversement la superposition de l’os talien au-dessus du calcanéus caractérisera le

14
morphotype de pied creux. On comprend immédiatement que le démembrement de morphotype
de pied ou de structure osseuse que ce soit par l’anatomie palpatoire, par l’analyse des
radiographies ou du CT-scanner, aura un impact fondamental sur la biomécanique du pied et
inversement.
D’un point de vue grossièrement biomécanique, on comprendra que la résultante de force
du tendon calcanéen sera modifiée sur l’ensemble du pied et de la cheville lorsqu’il existe une
désaxation ou un défaut d’alignement de l’arrière-pied en valgus ou en varus. Les rétractions
tendino-musculaires que l’on peut retrouver au niveau du triceps qui anime ce tendon calcanéen,
elles aussi, auront un impact positif ou négatif sur les mouvements articulaires de l’arrière-pied
et du médio-pied.
Au niveau ligamentaire, un puissant système unit les différentes malléoles aux os de
l’arrière-pied. Au niveau médial ou interne, on retrouve une structure fondamentale appelée
ligament collatéral médial qui stabilise intimement la malléole médiale à la face interne du talus
sur ses fibres profondes et le sustentaculum tali sur ses fibres superficielles. Ce ligament se
prolonge antérieurement jusqu’au bord médial du naviculaire et complète, sous forme de
hamac, le soutien de la tête talienne en prolongeant le sustentaculum tali dans sa région
plantaire. Cette partie ligamentaire plus communément appelée « spring ligament » sera très
souvent retrouvée comme déficiente lorsqu’il existe une déformation en pied plat.
Au niveau latéral de la cheville, il existe également un complexe ligamentaire caractérisé
par trois ligaments principaux, un faisceau antérieur entre la malléole fibulaire et le talus, un
faisceau moyen entre la malléole fibulaire et le calcanéus, et un faisceau postérieur lui aussi
talo-fibulaire. Ces structures stabilisatrices passives seront elles aussi plus ou moins sollicitées
en fonction de l’alignement présent ou absent au niveau de l’arrière-pied.
Comme déjà évoqué pour le tendon calcanéen, les structures tendineuses extrinsèques
glissent dans des gouttières para malléolaires postérieures latérales et médiales à l’arrière-pied.
Les tendons fibulaires sont situés dans la partie latérale de la cheville et s’insèrent sur la partie
haute de la fibula et de la membrane inter-osseuse au sein de la jambe. Ils se réfléchissent au
niveau de la malléole fibulaire et participent donc indirectement aux mouvements de celle-ci
lors de la flexion-extension de la cheville. Ils se terminent respectivement au niveau de la base
du cinquième métatarsien pour le fibulaire court et à la base du premier métatarsien pour le
fibulaire long. Ils se distinguent autour du tubercule latéral du calcanéus qui sera lui aussi un
point de repère important lors de la palpation de sa structure osseuse. De plus, ils ont une
relation intime avec les structures ligamentaires latérales dont ils pondèrent la tension lors des
mouvements de la cheville et de l’arrière-pied.

15
Dans la partie médiale de la cheville, on retrouve le tendon du tibial postérieur qui termine
son insertion sur le bord interne ou médial du naviculaire et participe dès lors à la stabilité de
l’arche médiale du pied. Sa gaine répond, elle aussi intimement sous sa face profonde, aux
fibres superficielles du complexe ligamentaire médial et donc au spring ligament. Le tendon
fléchisseur de l’hallux semble également un vecteur fonctionnel non équivoque. Il est issu de
la face postérieure de la jambe et après s’être réfléchi sur le bord postérieur du talus, il glisse
sous la partie plantaire du sustentaculum tali. A ce niveau, lors de sa contraction, il exerce une
force dynamique d’élévation de cette apophyse calcanéenne médiale. Il entraîne ou stabilise dès
lors indirectement un mouvement de valgus au niveau de la tubérosité calcanéenne. Son
insertion se termine au niveau de la base de la phalange distale du gros orteil sur laquelle il
génère une force de propulsion fondamentale lors de la phase terminale du pas.
L’articulation sous talienne antéro-médiale est en continuité avec la surface articulaire de
la tête talienne s'opposant à la concavité articulaire du naviculaire. Elle est renforcée, comme
nous avons pu le voir, par la gaine et le tendon du tibial postérieur. Il existe donc
anatomiquement, au niveau sous talien, une articulation individualisée en postérieur et une
articulation antéro-médiale poly-articulaire où interviennent d'importants ligaments de soutien
(spring ligament) en continuité avec la concavité naviculaire qui reçoit la tête du talus. Cette
région anatomique appelée communément articulation de Chopart représente la jonction entre
les os dit de « l’arrière-pied » et ceux du « médio-pied ». Si la description anatomique en est
relativement simple, son examen clinique et son exploration mécanique semblent beaucoup
plus compliqués. Elle participe de façon évidente à la jonction et à la transmission des forces
axiales de la jambe vers la partie antérieure du pied dont l’avant-pied est caractérisé par sa
palette métatarsienne où l’on retrouve uniquement des forces de propulsion.
Le segment du médio-pied dont la mobilité du Chopart est difficile à évaluer cliniquement
présente relativement peu de mobilité et il existe, à l’opposé de la surface articulaire avec le
talus au niveau du naviculaire, une surface articulaire qui reçoit la base des trois os cunéiformes.
Ces trois surfaces reçoivent le nom de ligne innominée. Il n’existe sur cette interligne
pratiquement aucune mobilité reconnue. Le 3e cunéiforme par contre, oppose en direction
latérale et plantaire, une surface articulaire avec le cuboïde où là aussi des mouvements peu
décrits se rencontrent.
La partie distale des surfaces articulaires des cunéiformes et du cuboïde s’oppose aux bases
des cinq métatarsiens au niveau d’une ligne transverse appelée communément articulation de
Lisfranc.

16
Le clavier métatarsien est caractérisé par une mobilité franche entre le premier cunéiforme
et la base du premier métatarsien. Cette articulation cunéo-métatarsienne du premier rayon
présente des mouvements composites de flexion-adduction, extension-abduction d’une dizaine
de degré et participe de façon formelle à la stabilité de l’arche médiale du pied. Cette articulation
est renforcée par de puissants ligaments plantaires entre les cunéiformes et la base du premier
métatarsien. Sur la base de cette dernière, au niveau plantaire s’insère le tendon terminal du
tendon long fibulaire qui, après s’être déroulé sur la face latérale du pied, se réfléchit sur la
gouttière cuboïdienne pour traverser ensuite la voûte plantaire. Son action franche est celui d’un
stabilisateur de la base du premier métatarsien avec un mouvement de flexion du premier rayon.
La base du 2e et du 3e métatarsien s’enclave de façon rigide stable avec son cunéiforme
respectif. Latéralement, le 4e et le 5e métatarsien s’opposent à la surface articulaire du cuboïde
avec un secteur de mobilité de 20 à 30°en flexion-extension. Sur la base du 5e métatarsien, on
décrit la styloïde métatarsienne qui est elle aussi un élément palpatoire essentiel du bord latéral
du pied et le site d’insertion du tendon terminal du court fibulaire.
Dans la région dite de l’avant-pied, la palette métatarsienne se termine par des surfaces
articulaires de type condylienne qui s’appuient sur une structure capsulo-ligamentaire
fondamentale appelée la plaque plantaire. Les plaques plantaires sont des structures fibro-
cartilagineuses en forme de hamac en continuité intime avec la partie plantaire des bases
phalangiennes des différents orteils. La structure la plus développée est la plaque plantaire du
premier rayon dans laquelle s’insère les os sésamoïdiens afin d’en renforcer sa structure et d’y
permettre l’insertion des différents muscles intrinsèques qui stabilisent partiellement le premier
rayon.
Lors de la phase de propulsion, il est communément admis que les têtes métatarsiennes
roulent au sein de ces plaques plantaires en maintenant, lorsqu’il n’existe pas d’anomalie
anatomique, les orteils plaqués en appui au niveau du sol. Ces plaques plantaires sont reliées de
façon intime à un réseau fibreux en continuité évidente avec l’aponévrose plantaire et la peau
et qui fait le lien rigide et plantaire entre les structures de l’avant-pied et de l’arrière-pied. On
voudrait décrire plus loin cette région d’amortissement-cisaillement dont les relations sont
intimes par ce réseau fibreux à la structure cutanée et entrelacé du tissu graisseux noyé
d’éléments veineux ; mais nous nous le sommes interdit dans l’introduction.
L’aponévrose plantaire est donc une structure fondamentale divisée en trois composants :
un médial, un central et un latéral. L’aponévrose est une structure rigide peu déformable insérée
sur la tubérosité du calcanéus qui s’étend progressivement en éventail pour s’insérer au niveau
des différentes structures fibro-cartilagineuses de l’avant-pied dont principalement les plaques

17
plantaires. Son rôle est fondamental dans la stabilité du pied et évite grossièrement
l’effondrement de la structure osseuse en arche lors de sa mise en contrainte par le poids du
corps.
Ce mécanisme est renforcé par l’ensemble des muscles intrinsèques du pied, bien présent
au niveau du premier rayon sous forme de court fléchisseur, d’abducteur et d’adducteur de
l’hallux. Les muscles interosseux sont de courtes structures musculaires insérées entre les
métatarsiens qui se terminent sur les bases des premières phalanges des orteils. On retrouve
également les courts fléchisseurs qui donnent un effet de flexion de la phalange par rapport à
l’articulation métatarso-phalangienne.
CONCLUSION
Ce survol extrêmement simplifié et rapide de la richesse de l’anatomie du pied et de la
cheville nous évoque toute la complexité de cet organe proprioceptif qui nous permet
d’effectuer des performances décrites comme simples lors de la marche mais beaucoup plus
complexes lors de la course, du sport ou de l’adaptation sur des terrains irréguliers. Le but n’est
pas de donner une description structurée de l’anatomie mais uniquement d’en survoler les
caractéristiques complexes et intriquées qui justifient la mise en œuvre d’examen et d’analyse
paracliniques extrêmement sophistiqués afin de pouvoir comprendre et déterminer au mieux la
fonction relative de chacun de ses segments ou régions.
REFERENCES
1) Lengele B, Leemrijse Th, Anatomie chirurgicale de la cheville et du pied in, Th
Leemrijse, B. Valtin Pathologie du pied et de la cheville, Masson Elsevier Paris 2009.
2) Sarrafian SK. Anatomy of the foot and ankle. 2nd ed. Lippincott Philadelphia 1993.

18
Chapter 2 : Long-term patient’s perceived recovery and
satisfaction after total ankle replacement, tibio-talar, and
tibio-talo-calcaneal arthrodesis
Paul-André Deleu,1,2 Maud Piron,3 Gabrielle Leemrijse,2 Jean-Luc Besse,1,4
Laurence Chèze,1 Bernhard Devos Bevernage,2 Thibaut Leemrijse2
1Univ Lyon, Université Claude Bernard Lyon 1, IFSTTAR, LBMC UMR_T9406,F69622, Lyon, France
2Foot & Ankle Institute, Brussels, Belgium
3Université de Liège, CHR de la Citadelle, Liège, Belgique
4Hospices Civils de Lyon, Centre Hospitalier Lyon-Sud, Service de Chirurgie Orthopédique et
Traumatologique, Lyon, France
This manuscript was submitted online the 26th September 2019 and is presently being given full
consideration for publication in Foot & Ankle International journal.

19
ABSTRACT
Background: Total ankle replacement (TAR), tibio-talo-calcaneal (TTC), and tibiotalar
(TT) arthrodeses are common surgical procedures used to treat end-stage ankle osteoarthritis.
Patient-reported outcome measures (PROMS) are increasingly used to evaluate these surgeries.
However, they lack at capturing patients’ perceived recovery state and ability to cope with
potential functional limitations. Therefore, this study aimed at evaluating and comparing the
postoperative surgical outcome of TAR, TTC, and TT arthrodeses by considering 3 PROMS,
satisfaction rate and a self-reported perceived recovery state.
Methods: This study consisted of a cross-sectional survey aiming at retrospectively
analyzing patient postoperative satisfaction and PROMS (FAOS, FFI and SF-12) following
TAR (n = 51), TTC (n = 51) and TT (n =50). In addition, each patient was asked to classify
himself in one of the following self-reported perceived recovery statements: ‘Recovered-
Resolved’ (better with no symptoms or residual effects); ‘Recovered-Not Resolved’ (better with
some residual effects); ‘Not Recovered’ (not better). Comparisons were performed between
surgeries and between patients’ perceived recovery groups.
Results: Almost 50% of the patients reported themselves in the ‘Recovered-Resolved’
group. Recovered-Resolved group showed higher patient satisfaction and PROMS scores
compared to Recovered-Not Resolved and to Not Recovered groups. However, TAR group did
not show higher satisfaction and better PROMS scores compared to the two arthrodesis groups.
Finally, no difference in distribution of patients’ perceived recovery state was observed between
the surgeries.
Conclusion: Almost half of the patients reported better postoperative outcomes with no
symptoms or residual effects independent of the type of the surgery that was performed.

20
BACKGROUND
Ankle osteoarthritis is a progressive and degenerative joint disease. The etiology of
osteoarthritis is frequently posttraumatic or secondary to chronic ankle instability which can be
associated with a malalignment of the hindfoot.7,9 It is characterised by severe pain, loss of
autonomy, functional limitations, diminished health-related quality of life, and, in later stages,
an inability to perform daily tasks.1,14,23 Saltzman et al. (2006) have measured the degree of
physical impairment in patients suffering from ankle osteoarthritis, end-stage kidney disease
and congestive heart failure using the SF-36.22 They showed that the degree of physical
impairment in these different groups were similar suggesting that suffering from ankle
osteoarthritis can be considered as a severe disabling medical problem.22 Currently, tibiotalar
arthrodesis, tibio-talo-calcaneal arthrodesis and total ankle replacement are the three common
surgical solutions proposed for end-stage debilitating ankle osteoarthritis. Both procedures aim
at removing pain and maintaining a satisfactory function of the lower limb.15
Measuring and documenting the outcome of these surgical procedures is a complicated
process. The first question that needs to be addressed is whose perspective (patient versus
surgeon) of outcomes should be explored. From a clinical point of view, the most common
methods of assessment of surgical procedures for end-stage ankle osteoarthritis are clinical
range of motion, radiographic measurements, alignment and quantitative data such as three-
dimensional gait analysis.17 In contrast, patient’s definition of surgical outcome will vary from
a patient to another and will be based on personal issues that are pertinent to him such as
resuming physical activities or pain relief. Nowadays, there exists a growing body of evidence
using patient-reported outcome measures (PROMS) to evaluate the outcome of total ankle
replacement (TAR), tibio-talo-calcaneal (TTC), and tibiotalar (TT) arthrodeses recognizing the
importance of capturing the patient’s perspective of his surgery.2,19,26,28 However, these
PROMS are not sufficiently fine-tuned to capture patients’ perceived recovery state and ability
to cope with the expected and or un-expected potential functional limitations after their surgery.
When assessing surgical outcome, surgeons should wonder which impairment and limitation
does the patient experience and whether the patient will be able to adapt and perform his desired
daily activities after surgery. In fact, discrepancies may be observed between the clinical and
radiographic results and the actual patient satisfaction.
Recently, Pinsker et al. (2016) evaluated both ankle arthroplasty and arthrodesis by
comparing PROMS (using the SF-12, the EuroQol-5, the SMFA and the AOS scores) to the

21
self-reported patient-perceived recovery state regarding residual impairments and limitations.19
They showed a concordance between the results of the different outcome measures and the self-
reported patient-perceived recovery state despite a non-homogeneous distribution between
TAR (n = 85) and TT arthrodesis (n = 15).
Therefore, the present study aimed at evaluating and comparing the surgical outcome of
TAR, TTC, and TT arthrodeses by considering 3 PROMS (SF-12, FAOS and FFI), a general
satisfaction percentage, and a self-reported classification measuring whether the patient can
cope with ongoing symptoms or limitations [i.e.: 1. Recovered-Resolved (R-R); 2. Recovered,
not Resolved (R-NR); 3. Not Recovered (NR)]. Three hypotheses were tested in this study.
First, it was expected that R-R patients would obtain high satisfaction scores and present no or
low difficulties in performing activities of daily living (ADL), that R-NR patients would have
midrange satisfaction and difficulties in performing ADLs, and that NR patients would report
low satisfaction and high difficulties in performing ADLs. Secondly, TAR patients would report
higher satisfaction, and no or lower difficulties in performing ADLs compared to TT or TTC
patients. Finally, it was expected that R-R group would be composed of a majority of TAR
patients.
MATERIALS & METHODS
Study Design and Sampling
Participants in this study were all operated in the same hospital by 2 senior orthopaedic foot
and ankle surgeons between April 2010 and March 2017. Patients were eligible to take part in
this study if they had (1) undergone TAR, TTC or TT for post-fracture ankle osteoarthritis (PF
OA), ankle osteoarthritis due to chronic ankle instability (Insta OA) and idiopathic ankle
osteoarthritis (Idiop OA), (2) a minimum of 12 months follow-up, (3) 18 years of age or older
and (4) the ability to complete the requested survey. Patients suffering from inflammatory
arthritis (lupus, haemochromatosis, rheumatoid arthritis), diabetic osteoarthropathy and
neurological diseases were excluded from this study. The rationale for this exclusion criteria is
that differences in issues of importance have been found between foot surgery patients with and
without rheumatoid arthritis.24 Based on these criteria, potential eligible patients were contacted
by phone. Criteria to take part in this study were explained and consent was obtained prior to
the study. A survey was then sent to them for completion. The study was approved by the local
ethics committee.

22
Survey Content
Demographic items: Patients were asked to provide demographic data including age,
gender, height, weight, and actual or last professional occupation which was classified as
physical (farmer, plumber, ...) or sedentary (secretary, accountant, ...) activity (Table 2.1).
Self-reported Recovery State: Patients were then asked to select one of the three statements
that best described their self-perceived recovery state.3,19 Patients classified themselves as
‘Recovered-Resolved’ (R-R) [i.e.: I’m better with no symptoms or residual effects],
‘Recovered, Not Resolved’ (R-NR) [i.e.: I’m better but I experience some residual effect.
Nevertheless, I have figured out ways to avoid them or can cope/live with them] and ‘Not
Recovered’ (NR) [i.e.: I’m not better at this point in time].
Satisfaction: Overall satisfaction was evaluated postoperatively based on 3 items: (1) ability
to perform daily activities; (2) symptom relief defined by the fact that the ankle can be forgotten;
and (3) decreased physical pain. Patients were asked to rate these items on a 5-point scale (i.e.:
0 = very dissatisfied; 1 = dissatisfied; 2 = neither satisfied nor dissatisfied; 3 = satisfied, as
expected; 4= very satisfied, better than expected).3,24
Functional Status: To assess functional abilities, patients were asked postoperatively to
complete the Foot Functional Index (FFI) which is a reliable and valid scale to evaluate the
effectiveness of a treatment in patients with conditions affecting the foot and ankle.5,20,25 This
score was rated by postoperative TAR and TT patients as the most likely to change due to
surgery compared to frequently used PROMS such as AOS, AOFAS, LEFS, WOMAC and
SFMA.18 The Foot Function Index is scored from 0 to 100, with a lower score representing a
better outcome. In addition, the FFI was completed by 3 additional criteria from the Foot and
Ankle Outcome Scale (FAOS) relating to symptoms (swelling and stiffness) and pain
frequency.8,21 The FAOS is scored from 0 to 100, with a higher score representing better scores.
Health Status: To measure health-related quality of life, patients completed postoperatively
the Short Form-12 version (SF-12). This questionnaire consisted of twelve questions measuring
8 health domains to assess physical and mental health.11,14,27 High scores represent better mental
and physical health. SF-12 was found to be a satisfactory psychometrical tool for the
assessment of health-related quality of life in patients suffering from end-stage ankle

23
osteoarthritis and their related surgical treatments.12,14,16 Moreover, the physical component of
SF-12 is strongly correlated with the physical component of the SF-36 which is well supported
by evidence of reliability, validity, and responsiveness for patients suffering from ankle
osteoarthritis.12,14
Statistical Analysis
The skewness and kurtosis scores were calculated and compared to the results of the
ShapiroWilk tests to determine whether the variables were normally distributed. If
discrepancies were found between the results for the same variable, data was plotted to make
an informed decision about the (non-) normality of the data. Depending on the data distribution,
the one-way ANOVA test (normal distribution) or the Kruskal-Wallis test (non-normal
distribution) were used to determine if there were any statistical difference for each variable
between the 3 surgical procedures and the 3 self-reported recovery groups. In the case of normal
distribution, if a significant difference was found for a variable between the 3 surgical procedure
groups, the Gabriel’s post hoc test was used to indicate groups’ differences as group sizes were
slightly unequal [i.e.: TAR (n = 51) ; TTC (n = 51) ; TT (n = 50)]. However, in the case of
normal distribution, if a significant difference was found for a variable between the 3 recovery
groups, Games-Howell’s post hoc test was performed to detect groups’ differences as sample
sizes were unequal [i.e.: R-R (n = 75) ; R-NR (n = 62) ; NR (n = 15)]. In the case of non-normal
distribution, if a significant difference was found between groups, Dunn’s post hoc test was
carried out on each pair of groups. To test the third hypothesis in this study, Pearson’s chi
square test was used to determine if there is a significant association between the self-reported
recovery state and the surgical procedure groups. Statistical significance was set at P ≤ .05 and
the SPSS Statistics software (Version 25) was used to analyse data (SPSS Inc., Chicago, Illinois,
USA).
RESULTS
Sample Description
Searching the foot and ankle registry of our department identified two hundred fourteen
eligible patients. Inspection of the visit notes allowed us to exclude 24 participants due to death
(n=3) and invalid contact details (n=21). In addition, two participants refused to participate in
the study. Of the 188 participants who consented to participate, 152 participants (TAR n=51;

24
TTC n=51; TT n=50) completed and responded accurately to the questionnaire, representing
80% valid response rate.
The final sample (n= 152; 51.3% female) had a mean age of 62.5 ± 12 years (mean±SD)
and had a mean body mass index of 28.5 ± 5.5 kg/m2. The preoperative diagnosis was post-
fracture osteoarthritis (PF OA) in 107 (70.4%) ankles, osteoarthritis due to chronic ankle
instability (Insta OA) in 30 (19.7%) ankles and idiopathic osteoarthritis (Idiop OA) in 15 (9.9%)
ankles (Table 2.1 & 2.2). Professional activities were classified as sedentary in 63.8% of the
participants. The mean postoperative follow-up duration was 46 ± 20.8 months (Tables 2.1 &
2.2).
Sample Description by Recovery Group
There was a significant difference in patient’s age between the self-reported recovery
groups [F(2, 149) = 8.23, P < .001, ω = 0.29] ; R-R group was significantly older than the R-
NR group (P = .002) and the NR group (p = .009). No statistical difference was found for age
between the R-NR group and the NR group. There was also no significant difference in BMI
[H(2) = 3.38, P = .184] and in follow-up duration [H(2) = .154, P = .926] between recovery
groups (Table 2.1). No significant association was observed between the preoperative diagnosis
and the self-reported recovery groups (χ² (4) = 2.78, P = .596).
Sample Description by Surgical Procedure
There was a significant difference in patients’ age between the surgical procedures [F(2,
149) = 12.08, P < .001, ω = .36]; TT patients were significantly younger than TAR (p < .001)
and TTC patients (P = .028) (Table 2.2). No significant difference in BMI was observed
between the three types of interventions [H(2) = 5.44, P = .066]. However, there was a
significant difference in follow-up duration between the different types of surgery [H(2) =
17.49, P < .001] ; TAR patients had a significant longer follow-up duration (55.7 ± 21.3) than
TTC patients (44.5 ± 21.3; P = .025, r = .21), and TT patients (37.7 ± 15.5; P < .001, r = .33)
(Table 2.2). A significant association was found between the preoperative diagnosis and the
types of surgical procedures (χ² (4) = 17.07, P = .002).

25
Table 2-1 : Demographic description by recovery groupa
R-R
(n=75 ; 49.3%)
R-NR
(n=62 ; 40.8%)
NR
(n=15 ; 9.9%)
Total Sample
(n = 152 ; 100%)
Gender (n, % F) 33 (44%) 33 (53.2%) 12 (80%) 78 (51.3%)
Age (Y) *,*** 66.3 ± 10.8 (36-85) 59.3 ± 12.6 (30-85) 57.1 ± 9.6 (42-72) 62.5 ± 12 (30-85)
Prof (n, % Sed) 48 (64%) 37 (59.7%) 12 (80%) 97 (63.8%)
BMI 27.9 ± 4.7 29.5 ± 6.3 27.2 ± 5.52 28.5 ± 5.51
Follow-up (months) 46.5 ± 20.9 (13-96) 45.5 ± 21.1 (14-93) 45.9 ± 20.5 (13-68) 46.0 ± 20.8 (13-96)
Pre-operative
diagnosis
PF OA (n, %) 50 (66.7%) 45 (72.6%) 12 (80%) 107 (70.4%)
Insta. OA (n, %) 17 (22.7%) 10 (16.1%) 3 (20%) 30 (19.7%)
Idiop. OA (n, %) 8 (10.7%) 7 (11.3%) 0 (0%) 15 (9.9%)
Abbreviations: *, significant difference between R-R and R-NR ; ***, significant difference between R-R and NR
; R-R, Recovered- Resolved ; R-NR , Recovered, Not Resolved ; NR, Not Recovered ; F, female ; Y, year ; Prof,
profession ; Sed, Sedentary ; BMI, Body Mass Index ; M, Months ; PF OA, Post-Fracture Ankle Osteoarthritis ;
Insta. OA, Ankle osteoarthritis due to chronic ankle instability ; Idiop OA, Idiopathic ankle osteoarthritis. aUnless otherwise stated, values refer to mean ± standard deviation (range).
Table 2-2 : Demographic description by surgical procedurea
TAR
(n=51)
TTC
(n=51)
TT
(n=50)
Total Sample
(n = 152)
Gender (n, % W.) 29 (56.9%) 22 (43.1%) 27 (54%) 78 (51,3%)
Age (Y) **, *** 67.8 ± 11.2 (41-85) 62.7 ± 10.3 (38-81) 56.9 ± 12 (30-83) 62.5 ± 12 (30-85)
Prof (n, % Sed) 37 (72.5%) 29 (56.9%) 31 (62%) 97 (63.8%)
BMI 28.3 ± 4.4 29.91 ± 6.6 27.2 ± 5.0 28.48 ± 5.5
Follow-up
(months) *, ***
55.7 ± 21.3 (16-96) 44.5 ± 21.3 (13-90) 37.7 ± 15.5 (13-66) 46 ± 20.8 (13-96)
Pre-operative
diagnosis
PF OA (n, %) 42 (82.4%) 27 (52.9%) 38 (76%) 107 (70.4%)
Insta. OA (n, %) 3 (5.8%) 19 (37.3%) 8 (16%) 30 (19.7%)
Idiop. OA (n, %) 6 (11.8%) 5 (9.8%) 4 (8%) 15 (9.9%)
Abbreviations: *, significant difference between TAR and TTC arthrodesis ; **, significant difference between
TTC and TT arthrodesis ; ***, significant difference between TAR and TT arthrodesis ; TAR, Total Ankle
Replacement ; TTC, Tibio-talo-Calcaneal arthrodesis ; TT, Tibiotalar arthrodesis ; F, female ; Y, year ; Prof,
profession ; Sed, Sedentary ; BMI: Body Mass Index ; M, Months ; PF OA, Post-Fracture Ankle Osteoarthritis ;
Insta. OA, Ankle Osteoarthritis due to chronic Ankle Instability ; Idiop OA, Idiopathic Ankle Osteoarthritis. aUnless otherwise stated, values refer to mean ± standard deviation (range).

26
Difference in Health-Related Outcome Measures Across Recovery Groups
Satisfaction: There was a significant difference in satisfaction score between the self-
reported recovery groups [H(2) = 107.85, P < .001]; R-R group had overall a higher satisfaction
rate compared to R-NR group (P < .001, r = .68) and to NR group (P < .001, r = .66). R-NR
group showed also higher satisfaction rate than NR group (P = .008, r = .24) (Table 2.3 &
Figure 2.1).
Functional status: There was a significant difference between the recovery groups in FAOS
score [H(2) = 61.002, P < .001]; planned comparison showed that R-R group had a higher
FAOS score compared to R-NR group (P < .001, r = .55) and NR group (P < .001, r = .45). A
significant difference was also found in FFI score between the recovery groups [H(2) = 88.58,
P < .001]; significant differences were observed between R-R and R-NR (P < .001, r = -.63),
R-R and NR (P < .001, r = -.59), and R-NR and NR groups (P = .029, r = -.21) with lower
scores achieved by R-R patients, followed by R-NR and NR patients.
Health Status: Significant differences were found in the SF-12 PC [F(2, 149) = 39.48, P <
.001, ω = .58] and in the SF-12 MC [F(2, 149) = 23.21, P < .001, ω = .48] between the self-
reported recovery groups. Games-Howell post-hoc tests revealed that there were highly
significant differences between every self-reported recovery group for both SF-12 sub-scores
(P < .001). P-value only differed between R-NR and NR groups for the SF-12 MC (P = .002)
(Table 2.3 & Figure 2.1).
In agreement with the first hypothesis, the three recovery groups displayed postoperatively
a logical gradient of satisfaction, FFI, SF-12 PC and SF-12 MC scores (except for the FAOS)
with the better results achieved by R-R patients, followed by R-NR and NR patients (Table
2.3).
Figure 2.1 : Satisfaction & health-related outcome measures by recovery group

27
Table 2-3 : Description of surgical procedure groups and outcome measures by recovery groupa
R-R
(n=75)
R-NR
(n=62)
NR
(n=15)
Total Sample
(n = 152)
TAR 31 (41.3%) 17 (27.4%) 3 (20%) 51 (33.6%)
TTC 24 (32%) 23 (37.1%) 4 (26.7%) 51 (33.6%)
TT 20 (26.7%) 22 (35.5%) 8 (53.3%) 50 (32.9%)
Satisfaction *,**,*** 92.6% ± 9.2 60.9% ± 16.5 26.1% ± 14.7 73.1% ± 25.3
FAOS *,*** 78.4 ±18.3 48.5 ± 23.5 36.3 ± 22.8 62.0 ± 266
FFI *,**,*** 15.6 ± 12.8 47.4 ± 21.9 74.2 ± 111 34.4 ± 26.2
SF-12 PC *,**,*** 44.7 ± 8.5 35.4 ± 7.3 29.4 ± 3.5 39.4 ± 9.4
SF-12 MC *,**,*** 50.7 ± 8.3 43.7 ± 10.7 34.2 ± 8.1 46.2 ± 10.6
Abbreviations: *, significant difference between R-R and R-NR ; **, significant difference between R-NR and NR
; ***, significant difference between R-R and NR ; R-R, Recovered- Resolved ; R-NR , Recovered, Not Resolved
; NR, Not Recovered ; TAR, Total Ankle Replacement ; TTC, Tibio-talo-Calcaneal arthrodesis ; TT, Tibiotalar
arthrodesis ; FAOS, Foot and Ankle Outcome Score ; FFI, Functional Foot Index ; SF-12, Short Form-12 ; PC,
Physical Component ; MC, Mental Component. aUnless otherwise stated, values refer to mean ± standard deviation (range).
Difference in Health-Related Outcome Measures Across Surgical Procedure
Groups
Satisfaction: There was a significant difference between the three different surgical
procedures in satisfaction score [H(2) = 9.09, P = .011]. TAR patients were significantly more
satisfied than TT patients (P = .009, r = .24). In contrast, TAR patients showed no significantly
higher satisfaction rates compared to TTC patients. One could also observe a trend in mean
satisfaction score decreasing gradually between the TAR (80.7% ± 22.5), the TTC (71.3% ±
26.9) and the TT (67.2% ± 24.9) groups (Table 2.4 & Figure 2.2).
Functional Status: There was no significant difference in the FAOS score between the
surgical procedures [H(2) = 3.96, P = .14]. However, TAR patients seem to score better at the
FAOS score (67.3 ± 18.9) than TTC patients (63.5 ± 27.4) and TT arthrodesis (55.2 ± 31.1).
Planned comparisons indicated a significant difference [H(2) = 7.74, P = .021] in FFI scores
between the three surgical procedure groups. TAR patients showed a lower FFI score compared
to TT patients (P = .02 , r = -.23).

28
Figure 2.2 : Outcome measures by surgical procedure
Health Status: No significant difference was observed between the different surgical
procedures in SF-12 PC [H(2) = 1.53, P = .465] and SF-12 MC scores [F(2, 149) = 1.13, P =
.33]. However, results displayed a gradual decrease for both scores between the three surgical
procedure groups with better results achieved by TAR patients, followed by TTC patients and
TT patients (Table 2.4 & Fig. 2).
Therefore, the second hypothesis was not demonstrated as almost none of the above
described results were significant. However, a general trend can be observed as TAR patients
showed better PROMS scores and satisfaction results compared to TTC and TT patients.
Table 2-4 : Description of recovery group and outcome measures by surgical procedurea
TAR
(n=51)
TTC
(n=51)
TT
(n=50)
Total Sample
(n = 152)
R-R (n, %) 31 (60.8%) 24 (47.1%) 20 (40%) 75 (49.3%)
R, NR (n, %) 17 (33.3%) 23 (45.1%) 22 (44%) 62 (40.8%)
NR (n, %) 3 (5.9%) 4 (7.8%) 8 (16%) 15 (9.9%)
Satisfaction *** 80.7% ± 22.5 71.3% ± 26.9 67.2% ± 24.9 73.1% ± 25.3
FAOS 67.3 ± 18.9 63.5 ± 27.4 55.2 ± 31.1 62.0 ± 26.6
FFI *** 27.0 ± 22.2 33.3 ± 25.4 43.1 ± 28.6 34.4 ± 26.2
SF-12 PCb 40.5 ± 8.9 39.0 ±9.0 38.7 ± 10.4 39.4 ± 9.4
SF-12 MCc 47.6 ± 8.9 46.6 ± 11.7 44.47 ± 11.0 46.2 ± 10.6
Abbreviation: ***, significant difference between TAR and TT arthrodesis ; TAR, Total Ankle Replacement ; TTC,
Tibio-talo-Calcaneal arthrodesis ; TT, Tibiotalar arthrodesis ; R-R, Recovered- Resolved ; R,NR , Recovered, Not Resolved ;
NR, Not Recovered ; FAOS, Foot and Ankle Outcome Score ; FFI, Functional Foot Index ; SF-12, Short Form-12 ; PC,
Physical Component ; MC, Mental Component. aUnless otherwise stated, values refer to mean ± standard deviation (range).

29
Association between Surgical Procedures and Recovery Groups
There was no significant association between the types of surgery and the recovery
groups (χ² (4) = 6.28, P = .18) meaning that the last hypothesis of this study was not
demonstrated. However, it appeared that R-R group was composed of a higher number of TAR
patients. In contrast, half of the NR group was composed of TT patients. (Figure 2.3).
Figure 2.3 : Surgical procedures by recovery group
DISCUSSION
This study aimed at assessing the surgical outcomes of three common procedures (TAR,
TTC, and TT) to treat end-stage ankle osteoarthritis by attempting to capture patients’
perception of their sense of recovery. As expected, there was a concordance between the
patient’s self-reported recovery state, satisfaction, and PROMS scores. However, no clear
difference in outcome scores was found to favour a surgical procedure over another.
The present study has attempted to emphasize the importance of patient satisfaction and
self-reported recovery state while evaluating surgical outcome. In contrast to traditional
outcome measures of a surgical procedure, patients’ recovery state is not only reflected in
changes or resolution of the state of a disease (end-stage ankle osteoarthritis), but could also be
described as an adjustement to the way of life or an adaptation to live with the disorder.4 In
addition, the perception of recovery is highly contextualized and influenced by many factors
such as age, the ability to resume work or to cope with functional limitations, carefully selecting
and resuming leisure activities, and many others.4,17 This indicates that two patients could mean

30
different things while saying that they have recovered from their surgery. Therefore, it is
essential that health professionals understand the full impact of a disease on a patient’s life in
order to completely understand what recovery means for him following surgery while
evaluating surgical outcomes.
Three main hypotheses were tested in this study. Our first hypothesis is in agreement
with previous evidence as a concordance was demonstrated between the patients’ self-reported
recovery state, satisfaction, and PROMS scores.19 Interestingly, a notable difference in the
distribution of participants in the three self-reported recovery groups was found compared to
the findings of Pinsker et al. (2016). In contrast to their results, the percentage of ‘Recovered-
Resolved’ patients (50%) was three times higher in the present study. A possible explanation
might be that patients received a more thorough explanation prior to surgery about potential
functional limitations related to their surgery, and therefore, might adapt better their functional
expectations prior to surgery decreasing the risk of becoming disappointed. Consequently, they
might cope better with their recovery state and potential functional limitations experienced
postoperatively. The authors strongly believe that capturing patients’ expectations and
functional issues prior to surgery is a key element to obtain effective surgical outcomes.2
However, it is difficult to develop questions that appropriately capture patients’ expectations in
all clinical conditions; the “one measure for all” approach adopted by many may not be
appropriate as issues of importance differs from one patient to another.
Secondly, it was not demonstrated that the TAR group would obtain a higher satisfaction
percentage and no or limited difficulties in performing ADLs compared to TTC and TT groups
(except for satisfaction and FFI scores between TAR and TT groups). In fact, from a surgical
point of view, it was expected that TAR group would have better PROMS scores than TTC
and TT groups as TAR is a motion-sparing surgery. Surprisingly, our results revealed that
preserving ankle motion does not statistically increase patient satisfaction and PROMS scores.
Nonetheless, a general trend can be observed as overall, TAR patients seem to have better
satisfaction and PROMS scores compared to TTC and TT patients. However, this trend can
potentially be explained by the mean age of each surgical group. TAR patients (67.8 ± 11.2)
were older than TT (56.9 ± 12) and TTC patients (62.7 ± 10.3). Studies have already
demonstrated that satisfaction following a surgery increases with age.2,6,23 Consequently, one
could argue that better results can be observed in TAR patients as they were older than TTC
and TT patients.
The third hypothesis was also not demonstrated. No statistical difference was found
suggesting that a higher number of TAR patients would classify themselves as ‘Recovered-

31
Resolved’ (R-R) group compared to TT and TTC patients. Based on these results, one may
conclude that the motion sparing procedure is not more likely to result in a ‘Recovered-
Resolved’ self-reported recovery state over the two types of arthrodesis procedures. However,
a general trend can be observed, and it appears that there were more TAR patients in the R-R
group and a higher number of TT patients in the NR group. This trend can be explained by
various factors including age and expectations. In fact, TT patients were younger than the two
other groups, meaning that they might have more difficulties in adapting their behaviours and
daily activities. This resilient behaviour to adapt at a younger age was described by Baltes’s
(1990) theory of selective optimization with compensation (SOC).3 His theory is related to
strategies to cope with age-related changes such as ‘selecting fewer, but important goals, pursue
these goals in an optimized way, and by doing so, apply adequate compensatory means to
overcome internal or external barriers’.10 In this perspective, patient’s expectations are
adjusted to permit the subjective experience of satisfaction. Based on this theory, one could
argue that older patients can more easily adopt these strategies in contrast to younger patients,
who could be more resilient to changes. Moreover, in their study, Gignac, Cott & Badley (2002)
have shown that older adults with osteoarthritis used more often compensation strategies (i.e.:
‘efforts to meet goals by new means’) in contrast to younger adults who tend to use optimization
strategies (i.e.: ‘efforts to augment or enrich one’s reserves in order to continue functioning’).13
Therefore, these differences in strategies to cope with changes will impact their sense of
limitations and satisfaction following surgery. Furthermore, our results showed that R-R
patients were older than R-NR patients (P = .002), and NR patients (P = .009). One may
therefore conclude that the results of the present study agreed well with previous studies
demonstrating the relationship between age and satisfaction following surgery.2,6,23
Another explanation might be that patients who underwent a TTC arthrodesis in contrast
to TT arthrodesis had lower functional expectations. Ajis et al. (2013) have reported that fewer
TT patients met their desired activity level after surgery compared to TTC patients. They also
found that TT patients were also much more likely to attribute their unmet level of activity to
their operated ankle compared to TTC patients.2 Evidence suggested that patients who
underwent TTC arthrodesis must go through a longer period of convalescence and might
therefore consider their surgery more ‘seriously’ as the TT arthrodesis is extended to the
subtalar joint. Consequently, it might be easier for them to meet their expectations following
surgery in contrast to patients who underwent TT arthrodesis.2 The present results provide
further evidence that TT patients had lower satisfaction rates and PROMS score which appeared
to be mostly prevalent in the ‘Not-Recovered’ group.

32
One of the strengths of this study was the ability to include and analyse the surgical
indications, which were divided into 3 groups: post-fracture ankle osteoarthritis, ankle
osteoarthritis due to chronic ankle instability, and idiopathic ankle osteoarthritis. Results have
shown that there were no significant associations between the patient-perceived recovery state
and the surgical indications (P = .596), which excludes the idea that surgical outcomes were
influenced by preoperative diagnosis discrepancies.
This study has some limitations. First, the present study was a retrospective study with
the limitation that no PROMS scores were collected prior to surgery. Second, one might argue
that the high level of satisfaction in this study could potentially be explained by a biased sample
selection underlying that unsatisfied patients would not agree to engage in this study. However,
only 2 patients have explicitly refused to take part in the study. Finally, PROMS were composed
of closed questions forcing patients to give an answer that does not accurately represent their
opinion. However, this shortcoming was partially tackled by being able to classify themselves
in one of the three self-perceived recovery statements.
CONCLUSION
This study provides a first attempt in assessing and comparing surgical outcomes following
TAR, TTC, and TT arthrodeses by capturing patients’ perception of their sense of recovery. An
unexpected finding was that R-R group was not exclusively composed of TAR patients.
Evidence suggests that patients with a TT or a TTC arthrodesis could also classify themselves
as ‘being better with no residual limitations’. However, to obtain a positive surgical outcome,
it appears that it is crucial to improve the patient - doctor communication, especially with
younger patients. They have higher expectations prior to surgery and different ways of coping
with functional limitations than older patients. Consequently, a patient’s concerns and
expectations should be considered prior to surgery in order to meet the patient’s expectations
and to avoid patient’s misconceptions of surgical outcomes.

33
REFERENCES
1. Agel J, Coetzee JC, Sangeorzan BJ, Roberts MM, Hansen ST. Functional limitations of
patients with end-stage ankle arthrosis. Foot Ankle Int. 2005;26(7):537-539.
2. Ajis A, Tan K, Myerson MS. Ankle Arthrodesis vs TTC Arthrodesis: Patient Outcomes,
Satisfaction, and Return to Activity. Foot Ankle Int. 2013;34(5):657-665.
3. Baltes PB, Baltes MM. Psychological perspectives on successful aging: The model of
selective optimization with compensation. In Baltes PB, Baltes MM (Eds.) Successful
Aging: A Psychological Model. New York, USA Cambridge University Press 1990:1-
34.
4. Beaton DE, Tarasuk V, Katz JN, Wright JG. “ Are You Better ?” A Qualitative Study of
the Meaning of Recovery. Arthritis Rheum. 2001;45(3):270-279.
5. Budiman-Mak E, Conrad J, Roach K. The Foot Function Index : a Measure of Foot Pain
and Disability. J Clin Epidemiol. 1991;44(6):561-570.
6. Cohen G. Age and health status in a patient satisfaction survey. Soc Sci Med.
1996;42(7):1085-1093.
7. Deleu P-A, Devos Bevernage B, Gombault V, Maldague P, Leemrijse T. Intermediate-
term Results of Mobile-bearing Total Ankle Replacement. Foot Ankle Int.
2015;36(5):518-530.
8. Domsic RT, Saltzman CL. Ankle osteoarthritis scale. FOOT ANKLE Int.
1998;19(7):466-471.
9. Ewalefo SO, Dombrowski M, Hirase T, et al. Management of Posttraumatic Ankle
Arthritis: Literature Review. Curr Rev Musculoskelet Med. 2018;11(4):546-557.
10. Freund AM, Baltes PB. The orchestration of selection, optimization, and compensation:
An action-theoretical conceptualization of a theory of developmental regulation. In:
Control of Human Behavior, Mental Processes, and Consciousness; Lawrence Erlbaum
Associates Inc; 2000:35-58.
11. Gandek B, Ware JE, Aaronson NK, et al. Cross-Validation of Item Selection and Scoring
for the SF-12 Health Survey in Nine Countries : Results from the IQOLA Project. J Clin
Epidemiol. 1998;51(11):1171-1178.
12. Gandhi SK, Warren Salmon J, Zhao SZ, Lambert BL, Gore PR, Conrad K. Psychometric
evaluation of the 12-Item Short-Form Health Survey (SF-12) in osteoarthritis and
rheumatoid arthritis clinical trials. Clin Ther. 2001; 23(7):1080-1098.

34
13. Gignac MAM, Cott C, Badley EM. Adaptation to disability: Applying selective
optimization with compensation to the behaviors of older adults with osteoarthritis.
Psychol Aging. 2002;17(3):520-524.
14. Hurst NP, Ruta DA, Kind P. Comparison of the MOS short form-12 (SF12) health status
questionnaire with the SF36 in patients with rheumatoid arthritis. Br J Rheumatol.
1998;37(8):862-869.
15. Leemrijse T, Besse J-L, Devos Bevernage B, Valtin B. Pathologie Du Pied et de La
Cheville. 2e édition. Elsevier Masson; 2015.
16. Nodzo SR, Miladore MP, Kaplan NB, Ritter C a. Short to midterm clinical and
radiographic outcomes of the Salto total ankle prosthesis. Foot Ankle Int. 2014;35(1):22-
29.
17. Parker J, Nester CJ, Long AF, Barrie J. The problem with measuring patient perceptions
of outcome with existing outcome measures in foot and ankle surgery. Foot Ankle Int.
2003; 24(1):56-60.
18. Pinsker E, Inrig T, Daniels TR, Warmington K, Beaton DE. Reliability and Validity of
6 Measures of Pain , Function , and Disability for Ankle Arthroplasty and Arthrodesis.
Foot Ankle Int. 2015;36(6):617-625.
19. Pinsker E, Inrig T, Daniels TR, Warmington K, Beaton DE. Symptom Resolution and
Patient-Perceived Recovery Following Ankle Arthroplasty and Arthrodesis. Foot Ankle
Int. 2016;37(12):1269-1276.
20. Pourtier-piotte C, Pereira B, Soubrier M, Thomas E, Gerbaud L, Coudeyre E. French
validation of the Foot Function Index (FFI). Ann Phys Rehabil Med. 2015;58(5):276-
282.
21. Roos EM, Brandsson S, Karlsson J. Validation of the foot and ankle outcome score for
ankle ligament reconstruction. Foot Ankle Int. 2001; 22(10):788-794.
22. Saltzman CL, Zimmerman B, O’Rrourke M, Brown T, Buckwalter J, Johnston R. Impact
of comorbidities on the management of Health in Patients with Ankle Osteoarthritis. J
Bone Jt Surg. 2006;88(11):2366-2372.
23. Schuh R, Hofstaetter J, Krismer M, Bevoni R, Windhager R, Trnka H-J. Total ankle
arthroplasty versus ankle arthrodesis. Comparison of sports, recreational activities and
functional outcome. Int Orthop. 2012;36(6):1207-1214.
24. Vallier GT, Petersen SA, LaGrone MO. The Keller resection arthroplasty: A 13-year
experience. Foot Ankle. 1991;11(4):187-194.

35
25. Venditto T, Tognolo L, Rizzo RS, et al. 17-Italian Foot Function Index with numerical
rating scale: Development, reliability, and validity of a modified version of the original
Foot Function Index. Foot. 2015;25(1):12-18.
26. Venkataramanan V, Gignac MA, Dunbar M, et al. The importance of perceived
helplessness and emotional health in understanding the relationship among pain ,
function, and satisfaction following revision knee replacement surgery. Osteoarthr
Cartil. 2013;21(7):911-917.
27. Ware JE, Kosinski M, Keller SD. A 12-Item Short-Form Health Survey: Construction of
Scales and Preliminary Tests of Reliability and Validity. Source Med Care Med
CARE.1996;34(3):220-233.
28. Younger ASE, Wing KJ, Glazebrook M, et al. Patient Expectation and Satisfaction as
Measures of Operative Outcome in End-Stage Ankle Arthritis : A Prospective Cohort
Study of Total Ankle Replacement Versus Ankle Fusion. Foot Ankle Int.
2015;36(2):123-134.

36
Chapter 3 : Change in gait biomechanics after total ankle
replacement and ankle arthrodesis: a systematic review and
meta-analysis
Paul-André Deleu1,2, Jean-Luc Besse1,3, Alexandre Naaim1, Thibaut Leemrijse2,
Ivan Birch4, Bernhard Devos Bevernage2, Laurence Chèze1
1Univ Lyon, Université Claude Bernard Lyon 1, IFSTTAR, LBMC UMR_T9406, F69622, 43 Boulevard du
11 novembre 1918, 69622 Villeurbanne, France
2Foot & Ankle Institute, 5 Avenue Ariane, 1200 Woluwe-Saint-Lambert, Belgium
3Hospices Civils de Lyon, Centre Hospitalier Lyon-Sud, Service de Chirurgie Orthopédique et
Traumatologique, 69495 Pierre-Bénite Cedex, France
4Sheffield Teaching Hospitals NHS Foundation Trust, Woodhouse Clinic, 3 Skelton Lane, Sheffield S13
7LY, United Kingdom
This manuscript was submitted online the 25th September 2019 and is presently being
given full consideration for publication in Clinical Biomechanics journal.

37
ABSTRACT
Background: The aim of this systematic review with meta-analysis was to determine the
change in gait biomechanics after total ankle replacement and ankle arthrodesis for end-stage
osteoarthritis.
Methods: Electronic databases were searched up until May 2019. Peer-reviewed journal
studies including adult participants suffering from end-stage ankle osteoarthritis and reporting
pre- and post-operative kinematics, kinetics and spatio-temporal effects of total ankle
replacement and ankle arthrodesis during walking were included. Seventeen suitable studies
were identified and assessed according to methodological and biomechanical qualities. Meta-
analysis was performed by calculating the effect size using standard mean differences between
pre- and post-operative gait status.
Findings: Seventeen studies with a total of 883 patients were included. Meta-analysis
revealed a significant improvement in lower limb kinematics, kinetics and spatio-temporal
parameters after total ankle replacement. However, no significant effect on maximum ankle
plantarflexion, knee and hip range of motion and cadence was found for fixed-bearing
prosthesis. Improvement in gait biomechanics after ankle arthrodesis was limited to ankle
moment, hip range of motion and walking speed.
Interpretation: The currently available evidence base of research papers evaluating changes
in gait biomechanics after total ankle replacement and ankle arthrodesis is limited by a lack of
prospective research, low sample sizes and heterogeneity in the patho-etiology of ankle
osteoarthritis. Following total ankle replacement for end-stage ankle osteoarthritis,
improvements were demonstrated for spatio-temporal, kinematic and kinetic gait patterns
compared to the pre-operative measrures. Improvements in gait mechanics after ankle
arthrodesis were limited to walking speed, ankle moment and hip range of motion.
Keywords: Osteoarthritis; Ankle replacement; Arthroplasty; Arthrodesis; Gait Analysis;
Biomechanics
38
INTRODUCTION
Osteoarthritis (OA) of the ankle is a common chronic disorder characterized by progressive
joint degeneration, significant pain and disability, with approximately 1% of the world’s adult
population living with symptomatic ankle OA.1,14,21,33,42 Currently, the “gold standard” surgical
treatment is ankle arthrodesis (AA), which provides good pain relief and a relatively well-
documented long-term survivalship of AA.15,16,23,46,47 However, AA leads to deficits in work
and leisure activities and to adjacent joint degeneration,4,12,20,34,53 thought to be a consequence
of altered mechanical loads as a result of the change in function of the ankle.4,6,12,20 These
disadvantages have encouraged the use of motion-sparing procedures such as total ankle
replacement (TAR), the potential benefits of which are conserving the existing pre-operative
ankle range of motion (RoM), improving gait and protecting the adjacent joints5,10,27, although
the latter has not yet been proven.35
Three-dimensional gait analysis (3DGA) is the state of the art of measuring lower limb joint
kinematics and kinetics simultaneously during activities of the daily living. Three narrative
reviews of the literature showed that 3DGA has considerable potential for evaluating functional
outcomes of TAR and AA aimed at improving function at the foot and lower limb.3,29,36
However, these papers did not assess the treatment effect of the procedures, which raises
questions regarding the evidence supporting the biomechanical value of TAR and AA in
patients suffering from end-stage ankle OA. The relative advantages of TAR versus AA
continue to be one of the most debated topics in foot and ankle surgery. Do TAR patients
maintain or improve their pre-operative dorsi-/plantarflexion ankle motion during gait? Do
TAR and AA patients improve their foot mechanics relative to their pre-operative state? The
debate also continues as to which ankle prosthesis design should be used to provide the best
clinical outcome, the evidence from the TAR group overall being unclear. The objective of this
review is to present a quantitative assessment of the scientific credibility and clinical utility of
the present knowledge regarding the assessment of the biomechanical effect of TAR and AA in
patients suffering from end-stage ankle OA.
METHODS
The systematic review protocol was developed in accordance to the guidelines provided by
the Preferred Reporting of Systematic Reviews and Meta-Analysis (PRISMA) Statement.30 The
protocol for the review was registered in the International Prospective register for Systematic
Reviews (PROSPERO; registration no. CRD42018110053).

39
Search strategy
The Population, Intervention, Comparison and Outcome (PICO) framework was used to
define the search strategy. The following databases were searched from inception: Cochrane
Library, PubMed and Web of Science (via ISI Web of Knowledge) (until May 2019). The three
main groups of keywords covering all MeSH terms and keywords related to “ankle
osteoarthritis”, “biomechanical and locomotion metrics” and “ankle arthrodesis / ankle
prosthesis” were used in this review (example for PubMed in Figure 3.1). Databases were
searched by two reviewers, with agreement required on the number of search hits achieved
before screening was initiated. References and abstracts of studies were stored alphabetically
using the reference management software Mendeley (Elsevier, Netherlands). Additional
relevant papers were found by examining the reference lists of papers identified in the initial
searches. Duplicate references sourced from different electronic searches were removed. The
inclusion and exclusion process was performed by two reviewers (JLB & PAD) based on the
title and abstract of the identified papers. A full-text evaluation was undertaken if the title and
abstract did not provide adequate information. A consensus meeting was held to resolve any
areas of disagreement between reviewers, and the opinion of a 3rd reviewer (AN) was sought if
a consensus was not reached. To affirm the inclusion of all eligible studies, one reviewer (PAD)
subsequently manually screened the reference lists of all included articles.
Eligibility criteria
Studies published in English as full papers were eligible for inclusion in this review when
they met the following criteria: 1) participants were adults aged ≥18 years undergoing primary
TAR and AA; 2) ankle OA was the principal indicator for surgical intervention; 3) studies
reported at least pre-operative and post-operative gait data; 4) a minimum of 12 months follow-
up providing evidence of any pre- to post-operative changes in gait;2,50 5) the use of non-
invasive/in-vivo 3DGA using a motion capture system to collect at least joint kinematic data
based on the trajectories of skin-mounted markers.); and 6) the participants were able to perform
the given task unaided. Studies including participants with a history of other major medical
conditions affecting gait or previous surgery (e.g. neuromuscular diseases, revision lower limb
arthroplasty, etc.) were not eligible for inclusion. Letters, conference proceedings, case reports,
cadaveric studies, bone pin (invasive) studies, abstracts and reviews were excluded from the
review.

40
Figure 3.1 : Pubmed search strategy & flow diagram of search results

41
Methodological quality assessment
A modified version of the Downs and Black Quality Index was used to evaluate the
methodological quality of the selected papers.17 The methodological quality of the papers was
assessed using a subset of the data extracted to gauge both internal and external validity. Two
reviewers (PAD, LC) independently evaluated the quality of each study, and any discrepancies
were resolved during a consensus meeting. The opinion of a 3rd reviewer (AN) was sought if a
consensus could not be reached. The modified version of the Downs and Black Quality Index17
is scored out of 26, with higher scores indicating higher-quality studies. The studies were ranked
using the following classifications: “high quality” (HQ) having scores greater than 21;
“moderate quality” (MQ) having scores between 17 and 21; “fair quality” (FQ) having scores
between14 and 17 and “poor quality” (PQ) having scores lower than 14.13 A Kappa inter-rater
agreement test (Kappa (K) statistic) was used to evaluate the agreement between the two
reviewers (PAD and LC). The K value was interpreted as follows: scores < 0.20 rated as Poor,
scores between 0.21-0.40 rated as Fair, scores between 0.41-0.60 rated as Moderate, scores
between 0.61-0.80 rated as Good, and scores between 0.81-1.00 rated as Very good. Studies
rated as “poor quality” were excluded from the systematic review.
Outcome measures and data extraction
A data-extraction file created in Cochrane Review Manager (RevMan, V.5, Cochrane
Collaboration, Oxford, UK) was used to extract numerical data from all studies by two
reviewers (PAD & AN). Once completed, one of the two reviewers compared the original data
with the extracted data to verify that the data were extracted accurately from the studies included
in the meta-analysis. The primary outcome measures for this review were spatiotemporal,
kinematic and kinetic parameters reported during level walking. Means and standard deviations
(SD) for all gait variables relating to the affected ankle were extracted for pre-operative and the
final post-operative assessments in order to determine the long term effect of surgery on gait
function, as functional recovery can take 6 to 12 months. To assist the interpretation of findings,
one investigator (PAD) extracted data regarding study design, participant characteristics and
publication details.50

42
Data synthesis and analysis
Where adequate data were reported, means and standard deviations (SDs) of the following
gait variables were used to calculate standardized mean differences (SMD and 95% confidence
intervals) between pre- and post-operative assessments using Cochrane Review Manager (V.5)
(RevMan, V.5, Cochrane Collaboration, Oxford, UK): ankle RoM, maximal ankle dorsiflexion
and plantarflexion angle, maximal ankle moment, maximal ankle power, knee RoM, hip RoM,
walking speed, cadence, stance duration and step length. When means and SDs were not
reported by the authors estimations were made using the methodology described by Wan et al.
and medians and interquartile ranges used.51 Meta-analyses were performed by calculating the
effect size using the standardized mean differences, and a random-effects model. Interpretation
of SMD magnitude was based on previous recommendations, where SMD values were
considered large (> 1.2), medium (0,6-1,2) or small (< 0,6). No significant differences were
considered to have been identified from the meta-analysis when the 95% confidence interval
was exceeded 0 (P < 0.05). When appropriate data (e.g. means and SDs) were not provided in
the publication, authors were contacted with a request to provide additional data. In the case of
non-response, the variables were recorded as “not reported” and excluded for further analysis.26
Forest plots were produced using Cochrane Review Manager (V.5) to facilitate the
interpretation of SMD values and their respective 95% Confidence Interval (CI). Results of
studies were pooled if adequate homogeneity was found to occur in terms of research design
and outcome measures. The level of statistical heterogeneity for pooled data was tested by using
a chi-squared test and I2 statistics.25 Heterogeneity was defined as high (>75%), moderate (50-
75%), and low (25-50%).25 When adequate data were reported in the same international system
of units, mean differences (MD and 95% confidence intervals) between pre- and post-operative
time points were calculated.
Evidence-based recommendations
Based on the previous publication of van Tulder et al. (2003), levels of evidence were
assigned for each variable of interest, based on the statistical outcomes and methodological
quality of the included studies.48

43
Levels of evidence-based recommendations (van Tulder et al., 2003) are :
- Strong evidence derived from three or more studies, including a minimum of two high
quality (HQ) studies that are statistically homogenous; may be associated with a
statistically significant or non-significant pooled results.
- Moderate evidence was based on statistically significant pooled results derived from
multiple studies that are statistically heterogeneous, including at least one high quality
study (HQ); or from multiple moderate quality (MQ) or fair quality (FQ) studies which
are statistically homogenous.
- Limited evidence was based on results from one high quality study (HQ) or multiple
moderate (MQ) or fair quality (FQ) studies that are statistically heterogeneous.
- Very limited evidence was based on results from one fair quality study (FQ).
- No evidence was based on pooled results insignificant and derived from multiple studies
regardless of quality that are statistically heterogeneous.
RESULTS
Review selection and identification
Details of the search results and the process of inclusion and exclusion are shown in Figure
1. A total of 6475 citations were retrieved from the electronic database search. After applying
the eligibility criteria and searching reference lists, 129 references were identified as being
eligible for full-text review based on their title and abstract. Of these, 112 papers were
subsequently excluded, the main reasons for exclusion being cadaveric studies, finite element
studies and studies without preoperative gait data. Seventeen papers were included for final
review.
Quality assessment
The Downs and Black scale checklist scores ranged from 9 to 23 of a possible 26 (Appendix
file 1). Of the 17 studies included, 2 had a score lower than 14 (rated as “poor quality”).9,19 One
study was rated as high-quality scoring between 26 and 22,39 and two studies were rated as
“moderate quality” scoring between 18 and 21.11,37 Twelve studies were rated as “fair quality”
scoring between 14 and 17.5,6,8,22,24,27,32,38,40,41,44,45 The Kappa inter-rater agreement value,
including the assessment of the 17 studies, was 0.747 (95% CI 0682 to 0.813). indicating a good
agreement between the two reviewers (PAD and LC). Of the 17 papers, 14 were case series
studies, 1 was a prospective cohort study and 2 were retrospective studies (Table 3.1)

44
Table 3-1 : Study and patient characteristics (NA : not applicable, NR : not reported, SD : standard deviation, FB : Fixed-bearing, MB : Mobile-bearing; Ankle prostheses : Salto Talaris® (Integra Life Sciences, USA), INBONE (Wright Medical Technology, USA); STARTM (Stryker, Orthopaedics, USA) ; Agility (Depuys Synthes USA), Hintegra (Integra, US); AES
(Ankle Evolutive System, Transystem, France), BOX (Bologna-Oxford,,Finsbury, UK), Mobility (Depuy, UK).
Author
(Year)
Study
Design
Sample size (M/F ratio) Mean age, SD (years) Sub-type
Ankle OA
Type of
Prosthesis
Biomechanica
l Model
Foot as 1
segment
Walking
speed Joints Plane
Follow-
up
Quality
score
TAR AA CTRL TAR AA CTRL
Segal
Cl Biomech
201837
Case series 20 (8/12) 13 (10/3) NA 59.9 ±
8.7
53.4 ±
9.8 NA NR
FB (Agility /
Salto Talaris) Plug-in Gait Yes
Self-
selected
Ankle,
Knee, Hip Sagittal 37 17
Brodsky FAI
201738 Case series 76 (28/48) NA NA 61.1 ±
10.3 NA NA
PT 42 /
7 RA /
27 PM
MB (STAR)
Modified
Helen Hayes
market set
Yes Self-
Selected
Ankle,
Knee, Hip Sagittal 12.8 16
Tenenbaum
FAS 201739 Case series
Old : 21
(8/13) NA NA
74.6 ±
3.4 NA NA NR
MB (STAR)
Modified
Helen Hayes
market set
Yes Self-
Selected
Ankle,
Knee, Hip Sagittal
27,4
15 Young : 21
(4/17) NA NA
55.4 ±
2.8 NA NA NR 26,2
Queen
CORR
201734
Case series
FB : 15
(7/8) NA NA
61 ±
13 NA NA NR
FB (Salto
Talaris) Modified
Helen Hayes
market set
Yes Self-
Selected
Ankle,
Knee, Hip Sagittal
12
23
MB : 18
(4/14) NA NA 65 ± 9 NA NA NR MB (STAR) 12
Brodsky BJJ
201616 Case series NA 20
(10/10) NA NA
58.95
± 14.8 NA
PT 12 /
PM 8 NR
Modified
Helen Hayes
market set
Yes Self-
Selected
Ankle,
Knee, Hip Sagittal 24 15
Grier G&P
201640 Case series
Neutral :
32 (NR) NA NA
63.5 ±
9.6 NA NA NR
FB & MB
(INBONE /
Salto Talaris /
STAR)
Modified
Helen Hayes
market set
Yes Self-
Selected
Ankle,
Knee, Hip Frontal
24
15 Varus : 38
(NR) NA NA
61.6 ±
7.7 NA NA NR
FB & MB
(INBONE /
Salto Talaris /
STAR)
24
Valgus :
23 (NR) NA NA
64.6 ±
11.0 NA NA NR
FB & MB
(INBONE /
Salto Talaris /
STAR)
24

45
Caravaggi Cl
Biomech
20151
Retrospecti
ve cohort
study
10 (5/5) NA 20
(11/9)
55
(rang
e 36
to 70)
NA
28
(range
23 to
36)
NR MB (BOX) IOR LLM
2007 Yes
Self-
Selected
Ankle,
Knee, Hip 3D 60 12
Queen FAI
201441 Case series
TAL : 22
(NR) NA NA
62.5 ±
11.1 NA NA
PT 19 /
PM 3
FB & MB
(INBONE /
Salto Talaris /
STAR)
Modified
Helen Hayes
market set
Yes Self-
Selected
Ankle,
Knee, Hip Sagittal
12
14 GSR : 37
(NR) NA NA
60.7 ±
9.5 NA NA
PT 29 /
PM 4 /
Other 2
FB & MB
(INBONE /
Salto Talaris /
STAR)
12
TAR : 170
(NR) NA NA
64.0 ±
9.4 NA NA
PT 136 /
PM 24 /
Other 7
FB & MB
(INBONE /
Salto Talaris /
STAR)
12
Queen JBJS
201442 Case series
FB : 41
(NR) NA NA
63.8 ±
9.0 NA NA NR
FB (Salto
Talaris) Modified
Helen Hayes
market set
Yes Self-
Selected
Ankle,
Knee, Hip Sagittal
24
16
MB 49
(NR) NA NA
62.4 ±
10.9 NA NA NR MB (STAR) 24
Queen Cl
Biomech
201443
Case series 78 (46/32) NA NA 63.6 ±
9.0 NA NA NR
FB & MB
(Salto Talaris
/ STAR)
Modified
Helen Hayes
market set
Yes Self-
Selected
Ankle,
Knee, Hip Sagittal 24 17
Choi FAI
201335 Case series 21 (5/16) NA NA 69 ±
6.9 NA NA
PT 12 /
PM 8 /
HEMA 1
FB (Salto
Talaris) Plug-in Gait Yes
Self-
Selected
Ankle,
Knee, Hip Sagittal 37,2 18
Flavin FAI
20132 Case series 14 (5/9) 14 (3/11) NA
56.9 ±
8.6
60.7 ±
16.3 NA
17 PT, 4
PM, 4
CAI, 4 PT
+ CAI
MB (STAR) Milwaukee
Foot Model No
Self-
selected
Ankle,
Hindfoot
Sagittal,
Frontal 12 12
Queen FAI
201236 Case series 51 (27/24) NA NA 65.0 ±
8.3 NA NA NR
FB (INBONE
/ Salto
Talaris)
Modified
Helen Hayes
market set
Yes Self-
selected Ankle Sagittal 24 20

46
Hahn FAI
201244 Case series 9 (4/5) 9 (6/3) NA 53.9 ±
8.7
62.7 ±
10.7 NA NR NR Plug-in Gait Yes
Self-
Selected
Ankle,
Knee, Hip Sagittal 12 16
Brodsky
JBJS 201118 Case series 50 (10/40) NA NA 60.8 ±
11.1 NA NA
PT & PM
47 / RA 3 MB (STAR)
Modified
Helen Hayes
market set
Yes Self-
Selected
Ankle,
Knee, Hip Sagittal 49 15
Ingrosso
G&P 200917
Retrospecti
ve cohort 10 (8/2) NA
20
(11/9)
57.4 ±
NR NA
27.9 ±
NR
PT 9 /
PSOA 1 MB (BOX)
IOR LLM
2007 Yes
Self-
Selected
Ankle,
Knee, Hip 3D 12 16
Valderraban
o Cl
Biomech
200747
Prospective
cohort 15 (6/9) NA
15
(6/9)
53.3 ±
NR NA
52.9 ±
NR PT 15 MB (Hintegra)
Helen Hayes
marker set Yes
Self-
Selected
Ankle,
Knee, Hip 3D 12 16

47
Sample selection, composition and description
Study details including sample sizes, participant demographics and type of prosthesis used
are shown in Table 3.1. The number of participants ranged from 9 to 229 in the 17 studies.
Gender male:female ratio was not reported in 3 studies. The subtype of OA was reported in 8
of the 17 studies. The characterization of the investigated ankle OA describing the subtype of
ankle OA and its associated osteo-articular deformity was poorly described in 14 studies. Post-
traumatic ankle OA was the most common aetiology reported by subjects in all of the included
studies. Only one study reported the radiographic severity of ankle OA prior to surgery.49 The
most common intervals between intervention and follow up were 12 and 24 months (range: 12
to 49 months).
Study procedures related to gait specific measurement protocol
Conventional marker setups and lower limb models available with the Motion Capture
systems were most commonly used for gait data acquisition, and kinematic and kinetic
computation (Table 3.1). The foot was modelled in most of the studies as a single rigid element,
except for the study of Flavin (2013). Variables relating to the mechanical behaviour of the
lower limb were limited to the sagittal plane in 12 of the included studies.
Outcome measures
A summary of findings for each gait variable in the meta-analysis is shown in Table 3.2 &
3.3 and Supplementary Materials (cfr Appendix) with detailed information of the magnitude
of effects and the strength of evidence provided below.
Ankle dorsi- / plantarflexion RoM
Based on the overall pooled SMD from 11 studies totalling 280 participants,
moderate evidence indicated an increase in ankle RoM after the implantation of TAR
(SMD: 0.68, 95%CI 0.51 to 0.85) with a MD of 3.20° (95%CI 2.44-3.96)(Figure
3.2). Mobile-bearing TAR showed similar improvements in ankle RoM to the fixed-
bearing TAR (Table 3.3).5,8,9,11,19,24,27,39,45,50
There was limited evidence of no change in ankle dorsi-/plantarflexion RoM
after an AA in the 17 studies (Figure 3.2).6,19,24

48
Figure 3.2 : The change in gait parameters (Ankle Dorsi-/Plantar-flexion RoM, Peak Ankle Plantarflexion Moment, Peak
Ankle Power Generation) following total ankle replacement (TAR global, Mobile-bearing prosthesis and Fixed-bearing
prosthesis) compared to pre-operative status

49
Figure 3.3 : The change in all gait parameters (Ankle Dorsi-/Plantar-flexion RoM, Peak Ankle Plantarflexion Moment,
Peak Ankle Power Generation) following ankle arthrodesis compared to pre-operative status.

50
Maximum ankle dorsiflexion angle
8 studies reported moderate evidence of an increase in ankle dorsiflexion angle
after the implantation of a TAR (SMD: 0.37, 95%CI 0.14 to 0.59) with a MD of 1.72°
(95%CI 0.70-2.73).8,9,11,19,27,37,44,45 Fixed-bearing TAR showed similar
improvements in ankle dorsiflexion angle to the mobile-bearing TAR (Table
3.3).11,37,44
Limited evidence indicated no change in ankle dorsiflexion angle after an
AA.6,19,44
Maximum ankle plantarflexion angle
Moderate evidence indicated an increase in ankle plantarflexion angle after
implantation of a TAR (SMD: 0.37, 95%CI 0.14 to 0.60) with a MD of 2.03° (95%CI
1.07-2.99).8,9,11,19,27,39,44,45 Six studies8,9,19,27,39,45 analysing mobile-bearing prostheses
reported moderate evidence of an increase in ankle plantarflexion angle after
implantation (SMD: 0.38, 95%CI 0.06 to 0.71) with a MD of 2.18° (95%CI 0.78-
3.58). However, pooled data of studies analysing fixed-bearing prostheses showed
moderate evidence of no increase or decrease in ankle plantarflexion RoM after
surgery.11,37,44
Limited evidence of no change in ankle plantarflexion angle after an AA.6,19,44
Peak plantarflexion ankle moment
Based on the pooled SMD from 10 studies totalling 224 participants, there was
moderate evidence of an increase in peak plantarflexion ankle moment (SMD: 0.39,
95%CI 0.15 to 0.64) after TAR (Table 3.2 & 3.3, Figure 3.2).5,9,11,19,24,27,39,44,45,50 No
MD could be given for studies analysing mobile-bearing prostheses as two of the
studies9,27 normalized the data by a length measurement as well as a weight
measurement.
There was moderate evidence of an increase in ankle moment after an AA (SMD:
0.54, 95%CI 0.17 to 0.92) with a MD of 0.16 N.m/kg (95%CI 0.05 to 0.27)(Figure
3.3).6,19,24,44

51
Table 3-2 : Summary findings for gait parameters. Change from pre-operative to post-operative status and quality of
the evidence related to Standard Mean Difference (SMD) : A : Total ankle replacement : pre-operative versus post-
operative; B ; Ankle arthrodesis : pre-operative versus post-operative (NA: Not applicable, MD : mean difference, deg:
degrees, HQ: High quality, MQ : Moderate Quality, FQ : Fair quality)
A. Total ankle replacement : pre-operative versus post-operative
Variables SMD/ MD
Mean Lower 95% CI
Higher 95% CI
I2 Overall effect
Evidence Quality studies Effect
Ankle RoM (deg)
SMD 0.68 0.51 0.85 0 P <0.00001
Moderate
HQ (Queen et al., 2017); MQ (Choi et al.,2013), FQ (Valderrabano et al.,
2007; Ingrosso et al., 2009; Brodsky et. al., 2011; Hahn et al., 2012; Tenenbaum et
al., 2017; Brodsky et al., 2017), PQ (Flavin et al., 2013; Caravaggi et al., 2015)
Medium
MD 3.20 2.44 3.96 0 P <0.00001
Ankle DF RoM (deg)
SMD 0.37 0.14 0.59 27 P <0.001
Moderate
MQ (Queen et al., 2012; Choi et al., 2013), FQ (Ingrosso et al., 2009;
Tenenbaum et al., 2017; Brodsky et al., 2017; Segal et al., 2018), PQ (Flavin et al.,
2013; Caravaggi et al., 2015)
Small
MD 1.72 0.70 2.73 32 P =0.0009
Ankle PF RoM (deg)
SMD 0.37 0.14 0.60 25 P =0.001
Moderate
HQ (Queen et al., 2017), MQ (Choi et al., 2013), FQ (Ingrosso et al., 2009;
Tenenbaum et al., 2017; Brodsky et al., 2017; Segal et al., 2018), PQ (Flavin et al.,
2013; Caravaggi et al., 2015)
Small
MD 2.03 1.07 2.99 11 P <0.0001
Ankle Moment (N.m/kg)
SMD 0.39 0.15 0.64 36 P =0.002
Moderate
HQ (Queen et al., 2017), MQ (Choi et al., 2013), FQ (Valderrabano et al., 2007;
Ingrosso et al., 2009; Brodsky et. al., 2011; Tenenbaum et al., 2017; Segal et al.,
2018), PQ (Flavin et al., 2013; Caravaggi et al., 2015)
Small
MD NA NA NA NA NA
Ankle Power (W/kg)
SMD 0.71 0.53 0.88 0 P <0.00001
Moderate
HQ (Queen et al., 2017), MQ (Choi et al., 2013), FQ (Valderrabano et al., 2007; Brodsky et. al., 2011; Tenenbaum et al., 2017; Brodsky et al., 2017; Segal et al.,
2018), PQ (Flavin et al., 2013)
Medium
MD 0.28 0.18 0.38 51 P <0.00001
Knee RoM (deg)
SMD 0.37 0.04 0.70 43 P =0.03
Moderate
MQ (Choi et al., 2013), FQ (Brodsky et. al., 2011; Hahn et al., 2012;
Tenenbaum et al., 2017; Segal et al., 2018)
Small MD 2.92 0.17 5.67 55 P =0.04
Hip RoM (deg)
SMD 0.62 0.38 0.86 0 P <0.00001
Moderate
MQ (Choi et al., 2013), FQ (Brodsky et. al., 2011; Hahn et al., 2012;
Tenenbaum et al., 2017; Segal et al., 2018)
Medium MD 3.90 2.33 5.46 9 P <0.00001
Walking speed (m/s)
SMD 1.02 0.85 1.19 35 P <0.00001
Moderate
HQ (Queen et al., 2017), MQ (Queen et al., 2012; Choi et al., 2013), FQ
(Valderrabano et al., 2007; Ingrosso et al., 2009; Brodsky et. al., 2011; Hahn et al., 2012; Queen et al., 2014; Grier et al.,
2016; Tenenbaum et al., 2017; Brodsky et al., 2017; Segal et al., 2018), PQ (Flavin et
al., 2013; Caravaggi et al., 2015)
Medium
MD 0.23 0.19 0.27 55 P <0.00001
Cadence (steps/min)
SMD 0.66 0.45 0.87 15 P <0.00001
Moderate
MQ (Choi et al., 2013),FQ (Valderrabano et al., 2007; Brodsky et. al.,
2011; Hahn et al., 2012; Tenenbaum et al., 2017; Brodsky et al., 2017; Segal et al.,
2018), PQ (Flavin et al., 2013)
Medium
MD 8.14 6.03 10.25 2 P <0.00001
Stance Duration
(%)
SMD -0.35 -0.55 -0.15 0 P =0.0005
Moderate
MQ (Queen et al., 2012; Choi et al., 2013), FQ (Valderrabano et al., 2007;
Ingrosso et al., 2009; Brodsky et. al., 2011; Tenenbaum et al., 2017), PQ (Caravaggi et
al., 2015)
Small MD -0.01 -0.62 0 3 P =0.001
Step Length (m)
SMD 0.75 0.98 26 26 P <0.00001
Moderate
MQ (Queen et al., 2012; Choi et al., 2013),
FQ (Valderrabano et al., 2007; Tenenbaum et al., 2017; Brodsky et al.,
2017; Segal et al., 2018), PQ (Flavin et al., 2013)
Medium MD NA NA NA NA NA

52
B. Ankle arthrodesis: pre-operative versus post-operative
Variables SMD /
MD Mean
Lower
95% CI
Higher
95% CI I2
Overall
effect Evidence Quality studies Effect
Ankle RoM
(deg)
SMD -0.16 -0.99 0.68 71 P = 0.71 Limited
FQ (Hahn et al., 2012; Brodsky et al.,
2016), PQ (Flavin et al., 2013) No effect
MD -0.49 -3.48 2.51 75 P = 0.75
Ankle DF
RoM (deg)
SMD 0.64 -0.42 1.70 83 P = 0.24 Limited
FQ (Brodsky et al., 2016, Segal et al.,
2018), PQ (Flavin et al., 2013) No effect
MD 3.64 -2.23 9.51 87 P = 0.22
Ankle PF
RoM (deg)
SMD -0.11 -1.20 0.97 85 P = 0.84 Moderate
FQ (Brodsky et al., 2016, Segal et al.,
2018), PQ (Flavin et al., 2013) No effect
MD -0.54 -7.45 6.38 87 P = 0.88
Ankle
Moment
(N.m/kg)
SMD 0.54 0.17 0.92 0 P = 0.005
Moderate
FQ (Hahn et al., 2012; Brodsky et al.,
2016, Segal et al., 2018), PQ (Flavin et al.,
2013)
Small MD 0.16 0.05 0.27 0 P = 0.004
Ankle
Power
(W/kg)
SMD 0.35 -0.06 0.76 0 P = 0.09
Moderate FQ (Brodsky et al., 2016, Segal et al.,
2018), PQ (Flavin et al., 2013) No effect
MD 0.17 -0.03 0.36 0 P = 0.09
Knee RoM
(deg)
SMD 0.34 -0.09 0.77 0 P = 0.12 Moderate
FQ (Hahn et al., 2012; Brodsky et al.,
2016, Segal et al., 2018) No effect
MD 1.43 -0.53 3.38 0 P = 0.15
Hip RoM
(deg)
SMD 0.89 0.44 1.34 0 P <0.0001 Moderate
FQ (Hahn et al., 2012; Brodsky et al.,
2016, Segal et al., 2018) Medium
MD 4.77 2.54 7.00 0 P = 0.0001
Walking
speed (m/s)
SMD 0.76 0.37 1.15 0 P <0.0001
Moderate
FQ (Hahn et al., 2012; Brodsky et al.,
2016, Segal et al., 2018), PQ (Flavin et al.,
2013)
Medium MD 0.17 0.09 0.24 0 P <0.00001
Cadence
(steps/min)
SMD 0.30 -0.07 0.68 0 P = 0.11
Moderate
FQ (Hahn et al., 2012; Brodsky et al.,
2016, Segal et al., 2018), PQ (Flavin et al.,
2013)
No effect MD 3.05 -0.24 6.34 0 P = 0.07
Stance
Duration
(%)
SMD -0.20 -0.83 0.42 NA NA
Very Limited FQ (Brodsky et al., 2016) No effect MD 0 -0.01 0.01 NA NA
Step Length
(m)
SMD 0.13 -0.84 1.10 0.79 P = 0.79 Limited
FQ (Brodsky et al., 2016, Segal et al.,
2018), PQ (Flavin et al., 2013) No effect
MD 0.03 -0.05 0.11 0.43 P = 0.43

53
Maximal ankle power
The overall pooled SMD from 8 studies totalling 271 participants showed
moderate evidence that patients exhibited an improvement in ankle power generation
after TAR compared to pre-operative levels (SMD: 0.71, 95%CI 0.53 to 0.88) with
a MD of 0.28 W/kg (95%CI 0.18 to 0.38) (Table 3.2 & 3.3, Figure
3.2).5,8,11,19,39,44,45,50 Three studies indicated moderate evidence that ankle power did
not change after an AA (Figure 3.3).6,19,44
Knee flexion/extension RoM
There was moderate evidence that patients with a TAR exhibited an improvement
in knee flexion/extension RoM after implantation (SMD: 0.37, 95%CI 0.04 to 0.70)
of a MD 2.92° (95%CI 0.17 to 5.67).5,11,24,44,45 Two studies5,45 showed limited
evidence of an improvement in knee flexion/extension RoM after implantation of a
mobile-bearing ankle prosthesis (SMD: 0.61, 95%CI 0.29 to 0.91) with a MD of
4.87° (95%CI 1.29 to 8.26). Two studies using fixed-bearing ankle prostheses
showed moderate evidence that there was no difference between pre- and post-
operative knee flexion/extension RoM.39,44
Three studies indicated moderate evidence that knee flexion/extension RoM did
not change after an AA.6,24,44
Hip Flexion/Extension RoM
The papers provided moderate evidence that patients with a TAR exhibited an
improvement in hip flexion/extension RoM after implantation (SMD: 0.62, 95%CI
0.38 to 0.86) with a MD of 3.90° (95%CI 2.33 to 5.46).5,11,24,44,45 The meta-analysis
indicated evidence of moderate heterogeneity between studies analysing fixed-
bearing prostheses (I2 = 62%), which was not the case for mobile-bearing prostheses
and yielded no significant difference between pre- and post-operative conditions
(SMD: 0.55, 95%CI -0.17 to 1.28).39,44
There was moderate evidence of an increase in hip flexion/extension RoM after
an AA (SMD: 0.89, 95%CI 0.44 to 1.34) with a MD of 4.77° (95%CI 2.54 to
7.00).6,24,44

54
Figure 3.4 : The change in walking speed following total ankle replacement and ankle arthrodesis compared to pre-
operative status
Walking speed
Fourteen studies totalling 534 participants reported moderate evidence that
patients with a TAR exhibited an increase in walking speed after surgery (Table 3.2
& 3.3, Figure 3.4) (SMD: 1.02, 95%CI 0.85 to 1.19) with a MD of 0.23 m/s (95%CI
0.19 to 0.27).5,8,9,11,19,22,24,27,37,39,41,44,45,50 Four studies reported moderate evidence of
an increase in walking speed after an AA (SMD: 0.76, 95%CI 0.37 to 1.15) with a
MD of 0.17 m/s (95%CI 0.09 to 0.24) )(Figure 3.4).6,19,24,44

55
Cadence
Based on the overall pooled SMD of 8 studies totalling 247 participants, there
was moderate evidence that patients with a TAR exhibited an increase in cadence
after implantation (SMD: 0.66, 95%CI 0.45 to 0.87) with a MD of 8.14 steps/min
(95%CI 6.03 to 10.25).5,8,11,19,24,44,45,50 In contrast to the data for mobile-bearing
prostheses, the meta-analysis yielded no significant difference in the cadence after
implantation of a fixed-bearing ankle prosthesis.11,44
There was moderate evidence that cadence did not change after an AA.6,19,24,44
Stance duration (% of the gait cycle)
Based on a total of 7 studies totalling 199 participants, moderate evidence was
found that patients exhibited a decrease in stance duration after the implantation of
ankle prosthesis regardless of the type of prosthesis that was implanted (Table 3.2 &
3.3) (SMD: -0.35, 95%CI -0.55 to -0.15 and MD -0.01%, 95%CI -0.02 to
0.00).5,9,11,27,37,45,50
One study reported very limited evidence that stance duration did not change after
an AA.6
Step Length
Moderate evidence was demonstrated that patients with a TAR exhibited an
increase in step length after implantation (SMD: 0.75, 95%CI 0.52 to
0.98).8,11,19,37,44,45,50 No MD could be established as one study37 normalized step
length by the height of the subjects. The meta-analysis indicated evidence of
moderate heterogeneity between studies analysing fixed-bearing prostheses (I2 =
62%), in contrast to that for mobile-bearing prostheses, and yielded a significant
difference between pre- and post-operative conditions (SMD: 0.84, 95%CI 0.32 to
1.36).11,37,44 Four studies indicated moderate evidence of an increase in step length
after implantation of a mobile-bearing ankle prosthesis (SMD: 0.66, 95%CI 0.42 to
0.90) with a MD of 0.06m (95%CI 0.02 to 0.09).8,19,45,50
Limited evidence was demonstrated for no change in step length after an AA.6,44

56
Table 3-3 : Summary findings for gait parameters. Change from pre-operative to post-operative status and quality of
the evidence related to Standard Mean Difference (SMD) : A : Mobile-bearing, B) Fixed-bearing. (NA: Not applicable, MD :
mean difference, deg: degrees, HQ: High quality, MQ : Moderate Quality, FQ : Fair quality)
A. Mobile-bearing total ankle replacement
Variables SMD/ MD Mean Lower
95% CI
Higher
95% CI I2
Overall
effect Evidence Quality studies Effect
Ankle RoM
(deg)
SMD 0.64 0.46 0.83 0 P< 0.00001
Moderate
HQ (Queen et al., 2017), FQ
(Valderrabano et al., 2007; Ingrosso et
al., 2009; Brodsky et. al., 2011;
Tenenbaum et al., 2017; Brodsky et al.,
2017), PQ (Flavin et al., 2013; Caravaggi
et al., 2015)
Medium
MD 3.32 2.32 4.07 0 P< 0.00001
Ankle DF RoM
(deg)
SMD 0.23 0.01 0.046 0 P =0.04
Moderate
FQ (Ingrosso et al., 2009; Tenenbaum et
al., 2017; Brodsky et al., 2017), PQ
(Flavin et al., 2013; Caravaggi et al.,
2015)
Small MD 1.3 -0.02 2.61 22 P =0.05
Ankle PF RoM
(deg)
SMD 0.38 0.06 0.71 46 P =0.02
Moderate
HQ (Queen et al., 2017), FQ (Ingrosso et
al., 2009; Tenenbaum et al., 2017;
Brodsky et al., 2017), PQ (Flavin et al.,
2013; Caravaggi et al., 2015)
Small
MD 2.18 0.78 3.58 31 P =0.002
Ankle
Moment
(N.m/kg)
SMD 0.39 0.06 0.71 47 P =0.02
Moderate
HQ(Queen et al., 2017), FQ
(Valderrabano et al., 2007; Ingrosso et
al., 2009; Brodsky et. al., 2011;
Tenenbaum et al., 2017), PQ (Flavin et
al., 2013; Caravaggi et al., 2015)
Small
MD NA NA NA NA NA
Ankle Power
(W/kg)
SMD 0.73 0.53 0.92 0 P< 0.00001
Moderate
HQ(Queen et al., 2017)
FQ (Valderrabano et al., 2007; Brodsky
et. al., 2011; Tenenbaum et al., 2017;
Brodsky et al., 2017), PQ (Flavin et al.,
2013)
Medium
MD 0.28 0.15 0.41 64 P< 0.00001
Knee RoM
(deg)
SMD 0.60 0.29 0.91 7 P =0.0001 Limited
FQ (Brodsky et. al., 2011; Tenenbaum et
al., 2017) Medium
MD 4.78 1.29 8.26 48 P =0.007
Hip RoM
(deg)
SMD 0.69 0.39 0.99 0 P< 0.00001 Limited
FQ (Brodsky et. al., 2011; Tenenbaum et
al., 2017) Medium
MD 4.58 2.70 6.45 0 P< 0.00001
Walking
speed (m/s)
SMD 0.91 0.71 1.11 5 P< 0.00001
Moderate
HQ (Queen et al., 2017),
FQ (Valderrabano et al., 2007; Ingrosso
et al., 2009; Brodsky et. al., 2011;
Tenenbaum et al., 2017; Brodsky et al.,
2017), PQ (Flavin et al., 2013; Caravaggi
et al., 2015)
Medium
MD 0.19 0.14 0.24 30 P< 0.00001
Cadence
(steps/min)
SMD 0.75 0.49 1.02 31 P< 0.00001
Moderate
FQ (Valderrabano et al., 2007; Brodsky
et. al., 2011; Tenenbaum et al., 2017;
Brodsky et al., 2017), PQ (Flavin et al.,
2013)
Medium MD 8.63 5.91 11.34 26 P< 0.00001
Stance
Duration (%)
SMD -0.30 -0.55 -0.05 0 P =0.02
Moderate
FQ (Valderrabano et al., 2007; Ingrosso
et al., 2009; Brodsky et. al., 2011;
Tenenbaum et al., 2017) , PQ (Caravaggi
et al., 2015)
Small MD -0.01 -0.02 0 10 P =0.03
Step Length
(m)
SMD 0.66 0.42 0.90 0 P< 0.00001
Limited
FQ (Valderrabano et al., 2007;
Tenenbaum et al., 2017; Brodsky et al.,
2017), PQ (Flavin et al., 2013)
Medium MD 0.06 0.02 0.09 59 P =0.0007

57
B. Fixed-bearing total ankle replacement
Variables SMD/
MD Mean
Lower
95% CI
Higher
95% CI I2
Overall
effect Evidence Quality studies Effect
Ankle RoM SMD 0.95 0.46 1.44 0 P =0.0001
Moderate HQ (Queen et al., 2017);
MQ (Choi et al.,2013) Medium
MD 3.42 1.21 5.63 41 P =0.002
Ankle DF RoM
SMD 0.55 0.07 1.03 56 P =0.02
Limited
MQ (Queen et al., 2012; Choi et al.,
2013),
FQ (Segal et al., 2018)
Small MD 2.21 0.66 3.76 41 P =0.005
Ankle PF RoM
SMD 0.27 -0.11 0.64 0 P =0.16
Moderate
HQ (Queen et al., 2017);
MQ (Choi et al., 2013);
FQ (Segal et al., 2018)
No
effect MD 1.29 -0.39 2.96 11 P <0.0001
Ankle
Moment
(N.m/kg)
SMD 0.52 0.14 0.90 0 P=0.007
Moderate
HQ (Queen et al., 2017);
MQ (Choi et al., 2013);
FQ (Segal et al., 2018)
Small MD 0.16 0.02 0.30 15 P=0.03
Ankle Power
(W/kg)
SMD 0.64 0.22 1.06 16 P=0.003
Moderate
HQ (Queen et al., 2017);
MQ (Choi et al., 2013);
FQ (Segal et al., 2018)
Medium MD 0.28 0.13 0.43 0 P=0.0002
Knee RoM SMD -0.07 -0.50 0.37 0 P =0.77
Moderate MQ (Choi et al., 2013);
FQ (Segal et al., 2018)
No
effect MD -0.43 -3.49 2.63 0 P =0.78
Hip RoM SMD 0.55 -0.17 1.28 62 P =0.13
Limited MQ (Choi et al., 2013);
FQ (Segal et al., 2018)
No
effect MD 3.42 -1.57 8.41 74 P =0.18
Walking
speed (m/s)
SMD 0.86 0.49 1.24 37 P <0.00001
Moderate
HQ (Queen et al., 2017);
MQ (Queen et al., 2012; Choi et al.,
2013);
FQ (Segal et al., 2018)
Medium MD 0.19 0.12 0.26 39 P <0.00001
Cadence
(steps/min)
SMD 0.45 0.01 0.89 0 P =0.05 Moderate
MQ (Choi et al., 2013);
FQ (Segal et al., 2018)
No
effect MD 6.01 0.26 11,77 0 P =0.04
Stance
Duration (%)
SMD -0.45 -0.78 -0.12 0 P =0.007 Moderate
MQ (Queen et al., 2012; Choi et al.,
2013), Small
MD -0.01 -0.02 0 0 P =0.009
Step Length
(m)
SMD 0.84 0.32 1.36 62 P =0.001 Limited
MQ (Queen et al., 2012; Choi et al.,
2013), FQ (Segal et al., 2018) Medium
MD NA NA NA NA NA
DISCUSSION
This systematic review aimed to synthesise previous research evaluating the biomechanical
effect of TAR and AA in patients suffering from end-stage ankle OA. There is currently limited
to moderate evidence that all spatio-temporal variables are improved following TAR
irrespective of the type of prosthesis implanted. Segal (2018) suggested that TAR patients
improved their walking speed by increasing their cadence.44 In contrast, very limited to
moderate evidence was shown by the systematic review that there is no improvement in spatio-
temporal variables after an AA except for walking speed.

58
The main advantage of TAR over AA is the conservation of the existing pre-operative ankle
RoM.5,10,27 Data pooling of ankle kinematics showed a medium effect (3.20°) in increasing the
dorsi-/plantarflexion RoM of the replaced ankle, using skin markers to assess motion. This
methodology may well have resulted in an over-estimation of bone motion due to soft tissue
artefact.31,52 The increase in RoM found could also be attributed to accessory offending motion
hypermobility of the adjacent foot joints in studies where the foot was considered to be one
rigid segment (Table 3.2). There was moderate evidence that experimental errors or natural gait
variability could account for only a small increase in RoM for dorsiflexion (1.72°) and for
plantarflexion (2.03°) during gait.43 In the light of these results, it seems that TAR does increase
the pre-operative ankle RoM. In contrast, a reduced ankle RoM should be an expected outcome
for AA. Although the ankle joint is fused, four studies reported the ankle dorsi- and/or
plantarflexion RoM.7,19,24,44 The movements reported in these studies could be due to the rigid
foot model used in the studies, the motion reported not being due to true ankle RoM, but the
resulting compensation of the neighbouring joints. Future prospective studies evaluating TAR
or AA should therefore use a 3D multi-segment foot model to avoid erroneus motion data
relating of the surgical effects on foot mechanics.
A second advantage of TAR over AA is the protection of the adjacent and non-adjacent
joints.5,10,27 Conventional gait models were used in all the studies included in this review,
allowing the evaluation of function of the neighbouring joints (i.e. hip, knee) pre and post
surgery (Table 3.1). Twelve of the seventeen studies limited their analysis to the affected joint
without considering the entirety of the lower kinetic chain. From a biomechanical point of view,
such consideration is an important facet of any procedure since the segments of the lower limb
are a linked system.18,28 Moderate evidence was found indicating that TAR patients increase
their flexion-extension RoM at the knee and the hip post-operatively.5,11,24,44,45 In contrast, the
evidence suggests that arthrodesis patients show no post-operatively change in knee RoM, but
an increase (4.77°) in hip RoM. This would seem to reinforce the notion that patients suffering
from the ankle OA compensate more at the hip than at the knee for reduced ankle RoM.44 Future
studies should combine 3D lower limb models with 3D multi-segment foot models to enhance
our understanding of the functional compensatory adaptations occurring at the neighbouring
joints after TAR and AA.
Moderate evidence was found that all ankle kinetic variables are improved following TAR.
Increase in peak plantar flexion moment and ankle power generation is a good indicator of an
improvement in the ability to use the foot to propel forward and an increase in the strength of
the calf muscles.27 AA studies demonstrated moderate evidence of an increase in ankle

59
dorsiflexion moment. However, there was also moderate evidence of a lack of effect on the
generation of ankle power during gait.
During the past decade, development of TAR design has resulted in two major types:
mobile-bearing implants, where the polyethylene meniscal bearing is free to slide on both tibial
and talar articular surface components fixed to the bones, and fixed-baring implants, where the
meniscal bearing is fixed to the tibial component.29 Unfortunately, there is a paucity of
randomized trial studies which analyse differences in gait mechanics in patients with a fixed-
versus mobile-bearing TAR. Only one study39 considered this topic, and revealed no difference
in outcomes between the two implant types. Pooled data from trials testing the two types of
prosthesis individually showed limited differences in gait mechanics after TAR using the two
implant designs (Table 3.3), the differences possible being the result of experimental error or
natural gait variability.43
There were of course limitations associated with the studies included in this review. The
methodological quality assessment of the studies allowed the identification of several
methodological limitations, such as the absence of outcome measurer blinding and reporting of
methodological validity. Moreover, the categorisation of ankle OA was limited and non-
specific in most of the studies. The heterogeneity in the patho-etiology of ankle OA means that
the functional consequences are difficult to define without considering the morphological and
structural changes associated with the ankle OA, thereby making it difficult to generate
meaningful pooled results for specific ankle OA sub-types. Only one study50 included in the
review had an intervention group composed exclusively of post-traumatic ankle OA. In contrast
to the global TAR results, patients suffering from post-traumatic ankle OA showed no evidence
of an effect of TAR on peak plantarflexion moment, stance duration or step length. Future
studies should clearly define the sub-type of end-stage ankle OA and their associated
osteoarticular deformity. In the absence of this information, caution should be exercised when
considering results generated by pooled data. A further limitation of the review was the lack of
access to data generated or analysed in several of the papers. Where necessary authors were
contacted with a request to provide additional data. Unfortunately, none of our requests were
met, decreasing the number of studies and participants included in the meta-analysis.

60
CONCLUSION
Current research evaluating changes in gait biomechanics after TAR and AA is limited by
a lack of prospective research, low sample sizes and heterogeneity in the patho-etiology of ankle
OA. Meta-analysis revealed a significant increase in lower limb kinematics, kinetics and spatio-
temporal parameters after total ankle replacement. Improvement in gait variables after ankle
arthrodesis was limited to ankle moment, hip range of motion and walking speed. Future studies
should combine 3D lower limb models with 3D multi-segment foot models to enhance our
understanding of the functional compensatory adaptations of the neighbouring joints after TAR
and AA.
Supplementary Materials Description
Supplementary materials can be found in the Appendix section
Supplementary material 1: Results of modified Downs and Black scale
Supplementary material 2: The change in gait parameters (Ankle Dorsiflexion RoM, Ankle
Plantarflexion RoM) following total ankle replacement (TAR global, Mobile-bearing prosthesis
and Fixed-bearing prosthesis) compared to pre-operative status
Supplementary material 3: The change in gait parameters (Knee and Hip RoM) following total
ankle replacement (TAR global, Mobile-bearing prosthesis and Fixed-bearing prosthesis)
compared to pre-operative status
Supplementary material 4: The change in spatio-temporal parameters (Cadence, Stance
Duration, Step Length) following total ankle replacement (TAR global, Mobile-bearing
prosthesis and Fixed-bearing prosthesis) compared to pre-operative status
Supplementary material 5: The change in all gait parameters (Ankle Dorsiflexion RoM, Ankle
Plantarflexion RoM, Knee and Hip RoM) following ankle arthrodesis compared to pre-
operative status.
Supplementary material 6: The change in spatio-temporal parameters (Cadence, Stance
Duration, Step Length) ) following ankle arthrodesis compared to pre-operative status

61
REFERENCES
1. Agel J, Coetzee JC, Sangeorzan BJ, Roberts MM, Hansen ST. Functional Limitations of
Patients with End-Stage Ankle Arthrosis. Foot Ankle Int. 2005;26(7):537-539.
2. Bahl JS, Nelson MJ, Taylor MJ, Solomon LB, Arnold JB, Thewlis D. Biomechanical
changes and recovery of gait function after total hip arthroplasty for osteoarthritis: a
systematic review and meta-analysis. Osteoarthr Cartil. 2018;26(7):847-863.
3. Barton T, Lintz F, Winson I. Biomechanical changes associated with the osteoarthritic,
arthrodesed, and prosthetic ankle joint. Foot Ankle Surg. 2011;17(2):52-57.
4. Beyaert C, Sirveaux F, Paysant J, Molé D, André J-M. The effect of tibio-talar
arthrodesis on foot kinematics and ground reaction force progression during walking.
Gait Posture. 2004;20(1):84-91.
5. Brodsky JW, Kane JM, Coleman S, Bariteau J, Tenenbaum S. Abnormalities of gait
caused by ankle arthritis are improved by ankle arthrodesis. 2016;98(10):1369-1375.
6. Brodsky JW, Kane JM, Coleman S, Bariteau J, Tenenbaum S. Abnormalities of gait
caused by ankle arthritis are improved by ankle arthrodesis. Bone Joint J. 2016;98-
B(10):1369-1375.
7. Brodsky JW, Kane JM, Taniguchi A, Coleman S, Daoud Y. Role of Total Ankle
Arthroplasty in Stiff Ankles. FOOT ANKLE Int. 2017;38(10):1070-1077.
8. Brodsky JW, Polo FE, Coleman SC, Bruck N. Changes in Gait Following the
Scandinavian Total Ankle Replacement. J Bone Jt Surg. 2011;93(20):1890-1896.
9. Caravaggi P, Lullini G, Leardini A, Berti L, Vannini F, Giannini S. Functional and
clinical evaluation at 5-year follow-up of a three-component prosthesis and
osteochondral allograft transplantation for total ankle replacement. Clin Biomech.
2015;30(1):59-65.
10. Cenni F, Leardini a, Pieri M, et al. Clinical Biomechanics Functional performance of a
total ankle replacement : thorough assessment by combining gait and fl uoroscopic
analyses. Jclb. 2012;28(1):79-87.
11. Choi JH, Coleman SC, Tenenbaum S, Polo FE, Brodsky JW. Prospective Study of the
Effect on Gait of a Two-Component Total Ankle Replacement. Foot Ankle Int.
2013;34(11):1472-1478.

62
12. Coester LM, Saltzman CL, Leupold J, Pontarelli W. Long-Term Results Following
Ankle Arthrodesis for Post-Traumatic Arthritis. J Bone Joint Surg Am. 2001;83(2):219-
228.
13. Cunningham LS, Kelsey JL. Epidemiology of musculoskeletal impairments and
associated disability. Am J Public Health. 1984;74(6):574-579.
14. Demetriades L, Strauss E, Gallina J. Osteoarthritis of the ankle. Clin Orthop Relat Res.
1998;(349):28-42.
15. Donatto KC. Arthritis and Arthrodesis of the Hindfoot. Clin Orthop Relat Res.
1998;349(349):81-92.
16. Downs SH, Black N. The feasibility of creating a checklist for the assessment of the
methodological quality both of randomised and non-randomised studies of health care
interventions. J Epidemiol Community Heal. 1998;52(6):377-384.
17. Dubbeldam R, Nester C, Nene A V., Hermens HJ, Buurke JH. Kinematic coupling
relationships exist between non-adjacent segments of the foot and ankle of healthy
subjects. Gait Posture. 2013;37(2):159-164.
18. Flavin R, Coleman SC, Tenenbaum S, Brodsky JW. Comparison of Gait After Total
Ankle Arthroplasty and Ankle Arthrodesis. Foot Ankle Int. 2013;34(10):1340-1348.
19. Fuchs S, Sandmann C, Skwara A, Chylarecki C. Quality of life 20 years after arthrodesis
of the ankle. J Bone Joint Surg Br. 2003;85-B(7):994-998.
20. Glazebrook M, Daniels T, Younger A, et al. Comparison of Health-Related Quality of
Life Between Patients with End-Stage Ankle and Hip Arthrosis. J Bone Joint Surg Am.
2008;90(3):499-505.
21. Grier AJ, Schmitt AC, Adams SB, Queen RM. The effect of tibiotalar alignment on
coronal plane mechanics following total ankle replacement. Gait Posture. 2016;48:13-
18.
22. Haddad SL. Intermediate and Long-Term Outcomes of Total Ankle Arthroplasty and
Ankle Arthrodesis<sbt aid="1210679">A Systematic Review of the Literature</sbt>. J
Bone Joint Surg. 2007;89(9):1899.
23. Hahn ME, Wright ES, Segal AD, Orendurff MS, Ledoux WR, Sangeorzan BJ.
Comparative Gait Analysis of Ankle Arthrodesis and Arthroplasty: Initial Findings of a
Prospective Study. Foot Ankle Int. 2012;33(4):282-289.
24. Higgins JPT. Measuring inconsistency in meta-analyses. BMJ. 2003.
doi:10.1136/bmj.327.7414.557.

63
25. Hume P, Hopkins W, Rome K, Maulder P, Coyle G, Nigg B. Effectiveness of Foot
Orthoses for Treatment and Prevention of Lower Limb Injuries. Sport Med.
2008;38(9):759-779.
26. Ingrosso S, Benedetti MG, Leardini A, Casanelli S, Sforza T, Giannini S. GAIT analysis
in patients operated with a novel total ankle prosthesis. Gait Posture. 2009;30(2):132-
27. Karandikar N, Vargas OOO. Kinetic Chains: A Review of the Concept and Its Clinical
Applications. PM R. 2011;3(8):739-745.
28. Leardini A, O’Connor JJ, Giannini S. Biomechanics of the natural, arthritic, and replaced
human ankle joint. J Foot Ankle Res. 2014;7(1):8.
29. Moher D, Liberati A, Tetzlaff J, et al. Preferred reporting items for systematic reviews
and meta-analyses: The PRISMA statement. PLoS Med. 2009.
doi:10.1371/journal.pmed.1000097.
30. Nester C, Jones RK, Liu a, et al. Foot kinematics during walking measured using bone
and surface mounted markers. J Biomech. 2007;40(15):3412-3423.
31. O’Connor SR, Tully MA, Ryan B, Bradley JM, Baxter GD, McDonough SM. Failure of
a numerical quality assessment scale to identify potential risk of bias in a systematic
review: a comparison study. BMC Res Notes. 2015;8(1):224.
32. Pagenstert GI, Hintermann B, Barg A, Leumann A, Valderrabano V. Realignment
surgery as alternative treatment of varus and valgus ankle osteoarthritis. Clin Orthop
Relat Res. 2007;(462):156-168.
33. Peyron J. The epidemiology of osteoarthritis. In: Moskowitz M, Goldberg V, Mankin H,
eds. Osteoarthritis: Diagnosis and Treatment. Philadelphia: WB Saunders; 1984:9–27.
34. Philippe P, Paul C, Mark M, Jean-Noel C, Delphine P, Thierry J. Ankle Replacement
versus Arthrodesis: A Comparative Gait Analysis Study. Foot Ankle Int. 2008;29(1):3-
9.
35. Pinsker E, Inrig T, Daniels TR, Warmington K, Beaton DE. Symptom Resolution and
Patient-Perceived Recovery Following Ankle Arthroplasty and Arthrodesis. Foot Ankle
Int. 2016;37(12):1269-1276.
36. Queen R. Directing clinical care using lower extremity biomechanics in patients with
ankle osteoarthritis and ankle arthroplasty. J Orthop Res. 2017;35(11):2345-2355.
37. Queen RM, De Biassio JC, Butler RJ, DeOrio JK, Easley ME, Nunley JA. Changes in
Pain, Function, and Gait Mechanics Two Years Following Total Ankle Arthroplasty
Performed With Two Modern Fixed-Bearing Prostheses. Foot Ankle Int.
2012;33(7):535-542.

64
38. Queen RM, Butler RJ, Adams SB, DeOrio JK, Easley ME, Nunley J a. Bilateral
differences in gait mechanics following total ankle replacement: a two year longitudinal
study. Clin Biomech. 2014;29(4):418-422.
39. Queen RM, Franck CT, Schmitt D, Adams SB. Are There Differences in Gait Mechanics
in Patients With A Fixed Versus Mobile Bearing Total Ankle Arthroplasty? A
Randomized Trial. Clin Orthop Relat Res. 2017;475(10):2599-2606.
40. Queen RM, Grier AJ, Butler RJ, et al. The Influence of Concomitant Triceps Surae
Lengthening at the Time of Total Ankle Arthroplasty on Postoperative Outcomes. Foot
Ankle Int. 2014;35(9):863-870.
41. Queen RM, Sparling TL, Butler RJ, et al. Patient-Reported Outcomes, Function, and
Gait Mechanics After Fixed and Mobile-Bearing Total Ankle Replacement. J Bone Joint
Surg Am. 2014;96A(12):987-993.
42. Saltzman CL. Impact of Comorbidities on the Measurement of Health in Patients with
Ankle Osteoarthritis. J Bone Joint Surg. 2006;88(11):2366.
43. Schwartz MH, Trost JP, Wervey RA. Measurement and management of errors in
quantitative gait data. Gait Posture. 2004;20(2):196-203.
44. Segal AD, Cyr KM, Stender CJ, et al. A three-year prospective comparative gait study
between patients with ankle arthrodesis and arthroplasty. Clin Biomech. 2018;54(August
2017):42-53.
45. Tenenbaum S, Bariteau J, Coleman S, Brodsky J. Functional and clinical outcomes of
total ankle arthroplasty in elderly compared to younger patients. Foot Ankle Surg.
2017;23(2):102-107.
46. Tenenbaum S, Bariteau J, Coleman S, Brodsky J. Functional and clinical outcomes of
total ankle arthroplasty in elderly compared to younger patients. Foot Ankle Surg.
2017;23(2):102-107.
47. Thomas R. Gait Analysis and Functional Outcomes Following Ankle Arthrodesis for
Isolated Ankle Arthritis. J Bone Joint Surg. 2006;88(3):526.
48. Thomas RH, Daniels TR. Ankle arthritis. J Bone Joint Surg Am. 2003;85-A(5):923-936.
49. van Tulder M, Furlan A, Bombardier C, Bouter L. Updated method guidelines for
systematic reviews in the cochrane collaboration back review group. Spine.
2003;28(12):1290-1299.
50. Valderrabano V, Nigg BM, Tscharner V von, Frank CB, Hintermann B. J. Leonard
Goldner Award 2006: Total Ankle Replacement in Ankle Osteoarthritis: An Analysis of
Muscle Rehabilitation. Foot Ankle Int. 2007;28(2):281-291.
65
51. Valderrabano V, Nigg BM, von Tscharner V, Stefanyshyn DJ, Goepfert B, Hintermann
B. Gait analysis in ankle osteoarthritis and total ankle replacement. Clin Biomech.
2007;22(8):894-904.
52. Wan X, Wang W, Liu J, Tong T. Estimating the sample mean and standard deviation
from the sample size, median, range and/or interquartile range. BMC Med Res Methodol.
2014;14(1):1-13.
53. Westblad P, Hashimoto T, Winson I, Lundberg A, Arndt A. Differences in Ankle-Joint
Complex Motion During the Stance Phase of Walking as Measured by Superficial and
Bone-Anchored Markers. Foot Ankle Int. 2002;23(9):856-863.
54. Wu W-L, Su F-C, Cheng Y-M, Huang P-J, Chou Y-L, Chou C-K. Gait analysis after
ankle arthrodesis. Gait Posture. 2000;11(1):54-61.

66
Chapter 4 : Intrinsic foot joints adapt a stabilized-resistive
configuration during the stance phase
Paul-André. Deleu1,2, Laurence Chèze,1, Raphaël Dumas,1, Jean-Luc Besse3,
Thibaut Leemrijse2, Bernhard Devos Bevernage2, Ivan Birch4, Alexandre Naaim1
1Univ Lyon, Université Claude Bernard Lyon 1, IFSTTAR, LBMC UMR_T9406,F69622, Lyon, France
2Foot & Ankle Institute, Brussels, Belgium
3Hospices Civils de Lyon, Centre Hospitalier Lyon-Sud, Service de Chirurgie Orthopédique et Traumatologique,
France
4Sheffield Teaching Hospitals NHS Foundation Trust, Woodhouse Clinic, 3 Skelton Lane, Sheffield S13
7LY, United Kingdom
This manuscript was submitted online the 21th September 2019 and is presently being given full
consideration for publication in Journal of Foot & Ankle Research.

67
ABSTRACT
Background: This study evaluated the 3D angle between the joint moment and the joint
angular velocity vectors at the Ankle, Chopart, Lisfranc and First Metatarso-phalangeal joints,
and investigated if these joints are predominantly driven or stabilized during gait.
Methods: The participants were 20 asymptomatic subjects. A four-segment kinetic foot
model was used to calculate and estimate intrinsic foot joint moments, powers and angular
velocities during gait. 3D angles between the joint moment and the joint angular velocity
vectors were calculated for the Ankle, Chopart, Lisfranc, and First Metatarso-phalangeal joints.
When the 3D vectors were approximately aligned the moment was considered to result in
propulsion (angle <60o) or resistance (angle >120o) at the joint. When the 3D vectors are
approximately orthogonal (angle close to 90°), the moment was considered to stabilize the joint.
Results: The results showed that the four intrinsic joints of the foot are never fully
propelling, resisting or being stabilized, but are instead subject to a combination of the three
effects during the majority of the stance phase of gait. However, the results also show that
during pre-swing all four of the joints are subject to moments that result purely in propulsion.
At heel off, the propulsive configuration appears for the Lisfranc joint first at terminal stance,
then for the other foot joints at pre-swing in the following order: Ankle joint, Chopart joint and
First Metatarso-Phalangeal joint.
Conclusions: Intrinsic foot joints adopt a stabilized-resistive configuration during the
majority of the stance phase, with the exception of pre-swing during which all joints were
found to adopt a propulsive configuration. The notion of stabilization, resistance and propulsion
should be further investigated in subjects with foot and ankle disorders.
Keywords : Foot kinetics, Multi-segment foot, Inverse dynamics, walking
68
BACKGROUND
Adequate measurement of the complex intrinsic movement of the foot and ankle
complex during walking has been impeded for decades by the simplified representation of foot
as a single functional segment.11 The development of three-dimensional (3D) multi-segment
foot models partially tackled this major shortcoming of the established 3D lower limb models
and showed their clinical value through the detection of intrinsic foot mobility impairments 11.
During the last decade, foot and ankle biomechanics were essentially described through the
kinematics of the gait cycle as determined from cadaver, invasive bone pins, biplanar
videoradiography and non-invasive surface marker studies, and plantar pressure
measurements.22,23,31–33 Recently, multi-segment kinetic foot models have received increasing
attention in methodological and clinical studies providing new insights into how the intrinsic
joints of the foot can have individual power distributions.2,4,10,41 While kinematic multi-segment
foot models can demonstrate the motion of the various intrinsic joints of the foot, establishing
the kinetics of these joints represent a new series of challenges: definition of inter-segment
joint centers, estimation of segmental shear forces and definition of segment inertial
properties.10 Despite these technical and methodological challenges, joint moments and powers
have been able to provide new insights into the dynamic contribution of the Chopart and
Lisfranc joints during gait, and new mechanisms of foot dysfunction in specific foot and ankle
pathologies.10,14,39
Based on the literature, kinetic analysis of intrinsic foot joints seems to be a valuable
way for uncovering the role of foot and ankle during locomotion. However, the clinical
interpretation of joint power remains an area of debate and not without controversies in the field
of biomechanics. Although subject to challenge, joint power has been reported separately for
the frontal, sagittal and transverse planes, which has revealed inconsistent results at the
ankle.1,5,15 The scientific community has also associated joint power with muscle action and
energy transfer.12,18,19 However, their link with joint power has been widely criticized in the
literature.12,18,19 The difficulty is largely in the attribution of energy transfer (e.g. storage in
elastic structures, muscle action) and in the allocation of forces to the agonist-antagonist and
multi-joint muscles.12,41 The nature of the foot and ankle further increases the complexity of
interpretation by the fact that, compared to the other major joints of the lower limb, intrinsic
foot joints share common ligament and muscle tendon structures. Further analysis integrating
in-vivo medical imaging37 with musculo-skeletal models43 would be required to shed light on

69
the contribution of each of the anatomical structures to foot and ankle function. It is therefore
proposed that the joint power be supplemented by an angle (M) which encapsulates a 3D
angular relationship between the joint moment (M) and the joint angular velocity () vectors,
in an attempt to translate kinetic data into a “simple” functional relationship expressed in an
accessible format applicable to the lower limb joints (ankle, knee, hip)12 When the 3D vectors
M and are aligned (0° or 180°), the moment results in propulsion or resistance. When the 3D
vectors M and are orthogonal (90°), the moment stabilizes the joint.12 The 3D angle M
between the joint moment (M) and the joint angular velocity () revealed that the ankle joint
generally adapts a resistive configuration (at midstance) followed by a propulsive configuration
(at pre-swing) in healthy adults.
Based on current knowledge on the estimation of foot joint kinetics, this study proposes
to expand the calculation of M to a four-segment kinetic foot model. Our hypothesis is that
intrinsic foot joints are only partially propelling, resisting or stabilized due to the complex
contributions of intrinsic and extrinsic foot muscles, ligaments and multiple joint surfaces.
Therefore, the objective of this study was to analyse M at the Chopart, Lisfranc and first
metatarso-phalangeal joints during the stance phase of gait and to investigate if these joints are
predominantly propelling, resisting or stabilized. Angle M was also computed at the ankle
joint with the foot considered to be a multi-segment system and a single segment for
comparison.
METHODS
Subjects
Twenty asymptomatic adult subjects participated in the study (male/female ratio 14/6;
age : 45.35 11.97 ; height, 1.75 0.08; weight : 75.5 9.13; BMI : 24.62 2.50; walking
speed 1.39 0.15). Participants were included if 1) they were able to walk barefooted
independently, without support, 2) they had no history of orthopaedic, neurological or
musculoskeletal problems affecting their gait. All participants were volunteers and signed the
informed consent approved by the local ethical committee (B200-2017-061).

70
Protocol
The simultaneous assessment of kinematics, kinetics, and plantar pressure
measurements of each subject was achieved through the use of an advanced clinical
examination platform combining a motion capture system, a force plate and a plantar pressure
plate. The motion capture system consisted of 8 Miqus cameras (Qualysis, Göteborg Sweden)
to capture the kinematic data (200Hz) of the participant while walking over a 10 meters
walkway at a self-selected speed.6 In the middle of the walkway, a Footscan® pressure plate
(dimensions 0.5m x 0.4m, 4096 sensors, 2.8 sensors per cm2, RSscan International, Paal,
Belgium) was mounted upon a custom made AMTI-force plate (dimensions 0.5 x 0.4m,
Advanced Mechanical Technology, Inc., Watertown, MA, US). The force plate was custom-
made to fit the surface dimensions of the plantar pressure plate. This set-up allowed for the
detection of specific gait events as well as for a continuous calibration of the pressure plate with
the force plate using a Footscan® 3D interface box (RSscan International, Paal, Belgium). Data
from the pressure and force plates were measured at a sampling rate of 200Hz. The integration
and synchronization of the three different hardware devices was achieved through the use of a
Miqus Sync unit interface (Qualysis, Göteborg Sweden).
Thirty-two 8mm retro-reflective markers were mounted over anatomical landmarks
according to the Instituto Orthopedico Rizzoli 3D multi-segment foot model (RFM).23 The skin
markers were mounted using double-sided adhesive tape. After maker placement, the
participants were asked to walk barefoot, at a self-selected speed until five valid trials were
recorded. A trial was considered valid when the following criteria were met: 1) walking speed
was within predetermined boundaries, 2) no visual adjustment was made in gait pattern to
contact the pressure plate and 3) a clear contact with the pressure plate.8 All marker trajectories
were computed by Qualysis Tracking Manager 2.16 (Qualysis, Göteborg Sweden).
Data analysis
Inter-segment 3D rotations were calculated according to an adapted version of Instituto
Orthopedico Rizzoli 3D multi-segment foot model developed by Deschamps et al. (2017) (IOR-
4Segment-model 1) following ISB recommendations, where dorsiflexion/plantarflexion
(sagittal plane) is defined as rotation about the medio-lateral axis of the proximal segment,
adduction/abduction (transversal plane) about the vertical axis of the distal segment and
inversion/eversion (frontal plane) about an axis orthogonal to the first two axes.23,44
Joint forces (F) and moments (M) were computed in the Inertial Coordinate System by a
bottom-up inverse dynamic method using a Newton-Euler recursive algorithm based on a
71
homogeneous matrix formalism during the stance phase of gait.24 Kinematic and force data
were filtered using a low-pass zero-lag, 4th order, Butterworth filter, with a cut-off frequency
of 10 Hz. Inertia and weight parameters of each foot segment were discounted as the inertia
effects were negligible during gait compared to the external forces. The force plate data were
distributed over each foot segment using the proportionality scheme described by Morlock &
Nigg (1991) and validated by Saraswat et al. (2014) based on the distribution of the vertical
ground reaction forces as measured by each sensor of the plantar pressure platform (i.e. if 15%
of the total vertical force acted on the forefoot, it was assumed that 15% of the total horizontal
force also acted on the forefoot).30,39 The estimation of the subarea of each foot segment was
achieved for each time frame by projecting the position of the retro-reflective markers vertically
on the sensor matrix of the plantar pressure platform. The resulting center of pressure (CoP) of
each estimated subarea was then used as the CoP for each foot segment in then inverse dynamics
calculations. The joint moments were expressed in the proximal segment coordinate system.
For the computation of foot kinematics and kinetics, a virtual cuboid marker was created
and defined as being at 2/3 of the distal distance between the peroneal tubercle and the base of
the fifth metatarsal (Figure 4.1). Inter-segment center definitions of the four segment foot model
were based on Deschamps et al. (2017). For both kinematic and kinetic foot models, the ankle
joint center was defined as the midpoint between the malleoli markers. Ankle joint motion was
described between the foot and the shank for the one-segment foot model (hereafter referred as
Ankle), and between the calcaneus and the shank for the multi-segment foot model (hereafter
referred as Shank-Calcaneus) (Figure 4.1). Calcaneus-Midfoot center (hereafter referred as
Chopart joint) was determined as being the midpoint between the cuboid and the navicular
bone. Midfoot-Metatarsus center (hereafter referred as Lisfranc joint) was determined as being
on the base of the second metatarsal. First Metatarso-Phalangeal joint center was the projection
of first metatarsal head marker vertically at mid distance to the ground.10
In supplement to the joint power, the 3D angle M between the joint moment (M) and
the joint angular velocity () vectors was calculated as described by Dumas and Chèze (2008).
When the 3D vectors M and are mainly aligned (M <60° or > 120°), the moment either
results in propulsion (P) or resistance (R). When the 3D vectors M and are almost orthogonal
(M >60° and <120°), the moment stabilizes the joint (S).12 Inter-segment kinematic and
kinetic computations were performed using an in-house constructed Matlab program. Joint
moments and powers were normalized by subject-mass and all variables were time-normalized
for the stance phase.
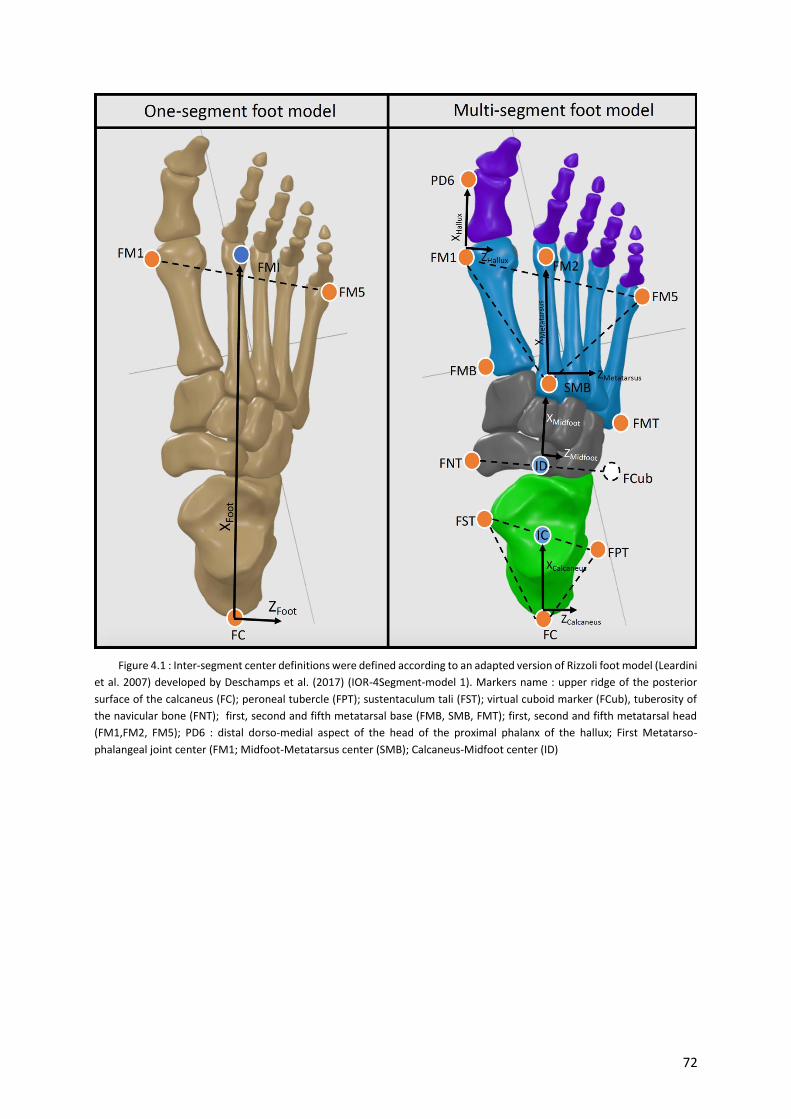
72
Figure 4.1 : Inter-segment center definitions were defined according to an adapted version of Rizzoli foot model (Leardini
et al. 2007) developed by Deschamps et al. (2017) (IOR-4Segment-model 1). Markers name : upper ridge of the posterior
surface of the calcaneus (FC); peroneal tubercle (FPT); sustentaculum tali (FST); virtual cuboid marker (FCub), tuberosity of
the navicular bone (FNT); first, second and fifth metatarsal base (FMB, SMB, FMT); first, second and fifth metatarsal head
(FM1,FM2, FM5); PD6 : distal dorso-medial aspect of the head of the proximal phalanx of the hallux; First Metatarso-
phalangeal joint center (FM1; Midfoot-Metatarsus center (SMB); Calcaneus-Midfoot center (ID)

73
RESULTS
The 3D angle M curves show that the four joints are never fully propelling, resisting or
stabilized, but adopt a stabilized-resistive configuration during most of the stance phase, except
at pre-swing with all joints in a propulsive configuration (Figure 4.5). At loading response, all
major joints quickly show a peak resistance (Ankle, Shank-Calcaneus, Lisfranc) or a
stabilization configuration (Chopart) followed by a short period of stabilization occurring first
at ankle, Shank-Calcaneus and then for Lisfranc joints. The First Metatarso-Phalangeal joint
demonstrates a propulsive configuration during loading response. During midstance, the Ankle
and Shank-Calcaneus predominantly show a resistive configuration, whereas the Chopart
adapts a stabilized-resistive configuration. In contrast, Lisfranc and First Metatarso-Phalangeal
joints show a stabilized configuration. The propulsive configuration appears for Lisfranc joint
first at terminal stance, then for other foot joints at pre-swing in the following order : shank-
calcaneus, Ankle, Chopart and First Metatarso-Phalangeal joint.
Ankle versus Shank-Calcaneus joints
The Ankle and shank-Calcaneus joint powers remained low during the stance phase,
except at loading response, when a peak of negative power occurred corresponding to a resistive
configuration (both joints 161°), and during pre-swing when a peak of positive power occurred
corresponding to a propulsive configuration (Shank-Calcaneus 50° versus Ankle 26°)
(Figure 5). The 3D angle M of both joints demonstrated a high variability during loading
response and at the end of midstance (Figure 4.5).
At loading response, the moments and angles (Figure 4.2-4.4) of both joints showed a
predominantly dorsiflexion inter-segmental action, and a combination of plantarflexion and
eversion movements. At midstance, the joint moments and angles of both joints showed a
plantarflexion inter-segmental action and a dorsiflexion movement. At terminal stance and pre-
swing, the joint moments and angles of both joints showed a predominantly plantarflexion inter-
segmental action combined with a plantarflexion movement. Both peak power generation and
absorption were lower in the Shank-Calcaneus joint than in the Ankle joint.

74
Figure 4.2 : Mean 3D kinematics (degrees) for the Ankle, Shank-Calcaneus (Sha-Cal), Chopart joint (Cal-Mid), Lisfranc
joint (Mid-Met), First Metatarso-Phalangeal joint (1st Metatarso-Phal). Standard deviations are visualized as bands.
Calcaneus-Midfoot (Chopart)
The Calcaneus-Midfoot power remained low during the stance phase, except during
terminal stance when a peak of negative power occurred corresponding to a resistive
configuration (143°), and during pre-swing when a peak of positive power occurred
corresponding to a propulsive configuration (36°). The 3D angle M demonstrated a high
variability during loading response and midstance (Figure 4.5).
At loading response, Calcaneus-Midfoot power was negligible and the moments and
angles showed a predominantly plantarflexion inter-segmental action and a combination of
dorsiflexion and eversion movements (Figure 4.2-4.4). Calcaneus-Midfoot power was also low

75
during midstance and the 3D angle M demonstrated a stabilised-resistive configuration. At
terminal stance, the moments and angles showed a predominantly plantarflexion inter-
segmental action combined with a dorsiflexion movement. At pre-swing, the moments and
angles showed a predominantly plantarflexion inter-segmental action combined with a
plantarflexion movement.
Midfoot-Metatarsus (Lisfranc)
The Midfoot-Metatarsus power remained low during the stance phase, except at the end
of terminal stance and the beginning of pre-swing when a peak of positive power was seen to
occur corresponding to a propulsive configuration (33°). The 3D angle M demonstrated a
high variability during midstance and terminal stance (Figure 4.5).
At loading response, Midfoot-Metatarsus power was negligible and the moments and
angles showed a predominantly plantarflexion inter-segmental action and a combination of
dorsiflexion and inversion/eversion movements (Figure 4.2-4.4). Midfoot-Metatarsus power
were also low during midstance and the 3D angle M demonstrated a stabilised configuration
(90°). At terminal stance, the moments and angles showed a predominantly plantarflexion
inter-segmental action combined with a plantarflexion movement. The moments and angles at
the transition between terminal stance and pre-swing showed a predominantly plantarflexion
inter-segmental action combined with a plantarflexion movement. In contrast to the ankle and
Chopart joints, the Lisfranc joint demonstrated a stabilized configuration at the end of pre-
swing. The moments and angles showed an eversion inter-segmental action combined with an
eversion movement.
First metatarso-phalangeal
The First Metatarso-Phalangeal power remained low during the stance phase, except at
pre-swing when a peak of negative power was seen to occur corresponding to a resistive
configuration (peak at 163°). The 3D angle M demonstrated a high variability during the
entire stance phase, except during pre-swing (Figure 4.5).
The First Metatarso-Phalangeal power was negligible from loading response to terminal
stance. 3D angle M showed a propulsive configuration at loading response and a stabilised
configuration during midstance. At terminal stance and pre-swing, the moments and angles
showed a predominantly plantarflexion inter-segmental action combined with a dorsiflexion
movement (Figure 4.2-4.4).

76
Figure 4.3 : Mean 3D angular velocities (degrees/second) for the Ankle, Shank-Calcaneus (Sha-Cal), Chopart joint (Cal-
Mid), Lisfranc joint (Mid-Met), First Metatarso-Phalangeal joint (1st Metatarso-Phal). Standard deviations are visualized as
bands.

77
Figure 4.4 : Mean 3D joint moments (Nm/kg) for the Ankle, Shank-Calcaneus (Sha-Cal), Chopart joint (Cal-Mid), Lisfranc
joint (Mid-Met), First Metatarso-Phalangeal joint (1st Metatarso-Phal). Standard deviations are visualized as bands.

78
Figure 4.5 : Mean 3D joint power (Watt/kg) and mean 3D angle between joint moment and joint angular velocity
vectors for the Ankle, Shank-Calcaneus (Sha-Cal), Chopart joint (Cal-Mid), Lisfranc joint (Mid-Met), First Metatarso-
Phalangeal joint (1st Metatarso-Phal). Standard deviations are visualized as bands. Subphases of the gait cycle.
Abbreviations : R : resistance configuration; P : propulsion configuration; S : stabilisation configuration.

79
DISCUSSION
The current study proposes the use of a 3D angle M, which encapsulates a 3D angular
relationship between the joint moment (M) and the joint angular velocity () vectors, in an
attempt to provide a “simple” measure of the function of intrinsic foot joints during gait. Our
hypothesis was confirmed by the results which showed that the intrinsic foot joints are never
fully propelling, resisting or stabilized, but instead adopt a stabilized-resistive configuration
during most of the stance phase, with the exception of during pre-swing when all joints adopt a
propulsive configuration. This stabilized-resistive configuration keeps the foot from collapsing
while bearing weight, allowing stabilization of the foot and thus accomplishing the stability
requirements of locomotion.40
This study expanded the calculation of 3D angle M from a lower limb model to a
four-segment kinetic foot model. The 3D angle M pattern of the Ankle joint found in this
study was generally similar to that proposed by Dumas and Chèze (2008).12 The most notable
difference between the results of the two studies was that during loading response Dumas and
Chèze (2008) found a stabilized configuration as opposed to the resistive configuration found
in this study. The decomposition of 3D angle M revealed that this discordance in configuration
is likely to arise from different kinematic patterns, as Dumas and Chèze (2008) found a
predominant combination of abduction and external rotation movements, whereas this study
showed a combination of plantarflexion and eversion movements. It may be concluded that the
observed differences may therefore come from the variation in foot kinematics between
participants, since both studies used the same joint center, anatomical landmarks and reference
frame to model the ankle joint.
A point of interest which deserves discussion is the critical role of the method by which
the ankle joint is modelled. The simplified representation of the foot as a single functional
segment is still widely used to quantify ankle joint kinetics in clinical biomechanical studies.
The results showed that both peak power generation and absorption to be lower in the Shank-
Calcaneus joint than in the Ankle joint (Figure 4.5). This is in accordance with previous gait
studies for asympatomatic3,26,45 and symptomatic14 subjects. However, in terms of 3D angle
M waveforms, the Shank-Calcaneus joint and the Ankle joint showed similar waveforms
during the stance phase of gait.
Adding 3D angle M waveforms to the computation of foot kinetics creating a four-
segment foot model enabled the discovery of new insights into how the Chopart and Lisfranc

80
joints are contributing to foot function from midstance to pre-swing. However, the
interpretation of 3D angle M of both joints during loading response should be undertaken
with care, as the forefoot may not yet be in contact with the ground, and their respective joint
moments were found to be close to zero. The computed 3D angle M waveforms of both joints
appear to correspond with their respective functional anatomy. The Lisfranc joint shows
predominantly a stabilized configuration during midstance, possibly caused by the anatomical
stiffness of the tarsometatarsal joints. The passive stability of the Lisfranc joint is largely
provided by the plantar ligaments and the second metatarsal with its encased base between the
cuneiforms. The peroneus longus tendon, inserted at the plantar aspect of the first metatarsal
base, and the first cuneiform further contribute to the stabilization of the first ray in opposition
to dorsiflexion moments that are commonly exerted by ground reaction forces acting plantar to
the first metatarsal head.36 In contrast to the Lisfranc joint, the Chopart joint has considerably
more freedom of movement and requires a resistive-stabilized configuration to control the
deformation of the longitudinal arch under load, and to avoid collapsing during midstance and
propulsion. Recent evidence suggests that the stability of the longitudinal arch is not only
provided by the passive structures (e.g. plantar ligaments and plantar fascia), but also by
contraction of the plantar intrinsic foot muscles.29 These muscles act as local stabilisers
increasing the inter-segmental stability of the longitudinal arch. They have small cross-sectional
areas and therefore produce small rotational moments.29 Flexor hallucis longus and tibialis
posterior provide further substantial dynamic support to the medial longitudinal arch. These
muscles provide both resistive and propulsive capabilities during gait.27,42
The foot’s rigidity in late stance is mainly attributed to the windlass and midtarsal
locking mechanisms.17,28 The stiffening of the foot is required to resist the ground reaction
forces and allow efficient propulsion of the body in late stance. At heel off, 3D angle M
waveforms of the ankle and Lisfranc joints are simultaneously adopting a propulsive
configuration at terminal stance, which means that both joints are predominantly being driven
by their respective plantarflexion moments, and thus contributing to power generation (Figure
4.4-4.5). Recent studies suggest that this power generation at the Lisfranc joint during terminal
stance is the result of the Windlass mechanism.3,10,13 The activation of this mechanism results
in tension the plantar fascia by winding it around the metatarsal heads as the toes extend in
terminal stance.17 The power generated at the Lisfranc joint would then in turn result in the
optimal repositioning of the bones around the Chopart joint.16 The reorientation of the midfoot
bones were mainly characterized in our results by a plantarflexion moment combined with a

81
dorsiflexion and inversion movement of the Chopart joint resulting in a resistive configuration.
This phenomenon is often referred in the literature as the midtarsal locking mechanism.28,35
However, the term “locking” seems inappropriate as rotational movement at the Chopart joint
was observed at terminal stance. It has also been suggested that the increased tension in the
plantar fascia, and possibly other muscle-tendon structures, would result in a shortening and
rise of the longitudinal arch through flexion and adduction of the metatarsals in combination
with an inversion of the rearfoot.7,17 The longitudinal arch raise would then induce a first ray
plantarflexion, an inversion of the Chopart joint, an inversion of the rearfoot, and ankle
dorsiflexion.16 At 65% of the stance, the resistive configuration adopted by the Chopart joint is
converted into a propulsive configuration where the moments and angles show predominantly
a plantarflexion inter-segmental action combined with a plantarflexion movement (Figure 4.2-
4.5). This configuration conversion allows the Chopart joint to contribute to power generation.
Elastic recoil of the tibialis posterior as well as of the plantarflexors of the ankle and toes’
further add to power generation at the Chopart and ankle joints during terminal stance and pre-
swing.10
A last point of interest is the functioning of the First Metatarso-phalangeal joint during
propulsion, which tends to absorb relatively more power than the joints distal to the Ankle joint
(Figure 4.5). The ankle and the First Metatarso-Phalangeal joints, among all joints of the foot,
undergo the largest ranges of motion in the sagittal plane, while moving in opposite directions
during the majority of the stance phase of gait. Both joints are crossed by the tendon of flexor
hallucis longus, which acts as a plantarflexor of the ankle and a joint-stabilizer of the First
Metatarso-Phalangeal joint. Further active stabilization of the hallux against the ground is
provided by the flexor hallucis brevis, adductor and abductor hallux muscles which exert a
plantar flexion moment. Evidence suggests that this power absorption observed at the First
Metatarso-Phalangeal joint could be the result of the flexion-pressor pull of the intrinsic foot
muscles and the flexor hallucis longus to stabilize the hallux against the ground and to
counteract the dorsiflexion and eversion moments externally produced by the ground reaction
forces.20,38 Kelly et al. (2014) further suggested that the intrinsic foot muscles also served to
decrease the stress on passive elements, such as the plantar ligaments, plantar fascia and plantar
plate, crossing the First Metatarso-Phalangeal joint.21 It may therefore be concluded that the
resistive configuration adopted by the First Metatarso-Phalangeal joint at terminal stance and
pre-swing is in accordance with earlier findings describing the mechanisms countering the
ground reaction forces.

82
There are several limitations to this study. A first issue concerns the estimation of the
center of pressure and resultant ground reaction forces for each foot segment, derived from
combining force and pressure data. The use of a proportionality scheme was originally validated
for the calculation of joint kinetics of a three segment foot model and not for a four segment
foot model.39 Validity of the proportionally scheme was assessed by comparing the predicted
shear forces obtained from the same experimental setup as the present study with the measured
shear forces obtained by asking the participants to adopt a 3 step controlled foot placement
approach on two adjacent force plates during a walking trial. Mean differences of less than 3%
between the shear force measured by 2 adjacent force plates and the shear force predicted by
the proportionality scheme in the hindfoot and forefoot segments were found in a paediatric
population. However, these results should be viewed with care as errors in the determination of
the point of force application have been found towards force plate edges.25 Therefore, the results
of the current study should be considered as an estimation and further research is needed. A
second limitation is the use of skin markers to estimate joint centers and segmental kinematics.
Soft tissue artefacts have been reported to reach 3.29 mm on the surface of the foot22, and the
impact of this error on the estimation of the moments and powers is difficult to estimate. A
third limitation concerns the recruitment of asymptomatic participants, which does not mean
that all feet were entirely free of degenerative changes in foot structure (e.g. clinical
osteoarthritic changes). Studies have shown that a sizeable percentage of asymptomatic
individuals may present abnormal findings of soft tissues on magnetic resonance imaging 9,34.
Finally, since walking speed results in different foot kinetics, the effect of walking speed on 3D
angle M should be further investigated in future studies.10
CONCLUSION
This study reports a first attempt to gain additional insight into the kinetic behaviour of
multiple foot joints through the use of a “simple” variable (3D angle M) during gait. Intrinsic
foot joints adopt a stabilized-resistive configuration during the majority of the stance phase.
Results of the current study should be considered with care as skin markers and a
proportionality scheme were used to estimate foot joint kinematics and kinetics. The notion of
stabilization, resistance and propulsion should be further investigated in subjects with foot and
ankle disorders.

83
REFERENCES
1. Allard P, Lachance R, Aissaoui R, Duhaime M. Simultaneous bilateral 3-D able-bodied
gait. Hum Mov Sci. 1996;15(3):327-346.
2. Bruening DA, Cooney KM, Buczek FL. Analysis of a kinetic multi-segment foot model.
Part I: Model repeatability and kinematic validity. Gait Posture. 2012;35(4):529-534.
3. Bruening DA, Cooney KM, Buczek FL. Analysis of a kinetic multi-segment foot model
part II: Kinetics and clinical implications. Gait Posture. 2012;35(4):535-540.
4. Bruening DA, Takahashi KZ. Partitioning ground reaction forces for multi-segment foot
joint kinetics. Gait Posture. 2018;62(March):111-116.
5. Buczek FL, Kepple TM, Siegel KL, Stanhope SJ. Translational and rotational joint
power terms in a six degree-of-freedom model of the normal ankle complex. J Biomech.
1994;27(12):1447-1457.
6. Caravaggi P, Leardini A, Crompton R. Kinematic correlates of walking cadence in the
foot. J Biomech. 2010;43(12):2425-2433.
7. Caravaggi P, Pataky T, Goulermas JY, Savage R, Crompton R. A dynamic model of the
windlass mechanism of the foot: evidence for early stance phase preloading of the plantar
aponeurosis. J Exp Biol. 2009;212(15):2491-2499.
8. De Cock a, Willems T, Witvrouw E, Vanrenterghem J, De Clercq D. A functional foot
type classification with cluster analysis based on plantar pressure distribution during
jogging. Gait Posture. 2006;23(3):339-347.
9. Culvenor AG, Oiestad BE, Hart HF, Stefanik JJ, Guermazi A, Crossley KM. Prevalence
of knee osteoarthritis features on magnetic resonance imaging in asymptomatic
uninjured adults: a systematic review and meta-analysis. Br J Sports Med. June 2018.
doi:10.1136/bjsports-2018-099257.
10. Deschamps K, Eerdekens M, Desmet D, Matricali GA, Wuite S, Staes F. Estimation of
foot joint kinetics in three and four segment foot models using an existing proportionality
scheme: Application in paediatric barefoot walking. J Biomech. 2017;61:168-175.
11. Deschamps K, Staes F, Roosen P, et al. Body of evidence supporting the clinical use of
3D multisegment foot models: A systematic review. Gait Posture. 2011;33(3):338-349.
12. Dumas R, Cheze L. Hip and knee joints are more stabilized than driven during the stance
phase of gait: An analysis of the 3D angle between joint moment and joint angular
velocity. Gait Posture. 2008;28(2):243-250.

84
13. Eerdekens M, Deschamps K, Staes F. The impact of walking speed on the kinetic
behaviour of different foot joints. Gait Posture. 2019;68(September):375-381.
14. Eerdekens M, Staes F, Matricali GA, Wuite S, Peerlinck K, Deschamps K. Quantifying
clinical misinterpretations associated to one-segment kinetic foot modelling in both a
healthy and patient population. Clin Biomech. 2019;67(May):160-165.
15. Eng JJ, Winter DA. Kinetic analysis of the lower limbs during walking: what information
can be gained from a three-dimensional model? J Biomech. 1995;28(6):753-758.
16. Fuller E a. The windlass mechanism of the foot. A mechanical model to explain
pathology. J Am Podiatr Med Assoc. 2000;90(1):35-46.
17. Hicks JH. The mechanics of the foot. J Anat. 1954;88(Pt 1):25-30.1.
18. Ingen Schenau GJ va., Cavanagh PR. Power equations in endurance sports. J Biomech.
1990;23(9):865-881.
19. van Ingen Schenau GJ. Positive work and its efficiency are at their dead-end: Comments
on a recent discussion. J Biomech. 1998;31(2):195-197.
20. Jacob HA. Forces acting in the forefoot during normal gait – an estimate. Clin Biomech.
2001;16(9):783-792.
21. Kelly LA, Cresswell AG, Racinais S, Whiteley R, Lichtwark G. Intrinsic foot muscles
have the capacity to control deformation of the longitudinal arch. J R Soc Interface.
2014;11(93):20131188-20131188.
22. Kessler SE, Rainbow MJ, Lichtwark GA, et al. A Direct Comparison of Biplanar
Videoradiography and Optical Motion Capture for Foot and Ankle Kinematics.
2019;7(August):1-10.
23. Leardini A, Benedetti MG, Berti L, Bettinelli D, Nativo R, Giannini S. Rear-foot, mid-
foot and fore-foot motion during the stance phase of gait. Gait Posture. 2007;25(3):453-
462.
24. Legnani G, Casolo F, Righettini P, Zappa B. A homogeneous matrix approach to 3D
kinematics and dynamics — I. Theory. Mech Mach Theory. 1996;31(5):573-587.
25. List R, Hitz M, Angst M, Taylor WR, Lorenzetti S. Gait & Posture In-situ force plate
calibration : 12 years ’ experience with an approach for correcting the point of force
application. Gait Posture. 2017;58(July):98-102.
26. MacWilliams B a., Cowley M, Nicholson DE. Foot kinematics and kinetics during
adolescent gait. Gait Posture. 2003;17(3):214-224.
27. Maharaj JN, Cresswell AG, Lichtwark GA. The mechanical function of the tibialis
posterior muscle and its tendon during locomotion. J Biomech. 2016;49(14):3238-3243.

85
28. Mann RA. Biomechanics of the foot. Atlas Orthot Biomech Princ Appl. 1975:257-266.
29. McKeon PO, Hertel J, Bramble D, Davis I. The foot core system: a new paradigm for
understanding intrinsic foot muscle function. Br J Sports Med. 2015;49(5):290-290.
30. Morlock M, Nigg BM. Theoretical considerations and practical results on the influence
of the representation of the foot for the estimation of internal forces with models. Clin
Biomech. 1991;6(1):3-13.
31. Nester C, Jones RK, Liu a, et al. Foot kinematics during walking measured using bone
and surface mounted markers. J Biomech. 2007;40(15):3412-3423.
32. Nester CJ. Lessons from dynamic cadaver and invasive bone pin studies: do we know
how the foot really moves during gait? J Foot Ankle Res. 2009;2(1):18.
33. Nester CJ, Liu a M, Ward E, et al. In vitro study of foot kinematics using a dynamic
walking cadaver model. J Biomech. 2007;40(9):1927-1937.
34. O’Neil J, McDonald E, Chapman T, Casper D, Shakked R, Pedowitz D. Anterior
Talofibular Ligament Abnormalities on Routine Magnetic Resonance Imaging of the
Ankle. Foot Ankle Orthop. 2017;2(3):2473011417S0003.
35. Okita N, Meyers SA, Challis JH, Sharkey NA. Midtarsal joint locking: New perspectives
on an old paradigm. J Orthop Res. 2014;32(1):110-115.
36. Perez HR, Reber LK, Christensen JC. The Effect of Frontal Plane Position on First Ray
Motion: Forefoot Locking Mechanism. Foot Ankle Int. 2008;29(1):72-76.
37. Péter A, Hegyi A, Finni T, Cronin NJ. In vivo fascicle behavior of the flexor hallucis
longus muscle at different walking speeds. Scand J Med Sci Sports. 2017;27(12):1716-
1723.
38. Péter A, Hegyi A, Stenroth L, Finni T, Cronin NJ. EMG and force production of the
flexor hallucis longus muscle in isometric plantarflexion and the push-off phase of
walking. J Biomech. 2015;48(12):3413-3419.
39. Saraswat P, MacWilliams BA, Davis RB, D’Astous JL. Kinematics and kinetics of
normal and planovalgus feet during walking. Gait Posture. 2014;39(1):339-345.
40. Shumway-Cook Anne WMH. Summary for Policymakers. In: Intergovernmental Panel
on Climate Change, ed. Climate Change 2013 - The Physical Science Basis. Cambridge:
Cambridge University Press; 2012:1-30.
41. Takahashi KZ, Worster K, Bruening DA. Energy neutral: the human foot and ankle
subsections combine to produce near zero net mechanical work during walking. Sci Rep.
2017;7(1):15404.

86
42. Thordarson DB, Schmotzer H, Chon J, Peters J. Dynamic support of the human
longitudinal arch. A biomechanical evaluation. Clin Orthop Relat Res. 1995;(316):165-
172.
43. Wager JC, Challis JH. Elastic energy within the human plantar aponeurosis contributes
to arch shortening during the push-off phase of running. J Biomech. 2016;49(5):704-709.
44. Wu G, Siegler S, Allard P, et al. ISB recommendation on definitions of joint coordinate
system of various joints for the reporting of human joint motion—part I: ankle, hip, and
spine. J Biomech. 2002;35(4):543-548.
45. Zelik KE, Honert EC. Ankle and foot power in gait analysis: Implications for science,
technology and clinical assessment. J Biomech. 2018;75:1-12.

87
Chapter 5 : Post-sprain versus post-fracture post-traumatic
ankle osteoarthritis : impact on foot and ankle kinematics
and kinetics
Paul-André Deleu,1,2 Thibaut Leemrijse,2 Laurence Chèze,1 Alexandre Naaim,1
Raphaël Dumas,1 Bernhard Devos Bevernage,2 Ivan Birch,4 Jean-Luc Besse3
1Univ Lyon, Université Claude Bernard Lyon 1, IFSTTAR, LBMC UMR_T9406,F69622, Lyon, France
2Foot & Ankle Institute, Brussels, Belgium
3Hospices Civils de Lyon, Centre Hospitalier Lyon-Sud, Service de Chirurgie Orthopédique et
Traumatologique, France
4Sheffield Teaching Hospitals NHS Foundation Trust, Woodhouse Clinic, 3 Skelton Lane, Sheffield S13 7LY,
United Kingdom
This manuscript was submitted online the 21th September 2019 and is presently being given full
consideration for publication in Clinical Biomechanics journal.

88
ABSTRACT
Background: The most common etiologies for post-traumatic end-stage ankle osteoarthritis
are ankle fractures and chronic ankle instability. As the nature of trauma is different for these
two etiologies, it might be expected that the two subtypes of post-traumatic ankle osteoarthritis
would display different foot mechanics during gait. The overall objective of this study was to
compare the foot kinematics and kinetics of patients suffering from post-fracture ankle
osteoarthritis with those of patients suffering from post-sprain ankle osteoarthritis.
Methods: Twenty-nine subjects with post-traumatic ankle osteoarthritis and fifteen
asymptomatic control subjects participated in this study. A four-segment kinematic and kinetic
foot model was used to calculate intrinsic foot joint kinematics and kinetics during gait. Anova
and statistical parametric mapping were used to compare the data from the two groups.
Findings: No differences in the joint angles and moments were found between the two post-
traumatic ankle osteoarthritis groups. Both osteoarthritis groups showed decreased spatio-
temporal variables, and reduced ankle joint angles and moments compared to the control
subjects. Post-fracture ankle osteoarthritis group were found to exhibit lower power generation
at the Lisfranc joint complex, and lower power absorption at the first metatarso-phalangeal joint
compared to the control group.
Interpretation: No differences were found in foot joint mechanics between the two post-
traumatic ankle osteoarthritis groups. However, both pathological groups showed altered foot
mechanics during gait compared to the control subjects. Alteration in foot mechanics was not
limited to the painful ankle joint, but also affected the kinetics of the neighbouring foot joints.
Keywords: post-traumatic osteoarthritis; ankle osteoarthritis; foot kinetics; foot
kinematics; gait

89
INTRODUCTION
Ankle osteoarthritis (OA) is a progressive and degenerative joint disease affecting
approximately 1% of the world’s adult population.26 Recent publications have demonstrated
that the degree of physical impairment from ankle osteoarthritis is at least as severe as that from
congestive heart failure and hip osteoarthritis using the SF-36.9,22 Numerous clinical and
epidemiologic studies of patients suffering from ankle osteoarthritis have identified previous
trauma as the most common aetiology.21,26 Post-traumatic ankle osteoarthritis most frequently
occurs secondary to ankle-related fractures (post-fracture) and to chronic ankle instability (post-
sprain).21 Evidence suggests that post-fracture ankle osteoarthritis results either from
irreversible cartilage damage which occurs at the time of the fracture, or from chronic cartilage
overloading which occurs as a result of post-fracture articular incongruity. The evidence also
suggests that post-sprain ankle osteoarthritis results from pathological cartilage overloading due
to chronic joint instability.15
Significant biomechanical alterations of the entire foot and lower limb have been
reported in patients suffering from post-traumatic ankle osteoarthritis.24,28 Their gait is
asymmetrical and characterized by a decreased walking speed, decreased stride length and
reduced mobility of the ankle joint complex.29 They also seem to adopt an antalgic walking
strategy to prevent shear loading through the painful joint.29 Despite this knowledge, no study
has so far compared the gait mechanics of patients suffering from post-fracture ankle
osteoarthritis to those of patients suffering from post-sprain ankle osteoarthritis. Moreover,
ankle joint kinetics reported in patients suffering from post-traumatic ankle osteoarthritis have
in the past been calculated using a rigid foot modelling approach, which is known to
overestimate the amount of ankle joint power, potentially leading to clinical
misinterpretations.6,30 The development of a more full understanding of the difference in the
gait mechanics, including those of both the ankle joint and intrinsic joints of the foot, of these
two subgroups of patients is therefore required. Currently, to the authors’ knowledge, no
research has been conducted using patients suffering from the two types of post-traumatic ankle
osteoarthritis using a four-segment kinetic foot model. This approach may show kinetic patterns
to occur that a rigid foot model would mask, and give additional information regarding forefoot
function by assessing Chopart and Lisfranc joint complex kinetics.
The overall objective of this study was to compare the foot kinematics and kinetics of
patients suffering from post-fracture ankle osteoarthritis with those of patients suffering from
90
post-sprain ankle osteoarthritis. As the nature of the causative trauma is different, one might
expect that the two types of post-traumatic ankle osteoarthritis would display different foot
mechanics during gait. In addition, each pathological group was individually compared to an
asymptomatic group of peer-matched control subjects.
METHODS
Participants
A convenience sample of twenty-nine subjects with post-traumatic ankle osteoarthritis
and fifteen asymptomatic subjects (CTRL) participated in this study (Table 5.1). All patients
suffered from post-traumatic ankle osteoarthritis secondary to ankle-related fracture (post-
fracture (PF OA; n=15 subjects; 9 males and 6 females) or to chronic ankle instability (post-
sprain (PS OA; n=14 subjects; 9 males and 5 females). Exclusion criteria for both post-
traumatic groups were (1) being younger than 18 years, (2) systemic or neurological diseases,
(3) any medical problem other than post-traumatic ankle osteoarthritis that could possibly affect
gait. The inclusion criteria for the pathological groups were post-traumatic end-stage ankle
osteoarthritis with an indication for either ankle fusion or total ankle replacement. The severity
of ankle osteoarthritis was scored using the Canadian Orthopaedic Foot & Ankle Society
(COFAS) classification system (Table 5.1).12 Control subjects (10 males and 5 females) were
peer-matched with both PF and PS OA groups according to their demographics. Exclusion
criteria for the control subjects were any medical problems that could possibly affect normal
gait. The local ethical committee approved the study (B200-2017-061) and all participants
signed an informed consent form.
Data collection
Participants were first fitted with sixteen 8mm retro-reflective markers on the foot and
shank in accordance with the multi-segment Rizzoli foot model.13 The measurement protocol
was started by asking participants to walk at a self-selected speed along a 10m walkway in
which a pressure plate (Footscan®, dimensions 0.58 m x 0.42 m, 4096 sensors, 2.8 sensors per
cm2, RSscan International, Paal, Belgium) was mounted upon an AMTI force plate (Advanced
Mechanical Technology, Inc., Watertown, MA, US). The force plate was custom-made to fit
the surface dimensions of the plantar pressure plate. The advantage of this set-up was the
continuous calibration of the pressure plate with the force plate using an RsScan® 3D interface
box (RSscan International, Paal, Belgium). A passive optoelectronic motion analysis system

91
(Qualysis, Göteborg Sweden) comprised of 8 Miqus cameras tracked the kinematic data of the
participants while walking over the instrumented walkway. The integration and synchronization
of the three hardware devices was achieved by connecting them using a Miqus Sync unit
interface (Qualysis, Göteborg Sweden). Data from the three hardware devices were measured
at a sampling rate of 200Hz. Data was collected from five valid trials for each participant. A
trial was considered valid when the foot under investigation made a clear contact with the
pressure and force plate combination without visible gait adjustments. Walking speed was also
required to remain relatively constant across all trials of a recording session. All marker
trajectories were calculated using Qualysis Tracking Manager 2.16 (Qualysis, Göteborg
Sweden).
Data analysis
Inter-segment center definitions of the four segment foot model were based on an adapted
version of Instituto Orthopedico Rizzoli 3D multi-segment foot model developed by
Deschamps et al. (2017) (IOR-4Segment-model 1) (Figure 5.1).2 The ankle joint center was
defined as the midpoint between the malleoli markers, and motion at this joint was considered
to describe the motion between the foot and the shank. This was the only joint considered in
the 1-segment foot model. In the 4-segment model, the same joint center was used to describe
the motion between the calcaneus and the shank (hereafter referred as shank-calcaneus). To
define the calcaneus-midfoot joint center, an additional virtual cuboid marker was created and
defined as being at 2/3 of the distal distance between the peroneal tubercle and the base of the
fifth metatarsal. The calcaneus-midfoot joint center was defined as the midpoint between the
cuboid and the navicular bone (hereafter referred as Chopart joint). The midfoot-metatarsus
center (hereafter referred as Lisfranc joint complex) was defined as being on the base of the
second metatarsal. The first metatarso-phalangeal joint center was defined as being at
intersection of the projection of the first metatarsal head marker vertically at mid distance and
the floor.2 Inter-segment 3D rotations were calculated according to IOR-4Segment-model 1 of
Deschamps et al. (2017) following ISB recommendations.2
Joint forces (F) and moments (M) were calculated in the Inertial Coordinate System using
a bottom-up inverse dynamic method utilising a Newton-Euler recursive algorithm based on a
homogeneous matrix formalism during the stance phase of gait.14 Kinematic and force data
were filtered using a low-pass zero-lag, 4th order, Butterworth filter, with a cut-off frequency
of 10 Hz. Inertia and weight parameters of each foot segment were not accounted for
considering that the inertia effects were negligible during stance in comparison to the external

92
forces.8,20 The force plate data were distributed over each foot segment using a validated
proportionality scheme.5,23 The estimation of the subarea of each foot segment was achieved
for each time frame by projecting the markers’ position vertically onto the sensor matrix of the
pressure platform. The resulting center of pressure (CoP) of each estimated subarea was then
used as the CoP for the corresponding foot segment in the inverse dynamics calculations. The
joint moments were expressed in the proximal segment coordinate system. In addition to the
joint power, the 3D angle M between the joint moment (M) and the joint angular velocity ()
vectors was calculated as described by Dumas and Chèze (2008).3 When the 3D angle M was
smaller than 60° or greater than 120°, the moment was considered to result mainly in the joint
being driven in propulsion (P) or resistance (R) respectively. If the 3D angle M was between
60° and 120°, the moment was considered to result in the joint being mainly stabilized (S).3 An
in-house written Matlab© program (The Mathworks Inc., Natick, Massachusetts, US) was used
for inter-segment kinematic and kinetic computations. Internal joint moments and powers were
normalized by subject-mass, and all one-dimensional data were time-normalized to 100% of
the stance phase.
Figure 5.1 : Inter-segment center definitions were defined
according to an adapted version of Rizzoli foot model (Leardini et
al. 2007) developed by Deschamps et al. (2017) (IOR-4Segment-
model 1). Markers name: upper ridge of the posterior surface of
the calcaneus (FC); peroneal tubercle (FPT); sustentaculum tali
(FST); virtual cuboid marker (FCub), tuberosity of the navicular
bone (FNT); first, second and fifth metatarsal base (FMB, SMB,
FMT); first, second and fifth metatarsal head (FM1,FM2, FM5);
PD6: distal dorso-medial aspect of the head of the proximal
phalanx of the hallux; First Metatarso-phalangeal joint center
(FM1; Midfoot-Metatarsus center (SMB); Calcaneus-Midfoot
center (ID)

93
Statistical analysis
First, a Shapiro-Wilk test was used to check for data normality. A one-way ANOVA test
and Kruskal-Wallis test were used to identify statistically significant differences between
groups for demographic and spatio-temporal data. In cases where significant differences were
observed, a Post hoc Tukey honest significant difference test was used to indicate which groups
were different. An adjusted P-value (0.05/3=0.017) was used to control the type 1 error rate
when performing multiple comparisons. All statistical tests were conducted using SPSS
(version 25, IBM Corp, Chicago, USA).
One-dimensional statistical parametric mapping (SPM) was used to compare foot
kinematics and kinetics between groups using an open-source code (v.M.0.4.5;
www.spm1d.org) in Matlab© (The Mathworks Inc., Natick, Massachusetts, US).7,17 The main
advantages of this methodological approach are that SPM regards the whole time-series as the
unit of observation, and that time dependence is incorporated directly in the statistical testing.
The scalar output one-way between subjects ANOVA (SPM{F}) was calculated separately for
each time interval. To test the null hypothesis, the critical threshold at which only = 5% of
smooth random curves would be expected to cross was calculated. This threshold was based on
estimates of trajectory smoothness gained from temporal gradients19 and Random Field
Theory.17 This approach was validated for 1D data.18 Individual probability values were then
calculated for each supra-threshold cluster that could have resulted from an equally smooth
random process. If statistical significance was reached in the SPM{F}, then post-hoc two-
sample t-test (SPM{t})(post-hoc p-value 0.05/3 = 0.017) was performed to determine the
between-group differences (using the same processes as described above to establish the
significance of the SPM{F}).
RESULTS
Demographic and spatio-temporal data
No significant differences between the groups were found for age, weight, height or BMI
(Table 5.1). No significant differences were found between PF OA and PS OA groups for
walking speed or stride length (Table 5.1). However, both post-traumatic ankle OA groups
showed significantly shorter stride lengths (P<0.001) and slower walking speeds than the
control group (P<0.001).

94
Table 5-1 : Demographic and spatio-temporal data between 1) post-sprain post-traumatic ankle osteoarthritis (PS OA); 2) post-traumatic post-fracture ankle osteoarthritis (PF OA) and 3)
asymptomatic control subjects (CTRL). Abbreviations: COFAS: Canadian Orthopaedic Foot & Ankle Society classification system for ankle osteoarthritis (Type 1 has isolated ankle osteoarthritis;
Type 2 signifies ankle osteoarthritis associated with intra-articular ankle deformity or a tight heel cord or both, Type 3 patients have ankle osteoarthritis with deformity of the hind- or
midfoot, tibia or forefoot; and Type 4 includes Type 1 to Type 3 plus subtalar or calcaneocuboid or talonavicular osteoarthritis); SD:standard deviation; BMI: body mass index; N.S.: not
significant. *Post hoc Tukey honestly test (adjusted p-value 0.3/3=0.017).
PS OA (n=15 ankles) PF OA (n=15 ankles) CTRL (n= 15 ankles) ANOVA (F)a /
Kruskal-Wallis (H)b
CAI OA vs
PF OA
CAI OA vs
CTRL
PF OA vs
CTRL Mean SD Min-Max Mean SD Min-Max Mean SD Min-Max F / H P-value P-value P-value P-value
Age (years) 63.86 5.96 51-70 58.47 9.79 38-74 59.67 7.96 43-70 3.216 (H) 0.196 N.S. N.S. N.S.
Height (m) 1.72 0.11 1.48-1.90 1.73 0.08 1.57-1.85 1.72 0.07 1.63-1.83 0.218 (H) 0.897 N.S. N.S. N.S.
Weight (kg) 82.64 12.50 59-100 84.13 15.09 64-111 77.36 15.85 53-111 0.888 (F) 0.419 N.S. N.S. N.S.
BMI 28.01 4.23 21.7-34.6 28.01 4.21 21.4-34.6 26 4.27 20.0-34.6 1.109 (F) 0.34 N.S. N.S. N.S.
Walking
Speed (m/s) 0.91 0.17 0.61-1.27 0.97 0.19 0.65-1.27 1.25 0.15 0.96-1.46 16.498 (F) < 0.001 0.592* < 0.001* < 0.001*
Stride
Length
(% Height)
0.64 0.05 0.56-0.75 0.65 0.09 0.44-0.75 0.78 0.06 0.66-0.88 19.835 (F) < 0.001 0.940* < 0.001* < 0.001*
CO
FA
S Type 1 4 Type 1 7
N/A
Type 2 5 Type 2 0
Type 3 5 Type 3 6
Type 4 1 Type 4 2

95
SPM analysis
The results showed significant SPM{F} main effects for all three groups for foot kinematics
(ankle, shank-calcaneus, Chopart), and kinetics (ankle, shank-calcaneus, Chopart, Lisfranc,
first metatarso-phalangeal joints). Post-hoc comparisons of the time-series data showed no
differences between PF OA and PS OA groups for all foot kinematic and kinetic variables. In
contrast, differences were shown in kinematics and kinetics between PF OA and CTRL groups
and between PS OA and CTRL groups.
Foot joint angles
During loading response and midstance, the PF OA group showed a more
abducted shank-calcaneus joint position (P=0.003; 0-60%) associated with a less
abducted position of the Chopart joint (P=0.012; 4-26%) compared to the CTRL
group. Further significant differences were found at pre-swing, where the ankle and
shank-calcaneus joints of both pathological groups exhibited a less plantarflexed
position (PS vs CTRL : ankle (P=0.006) & shank-calcaneus (P=0.017); PF vs CTRL
: ankle (P=0.012) & shank-calcaneus (P=0.015)) as well as a less adducted shank-
calcaneus position compared to CTRL (PS vs CTRL : shank-calcaneus (P=0.017);
PF vs CTRL : shank-calcaneus (P=0.016)) (Figure 5.2).
Joint moments
Comparison of the joint moments of all intrinsic joints of the foot of the two
pathological groups to those of the CTRL group, showed the largest differences to
occur in the sagittal plane at between pathological 60% and 86% of the stance phase
of gait (P<0.001)(Figure 5.3-5.5). The PS OA group also showed a decreased
abduction moment at the ankle (P=0.007; 57-62%) and the shank-calcaneus joint
(P<0.001; 54-66%) compared to the CTRL group. In contrast, the PF OA group
showed only a decreased abduction moment at the shank-calcaneus joint (vs CTRL :
P<0.001; 54-66%). With respect to the frontal plane, significant differences were
only observed for the ankle joint (for both pathological groups) and for the first
metatarso-phalangeal joint (PF OA) compared to CTRL.

96
Figure 5.2 : Kinematic waveforms representation with +/- 1 standard deviation cloud for the intrinsic joints of the foot:
Ankle (between the Foot and Shank); Sha-Cal: Shank-Calcaneus ; 1st Metatarso-Phal: 1st Metatarso-Phalangeal joint. PS OA
group (blue), CTRL group (green) and PF OA (purple); DF: dorsiflexion ; PF: plantarflexion; Add: Adduction ; Abd :Abduction ;
Inv: Inversion ; Ev: Eversion.
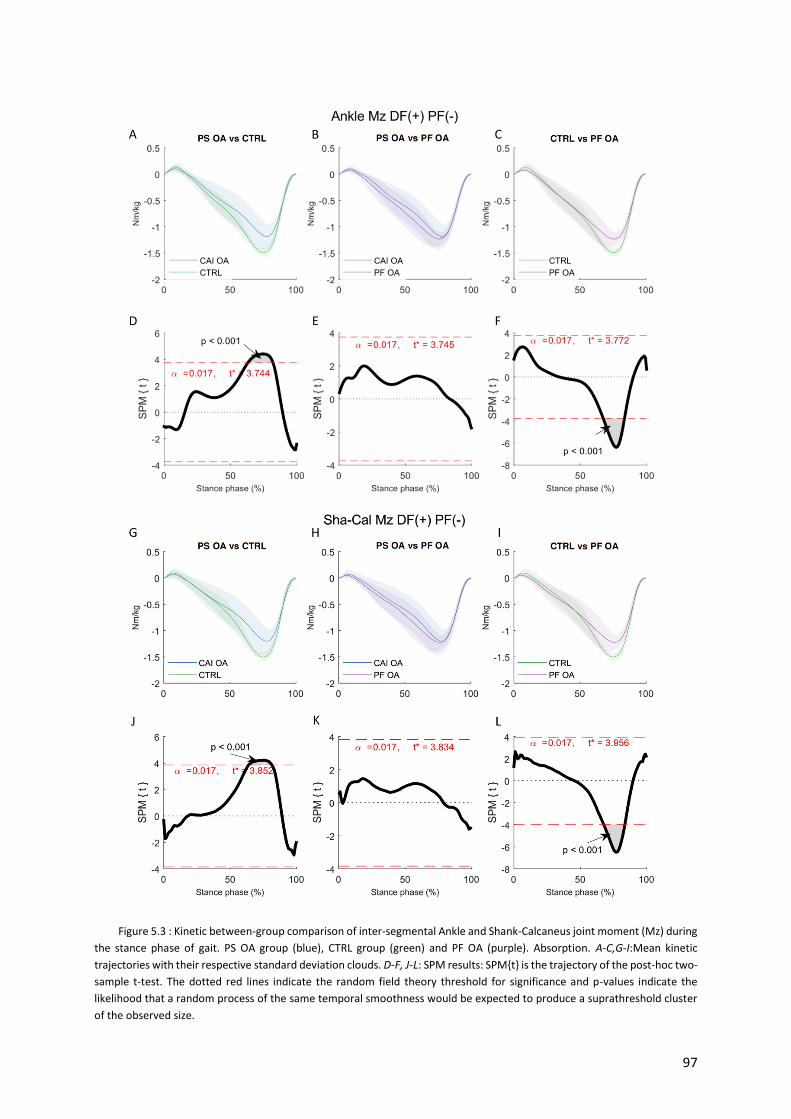
97
Figure 5.3 : Kinetic between-group comparison of inter-segmental Ankle and Shank-Calcaneus joint moment (Mz) during
the stance phase of gait. PS OA group (blue), CTRL group (green) and PF OA (purple). Absorption. A-C,G-I:Mean kinetic
trajectories with their respective standard deviation clouds. D-F, J-L: SPM results: SPM{t} is the trajectory of the post-hoc two-
sample t-test. The dotted red lines indicate the random field theory threshold for significance and p-values indicate the
likelihood that a random process of the same temporal smoothness would be expected to produce a suprathreshold cluster
of the observed size.

98
Figure 5.4 : Kinetic between-group comparison of inter-segmental Ankle and Shank-Calcaneus joint power during the
stance phase of gait. PS OA group (blue), CTRL group (green) and PF OA (purple). Abbreviations: Gen (+): Generation ; Abs (-
): Absorption. A-C,G-I: Mean kinetic trajectories with their respective standard deviation clouds. D-F, J-L: SPM results: SPM{t}
is the trajectory of the post-hoc two-sample t-test. The dotted red lines indicate the random field theory threshold for
significance and p-values indicate the likelihood that a random process of the same temporal smoothness would be expected
to produce a suprathreshold cluster of the observed size.

99
Figure 5.5 : Kinetic between-group comparison of inter-segmental Lisfranc joint moment (Mz) and power during the
stance phase of gait. PS OA group (blue), CTRL group (green) and PF OA (purple). Abbreviations: Gen (+): Generation; Abs (-):
Absorption. A-C,G-I: Mean kinetic trajectories with their respective standard deviation clouds. D-F, J-L: SPM results: SPM{t} is
the trajectory of the post-hoc two-sample t-test. The dotted red lines indicate the random field theory threshold for
significance and p-values indicate the likelihood that a random process of the same temporal smoothness would be expected
to produce a suprathreshold cluster of the observed size.

100
Power and 3D angle M
During loading response, a significantly lower ankle power absorption was observed for
both pathological groups (PS vs CTRL (P=0.004; 6-11%); PF vs CTRL (P=0.012; 3-8%))
(Figure 5.4). In addition, the PS OA group demonstrated a lack of resistance-configuration
during loading response (P=0.015) compared to the CTRL group based on 3D angle M. At
the end of midstance, the PF OA group showed a lower ankle power absorption compared to
the CTRL group. At heel off, significantly lower ankle and shank-calcaneus power generation
were observed for both pathological groups compared to the CTRL group (Figure 5.4). More
noteworthy differences in power patterns were observed for the PF OA group highlighting
lower Lisfranc joint complex power generation (P<0.001; 79-87%) as well as lower power
absorption at the first metatarso-phalangeal joint (P<0.001; 75-85%) compared to CTRL
(Figure 5.5).
DISCUSSION
To our knowledge, this was the first study to compare the foot kinematics and kinetics of
patients suffering from post-fracture ankle osteoarthritis to those of patients suffering from
post-sprain ankle osteoarthritis. We did not find any differences in joint angles and moments
between the pathological groups. We believe that there may be two possible explanations for
this lack of differences. Firstly, patients suffering from end-stage ankle osteoarthritis adopt an
antalgic walking strategy to prevent shear loading through their painful ankle joint.29 This may
suggest that the results of this study could be attributed to the fact that both pathological groups
had adopted a similar walking pattern to avoid pain in their arthritic ankle. Secondly, patients
with ankle osteoarthritis often present concomitant foot and ankle deformities, which may affect
the intrinsic foot joint mechanics during gait.10,11 It is therefore plausible to suggest that both
pathological groups may have had similar intra- and extra-articular foot and ankle deformities,
the effects of which masked the more subtle differences resulting from the primary pathologies.
Future biomechanical studies should therefore include the assessment of intra- and extra-
articular foot and ankle deformities, the addition of which may provide further insight into the
mechanical deficits associated with ankle osteoarthritis.

101
One of the objectives of this study was also to compare the foot mechanics of patients
suffering from post-traumatic ankle osteoarthritis to those of a group of asymptomatic subjects.
Overall, the gait alterations identified were comparable with corresponding results from
previous studies. The gait of our post-traumatic patients was characterized by a decreased
walking speed, decreased stride length and reduced ankle kinematics and kinetics in comparison
with the CTRL group.1,24,26 A reduction in sagittal plane range of motion (ROM) at the ankle
and shank-calcaneus joints, particularly during pre-swing, as well as a reduced transverse plane
ROM at the shank-calcaneus joint, were observed in both pathological osteoarthritis groups
compared to the CTRL group. These findings are in accordance with those from previous
studies.1,24,29 In contrast to the results of Valderrabano et al. (2007), no significant reduction in
ROM was observed in the frontal plane. However, both post-traumatic ankle osteoarthritis
groups tended to have a more inverted ankle and shank-calcaneus joint position during loading
response and early midstance compared to the CTRL group. Furthermore, the PF OA group
exhibited a significantly more adducted position of the Chopart joint during the same period of
gait. It is reasonable to assume that the inverted hindfoot position, in association with a more
adducted position of the Chopart joint, may be explained by a co-contraction phenomenon
between the tibialis anterior and gastrocnemius muscle, both foot and ankle adductor and
invertor muscles, in an attempt to keep the ankle joint stable from heel strike to midstance.25
Multi-segment kinetic foot models have recently been shown to be sensitive enough to
detect differences between the gait of healthy subjects and the gait of patients with ankle
osteoarthritis.6,20 This study has provided further insight into the kinetic behavior of the Chopart
joint and Lisfranc joint complex by using a four-segment foot model. The results showed that
both post-traumatic ankle osteoarthritis groups displayed significantly less plantarflexion
moment for all intrinsic joints of the foot during propulsion compared to the control group.
Valderrabano et al. (2007) suggested that the reduction of moments in post-traumatic ankle
osteoarthritis may be a consequence of the associated atrophy and weakness of the lower leg
muscles or a protective gait strategy to reduce loading in the painful joint.29
Direct comparison between the two ankle osteoarthritis groups revealed no differences in
joint power. However, when the two groups were individually compared to the CTRL group,
the results suggested that PS OA reduces power generation only at the ankle and shank-
calcaneus joints, whereas PF OA results in reductions in joint power at the ankle and shank-
calcaneus joints as well as at the Lisfranc and first metatarso-phalangeal joints. This could be
explained by the nature of trauma in the PF OA group, as the soft-tissue envelope around the
fractured ankle may have become scarred and inelastic due to fibrosis after osteosynthesis

102
surgery, affecting the functioning of the extrinsic foot muscle tendons, and thus the function of
the joints distal to the ankle joint. Previous studies have provided further evidence of lower leg
muscle dysfunction in patients suffering from end-stage post-traumatic ankle osteoarthritis
resulting from secondary arthritic muscle atrophy, arthrogenous muscle inhibition or a
combination of the two.16,25
Since walking speed affects foot kinetics, caution should be exercised when interpreting the
differences in joint moments and power between our pathological groups and the control group
as their walking speed differed.4 However, it is of interest to note that the 1D-analysis did not
reveal any significant differences in the 3D angle M variable between the groups. This could
mean that subjects suffering from post-traumatic ankle osteoarthritis have adapted their gait to
avoid loading the painful ankle without affecting how the joints of the foot are driven or
stabilized by the moments. The findings therefore suggest that walking speed may not fully
explain the differences observed in foot kinetics between the CTRL and the ankle osteoarthritis
groups. Future studies investigating foot joint kinetics should address this limitation by
comparing symptomatic subjects with speed-matched control subjects.
CONCLUSION
This paper provides the first quantification and comparison of multi-segment foot
kinematics and kinetics between subjects suffering from post-fracture ankle osteoarthritis and
post-sprain ankle osteoarthritis. No significant differences were found between the two
pathological groups. However, it was found that the alteration in foot mechanics in the two
pathological groups was not limited to the painful ankle joint, but also affected the kinetics of
the adjacent and non-adjacent foot.

103
REFERENCES
1. Berti L, Vannini F, Lullini G, Caravaggi P, Leardini A, Giannini S. Functional evaluation
of patients treated with osteochondral allograft transplantation for post-traumatic ankle
arthritis: One year follow-up. Gait Posture. 2013;38(4):945-950.
2. Deschamps K, Eerdekens M, Desmet D, Matricali GA, Wuite S, Staes F. Estimation of
foot joint kinetics in three and four segment foot models using an existing proportionality
scheme: Application in paediatric barefoot walking. J Biomech. 2017;61:168-175.
3. Dumas R, Cheze L. Hip and knee joints are more stabilized than driven during the stance
phase of gait: An analysis of the 3D angle between joint moment and joint angular
velocity. Gait Posture. 2008;28(2):243-250.
4. Eerdekens M, Deschamps K, Staes F. The impact of walking speed on the kinetic
behaviour of different foot joints. Gait Posture. 2019;68(September):375-381.
5. Eerdekens M, Staes F, Matricali GA, Deschamps K. Clinical Applicability of an Existing
Proportionality Scheme in Three-Segment Kinetic Foot Models. Ann Biomed Eng.
August 2019. doi:10.1007/s10439-019-02344-8.
6. Eerdekens M, Staes F, Matricali GA, Wuite S, Peerlinck K, Deschamps K. Quantifying
clinical misinterpretations associated to one-segment kinetic foot modelling in both a
healthy and patient population. Clin Biomech. 2019;67(May):160-165.
7. Friston KJ, Holmes AP, Worsley KJ, Poline J-P, Frith CD, Frackowiak RSJ. Statistical
parametric maps in functional imaging: A general linear approach. Hum Brain Mapp.
1994;2(4):189-210.
8. Futamure S, Bonnet V, Dumas R, Venture G. A sensitivity analysis method for the body
segment inertial parameters based on ground reaction and joint moment regressor
matrices. J Biomech. 2017;64:85-92.
9. Glazebrook M, Daniels T, Younger A, et al. Comparison of Health-Related Quality of
Life Between Patients with End-Stage Ankle and Hip Arthrosis. J Bone Joint Surg Am.
2008;90(3):499-505.
10. Grier AJ, Schmitt AC, Adams SB, Queen RM. The effect of tibiotalar alignment on
coronal plane mechanics following total ankle replacement. Gait Posture. 2016;48:13-
18.
11. Khazzam M, Long JT, Marks RM, Harris GF. Preoperative gait characterization of
patients with ankle arthrosis. Gait Posture. 2006;24(1):85-93.

104
12. Krause FG, Di Silvestro M, Penner MJ, et al. Inter- and intraobserver reliability of the
COFAS end-stage ankle arthritis classification system. Foot Ankle Int. 2010;31(2):103-
108.
13. Leardini a, Benedetti MG, Berti L, Bettinelli D, Nativo R, Giannini S. Rear-foot, mid-
foot and fore-foot motion during the stance phase of gait. Gait Posture. 2007;25(3):453-
462.
14. Legnani G, Casolo F, Righettini P, Zappa B. A homogeneous matrix approach to 3D
kinematics and dynamics — I. Theory. Mech Mach Theory. 1996;31(5):573-587.
15. McKinley TO, Rudert MJ, Koos DC, Brown TD. Incongruity versus Instability in the
Etiology of Posttraumatic Arthritis. Clin Orthop Relat Res. 2004;423:44-51.
16. Nüesch C, Huber C, Pagenstert G, von Tscharner V, Valderrabano V. Muscle activation
of patients suffering from asymmetric ankle osteoarthritis during isometric contractions
and level walking – A time–frequency analysis. J Electromyogr Kinesiol.
2012;22(6):939-946.
17. Pataky TC. One-dimensional statistical parametric mapping in Python. Comput Methods
Biomech Biomed Engin. 2012;15(3):295-301.
18. Pataky TC, Vanrenterghem J, Robinson MA. The probability of false positives in zero-
dimensional analyses of one-dimensional kinematic, force and EMG trajectories. J
Biomech. 2016;49(9):1468-1476.
19. Penny W, Friston K, Ashburner J, Kiebel S, Nichols T. Statistical Parametric Mapping:
The Analysis of Functional Brain Images.; 2007. doi:10.1016/B978-0-12-372560-
8.X5000-1.
20. Rouhani H, Favre J, Crevoisier X, Aminian K. A wearable system for multi-segment
foot kinetics measurement. J Biomech. 2014;47(7):1704-1711.
21. Saltzman CL, Salamon ML, Blanchard GM, et al. Epidemiology of ankle arthritis: report
of a consecutive series of 639 patients from a tertiary orthopaedic center. Iowa Orthop
J. 2005;25:44-46.
22. Saltzman CL, Zimmerman B, O’Rrourke M, Brown T, Buckwalter J, Johnston R. Impact
of comorbidities on the management of Health in Patients with Ankle Osteoarthritis. J
Bone Joint Surg. 2006;88(11):2366-2372.
23. Saraswat P, MacWilliams BA, Davis RB, D’Astous JL. Kinematics and kinetics of
normal and planovalgus feet during walking. Gait Posture. 2014;39(1):339-345.

105
24. Segal AD, Shofer J, Hahn ME, Orendurff MS, Ledoux WR, Sangeorzan BJ. Functional
Limitations Associated with End-Stage Ankle Arthritis. J Bone Joint Surg Am.
2012;94(9):777-783.
25. von Tscharner V, Valderrabano V. Classification of multi muscle activation patterns of
osteoarthritis patients during level walking. J Electromyogr Kinesiol. 2010;20(4):676-
683.
26. Valderrabano V, Horisberger M, Russell I, Dougall H, Hintermann B. Etiology of ankle
osteoarthritis. Clin Orthop Relat Res. 2009;467(7):1800-1806.
27. Valderrabano V, Nigg BM, Hintermann B, et al. Muscular lower leg asymmetry in
middle-aged people. Foot Ankle Int. 2007;28(2):242-249.
28. Valderrabano V, Nigg BM, von Tscharner V, Stefanyshyn DJ, Goepfert B, Hintermann
B. Gait analysis in ankle osteoarthritis and total ankle replacement. Clin Biomech.
2007;22(8):894-904.
29. Zelik KE, Honert EC. Ankle and foot power in gait analysis: Implications for science,
technology and clinical assessment. J Biomech. 2018;75:1-12.

106
Chapter 6 : The effect of ankle and hindfoot malalignment on
foot mechanics in patients suffering from post-traumatic
ankle osteoarthritis
Paul-André Deleu,1,2 Alexandre Naaim,1 Laurence Chèze,1 Raphaël Dumas,1
Bernhard Devos Bevernage,2 Jean-Luc Besse,3 Thibaut Leemrijse2
1Univ Lyon, Université Claude Bernard Lyon 1, IFSTTAR, LBMC UMR_T9406,F69622, Lyon, France
2Foot & Ankle Institute, Brussels, Belgium
3Hospices Civils de Lyon, Centre Hospitalier Lyon-Sud, Service de Chirurgie Orthopédique et
Traumatologique, France
This manuscript was submitted online the 29th September 2019 and is presently being given full
consideration for publication in Clinical Biomechanics journal.

107
ABSTRACT
Background: Ankle and hindfoot malalignment is a common finding in patients suffering
from post-traumatic ankle osteoarthritis. However, no studies have addressed the effect of
concomitant foot deformities on intrinsic foot kinematics and kinetics. Therefore, the objective
of this study was to investigate the effect of ankle and hindfoot malalignment on the kinematics
and kinetics of multiple joints in the foot and ankle complex in patients suffering from post-
traumatic ankle osteoarthritis.
Methods: Twenty-nine subjects with post-traumatic ankle osteoarthritis participated in this
study. Standardized weight-bearing radiographs were obtained preoperatively to categorize
patients as having cavus, planus or neutral ankle and hindfoot alignment, based on 4 X-ray
measurements. All patients underwent standard gait assessment. A 4-segment foot model was
used to estimate intrinsic foot joint kinematics and kinetics during gait. Statistical parametric
mapping was used to compare foot kinematics and kinetics between groups.
Findings: There were 3 key findings regarding overall foot function in the 3 groups of post-
traumatic ankle osteoarthritis: (i) altered frontal and transverse plane joint angles and moments
of the hindfoot and Chopart joint in the cavus compared to the planus group; (ii) in cavus OA
group, Lisfranc joint abduction sought to compensate the varus inclination of the ankle joint;
(iii) there were no significant differences in joint angles and moments between the planus and
neutral OA groups.
Interpretation: Future studies should integrate assessment of concomitant foot and ankle
deformities in post-traumatic ankle osteoarthritis, to provide additional insight into associated
mechanical deficits and compensation mechanisms during gait.
Keywords: ankle osteoarthritis, malalignment, foot kinetics, kinematics, gait

108
INTRODUCTION
End-stage ankle osteoarthritis rarely occurs in isolation, but more often presents
concomitant ankle and hindfoot deformities.18 As the ankle is a weight-bearing joint, the intra-
articular load distribution is not only influenced by the alignment of the tibiotalar joint itself
but is also highly dependent on extra-articular mechanical forces related to the 3D orientation
of the subtalar joint, anatomic variants in the hindfoot joints, and alignment of the medial
column of the foot.16 Malalignment of the ankle and hindfoot joints in ankle osteoarthritis has
been investigated intensively in the last decade, mainly on conventional radiography and
weight-bearing computed tomographic scans.16–18 However, there is a paucity of literature
regarding the interrelationship between structural changes to underlying bony anatomy and
alterations in foot mechanics during gait in patients suffering from post-traumatic ankle
osteoarthritis.10,12,15 Khazzam et al. (2006) used radiographic tibiotalar alignment
measurements to correct the orientation and segment-embedded reference frames of their foot
model.15 Unfortunately, the effect of this angle on foot kinematics was not assessed. The
interrelationship between radiographic tibiotalar alignment measure and plantar pressure
distribution was investigated by Horisberger et al. (2009), who found that post-traumatic ankle
osteoarthritis patients with a varus malalignment had a significantly greater pressure center
excursion index than those with valgus malalignment.12 In terms of kinematics and kinetics,
Grier et al. (2016) investigated the effect of preoperative tibiotalar malalignment on
postoperative lower-limb coronal plane mechanics during gait after total ankle replacement
associated with realignment surgery. Patients with preoperative tibiotalar malalignment showed
biomechanics similar to that of patients with neutral preoperative alignment.10 However, the
nature of the deformity was characterized only by a single radiographic value assessing the
intra-articular ankle deformity, regardless of any concomitant foot deformities. The impact of
concomitant foot deformities on intrinsic foot mechanics in post-traumatic ankle osteoarthritis
has not been explored, as foot kinematics and kinetics were generally computed on a rigid foot
modeling approach, without information on Lisfranc and Chopart joint function. The present
study therefore aimed to investigate the effect of ankle and hindfoot malalignment on the gait
kinematics and kinetics of multiple joints of the foot and ankle complex in patients suffering
from post-traumatic ankle osteoarthritis.

109
METHODS
Participants
Twenty-nine subjects with post-traumatic ankle osteoarthritis scheduled for primary
total ankle replacement or ankle fusion between January 2017 and June 2019 participated in
this study (Table 6.1). This study was approved by the local review board (B200-2017-061) and
all participants signed an informed consent form. Exclusion criteria were (1) age <18 years, (2)
systemic or neurological disease, and (3) any medical problem other than post-traumatic ankle
osteoarthritis liable to affect gait. Standardized weight-bearing radiographs of the foot and the
ankle were obtained preoperatively to assess the concomitant foot and ankle deformities and
categorize them in three deformity groups. Cavus type (hereafter referred as cavus OA) was
defined as: varus position of the hindfoot and ankle joint complex, bony dorsum deformity of
the midfoot characterized by dorsiflexion of the talus within the ankle, upward position of the
metatarsals with respect to the ground, and high medial longitudinal arch (Figure 6.1 A,B,C).
Planus type (hereafter referred as planus OA) was defined as: valgus position of the hindfoot
and ankle joint complex, collapse deformity of the midfoot characterized by a plantar flexion
of the talus within the ankle, downward position of the metatarsals with respect to the ground,
and low medial longitudinal arch (Figure 6.1 D,E,F). Neutral type ((hereafter referred as neutral
OA) had no midfoot, hindfoot or ankle malalignment. Osteoarthritis severity was scored on the
Canadian Orthopaedic Foot & Ankle Society (COFAS) classification system (Table 6.1)18:
Type 1, isolated ankle osteoarthritis; Type 2, ankle osteoarthritis associated with intra-articular
ankle deformity or tight heel cord or both; Type 3, ankle osteoarthritis with deformity of the
hindfoot, midfoot, tibia or forefoot; and Type 4, Type 1 to 3 with subtalar or calcaneocuboid or
talonavicular osteoarthritis.18
Radiographic assessment
Radiographic assessment comprised: (1) standardized anteroposterior ankle Méary view
to measure the hindfoot deformity (<90° = valgus; >90° = varus) and intra-articular ankle varus
or valgus alignment (Tibia-Talus) (<90° = valgus; >90° = varus);18,21 (2) standardized weight-
bearing lateral foot (and ankle) view to measure the midfoot deformity as the talar/1st metatarsal
angle (≥10°)18( 170° = bony dorsum deformity; 190° = collapse deformity) and the medial
longitudinal arch deformity as Djian-Annonier angle (≥10°) ( 115° = high arch; 130° = low
arch) (Table 6.1 & Figure 6.1).5

110
Table 6-1 : Demographic, spatio-temporal and radiographic data for the three patient groups: post-traumatic ankle osteoarthritis associated with planus foot deformity (Planus OA), with
cavus foot deformity (Cavus OA), and without foot deformity (Neutral OA). Abbreviations: COFAS: Canadian Orthopaedic Foot & Ankle Society classification system for ankle osteoarthritis;
MLA: medial longitudinal arch; SD: standard deviation; BMI: body mass index; N/A: not applicable; N.S.: not significant. Statistics: Depending on the distribution of the demographic and
spatio-temporal data, 1-way ANOVA (normal distribution) or Kruskal-Wallis test (non-normal distribution) were used to assess statistical differences for each variable between the three
groups. *Gabriel’s post-hoc test (adjusted P-value 0.3/3=0.017); ** post-hoc Mann-Whitney U test (adjusted P-value 0.3/3=0.017).
Planus OA (n=8 ankles) Cavus OA (n=10 ankles) Neutral OA (n=12 ankles) ANOVA (F)a /
Kruskal-Wallis (H)b
Planus OA
vs
Cavus OA
Planus OA
vs
Neutral OA
Cavus OA
vs
Neutral OA Mean SD Min-Max Mean SD Min-Max Mean SD Min-Max F / H P-value P-value P-value P-value
Age (years) 63.50 11.32 38-74 61.44 7.4 51-73 59.17 7.3 46-68 2.848 (H) 0.241 N.S. N.S. N.S.
Height (m) 1.71 0.12 1.48-1.87 1.73 0.08 1.65-1.90 1.73 0.1 1.57-1.90 0.171 (F) 0.844 N.S. N.S. N.S.
Weight (kg) 84.6 11.00 69-99 79.6 12.3 65-100 85.5 16.4 59-111 0.511 (F) 0.606 N.S. N.S. N.S.
BMI 29.1 3.79 24.3-33.8 26.5 4.21 22.0-34.6 28.4 4.32 21.4-34.6 0.940 (F) 0.403 N.S. N.S. N.S.
Walking
Speed (m/s) 0.88 0.21 0.61-1.27 0.98 0.17 0.73-1.22 0.95 0.17 0.65-1.27 0.693 (F) 0.509 N.S. N.S. N.S.
Stride
Length (%
Height)
0.63 0.07 0.56-0.75 0.65 0.06 0.58-0.74 0.66 0.08 0.45-0.75 0.424 (F) 0.659 N.S. N.S. N.S.
Meary
(degrees) 79.6 2.86 75-84 91.4 4.03 85-99 85.5 2.84 81-90 28.513 (F) < 0.001 < 0.001* 0.002* 0.001*
MLA
(degrees) 126.4 10.41 108-141 110.6 4.62 104-115 118.9 4.66 111-126 14.967 (H) 0.001 0.002**
0.044
(N.S.)** 0.002**
TALOM1
(degrees) 187.5 11.07 174-202 170.4 6.54 162-185 178.4 5.07 170-186 11.513 (F) < 0.001 <0.001* 0.038 (N.S.)* 0.055*
TibiaTalus
(degrees) 83.6 7.07 72-93 97.2 7.5 90-109 89.5 3.9 82-93 12.610 (H) 0.002 0.001** 0.052**
0.022
(N.S.)**
COFAS
Type 1 1 Type 1 2 Type 1 8
Type 2 2 Type 2 3 Type 2 0
Type 3 5 Type 3 4 Type 3 2
Type 4 0 Type 4 1 Type 4 2
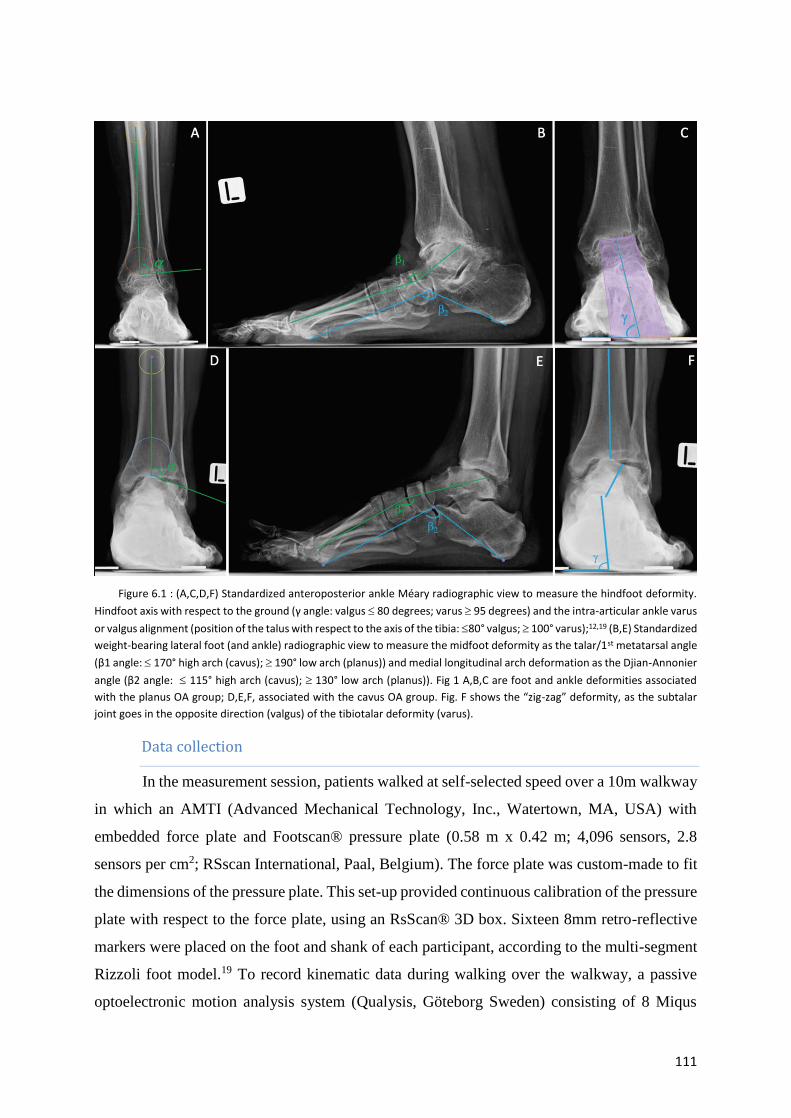
111
Figure 6.1 : (A,C,D,F) Standardized anteroposterior ankle Méary radiographic view to measure the hindfoot deformity.
Hindfoot axis with respect to the ground (γ angle: valgus 80 degrees; varus 95 degrees) and the intra-articular ankle varus
or valgus alignment (position of the talus with respect to the axis of the tibia: 80° valgus; 100° varus);12,19 (B,E) Standardized
weight-bearing lateral foot (and ankle) radiographic view to measure the midfoot deformity as the talar/1st metatarsal angle
(β1 angle: 170° high arch (cavus); 190° low arch (planus)) and medial longitudinal arch deformation as the Djian-Annonier
angle (β2 angle: 115° high arch (cavus); 130° low arch (planus)). Fig 1 A,B,C are foot and ankle deformities associated
with the planus OA group; D,E,F, associated with the cavus OA group. Fig. F shows the “zig-zag” deformity, as the subtalar
joint goes in the opposite direction (valgus) of the tibiotalar deformity (varus).
Data collection
In the measurement session, patients walked at self-selected speed over a 10m walkway
in which an AMTI (Advanced Mechanical Technology, Inc., Watertown, MA, USA) with
embedded force plate and Footscan® pressure plate (0.58 m x 0.42 m; 4,096 sensors, 2.8
sensors per cm2; RSscan International, Paal, Belgium). The force plate was custom-made to fit
the dimensions of the pressure plate. This set-up provided continuous calibration of the pressure
plate with respect to the force plate, using an RsScan® 3D box. Sixteen 8mm retro-reflective
markers were placed on the foot and shank of each participant, according to the multi-segment
Rizzoli foot model.19 To record kinematic data during walking over the walkway, a passive
optoelectronic motion analysis system (Qualysis, Göteborg Sweden) consisting of 8 Miqus
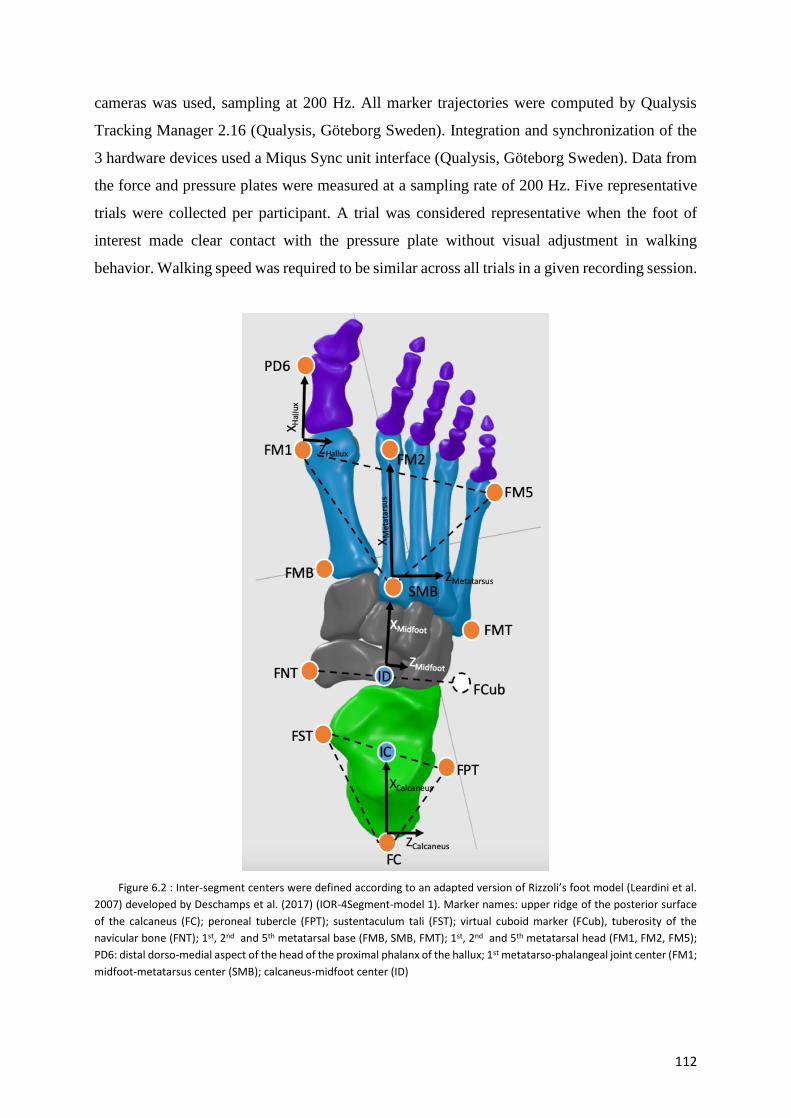
112
cameras was used, sampling at 200 Hz. All marker trajectories were computed by Qualysis
Tracking Manager 2.16 (Qualysis, Göteborg Sweden). Integration and synchronization of the
3 hardware devices used a Miqus Sync unit interface (Qualysis, Göteborg Sweden). Data from
the force and pressure plates were measured at a sampling rate of 200 Hz. Five representative
trials were collected per participant. A trial was considered representative when the foot of
interest made clear contact with the pressure plate without visual adjustment in walking
behavior. Walking speed was required to be similar across all trials in a given recording session.
Figure 6.2 : Inter-segment centers were defined according to an adapted version of Rizzoli’s foot model (Leardini et al.
2007) developed by Deschamps et al. (2017) (IOR-4Segment-model 1). Marker names: upper ridge of the posterior surface
of the calcaneus (FC); peroneal tubercle (FPT); sustentaculum tali (FST); virtual cuboid marker (FCub), tuberosity of the
navicular bone (FNT); 1st, 2nd and 5th metatarsal base (FMB, SMB, FMT); 1st, 2nd and 5th metatarsal head (FM1, FM2, FM5);
PD6: distal dorso-medial aspect of the head of the proximal phalanx of the hallux; 1st metatarso-phalangeal joint center (FM1;
midfoot-metatarsus center (SMB); calcaneus-midfoot center (ID)

113
Data analysis
Inter-segment center definitions of the 4-segment foot model were based on an adapted
version of Rizzoli’s 3D multi-segment foot model, developed by Deschamps et al. (2017) (IOR-
4Segment-model 1) (Figure 6.2).4 The main differences between IOR-4Segment-model 14 and
Rizzoli’s foot model19 consists in the creation of a virtual cuboid marker at two-thirds of the
distal distance between the peroneal tubercle and the base of the fifth metatarsal, and in the
definition of the calcaneus-midfoot joint center. Inter-segment 3D rotations were computed
according to Deschamps et al.’s IOR-4Segment-model 1 (2017), following ISB
recommendations4, and were defined as follows: shank-calcaneus joint (midpoint between the
malleoli markers, describing the shank-calcaneus center), Chopart joint (midpoint between the
cuboid and the navicular bone, describing the calcaneus-midfoot center), Lisfranc joint (at the
second metatarsal base, describing the midfoot-metatarsus center), and 1st metatarso-phalangeal
joint (projection of 1st metatarsal head marker vertically at mid distance to the ground,
describing the metatarsus-hallux center).
Joint forces (F) and moments (M) were computed in the inertial coordinate system by a
bottom-up inverse dynamic method using a Newton-Euler recursive algorithm based on a
homogeneous matrix formalism during the stance phase of gait.20 Kinematic and force data
were filtered using a low-pass zero-lag 4th order Butterworth filter, with 10 Hz cut-off
frequency. Inertia and weight parameters of each foot segment were neglected, considering that
inertia effects during stance are negligible compared to external forces.23 The force plate data
were distributed over each foot segment using a validated proportionality scheme.8,24 The
subarea of each foot segment was estimated for each time frame by projecting the markers’
position vertically on the sensor matrix of the pressure platform. The resulting center of pressure
(CoP) of each estimated subarea was used as the CoP for the corresponding foot segment in
inverse dynamics calculations. The joint moments were expressed in the proximal segment
coordinate system. In supplement to the joint power, the 3D angle M between the joint
moment (M) and the joint angular velocity () vectors was calculated as described by Dumas
and Chèze (2008).7 When the 3D angle M is <60° or >120°, the moment mainly drives the
joint, with, respectively, propulsion or resistance; when it is between 60° and 120°, the moment
mainly stabilizes the joint.7 Inter-segment kinematic and kinetic computations and extraction
of discrete spatio-temporal variables (walking speed and stride length) were performed using
an in-house Matlab© program (The Mathworks Inc., Natick, MA, USA). Internal joint

114
moments and powers were normalized by subject-mass and all 1D data were time-normalized
to 100% of the stance phase.
Statistical analysis
First, the Shapiro-Wilk test was used to check data normality. One-way ANOVA and
Kruskal-Wallis test were used to identify significant differences between groups for
demographic, spatio-temporal and radiographic variables. For significant differences, Gabriel’s
post-hoc test or the Mann-Whitney-U test (adjusted P-value (0.5/3=0.017) were used to indicate
which groups were different. All statistical tests were conducted on SPSS software (version 25,
IBM Corp, Chicago, USA). One-dimensional statistical parametric mapping (SPM) was used
to compare foot kinematics and kinetics between groups, using an open-source code (v.M.0.4.5;
www.spm1d.org) in Matlab© (The Mathworks Inc., Natick, MA, USA).5,16 The main
advantages of this methodological approach is that SPM regards the whole time-series as the
unit of observation and that time-dependence is incorporated directly in statistical testing. 1D-
SPM 1-way ANOVA over the normalized time series was used to confirm significant
differences between groups. If statistical significance was reached, a post-hoc 1D-SPM 2-
sample t-test (post-hoc P-value 0.05/3 = 0.017) was used to determine between which groups
the significant differences occurred.
RESULTS
Demographic, spatiotemporal and radiographic data
No inter-group differences were found for the demographic and spatio-temporal variables
(Table 6.1). Significant differences were found between the cavus and planus OA groups for
all radiographic parameters. The cavus OA group also showed significantly greater medial
longitudinal arch deformation than the neutral OA group. Méary angle was significantly
different on all between-groups comparisons.
SPM analysis
There were significant SPM{F} main effects between the three groups for all the intrinsic
foot joints.

115
Planus OA versus neutral OA
Post-hoc comparisons showed no differences between planus and neutral OA
groups for any foot joint angles or moments. However, 1D-analysis revealed that the
planus OA group exhibited a greater shank-calcaneus power pattern (P=0.016; 93-
94%) at end of stance phase than the neutral OA group.
Cavus OA versus neutral OA
The cavus OA group showed a more inverted angle of the shank-calcaneus joint
(P=0.017, 0-6% & P<0.001, 10-72%) associated with a more abducted angle of the
Lisfranc joint (P<0.001; 0-100%) than the neutral OA group during almost the entire
stance phase. The 1st metatarso-phalangeal joint showed greater dorsiflexion
(P=0.013; 40-50%) in the cavus than in the neutral OA group during midstance. Post-
hoc comparisons showed no differences in kinetics between these two groups.
Cavus OA versus planus OA
The main differences observed between the planus and cavus OA groups all
concerned the frontal and transverse plane (Figure 6.3-6.4). The planus OA group
showed a significantly more everted shank-calcaneus joint angle (P<0.001; 0-77%)
associated with a more abducted Chopart joint angle (P<0.001; 0-94%) than the
cavus OA group. The moment patterns revealed that the planus OA group exhibited
larger shank-calcaneus inversion moment (P<0.001; 10-35%) than the cavus OA
group (Figure 6.4). During propulsion, the cavus OA group showed larger shank-
calcaneus abduction moment (P<0.001; 88-95%) than the planus OA group.
However, no differences were observed for power or 3D M angle patterns between
the cavus and planus OA groups.

116
Figure 6.3 : Kinematic waveform representation with ±1 standard deviation cloud for the intrinsic foot joints: Sha-Cal:
Shank-Calcaneus; 1st Metatarso-Phal: 1st Metatarso-Phalangeal joint. Cavus OA group (blue), Neutral OA group (green) and
Planus OA (purple); DF: dorsiflexion; PF: plantar flexion; Add: Adduction; Abd: Abduction; Inv: Inversion; Ev: Eversion.

117
Figure 6.4 : Kinetic between-group comparison of inter-segmental Shank-Calcaneus joint moments (Mx & My) during
the stance phase of gait. Cavus OA group (blue), Neutral OA group (green) and Planus OA group (purple); Sha-Cal: Shank-
Calcaneus; A-C,G-I: Mean kinetic trajectories with their respective standard deviation clouds. D-F, J-L: SPM results: SPM{t} is
the trajectory of the post-hoc 2-sample t-test. The dotted red lines indicate the random field theory threshold for significance,
and p-values indicate the likelihood that a random process of the same temporal smoothness would be expected to produce
a suprathreshold cluster of the observed size.

118
Figure 6.5 : Kinetic between-group comparison of 3D angle M of the Shank-Calcaneus and Chopart joints during the
stance phase. Cavus OA group (blue), Neutral OA group (green) and Planus OA group (purple); Sha-Cal: Shank-Calcaneus;
When the 3D angle M is <60° or >120°, the moment mainly drives the joint, with, respectively, propulsion (P) or resistance
(R). When the 3D angle M is between 60° and 120°, the moment mainly stabilizes the joint (S); A-C,G-I: Mean kinetic trajectories with their respective standard deviation clouds. D-F, J-L: SPM results: SPM{t} is the trajectory of the post-hoc 2-sample t-test. The dotted red lines indicate the random field theory threshold for significance, and p-values indicate the likelihood that a random process of the same temporal smoothness would be expected to produce a suprathreshold cluster of the observed size.

119
DISCUSSION
To our knowledge, this was the first study to investigate the effect of ankle and hindfoot
malalignment on the intrinsic foot mechanics in patients suffering from post-traumatic ankle
osteoarthritis. Results showed that the cavus OA group presented a distinctive pattern of joint
angles and moments compared to the neutral and planus OA groups. These differences shed
light on a number of radiographic concepts which are currently used regarding the
compensatory mechanism of the neighboring joints of the ankle, and in particular in the surgical
management of intra- and extra-articular deformities in ankle osteoarthritis.
Concerning 3D inter-segmental rotations and actions, the most important differences were
observed between the cavus and planus OA groups in the shank-calcaneus and Chopart joints
during almost the entire stance phase. Our data seem to provide further evidence of the
interrelationship between foot structure and alterations in foot mechanics. The cavus OA group
showed a significantly greater inverted shank-calcaneus joint angle and a more adducted
Chopart joint angle than the planus OA group. It is further believed that the etiology of these
differences is mainly guided by the multiplanar orientation of the talus, guided in turn by the
geometry of the subtalar joint.13 Radiographic and anatomical studies suggested that pes cavus
feet have a high vertical subtalar joint axis associated with a talar head placed tightly within a
subtalar joint geometry featuring a V-shaped groove, limiting subtalar joint motion.6,13 In
contrast, the subtalar joint in pes planus feet seems to be characterized by a lower vertical axis
associated with larger and relatively flat articular facets, allowing greater range of motion in
the subtalar joint.1,13 This notion of talar head stability provided by the orientation of the axis
and the subtalar joint geometry is further underpinned by the 3D M angle of the shank-
calcaneus and Chopart joints. Even though, with the numbers available, no significant
difference could be demonstrated here, it could be observed from the 3D M angle waveforms
that both joints in the planus OA group adapted a more resistant configuration than in the cavus
OA group (Figure 6.5). This could mean that the planus OA group has to counter higher external
forces than the cavus OA group, to keep the foot from collapsing and to stabilize it during
walking.

120
Another noteworthy finding in our study was the significant difference in joint angles
between the cavus and the neutral OA groups. As expected, the cavus OA group showed a more
inverted angle of the shank-calcaneus joint than the neutral OA group during a significant part
of the stance phase. One may expect from the kinematic coupling between the foot segments
that cavus OA would exhibit a more adducted angle of the Lisfranc joint in association with the
inverted position of the shank-calcaneus joint compared to neutral OA; instead, a significantly
more abducted position of the Lisfranc joint was found. This ‘twist” in the osteo-articular
geometry of foot may represent a compensatory mechanism to counter the varus inclination of
the ankle joint and therefore to reduce the stress concentration located in the medial part of the
joint. We further believe that this mechanism originates from an eversion of subtalar joint to
compensate for the varus deformity of the ankle joint.11,16 This osteo-articular configuration of
the hindfoot and ankle joint complex has often been referred as the “zig-zag” deformity, as the
subtalar joint goes in the opposite direction to the tibiotalar deformity (Figure 6.1.F).11
The positioning of the 1st metatarso-phalangeal joint was also found to be significantly
different, as the cavus OA group showed less hallux plantar flexion with respect to the forefoot
than the neutral OA group. This reduced plantar flexion of the 1st metatarso-phalangeal joint
may reduce loading underneath the hallux during the stance phase. This finding is supported by
comparable studies analyzing kinematic and plantar pressure measurements between normal,
planus and cavus feet.2,3
The majority of the significant differences were found in the cavus group versus both
the neutral and planus groups. In contrast, no significant differences in joint angles or moments
were observed between the planus and neutral groups. This suggests that the present results
may be attributed to these two pathologic groups adopting a similar walking pattern to avoid
pain in their arthritic ankle. Inspection of between-group comparisons found that the cavus OA
group had significantly greater radiographic deformities than the neutral and planus OA groups.
Only one variable differed significantly between the planus and neutral OA groups. This could
mean that the difference in malalignment of the ankle and hindfoot between these two groups
was not sufficiently great to be detected dynamically during gait.
The findings of this study should be considered in the context of two limitations. First,
our classification of multi-joint, multi-planar foot deformities was based on 2D plain weight-
bearing radiographs. Assessment of submalleolar deformity is challenging, due to the limited
imaging modalities. New-generation weight-bearing CT scans may be a valuable tool to better
represent the 3D orientation of the hindfoot and ankle malalignment in ankle osteoarthritis.
Moreover, partitioning of the total ground reaction forces acting on the calcaneus segment was

121
based on an estimation method (proportionality scheme) which combined pressure and force
plate data together with marker placement data. Even though this proportionality scheme was
validated, the reported ankle joint moments and powers should be regarded as estimates. A
second limitation was the use of skin markers to estimate joint centers and segment kinematics.
Soft-tissue artefacts have been reported to be as much as 3-4 mm on the surface of the foot.14
The impact of these errors on the estimation of the moments and powers is currently difficult
to estimate.
CONCLUSION
Three key findings in overall foot function were observed between three groups of post-
traumatic ankle osteoarthritis: (i) altered frontal and transverse plane joint angles and moments
of the hindfoot and Chopart joints in the cavus OA group compared to the planus OA group;
(ii) the cavus ankle group, Lisfranc joint abduction tried to reduce the varus inclination of the
ankle joint; and (iii) there were no significant differences in joint angles or moments between
the planus OA group and the neutral OA group. These findings indicate that malalignment of
the hindfoot and the ankle as revealed by radiographic assessment does indeed influence foot
mechanics during gait in patients suffering from post-traumatic ankle osteoarthritis.

122
REFERENCES
1. Bruckner J. Variations in the Human Subtalar Joint. J Orthop Sport Phys Ther.
1987;8(10):489-494.
2. Buldt AK, Allan JJ, Landorf KB, Menz HB. The relationship between foot posture and
plantar pressure during walking in adults: A systematic review. Gait Posture.
2018;62(July 2017):56-67.
3. Buldt AK, Forghany S, Landorf KB, Levinger P, Murley GS, Menz HB. Foot posture is
associated with plantar pressure during gait: A comparison of normal, planus and cavus
feet. Gait Posture. 2018;62(March):235-240.
4. Deschamps K, Eerdekens M, Desmet D, Matricali GA, Wuite S, Staes F. Estimation of
foot joint kinetics in three and four segment foot models using an existing proportionality
scheme: Application in paediatric barefoot walking. J Biomech. 2017;61:168-175.
5. Djian A, Annonier C, Denis A, Baudoin P. [Radiopodometry (principles and results)]. J
Radiol Electrol Med Nucl. 1968;49(10):769-772.
6. Drayer-Verhagen F. Arthritis of the subtalar joint associated with sustentaculum tali
facet configuration. J Anat. 1993;183 ( Pt 3:631-634.
7. Dumas R, Cheze L. Hip and knee joints are more stabilized than driven during the stance
phase of gait: An analysis of the 3D angle between joint moment and joint angular
velocity. Gait Posture. 2008;28(2):243-250.
8. Eerdekens M, Staes F, Matricali GA, Deschamps K. Clinical Applicability of an Existing
Proportionality Scheme in Three-Segment Kinetic Foot Models. Ann Biomed Eng.
August 2019. doi:10.1007/s10439-019-02344-8.
9. Friston KJ, Holmes AP, Worsley KJ, Poline J-P, Frith CD, Frackowiak RSJ. Statistical
parametric maps in functional imaging: A general linear approach. Hum Brain Mapp.
1994;2(4):189-210.
10. Grier AJ, Schmitt AC, Adams SB, Queen RM. The effect of tibiotalar alignment on
coronal plane mechanics following total ankle replacement. Gait Posture. 2016;48:13-
18.
11. Hintermann B, Knupp M, Barg A. Peritalar Instability. FOOT ANKLE Int.
2012;33(5):450-454.
12. Horisberger M, Hintermann B, Valderrabano V. Alterations of plantar pressure
distribution in posttraumatic end-stage ankle osteoarthritis. Clin Biomech (Bristol,
Avon). 2009;24(3):303-307.
123
13. Jung M-H, Choi BY, Lee JY, et al. Types of subtalar joint facets. Surg Radiol Anat.
2015;37(6):629-638.
14. Kessler SE, Rainbow MJ, Lichtwark GA, et al. A Direct Comparison of Biplanar
Videoradiography and Optical Motion Capture for Foot and Ankle Kinematics.
2019;7(August):1-10.
15. Khazzam M, Long JT, Marks RM, Harris GF. Preoperative gait characterization of
patients with ankle arthrosis. Gait Posture. 2006;24(1):85-93.
16. Knupp M. The Use of Osteotomies in the Treatment of Asymmetric Ankle Joint
Arthritis. Foot Ankle Int. 2017;38(2):220-229.
17. Krähenbühl N, Tschuck M, Bolliger L, Hintermann B, Knupp M. Orientation of the
subtalar joint: Measurement and reliability using weightbearing CT scans. Foot Ankle
Int. 2016;37(1):109-114.
18. Krause FG, Di Silvestro M, Penner MJ, et al. Inter- and intraobserver reliability of the
COFAS end-stage ankle arthritis classification system. Foot Ankle Int. 2010;31(2):103-
108.
19. Leardini a, Benedetti MG, Berti L, Bettinelli D, Nativo R, Giannini S. Rear-foot, mid-
foot and fore-foot motion during the stance phase of gait. Gait Posture. 2007;25(3):453-
462.
20. Legnani G, Casolo F, Righettini P, Zappa B. A homogeneous matrix approach to 3D
kinematics and dynamics — I. Theory. Mech Mach Theory. 1996;31(5):573-587.
21. Meary R, Filipe G, Aubriot JH, Tomeno B. [Functional study of a double arthrodesis of
the foot]. Rev Chir Orthop Reparatrice Appar Mot. 1977;63(4):345-359.
22. Pataky TC. One-dimensional statistical parametric mapping in Python. Comput Methods
Biomech Biomed Engin. 2012;15(3):295-301.
23. Rouhani H, Favre J, Crevoisier X, Aminian K. A wearable system for multi-segment
foot kinetics measurement. J Biomech. 2014;47(7):1704-1711.
24. Saraswat P, MacWilliams BA, Davis RB, D’Astous JL. Kinematics and kinetics of
normal and planovalgus feet during walking. Gait Posture. 2014;39(1):339-345.

124
Chapter 7 : Quantifying the effect of total ankle replacement
using a 1-segment versus a multi-segment foot modeling
approach: a pilot study
Paul-André Deleu,1,2 Alexandre Naaim,1 Thibaut Leemrijse,2 Raphaël Dumas,1 Bernhard
Devos Bevernage,2 Jean-Luc Besse,3 Laurence Chèze1
1Univ Lyon, Université Claude Bernard Lyon 1, IFSTTAR, LBMC UMR_T9406,F69622, Lyon, France
2Foot & Ankle Institute, Brussels, Belgium
3Hospices Civils de Lyon, Centre Hospitalier Lyon-Sud, Service de Chirurgie Orthopédique et
Traumatologique, France

125
ABSTRACT
Background: Kinetic foot models showed that computing ankle joint moments and power
with a rigid foot modeling approach overestimates ankle joint power. Nevertheless, studies
continue to implement rigid foot models to assess the effect of total ankle replacement on gait.
Therefore, our aim was to compare the effect of total ankle replacement on ankle joint angles,
moments and power as assessed on a 1-segment versus a multi-segment kinematic and kinetic
foot model. In addition to the comparison between pre- and postoperative conditions of the
patients, postoperative condition were compared to a peer-matched control group.
Methods: A sample of 10 subjects with post-traumatic ankle osteoarthritis scheduled for
total ankle replacement and 10 asymptomatic subjects was recruited. A 1-segment and a multi-
segment kinematic and kinetic foot model were used to calculate intrinsic foot joint kinematics
and kinetics during gait. A first linear mixed model was used to investigate the effect of total
ankle replacement (preop versus postop) and the effect of the foot model on ankle joint
kinematic and kinetic analysis. A second linear mixed model was used to compare ankle joint
kinematics and kinetics between groups and the effect of the foot model. Statistical parametric
mapping was used to statistically compare pre- to post-operative differences between the two
modeling approaches.
Findings: Ankle and shank-calcaneus joint angles did not improve postoperatively except
for an increase in range of motion during the loading response phase. Peak plantar flexion
moment and peak power generation of both the ankle and the shank-calcaneus joints improved
postoperatively, but remained reduced compared with asymptomatic control subjects. No
difference in pre- to post-operative outcome was found between the two modelling approaches
for the ankle joint.
Interpretation: The effect of total ankle replacement on ankle kinematics is limited.
However, the ankle joint kinetics of the two modelling approaches improved postoperatively.
Pre- to post-operative outcome difference in ankle joint kinematics and kinetics was not
significantly overestimated when computed with 1-segment rigid foot model. Although no
significant difference could be demonstrated, we strongly believe that neglecting the intrinsic
foot joints can hinder our clinical understanding of how a therapeutic intervention benefits or
degrades the patient’s biomechanical performance.

126
INTRODUCTION
Currently, therapeutic success in total ankle replacement is primarily assessed on
clinical, radiographic and questionnaire outcomes.5,22 Recent publications have indicated that
function is not systematically restored, even if clinical and radiographic parameters show
ilmprovement.22,31 Therefore, during the last decade, substantial efforts have gone into
characterizing the impact of total ankle replacement on ankle joint angles and moments during
gait.15 These studies showed that, implantation of a total ankle replacement prosthesis improved
ankle joint angles and moments compared to preoperative values, but that they remain impaired
compared to asymptomatic subjects.1,15
Over the last decade, an increasing number of 3D multi-segment kinematic foot models
have become available for clinical use and have clearly shown their clinical relevance in
detecting intrinsic foot mobility impairments.14 Recently, multi-segment kinetic foot models
have received increasing attention in methodological and clinical studies, providing new
insights into the individual power distributions of the intrinsic joints of the foot.2,6,18,33 These
kinetic foot models further highlighted the shortcomings of computing ankle joint moments and
power with a rigid foot modeling approach, as it overestimates ankle joint power,8,33 potentially
leading to clinical misinterpretation of how a therapeutic intervention benefits or degrades
biomechanical performance, as the estimated changes simply reflect methodological errors
inherent to conventionally modeling the foot as a single rigid segment.33 Nevertheless, gait
analysis studies continue to implement a rigid foot modeling approach to assess the effect of
total ankle replacement on ankle joint angles and moments.29,30
The purpose of this pilot study was to compare the effect of total ankle replacement on
ankle joint angles, moments and power as assessed on 1-segment versus multi-segment
kinematic and kinetic foot models, comparing pre- to post-operative difference between the two
modeling approaches. We also assessed the effects of the foot model and of the surgical
intervention. In supplement, the postoperative ankle kinematics and kinetics of the patients
were compared to a peer-matched control group. It was hypothesized that ankle joint angles,
moments and power improve after total ankle replacement but remain different from the control
group, irrespective of the ankle joint modeling approach, and that the effect of total ankle
replacement on ankle joint angles and moments is overestimated on a 1-segment compared to
a multi-segment foot model.

127
METHODS
Participants
A sample of 10 asymptomatic and 10 symptomatic adult patients participated in the
study (Table 7.1). All patients suffered from post-traumatic ankle osteoarthritis scheduled for
primary total ankle replacement between January 2017 and June 2019. Severity of ankle
osteoarthritis was scored using the Canadian Orthopaedic Foot & Ankle Society (COFAS)
classification system (Table 7.1).12 The inclusion criteria for the pathologic group were: post-
traumatic end-stage ankle osteoarthritis with indication for total ankle replacement; exclusion
criteria comprised: (1) age <18 years, (2) systemic or neurological disease, and (3) any medical
problem other than post-traumatic ankle osteoarthritis liable to affect gait. All patients were
scheduled for total ankle replacement within 2 weeks of their preoperative data collection, and
were tested again 1 year after surgery. A two-component fixed-bearing Cadence prosthesis
(Integra Life Sciences, Plainsboro, NJ, USA) was implanted in all patients. Control subjects
were peer-matched according to demographics; exclusion criteria comprised any medical
problem possibly affecting normal gait. The local review board approved the study (B200-
2017-061) and all participants signed an informed consent form.
Table 7-1 : Demographic data of patients and control subjects (Abbreviations: CTRL: control subjects; BMI: body mass index;
SD: standard deviation; N/A: not applicable; preop: preoperative; postop: postoperative)
Ankle osteoarthritis
patients CTRL subjects P-values
Mean SD Mean SD
Patients
vs CTRL
Preop
vs Postop
Age (years) 62.7 8.1 61.9 6.4 0.810 N/A
Height (m) 1.7 0.1 1.7 0.1 0.928 N/A
Weight (kg) 80.5 14.2 73.9 17.6 0.370 N/A
BMI (kg/m²) 27.6 4.3 25.2 4.4 0.237 N/A
Male:Female 4 6 6 4 N/A N/A
Preop Walking speed (m/s) 0.93 0.17 1.18 0.13
0.001 0.009
Postop Walking speed (m/s) 1.08 0.17 0.134
Preop Stride length (% Height) 0.66 0.06 0.76 0.06
0.001 0.002
Postop Stride length (% Height) 0.74 0.06 0.430
COFAS
Type 1 2
Type 2 1
Type 3 5
Type 4 2

128
Data collection
The measurement session consisted in asking participants to walk at a self-selected speed
over a 10m walkway in which a Footscan® pressure plate (0.5m x 0.4m, 4,096 sensors, 2.8
sensors per cm2; RSscan International, Paal, Belgium) was mounted on a AMTI-force plate (0.5
x 0.4m; Advanced Mechanical Technology, Inc., Watertown, MA, USA) custom-made to fit
the surface dimensions of the pressure plate. This set-up provided continuous calibration of the
pressure plate with respect to the force plate, using an RsScan® 3D box. Sixteen 8mm retro-
reflective markers were placed on the foot and shank of each participant according to the multi-
segment Rizzoli foot model.13 A passive optoelectronic motion analysis system (Qualysis,
Göteborg Sweden) composed of 8 Miqus cameras tracked kinematic data during walking over
the instrumented walkway. The 3 different hardware devices were integrated and synchronized
by connecting them all up to the Miqus Sync unit interface (Qualysis, Göteborg Sweden). Data
from the 3 devices were measured at a sampling rate of 200Hz. Patients suffering from ankle
osteoarthritis often experience pain during barefoot walking; to avoid maladaptive walking
strategies, 3 representative trials were collected per participant, a trial being considered
representative when the foot of interest made clear contact with the pressure plate without visual
adjustments in walking behavior. Walking speed was required to remain similar across all trials
in a given recording session.
Data analysis
Ankle joint angles and moments were calculated from the rigid Rizzoli foot model
(hereafter referred as the ankle joint)16 and the multi-segment IOR-4Segment-model 1
(hereafter referred as shank-calcaneus joint).6 In this study, the term joint signifies the modeled
biomechanical interaction between two body segments. In the rigid Rizzoli foot model, the
ankle joint is defined as the interaction between a rigid-body shank (tibia + fibula) and a rigid-
body 1-segment foot. In the 4-segment model, the shank-calcaneus joint refers to the interaction
between a rigid-body shank (tibia + fibula) and a rigid-body calcaneus segment. The joint center
of both joints was defined as the midpoint between the 2 malleoli markers. Inter-segment 3D
rotations were calculated according to rigid Rizzoli foot model and the multi-segment IOR-
4Segment-model 1, following ISB recommendations.6,13,32
Joint forces (F) and moments (M) were computed in the Inertial Coordinate System by a
bottom-up inverse dynamic method using a Newton-Euler recursive algorithm based on a
homogeneous matrix formalism during the stance phase of gait.17 Kinematic and force data
were filtered using a low-pass zero-lag 4th order Butterworth filter, with cut-off frequency of

129
10 Hz. Inertia and weight parameters of each foot segment were discounted, as the inertia
effects were negligible compared to external forces during stance.10,27 The force plate data were
distributed over each foot segment using a validated proportionality scheme.7,28 Subarea per
foot segment was estimated for each time frame by projecting the marker positions vertically
on the sensor matrix of the pressure platform. The resulting center of pressure (CoP) of each
estimated subarea was then used as the CoP for the corresponding foot segment in the inverse
dynamics calculations. Joint moments were expressed in the proximal segment coordinate
system. An in-house Matlab© program (The Mathworks Inc., Natick, MA, USA) was used for
inter-segment kinematic and kinetic computations. Internal joint moments and powers were
normalized by subject-mass and all 1-dimensional data were time-normalized to 100% of the
stance phase.
The main characteristic for ankle osteoarthritis is the alteration of the sagittal plane ankle
mechanics. Therefore, the following discrete zero-dimensional variables were extracted from
the sagittal plane: range of motion of both joints for 5 gait sub-phases (stance phase, loading
response, midstance, terminal stance and pre-swing), peak plantar flexion and dorsiflexion
angles, peak plantar flexion moment and peak ankle power generation. Even though joint power
is computed from 3D data, ankle joint power represents a variable of interest as it is essentially
generated by the ankle plantarflexor muscles. In addition, walking speed and stride length were
extracted as discrete zero-dimensional spatio-temporal variables.
Statistics
First, the Shapiro-Wilk test was used to check data normality. Independent t-tests
(significance threshold, p<0.05) were conducted to compare demographic data between
asymptomatic and symptomatic participants. A linear mixed model was used to model the
relationship of dependent variables (RoM for each subphase of interest of the gait cycle; peak
plantar flexion moment and peak ankle power generation) over time (pre- versus post-
operative) in patients receiving total ankle replacement for post-traumatic ankle
osteoarthritis.19,26 All results were analyzed in 3 ways: according to time, to foot model, and to
time plus foot model, each as the main effect. A second linear mixed model was used to model
the relationship of dependent variables (RoM for each subphase of interest of the gait cycle;
peak plantar flexion moment and peak ankle power generation) between groups (patients versus
controls).19,26 All results were analyzed in 3 ways: according to group, to foot model, and to
group plus foot model, each as the main effect. All statistical tests used R software, version
3.4.3. (https://www.r-project.org/; The. R Foundation for Statistical Computing, Vienna,

130
Austria). Considering that there were 7 statistical tests performed on the dorsi-/plantarflexion
kinematic curve of each modelling approach of the ankle joint, the significance threshold was
corrected to = 0.007 (0.05/7) for the kinematic data to control the type 1 error rate when
performing multiple comparisons. Significance threshold was set at = 0.05 for joint moment
and power variables.
One-dimensional statistical parametric mapping (SPM) was used to statistically compare
pre- to post-operative difference values between the two ankle joint modeling approaches for
the dorsiflexion and plantar flexion joint angles, joint angular velocity, dorsiflexion and plantar
flexion joint moments, and joint power using an open-source code (v.M.0.4.5;
www.spm1d.org) in Matlab© (The Mathworks Inc., Natick, MA, USA).5,16 The main
advantages of this methodological approach is that SPM regards the whole time-series as the
unit of observation and that time-dependence is incorporated directly in statistical testing. 1D-
SPM paired t-test over the normalized time series was used to assess significant differences
between pre- and post-operative conditions.
RESULTS
Demographic and spatiotemporal data
No significant differences between the two groups were found for age, weight, height or
BMI (Table 7.1). The spatiotemporal parameters showed a statistically significant improvement
in walking and stride length after surgery, with the postoperative values comparable to controls
(Table 7.1).
Pre- versus post-operative condition
Time as main effect. No significant ‘time’ effect was found for the kinematic variables
except for the loading response. However, a nearly significant increase in range of motion was
observed for midstance (P = 0.008). Significant increases in peak plantar flexion moment (P =
0.002) and in peak power generation (P = 0.007) were found after surgery.
Foot model as main effect. A significant ‘foot model’ effect was found, in which ankle
osteoarthritis patients showed higher values both pre- and post-operatively for peak plantar
flexion, peak power generation, loading response and pre-swing range of motion on the 1-
segment (ankle) than on the multi-segment (shank-calcaneus) foot model (Table 7.2).
Time plus foot model as main effect. No significant ‘time plus foot model’ effect was found
for any of the investigated variables (Table 7.2).

131
Table 7-2 : Kinematic and kinetic comparison of ankle joint outcome variables measured with a 1-segment and a multi-segment foot model between pre- and post-operative conditions. P-
values for kinematic variables ( = 0.007) and for kinetic variables ( = 0.05) of between-times effect, between-models effect and time*foot model interaction effect are presented. Bold P-
values indicate significant difference.

132
Table 7-3 : Kinematic and kinetic comparison of ankle joint outcome variables measured with a 1-segment and a multi-segment foot model in control subjects and patients after total ankle
replacement (TAR). P-values for kinematic variables ( = 0.007) and for kinetic variables ( = 0.05) of between-times effect, between-models effect and time*foot model interaction effect are
presented. Bold P-values indicate significant difference.

133
Control subjects versus patients after total ankle replacement
Group as main effect. A significant ‘group’ effect was found for peak plantar flexion, and
stance phase and pre-swing range of motion, with total ankle replacement patients showing
lower peak and range of motion values than controls (Table 7.3). Significant differences in peak
plantar flexion moment (P=0.021) and peak power generation (P = 0.016) were found, with
control subjects showing higher peak values than patients.
Foot model as main effect. A significant ‘foot model’ effect was found, with total ankle
replacement patients and control subjects all showing lower range of motion and peak values
(peak plantar flexion, and stance, midstance and pre-swing range of motion) on the 1-segment
(ankle) than on the multi-segment (shank-calcaneus) foot model (Table 7.3). A significant ‘foot
model’ effect was also found for peak plantar flexion moment and peak joint power generation.
Group plus foot model as main effect. No significant ‘group plus foot model’ effect was
found for any of the investigated variables (Table 7.3).
Outcome differences between ankle joint and shank-calcaneus joint
1D-analysis did not reveal any differences in pre- to post-operative change between the
ankle joint and shank-calcaneus joint for any of the variables of interest (Figure 7.1).

134
Figure 7.1 : A-D: Pre- to post-operative outcome differences between the two ankle joint modeling approaches (blue line: ankle joint; green line: shank-calcaneus joint) for the dorsiflexion-
plantar flexion joint angle (A), joint angular velocity (B), dorsiflexion-plantar flexion joint moment (C) and joint power (D). E,F,G,H: SPM{t} is the trajectory of the post-hoc paired t-test. The
dotted red lines indicate the random field theory threshold for significance and p-values indicate the likelihood that a random process of the same temporal smoothness would to produce a
suprathreshold cluster of the observed size. Abbreviations: DF: dorsiflexion; PF: plantarflexion; Gen (+): Generation; Abs (-): Absorption.

135
DISCUSSION
The aim of this pilot study was to compare the effect of total ankle replacement on ankle
joint angles, moments and power assessed with a 1-segment versus a multi-segment kinematic
and kinetic foot model. The first hypothesis was only partially confirmed by the results, as the
ankle and shank-calcaneus joint angles did not improve post-operatively, except for an increase
in range of motion during the loading response phase. However, the peak plantar flexion
moment and peak power generation of both ankle and shank-calcaneus joints improved
postoperatively, mainly due to patients’ ability to walk faster with less pain after surgery. Few
studies analyzed fixed-bearing prostheses, and reported contrasting results in terms of increase
and decrease in ankle joint angles and moments after surgery.4,23–25,29 These contrasting results
may arise from differences in fixed-bearing implant designs between and within studies.
Another explanation may be the data extraction from biomechanical curves in a relatively small
number of so-called “summary” metrics (e.g. range of motion values during sub-phases of the
gait cycle): as each point on the biomechanical curve has a relationship with other points on the
curve, such data reduction may inflate the ‘false positives’ observed with traditional null-
hypothesis significance testing and even lead to opposing results.20 However, there seems to be
a general agreement in earlier studies as well as in the present results, that gait mechanics after
total ankle replacement remains impaired compared with asymptomatic control subjects.
One of the objectives of the present study was to compare the effect of total ankle
replacement on ankle joint kinematics and kinetics computed with a 1-segment (ankle) and
multi-segment (shank-calcaneus) foot model. The outcome of the linear mixed model showed
that the ‘foot model’ had a significant effect on range of motion, peak plantar flexion and peak
power generation estimates. This is in accordance with earlier studies highlighting the
overestimation of ankle joint angles and peak power generation by the 1-segment foot model
compared to the multi-segment foot model.3,8,33 However, no research yet confirmed this
overestimation in patients treated surgically for post-traumatic ankle osteoarthritis.
Furthermore, no previous research investigated the effect of the foot modeling approach on how
a surgical intervention such as total ankle replacement is estimated to benefit or degrade
biomechanical performance. The present study showed no difference in pre- to post-operative
outcome between the two modelling approaches for the ankle joint (Table 7.2 and Figure 7.1).
However, the danger of modeling the foot as a single rigid body is that motion occurring in the
intrinsic foot joints may add an extra rotation of the foot segment relative to the shank. This

136
could then overestimate ankle joint kinematics and angular velocity, resulting in overestimation
of ankle joint power. Although no significant difference could be demonstrated on the present
data, the pre- to post-operative outcome difference curves suggest that the peak values were
greater on the 1-segment (ankle) foot model than on the multi-segment (shank-calcaneus) foot
model. Therefore, we strongly believe that neglecting the intrinsic foot joints can hinder our
clinical and scientific understanding of how a therapeutic intervention benefits or degrades the
patient’s biomechanical performance.
The findings of this pilot study should be considered in the context of three limitations.
Firstly, sample size was limited to 10 symptomatic and 10 asymptomatic subjects. To detect a
minimal clinical change between pre- and post-operative conditions for the variables of interest
in the ankle joint (range of motion, peak dorsi- and plantar flexion, peak plantar flexion moment
and peak power generation), 35 participants would be needed to detect a significant difference
with 80% power and a p-value at 0.05. A second limitation was the partitioning of the total
ground reaction forces acting on the calcaneus segment based on an estimation method
(proportionality scheme) which combined pressure and force plate data together with marker
placement data. Even though this proportionality scheme was validated, the reported ankle joint
moments and power should be regarded as estimates. A third limitation was the use of skin
markers to estimate joint centers and segment kinematics. Kessler et al. (2019) compared foot
motion measured by biplanar videoradiography and optical motion capture,11 and found soft-
tissue artefacts of 3.29 mm on the surface of the foot.11 However, they found also strong
agreement between the two systems for foot motion in the sagittal plane which is the anatomical
plane of interest of this pilot study. The impact of these soft tissue errors on the estimation of
the foot joint moments and powers is difficult to determine. Therefore, the results of the current
study should be considered as an estimation and further research is needed.
CONCLUSION
This paper provides a first estimation of the effect of total ankle replacement on ankle joint
angles, moments and power assessed with a 1-segment and a multi-segment kinematic and
kinetic foot model. The foot modeling approach may affect the clinical interpretation of how a
surgical intervention such as total ankle replacement benefits or degrades the patient’s
biomechanical performance. Therefore, it is of clinical relevance to assess ankle joint
kinematics and kinetics on a multi-segment foot modeling approach.

137
REFERENCES
1. Barton T, Lintz F, Winson I. Biomechanical changes associated with the osteoarthritic,
arthrodesed, and prosthetic ankle joint. Foot Ankle Surg. 2011;17(2):52-57.
2. Bruening DA, Cooney KM, Buczek FL. Analysis of a kinetic multi-segment foot model.
Part I: Model repeatability and kinematic validity. Gait Posture. 2012;35(4):529-534.
3. Bruening DA, Cooney KM, Buczek FL. Analysis of a kinetic multi-segment foot model
part II: Kinetics and clinical implications. Gait Posture. 2012;35(4):535-540.
4. Choi JH, Coleman SC, Tenenbaum S, Polo FE, Brodsky JW. Prospective Study of the
Effect on Gait of a Two-Component Total Ankle Replacement. FOOT ANKLE Int.
2013;34(11):1472-1478.
5. Deleu P-A, Devos Bevernage B, Gombault V, Maldague P, Leemrijse T. Intermediate-
term Results of Mobile-bearing Total Ankle Replacement. Foot Ankle Int.
2015;36(5):518-530.
6. Deschamps K, Eerdekens M, Desmet D, Matricali GA, Wuite S, Staes F. Estimation of
foot joint kinetics in three and four segment foot models using an existing proportionality
scheme: Application in paediatric barefoot walking. J Biomech. 2017;61:168-175.
7. Eerdekens M, Staes F, Matricali GA, Deschamps K. Clinical Applicability of an Existing
Proportionality Scheme in Three-Segment Kinetic Foot Models. Ann Biomed Eng.
August 2019. doi:10.1007/s10439-019-02344-8.
8. Eerdekens M, Staes F, Matricali GA, Wuite S, Peerlinck K, Deschamps K. Quantifying
clinical misinterpretations associated to one-segment kinetic foot modelling in both a
healthy and patient population. Clin Biomech. 2019;67(May):160-165.
9. Friston KJ, Holmes AP, Worsley KJ, Poline J-P, Frith CD, Frackowiak RSJ. Statistical
parametric maps in functional imaging: A general linear approach. Hum Brain Mapp.
1994;2(4):189-210.
10. Futamure S, Bonnet V, Dumas R, Venture G. A sensitivity analysis method for the body
segment inertial parameters based on ground reaction and joint moment regressor
matrices. J Biomech. 2017;64:85-92.
11. Kessler SE, Rainbow MJ, Lichtwark GA, et al. A Direct Comparison of Biplanar
Videoradiography and Optical Motion Capture for Foot and Ankle Kinematics.
2019;7(August):1-10.

138
12. Krause FG, Di Silvestro M, Penner MJ, et al. Inter- and intraobserver reliability of the
COFAS end-stage ankle arthritis classification system. Foot Ankle Int. 2010;31(2):103-
108.
13. Leardini a, Benedetti MG, Berti L, Bettinelli D, Nativo R, Giannini S. Rear-foot, mid-
foot and fore-foot motion during the stance phase of gait. Gait Posture. 2007;25(3):453-
462.
14. Leardini A, Caravaggi P, Theologis T, Stebbins J. Multi-segment foot models and their
use in clinical populations. Gait Posture. 2019;69:50-59.
15. Leardini A, O’Connor JJ, Giannini S. Biomechanics of the natural, arthritic, and replaced
human ankle joint. J Foot Ankle Res. 2014;7(1):8.
16. Leardini A, Sawacha Z, Paolini G, Ingrosso S, Nativo R, Benedetti MG. A new
anatomically based protocol for gait analysis in children. Gait Posture. 2007;26(4):560-
571.
17. Legnani G, Casolo F, Righettini P, Zappa B. A homogeneous matrix approach to 3D
kinematics and dynamics — I. Theory. Mech Mach Theory. 1996;31(5):573-587.
18. MacWilliams B a., Cowley M, Nicholson DE. Foot kinematics and kinetics during
adolescent gait. Gait Posture. 2003;17(3):214-224.
19. Molenberghs G, Verbeke G. Linear Mixed Models for Longitudinal Data. 1st ed. New
York, NY: Springer New York; 2000.
20. Pataky TC. Generalized n-dimensional biomechanical field analysis using statistical
parametric mapping. J Biomech. 2010;43(10):1976-1982.
21. Pataky TC. One-dimensional statistical parametric mapping in Python. Comput Methods
Biomech Biomed Engin. 2012;15(3):295-301.
22. Pinsker E, Inrig T, Daniels TR, Warmington K, Beaton DE. Symptom Resolution and
Patient-Perceived Recovery Following Ankle Arthroplasty and Arthrodesis. Foot Ankle
Int. 2016;37(12):1269-1276.
23. Queen RM, De Biassio JC, Butler RJ, DeOrio JK, Easley ME, Nunley JA. Changes in
Pain, Function, and Gait Mechanics Two Years Following Total Ankle Arthroplasty
Performed With Two Modern Fixed-Bearing Prostheses. Foot Ankle Int.
2012;33(7):535-542.
24. Queen RM, Butler RJ, Adams SB, DeOrio JK, Easley ME, Nunley J a. Bilateral
differences in gait mechanics following total ankle replacement: a two year longitudinal
study. Clin Biomech (Bristol, Avon). 2014;29(4):418-422.

139
25. Queen RM, Franck CT, Schmitt D, Adams SB. Are There Differences in Gait Mechanics
in Patients With A Fixed Versus Mobile Bearing Total Ankle Arthroplasty? A
Randomized Trial. Clin Orthop Relat Res. 2017;475(10):2599-2606.
26. R Development Core Team. R: A Language and Environment for Statistical Computing.
Vienna, Austria: R Foundation for Statistical Computing; 2015. http://www.r-
project.org.
27. Rouhani H, Favre J, Crevoisier X, Aminian K. A wearable system for multi-segment
foot kinetics measurement. J Biomech. 2014;47(7):1704-1711.
28. Saraswat P, MacWilliams BA, Davis RB, D’Astous JL. Kinematics and kinetics of
normal and planovalgus feet during walking. Gait Posture. 2014;39(1):339-345.
29. Segal AD, Cyr KM, Stender CJ, et al. A three-year prospective comparative gait study
between patients with ankle arthrodesis and arthroplasty. Clin Biomech. 2018;54(August
2017):42-53.
30. Tenenbaum S, Bariteau J, Coleman S, Brodsky J. Functional and clinical outcomes of
total ankle arthroplasty in elderly compared to younger patients. Foot Ankle Surg.
2017;23(2):102-107.
31. Valderrabano V, Tscharner V von, Nigg BM, et al. Muscle atrophy in ankle osteoarthritis
and its rehabilitation with total ankle arthroplasty. J Biomech. 2006;39.
32. Wu G, Siegler S, Allard P, et al. ISB recommendation on definitions of joint coordinate
system of various joints for the reporting of human joint motion—part I: ankle, hip, and
spine. J Biomech. 2002;35(4):543-548.
33. Zelik KE, Honert EC. Ankle and foot power in gait analysis: Implications for science,
technology and clinical assessment. J Biomech. 2018;75:1-12.
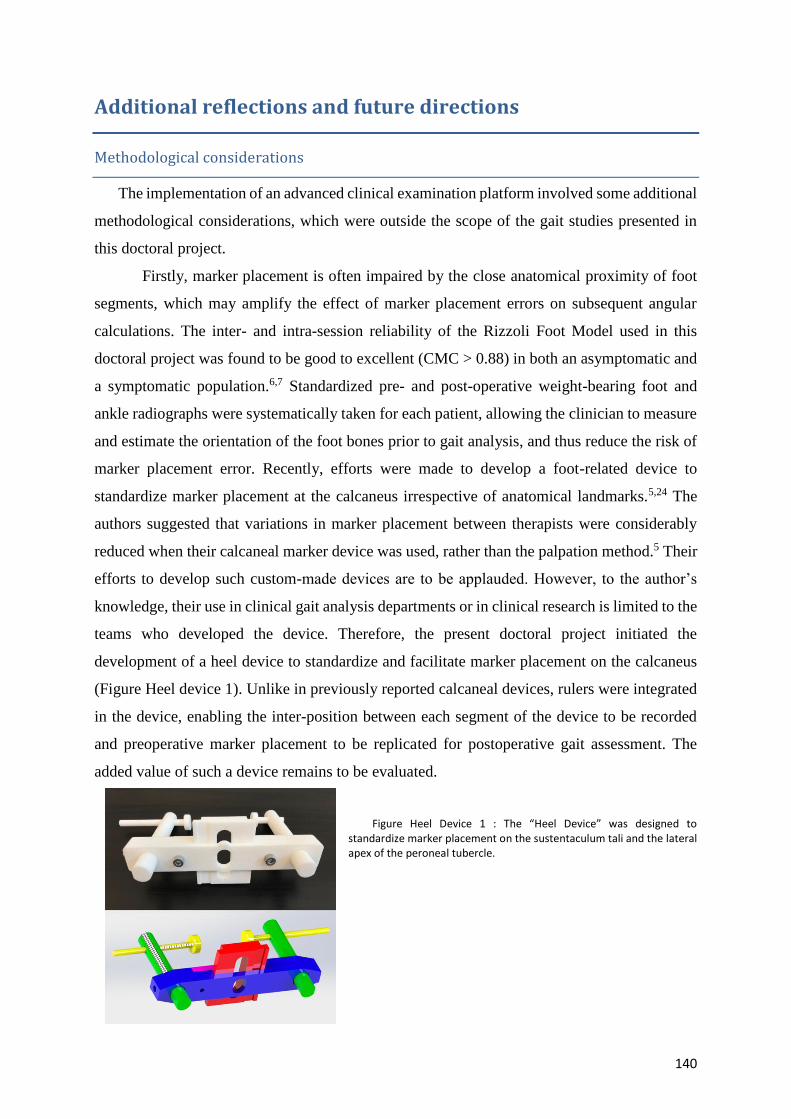
140
Additional reflections and future directions
Methodological considerations
The implementation of an advanced clinical examination platform involved some additional
methodological considerations, which were outside the scope of the gait studies presented in
this doctoral project.
Firstly, marker placement is often impaired by the close anatomical proximity of foot
segments, which may amplify the effect of marker placement errors on subsequent angular
calculations. The inter- and intra-session reliability of the Rizzoli Foot Model used in this
doctoral project was found to be good to excellent (CMC > 0.88) in both an asymptomatic and
a symptomatic population.6,7 Standardized pre- and post-operative weight-bearing foot and
ankle radiographs were systematically taken for each patient, allowing the clinician to measure
and estimate the orientation of the foot bones prior to gait analysis, and thus reduce the risk of
marker placement error. Recently, efforts were made to develop a foot-related device to
standardize marker placement at the calcaneus irrespective of anatomical landmarks.5,24 The
authors suggested that variations in marker placement between therapists were considerably
reduced when their calcaneal marker device was used, rather than the palpation method.5 Their
efforts to develop such custom-made devices are to be applauded. However, to the author’s
knowledge, their use in clinical gait analysis departments or in clinical research is limited to the
teams who developed the device. Therefore, the present doctoral project initiated the
development of a heel device to standardize and facilitate marker placement on the calcaneus
(Figure Heel device 1). Unlike in previously reported calcaneal devices, rulers were integrated
in the device, enabling the inter-position between each segment of the device to be recorded
and preoperative marker placement to be replicated for postoperative gait assessment. The
added value of such a device remains to be evaluated.
Figure Heel Device 1 : The “Heel Device” was designed to standardize marker placement on the sustentaculum tali and the lateral apex of the peroneal tubercle.

141
Secondly, soft-tissue artefacts must be considered in segmental foot analysis.14,20,27 The
assumption in the present doctoral project was that the movement of the overlying skin
accurately represents the actual movement produced by the underlying bone, which is known
as the rigid-body assumption. To assess the errors in experimental data due to violation of the
rigid-body assumption, studies compared the use of bone-mounted markers with skin-mounted
markers20,27, and found no systematic error pattern in the degree of skin motion over the
underlying foot bones and that the degree of error varied between subjects and between
anatomical sites. Recently, Kessler et al. (2019) compared foot motion measured by biplanar
videoradiography and optical motion capture.14 They found good agreement between the two
systems for foot motion in the sagittal plane, and reported soft-tissue artefacts of 3.29 mm on
the surface of the foot.14 The impact of these errors on the estimation of foot joint moments and
powers is difficult to assess. Therefore, the results of the current study should be considered as
an estimate, and further research is needed.
Thirdly, a more comprehensive, detailed and accurate view of foot mechanics was
obtained by integrating plantar pressure measurements with a 3D motion analysis system. In
the present doctoral project, integration means that both marker trajectories and plantar pressure
measurements are measured simultaneously. Plantar pressure was measured by placing a
standard Footscan® pressure plate (0.5m x 0.4m, 4,096 sensors, 2.8 sensors per cm2; RSscan
International, Paal, Belgium) on top of an AMTI-force plate (0.5 x 0.4m; Advanced Mechanical
Technology, Inc., Watertown, MA, US). The force plate was custom-made to fit the surface
dimensions of the plantar pressure plate. This set-up enabled continuous calibration of the
pressure plate with respect to the force plate, using a Footscan® 3D interface box (RSscan
International, Paal, Belgium), and also synchronized the motion analysis system and the
pressure plate by measuring the optimal signal correlation between the force signals of both the
pressure and force plates.11 Furthermore, this ‘fusion’ approach allowed us to create a 4-
segment kinetic foot model, providing new insights into the individual power distributions of
the intrinsic joints of the foot. However, the scientific community has formulated doubts about
the method used to partition the total ground reaction forces acting on each foot segment. In the
present doctoral project, the force plate data were distributed over each foot segment using the
proportionality scheme described by Morlock & Nigg (1991) and validated by Saraswat et al.
(2014).19,22 The validity of the proportionality scheme was assessed by comparing the predicted
shear forces obtained from the same experimental setup as the present study with the measured
shear forces obtained by asking the participants to adopt a 3-step controlled foot placement
approach on two adjacent force plates during a walking trial. Mean differences between the

142
shear force measured by 2 adjacent force plates and the shear force predicted by the
proportionality scheme in the hindfoot and forefoot segments in a pediatric population were
less than 3%. The clinical applicability of the proportionality scheme was further investigated
in ankle and hindfoot osteoarthritis subjects, revealing insignificant over- and under-estimation
errors in multi-segment foot kinetics by comparing estimated shear forces versus shear forces
measured by the adjacent force-plate method.9 However, these results should be viewed with
caution, as errors in determining the point of force application have been found towards the
edges of the force plate.17 Although this proportionality scheme seems to be validated, the
reported ankle joint moments and powers in the present doctoral project should be regarded as
estimates. However, during the last decade, there seems to be an emerging interest in the
development of plantar shear-stress measurement technologies. Integrating such devices in our
current measurement set-up could provide further insight into partitioning errors and the clinical
validity of the proportionality scheme.
Finally, gait analysis has progressed during recent decades and is now considered the
gold standard for the functional assessment of lower-limb pathologies.10 Moreover, in our
opinion, functional evaluation of patients’ capabilities should be investigated not only during
gait, but also during other more demanding motor tasks. Activities of daily living are not limited
to straight walking tasks, but require the ability to adapt in order to avoid obstacles, to support
the entire body weight on different terrains, and to change speed and direction as needed to
meet functional objectives.18,23 Currently, no literature exists on the use of 3D multi-segment
foot models and plantar pressure measurements in foot and ankle patients in demanding motor
tasks that challenge the various foot segments during the complex functions frequently
performed in daily life. Demanding motor tasks have proved to be valuable in discriminating
subjects with knee disorders,7 inducing ranges of motion in knee rotation out of the sagittal
plane large enough to exceed experimental error and variability across repeated trials.13
Consequently, the change in skeletal kinematics in pathologic patients was more detectable than
during walking. Therefore, we strongly believe that future studies should incorporate
demanding motor tasks to evaluate the functional capacity of patients, to provide further insight
into their foot mechanics. Furthermore, assessment of these demanding motor tasks should not
be restricted to artificial conditions created in the gait laboratory, but could also be evaluated
in more natural environment through the use of wearable sensors.

143
Clinical considerations
In contrast to hip and knee osteoarthritis, the etiology of osteoarthritis and arthritis in
the ankle joint is often secondary to a group of diseases (rheumatoid pathology, hemophilia,
hemochromatosis, etc.) or injuries (fracture, ankle sprain, etc.). The loss of joint space and
cartilage frequently results from a progressive pathomechanical process induced by joint and
bone geometry as well as by soft-tissue imbalance. As a consequence of the individual
pathomechanical processes associated with ankle osteoarthritis, ‘ankle osteoarthritis’ covers a
large diversity of categories, subtypes and levels of involvement. It is therefore reasonable to
assume that there is also a wide variety in gait biomechanics. The interpretation of results can
only be valid if this large variability is taken into account.
In research, this is theoretically managed by strict implementation of inclusion and
exclusion criteria, to recruit a homogenous study group. However, the systematic review and
meta-analysis performed in the present doctoral project showed that the ankle osteoarthritis
being investigated, in terms of subtype and associated osteo-articular deformities, was poorly
described in 14 of the 17 included gait studies.
Evaluating concomitant joint deformities and intrinsic foot mobility plays an essential
role in the surgical management of patients suffering from ankle osteoarthritis.15,16 However,
these key factors and the corresponding alterations in foot biomechanics have never been truly
investigated (Cf. Chapters 5 & 6). Chapter 6 aimed at comparing the effect of ankle and hindfoot
malalignment on the gait kinematics and kinetics of multiple joints of the foot and ankle
complex in patients suffering from post-traumatic ankle osteoarthritis. Our data seem to provide
further evidence of the interrelationship between foot structure and alterations in foot
mechanics. Therefore, future studies should further investigate this interrelationship, by
breaking down the three deformity groups of Chapter 5 into the subgroups presented in Figure
Ankle OA Classification. Profiling groups of patients has proved to be a powerful approach in
medicine, and is often the first step in treatment algorithms. In ankle osteoarthritis,
classification may be used to understand and treat dysfunction, with three major objectives:
understanding biomechanical factors related to etiology, predicting progression, and designing
optimal treatment strategies. The major challenge associated with the profiling approach is to
be able to recruit a sufficient number of patients to create homogeneous study groups for each
ankle osteoarthritis profile. The low prevalence (1% of the adult population) of ankle
osteoarthritis further complicates recruitment. The number of patients suffering from
symptomatic hip and knee osteoarthritis is 9 to 10 times higher than those suffering from

144
symptomatic ankle osteoarthritis.3,4,13 Therefore, the present doctoral project initiated a
multicenter study in two foot and ankle research centers (Lyon and Brussels), following the
same research protocol. Recruitment of preoperative ankle osteoarthritis cases has recently
started in Lyon (January 2019) and will provide adequate sample size for meaningful statistics.
No such multicenter studies have previously been developed.
Critical appraisal of the literature further reveals that the effect of ankle arthrodesis and total
ankle replacement is poorly understood from the point of view of foot biomechanics, as the foot is still
implemented as a rigid functional segment in gait studies (Chapter 3). There is also a lack of knowledge
concerning the correlation between ankle arthrodesis or total ankle arthroplasty positioning and the
patient’s foot mechanics. Although gait is improved after total ankle replacement or ankle arthrodesis
compared to the preoperative situation, patients still experience impaired lower-limb function.1,8,21,26
They have to make compensatory functional adaptations to remain capable of performing basic activities
of daily living. These compensations are known as accessory offending motion hypermobility, which
takes the path of least resistance of motion and is an underlying characteristic of degenerative joint
disease.10 Studies showed secondary postoperative arthritic changes in the ipsilateral adjacent joints,
with most degeneration occurring in the subtalar joint, followed by the midtarsal joints.2,25 This is the
result of tissue trauma caused by repeated compensatory movements during activities of daily living.
When these arthritic changes become symptomatic, additional surgical procedures will be required,
exacerbating the functional deficiencies.12 Unfortunately, these secondary functional limitations and
compensatory adaptations and their impact on structures of neighboring joints during activities of daily
living have been little studied. Therefore, we strongly believe that future studies should extend
biomechanical assessment of the affected to the adjacent and non-adjacent foot joints in order to improve
postoperative care.

145
REFERENCES
1. Barton T, Lintz F, Winson I. Biomechanical changes associated with the osteoarthritic,
arthrodesed, and prosthetic ankle joint. Foot Ankle Surg. 2011;17(2):52-57.
2. Coester LM, Saltzman CL, Leupold J, Pontarelli W. Long-Term Results Following
Ankle Arthrodesis for Post-Traumatic Arthritis. J Bone Joint Surg Am. 2001;83(2):219-
228.
3. Cunningham LS, Kelsey JL. Epidemiology of musculoskeletal impairments and
associated disability. Am J Public Health. 1984;74(6):574-579.
4. Cushnaghan J, Dieppe P. Study of 500 patients with limb joint osteoarthritis. I. Analysis
by age, sex, and distribution of symptomatic joint sites. Ann Rheum Dis. 1991;50(1):8-
13.
5. Deschamps K, Roosen P, Birch I, et al. A novel device for standardizing marker
placement at the calcaneus. J Am Podiatr Med Assoc. 2014;104(1):43-49.
6. Deschamps K, Staes F, Bruyninckx H, et al. Repeatability in the assessment of multi-
segment foot kinematics. Gait Posture. 2012;35(2):255-260.
7. Deschamps K, Staes F, Bruyninckx H, et al. Repeatability of a 3D multi-segment foot
model protocol in presence of foot deformities. Gait Posture. 2012;36(3):635-638.
8. Doets HC, Vergouw D, Veeger HEJ (Dirkjan., Houdijk H. Metabolic cost and
mechanical work for the step-to-step transition in walking after successful total ankle
arthroplasty. Hum Mov Sci. 2009;28(6):786-797.
9. Eerdekens M, Staes F, Matricali GA, Deschamps K. Clinical Applicability of an Existing
Proportionality Scheme in Three-Segment Kinetic Foot Models. Ann Biomed Eng.
August 2019.
10. Guilak F, Fermor B, Keefe FJ, et al. The role of biomechanics and inflammation in
cartilage injury and repair. Clin Orthop Relat Res. 2004;(423):17-26.
11. Hagman F. Can plantar pressure predict foot motion ? 2005.
12. Hintermann B, Barg A, Knupp M, Valderrabano V. Conversion of painful ankle
arthrodesis to total ankle arthroplasty. J Bone Joint Surg Am. 2009;91(4):850-858.
13. Huch K, Kuettner KE, Dieppe P. Osteoarthritis in ankle and knee joints. Semin Arthritis
Rheum. 1997;26(4):667-674.
14. Kessler SE, Rainbow MJ, Lichtwark GA, et al. A Direct Comparison of Biplanar
Videoradiography and Optical Motion Capture for Foot and Ankle Kinematics.
2019;7(August):1-10.

146
15. Knupp M. The Use of Osteotomies in the Treatment of Asymmetric Ankle Joint
Arthritis. Foot Ankle Int. 2017;38(2):220-229.
16. Krause FG, Di Silvestro M, Penner MJ, et al. Inter- and intraobserver reliability of the
COFAS end-stage ankle arthritis classification system. Foot Ankle Int. 2010;31(2):103-
108.
17. List R, Hitz M, Angst M, Taylor WR, Lorenzetti S. Gait & Posture In-situ force plate
calibration : 12 years ’ experience with an approach for correcting the point of force
application. Gait Posture. 2017;58(July):98-102. doi:10.1016/j.gaitpost.2017.07.111.
18. McKeon PO, Hertel J, Bramble D, Davis I. The foot core system: a new paradigm for
understanding intrinsic foot muscle function. Br J Sports Med. 2015;49(5):290-290.
19. Morlock M, Nigg BM. Theoretical considerations and practical results on the influence
of the representation of the foot for the estimation of internal forces with models. Clin
Biomech. 1991;6(1):3-13.
20. Nester C, Jones RK, Liu a, et al. Foot kinematics during walking measured using bone
and surface mounted markers. J Biomech. 2007;40(15):3412-3423.
21. Philippe P, Paul C, Mark M, Jean-Noel C, Delphine P, Thierry J. Ankle Replacement
versus Arthrodesis: A Comparative Gait Analysis Study. Foot Ankle Int. 2008;29(1):3-
9.
22. Saraswat P, MacWilliams BA, Davis RB, D’Astous JL. Kinematics and kinetics of
normal and planovalgus feet during walking. Gait Posture. 2014;39(1):339-345.
23. Shumway-Cook Anne WMH. Summary for Policymakers. In: Intergovernmental Panel
on Climate Change, ed. Climate Change 2013 - The Physical Science Basis. Cambridge:
Cambridge University Press; 2012:1-30.
24. Simon J, Doederlein L, McIntosh AS, Metaxiotis D, Bock HG, Wolf SI. The Heidelberg
foot measurement method: Development, description and assessment. Gait Posture.
2006;23(4):411-424.
25. Thomas R. Gait Analysis and Functional Outcomes Following Ankle Arthrodesis for
Isolated Ankle Arthritis. J Bone Jt Surg. 2006;88(3):526.
26. Valderrabano V, Nigg BM, von Tscharner V, Stefanyshyn DJ, Goepfert B, Hintermann
B. Gait analysis in ankle osteoarthritis and total ankle replacement. Clin Biomech.
2007;22(8):894-904.
27. Westblad P, Hashimoto T, Winson I, Lundberg A, Arndt A. Differences in Ankle-Joint
Complex Motion During the Stance Phase of Walking as Measured by Superficial and
Bone-Anchored Markers. Foot Ankle Int. 2002;23(9):856-863.

147
General conclusion
In conclusion, this doctoral project provided biomechanical insight into the (patho-
)mechanics of ankle osteoarthritis by developing an advanced clinical examination platform.
The integration of all the hardware devices composing the platform enabled the creation of a 4-
segment kinematic and kinetic foot model, providing valuable information for future clinical
reasoning and interpretation. We strongly believe that the combination of such an advanced
clinical examination platform in association with clinical and radiographic information will
help us to gain further insight into the complex of foot and ankle biomechanics. Before being
able to determine an optimal approach, further research is needed. The present doctoral project
suggests that profiling ankle osteoarthritis patients solely according to etiology would be a
considerable limitation, whereas a biomechanical approach integrating clinical and
radiographic information to develop a new classification system may be the state-of-the-art
methodological approach for future studies on the mechanical component of ankle
osteoarthritis, forming the basis for research on etiology, prediction and treatment of
pathological conditions related to ankle osteoarthritis.

148
List of Figures
Figure 2.1 : Satisfaction & health-related outcome measures by recovery group ......................... 26 Figure 2.2 : Outcome measures by surgical procedure .................................................................. 28 Figure 2.3 : Surgical procedures by recovery group ....................................................................... 29 Figure 3.1 : Pubmed search strategy & flow diagram of search results ......................................... 40 Figure 3.2 : The change in gait parameters (Ankle Dorsi-/Plantar-flexion RoM, Peak Ankle
Plantarflexion Moment, Peak Ankle Power Generation) following total ankle replacement (TAR global, Mobile-bearing prosthesis and Fixed-bearing prosthesis) compared to pre-operative status . 48
Figure 3.3 : The change in all gait parameters (Ankle Dorsi-/Plantar-flexion RoM, Peak Ankle Plantarflexion Moment, Peak Ankle Power Generation) following ankle arthrodesis compared to pre-operative status. .................................................................................................................................... 49
Figure 3.4 : The change in walking speed following total ankle replacement and ankle arthrodesis compared to pre-operative status ........................................................................................................ 54
Figure 4.1 : Inter-segment center definitions were defined according to an adapted version of Rizzoli foot model (Leardini et al. 2007) developed by Deschamps et al. (2017) (IOR-4Segment-model 1). Markers name : upper ridge of the posterior surface of the calcaneus (FC); peroneal tubercle (FPT); sustentaculum tali (FST); virtual cuboid marker (FCub), tuberosity of the navicular bone (FNT); first, second and fifth metatarsal base (FMB, SMB, FMT); first, second and fifth metatarsal head (FM1,FM2, FM5); PD6 : distal dorso-medial aspect of the head of the proximal phalanx of the hallux; First Metatarso-phalangeal joint center (FM1; Midfoot-Metatarsus center (SMB); Calcaneus-Midfoot center (ID) .............................................................................................................................................. 72
Figure 4.2 : Mean 3D kinematics (degrees) for the Ankle, Shank-Calcaneus (Sha-Cal), Chopart joint (Cal-Mid), Lisfranc joint (Mid-Met), First Metatarso-Phalangeal joint (1st Metatarso-Phal). Standard deviations are visualized as bands. ........................................................................................ 74
Figure 4.3 : Mean 3D angular velocities (degrees/second) for the Ankle, Shank-Calcaneus (Sha-Cal), Chopart joint (Cal-Mid), Lisfranc joint (Mid-Met), First Metatarso-Phalangeal joint (1st Metatarso-Phal). Standard deviations are visualized as bands. ........................................................... 76
Figure 4.4 : Mean 3D joint moments (Nm/kg) for the Ankle, Shank-Calcaneus (Sha-Cal), Chopart joint (Cal-Mid), Lisfranc joint (Mid-Met), First Metatarso-Phalangeal joint (1st Metatarso-Phal). Standard deviations are visualized as bands. ........................................................................................ 77
Figure 4.5 : Mean 3D joint power (Watt/kg) and mean 3D angle between joint moment and joint angular velocity vectors for the Ankle, Shank-Calcaneus (Sha-Cal), Chopart joint (Cal-Mid), Lisfranc joint (Mid-Met), First Metatarso-Phalangeal joint (1st Metatarso-Phal). Standard deviations are visualized as bands. Subphases of the gait cycle. Abbreviations : R : resistance configuration; P : propulsion configuration; S : stabilisation configuration. ..................................................................... 78
Figure 5.1 : Inter-segment center definitions were defined according to an adapted version of Rizzoli foot model (Leardini et al. 2007) developed by Deschamps et al. (2017) (IOR-4Segment-model 1). Markers name: upper ridge of the posterior surface of the calcaneus (FC); peroneal tubercle (FPT); sustentaculum tali (FST); virtual cuboid marker (FCub), tuberosity of the navicular bone (FNT); first, second and fifth metatarsal base (FMB, SMB, FMT); first, second and fifth metatarsal head (FM1,FM2, FM5); PD6: distal dorso-medial aspect of the head of the proximal phalanx of the hallux; First Metatarso-phalangeal joint center (FM1; Midfoot-Metatarsus center (SMB); Calcaneus-Midfoot center (ID) .............................................................................................................................................. 92
Figure 5.2 : Kinematic waveforms representation with +/- 1 standard deviation cloud for the intrinsic joints of the foot: Ankle (between the Foot and Shank); Sha-Cal: Shank-Calcaneus ; 1st Metatarso-Phal: 1st Metatarso-Phalangeal joint. PS OA group (blue), CTRL group (green) and PF OA (purple); DF: dorsiflexion ; PF: plantarflexion; Add: Adduction ; Abd :Abduction ; Inv: Inversion ; Ev: Eversion. ................................................................................................................................................ 96
Figure 5.3 : Kinetic between-group comparison of inter-segmental Ankle and Shank-Calcaneus joint moment (Mz) during the stance phase of gait. PS OA group (blue), CTRL group (green) and PF

149
OA (purple). Absorption. A-C,G-I:Mean kinetic trajectories with their respective standard deviation clouds. D-F, J-L: SPM results: SPM{t} is the trajectory of the post-hoc two-sample t-test. The dotted red lines indicate the random field theory threshold for significance and p-values indicate the likelihood that a random process of the same temporal smoothness would be expected to produce a suprathreshold cluster of the observed size. ........................................................................................ 97
Figure 5.4 : Kinetic between-group comparison of inter-segmental Ankle and Shank-Calcaneus joint power during the stance phase of gait. PS OA group (blue), CTRL group (green) and PF OA (purple). Abbreviations: Gen (+): Generation ; Abs (-): Absorption. A-C,G-I: Mean kinetic trajectories with their respective standard deviation clouds. D-F, J-L: SPM results: SPM{t} is the trajectory of the post-hoc two-sample t-test. The dotted red lines indicate the random field theory threshold for significance and p-values indicate the likelihood that a random process of the same temporal smoothness would be expected to produce a suprathreshold cluster of the observed size. .............. 98
Figure 5.5 : Kinetic between-group comparison of inter-segmental Lisfranc joint moment (Mz) and power during the stance phase of gait. PS OA group (blue), CTRL group (green) and PF OA (purple). Abbreviations: Gen (+): Generation; Abs (-): Absorption. A-C,G-I: Mean kinetic trajectories with their respective standard deviation clouds. D-F, J-L: SPM results: SPM{t} is the trajectory of the post-hoc two-sample t-test. The dotted red lines indicate the random field theory threshold for significance and p-values indicate the likelihood that a random process of the same temporal smoothness would be expected to produce a suprathreshold cluster of the observed size. .............. 99
Figure 6.1 : (A,C,D,F) Standardized anteroposterior ankle Méary radiographic view to measure
the hindfoot deformity. Hindfoot axis with respect to the ground (γ angle: valgus 80 degrees; varus
95 degrees) and the intra-articular ankle varus or valgus alignment (position of the talus with
respect to the axis of the tibia: 80° valgus; 100° varus);12,19 (B,E) Standardized weight-bearing lateral foot (and ankle) radiographic view to measure the midfoot deformity as the talar/1st
metatarsal angle (β1 angle: 170° high arch (cavus); 190° low arch (planus)) and medial
longitudinal arch deformation as the Djian-Annonier angle (β2 angle: 115° high arch (cavus); 130° low arch (planus)). Fig 1 A,B,C are foot and ankle deformities associated with the planus OA group; D,E,F, associated with the cavus OA group. Fig. F shows the “zig-zag” deformity, as the subtalar joint goes in the opposite direction (valgus) of the tibiotalar deformity (varus). ................ 111
Figure 6.2 : Inter-segment centers were defined according to an adapted version of Rizzoli’s foot model (Leardini et al. 2007) developed by Deschamps et al. (2017) (IOR-4Segment-model 1). Marker names: upper ridge of the posterior surface of the calcaneus (FC); peroneal tubercle (FPT); sustentaculum tali (FST); virtual cuboid marker (FCub), tuberosity of the navicular bone (FNT); 1st, 2nd and 5th metatarsal base (FMB, SMB, FMT); 1st, 2nd and 5th metatarsal head (FM1, FM2, FM5); PD6: distal dorso-medial aspect of the head of the proximal phalanx of the hallux; 1st metatarso-phalangeal joint center (FM1; midfoot-metatarsus center (SMB); calcaneus-midfoot center (ID) ... 112
Figure 6.3 : Kinematic waveform representation with ±1 standard deviation cloud for the intrinsic foot joints: Sha-Cal: Shank-Calcaneus; 1st Metatarso-Phal: 1st Metatarso-Phalangeal joint. Cavus OA group (blue), Neutral OA group (green) and Planus OA (purple); DF: dorsiflexion; PF: plantar flexion; Add: Adduction; Abd: Abduction; Inv: Inversion; Ev: Eversion. .......................................................... 116
Figure 6.4 : Kinetic between-group comparison of inter-segmental Shank-Calcaneus joint moments (Mx & My) during the stance phase of gait. Cavus OA group (blue), Neutral OA group (green) and Planus OA group (purple); Sha-Cal: Shank-Calcaneus; A-C,G-I: Mean kinetic trajectories with their respective standard deviation clouds. D-F, J-L: SPM results: SPM{t} is the trajectory of the post-hoc 2-sample t-test. The dotted red lines indicate the random field theory threshold for significance, and p-values indicate the likelihood that a random process of the same temporal smoothness would be expected to produce a suprathreshold cluster of the observed size. ............ 117
Figure 6.5 : Kinetic between-group comparison of 3D angle M of the Shank-Calcaneus and Chopart joints during the stance phase. Cavus OA group (blue), Neutral OA group (green) and Planus
OA group (purple); Sha-Cal: Shank-Calcaneus; When the 3D angle M is <60° or >120°, the moment
mainly drives the joint, with, respectively, propulsion (P) or resistance (R). When the 3D angle M is

150
between 60° and 120°, the moment mainly stabilizes the joint (S); A-C,G-I: Mean kinetic trajectories with their respective standard deviation clouds. D-F, J-L: SPM results: SPM{t} is the trajectory of the post-hoc 2-sample t-test. The dotted red lines indicate the random field theory threshold for significance, and p-values indicate the likelihood that a random process of the same temporal smoothness would be expected to produce a suprathreshold cluster of the observed size. ............ 118
Figure 7.1 : A-D: Pre- to post-operative outcome differences between the two ankle joint modeling approaches (blue line: ankle joint; green line: shank-calcaneus joint) for the dorsiflexion-plantar flexion joint angle (A), joint angular velocity (B), dorsiflexion-plantar flexion joint moment (C) and joint power (D). E,F,G,H: SPM{t} is the trajectory of the post-hoc paired t-test. The dotted red lines indicate the random field theory threshold for significance and p-values indicate the likelihood that a random process of the same temporal smoothness would to produce a suprathreshold cluster of the observed size. Abbreviations: DF: dorsiflexion; PF: plantarflexion; Gen (+): Generation; Abs (-): Absorption. .......................................................................................................................................... 134

151
List of tables
Table 2-1 : Demographic description by recovery groupa .............................................................. 25 Table 2-2 : Demographic description by surgical procedurea ......................................................... 25 Table 2-3 : Description of surgical procedure groups and outcome measures by recovery groupa
............................................................................................................................................................... 27 Table 2-4 : Description of recovery group and outcome measures by surgical procedurea .......... 28 Table 3-1 : Study and patient characteristics (NA : not applicable, NR : not reported, SD : standard
deviation, FB : Fixed-bearing, MB : Mobile-bearing; Ankle prostheses : Salto Talaris® (Integra Life Sciences, USA), INBONE (Wright Medical Technology, USA); STARTM (Stryker, Orthopaedics, USA) ; Agility (Depuys Synthes USA), Hintegra (Integra, US); AES (Ankle Evolutive System, Transystem, France), BOX (Bologna-Oxford,,Finsbury, UK), Mobility (Depuy, UK). .................................................. 44
Table 3-2 : Summary findings for gait parameters. Change from pre-operative to post-operative status and quality of the evidence related to Standard Mean Difference (SMD) : A : Total ankle replacement : pre-operative versus post-operative; B ; Ankle arthrodesis : pre-operative versus post-operative (NA: Not applicable, MD : mean difference, deg: degrees, HQ: High quality, MQ : Moderate Quality, FQ : Fair quality) ....................................................................................................................... 51
Table 3-3 : Summary findings for gait parameters. Change from pre-operative to post-operative status and quality of the evidence related to Standard Mean Difference (SMD) : A : Mobile-bearing, B) Fixed-bearing. (NA: Not applicable, MD : mean difference, deg: degrees, HQ: High quality, MQ : Moderate Quality, FQ : Fair quality) ...................................................................................................... 56
Table 5-1 : Demographic and spatio-temporal data between 1) post-sprain post-traumatic ankle osteoarthritis (PS OA); 2) post-traumatic post-fracture ankle osteoarthritis (PF OA) and 3) asymptomatic control subjects (CTRL). Abbreviations: COFAS: Canadian Orthopaedic Foot & Ankle Society classification system for ankle osteoarthritis (Type 1 has isolated ankle osteoarthritis; Type 2 signifies ankle osteoarthritis associated with intra-articular ankle deformity or a tight heel cord or both, Type 3 patients have ankle osteoarthritis with deformity of the hind- or midfoot, tibia or forefoot; and Type 4 includes Type 1 to Type 3 plus subtalar or calcaneocuboid or talonavicular osteoarthritis); SD:standard deviation; BMI: body mass index; N.S.: not significant. *Post hoc Tukey honestly test (adjusted p-value 0.3/3=0.017). ............................................................................................................ 94
Table 6-1 : Demographic, spatio-temporal and radiographic data for the three patient groups: post-traumatic ankle osteoarthritis associated with planus foot deformity (Planus OA), with cavus foot deformity (Cavus OA), and without foot deformity (Neutral OA). Abbreviations: COFAS: Canadian Orthopaedic Foot & Ankle Society classification system for ankle osteoarthritis; MLA: medial longitudinal arch; SD: standard deviation; BMI: body mass index; N/A: not applicable; N.S.: not significant. Statistics: Depending on the distribution of the demographic and spatio-temporal data, 1-way ANOVA (normal distribution) or Kruskal-Wallis test (non-normal distribution) were used to assess statistical differences for each variable between the three groups. *Gabriel’s post-hoc test (adjusted P-value 0.3/3=0.017); ** post-hoc Mann-Whitney U test (adjusted P-value 0.3/3=0.017). .............. 110
Table 7-1 : Demographic data of patients and control subjects (Abbreviations: CTRL: control subjects; BMI: body mass index; SD: standard deviation; N/A: not applicable; preop: preoperative; postop: postoperative) ........................................................................................................................ 127
Table 7-2 : Kinematic and kinetic comparison of ankle joint outcome variables measured with a 1-segment and a multi-segment foot model between pre- and post-operative conditions. P-values for
kinematic variables ( = 0.007) and for kinetic variables ( = 0.05) of between-times effect, between-models effect and time*foot model interaction effect are presented. Bold P-values indicate significant difference. ........................................................................................................................................... 131
Table 7-3 : Kinematic and kinetic comparison of ankle joint outcome variables measured with a 1-segment and a multi-segment foot model in control subjects and patients after total ankle replacement
(TAR). P-values for kinematic variables ( = 0.007) and for kinetic variables ( = 0.05) of between-times

152
effect, between-models effect and time*foot model interaction effect are presented. Bold P-values indicate significant difference. ............................................................................................................ 132

153
Appendix

154
Appendix 1 : Chapter 3 : Supplementary material 1 : Results of modified Downs and Black scale

155

156

157

158

159
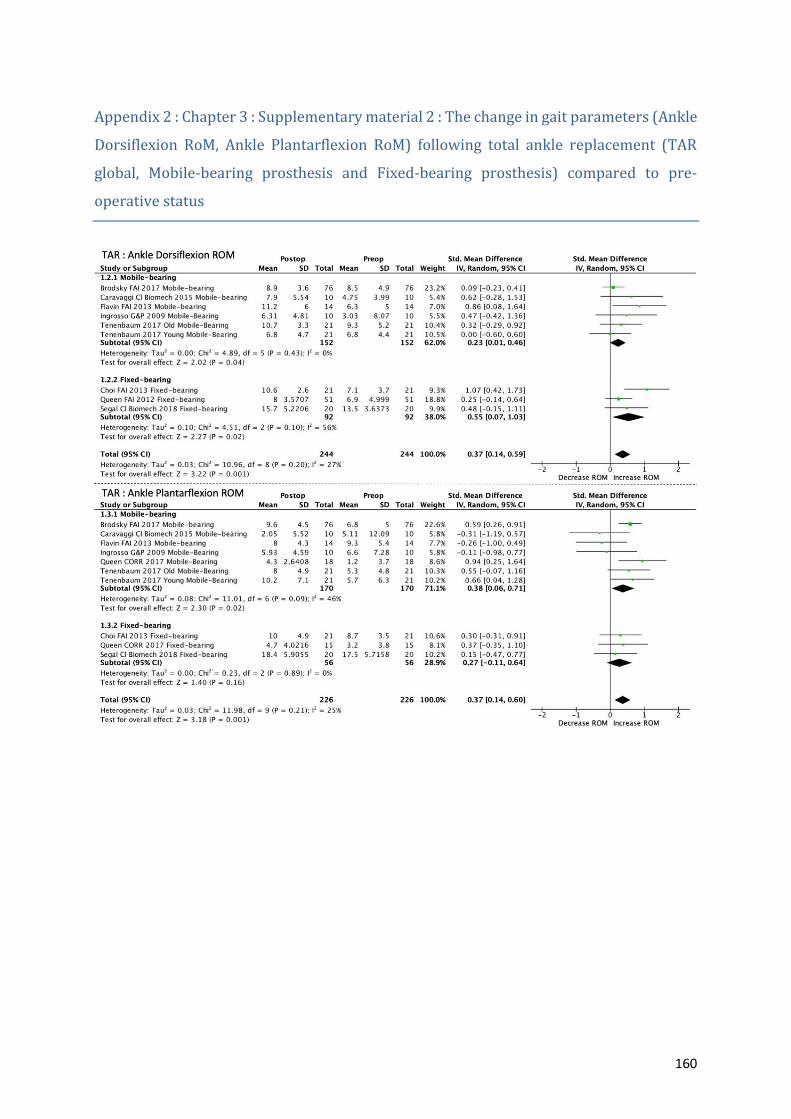
160
Appendix 2 : Chapter 3 : Supplementary material 2 : The change in gait parameters (Ankle
Dorsiflexion RoM, Ankle Plantarflexion RoM) following total ankle replacement (TAR
global, Mobile-bearing prosthesis and Fixed-bearing prosthesis) compared to pre-
operative status

161
Appendix 3 : Chapter 3 : Supplementary material 3 : The change in gait parameters (Knee
and Hip RoM) following total ankle replacement (TAR global, Mobile-bearing prosthesis
and Fixed-bearing prosthesis) compared to pre-operative status

162
Appendix 4 : Chapter 3 : Supplementary material 4 : The change in spatio-temporal
parameters (Cadence, Stance Duration, Step Length) following total ankle replacement
(TAR global, Mobile-bearing prosthesis and Fixed-bearing prosthesis) compared to pre-
operative status

163
Appendix 5 : Chapter 3 : Supplementary material 5 : The change in all gait parameters
(Ankle Dorsiflexion RoM, Ankle Plantarflexion RoM, Knee and Hip RoM) following ankle
arthrodesis compared to pre-operative status.

164
Appendix 6 : Chapter 3 : Supplementary material 6 : The change in spatio-temporal
parameters (Cadence, Stance Duration, Step Length) ) following ankle arthrodesis
compared to pre-operative status