Proceedings of the 7th Australasian Biomechanics Conference
100
PROCEEDINGS OF THE 7TH AUSTRALASIAN BIOMECHANICS CONFERENCE Official conference of the Australian & New Zealand Society of Biomechanics Griffith University, Gold Coast campus Gold Coast, Australia November 30 & December 1, 2009
Transcript of Proceedings of the 7th Australasian Biomechanics Conference

PROCEEDINGS OF THE 7TH AUSTRALASIAN BIOMECHANICS CONFERENCE
Official conference of the Australian & New Zealand Society of Biomechanics
Griffith University, Gold Coast campus Gold Coast, Australia
November 30 & December 1, 2009


Proceedings of the 7th Australasian Biomechanics Conference, Griffith University, November /December 2009
Proceedings of the 7th Australasian Biomechanics Conference Griffith University, Gold Coast campus Gold Coast, Australia November 30 & December 1, 2009 Edited by: Dr Peter Mills A/Prof Rod Barrett Prof Peter Milburn Dr Glen Lichtwark Dr Justin Kavanagh A/Prof Chris Barclay A/Prof Belinda Beck

Published by the School of Physiotherapy and Exercise Science, Griffith University, Gold Coast campus, 4222, Australia All rights to this publication are reserved. This book may not be reproduced in any form without permission from the editors. All papers appearing in this publication have been peer-reviewed by the ABC7 Scientific Committee. Additional copies can be obtained from: Dr Peter Mills Chair, ABC7 Organising Committee School of Physiotherapy and Exercise Science Griffith University, Gold Coast campus 4222, Australia Fax: +61 7 5552 8674 Email: [email protected] Price: $40.00 AUD including GST. Cheque or money order payable to Griffith University with your request for copies of the Proceedings of ABC7. ISBN: 978-0-646-52474-0
s1024610
Cross-Out

Proceedings of the 7th Australasian Biomechanics Conference, Griffith University, November /December 2009
WELCOME On behalf of the Organising Committee, it gives me great pleasure to welcome you to the 7th Australasian Biomechanics Conference (ABC7), hosted by the School of Physiotherapy and Exercise Science, Griffith University, Gold Coast campus. The main aim of the conference is to provide a regional forum in which researchers working in the broad field of Biomechanics can meet to present and discuss their scientific ideas and findings. This year, we are confident that we have an excellent scientific program and are confident that ABC& will live up to the high standard of previous ABC conferences. ABC7 will consist of a combination invited and free of podium and poster presentations, and an invited panel discussion of where biomechanics may be in 20 years time. Abstracts accepted for free podium and poster presentation following peer review by the ABC7 Scientific Committee appear in the conference proceedings. Over 60 abstracts, from a total of more than 180 co-authors were finally accepted spanning the topics of tissue mechanics, gait, biomechanics of sport and exercise, ergonomics and biomechanical modelling. It was particularly encouraging to see that a large number of abstracts were submitted by students, and we hope that they, and other presenters, will benefit from the opportunity to receive constructive feedback from their colleagues. Following completion of the conference, conference abstracts will be made available via the conference website located at: http://www.griffith.edu.au/conference/australasian-biomechanics-conference-2009. On behalf of the Organising Committee, I wish you all the best for the conference and thank you for your participation. Dr Peter Mills Chair, Organising Committee

ORGANISING COMMITTEE Dr Peter Mills (Chair) School of Physiotherapy & Exercise Science, Griffith University A/Prof Rod Barrett School of Physiotherapy & Exercise Science, Griffith University Prof Peter Milburn School of Physiotherapy & Exercise Science, Griffith University Dr Glen Lichtwark School of Physiotherapy & Exercise Science, Griffith University Dr Justin Kavanagh School of Physiotherapy & Exercise Science, Griffith University A/Prof Chris Barclay School of Physiotherapy & Exercise Science, Griffith University A/Prof Belinda Beck School of Physiotherapy & Exercise Science, Griffith University SCIENTIFIC COMMITTEE Dr Peter Mills School of Physiotherapy & Exercise Science, Griffith University A/Prof Rod Barrett School of Physiotherapy & Exercise Science, Griffith University Prof Peter Milburn School of Physiotherapy & Exercise Science, Griffith University Dr Glen Lichtwark School of Physiotherapy & Exercise Science, Griffith University Dr Justin Kavanagh School of Physiotherapy & Exercise Science, Griffith University A/Prof Chris Barclay School of Physiotherapy & Exercise Science, Griffith University A/Prof Belinda Beck School of Physiotherapy & Exercise Science, Griffith University A/Prof Graham Kerr School of Human Movement Studies, Queensland University of Technology Prof Mark Pearcy School of Engineering Systems, Queensland University of Technology Prof Paul Hodges School of Human Movement Studies, University of Queensland Prof Andrew Cresswell School of Human Movement Studies, University of Queensland Dr Robyn Grote Royal Children’s Hospital, Brisbane A/Prof Wendy Gilleard School of Health and Human Sciences, Southern Cross University A/Prof Brendan Burkett School of Health and Sport Sciences, Sunshine Coast University Dr Chris Carty School of Physiotherapy and Exercise Science, Griffith University Dr Ben Weeks School of Physiotherapy and Exercise Science, Griffith University ANZSB EXECUTIVE President: A/Prof Wendy Gilleard School of Health and Human Sciences, Southern Cross University President elect: Prof Andrew Cresswell School of Human Movement Studies, University of Queensland Sectetary/treasurer: A/Prof Tim Doyle School of Sport Science, Exercise & Health, The University of Western Australia Conference liason: Dr Peter Mills School of Physiotherapy & Exercise Science, Griffith University CONFERENCE ASSISTANTS Lee Barber James Fletcher Jarred Gillett Sean Horan Ravin Lal Murray Tucker

Proceedings of the 7th Australasian Biomechanics Conference, Griffith University, November /December 2009
SPONSORS
International Society of Biomechanics http://isbweb.org
OpenSim https://simtk.org/home/opensim
Human Kinetics www.humankinetics.com
Journal of Applied Biomechanics www.humankinetics.com/JAB

Australian and New Zealand Society of Biomechanics www.anzsb.asn.au
Griffith University www.griffith.edu.au
Innovision systems http://www.innovision-systems.com

Proceedings of the 7th Australasian Biomechanics Conference, Griffith University, November /December 2009
TRADE EXHIBITORS
Kistler Instruments Australia Pty Ltd Contact: Warren Brooks G21/202 Jells Rd Wheelers Hill VIC 3150 Australia Tel +61 3 9560 5055 Fax +61 3 8625 0065 Mob: + 61 (0)407 875 479 www.kistler.com [email protected]
Qualisys AB Contact: Pavel Bogachko Packhusgatan 6, S-41113 Gothenburg, Sweden Mobile: +46 704 900 270 Phone: + 46 31 336 94 07 Fax: + 46 31 336 94 20 [email protected]
NDI Asia Pacific Unit 301, 3/F, Core Building 1, No. 1 Science Park East Avenue, Hong Kong Science Park, Shatin, N.T., Hong Kong Telephone: + (852) 2802-2205 Global: + (800) 634-634-00 Fax: + (852) 2802-0060 www.ndigital.com
J C Measurements Pty Ltd Contact: John Corcoran Phone: (07) 5546 8000 Fax: (07) 5547 0800 Mobile: 0413 189 027 [email protected]

TABLE OF CONTENTS Keynote presentation
W Herzog. Force enhancement/force depression and mechanisms of contraction in skeletal muscles 2 Invited presentations
C Barclay. The molecular basis of the force-velocity and efficiency-velocity relationships 5 A Cresswell. Motoneurone firing behaviour and reflex excitability during the performance of controlled isometric contractions and other more functional motor tasks
7
N Brown. Cycling biomechanics: joint-specific powers and aerodynamic drag 8 M Forwood. Bone is tough: but is it Tonka tough? Skeletal fragility from bone mass to bone quality 10 R Hall. Biomechanics of vertebral augmentation 12 A Seth, J Reinbolt & S Delp. Musculoskeletal modelling: how it began, what it offers, and where it is heading
14
Clinical I. Chairs: Graham Kerr & Wendy Gilleard
D Thewlis, J Selfe, J Richards, S Hill & J Whittaker. A clinical study of the biomechanics of step descent using different treatment modalities for patellofemoral pain.
17
C Jones, S Sadani, A Seal, B Bhakta, R Hall & M Levesley. A user centred design approach to assessing the spine and seating for children with non-ambulant cerebral palsy.
18
M Arakilo, D Thewlis, G Paul & J Rasmussen. Simulation of ankle joint forces to optimise total ankle replacement design
19
J Blennerhassett, N Lythgo, C Muir & M Galea. Dynamic 3-dimensional shoulder motion in people with stroke
20
E Clarke, S Cheng & L Bilston. Low stiffness of paediatric spinal cord: implications for injury severity/thresholds
21
J Prinold, A Shaheen & A Bull. Measuring scapula kinematics with a new motion capture and digitisation technique
22
Sport & Exercise I. Chairs: Julie Steele & Nick Brown
P McAlpine, U Kersting, N Kurpiers, J Determan & S Walt. Kinetic analysis of snowboard jump landings: influence of landing style.
23
A Dempsey, B Elliott, B Munroe, J Steele & D Lloyd. Increasing knee flexion in landing tasks may not reduce the risk of non-contact anterior cruciate ligament injury.
24
I Janssen, W Spratford, J Sheppard, D Chapman & A Dingley. Knee joint dynamics during landing of assisted and resisted vertical jumps.
25
M Galloway & C Draper. Gender differences between high and low stroke rate rowing. 26 J Selinger, J Stevenson, D Tack & G Chafe. The effect of weapon weight and weight distribution on upper extremity muscle activity during static rifle aiming.
27
S Edwards, J Steele, J Cook, C Purdam, S Beattie & D McGhee. Fatigue does not change the lower limb landing strategies utilized by asymptomatic athletes with patellar tendon ultrasonographic abnormality.
28

Proceedings of the 7th Australasian Biomechanics Conference, Griffith University, November /December 2009
Muscle. Chairs: Chris Barclay & Robert Herbert
R Herbert, P Hoang, L Kwah, J Diong, J Clarke, E Clarke, J Martin, L Harvey, L Bilston & S Gandevia. Measurement of passive length-tension properties of human gastrocnemius muscle fascicles and tendons in vivo: application to study of contracture.
29
G Lichtwark & C Barclay. Fibre recruitment during sub-maximal contractions influences both muscle mechanics and energetics.
30
B Hoffman, T Oya, T Carroll & A Cresswell. Changes in cortical and spinal responsiveness during a fatiguing submaximal contraction.
31
M-L Bird, S Dornauf, A Cornock & D Visentin. A comparative EMG study of trunk musculature using exercise equipment.
32
M Tian, P Hoang, S Gandevia, L Bilston & R Herbert. Stress relaxation in relaxed human ankles is nearly independent of knee and ankle angles.
33
Posture. Chairs: Andrew Cresswell & Justin Kavanagh
M Tucker, J Kavanagh, S Morrison & R Barrett. Voluntary sway and rapid orthogonal transitions of voluntary sway in young adults, and low and high falls-risk older adults.
34
F Ulmer & A Smith. An investigation into the effect of body mass and physical activity on postural stability in children.
35
C Carty, P Mills & R Barrett. Recovery from forward loss of balance in young and older adults. 36 G Kerr, M Cole, R Wilcox, F Sinclair, T Coyne & P Silburn. Long-term bilateral stimulation of the pedunculopontine nucleus improves balance and gait stability and alleviates falls in Parkinson’s disease.
37
M Jaffrey & R Best. Improved estimation of centre of mass kinematics for posturographic analysis. 38 Sport & Exercise II. Chairs: Peter Milburn & Tim Doyle
J Baker, B Elliott, D Farrow & J Alderson. Combining biomechanics and skill acquisition: the hockey drag flick.
39
S Horan, K Evans, N Morris & J Kavanagh. 3-dimensional kinematic analysis of thorax and pelvis motion during the downswing of male and female skilled golfers.
40
J Seater, N Saunders & L Otago. An investigation into the effect of visual targeting in a run up and land task on lower limb muscle activation.
41
K Doma & G Deakin. EMG, force and kinematics between concentric and eccentric contractions of a chin up exercise.
42
D Walker, P Clothier, C Strachan, B Ridge, J McLaren & R Robergs. The effect of a lower-body graded compression garment on thigh and calf width changes during ergometer cycling.
43
C Joseph & T Furness. Concurrent validity of an accelerometer to quantify vibration platform frequency. 44

Innovative methods. Chairs: Mark Pearcy & Lynne Bilston
A Peters, M Sangeux, M Morris & R Baker. Establishing the accuracy of 3-D ultrasound determined HJC with MRI.
45
M Sartori, D Lloyd, M Reggiani, G Chemello & E Pagello. Scaling tendons preserving the consistency of EMG-to-activation relationship.
46
A Campbell, J Alderson, D Lloyd & B Elliott. MRI verification of the accuracy and reliability of functional methods of glenohumeral joint centre of rotation identification.
47
S Cheng, E Clarke & L Bilston. Preconditioning strain and strain rate affect measured tissue properties. 48 C Donnelly, K Middleton, J Alderson, D Lloyd & B Elliott. The use of a Dunnett pairwise comparison statistical method to estimate ball release during cricket bowling.
49
P Davidson, S Wilson, M Taylor & J Kieser. A rheological model of blunt force trauma. 50 Gait. Chairs: Andrew Smith & Robyn Grote
M Cole, J Wood, P Silburn & G Kerr. Three-dimensional gait characteristics of Parkinson’s disease patients who fall.
51
N Lythgo, B Marmaras & H Connor. Physical function of above knee amputees with the 3R90 and 3R92 knee device.
52
S Ilich, D Sturnieks, P Mills, A Dempsey & D Lloyd. Knee abduction moments in gait predict radiological and functional change.
53
D McKenzie, N Lythgo & R Baker. Knee flexion precedes initial contact in human gait and is speed dependent.
54
Cricket. Chairs: David Lloyd & Rene Ferdinands
R Ferdinands. Kinematic segmental sequencing of bowling in cricket 55 N Thomlinson, K Ness & S Belward. Response of elite male cricket batsmen facing deliveries of various lengths
56
K Middleton, A Campbell, J Alderson, A Chin & B Elliott. The effect of altering the helical endpoint technical reference frame on elbow angle in cricket bowling
57
J Weissensteiner, B Abernethy & D Farrow. Examining the development of technical skill in cricket batting
58
E Phillips, M Portus, K Davids, N Brown & I Renshaw. Coordination profiling: implications for fast bowling research
59

Proceedings of the 7th Australasian Biomechanics Conference, Griffith University, November /December 2009
Posters
A Alcock, N Brown, J Baker, W Gilleard & A Hunter. Comparison of straight and curve kick impact kinematics In elite female football players
61
L Barber, R Barrett & G Lichtwark. Clinical measurement of muscle length 62 C Bishop & D Thewlis. An exploratory two-dimensional kinematic analysis of three commonly used cricket shoes by fast bowlers in elite cricket
63
S Brice, K Ness & D Rosemond. Kinematics and kinetics of male three and four turn hammer throwers 64 C Donnelly, J Callaghan & J Durkin. The influence of body mass and gender on posture, lumbar kinematics and discomfort during prolonged driving
65
J Dunne, C Donnelly, T Besier & J McConnell. Comparison of passive and dynamic shoulder range of motion measures in elite collegiate throwing athletes following shoulder taping
66
J Gillett, G Lichtwark, C Carty & R Barrett. Lower extremity strength demands of balance recovery by stepping in young and older adults
67
K Persson, J Summers & R Hall. The effect of cerebrospinal fluid thickness on traumatic spinal cord deformation
68
H Keshishian & I Heazlewood. Biomechanical comparison between high performance and non-high performance karate athletes based on general and sports specific motor fitness tests
69
N Lythgo, C Wilson & M Galea. Gait symmetry measures for primary school-aged children and young adults
70
N Lythgo & K Kotschet. Utility of 3d motion analysis to assess cervical dystonia severity and response to botulinum toxin treatment
71
N Lythgo, L Edbrooke, U Goldsworthy, J Friedman & L Denehy. Validity of the amp 331 to record over-ground and treadmill walking
72
N Lythgo, M Pelligrini, D Morgan & M Galea. Voluntary activation of the ankle plantar flexors following whole-body vibration
73
P McAlpine, F Borrani & Y Zhang. A lower body kinematic model for estimation of lateral ankle ligament strain during snowboarding
74
K McMahon, J Kavanagh, S Horan & J Keogh. Amplitude and timing of segment speeds in skilled male and female golfers
75
M Moreau & S Walt. Centre of pressure pathways in stance as an indicator for dynamic stability. 76 A Hashemi Oskouei, A Carman, M Paulin & D Baxter. The relationship between hand grip force, forearm surface shape changes, and forearm emg: a reliability study
77
K Rathnayaka, T Sahama, M Schuetz & B Schmutz. Validation of 3d models of the outer and inner surfaces of an ovine femur.
78
W Spratford, C Mackintosh, M Davis, M James & R Turner. The impact of sway, equipment & release timing on scoring in elite level archery
79
M Sweeney, J Alderson, P Mills & B Elliott. Timing of peak clubhead velocity in the golf drive without the effect of impact
80
B Weeks & B Beck. Tibial bone strength is predicted by habitual bone-specific physical activity in healthy, young adults
81
C Wild, B Munro, J Steele & L Astheimer. Do musculoskeletal and hormonal changes during puberty affect lower limb coordination in girls? A work in progress
82
Index of authors 83


Proceedings of the 7th Australasian Biomechanics Conference, Griffith University, November /December 2009
1
KEYNOTE ADDRESS

2
KEYNOTE ADDRESS: FORCE ENHANCEMENT/FORCE DEPRESSION AND MECHANISMS OF CONTRACTION IN SKELETAL MUSCLES
Walter Herzog
Faculty of Kinesiology, The University of Calgary, Canada email: [email protected]
INTRODUCTION It has been known for a long time that the isometric steady state forces following muscle stretching are greater and following muscle shortening are smalller than the corresponding purely isometric forces[1]. These properties of skeletal muscle contraction have become known as residual force enhancement and residual force depression, respectively [2]. Interestingly, force enhancment/depression proerties are not accounted for in the most accepted paradigm of muscle contraction: the sliding filament [3;4] and the cross-bridge theory [5;6] Rather, force enhancement/depression have been explained with the sarcomere length non-uniformity theory [7] which asssumes that sarcomeres are unstable on the descending limb of the force-length relationship and thus develop great non-uniformities in lengths that can explain these properties. In recent years, evidence has been accumulated that strongly suggests that the sarcomere length non-uniformity theory cannot explain force enhancement/depression, and that this property must be associated in some way with the production of extra force (force enhancement), or the loss of force in the actin-myosin based cross-bridges (force depression). The purpose of our work over the past ten years was to identify the mechanisms of force enhancement/depression and to determine the molecular origins of these properties of skeletal muscle contraction. METHODS We evaluated force enhancement/depression on all structural levels of skeletal muscle including in vivo human skeletal muscles activated voluntarily and electrically, isolated muscles, isolated fascicles and fibres, single myofibrils and mechanically isolated sarcomeres as well as single cross-bridges using a laser trap approach. Here, I will primarily focus on the single myofibril and isolated sarcomere preparations as these preparations reveal the most convincing evidence for how force enhancement/depression might work. Myofibrils are isolated from rabbit psoas muscles through a series of chemical steps followed by mechanical isolation. A myofibril with a good striation pattern is then identified in the mechanical chamber that is set up on top of an inverted microscope and its ends are attached to a motor (for length changes) and to a silicon nitride lever for nano Newton force measurements [8]. Sarcomere lengths and myofibril forces are then continuously measured while the preparations are stretched or shortened and the isometric forces following the dynamic contractions are compared to the corresponding purely isometric reference forces.
RESULTS AND DISCUSSION The sarcomere length non uniformity theory predicts that force enhancement is not possible on the ascending limb of the force-length relationship and that the enhanced forces following muscle stretching cannot exceed the isometric plateau forces. Both these predictions were rejected by our work (and that of others) on single fibre and muscle preparations (not shown) One of the defining moments in this work occurred when we discovered that force enhancement was associated with a passive component contribution, which we called the “passive” force enhancement. [9](Fig 1).
Figure 1: Force-time traces of an isometric (flat trace), passive stretch (bottom trace) and active stretch (top trace) contraction of cat soleus. Note that the passive force following deactivation (at about 9s) remains higher following active stretching (passive force enhancement) than the passive forces for the isometric and passive stretch contractions, despite the fact that muscle length is the same for all conditions. This passive force enhancement was first discovered in isolated muscle preparations followed by voluntarily activated human muscles, single fibres, isolated myofibrils and mechanically isolated sarcomeres. These results suggested that the passive force enhancement is associated with properties inherent in the sarcomere. When investigating the origin of this passive force enhancement more closely in isolated myofibrils, we discovered that force enhancement and the passive force enhancement were crucially dependent on the presence of the molecular spring titin. Eliminating titin from myofibrils abolished all force enhancement and abolished most of the passive forces illustrating the crucial role of titin in this preparation. When testing titin in high and low calcium activation solutions, it became apparent that titin becomes stiffer with increasing concentrations of calcium (Fig 2), and it was discovered that titin binds calcium and thereby changes its mechanical properties [10].

Proceedings of the 7th Australasian Biomechanics Conference, Griffith University, November /December 2009
3
Figure 2: Stress-time and stress-sarcomere length traces for a myofibril stretched at low calcium (Rel=relaxed) and high (Act=activated) calcium concentrations. Note the increase in force and stiffness for stretching of the myofibril in the high calcium concentration solution. Active forces were inhibited in this preparation by eliminating troponin C from actin. Finally, in most recent experiments we discovered that titin is not only a molecular spring that becomes stiffer with activation (calcium binding) but that titin also appears to interact with actin so as to change its spring length thereby becoming a potent regulator of active and passive forces upon skeletal muscle stretching (Fig 3). However, the titin-actin interactions were not enhanced by calcium, but required that active force was present. We concluded from this result that force regulation through titin-actin interactions was either force dependent or relied on the attachment of cross-bridges to actin. Force-dependent interactions between proteins have been observed before and rely on mechanisms whereby attachment sites areexposed by force-dependent alterations in protein structures [11], while cross-bridge binding might expose titin attachment sites on actin through movements of regulatory proteins (troponin and/or tropomyosin). These ideas need further testing.
Figure 3: Stress-sarcomere length traces for myofibrils stretched actively (Active) and passively (passive). Note that the forces in the actively stretched myofibrils are much greater than the passively stretched myofibrils even at sarcomere length beyond myofilament overlap (4.0μm) where actin-myosin based cross-bridge forces cannot act. ACKNOWLEDGEMENTS This work was supported by the Canada Research Chair program for Molecular and Cellular Biomechanics, The Canadian Institutes of Health Research, and The Natural Sciences and Engineering Research Council of Canada. Unpublished data from titin-actin interaction experiments (Fig 3) were collected by my doctoral student Tim Leonard. REFERENCES 1. Abbott BC & Aubert XM. J Physiol London 117: 77-
86, 1952. 2. Edman KAP, Elzinga G, & Noble MIM. J Gen Physiol
80: 769-784, 1982. 3. Huxley AF & Niedergerke R. Nature 173: 971-3, 1954. 4. Huxley HE & Hanson J. Nature 173: 973-6, 1954. 5. Huxley AF. Prog Biophys Biophys Chem 7: 255-318,
1957. 6. Huxley HE. Science 164: 1356-66, 1969. 7. Morgan DL. Exp Physiol 79: 831-8, 1994. 8. Joumaa V, Leonard TR, & Herzog W. Proc R Soc B
275: 1411-9, 2008. 9. Herzog W & Leonard TR. J Exp Biol 205: 1275-83,
2002. 10. Joumaa V, Rassier DE, Leonard TR, & Herzog W. Am.
J Physiol Cell Physiol 294: C74-C78, 2008. 11. del Rio A, Perez-Jimenez R, Liu R, Roca-Cusachs P,
Fernandez JM, & Sheetz MP. Science 323: 638-641, 2009.

4
INVITED PRESENTATIONS

Proceedings of the 7th Australasian Biomechanics Conference, Griffith University, November /December 2009
5
THE MOLECULAR BASIS OF THE FORCE-VELOCITY AND EFFICIENCY-VELOCITY RELATIONSHIPS
Chris Barclay
School of Physiotherapy & Exercise Science, Griffith University email: [email protected]
INTRODUCTION Almost all animal movement is powered by muscles and muscle power output comes from cyclic interactions between myosin crossbridges and adjacent actin filaments. Crossbridges generate the forces that result in muscle shortening or, when an active muscle is stretched, that resist lengthening. The source of energy for these processes is the chemical free energy obtained when adenosine triphosphate (ATP) is hydrolysed by the crossbridge. The dyanmic mechanical properties of a muscle are characterised by the relationship between muscle force output and the velocity at which it shortens or lengthens. The energetic properties of muscle can be characterised by velocity dependence of the efficiency with which mechanical energy is obtained from chemical free energy. The aim of the analysis presented here is to describe the bases of these two fundamental relationships in terms of the underlying crossbridge processes. CROSSBRIDGE BASIS OF THE FORCE-VELOCITY RELATIONSHIP The basic contractile unit of muscle is the half-sarcomere. The total force generated in a half-sarcomere is the product of the number of crossbridges attached to actin at any instant and the force generated by each crossbridge. The force generated by each crossbridge, in turn, depends on the crossbridge strain, that is, the extension of the crossbridge from its elastic energy minimum. Thus, changes in force with velocity must reflect changes in either, or both, the number of attached crossbridges and/or the average crossbridge strain. Information about the number of attached crossbridges and their average strain can be obtained from measurements of the longitudinal stiffness of contracting muscle fibres [1]. These measurements are typically made by recording the force response during and after application of rapid, small amplitude changes in the length of a contracting muscle fibre (Fig. 1A). A B
Figure 1: A. Changes in force output following rapid change in fibre length. B. Velocity dependence of number of attached crossbridges and average crossbridge strain. All values are expressed relative to that in isometric contraction. Velocity is expressed in nm per half-sarcomere per second.
When a length step is applied to a contracting fibre, force first changes in synchrony with the applied step and then, over the next few milliseconds, at least partially recovers (Fig. 1A). The fibre stiffness is given by the ratio of the initial change in force to the step amplitude. The size of step required to just reduce force to 0 gives the average strain of elastic structures in the fibre. If the only structures giving rise to the stiffness of a contracting fibre were crossbridges, then fibre stiffness could be used as an index of how many crossbridges were attached when the length step was applied and fibre strain could be used as an index of crossbridge strain. However, the stiffness of a contracting fibre arises from not just attached crossbridges but also from the actin and myosin filaments themselves. If we know the average strain of structures other than attached crossbridges at the moment a length step is applied, then the proportion of the length step taken up by compliant structures in series with attached crossbridges can be calculated and thus the length change that is transmitted to the crossbridges can be found. Only for frog muscle is a complete data set available from which crossbridge properties during isometric contraction and steady shortening and lengthening can be extracted from fibre properties. These data were used determine how the number of attached crossbridges depends on velocity. The open squares in Fig. 1B show the velocity dependence of ensemble crossbridge stiffness; that is, the stiffness arising from all the attached crossbridges (i.e. after removal of the effects of non-crossbridge compliances) and which is proportional to the number of attached crossbridges. Over much of the force-velocity relationship ( , Fig. 1B), almost all the change in force can be accounted for by changes in the number of attached crossbridges ( ) with little alteration in average crossbridge strain (Δ). Only when shortening at velocities faster than 50% of the maximum shortening velocity (Vmax) do changes in crossbridge strain contribute substantially to the change in force. NUMBER OF CROSS-BRIDGES ATTACHED IN ISOMETRIC CONTRACTION The data for crossbridge stiffness and strain in Fig. 1B are expressed relative to the value in an isometric contraction. Further insight into the crossbridge basis of contractile and energetic properties of muscle requires knowledge of the absolute fraction of crossbridges attached. This can be calculated by comparing the ensemble crossbridge stiffness in an isometric contraction to that in a fibre in rigor (a state in which all the crossbridges are attached and are not cycling) [2]. The result of this analysis is shown in Fig. 2. All the stiffness measurements indicated by the solid symbols in Fig. 2 were made using frog muscle fibres under very similar experimental conditions. However, for a variety of reasons, there is considerable variation in ensemble
0.0 0.4 0.8 1.2Time after start of length step (ms)
0.0
0.2
0.4
0.6
0.8
1.0
Forc
e (T
T0-1
)
T1
T2
-6-4-20
ΔL
(nm
hs-1
)
-1600 -800 0 800 1600Half-sarcomere velocity (nm hs-1 s-1)
Values relative to isometric (%)
150
200
100
50
Force Stiffness Strain

6
crossbridge stiffness and isometric force amongst the studies. The analysis revealed that crossbridge strain was constant across all the studies, that all the variation in force could be accounted for by variation in the fraction of crossbridges attached and that the fraction attached ranged between about 20 and 40%. For the analysis in the following section, which is based on experimentally determined rates of ATP splitting, it was assumed that 36% of crossbridges were attached in the isometric state; this value was appropriate for the isometric force and ensemble crossbridge stiffness in the studies from which the ATP splitting data were obtained.
Figure 2: The relationship between ensemble crossbridge stiffness and fraction of crossbridges attached in different studies. CROSSBRIDGE WORKING STROKE AND EFFICIENCY As illustrated in Fig. 1, after an abrupt decrease in muscle fibre length there is a rapid force recovery. The maximum crossbridge displacement over which force will redevelop is ~11 nm, indicating that this is the amount of filament sliding that a single crossbridge can generate during one attachment. If it is known how many crossbridges are attached in an isometric contraction(see previous section), how the number attached depends on shortening velocity (Fig. 1) and how long a crossbridge remains attached in each cycle, then the amount of filament movement that occurs while a crossbridge is attached (i.e. the working stroke) can be calculated. The time for which crossbridges are attached can be calculated from the rate of ATP splitting, which provides the complete crossbridge cycle time including both attached and detached phases, and the proportion of crossbridges attached (equal to the crossbridge duty cycle, time attached/total cycle time). Rates of ATP splitting by crossbridges during shortening can be determined from the rate of crossbridge-dependent enthalpy output.
Crossbridge working stroke (solid line, Fig. 3) increases monotonically with shortening velocity: working stroke is, by definition, zero in an isometric contraction (no filament sliding), increases to ~12 nm at 0.25Vmax and 14 nm at 0.5Vmax. For velocities less than 0.15Vmax (vertical line in Fig. 3) the working stroke is less than 11 nm, the distance over which a crossbridge can exert positive force. At these low velocities, crossbridges detach before completing their maximum working stroke. At velocities >0.15Vmax, the working stroke is greater than 11 nm which indicates that crossbridges must remain attached beyond the filament displacement at which they can generate force. In this case,
crossbridges must stay attached after completing their power-generating stroke and, as the thin filament is pulled by crossbridges at earlier stages of their attachment cycle, generate forces that oppose filament movement. These crossbridges thus contribute to the declines in force and average crossbridge strain as shortening velocity increases (Fig. 1).
Figure 3: Velocity dependences of crossbridge working stroke (solid line) and efficiency (dashed line). Crossbridge efficiency is also shown in Fig. 3 (dashed line). In this case, efficiency is the proportion of the free energy from splitting ATP that is converted into mechanical work. The efficiency is zero both when velocity is zero (i.e. in isometric contraction) and when force is zero (i.e. when shortening at Vmax) and has a maximum value of 0.4 at a shortening velocity of 0.17Vmax. It is notable that the velocity at which at which efficiency is maximal corresponds closely to that at which the working stroke is equal to the maximum filament displacement over which crossbridges can produce positive force. SUMMARY The analyses presented here are based on both mechanical experiments, designed to probe basic aspects of the crossbridge cycle, and energetic measurements, which provide information about crossbridge turnover rate. From these data, it has been shown that the changes in muscle force output during lengthening and during low velocity shortening largely result from changes in the number of simultaneously attached crossbridges. Further decreases in force with increased shortening velocity above 50% Vmax are largely due to decreases in average strain, perhaps reflecting crossbridges remaining attached after completion of their power-delivering stroke. Peak crossbridge efficiency occurs at the shortening velocity at which crossbridges remain attached for just long enough to complete a full power delivering stroke before detaching. ACKNOWLEDGEMENTS The ideas presented here resulted from collaboration among the author, N. A. Curtin and R. C. Woledge (both Imperial College London, UK). REFERENCES 1. Ford LE, et al. J Physiol (Lond) 269: 441-515, 1977. 2. Linari M, et al. Biophys J 74: 2459-73, 1998.
0.0 0.2 0.4 0.6 0.8 1.0
Proportion attached
0
100
200
300
400
500
Ens
embl
e cr
ossb
ridge
stif
fnes
s
(k
Pa (n
m h
s-1)-1
)
0
1
2
3 Crossbridge stiffness (pN
nm-1)
R. esculenta R. temporaria Rigor (Linari et al.) Rigor (Piazzesi et al.) T'dynamic method
0.0 0.2 0.4 0.6 0.8 1.0Shortening velocity (V Vmax
-1)
0
5
10
15
20
25
Cro
ssbr
idge
wor
king
stro
ke (n
m)
0.0
0.2
0.4
0.6
0.8
1.0
Crossbridge efficiency

Proceedings of the 7th Australasian Biomechanics Conference, Griffith University, November /December 2009
7
MOTONEURONE FIRING BEHAVIOUR AND REFLEX EXCITABILITY DURING THE PERFORMANCE OFCONTROLLED ISOMETRIC CONTRACTIONS AND OTHER MORE FUNCTIONAL MOTOR TASKS
Andrew G. Cresswell
School of Human Movement Studies, The University of Queensland, Brisbane, Australia
email: [email protected]
INTRODUCTION For biomechanists interested in strength and performance, the force producing capacity of a muscle is often of interest. Increasing the cross-sectional area of a muscle will significantly increase force production, however the moment arm of the muscle also plays a significant role in what torque or strength can be produced about a joint. Of course strength is also dependent upon the state of the muscle, including its length, temperature and energy reserves, as well as the level of neural drive activating the motoneurone pool of the muscle. Generally speaking we consider the central nervous system as having two strategies to increase force production. Already firing motor units can be activated at higher rates and additional motor units can be recruited. These two processes work together until theoretically all motor units to a given muscle are recruited, and all motor units are firing at their optimal frequency for the required force production [1]. However, maximal voluntary contractions are often found not to be truly maximal, that is suboptimal, as short duration superimposed electrical stimulation to the activated muscle results in additional tension being developed [2]. Many factors can be responsible for neural drive being reduced or less than optimal for the required task. For example, drive from the motor cortex may be sub-optimal and/or spinal motoneurones may not be activated or firing at their best possible rates [3]. These situations may be controlled via intrinsic motoneurone properties and/or via neural pathways driven via sensory or descending inputs. We have performed many experiments over recent years to elucidate the firing behaviour of motor units during controlled contractions. We have also investigated motoneurone responsiveness and afferent pathway transmission during various types of contractions and tasks, in order to gain a greater understanding of the neural control of human movement. METHODS Intra-muscular electromyography (EMG) and torque production have been used together to investigate motor unit recruitment and firing properties, typically while performing isometric ramp contractions at different muscle lengths and at different rates of force production. Sustained submaximal contractions have also been used to investigate how motoneurone firing properties vary with fatigue. Peripheral nerve stimulation at varying current intensities has been used to assess the efficacy of synaptic transmission, including pre-synaptic inhibition, at the Ia-afferent terminal during controlled isometric contractions. These techniques have also been employed during more
functional motor tasks, such as quiet standing, where postural sway is a component. The brief electrical stimulations evoke discernible reflex responses in the surface EMG of the investigated muscle, which can be subsequently measured and compared across test situations. In some cases, magnetic stimulation of the motor cortex and/or descending corticospinal pathways has been used to isolate the origin of specific central nervous system changes. Similar to the aforementioned peripheral electrical stimulations, changes in the amplitude of the magnetic evoked responses in the surface EMG can be used to assess independent changes in cortical and spinal motoneurone excitability. RESULTS AND DISCUSSION The results presented will show patterns of recruitment and rate coding for the postural soleus muscle during isometric contractions to maximum strength capacity. The observed recruitment and firing behaviour for this muscle does not appear to be like the “onion skin” behaviour described for upper-limb muscles by other authors [4], but rather suits the resumed mechanical properties of progressively recruited motor units. The firing behaviour of the same soleus motor units will be revealed for submaximal contractions that are sustained for long periods of time. Here we will see that while neural drive to the motoneurone pool is progressively increased, firing rates remain stable at lower than maximal levels. The importance of neural networks on motor output will also be shown through evidence of changing levels of presynaptic inhibition in the soleus muscle when performing isometric ramp contractions and during different phases of postural sway when standing quietly. CONCLUSIONS Taken together, the presented results confirm that neural control of motor output is complex and highly specific to the muscle and type of action performed. A case for further investigations on the importance of intrinsic motoneurone properties on motor behaviour will be made. ACKNOWLEDGEMENTS Significant contributions to the presented work have been made by CD Tokuno (Brock University), T Oya, BW Hoffman, H Lim and M-Y Chung (The University of Queensland). Financial support for the projects was provided by the Swedish Research Council, The NHMRC, ARC and The University of Queensland. REFERENCES 1. Freund H. Physiol Rev 63: 387-436, 1983. 2. Belanger AY & McComas AJ et al. J Appl Physiol 51:
1131-5, 1981. 3. Gandevia SC, et al. J Physiol 512: 595-602, 1999. 4. Erim Z, et al. Muscle Nerve 19: 563-73, 1996.

8
CYCLING BIOMECHANICS: JOINT-SPECIFIC POWERS AND AERODYNAMIC DRAG
Nicholas Brown
Biomechanics and Performance Analysis; Australian Institute of Sport email: [email protected]
INTRODUCTION Cycling speed, for a particular wind condition and gradient, is largely determined by the power the cyclist can produce and the aerodynamic drag the cyclist epxeriences. Cycling power is routinely measured in high-performance sport at the bicycle’s crank or rear wheel. Crank power is produced by muscular powers developed at the ankle, knee and hip joints, and via power transferred across the hip joint. It is known that cycling power decreases substantially during maximal cycling trials [1], but contributions from joint-specific powers is only beginning to be explored. Joint-specific power for maximal bouts of cycling will be examined to provide insight into several aspects of fatigue, neuromuscular control [2] and pacing strategies. After cycling power, aerodynamic drag, usually reported as the Coefficient of drag Area (CdA) strongly influences cycling speed. The combined rider and bicycle CdA can be predicted in the field [3] or accurately measured in wind tunnels. While reductions in CdA can be found for most cyclists, the mechanisms that underlie these improvements are not well understood. Some potential mechanisms that influence cycling aerodynamics will also be explored in this paper. METHODS Joint-specific power: In these studies, elite cyclists performed maximal cycling bouts for between 30 seconds and 4 minutes on either an isokinetic cycle ergometer or high inertial load ergometer. Pedal forces and limb kinematics were recorded for each. Ankle, knee and hip joint powers, and the power transferred acros the hip joint were calculated throughout. Aerodynamic Drag: The drag (N) and CdA (m2) of elite cyclists were obtained in the Monash University Wind tunnel (Melbourne, Australia) for a range of riding conditions including road time trial, track pursuit riding and track sprint riding. Bicycles were mounted on a custom-built air-bearing rig to de-couple the forces from body motion from the force balance on which the testing rig and bicycle were mounted. Front and side images of body position were recorded throughout testing. Test wind speeds where set between 40 and 60 km/hr to reflect typical riding speeds during competition. CdA was calculated for a systematically tested range of head positions, elbow widths and handle bar heights. RESULTS AND DISCUSSION Joint-specific power: During maximal cycling, hip joint power was found to contribute most to crank power which contrasts sub-maximal cycling where the knee power has been noted to be the major contributor [4]. During 30 seconds of maximal isokinetic cycling, ankle extension power decreased significantly more (~63%, p=0.010) than knee and hip extension power (Table 1) relative to initial power. Relative knee extension power was also significantly less than relative hip extension power during the final three-second interval. These changes in power
were accompanied by a decrease in time spent extending by each joint (i.e., decreased duty cycle). Because the ankle fatigued more then the hip and knee joints, either peripheral muscle fatigue or changes in motor control strategies were identified as the potential mechanisms for fatigue during a maximal 30-second cycling trial. Further, because joint powers are dependent on joint angular velocities, factors such as riding position and the arrangement of the pedal-shoe interface could influence a cyclist’s resistance to fatigue under maximal conditions.
Figure 1: Mean pedal (crank), muscular, and joint specific powers vs. crank angle during maximal cycling for all participants during the initial non-fatigued three seconds of pedalling. Pedal power was greater than muscular power during extension and less than muscular power during flexion because limb weight and inertial forces [5] combine to provide additional power during extension and consume power during flexion. Table 1: Mean muscular, ankle, knee, and hip joint powers (watts) during the initial, middle and final 3-scond periods of 30 seconds of maximal cycling.
Aerodynamic Drag: Compared to each rider’s baseline riding position, adjustments in head and elbow positions, and in handle bar height lead to improvements of up to 15% in CdA (n = 17 elite riders). The factors that led to the greatest reduction in CdA varied across cyclists – for some riders, a narrow elbow position resulted in lower drag forces, while wider elbow positions showed the strongest effect in others. These differences can likely be attributed to each athlete’s different body shape, and trunk and joint flexibility. Frontal surface area (FSA, Fig 2) is generally considered to be the major determinant of CdA, but FSA did not strongly influence aerodynamic drag in this work. Head height however did affect CdA (r2 = 0.63, Fig 3)
Total Ankle Knee Hip Initial 540 ± 31 141 ± 16 217 ± 24 425 ± 32 Mid 344 ± 18 73 ± 12 145 ± 19 295 ± 25 Final 224 ± 13 52 ± 8 89 ± 17 230 ± 16

Proceedings of the 7th Australasian Biomechanics Conference, Griffith University, November /December 2009
9
suggesting that rather than simply changing FSA, head position principally affects wind flow.
Figure 2: Frontal surface area calculated form video images taken during aerodynamic testing was found to only moderately influence CdA.
Figure 3: The cyclist’s head height, which was related to body position and handle bar-height, explained 63% of the variance in CdA for 13 elite female riders. ACKNOWLEDGEMENTS The joint-specific power studies were conducted with JC Martin (University of Utah), and A Drory and A Hunter (AIS). All aerodynamic testing was conducted at Monash University’s large section wind tunnel with J Sheridan, D Burton, and T Crouch (Monash), and A Drory and D Martin (AIS). REFERENCES 1. Green S. Sports Med 19: 32-42, 1995. 2. Martin J & Brown NAT. J Biomech 42: 474-9, 2009. 3. Martin JC et al. J Appl Biomech 14: 276-91, 1998. 4. Broker JP & Gregor RJ. Med Sci Sports Exerc 26: 64-
74, 1994. 5. Kautz SA & Hull, ML. J Biomech 26: 155-65, 1993.

10
BONE IS TOUGH: BUT IS IT TONKA TOUGH? SKELETAL FRAGILITY FROM BONE MASS TO BONE QUALITY
Mark R. Forwood
School of Medical Science, Griffith University, Gold Coast Campus, Qld 4222
email: [email protected] INTRODUCTION Our bones are full of microscopic cracks, but the hierarchical character of skeletal structures, from molecular to macroscopic scales, makes them remarkably resistant to fracture. The traditional view of bone fragility has focussed on the quantity of bone, or bone mass, assessed clinically as bone mineral density (BMD). But it is known that there is roughly a 10-fold increase in fracture risk with ageing, independent of BMD (Hui et al 1988), and that about 50% of individuals who sustain osteoporotic fracture have a BMD above the WHO criteria for osteoporosis (Sornay Rendu et al 2005). This has led a paradigm shift in the field to understand aspects of bone properties, other than mass, that contribute to fragility. These aspects have been termed bone quality, to distinguish them from BMD, but are not as straightforward to understand or quantify. The characteristic of a material that makes it resistant to initiation, or propagation, of cracks is termed toughness. Toughness is generally understood as the amount of energy required to cause failure (or work to fracture), and typically assessed from the area under a stress-strain curve. But in mechanical engineering, toughness is more precisely evaluated using a fracture mechanics approach in which specific tests are employed to evaluate the stresses required to initiate microcracking (initiation toughness), and those required for their propagation (propagation toughness). Such tests have been used to understand numerous toughening mechanisms inherent in the hierarchical microstructure of bone tissue. At the macroscopic level, it is understood that bone mineral gives rise to the elastic behaviour of bone, and the collagenous matrix contributes to bone’s post-yield, or plastic, behaviour. Deformation of mineralised collagen fibrils toughens bone tissue by forming plastic zones around crack-like defects. Those zones protect the integrity of the whole structure by allowing energy to dissipate in a localised area of bone. With aging and in diabetes, cross-links accumulate in bone collagen as a result of non-enzymatic glycation and consequently impair matrix properties, and reduce toughness (Tang et al., 2007). These alterations occur because the ability of collagen to resist crack growth or propagation is diminished. Gamma irradiation is commonly used to sterilise bone allografts, with 25 kGy accepted as the Australian standard dose. It is known that gamma irradiation influences collagen cross-linking due to the action of free radicals produced during irradiation. But there are no data to demonstrate that generation of free radicals during sterilisation influences their production at standard doses used for sterilisation. Radiation causes dose-related degradation in mechanical properties of allograft bone, but it is not known exactly which components of the bone microstructure are affected. We investigated the mechanical properties of bone allografts
irradiated at 25, 20, 15, 10, and 5 kGy and determined the content of pyridinoline (PYD), deoxypyridinoline (DPD), pentosidine (PEN), as well as collagen degradation products in the bone samples. METHODS Sixteen femoral shafts from eight human donors were sectioned into six cortical bone beams (40x4x2mm) and irradiated at 0, 5, 10, 15, 20, and 25 kGy for three-point bending tests. Samples of 0.3g of bone samples were hydrolysed for determination of PYD, DPD and PEN by HPLC; and collagen degradation products in the bone samples was assessed using chymotrypsin digestion. RESULTS AND DISCUSSION Irradiation up to 25 kGy did not affect the elastic properties, ultimate stress, of cortical bone in 3-point bending, but the toughness, or resistance to crack growth, showed a significant dose-response decline from 87% to 74% (p < 0.05) compared with controls at doses from 15 to 25 kGy (Fig 1).
Figure 1: Mechanical properties of bone allograft subjected to gamma irradiation. Neither the contents of enzymatic cross-links such as pyridinoline (PYR) and deoxypyridinoline (DPD), nor non-enzymatic glycation, such as pentosidine (PEN) changed in cortical bone as a function of gamma doses up to 25 kGy. However, using protease digestion, there was dose-dependent increase in percentage of degraded collagen/total collagen as gamma dose increased. This increase in denatured collagen was negatively correlated to the decreases in toughness, and also osteoclast formation (Fig 2).
Figure 2: The correlation between denatured collagen, toughness and osteoclast formation with gamma radiation dose (r= 0.84, -0.79 and -0.44; p<0.001, respectively).

Proceedings of the 7th Australasian Biomechanics Conference, Griffith University, November /December 2009
11
The correlation between denatured collagen content and toughness modulus was r = -0.34 (p=0.01). This suggests that decreases in mechanical and biological properties due to irradiation at the standard dose of 25 kGy are caused by alterations in the collagen triple helix due to free radicals, rather than in the enzymatic or non-enzymatic cross-links. The interest in bone quality parameters that influence bone fragility has also become a source of debate for osteoporosis treatments such as the bisphosphonates. This class of drug increases bone mass by reducing the rate of turnover. We hypothesised that high levels of suppression of remodelling by such drugs would reduce the rate of repair of tissue microdamage, allowing it to accumulate. We in fact showed this to be the case (Mashiba et al., 2000). Our original explanation suggested that the slight increase in mineralisation and increase in microdamage, reduced the toughness of bone; but that this slight decrease in material property was buffered by the greater bone mass. More recent evidence suggests that the decrease in toughness is more complex. By reducing turnover, bisphosphonates result in significant changes to three key material properties of bone, increasing the mean degree and homogeneity of mineralization, the accumulation of microdamage, and the degree of collagen cross-linking. Each of these changes in the bone material has a significant effect on material-level biomechanical properties, independent of changes in bone mass, although their specific individual contribution is difficult to assess experimentally. By all accounts, it appears that changes to mineralization and collagen cross-linking, which tend to increase material-level strength and stiffness, are offset by the increased microdamage (which tends to lower both). This results in minimal change to material-level strength (ultimate stress) and stiffness (modulus). Conversely, changes to all three parameters, mineralization, microdamage, and cross-linking, likely contribute to reducing energy absorption capacity at the material level (toughness).
In summary, bone is organised as a hierarchical structure in which elements of its microstructure contribute to mechanical properties from the nano-scale to its macroscopic structure at organ level. Structural-level biomechanical properties are determined by a combination of factors including bone mass, geometry/architecture, and the biomechanical properties of the bone tissue (material properties). Material-level biomechanical properties are determined by factors such as mineralization (both degree and heterogeneity), the level of microdamage accumulation, and the organic matrix (e.g., collagen cross-linking). ACKNOWLEDGEMENTS I would like to thank Dr H Nguyen (Griffith University), DAF Morgan (Qld Bone Bank) and Mrs WL Kelly (Griffith University for their contribution to these studies. This work funded in part by National Health and Medical Research Council Project Grant 453624; a grant in aid from the Australian Institute of Nuclear Science and Engineering; and the Qld Bone Bank. REFERENCES 1. Hui S, Slemenda C, & Johnston C. J Clin Invest 81:
1804-9, 1988. 2. Tang et al. Bone 40: 1144-51, 2007. 3. Sornay-Rendu E. J Bone Miner Res 20: 1813-9. 2005. 4. Mashiba T, et al. J Bone Min Res 15: 613-20, 2000.

12
BIOMECHANICS OF VERTEBRAL AUGMENTATION
Prof Richard M Hall
Institute of Medical and Biological Engineering, University of Leeds email: [email protected]
INTRODUCTION The recent success of percutaneous vertebroplasty (PVP) in the treatment of osteoporotic vertebral compression fractures (VCFs) has highlighted the possibility of using this technique in other pathologies, mainly metastatic bone disease, multiple myeloma (MM) and trauma including its use in selected burst fractures [1]. Experimental research, particularly cadaveric investigations, has had a significant impact on the evolution of PVP for use in osteoporotic VCFs [2]. No similar quantity of research exists for either traumatic fractures or those skeletal related events arising from metastatic vertebral bodies (VB). However, as with osteoporosis, the utilisation of PVP for the treatment of these additional pathologies may be undermined by potentially serious complications. These challenges include cement leakage and accelerated adjacent vertebral fracture [3]. Further risks occur because of the high intra-vertebral pressures observed in metastatic vertebrae, which may lead to a burst-type fracture [4]. This complication may be mitigated by the removal of a portion of the lesion material prior to cement injection. In axial skeletal trauma, which occurs in both the young and, increasingly, the elderly, similar considerations apply with anterior support and acceptable fusion being of primary biomechanical concern. The presentation outlines some of the recent work undertaken by the author and his colleagues that investigates the effects these different pathologies have on the mechanical characteristics of vertebrae. Results will be presented on the mechanics of augmentation in each case. The idea of pathology specific cements and delivery systems will be highlighted as a way of optimising these procedures. METHODS Human cadaveric spinal spines were obtained from a tissue bank with appropriate ethics committee approval. Specimens were prepared by removal of excess tissue and disarticulated to produce either single vertebrae or segments comprising 3 vertebrae. Ligamentous tissue, facet structures, disc and posterior elements were preserved where appropriate. In investigations of PVP for osteoporotic and metastatic VCFs a within-subject design was used in which the post augmentation values were compared to the initial pre-augmentation ones. Within the simulated prophylactic procedures and interventions for axial trauma no initial failure load data were available and cross group comparisons of post-augmentation characteristics were used. Investigations within a metastatic context included lesion removal using Coblation (Arthrocare Inc). Burst fractures were generated using a previously described method [5]. Within the trauma investigations two major comparisons were utilised: a) calcium phosphate against PMMA cements for burst fracture augmentation investigated using static conditions and b) traditional anterior instrumentation compared to
PVP interventions, both with posterior instrumentation, under dynamic loading. Prior to and during testing all specimens underwent either CT or microCT scanning. Details of these experimental protocols can be found in Furtado et al [6] and Oakland et al [7]. RESULTS AND DISCUSSION The trabecular morphology for the three pathologies causing insufficiency fractures are given in Figure 1.
Figure 1: Different morphologies that cause bone degradation which leads ultimately to a VCF; osteoporosis (top), MM (left) and bladder metastases (right). It is clear that in each case structural weakening of the vertebral body is achieved by a different route. In classic osteoporosis, there is, to a first approximation, a generalised bone loss causing a weakening of the bone throughout the VB. In contrast, in bladder metastases there are one or two lesions, which are largely devoid of bone that can be approximated to a geometric defect in the vertebral structure. Here, bone only a small distance from lesion appeared to have relatively normal BMD. Bone from MM appeared to be a combination of these two more extreme cases with a generalised bone loss together with multiple lesions. It is clear from Figure 1, together with similar images showing differences in the integrity of the vertebral shell, that different cement properties and delivery systems are required if the procedure is to be optimised for each of the pathologies. For instance, the osteoporotic VB requires generalised support from the augmentation process whereas the metastatic bone needs only void filling, provided the tumour spread can be halted and no further bone degradation occurs. Myelomic bone disease, which shows significant late stage bone deterioration and compromise of the vertebral wall provides a particularly challenging environment in which delivery of the cement must mitigate against leakage as well as enhancing strength. Preliminary results using static biomechanical assessment of single vertebrae from osteoporotic, metastatic and myelomic spines demonstrated significant differences in terms of failure load (ANOVA, F=18, P<0.001) (Fig 2).

Proceedings of the 7th Australasian Biomechanics Conference, Griffith University, November /December 2009
13
Figure 2: Initial failure load of vertebrae from three different pathologies: bladder metastases, MM and osteoporosis. There was no significant difference in the strength improvements between cohorts following vertebroplasty (ANOVA, F=0.17, P=0.84) in which essentially the same technologies were used to augment the vertebrae following fracture regardless of pathology. Such an increase, in most cases, is greater than one body weight for osteoporotic specimens, and therefore may provide adequate structural augmentation. However, in MM, where life expectancy is increasing rapidly due to new treatments, this may not provide adequate improvements in strength to prevent re-fracture, and additional technologies or techniques are required. Coblation for tumour debulking had only a marginal effect on the final biomechanical outcome. A natural progression of this intervention may be to undertake the procedure prophylactically. Here the diagnostic tools would have to be sufficiently robust to allow identification of those VB at risk of fracture, but hypothetically there are a number of reasons why this procedure might be advantageous including the retention of normal spinal profile and reduced risk of leakage [8]. Research on cadaveric specimens indicated that similar improvements were ascertained post-PVP in prophylactic VB failure load to that observed in traditional scenarios. Interestingly, the prophylactically augmented VBs did not show the reduced stiffness observed in more conventional simulations. Where this type of preventative intervention may be of use in the near future is in the metastatic spine were lesions can be more easily identified and tissue debulking may be indicated to reduce burst fracture risk. High-rate axial fractures including burst type injuries with no neurological deficit are further candidates for an anterior VB augmentation with additional posterior instrumentation to prevent instability. In the first series of experiments different cements were utilised: one based on traditional PMMA and a second on calcium phosphate (CaP) (Fig 3). Notwithstanding the difficulty with injecting this particular formulation of CaP into bone, regression analysis demonstrated that the principle factor for the structural characteristics of the VB under axial load was the cement volume with the effect of BMD only marginal.
Figure 3: Post fracture CT (top) and post-augmentation microCT scans (bottom) for vertebrae injected with PMMA (left) and CaP (right) cements. Utilisation of three vertebrae segments in the axial trauma scenario allowed us to compare the biomechanics of traditional posterior and anterior instrumentation against PVP and posterior instrumentation only, under dynamic loading conditions. The construct with anterior cement augmentation was just as effective in sustaining physiologically relevant axial loads as the more traditional, surgically more invasive, intervention. Both at the index level and across three vertebrae the level of specimen deformation was found not to be significant between groups. In summary, vertebroplasty has the potential to provide biomechanically sound interventions in a number of different pathological scenarios. However, this promise will only be realised if a more focused approach on the underlying pathologies, as well as the fracture itself, is delivered. Here the development of pathology specific interventions with cements of differing properties, injection technologies and adjunct procedures are a real necessity. ACKNOWLEDGEMENTS Funding: Engineering and Physical Sciences Research Council, Action Medical Research and Yorkshire Children’s Spine Foundation. Company sponsorship: Arthrocare, DePuy Spine and Synthes. Collaborators: Dr RJ Oakland, Mr N Furtado, Dr S Rehman, Dr RK Wilcox (University of Leeds, UK), Mr Jake Timothy, Mr Peter Millner & Mr David Limb (Leeds Teaching Hospitals Trust, UK). REFERENCES 1. Peh WCG, et al. Semin Ultrasound CT MR 26: 52-64,
2005. 2. Sun K, et al. Ann Biomed Eng. 32: 77-91, 2004. 3. Hulme PA, et al. Spine 31: 1983-2001, 2006. 4. Reidy D, et al. Spine 28: 1534-9, 2003. 5. Wilcox RK, et al. J Bone Joint Surg-A 85: 2184-9,
2003. 6. Furtado N, et al. Spine 32: E480-7, 2007. 7. Oakland RJ, et al. J Neurosurg Spine 9: 493-501, 2008. 8. Sun K, et al. Spine 29: 1428-35, 2004.

14
MUSCULOSKELETAL MODELLING: HOW IT BEGAN, WHAT IT OFFERS, AND WHERE IT IS HEADING
1 Ajay Seth, 1,3 Jeffrey A. Reinbolt and 1,2 Scott L. Delp
Departments of 1Bioengineering and 2Mechanical Engineering, Stanford University 3 Department of Mechanical, Aerospace, and Biomedical Engineering, University of Tennessee
email: [email protected]; web: www.stanford.edu/group/nmbl
MOTIVATION Musculoskeletal diseases in 2004 cost the United States economy more than $849 billion [1] (7.7% of GDP) and places great demands on healthcare systems worldwide. Musculoskeletal modelling and simulation has a tremendous potential to improve patient care and reduce treatment costs by elucidating cause and effect relationships related to neurological and musculoskeletal impairments and by predicting effective surgical and rehabilitation treatments. EVOLUTION OF MUSCULOSKELETAL MODELING Conceptual models of the musculoskeletal system began as early as the 18th century when Newton’s equations of motion were formulated by hand to investigate animal limb movement and dynamics [2]. From these roots, musculoskeletal models have evolved rapidly matching the exponential growth in computing capacity. Computers have enabled nonlinear dynamical equations, typical of musculoskeletal models, to be solved numerically without analytical or closed-form solutions. Beginning with the dynamic computer simulations of Chow and Jacobson [3] models have advanced to provide greater insights into human gait with greater ease (Table 1). Table 1: The evolution of dynamic gait simulations. dofs forces cpu time(s) Chow & Jacobson (1976) 5 5 NADavy & Audu (1987) 3 9 NAYamaguchi & Zajac (1990) 8 10 NAAnderson & Pandy (2001) 23 64* 8,000,000Thelen and Anderson (2006) 21 92† 1,800* 54 muscles, 10 foot springs; † 92 muscles Although numerical integration can solve dynamical models with many degrees of freedom and applied forces, formulating representative computerized equations is a nontrivial task. The advent of multibody solvers (e.g., SD/FAST, ADAMS, DADs, SimBody) has allowed non-dynamicists to formulate and solve equations with greater ease. The difficulty, however, remains in describing the geometry and interconnectivity of musculoskeletal systems that do not resemble the idealized shapes found in engineered mechanisms. Muscle paths, for example, are either ignored [3] or painstakingly described according to experimental data sets [4, 5]. DESCRIPTIVE MUSCULOSKELETAL MODELS Delp et al. [5] leveraged emerging computer graphics to visualize bones and muscles to enable interactive manipulation of muscle paths and automated calculations of muscle moment-arms and lengths. Graphical models are more easily compared to cadaver and medical imaging data. Software for Interactive Musculoskeletal Modeling (SIMM) was born to bring computer aided design tools, so effective in engineering industries, to the biomechanist.
SIMM has enabled the accurate description of joints and muscle paths and provided an environment to test effects of muscle path changes, for example, from a tendon transfer surgery, on the moment generating capacity of muscles. INTEGRATING GRAPHICS WITH DYNAMICS SIMM combined with SD/FAST to formulate the equations of motion, which generated the computer code necessary to solve the equations numerically. Seamlessly integrating graphical and dynamical modelling is one of the features of OpenSim [6]. COMBINING MODELS WITH MOTION-CAPTURE Models also allow us to obtain access to internal variables not accessible in experimental studies. Typical motion capture experiments, with trajectories from markers affixed to body segments and force-plate reaction forces, do not provide information about the action of individual muscles. However, by prescribing kinematics and applied loads from measurements, the internal forces/moments can be estimated with a model that satisfies Newton’s laws of motion. In most cases, static optimization is employed to decompose joint moments into individual muscle forces. Solving a tracking problem (following motion-capture kinematics) with a dynamic model ensures that Newton’s laws are satisfied and enables muscle dynamics to be included. Models can be deconstructed to determine the acceleration of the whole body due to a single muscle, by applying or perturbing a single muscle force. This process, called muscle induced acceleration analysis, was used with muscle actuated models of nine subjects walking at four different speeds to determine which muscles contribute to support and progression in unimpaired gait [7]. Recently we have analysed the muscle induced acceleration of a group of children with crouch gait resulting from cerebral palsy. The results present a dichotomy between the positive contribution of gastrocnemius to support (Fig. 1) and its large knee flexion acceleration. The large contributions to support offered by the plantarflexors argues against lengthening the Achilles tendon.
Figure 1: Muscle contributions to center-of-mass acceleration in impaired (crouch) and unimpaired gait.

Proceedings of the 7th Australasian Biomechanics Conference, Griffith University, November /December 2009
15
THE MODEL AS THE HYPOTHESIS Models are useful for testing hypotheses about form and function. For example, it is assumed that crouched gait is induced or worsened by muscle tightness, thus tendon transfer surgeries are the leading form of treatment for crouch gait. However, outcomes from these surgeries are mixed. The question that arises is whether adopting a crouch gait provides advantages that make it favourable to adopt in some cases. We proposed the hypothesis that the crouched posture itself improves the capability of an individual to accelerate their body. To test this hypothesis, we placed a 3D musculoskeletal model with 15 degrees of freedom and 92 muscles into crouched and upright postures during midstance. We then maximised the transverse-plane ground reaction forces by varying muscle forces in the model within physiological ranges.
Figure 2: Maximum midstance transverse plane ground reaction forces generated from the musculoskeletal model in unimpaired (upright, left) and crouched (right) gait. The crouched posture, on average, generated 24% larger maximum ground reaction forces during midstance compared with an upright posture (Figure 2). Therefore, one potential benefit of adopting a crouched posture is the increased mechanical advantage of muscles to accelerate the center-of-mass both forward and medio-laterally as was hypothesized. This may help compensate for balance and other deficiencies resulting from cerebral palsy. PREDICTING OUTCOME FROM SIMULATION By far the most powerful aspect of dynamical models is the ability to ask “what if” questions and the potential to predict outcome. This requires a high degree of confidence in the model to represent both the mechanical and neurological conditions of the patient, which can be very difficult considering the complexity of the central nervous system. In some cases we can assume an ideal behaviour to test the best case scenarios. For example, stiff-knee gait, which is characterized by diminished knee flexion during the swing phase, is a common symptom of spastic cerebral palsy. Many stiff-knee patients exhibit excessive knee extension moments prior to swing which has been attributed to rectus femoris (RF) muscle activity [8]. We asked whether abnormal RF excitation prior to swing or during swing has a greater influence on peak knee flexion by ideally eliminating RF excitation during pre-swing and early swing (Figure 3b). We generated preoperative subject-specific simulations of ten cerebral palsy patients who exhibited stiff-knee gait and underwent RF transfer by tracking subject motion capture data with scaled models. The simulated effects on peak knee flexion were compared for each subject, by eliminating excitation prior to and during swing. Peak knee flexion was influenced more by abnormal RF excitations prior to swing compared to those during swing, (Figure 3c). Therefore, pre-swing RF activity is a stronger
indication for RF transfer than the traditional focus on activity during swing.
Figure 3: Increase in peak knee flexion when rectus femoris activity was separately eliminated during pre-swing and early swing. (a) Surface EMG. (b) Eliminated muscle activities. (c) Simulated knee flexion angles. CHALLENGES AND FUTURE VISION Subject-specific simulation is a powerful tool for identifying the biomechanical causes of movement abnormalities and has the potential to improve treatment planning. However, simulations have yet to deliver on this promise. Joint and muscle path descriptions have improved significantly in the last two decades, but important challenges remain. First, the body’s acceleration is a consequence of the resulting ground reaction force; thus, it is imperative that contact modelling be incorporated for analysing locomotion. Second, to investigate the effects of model changes, we must be able to synthesize the excitation (controls) to muscles that would reproduce human behaviour. This is a daunting challenge given the complexity of the human central nervous system. Fortunately, detailed musculoskeletal models can serve as the platform for developing theories of motor control. We envision a future in which simulations maximize treatment efficacy, limit undesired consequences and reduce costs. To accomplish this will require the scientific and clinical community to contribute and refine musculoskeletal models and their analyses. Towards this end OpenSim [8] was introduced to provide a free and open musculoskeletal modelling and simulation environment that combines the efficient formulation and solution of system dynamics with high fidelity graphics and analysis tools. It is our hope that OpenSim will act as a catalyst to promote model exchange and ignite modelling innovation to be shared by all. ACKNOWLEDGEMENTS Support provided by an NIH Roadmap for Medical Research, Grant U54 GM072970. We thank Sam Hamner, Kat Steele, and Melanie Fox for their valuable contributions. REFERENCES 1. AAOS, Burden of Musculoskelatal Diseases, 2008. 2. Borelli GA, & Bernoullii J. De Motu Animalium,
1743. 3. Chow CK, Jacobson DH, Math Biosci 10: 239-306 4. Davy DT & Audu ML. J Biomech 20: 187-201, 1987. 5. Delp SL, et al. IEEE Tran Biomed Eng 37: 757-67,
1990. 6. Delp SL, et al. IEEE Tran Biomed Eng 55: 1940-50,
2007. 7. Liu MQ, et al. J Biomech 39: 2623-30, 2005. 8. Goldberg S, et al. J Biomech 39: 689-98, 2006.

16
PODIUM PRESENTATIONS

Proceedings of the 7th Australasian Biomechanics Conference, Griffith University, November /December 2009
17
A CLINICAL STUDY OF THE BIOMECHANICS OF STEP DESCENT USING DIFFERENT TREATMENT MODALITIES FOR PATELLOFEMORAL PAIN
1 Dominic Thewlis, 2 James Selfe, 2 Jim Richards, 3 Stephen Hill and 2 Jonathan Whittaker
1 School of Health Sciences, University of South Australia, Adelaide, Australia
2 School of Public Health & Clinical Sciences, University of Central Lancashire, UK 3 Central Lancashire Primary Care NHS Trust, UK
email: [email protected] INTRODUCTION The majority of research on the biomechanics of the patellofemoral joint during step descent has either focussed on the sagittal plane or used very simple marker sets, leading to conflicting results. The knee and the patellofemoral joint both move in six degrees of freedom and both have moving centres of joint rotation leading to extremely complex control mechanisms. The importance of this was highlighted by Kowalk et al [1]. This is also important when considering the effect of taping and bracing as these modalities apply medially directed forces. Previous work by the authors demonstrated that patellofemoral bracing and taping both had a significant effect on the coronal and transverse plane mechanics of the knee, which had not been previously identified [2]. The current study investigated the effect of patellar bracing and taping on the mechanics of the knee during a controlled eccentric step down task in a group of patients suffering from Patellofemoral Pain Syndrome (PFPS). METHODS Thirteen PFPS patients were recruited from a single primary care trust in the UK. A step descent was used to assess the control of the knee as the body was lowered as slowly as possible. The task was conducted under three randomised conditions: a) no intervention, b) Trupull Advance sleeve knee brace (DJ Ortho), c) neutral patella taping. For the application of the taping technique the subjects were sitting with a relaxed, extended knee. One strip of tape was applied without tension across the centre of the patella. The tape was not pulled in either the medial or lateral direction. Kinetic data were collected at 200Hz using two AMTI force platforms. Kinematic data were collected using a ten camera Oqus motion capture system (Qualisys medical AB, Gothenburg, Sweden) at 100Hz. The segments of the lower limbs were modelled in six-degrees of freedom [3], using the markers set described by Thewlis et al [4]. The knee joint kinematics were calculated relative to the shank co-ordinate system using an XZY Cardan sequence which is equivalent to the joint coordinate system [5]. The kinematic and kinetic data about the knee were then quantified from toe off, of the contralateral limb to contact of the contralateral limb. The maximum, minimum and range of joint kinematics (ROM) and moments were calculated at the knee. RESULTS Repeated measures ANOVA identified significant changes in the maximum coronal plane knee angle, the range of coronal plane knee angles, the range of transverse plane knee angles and the peak transverse plane internal rotation moment (p<0.05). No significant differences were identified in the mean, maximum or minimum sagittal plane knee angular velocity (p>0.05), reducing the
possibility of measured differences being a result of variability in descent velocity. Table 1: Post-hoc pairwise comparisons for the significant knee kinematics (degrees) and moments (Nm/kg) in the coronal and transverse planes. Mean difference P No intervention - Brace Max coronal plane angle -3.3 0.003Coronal ROM -3.0 0.007Transverse ROM -3.0 0.012Max internal rotation moment 0.0 0.951 No intervention - Tape Max coronal plane angle -0.5 0.542Coronal ROM -1.1 0.017Transverse ROM 0.4 0.671Max internal rotation moment 0.02 0.165 Tape - Brace Max coronal plane angle 2.7 0.022Coronal ROM 2.6 0.066Transverse ROM 2.3 0.072Max internal rotation moment 0.02 0.047 DISCUSSION Changes were identified in the coronal and transverse plane kinematics and transverse plane moments of the knee between no intervention and both bracing and taping. The results of taping are interesting as there was a measurable mechanical effect from a treatment intervention designed not to have any mechanical effect. The brace compared to no intervention resulted in significant reductions in ROM in the coronal and transverse planes. The effect of the brace was greater than that of tape but both treatments appear to result in a step descent, which was more controlled and less painful compared to no intervention in this group of patients. ACKNOWLEDGEMENTS DJO supplied the Trupull Advance sleeve knee braces. REFERENCES 1. Kowalk et al. J Biomech 29: 383-8, 1996. 2. Selfe et al. Gait Posture 27: 258-63, 2008. 3. Cappozzo et al. Clin Biom 10: 171-8, 1995. 4. Thewlis et al. J App Biomech 24: 185-90, 2008. 5. Grood & Suntay. Trans ASME 105: 136-44, 1983.

18
A USER CENTRED DESIGN APPROACH TO ASSESSING THE SPINE AND SEATING FOR CHILDREN WITH NON-AMBULANT CEREBRAL PALSY
1 Carwyn Rhys Jones, 2 Sneha Sadani, 2 Arnab Seal, 3 Bipinchandra Bhakta, 1 Richard Hall and 1 Martin Levesley
1 Mechanical Engineering, University of Leeds, Leeds, UK
2 Department of Community Paediatrics, NHS Leeds Community Healthcare 3 Department of Rehabilitation Medicine, University of Leeds & Leeds Teaching Hospitals NHS trust
email: [email protected]
INTRODUCTION The purpose of this study was to develop an objective measurement system to assist in the prescription of supportive seating for children with non-ambulant cerebral palsy (CP) who are at high risk of scoliosis. Currently the prescription of patients’ bespoke seating relies on the clinical skills and the subjective knowledge of trained seating staff (physiotherapists and engineers). To develop an objective measurement system to supplement this clinical approach, a user centred design methodology was chosen. A major consideration of seating is the correction of spinal deformity which is common in this group of children. Within this group the Mac Keith Consensus Statement [1] has recommended spinal X-rays to monitor scoliosis. A pilot study was carried out to assess a) the feasibility of a surface topography system (Quantec® scanner) for spinal assessment whilst seated, b) the repeatability of the system and c) the validity against the X-ray Cobb angle. METHODS The Seating Measurement System (SMS) was developed following a user centred design methodology, with in-depth stakeholder involvement (clinical, seating, and technical staff) throughout the design process. Following each development stage each stakeholder group reassessed their requirements alongside other groups to allow the discussion of contradicting requirements. The SMS was used in a pilot study involving twenty children aged 5-11 years with non-ambulant CP and poor posture control. The final modular seating system design incorporated critical aspects of seating, allowing clinical staff to correct the children’s posture and maintain comfort in a seated position, whilst exposing the back for spinal monitoring. Feasibility of the seating and Quantec® process was assessed using a parent Questionnaire. Q-angles (lateral scoliosis measure) were compared between two observers taking separate scans of each child to assess repeatability. Each child also had a spinal X-ray in a repeatable seated position and the mean Q-angle was compared to the Cobb angle to assess validity. RESULTS AND DISCUSSION Eighteen children had successful radiological and Quantec® assessment of their spine whist supported in the SMS. For two children Quantec® scans could not be processed as supports obscured some back markers. Scoliosis (Cobb>10°) incidence was 72%; Cobb angles ranged from 1-73° (mean 18.2°).
Parent Questionnaires showed Quantec® scanning was feasible with appropriate postural support. Repeatability assessment showed mean interobserver differences of 0.5±5.8° and validity assessment showed mean differences between Cobb and Q-angle of 0.02±6.2°. Results are comparable to similar studies for standing patients, with Cobb and Q-angle mean differences ranging from 1.1-2.6 ±4.9-10.2° [2]. Figure 1 shows the agreement plot between Cobb and Q angle for each patient, most of the patients had mild scoliosis with the exception of one child with a Cobb angle of 73°.
Figure 1: Bland-Altman agreement plot of Cobb Vs Q angle, dashed line is upper & lower limits of agreement. CONCLUSIONS The use of surface-topography to assess the spine whilst seated, for children with non-ambulant CP was feasible with appropriate postural support. Results were repeatable and valid against the gold standard, spinal X-ray. However this study involved a small number of patients, most with a mild scoliosis. The user centred design approach enabled informative decision making from stakeholders, highlighting fundamental requirements, which facilitated effective solutions. The scanning/seating process was notably easier for children who could co-operate. Stakeholder’s key seating outcomes include; comfort, upper limb function, spinal curvature/correction, pressure levels and, pelvic obliquity, these are being evaluated in the next investigation phase. REFERENCES 1. Gericke T. Dev Med & Child Neurol 48: 244, 2006. 2. Thometz JG, et al. J Ped Orthop 20: 512-6, 2000.
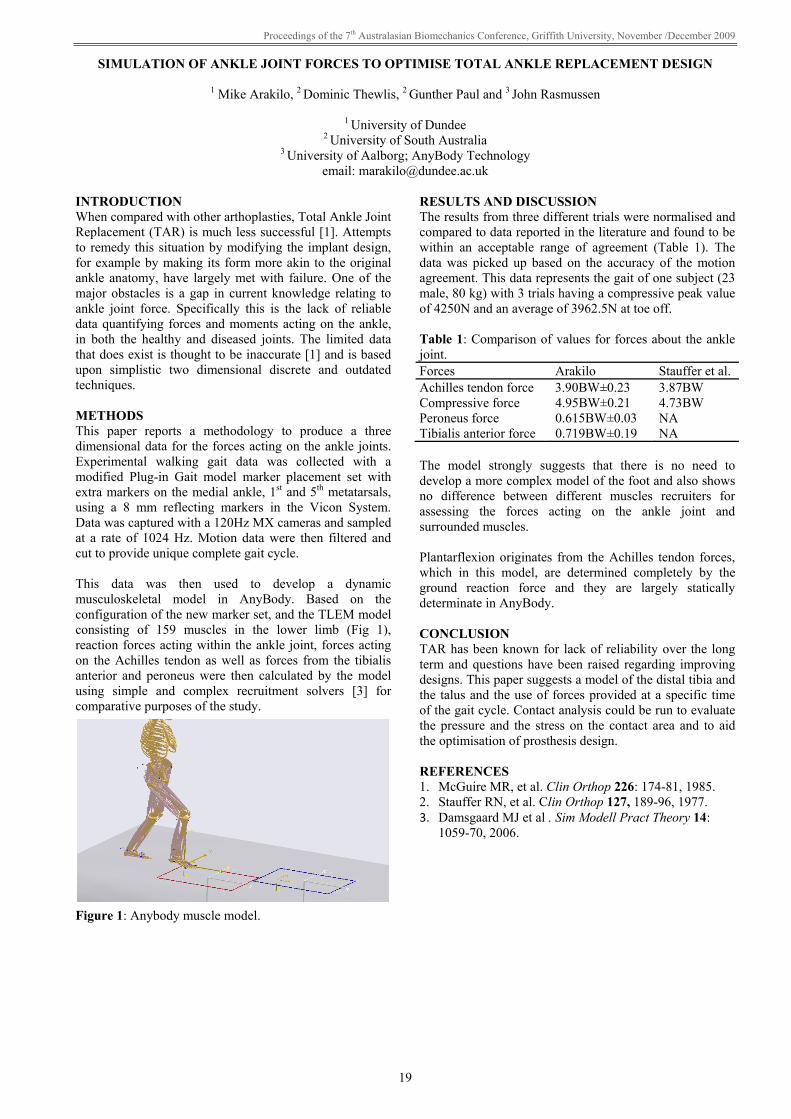
Proceedings of the 7th Australasian Biomechanics Conference, Griffith University, November /December 2009
19
SIMULATION OF ANKLE JOINT FORCES TO OPTIMISE TOTAL ANKLE REPLACEMENT DESIGN
1 Mike Arakilo, 2 Dominic Thewlis, 2 Gunther Paul and 3 John Rasmussen
1 University of Dundee 2 University of South Australia
3 University of Aalborg; AnyBody Technology email: [email protected]
INTRODUCTION When compared with other arthoplasties, Total Ankle Joint Replacement (TAR) is much less successful [1]. Attempts to remedy this situation by modifying the implant design, for example by making its form more akin to the original ankle anatomy, have largely met with failure. One of the major obstacles is a gap in current knowledge relating to ankle joint force. Specifically this is the lack of reliable data quantifying forces and moments acting on the ankle, in both the healthy and diseased joints. The limited data that does exist is thought to be inaccurate [1] and is based upon simplistic two dimensional discrete and outdated techniques. METHODS This paper reports a methodology to produce a three dimensional data for the forces acting on the ankle joints. Experimental walking gait data was collected with a modified Plug-in Gait model marker placement set with extra markers on the medial ankle, 1st and 5th metatarsals, using a 8 mm reflecting markers in the Vicon System. Data was captured with a 120Hz MX cameras and sampled at a rate of 1024 Hz. Motion data were then filtered and cut to provide unique complete gait cycle. This data was then used to develop a dynamic musculoskeletal model in AnyBody. Based on the configuration of the new marker set, and the TLEM model consisting of 159 muscles in the lower limb (Fig 1), reaction forces acting within the ankle joint, forces acting on the Achilles tendon as well as forces from the tibialis anterior and peroneus were then calculated by the model using simple and complex recruitment solvers [3] for comparative purposes of the study.
Figure 1: Anybody muscle model.
RESULTS AND DISCUSSION The results from three different trials were normalised and compared to data reported in the literature and found to be within an acceptable range of agreement (Table 1). The data was picked up based on the accuracy of the motion agreement. This data represents the gait of one subject (23 male, 80 kg) with 3 trials having a compressive peak value of 4250N and an average of 3962.5N at toe off. Table 1: Comparison of values for forces about the ankle joint. Forces Arakilo Stauffer et al. Achilles tendon force 3.90BW±0.23 3.87BW Compressive force 4.95BW±0.21 4.73BW Peroneus force 0.615BW±0.03 NA Tibialis anterior force 0.719BW±0.19 NA The model strongly suggests that there is no need to develop a more complex model of the foot and also shows no difference between different muscles recruiters for assessing the forces acting on the ankle joint and surrounded muscles. Plantarflexion originates from the Achilles tendon forces, which in this model, are determined completely by the ground reaction force and they are largely statically determinate in AnyBody. CONCLUSION TAR has been known for lack of reliability over the long term and questions have been raised regarding improving designs. This paper suggests a model of the distal tibia and the talus and the use of forces provided at a specific time of the gait cycle. Contact analysis could be run to evaluate the pressure and the stress on the contact area and to aid the optimisation of prosthesis design. REFERENCES 1. McGuire MR, et al. Clin Orthop 226: 174-81, 1985. 2. Stauffer RN, et al. Clin Orthop 127, 189-96, 1977. 3. Damsgaard MJ et al . Sim Modell Pract Theory 14:
1059-70, 2006.

20
DYNAMIC 3-DIMENSIONAL SHOULDER MOTION IN PEOPLE WITH STROKE
1 Jannette Blennerhassett, 2 Noel Lythgo, 1 Cathy Muir and 2 Mary Galea
1 Austin Health: Royal Talbot Rehabilitation Centre 2 Rehabilitation Sciences Research Centre, The University of Melbourne
email: [email protected]
INTRODUCTION Altered arm function and shoulder pain are common following stroke [1,2]. Impaired movement control and musculoskeletal changes after stroke lead to abnormal shoulder movement patterns. These altered movements may cause joint impingement and shoulder pain, which interfere with use of the arm during everyday life and rehabilitation [1]. Currently, there is limited biomechanical knowledge about shoulder motion post-stroke [3]. This type of information is needed to guide rehabilitation programs to improve patient outcome. This study used 3-D-motion analysis to investigate shoulder motion in people with stroke to gain insight into biomechanical factors that may contribute to altered shoulder function and pain. We hypothesised that shoulder motion on the affected side was significantly altered in people recovering from stroke when compared to the unaffected side. METHODS Ten people (mean age of 52 yrs, range 31-69 yrs) recovering from stroke who had some movement control of the affected arm (Motor Assessment Scale (MAS) Upper Arm item score 4-6 [4]) and could sit without support participated in the study. The participants did not have cognitive and lingusitic impairment or previous shoulder pathology. Median time post stroke was 142 days (range 21-1945). Five particpants had an affected right side. Six participants reported shoulder pain. Median MAS score was 5 (range 4-6). All participants were right handed. Participants performed 3 trials of bilateral shoulder flexion and abduction whilst seated. 3D shoulder joint motion relative to the trunk was recorded by a Vicon Motion System and analysed with BodyLanguage software (Upper Body Model). Euler angle XZY was used for flexion, while YZY was used for abduction. The measures extracted were (1) angular displacement from start position to the highest lift and (2) peak velocity and peak acceleration in early lift.
RESULTS AND DISCUSSION Table 1 lists the descriptive statistics for both the affected and unaffected side. Overall, significant differences were found between the affected and unaffected arm during shoulder flexion (P = 0.001) and abduction (P < 0.001). Despite attempting to gain a symmetrical starting position, the affected side was found to start with significantly less angular displacement (approximately 5°) from the trunk for both movements. This may reflect a lower resting position of the shoulder girdle, but needs further exploration. Maximum elevation for the affected arm was less for both abduction (average 15°, P < 0.001) and flexion (average 10°, P = 0.001). Early in the lifting phase, greater peak velocity was exhibited by the unaffected arm (abduction P = 0.009; flexion P = 0.004). Peak acceleration was significantly different for abduction (P = 0.01), but not for flexion (P = 0.23). Observation of the acceleration curves during elevation revealed notable jerk on the affected side. Both velocity and acceleration profiles warrant further investigation. CONCLUSIONS The affected shoulder exhibits disordered motion relative to the unaffected side following stroke. This type of movement impairment may contribute to the development of shoulder pain but needs further investigation. ACKNOWLEDGEMENTS The project was supported by a grant provided by Austin Hospital Medical Research Foundation. REFERENCES 1. Chae JD, et al. Arch Phys Med Rehabil 88: 298-301,
2007. 2. Lingdgren IA, et al. Stroke 38: 343-8, 2007. 3. Price C. Age Ageing 3: 36-8, 2002. 4. Carr JH, et al. Phys Ther 65: 175-80, 1985.
Table 1: Angular data for the affected and unaffected arms during shoulder flexion and abduction. Flexion Abduction Variable Affected arm Unaffected arm Affected arm Unaffected arm Starting position (°) 12.6 ± 12.8** 17.0 ± 9.9 17.3 ± 6.1** 22.3 ± 6.8 Maximum elevation (°) 126.1 ± 20.1** 135.8 ± 12.8 124.1 ± 20.8** 138.7 ± 11.1 Movement amplitude (°) 113.2 ± 21.6 118.8 ± 14.6 106.8 ± 23.4** 116.4 ± 12.5 Peak angular velocity (°/s) 73.3 ± 18.5** 81.0 ± 19.9 62.1 ± 25.0** 72.5 ± 28.8 Peak angular acceleration (°/s2) 167.8 ± 68.0 155.3 ± 65.2 183.5 ± 136.7* 250.6 ± 211.2 Values indicate mean ± 1 standard deviation. Arm comparison: * significant at P < 0.05; ** significant at P < 0.01.

Proceedings of the 7th Australasian Biomechanics Conference, Griffith University, November /December 2009
21
LOW STIFFNESS OF PAEDIATRIC SPINAL CORD: IMPLICATIONS FOR INJURY SEVERITY/THRESHOLDS
1,2 Elizabeth Clarke, 1,2 Shaokoon Cheng and 1 Lynne Bilston
1 Prince of Wales Medical Research Institute, University of New South Wales, Sydney 2 Equal contributions of EC and SC
email: [email protected] INTRODUCTION The mechanical properties of spinal cord are of interest in understanding spinal cord injury (SCI) and disease, developing spinal cord models and predicting injury thresholds. While the properties of adult spinal cord are known, the effects of age and development on spinal cord properties have not been previously investigated. This topic is of both clinical and experimental interest. SCI in children is generally more severe initially but is also associated with better and faster functional recovery e.g. [1,2]. The reasons for these differences are not known and this has led to the development of neonatal rat models of SCI. However the use of a smaller neonatal animal introduces the challenge of matching experimental injury with the larger adult animal. Understanding differences in adult and paediatric spinal cord properties could help refine experimental models of SCI and improve our understanding of SCI. METHODS Neonatal spinal cord properties were investigated in vitro in the current study and were compared to results from a similar study [3] on adult spinal cord (1a-c, Table 1). Entire spinal cords were harvested from euthanised neonatal (14 days) rats, preconditioned in tension for 10 cycles and then mechanically tested in tension (2a-c, Table 1). Entire adult spinal cords in the study by Fiford and Bilston were also preconditioned for 10 cycles then tested in tension [3]. Three different spinal cord strain rates were investigated for each age group. The stress at 5% strain was compared for adult and neonatal groups tested at equivalent strain rates using a t-test. Table 1: Preconditioning and testing protocols Group N Preconditioning
(strain, strain rate) Mechanical test (strain, strain rate)
Adult: 1a [3] 7 5%, 0.2/s 5%, 0.2/s Adult: 1b [3] 7 5%, 0.02/s 5%, 0.02/s Adult: 1c [3] 7 5%, 0.002/s 5%, 0.002/s Neonate: 2a 8 5%, 0.2/s 5%, 0.2/s Neonate: 2b 7 5%, 0.2/s 5%, 0.02/s Neonate: 2c 6 5%, 0.2/s 5%, 0.002/s RESULTS AND DISCUSSION Mean stress-strain responses are shown in Figure 1. The stress-strain responses of adult and neonatal spinal cords are qualitatively similar in that they are both non-linear, have increaseing stiffness with strain and have higher stiffness at higher strain rates.
However, the stiffness of adult spinal cords was higher and the peak stress was significantly higher for the adult cords (p<0.001, all 3 strain rates). An increase in strain rate appeared to have a greater effect on stiffness of adult spinal cords than neonatal spinal cords.
Figure 1: Stress-strain responses for adult and neonatal rat spinal cord in tension (mean ± standard deviation). The lower stiffness of the neonatal spinal cord implies that under a given load the neonatal spinal cord would undergo a larger degree of deformation. This may explain the initially higher severity of clinical SCI in children, as the magnitude of spinal cord deformation affects SCI severity e.g. [4]. Similarly, the lower stiffness of the neonatal spinal cord could lower the injury threshold of the paediatric spinal cord as the strain at which SCI occurs may be reached at a lower load. These findings may also have implications for experimental models of neonatal SCI. A common approach for matching injury severities in adult and neonatal SCI models is to scale the displacement/strain and speed/strain rate of the injury based on anatomical proportions. Our results suggest that matching adult and neonatal spinal cord strains/displacements would likely produce a lower stress in the neonatal spinal cord and this may affect the injury severity. Also, the stiffness of the neonatal spinal cord appears to be less sensitive to changes in strain rate, therefore the speed of injury may have a lesser effect on paediatric SCI than on adult SCI. REFERENCES 1. Wang MY, et al. Spine 29:1493-7, 2004. 2. Pickett GE, et al. Spine 31:799-805, 2006. 3. Fiford R & Bilston LE. J Biomech 38:1509-15, 2005. 4. Fiford R, et al. J Neurotrauma 21:451-8, 2004.

22
MEASURING SCAPULA KINEMATICS WITH A NEW MOTION CAPTURE & DIGITISATION TECHNIQUE
1 Joe AI Prinold, 1 Aliah F Shaheen and 1 Anthony MJ Bull
1 Department of Bioengineering, Imperial College London, U.K email: [email protected]
INTRODUCTION Measurement of the 3-D kinematics of the scapula during dynamic activities can provide important information for clinical disorders, rehabilitation techniques and sports performance. However, the thick layer of skin that covers the scapula means that skin-based measurement techniques will underestimate actual bone movements. A scapular palpation device known as the scapula locator has been developed [1] and then applied to dynamic motions [2]. It has been shown to be accurate but is impractical for high speed motions such as throwing. Two other skin-based techniques have been developed which are significantly more practical for high speed motions. The first, which is the focus of this study, is the scapular tracker [3]. This uses two points of contact on the shoulder and has not previously been used in a motion capture environment. The other more popular technique is the acromial method that uses only one point of contact [4]. Studies have compared the acromial method to the scapula locator [5], but no similar studies have been found for the scapula tracker. These two methods have been compared to a bone-based measurement technique and greater accuracy was found in the scapula tracker for external rotation and posterior tilt [3]. In previous studies using the scapula tracker and acromial method, digitisation with the scapula has been at a position of rest. This leads to increasing measurement errors as the scapula moves away from the digitisation position; becoming large at higher angles of humeral elevation. These errors have led to a consensus in the literature that skin-based methods are not valid above ~100 deg humeral elevation. Altering the angle of digitisation and having multiple digitisation points may significantly reduce this error. The aim of this study was to validate the use of the scapular tracker against the scapula locator during dynamic movement in a motion capture environment. A new digitisation approach will also be analysed. METHODS A scapula tracker was developed to incorporate a cluster of retro-reflective markers (Fig 1). An optical motion tracking system was used to record the position of these markers and other markers on the thorax, humerus and scapula locator. A total of 10 subjects and 2 investigators participated in the study. Subjects were seated comfortably on a stool; the position of the stool was adjusted so that an elevation in the scapular plane corresponded with the arm pointing to a line along the floor and up the wall. The subject tracked this line with a laser pointer attached to the forearm. These measures helped keep a consistent motion and reduce motor noise.
All subjects performed slow, controlled bilateral abduction in the scapular plane. Six subjects also performed slow, controlled bilateral abduction in the sagittal plane. The scapula tracker and locator positions were recorded simultaneously. One investigator used the locator and the other placed the scapula tracker throughout the study in order to reduce inter-investigator errors. The scapula tracker was digitised with the locator at a number of humeral elevation angles. Individual digitisation angles were then analysed separately as well as in an incremental approach.
Figure 1: Scapular tracker attached to mid portion of scapula spine and posterior portion on flat of the acromion. RESULTS AND DISCUSSION The scapula tracker recorded comparable errors to those seen in the literature for the acromial and scapula tracker methods. The angle of digitisation is shown to have a significant, positive effect on the errors recorded. Multiple digitisation points reduced the errors further, although this process is relatively time consuming. REFERENCES 1. Johnson et al. Clin Biomech 8: 269-73, 1993. 2. Shaheen et al. Proceedings of ISB XXII, Cape Town,
South Africa, Abstract 204, 2009. 3. Karduna et al. J Biomech Eng., 123: 184-190, 2001. 4. McQuade & Smidt. J Orthop Sports Phys Ther 27:
125-33, 1998. 5. van Andel et al. Gait Posture 29: 123-128, 2009.

Proceedings of the 7th Australasian Biomechanics Conference, Griffith University, November /December 2009
23
KINETIC ANALYSIS OF SNOWBOARD JUMP LANDINGS: INFLUENCE OF LANDING STYLE
1 Paul McAlpine, 2 Uwe Kersting, 1 Nico Kurpiers, 3 Jeremy Determan and 1 Sharon Walt
1 The University of Auckland, New Zealand 2 Aalborg University, Denmark
3 Sole Technology Institute, USA email: [email protected]
INTRODUCTION Today terrain parks are well utilized by the snowboarding population. Epidemiological data show an increased injury risk associated with jumping. At present, the magnitude of the impact loads experienced during jumping, and potential moderating factors, are not well understood. Apart from a small handful of theoretical and experimental research projects [1, 2] this aspect of snowboarding has been largely ignored. The aim of the current study was to investigate the ground reaction forces (GRF) applied to snowboarders during controlled on-mountain tabletop jump landings and to assess the influence of landing technique on these measures. METHOD Thirteen snowboarders participated in this study. The test session involved 12 straight jumps over tabletop snow jumps. Kinetic data were collected at 1000 Hz using two custom six degree of freedom snowboard force plates, mounted between the binding and board. All jumps were recorded using a standard digital video camera for qualitative assessment. Force and moment data were filtered with a low pass 4th order Butterworth digital filter at 100 Hz [3]. For each participant, the landing trials were divided into tail first and board flat landings based on the GRF loading patterns and qualitative review of the video recordings. Maxima, loading rates and impulse were calculated for all components of the landing GRF. Non-parametric Wilcoxon Signed Rank tests were used to identify differences between the landing categories. Significance level was set at p < 0.05. RESULTS AND DISCUSSION As expected, the GRF loads applied at the feet during landing were of high magnitude. The pooled mean vertical impact peak for all trials was 5.2 (SD 1.9) and 5.5 BW (SD 1.8) for the front and back feet respectively. Combining the output from both plates, the net peak compressive load applied to the body was 7.8 BW (SD 2.6, range 4.2 – 17.1). This corresponds with a mean whole body COM acceleration maximum of 67 G across all participants. This data compares well with the results of a previous accelerometer based investigation [2]. Landing style had an influence on both the magnitude and timing of landing GRF. Tail landings significantly decreased the net vertical force peak (Fig 1) and impulse. The effect of landing style on individual foot loading was dependent on the segment of interest. Front foot vertical loads and moment rates about the long axis of the snowboard significantly decreased for tail first landings whereas back foot vertical force, shear force along the snowboard and applied moments significantly increased. Additionally the back foot centre of pressure was located more laterally for tail first landings.
Based on these results it is difficult to identify which landing technique is superior with regard to injury prevention or performance. The results show that tail first landings decrease the net applied force by increasing the time period over which the landing movement occurs. Active bending of the snowboard with such landings may act to dissipate energy. However, a tail first landing technique was also shown to generally increase the forces and moments applied to snowboarders’ rear foot. It is clear that further research into jump landing technique will benefit this sport as a whole.
Figure 1: Representative mean vertical force traces. CONCLUSIONS Biomechanical descriptions of snowboard jumping will prove valuable in future development of injury prevention strategies. Further investigation into the effect of snowboard equipment adjustments on kinematic and joint loading measures will be conducted in the near future. ACKNOWLEDGEMENTS Thank you to ThirtyTwo Snowboard Footwear for their financial contributions to this project. REFERENCES 1. Bohm H, et al. J ASTM Int. 5, 2008. 2. Shealy J & Stone F. J ASTM Int. 5, 2008. 3. Winter, DA. Biomechanics and motor control of
human movement (3rd Ed). New Jersey, John Wiley and Sons, 2004.

24
INCREASING KNEE FLEXION IN LANDING TASKS MAY NOT REDUCE THE RISK OF NON-CONTACT ANTERIOR CRUCIATE LIGAMENT INJURY
1 Alasdair R Dempsey, 1 Bruce C Elliott, 2 Bridget J Munroe, 2 Julie R Steele and 1 David G Lloyd
1 School of Sport Science Exercise and Health, The University of Western Australia
2 Biomechanics Research Laboratory, The University of Wollongong email: [email protected]
INTRODUCTION Anterior Cruciate Ligament (ACL) injuries are a severe, debilitating injury that occurs all too often during team sports. The majority of these injuries occur with no contact to the athlete, during sidestep cutting and landing tasks [1]. Though the ACL’s primary function is to prevent anterior tibial translation it is also loaded by internal rotation and valgus moments at the knee [2]. Combining internal rotation moments with anterior drawer forces produces high ACL loads below 10° of knee flexion, while the same is true for valgus moment and anterior drawer forces from 10° - 50° of knee flexion. Combined with the extended knee postures observed during injury [1, 3] these results have led to the recommendation for increased knee flexion during sporting tasks to reduce injury risk [4]. The aim of this study was to test the recommendation for increased knee flexion during landing tasks. It was hypothesised that increased knee flexion would result in reduced knee moments. METHODS Twenty two male team sports athletes were recruited to participate in this study. All participants were experienced in performing functional landing tasks through their respective team sport. Five participants withdrew from the study because of time constraints. The technique modification program was based on Dempsey el al. [5]. It consisted of a 6 week programs with drills designed to move from closed to open tasks. Participants received visual and oral feedback during the session. Training focused on increasing knee flexion and maintaining a forward facing upright torso. Participants underwent full three dimensional motion analysis pre and post training [5]. An inverse dynamic model was used to calculate 3D knee loading and kinematics during the landing tasks. Maximal knee angles were identified as well as at foot contact and at peak valgus and internal rotation moment. Pre- and post-intervention scores were compared using paired t-tests. Pearson correlations were performed between kinetic and kinematic variables found to be significantly different. Table 1: Mean (SD) knee flexion angles (°). Pre Post p Initial Foot Contact 6.8 (7.1) 8.0 (6.2) 0.459Max 57.0 (14.5) 66.7 (17.9)* 0.010Peak Valgus 25.7 (10.5) 30.9 (15.6) 0.250Peak Internal Rotation 31.8 (9.9) 46.2 (21.1)* 0.017* Significant difference at p < 0.05
RESULTS AND DISCUSSION Following training there was a reduction in maximal knee flexion angle (Table 1) which was correlated to an increased internal rotation moment (r = 0.613, p = 0.009) (Table 2). There was also an increase in the knee angle at peak internal rotation moment, however there were no other significant changes (Tables 1 & 2). Table 2: Mean (SD) peak knee joint moments (Nm.kg-1.m-
1). Pre Post p Flexion -2.07 (0.56) -2.03 (0.392) 0.676 Valgus 0.41 (0.23) 0.32 (0.19) 0.244 Internal Rotation -0.13 (0.05) -0.20 (0.13)* 0.042
* Significant difference at p < 0.05 Despite the literature recommendation for increased knee flexion angle to reduce the risk non-contact ACL injury, the results from this study suggest that increasing knee flexion angle results in increased internal rotation moments. This increase in moment initially suggests that increasing knee flexion angle potentially raises the risk of injury, however further analysis reveals that the relationship may be more complex. The peak internal rotation moment occurs well outside the knee angle range where it may highly load the ACL [2]. This suggests that the increase in moment may not result in an increased risk of injury. Further work utilising neuromuscular and stochastic modelling is required to understand the relationship between increased knee flexion and ACL load during sporting tasks. CONCLUSIONS Despite the increase in peak knee internal rotation moments associated with increasing knee flexion there may be no increase in risk of non-contact ACL injury as the peak moment occurred outside the knee angle range associated with high ACL load. Further work utilising computer modelling techniques is required to better understand the relationship between knee angle and ACL loading in functional sporting tasks. ACKNOWLEDGEMENTS Funding for this project was provided by the Australian Football League Research Board. REFERENCES 1. Cochrane JL, et al. J Sci Med Sport 10: 96-104, 2007. 2. Markolf KL, et al. J Orthop Res 13: 930-5, 1995. 3. Olsen OE, et al. Am J Sports Med 32: 1002-12, 2004. 4. Hewett TE, et al. Am J Sports Med 27: 699-706, 1999. 5. Dempsey AR, et al. Am J Sports Med: In press.

Proceedings of the 7th Australasian Biomechanics Conference, Griffith University, November /December 2009
25
KNEE JOINT DYNAMICS DURING LANDING OF ASSISTED AND RESISTED VERTICAL JUMPS
1 Ina Janssen, 1 Wayne Spratford, 2 Jeremy Sheppard, 3 Dale Chapman, and 3 Andrew Dingley
1 Biomechanics and Performance Analysis, Australian Institute of Sport, Canberra ACT 2 Strength and Conditioning, Queensland Academy of Sport, Sunnybank QLD
3 Department of Physiology, Australian Institute of Sport, Canberra ACT email: [email protected]
INTRODUCTION Assisted and resisted jump squats are training modalities often used for training of lower body power by increasing the power of the leg extensors, and in turn, this increase is thought to contribute to improved jump performance [1, 2, 3]. However, it is unclear how assisted and resisted jump squats affect knee joint loading during landing. This study aimed to investigate the loading placed on the knee, as measured by knee extensor moments, during landing from assisted and resisted countermovement jumps. METHODS Ten elite male volleyball players (17.1 ± 1.0 yrs; 86.5 ± 10.2 kg; 202.1 ± 6.5 cm) from the Australian Institute of Sport participated in the study. Each subject performed five successful countermovement vertical jumps landing bilaterally at body mass (Normal), whilst being assisted by a bungee jumping apparatus that unloaded the subject by approximately 9.97 kg (Assisted), and whilst wearing a 9.89 kg weight vest (Resisted). Three-dimensional kinematic (250 Hz; VICON; Oxford Metrics Ltd, Oxford, UK) and kinetic (1500 Hz; Kistler force plates; Model Z12697, Kistler Instrument Corporation, Amherst, NY, USA) data of each landing trial were collected and assessed. Kinematic and kinetic data were filtered using a low-pass 4th order Butterworth filter with a cut-off frequency of 12 Hz and 90 Hz, respectively. Kinematic data were then combined with the filtered ground reaction forces to calculate knee joint moments. Moments were normalised to subject body weight and height to reduce within group anthropometric differences. For each condition, the three highest vertical jumps based on displacement of the sacrum, were further analysed. The outcome variables determined were knee extensor moments at maximum knee flexion and at peak vertical ground reaction force (vGRF), and peak vGRF with the average of these from the three assessed jumps used in the statistical analyses.
Repeated measures ANOVA determined whether there was any significant effect of jump condition on the outcome variables. Statistical significance was set at p ≤ 0.05 and all analyses were performed using SPSS statistical package (Version 15.0, SPSS Inc, IL). RESULTS AND DISCUSSION No significant difference between jump condition and the magnitude of knee moment at maximum knee flexion or peak vGRF were observed (Table 1). Peak vGRF generated during landing between jump conditions was not significantly different. A significant difference was found in jump height between conditions. As the assisted condition resulted in higher jump heights and resisted jumps involved landing with a greater mass, there is potential for an altered landing technique between conditions allowing subjects to reduce the impact of these factors on knee loading. Further investigation is required to determine how the landing strategy employed by the subjects is altered to minimise knee loading. CONCLUSIONS The results of this study indicate that performing assisted or resisted vertical jumps does not significantly increase peak loading on the knee joint during landing. The amount of load on the knee during these three conditions is comparable and training with a weight vest or bungee of approximately ±10 kg does not place the knee joint in a compromising position. ACKNOWLEDGEMENTS This work was funded by a grant from the National Strength and Conditioning Association. REFERENCES 1. Dugan EL, et al. J Strength Cond Res 18: 668-74,
2004. 2. Stone MH, et al. J Strength Cond Res 17: 140-7, 2003. 3. Newton RU, et al. Med Sci Sports Exerc 31: 323-30,
1999. Table 1: Mean (SD) values of knee extensor moments, peak vGRF, and jump height in normal, assisted, and resisted vertical jump landing. Normal Assisted Resisted Knee extensor moment (N.m/kg) – at max knee flexion 2.63 (0.56) 1.34 (3.55) 2.87 (0.97) Knee extensor moment (N.m/kg) – at peak vGRF 6.95 (3.66) 5.93 (2.76) 7.04 (2.83) Peak vGRF (BW) 4.36 (0.70) 4.54 (0.52) 4.48 (0.78) Jump height (cm) 56.79 (9.31) 63.05 (11.44)* 50.61 (8.43)* * indicates significantly different (p ≤ 0.05) from the normal condition.

26
GENDER DIFFERENCES BETWEEN HIGH AND LOW STROKE RATE ROWING
Margy Galloway and Conny Draper
Australian Institute of Sport, Canberra email: [email protected]
INTRODUCTION Much rowing training in Australia and internationally occurs at relatively low stroke rates (less than 20 strokes per min). Stroke rates (SR) during racing are generally above 32 strokes per minute (spm). Low SR training is thought to create less physiological strain and is used as the predominant form of on-water low intensity training [1]. Rowers are usually encouraged to apply maximal force per stroke at low SR training. The longer recovery time between strokes and the slightly shorter drive time results in less power being produced at low SRs, and hence a lower physiological cost overall. Anecdotally however, male crews in Australia tend not to train at the very low SRs female crews train at (less than 18spm). Many coaches believe that forces generated by male rowers are relatively high at low SRs compared with forces produced at higher rates. Hence the workload is not minimised as much as occurs with females and the potential for injury to occur is increased. Gender differences at low and high stroke rate rowing have not been identified in the literature. The aim of this study was to quantify gender differences between low SR (SR16) and high SR (race pace) (RP) rowing. METHODS Biomechanical data from seven male (M2-) and six female (W2-) national standard pair oared crews were analysed. Each pair was asked to row three trials as part of standardised biomechanical rowing testing on an 1800m buoyed rowing course. Each trial was separated by 1800m of low intensity rowing. The first trial consisted of 300m at SR14 (females), SR16 (males), followed by 500m at SR16, then SR18, then SR20. The second trial consisted of 300m at SR18, then 500m at SR22, SR26 (both genders), then 500m at SR30 (females) and 250m at SR30 and 250m at SR32 (males). The final lap consisted of a flying 500m at mid-race race pace (RP). Each boat was set up with rowing gates instrumented with strain gauges and angle potentiometers (WEBA) and a minimaxX device (Catapult) containing a GPS, three accelerometers, gyroscopes and magnetometers to monitor boat performance.
RESULTS AND DISCUSSION Data at SR16 and RP were used for analysis and comparison (Table 1). Male (M) and female (F) crews rated at SR16 (M) 16.6±0.2 and (F) 16.2±0.5 spm respectively and at RP (M) 35.1±1.5 and (F) 35.0±2.3 spm. At SR16 male crews averaged 81.2% of the boat velocity they achieved at RP and produced 58.8% of the power compared with their RP average power output. Female crews achieved slightly lower relative velocity (79.3% of RP) and produced only 48.3% of the power they produced at RP. At SR16 compared to RP male rowers produced 117% of the peak force, their average rate of force development (RFD) was 104% and they produced 125% of the work per stroke. Females rowing at SR16 compared with RP only produced 98% of the peak force, their average RFD was 94% and work done per stroke was only 105% of RP. Stroke lengths were relatively longer at SR16, however the differences were similar for both genders (105% (M), 105.5% (F)). CONCLUSIONS Male pair oared rowers rowed with relatively more work per stroke than females at SR16 compared with the work per stroke they produced at race pace. The increased work per stroke was created by relatively higher forces throughout each stroke. This may lead to a relatively higher physiological or mechanical load than females. Rowing coaches may be justified in limiting the amount of very low SR training for male crews given the relatively high loading incurred. REFERENCES 1. Nilsen TS. et al. Basic Training Methodology. FISA Coaching manuals, pp 78-87, 2009.
Table 1: Means ± SD for M2- (n=7) and W2- (n=6) at SR16 and RP Boat SR
step Actual
SR (spm)
Boat velocity (m.s-1)
Drive time (s)
Recovery time (s)
Power
(w)
Peak Force (N)
Work/ stroke
(j)
Stroke length (deg)
RFD
(kN.s-1) M2- 16 16.6±0.2 4.05±0.25 1.04±0.07 2.57±0.07 237±22 1210±129 858±79 92.1±3.2 2.3±0.3 RP 35.1±1.5 4.98 ±0.34 0.83±0.05 0.88±0.05 404±47 1026±124 685±70 87.7±3.6 2.2±0.2 W2- 16 16.2±0.5 3.64±0.11 1.07±0.05 2.64±0.09 128±15 725±85 474±65 89.9±5.1 1.5±0.3 RP 35.0±2.3 4.59±0 .16 0.85±0.03 0.87±0.09 264±48 737±97 451±69 85.2±3.4 1.7±0.3

Proceedings of the 7th Australasian Biomechanics Conference, Griffith University, November /December 2009
27
THE EFFECT OF WEAPON WEIGHT AND WEIGHT DISTRIBUTION ON UPPER EXTREMITY MUSCLE ACTIVITY DURING STATIC RIFLE AIMING
1 Jessica Selinger, 1 Joan Stevenson, 2 David Tack and 3 Lt Gabrielle Chafe
1 Queen’s University, Kingston ON, Canada 2 Humansystems Inc., Guelph ON, Canada
3 Defence Research and Development Canada, Toronto ON, Canada email: [email protected]
INTRODUCTION Modern weapon-mounted technologies, such as novel sighting devices, aiming and illumination aids, fire control systems, and detachable grenade launchers, can add considerable weight to soldier personal weapons and can alter the weapon’s centre of mass (COM). The Canadian Forces will soon start the process of replacing its small arms fleet under the Small Arms Replacement Project (SARP), and, therefore, are interested in the effects of changes in weapon weight and COM on soldier weapon firing performance. The purpose of this study was to examine the effect of weight and weight distribution on upper extremity muscular activity during static rifle aiming. METHODS Custom testing rigs were designed to allow the weight and COM of the in-service C7A2 assault rifle to be altered using supplementary weights and an adjustable rail system. Seven rifle configurations, each of which represented the weight and COM of a potential future design, were assessed. Fourteen Canadian Forces Reserve soldiers performed static rifle holds with each of the rifle configurations. Upper extremity muscle activity was monitored using surface electromyography (EMG) and a subjective scale was used to assess perceived exertion. Dependent measures included muscular activity level (integrated EMG), rate of muscular fatigue (slope of the median power frequency), and subjective ratings of perceived exertion (Borg CR10 scale). The body areas exhibiting the most muscular strain throughout testing were also subjectively assessed using a body map. RESULTS AND DISCUSSION Muscle activity levels of the supporting arm were significantly greater (>30% increase) when the COM of the rifle was shifted forward 7 cm (p<0.05) (Fig 1). This objective finding was supported by soldiers’ subjective perceptions of muscle strain. Conversely, muscle activity levels did not significantly respond to the effects of added weight; although, this may have been largely due to the fact that muscle activity of lower back was not captured. Rates of muscle fatigue were found to be greater in the anterior deltoid then other extremity muscles and fatigue levels were greater in the supporting arm than the trigger arm (p<0.05) (Fig 2). However, using EMG rates of fatigue only, it was not possible to differentiate between weight conditions and COM positions.
Figure 1: Integrated EMG of the supporting arm biceps brachii (BB) and brachioradialis (BR) for each COM position. (†Individual values were normalized to the intra-subject averages (ISA), calculated across all rifle configurations, prior to averaging across subjects. This removed much of the inter-subject variability and was applied for graphical purposes only.)
Figure 2: Percent Median Density Function change for the anterior deltoid (AD), brachioradialis (BR), and biceps brachii (BB) of the supporting arm (SA) and trigger arm (TA). CONCLUSIONS These findings will contribute to enhancing the current weapon selection process and have provided a starting point toward developing a standardized protocol for assessing muscular activity during rifle aiming.
-40-30-20-10
0102030405060
-7 0 +7In
tegr
ated
EM
G (%
ISA†
)COM Position (cm)
BBBR
**
-25
-20
-15
-10
-5
0
5
10
AD BB BR
Cha
nge
in M
DF
(%)
Muscle
SA
TA*

28
FATIGUE DOES NOT CHANGE THE LOWER LIMB LANDING STRATEGIES UTILIZED BY ASYMPTOMATIC ATHLETES WITH PATELLAR TENDON ULTRASONOGRAPHIC ABNORMALITY
1 Suzi Edwards, 1 Julie R Steele, 2 Jill L Cook, 3 Craig Purdam, 4 Sue Beattie and 1 Deirdre E McGhee
1 Biomechanics Research Laboratory, University of Wollongong, New South Wales 2 School of Exercise and Nutrition Sciences, Deakin University, Burwood, Victoria
3 Department of Physical Therapies, Australian Institute of Sport, Canberra, Australian Capital Territory 4 PRP Diagnostic Imaging, Wollongong, New South Wales
email: [email protected] INTRODUCTION Patellar tendinopathy, frequently incurred in repetitive landing sports [1], is typically diagnosed via tendon pain and the presence of a patellar tendon ultrasonographic abnormality (PTA) on diagnostic imaging [2]. The presence of a PTA in asymptomatic athletes has been identified as a risk factor in the development of patellar tendinopathy [3]. Fatigue has also been identified as a contributing factor to knee joint injuries [4]; fatigued muscles are less able to absorb the loads generated during landing. Given the paucity of research in this field, this study aimed to investigate the effects of fatigue on biomechanical variables characterising the landing technique of asymptomatic athletes with a PTA during a stop-jump task to determine whether fatigue increased the risk of developing PTA and, in turn, patellar tendinopathy. METHODS Sixteen asymptomatic male athletes with a PTA performed five successful trials of a stop-jump task before and after a fatigue protocol. The fatigue protocol consisted of repetitive sets of 30 stretch-shortening exercises on a sledge apparatus with 1 minute rest between sets. During each stop-jump trial, participants’ ground reaction forces (GRF; 1000 Hz), 3-dimensional kinematics (100 Hz), and electromyographic activity (1000 Hz) of seven lower limb muscles were recorded for both lower limbs. Participants’ kinematic, kinetic and patellar tendon force (FPT) data for the horizontal landing phase of the stop-jump task were analysed using Visual 3D software (C-Motion, USA). Paired t-tests were used to detect significant differences between non-fatigued and fatigued conditions (P < 0.05). RESULTS AND DISCUSSION Most of the kinematic and kinetic data during the landing phase of the stop-jump task remained unaffected by fatigue, reflected by the lack of significant between-fatigue condition differences (Fig 1 & 2).
Figure 1: Means (± SD) of joint angles displayed at initial foot-ground contact (IC), peak vertical GRF (FV) and peak patellar tendon force (FPT) during the stop-jump task. Our previous research has found that PTA athletes, when compared to athletes with normal patellar tendons, sustained similar patellar tendon loads, landed with greater
knee flexion and utilised a different hip movement strategy whereby they extended, not flexed, their hips are they landed [4]. Interestingly, irrespective of fatigue condition, PTA participants in the present study also displayed this unique landing strategy. We speculate that this landing strategy may predispose these PTA participants to developing patellar tendinopathy in the longer term.
Figure 2: Means (± SD) of forces (normalized to body weight) generated during the stop-jump. FV = peak vertical GRF; FAP = peak anterior-posterior GRF; FPT = peak patellar tendon force; LR FV = FV loading rate; LR FPT = FPT loading rate; IC-FV = time from initial foot-ground contact (IC) to FV; IC-FAP = time from IC to FAP; IC-FPT = time from IC to FPT. Although PTA participants continued to extend their hips as they landed when fatigued, they landed in less hip flexion compared to non-fatigued condition (Fig 1). This may be a consequence of fatigue causing the PTA participants to enter the landing phase of the stop-jump task with a slower approach velocity, landing in a more vertically upright position and attaining a lower vertical jump height following the subsequent take-off phase. CONCLUSIONS There was no significant effect of fatigue on the patellar tendon loads or landing strategy displayed by PTA participants during a stop jump task. Although fatigue did not place any additional risk of developing a PTA and in turn, patellar tendinopathy, we speculate that the unique landing strategy used by PTA participants is the important factor that may increase their risk of developing a PTA. ACKNOWLEDGEMENTS NSW Sporting Injures Committee for funding this study. REFERENCES 1. Lian OB, et al. Am J Sports Med 33: 561-7, 2005. 2. Khan KM, et al. Radiol 200:821-7, 1996. 3. Cook JL, et al. Scand J Med Sci Sports 11: 321-7,
2001. 4. Edwards S, et al. Submitted to Am J Sports Med 2009. 5. Chappell JD, et al. Am J Sports Med 33: 1022-9, 2005.

Proceedings of the 7th Australasian Biomechanics Conference, Griffith University, November /December 2009
29
MEASUREMENT OF PASSIVE LENGTH-TENSION PROPERTIES OF HUMAN GASTROCNEMIUS MUSCLE FASCICLES AND TENDONS IN VIVO: APPLICATION TO STUDY OF CONTRACTURE
1 Rob Herbert, 2 Phu Hoang, 1 Li Khim Kwah, 1 Joanna Diong, 3 Jill Clarke, 1 Elizabeth Clarke, 2 Josh Martin, 3 Lisa Harvey,
2 Lynne Bilston and 2 Simon Gandevia
1 The George Institute for International Health 2 The Prince of Wales Medical Research Institute
3 The University of Sydney email: [email protected]
INTRODUCTION Characterisation of length-tension properties of human calf muscles involves estimation of muscle tension. Some investigators estimate tension by dividing ankle torque by Achilles tendon moment arm. Others use invasive technologies such as buckle transducers or fiber optic transducers to measure tendon force. Both approaches necessitate problematic assumptions about muscle load sharing. We developed a non-invasive method for measuring passive length-tension properties of the human gastrocnemius [1] based on the approach of Herzog and ter Keurs [2]. We combined gastrocnemius length-tension data with ultrasonography to obtain separate length-tension curves of muscles fascicles and tendons [3]. Here we demonstrate use of these methods in a study designed to determine if contractures in patients with stroke, spinal cord injury and multiple sclerosis are due to changes in passive length-tension curves of muscle fascicles or tendons. METHODS Passive torque-angle properties of the ankle are measured during sagittal ankle displacements at 6 knee angles. It is assumed (a) the gastrocnemius muscle is the only structure with non-negligible stiffness that crosses the knee and ankle, (b) torque-angle properties of other ankle structures are independent of knee angle, and (c) ankle torque-angle properties and gastrocnemius length-tension properties have an exponential form. It follows that:
Ggll
ggg
Dadd
Pappkaankle
lleEm
eE
eE
Ggg
aDd
Pap
>−+
<−+
>−=
−
−
−
)1(/
)1(/
)1(/},{
)(
)(
)(
α
θθα
θθα
α
θθα
θθαθθτ
where θa and θk are the angles of the ankle and knee, lg is the length of the gastrocnemius (a function of θa and θk), and the moment arm mg = δlg/δθa. The constants Ep, αp, θP, Ed, αd, θD, Eg, αg and lG are estimated with a multivariable nonlinear minimisation routine implemented in MATLAB [4]. Eg, αg and lG are used to reconstruct gastrocnemius length-tension curves. Ultrasonography (Esaote MyLab25, 46 mm linear array, 7.5-12 MHz operating at 10 MHz) is used to image gastrocnemius muscle fascicles. To obtain a wide field of view, two ultrasound transducers are coupled side by side. The two sequences are sampled at 15 Hz. In-house software is used to track muscle fascicle lengths. Data on the relationship between fascicle length and muscle-tendon length are used to partition gastrocnemius length-tension curves into muscle fascicle and tendon length-tension curves.
Figure 1: Composite sagittal image of gastrocnemius muscle. Dashed lines, muscle boundaries. Dotted lines, two muscle fascicles. Arrow, muscle-tendon junction. Black area in the middle of the image, a region not imaged by either transducer.
Figure 2: Length tension curves for spinal cord injured patients and controls. RESULTS Preliminary data (95% CIs about mean length-tension curves) from 16 spinal cord injured patients and 16 controls are shown in Figure 2. CONCLUSIONS It is possible to obtain non-invasive measures of the length-tension properties of muscle fascicles and tendons from humans in vivo. The methods have been used to investigate mechanisms of contracture in people with stroke, spinal cord injury and multiple sclerosis. ACKNOWLEDGEMENTS Rob Herbert, Lynne Bilston and Simon Gandevia are supported by the NHMRC. This project was supported by an ARC Discovery Grant. REFERENCES 1. Hoang PD, et al. J Biomech 38: 1333-41, 2005. 2. Herzog W, et al. Pflugers Archiv 411: 637-41, 1988. 3. Hoang PD, et al. J Exp Biol 210: 4159-68, 2007 4. Nordez, A, et al. J Biomech: In press.
0
50
100
150
200
250
300Te
nsio
n (N
)
40 60 80 100 120Length (% of shank length)
ControlSCI
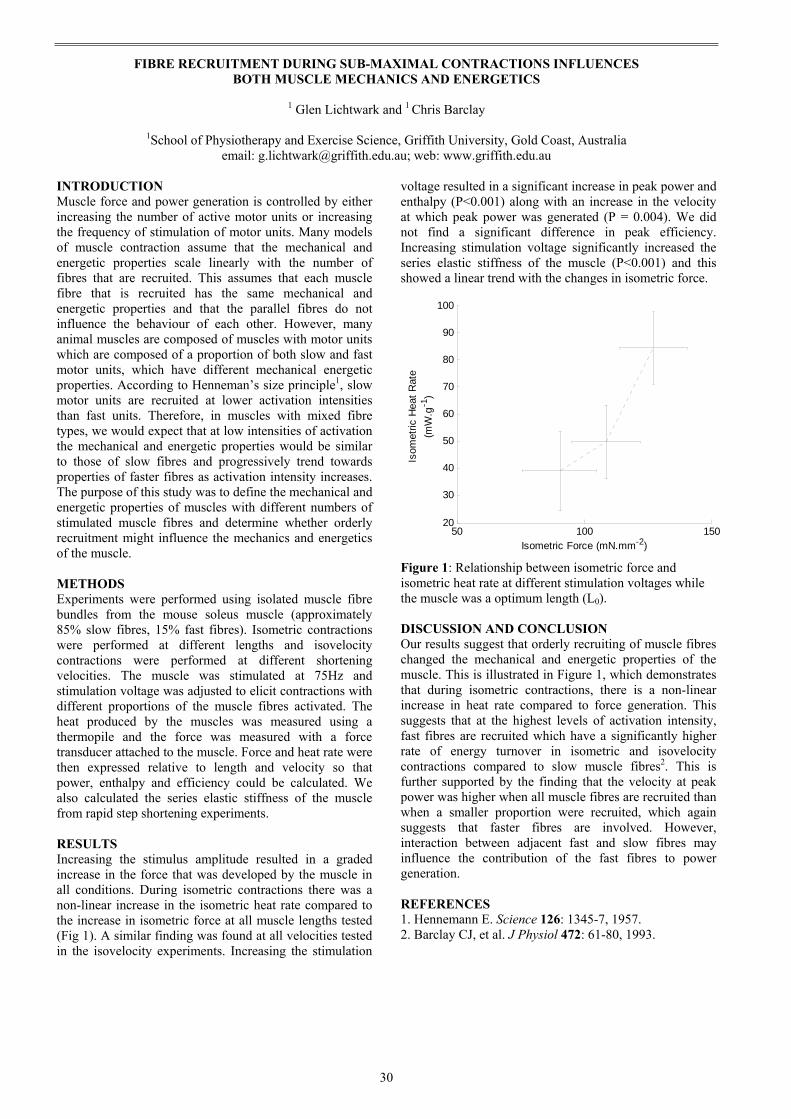
30
FIBRE RECRUITMENT DURING SUB-MAXIMAL CONTRACTIONS INFLUENCES BOTH MUSCLE MECHANICS AND ENERGETICS
1 Glen Lichtwark and 1 Chris Barclay
1School of Physiotherapy and Exercise Science, Griffith University, Gold Coast, Australia
email: [email protected]; web: www.griffith.edu.au
INTRODUCTION Muscle force and power generation is controlled by either increasing the number of active motor units or increasing the frequency of stimulation of motor units. Many models of muscle contraction assume that the mechanical and energetic properties scale linearly with the number of fibres that are recruited. This assumes that each muscle fibre that is recruited has the same mechanical and energetic properties and that the parallel fibres do not influence the behaviour of each other. However, many animal muscles are composed of muscles with motor units which are composed of a proportion of both slow and fast motor units, which have different mechanical energetic properties. According to Henneman’s size principle1, slow motor units are recruited at lower activation intensities than fast units. Therefore, in muscles with mixed fibre types, we would expect that at low intensities of activation the mechanical and energetic properties would be similar to those of slow fibres and progressively trend towards properties of faster fibres as activation intensity increases. The purpose of this study was to define the mechanical and energetic properties of muscles with different numbers of stimulated muscle fibres and determine whether orderly recruitment might influence the mechanics and energetics of the muscle. METHODS Experiments were performed using isolated muscle fibre bundles from the mouse soleus muscle (approximately 85% slow fibres, 15% fast fibres). Isometric contractions were performed at different lengths and isovelocity contractions were performed at different shortening velocities. The muscle was stimulated at 75Hz and stimulation voltage was adjusted to elicit contractions with different proportions of the muscle fibres activated. The heat produced by the muscles was measured using a thermopile and the force was measured with a force transducer attached to the muscle. Force and heat rate were then expressed relative to length and velocity so that power, enthalpy and efficiency could be calculated. We also calculated the series elastic stiffness of the muscle from rapid step shortening experiments. RESULTS Increasing the stimulus amplitude resulted in a graded increase in the force that was developed by the muscle in all conditions. During isometric contractions there was a non-linear increase in the isometric heat rate compared to the increase in isometric force at all muscle lengths tested (Fig 1). A similar finding was found at all velocities tested in the isovelocity experiments. Increasing the stimulation
voltage resulted in a significant increase in peak power and enthalpy (P<0.001) along with an increase in the velocity at which peak power was generated (P = 0.004). We did not find a significant difference in peak efficiency. Increasing stimulation voltage significantly increased the series elastic stiffness of the muscle (P<0.001) and this showed a linear trend with the changes in isometric force.
Figure 1: Relationship between isometric force and isometric heat rate at different stimulation voltages while the muscle was a optimum length (L0). DISCUSSION AND CONCLUSION Our results suggest that orderly recruiting of muscle fibres changed the mechanical and energetic properties of the muscle. This is illustrated in Figure 1, which demonstrates that during isometric contractions, there is a non-linear increase in heat rate compared to force generation. This suggests that at the highest levels of activation intensity, fast fibres are recruited which have a significantly higher rate of energy turnover in isometric and isovelocity contractions compared to slow muscle fibres2. This is further supported by the finding that the velocity at peak power was higher when all muscle fibres are recruited than when a smaller proportion were recruited, which again suggests that faster fibres are involved. However, interaction between adjacent fast and slow fibres may influence the contribution of the fast fibres to power generation. REFERENCES 1. Hennemann E. Science 126: 1345-7, 1957. 2. Barclay CJ, et al. J Physiol 472: 61-80, 1993.
50 100 15020
30
40
50
60
70
80
90
100
Isometric Force (mN.mm-2)
Isom
etric
Hea
t Rat
e(m
W.g
-1)

Proceedings of the 7th Australasian Biomechanics Conference, Griffith University, November /December 2009
CHANGES IN CORTICAL AND SPINAL RESPONSIVENESS DURING A FATIGUING SUBMAXIMAL CONTRACTION
1 Ben Hoffman, 1 Tomomichi Oya, 1,2 Tim Carroll and 1,3 Andrew Cresswell
1 School of Human Movement Studies, The University of Queensland 2 School of Medical Sciences, Faculty of Medicine, University of New South Wales
3 School of Health and Rehabilitation Sciences, The University of Queensland email: [email protected]
INTRODUCTION The literature investigating corticospinal changes at different sites during fatigue is small [1], especially in lower limb muscles. We investigated changes in corticospinal responsiveness during a sustained submaximal contraction of the plantar flexors. Comparisons were made between changes in motor evoked potentials (MEPs), which reflect responsiveness of the entire corticospinal pathway, and cervicomedullary motor evoked potentials (CMEPs), which reflect responsivness of the motoneurone pool [1], to determine the site of corticospinal changes during fatigue. METHODS Subjects sustained an isometric contraction of the plantar flexors at 30% of maximum voluntary contraction (MVC) for as long as possible on two occasions. Stimulations were applied differently on each occasion; either to the motor cortex to evoke MEPs, or to the cervicomedullary junction to evoke CMEPs in the medial gastrocnemius. Stimulations were applied every minute until task failure. Peripheral nerve stimulation was also applied at the popliteal fossa to evoke maximal M-waves (Mmax) and superimposed twitches (SIT). MEPs, CMEPs and Mmax were also evoked during brief non-fatigued MVCs prior to the sustained submaximal contraction. Peak-to-peak amplitude of MEPs, CMEPs and Mmax, surface electromyography (EMG) amplitude and superimposed twitches were measured and compared at the start and end of the sustained contraction using a Student’s t-test. These values were also compared to those measured during the brief non-fatigued MVC. RESULTS AND DISCUSSION Central fatigue occurred during the sustained contraction as the SIT was still significantly higher at task failure than during the brief pre-fatigued MVC. Furthermore, EMG amplitude was ≈60% lower at task failure than during the brief pre-fatigued MVC. During the sustained contraction, MEP amplitude increased significantly by 108% and at task failure matched MEP size during the brief non-fatigued MVC (≈21% Mmax vs. ≈23% Mmax; Fig 1). Similarly, CMEP size significantly increased by 51%, however at task failure it was significantly smaller than during the brief MVC (≈5% Mmax vs. ≈13% Mmax; Fig 2). The large increase in MEP along with the small increase in CMEP during the sustained submaximal plantar flexion contraction indicates that cortical processes contributed substantially to the increase in corticospinal responsiveness.
Figure 1: MEP amplitude (mean±SEM) during the brief non-fatigued MVC and at the start and end of the sustained submaximal contraction.
Figure 2: CMEP amplitude (mean±SEM) during the brief non-fatigued MVC and at the start and end of the sustained submaximal contraction. The strength of corticospinal projections and the upper-limit of motor unit recruitment may explain why corticospinal responsiveness appears different for plantar flexors (observed here) compared to upper-arm muscles [1]. Furthermore, differences in motor unit recruitment and firing rate may explain differences in spinal responsiveness between submaximal and MVCs. CONCLUSIONS Changes in corticospinal responsiveness during a centrally fatiguing submaximal contraction of the plantar flexors occurs predominately at the cortical level. Muscle type and the strength of the muscle contraction appear to influence these changes. REFERENCES 1. Taylor JL, et al. J Physiol 490: 519-28, 1996.
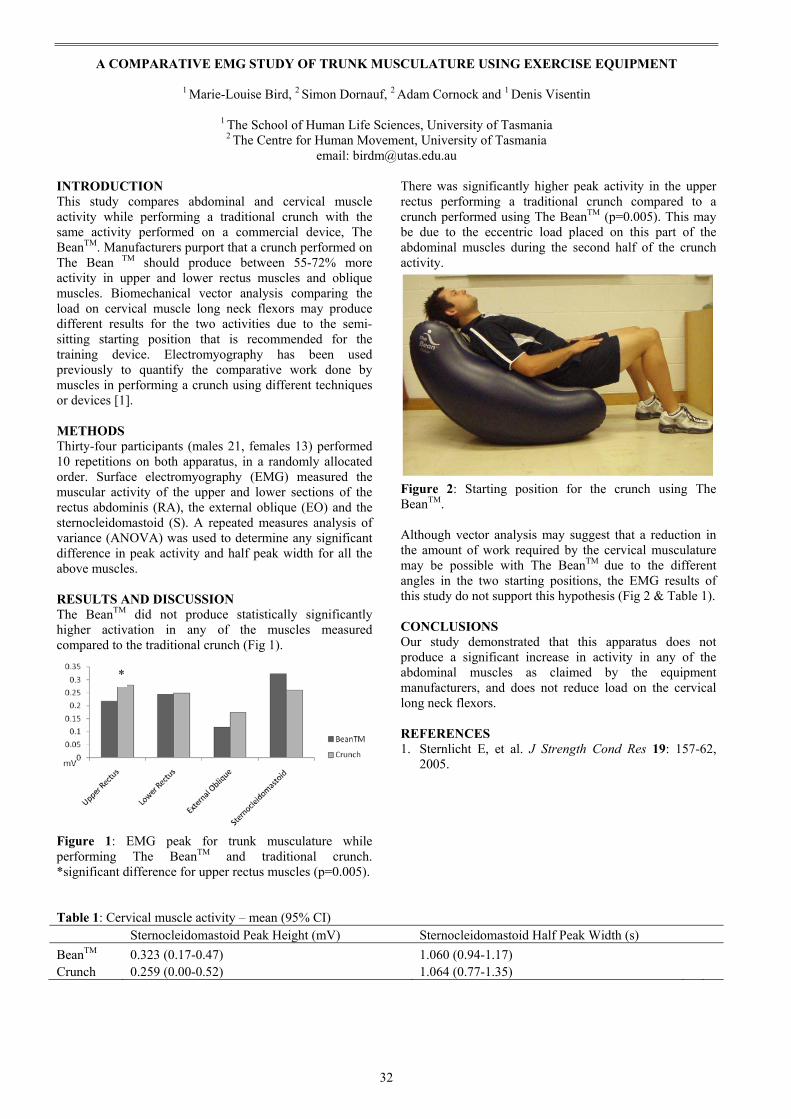
32
A COMPARATIVE EMG STUDY OF TRUNK MUSCULATURE USING EXERCISE EQUIPMENT
1 Marie-Louise Bird, 2 Simon Dornauf, 2 Adam Cornock and 1 Denis Visentin
1 The School of Human Life Sciences, University of Tasmania 2 The Centre for Human Movement, University of Tasmania
email: [email protected] INTRODUCTION This study compares abdominal and cervical muscle activity while performing a traditional crunch with the same activity performed on a commercial device, The BeanTM. Manufacturers purport that a crunch performed on The Bean TM should produce between 55-72% more activity in upper and lower rectus muscles and oblique muscles. Biomechanical vector analysis comparing the load on cervical muscle long neck flexors may produce different results for the two activities due to the semi-sitting starting position that is recommended for the training device. Electromyography has been used previously to quantify the comparative work done by muscles in performing a crunch using different techniques or devices [1]. METHODS Thirty-four participants (males 21, females 13) performed 10 repetitions on both apparatus, in a randomly allocated order. Surface electromyography (EMG) measured the muscular activity of the upper and lower sections of the rectus abdominis (RA), the external oblique (EO) and the sternocleidomastoid (S). A repeated measures analysis of variance (ANOVA) was used to determine any significant difference in peak activity and half peak width for all the above muscles. RESULTS AND DISCUSSION The BeanTM did not produce statistically significantly higher activation in any of the muscles measured compared to the traditional crunch (Fig 1).
Figure 1: EMG peak for trunk musculature while performing The BeanTM and traditional crunch. *significant difference for upper rectus muscles (p=0.005).
There was significantly higher peak activity in the upper rectus performing a traditional crunch compared to a crunch performed using The BeanTM (p=0.005). This may be due to the eccentric load placed on this part of the abdominal muscles during the second half of the crunch activity.
Figure 2: Starting position for the crunch using The BeanTM. Although vector analysis may suggest that a reduction in the amount of work required by the cervical musculature may be possible with The BeanTM due to the different angles in the two starting positions, the EMG results of this study do not support this hypothesis (Fig 2 & Table 1). CONCLUSIONS Our study demonstrated that this apparatus does not produce a significant increase in activity in any of the abdominal muscles as claimed by the equipment manufacturers, and does not reduce load on the cervical long neck flexors. REFERENCES 1. Sternlicht E, et al. J Strength Cond Res 19: 157-62,
2005.
Table 1: Cervical muscle activity – mean (95% CI) Sternocleidomastoid Peak Height (mV) Sternocleidomastoid Half Peak Width (s) BeanTM 0.323 (0.17-0.47) 1.060 (0.94-1.17) Crunch 0.259 (0.00-0.52) 1.064 (0.77-1.35)
*

Proceedings of the 7th Australasian Biomechanics Conference, Griffith University, November /December 2009
STRESS RELAXATION IN RELAXED HUMAN ANKLES IS NEARLY INDEPENDENT OF KNEE AND ANKLE ANGLES
1 Maoyi Tian, 1 Phu D Hoang, 1 Simon C Gandevia, 1 Lynne E Bilston and 2 Robert D Herbert
1 Prince of Wales Medical Research Institute, The University of New South Wales, Sydney, Australia 2 The George Institute, Sydney, Australia
email: [email protected]
INTRODUCTION Stress relaxation, creep and hysteresis are viscoelastic behaviours exhibited by most biolgical tissues. These behaviours are commonly modeled with quasi-linear visoelastic (QLV) theory [1]. Complete characterisation of stress relaxation at different joint angles will allow us to create robust models of viscoelastic behaviours of human joints. The objective of this study was to determine if there are any effects of changing ankle and knee angles on stress relaxation of human ankles in vivo under passive conditions. METHODS The right legs of 8 healthy volunteering subjects were tested. The experimental apparatus was similar to that described by Hoang et al. [2]. Bipolar surface EMG was used to ensure subjects remained relaxed throughout the experiments. We conducted two experiments. In the first we examined the effect on stress relaxation of changing gastrocnemius length while keeping the length of single joint structures fixed. In the second we examined the effect on stress relaxation of changing the lengths of single joint structures while keeping the gastrocnemius length fixed. The experiments and conditions were conducted in a random order. A one-hour break was given between each experiment, and subjects were asked not to exercise or stretch their lower legs. The experimental data were fitted with a two-term exponential function (5 parameters). Mixed linear models were used to determine if there were significant effects on parameter estimates (G0, G1, G2, λ1, λ2) due to the length of gastrocnemius muscle length or the length of single-joint structures. RESULTS AND DISCUSSION Figure 1 shows data for all experiments for one subject. There was no significant effect of changing gastrocnemius muscle length on estimating G0, G2, λ1 or λ2, nor was there an effect of changing the length of single joint structures on G0 or G1 in the second comparison group (P>0.05). However, there were statistically significant effects of changing gastrocnemius length on G1 (P<0.05), and of changing length of single joint structures on G2, λ1 and λ2 (P<0.05). There was no evidence that the order of experimental conditions influenced any parameter. Although the statistical analysis found some significant effects of gastrocnemius length and length of single-joint structures on parameter estimates, the size of effects was small (ΔG/G<10%) (Fig 1). That is, these effects may be statistically significant but not practically important.
This study reported similar values for G0, G1, G2 to those reported for human ankles by Duong et al. [3]. However, the shorter time constants found in this study may be because we ignored the early relaxation in order to minimise potential errors due to the finite ramp loading rate. Best et al. [4] and Mutungi and Ranatunga [5] reported similar stress relaxation responses in rabbit hindlimb muscles and rat hindlimb muscle fibres to those observed in this study.
Figure 1: Shaded area represents the bounds of all smoothed and normalized raw experimental data for one subject. CONCLUSIONS The stress relaxation function of the human ankle was largely unaffected either by changing the gastrocnemius muscle length or by changing the length of single joint structures. This suggests a common relaxation function could be applied in constructing quasi-linear viscoelastic human ankle models at a range of knee and ankle angles. ACKNOWLEDGEMENTS This research is supported by a Discovery grant from Australian Research Council. Simon Gandevia, Rob Herbert and Lynne Bilston are supported by NHMRC senior research fellowships. REFERENCES 1. Fung FC. Biomechanics: Mechanical properties of
living tissues, 2nd ed. pp. 277-92. Springer, New York, 1993.
2. Hoang PD, et al. J Exp Biol 210: 4159-68, 2007. 3. Duong B, et al. Clin Biomech 16: 601-7, 2001. 4. Best TM, et al. J Biomech 27: 413-9, 1994. 5. Mutungi G & Ranatunga KW. J Muscle Res Cell Motil
17: 357-64, 1996.

34
VOLUNTARY SWAY AND RAPID ORTHOGONAL TRANSITIONS OF VOLUNTARY SWAY IN YOUNG ADULTS, AND LOW AND HIGH FALLS-RISK OLDER ADULTS
1 Murray Tucker, 1 Justin Kavanagh, 2 Steven Morrison and 1 Rod Barrett
1 School of Physiotherapy and Exercise Science, Griffith University, Gold Coast, Australia; 2 School of Physical Therapy, Old Dominion University, Norfolk VA, USA; email: [email protected]
INTRODUCTION Falls are a major cause of injury and reduced quality of life among older people. Most falls result from a failure of postural control. The ability to avoid a fall depends upon detecting a stimulus, processing the information contained in the stimulus, selecting an appropriate response, and correctly executing the response within a critical time frame [1]. Age-related changes in sensorimotor function often impair the execution of these processes, thus increasing falls-risk. Although age-related deterioration of task specfic postural control has been reported for anterior-posterior (AP) and medial-lateral (ML) directions, few studies have examined the effect of ageing or falls-risk on reactive postural tasks requiring combined AP and ML movement. The purpose of this study was to examine differences in response speed and postural stability between young, low falls-risk older, and high falls-risk older adults during rapid orthogonal transitions of voluntary postural sway between AP and ML directions. METHODS Young adults (N = 25; age = 25 ± 4 yr), low falls-risk older adults (N = 32; age = 74 ± 5 yr), and high falls-risk older adults (N = 16; age = 79 ± 7 yr) participated. Falls-risk was measured using the Physiological Profile Assessment (PPA) [2]. Participants executed rapid orthogonal switches of AP to ML voluntary sway or ML to AP voluntary sway (Fig 1). For AP-ML transitions, participants swayed in the AP direction, and then switched sway to the ML direction after reacting to a ‘left’ or ‘right’ auditory cue. For ML-AP transitions, participants swayed in the ML direction and then switched sway to the AP direction after reacting to a ‘forward’ or ‘backward’ auditory cue. The amplitude of pre- and post-transition voluntary sway was regulated to the central 60% of each participant’s AP and ML maximum lean amplitude. A Kistler force plate (Type 9287A, Kistler Corporation) collected the AP and ML centre of pressure (COP). Reflective markers were placed on participants according to the full-body Plug-In Gait model (VICON, Oxford Metrics Group). 3D motion analysis was used to determine the AP and ML movement of the centre of mass (COM) (VICON, Oxford Metrics Group). COP and COM amplitudes were normalised to maximum voluntary sway amplitude prior to data analysis. Analysis of variance tests were used to analyse group differences in reaction time (RT), movement time (MT) and the root mean square (RMS) amplitudes of the COP, COM and the separation distance between the COP and COM (COP-COM) in the AP and ML directions during orthogonal sway transitions and pre- and post-transition voluntary sway. Group differences in the amplitude and frequency of pre-transition voluntary sway and COP location at cue onset were used as covariates for the orthogonal transition
variables.
Figure 1: AP and ML COP, COM, and COP-COM data from a high falls-risk older adult during a ML-AP transition. t=0 s is the onset of the RT cue to switch sway. RESULTS The low and high falls-risk older adults compared to the young adults had slower RT and MT and reduced AP COP and AP and ML COP-COM amplitudes during orthogonal transitions, increased non-target (orthogonal) COP and COM motion and reduced AP COP amplitude during pre- and post-transition voluntary sway. High compared to low falls-risk older adults had slower RT and MT and reduced ML COP-COM separation during orthogonal transitions, and increased non-target COM motion and reduced ML COP-COM separation during pre- and post-transition voluntary sway. DISCUSSION AND CONCLUSIONS Ageing and increased falls-risk resulted in a slowing of postural reaction responses when rapidly switching voluntary postural sway between the AP and ML directions. Older compared to younger adults had reduced direction control of voluntary sway as seen in their increased non-target sway and diminished AP COP shifting responses. High compared to low falls-risk older adults had poor control of COM motions during orthogonal transitions and voluntary postural sway, particularly in the ML direction. The decreased COP-COM separation for the older groups compared to the young, and high compared to low falls-risk older adults demonstrates a reduction in the ability to accelerate the COM in the target direction of sway and a decline in postural stability during voluntary sway movements. REFERENCES 1. Stelmach GE, et al. Clin Geriatr Med 1: 679-94, 1985. 2. Lord SR, et al. Phys Ther 83: 237-52, 2003.
-1.0
-0.5
0.0
0.5
1.0M L COP M L COM M L COP-COM
Time (s)-10 -5 0 5 10
Nor
mal
ised
Am
plitu
de
-1.0
-0.5
0.0
0.5
1.0AP COP AP COM AP COP-COM

Proceedings of the 7th Australasian Biomechanics Conference, Griffith University, November /December 2009
35
AN INVESTIGATION INTO THE EFFECT OF BODY MASS AND PHYSICAL ACTIVITY ON POSTURAL STABILITY IN CHILDREN
1 Franciska F. Ulmer and 2 Andrew W. Smith
1 Department of Sport and Exercise Science, University of Auckland, New Zealand 2 Department of Health and Physical Education, Hong Kong Institute of Education, Hong Kong
email: [email protected]
INTRODUCTION Research investigating the effect of adiposity on balance control in children is limited. The purpose of this study is to examine the differences of postural stability among weight groups and the association of physical activity with balance in a sample of young children. Emerging evidence suggests that excess body mass adversely affects postural stability [6]. The sensory systems of overweight individuals may be particularly challenged. Increased fatty deposits on the soles of the feet may impede essential sensory detection. Furthermore, the reduced level of physical activity associated with adiposity may lead to underdeveloped sensory processing [1,3,5]; and lastly, a young age is associated with an immature postural stability system. All these factors contribute to a very inefficient balance control system observed in children affected by greater body mass. METHODS Postural sway parameters were evaluated in 30 children of different body types aged 8-12 years, while they stood as quiet as possible on a force plate for 30 seconds. The experiment consisted of three different sensory conditions: normal standing, standing with eyes closed and head tilted back, and standing on foam. To evaluate the physical activity level children had to complete a self-reported questionnaire. A single session cross-sectional analysis design was employed for this study. The experimental session comprised of nine balance trials for three different conditions with each trial for 30 seconds. This duration has been shown to be sufficient for reliable postural sway measures [4]. The following conditions were selected to allow systematic manipulation of sensory systems: • Normal Stability: eyes open, head upright (Baseline). • Perturbed Stability: eyes closed, head tilted back
(ECHB). • Perturbed Stability: Foam (Foam) Vestibular input was either normal when the head was in its normal upright position or degraded by tilting the head backward 45°. Standing on foam as a third intervention was used to remove input from presso- and mechanoreceptors of the foot sole. Thus, the suppression of one type of sensory source can be used to estimate the importance of that information to postural control and indicate how the central nervous system adapts and reorganises information provided by the remaining sensory information. The children were administered a physical activity level questionnaire designed to quantify their daily activity level. The PAQ-C is a guided self-administered 7- day recall measure for children in grades four and higher. The questionnaire consists of a segmented day procedure
(e.g. recess, lunch, after school, evening) and separates week-day and weekend activity. It provides a summary physical activity score derived from nine items, each scored on a 5-point scale. The PAQ-C has been suggested as one of the most reliable and valid self-administered recall instruments [2]. Body Mass Index (BMI) data were recorded to categorise the children’s body composition. Because males and females have variable body compositions, they were also analysed separately according to age and sex specific cut-off points. Force data were taken on two Bertec strain-gauge force plates. Eight high-speed VICON cameras were placed around the force plates to setup a capture volume for 3D motion analysis, with 21-reflective markers used to define an 11-segment model. The passive markers reflect camera-projected infrared light and the digital signal is fed into a computer. A commercially available model was used to define angles, forces, moments and powers for all segments and joints. A second model, created in VICON BodyBuilder was applied in order to obtain COP data from each force plate and as well as whole body COP and COM. RESULTS AND DISCUSSION A statistically significant correlation was found between sway velocity and body mass index (BMI). However, no correlation was observed between postural sway area and BMI. A greater reliance on visual and vestibular information was not observed. In terms of physical activity, a significant correlation with postural stability was observed in the females. The negative correlation between BMI and sway velocity can be associated with a damping effect of inertia. In general, greater body mass did not appear to deteriorate balance control. CONCLUSIONS Since age played a significant role for all sway parameters, it is believed that maturation of the neuromuscular system and physical growth have the greatest effect on postural control in children; while the effect of BMI may be obscured. REFERENCES 1. Bulbulian R & Hargan ML. Physiol Behav 70: 319-25,
2000. 2. Crocker PR, et al. Med Sci Sport Exerc 29: 1344-9,
1997. 3. Jebb SA & Moore MS. Med Sci Sport Exerc 31: S534-
41, 1999. 4. Le Clair R & Riach C. Clin Biomech 11: 176-8, 1996. 5. Simoneau G, et al. Gait Posture 3: 115-22, 1995. 6. Wearing SC, et al. Obes Rev 7: 209-18, 2006.

36
RECOVERY FROM FORWARD LOSS OF BALANCE IN YOUNG AND OLDER ADULTS
Chris Carty, Peter Mills and Rod Barrett
School of Physiotherapy and Exercise Science, Griffith University
INTRODUCTION Loss of balance is a leading cause of morbidity and mortality in older adults. Although older adults have reduced stability following loss a balance [1], the kinematic and kinetic factors that contribute to step recovery capacity are not well understood. The purpose of this study was to quantify the margin of stability (MoS) following forward loss of balance in young single steppers (YSS), older single steppers (OSS) and older multiple steppers (OMS), and to identify the kinematic and kinetic factors associated with ageing and step recovery strategies that influence the MoS. METHODS Based on age and step recovery strategy participants were organized into three groups (YSS, n = 19, age: 24.9±1.3; OSS, n = 12, age: 71.4±1.5; OMS, n = 19, age: 76.4±1.2). Participants were tilted forward using a horizontal cable attached at the level of their centre of mass until 20% of their body weight was recorded on a strain gauge placed in series with the cable. After a random time interval participants were released unexpectedly to induce a forward loss of balance [2]. Kinematic data were collected at 200 Hz using an 8-camera 3D motion analysis system (Vicon Motion Systems, USA). Ground reaction force data were simultaneously collected at 1 kHz using two piezoelectric force platforms (Kistler Instruments, USA). Sagittal trunk, hip, knee and ankle joint angles and angular velocities, and MoS related measures (Eq. 1 and Eq. 2) [3] were calculated at cable release (CR), toe off (TO), foot contact (FC) and maximum knee joint flexion angle post FC (KJMAX).
CMXBoSMoS −= (Eq.1) l
gCMV
CMPCMX +=
(Eq.2)
BoS is the anterior boundary of the base of support (m), PCM is the vertical projection of the centre of mass (m), XCM is the extrapolated centre of mass position (m), VCM is the horizontal centre of mass velocity (m.s-1), l is the distance between centre of mass and ankle joint (m), and g is the acceleration due to gravity (m.s-2). Peak hip, knee and ankle joint flexion angles, angular velocities and joint extension moments were calculated between FC and KJMAX. One way ANOVA with Bonferroni correction were used to assess differences between; 1) YSS and OMS, and 2) OSS and OMS for each dependent measure. A stepwise multiple linear regression model (Y = A1X1 + A2X2 + A3X3 + A4) was used to determine predictors of MoS at FC and at KJMAX. Statistical analyses were performed using SPSS (v13, SPSS, USA). Sig was accepted at p < 0.05. RESULTS Differences in MoS and trunk kinematics between YSS and OMS and between OSS and OMS are presented in Figures 1 and 2. Peak hip (YSS, 66±3°; OMS, 55±3°), knee (YSS, 59±3°; OMS, 34±3°) and ankle (YSS, 19±2°; OMS, 10±2°) flexion angles and knee extension moments (YSS, 0.78±0.06 N m; OMS, 0.54±0.05 N m) from FC to KJMAX were reduced in OMS compared to YSS. Step
length (YSS, 0.73±0.03 m, OMS, 0.59±0.02 m) was reduced in OMS compared to YSS.
Figure 1: MoS related measures at CR, FC and KJMAX.
Figure 2: Trunk kinematics at CR, TO, FC and KJMAX. Trunk angle (r=0.54) and step length (r=-0.55) were correlated with MoS at FC. The highest correlated variable with MoS at KJMAX was MoS at FC (r=0.88). Table 1: Prediction of MoS at FC and at KJMAX using kinetic, kinematic and stability related measures. Y variable Co-efficients X variable R2 SEM MoS at FC A1 -0.004 X1 Trunk flex. angle
0.51 0.07 A2 0.338 X2 Step length A3 A4 -0.109 MoS at KJMAX A1 1.132 X1 MoS at FC
0.84 0.06 A2 0.002 X2 Knee flex. angle A3 0.084 X3 Peak knee A4 -0.142 ext. moment
CONCLUSIONS MoS was reduced at FC and KJMAX in OMS compared to YSS, and in OMS compared to OSS. Differences in spatial, kinematic and kinetic factors were apparent for YSS versus OMS but not for OSS versus OMS. Kinematic and kinetic factors underlying group differences in MoS during balance recovery were identified. REFERENCES 1. Arampatzis A, et al. J Biomech 41: 1754-61, 2008. 2. Thelen DG, et al. J Gerontol A Biol Sci Med Sci 52:
M8-13, 1997. 3. Hof AL, et al. J Biomech 38: 1-8, 2005.
CR FC-0.3
-0.2
-0.1
0
0.1
0.2
KJMAX
A
MoS
[m]
FC0
0.4
0.8
1.2
KJMAX
B
BoS
[m]
CR FC0
0.4
0.8
1.2
KJMAX
C
XC
M [m
]
YSSOSSOMS
CR FC0
0.4
0.8
KJMAX
D
PC
M [m
]
CR FC0
0.4
0.8
1.2
KJMAX
E
VC
M [m
.s-1
]
CR FC0
1.6
3.2
4.8
KJMAX
F
g/l [
s-1]
CR TO FC10
20
30
40
KJMAX
Trun
k fle
xion
ang
le [d
eg]
A
YSSOSSOMS
CR TO FC-30
0
30
60
90
120
KJMAX
Trun
k fle
xion
ang
ular
vel
ocity
[deg
/s] B

Proceedings of the 7th Australasian Biomechanics Conference, Griffith University, November /December 2009
37
LONG-TERM BILATERAL STIMULATION OF THE PEDUNCULOPONTINE NUCLEUS IMPROVES BALANCE AND GAIT STABILITY AND ALLEVIATES FALLS IN PARKINSON’S DISEASE
1, 2 Graham Kerr, 1, 2 Michael Cole, 1, 3 Robert Wilcox, 4 Felicity Sinclair, 4 Terry Coyne and 1, 4, 5 Peter Silburn
1 Institute of Health & Biomedical Innovation, Queensland University of Technology, Brisbane, QLD
2 School of Human Movement Studies, Queensland University of Technology, Brisbane, QLD 3 Prince Charles Hospital, Brisbane, QLD
4 St Andrews Hospital, Brisbane, QLD 5 University of Queensland Centre for Clinical Research, Brisbane, QLD
INTRODUCTION Postural instability, freezing of gait and falls have a high occurrence (>40%) in Parkinson’s disease (PD) patients [1,2]. Falls are the most common occurrence for emergency room visits and the largest contributor to health care costs in PD. Freezing of gait off medication is typically treated with dopaminergic medication and deep brain stimulation (DBS) of the subthalamic nucleus (STN) and globus pallidus interna (GPi). However, some PD patients have problems in gait and freezing on medication, which is refractory to usual treatments. The pendunculopontine nucleus (PPN) is a known locomotor centre that has a possible role in mechanisms of axial symptoms and postural instability in PD. The PPN contains mainly cholinergic neurons and constitutes a different movement control pathway from that of the dopaminergic system [3]. The aim of this study was to determine the effectiveness of DBS of the PPN on stability and gait in Parkinson’s disease patients. METHODS Six PD patients (63-73 yrs) whose predominant disability related to gait stability and function were selected for PPN DBS. Duration with PD ranged from 8-18 years. Patients were levodopa responsive but drug refractory. Patients were clinically examined pre- and post-surgery by a neurologist and assessed on the UPDRS part III and the freezing of gait (FOG) questionnaire. A six camera motion analysis system (Peak Motus, 50 Hz) was used to track the position of 28 skin-based markers during walking on a firm surface. Participants performed
each trial (n = 6) in a barefoot condition and at a comfortable and self-selected walking speed. A full-body, linked-segment model was generated and was used to derive temporospatial characteristics (e.g. stride length, cadence, walking velocity) and 3D joint kinematics in the sagittal plane. Patients were assessed using these same procedures pre- and post-surgery (six weeks to two years following surgery). RESULTS AND DISCUSSION There was a 65% improvement in FOG (Fig. 1), reduction in the number and duration of freezing episodes (gait initiation and during gait), and a commensurate reduction in falls. Patients walked with the same cadence, but demonstrated reduced double-support time and increased stride length and walking speed post-operatively (Fig.1). Similarly, the range of hip, knee and ankle motion was increased following the procedure and was likely related to the increase in stride length. CONCLUSIONS DBS targeting of the PPN provides significant improvement of stability and gait performance. The PPN appears to be a viable target for DBS in PD patients with predominantly gait and stance stability problems. ACKNOWLEDGEMENTS Financial support was received from a QUT seeding grant. REFERENCES 1. Giladi N, et al. Neurology 56:1712-21, 2001. 2. Pickering RM, et al. Mov Disord 22: 1892-900, 2007. 3. Jenkinson N, et al. Mov Disord 24: 319-28, 2009.
Figure 1: Gait parameters pre (solid) and post (lines) DBS surgery.

38
IMPROVED ESTIMATION OF CENTRE OF MASS KINEMATICS FOR POSTUROGRAPHIC ANALYSIS
Mark A Jaffrey and Russell J Best
School of Exercise & Sport Science & Centre for Ageing, Rehabilitation, Exercise and Sport Science, Victoria University email: [email protected]
INTRODUCTION Whole body centre of mass (CM) kinematics in the horizontal plane can be used to analyse postural stance. Utilising only Ground Reaction Force (GRF) data from a force plate, CM kinematics can be estimated using the integration approach (IA). This involves double numerical integration of the acceleration-time history of the CM (e.g. [1]). The two integration constants formed by this process (viz. initial position and initial velocity of the CM) need to be known or estimated to complete this method. The accuracy of the IA is dependent upon the accuracy of the integration constants and the accuracy of the GRF data. Many variations of the IA have been proposed over recent years. Jaffrey [2] judged the zero-point-to-zero-point (ZPZP) methods of representing antero-posterior (A-P) CM trajectory [3,4] to be the most promising integration approaches for posturographic analysis. The fundamental premise upon which the ZPZP methods are based is that, during stance, the vertical projection of the A-P CM and the centre of pressure (COP) coincide whenever the A-P GRF is momentarily zero (i.e. at ‘Zero Points’ or Instant Equilibrium Points, IEPs). Although not stated by previous exponents of this method [1,3,4], this piecewise approach appears to produce discontinuities in the CM velocity-time history at the IEPs. METHODS Modifications to the ZPZP method [4] were made and compared. One modification (a) involved detrending the A-P GRF-time history whereas another (b) involved including an optimised A-P GRF measurement offset error term. Yet another (c) also included optimised ‘tolerance’ parameters that allowed A-P CM and COP displacements to vary by up to 1 mm at the IEPs. A single subject completed six stance trials ranging in duration from 11.0 to 12.3 s. Various static head and neck flexion and extension orientations were adopted within each of these trials. AMTI force plate data was captured at 1000 Hz and low-pass filtered at a cut-off frequency of 8 Hz. RESULTS AND DISCUSSION Figures 1a, b and c show an indicative CM velocity-time history for one of the trials for the modified ZPZP methods. These figures confirm the discontinuous nature of the CM velocity-time history produced by these methods. Much smoother, more realistic CM trajectory was produced by the modified ZPZP optimisation methods. An optimised A-P GRF measurement offset error term (Fig. 1b) produced better results than simply detrending A-P GRF data (Fig. 1a). The further inclusion of optimised ‘tolerance’ parameters produced the best results (Fig. 1c). However, small discontinuities remain.
Figure 1: A-P CM velocity-time history for the modified ZPZP methods. CONCLUSIONS The modified methods proposed in this study produced more realistic representations of CM kinematics derived only from force plate data, compared with the source method [4]. The additional step of applying smoothing splines would produce continuous data and may produce data that is more representative of CM behaviour. REFERENCES 1. Zatsiorsky VM, et al. J Biomech 31: 161-4, 1998. 2. Jaffrey MA, PhD Thesis, Victoria University, 2008. 3. King DL, et al. Gait Posture 6: 27-38, 1997. 4. Zatsiorsky VM, et al. Motor Control 4: 185-200, 2000.

Proceedings of the 7th Australasian Biomechanics Conference, Griffith University, November /December 2009
39
COMBINING BIOMECHANICS AND SKILL ACQUISITION: THE HOCKEY DRAG FLICK
1John Baker, 2Bruce Elliott, 1 Damian Farrow, 2Jacque Alderson
1 Australian Institute of Sport 2 The University of Western Australia
email: [email protected] INTRODUCTION Combining biomechanics with its logical associate skill acquisition has been an underutilised partnership particularly in elite sport [1]. The aim of this study was to provide empirical biomechanical data on the hockey drag flick and feed it into a progressive temporal occlusion paradigm for the testing and preparation of Olympic hockey goalkeepers. In addition the study was designed to evaluate expert-novice differences in goalkeeprs ability. The temporal occlusion paradigm has been one of the prime experimental methods to examine perceptual expertise in time restricted sports requiring anticipation [2, 3]. METHODS To obtain the highest quality and homogeneity of data possible the participants consisted of seven international level male players (five senior international level players and two under 21 international level players). These players represented the entire available population of elite drag flickers in Australia as such the number of participants was limited to these players. Three dimensional (3D) movement of the players were captured using a 12 camera VICON system operating at 250 Hz. The University of Western Australia model [4] was used to calculate full body kinematics. Players performed repeat trials to each corner of the goals. The expert goalkeeper group consisted of six international level players at the senior (4) and under 21 (2) level. A novice group consisted of 10 undergraduate university students with no prior hockey experience. The visual stimuli presented to the participants were that of an international level performing penalty corner drag flicks to the four corners of the goals. One hundred trials were presented to the participants across five different temporal occlusion periods (TOPs) (4 corners x 5 TOPs x 5 Trials). From the 3D analysis significant kinematic events were identified and the corresponding time periods were used to guide the determination of the occlusion series. RESULTS AND DISCUSSION Significant kinematic differences were evident at release, 0.12 s prior to release and 0.36 s before release. Based on these findings the occlusion period was set at 0.12 s to enable five occlusion periods. Both expert goalkeepers and novices demonstrated significant information pick-up in the progressive occlusion periods bounded between t3-t4 and t4-t5 (see Figure 1), with the expert goalkeepers’ prediction performance being significantly better than the novices at a time-point consistent with T4. This relatively late pick up of meaningful information in the event sequence highlights that observable differences occur very late in the movement pattern. For instance, kinematic analyses of the penalty corner drag flick action reveal that there is an
average of 5˚ difference in foot alignment at release depending on drag flick direction suggesting that what anticipatory cues are available are quite subtle and are only used by the expert keepers.
Figure 1: Prediction accuracy as a function of skill level and time of occlusion, data collapsed across display condition. CONCLUSIONS While the expert goalkeepers’ prediction performance was superior to that of the novices, both groups were found to pick up information relatively late in the penalty corner drag flick sequence, highlighting that the availability of advance information is relatively limited in this particular time-stressed skill. This finding highlights the need for future research to more closely consider the relative contribution of pre-release kinematic information to anticipatory skill in perception-action coupled settings. The use of quantitative biomechanical data is recommended when constructing occlusion paradigms as it potentially enriches the quality of the visual stimuli. ACKNOWLEDGEMENTS Barry Dancer, National and AIS Men’s Hockey Coach 2001-08; Players of the National Men’s Hockey team the Kookaburras REFERENCES 1. Buttfield A, et al. Int J Sport Psychol: In press. 2. Abernethy B & Russell DG. J Sport Psychol 9: 326-45,
1987. 3. Müller S, et al. Q J Exp Psychol-A 59: 2162-86, 2006. 4. Lloyd DG, et al. J Sport Sci 18: 975-82, 2000.

40
3-DIMENSIONAL KINEMATIC ANALYSIS OF THORAX AND PELVIS MOTION DURING THE DOWNSWING OF MALE AND FEMALE SKILLED GOLFERS
Sean Horan, Kerrie Evans, Norman Morris and Justin Kavanagh
School of Physiotherapy and Exercise Science, Griffith University, Australia email: [email protected]
INTRODUCTION Despite being a complex and continuous movement task, golf swing kinematics have most frequently been described for skilled male golfers at discrete points during the swing [1, 2]. Such discrete analyses, which have commonly focused on uni-planar motion of the thorax and pelvis, may fail to reveal the dynamics of the downswing motion. Furthermore, some researchers have suggested that it is the coordinated motion of the thorax and pelvis, which plays a significant role in generating high clubhead speeds observed in the swings of skilled golfers [1]. To date comprehensive 3-dimensional data for the thorax and pelvis has yet to be reported and only limited swing data relating to skilled female golfers exists. Therefore, the purpose of this study was to profile the 3D kinematics of the thorax and the pelvis during the downswing, and determine if gender-differences exist in skilled golfers. METHODS 19 males (26 ± 7 yrs) and 19 females (25 ± 7 yrs) with mean handicaps of 0.6 ± 1.1 and 1.3 ± 1.6 respectively, volunteered for this study. Prior to the experimental trials, each subject performed a standardized 10 minute warm-up based on a program reported previously by Fradkin and colleagues [3]. Subsequently, five trials were collected where subject’s hit reflective golf balls using their own driver from an artificial grass mat, into a net 5 m away. Three-dimensional marker trajectories were collected using a Vicon® motion analysis system (Oxford Metrics Ltd, Oxford, UK), consisting of eight MX 13 near-infrared cameras, at a sampling rate of 500 Hz. A customized kinematic model was written using Vicon® BodyBuilder version 3.6 software. A local coordinate system (LCS) was created based on the alignment of the subjects feet at address. Thorax and pelvis motion were subsequently calculated with respect to this LCS. Data analysis was restricted to the downswing phase, defined as the period from the top of backswing (TBS) to ball contact (BC).
Dependent variables included peak amplitude, and amplitude at TBS and BC of 3D linear displacement, angular displacement, and angular velocity of the thorax and pelvis; and peak amplitude and timing of X-Factor angle, X-Factor angle velocity, and hand and clubhead speed. RESULTS AND DISCUSSION At BC males exhibited greater thorax anterior tilt and thorax lateral tilt to the right and greater pelvis lateral tilt to the right compared to females. Males also had greater angular velocity for thorax posterior tilt and lateral tilt to the right and pelvis posterior tilt and lateral tilt to the right at BC. Hand, clubhead, and ball speed were significantly greater for males compared to females. CONCLUSIONS Male and female skilled golfers have different kinematics for thorax and pelvis motion in the anterior-posterior and lateral directions. The lack of gender differences identified for axial rotation, may indicate that thorax and pelvis motion in the anterior-posterior and lateral directions is an important contributor to the higher clubhead speeds observed in males. What might be considered optimal swing characteristics for male golfers cannot be generalized to female golfers. REFERENCES 1. Burden AM, et al. J Sports Sci 16:165-76, 1998. 2. Egret CI, et al. Int J Sports Med 27:463-7, 2006. 3. Fradkin AJ, et al. Br J Sports Med 38:762-5, 2004.

Proceedings of the 7th Australasian Biomechanics Conference, Griffith University, November /December 2009
41
AN INVESTIGATION INTO THE EFFECT OF VISUAL TARGETING IN A RUN UP AND LAND TASK ON LOWER LIMB MUSCLE ACTIVATION
1 Jessica Seater, 1 Natalie Saunders and 1 Leonie Otago
1 University of Ballarat, Victoria, Australia
email: [email protected]
INTRODUCTION Previous research has collected kinetic data during a task that involves an approach phase toward a force plate in order to for example, inform injury prevention practice [1]. It is unknown if the use of visual targeting in such tasks affects neuromuscular activation in the lower limb to ensure an accurate land on a force plate. This may not accurately reflect real life tasks where targeting is rare, affecting the ecological validity between research and real life environments as well as the results of prior research. It has been reported that no significant differences in kinetics exist when comparing targeting and non-targeting conditions during walking [2,3]. However, it has been shown that kinetics can remain unchanged while muscle activity can show significant change between conditions [4]. Therefore, the purpose of this research was to compare muscle activation during a run up and leap land task between targeting and non-targeting conditions. METHODS Surface electromyography was used to measure onset of muscle activation and duration during a typical netball landing (run up and leap land) for rectus femoris (RF), vastus medialis (VM), vastus lateralis (VL), gluteus medius (GM), medial hamstrings (MH) and biceps femoris (BF) muscles in 15 skilled female netballers. Muscle onset and subsequently offset, was defined as activity greater than baseline levels for a period of at least 10ms. A thin carpet covering was placed over a force plate and surrounding run up area in both non-targeting and targeting conditions. In the targeting condition “L” shaped cardboard templates were added to the corners of the force plate, and the non-targeting condition was performed first to prevent participants learning the location of the force plate. Participants were instructed to break from a defender, run toward the force plate as if leading for a pass, leap land while catching a ball passed from directly in front of them, followed by a pivot and pass back behind them. A valid land was considered one where the participant leap landed with full foot contact onto the force plate. Monitoring of this was performed using a closed circuit video feed with the location of the force plate marked on a screen. Participants repeated the condition until 10 valid lands had been performed for each condition. A linear mixed model was used to compare results in targeting and non-targeting conditions with an alpha level set at .05. RESULTS AND DISCUSSION It was found that all muscles were activated for a longer duration in the non-targeting condition than the targeting condition (Fig 1) with the VM (p = 0.001), VL (p = 0.011), GM (p = 0.027) and the BF (p = 0.008) muscles showing a statistically significant increase in duration times in the non-targeting condition. This difference suggests that the body may be using a generalised co-activation strategy to
perform the landing and prevent injury [5] rather than a selective activation strategy.
Figure 1: Overall mean duration times and standard deviations for each muscle (ms). * denotes statistical significance at p = <.05. While non-significant, there was a trend for all muscles to be activated earlier in the non-targeting condition than the targeting condition, with the exception being the RF muscle (Fig 2).
Figure 2: Overall mean onset times and standard deviations for each muscle (ms). CONCLUSIONS It is possible that the observed earlier and longer activations suggest that a generalised co-activation strategy is used during non-targeting conditions. Therefore, the use of visual targeting in the present study shows different muscle activation strategies to those used when not visual targeting. REFERENCES 1. Otago L. J Sci Med Sport 7: 85-95, 2004. 2. Wearing SC, et al. Clin Biomech 15: 583-91, 2000. 3. Grabiner MD, et al. J Biomech 28: 1115-7, 1995. 4. Cowling EJ & Steele JR, J Bone Joint Surg 83A: 38-
41, 2001. 5. Bessier TF, et al. Med Sci Sport Exer 35: 119-27, 2003.
* * **

42
EMG, FORCE AND KINEMATICS BETWEEN CONCENTRIC AND ECCENTRIC CONTRACTIONS OF A CHIN UP EXERCISE
Kenji Doma and Glen Deakin
Institute of Sport and Exercise Science, James Cook University, Australia
email: [email protected]
INTRODUCTION The movements during isointertial resistance exercises are typically executed with concentric and eccentric contractions to perform the movement pattern of the exercise (1). Numerous studies have shown a higher electromyography (EMG) response during concentric compared to eccentric contractions (2, 3 and 4). However, the exercises incorporated in these studies have been limited to single-joint movements, and subsequently, only one muscle group at a time has been examined. In addition, the magnitude of force production and the displacement of body segments have yet to be compared between concentric and eccentric contractions of multi-joint exercises in literature. Consequently, the purpose of this study was to compare the level of muscle activity (MA) between concentric and eccentric phases of a multi-joint exercise, such as a chin-up (CH), and to determine whether tensile force production (TFP) and the kinematics of the exercise would affect the characteristics of MA. METHODS Eleven resistance trained males (age 25.5 ± 7.5 years, height 1.78 ± 0.76 m, weight 81.7 ± 11.4 kg) performed five sub-maximal repetitions of CH. The middle three repetitions were examined to compare the average level of MA, TFP and displacement between the concentric and eccentric phases. Maximal voluntary contractions were conducted to normalize root-mean squared electromyography values (NrmsEMG) of the pectoralis major, latissimus dorsi, biceps brachii, triceps brachii, rectus abdominus and erector spinae. The angular displacement of the back and the horizontal displacement of the shoulder and seventh cervical vertebrae (C7) were obtained via kinematic analysis. The TFP was obtained by attaching a load cell (force transducer) between the support and a custom built chin up bar. The NrmsEMG, kinematic and TFP values were analysed using a repeated measures ANOVA. RESULTS AND DISCUSSION The NrmsEMG of pectoralis major, biceps brachii, triceps brachii, erector spinae and latissimus dorsi, the TFP and the horizontal displacement of the shoulder and C7 were significantly greater during the concentric compared to the eccentric phase for the CH (p < 0.05). There were no significant differences in NrmsEMG of rectus abdominus and angular displacement of the back between the concentric and eccentric phases for the CH (p > 0.05).
The NrmsEMG of the majority of the selected muscle groups and the TFP during concentric was significantly greater than the eccentric phase. These similar patterns of change for TFP and NrmsEMG between the two types of contraction suggest that the magnitude of load is related to the level of muscle activity (5), supporting the linear EMG-force relationship (6). The greater level of MA during the concentric phase may be due to the muscle fibres producing greater force with eccentric contractions (7), and subsequently, the level of MA during the eccentric does not have to match that of the concentric phase to produce the same magnitude of force. In addition, the overcoming of inertia during the lifting phase, a factor which is absent during the lowering phase, may explain the greater TFP and MA during the concentric compared to the eccentric phase. The displacement of the shoulder and C7 in the sagittal plane was greater during the concentric compared to the eccentric phase. These kinematic differences are expected since CH is an open-kinetic chain exercise, where the lower extremity is free to move in any cardinal plane. Subsequently, as greater movement occurred during the concentric phase, the level of MA of the selected muscle groups may have been higher in order to stabilize the body. The subjects may have also pulled against the chin-up bar with greater force in order to stabilize the body, producing greater TFP during the concentric phase. CONCLUSION The results indicated that the level of MA is greater during the concentric compared to the eccentric phases of the CH for the majority of the selected muscle groups. These differences appear to be due to the alteration in TFP as well as differences in the displacement of the body segment movements between the concentric and eccentric phases. REFERENCES 1. Rall JA. Exerc Sport Sci Rev 13: 33-74, 1985. 2. Clark BC, et al. Am J Phys Med Rehabil 86: 373-9,
2007. 3. Del Valle A, et al. Muscle Nerve 32: 316-25, 2005. 4. Grabiner M, et al. Exp Brain Res 145: 505-11, 2002. 5. Rodriques JA, et al. Electromyogr Clin Neurophysiol,
43: 413-9, 2003. 6. Fuglevand A, et al. J Neurophysiol 70: 2470-88, 1993. 7. Altenburg TM, et al. J Appl Physiol 103: 1752-6, 2007.

Proceedings of the 7th Australasian Biomechanics Conference, Griffith University, November /December 2009
43
THE EFFECT OF A LOWER-BODY GRADED COMPRESSION GARMENT ON THIGH AND CALF WIDTH CHANGES DURING ERGOMETER CYCLING
1 Dayne Walker, 1 Peter Clothier, 1 Colin Strachan, 1 Barry Ridge, 2 Jason McLaren and 1 Robert Robergs
1 University of Western Sydney 2 iSPORT Biomechanics
email: [email protected]
INTRODUCTION Much research has been performed into the physiological benefits of graded compression garments however, conjecture exists around their mechanical properties and biomechanical benefits when used during sport and exercise. Despite a growing body of research examining the use of graded compression garments in sport settings, research into their effects in reducing soft tissue oscillation and movement during exercise has been limited to impact activities such as maximal countermovement jump [1] and maximal vertical jump [2]. Therefore, a need exists for similar research to be performed in minimal or non-impact activities such as cycling. The aim of this investigation was to determine whether the application of a lower-body graded compression garment reduced anterior-posterior thigh and medial-lateral calf width changes during short-duration bouts of ergometer cycling at varied intensities and cycling postures. METHODS Seventeen participants (14 male, 3 female) completed four, two minute cycling conditions varying in intensity, and cycling posture (see Table 1.) under two experimental conditions: no-garment (control); and garment (intervention). Participant thigh and calf soft tissue width changes (range) were measured by digitising three selected locations on each the lateral thigh and posterior calf throughout one complete crank cycle. Width range for the three locations on the thigh and calf were combined, respectively, and compared between the experimental conditions.
RESULTS AND DISCUSSION Thigh and calf width range data for both the garment and no-garment condition were analysed using a within groups repeated measures analysis of variance (ANOVA) with Sidak adjustment for multiple comparisons. Using an alpha level of 0.05, the difference between garment and no-garment width range for the thigh; cycling condition 1 (p<0.05) and 3 (p<0.05), and calf; cycling condition 1 (p<0.05), 2 (p<0.05), 3 (p<0.05), and 4 (p<0.05), were significant. In addition, the difference between no-garment seated and standing width range for the thigh (p<0.001) and calf (p<0.001) were significant. Descriptive statistics for thigh and calf width range are shown in Table 1. CONCLUSIONS This study demonstrated that lower extremity soft tissue width changes (oscillations) exist in ergometer cycling and that the application of a lower-body graded compression garment produced significant reductions in anterior-posterior thigh and medial-lateral calf width range under various cycling conditions. It is hypothesised that this reduction in leg width range may assist in decreasing energy expenditure by limiting unwanted muscle movement and/or decrease the wearer’s risk of muscular injury especially during times of fatigue. ACKNOWLEDGEMENTS The authors would like to thank the University of Western Sydney for funding this project, Skins™ for supplying their product, and the subjects who volunteered to participate. REFERENCES 1. Doan BK, et al. J Sports Sci 21: 601-10, 2003. 2. Kraemer WJ, et al. Sports Med Train Rehabil 8: 163-
84, 1998. Table 1: Mean participant aggregate anterior-posterior thigh and medial-lateral calf width range (cm) for the no-garment and garment conditions (mean ± SD).
Thigh Calf No garment Garment No garment Garment
Cycling Condition Mean SD Mean SD Mean SD Mean SD 1 – Seated/2.5kp/90rpm 11.29 1.38 10.26 1.22 6.37 1.02 5.87 0.89 2 – Standing 2.5kp/90rpm 9.74 1.37 10.48 1.74 8.05 1.30 7.37 1.14 3 – Seated/4kp/60rpm 11.88 1.66 10.95 1.54 6.56 0.88 6.04 0.93 4 – Seated/2kp/110rpm 10.62 1.30 9.72 0.98 6.67 1.02 5.98 0.97

44
CONCURRENT VALIDITY OF AN ACCELEROMETER TO QUANTIFY VIBRATION PLATFROM FREQUENCY
C Joseph and T Furness
Centre of Physical Activity Across the Lifespan, The Australian Catholic University
email: [email protected]
INTRODUCTION Vibration platforms are used to deliver whole-body vibration to an individual. Depending on the specifications of the platform, frequency (Hz) may be manipulated to affect intensity of whole-body vibration. Frequency should be accurately reported in literature to enable replication in the laboratory and field. Such information is under researched. Measurement of frequency can occur in the laboratory with VICON, but portable, light weight and inexpensive measurement instruments are desired in the field. The purpose of this study, therefore, was to concurrently validate a portable accelerometer with the VICON motion analysis system. METHODS Two sea-saw vibration platforms were used; VibroTrainerCommercial and VibroTrainerSemi-Commercial (Amazing Super Health, AUS). The platforms were 2009 models. Vertical data were concurrently recorded with a three-dimensional motion analysis system (VICON Oxford Metrics, Oxford UK, six cameras, 500 Hz) and a tri-axial accelerometer (Crossbow Technology, San Jose, USA, 500 Hz). Data were recorded for five seconds during steady-state for three vibration platform speeds. After normality testing, 95% limits of agreement were computed to describe concurrent validity between the accelerometers and VICON. RESULTS & DISCUSSION Descriptive statistics are shown in Table 1: The difference in vibration platform frequency was less than ± 0.50 Hz between VICON and a tri-axial accelerometer. The results of limits of agreement computed are shown in Figure 1. The 95% limit of agreement of the difference between the two measurement instruments was between 2.07 Hz or -2.13 Hz for each platform speed.
Figure 1: VICON and tri-axial accelerometer CONCLUSIONS In order to prescribe vibration treatment platform frequency must be known. The preliminary study establishes the concurrent validity of a tri-axial accelerometer. When used in the field, researchers should consider vibration platform frequency measured with the tri-axial accelerometer to be within ±2 .5 Hz of actual frequency established by a gold standard measurement device.
Diffe
renc
e (V
ICO
N-Ac
cele
rom
eter
) (Hz
)
3.00
2.00
1.00
0.00
-1.00
-2.00
-3.00
2.07
-2.13
Average of VICON and Accelerometer (Hz)30.0025.0020.00
Table 1: Descriptive Statistics of a Tri-axial Accelerometer to VICON for various vibration platform speeds. Platform speed Hz (± SD) Mean difference
(VICON-Accelerometer) 95% Limit of Agreement
20 VICON 19.92 (0.24) 0.19 Hz -2.13 Hz and 2.07 Hz Accel 19.73 (0.50)
25 VICON 24.88 (0.38) 0.42 Hz Accel 24.46 (1.85)
30 VICON 29.78 (0.78) -0.38 Hz Accel 30.16 (0.90)

Proceedings of the 7th Australasian Biomechanics Conference, Griffith University, November /December 2009
45
ESTABLISHING THE ACCURACY OF 3-D ULTRASOUND DETERMINED HJC WITH MRI
1,2,3 Alana Peters, 1,2 Morgan Sangeux, 2,3 Meg Morris and 1,2 Richard Baker
1 Hugh Williamson Gait Lab, Royal Children’s Hospital, Melbourne 2 Gait CCRE, Murdoch Children’s Research Institute, Melbourne
3 The School of Physiotherapy, The University of Melbourne, Melbourne email: [email protected]
INTRODUCTION The validation of biomechanical models for gait analysis is an important process. Kinematic fitting and functional calibration techniques can be validated by comparing predictions of hip joint centre (HJC) location with 3-D imaging techniques. An advantage of functional calibration techniques is that they accurately predict the position of HJC in relation to the pelvis marker set. Previous work compared kinematic results with invasive x-ray radiographs [1] or magnetic resonance imaging (MRI) [2], but these are time consuming processes. Hicks and Richards [3] suggested an agreement between functional calibration and 3-D ultrasound (3-DUS) measurements, but, they did not validate the ultrasound techniques. This study extends the Hicks and Richards approach by using a full 3-D reconstruction of the ultrasound data and validating this technique against a gold standard of MRI scans. This study provides a basis for the validation of new lower limb kinematic modelling techniques. 3-DUS could be used in evaluating new kinematic models for clinical use. METHODS Twenty healthy subjects participated in the study with a mean age of 35±18 years and BMI of 23.5±4.3 kg/m2. Participants had a MRI scan of PD-weighted Fast Spin Echo images in a 3T Siemens Trio (Erlangen, Germany). They then had a 3-DUS scan of their pelvis to identify anatomical landmarks used for marker placement, and the femoral heads, using a Beamformer Echo Blaster 128-IZ (Vilnius, Lithuania). To determine the HJC our protocol used the 2-D ultrasound images reconstructed in 3-D space. This was achieved by the simultaneous use of the 3-DUS imager with a 3-D tracking system able to locate the position and orientation of the ultrasound probe. For this purpose, markers were rigidly attached to the ultrasound probe. Data from the largest participant were noteworthy outliers. The inter-HJC error was three times greater than the nearest participant. For this reason, the data is not included in the statistical analysis. RESULTS AND DISCUSSION The primary parameter investigated was the difference between 3-DUS and MRI inter-HJC distance (Fig 1). MRI and 3-DUS agreement was excellent for inter-HJC distance where the average error was 4.0±2.3mm. The 95% C.I. was (3.0, 5.0). Figure 1 shows the spread of the error in the 3-D location of the HJC, and each individual axis. The total 3-D location error between MRI and 3-DUS was 23.0±12.4mm with a 95% confidence interval of (18.5, 25.2). The greatest axial error was observed in the x-axis (A-P). The y-axis (M-L) and z-axes (S-I) both showed less error, however this was greater than the inter-HJC distance error. It was thought that some of the 3-D location error may be due to the pelvic frame definition for the 3-
DUS. It was recognised that MRI scans were obtained in supine and the ultrasound scans were collected in standing.
Figure 1: Box-plot of parameters investigated. Given the rigidity of inter-HJC distance measurement between MRI and 3-DUS, results were investigated to determine whether a statistically significant difference exists between the methods (Fig 2).
Figure 2: Bland & Altman plot of inter-HJC distance. The plot indicates strong evidence to support the hypothesis that there is no significant difference between MRI and 3-DUS. A weak correlation was also determined between BMI and error between 3-DUS and MRI (r < 0.5). CONCLUSIONS This study shows 3-DUS is a suitable gold standard measure of 3-D location of bony anatomy such as the femoral head. REFERENCES 1. Leardini A, et al. J Biomech 23: 99-103, 1999. 2. Sangeux M, et al. Clin Biomech 21: 984-91, 2006. 3. Hicks J & Richards J. Gait Posture 22: 138-45, 2005.

46
SCALING TENDONS PRESERVING THE CONSISTENCY OF EMG-TO-ACTIVATION RELATIONSHIP
1,2 Massimo Sartori, 2 David G. Lloyd, 3 Monica Reggiani, 4 Gaetano Chemello and 1,4 Enrico Pagello
1 Dept of Inf. Eng. and 3 Dept of Tech. and Management, University of Padova, Italy 2 School of Sport Science Exercise and Health, University of Western Australia
4 Institute of Biomedical Engineering, National Research Council, Italy email: [email protected]
INTRODUCTION Neuromusculoskeletal (NM) modeling is a powerful tool for understanding how the nervous system controls muscles to generate movements. To scale NM models to different subjects we must include physiological parameters that caracterize individual muscle properties. Most of them cannot be measured directly unless invasive or expensive approaches are adopted. This paper presents a rapid method for estimating muscle tendon slack lengths for muscles crossing the knee. METHODS Tests involved collecting EMG signals and the net knee flexion-extension moment during isometric tasks. The recorded muscles were: vastus medialis, vastus lateralis, rectus femoris, semimembranosus, semitendinosus, biceps femoris. Trials were performed at different knee angles. The idea is to modify the tendon slack length for every muscle in such a way the computation of the muscle activation based on the EMG signal for a specific muscle is consistent for all joint angles. From the net knee moment recorded from each trial, we solved the force sharing problem to estimate the contribution of individual muscles. We used two different approaches: the first was based on the method described in [1] where muscles are assumed to share the load by minimizing the total endurance. In the second method we used the NM model developed by Lloyd et al. to predict muscle forces thus not making any assumption on load sharing behaviour [2]. Muscle activation was then derived from the estimated muscle force as follows:
mmA
mmP
m
FlfFlfFua
0
0
)~()~()( −
= (1)
where mF is the estimated muscle force, ml~ is the normalized fibre length, mF0 is the maximum isometric force, while Af and Pf are the active and passive force-length relationships respectively. For each trial, a table per muscle is created in which data is stored, including: raw EMG, muscle fibre length and muscle activation as derived from eq. 1. For a particular muscle i, data from the
thk trial is stored in the table entry kih , relative to the
excitation kiu , : Suh kiki ,, = , where S is the interval width of each entry. Those tables relate each level of excitation to the corresponding activation which has been arranged as in eq. 1 and is thus dependent on the tendon slack length (affecting the fibre length).
The relationship between muscle excitation and activation should be consistent for a specific muscle over all trials. The tendon slack length is tuned to preserve this consistency. RESULTS AND DISCUSSION Figure 1a shows a significant discrepancy between the EMG-to-activation relationship over different angles when the subject’s geometry is not taken into account. Figure 1b shows the same relationship after calibration. The EMG-to-activation relationship is preserved over all trials. When deriving muscle forces using the NM model, a perfect match between the recorded net knee moment and the estimated one cannot be achieved. We therefore scaled each muscle force by: ER TT where RT and ET are the knee reference torque and the estimated one respectively. This allows us to obtain force estimates that generate the actual reference joint torque and preserve the force sharing predicted by the NM model. Forces were scaled so that the corresponding activation level was always between 0 and 1.
(a) (b)
Figure 1: EMG-to-activation relationship for the semitendinosus muscle before (a) and after (b) the calibration process. Data are relative to flexion isometric contractions. CONCLUSIONS We presented a computational inexpensive method for scaling tendons that relies on preserving the strong relationship existing between excitation and activation. We suggested an approach that does not make any a priori assumption on muscles behaviour in sharing load. This, in particular, has to be further validated. Future research will further assess our approach using ultrasound technology. REFERENCES 1. Schappacher-Tilp G, et al. J Biomech 42: 657-60,
2009. 2. Lloyd DG & Besier TF. J Biomech 36: 765-76, 2003.

Proceedings of the 7th Australasian Biomechanics Conference, Griffith University, November /December 2009
47
MRI VERIFICATION OF THE ACCURACY AND RELIABILITY OF FUNCTIONAL METHODS OF GLENOHUMERAL JOINT CENTRE OF ROTATION IDENTIFICATION
1,2 Amity Campbell, 1 Jacqueline Alderson, 1 David Lloyd and 1 Bruce Elliott
1 School of Sport Science, Exercise and Health, The University of Western Australia 2 School of Physiotherapy, Curtin University of Technology
email: [email protected]
INTRODUCTION The identification of the Gleonohumeral Joint Centre of Rotation (GHJ) is critical for upper limb three dimensional (3D) motion analyses. Functional methods rely on a kinematic movement trial and are the recommended method of GHJ identification during 3D motion analysis with surface landmarks [7]. However a single, fixed point of rotation that is equivalent to the centre of the humeral head, has only been demonstrated on cadavers [6]. Therefore, the error associated with the upper arm soft tissue artifact that may occur during the kinematic movement trial is unknown. This investigation compared the single, fixed GHJ location calculated from a representative sample of currently used functional algorithms, with the magnetic resonance image (MRI) determined GHJ location. METHODS Ten healthy males provided informed consent and participated in this study. Clusters of three markers were affixed to their dominant upper arm and acromion process prior to MRI scanning at Perth Radiological Clinic (Subiaco, Western Australia). These makers were made to be visible in both imaging systems. The subjects laid supine with their upper arm secured next to their torso. Immediately following imaging the participants were transported to the biomechanics laboratory where a kinematic analysis was performed using a Vicon motion analysis system (250Hz). The laboratory data collection included one static trial and the performance of the previously validated gold standard movement trial for functional algorithms [1]. This kinematic data collection was repeated four times, with different testers applying the markers. The centre of the humeral head and markers were identified in each MRI with specialized software (Mimics, Materialise Inc.), following a previously described process [2]. The kinematic data were filtered with a low pass Butterworth filter at the pre-determined average optimal cut-off frequency of 5 Hz. The GHJ was calculated from this kinematic data using three previously described algorithms; the symmetrical centre of rotation (SCORE) algorithm [5], sphere fit method (SF) [4] and least-squares criterion method (LS) [3], in a custom Matlab program (Mathworks, inc.). Each calculated GHJ was expressed relative to a coordinate system defined from the acromion markers. The accuracy assessment compared the average Euclidean distance between the GHJ locations calculated by each algorithm and the MRI determined GHJ location in a repeated measures analysis of variance (ANOVA). The mean and standard deviation of the x, y and z GHJ coordinate location calculated by each algorithm over the
four kinematic data collections was also compared in a repeated measures ANOVA. RESULTS AND DISCUSSION The LS algorithm reported lower reliability than the SF and SCORE algorithms. The SF and SCORE algorithms reliably calculated the centre of rotation from four repeat kinematic data collections (Fig 1). The accuracy comparison indicated that the GHJ determined using functional methods was not equivalent to the geometric centre of the humeral head identified with MRI. The SF algorithm produced the smallest average error of all algorithms (27 ±8.6 mm; Table 1). Given that the average diameter of the humeral head is around 30 mm; this may not be an acceptable margin of error. These results suggest that functional methods of GHJ identification may not be the most accurate option. However, further research using a scapular parent coordinate system is necessary to fully clarify this issue.
Figure 1: The mean GHJ coordinate reliability error across four data collections for each algorithm. * indicates significant difference (P < 0.001). Table 1: GHJ prediction error; mean (± standard deviation) Algorithm 1
(SF) Algorithm 2 (LS)
Algorithm 3 (Score)
error (mm) 27.6 (±8.6)* 33.3 (±13.7) 39.2 (±7.8)
* indicates significant difference (P < 0.001). REFERENCES 1. Camomilla VA, et al. J Biomech 39: 1096-106, 2006. 2. Campbell AC, et al. J Biomech 42: 1527-32, 2009. 3. Gamage VA, et al. J Biomech 35: 87-93, 2002. 4. Piazza SJ, et al. J Biomech 37: 349-56, 2004. 5. Siston RA, et al. J Biomech 39: 125-30, 2006. 6. Veeger HE, et al. J Biomech 33: 1711-5, 2000. 7. Wu G, et al. J Biomech 38: 981-92, 2005.

48
PRECONDITIONING STRAIN AND STRAIN RATE AFFECT MEASURED TISSUE PROPERITES
1,2 Shaokoon Cheng, 1,2 Elizabeth Clarke and 1 Lynne Bilston
1 Prince of Wales Medical Research Institute, University of New South Wales, Sydney 2 Equal contributions of EC and SC, email: [email protected]
INTRODUCTION The mechanical properties of biological tissues are of interest in several fields including investigation of injury mechanisms and thresholds, producing biofidelic tissue surrogates and engineered scaffolds, and to investigate the mechanical effects of disease processes and treatments. Biological tissues are viscoelastic and therefore their mechanical properties are history dependent. Cyclic preconditioning (PC) has been adopted as a standard procedure prior to mechanical testing of biological tissues to standardise the strain history and produce a repeatable reference state before the actual test. The procedure has been used for over 25 years [1] however there are still uncertainties about the mechanisms behind PC and the effects of PC protocols on measured mechanical properties. METHODS The effects of preconditioning strain and strain rate were assessed in two separate in vitro experiments; PC strain was investigated in rat spinal cord in tension and PC strain rate was investigated in bovine liver in unconfined compression. In the first study, entire spinal cords were harvested from euthanised neonatal rats, preconditioned under tension for 10 cycles and then mechanically tested under tension (1a-c, Table 1). The peak stress at 2% strain for groups 1b and 1c (same test conditions but different PC strains) were compared using a t-test. In the second study 20mm diameter specimens were cored from bovine liver (obtained from an abattoir, tested within 6 hours of death), preconditioned under compression for 6 cycles and then mechanically tested under compression (2a-b, Table1). The peak stress at 19% strain for groups 2a and 2b (same test conditions but different PC strain rates) were compared using a Mann-Whitney U-test. Table 1: Preconditioning and mechanical testing protocols Study/group N Preconditioning
(strain, strain rate) Mechanical test (strain, strain rate)
1a 6 5%, 0.25/s 5%, 0.0025/s 1b 6 5%, 0.25/s 2%, 0.0025/s 1c 8 2%, 0.25/s 2%, 0.0025/s 2a 5 19%, 0.01/s 19%, 0.01/s 2b 6 19%, 0.1/s 19%, 0.01/s RESULTS AND DISCUSSION In the first study on PC strain, groups 1a and 1b were PC to a common strain (5%) and showed agreement in stress-strain curves (Fig 1). However group 1c, which was mechanically tested under the same conditions as group 1b but had a lower preconditioning strain, had a significantly higher peak stress than group 1b (p=0.02, Fig 1). Similarly in the second study on PC strain rate group 2b, which was
mechanically tested under the same conditions as group 2a but had a higher preconditioning strain rate, had a significantly higher peak stress than group 2a (p=0.04, Fig 2). These findings are important as biological tissues are often mechanically tested under various strains and strain rates (e.g. for fitting and validating a constitutive model) but often PC is performed at those same test conditions e.g. [2].
Figure 1: Effect of PC strain on stress-strain data. Data points are mean ± standard deviation.
Figure 2: Effect of PC strain rate on stress-strain data. Individual specimen stress-strain curves are shown. CONCLUSIONS Preconditioning strain and strain rate appear to affect the later measured mechanical properties of soft tissues. A higher PC strain appears to reduce stiffness, whereas a higher preconditioning strain rate appears to increase the stiffness. Therefore if testing tissues at multiple strains or strain rates (as is often the case) it would be prudent to precondition all specimens to a common strain and strain rate to ensure that all tests are conducted from a standardised reference level. Since preconditioning is a common procedure prior to testing biological tissues, the mechanisms behind these effects warrant further investigation so that informed standard procedures can be adopted. REFERENCES 1. Woo SL. Biorheology 19:385-96, 1982. 2. Fiford R & Bilston LE. J Biomech 38:1509-15, 2005.
5% PC strain 5% PC strain
2% PC strain
Fast PC Slow PC

Proceedings of the 7th Australasian Biomechanics Conference, Griffith University, November /December 2009
49
THE USE OF A DUNNETT PAIRWISE COMPARISON STATISTICAL METHOD TO ESTIMATE BALL RELEASE DURING CRICKET BOWLING
Cyril J. Donnelly, Kane J. Middleton, Jacqueline A. Alderson, David G. Lloyd and Bruce C. Elliott
School of Sport Science, Exercise and Health, The University of Western Australia
email: [email protected]; web: www.sseh.uwa.edu.au INTRODUCTION The International Cricket Council (ICC) defines an illegal bowling delivery as when elbow extension from horizontal arm position to ball release exceeds 15º [1]. Currently, ball release is defined subjectively with operational definitions that can vary across laboratories, investigators and time. Interpretation of an operational definition among other variables can contribute to errors in estimating ball release subjectivly; influencing the results of a bowling analysis and recommendations for bowler suspension [1]. The purpose of this investigation was to develop a method to independently and quantitatively estimate ball release during a bowling delivery. METHODS Thirteen deliveries bowled by an international spin bowler were used for analysis. Retro-reflective marker triads were placed on the acromion, upper arm, forearm and hand of the bowling arm [2]. Two kinematic markers placed on the cricket ball were used to track ball position. Kinematic data were collected using a 12-camera VICON MX motion capture system (VICON Peak, Oxford, UK) at 250 Hz [1]. Using a custom BodyBuilder model (VICON Peak, Oxford, UK) [2], vertical, horizontal arm positions and relative elbow angles were calculated [1, 2]. An independent biomechanical researcher used a Dunnett pairwise comparison statistical model (DM) [3] to estimate ball release. A DM is designed to compare a control or reference mean (RM) with multiple treatment or event means. It was assumed the distance of the ball relative to the hand segment (DBRH) was constant for 25 frames following vertical arm position and used to calculate the RM. Event means representing DBRH are then calculated in ‘data couples’ during the bowling delivery time series and compared back to the RM via the DM (Equation 1). When a data couple mean is statistically different than the RM (α = 0.05), the first frame in the data couple is defined as when ball release has occurred.
Equation 1: Method used to create ‘data couples’ for comparison to RM in the DM to estimate ball release. To assess the robustness of the DM, ball release was estimated after smoothing the kinematic data with 4 different digital filters. Filters types used were a 2nd order zero-lag Woltring and Butterworth (BW). Low pass cut off frequencies were 16 and 20 Hz. The BW 16 Hz bowling data [1] was then analysed by 3 independent, experienced biomechanical researchers to subjectively define when ball release occurred. Ball release estimates using the DM from the BW 16 Hz data relative to estimates of all other smoothing techniques was calculated.
BW 16 Hz DM ball release estimates relative to subjective tester ball release estimates were calculated. Relative differences between subjective tester estimates of ball release were also calculated. All Means were compared using a one-way ANOVA (α=0.05). A Tukey Post Hoc (α=0.05) was used when significant differences were found. RESULTS AND DISCUSSION Regardless of smoothing technique, no statistical differences in ball release estimates were observed when using DM. Statistical differences between biomechanical testers relative to the DM were observed (p = 0.02). Ball release estimates relative to the DM for tester 1 was significantly lower than estimates from tester 2 (p = 0.04) and tester 3 (p = 0.05) (Fig 1). Mean differences relative to the DM for tester 1, 2 & 3 were -0.2 ± 1.4, -1.4 ± 1.2, and -1.3 ± 1.1 frames respectively. Results indicate that the DM was similar but less conservative than subjective estimates of ball release.
Figure 1: Ball release estimates of testers 1-3 relative to DM ball release estimates. Positive and negative frame numbers mean ball release estimate is following or prior to the DM ball release estimate respectively. Differences between tester subjective estimates of ball release were observed (p = 0.002). Ball release estimates for tester 2 relative to tester 1 and tester 3 relative to tester 1 were not statistically different. Ball release estimates between tester 1 relative to testers 2 & 3 and tester 2 relative to tester 3 were different (p = 0.004 & p = 0.008). Results show that subjective measures of ball release vary depending on the investigator analysing the data. CONCLUSIONS The DM can be used as an independent, quantitative method to estimate ball release during cricket bowling. REFERENCES 1. Hitchcock C. ICC Operations Manual. International
Cricket Council, 2008. 2. Campbell A, et al. J Biomech 42: 1527-32, 2009. 3. Kuehl RO. Statistical principles of research design and
analysis, pp.73-121. Pacific Grove: Brooks/Cole, 2000.
for j = i to N; Data Couple (j) = [Xj and X(j+1)]j = current frame numberi = frame number following reference mean (RM)N = last frame in bowling trialX = distance of ball relative to hand segment (DBRH)
-3
-2
-1
0
1
2
3
1 2 3 4 5 6 7 8 9 10 11 12 13
Fram
e d
iffer
ence
re
lativ
e to
DM
Trial #
DM - Tester 1
DM - Tester 2
DM - Tester 3

50
A RHEOLOGICAL MODEL OF BLUNT FORCE TRAUMA
1 Peter L. Davidson, 1 Suzanne J. Wilson, 2 Michael Taylor and 3 Jules Kieser
1 Injury Prevention Research Unit, Dunedin School of Medicine
2 Christchurch Service Centre, ESR, Christchurch 3 Department of Oral Sciences, University of Otago, New Zealand
email: [email protected]
INTRODUCTION One of the main goals of forensics is to predict injury intent. This is of utmost important in suspected child abuse blunt force trauma (BFT) cases. The challenge for forensic science is to recreate the injury event based on the physical evidence and the latest scientific knowledge. Employing mathematical models can enhance this knowledge by providing information about the mechanical stresses and strains within tissues, and their relation to the force of impacting objects and tolerance of tissues to damage. There are no known mathematical models of forensic BFT, however. The first two authors of this paper have developed rheological models for wrist fracture in children [1]. Rheological models can characterise the human body in terms of its elastic, viscous and inertial characteristics and have been used in several impact situations. It would be useful to know whether rheological models can replicate soft tissue impacts such as BFT. In this paper, we test a simple rheological model and make recommendations for the next step in the development of a mathematical model of BFT. METHODS The spring-dashpot rheological model, also referred to as the Voight Body, is a lumped parameter representation of the dynamics of a viscoelastic material. To characterise the skin response to blunt impact, Voight models or ‘bricks’ were connected in series across two dimensions of the x-y plane to represent a vertical cross section of the tissue. In this study, a 54-brick (8 x 7) model was created.
Figure 1: Snapshot of the maximum strain from a small impact (10% strain) on the 54-brick rheological model.
Impact simulations were conducted with Simmechancis ® toolbox of Matlab ® software. A step function force was applied to a single offset brick (fourth from the right) to represent a blunt force impact on the surface (Figs 1 and 2). The stiffness and damping values were set to match the
stress and strain response of plantar tissue to a 10Hz sine impact [2]. RESULTS AND DISCUSSION For small impacts, the rheological model responded quite realistically and displayed a damped oscillatory motion (Fig 1). Large impact forces, however, jumbled up the bricks in an inconsistent manner (Fig 2). As can be observed in horizontal cross section (dotted line in Figure 2), the point masses are disturbed in a haphazard manner indicating an unstable disruption of mass in the impacted material. Also, during the simulation the bricks demonstrated uneven swirling motions which were not consistent with a homogeneous material.
Figure 2: Snapshot of the maximum strain from a large impact (50% strain) on the 54-brick rheological model. To be of use in forensic investigations, physical and mathematical models must demonstrate realistic behaviour, especially at the simplest level. The proposed rheological model did not pass this basic test. The way the bricks freely passed each other indicated that a fundamental component was missing in the modelling. This component is thought to be shear strain. While the spring and dashpot unit restricts translation motion along the brick’s relative axis that connects each point mass, they provide no direct restriction to rotation of point masses with respect to each other. It is believed that adding shear components would be going beyond the capabilities of this type of modelling and another approach such as finite element modelling should be considered for the modelling of BFT. REFERENCES 1. Davidson PL, et al. J Biomech 39: 503-9, 2006. 2. Ledoux WR, et al. J Biomech 40: 2975-81, 2007.

Proceedings of the 7th Australasian Biomechanics Conference, Griffith University, November /December 2009
51
THREE-DIMENSIONAL GAIT CHARACTERISTICS OF PARKINSON’S DISEASE PATIENTS WHO FALL
1 Michael H. Cole, 1 Joanne M. Wood 1, 2 Peter A. Silburn and 1 Graham K. Kerr
1 Institute of Health & Biomedical Innovation, Queensland University of Technology, Brisbane, QLD 2 School of Medicine, University of Queensland, Brisbane, QLD
email: [email protected]
INTRODUCTION In 2005, Parkinson’s Disease (PD) was reported to affect between 53,000 and 72,000 Australians [1], yet the aetiology of the condition remains largely unknown. The incidence of PD increases as a function of age, with the highest prevelance of the condition evident in people aged 50 years and over. Prospective research shows an increased incidence of falls in PD compared with healthy community-dwelling adults [2], with almost 50% of these falls occurring during locomotion. Clinical gait analyses have shown that PD patients take shorter strides, and walk at a reduced speed compared with controls [e.g. 3]. Despite this, little research has been carried out to examine the gait profiles of PD patients who prospectively report falling. METHODS Forty-nine patients with idiopathic PD (66.4 ± 8.2 yrs) and thirty-four controls (67.7 ± 9.4 years) had their gait assessed using three-dimensional motion analysis. All patients were assessed while optimally-medicated. Participants performed 6 trials while walking barefoot at a self-selected and comfortable pace on a firm surface. Twenty-eight skin-based markers were tracked using a 6-camera motion analysis system (Motus 2000; 50Hz), which facilitated the construction of a linked-segment model. This allowed the calculation of temporospatial parameters and angular quantities for the lower limbs. Participants were asked to report whether they experienced any falls or injuries over the subsequent 12-month period using a monthly falls diary. Based on the prospective falls data collected, the participants were divided into four groups; PD Fallers (n = 32); PD Non-Fallers (n = 17); Control Fallers (n = 17); and Control Non-Fallers (n = 17). RESULTS AND DISCUSSION The mean age of the four groups of participants was not significantly different. Similarly, PD fallers were not significantly different from non-fallers with respect to disease severity (Hoehn & Yahr, UPDRS), but had longer disease duration. The gait of the PD fallers group was characterised by shorter strides, poorer gait stability ratio (cadence/velocity), and slower walking velocity compared with all other groups.
Additionally, PD fallers spent a significantly greater percent of the gait cycle in double support compared with the controls (fallers and non-fallers), but not with respect to their PD counterparts who had not fallen. These temporospatial differences were accompanied by a significant reduction in the range of hip and knee motion in the sagittal plane for the PD fallers compared with the other groups. However, when joint range of motion was normalised to stride length, these differences were negated. Importantly, no significant differences were found between control fallers and non-fallers for any the variables or between PD non-fallers and the control groups.
Figure 1: Mean stride length, walking speed and gait stability ratios for the four groups (* p < 0.05). CONCLUSIONS PD patients who prospectively reported falling walked differently to PD non-fallers and age-matched controls. Given that most falls occur during locomotion, an appreciation of these differences may help to identify PD patients at a higher risk of falling. ACKNOWLEDGEMENTS Funding received from the NHMRC Injury Prevention Partnership grant, Prevention of Injuries in Older People. REFERENCES 1. Parkinson’s Australia. Living with Parkinson’s disease.
Report prepared by Access Economics, Canberra, 2007.
2. Pickering RM, et al. Mov Disord 22: 1892-900, 2007. 3. Morris ME, et al. Clin Biomech 16: 459-70, 2001.
Table 1: Mean (±1 SE) values for the hip, knee and ankle range of motion r for the four groups in the sagittal plane. PD Faller PD Non-Faller Control Faller Control Non-Faller Sig. Hip Flexion/Extension 35.75 (0.97) 39.64 (1.56) 41.08 (1.03) 43.54 (1.70) a, b, c Knee Flexion/Extension 47.65 (1.13) 52.12 (1.15) 52.52 (1.12) 53.86 (1.41) a, b, c Ankle Plantar/Dorsi 23.76 (0.71) 26.98 (0.88) 25.53 (1.04) 25.69 (1.12) ns ns. not significant; a. PD F different to PD NF; b. PD F different to Control F; c. PD F different to Control NF.
0.00.10.20.30.40.50.60.70.80.91.01.11.21.31.41.5
Strid
e Le
ngth
(m)
**
*
PD F
alle
rsPD
Non
-Fal
lers
Con
trol F
alle
rsC
ontro
l Non
-Fal
lers
0.00.10.20.30.40.50.60.70.80.91.01.11.21.31.41.5
Wal
king
Spe
ed (m
/s)
**
*
PD F
alle
rsPD
Non
-Fal
lers
Con
trol F
alle
rsC
ontro
l Non
-Fal
lers
0.00.2
0.40.6
0.81.0
1.21.4
1.61.8
2.02.2
2.4
Gai
t Sta
bilit
y R
atio
**
*
PD F
alle
rsPD
Non
-Fal
lers
Con
trol F
alle
rsC
ontro
l Non
-Fal
lers

52
PHYSICAL FUNCTION OF ABOVE KNEE AMPUTEES WITH THE 3R90 AND 3R92 KNEE DEVICE
1 Noel Lythgo, 2 Bill Marmaras and 2Helen Connor
1 Rehabilitation Sciences Research Centre, The University of Melbourne 2Austin Health, Melbourne
email: [email protected]
INTRODUCTION This study investigated the performance of new generation of mechanical passive knee prostheses. METHODS Five unilateral transfemoral amputees (58.4 ± 11.9 yrs; 175.2 ± 4.9 cm; 78.2 ± 8.0 kg) of medium/long residual limb length with stable residual limb volume participated. Socket suspension and interface systems were held constant. Suspension systems were 4 suction with valve and 1 seal in silicon liner. Original knee devices (ORIG) worn by participants were a CP Tribute, 3R49, 3R45, Mauch SNS and Total Knee. All participants met the experimental criteria for inclusion in the study. Two knee prosthetic devices (3R90, 3R92, Otto Bock) were fitted and aligned with the 1A30 foot (Greissinger Plus) by a senior prosthetist. After fitting, participants were given gait training by an amputee physiotherapist. Participants had a 25.5 ± 9.3 day acclimation period after fitting. The following functional tests and questionnaire were administered upon entry into the study and at the end of each acclimation period: 6-minute Walk Test; Timed Up and Go Test; Four Square Step Test (4SST); a modified version of the Prosthesis Evaluation Questionnaire (PEQ). Seven of the functional domains of the PEQ were used; ambulation, utility, sounds, frustration, satisfaction, back pain and sound limb symptoms. Following these tests, participants completed 8 walks at self-selected speed along a 10 m level walkway and across a 4.9 m GAITRite mat. Participants then completed a series of walks (self-selected speed) that required a sudden 30° left or right turn, a sudden stop or no change (total = 42 trials) [1]. Cue lights triggered by force plate contact (AMTI) and located at the end of the walkway were used to prompt a sudden turn or stop. For the turn condition, participants had to complete either a cross-over or side-stepping strategy (dependent on limb contact) and then follow a line marked on the floor. In the stop condition, participants had to stop within 2 steps. The average delay from initial contact to light activation was 380 ± 30 ms allowing about 1½ step durations to turn or stop. Repeated measures MANOVAs were used for data analysis.
RESULTS AND DISCUSSION Compared to the 3R90 and ORIG, the functional tests showed improvement with the 3R92. The PEQ results partly support this finding since the participants’ PEQ score (82.0 ± 6.3) for the 3R92 was higher than the 3R90 (65.5 ± 16.8). The PEQ score for the ORIG was 83.8 ± 4.8. The PEQ sound measure was significantly different (P < .05) between ORIG and 3R90 with the latter device rated as having a high sound score. The PEQ scores on each item were higher (improved) for the 3R92 than the 3R90 except for the PEQ pain score. Gait speed was the same (1.06 m⋅s-1) for the ORIG and 3R90 but significantly less (P < .05) for the 3R92 (1.01m⋅s-1). No significant knee device effects were found for the turn and stop conditions. Success rate the cross-over strategy was; ORIG (52.0%), 3R90 (40.0%) and 3R92 (32%). For side-stepping it was; ORIG (52%), 3R90 (13%) and 3R92 (16%). Symmetry ([Prosthetic-Intact)/average]⋅100% remained unaffected by knee device. Single support (ORIG: -29.9 ± 21.1%; 3R90: -30.7 ± 12.8%; 3R92; -30.3 ± 17.6%) and stance time (ORIG: -19.0 ± 11.9%; 3R90: -19.9 ± 7.78%; 3R92; -18.0 ± 9.6%) exhibited the greatest asymmetries. Gait measures are shown in Table 1: Participants had a wider support base (≈ 2cm) and Zig-Zagged more (≈ 3°, P = 0.012) with the 3R92. CONCLUSIONS Knee device differences were found with the PEQ, function and gait tests though gait generally remained unchanged. Limitations include participant numbers and homogeneity. Differences were found for the turn and stop tasks. ACKNOWLEDGEMENTS The project was supported by a grant provided by Austin Hospital Medical Research Foundation. REFERENCES 1. Patla A, et al. J Exp Psychol 17: 603-4, 1991.
Table 1: Gait measures: Mean (SD). Prosthetic Intact ORIG 3R90 3R92 ORIG 3R90 3R92
Stride Length (cm) 132.9 (19.9) 135.6 (19.9) 131.1 (23.4) 132.6 (19.6) 136.0 (19.8) 131.5 (23.7) Support Base (cm) 16.9 (5.3) 18.5 (5.0) 18.9 (4.6) 16.8 (5.4) 18.4 (5.0) 18.9 (4.2) Single Support (%) 33.3 (5.0) 33.0 (3.4) 33.0 (4.3) 44.6 (2.5) 44.8 (2.2) 44.4 (2.1) Double Support (%) 22.8 (2.9) 22.0 (3.0) 22.7 (2.9) 23.1 (2.7) 22.0 (2.9) 22.8 (3.1)
Stance Time (%) 55.2 (2.6) 54.8 (2.3) 55.6 (2.2) 66.7 (4.9) 66.8 (3.1) 66.6 (4.8) Zig-Zag (°) 150.6 (12.4) 148.8 (10.9) 146.3 (12.1) 150.3 (12.3)* 148.8 (10.6)* 146.3 (12.0)
* P = 0.012

Proceedings of the 7th Australasian Biomechanics Conference, Griffith University, November /December 2009
53
KNEE ABDUCTION MOMENTS IN GAIT PREDICT RADIOLOGICAL AND FUNCTIONAL CHANGE
1 Shane S. Ilich, 1 Daina L. Sturnieks, 2 Peter M. Mills, 3 Alasdair R. Dempsey and 1 David G. Lloyd
1School of Sport Science, Exercise & Health, The University of Western Australia, Crawley, WA, 6009, Australia; 2Prince of Wales Medical Research Institute, Barker Street, Randwick, Sydney, NSW 2031, Australia;
3School of Physiotherapy and Exercise Science, Griffith University, Gold Coast Campus, QLD 4222, Australia; email: [email protected]
INTRODUCTION Increased severity of radiological osteoarthritis (OA) of the knee has been correlated with decreased knee function, and associated with increased knee abduction moments during gait [1]. Baseline abduction moments have been predictive of radiographic OA progression over 6 years [2]. Increased abduction moments during gait have also been recently identified in arthroscopic partial meniscectomy (APM) patients when compared to controls [3]. APM patients have been shown to have an increased rate of development of radiological OA [4]. Further, APM patients have been shown to experience decreased knee function 18 to 48 months after surgery [5]. This study aimed to investigate any potential predictive relationship between baseline abduction moments during gait in APM patients and subsequent worse outcome of radiological OA and knee function after 4 years. METHODS Seventeen APM patients underwent three-dimensional gait analysis with a 50Hz Vicon motion analysis system, incorporating 2 AMTI force platforms, within 4-12 weeks of surgery, walking at a self-selected pace. 3D joint moments were calculated according to established procedures [6]. Peak knee abduction moments were identified during the stance phase of gait. Bilateral semi-flexed (30 deg) standing posterior-anterior view radiographs were taken within 1 week of gait analysis, and again at 48 months post-surgery. Radiographs were graded for tibio-femoral joint space width (JSW), osteophyte formation, and tibial spiking [7]. Patients were administered the Knee Osteoarthritis Outcome Scale (KOOS) [5] at baseline, and again 48 months post-surgery. Fourteen controls fulfilling identical age and BMI inclusion criteria also underwent the same testing protocol. The relationships between kinetics at baseline and the change in radiological scores at 4-year follow-up were quantified using Spearman rank correlation (1-tailed for a
negative relationship). Pearson product-moment correlations (1-tailed for a negative relationship) were used to quantify the relationship between baseline kinetics and change in KOOS scores. Significance for both tests was set at p< 0.05. RESULTS AND DISCUSSION: Both surgery patients and healthy controls exhibiting increased peak knee abduction moments during gait experienced decreased improvements in knee function and pain over 48 months (Table 1).Peak knee abduction moments during gait post surgery were shown be associated with an increase in medial tibial spiking in APM patients 48 months post-surgery (Table 1), with no corresponding significant correlation identified in the control group. CONCLUSIONS Given the relationships that have already been shown to exist between OA populations and increased abduction moments during gait, and the increased propensity of APM patients to experience less improvement in functional outcomes post-surgery, these results suggest a possible mechanical basis for OA development and may hint at a more sensitive instrument for identifying patients at risk of decreased knee function. Further longitudinal investigations are needed to clarify this possible causal relationship. REFERENCES 1. Mündermann A, et al. Arthritis Rheum 52: 2835-44,
2005. 2. Miyazaki T, et al. Ann Rheum Dis 61:617-622, 2002. 3. Sturnieks DL, et al. J Orthop Res. 26:1075-80, 2008. 4. Rangger C, et al. Am J Sports Med 23:240-4, 1995. 5. Roos EM, et al. Ann Rheum Dis 67: 505-10, 2008. 6. Besier TF, et al. J Biomech 36:1159-68, 2003. 7. Mills PM, et al. Osteoarthritis Cartilage 16:1526-31,
2008. Table 1: Correlation between baseline gait abduction moments and changes in radiological features and knee function (KOOS) over 4 years. * Correlation is significant at the 0.05 level (1-tailed). ** Correlation is significant at the 0.01 level (1-tailed).
Medial tibial spiking (r) KOOS score (r) APM CON APM CON
Peak adduction moment -0.416* - -0.497* -0.634**

54
KNEE FLEXION PRECEDES INITIAL CONTACT IN HUMAN GAIT AND IS SPEED DEPENDENT
¹ David McKenzie, ¹ Noel Lythgo and 2 Richard Baker
¹ Rehabilitation Sciences Research Centre, Melbourne University, Kew 2 Royal Children’s Hospital, Melbourne
e-mail: [email protected] INTRODUCTION Biomechanical analyses have provided detailed information about joint kinematics and kinetics of the gait cycle. Interpretation of this data has largely overlooked [1], or even misrepresented [2,3], knee kinematics around initial contact (IC). Because of the complex nature of IC, particularly the re-introduction of ground reaction forces to the leading limb, we suggest this point in the gait cycle requires thorough investigation. The aims of this study were to identify the onset and the amount of knee flexion (KF) around IC in human gait and the relationship between these variables and gait speed. METHODS Sixteen healthy young adults (age: 18.8 ± 0.6 years; mass: 62.2 ± 12.8 kg; height: 1.7 ± 0.1 m; 12 females, 4 males) participated in this study. A Vicon 3D Infra-red motion analysis system (Oxford Metrics Ltd., Oxford, England) sampling at 120 Hz and AMTI Force Plates (Watertown, USA) sampling at 1080 Hz were used to record kinematic and kinetic data from a total of between 216 and 229 walking trials at three self-selected speeds: slow; preferred and fast. Data were analysed, using descriptive statistics representing the timing of the onset of KF prior to IC and the amount of KF occurring between maximum knee extension prior to IC and IC. Friedman’s χ2r statistic was used to investigate differences across gait speed. Post hoc testing was performed with the Wilcoxon test. Normality was assessed by the Kolmogorov-Smirnov test of normality and through skewness and kurtosis.
RESULTS AND DISCUSSION All data sets were found to be non-normal. Medians and Interquartile Range (IQR) values for timing of KF onset (% stride) for each speed condition are listed in Table 1: The data show that at preferred speed 2.6% of stride was taken up with flexing the swinging knee prior to IC. This rose to 3.5% at fast speed and fell to 2.2% at slow speed. At preferred speed the amount of KF prior to IC was 1.4˚. This rose to 2.3˚ at fast speed and was 0.8˚ at slow speed. Friedman’s χ2r statistic shows that speed significantly affected (p < 0.001) these variables. Post hoc testing between speeds showed significant differences between each variable (p < 0.001). CONCLUSIONS Results support the hypothesis that knee flexion occurs prior to IC in human gait. The amount and duration of this knee flexion are dependent upon the speed of walking. These findings suggest that in human gait a motor control strategy is implemented where the knee flexes in anticipation of initial contact. These results show that KF prior to IC plays an important role in human gait in healthy young adults. Future work should investigate the role of this action in pathological populations. It may be a critical feature in gait rehabilitation. REFERENCES 1. Winter DA. J Mot Behav 15: 302-30, 1983. 2. Cerny K. Phys Ther 64: 1851-59, 1984. 3. Perry J. Gait analysis normal and pathological function,
pp. 100-108, Slack, Inc. Thorofare, 1992. Table 1: Descriptive statistics and Friedman’s χ2r statistic for timing of onset (% of stride) and amount of KF (θk) for the three speed conditions.
Statistic N Median IQR Friedman’s χ2r p N
% stride (%) Slow 229 2.2 2.1
50 < 0.001 188 Preferred 216 2.6 1.8 Fast 222 3.5 2.0
θ (˚) Slow 229 0.8 1.8
50 < 0.001 188 Preferred 216 1.4 2.1 Fast 222 2.3 2.8

Proceedings of the 7th Australasian Biomechanics Conference, Griffith University, November /December 2009
55
KINEMATIC SEGMENTAL SEQUENCING OF BOWLING IN CRICKET
1 René E.D. Ferdinands
1 Discipline of Exercise and Sports Science, Faculty of Health Sciences, University of Sydney email: [email protected]
INTRODUCTION Cricket coaches and bowlers generally agree that the sequence of movements is an essential component of fast bowling. The kinetic link principle proposes that a proximal to distal ordering of segmental movement is optimal for producing high end effector velocities [1]. Although previous reasearch suggests that there may be a general order of motion, progressing from hips and shoulders to the bowling arm and wrist, there has been little specific research investigating the three-dimensional segmental sequencing in bowling [2]. The aim of this study is to examine the temporal differences between the occurrence of peak segment angular velocities to determine the segmental sequencing in a sample of bowlers. The hypotheses are that bowling requires a general proximal to distal segmental seqencing and that certain sequencing elements are associated with ball speed. METHODS Thirty-four bowlers (22.3 ± 3.7 years) were recruited from New Zealand premier grade club and above. An 8-camera EVa Motion Analysis System (Motion Analysis Corporation Ltd., USA) was used to capture three-dimensional (3D) motion analysis (240 Hz) and force plate (960 Hz) data on six trials for each bowler while front and rear foot contact were made on two Bertec 6090 force plates. The bowlers were divided into four speed groups (fast, med-fast, medium and slow). Motion analysis capture was performed on each subject wearing a full body marker set comprising forty-five 15 mm spherical markers. The linear and Euler angle representation of local coordinate systems were used to create a 3D 15-segment rigid body model of the cricket bowler in Mathematica’s Mechanical Systems Pack (Version 5.2, Wolfram Research Ltd.)[3]. This model was used to calculate the magnitude and timing of the segmental angular velocities from front foot contact to ball release. A GLM repeated measures was used to test for significant differences in segmental sequencing between the speed groups. A partial correlation analysis was performed with competition level set as the control variable. All statistical analysis was performed in SPSS (Version 16.0.2) RESULTS AND DISCUSSION Figure 1 shows the pattern of segmental sequencing based on the timing of peak angular velocities. Repeated measures ANOVA shows that there were significant differences (F > 13.0; p < 0.005) between the speed groups in all the segmental timings except between (i) pelvic lateral tilt and humeral internal rotation, (ii) pelvic flexion and left arm adduction, and (iii) thoracic flexion and humeral internal rotation. The timings of the following maximum angular velocities were partially correlated with
ball speed: bowling arm vertical adduction (r = 0.403, p = 0.020), humeral internal rotation (r = 0.356, p = 0.040) and hand flexion (r = 0.426, p = 0.013). Pelvic and thoracic angular velocity magnitudes (flexion and rotation) were partially correlated with ball speed (p < 0.01: r > 0.60 and r > 0.40, respectively). In addition, upper arm vertical adduction and wrist flexion angular velocities were partially correlated with ball speed (p < 0.04: r = 0.461 and 0.363, respectively).
Figure 1: Segmental sequencing of peak angular velocities during the period front foot contact to ball release. (Z-axis: anterior-posterior axis, Y-axis: long axis and X-axis: flexion-extension axis). CONCLUSIONS In general, the lower and upper trunk segments were activated before the bowling arm segments. There were also weak-moderate associations between a delayed activation of the bowling arm segments and ball speed. However, there were also some notable exceptions from the classic proximal to distal scheme. In addition, the magnitudes of the certain segment angular velocities were more strongly correlated with ball speed than their respective timings. Further research in bowling biomechanics is needed to understand the relationship between segmental sequencing and performance. REFERENCES 1. Putnam CA. J Biomech 26: 125-35, 1993. 2. Bartlett R, et al. J Sports Sci 14: 403-24, 1996. 3. Ferdinands RED. J Biomech 42: 1616–21, 2009.
0
10
20
30
40
50
60
70
80
90
100
Pel
vis
Z
Pel
vis
Y
Thor
ax Z
Thor
ax Y
Pel
vis
X
FUpA
rm Z
Thor
ax X
BU
pArm
X
Bha
nd X
BU
pArm
Y
0
5
10
15
20
25
30
Nor
mal
ised
Tim
e (s
)
Ang
ular
Vel
(rad
/s)

56
RESPONSE OF ELITE MALE CRICKET BATSMEN FACING DELIVERIES OF VARIOUS LENGTHS
1,2 Nadine Thomlinson, 1,3 Kevin F. Ness and 1 Shaun Belward
1Engineering and Physical Sciences, James Cook University 2 Biomechanics and Performance Analysis, Australian Institute of Sport
3 Inspectorate Australia (Assay) Pty Ltd email: [email protected]
INTRODUCTION Cricket is a Batsman’s game, its very nature demands runs be scored. Despite this fact there is little scientific, particularly biomechanical, analyses of batting techniques. When facing deliveries from fast bowlers the time constraints on a batsman are severe. A batsman must move quickly into a well-balanced position to play a competent stroke. Aspects of this movement and the stroke played vary with the length of the delivery being bowled at the batsman. To gain additional time, a batsman will try to predict information about the impending delivery. Such information, particularly knowledge of delivery length, is crucial as it directly influences the first decision a batman makes; whether to play forward or back. Evidence regarding a batsman’s ability to predict delivery length is conflicting, with all studies to date having involved occlusion experiments rather than live bowlers [1]. The aim of this study was to quantify the response of batsmen to live deliveries of various lengths from fast-medium bowlers. METHODS Ten elite male cricket batsmen and five male fast-medium bowlers participated in the study. Each batsman faced a randomised order of short, good and full length deliveries against which they played strokes of their choosing. The batsman’s foot movements were recorded from stance through to bat/ball impact using high speed cameras, a motion capture system and force plates. Only data from competent strokes were analysed. Kinematic measurements comprised stance width and definitive stride length as well as timings related to the stride and bat and ball movements. Kinetic measurements included the vertical component of the batsman’s ground reaction force during stance, at bowler’s back foot contact and ball release. A descriptive analysis of the foot movement techniques used by individuals was also undertaken. RESULTS AND DISCUSSION In contrast to coaching manuals the batsmen in this study had wider stance widths and greater loading on the front leg than that recommended.
A one-way ANOVA revealed that when playing full length deliveries, the definitive stride was significantly longer in length and duration and completed later relative to ball release than when playing short length deliveries. Regardless of delivery length and stroke played, the batsmen’s stride was initiated approximately 100 ms after ball release and always in the same direction. Given that previous research has estimated that a batsman’s visual reaction time is 200 ms [2], the timing of the initiation of the stride suggests that the batsmen used advanced cues to predict delivery length. When playing back foot strokes, nine of the ten batsmen took a quick, short stride forward with their front foot in order to push back and play the stroke off the back foot. In contrast, the coaching literature consistently recommends that batsmen move directly back with their back foot to play a back foot stroke [3]. In addition, seven batsmen used preliminary foot movements prior to ball release. These movements were performed every trial, independent of delivery length, and appeared to be an inherent response to the fact that a bowler was about to deliver a ball. Although several scientific studies have also noted preliminary foot movements, their existence is rarely mentioned in the coaching literature. CONCLUSIONS The current study has quantified some aspects of an elite batsman’s response to deliveries of short, good and full length. It suggests that the batsmen in this study used advanced cues to predict delivery length. Further research is needed to firstly determine the sources of these cues; and secondly, develop methods of instruction and perceptual training to enhance the ability of lesser skilled players. In addition, the batsmen in this study used techniques that contradict recommendations in the coaching literature. Whilst the question of who is “right” cannot be answered, coaches need to be aware that batsmen may use “unorthodox” techniques yet still achieve a successful outcome and reach elite status in the game of cricket. REFERENCES 1. Weissensteiner J, et al. J Sport Exerc Psychol 30: 1-23,
2008. 2. McLeod P. Perception 16: 49-59, 1987. 3. See for example: Andrew K. The skills of cricket (Rev
ed). Crowood Press, Wiltshire, 1989.

Proceedings of the 7th Australasian Biomechanics Conference, Griffith University, November /December 2009
57
THE EFFECT OF ALTERING THE HELICAL ENDPOINT TECHNICAL REFERENCE FRAME ON ELBOW ANGLE IN CRICKET BOWLING
1 Kane Middleton, 2 Amity Campbell, 1 Jacqueline Alderson, 1 Aaron Chin and 1 Bruce Elliott
1 The School of Sport Science, Exercise and Health, The University of Western Australia
2 School of Physiotherapy, Curtin University of Technology email: [email protected]
INTRODUCTION Cricket bowlers are currently allowed to extend their elbow joint up to 15° in the forward swing phase of their bowling action without transgressing the fair delivery law. Therefore, measurement of actual elbow flexion/extension (FE), with little or no crosstalk, is paramount if a bowler is to be assessed responsibly. Using a mean finite helical axis - with the endpoints referenced in a technical coordinate system (TCS) - as the FE axis of the elbow will help to reduce crosstalk [1]. However, the ability of a TCS to replicate the endpoint positions throughout dynamic motion may be determined by which TCS they are held relative to. The aim of this investigation is to assess the effect of calculating a helical axis and referencing it’s endpoints relative to varying TCSs on elbow angle in cricket bowling. METHODS One international spin bowler participated in this study. Fifteen retro-reflective markers were attached to the right upper limb of the participant and were tracked using a 12-camera Vicon motion analysis system. The participant was required to perform a number of static and dynamic calibration trials as well as dynamic bowling trials. The mean finite FE helical axis was calculated from the forearm and upper arm marker trajectories during a dynamic calibration trial. Its endpoint positions were then stored relative to an upper arm TCS. A UWA custom model recalled these endpoint positions throughout the bowling trial in order to calculate the elbow joint FE angle. For the purpose of this investigation, this process was repeated three times, with the helical endpoints calculated and held in TCS’s created from a: (1) proximal marker cluster, (2) distal marker cluster, and (3) a hybrid marker configuration constructed from the medial and lateral distal cluster markers and the right shoulder joint centre (SJC) (Fig 1).
Figure 1: Illustration of markers used to create TCSs.
RESULTS AND DISCUSSION Figure 2 demonstrates the effect of referencing helical endpoints in different TCSs on the calculation of elbow joint FE angle. However, the most practically significant difference is seen in the overall elbow extension levels of the three TCSs (Table 1). According to the allowable extension limits imposed by the International Cricket Council, this particular bowler’s action would be deemed legal if the helical endpoints were to be held relative to the proximal or hybrid TCS. However, if held relative to the distal TCS, the bowler’s action would be deemed to be illegal and would face remedial action and possible suspension.
Figure 2: Elbow angles during swing phase (upper arm horizontal to ball release) of three bowling deliveries. This study shows that further investigation must be given to which TCS the FE axis is referenced in, as this can have a profound effect on elbow joint angle outputs. It is our recommendation that the elbow FE axis, when determined as a helical axis, should be referenced in a TCS created from markers on the distal upper arm. This recommendation is based on a previous validation study which found that the marker set cluster closest to the SJC optimally held its position during dynamic trials [2]. However, further validation investigations regarding the elbow joint centre are required. REFERENCES 1. Schache A, et al. Gait Posture 24: 100-9, 2006. 2. Campbell A, et al. Med Biol Eng 47: 543-50, 2009.
Table 1: Mean values at events during swing phase TCS (N=3) Upper arm horizontal (°) Maximum (°) Release (°) Extension (°) Proximal 2.8 ± 0.5 23.5 ± 1.6 13.2 ± 1.3 10.3 ± 1.4 Distal 21.7 ± 1.2 30.6 ± 1.9 13.1 ± 1.6 17.5 ± 1.0 Hybrid 16.3 ± 1.3 30.2 ± 1.7 17.7 ± 2.4 12.5 ± 0.7
0
20
40
Angle (degrees)
0
20
40
0 50 100Angle (degrees)
% Cycle
Proximal TCS Distal TCS Hybrid TCS
0
20
40
Angle (degrees)

58
EXAMINING THE DEVELOPMENT OF TECHNICAL SKILL IN CRICKET BATTING.
¹ Juanita Weissensteiner, 2,3 Bruce Abernethy and 4 Damian Farrow
¹ National Talent Identification and Development, Australian Sports Commission, Australia ² Institute of Human Performance, University of Hong Kong, Hong Kong
³ School of Human Movement Studies, The University of Queensland, Australia 4 Sports Science and Sports Medicine, Australian Institute of Sport, Australia
email: [email protected]
INTRODUCTION Three experiments were conducted to examine technical skills associated with expertise in cricket batting and the developmental emergence of such skills. In Experiment 1, a technical skill test incorporating spatial constraints was administered to highly skilled and lesser skilled adult-aged batsmen. Experiment 2 examined the development of technical skill characteristic of the highly skilled batsmen in Experiment 1, by collecting cross-sectional data on the technical proficiency of skilled and lesser skilled players across the developmental spectrum. The final experiment examined the relative contribution of developmental and morphological factors to the development of batting technique identified in Experiments 1 and 2. METHODS In Experiment 1, critical technical contributors identified in an earlier investigation [1] guided the development of a batting skill test that incorporated manipulation of the spatial requirements of the task whereby participants were required to perform front foot on-drives against a ball machine set at 120 km/hr using three different width bats (normal, half and third width). This test was administered to twenty one adult-aged, highly-skilled batsmen and lesser skilled batsmen. In Experiment 2, the development of technical skill was examined using a cross-sectional design incorporating ninety six skilled and lesser skilled male batsmen of varying age (U15, U20 and adult). All participants completed the batting skill test following the same procedures as in the previous experiment but with the inclusion of two different speeds of delivery (an age-specific, medium pace and a common pace of 80 km/hr). For comparative purposes, the adult participants were as described in Experiment 1. Experiment 3 examined the relative contribution to technical proficiency of developmental practice and morphological factors with the same 96 batsmen who participated in Experiment 2. Three discrete sets of data were collected from each participant – technical proficiency (available from the previous experiments); practice history data [2]; and anthropometric data from a full profile [3]. Analysis of data for all experiments proceeded in four logical steps. First, descriptive statistics for each component (technical component variables i.e. outcome measures, relative sequencing and duration parameters; practice and anthropometric variables) were calculated for each of the skill and age groups. Second, all variables and significance of main effects were analysed using multivariate and univariate analyses of variance. Third, variables found to be significant were entered into a stepwise discriminant function analysis to determine which variable or combination of variables best predicted skill level at each age. Fourth, multiple stepwise regression
analyses were employed to firstly determine which movement pattern or movement component duration variable, or combination of variables best predicted stroke accuracy and quality of interception for each of the age groups. Specific to Experiment 3, multiple regression analyses were conducted to determine which key anthropometric and practice variables were most predictive of key variables of technical performance. RESULTS AND DISCUSSION Findings from Experiment 1 demonstrated that the highly skilled batsmen were distinguishable from their lesser-skilled counterparts by their technical proficiency i.e. definitive foot movement (viz., their significantly earlier initiation and completion of front foot stride), relative timing and temporal sequencing (viz., their ability to synchronise the front foot with bat swing) and by their superior interceptive skill evidenced by their fine and consistent timing of downswing with ball bounce and impact which, in turn, translated into higher accuracy scores. Findings from Experiment 2 revealed that while some skill-based differences are evident by the age of 15 (i.e. shot accuracy), coincidence timing ability, preparatory movement, temporal sequencing and bat swing tempo (i.e. ratio of back-lift to downswing) is refined with subsequent age, the expert advantage being first evident around an U20 level. In Experiment 3, significant difference between the skill groups in regard to morphology and developmental practice investment were revealed whereby the skilled group were distinguishable in regard to their stature (i.e. shorter torso and upper arm length) and their practice investment (i.e. accrued significantly greater amounts of cricket-specific practice). Follow-up correlational analyses revealed that up to 14% of variance in technical performance across age was accounted for by a combination of morphological attributes and practice investment. CONCLUSIONS Collectively, the findings of this investigation not only contribute further to current theory relating to interceptive skill but have important implications for coaching practice in cricket specific to the development of young batsmen. REFERENCES 1. Weissensteiner J, et al. J Appl Sport Psychol 21: 276-
92, 2009. 2. Weissensteiner J, et al. J Sport Exerc Psychol 30: 663-84,
2008. 3. International Standards for Anthropometric
Assessment. ISAK, 2001.

Proceedings of the 7th Australasian Biomechanics Conference, Griffith University, November /December 2009
59
COORDINATION PROFILING: IMPLICATIONS FOR FAST BOWLING RESERACH
1,2,3 Elissa Phillips, 1 Marc Portus, 2 Keith Davids, 3 Nick Brown and 2 Ian Renshaw
1 Sport Science Sport Medicine Unit, Cricket Australia Centre of Excellence, Brisbane 2 School of Human Movement Studies, Queensland University of Technology, Brisbane
3 Biomechanics and Performance Analysis, Australian Institute of Sport, Canberra email: [email protected]
INTRODUCTION Multi-articular actions such as fast bowling in cricket provide valuable research vehicles to examine the role of adaptive movement behaviours. Coordination profiling of sport performers has revealed the nature of individual differences in movement patterning as athletes’ unique individual constraints result in the emergence of varied movement solutions. Coordination profiling might explain the conflicting evidence on the correlation between technique parameters and ball speed and skill level in cricket fast bowling [1]. In fast bowling the paradoxical relationship between stability and variability explains why elite athletes are capable of both consistency and adaptability of technique [2]. The aim of this study was to examine the influence of expertise level on trunk and upper extremity segmental coordination in elite and developing fast bowlers. Several methods of coordination profiling are discussed. METHODS Ten Australian nationally contracted (NAT) and Junior Pace Squad (JNR) fast bowlers performed repeated trials of good, short and full length deliveries at match intensity. Three-dimensional full body movements were captured using a 22-camera VICON motion analysis system (Oxford Metrics Ltd., Oxford, UK) sampling at 250Hz. The University of Western Australia cluster-based model [3] was used to calculate three-dimensional kinematics. The following joint and segment angle couplings were analysed from back foot contact to ball release: pelvis rotation to trunk flexion (C1), trunk abduction (C2), elbow flexion (C3), shoulder flexion (C4), and elbow flexion to shoulder flexion (C5). Relative motion plots, a modified vector coding technique [4] and a cross-correlation technique [5] were utilised to profile coordination and its variability in all participants. RESULTS AND DISCUSSION Optimised cross-correlations showed strong correlations in most couplings (Table 1). Larger phase shifts in C1 and C3 in the NAT group highlighted the change in temporal coordination with development.
Individual analysis of relative motion plots suggested that, although strong correlations were established, groups differed in coordination patterning between individuals and delivery types. Profiling of coordination variability showed no common group trends across couplings. Differences in relative motion plots and coupling variability (s) suggested the need for individual and multi-factorial analyses (Fig 1).
Figure 1: C3 Mean + standard deviation NAT (black) and JNR (grey) coordination variability. CONCLUSIONS Individual and in-depth analysis of segmental coordination is advocated to better understand movement coordination in elite and developing elite fast bowlers. Coordination profiling across different deliveries allows the identification of couplings which may be associated with existence of order and control parameters in fast bowing. REFERENCES 1. Portus M, et al. Sports Biomech 3: 263-84, 2004. 2. Phillips EJ, et al. Sports Med: In Press. 3. Lloyd DG, et al. J Sports Sci 18: 975-82, 2000. 4. Heiderscheit BC, et al. J Appl Biomech 18: 110-21,
2002. 5. Pohl MB, et al. Clin Biomech 21: 175-83, 2006.
Table 1: JNR and NAT Mean (s) optimal cross correlation (cor) values and required phase shifts (opt). C1 cor C1 opt C2 opt C2 opt C3 cor C3 opt C4 cro C4 opt C5 cor C5 opt
JNR 0.60(0.18) 1.0(0.2) -0.90(0.10) 1.1(0.5) -0.67(0.17) 14.6(6.5) -0.82(0.15) 3.1(3.1) 0.74(0.21) 6.7(7.2)NAT 0.66(0.14) 5.2(5.9) -0.95(0.09) 1.3(0.9) -0.60(0.12) 17.3(9.5) -0.76(0.09) 4.1(3.2) 0.75(0.09) 8.4(6.8)
0
10
20
30
40
50
60
70
80
0 10 20 30 40 50 60 70 80 90
% BFC to BR Phase
Coo
rdin
taio
n V
aria
bilit
y (d
egre
es)

60
POSTER PRESENTATIONS

Proceedings of the 7th Australasian Biomechanics Conference, Griffith University, November /December 2009
61
COMPARISON OF STRAIGHT AND CURVE KICK IMPACT KINEMATICS IN ELITE FEMALE FOOTBALL PLAYERS
1, 2 Alison Alcock, 1 Nick Brown, 1 John Baker, 2 Wendy Gilleard and 1 Adam Hunter
1 Biomechanics and Performance Analysis Department, Australian Institute of Sport, Canberra
2 Southern Cross University, Lismore email: [email protected]
INTRODUCTION In football (soccer), the trajectory and velocity of the ball are determined by the forces applied to it by the kicking foot at impact. Thus, straight and curved trajectories require different impact points of the foot on the ball to achieve the desired flight outcomes [1]. A biomechanical analysis of expert performers would provide an insight into the techniques used to achieve these different impact points. The aim of this study was to compare foot contact characteristics of elite females performing straight and curve kicks. METHODS Sixteen international female footballers performed 15 straight and 15 curve kicks of a stationary ball. A FIFA approved ball was kicked from a distance of 20 m at a 1x1 m target positioned in the top corner of a projected image of a full size football goal. The target was directly in front of the ball. For curve kicks, a wall 1.83 m tall and 1.78 m wide was placed 9.15 m from the ball to simulate a direct free kick. Players wore their own football boots and performed the tasks on artificial turf. They were instructed to kick with the same focus on accuracy and velocity as in a game, that is, attempting to hit the target whilst also beating the goalkeeper. Reflective markers, attached to participants in accordance with the University of Western Australia model [2], were tracked by 17 Vicon cameras (Oxford, UK) sampling at 250 Hz. Four pieces of reflective tape adhered to the ball were used to calculate linear velocity. The five most accurate straight and curve kicks were used for analysis. Paired t-tests with a significance level of p < 0.05 were used. Data are presented for a right footed kick. RESULTS AND DISCUSSION The ball velocities of the straight kicks (22.5 ± 1.7 m·s-1) were comparable to those achieved by male professional footballers aiming at a target [3] and significantly faster than the curve kicks (21.2 ± 1.5 m·s-1) (p = 0.002). Participants used a significantly greater approach angle for curve kicks compared with straight kicks where 0º was the direction of the kick and the line perpendicular to the goal. As a result, the pelvis and foot were significantly more rotated at ball impact for the curve kicks (Table 1). There was no difference in the resultant velocity of the toe (5th metatarsal) at impact (p = 0.069) (Table 2), indicating a better transfer of momentum from the foot to the ball in the straight kicks to produce a higher ball velocity.
However when toe velocity was considered in its three separate axial components, there were significant differences between the two conditions (Table 2). This indicates that the path of the foot during the kicks differed in order to achieve the different flight outcomes, an area warranting further research. Table 1: Mean ± standard deviations for approach angle and impact variables. All angles are relative to the global coordinate system with 0º being the direction of the kick.
Angle (degrees) Curve Straight Approach * 42.1±7.6 20.4±6.6 Pelvis rotation1 * -25.8±5.6 -8.9±9.8 Foot ab / adduction2 * -63.6±8.8 -50.4±13.3
1negative is rotation to the right about a superior-inferior axis (i.e. right hip rotated behind left hip relative to target) 2negative is abduction, positive is adduction * indicates statistical significance Table 2: Mean ± standard deviations for the resultant and axial component velocities of the toe at impact.
Toe velocity (m·s-1) Curve Straight Resultant 15.0±1.5 15.7±1.5 X axis (medio-lateral)* 6.5±1.9 2.2±1.1 Y axis (antero-posterior)* 13.4±1.13 15.3±1.4 Z axis (superior-inferior)* -0.06±0.9 -2.3±0.9
* indicates statistical significance CONCLUSIONS Differences in kinematic variables at impact were identified for straight and curve kicks. Future research will investigate athlete kinematics prior to impact to better understand how these differences at impact are achieved. ACKNOWLEDGEMENTS The authors would like to acknowledge the use of the University of Western Australia BodyBuilder model in the analysis of data and members of the Australian Institute of Sport Biomechanics and Performance Analysis department for their contribution. REFERENCES 1. Asai T. The Engineering of Sport, pp. 487-94.
Blackwell Science Ltd, London, 2000. 2. Besier TF, et al. J Biomech 36: 1159-68. 3. Lees A & Nolan L. Science and Football IV,
pp. 16-21. Routledge, London, 2002.

62
CLINICAL MEASUREMENT OF MUSCLE LENGTH
Lee Barber, Rod Barrett and Glen Lichtwark
School of Physiotherapy and Exercise Science, Griffith University, Gold Coast, Australia email: [email protected]; web: www.griffith.edu.au/health/school-physiotherapy-exercise-science
INTRODUCTION Individuals with upper motor neuron disorders can develop spasticity and contracture which presents clinically as movement restrictions with reduced joint range of motion and muscle-tendon lengths. Muscle-tendon length is reduced in contracture due to shortening of the muscle belly length, however this is very difficult to quantify because a simple clinical measure of muscle belly length does not exist. Ultrasound imaging is effective at localising and allowing in vivo visualisation of superficial bony and soft tissue structures. Freehand 3D ultrasound has been used and validated for in vivo muscle belly length measurements [1-4]. This study compared a novel ultrasound-tape length measuring device to make measures of the medial gastrocnemius muscle belly length. METHODS In eleven subjects, the ultrasound-tape was used to measure the medial gastrocnemius muscle-tendon length (calcaneus to muscle insertion) and tendon length (calcaneus to muscle tendon junction). These measurements were performed at three ankle joint angles: maximum dorsiflexion, 60° and 30° maximum ankle range of motion, three times. Muscle belly lengths were calculated (muscle-tendon minus tendon length). The muscle belly of the medial gastrocnemius was also scanned at the same ankle joint angles, three times using freehand 3D ultrasound. The 3D ultrasound images were segmented, volumes rendered and muscle belly lengths measured. Muscle belly lengths were compared between the two measurement methods. RESULTS Muscle belly lengths assessed in the study were in the range 200 - 300 mm (Fig 1). The ultrasound-tape was found to be a valid measure of muscle belly length overestimating by only 0.2 ± 0.6 mm (0.1 ± 0.2% difference) compared to the 3D ultrasound measure. The 95% confidence interval for the level of agreement between the 3D ultrasound and the ultrasound-tape was 6 mm for muscle belly length (Fig 1).
Figure 1: Scatter plots and Bland-Altman plots of the medial gastrocnemius muscle belly length in three ankle positions. The diagonal line in the scatter plots corresponds to the line of perfect agreement. The horizontal lines on the Bland-Altman plots represent the mean difference and the upper and lower 95% limits of agreement. CONCLUSION The ultrasound-tape is a valid method for the measurement of human muscle belly length in vivo. This simple tool may be used to monitor changes in muscle-tendon, muscle belly and tendon length during the development of contracture following neurological disorders such as cerebral palsy, stroke and multiple sclerosis or to monitor the affects of surgical or conservative interventions. REFERENCES 1. Barber LA, et al. J Biomech 42: 1313-9, 2009. 2. Fry NR, et al. Gait Posture 17: 119-24, 2003. 3. Malaiya R, et al. J Electromyogr Kinesiol 17: 402-7, 2007. 4. Weller R, et al. Ultrasound Med Biol 33: 657-63, 2007.

Proceedings of the 7th Australasian Biomechanics Conference, Griffith University, November /December 2009
63
AN EXPLORATORY TWO-DIMENSIONAL KINEMATIC ANALYSIS OF THREE COMMONLY USED CRICKET SHOES BY FAST BOWLERS IN ELITE CRICKET
1,2 Chris Bishop and 2 Dominic Thewlis
1Leading Edge Physical Therapy, Rose Park, Adelaide, Australia
2School of Health Sciences, University of South Australia, Adelaide, Australia email: [email protected]
INTRODUCTION The use of footwear in cricket, and in particular in fast bowling, has been poorly reported in biomechanical and sports medicine research. It is widely accepted that cricket as a non-contact sport has a very high risk of bowling injury [1]. This has been largely attributed to increased ground reaction forces during the delivery stride [2] and the activity of the lead limb knee joint [3]. Athletic footwear companies have developed cricket specific shoes with characteristic design features aimed to reduce biomechanical injury. The aim of the study is to explore the relationship between footwear and lead limb knee and ankle joint activity, and whether this changes between three cricket shoes commonly worn by the fast bowler. METHODS An exploratory cohort study was performed using a within-subject, repeated measures design. Five male subjects were recruited from the South Australian Cricket Association (SACA). The hip, knee, ankle and 5th MTPJ were marked to facilitate a two-dimensional analysis of front knee and ankle joint kinematics in the sagittal plane. Bowlers were provided with 3 pairs of shoes (ASICS 170no, ASICS 480 TR and ASICS Gel Strike Rate) and bowled 8 balls in each of the three pairs of shoes. Video data was captured on the position of the lead limb knee and ankle joint at heel strike, mid stance and propulsion of the delivery stride. Video images were digitized at each event to calculate the knee joint flexion/extension angle and the ankle joint dorsiflexion/plantarflexion angle. Statistical analysis was carried out using SPSS. Ethics approval was received from the Division of Health Science, Human Research Ethics Committee, University of South Australia. RESULTS A significant difference in front knee joint extension/flexion angle was identified between the three footwear environments at heel strike (P<0.05). There was no significant difference noted in the front knee joint extension/flexion angle at midstance or propulsion. The ankle plantarflexion/dorsiflexion angle did not change significantly between the three shoes at heel strike, midstance or propulsion. Post hoc pairwise comparisons (Table 1) identified a significant mean decrease in knee joint flexion of 2.5deg between the ASICS 480 TR and ASICS Gel Strike Rate (p=0.049). An additional significant mean increase in knee joint extension of 2.7 deg was identified between ASICS 170 no and the ASICS Gel Strike Rate (p=0.021).
Table 1: Post-hoc pairwise comparisons for the significant knee kinematics (degrees) in the sagittal plane. Mean difference P valueKnee Joint – Heel Strike ASICS 170no – 480 TR -0.2 0.688 ASICS 480 TR – Gel Strike Rate 2.6 0.049 ASICS Gel Strike Rate – 170 no -2.8 0.021 The results of this study support the technical notion that bowlers should land on their heel with a flexed front knee and dorsiflexed ankle joint, proceed to extend their knee joint and plantarflex their ankle joint through midstance, and remain at or near this position in preparation for propulsion and toe off. DISCUSSION This is the first study to consider the lower limb kinematics of the knee and ankle joint at three key events of the gait cycle; heel strike, midstance and propulsion. The range of knee joint angles reported in this study (mean 169deg – 171deg) compared very well to the literature [3], who reported 173 deg at front foot strike. Any noticeable differences in knee joint sagittal plane kinematics found in this study can be explained by experimental and methodological errors, whereby true joint measurements are not recorded due to insufficiency in two-dimensional measurements and perspective camera error. CONCLUSION An effect was identified at the knee joint at heel strike between conditions. No difference was identified at the ankle joint between conditions. This change in knee joint angle may prove important when considering an individual’s susceptibility to injury and the role footwear may play in reducing the mechanism of lower limb injury to the fast bowler in cricket. ACKNOWLEDGEMENTS ASICS Oceania provided the footwear for this study. The SACA provided the participants for this study. REFERENCES 1. Fitch K. Send the Stumps Flying: The Science of Fast
Bowling. 60-67, 1989. 2. Stretch. South African Medical Journal 91: 336-9,
1993. 3. Elliot BC & Foster D. J Hum Mov Stud 10: 83-94,
1984.

64
KINEMATICS AND KINETICS OF MALE THREE AND FOUR TURN HAMMER THROWERS
1,2 Sara M. Brice, 1 Kevin F. Ness and 2 Doug Rosemond
1Engineering and Physical Sciences, James Cook University 2 Biomechanics and Performance Analysis, Australian Institute of Sport
email: [email protected] INTRODUCTION The aim of the hammer throw is to throw the hammer as far as possible. Athletes perform preliminry swings followed by full body turns and release. An athlete performs three or four turns with each turn consisting of a double and single leg support (DS and SS) phase. There is no biomechanical evidence that indicates whether the three of four turn technique is superior. It has been suggested that the number of turns an athlete undergoes is determined by technical ability and power development [1]. In recent years the top male athletes have predominantly been four turn throwers however the world record was set by a three turn thrower. The aim of this study was to compare both turn techniques to determine which is more favorable. METHODS Four elite Australian male hammer throwers (two four turn and two three turn) participated in this study. Each was required to perform ten throws with a hammer that had retro-reflective tape positioned on the wire at known distances. The positions of the tape were captured using 21 Vicon cameras (Oxford, UK) sampling at 250 Hz. The hammer head position relative to the tape was determined using direction cosines. The magnitude of the force applied by the athlete to the hammer’s head (cable force, FC) was derived from the kinematics of the hammer’s head [2]. From this, the tangential component of the cable force (FCt) was determined using:
FCt = FC cos θ where θ is the angle between the cable force vector and the velocity vector. The hammer speed, power and work that the cable force applied were also determined. RESULTS AND DISCUSSION The most important kinematic variable, with regards to distance thrown, is release speed of the hammer [3]. This was supported by a strong correlation between release speed and distance thrown for both techniques (R3turn = 0.93 and R4turn = 0.92). The release speed was similar for both techniques (three turn: 24.37 ± 0.96 m.s-1, four turn: 24.67 ± 0.44 m.s-1). Plots of speed versus time showed a distinct peak and trough in each turn for both techniques. The peak generally occured at the end of DS and the trough during SS. For the four turn throwers there was a more gradual increase in the magnitude of the speed than for the three turn throwers which could allow a slower, more controlled increase in hammer speed. As the hammer is travelling at a slower speed in the early parts of a four turn throw, this could potentially allow a four turn thrower to correct aspects of throw technqiue which may not be as easy to correct under the higher speeds of a three turn throw.
As with speed, the cable force had a peak and a trough in its trace for each turn with a final peak occurring just prior to release (Fig 1). The cable force differed from the speed in that the force peak occurred earlier in DS, approximately when the hammer was going through its lowest point. For both techniques, the cable force dropped off at the end of DS and began increasing at the end of SS. The three turn throwers started at a higher magnitude and increased the force at a faster rate.
Figure 1: Magnitude of FC for a three and four turn throw from entry to release (DS and SS indicated at top (four turn) and bottom (three turn)). The tangential component of the cable force is important as it has the greatest effect on the speed. For all throwers the timing of when the tangential force was negative in magnitude closely matched with when the speed decreased. This coincided with when the cable force was producing negative work on the hammer and when there was a reduction in power. CONCLUSIONS Even though it cannot be conclusively determined which technique is better it can be inferred that a four turn thrower has more time to carry out their throw which may allow for greater power development. A slower technique may also allow the athlete to make corrections to technique more easily during a throw. Future research into athlete based kinematics is required to definitively say which technique may be better, although strength and ability may be the limiting factors as to which technique an individual uses. REFERENCES 1. Jaede E. Mod Athlete & Coach 29: 16-9, 1991. 2. Brice SM, et al. Sport Biomech 7: 274-87, 2008. 3. Dapena J. J Biomech 17: 553-9, 1984.
0 0.2 0.4 0.6 0.8 1 1.2 1.4 1.6 1.8 20
500
1000
1500
2000
2500
3000
Time of a three turn throw (sec)
Cab
le fo
rce
mag
nitu
de (N
)
0 0.5 1 1.5 2 2.5
0
500
1000
1500
2000
2500
3000
Time of a four turn throw (sec)
Three turn throw (63.22m)
Four turn throw (60.71m)
DS SS DS SS DS SS DS SS DS
DS SS DS SS DS SS DS
Three turn throw (63.22m)
Four turn throw (60.71m)
DS SS DS SS DS SS DS SS DS
DS SS DS SS DS SS DS
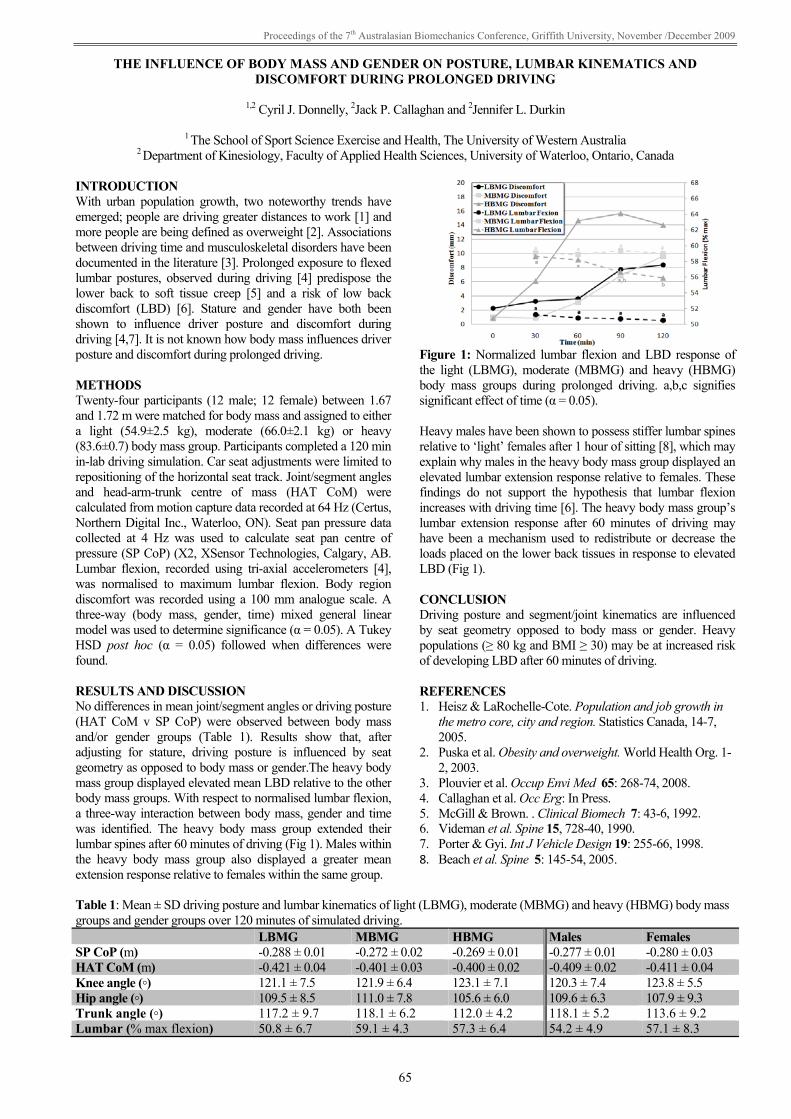
Proceedings of the 7th Australasian Biomechanics Conference, Griffith University, November /December 2009
65
THE INFLUENCE OF BODY MASS AND GENDER ON POSTURE, LUMBAR KINEMATICS AND DISCOMFORT DURING PROLONGED DRIVING
1,2 Cyril J. Donnelly, 2Jack P. Callaghan and 2Jennifer L. Durkin
1 The School of Sport Science Exercise and Health, The University of Western Australia
2 Department of Kinesiology, Faculty of Applied Health Sciences, University of Waterloo, Ontario, Canada INTRODUCTION With urban population growth, two noteworthy trends have emerged; people are driving greater distances to work [1] and more people are being defined as overweight [2]. Associations between driving time and musculoskeletal disorders have been documented in the literature [3]. Prolonged exposure to flexed lumbar postures, observed during driving [4] predispose the lower back to soft tissue creep [5] and a risk of low back discomfort (LBD) [6]. Stature and gender have both been shown to influence driver posture and discomfort during driving [4,7]. It is not known how body mass influences driver posture and discomfort during prolonged driving. METHODS Twenty-four participants (12 male; 12 female) between 1.67 and 1.72 m were matched for body mass and assigned to either a light (54.9±2.5 kg), moderate (66.0±2.1 kg) or heavy (83.6±0.7) body mass group. Participants completed a 120 min in-lab driving simulation. Car seat adjustments were limited to repositioning of the horizontal seat track. Joint/segment angles and head-arm-trunk centre of mass (HAT CoM) were calculated from motion capture data recorded at 64 Hz (Certus, Northern Digital Inc., Waterloo, ON). Seat pan pressure data collected at 4 Hz was used to calculate seat pan centre of pressure (SP CoP) (X2, XSensor Technologies, Calgary, AB. Lumbar flexion, recorded using tri-axial accelerometers [4], was normalised to maximum lumbar flexion. Body region discomfort was recorded using a 100 mm analogue scale. A three-way (body mass, gender, time) mixed general linear model was used to determine significance (α = 0.05). A Tukey HSD post hoc (α = 0.05) followed when differences were found. RESULTS AND DISCUSSION No differences in mean joint/segment angles or driving posture (HAT CoM v SP CoP) were observed between body mass and/or gender groups (Table 1). Results show that, after adjusting for stature, driving posture is influenced by seat geometry as opposed to body mass or gender.The heavy body mass group displayed elevated mean LBD relative to the other body mass groups. With respect to normalised lumbar flexion, a three-way interaction between body mass, gender and time was identified. The heavy body mass group extended their lumbar spines after 60 minutes of driving (Fig 1). Males within the heavy body mass group also displayed a greater mean extension response relative to females within the same group.
Figure 1: Normalized lumbar flexion and LBD response of the light (LBMG), moderate (MBMG) and heavy (HBMG) body mass groups during prolonged driving. a,b,c signifies significant effect of time (α = 0.05). Heavy males have been shown to possess stiffer lumbar spines relative to ‘light’ females after 1 hour of sitting [8], which may explain why males in the heavy body mass group displayed an elevated lumbar extension response relative to females. These findings do not support the hypothesis that lumbar flexion increases with driving time [6]. The heavy body mass group’s lumbar extension response after 60 minutes of driving may have been a mechanism used to redistribute or decrease the loads placed on the lower back tissues in response to elevated LBD (Fig 1). CONCLUSION Driving posture and segment/joint kinematics are influenced by seat geometry opposed to body mass or gender. Heavy populations (≥ 80 kg and BMI ≥ 30) may be at increased risk of developing LBD after 60 minutes of driving. REFERENCES 1. Heisz & LaRochelle-Cote. Population and job growth in
the metro core, city and region. Statistics Canada, 14-7, 2005.
2. Puska et al. Obesity and overweight. World Health Org. 1-2, 2003.
3. Plouvier et al. Occup Envi Med 65: 268-74, 2008. 4. Callaghan et al. Occ Erg: In Press. 5. McGill & Brown. . Clinical Biomech 7: 43-6, 1992. 6. Videman et al. Spine 15, 728-40, 1990. 7. Porter & Gyi. Int J Vehicle Design 19: 255-66, 1998. 8. Beach et al. Spine 5: 145-54, 2005.
Table 1: Mean ± SD driving posture and lumbar kinematics of light (LBMG), moderate (MBMG) and heavy (HBMG) body mass groups and gender groups over 120 minutes of simulated driving. LBMG MBMG HBMG Males Females SP CoP (m) -0.288 ± 0.01 -0.272 ± 0.02 -0.269 ± 0.01 -0.277 ± 0.01 -0.280 ± 0.03 HAT CoM (m) -0.421 ± 0.04 -0.401 ± 0.03 -0.400 ± 0.02 -0.409 ± 0.02 -0.411 ± 0.04 Knee angle (◦) 121.1 ± 7.5 121.9 ± 6.4 123.1 ± 7.1 120.3 ± 7.4 123.8 ± 5.5 Hip angle (◦) 109.5 ± 8.5 111.0 ± 7.8 105.6 ± 6.0 109.6 ± 6.3 107.9 ± 9.3 Trunk angle (◦) 117.2 ± 9.7 118.1 ± 6.2 112.0 ± 4.2 118.1 ± 5.2 113.6 ± 9.2 Lumbar (% max flexion) 50.8 ± 6.7 59.1 ± 4.3 57.3 ± 6.4 54.2 ± 4.9 57.1 ± 8.3

66
COMPARISON OF PASSIVE AND DYNAMIC SHOULDER RANGE OF MOTION MEASURES IN ELITE COLLEGIATE THROWING ATHLETES FOLLOWING SHOULDER TAPING
1 James Dunne, 1 Cyril J. Donnelly, 2Thor Besier and 3Jenny McConnell
1 The School of Sport Science, Exercise and Health, The University of Western Australia
2Human Performance Laboratory, Department of Orthopaedics, Stanford University 3McConnell & Clements Physiotherapy
email: [email protected]
INTRODUCTION Overhead throwing athletes generally have reduced internal and increased external arm rotation range of motion (ARROM) in their preferred throwing arm. This has been attributed to differences in posterior capsule tightness and humeral torsion angle [1,2,3]. The application of shoulder taping has been shown to increase the passive total ARROM in asymptomatic athletes [4]. The aim of this study was to determine if clinical measures of passive ARROM following shoulder taping are associated with dynamic ARROM measured during overhead throwing tasks. METHODS Five asymptomatic elite collegiate over-head throwing athletes (3 female, 2 male) were recruited for clinical and biomechanical testing. Passive ARROM of each participants preferred throwing arm was randomly measured with and without shoulder while in a supine position. To measure passive ARROM, participants preferred throwing arm was abducted and elbow flexed to 90º. The glenohumeral joint was passively rotated into internal and external rotation until scapulothoracic movement occurred. A goniometer was used to measure the relative change in internal and external rotation. Dynamic measures of ARROM were randomly measured during restrained seated overhead throwing task with and without shoulder taping. An 8-camera VICON (VICON Peak, Oxford, UK) motion capture system recorded retro-reflective kinematic markers placed on the trunk, each segment of the preferred throwing arm and the ball at 120 Hz. Participants threw a handball three times. An OpenSim (OpenSim, Stanford CA) kinematic model of the upper limb and trunk was scaled and inverse kinematics was used to calculate shoulder (3dof) and elbow (2 dof) angles. A two-way repeated measures ANOVA (α = 0.05) with measurement method (between groups) and taped condition (within group) was used. A one-way ANOVA was also used to compare the differences in ARROM between taped and un-taped conditions. RESULTS & DISCUSSION Mean ball velocity, elbow flexion, shoulder flexion and shoulder abduction were not affected by the application of tape. Passive measures of ARROM were significantly greater than dynamic measures of ARROM during throwing (p = 0.047), while the effect of taping showed a positive trends towards increasing ARROM when measured clinically and dynamically (p = 0.067) (Fig 1). These results suggest that clinical passive measures of ARROM are not associated with AAROM during dynamic throwing tasks.
Figure 1: Glenohumeral taping and ARROM using clinical passive and dynamic (overhead throwing) measures. Results showed that differences following shoulder taping were not statistically different when using passive clinical or dynamic measures (5.8 ± 11.72 & 7.59 ± 2.82, respectively)(p = 0.678). This suggests that passive clinical measures of ARROM are reasonable estimates of how taping will influence ARROM during overhead throwing. Though results from this study are significant, further research using a larger cohort of asymptomatic overhead throwing athletes is being conducted to confirm results. CONCLUSION Passive clinical measures of ARROM are not associated with the dynamic ARROM measured during overhead throwing tasks. Passive clinical measures of ARROM are reasonable estimates of how shoulder taping will influence dynamic ARROM during overhead throwing tasks in asymptomatic throwing populations. ACKNOWLEDGEMENTS This study was funded by the NSW Sporting Injuries Committee. The authors would like to thank Samuel Hamner for model development and varsity athletes who volunteered to be involved in this study. REFERENCES 1. Ellenbecker TS, et al. Med Sci Sport Exerc 34: 2052-
62, 2002. 2. Clabbers KM, et al. J Sport Rehab 16: 41-9, 2007. 3. Pieper HG. Am J Sports Med 26:247- 54, 1998. 4. McConnell J & McIntosh B. Clin J Sports Med: In
Press.
0
20
40
60
80
100
120
140
160
180
NoTape TapeARR
OM (D
egrees)
Clinical Measure
Dynamic Measure

Proceedings of the 7th Australasian Biomechanics Conference, Griffith University, November /December 2009
67
LOWER EXTREMITY STRENGTH DEMANDS OF BALANCE RECOVERY BY STEPPING IN YOUNG AND OLDER ADULTS
Jarred Gillett, Glen Lichtwark, Chris Carty and Rod Barrett
School of Physiotherapy and Exercise Science, Griffith University, Gold Coast, Australia email: [email protected]; web: www.griffith.edu.au/health/school-physiotherapy-exercise-science
INTRODUCTION Falls are a major health concern for the elderly population. The loss of strength that occurs with ageing is thought to contribute to the reduced balance recovery ability in the elderly population [1]. It is important to understand the mechanisms and risk factors that underlie falls and, perhaps more importantly, the mechanisms underlying successful balance recovery in order to establish intervention programs aimed at decreasing the incidence of falls in the elderly. Although studies have found age-related differences in joint torque requirements in balance recovery by stepping (BRBS) [2], this study offers novel findings on the torques produced following step contact during BRBS relative to subject-specific maximum isometric strength. METHODS Seven young subjects (5M, 2F) aged 24 ± 5 years, and seven older subjects (5M, 2F) aged 74 ± 5 years underwent isometric strength testing and performed a BRBS task. Maximum isometric torque data of ankle, knee, and hip extensors were collected using a Biodex Isokinetic Dynamometer (System 4 Pro). Three isometric contractions were performed at five joint angles throughout range of motion. For the BRBS task, participants were released from forward restraint using a tether release method [3]. Participants were leaned forward until 20% body weight was recorded on a strain gauge attached to a tether at the posterior pelvis. Once motionless, the tether was released at a random time interval by removing the current from an electromagnet via a trigger pulse. Ground reaction force data was collected at 1000 Hz using two force platforms, and joint moment data were calculated using inverse dynamic methods. 3D kinematic data were recorded at 200 Hz using a 10 camera Vicon motion analysis system. ANOVA was used to test for significant differences between young and older groups with significance determined at an alpha level of 0.05. RESULTS AND DISCUSSION The young group produced significantly greater isometric knee and hip extensor torque than the older adults (p < 0.05) (Table 1).
All participants recovered balance following release of the tether using a single step. Absolute peak landing phase torque was significantly greater in the young group at the hip compared to the older group (p < 0.05) (Fig 1A). Following normalisation to maximum isometric strength, the strength demands of BRBS were significantly higher for the older subjects at the knee joint (p < 0.005), with a non-significant trend at the hip (p = 0.086) (Fig 1B). A B
Figure 1: A. Peak joint extension torque during the landing phase of BRBS in young and older subjects. B. Peak joint extension torque during the landing phase BRBS ÷ maximum voluntary isometric extension torque of young and older groups. Values are mean ± 1 standard deviation. * Indicates significant effect of age, p < 0.05. CONCLUSIONS • Older adults produced significantly lower maximum isometric torque at the knee and hip extensors compared to young individuals. • Peak landing phase hip extensor torque was significantly greater in the young adults compared to older subjects. • Normalised landing phase torques indicated a larger muscular demand on the knee extensors of older individuals to successfully restore balance compared to young adults. • Knee extensor strength may be limiting factor in older adults recovering balance following a forward fall. REFERENCES 1. Moreland et al. J Am Geriatr Soc 52: 1121-9, 2004. 2. Madigan ML & Lloyd EM. J Gerontol 60A: 910-4,
2005. 3. Hsiao-Wecksler ET. J Electromyography Kinesiol 18:
179-87, 2008.
Table 1: Age-related differences in isometric torque production averaged across all angles in the ankle, knee and hip. Muscle Group Young (Nm.Kg-1) Older (Nm.Kg-1) Older (% of Young) F (1, 12) P value Ankle Plantar Flexors 1.19 ± 0.53 0.93 ± 0.41 78.2 2.22 0.162 Knee Extensors 2.58 ± 0.82 1.63 ± 0.57 63.2 12.53 0.004* Hip Extensors 1.70 ± 0.68 0.91 ± 0.42 53.5 10.18 0.008* Data are mean ± 1 standard deviation. * Indicates significant difference between young and older adults.
ankle knee hip0
0.5
1
1.5
2
2.5
3
3.5
4*
Joint
Peak
Lan
ding
Tor
que
(Nm
/kg)
YoungOlder
ankle knee hip0
50
100
150
200
250
300
Joint
BR
BS
Tor
que
/ Max
imum
Isom
etri
c T
orqu
e (%
)
*
YoungOlder

68
THE EFFECT OF CEREBROSPINAL FLUID THICKNESS ON TRAUMATIC SPINAL CORD DEFORMATION
1 K Cecilia Persson, 2 Jon L Summers, 1 Richard M Hall
1 Institute of Medical and Biological Engineering, School of Mechanical Engineering, University of Leeds, UK 2 Institute of Engineering Thermofluids, Surfaces and Interfaces, Mechanical Engineering, University of Leeds, UK
email: [email protected]; web: www.imbe.leeds.ac.uk
INTRODUCTION Vertebral burst fractures account for 15-30% of all traumatic spinal cord injuries (SCI) and may lead to paralysis or even death [1]. Different mechanisms of trauma such as vertebral fractures and/or dislocations have been found to give rise to different patterns of neurological damage [2]. Therefore an understanding of the initial mechanical insult may be important to SCI prevention strategies and/or therapies. Previous research has found that the cerebrospinal fluid (CSF) surrounding the cord may limit cord deformation during impact [3,4]. However, the effects of small variations to the system are difficult to detect experimentally and a computational model may be useful for the evaluation of these changes. The aim of this study was to use a validated fluid-structure interaction (FSI) model of the impact between bone and cord in order to assess the effect of CSF layer thickness. METHODS A three-dimensional FSI model of the spinal cord and para-spinal tissue was built in ADINA® (ADINA R&D Inc., Watertown, MA). This model was validated with in vitro test data from transverse impact tests between a simulated bone fragment and the detached bovine spinal cord [4]. The spinal cord was modelled using a non-linear material model and the CSF was modelled as a Newtonian fluid (saline solution). Three thicknesses of CSF layer were used based on the range (0.6-2.8mm) and the average (1.5mm) thickness found in the experiments. Another two geometries were used to represent the human spinal canal at levels commonly subject to burst fractures, C6 and T12, based on geometry found in vivo [5]. Cross-sections of the average bovine and the human cord geometries are shown in figure 1.
Figure 1: Cross-sections of the cord geometries. RESULTS AND DISCUSSION The geometry of the cord and the thickness of the CSF layer were found to have a significant influence on the displacement pattern of the cord as shown in Figure 2: In general, the maximum cord deformation occurred before the maximum deformation of the whole construct.
However, the minimum CSF layer gave a cord deformation that followed the deformation of the whole construct more closely. The maximum cord deformation was, in this case, significantly higher than for the other two bovine CSF layers, which presented similar amounts of maximum cord deformation. This suggests that there exists an optimum thickness of the CSF layer for a given cord geometry. The human geometries (with smaller cords but thicker CSF layers) gave significantly lower cord deformations and durations of deformation than the bovine ones. The presence of CSF also gave a greater longitudinal spread of stresses and strains within the cord. These findings suggest that the SCI insult generated in the frequently used rat model may not be representative of an injury in humans, as the relative CSF layer is even thinner in rats.
Figure 2: Fragment trajectory into the spinal cord surrounded by dura and CSF. Filled lines give the deformation of the whole construct (cord/dura/ CSF) and dashed lines give the cord deformations. CONCLUSIONS The CSF layer plays a significant role in modulating the spinal cord deformation during trauma and should be adequately represented in future models. Furthermore, the different deformation patterns found for bovine and human geometries suggest that the morphology of in vivo animal models needs to be taken into careful consideration if the effects of different injury mechanisms are to be extrapolated to humans. REFERENCES 1. Sekhon LH, et al. Spine 26: S2-12, 2001. 2. Choo AM, et al. J Neurosurg Spine 6: 255-66, 2007. 3. Jones CF, et al. Spine. 33: E580-8, 2008. 4. Persson C, et al. J Neurosurg Spine 10: 315-23, 2009. 5. Holsheimer J, et al. Am J Neuroradiol 15: 951-9, 1994.
01234567
0 1 2 3 4 5 6 7 8 9
Def
orm
atio
n (m
m)
Time (ms)
Bovine - average
Human - C6
Human - T12
Bovine - average -cordHuman - C6 -cordHuman - T12 -cord

Proceedings of the 7th Australasian Biomechanics Conference, Griffith University, November /December 2009
69
BIOMECHANICAL COMPARISON BETWEEN HIGH PERFORMANCE AND NON-HIGH PERFORMANCE KARATE ATHLETES BASED ON GENERAL AND SPORTS SPECIFIC MOTOR FITNESS TESTS
1 Hovik Keshishian and 2 Ian Heazlewood
1 ACU National
2 Charles Darwin University email: [email protected]
INTRODUCTION The sport of karate has been in existence for approximately 5000 years and it is thought to have originated in India. Today the sport of karate has achieved international significance and has been included in the Modern Olympic Games from 2000 and the Australian National Team participated in the first World Karate Championships in 1970. However, this long history of activity is coupled with minimal exercise and sport science research to develop evidence-based practice for talent ID, training and competition [1]. Minimal evidence has examined whether biomechanical general and specific fitness constructs such as strength, power, speed and ROM discriminate between karate athletes of different abilities. The aim of the research was to assess if general and karate specific biomechanical based motor fitness tests can discriminate between karate athletes of different abilities. It was hypothesised that the karate or sport specific test would be more discriminatory than the general tests. The research design was based on comparative descriptive methodology [2]. METHODS Ethics approval was obtained from ACU National Research Ethics Committee to conduct the research. The study site was in a climate controlled exercise science laboratory at ACU National. The study compared volunteer adult male high performance (n=12) and non-high performance (n=12) karate athletes. Specifically, the classification for high performance athletes were males who hold a black belt or higher with no known illnesses or injury and non-high performance or novice athletes were males who hold a green belt or lower. The variables of age, height and weight were recorded and the variables were not significantly different between the groups. The tests were based on established tests [3] of strength, power, speed and ROM and sports specific developed tests for these constructs. The general motor fitness tests [3] were the Margaria power test, Wingate 30s power test, standing long jump, isometric handgrip force, stability, sit/reach ROM, upper body power-arm crank and simple reaction time. Sports specific biomechanics motor fitness tests were designed by a panel of experts, masters, coaches and competitors from the sport of karate and included maximal ROM bilateral lower extremity abduction, a specific karate agility test, karate power punch and karate speed punch. Age, height and weight were also recorded and which were not significantly different between the groups.
The statistical analysis consisted of independent t-test and discriminant function analysis [2]. Discriminant analysis classifies participants into several mutually exclusive groups (two groups in this context), on the basis of the dependent variable scores, establishes which characteristics are important to distinguish between the groups and evaluate the accuracy of the classification. The higher the classification rate as a percentage beyond chance alone the better, the best value is 100%. RESULTS AND DISCUSSION The univariate t-tests indicated that both general (Margaria power test, Wingate 30s power test, stability, sit/reach ROM and upper body power-arm crank) and sports specific (maximal ROM bilateral lower extremity abduction, specific karate agility test, karate power punch and karate speed punch) tests showed significant (p < 0.05 -0.01) difference between the groups and in favour of the high performance athletes. Based on the findings at the univariate level, those variables within the general and sport specific sets, which indicated significant difference, were included in the discriminant analysis. Discriminant analysis using stepwise statistical and then the researcher specified enter method was applied to develop a statistical hierarchy to identify which variables were the best event specific discriminators. A subset of variables from pooled from general and specific tests indicated group membership could be classified correctly in 95.7% of cases. Dividing the variables into general and specific tests resulted in 95.7% and 91.7% classification rates respectively. For each analysis the high performance athletes were classified at 100%, where the misclassification occurred with one or two novice athletes. These results indicate that both general and specific test can accurately classify ability groups with a high degree of accuracy using general and specific biomechanics based variable sets or in combination. CONCLUSIONS These findings indicate both general and specific biomechanical motor fitness tests can be applied to talent identification for the sport of karate as well as assisting to design general and event specific training programs. REFERENCES 1. Beneke R, et al. Euro J Appl Physiol 95: 518-23, 2004. 2. Hair JF, et al. Multivariate Data Analysis. Pearson
Education International, Sydney, 2006. 3. Shell J, et al. Physical Fitness Assessment in Exercise
and Sport Science. Leelar Biomediscience, Sydney, 1994.

70
GAIT SYMMETRY MEASURES FOR PRIMARY SCHOOL-AGED CHILDREN AND YOUNG ADULTS
1Noel Lythgo, 2Cameron Wilson, 1Mary Galea
1Rehabilitation Sciences Research Centre, The University of Melbourne 2Australian Catholic University email: [email protected]
INTRODUCTION Limited knowledge exists about the gait symmetry of healthy school-aged children. The aims of this investigation were to: (1) record normative or reference gait symmetry data from a large sample of healthy school-aged children and young adults whilst walking barefoot and shod; and, (2) assess whether gait symmetry is affected by age. METHODS A sample of 898 healthy able-bodied children (5 to 13 yrs) and 82 young adults (19.6 ± 1.6 yrs) participated in this study. Participants were excluded if any neurological, musculoskeletal or other medical conditions affected their gait. The children were tested in schools, whereas the young adults were tested in a gait laboratory. The school test venues were located in isolated areas such as the gymnasium. The same assessors collected the data and were overseen by the chief investigator. The participants were bought to the test venue in groups of three or less to minimize distraction. Each participant wore athletic shoes or runners. Participants completed 2 practice trials followed by 6 to 8 walks across a GAITRite mat (80 Hz) at self-selected speed. Footwear and socks were then removed and 6 to 8 walks completed at self-selected speed. In order to achieve steady state gait, an approach and departure distance of at least 4 m was used [1]. Basic gait measures were extracted from each trial. Average gait parameter data were calculated for each participant and used in the statistical analyses. Gait parameters extracted were step and stride length, single support, double support, step and swing time. Symmetry measures were calculated by the following equation; Symmetry = ⎟Right Measure - Left Measure⎜.
Temporal measures were expressed relative to the gait cycle (%). The method described by Conover [2] was used to calculate confidence intervals for non-normal data sets. Pearson’s product moment correlation was used to examine the effect of age (SPSS). RESULTS AND DISCUSSION Data sets were found to be non-normal. Symmetry was unaffected by age with correlation values ranging from -0.095 to 0.085. On average (combining conditions), measures of step and stride symmetry were 0.8 cm and 0.6 cm respectively. Symmetry measures for step, swing, single and double support times fell below 0.9%. CONCLUSIONS Symmetry was found to be remarkably invariant across age. Step and stride differentials fell around 0.7 cm whereas temporal differentials fell around 0.6%. This shows that gait is highly symmetrical in healthy children and young adults. This appears to be an invariant quality of human gait but may change with pathology. ACKNOWLEDGEMENTS Funding was granted by the Faculty of Medicine, Health Sciences and Dentistry, University of Melbourne. REFERENCES 1. Lindemann U. Gait Posture 27: 91-6, 2008 2. Conover, WJ. Practical Nonparametric Statistics. New
York: John Wiley and Sons, 1980.
Table 1: Basic gait symmetry measures (Mean, 95% CI) for barefoot walking condition.
Age (yrs)
Step Length (cm)
Stride Length (cm)
Step Time (%)
Swing Time (%)
Single Support (%)
Double Support (%)
5.7 (0.2) 0.6 (0.4-0.7) 0.6 (0.2-0.7) 0.59 (0.41-0.71) 0.38 (0.26-0.53) 0.69 (0.39-0.82) 0.36 (0.27-0.42) 6.6 (0.3) 0.7 (0.5-0.9) 0.5 (0.4-0.7) 0.62 (0.57-0.82) 0.56 (0.40-0.67) 0.66 (0.54-0.77) 0.38 (0.29-0.42) 7.5 (0.3) 0.8 (0.6-0.8) 0.6 (0.5-0.7) 0.70 (0.56-0.84) 0.60 (0.47-0.68) 0.65 (0.54-0.87) 0.26 (0.19-0.35) 8.5 (0.3) 0.7 (0.5-1.0) 0.5 (0.4-0.6) 0.78 (0.51-0.92) 0.67 (0.53-0.76) 0.52 (0.36-0.60) 0.30 (0.23-0.36) 9.5 (0.3) 0.8 (0.5-1.0) 0.6 (0.4-0.6) 0.64 (0.47-0.76) 0.65 (0.49-0.70) 0.74 (0.51-0.88) 0.32 (0.26-0.41) 10.5 (0.3) 0.8 (0.5-1.2) 0.7 (0.4-0.9) 0.57 (0.31-0.74) 0.51 (0.35-0.62) 0.56 (0.33-0.73) 0.33 (0.24-0.38) 11.5 (0.3) 1.0 (0.7-1.2) 0.6 (0.3-0.7) 0.52 (0.33-0.60) 0.70 (0.47-0.75) 0.66 (0.45-0.79) 0.27 (0.14-0.30) 12.6 (0.5) 0.9 (0.5-1.1) 0.6 (0.4-0.7) 0.61 (0.36-0.70) 0.66 (0.40-0.72) 0.81 (0.61-0.92) 0.31 (0.22-0.34) 19.6 (1.6) 0.7 (0.5-0.8) 0.6 (0.4-0.7) 0.62 (0.37-0.73) 0.75 (0.49-0.85) 0.88 (0.52-1.00) 0.36 (0.23-0.38)

Proceedings of the 7th Australasian Biomechanics Conference, Griffith University, November /December 2009
71
UTILITY OF 3D MOTION ANALYSIS TO ASSESS CERVICAL DYSTONIA SEVERITY AND RESPONSE TO BOTULINUM TOXIN TREATMENT
1 Noel Lythgo and 2 Katya Kotschet
1 Rehabilitation Sciences Research Centre, The University of Melbourne
2 St Vincent’s Hospital, Melbourne, Victoria email: [email protected]
INTRODUCTION Cervical dystonia (CD) is a neurological condition causing involuntary contractions in neck musculature, leading to abnormal postures (dystonia) and repetitive movements or tremor. In CD, aberrant brain signals are believed to increase muscle activity (with superimposed tremor) causing the head/neck to be pulled towards the direction of action of the dystonic muscles. These actions result in muscle hypertrophy, but it is not known whether this occurs before or after the onset of abnormal neck posturing (i.e. cause or effect). Generally, only a few muscles are affected by CD, and these are targeted with botulinum toxin treatment. This treatment improves symptoms but has unwanted side effects and is also costly. Treatment is most effective when only the dystonic muscles are injected. Clinicians find it difficult, however, to identify the muscles that are most affected. Currently, the decision is based on a combination of clinical assessment (palpable muscle enlargement, direction of neck rotation) and EMG, however, neither is more than 80% accurate. There is a need for novel and objective measures to assess CD severity to guide muscle selection for treatment. The aim of this investigation is to examine the utility of 3D motion analysis, in conjunction with radiological imaging (MRI, magnetic resonance imaging) and clinical assessment, to objectively measure head/neck motion and tremor in patients with CD. METHODS Nineteen CD patients participated in this study (Age: 56.3 ± 14.4 yrs). At this stage, participants have been clinically assessed, completed MRI and 3D movement analysis. Only preliminary data has been extracted and reported here. Ten spherical passive reflective markers (14 mm) were positioned on the head, shoulders and trunk. Head/Neck motion was recorded by a Vicon system (OMG, England) with 8 MX cameras (100 Hz). The following movements were recorded: (1) relaxed posture; (2) relaxed posture with a trick movement to lessen dystonic response; (3) relaxed posture with distraction (e.g. counting backwards); and, (4) neck range of motion in the sagittal (Flex/Ext), frontal (lateral Flex/Ext) and transverse planes (rotation). A Body Builder program was used to extract head/neck motion relative to the thorax and to assess tremor. Imaging data will be used in the near future to estimate muscle volumes based on the principle of summation of truncated cones. RESULTS AND DISCUSSION Figures 1 shows the vertical displacement (z-axis) of a virtual marker located between two markers placed on the front of the head (participant #6). It demonstrates that the
Vicon system can record tremor associated with CD. This tremor is in the order of 1 to 2 mm. Figure 2 illustrates the Head/Neck sagittal plane angular motion and tremor associated with CD. Figure 3 shows the frequency content of the signal with a dominant frequency at 4 Hz in the sagittal and transverse planes.
Figure 1: Vertical displacement of head marker (#6).
Figure 2: Head/Neck range of motion (#6).
Figure 3: Spectrum analysis of head/neck ROM (#6). CONCLUSIONS 3D motion analysis can identify movement abnormality and tremor in CD and may prove valuable in identifying neck musculature for botulinum toxin treatment.
-2-10123
0 1 2 3 4 5Time (seconds)
(mm
)
-20
0
20
40
60
0 10 20 30 40 50 60Time (seconds)
Deg
rees

72
VALIDITY OF THE AMP 331 TO RECORD OVER-GROUND AND TREADMILL WALKING
1,2,3 Noel Lythgo, 1,2 Lara Edbrooke, 2 Unna Goldsworthy, 2 Jeremy Friedman and 1,2,3 Linda Denehy
1 Rehabilitation Sciences Research Centre, The University of Melbourne 2 School of Physiotherapy, The University of Melbourne
3Austin Health email: [email protected]
INTRODUCTION Regular continuous walking enhances physical health and mental well-being. Positive outcomes include weight management, blood pressure reduction, lower risk of significant chronic disease (cardiovascular, cancer) and reductions in depression and anxiety [1]. Health professionals or clinicians need to accurately monitor walking levels in patient populations. This is especially important in people with chronic cardiovascular disease. Traditional methods of monitoring physical activity have used questionnaires or activity logs. The validity of these methods has been shown to be poor, especially for light to moderate activity. In contrast, accelerometers such as the AMP 331 Activity Monitoring Pod (Dynastream Innovations Inc., Cochrane, Alberta, Canada) provide an objective way to record walking over many days (e.g. 7 to 10 days). This study investigated the validity of the AMP 331 to record over-ground and treadmill walking. The monitor was directly compared to equivalent data simultaneously recorded by a Vicon System. METHODS Two experiments were conducted. In the first experiment, 15 participants (Age: 24.1 ± 9.1 yrs; Height: 172.3 ± 8.6 cm; Mass: 69.0 ± 14.2 kg) completed a series of over-ground walks (2, 4 and 6 laps) at self-selected speed around a 14.76 m curvilinear circuit (3.2 m straights, 4.2 m curves). In the second experiment, 15 participants (22 ± 7.8 yrs; 173.3 ± 6.6 cm; 72.1 ± 12.7 kg) completed a series of walks on a motorized treadmill set at 2.4, 3.2, 4.2 and 5 km⋅h-1 with an additional walk at 4.2 km⋅h-1 on a 5° incline. In both experiments, basic gait parameters were simultaneously recorded by the AMP 331 and a Vicon System capturing at 120 Hz (OMG, London). RM MANOVAs with contrast testing were used to investigate the accuracy of the data recorded by the AMP 331. Separate RM MANOVAs were performed on the gait data collected for each walking condition. Three RM MANOVAs were conducted on the over-ground data and five were conducted on the treadmill data. Due to the high number of comparisons, the alpha level was modified by a Bonferroni adjustment. For the over-ground comparisons p-values had to fall below 0.016 to achieve significance (α = 0.05), whereas the p-values for the treadmill comparisons had to fall below 0.01 (α = 0.05).
RESULTS AND DISCUSSION Good agreement was found between the gait measures recorded in the over-ground walking condition (Table 1). Across the over-ground conditions, average distance walked differed by 2 m, step count by 0.23 steps, speed by 0.2 cm⋅s-1, step length by 1.6 cm, cadence by 3.3 steps⋅min-
1, and walking time by 2 seconds. Only gait speed in the 4 lap condition was found to differ significantly (P < 0.05) but this difference (0.2 cm⋅s-1) was not considered to be clinically significant. In contrast, forty-three percent of the gait measures recorded in the treadmill condition were found to be significantly different (P < 0.05). The measures to exhibit the greatest error were distance walked, step count and gait speed. In the 2.4 km⋅h-1 treadmill condition, for example, the AMP 331 significantly underestimated distance walked (29.1 m), step count (27.1 steps) and walking time (45 s). CONCLUSIONS The AMP 331 was found to be a valid instrument for the collection of gait data during over-ground walking. In contrast, large differences were found in the treadmill condition and caution should be used when monitoring gait activity with the AMP 331 during treadmill walking. ACKNOWLEDGEMENTS We wish to acknowledge some funding assistance from the GAIT Centre for Clinical Research Excellence. REFERENCES 1. Eyler A, et al. Med Sci Sports Exerc 35: 1529-36,
2003. 2. Richardson M, et al. Med Sci Sports Exerc 28: 1529-
36, 1996. 3. Vincent W. Statistics in Kinesiology. Human Kinetics,
Champaign, 1995.
Table 1: Examples of gait measures recorded by systems: Mean (SD). *P< 0.05. Over-ground (2 Laps) Over-ground (6 Laps) Treadmill at 2.4 km⋅h-1
System AMP Vicon AMP Vicon AMP Vicon Distance (m) 27.9 (2.3) 28.96 84.2 (9.5) 86.87 88.7* (39.8) 117.8 (0.7) Count (steps) 22.3 (1.8) 22.6 (1.7) 64.9 (5.4) 65.1 (5.2) 87.0* (40.2) 114.1 (9.8) Speed (cm⋅s-1) 116.2 (16.6) 116.0 ( 19.2) 122.5 (20.9) 123.4 (0.2) 65.9 (7.6) 65.6 (0.1) Step length (cm) 63.2 (8.2) 64.4 (5.2) 65.2 (8.8) 67.1 (5.4) 52.0 (8.0) 52.0 (4.3) Cadence (⋅min-1) 111.0 (10.9) 107.7 (11.9) 112.8 (11.4) 109.8 (11.9) 76.6 (6.2) 76.1 (6.5) Time (s) 24.4 (3.3) 25.6 (3.9) 69.3 (11.4) 72.3 (11.8) 134.7* (59.3) 179.6 (1.0)
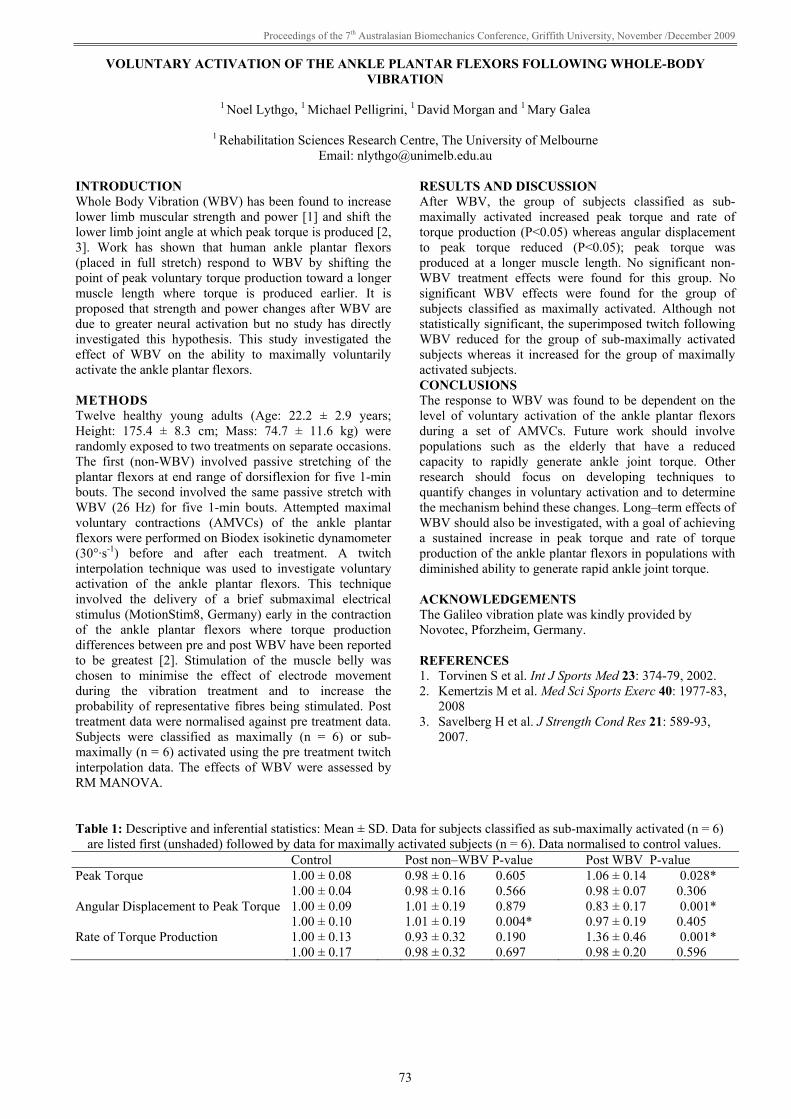
Proceedings of the 7th Australasian Biomechanics Conference, Griffith University, November /December 2009
73
VOLUNTARY ACTIVATION OF THE ANKLE PLANTAR FLEXORS FOLLOWING WHOLE-BODY VIBRATION
1 Noel Lythgo, 1 Michael Pelligrini, 1 David Morgan and 1 Mary Galea
1 Rehabilitation Sciences Research Centre, The University of Melbourne
Email: [email protected] INTRODUCTION Whole Body Vibration (WBV) has been found to increase lower limb muscular strength and power [1] and shift the lower limb joint angle at which peak torque is produced [2, 3]. Work has shown that human ankle plantar flexors (placed in full stretch) respond to WBV by shifting the point of peak voluntary torque production toward a longer muscle length where torque is produced earlier. It is proposed that strength and power changes after WBV are due to greater neural activation but no study has directly investigated this hypothesis. This study investigated the effect of WBV on the ability to maximally voluntarily activate the ankle plantar flexors. METHODS Twelve healthy young adults (Age: 22.2 ± 2.9 years; Height: 175.4 ± 8.3 cm; Mass: 74.7 ± 11.6 kg) were randomly exposed to two treatments on separate occasions. The first (non-WBV) involved passive stretching of the plantar flexors at end range of dorsiflexion for five 1-min bouts. The second involved the same passive stretch with WBV (26 Hz) for five 1-min bouts. Attempted maximal voluntary contractions (AMVCs) of the ankle plantar flexors were performed on Biodex isokinetic dynamometer (30°·s-1) before and after each treatment. A twitch interpolation technique was used to investigate voluntary activation of the ankle plantar flexors. This technique involved the delivery of a brief submaximal electrical stimulus (MotionStim8, Germany) early in the contraction of the ankle plantar flexors where torque production differences between pre and post WBV have been reported to be greatest [2]. Stimulation of the muscle belly was chosen to minimise the effect of electrode movement during the vibration treatment and to increase the probability of representative fibres being stimulated. Post treatment data were normalised against pre treatment data. Subjects were classified as maximally (n = 6) or sub-maximally (n = 6) activated using the pre treatment twitch interpolation data. The effects of WBV were assessed by RM MANOVA.
RESULTS AND DISCUSSION After WBV, the group of subjects classified as sub-maximally activated increased peak torque and rate of torque production (P<0.05) whereas angular displacement to peak torque reduced (P<0.05); peak torque was produced at a longer muscle length. No significant non-WBV treatment effects were found for this group. No significant WBV effects were found for the group of subjects classified as maximally activated. Although not statistically significant, the superimposed twitch following WBV reduced for the group of sub-maximally activated subjects whereas it increased for the group of maximally activated subjects. CONCLUSIONS The response to WBV was found to be dependent on the level of voluntary activation of the ankle plantar flexors during a set of AMVCs. Future work should involve populations such as the elderly that have a reduced capacity to rapidly generate ankle joint torque. Other research should focus on developing techniques to quantify changes in voluntary activation and to determine the mechanism behind these changes. Long–term effects of WBV should also be investigated, with a goal of achieving a sustained increase in peak torque and rate of torque production of the ankle plantar flexors in populations with diminished ability to generate rapid ankle joint torque.
ACKNOWLEDGEMENTS The Galileo vibration plate was kindly provided by Novotec, Pforzheim, Germany. REFERENCES 1. Torvinen S et al. Int J Sports Med 23: 374-79, 2002. 2. Kemertzis M et al. Med Sci Sports Exerc 40: 1977-83,
2008 3. Savelberg H et al. J Strength Cond Res 21: 589-93,
2007.
Table 1: Descriptive and inferential statistics: Mean ± SD. Data for subjects classified as sub-maximally activated (n = 6)
are listed first (unshaded) followed by data for maximally activated subjects (n = 6). Data normalised to control values. Control Post non–WBV P-value Post WBV P-value Peak Torque 1.00 ± 0.08
1.00 ± 0.04 0.98 ± 0.16 0.98 ± 0.16
0.605 0.566 1.06 ± 0.14
0.98 ± 0.07 0.028* 0.306
Angular Displacement to Peak Torque 1.00 ± 0.09 1.00 ± 0.10 1.01 ± 0.19
1.01 ± 0.19 0.879 0.004* 0.83 ± 0.17
0.97 ± 0.19 0.001* 0.405
Rate of Torque Production 1.00 ± 0.13 1.00 ± 0.17 0.93 ± 0.32
0.98 ± 0.32 0.190 0.697 1.36 ± 0.46
0.98 ± 0.20 0.001* 0.596

74
A LOWER BODY KINEMATIC MODEL FOR ESTIMATION OF LATERAL ANKLE LIGAMENT STRAIN DURING SNOWBOARDING
Paul McAlpine, Fabio Borrani and Yanxin Zhang
The University of Auckland; email: [email protected]
INTRODUCTION Lower limb injury is common in snowboarding. The use of flexible boots predisposes snowboarders to a greater incidence of ankle injuries than their skiing counterparts [1]. Of particular importance are sprains which represent 52% of all ankle injuries [2]. Jumping is popular in the sport of snowboarding. Pilot data, collected by the author, showed high magnitude impact forces of up to 11 BW under each foot during jump landings. It is likely that these impact situations could force the lower limb joints into potentially injurious positions. A lower body kinematic model has been created to allow for the estimation of lateral ligament strain during snowboarding to assist in the understanding of snowboard specific lower body injury mechanisms. METHOD External skin and boot fixed markers are used to track segment motion. The kinematic model consists of the shank, talus and calcaneus segments for both legs. The ankle is represented by two hinge joints – the ankle and subtalar. The anatomical axes of these joints are defined in a barefoot static trial. The ankle axis is defined as a line between the malleoli and the subtalar axis as a line connecting a mid calcaneus virtual marker and a marker on the navicular head. Analogous joint axis definitions have been presented previously [3, 4]. Ankle and subtalar joint kinematics are calculated in Vicon Body Builder based on the relative motion of segment embedded coordinate systems.
Figure 1: OpenSim screen shot showing ankle ligament definitions. A previously validated lower body model [5] was modified for the purposes of this research. The ankle and subtalar joint articulations were adjusted to recreate realistic motion patterns with no bone through bone protrusions. Additionally, lateral ankle ligaments (ATFL, CFL, PTFL) were added as passive structures. The ankle ligaments were attached to bony prominences as outlined within the literature.
OpenSim modelling software was used to edit and run the anatomical model (Fig 1). Bodybuilder joint kinematic output data is used to ‘drive’ the defined joints in Open Sim and the resulting ligament elongations can be plotted. Lab based simulated snowboard jump landing trials were collected to assess the feasibility of this ankle modelling methodology. RESULTS AND DISCUSSION Figure 2 shows an example ligament strain output for a simulated jump landing movement. The ligament elongation response appears to be appropriate when compared with data that is available within the literature [6].
Figure 2: Sample ligament strain data CONCLUSIONS On-snow 3D Kinematic data is to be collected in the near future from a sample of snowboarders performing jumps. The ankle model is to be used to investigate the influence of equipment modifications on lower limb joint motion and ankle ligament strain. Additionally, this model may be applicable in a number of clinical and sports applications. REFERENCES 1. Shealy J, et al. Ski Traum Safety 11: 49-59, 1997. 2. Kirkpatrick D, et al. Am J Sports Med 26: 271-7, 1998. 3. MacWilliams B, et al. Gait Posture 17: 214-24, 2003. 4. Scott S & Winter D. J Biomech 24: 743-52, 1991. 5. Delp S, et al. IEEE Trans Biomed Eng 37: 757-67,
1990. 6. Colville M, et al. Am J Sports Med 18: 196-200, 1999.

Proceedings of the 7th Australasian Biomechanics Conference, Griffith University, November /December 2009
75
AMPLITUDE AND TIMING OF SEGMENT SPEEDS IN SKILLED MALE AND FEMALE GOLFERS
1 Kate McMahon, 1 Justin Kavanagh, 1 Sean Horan and 2 Justin Keogh
1 Griffith University, Gold Coast Campus, Queensland, Australia 2 School of Sport & Recreation, Auckland University of Technology, New Zealand
email: [email protected] INTRODUCTION The summation of proximal-to-distal upper body segmental speeds (i.e., maximium pelvis rotation speed followed by greater maximum thorax rotation speed) in order to generate optimally large club head speeds is a concept frequently cited in golf research [1]. Recent research has suggested that gender-related differences may exist in such golf swing characteristics [2], however limited data exists for female golfers. While information exists regarding the swing mechanics of male golfers [2], considerably less is known about female golfers. Therefore, the purpose of this investigation was to examine whether gender-differences existed in the maximum speed, and the timing of maximum speed, of individual upper body segments of skilled male and female golfers during the downswing phase of a golf swing when using a Driver. METHODS A cross-sectional study was performed which measured and compared the 3D swing kinematics of nine skilled male (24.6 ± 5.1 yrs; 2.5 ± 2.0 golf handicap) and ten skilled female (24.6 ± 5.1 yrs; 3.4 ± 0.8 golf handicap) golfers. Using an eight-camera VICON 3D motion analysis system (Oxford, UK), at a sampling frequency of 500 Hz, 3D marker trajectories were obtained via retro-reflective markers attached directly to the subject over specific upper body anatomical landmarks, and also to the golf club. Following a self-directed warm-up routine, subjects were required to perform 15 golf swings with their own Driver. For each trial, a standard golf ball covered in retro-reflective tape was hit off a 30 mm thick artificial surface into a 4 x 4 m nylon net located 5 m in front of the subject. Raw data were filtered and modelled using custom-designed Vicon BodyBuilder software Version 3.6
(Oxford Metrics, UK). Data were time-normalised so that each golfer’s swing was represented as a percentage of a downswing phase, defined as the period from the top of backswing to ball contact. All other analyses were completed using custom-designed MatLab 7.6 software (MathWorks Inc., MA). Independent t-tests were used to determine if gender differences existed for individual segment speeds. RESULTS AND DISCUSSION The results of this study indicate that for the downswing, 1) male golfers exhibited significantly greater peak hand and club head speeds, and 2) males reached peak pelvis segment speed significantly earlier than females, and achieved peak thorax and hand segment speeds significantly later when compared to females (Table 1). An interesting finding was that males created a significantly longer delay between maximum pelvis and thorax segment speeds in comparison to females during the downswing. Such a delay, along with the dynamics of the arms, may contribute to the greater club head speeds observed in the male golfers. The summation of speed principle was observed in the downswings of both genders between the more-proximal pelvis and thorax segments, however notably, the maximum hand segment speed was achieved prior to the relatively more-proximal thorax segment. CONCLUSIONS Further research is warranted regarding the relationship between upper body motion and arm motion during the downswing phase of the golf swing. REFERENCES 3. Burden AM, et al. J Sports Sci 16: 165-76, 1998. 4. Zheng N, et al. Int J Sports Med 29: 965-70, 2008.
Table 1: Upper-body segment speeds of male and female subjects during the downswing phase of a golf swing.
Male Female P-value Peak pelvis speed (deg.s-1) 484.1 ± 50.4 500.0 ± 76.3 0.230 Peak thorax speed (deg.s-1) 654.1 ± 78.5 652.8 ± 87.3 0.939 Peak hand speed (m.s-1) 10.0 ± 0.9 7.9 ± 1.0 < 0.001* Peak club head speed (m.s-1) 52.4 ± 4.2 43.1 ± 6.4 < 0.001* Timing of peak pelvis speed (%) 72.4 ± 7.2 75.7 ± 8.7 0.048* Timing of peak thorax speed (%) 86.6 ± 8.7 82.4 ± 7.6 0.014* Timing of peak hand speed (%) 80.3 ± 4.5 77.2 ± 5.0 0.002* Timing of peak club head speed (%) 98.4 ± 2.0 97.9 ± 2.5 0.247
Values are mean ± standard deviation. % = Percentage of the downswing phase. * = Significant effect of gender.

76
CENTRE OF PRESSURE PATHWAYS IN STANCE AS AN INDICATOR FOR DYNAMIC STABILITY
Megan Moreau and Sharon Walt
University of Auckland, Auckland, New Zealand email: [email protected]
INTRODUCTION The centre of pressure (COP) has been described as the neuromuscular response to the imbalances of the body’s centre of mass (COM) [1]. An understanding of the relationship between the movements of the COM and COP, along with how each are generated and controlled during walking can help quantify dynamic stability [2]. The use of COP to measure balance is common for quiet standing or static balance tests where increased values of COP parameters indicating instability. As walking has often been described as controlled falling, the same increase in COP parameters does not necessarily indicate a lack of stability. Taking into account all segment movements the COP can be thought of as a resultant measure of dynamic balance when walking. During walking the COP relative to the foot shifts within its borders to control the whole body COM that is continuously moving outside the borders of the base of support. Though the COP patterns within the foot are predictable for normal walking in adults, the current study aims to complement the sparse research of COP patterns in normally developing children. In addition this work will extend the research by investigating COP patterns in children walking in balance compromising manners akin to the walking patterns of children with cerebral palsy (CP). METHODS An eight camera Vicon MX system along with three Bertec force plates were used to collect kinematic and kinetic data. COP trajectories analysed were those transposed into the local foot segment. Each foot strike to toe-off COP trajectory was normalised to 100% of stance phase and a mean of each walking condition was calculated. Eighteen children (mean age 10.6±3 yrs) with no functional abnormalities participated in the study. Each session comprised of normal walking (NW) along with four balance compromising walks: toe walking (TW), crouch walking while on toes (CW), walking on the outside of the feet (OW), and walking along a line (LW). Criteria for a successful session were at least four trials of each condition where there was a single foot strike on any force plate. These conditions were chosen as they force the child to compensate for the lack of a typical base of support via kinematic and kinetic adaptations and interactions throughout the rest of the body. Paired t-tests were performed to compare the range of COP in both the anterior-posterior (AP) and medio-lateral (ML) directions between conditions for each subject. Statistical analysis was completed at the level of significance of p<0.05.
RESULTS AND DISCUSSION Paired t-tests confirmed that significant differences existed between the COP ranges in the AP direction when comparing all walking conditions except between NW and LW. In the ML direction significance was found between the NW and CW, NW and LW, and between TW and CW conditions (Fig 1).
Figure 1: Mean ML and AP COP ranges for normal walking (NW), toe walking (TW), crouch walking while on toes (CW), walking on the outside of the feet (OW), and walking along a line (LW). These results agree with previous research noting children with CP display a smaller range of COP displacement in the AP direction and a larger range in the ML direction [2]. These results reflect poor balance in children with CP and have been attributed to reduced postural control at the ankle and hip (AP) and hip ab/adductors weakness (ML) [1,2]. The children in this study were non-pathological, thus poor postural control and lack of musculature cannot explain the significant COP results. These results suggest the musculoskeletal constraints of altered walking positions contribute to the muscle response patterns, exposed as increased COP ranges that mirror children with CP [3]. CONCLUSIONS Children with normal musculature were able reorganize their muscle responses to emulate the COP and walking patterns of CP children. Further work explores dynamic stability including power and energy flows and inter-segmental coordination. REFERENCES 1. De Cock A, et al. Gait Posture 27: 669-75, 2008. 2. Hsue B-J, et al. Gait Posture 29: 465-70, 2009. 3. Woollacott, M, et al. Neurosci Biobehav Rev 22: 583-9,
1998.
0
50
100
150
200
NW TW CW OW LW
ML

Proceedings of the 7th Australasian Biomechanics Conference, Griffith University, November /December 2009
77
THE RELATIONSHIP BETWEEN HAND GRIP FORCE, FOREARM SURFACE SHAPE CHANGES, AND FOREARM EMG: A RELIABILITY STUDY
1 Alireza Hashemi Oskouei, 1 Allan Carman, 2 Mike Paulin and 1 David Baxter
1 School of Physiotherapy, Centre for Physiotherapy Research, University of Otago, Dunedin, New Zealand 2 Department of Zoology, University of Otago, Dunedin, New Zealand
e-mail: [email protected] INTRODUCTION Hand grip force is an important biomechanical parameter in the interaction between human and machine. Due to difficulties in the direct measurment of hand force during daily tasks, methods such as surface electromyography (SEMG) have been applied to predict forces. The present study was performed to establish the reliability of surface electromyography as well as forearm surface shape changes in predicting hand and finger grip forces. METHODS Thirty two healthy right-handed male and female participants, age 20-40, with no history of forearm or hand injury or other pathological condition volunteered to take part in this study. In 9 participants forearm surface shape changes were measured using 32 small circular (radius = 0.3cm) retro-reflective markers placed on the forearm and a 10 camera Motion Analysis System. The position of markers was captured in thirty six randomized trials consisting of 6 different sub-maximum grip forces and six repeats of each force. Change in marker positions for each grip force was expressed relative to their location in the hand open rest position. In 23 participants surface EMG signals of 5 hand and finger flexor muscles were recorded (TeleMyo 2400T-G2 16 channel telemetric SEMG system, Noraxon, USA). EMG were recorded for three maximum voluntary contractions (MVC) of 3 second duration, followed by thirty six randomized trials consisting of 6 different sub-maximum grip forces and six repeats of each force. EMG signals were filtered (15Hz high-pass); full wave rectified, expressed as RMS and normalized to hand grip MVC signals. Single measure interclass correlation coefficient (ICC2,1) was applied to find the reliability of the measures. Mean and 95%CI were used to compare measures between conditions.
RESULTS AND DISCUSSION This study showed high reliability (ICC >0.98) for relative changes of markers’ position on the forearm during hand grip with different forces (Table1). For 8 markers significant changes occurred across all forces, 10 showed changes only between low, medium and high levels of grip forces, while 14 showed no changes at all. This research has lead to a set of forearm surface marker locations that will be the focus of further study on predicting hand and finger grip forces. EMG signals had lower reliability (ICC<0.78, Table 1). This result is comparable to previous studies [1]. As Hoozemans et al. [1] suggests we calculated ICC values for individual and combined muscles. The results show no improvement in reliability when combining muscle EMG. However, the results do show an improvement of ICC when comparing with our initial study [2] with fewer participants where 0.3<ICC<0.8 for 11 participants. CONCLUSIONS This study suggests that surface shape changes measured from selected forearm sites are a reliable and promising means for predicting hand and finger grip forces. The application of pressure sensors to the forearm may be a means of controlling hand assistive devices and robots. ACKNOWLEDGEMENTS This study was supported by the University of Otago Postgraduate Scholarship. REFERENCES 1. Hoozemans Marco J.M., et al. J Electromyogr Kinesiol
15: 358-66, 2005. 2. Hashemi Oskouei A, et al. Proc 4th Asian Pacific
Conference on Biomechanics, Christchurch, New Zealand, 2009.
Table 1: ICC for normalised EMG of two selected muscles and relative displacement of two selected markers across different grip forces. 5% MVC 20% MVC 50% MVC 80% MVC Marker 9 (Lateral proximal) 0.998(0.995,0.999) 0.997(0.993,0.999) 0.996(0.995,0.999) 0.998(0.994,0.999) Marker 18 (Anterior distal) 0.995(0.987,0.998) 0.992(0.979,0.998) 0.997(0.995,0.998) 0.979(0.945,0.994) Flexor Digitrum Superfacialis 0.78 (0.65, 0.88) 0.77 (0.64,0.88) 0.60 (0.41,0.77) 0.75 (0.61,0.87) Flexor Pollicis Longus 0.75 (0.60,0.87) 0.60 (0.42,0.77) 0.53 (0.35,0.73) 0.59 (0.40, 0.76) Values indicate ICC (lower bound and upper bound of 95% confidence interval).

78
VALIDATION OF 3D MODELS OF THE OUTER AND INNER SURFACES OF AN OVINE FEMUR
1 Kanchana Rathnayaka, 1 Tony Sahama, 1,2 Michael Schuetz, 1 Beat Schmutz
1Institute of Health and Biomedical Innovation, Queensland University of Technology, Brisbane, Australia 2 Princess Alexandra Hospital, Brisbane, Australia
email: [email protected]
INTRODUCTION The validation of Computed Tomography (CT) based 3D models takes an integral part in studies involving 3D models of bones. This is of particular importance when such models are used for Finite Element studies. The validation of 3D models typically involves the generation of a reference model representing the bones outer surface. Several different devices have been utilised for digitising a bone’s outer surface such as mechanical 3D digitising arms, mechanical 3D contact scanners, electro-magnetic tracking devices and 3D laser scanners [1-3]. However, none of these devices is capable of digitising a bone’s internal surfaces, such as the medullary canal of a long bone. Therefore, this study investigated the use of a 3D contact scanner, in conjunction with a microCT scanner, for generating a reference standard for validating the internal and external surfaces of a CT based 3D model of an ovine femur. METHODS One fresh ovine limb was scanned using a clinical CT scanner (Brilliance 64, Phillips) with a pixel size of 0.4 mm2 and slice spacing of 0.5 mm. Then the limb was dissected to obtain the soft tissue free bone while care was taken to protect the bone’s surface. A desktop mechanical 3D contact scanner (Roland DG Corporation, MDX 20, Japan) was used to digitise the surface of the denuded bone. The scanner was used with the resolution of 0.3 × 0.3 × 0.025 mm. The digitised surfaces were reconstructed into a 3D model using reverse engineering techniques in Rapidform (Inus Technology, Korea). After digitisation, the distal and proximal parts of the bone were removed such that the shaft could be scanned with a microCT (µCT40, Scanco Medical, Switzerland) scanner. The shaft, with the bone marrow removed, was immersed in water and scanned with a voxel size of 0.03 mm3. The bone contours were extracted from the image data utilising the Canny edge filter in Matlab (The Mathswork). The extracted bone contours were reconstructed into 3D models using Amira 5.1 (Visage Imaging, Germany). The 3D models of the bone’s outer surface reconstructed from CT and microCT data were compared against the 3D model generated using the contact scanner. The 3D model of the inner canal reconstructed from the microCT data was compared against the 3D models reconstructed from the clinical CT scanner data.
The disparity between the surface geometries of two models was calculated in Rapidform and recorded as average distance with standard deviation. RESULTS AND DISCUSSION The comparison of the 3D model of the whole bone generated from the clinical CT data with the reference model generated a mean error of 0.19 mm while the shaft was more accurate than the proximal and distal parts (Table 1). The comparison between the outer 3D model generated from the microCT data and the contact scanner model generated a mean error of 0.10 mm indicating that the microCT generated models are sufficiently accurate for validation of 3D models generated from other methods. The comparison of the inner models generated from microCT data with that of clinical CT data generated an error of 0.09 mm. Table 1: The results of comparing the3D models.
Model Mean (mm) SD Contact scanner vs Clinical CT model (whole bone) 0.19 0.16
Contact scanner vs Clinical CT model (proximal part) 0.26 0.18
Contact scanner vs Clinical CT model (shaft) 0.08 0.06
Contact scanner vs Clinical CT model (distal part) 0.22 0.16
Contact scanner vs MicroCT outer 3D models (shaft) 0.10 0.03
MicroCT vs Clinical CT outer 3D models (shaft) 0.13 0.07
MicroCT vs Clinical CT inner 3D models (shaft) 0.09 0.07
CONCLUSIONS Utilising a mechanical contact scanner in conjunction with a microCT scanner enabled to validate the outer surface of a CT based 3D model of an ovine femur as well as the surface of the model’s medullary canal. REFERENCES 1. Gelaude F, et al. Comput Aided Surg 13: 188-99, 2008. 2. Martelli S, et al. Proc MICCAI 2002, Tokyo, p. 308-
314, 2002. 3. Kowal J, et al. Int J Med Robotics Comput Assist Surg
3: 341-8, 2007.

Proceedings of the 7th Australasian Biomechanics Conference, Griffith University, November /December 2009
79
THE IMPACT OF SWAY, EQUIPMENT & RELEASE TIMING ON SCORING IN ELITE LEVEL ARCHERY
1 Wayne Spratford, 1 Col Mackintosh, 1 Mark Davis, 1 Mark James and 2 Robert Turner
1 Department of Biomechanics and Performance Analysis, Australian Institute of Sport, Canberra ACT 2 Archery Program, Australian Institute of Sport, Canberra ACT
email: [email protected]
INTRODUCTION Recurve archery is an Olympic sport that requires competitors to shoot at a target at a distance of 70 m, with the maximum score being contained within an inner ring measuring 6.1 cm in diameter. This level of precision requires strength, concentration and the ability to make this closed looped skill as repeatable as possible [1]. The aim of this research was to quantify how body movements (postural sway) immediately pre and post release, timing of release (clicker time) and equipment (bow poundage and arrow length) influence the scoring of the shot. METHODS 39 elite level archers (23 male and 16 female, 24.7 ± 7.3 yrs, 77.2 + 15.6 kg; 172.4 + 10.4 cm) participated in this study. Bow poundage and arrow length were recorded prior to each archer shooting five arrows (n = 195) while standing on an AMTI force-platform (600mm x 900mm), the scores of all arrow were recorded as they hit the target as per the normal archery scoring convention (0-10). Kinetic data was captured 1 sec prior to release and 0.5 sec post release at a 1000 Hz, filtered with a Butterworth filter (cut-off frequency 6 Hz) before centre of pressure (CoP) calculations were made within a custom designed program and inferred as a measure of postural sway [2]. Sway speed was calculated as the change of CoP over time. The system was synchronised and triggered to arrow release using a microphone (detecting sound) and an exponential change in the force-platform moment about the X axis. Clicker time was defined as the time between the arrowhead slipping over the “clicker” until arrow release, detected by the microphone (the clicker is a piece of spring steel attached to the bow that allows the archer to know when full draw is). Statistical significance was set at p < 0.05 and all data was analysed using a stepwise linear regression with the performance score being the dependant variable (Version 15.0, SPSS Inc, Chicago, IL). RESULTS AND DISCUSSION Mean and standard deviations for equipment, clicker time, postural sway and score for all arrows are presented in Table 1: The linear regression identified clicker time, bow poundage, and maximum sway speed as the variables that provided the best fitting model (r2 = 0.42) for predicting the outcome of the shot:
Score = 8.722 – (15.955 * clicker time) + (0.119 * poundage) – (0.005 * max sway speed)
The model indicated that the score increased as the clicker time became shorter, bow poundage increased and the maximum sway speed decreased. Anecdotally clicker time has always said to be controlled by “feel” and with it only ranging from between 13-23 ms (in this study) it may not be possible to consciously control or change this. Increasing the bow poundage is also problematic as increases are limited by the strength of the individual archer. This coupled with the fact that maximum sway speed ranged from between 36 to 696 mm/sec indicating that it had the biggest influence on the scoring of the shot (over 3 scoring points when using the regression equation) highlights the importance of addressing or reducing the maximum sway during the shot cycle. It is important to note that the maximum sway speed occurs in all instances after arrow release but correlates highly to sway speed at release (0.80) and to total sway prior to release (0.70), these also correlate highly to each other (0.70). While coaching literature emphasises the importance of the follow through in the shot cycle [1] and our data also supporting this theory, a more holistic view suggests that events prior to the release influence sway speeds and subsequently the outcome of the shot. CONCLUSIONS The ability to reduce the maximum sway speed has the biggest impact on increasing the potential score of the shot. This research suggests that reducing total sway prior to release is the best way to reduce maximum sway speed and as such interventions should be aimed in this area. Other researchers have linked fatigue to increased postural instability [3,4] and therefore strength interventions are the possible future direction of this research. Increased strength also increases the potential of the archer to shoot with a higher poundage bow. REFERENCES 1. Lee K & de Bont R. Total Archery, Samick Sports,
2005. 2. Winter DA. Biomechanics and Motor Control of
Human Movement, pp. 108-9. Wiley, New York, 2005. 3. Salvati M, et al. Gait Posture 26: 214-8, 2007. 4. Zemoka E & Hamar D. International J Appl Sports Sci
17: 1-6, 2005.
Table 1: Mean and standard deviations for pre and post release sway variables, clicker time, arrow length, bow poundage and the score for all shots.
Sway (mm)
X (mm)
Y (mm)
Maximum sway speed (mm)
Clicker time (ms)
Arrow length (cm)
Bow poundage (kg)
Score
Pre release 20 ± 6 11 ± 4 14 ± 5 159 ± 86 16±2 73.10±5.05 20.30±2.53 8.2±1.0Post release 48 ± 19 25 ± 12 36 ± 16 235 ± 120

80
TIMING OF PEAK CLUBHEAD VELOCITY IN THE GOLF DRIVE WITHOUT THE EFFECT OF IMPACT
1 Matthew Sweeney, 1 Jacqueline Alderson, 2 Peter Mills and 1 Bruce Elliott
1 School of Sport Science Exercise and Health, University of Western Australia 2 School of Physiotherapy and Exercise Science, Griffith University
INTRODUCTION During a golf swing, clubhead velocity plays an integral role in producing ball velocity. It is then logical to assume the peak clubhead velocity should come at, or close to impact. While some researchers reported clubhead velocity at its peak immediately prior to impact in the golf drive [1], others [2] have reported that clubhead velocity slightly decreases prior to ball contact. The later is characteristic of findings across a number of sports [3], however, in baseball it has been reported that peak bat velocity was achieved after impact [4]. The aim of the current study was to compare the timing of peak club head velocity in the golf drive using a golf ball and a replacement target with negligible mass. METHODS Participants: Four male collegiate golfers with a mean handicap of 2.75 (±1.9) were recruited. Mean participant age, height and weight was 20 years (±1), 173.8 cm (±7.7) and 71 kg (±9.8), respectively. Following standard ethical procedures and an individual warm-up participants performed in a random format, two drives using a regulation golf ball (Titleist NXT) and a further two drives using a paper target shaped like a golf ball and tee. Each drive was recorded using a 12 camera Vicon Mx (VICON Peak, Oxford Metrics Ltd., UK) motion capture system at 400Hz. Three retro-reflective markers fixed to the top of the club-head formed a technical coordinate system and a spherical pointer method, outlined by Cappazo et al. [5], was used to identify four key points on the club face, which defined the club face coordinate system. The position of the both the golf ball and paper target was held in the laboratory coordinate system, as a virtual ball created by a calibration trial. To determine time of impact, a linear interpolation was performed on the club-head velocity 10 data points (25ms) around contact. Contact was defined as the point where the digitized club face coordinate system was closest to the ball/ virtual ball in the x-direction of the global reference system. Timing of mean peak resultant clubhead velocity with relation to impact, was compared using a paired T-test (α = 0.05). RESULTS AND DISCUSSION The effect of impact is clear in the trials with the ball, with a marked decrease in clubhead velocity at the frame immediately post impact (Fig 1).
Figure 1: Clubhead velocity of a typical participant hitting a golf ball and paper target. Peak club-head velocity was achieved post impact in all but one trial in the paper target condition. Average peak resultant club head velocity occurred 3.3 ms following contact in the paper target condition, which was significantly (p = 0.003) later compared with the golf ball condition where it occurred 2.5 ms prior to ball contact (Fig 2). Results indicate that devoid of the impact effect on the club by a ball, players of a low handicap achieve the greatest clubhead speed close to, or after, impact.
Figure 2: Average timing of peak resultant velocity of the club-head relative to impact for both conditions. REFERENCES 1. Nozawa & Kaneko, Proceedings of ISB XIX, Dunedin,
New Zealand: 300, 2003. 2. William & Sih. Sports Engineering 5: 65-80, 2002. 3. Plagenhoef S. Patterns of human motion. Prentice-Hall,
Englewood Cliffs, 1971. 4. Tabuchi N. Sports Biomechanics 6: 17-30, 2007. 5. Capozzo A, et al. IEEE Trans on Biomed Eng 44:
1165-74, 1997.

Proceedings of the 7th Australasian Biomechanics Conference, Griffith University, November /December 2009
81
TIBIAL BONE STRENGTH IS PREDICTED BY HABITUAL BONE-SPECIFIC PHYSICAL ACTIVITY IN HEALTHY, YOUNG ADULTS
Benjamin K. Weeks and Belinda R. Beck
Bone Muscle and Movement Research Group, Griffith University
Email: [email protected]
INTRODUCTION The bone-specific physical activity questionnaire (BPAQ) is a newly developed instrument to account for the influence of habitual mechanical loading on the skeleton. The questionnaire is scored using algorithms embedded with empirical ground reaction force data for common sports and physical activities. We have previously shown that the BPAQ predicts bone mass at clinically important sites in young adult men and women better than other common measures of physical activity [1]. Its ability to predict important indices of bone strength such as volumetric, geometric or composite strength parameters, however, remains unknown. Thus, it was the aim of this study to determine the ability of the BPAQ to predict bone strength parameters measured by peripheral quantitative computed tomography (pQCT) of the tibia in healthy, young adults. METHODS We recruited healthy men and women between the ages 18 to 35 years. Participants completed the BPAQ, which was analysed for current (previous 12 months) and past scores (birth to 12 months prior). Dominant tibiae were scanned using pQCT (XCT-3000, Stratec Medizintechnik, Germany) at the 4%, 14%, 38%, and 66% sites. Total density, cortical density, and trabecular density were calculated from the images using host software. Further composite and density-weighted strength parameters including strength strain index (SSI) and fracture load were analysed. Correlation and regression analyses were performed to determine relationships between BPAQ scores and tibial bone strength parameters. RESULTS AND DISCUSSION Significant positive relationships were found between the current component of BPAQ and a number of bone strength parameters, including fracture load at the 38% site and SSI at the 14% and 38% sites for bending and torsional loads (r = 0.70-0.94, p<0.05). No significant relationships were found between the past component of the BPAQ and any bone strength parameters.
Figure 1: Anterior-posterior (AP) fracture load at the 38% tibial site versus current BPAQ score for healthy, adult men and women. CONCLUSIONS Current habitual mechanical loading determined by a bone-specific physical activity questionnaire bears a positive relationship with pQCT-derived bone strength indices of the tibia in healthy young adults, while past physical activity exposure does not. REFERENCES 1. Weeks BK & Beck BR. Osteoporos Int. 19: 1567-77,
2008.

82
DO MUSCULOSKELETAL AND HORMONAL CHANGES DURING PUBERTY AFFECT LOWER LIMB COORDINATION IN GIRLS? A WORK IN PROGRESS
1 Catherine Wild, 1 Bridget Munro, 1 Julie Steele, 2 Lee Astheimer
1 Biomechanics Research Laboratory, School of Health Sciences, University of Wollongong; 2 Deakin University; email: [email protected]
INTRODUCTION Sport is the leading cause of injury among children and adolescents, particularly sports involving highly coordinated jumping and landing movements [1, 2]. In girls, the highest prevalence of these sport-related injuries occurs at the onset and during puberty, potentially due to the increased influx of sex-steroid hormones and rapid musculoskeletal structural and functional changes [3]. Due to the rapid growth in height that occurs during puberty, the lever length of the upper and lower limbs increases, changing each limb’s moment of inertia [4]. As a consequence of these segmental changes, greater muscular strength is required to accelerate the limbs for the same activity. Research has shown that compared to boys, pubescent girls do not have a defined strength spurt [5]. Therefore, pubescent girls may not have adequate muscular strength to control their limbs during coordinated landing movements, increasing their risk of sustaining sports-related injuries, particularly during jumping and landing movements. Aside from the gender differences in growth and development during puberty, pubescent girls also have fluctuating levels of oestrogen. It has been suggested that oestrogen may affect the mechanical properties of the ACL [6], which may provide an explanation for the greater incidence of non-contact ACL ruptures [6] and other soft-tissue injuries [2] in women compared to men [6]. There are conflicting reports, however, on whether oestrogen does in fact change the mechanical properties of the soft tissue, and thus it is important to understand how oestrogen levels coincide with both the musculoskeletal and coordination changes that occur during puberty. This study aims to examine how the musculoskeletal structural, functional and hormonal changes in pubescent girls affect lower limb coordination throughout the adolescent growth spurt. METHODS Female volunteers (10-13 years) will be screened for Tanner stage 2 and time from peak height velocity (PHV; 4-6 months; peak growth in height). Seventy volunteers who satisfy the inclusion criteria will have their height, weight, leg strength (seated isometric hamstring strength) and leg flexibility (passive hamstring flexibility) tracked monthly for 12 months. Subjects will also be assessed at baseline (4-6 months prior to PHV), 4 months after baseline (the time of PHV) as well as 8 and 12 months after baseline. During each assessment, saliva samples will be collected for oestrogen analysis, as well as passive knee joint laxity, leg flexibility, isokinetic quadriceps and
hamstring strength and lower limb coordination. Coordination will be assessed during two dynamic landing movements (running leap and a single-leg standing long jump). During each movement kinematics (100 Hz), ground reaction forces (GRF) and electromyography (EMG; 1000 Hz) of the dominant leg will be collected to determine the changes in coordination across different stages of growth. Visual 3D and Spike software will be used to analyse the kinematic, GRF and EMG data collected during each landing movement. A repeated measures ANOVA design with one within factor (PHV) will be used to determine any significant (p < 0.05) main effects of musculoskeletal structure, function and oestrogen levels on lower limb coordination. ANTICIPATED OUTCOMES At the time of PHV, it is anticipated girls will display reduced strength and flexibility and thus lower limb coordination due to the rapid and differential timing of lower limb segment growth. Therefore, after PHV, as the growth of the skeleton begins to slow, it is anticipated that an increase in strength and flexibility will result in improved coordination during the dynamic landing movements. It is hypothesised that oestrogen levels will increase continuously throughout puberty. However, levels will increase more rapidly at the time of PHV, contributing to greater passive knee joint laxity. It is postulated that the rapid rise in oestrogen during PHV may contribute to altered mechanical properties of the ACL, potentially changing the biomechanical factors recorded upon landing. FUTURE DIRECTIONS The results of this study can be applied to training programs which aim to improve strength, flexibility and neuromuscular control, in an attempt to improve lower limb coordination during dynamic movements. This could potentially decrease the risk of lower limb injuries during the growth spurt so that all children and adolescents, particularly pubescent girls, can play sport with a reduced risk of injury. REFERENCES 1. Jones SR, et al. J Public Health 23: 268-71, 2001. 2. Kelm JF, et al. Sportverletz Sports 18: 179-84, 2004. 3. Emery CA, et al. Clin J Sport Med 16: 20-6, 2006. 4. Hawkins D, et al. Med Sci Sports Exerc 33: 1701-7, 2001. 5. Round JM, et al. Ann Hum Biol 26: 49-62, 1999. 6. Liu SH, et al. Am J Sports Med 25: 704-9, 1997.

Proceedings of the 7th Australasian Biomechanics Conference, Griffith University, November /December 2009
83
AUTHOR INDEX Surname, first initial Page(s) Abernethy, B 58 Alcock, A 61 Alderson, J 39, 47, 49, 57, 80 Arakilo, M 19 Astheimer, L 82 Baker, J 39, 61 Baker, R 45, 54 Barber, L 62 Barclay, C 5, 30 Barrett, R 34, 36, 62, 67 Baxter, D 77 Beattie, S 28 Beck, B 81 Belward, S 56 Besier, T 66 Best, R 38 Bhakta, B 18 Bilston, L 21, 29, 33, 48 Bird, M-L 32 Bishop, C 63 Blennerhassett, J 20 Borrani, F 74 Brice, S 64 Brown, N 8, 59, 61 Bull, A 22 Callaghan, J 65 Campbell, A 47, 57 Carman, A 77 Carroll, T 31 Carty, C 36, 67 Chafe, G 27 Chapman, D 25 Chemello, G 46 Cheng, S 21, 48 Chin, A 57 Clarke, E 21, 29, 48 Clarke, J 29 Clothier, P 43 Cole, M 37, 51 Connor, H 52 Cook, J 28 Cornock, A 32 Coyne, T 37 Cresswell, A 7, 31 Davids, K 59 Davidson, P 50 Davis, M 79 Deakin, G 42 Delp, S 14 Dempsey, A 24, 53 Denehy, L 72 Determan, J 23 Dingley, A 25 Diong, J 29 Doma, K 42 Donnelly, C 49, 65, 66
Surname, first initial Page(s) Dornauf, S 32 Draper, C 26 Dunne, J 66 Durkin, J 65 Edbrooke, L 72 Edwards, S 28 Elliott, B 24, 39, 47, 49, 57, 80 Evans, K 40 Farrow, D 39, 58 Ferdinands, R 55 Forwood, M 10 Friedman, J 72 Furness, T 44 Galea, M 20, 70, 73 Galloway, M 26 Gandevia, S 29, 33 Gilleard, W 61 Gillett, J 67 Goldsworthy, U 727 Hall, R 12, 18, 68 Harvey, L 29 Hashemi Oskouei, A 77 Heazlewood, I 69 Herbert, R 29, 33 Herzog, W 2, Hill, S 17 Hoang, P 29, 33 Hoffman, B 31 Horan, S 40, 75 Hunter, A 61 Ilich, S 53 Jaffrey, M 38 James, M 79 Janssen, I 25 Jones, C 18 Joseph, C 44 Kavanagh, J 34, 40, 75 Keogh, J 75 Kerr, G 37, 51 Kersting, U 23 Keshishian, H 69 Kieser, J 50 Kotschet, K 71 Kurpiers, N 23 Kwah, L 29 Levesley, M 18 Lichtwark, G 30, 62, 67 Lloyd, D 24, 46, 47, 49, 53 Lythgo, N 20, 52, 54, 70, 71, 72, 73 Mackintosh, C 79 Marmaras, B 52 Martin, J 29 McAlpine, P 23, 74 McConnell, J 66 McGhee, D 28 McKenzie, D 54

84
Surname, first initial Page(s) McLaren, J 43 McMahon, K 75 Middleton, K 49, 57 Mills, P 36, 53, 80 Moreau, M 76 Morgan, D 73 Morris, M 45 Morris, N 40 Morrison, S 34 Muir, C 20 Munro, B 24, 82 Ness, K 56, 64 Otago, L 41 Oya, T 31 Pagello, E 46 Paul, G 19 Paulin, M 77 Pelligrini, M 73 Persson, C 68 Peters, A 45 Phillips, E 59 Portus, M 59 Prinold, J 22 Purdam, C 28 Rasmussen, M 19 Rathnayaka, K 78 Reggiani, M 46 Reinbolt, J 14 Renshaw, I 59 Richards, J 17 Ridge, B 43 Robergs, R 43 Rosemond, D 64 Sadani, S 18 Sahama, T 78 Sangeux, M 45 Sartori, M 46 Saunders, N 41 Schmutz, B 78
Surname, first initial Page(s) Schuetz, M 78 Seal, A 18 Seater, J 41 Selfe, J 17 Selinger, J 27 Seth, A 14 Shaheen, A 22 Sheppard, J 25 Silburn, P 37, 51 Sinclair, F 37 Smith, A 35 Spratford, W 25, 79 Steele, J 24, 28, 82 Stevenson, J 27 Strachan, C 43 Sturnieks, D 53 Summers, J 68 Sweeney, M 80 Tack, D 27 Taylor, M 50 Thewlis, D 17, 19, 63, Thomlinson, N 56 Tian, M 33 Tucker, M 34 Turner, R 79 Ulmer, F 35 Visentin, D 32 Walker, D 43 Walt, S 23, 76 Weeks, B 81 Weissensteiner, J 58 Whittaker, J 17 Wilcox, R 37 Wild, C 82 Wilson, C 70 Wilson, S 50 Wood, J 51 Zhang, Y 74


Australian & New Zealand Society of Biomechanics
Griffith University, Gold Coast campus Gold Coast, Australia