RESEARCH JOURNAL OF FOOT AND ANKLE RESEARCH Open Access Reliability and validity of the Microsoft...
10
RESEARCH Open Access Reliability and validity of the Microsoft Kinect for evaluating static foot posture Benjamin F Mentiplay 1 , Ross A Clark 1 , Alexandra Mullins 1 , Adam L Bryant 2 , Simon Bartold 2 and Kade Paterson 1* Abstract Background: The evaluation of foot posture in a clinical setting is useful to screen for potential injury, however disagreement remains as to which method has the greatest clinical utility. An inexpensive and widely available imaging system, the Microsoft Kinect ™ , may possess the characteristics to objectively evaluate static foot posture in a clinical setting with high accuracy. The aim of this study was to assess the intra-rater reliability and validity of this system for assessing static foot posture. Methods: Three measures were used to assess static foot posture; traditional visual observation using the Foot Posture Index (FPI), a 3D motion analysis (3DMA) system and software designed to collect and analyse image and depth data from the Kinect. Spearman’s rho was used to assess intra-rater reliability and concurrent validity of the Kinect to evaluate foot posture, and a linear regression was used to examine the ability of the Kinect to predict total visual FPI score. Results: The Kinect demonstrated moderate to good intra-rater reliability for four FPI items of foot posture (ρ = 0.62 to 0.78) and moderate to good correlations with the 3DMA system for four items of foot posture (ρ = 0.51 to 0.85). In contrast, intra-rater reliability of visual FPI items was poor to moderate (ρ = 0.17 to 0.63), and correlations with the Kinect and 3DMA systems were poor (absolute ρ = 0.01 to 0.44). Kinect FPI items with moderate to good reliability predicted 61% of the variance in total visual FPI score. Conclusions: The majority of the foot posture items derived using the Kinect were more reliable than the traditional visual assessment of FPI, and were valid when compared to a 3DMA system. Individual foot posture items recorded using the Kinect were also shown to predict a moderate degree of variance in the total visual FPI score. Combined, these results support the future potential of the Kinect to accurately evaluate static foot posture in a clinical setting. Keywords: Foot morphology, Injury screening, Clinical assessment, Lower limb, Biomechanics, Anthropometry Background Abnormal foot posture and mechanics have long been associated with lower limb injuries [1-4]. For instance, clinical measures of a pronated foot posture, such as a low arch [5] and excessive navicular drop [6], have been retrospectively identified with knee injuries and anterior cruciate ligament injury respectively. Similarly, measures indicating a more supinated foot posture, such as a high arch [7] and rearfoot varus [3] have been retro- spectively associated with stress fractures and patellofe- moral pain respectively. Consequently, the measurement and classification of foot posture in a clinical setting has become a central focus of lower extremity medicine, and now is widely used to evaluate injury risk and monitor treatment efficacy. Despite the existence of many different techniques to evaluate foot posture in the clinical setting, there is still disagreement as to which method is the most clinically useful [8]. Indeed, some studies have found contrasting results regarding the association between abnormal foot type and injury depending on the clinical technique employed [3,4,9,10], with some researchers arguing that these conflicting findings may be at least partly due to the lack of reliability and validity of many of these mea- sures [11-13]. Moreover, the inability of many of the * Correspondence: [email protected] 1 School of Exercise Science, Faculty of Health Sciences, Australian Catholic University, Melbourne, Australia Full list of author information is available at the end of the article JOURNAL OF FOOT AND ANKLE RESEARCH © 2013 Mentiplay et al.; licensee BioMed Central Ltd. This is an Open Access article distributed under the terms of the Creative Commons Attribution License (http://creativecommons.org/licenses/by/2.0), which permits unrestricted use, distribution, and reproduction in any medium, provided the original work is properly cited. Mentiplay et al. Journal of Foot and Ankle Research 2013, 6:14 http://www.jfootankleres.com/content/6/1/14
-
Upload
independent -
Category
Documents
-
view
0 -
download
0
Transcript of RESEARCH JOURNAL OF FOOT AND ANKLE RESEARCH Open Access Reliability and validity of the Microsoft...

JOURNAL OF FOOTAND ANKLE RESEARCH
Mentiplay et al. Journal of Foot and Ankle Research 2013, 6:14http://www.jfootankleres.com/content/6/1/14
RESEARCH Open Access
Reliability and validity of the Microsoft Kinect forevaluating static foot postureBenjamin F Mentiplay1, Ross A Clark1, Alexandra Mullins1, Adam L Bryant2, Simon Bartold2 and Kade Paterson1*
Abstract
Background: The evaluation of foot posture in a clinical setting is useful to screen for potential injury, howeverdisagreement remains as to which method has the greatest clinical utility. An inexpensive and widely availableimaging system, the Microsoft Kinect™, may possess the characteristics to objectively evaluate static foot posture ina clinical setting with high accuracy. The aim of this study was to assess the intra-rater reliability and validity of thissystem for assessing static foot posture.
Methods: Three measures were used to assess static foot posture; traditional visual observation using the FootPosture Index (FPI), a 3D motion analysis (3DMA) system and software designed to collect and analyse image anddepth data from the Kinect. Spearman’s rho was used to assess intra-rater reliability and concurrent validity of theKinect to evaluate foot posture, and a linear regression was used to examine the ability of the Kinect to predicttotal visual FPI score.
Results: The Kinect demonstrated moderate to good intra-rater reliability for four FPI items of foot posture (ρ = 0.62to 0.78) and moderate to good correlations with the 3DMA system for four items of foot posture (ρ = 0.51 to 0.85).In contrast, intra-rater reliability of visual FPI items was poor to moderate (ρ = 0.17 to 0.63), and correlations withthe Kinect and 3DMA systems were poor (absolute ρ = 0.01 to 0.44). Kinect FPI items with moderate to goodreliability predicted 61% of the variance in total visual FPI score.
Conclusions: The majority of the foot posture items derived using the Kinect were more reliable than thetraditional visual assessment of FPI, and were valid when compared to a 3DMA system. Individual foot postureitems recorded using the Kinect were also shown to predict a moderate degree of variance in the total visual FPIscore. Combined, these results support the future potential of the Kinect to accurately evaluate static foot posturein a clinical setting.
Keywords: Foot morphology, Injury screening, Clinical assessment, Lower limb, Biomechanics, Anthropometry
BackgroundAbnormal foot posture and mechanics have long beenassociated with lower limb injuries [1-4]. For instance,clinical measures of a pronated foot posture, such as alow arch [5] and excessive navicular drop [6], have beenretrospectively identified with knee injuries and anteriorcruciate ligament injury respectively. Similarly, measuresindicating a more supinated foot posture, such as ahigh arch [7] and rearfoot varus [3] have been retro-spectively associated with stress fractures and patellofe-moral pain respectively. Consequently, the measurement
* Correspondence: [email protected] of Exercise Science, Faculty of Health Sciences, Australian CatholicUniversity, Melbourne, AustraliaFull list of author information is available at the end of the article
© 2013 Mentiplay et al.; licensee BioMed CentCommons Attribution License (http://creativecreproduction in any medium, provided the or
and classification of foot posture in a clinical setting hasbecome a central focus of lower extremity medicine, andnow is widely used to evaluate injury risk and monitortreatment efficacy.Despite the existence of many different techniques to
evaluate foot posture in the clinical setting, there is stilldisagreement as to which method is the most clinicallyuseful [8]. Indeed, some studies have found contrastingresults regarding the association between abnormal foottype and injury depending on the clinical techniqueemployed [3,4,9,10], with some researchers arguing thatthese conflicting findings may be at least partly due tothe lack of reliability and validity of many of these mea-sures [11-13]. Moreover, the inability of many of the
ral Ltd. This is an Open Access article distributed under the terms of the Creativeommons.org/licenses/by/2.0), which permits unrestricted use, distribution, andiginal work is properly cited.

Mentiplay et al. Journal of Foot and Ankle Research 2013, 6:14 Page 2 of 10http://www.jfootankleres.com/content/6/1/14
static measures of foot posture to predict dynamic func-tion also calls in to question their clinical utility [14,15].To address these concerns, Redmond, Crosbie and
Ouvrier [16] developed a subjective measure of staticfoot posture termed the Foot Posture Index (FPI). TheFPI is comprised of one palpatory and five visual criteriaused to determine whether the foot is in a supinated,neutral or pronated position [16]. Research has reportedthat the FPI possesses acceptable intra-rater reliability[1,17,18], and the tool has been validated against bothstatic and dynamic three-dimensional (3D) lower limbmodels [16]. However, despite these advantages, the sub-jective nature and limited five-point Likert-type scoringscale of the FPI may limit the tool’s precision, with someresearchers suggesting that the results need to beinterpreted with caution and may actually have limitedvalue, especially in a research setting [18]. Consequently,there remains a need for an inexpensive, portable andaccurate assessment tool that can quantifiably assessstatic foot posture, which could be implemented in aclinical setting for everyday patient assessment.The Microsoft Kinect™ is an inexpensive and por-
table video game accessory that combines a video andinfrared-sensing camera to create a 3D model of thebody. Recent research has shown that the Kinect systemis capable of creating this 3D human model with similaraccuracy to expensive and complex 3D body scanningsystems [19]. Similarly, early work has also shown prom-ising results for the Kinect to evaluate gait velocity [20],hand and elbow movements [21] and anatomical land-mark displacement and trunk angle [22] when comparedto 3D motion analysis systems. Combined, these studiesdemonstrate that the Kinect is able to obtain some kine-matic and anatomical mapping data with a similar de-gree of accuracy to more expensive 3D motion analysisand scanning systems [19,22]. Consequently, the Kinectmay have the potential to objectively evaluate static footposture in a clinical setting with more accuracy than thesubjectively based FPI. This in turn may permit betterinjury prediction accuracy, increased measurement re-liability and improved clinical utility. Therefore, thisstudy aimed to evaluate whether the Kinect is able to re-liably and validly evaluate static foot posture, as mea-sured using the FPI. A secondary aim was to validate theKinect-derived data with assessment of static foot pos-ture using a 3D motion analysis system. Lastly, a thirdaim was to examine whether Kinect measures of footposture were able to predict the variance in the total vi-sual FPI score.
MethodsParticipantsA convenience sample of 30 young, healthy males(age: 22.2 ± 3.2 years, height: 177.4 ± 5.0 cm, mass:
74.4 ± 4.7 kg, leg length - right limb: 92.9 ± 3.9 cm, kneewidth - right limb: 9.9 ± 0.7 cm, ankle width – right limb:7.5 ± 0.3 cm) with no lower limb injuries in the prior twomonths volunteered to participate in this study. Onlymales were recruited due to the potential influence ofmenstrual cycle phase on lower limb function and tendonmechanical properties and the likely impact of this on testre-test reliability data [23,24]. Participants completed in-formed consent forms prior to testing and all procedureswere approved (approval number 2012 47V) by theAustralian Catholic University Human Research EthicsCommittee.
ProcedureThis study used a concurrent validity, test re-test reli-ability design to determine if the Kinect can reliably andvalidly evaluate static foot posture, using items describedfor the FPI. This design validated the accuracy of mea-suring the FPI using the Kinect against the traditionalvisual observation of the FPI and a benchmark reference,the Vicon motion analysis system. Additionally, the re-peated measures design was used to evaluate the reliabi-lity of measuring the FPI using the Kinect.Eligible participants attended two testing sessions,
seven days apart (median = 7; IQR = 5 to 9). Basic an-thropometric data were recorded in the first session,such as height (cm), mass (kg), leg length (cm), kneewidth (cm) and ankle width (cm). Next, each partici-pant’s foot posture was evaluated by visual observation(FPI), and by using both the Vicon and Kinect systemsas described below. Participants were required to returnapproximately one week following the initial testingsession where these foot posture measurements wererepeated.
Assessment of the Foot Posture Index using visualobservationThe Foot Posture Index (FPI) is a validated, subjectivemeasure that is widely used in a clinical setting, andwhich is comprised of six measurements of the foot toevaluate static foot posture [16]. The FPI has been shownto possess good intra-rater reliability (ICC = 0.81 – 0.94),however inter-rater reliability has only been shown to bemoderate to good (ICC = 0.53– 0.79) [1,17,18]. The FPIhas also been validated against an electromagnetic motiontracking system with results demonstrating that thesix-item FPI total score predicted 64% of the variation(R2 = 0.64, p < 0.001) in static measurements [16].The six-item version of the FPI includes evaluation of
talar head palpation (FPI item 1), supra and infra lateralmalleolar curvature (FPI item 2), calcaneal inversion/eversion (FPI item 3), talo-navicular joint bulging (FPIitem 4), congruence of the medial longitudinal arch (FPIitem 5), and forefoot abduction/adduction (FPI item 6)

Mentiplay et al. Journal of Foot and Ankle Research 2013, 6:14 Page 3 of 10http://www.jfootankleres.com/content/6/1/14
[16]. A five-point Likert-type scale is used to score eachof these items, from −2 to +2, with zero being the cen-tral value or a neutral position and negative and positivevalues indicating a more supinated or pronated positionrespectively. A total FPI score of above +10 indicatesa highly pronated foot posture, +6 to +9 indicates apronated foot posture, 0 to +5 indicates a normal orneutral foot posture, -1 to −4 indicates a supinated footposture while a score of −5 to −12 indicates a highly su-pinated foot posture [16].Participants were told to assume a relaxed comfortable
stance with their right foot on a straight line drawn onthe ground. This line was orientated on the Y-axis of thelaboratory to align the foot with the axes of the globalcoordinate system. Their foot was then positioned sothat the posterior calcaneus and the interspace betweenthe second and third metatarsophalangeal joints werebisecting the line, aligning the central axis of the footwith the axis of the laboratory reference frame. Scoresfor each of the six items of the FPI were recorded aftervisual observation of the participant’s right foot. Thiswas completed on each of the two sessions, approxi-mately one week apart, with the same rater recordingvisual FPI scores for every session who was blinded toany earlier scores. The rater in this study was a re-searcher who received three one-hour training sessionsfor the FPI prior to the study from an experienced po-diatrist. The same researcher conducted all analyses ofthe Vicon and Kinect systems.
Assessment of the Foot Posture Index using the Viconanalysis systemAn eight camera visible red Vicon 3D motion analysissystem (Vicon, Oxford, United Kingdom) sampling at200 Hz was used to determine each of the FPI items,with the exception of talar head palpation. To evaluatethe static FPI using the Vicon system, a calibration wandwas used to identify the items of the modified FPI. Fol-lowing calibration, the system used the fixed markers onthe wand to determine the position of the wand tip in3D space [25]. Pointing the wand tip at specific anato-mical landmarks, or tracing regions using the wand tip,may be used to provide a high degree of accuracy with-out the limitation of soft tissue artefact or marker place-ment inaccuracy [26]. Five different trials were captured,being lateral curvature, lateral and medial landmarks, rear-foot mesh and medial mesh trials as explained below.To establish the lateral malleolar curvature (FPI item
2), the proximal and distal groove sizes were calculatedfrom the virtual marker, and the proximal groove wassubtracted from the distal groove. This was done byplotting the vertical and mediolateral position of thewand tip (in the anatomical reference frame) on a two-dimensional (2D) scatter plot for visualisation using the
data from this trial. This created a graph that repre-sented the lateral surface of the lower leg along a slicerunning from mid-shank to the plantar calcaneal fat pad.The distal groove was identified based on the minimum,or most medial, wand tip position below the malleolus,while the proximal groove was deemed the minimumvalue above the malleolus.To assess calcaneal inversion/eversion (FPI item 3), a
rearfoot mesh trial was used. The mesh was created bysweeping the wand tip across the rearfoot mediolaterally,gradually moving from the most inferior to superiorpoint on the calcaneus, with the vertical distance be-tween each sweep within 5 mm. The most posteriorpoint of the calcaneus was found for each sweep, withthis position identified by plotting the medial-lateral andanterior-posterior positions of the marker on a 2D scat-ter plot for visualisation. The single most posterior pos-ition of the wand tip in each medial-lateral sweep wasthen identified and extracted. The resultant angle ofthese points to the vertical was established using a least-square error linear fit to calculate calcaneal inversion/eversion.Talo-navicular joint bulging (FPI item 4) was deter-
mined by using the medial landmarks trial, calculated bymeasuring the medial-lateral displacement of the navicu-lar tuberosity in relation to the medial calcaneus. Con-gruence of the medial longitudinal arch (FPI item 5) wascalculated from a medial mesh trial and split into twocategories, arch height and arch peak. The wand tip wasswept across the medial foot vertically, gradually movingfrom the medial calcaneus to the head of the first meta-tarsal. In this case, the most medial position of the wandtip during each vertical sweep was extracted, and wasplotted on a 2D scatter plot for visualisation of the me-dial arch. These extracted points were then smoothedusing a polynomial filter and the most superior point onthe plot was deemed the arch height. Additionally, theanterior-posterior position of the arch height point wasalso expressed as a percentage distance from the calca-neus to the head of the first metatarsal, termed archpeak. Therefore, FPI item 5 was compared to two mea-sures, arch height and arch peak, derived from the Viconsystem.Lastly, forefoot abduction/adduction (FPI item 6) used
both the lateral and medial landmark trials. The medial-lateral displacement between the lateral calcaneus andthe head of the fifth metatarsal was compared with themedial-lateral displacement between the medial calcaneusand the head of the first metatarsal. The medial displace-ment was then subtracted from the lateral displacementto give a score for forefoot abduction/adduction. Refer toAdditional file 1 for further detail and images regardingthe assessment and data analysis of foot posture using theVicon 3D motion analysis system.

Mentiplay et al. Journal of Foot and Ankle Research 2013, 6:14 Page 4 of 10http://www.jfootankleres.com/content/6/1/14
Assessment of the Foot Posture Index using the MicrosoftKinect™
Each of the FPI items, with the exception of talar headpalpation, was also captured using a Microsoft Kinectcamera. The video camera can record images at a varietyof resolutions, with the resolution for this study set at640×480 pixels. The infrared-sensing camera acts as adepth sensor that determines the distance of objects infront of the Kinect, and was used to obtain a calibrateddepth map of this area at a resolution of 320×240 pixels.The precision of the depth map becomes exponentiallyworse as the distance from the Kinect increases, how-ever it has been shown to possess a precision of < 3 mmat the range used in this study [27]. Additionally, al-though the individual pixel data is somewhat noisy, theuse of a 2D median filter allows for accurate depth map-ping to be performed [28].To acquire the Kinect data, the device was firstly
placed on the ground at a distance of 100 cm from wherethe participant was required to stand, and a calibrationtechnique was performed to set the global referenceframe [22]. In each position, the participant’s right footwas placed on a line drawn on the ground 100 cm fromthe Kinect. The items of the modified FPI (talar headpalpation being excluded) were then acquired in lateral,posterior and medial views of the foot whilst the partici-pant stood as still as possible. To allow the camera to seethe medial aspect of their foot, the participant’s left footwas placed in a comfortable position behind them andthey were instructed to keep their right shank perpen-dicular to the ground and to have approximately 50% oftheir body mass through their right foot.Custom made LabVIEW software (National Instru-
ments, U.S.A.) was used to collect and analyse the datafrom the Kinect using the Microsoft Software Develop-ment Kit (SDK) Beta 2 (Microsoft, U.S.A.). Data weresampled at the native frequency of the Kinect, which isirregular at ≈ 30Hz. The depth image was converted tothe same resolution as the video image using inter-polation, and the two images were aligned using a crosscorrelation function. The real world coordinates of thepixels in the video and depth images were determinedusing the calibration data extracted from the SDK.When anatomical landmarks or specific positions nee-ded to be identified, these were located using the videoimage and the corresponding points on the depth mapwere extracted. For all values the median of five con-secutive frames of Kinect data were used.The lateral position trial was used to determine the
lateral malleolar curvature (FPI item 2). Specifically, thevideo image was used to place cursors along a verticalline that had previously been drawn on the participant’sleg to represent the middle of the lateral aspect of theirshank. The proximal and distal groove size was then
calculated from the corresponding depth sensor data,and the proximal groove was subtracted from the distalgroove. To remove noise and improve the accuracy ofthe depth data, a five point median filter with the centrepositioned on the line drawn on the participant’s leg wasapplied to each vertical pixel row.For calcaneal inversion/eversion (FPI item 3) the rear-
foot position trial was used. The most posterior pointsof the calcaneus in each pixel row were determined fromthe depth sensor data and the resultant angle of thesepoints was calculated against the vertical.Talo-navicular joint bulging (FPI item 4) was deter-
mined from the medial trial by calculating the medial-lateral displacement of the navicular tuberosity in relationto the medial calcaneus. This was done through the iden-tification of these landmarks by manually placing cursorson the video image and using the corresponding points onthe depth map.The medial trial was also used to determine the con-
gruence of the medial longitudinal arch (FPI item 5) in asimilar way to the Vicon analysis. The vertical positionof the point in each vertical column of the depth mappixels was identified and plotted on a 2D scatter plotalong its anterior-posterior position. The maximum ver-tical position was deemed arch height, and the anterior-posterior position of this was termed the arch peak. Thearch peak was calculated relative to the distance betweenthe calcaneus and head of the first metatarsal, and ex-pressed as a percentage from the calcaneus. Therefore,similar to the Vicon analysis, FPI item 5 was comparedto two measures derived from the Kinect, arch heightand arch peak.Lastly, forefoot abduction/adduction (FPI item 6) used
both the lateral and medial position trials. The medial-lateral displacement between the lateral calcaneus andthe head of the fifth metatarsal was compared with themedial-lateral displacement between the medial calca-neus and the head of the first metatarsal. These pointswere first identified manually on the video image andthe corresponding points on the depth image wereextracted for analysis. The medial displacement wasthen subtracted from the lateral displacement. Referto Additional file 2 for further detail and images re-garding the assessment and data analysis of foot pos-ture using the Kinect system.
Statistical analysisAll data were imported to and analysed using the Statis-tical Package for Social Sciences (SPSS) version 19.0. Datawere initially assessed for normality using the Shapiro-Wilks test (p > 0.05), however the majority of data werenot normally distributed hence non-parametric statisticswere used.

Mentiplay et al. Journal of Foot and Ankle Research 2013, 6:14 Page 5 of 10http://www.jfootankleres.com/content/6/1/14
To examine test-retest reliability of the FPI and Kinectdata, Spearman’s rho was calculated for each FPI item(visual observation, Vicon and Kinect analysis of FPI)and a rank transformed intraclass correlation coefficient(ICC) (2,1) was used for total FPI score (visual observa-tion of FPI only), which is consistent with previous re-search [29]. To determine the concurrent validity of theKinect to measure foot posture, Spearman’s rho, thenon-parametric measure of association between twovariables, was used [30]. Data obtained from the Kinectwere compared to scores obtained from both the visualobservation of the FPI as well as those derived from theVicon system for each of the FPI items recorded. Ad-ditionally, the visual observation of the FPI was alsocompared to FPI data obtained from the Vicon system.Based on the thresholds provided by Portney and Watkins[31], poor correlations were interpreted as a fair or below-fair relationship (< 0.50) and acceptable correlations weredeemed reliable and valid as a moderate to good (0.50 –0.75) or good to excellent (> 0.75) relationship for all reli-ability and validity analyses.To further examine the agreement between the Vicon
and Kinect systems for each FPI item, 95% limits ofagreement (LOA) and Bland-Altman plots were alsoused if the mean difference between systems was nor-mally distributed [32]. The LOA method uses the meandifference between the measures and the standard devi-ation of the differences, and states that the plots shouldfall between ±1.96SD of the mean difference [32]. TheBland-Altman method plots the difference between theFPI items recorded by the Vicon and Kinect systemsagainst the mean of the two measures. Visual inspectionfor any fixed or proportional bias were performed on theBland-Altman plots. Finally, to determine if the Viconand Kinect systems were able to predict the total scoresobtained on the clinical FPI observation, a linear regres-sion was used on rank transformed data. The reliableitems from the Vicon and Kinect systems obtained inthe first testing session were entered as the independentvariables with the total FPI score as the dependent vari-able. The total FPI score can be compared against thecontinuous Vicon and Kinect data as the summationof the FPI items to obtain a total FPI score results incontinuous data [29]. If a measure demonstrated signi-ficance (p < 0.05) in this regression, a Spearman’s rhocorrelation was used to determine the strength of the as-sociation between the measure and total FPI score.
ResultsReliabilityDescriptive statistics and intra-rater reliability for eachof the FPI items measured by the visual FPI, Kinect andVicon systems are presented in Table 1. Reliability of thevisual FPI items was mixed, with the ICC value for the
total visual FPI score demonstrating good to excellentintra-rater reliability (ICC = 0.87), however moderate togood reliability was shown for lateral curvature and con-gruence of the medial longitudinal arch (ρ = 0.52 to0.63), and poor reliability for talar head palpation, cal-caneal inversion/eversion, talo-navicular joint bulgingand forefoot abduction/adduction (ρ = 0.17 to 0.42). TheSpearman’s rho for the Kinect indicates good to excel-lent intra-rater reliability for lateral curvature (ρ = 0.78),with moderate to good reliability for talo-navicular jointbulging, arch height and arch peak (ρ = 0.62 to 0.72) andpoor reliability for forefoot abduction/adduction and cal-caneal inversion/eversion (ρ = 0.21 to 0.30). The intra-rater reliability for Vicon items were similar, with goodto excellent reliability for talo-navicular joint bulgingand arch height (ρ = 0.78 to 0.79), with moderate togood reliability for lateral curvature and forefoot ab-duction/adduction (ρ = 0.55 to 0.73) and poor reliabilityfor arch peak and calcaneal inversion/eversion (ρ = 0.13to 0.37).
ValidityConcurrent validity between the visual FPI, Kinect andVicon systems are displayed in Table 2. Results of thevalidity analysis indicate a good to excellent correlationbetween the Kinect and Vicon items of lateral curvature(ρ = 0.85). Moderate to good correlations were shownfor talo-navicular joint bulging, arch height and forefootabduction/adduction (ρ = 0.51 to 0.74) and poor correla-tions were found for arch peak and calcaneal inversion/eversion (ρ = 0.30 to 0.34). The concurrent validity re-sults demonstrated that all individual visual FPI itemscorrelated poorly with the corresponding items recordedusing either the Kinect or Vicon systems, with all ofthe items indicating little to fair relationships (absoluteρ = 0.01 to 0.44).Bland-Altman plots were also used to indicate the
agreement between the Kinect and Vicon systems foreach FPI item (Figure 1). The LOA method was calcu-lated for all items except for calcaneal inversion/eversion(FPI item 3) due to the mean difference between the sys-tems not being normally distributed for this item. Fixedbiases were evident between devices for the arch height(Figure 1D) and arch peak items (Figure 1E), whereas noobvious relationship between the difference and themean was observed for any item. These plots demon-strate poor absolute agreement between the two devices.The Kinect items with moderate to excellent reliability
(ρ > 0.50) that were entered into the regression modelwere lateral curvature, talo-navicular joint bulging, archheight and arch peak. The regression analysis showedthat the reliable Kinect items explained 61% (r = 0.78,R2 = 0.61, F = 10.08, p < 0.001) of the variance in thetotal visual FPI score. However, the only item that

Table 2 Concurrent validity between systems for each FPI item
Kinect-FPI ρ Kinect-Vicon ρ Vicon-FPI ρ
FPI item Instrumented item
FPI 2 Lateral curve Lateral curve −0.03 0.85* −0.01
FPI 3 Calcaneal inv/eversion Calcaneal inv/eversion 0.36* 0.34 0.44*
FPI 4 TNJ bulging TNJ bulging −0.34 0.74* −0.35
FPI 5 Congruence of MLA Arch height −0.01 0.51* −0.20
Arch peak −0.36 0.30 −0.44*
FPI 6 Forefoot ab/adduction Forefoot ab/adduction −0.14 0.57* −0.19
Note: * p < 0.05; FPI = Foot Posture Index; ρ = Spearman’s rho; TNJ = talo-navicular joint; MLA =medial longitudinal arch.
Table 1 Intra-rater reliability of the visual FPI, Kinect and Vicon systems for each item of the FPI
FPI Kinect Vicon
FPI 1 Talar head
Day 1 median (IQR) 0 (0 to 1)
Day 2 median (IQR) 1 (0 to 1) N/A N/A
Spearman’s rho 0.38*
FPI 2 Lateral curvature
Day 1 median (IQR) 0 (0 to 1) −1.55 (−3.40 to 0.75) −1.32 (−5.06 to 0.93)
Day 2 median (IQR) 0 (0 to 1) −0.97 (−4.29 to 0.74) −2.83 (−4.06 to 0.51)
Spearman’s rho 0.52* 0.78* 0.73*
FPI 3 Calcaneal inv/ev
Day 1 median (IQR) 0 (0 to 1) 10.03 (7.54 to 11.71) 9.77 (6.82 to 12.98)
Day 2 median (IQR) 1 (0 to 1) 11.34 (9.32 to 14.26) 10.73 (7.57 to 12.18)
Spearman’s rho 0.42* 0.30 0.37
FPI 4 TNJ bulging
Day 1 median (IQR) 1 (0 to 1) −17.00 (−22.00 to −13.00) −12.93 (−15.86 to −8.52)
Day 2 median (IQR) 1 (0 to 1) −16.50 (−19.25 to −13.00) −11.63 (−16.22 to −8.71)
Spearman’s rho 0.17 0.62* 0.79*
FPI 5 Congruence of MLA/Arch height
Day 1 median (IQR) 1 (0 to 2) 49.35 (39.94 to 61.36) 26.75 (22.19 to 31.12)
Day 2 median (IQR) 1 (0 to 1) 46.28 (40.33 to 58.88) 28.82 (23.86 to 32.72)
Spearman’s rho 0.63* 0.72* 0.78*
FPI 5 Arch peak
Day 1 median (IQR) 17.65 (15.69 to 32.65) 42.67 (38.25 to 45.03)
Day 2 median (IQR) N/A 24.20 (15.56 to 35.76) 42.41 (34.59 to 46.53)
Spearman’s rho 0.66* 0.13
FPI 6 Forefoot ab/add
Day 1 median (IQR) 1 (0 to 2) −3.00 (−6.00 to 3.00) 2.87 (−0.71 to 7.88)
Day 2 median (IQR) 1 (0.75 to 1) 0.00 (−6.00 to 6.50) 4.19 (−1.15 to 8.75)
Spearman’s rho 0.29 0.21 0.55*
FPI total score
Day 1 median (IQR) 3 (2 to 6)
Day 2 median (IQR) 4 (2 to 5.25) N/A N/A
ICC 0.87*
Note: * p < 0.05; FPI = Foot Posture Index; IQR = interquartile range; TNJ = talo-navicular joint; MLA =medial longitudinal arch; ICC = Intraclass correlation coefficient.
Mentiplay et al. Journal of Foot and Ankle Research 2013, 6:14 Page 6 of 10http://www.jfootankleres.com/content/6/1/14

Figure 1 Bland-Altman plots demonstrating the agreement between the Kinect and Vicon systems for each FPI item. A: Lateralcurvature (FPI item 2). B: Calcaneal inversion/eversion (FPI item 3). C: Talo-navicular joint bulging (FPI item 4). D: Arch height (FPI item 5). E: Archpeak (FPI item 5). F: Forefoot abduction/adduction (FPI item 6). Note: LOA were not calculated for B due to the mean difference not beingnormally distributed.
Mentiplay et al. Journal of Foot and Ankle Research 2013, 6:14 Page 7 of 10http://www.jfootankleres.com/content/6/1/14
independently demonstrated significance (p < 0.05) wastalo-navicular joint bulging. Similarly, the Vicon items withmoderate to excellent reliability (ρ > 0.50) (lateral curva-ture, talo-navicular joint bulging, arch height and forefootabduction/adduction) explained 58% (r = 0.76, R2 = 0.58,F = 8.2, p < 0.001) of the variance in the total visual FPIscore, with only talo-navicular joint bulging again inde-pendently demonstrating significance (p < 0.05). Corre-lations between talo-navicular joint bulging, recordedusing the Kinect and Vicon systems, and the total visualFPI score were shown to be good to excellent (ρ = 0.75,p < 0.001; ρ = 0.74, p < 0.001 respectively).
DiscussionThis study was the first to examine the reliability andvalidity of the Microsoft Kinect to evaluate static footposture. The Kinect demonstrated moderate to goodreliability for four out of six items of the modified FPI(lateral malleolar curvature, talo-navicular joint bulging
and medial arch height and peak). Additionally, theKinect also displayed moderate to good concurrent va-lidity for four items of the FPI when compared to theVicon 3D analysis system (lateral malleolar curvature,talo-navicular joint bulging, medial arch height and fore-foot abduction/adduction). However the relationship be-tween Kinect and visual FPI items was found to be poor.Regression analysis revealed that the Kinect FPI itemswith moderate to good reliability were able to predict61% of the variance in the total visual FPI score, withthe only significant variable (talo-navicular joint bulging)also demonstrating a good to excellent relationship withthe total visual FPI score. The advantage of the Kinect incomparison with the individual items of the visual FPI isthat it provides quantified data on a continuous scale ra-ther than on a limited ordinal scale. Although somewhatmixed, these results support the future potential use ofthe Kinect as a tool to assess static foot posture in a cli-nical setting.
Mentiplay et al. Journal of Foot and Ankle Research 2013, 6:14 Page 8 of 10http://www.jfootankleres.com/content/6/1/14
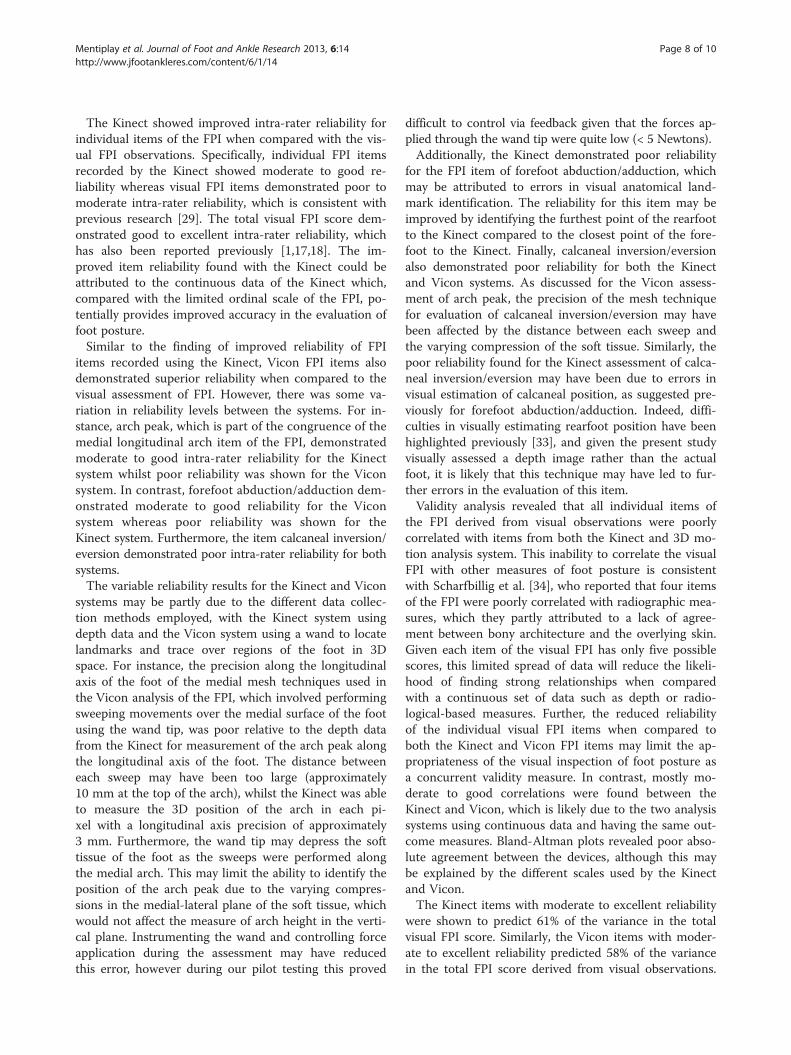
The Kinect showed improved intra-rater reliability forindividual items of the FPI when compared with the vis-ual FPI observations. Specifically, individual FPI itemsrecorded by the Kinect showed moderate to good re-liability whereas visual FPI items demonstrated poor tomoderate intra-rater reliability, which is consistent withprevious research [29]. The total visual FPI score dem-onstrated good to excellent intra-rater reliability, whichhas also been reported previously [1,17,18]. The im-proved item reliability found with the Kinect could beattributed to the continuous data of the Kinect which,compared with the limited ordinal scale of the FPI, po-tentially provides improved accuracy in the evaluation offoot posture.Similar to the finding of improved reliability of FPI
items recorded using the Kinect, Vicon FPI items alsodemonstrated superior reliability when compared to thevisual assessment of FPI. However, there was some va-riation in reliability levels between the systems. For in-stance, arch peak, which is part of the congruence of themedial longitudinal arch item of the FPI, demonstratedmoderate to good intra-rater reliability for the Kinectsystem whilst poor reliability was shown for the Viconsystem. In contrast, forefoot abduction/adduction dem-onstrated moderate to good reliability for the Viconsystem whereas poor reliability was shown for theKinect system. Furthermore, the item calcaneal inversion/eversion demonstrated poor intra-rater reliability for bothsystems.The variable reliability results for the Kinect and Vicon
systems may be partly due to the different data collec-tion methods employed, with the Kinect system usingdepth data and the Vicon system using a wand to locatelandmarks and trace over regions of the foot in 3Dspace. For instance, the precision along the longitudinalaxis of the foot of the medial mesh techniques used inthe Vicon analysis of the FPI, which involved performingsweeping movements over the medial surface of the footusing the wand tip, was poor relative to the depth datafrom the Kinect for measurement of the arch peak alongthe longitudinal axis of the foot. The distance betweeneach sweep may have been too large (approximately10 mm at the top of the arch), whilst the Kinect was ableto measure the 3D position of the arch in each pi-xel with a longitudinal axis precision of approximately3 mm. Furthermore, the wand tip may depress the softtissue of the foot as the sweeps were performed alongthe medial arch. This may limit the ability to identify theposition of the arch peak due to the varying compres-sions in the medial-lateral plane of the soft tissue, whichwould not affect the measure of arch height in the verti-cal plane. Instrumenting the wand and controlling forceapplication during the assessment may have reducedthis error, however during our pilot testing this proved
difficult to control via feedback given that the forces ap-plied through the wand tip were quite low (< 5 Newtons).Additionally, the Kinect demonstrated poor reliability
for the FPI item of forefoot abduction/adduction, whichmay be attributed to errors in visual anatomical land-mark identification. The reliability for this item may beimproved by identifying the furthest point of the rearfootto the Kinect compared to the closest point of the fore-foot to the Kinect. Finally, calcaneal inversion/eversionalso demonstrated poor reliability for both the Kinectand Vicon systems. As discussed for the Vicon assess-ment of arch peak, the precision of the mesh techniquefor evaluation of calcaneal inversion/eversion may havebeen affected by the distance between each sweep andthe varying compression of the soft tissue. Similarly, thepoor reliability found for the Kinect assessment of calca-neal inversion/eversion may have been due to errors invisual estimation of calcaneal position, as suggested pre-viously for forefoot abduction/adduction. Indeed, diffi-culties in visually estimating rearfoot position have beenhighlighted previously [33], and given the present studyvisually assessed a depth image rather than the actualfoot, it is likely that this technique may have led to fur-ther errors in the evaluation of this item.Validity analysis revealed that all individual items of
the FPI derived from visual observations were poorlycorrelated with items from both the Kinect and 3D mo-tion analysis system. This inability to correlate the visualFPI with other measures of foot posture is consistentwith Scharfbillig et al. [34], who reported that four itemsof the FPI were poorly correlated with radiographic mea-sures, which they partly attributed to a lack of agree-ment between bony architecture and the overlying skin.Given each item of the visual FPI has only five possiblescores, this limited spread of data will reduce the likeli-hood of finding strong relationships when comparedwith a continuous set of data such as depth or radio-logical-based measures. Further, the reduced reliabilityof the individual visual FPI items when compared toboth the Kinect and Vicon FPI items may limit the ap-propriateness of the visual inspection of foot posture asa concurrent validity measure. In contrast, mostly mo-derate to good correlations were found between theKinect and Vicon, which is likely due to the two analysissystems using continuous data and having the same out-come measures. Bland-Altman plots revealed poor abso-lute agreement between the devices, although this maybe explained by the different scales used by the Kinectand Vicon.The Kinect items with moderate to excellent reliability
were shown to predict 61% of the variance in the totalvisual FPI score. Similarly, the Vicon items with moder-ate to excellent reliability predicted 58% of the variancein the total FPI score derived from visual observations.

Mentiplay et al. Journal of Foot and Ankle Research 2013, 6:14 Page 9 of 10http://www.jfootankleres.com/content/6/1/14
In both cases, talo-navicular joint bulging was the onlyitem entered into the regression model to independentlydemonstrate significance (p < 0.05). Although no previ-ous study has investigated the ability of objective 3Dmeasures of foot posture or an individual analysis ofeach of the FPI items to predict total FPI score, Red-mond et al. [16] reported that total FPI score was able topredict 64% of the variance in a measure of ankle jointposition in 3D space. The validation of the Kinect inexplaining a high proportion of the variance in total vis-ual FPI scores suggests the potential feasibility of theKinect and custom analysis software to be further re-fined to classify overall foot posture. Indeed, given thegreater reliability of the individual items of the FPI de-rived from the Kinect, and the greater similarity inKinect FPI items to FPI items from the 3D analysis sys-tem, future studies may attempt to develop a totalKinect FPI-type score that could be used to classify footposture with greater accuracy and reliability comparedto the FPI derived from visual observations.Interestingly, one item of the FPI, talo-navicular joint
bulging, demonstrated good to excellent correlations withthe total visual FPI score when measured by the Kinect.This may indicate the potential of this particular item ofthe FPI derived from the Kinect to be used as a stand-alone measure to classify foot posture. Similarly, other re-search has reported that clinical measures of the midfootstrongly correlated with radiographic measures of footposture [35]. Future research should further examine theagreement between the measure of talo-navicular jointbulging derived from the Kinect and total FPI score.A limitation of the current study is the lack of a total
score for the Kinect FPI items. Given the different scalesused within each FPI item for the Kinect, this made thegeneration of a total FPI-type score and foot postureclassification problematic. Future research may wish tofirst implement techniques, such as multiple regressions,to derive a total FPI-type score and foot classificationfrom the Kinect items and secondly to collect a compre-hensive data set of the full range of foot posture usingthe Kinect, from highly supinated to highly pronated.Additionally, future research should examine the inter-rater reliability of the Kinect to evaluate foot posturegiven previous research has shown poor inter-rater reli-ability of the FPI based on visual observation [1,18]. Ifinter-rater reliability was found to be superior, this mayfurther the potential use of the Kinect as a tool to assessstatic foot posture in a clinical setting. Although mostlymoderate to excellent correlations were found betweenthe Kinect and the 3D motion analysis system, anotherpotential limitation may have been the use of the Viconsystem as a benchmark reference. This is supported bythe poor test re-test reliability of the Vicon data in evalu-ating two FPI items, and may be partially explained by
the limited accuracy from the distance between sweepsalong the longitudinal axis of the foot and from soft tis-sue deformation as explained previously. In contrast,previous research has shown that a 3D foot scanner isable to reliably and accurately provide a 3D digital repre-sentation of the foot [36,37]. Although such a tool mayprovide a more appropriate benchmark reference withwhich to compare the Kinect, the Vicon system was usedin this study due to the need of further research to de-velop standardised 3D foot scanning protocols for evalu-ating foot posture and morphology, and the limitedavailability of such systems. Future studies may wish toexamine the concurrent validity of the Kinect to evaluatestatic foot posture when compared to 3D foot scanners.Furthermore, the generalizability of the study may becomprised due to the male only participants and the useof a novice rater for assessment. To attain generalisedresults, future research is required using many raterswith larger participant numbers.
ConclusionsThis study found that four foot posture items derivedusing the Microsoft Kinect demonstrated good intra-rater reliability and four items were valid when com-pared to a 3D analysis system. In contrast, poor reliabil-ity and validity was shown for the visual inspection ofindividual FPI items. Items of foot posture recordedusing the Kinect were also shown to predict a moderatedegree of variance in the total FPI score derived fromvisual observations. Future research should consider de-veloping a total FPI-type score and foot posture classifi-cation using the Kinect FPI items. Combined, theseresults support the future potential of the Kinect to ac-curately evaluate static foot posture in a clinical setting.
Additional files
Additional file 1: Assessment of the Foot Posture Index using theVicon analysis system. Procedure and data analysis for the assessmentof foot posture using the Vicon motion analysis system.
Additional file 2: Assessment of the Foot Posture Index using theMicrosoft Kinect™. Procedure and data analysis for the assessment offoot posture using the Kinect.
Competing interestsThis study was funded in part by ASICS Oceania. All authors have receivedfunding from ASICS Oceania either directly or indirectly via research grantsor employment. Author RC designed the software and may at some stagerelease it either for free or at a cost.
Authors’ contributionsAuthors BM, KP and RC were involved in all aspects of the study. Author AMwas involved in the pilot testing, data collection and drafting stage of thestudy. Authors SB and AB were involved in the preliminary design anddrafting stages of the study. All authors read and approved the finalmanuscript.

Mentiplay et al. Journal of Foot and Ankle Research 2013, 6:14 Page 10 of 10http://www.jfootankleres.com/content/6/1/14
Author details1School of Exercise Science, Faculty of Health Sciences, Australian CatholicUniversity, Melbourne, Australia. 2Department of Physiotherapy, Faculty ofMedicine, Dentistry and Health Sciences, The University of Melbourne,Melbourne, Australia.
Received: 8 November 2012 Accepted: 29 March 2013Published: 8 April 2013
References1. Cain LE, Nicholson LL, Adams RD, Burns J: Foot morphology and foot/
ankle injury in indoor football. J Sci Med Sport 2007, 10:311–319.2. Yates B, White S: The incidence and risk factors in the development of
medial tibial stress syndrome among naval recruits. Am J Sports Med2004, 32:772–780.
3. Powers CM, Maffucci R, Hampton S: Rearfoot posture in subjects withpatellofemoral pain. J Orthop Sports Phys Ther 1995, 22:155–160.
4. Cowan DN, Jones BH, Robinson JR: Foot morphologic characteristics andrisk of exercise-related injury. Arch Fam Med 1993, 2:773–777.
5. Williams DS, McClay IS, Hamill J: Arch structure and injury patterns inrunners. Clin Biomech 2001, 16:341–347.
6. Loudon JK, Jenkins W, Loudon KL: The relationship between staticposture and ACL injury in female athletes. J Orthop Sports Phys Ther 1996,24:91–97.
7. Korpelainen R, Orava S, Karpakka J, Siira P, Hulkko A: Risk factors forrecurrent stress fractures in athletes. Am J Sports Med 2001, 29:304–310.
8. Razeghi M, Batt ME: Foot type classification: A critical review of currentmethods. Gait Posture 2002, 15:282–291.
9. de Groot R, Malliaras P, Munteanu S, Payne C, Morrissey D, Maffulli N:Foot posture and patellar tendon pain among adult volleyball players.Clin J Sport Med 2012, 22:157–159.
10. Beynnon BD, Renström PA, Alosa DM, Baumhauer JF, Vacek PM: Ankleligament injury risk factors: a prospective study of college athletes.J Orthop Res 2001, 19:213–220.
11. Saltzman CL, Nawoczenski DA, Talbot KD: Measurement of the mediallongitudinal arch. Arch Phys Med Rehabil 1995, 76:45–49.
12. Jonson SR, Gross MT: Intraexaminer reliability, interexaminer reliability,and mean values for nine lower extremity skeletal measures in healthyNaval midshipmen. J Orthop Sports Phys Ther 1997, 25:253–263.
13. Sell KE, Verity TM, Worrell TW, Pease BJ, Wigglesworth J: Two measurementtechniques for assessing subtalar joint position: a reliability study.J Orthop Sports Phys Ther 1994, 19:162–167.
14. McPoil TG, Cornwall MW: The relationship between static lower extremitymeasurements and rearfoot motion during walking. J Orthop Sports PhysTher 1996, 24:309–314.
15. Hamill J, Bates B, Knutzen KM, Kirkpatrick GM: Relationship betweenselected static and dynamic lower extremity measures. Clin Biomech1989, 4:217–225.
16. Redmond AC, Crosbie J, Ouvrier RA: Development and validation of anovel rating system for scoring standing foot posture: The Foot PostureIndex. Clin Biomech 2006, 21:89–98.
17. Evans AM, Rome K, Peet L: The Foot Posture Index, ankle lunge test,Beighton scale and the lower limb assessment score in healthy children:a reliability study. J Foot Ankle Res 2012, 5:1–1.
18. Cornwall MW, McPoil TG, Lebec M, Vicenzino B, Wilson J: Reliability of themodified Foot Posture Index. J Am Podiatr Med Assoc 2008, 98:7–13.
19. Weiss A, Hirshberg D, Black MJ: Home 3D body scans from noisy imageand range data. In Computer Vision (ICCV), 2011 IEEE InternationalConference; 6–13 November, 2011. Barcelona: Spain: IEEE; 2011:1951–1958.
20. Stone EE, Skubic M: Passive in-home measurement of stride-to-stride gaitvariability comparing vision and Kinect sensing. In Engineering in Medicineand Biology Society, EMBC, 2011 Annual International Conference of the IEEE;August 30 - September 3 2011. Boston, Massachusetts, USA: EMBC;2011:6491–6494.
21. Chang CY, Lange B, Zhang M, Koenig S, Requejo P, Somboon N, SawchukAA, Rizzo AA: Towards pervasive physical rehabilitation using MicrosoftKinect. In Pervasive Computing Technologies for Healthcare (PervasiveHealth),2012 6th International Conference; 21–24 May 2012. San Diego, California,USA: IEEE; 2012:159–162.
22. Clark RA, Pua Y-H, Fortin K, Ritchie C, Webster KE, Denehy L, Bryant AL:Validity of the Microsoft Kinect for assessment of postural control.Gait Posture 2012, 36:372–377.
23. Pearson SJ, Burgess KE, Onambélé GL: Serum relaxin levels affect thein vivo properties of some but not all tendons in normally menstruatingyoung women. Exp Physiol 2011, 96:681–688.
24. Bryant AL, Clark RA, Bartold S, Murphy A, Bennell KL, Hohmann E,Marshall-Gradisnik S, Payne C, Srossley KM: Effects of estrogen on themechanical behavior of the human Achilles tendon in vivo. J Appl Physiol2008, 105:1035–1043.
25. Cappozzo A, Catani F, Della Croce U, Leardini A: Position and orientation inspace of bones during movement: anatomical frame definition anddetermination. Clin Biomech 1995, 10:171–178.
26. Donati M, Camomilla V, Vannozzi G, Cappozzo A: Anatomical frameidentification and reconstruction for repeatable lower limb jointkinematics estimates. J Biomech 2008, 41:2219–2226.
27. Khoshelham K, Elberink SO: Accuracy and resolution of Kinect depth datafor indoor mapping applications. Sensors 2012, 12:1437–1454.
28. Park S, Yu S, Kim J, Kim S, Lee S: 3D hand tracking using Kalman filter indepth space. EURASIP J Adv Signal Process 2012, 36:1–18.
29. Evans AM, Copper AW, Scharfbillig RW, Scutter SD, Williams MT: Reliabilityof the Foot Posture Index and traditional measures of foot position.J Am Podiatr Med Assoc 2003, 93:203–213.
30. Fredricks GA, Nelsen RB: On the relationship between Spearman’s rho andKendall’s tau for pairs of continuous random variables. J Stat PlanInference 2007, 137:2143–2150.
31. Portney LG, Watkins MP: Foundations of Clinical Research: Applicationsto Practice. 3rd edition. Upper Saddle River, New Jersey: Pearson/Prentice-Hall; 2009.
32. Bland JM, Altman DG: Statistical methods for assessing agreement betweentwo methods of clinical measurement. Lancet 1986, 327:307–310.
33. Menz HB: Alternative techniques for the clinical assessment of footpronation. J Am Podiatr Med Assoc 1998, 88:119–129.
34. Scharfbillig R, Evans AM, Copper AW, Williams M, Scutter S, Iasiello H,Redmond A: Criterion validation of four criteria of the foot posture index.J Am Podiatr Med Assoc 2004, 94:31–38.
35. Menz HB, Munteanu SE: Validity of 3 clinical techniques for themeasurement of static foot posture in older people. J Orthop Sports PhysTher 2005, 35:479.
36. De Mits S, Coorevits P, De Clercq D, Elewaut D, Woodburn J, Roosen P:Reliability and validity of the INFOOT three-dimensional foot digitizer forpatients with rheumatoid arthritis. J Am Podiatr Med Assoc 2011,101:198–207.
37. Carroll M, Annabell M-E, Rome K: Reliability of capturing foot parametersusing digital scanning and the neutral suspension casting technique.J Foot Ankle Res 2011, 4:9–15.
doi:10.1186/1757-1146-6-14Cite this article as: Mentiplay et al.: Reliability and validity of theMicrosoft Kinect for evaluating static foot posture. Journal of Foot andAnkle Research 2013 6:14.
Submit your next manuscript to BioMed Centraland take full advantage of:
• Convenient online submission
• Thorough peer review
• No space constraints or color figure charges
• Immediate publication on acceptance
• Inclusion in PubMed, CAS, Scopus and Google Scholar
• Research which is freely available for redistribution
Submit your manuscript at www.biomedcentral.com/submit