Development of a mobile-based EMG biofeedback system –
72
Development of a mobile-based EMG biofeedback system – How can EMG-biofeedback training be transferred from the clinic to the patient’s home environment? Master’s thesis in Biomedical Engineering THUNDLUCK SEREEVORAVITGUL Department of Electrical Engineering CHALMERS UNIVERSITY OF TECHNOLOGY Gothenburg, Sweden 2018
-
Upload
khangminh22 -
Category
Documents
-
view
1 -
download
0
Transcript of Development of a mobile-based EMG biofeedback system –
Development of a mobile-based EMGbiofeedback system –How can EMG-biofeedback training be transferred from theclinic to the patient’s home environment?
Master’s thesis in Biomedical Engineering
THUNDLUCK SEREEVORAVITGUL
Department of Electrical EngineeringCHALMERS UNIVERSITY OF TECHNOLOGYGothenburg, Sweden 2018


Master’s thesis EX108/2018
Development of a mobile-basedEMG biofeedback system –
How can EMG-biofeedback training be transferred from the clinic tothe patient’s home environment?
THUNDLUCK SEREEVORAVITGUL
Department of Electrical EngineeringChalmers University of Technology
Gothenburg, Sweden 2018
Development of a mobile-based EMG biofeedback system –How can EMG-biofeedback training be transferred from the clinic to the patient’shome environment?THUNDLUCK SEREEVORAVITGUL
© THUNDLUCK SEREEVORAVITGUL, 2018.
Supervisor: Associate Professor Leif Sandsjö and Li Guo, University of BoråsExaminer: Assistant Professor Stefan Candefjord, Department of Electrical
Engineering
Master’s Thesis EX108/2018Department of Electrical EngineeringChalmers University of TechnologySE-412 96 GothenburgTelephone +46 31 772 1000
Cover: Illustration of the methodology of this thesis.
Typeset in LATEXGothenburg, Sweden 2018
iv
Development of a mobile-based EMG biofeedback system –How can EMG-biofeedback training be transferred from the clinic to the patient’shome environment?THUNDLUCK SEREEVORAVITGULDepartment of Electrical EngineeringChalmers University of Technology
AbstractMuscle pain and muscle disorder occur in all ages. The abnormalities could be,for example, pains in office syndrome caused by incorrect working postures, pareticmuscles in after stroke patients, or even genetic muscle diseases e.g. Muscular Dys-trophies. One common treatment for muscle related problem is a physical therapyusing biofeedback technique with a guidance from physical therapist who will intro-duce the patients to perform muscle training.
This research is a collaboration between universities and hospitals, which aims tobring the clinical application to the home-based treatment. In order to do that,an Electromyography (EMG) biofeedback application has been developed on anAndroidTM smartphone device with a connection to an EMG hardware unit pro-duced by ShimmerTM. The system will acquire real-time EMG signal of the muscleactivities by using surface electrodes connected to the EMG unit and transmit EMGdata via Bluetooth®. The data will be visualized on the smartphone device as time-series graphs and bar plots with adjustable threshold for the different muscle traininglevels. The EMG data can optionally be saved as text files in the device storagefor further analysis. Pre-processing of the biomedical signal or EMG signal is doneby digital filters and average rectified value methods developed in the software ap-plication. The prototype system was tested by the research group members andresulted in a possible visual perceptive feedback system with well mobility for homeenvironment usage. The feasibility in Smart Textile was ensured by evaluating thesystem with Smart Textile electrodes introduced by Scan-to-knit project. The resultof the acquired signal from the textile electrodes is as effective as the EMG signalacquired from the traditional contact gel electrodes. The proposed system is mainlybeneficial because the patients can do the therapy anytime anywhere based on theguideline program provided by the physical therapist as well as reduce the costs ofvisit the hospital frequently and enhance the latency of the rehabilitation due to theaccessible system.
Keywords: EMG biofeedback, mobile application, AndroidTM development, ShimmerTM.
v


AcknowledgementsThe thesis was conducted in collaboration with MedTech West. I would like to ex-press my great attitude to my supervisor, associate professor Leif Sandsjö and myexaminer assistant professor Stefan Candefjord who motivate, encourage and guideme throughout the whole research and this report. I also particularly appreciatefor the assistance in Smart Textile electrodes given by Li Guo, a postdoctoral re-searcher from University of Borås, and the warm welcome from Cecilia Ehrenborg,an occupational therapist, and her team at Södra Älvsborgs Sjukhus for the visiting.Apart from that, the software development would not be done without the supportfrom ShimmerTM service and my colleague, Araya Watthanakaruna. Last but notleast my thesis would not be achieved without the great power from my parents whopushed me forward to this point with their greatest love and all support, especiallymy aunts who gave me an inspiration and motivation for all of my works due totheir muscle weakness problem in the elderly.
Thundluck SereevoravitgulGothenburg, December 2018
vii


Contents
List of Figures xi
Abbreviations xiii
1 Introduction 11.1 Motivation . . . . . . . . . . . . . . . . . . . . . . . . . . . . . . . . . 21.2 Aim and Limitations . . . . . . . . . . . . . . . . . . . . . . . . . . . 31.3 Research Questions . . . . . . . . . . . . . . . . . . . . . . . . . . . . 3
2 Background and Theory 52.1 Biofeedback system . . . . . . . . . . . . . . . . . . . . . . . . . . . . 52.2 EMG signal . . . . . . . . . . . . . . . . . . . . . . . . . . . . . . . . 62.3 EMG Signal Recording . . . . . . . . . . . . . . . . . . . . . . . . . . 8
2.3.1 Traditional Surface Electrode . . . . . . . . . . . . . . . . . . 82.3.2 Textile electrode . . . . . . . . . . . . . . . . . . . . . . . . . 10
2.4 EMG signal Processing . . . . . . . . . . . . . . . . . . . . . . . . . . 102.4.1 Artifacts and Noises . . . . . . . . . . . . . . . . . . . . . . . 102.4.2 Digital filter . . . . . . . . . . . . . . . . . . . . . . . . . . . . 112.4.3 Signal Analysis . . . . . . . . . . . . . . . . . . . . . . . . . . 11
2.5 EMG biofeedback system at SÄS . . . . . . . . . . . . . . . . . . . . 122.5.1 1-Channel EMG biofeedback system . . . . . . . . . . . . . . 122.5.2 2-Channel EMG biofeedback system . . . . . . . . . . . . . . 122.5.3 Technology integration . . . . . . . . . . . . . . . . . . . . . . 13
3 Developing process and methods 153.1 Interview and Study Visit . . . . . . . . . . . . . . . . . . . . . . . . 153.2 Design Criteria and Flowchart . . . . . . . . . . . . . . . . . . . . . . 153.3 EMG device - Shimmer3 EMG unit . . . . . . . . . . . . . . . . . . . 173.4 Android Development . . . . . . . . . . . . . . . . . . . . . . . . . . . 19
4 Results 234.1 System Overview . . . . . . . . . . . . . . . . . . . . . . . . . . . . . 234.2 Signal Amplification . . . . . . . . . . . . . . . . . . . . . . . . . . . 244.3 Signal Processing . . . . . . . . . . . . . . . . . . . . . . . . . . . . . 24
4.3.1 Filtering . . . . . . . . . . . . . . . . . . . . . . . . . . . . . . 244.3.2 Signal Analysis . . . . . . . . . . . . . . . . . . . . . . . . . . 244.3.3 Real-time processing . . . . . . . . . . . . . . . . . . . . . . . 25
ix
Contents
4.4 Feedback . . . . . . . . . . . . . . . . . . . . . . . . . . . . . . . . . . 254.4.1 Application Specification . . . . . . . . . . . . . . . . . . . . . 254.4.2 Application Programming . . . . . . . . . . . . . . . . . . . . 254.4.3 Data Presenting and UI . . . . . . . . . . . . . . . . . . . . . 26
4.5 Scenarios . . . . . . . . . . . . . . . . . . . . . . . . . . . . . . . . . . 284.5.1 Relaxation training . . . . . . . . . . . . . . . . . . . . . . . . 284.5.2 Strengthen training . . . . . . . . . . . . . . . . . . . . . . . . 29
4.6 System Evaluation . . . . . . . . . . . . . . . . . . . . . . . . . . . . 294.7 Smart Textile Electrode Evaluation . . . . . . . . . . . . . . . . . . . 31
5 Discussion 335.1 EMG unit (hardware) . . . . . . . . . . . . . . . . . . . . . . . . . . 335.2 EMG biofeedback System . . . . . . . . . . . . . . . . . . . . . . . . 345.3 Application of usage . . . . . . . . . . . . . . . . . . . . . . . . . . . 345.4 Feasibility in Smart Textile Electrode . . . . . . . . . . . . . . . . . . 355.5 Future Work . . . . . . . . . . . . . . . . . . . . . . . . . . . . . . . . 35
5.5.1 Function . . . . . . . . . . . . . . . . . . . . . . . . . . . . . . 355.5.2 Application Design . . . . . . . . . . . . . . . . . . . . . . . . 36
6 Conclusion 37
Bibliography 39
A Appendix 1 - Android code IA.1 Main function for graph activity . . . . . . . . . . . . . . . . . . . . . IA.2 Acquiring and Processing Data . . . . . . . . . . . . . . . . . . . . . IIA.3 Filtering . . . . . . . . . . . . . . . . . . . . . . . . . . . . . . . . . . VIIA.4 Plotting . . . . . . . . . . . . . . . . . . . . . . . . . . . . . . . . . . XIII
x

List of Figures
1.1 An illustration of examples of posture in different situation whichmay lead to the pain or disorder. (Freepik, 2018) . . . . . . . . . . . 2
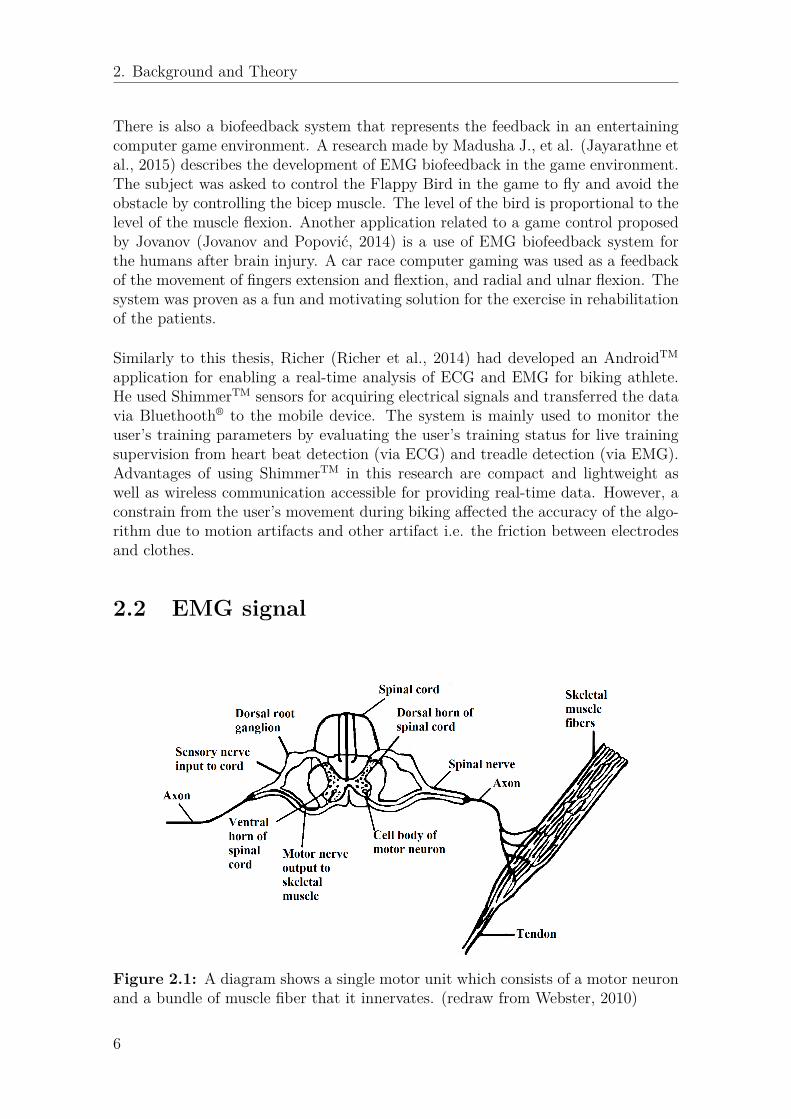
2.1 A diagram shows a single motor unit which consists of a motor neuronand a bundle of muscle fiber that it innervates. (redraw fromWebster,2010) . . . . . . . . . . . . . . . . . . . . . . . . . . . . . . . . . . . . 6
2.2 An illustration diagram represents an initiative of the muscle actionpotential at the neuromuscular junction. It starts from a comingnerve impulse from a motor neuron along a synaptic vesicle whichtriggers a neurotransmitter substance, so called acetylcholine (ACh),to diffuse across a synaptic cleft. After that ACh will activate an ionchannel which especially allows sodium ions (Na+) to pass throughit. The inflow of Na+ then causes a muscle action potential to furtherinnervate the muscle fibers. (redraw from Gerard J. Tortora, 2010) . 7
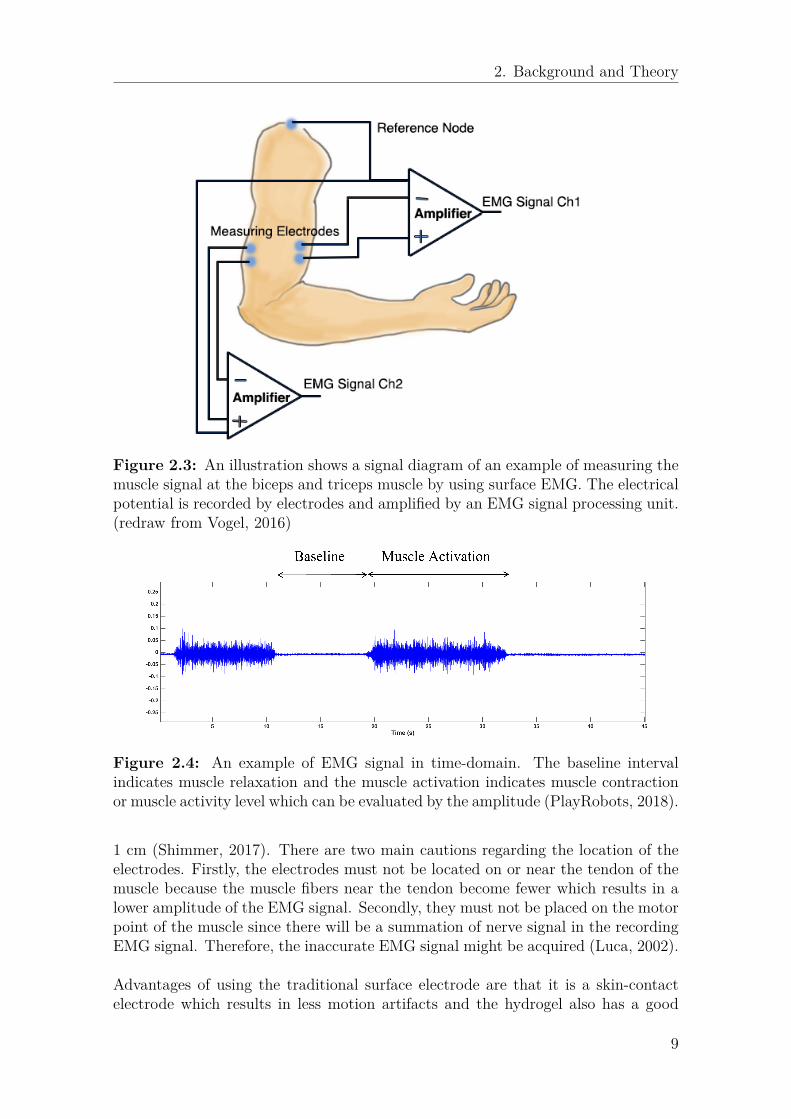
2.3 An illustration shows a signal diagram of an example of measuringthe muscle signal at the biceps and triceps muscle by using surfaceEMG. The electrical potential is recorded by electrodes and amplifiedby an EMG signal processing unit. (redraw from Vogel, 2016) . . . . 9
2.4 An example of EMG signal in time-domain. The baseline intervalindicates muscle relaxation and the muscle activation indicates musclecontraction or muscle activity level which can be evaluated by theamplitude (PlayRobots, 2018). . . . . . . . . . . . . . . . . . . . . . . 9
2.5 A traditional surface electrode that used in this project produced byCovidienTM (bio-medical, 2018). . . . . . . . . . . . . . . . . . . . . . 10
2.6 An illustration of 1-channel EMG biofeedback system . . . . . . . . . 122.7 An EMG amplifier unit using at SÄS. Gains can be adjusted by the
white knob and threshold level can be selected by the red and blackknob for channel A and channel B respectively. The blue knob is usedfor adjusting the delay in a unit of second(s). . . . . . . . . . . . . . . 13
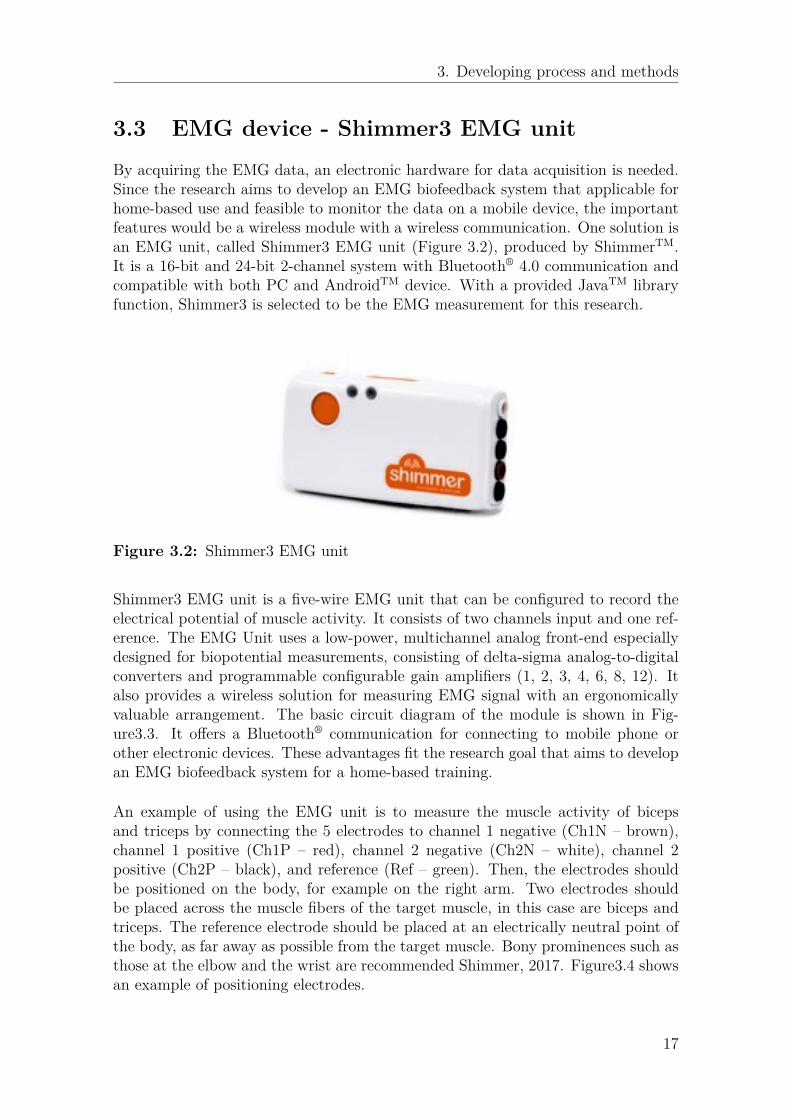
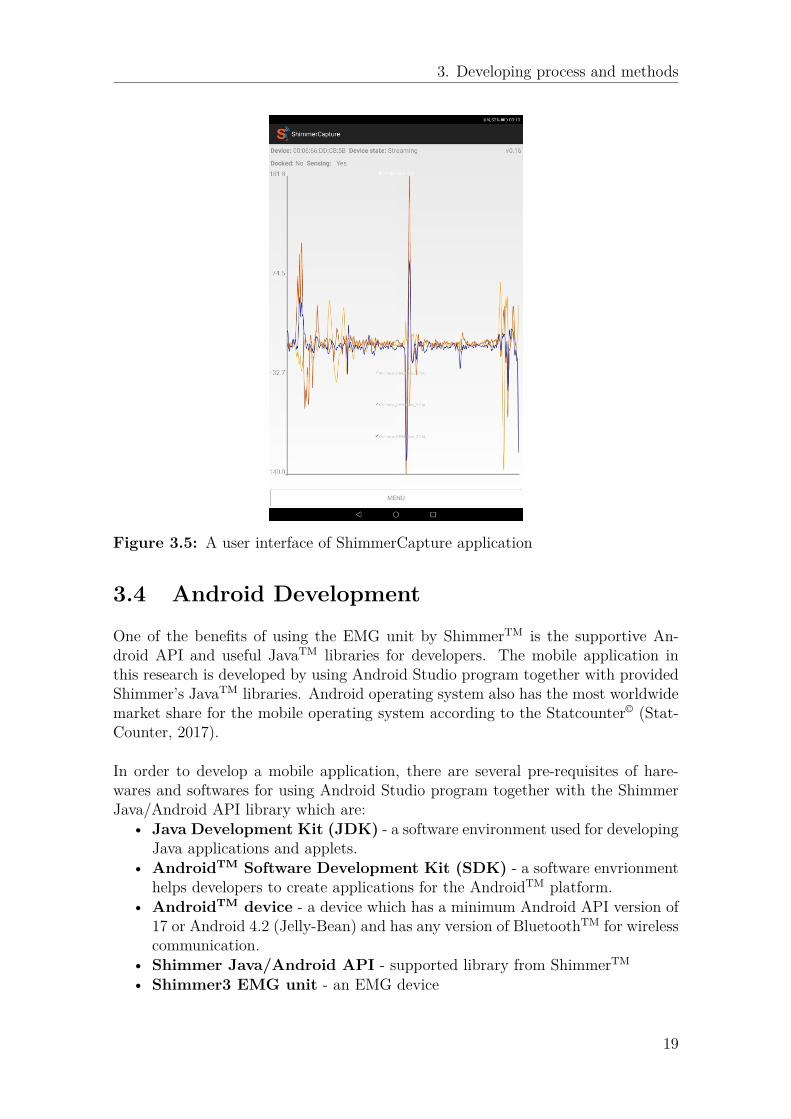
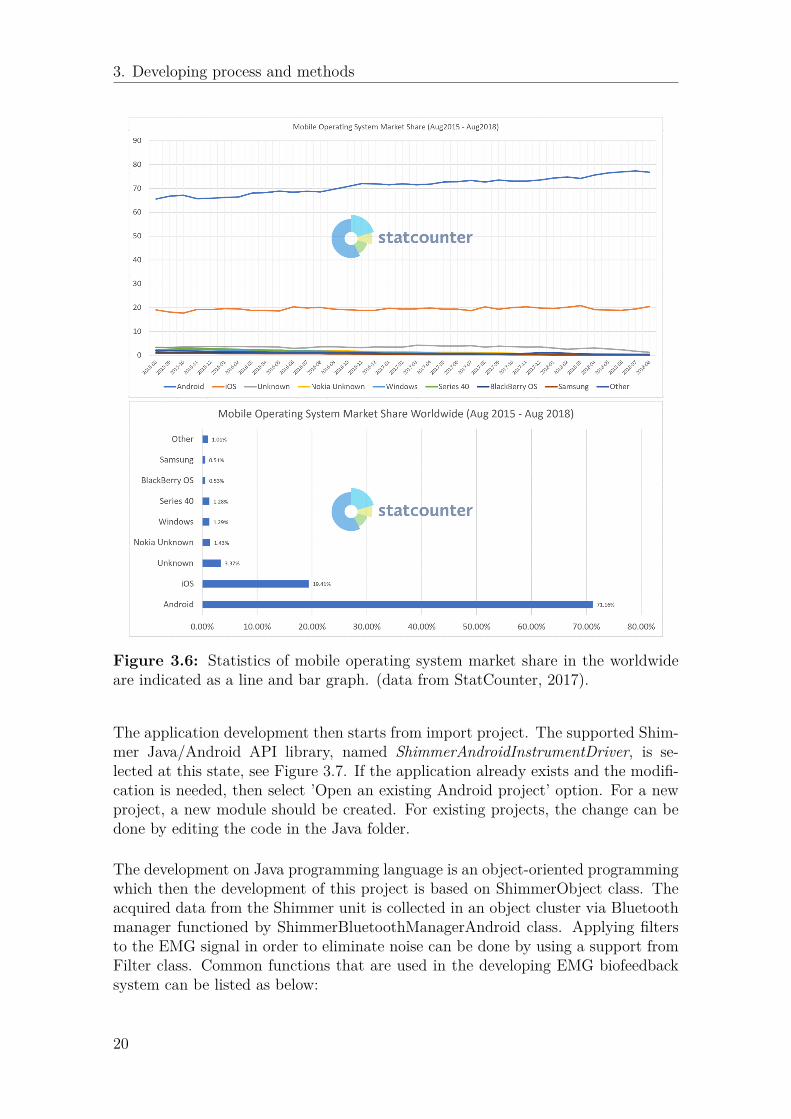
3.1 A flowchart shows the application flow of data. . . . . . . . . . . . . . 163.2 Shimmer3 EMG unit . . . . . . . . . . . . . . . . . . . . . . . . . . . 173.3 A block diagram of Shimmer3 EMG unit is illustrated. . . . . . . . . 183.4 An example of positioning of electrodes for EMG measurement. . . . 183.5 A user interface of ShimmerCapture application . . . . . . . . . . . . 193.6 Statistics of mobile operating system market share in the worldwide
are indicated as a line and bar graph. (data from StatCounter, 2017). 20
xi
List of Figures
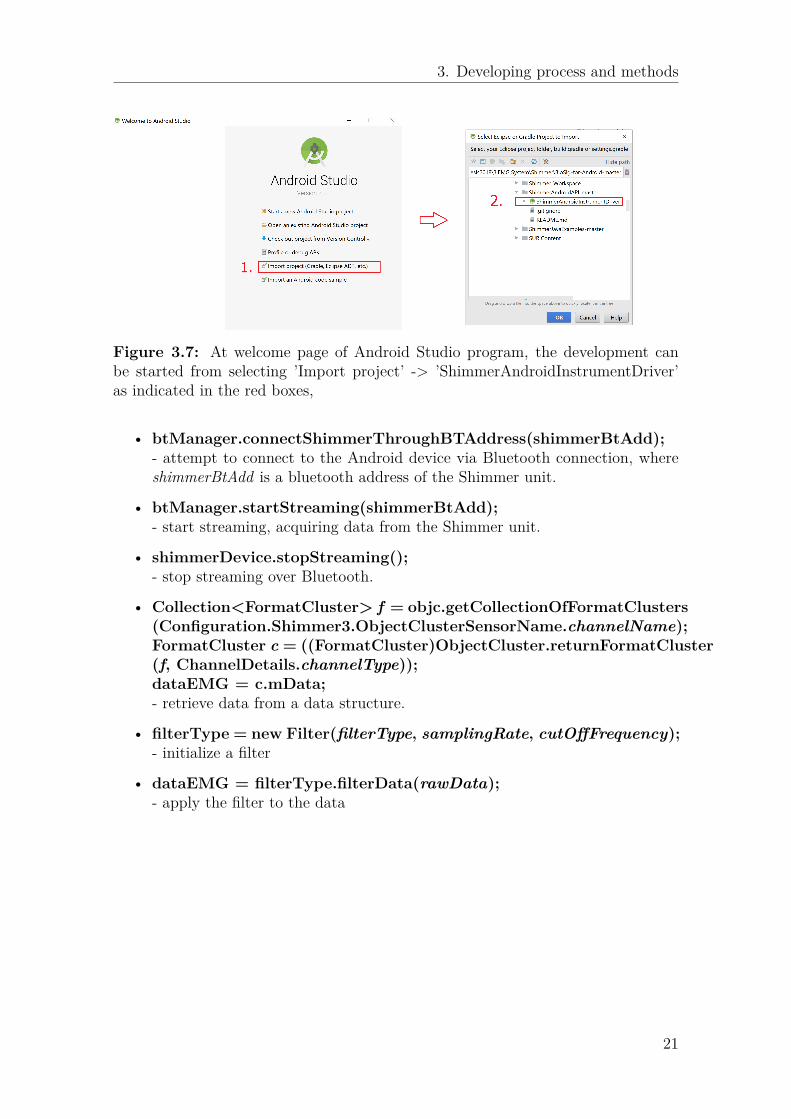
3.7 At welcome page of Android Studio program, the development canbe started from selecting ’Import project’ -> ’ShimmerAndroidIn-strumentDriver’ as indicated in the red boxes, . . . . . . . . . . . . . 21
4.1 A block diagram shows the overview of the EMG biofeedback system. 234.2 An illustration shows how to enable Developer Options for Samsung
Galaxy 7 . . . . . . . . . . . . . . . . . . . . . . . . . . . . . . . . . . 264.3 An illustration shows how to turn on a debugging mode and allow
the installation from other source. . . . . . . . . . . . . . . . . . . . . 264.4 Illustrations shows a design of the user interface which can present
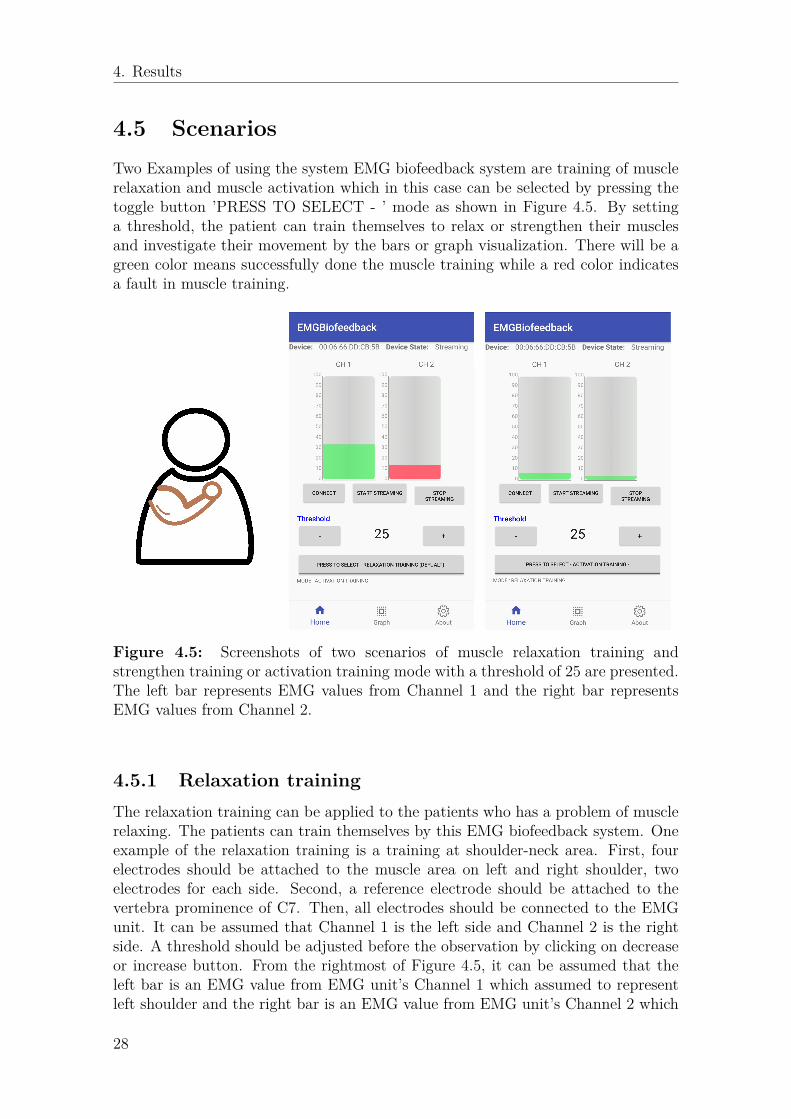
EMG data as bars or graph. . . . . . . . . . . . . . . . . . . . . . . . 274.5 Screenshots of two scenarios of muscle relaxation training and strengthen
training or activation training mode with a threshold of 25 are pre-sented. The left bar represents EMG values from Channel 1 and theright bar represents EMG values from Channel 2. . . . . . . . . . . . 28
4.6 The electrode locations and system connection for shoulder’s muscleactivity investigation are presented. . . . . . . . . . . . . . . . . . . . 30
4.7 Evaluations of the system have been done by three subjects. Theyare all healthy adults. . . . . . . . . . . . . . . . . . . . . . . . . . . . 30
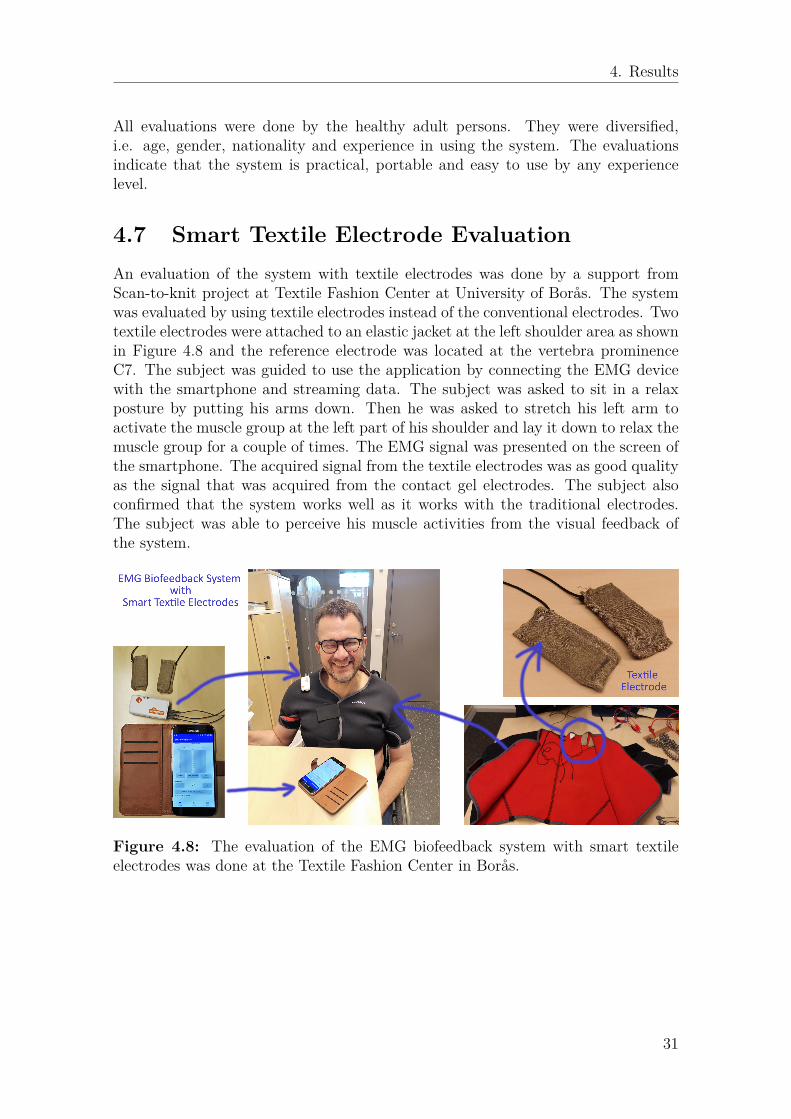
4.8 The evaluation of the EMG biofeedback system with smart textileelectrodes was done at the Textile Fashion Center in Borås. . . . . . . 31
xii

Abbreviations
ADC Analog-to-Digital ConverterAg/AgCl Silver/Silver ChlorideAPI Application Programming InterfaceARV Average Rectified ValueCh ChannelECG ElectrocardiographyEMG ElectromyographyFIR Finite Impulse ResponseHz Hertz (unit)IIR Infinite Impulse ResponseJDK Java Development KitSÄS Södra Älvsborgs SjukhusSDK Software Development KitUI User Interface
xiii

List of Figures
xiv
1Introduction
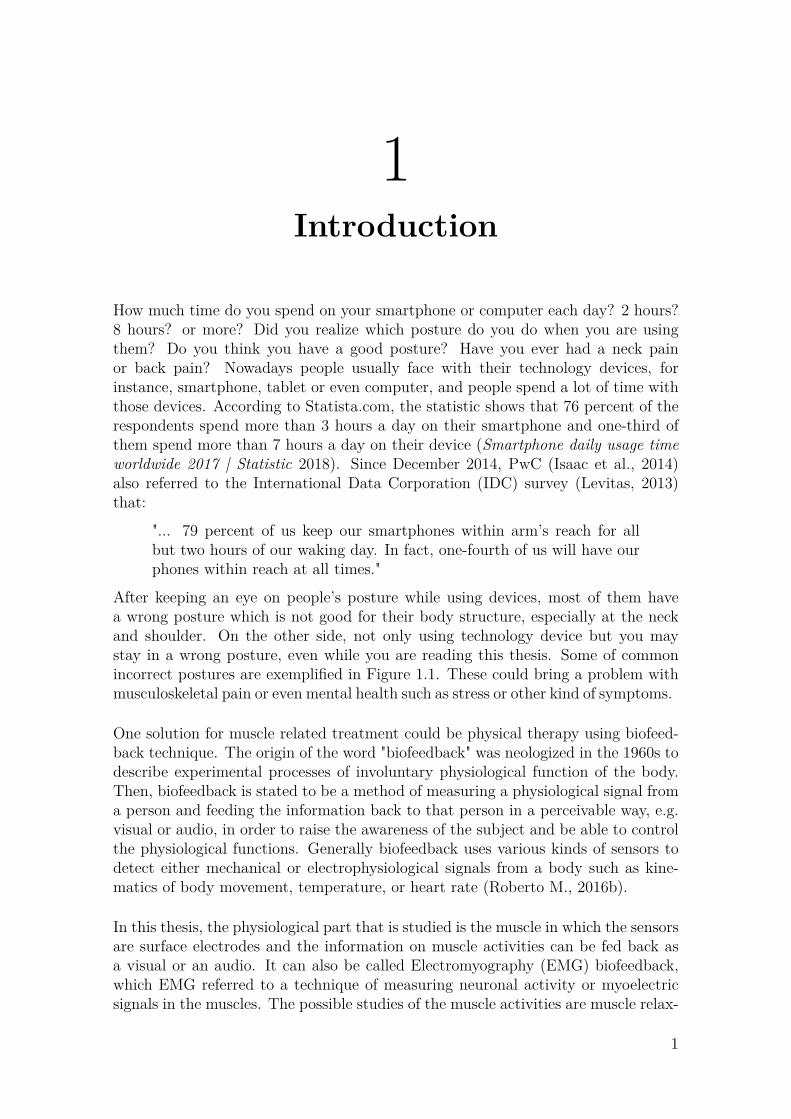
How much time do you spend on your smartphone or computer each day? 2 hours?8 hours? or more? Did you realize which posture do you do when you are usingthem? Do you think you have a good posture? Have you ever had a neck painor back pain? Nowadays people usually face with their technology devices, forinstance, smartphone, tablet or even computer, and people spend a lot of time withthose devices. According to Statista.com, the statistic shows that 76 percent of therespondents spend more than 3 hours a day on their smartphone and one-third ofthem spend more than 7 hours a day on their device (Smartphone daily usage timeworldwide 2017 | Statistic 2018). Since December 2014, PwC (Isaac et al., 2014)also referred to the International Data Corporation (IDC) survey (Levitas, 2013)that:
"... 79 percent of us keep our smartphones within arm’s reach for allbut two hours of our waking day. In fact, one-fourth of us will have ourphones within reach at all times."
After keeping an eye on people’s posture while using devices, most of them havea wrong posture which is not good for their body structure, especially at the neckand shoulder. On the other side, not only using technology device but you maystay in a wrong posture, even while you are reading this thesis. Some of commonincorrect postures are exemplified in Figure 1.1. These could bring a problem withmusculoskeletal pain or even mental health such as stress or other kind of symptoms.
One solution for muscle related treatment could be physical therapy using biofeed-back technique. The origin of the word "biofeedback" was neologized in the 1960s todescribe experimental processes of involuntary physiological function of the body.Then, biofeedback is stated to be a method of measuring a physiological signal froma person and feeding the information back to that person in a perceivable way, e.g.visual or audio, in order to raise the awareness of the subject and be able to controlthe physiological functions. Generally biofeedback uses various kinds of sensors todetect either mechanical or electrophysiological signals from a body such as kine-matics of body movement, temperature, or heart rate (Roberto M., 2016b).
In this thesis, the physiological part that is studied is the muscle in which the sensorsare surface electrodes and the information on muscle activities can be fed back asa visual or an audio. It can also be called Electromyography (EMG) biofeedback,which EMG referred to a technique of measuring neuronal activity or myoelectricsignals in the muscles. The possible studies of the muscle activities are muscle relax-
1

1. Introduction
Figure 1.1: An illustration of examples of posture in different situation which maylead to the pain or disorder. (Freepik, 2018)
ation, muscle activation or contraction, and training on muscle control. Therefore,using biofeedback technique can notice the patient to aware of their unconsciousmuscle tension or unfavorable postures. In addition, the EMG biofeedback can beapplied in other applications, for instance chronical pain disorder, neuromuscularrehabilitation, sport training, stroke patient (Kim, 2017) or bladder dysfunction(Horowitz, 2006).
However, the traditional EMG biofeedback system is accessible only in hospital orclinic where the patient need to frequently visit for rehabilitation. By the time pastand developing of technology, it can be found that mobile devices such as a smart-phone or tablet can be an option for visualizing the biofeedback information and itallows the patient to practice at their home environment. These would enhance anefficiency of restoration and reduce the time wasting for transport to the clinic.
1.1 Motivation
The rehabilitation clinic at Södra Älvsborgs sjukhus (SÄS) has a long tradition inusing EMG signal for biofeedback, but there are several issues that can be developede.g availability of the EMG acquiring hardware, mobility of the system, new tech-nology integration, etc. Therapists at the clinic have expressed interest in improvingthe current EMG biofeedback system to be able to move freely and allow the patientto train themselves at home. Therefore, this thesis is motivated from them.
2
1. Introduction
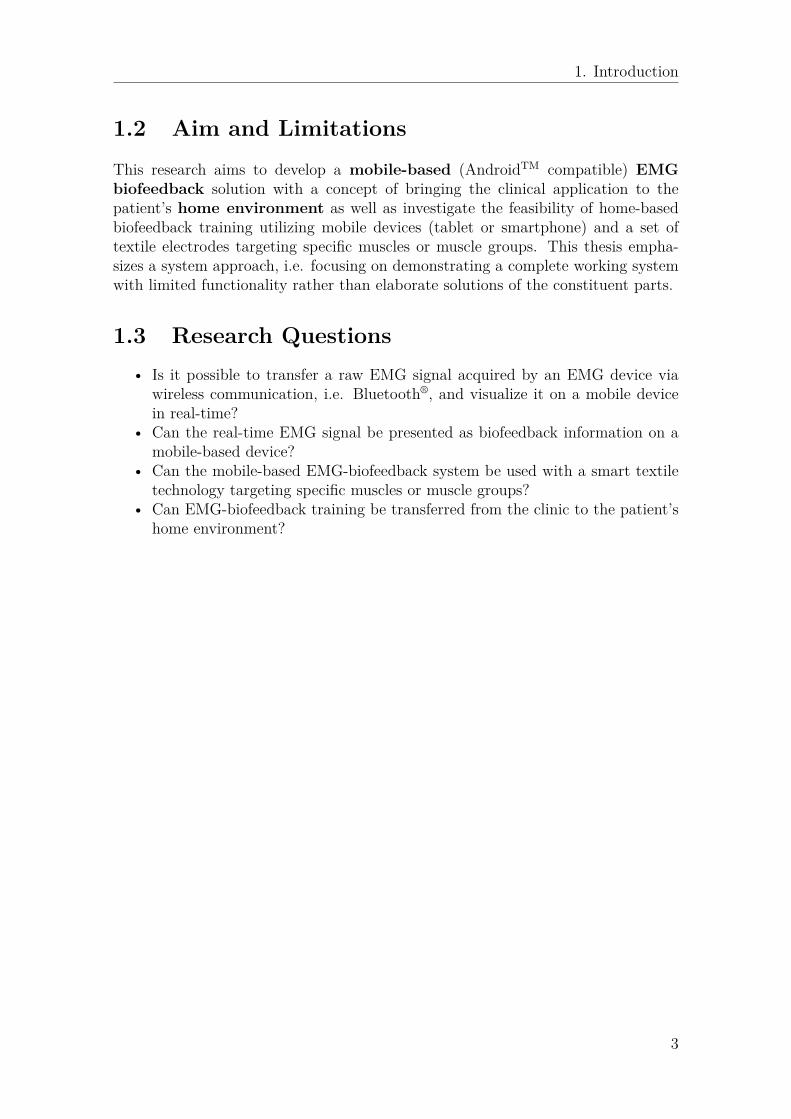
1.2 Aim and LimitationsThis research aims to develop a mobile-based (AndroidTM compatible) EMGbiofeedback solution with a concept of bringing the clinical application to thepatient’s home environment as well as investigate the feasibility of home-basedbiofeedback training utilizing mobile devices (tablet or smartphone) and a set oftextile electrodes targeting specific muscles or muscle groups. This thesis empha-sizes a system approach, i.e. focusing on demonstrating a complete working systemwith limited functionality rather than elaborate solutions of the constituent parts.
1.3 Research Questions• Is it possible to transfer a raw EMG signal acquired by an EMG device via
wireless communication, i.e. Bluetooth®, and visualize it on a mobile devicein real-time?
• Can the real-time EMG signal be presented as biofeedback information on amobile-based device?
• Can the mobile-based EMG-biofeedback system be used with a smart textiletechnology targeting specific muscles or muscle groups?
• Can EMG-biofeedback training be transferred from the clinic to the patient’shome environment?
3

1. Introduction
4
2Background and Theory
This section contains fundamental background and theories behind the EMG biofeed-back system. The physiology of muscle activation and myoelectric signal generationwill be described. Then, a tool for measuring EMG signal which is an electrode andits type will be discussed as well as essential algorithms used to analyze the signal.
2.1 Biofeedback system
In a review of biofeedback in rehabilitation by Giggins et al. (Giggins et al., 2013),the biofeedback has been used in rehabilitation application for more than 50 yearsto help the patient in the physical control after the injury. The review has cate-gorized the different biofeedback in rehabilitation into 2 main categories. One isthe physiological biofeedback and another one is biomechanical biofeedback. Thephysiological system of the body that can be investigated and provide biofeedbackcan be divided into 3 types. The first type is the physiological biofeedback whichincludes neuromuscular biofeedback, EMG biofeedback, and real-time ultrasoundimaging biofeedback. The second type is cardiovascular biofeedback which can bea heart rate biofeedback and heart rate variability or respiratory sinus arrhythmia.The last type is the respiratory system, for instance breathing measurement or pres-sure. Meanwhile, the biomechanical biofeedback can be divided into 3 main typeswhich are movement, postural control and force. Within the study of rehabilitation,a postural correction is also another utilize of biofeedback in the neuromuscularsystem. A research written by Gaffney BM. et al.(Gaffney et al., 2015) has shownan experiment of adopting a neutral posture by a typing task. There is an evidenceof the ability to modify posture using their biofeedback system to improve postureand prevent neck/shoulder pain during computer work .
Another study of biofeedback shows that biofeedback was used in after injury, forexample, after a stroke (Kim, 2017) or after whiplash-associated disorders (Ehren-borg and Archenholtz, 2010). A case study by Cecilia Ehrenborg at SÄS expressedan evaluation of the effectiveness of surface EMG biofeedback training to an inter-disciplinary rehabilitation program about the consequences of activities in daily life.It resulted in no support of the effectiveness of surface EMG biofeedback training forpeople with long-lasting pain after whiplash after four weeks. However, the studyshows a promising consequence as the surface EMG biofeedback has increased aware-ness of the treatment group’s working posture in daily life. With the inconclusiveresult, the interest in the surface EMG biofeedback system is still expressed.
5
2. Background and Theory
There is also a biofeedback system that represents the feedback in an entertainingcomputer game environment. A research made by Madusha J., et al. (Jayarathne etal., 2015) describes the development of EMG biofeedback in the game environment.The subject was asked to control the Flappy Bird in the game to fly and avoid theobstacle by controlling the bicep muscle. The level of the bird is proportional to thelevel of the muscle flexion. Another application related to a game control proposedby Jovanov (Jovanov and Popović, 2014) is a use of EMG biofeedback system forthe humans after brain injury. A car race computer gaming was used as a feedbackof the movement of fingers extension and flextion, and radial and ulnar flexion. Thesystem was proven as a fun and motivating solution for the exercise in rehabilitationof the patients.
Similarly to this thesis, Richer (Richer et al., 2014) had developed an AndroidTM
application for enabling a real-time analysis of ECG and EMG for biking athlete.He used ShimmerTM sensors for acquiring electrical signals and transferred the datavia Bluethooth® to the mobile device. The system is mainly used to monitor theuser’s training parameters by evaluating the user’s training status for live trainingsupervision from heart beat detection (via ECG) and treadle detection (via EMG).Advantages of using ShimmerTM in this research are compact and lightweight aswell as wireless communication accessible for providing real-time data. However, aconstrain from the user’s movement during biking affected the accuracy of the algo-rithm due to motion artifacts and other artifact i.e. the friction between electrodesand clothes.
2.2 EMG signal
Figure 2.1: A diagram shows a single motor unit which consists of a motor neuronand a bundle of muscle fiber that it innervates. (redraw from Webster, 2010)
6

2. Background and Theory
EMG signal is an electrical signal which represents muscle activities. The fundamen-tal process underlying the muscle activation is a transmission of a force generatedby individual muscle fibers through the neuromuscular system. The origin of EMGor myoelectric signal simply starts from the basic unit of the neuromuscular sys-tem called motor unit. A motor unit consists of a motor neuron in spinal cord, itsdendrites, axon, and the bundle of muscle fibers as shown in Figure 2.1. When themotor neuron receives sensory or input from other parts of the nervous system, anelectrical impulse or the action potential is generated by a motor neuron through allthe axons and innervates muscle fibers in order to response an action (Roberto M.,2016a). The stimulation of the motor neuron then causes a group of muscle fibersto contract or relax. Figure 2.2 represents how the muscle action potential can beproduced at a neuromuscular junction where the axon terminal of the motor neuronjoin with the motor end plate of the muscle fiber (Gerard J. Tortora, 2010).
Figure 2.2: An illustration diagram represents an initiative of the muscle actionpotential at the neuromuscular junction. It starts from a coming nerve impulse froma motor neuron along a synaptic vesicle which triggers a neurotransmitter substance,so called acetylcholine (ACh), to diffuse across a synaptic cleft. After that ACh willactivate an ion channel which especially allows sodium ions (Na+) to pass throughit. The inflow of Na+ then causes a muscle action potential to further innervate themuscle fibers. (redraw from Gerard J. Tortora, 2010)
7
2. Background and Theory
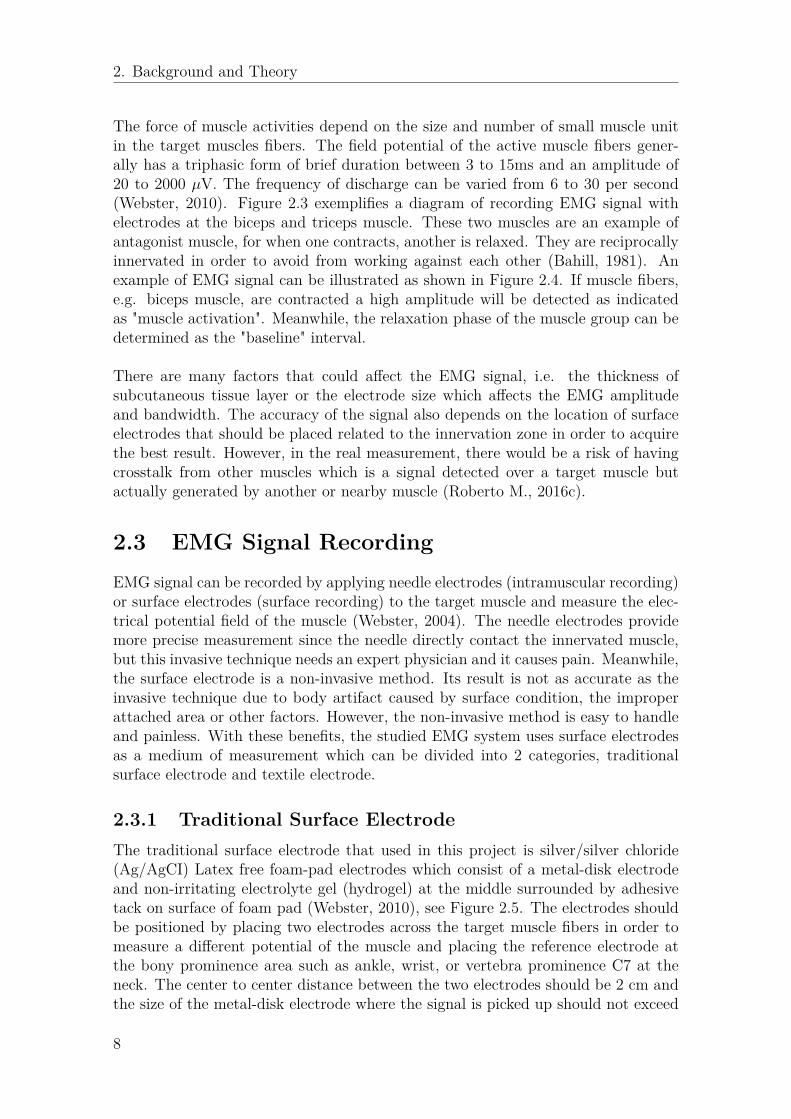
The force of muscle activities depend on the size and number of small muscle unitin the target muscles fibers. The field potential of the active muscle fibers gener-ally has a triphasic form of brief duration between 3 to 15ms and an amplitude of20 to 2000 µV. The frequency of discharge can be varied from 6 to 30 per second(Webster, 2010). Figure 2.3 exemplifies a diagram of recording EMG signal withelectrodes at the biceps and triceps muscle. These two muscles are an example ofantagonist muscle, for when one contracts, another is relaxed. They are reciprocallyinnervated in order to avoid from working against each other (Bahill, 1981). Anexample of EMG signal can be illustrated as shown in Figure 2.4. If muscle fibers,e.g. biceps muscle, are contracted a high amplitude will be detected as indicatedas "muscle activation". Meanwhile, the relaxation phase of the muscle group can bedetermined as the "baseline" interval.
There are many factors that could affect the EMG signal, i.e. the thickness ofsubcutaneous tissue layer or the electrode size which affects the EMG amplitudeand bandwidth. The accuracy of the signal also depends on the location of surfaceelectrodes that should be placed related to the innervation zone in order to acquirethe best result. However, in the real measurement, there would be a risk of havingcrosstalk from other muscles which is a signal detected over a target muscle butactually generated by another or nearby muscle (Roberto M., 2016c).
2.3 EMG Signal RecordingEMG signal can be recorded by applying needle electrodes (intramuscular recording)or surface electrodes (surface recording) to the target muscle and measure the elec-trical potential field of the muscle (Webster, 2004). The needle electrodes providemore precise measurement since the needle directly contact the innervated muscle,but this invasive technique needs an expert physician and it causes pain. Meanwhile,the surface electrode is a non-invasive method. Its result is not as accurate as theinvasive technique due to body artifact caused by surface condition, the improperattached area or other factors. However, the non-invasive method is easy to handleand painless. With these benefits, the studied EMG system uses surface electrodesas a medium of measurement which can be divided into 2 categories, traditionalsurface electrode and textile electrode.
2.3.1 Traditional Surface ElectrodeThe traditional surface electrode that used in this project is silver/silver chloride(Ag/AgCI) Latex free foam-pad electrodes which consist of a metal-disk electrodeand non-irritating electrolyte gel (hydrogel) at the middle surrounded by adhesivetack on surface of foam pad (Webster, 2010), see Figure 2.5. The electrodes shouldbe positioned by placing two electrodes across the target muscle fibers in order tomeasure a different potential of the muscle and placing the reference electrode atthe bony prominence area such as ankle, wrist, or vertebra prominence C7 at theneck. The center to center distance between the two electrodes should be 2 cm andthe size of the metal-disk electrode where the signal is picked up should not exceed
8
2. Background and Theory
Figure 2.3: An illustration shows a signal diagram of an example of measuring themuscle signal at the biceps and triceps muscle by using surface EMG. The electricalpotential is recorded by electrodes and amplified by an EMG signal processing unit.(redraw from Vogel, 2016)
Figure 2.4: An example of EMG signal in time-domain. The baseline intervalindicates muscle relaxation and the muscle activation indicates muscle contractionor muscle activity level which can be evaluated by the amplitude (PlayRobots, 2018).
1 cm (Shimmer, 2017). There are two main cautions regarding the location of theelectrodes. Firstly, the electrodes must not be located on or near the tendon of themuscle because the muscle fibers near the tendon become fewer which results in alower amplitude of the EMG signal. Secondly, they must not be placed on the motorpoint of the muscle since there will be a summation of nerve signal in the recordingEMG signal. Therefore, the inaccurate EMG signal might be acquired (Luca, 2002).
Advantages of using the traditional surface electrode are that it is a skin-contactelectrode which results in less motion artifacts and the hydrogel also has a good
9
2. Background and Theory
property of electron transport across the interface that will enhance the recordingof the EMG signal (Tavakoli and Tang, 2017). On the other side, the traditionalsurface electrode is a consumable element due to the disposable material. So, itwould be great if there is a solution for reusable electrode.
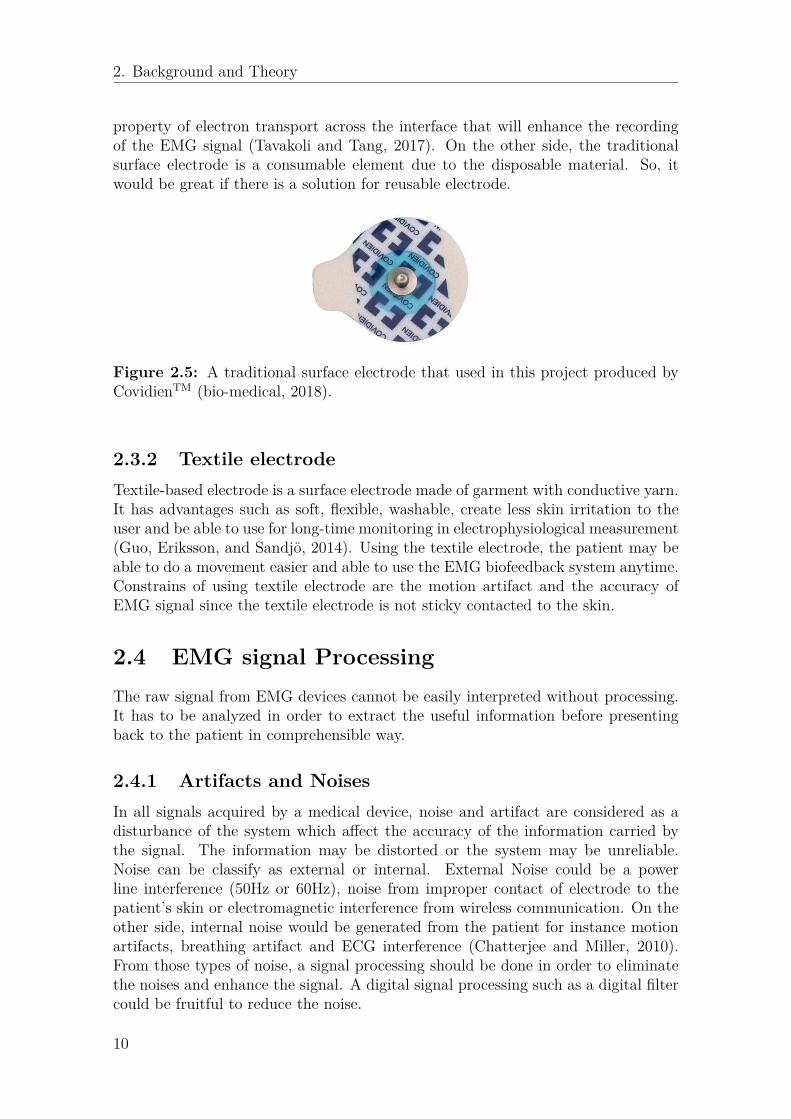
Figure 2.5: A traditional surface electrode that used in this project produced byCovidienTM (bio-medical, 2018).
2.3.2 Textile electrodeTextile-based electrode is a surface electrode made of garment with conductive yarn.It has advantages such as soft, flexible, washable, create less skin irritation to theuser and be able to use for long-time monitoring in electrophysiological measurement(Guo, Eriksson, and Sandjö, 2014). Using the textile electrode, the patient may beable to do a movement easier and able to use the EMG biofeedback system anytime.Constrains of using textile electrode are the motion artifact and the accuracy ofEMG signal since the textile electrode is not sticky contacted to the skin.
2.4 EMG signal ProcessingThe raw signal from EMG devices cannot be easily interpreted without processing.It has to be analyzed in order to extract the useful information before presentingback to the patient in comprehensible way.
2.4.1 Artifacts and NoisesIn all signals acquired by a medical device, noise and artifact are considered as adisturbance of the system which affect the accuracy of the information carried bythe signal. The information may be distorted or the system may be unreliable.Noise can be classify as external or internal. External Noise could be a powerline interference (50Hz or 60Hz), noise from improper contact of electrode to thepatient’s skin or electromagnetic interference from wireless communication. On theother side, internal noise would be generated from the patient for instance motionartifacts, breathing artifact and ECG interference (Chatterjee and Miller, 2010).From those types of noise, a signal processing should be done in order to eliminatethe noises and enhance the signal. A digital signal processing such as a digital filtercould be fruitful to reduce the noise.
10
2. Background and Theory
2.4.2 Digital filterDigital Filter is a part of signal processing which mainly used for separate inter-ference signal from the acquired signal and restore a distorted signal in some way(Smith, 1997a). As mentioned in the section 2.2 and 2.4.1, there are many factorsthat could affect EMG data. The acquired EMG data can be disturbed by noisefrom the environment and motion artifacts. Thus, EMG data should be filtered outthe noises. The filter design depends on the specification of the filters which mayrely on constraints of frequency response, unit or step response, filter type (e.g. FIRor IIR), and filter order (Hayes, 2012). In EMG application, the muscle activitiesare generally within the range of 15-500Hz (Luca, 1997 and Boxtel, 2001). There-fore, a high-pass filter with a 3dB cut-off frequency at 10-20 Hz and a low-pass filterwith a 3dB cut-off frequency at 400-450Hz should be applied in order to extract theuseful information and avoid loss of information. However, if the muscles under avery thin subcutaneous fat layer are investigated, some exceptions could be found.Then, the bandwidth can be increased more than 450Hz. Moreover, the movementartifact can be eliminated by applying a high-pass filter at 25-30 Hz for movementor gait analysis (Merletti, 2009, Sandsjö, 2004, Assambo and Burke, 2012).
In this thesis, BlackMan-Windowed-Sinc filters (Smith, 1997b) are used to separatethe noise from the EMG signal. Advantages of using this type of the filter are stable,produce few overshoot, good stopband attenuation and easy to program . The idealfilter kernel of the sinc function, written in Equation 2.1, has a limitation of non-zero amplitude dropping to both negative and positive infinity and the abruptnessof the truncated ends. A modification of Blackman window is then added to flattenthe stopband, which is given by Equation 2.2. The multiplication of the sinc-filterkernel and the Blackman window will result in a perfect EMG signal for the system.
h[i] = sin(2πfci)iπ
(2.1)
w[i] = 0.42 − 0.5cos(2πiM
) + 0.08cos(4πiM
) (2.2)
Where M = length of filter, and fc = cut-off frequency.
2.4.3 Signal AnalysisThe EMG raw signal can be biphasic depends on the connection of the EMG channelsand it has a sampling rate of 1024 Hz. The average rectified value (ARV) is computedin order to estimate the signal and make it becomes easier to be interpreted. A chunkof 256 (N=256) data or 32 (N=32) data of each second will be used for calculatingthe average of its absolute value according to Equation 2.3, where X̄ is the meanvalue of the chunk of interested data. The difference in the number of samples (N)depends on the different applications which will be explained in section 4.3.2.
[h]ARV = 1N
N∑i=1
∣∣∣x1 − X̄∣∣∣ (2.3)
11

2. Background and Theory
2.5 EMG biofeedback system at SÄSAt SÄS, there are two traditional EMG biofeedback systems. One is a 1-channelEMG biofeedback system with audio feedback or visual feedback on an analog meter.Another system is a 2-channel EMG biofeedback system with a visual feedback onPC screen, including time-graph and bar.
2.5.1 1-Channel EMG biofeedback systemThe 1-channel system can measure only a muscle group. The system using at SÄSis shown in Figure 2.6. This system can result in audio feedback or visual feedbackas an analog meter. Even though the electrode are applied at the muscle groups onboth left and right areas of the shoulder, but the meter represents only one valuewhich is the summation of those EMG values. The threshold and audio level canbe manually adjusted at the hardware.
Figure 2.6: An illustration of 1-channel EMG biofeedback system
2.5.2 2-Channel EMG biofeedback systemThe 2-channel EMG biofeedback system is a system where 5 electrodes are used tomeasure the EMG signal. It requires 2 electrodes per channel and the last electrodeact as a reference which should be applied at the bony area. The advantage ofusing 2-channel at SÄS is to monitor the muscle group on both left and right sidefor instance the muscle groups in the shoulder for posture correction. An amplifierunit using at SÄS is shown in Figure 2.7. It can adjust various parameter by thishardware i.e. gain, range, etc. The EMG signal will be processed by this hardwareand result in visual feedback on the screen. There are two visual feedback option.One is bar chart and another one is time-graph. On the screen, a threshold of themuscle activation can be set. If the EMG value is higher than the threshold, thegreen color will be present. Otherwise, red color is shown.
12
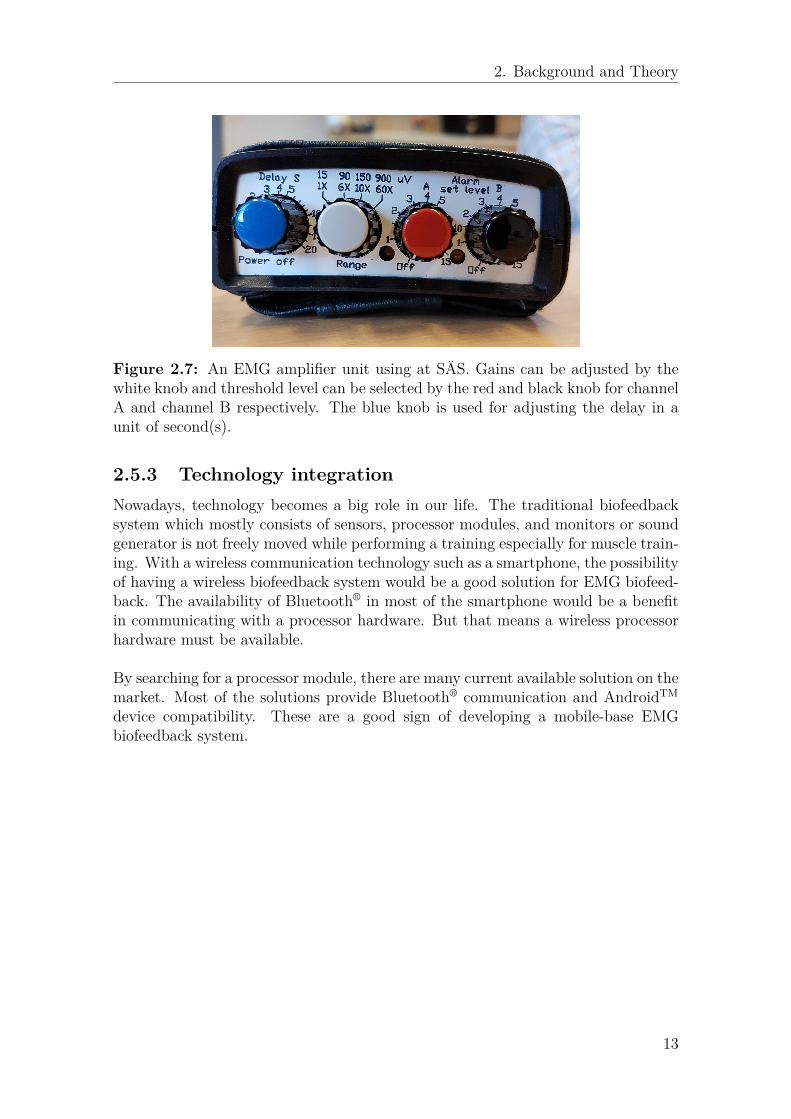
2. Background and Theory
Figure 2.7: An EMG amplifier unit using at SÄS. Gains can be adjusted by thewhite knob and threshold level can be selected by the red and black knob for channelA and channel B respectively. The blue knob is used for adjusting the delay in aunit of second(s).
2.5.3 Technology integrationNowadays, technology becomes a big role in our life. The traditional biofeedbacksystem which mostly consists of sensors, processor modules, and monitors or soundgenerator is not freely moved while performing a training especially for muscle train-ing. With a wireless communication technology such as a smartphone, the possibilityof having a wireless biofeedback system would be a good solution for EMG biofeed-back. The availability of Bluetooth® in most of the smartphone would be a benefitin communicating with a processor hardware. But that means a wireless processorhardware must be available.
By searching for a processor module, there are many current available solution on themarket. Most of the solutions provide Bluetooth® communication and AndroidTM
device compatibility. These are a good sign of developing a mobile-base EMGbiofeedback system.
13
2. Background and Theory
14
3Developing process and methods
This chapter describes the project’s development processes which are a combinationof methodologies for researching and the development of the EMG system. Thethesis is performed by designing criteria of the system based on the study visit andsearching for an available commercial EMG amplifier. The work then proceeded bydeveloping an AndroidTM application in order to present real-time EMG-signals ina biofeedback manner on a mobile device.
3.1 Interview and Study Visit
With a collaboration at SÄS, a study visit and interview at the hospital were per-formed to understand the traditional EMG biofeedback system at clinical. A discus-sion with occupational therapists who experience working with target patients hasbeen done in order to learn the training process of the muscle relaxation trainingwhich is one of the EMG biofeedback system used at the rehabilitation clinic. Thevisit was done on the 26th of April 2018 at the Rehabilitation clinic at SÄS in Borås.
At the visit, a big picture of the EMG biofeedback system has been clearly presentedas well as comments from the therapists who are familiar with the system wasexpressed. The system at SÄS consists of 3 main parts which are electrodes formeasuring EMG signal, an EMG amplifier unit for acquiring and processing thesignal, and an analog meter or a computer for monitoring the signal. It can befound that the traditional system is not easy to carry by the user due to the wireconnections of the computer and the EMG device. It also does not allow the patientsto have the system at their home. The patient needs to visit the clinic frequentlyto perform the rehabilitation training for a period of time.
3.2 Design Criteria and FlowchartFrom the study visit, interview, and literature reviews, a design criteria of the devel-oping system is then summarized. The implemented prototype of EMG biofeedbacksystem is developed based on criteria :
• simple, i.e. easy to use and understand by low-technology usage, easy to setup and operate.
• portable, i.e. the system should be moved freely so the patient can be usedat home environment (Koga et al., 2013).
15

3. Developing process and methods
• practical, i.e. reliable result / data.• real-time, i.e. the EMG data can be acquired and visualized real-time.
The implemented Android software should work following a procedure simplified inFigure 3.1.
Figure 3.1: A flowchart shows the application flow of data.
16
3. Developing process and methods
3.3 EMG device - Shimmer3 EMG unit
By acquiring the EMG data, an electronic hardware for data acquisition is needed.Since the research aims to develop an EMG biofeedback system that applicable forhome-based use and feasible to monitor the data on a mobile device, the importantfeatures would be a wireless module with a wireless communication. One solution isan EMG unit, called Shimmer3 EMG unit (Figure 3.2), produced by ShimmerTM.It is a 16-bit and 24-bit 2-channel system with Bluetooth® 4.0 communication andcompatible with both PC and AndroidTM device. With a provided JavaTM libraryfunction, Shimmer3 is selected to be the EMG measurement for this research.
Figure 3.2: Shimmer3 EMG unit
Shimmer3 EMG unit is a five-wire EMG unit that can be configured to record theelectrical potential of muscle activity. It consists of two channels input and one ref-erence. The EMG Unit uses a low-power, multichannel analog front-end especiallydesigned for biopotential measurements, consisting of delta-sigma analog-to-digitalconverters and programmable configurable gain amplifiers (1, 2, 3, 4, 6, 8, 12). Italso provides a wireless solution for measuring EMG signal with an ergonomicallyvaluable arrangement. The basic circuit diagram of the module is shown in Fig-ure3.3. It offers a Bluetooth® communication for connecting to mobile phone orother electronic devices. These advantages fit the research goal that aims to developan EMG biofeedback system for a home-based training.
An example of using the EMG unit is to measure the muscle activity of bicepsand triceps by connecting the 5 electrodes to channel 1 negative (Ch1N – brown),channel 1 positive (Ch1P – red), channel 2 negative (Ch2N – white), channel 2positive (Ch2P – black), and reference (Ref – green). Then, the electrodes shouldbe positioned on the body, for example on the right arm. Two electrodes shouldbe placed across the muscle fibers of the target muscle, in this case are biceps andtriceps. The reference electrode should be placed at an electrically neutral point ofthe body, as far away as possible from the target muscle. Bony prominences such asthose at the elbow and the wrist are recommended Shimmer, 2017. Figure3.4 showsan example of positioning electrodes.
17

3. Developing process and methods
Figure 3.3: A block diagram of Shimmer3 EMG unit is illustrated.
Figure 3.4: An example of positioning of electrodes for EMG measurement.
In addition, ShimmerTM also has several available AndroidTM applications on GoogleTM
Play which can be used for monitoring EMG data on a smartphone or a tablet. Oneof the available application that is used at the start of the project is called Shim-merCapture application. This application has simple useful features for EMG dataacquisition such as streaming, logging and plotting the signals to graph. However,this application is not limited to monitoring EMG-signal, but also allows other kindof sensors included in Shimmer3 module to be explored such as ECG, gyroscope,etc. Several configurations, such as gain, sampling rate, resolution, are provided.Figure 3.5 represents the user interface of ShimmerCapture application.
18
3. Developing process and methods
Figure 3.5: A user interface of ShimmerCapture application
3.4 Android Development
One of the benefits of using the EMG unit by ShimmerTM is the supportive An-droid API and useful JavaTM libraries for developers. The mobile application inthis research is developed by using Android Studio program together with providedShimmer’s JavaTM libraries. Android operating system also has the most worldwidemarket share for the mobile operating system according to the Statcounter© (Stat-Counter, 2017).
In order to develop a mobile application, there are several pre-requisites of hare-wares and softwares for using Android Studio program together with the ShimmerJava/Android API library which are:
• Java Development Kit (JDK) - a software environment used for developingJava applications and applets.
• AndroidTM Software Development Kit (SDK) - a software envrionmenthelps developers to create applications for the AndroidTM platform.
• AndroidTM device - a device which has a minimum Android API version of17 or Android 4.2 (Jelly-Bean) and has any version of BluetoothTM for wirelesscommunication.
• Shimmer Java/Android API - supported library from ShimmerTM
• Shimmer3 EMG unit - an EMG device
19
3. Developing process and methods
Figure 3.6: Statistics of mobile operating system market share in the worldwideare indicated as a line and bar graph. (data from StatCounter, 2017).
The application development then starts from import project. The supported Shim-mer Java/Android API library, named ShimmerAndroidInstrumentDriver, is se-lected at this state, see Figure 3.7. If the application already exists and the modifi-cation is needed, then select ’Open an existing Android project’ option. For a newproject, a new module should be created. For existing projects, the change can bedone by editing the code in the Java folder.
The development on Java programming language is an object-oriented programmingwhich then the development of this project is based on ShimmerObject class. Theacquired data from the Shimmer unit is collected in an object cluster via Bluetoothmanager functioned by ShimmerBluetoothManagerAndroid class. Applying filtersto the EMG signal in order to eliminate noise can be done by using a support fromFilter class. Common functions that are used in the developing EMG biofeedbacksystem can be listed as below:
20
3. Developing process and methods
Figure 3.7: At welcome page of Android Studio program, the development canbe started from selecting ’Import project’ -> ’ShimmerAndroidInstrumentDriver’as indicated in the red boxes,
• btManager.connectShimmerThroughBTAddress(shimmerBtAdd);- attempt to connect to the Android device via Bluetooth connection, whereshimmerBtAdd is a bluetooth address of the Shimmer unit.
• btManager.startStreaming(shimmerBtAdd);- start streaming, acquiring data from the Shimmer unit.
• shimmerDevice.stopStreaming();- stop streaming over Bluetooth.
• Collection<FormatCluster> f = objc.getCollectionOfFormatClusters(Configuration.Shimmer3.ObjectClusterSensorName.channelName);FormatCluster c = ((FormatCluster)ObjectCluster.returnFormatCluster(f, ChannelDetails.channelType));dataEMG = c.mData;- retrieve data from a data structure.
• filterType = new Filter(filterType, samplingRate, cutOffFrequency);- initialize a filter
• dataEMG = filterType.filterData(rawData);- apply the filter to the data
21
3. Developing process and methods
22
4Results
Since this thesis is a development of a system. This chapter will represent the EMGbiofeedback system and its specification. Two scenarios that the system could beinvolved will be shown. Then the thesis work was evaluated by testing the systemwith subjects and the possibility in smart textile electrodes was investigated togetherwith the Scan-to-Knit project at the University of Borås. The supported idea andother comments will be discussed in the next chapter.
4.1 System Overview
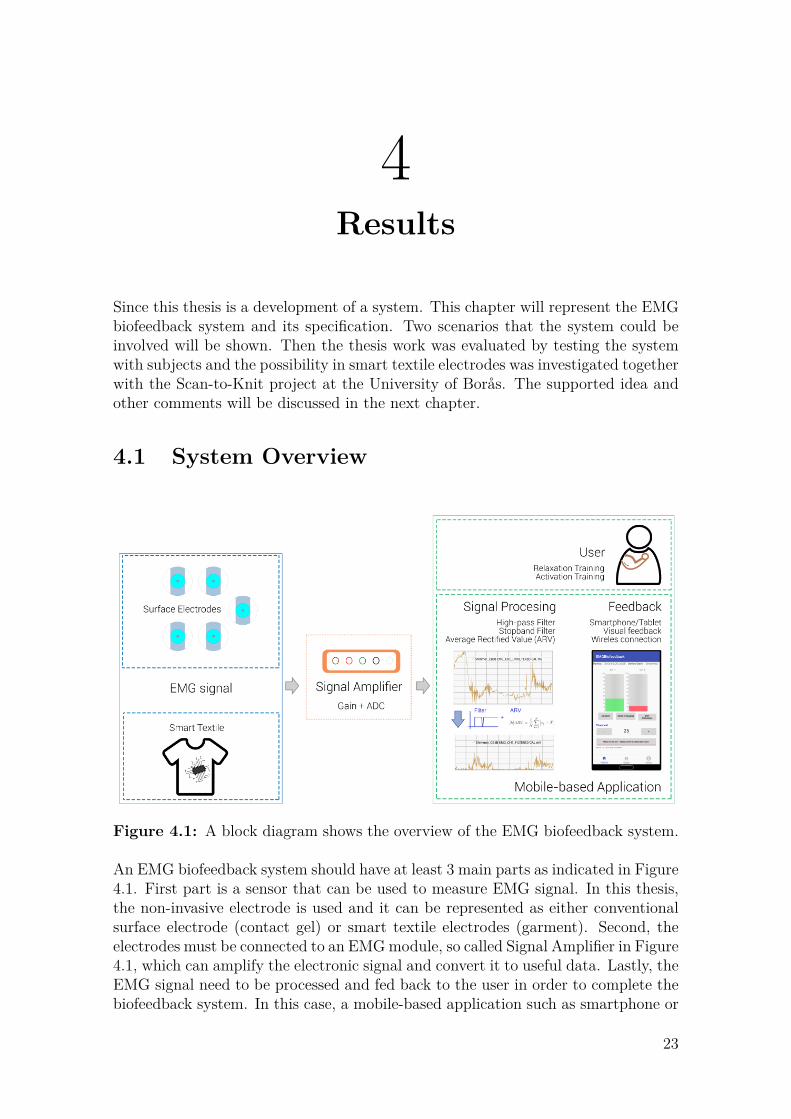
Figure 4.1: A block diagram shows the overview of the EMG biofeedback system.
An EMG biofeedback system should have at least 3 main parts as indicated in Figure4.1. First part is a sensor that can be used to measure EMG signal. In this thesis,the non-invasive electrode is used and it can be represented as either conventionalsurface electrode (contact gel) or smart textile electrodes (garment). Second, theelectrodes must be connected to an EMGmodule, so called Signal Amplifier in Figure4.1, which can amplify the electronic signal and convert it to useful data. Lastly, theEMG signal need to be processed and fed back to the user in order to complete thebiofeedback system. In this case, a mobile-based application such as smartphone or
23
4. Results
tablet is a mean of feedback that uses to visualize the EMG information and can bedeveloped to warning as an audio feedback.
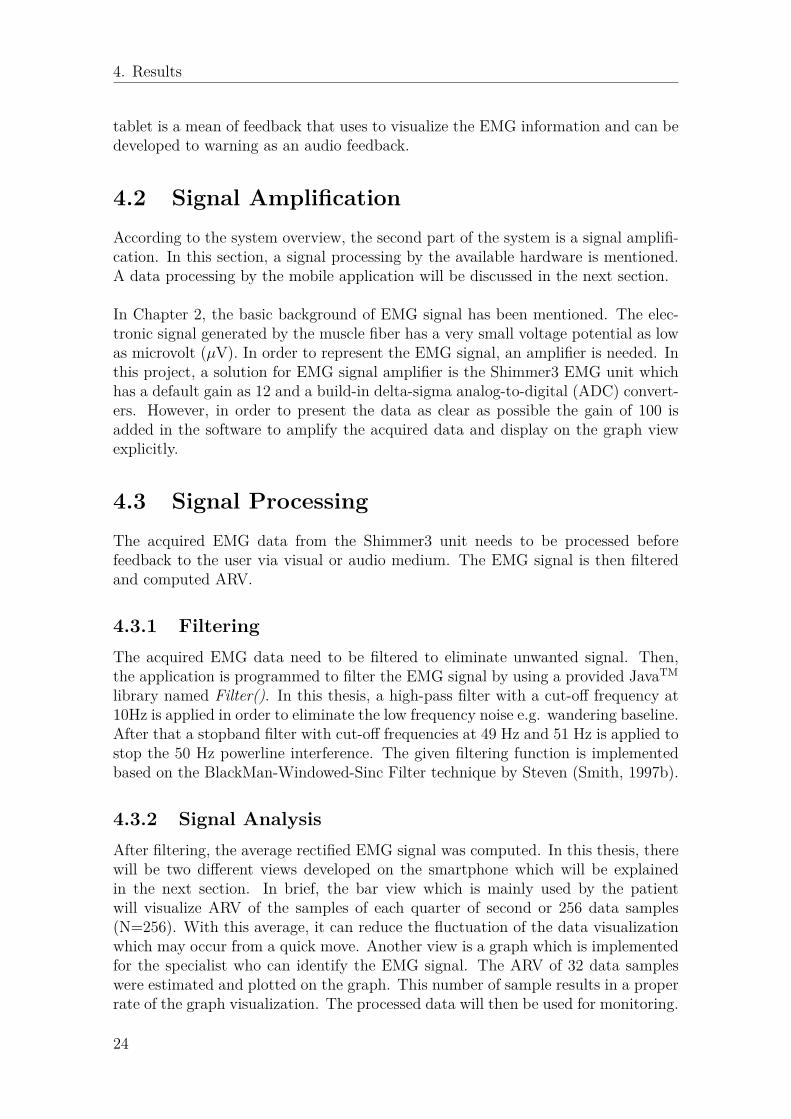
4.2 Signal AmplificationAccording to the system overview, the second part of the system is a signal amplifi-cation. In this section, a signal processing by the available hardware is mentioned.A data processing by the mobile application will be discussed in the next section.
In Chapter 2, the basic background of EMG signal has been mentioned. The elec-tronic signal generated by the muscle fiber has a very small voltage potential as lowas microvolt (µV). In order to represent the EMG signal, an amplifier is needed. Inthis project, a solution for EMG signal amplifier is the Shimmer3 EMG unit whichhas a default gain as 12 and a build-in delta-sigma analog-to-digital (ADC) convert-ers. However, in order to present the data as clear as possible the gain of 100 isadded in the software to amplify the acquired data and display on the graph viewexplicitly.
4.3 Signal ProcessingThe acquired EMG data from the Shimmer3 unit needs to be processed beforefeedback to the user via visual or audio medium. The EMG signal is then filteredand computed ARV.
4.3.1 FilteringThe acquired EMG data need to be filtered to eliminate unwanted signal. Then,the application is programmed to filter the EMG signal by using a provided JavaTM
library named Filter(). In this thesis, a high-pass filter with a cut-off frequency at10Hz is applied in order to eliminate the low frequency noise e.g. wandering baseline.After that a stopband filter with cut-off frequencies at 49 Hz and 51 Hz is applied tostop the 50 Hz powerline interference. The given filtering function is implementedbased on the BlackMan-Windowed-Sinc Filter technique by Steven (Smith, 1997b).
4.3.2 Signal AnalysisAfter filtering, the average rectified EMG signal was computed. In this thesis, therewill be two different views developed on the smartphone which will be explainedin the next section. In brief, the bar view which is mainly used by the patientwill visualize ARV of the samples of each quarter of second or 256 data samples(N=256). With this average, it can reduce the fluctuation of the data visualizationwhich may occur from a quick move. Another view is a graph which is implementedfor the specialist who can identify the EMG signal. The ARV of 32 data sampleswere estimated and plotted on the graph. This number of sample results in a properrate of the graph visualization. The processed data will then be used for monitoring.
24
4. Results
4.3.3 Real-time processingThe thesis work aims to develop a real-time system. Since the Shimmer3 unit offersBluetooth® connection and most of mobile devices in the market provides Bluetooth®
connection, so a real-time system is not too difficult to implement. The EMG datais processed to be presented on the smartphone as close as real-time. The EMGbiofeedback application is programmed to set the frequency of the Shimmer3 unitto be 1024Hz. Then, a chunk of 256 samples or 32 samples, depends on views, will befurther processed. The method of signal analysis will result in a small delay abouta quarter of second or 0.25 seconds due to the data collection which is acceptable.
4.4 FeedbackEMG biofeedback can be represented in many way such as visual or audio. Frommany literature, there are many solution to express EMG biofeedback but thisproject chooses a smartphone Samsung Galaxy 7 as a mobile device to representthe EMG biofeedback because it could both visualize and make a sound feedback aswell as the AndroidTM operating system has the most market share in the world. Italso fit the requirement of the project that would like to transfer the clinical usageto the home environment.
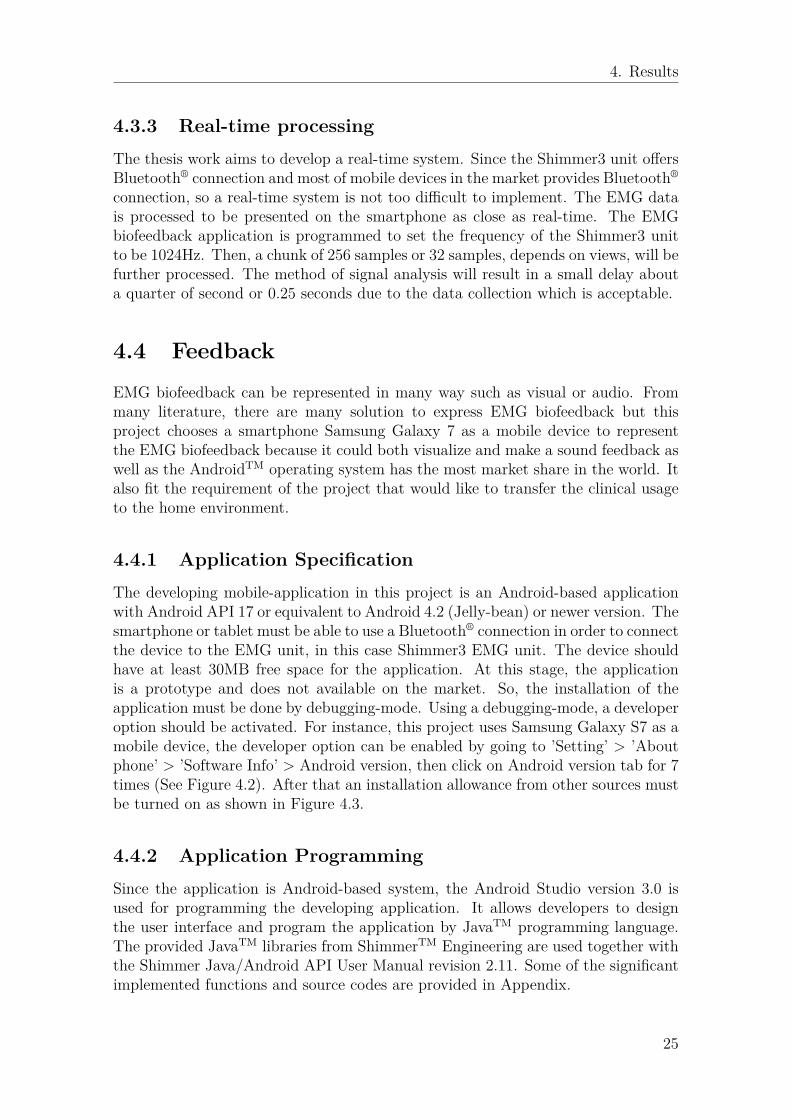
4.4.1 Application SpecificationThe developing mobile-application in this project is an Android-based applicationwith Android API 17 or equivalent to Android 4.2 (Jelly-bean) or newer version. Thesmartphone or tablet must be able to use a Bluetooth® connection in order to connectthe device to the EMG unit, in this case Shimmer3 EMG unit. The device shouldhave at least 30MB free space for the application. At this stage, the applicationis a prototype and does not available on the market. So, the installation of theapplication must be done by debugging-mode. Using a debugging-mode, a developeroption should be activated. For instance, this project uses Samsung Galaxy S7 as amobile device, the developer option can be enabled by going to ’Setting’ > ’Aboutphone’ > ’Software Info’ > Android version, then click on Android version tab for 7times (See Figure 4.2). After that an installation allowance from other sources mustbe turned on as shown in Figure 4.3.
4.4.2 Application ProgrammingSince the application is Android-based system, the Android Studio version 3.0 isused for programming the developing application. It allows developers to designthe user interface and program the application by JavaTM programming language.The provided JavaTM libraries from ShimmerTM Engineering are used together withthe Shimmer Java/Android API User Manual revision 2.11. Some of the significantimplemented functions and source codes are provided in Appendix.
25
4. Results
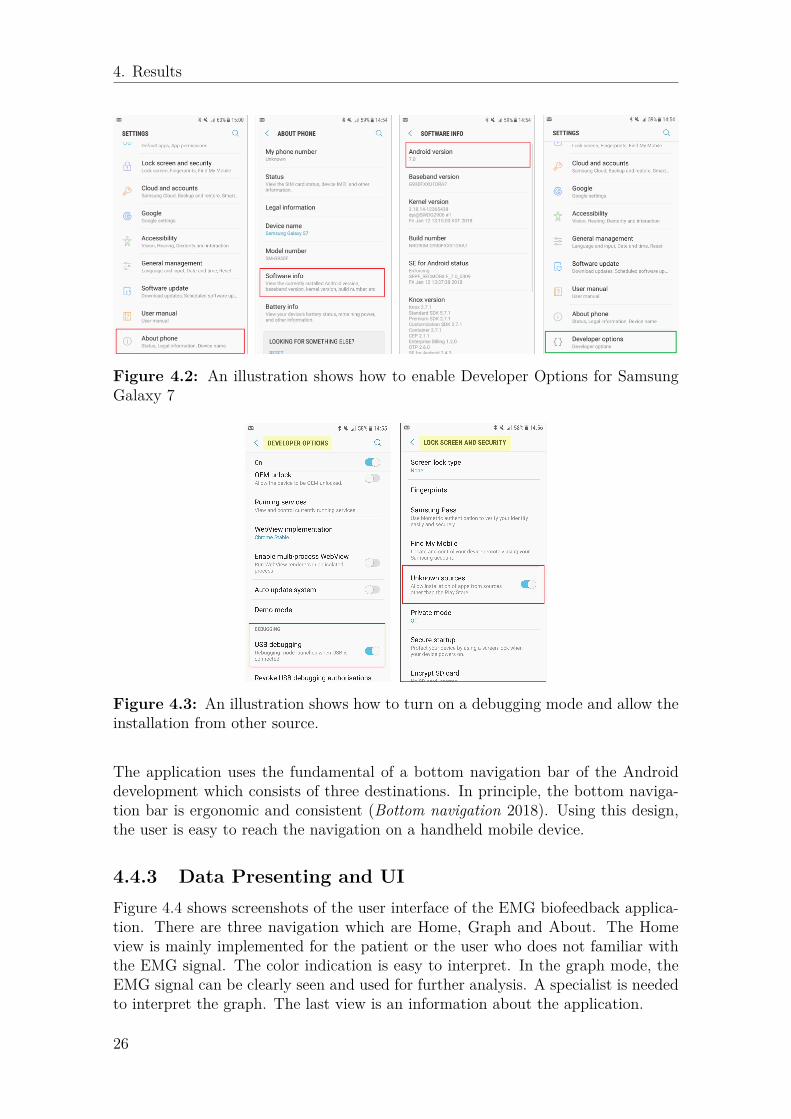
Figure 4.2: An illustration shows how to enable Developer Options for SamsungGalaxy 7
Figure 4.3: An illustration shows how to turn on a debugging mode and allow theinstallation from other source.
The application uses the fundamental of a bottom navigation bar of the Androiddevelopment which consists of three destinations. In principle, the bottom naviga-tion bar is ergonomic and consistent (Bottom navigation 2018). Using this design,the user is easy to reach the navigation on a handheld mobile device.
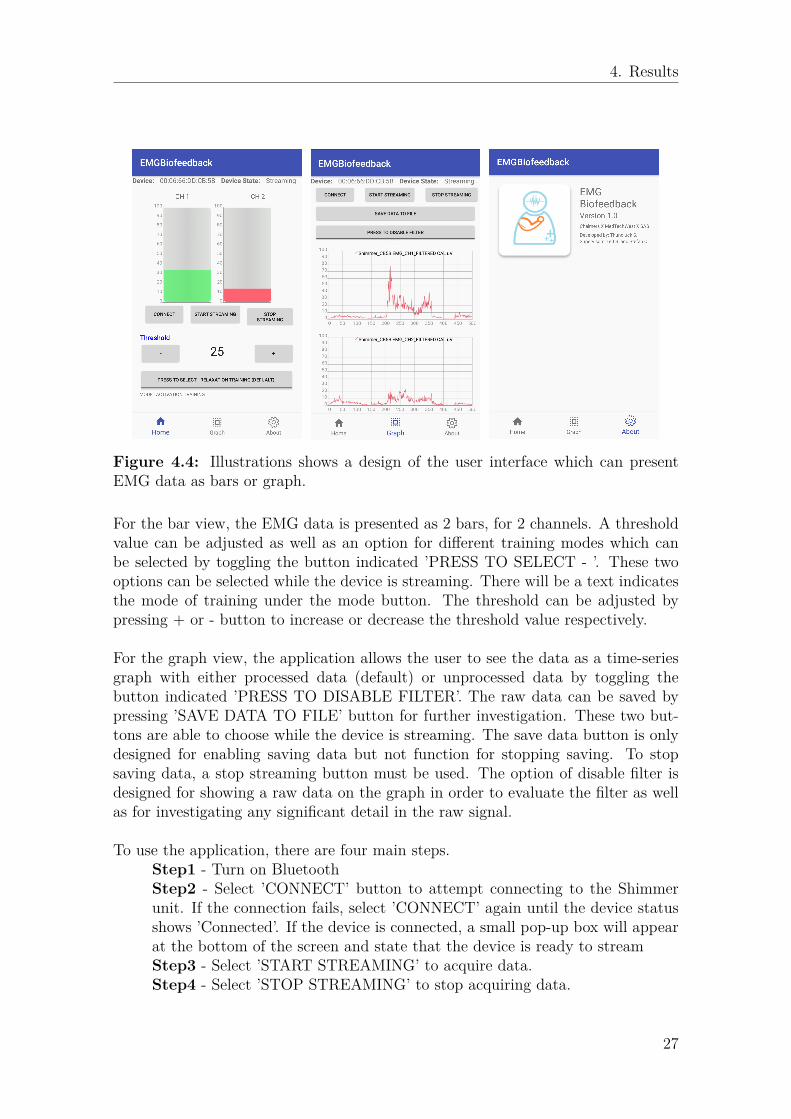
4.4.3 Data Presenting and UIFigure 4.4 shows screenshots of the user interface of the EMG biofeedback applica-tion. There are three navigation which are Home, Graph and About. The Homeview is mainly implemented for the patient or the user who does not familiar withthe EMG signal. The color indication is easy to interpret. In the graph mode, theEMG signal can be clearly seen and used for further analysis. A specialist is neededto interpret the graph. The last view is an information about the application.
26
4. Results
Figure 4.4: Illustrations shows a design of the user interface which can presentEMG data as bars or graph.
For the bar view, the EMG data is presented as 2 bars, for 2 channels. A thresholdvalue can be adjusted as well as an option for different training modes which canbe selected by toggling the button indicated ’PRESS TO SELECT - ’. These twooptions can be selected while the device is streaming. There will be a text indicatesthe mode of training under the mode button. The threshold can be adjusted bypressing + or - button to increase or decrease the threshold value respectively.
For the graph view, the application allows the user to see the data as a time-seriesgraph with either processed data (default) or unprocessed data by toggling thebutton indicated ’PRESS TO DISABLE FILTER’. The raw data can be saved bypressing ’SAVE DATA TO FILE’ button for further investigation. These two but-tons are able to choose while the device is streaming. The save data button is onlydesigned for enabling saving data but not function for stopping saving. To stopsaving data, a stop streaming button must be used. The option of disable filter isdesigned for showing a raw data on the graph in order to evaluate the filter as wellas for investigating any significant detail in the raw signal.
To use the application, there are four main steps.Step1 - Turn on BluetoothStep2 - Select ’CONNECT’ button to attempt connecting to the Shimmerunit. If the connection fails, select ’CONNECT’ again until the device statusshows ’Connected’. If the device is connected, a small pop-up box will appearat the bottom of the screen and state that the device is ready to streamStep3 - Select ’START STREAMING’ to acquire data.Step4 - Select ’STOP STREAMING’ to stop acquiring data.
27
4. Results
4.5 ScenariosTwo Examples of using the system EMG biofeedback system are training of musclerelaxation and muscle activation which in this case can be selected by pressing thetoggle button ’PRESS TO SELECT - ’ mode as shown in Figure 4.5. By settinga threshold, the patient can train themselves to relax or strengthen their musclesand investigate their movement by the bars or graph visualization. There will be agreen color means successfully done the muscle training while a red color indicatesa fault in muscle training.
Figure 4.5: Screenshots of two scenarios of muscle relaxation training andstrengthen training or activation training mode with a threshold of 25 are presented.The left bar represents EMG values from Channel 1 and the right bar representsEMG values from Channel 2.
4.5.1 Relaxation trainingThe relaxation training can be applied to the patients who has a problem of musclerelaxing. The patients can train themselves by this EMG biofeedback system. Oneexample of the relaxation training is a training at shoulder-neck area. First, fourelectrodes should be attached to the muscle area on left and right shoulder, twoelectrodes for each side. Second, a reference electrode should be attached to thevertebra prominence of C7. Then, all electrodes should be connected to the EMGunit. It can be assumed that Channel 1 is the left side and Channel 2 is the rightside. A threshold should be adjusted before the observation by clicking on decreaseor increase button. From the rightmost of Figure 4.5, it can be assumed that theleft bar is an EMG value from EMG unit’s Channel 1 which assumed to representleft shoulder and the right bar is an EMG value from EMG unit’s Channel 2 which
28
4. Results
assumed to represent right shoulder. An example of the result in the Figure 4.5 is arelaxation of both left and right muscle groups of shoulder which could be a postureof put your arm freely downward and sit comfortably on a chair. The left and rightmuscle group should be relaxed which result in green color as it is lower than thethreshold. If the patient has a problem of muscle relaxation, for example an officesyndrome patient, it may result in red color indicated on the bar.
4.5.2 Strengthen trainingAn example of the strengthen training can be applied to the patient who has a musclecontraction problem e.g. after stroke patient. It could be a training at the bicepsand triceps muscles. Two electrodes should be attached to the biceps muscle areaand another two electrodes should be attached at the triceps muscle area. Then, areference electrode should be attached to the elbow or any bony part. After that theelectrodes should be connected to the EMG unit. It can be assumed that Channel1 is the biceps muscle and Channel 2 is the triceps muscle. An example of musclestrengthening training is a posture of grasp the hand and curl the arm as a drawingin the most left of the Figure 4.5. A setting of threshold level at 25 is applied. Thered color of the bars shows EMG values that are lower than the threshold whichmean that the muscle is not strength enough. On the other hand, the green colorrepresents a successful strengthen muscle over the target threshold.
4.6 System EvaluationThe EMG biofeedback system has been evaluated by testing on a volunteer subject.The system was used for investigating the muscle activity at the shoulder-neck area.The electrodes were placed on the muscle fiber on both left and right shoulders ofthe subject and the reference electrode was placed at the vertebra prominence C7as shown in Figure 4.6. The evaluation was done by asking the subject to use theapplication with advice from the creator. The subject was guided to start turn onBluetooth, connect to the Shimmer unit and start streaming data. The subject wasasked to stretch out his left arm and right arm separately alternately to activatethe muscle group at the shoulder area and watched the result on the screen for aperiod of time. The test was done in the graph view first. Then, the same testwas moved to the bar view. The subject can successfully perceive the feedbackfrom both graph view and bar view. After the test, the subject was allowed to playaround the application by himself in order to evaluate the user interface. At theend, the subject was asked for a cognition on the presented results. The subjectanswered that the system works well and allows him to train his muscle with a goodperceivable presentation.
There were also evaluations on other two subjects at extensor muscle group. Twoelectrodes were place across the extensor muscle area and the reference electrodewas placed at the wrist as shown in Figure 4.7, leftmost. The subjects were askedto bend back their hand in order to activate the extensor muscle group and see theresult on the smartphone. These two subject expressed that the system is easy to
29

4. Results
Figure 4.6: The electrode locations and system connection for shoulder’s muscleactivity investigation are presented.
use and it successfully shows the feedback of their movement. It should be valuablefor the muscle training. Another evaluation was a usage of the system with thebicep muscle group for strengthening training, see Figure 4.7, rightmost. For thisevaluation, the subject was asked to raise her arm against the specialist’s hand whichthen result in activating the bicep muscle. The subject can perceive the feedbackby the graph and bar visualization on the smartphone.
Figure 4.7: Evaluations of the system have been done by three subjects. They areall healthy adults.
30
4. Results
All evaluations were done by the healthy adult persons. They were diversified,i.e. age, gender, nationality and experience in using the system. The evaluationsindicate that the system is practical, portable and easy to use by any experiencelevel.
4.7 Smart Textile Electrode EvaluationAn evaluation of the system with textile electrodes was done by a support fromScan-to-knit project at Textile Fashion Center at University of Borås. The systemwas evaluated by using textile electrodes instead of the conventional electrodes. Twotextile electrodes were attached to an elastic jacket at the left shoulder area as shownin Figure 4.8 and the reference electrode was located at the vertebra prominenceC7. The subject was guided to use the application by connecting the EMG devicewith the smartphone and streaming data. The subject was asked to sit in a relaxposture by putting his arms down. Then he was asked to stretch his left arm toactivate the muscle group at the left part of his shoulder and lay it down to relax themuscle group for a couple of times. The EMG signal was presented on the screen ofthe smartphone. The acquired signal from the textile electrodes was as good qualityas the signal that was acquired from the contact gel electrodes. The subject alsoconfirmed that the system works well as it works with the traditional electrodes.The subject was able to perceive his muscle activities from the visual feedback ofthe system.
Figure 4.8: The evaluation of the EMG biofeedback system with smart textileelectrodes was done at the Textile Fashion Center in Borås.
31
4. Results
32
5Discussion
The thesis is purposed to develop an EMG biofeedback system which can transferthe clinical application to the home environment. From literature reviews and studyvisit at SÄS, understanding of the system, problems and ideas as well as interestsin the development of the system were fully expressed. It is found that the mainproblems are the limitation in movement of the system and the need of using thesystem at the patient’s home. Since most of the EMG biofeedback applications areused for muscle training, it is better for the patient to be able to train at their homecircumstance in order to enhance the restoration. Therefore, an integration of thewireless communication as BluetoothTM has been involved to make the system beportable. A wireless EMG unit was then chosen to be an EMG signal acquisitionand a mobile device as smartphone was selected to be a solution for EMG signalmonitoring. During the developing process, an idea of color identification on thebar visualization is established for easier comprehension. Most of the thesis workwas contributed to the software development which is implemented on AndroidTM
platform. The signal processing and analyzing were digitally done in the softwareand the processed data was then presented on AndroidTM devices. At the end, thedeveloped system was evaluated by four volunteer healthy adults which results in asuccessful EMG biofeedback system with portable, reliable and practical qualifica-tions. This solution can fulfill the need of transfer the clinical system to the homeenvironment. It can also increase the capability of rehabilitation of the patient dueto feasible to access the system anywhere anytime. However, the developed systemis a prototype and the developed software is not available in the market. It has tobe developed in the future work before launch.
5.1 EMG unit (hardware)To develop the EMG biofeedback system, an EMG device is needed. From the result,the Shimmer3 EMG Unit is used because it has 2-channel of electrodes and it comestogether with the Android API solution, a support for AndroidTM development. Byusing 2-channel EMG system, it allows the system to be applied to bilateral partsof the body (i.e. left and right side training simultaneously). The Android APIsolution is also a good start on developing a AndroidTM application. Moreover, theShimmer3 unit also consists of other kind of useful sensors such as IMU, ECG, andGSR which can be a solution for EMG biofeedback in the future work.
33
5. Discussion
However, after using the Shimmer unit for all the development. Some disadvantagesof the system are found. The provided cables for the electrode connection is toosmall and too short. A usage of the system where the target muscle groups are farfrom each other or far from the reference point is hard to be done. With the smallcable, there is a risk of broken cable which is very difficult to investigate. The elasticstrap that used to hold the Shimmer unit is also not firm. The Shimmer unit canbe dropped off if the strap is too tight.
5.2 EMG biofeedback SystemRegarding the data presented, many ideas were encourage by the EMG biofeedbacksystem at SÄS. The bar graph is available on the traditional system at SÄS butSÄS has a difficulty in wireless accessible. The SÄS system needs to be wired bythe computer power which is not comfortable to do a movement training. With thewireless communication technology, this research proposes a Bluetooth communica-tion to the system. By using the wireless EMG Device together with a smartphone,the muscle training can be done easier. The system become smaller in size. TheEMG device can be attached to any part of body by a stretch strap and the user canaccess to the biofeedback though a smartphone with an available software on its.There is one problem that the research’s team found on the SÄS’s data presenting.It is a color of the bar which contrasts to the general meaning. It is the case that auser performs muscle relaxation training and the EMG value should be lower thanthe threshold. Then, the bar should be a green color but in the existing program,the bar is red when the EMG value is lower than the threshold. This might makea confusion. Another point is the 1-channel system of SÄS which normally givesfeedback as a sound. The device always alarm when the user has a muscle relaxationbut the alarm itself can make the user be stressed. These are two main points thatcan be inspected from the visit at the hospital.
Therefore, the developed EMG biofeedback system allows the user to choose themode of training and the colors will be changed regarding the selected mode. Thegreen color means a successful in training and the red color means a failure inthe training for both relaxation and activation training. So, the problem of colorrecognition can be solved by this system. However, this system is mainly developedfor visual feedback. The problem in audio system is still unsolved.
5.3 Application of usageThe EMG biofeedback system of this project is developed for the feasibility in utiliz-ing for both muscle relaxation and muscle stress training. The system also introducesthe mobility of the treatment by using Bluetooth wireless communication of the mo-bile device.
According to the test during the development and the evaluation, the system can beused for different muscle groups i.e bicep, tricep, and shoulder-neck muscle group.
34
5. Discussion
The volunteer subjects were diversifying. Some of them has no background usingthe EMG biofeedback system. The evaluation can confirm that the system is stable,reliable, and also easy to use by every level of experience. The availability of savingalso benefits for the specialist in further study of the patient’s result.
5.4 Feasibility in Smart Textile ElectrodeThe result presents the feasibility in using smart textile electrodes with the de-veloped EMG biofeedback system. In the evaluation, the reference electrode wasa conventional contact gel electrode instead of the textile electrode because of alimited number of the textile electrode at the moment. However, the Scan-to-knitproject has ensured that there is no difference in the result if the reference electrodeis a textile electrode. This guarantees that the textile-based electrode can be usedwith the developed system.
One obstacle would be the elastic jacket which is not well fitted to the subject. So,the electrodes were not attached to the body skin properly. A tape needed to fastenthe electrodes to the skin during the test. In addition, there was an assumption thatthe humid electrode results in a better signal acquisition. This could be proven inthe future work of the Scan-to-knit project.
From the evaluation, it is possible to produce a garment with textile electrodes fixedat the different position of the body for the different muscle group training. Thissolution allows the patient to do the training without the occupational therapist.Therefore, it additionally supports the idea of bringing the clinical system to thehome environment.
5.5 Future WorkEven though the system has been evaluated by subjects but the system itself is stilla prototype of the EMG biofeedback system. There are several outstanding pointsthat could be further developed in order to enhance the capability of the system.
5.5.1 FunctionAt this moment, the three different views of the user interface is not connected toeach other. The change in the view results in a reset of the screen. Even thoughthe device is still connected to the EMG unit but the information on the screen isdisappeared and no status is shown after changing the view. To solve this problem,fragment bundle should be added in the software.
Moreover, the data presented on the bar is still flickering. A median average windowcan be applied in order to flatten the overshoot of the data due to a twitch of themuscle. In addition, an option for retrieving the saved data and present on the
35

5. Discussion
application could be done. So, the therapist or even the patient can recall for theresult that has been recorded without open the file on the computer.
5.5.2 Application DesignA review from one of the subjects is that the UI design is easy to understand andprovide feedback on the action made by the user. Other subjects also agree thatthe UI is easy to handle. One problem would be a UI on tablet devices which is notproper in the ratio of the screen. The UI is not well implemented for the tablet useat this moment. A screen rotation may also cause a problem which UI is not fit tothe screen. The application should be redesigned based on the UX/UI design criteriaincluding the ergonomic standard for instance a comprehensive of the button.
36
6Conclusion
It can be concluded that the developed EMG biofeedback system in this projecthas solved most of the problem from the system at SÄS which are the possibility ofmoving the clinical treatment to home environment with the use of mobile deviceand the better recognition in different training mode of relaxation and activation.The system can be used freely as it has no wire connection between the monitordevice , i.e. AndroidTM smartphone, and the EMG unit, i.e. Shimmer3 EMG unit.With the evaluation results, the system can be proved that it is stable, reliable andportable. It also answers the research questions:
• Is it possible to transfer a raw EMG signal acquired by an EMGdevice via wireless communication, i.e. Bluetooth®, and visualize iton a mobile device in real-time?Yes, it is possible. From the evaluation results, the raw EMG signal acquiredby the ShimmerTM EMG device can be transferred via Bluetooth® and visual-ized on the mobile-based device in real-time. The communication bandwidthand real-time data management are not issues.
• Can the real-time EMG signal be presented as biofeedback informa-tion on a mobile-based device?Yes, the real-time EMG signal can be presented as biofeedback information,i.e. bar graphs, on the mobile device. However, the signal pre-processing andsignal analysis are needed to make biofeedback information. There is no prob-lem related to the mobile device capacity in order to present the processeddata in real-time.
• Can the mobile-based EMG-biofeedback system be used with asmart textile technology targeting specific muscles or muscle groups?Yes, the developed system can be used with the smart textile electrodes. Thesmart textile technology can be a solution for recording EMG-signal by thepatient him/herself as well as performing the training outside the clinic.
• Can EMG-biofeedback training be transferred from the clinic to thepatient’s home environment?Yes, EMG biofeedback training can be done at the patient’s home by usingthe developed system in this project.
However, the developed system is a prototype and mainly express the idea of thesolution. So, the system can be developed more in an aspect of mobile application,ergonomics usage and more. The EMG device can be further developed as well inorder to get lower cost of the hardware.
37

6. Conclusion
38
Bibliography
Assambo, Cédric and Martin J. Burke (2012). “Low-Frequency Response and theSkin-Electrode Interface in Dry-Electrode Electrocardiography”. In: Advances inElectrocardiograms. Ed. by Richard M. Millis. Rijeka: IntechOpen. Chap. 2. doi:10.5772/22777. url: https://doi.org/10.5772/22777.
Bahill, A. Terry (1981). “Chapter 4 : Close loop”. In: BIOENGINEERING —Biomedical, Medical, and Clinical Engineering. Englewood Cliffs, N.J: Prentice-Hall, Inc.
bio-medical (2018). Covidien Kendall Disposable Surface EMG/ECG/EKG Elec-trodes 1 3/8" (35mm) 50pkg. url: https : / / bio - medical . com / covidien -kendall- disposable- surface- emg- ecg- ekg- electrodes- 1- 3- 8- 35mm-50pkg.html.
Bottom navigation (2018). url: https://material.io/design/components/bottom-navigation.html#implementation.
Boxtel, A. (2001). “Optimal signal bandwidth for the recording of surface EMGactivity of facial, jaw, oral, and neck muscles”. In: Psychophysiology 38.1, pp. 22–34. doi: 10.1111/1469-8986.3810022.
Chatterjee, Shakti and Aubert Miller (2010). Biomedical instrumentation systems.Delmar Cengage Learning.
Ehrenborg, Cecilia and Birgitha Archenholtz (2010). “Is surface EMG biofeedbackan effective training method for persons with neck and shoulder complaints afterwhiplash-associated disorders concerning activities of daily living and pain — arandomized controlled trial”. In: Clinical Rehabilitation 24.8, pp. 715–726. doi:10.1177/0269215510362325.
Freepik (2018). Correct and incorrect postures. url: http://www.freepik.com.Gaffney, Brecca M. et al. (2015). “Evaluation of Novel EMG Biofeedback for PosturalCorrection During Computer Use”. In: Applied Psychophysiology and Biofeedback41.2, pp. 181–189. doi: 10.1007/s10484-015-9328-3.
Gerard J. Tortora, Bryan Derrickson (2010). “Chapter 8 : The Muscular System”.In: Introduction to the Human body - the essentials of anatomy and physiology.8th ed. John Wiley & Sons, Inc., pp. 184–193.
Giggins, Oonagh M. et al. (2013). “Biofeedback in rehabilitation”. In: Journal ofNeuroEngineering and Rehabilitation 10.1, p. 60. doi: 10.1186/1743-0003-10-60. url: https://doi.org/10.1186/1743-0003-10-60.
Guo, Li, Siw Eriksson, and Leif Sandjö (2014). Surface Resistivity of Textile-BasedElectrodes.
Hayes, Monson H (2012). “Chapter 9 : Filter Design”. In: Schaum’s outlines DigitalSignal Processing. 2nd ed. McGraw-Hill, pp. 358–379.
39
Bibliography
Horowitz, Sala (2006). “Biofeedback Applications: A Survey of Clinical Research”.In: 12, pp. 275–281.
Isaac, Chris et al. (2014). Mobile data analytics: not just for consumers any more.url: https://www.pwc.com/id/en/publications/assets/ticepublications/data-analytics.pdf.
Jayarathne, M. et al. (2015). “EMG based biofeedback system using a virtual realitymethod”. In: 2015 IEEE 10th International Conference on Industrial and Infor-mation Systems (ICIIS), pp. 111–116. doi: 10.1109/ICIINFS.2015.7398995.
Jovanov, I. M. and D. B. Popović (2014). “EMG based biofeedback with the smart-ing system”. In: 12th Symposium on Neural Network Applications in ElectricalEngineering (NEUREL), pp. 163–166. doi: 10.1109/NEUREL.2014.7011494.
Kim, Ju-Hong (2017). “The effects of training using EMG biofeedback on strokepatients upper extremity functions”. In: Journal of Physical Therapy Science 29.6,pp. 1085–1088. doi: 10.1589/jpts.29.1085.
Koga, Kenichiro et al. (2013). “Portable biological signal measurement system forbiofeedback and experiment for functional assessment”. In: pp. 412–416. isbn:978-89-93215-05-2. doi: 10.1109/ICCAS.2013.6704003.
Levitas, Danielle (2013). Always Connected How Smartphones And Social Keep UsEngaged.
Luca, Carlo J. De (1997). “The Use of Surface Electromyography in Biomechanics”.In: Journal of Applied Biomechanics 13.2, pp. 135–163. doi: 10.1123/jab.13.2.135.
– (2002). SURFACE ELECTROMYOGRAPHY: DETECTION AND RECORD-ING.
Merletti, Roberto et al. (2009). “Technology and instrumentation for detection andconditioning of the surface electromyographic signal: State of the art”. In: 24 (2),pp. 122–134. doi: 10.1016/j.clinbiomech.2008.08.006.
PlayRobots (2018). Bio-Potential Measurement Basics. url: http://www.playrobots.co.uk/bio-potential-monitoring/bio-potential-measurement-basics/.
Richer, R. et al. (2014). “Real-Time ECG and EMG Analysis for Biking UsingAndroid-Based Mobile Devices”. In: pp. 104–108. issn: 2376-8886. doi: 10.1109/BSN.2014.20.
Roberto M., DarioF. (2016a). “Chapter 1 : Phusiology of muscle activation andforce GENERATION”. In: SURFACE ELECTROMYOGRAPHY Physiology, En-gineering, and Applications. John Wiley & Sons, Inc., pp. 1–29.
– (2016b). “Chapter 18 : Surface EMG Biofeedback”. In: SURFACE ELECTROMYO-GRAPHY Physiology, Engineering, and Applications. John Wiley & Sons, Inc.,pp. 485–500.
– (2016c). “Chapter 2 : Biophysics of the generation of EMG signals”. In: SURFACEELECTROMYOGRAPHY Physiology, Engineering, and Applications. John Wi-ley & Sons, Inc., pp. 30–53.
Sandsjö, Leif (2004). Ambulatory monitoring and analysis of surface electromyo-graphic signals in ergonomic field studies : methods and applications. Doktor-savhandlingar vid Chalmers tekniska högskola: Ny serie 2127. Göteborg : Chalmerstekniska högsk., 2004. isbn: 91-7291-445-9. url: http://proxy.lib.chalmers.
40
Bibliography
se/login?url=http://search.ebscohost.com/login.aspx?direct=true&db=cat06296a&AN=clc.b1294819&site=eds-live&scope=site.
Shimmer (2017). EMG User Guide Revision 1.12.Smartphone daily usage time worldwide 2017 | Statistic (2018). url: https://
www.statista.com/statistics/781692/worldwide-daily-time-spent-on-smartphone/ (visited on 08/21/2018).
Smith, Steven W. (1997a). “Chapter 14 : Introduction to Digital Filters”. In: TheScientist and Engineer’s Guide to Digital Signal Processing. San Diego, CA, USA:California Technical Publishing, pp. 261–276.
– (1997b). “Chapter 16 : Windowed-sinc filters”. In: The Scientist and Engineer’sGuide to Digital Signal Processing. San Diego, CA, USA: California TechnicalPublishing, pp. 285–296.
StatCounter (2017). Mobile operating system market share worldwide. url: http://gs.statcounter.com/os- market- share/mobile/worldwide (visited on09/10/2018).
Tavakoli, Javad and Youhong Tang (2017). “Hydrogel Based Sensors for BiomedicalApplications: An Updated Review”. In: Polymers 9.12, p. 364. doi: 10.3390/polym9080364.
Vogel, Richard (2016). EMG. url: https://neurologiclabs.com/neuromonitoring/emg/.
Webster, John G. (2004). “Chapter 7 : Nervous System”. In: Bioinstrumentation.New York: John Wiley & Sons, Inc, pp. 255–257.
– (2010). “Chapter 4 : The origin of Biopotentials”. In: Medical Instrumentation :Application and Design. 4th ed. Hoboken, New Jersey: John Wiley & Sons, Inc.,pp. 144–146.
41
Bibliography
42
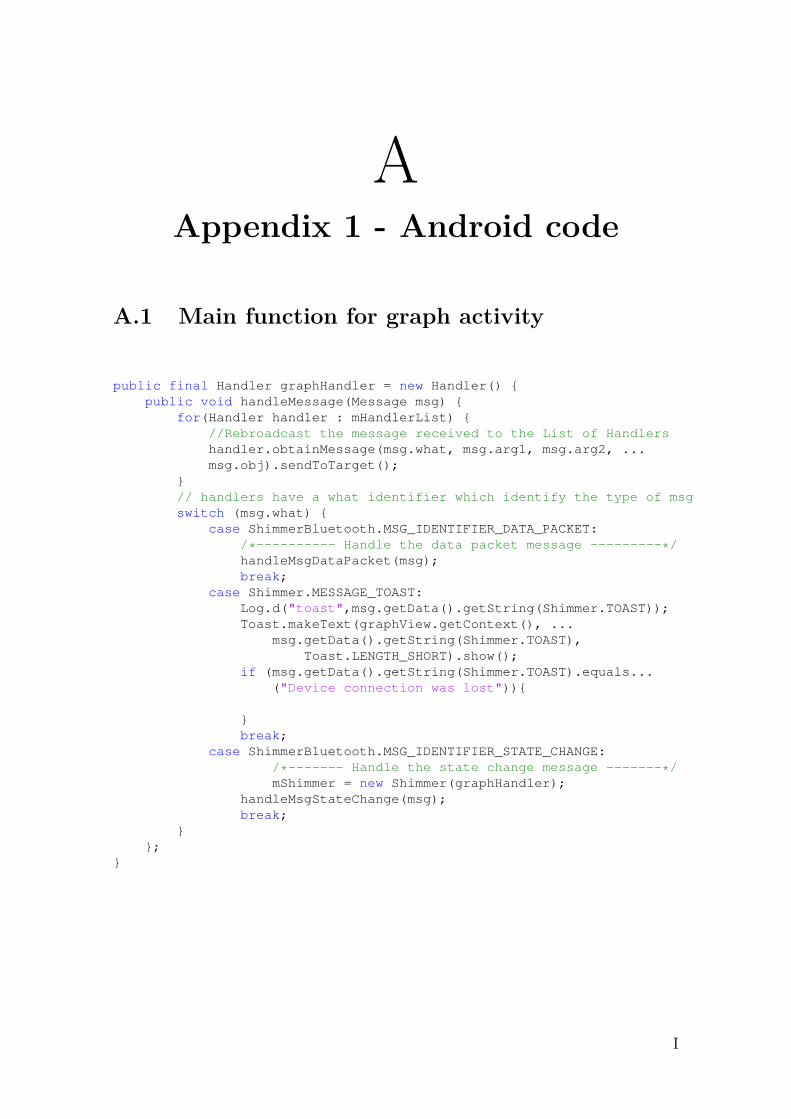
AAppendix 1 - Android code
A.1 Main function for graph activity
public final Handler graphHandler = new Handler() {public void handleMessage(Message msg) {
for(Handler handler : mHandlerList) {//Rebroadcast the message received to the List of Handlershandler.obtainMessage(msg.what, msg.arg1, msg.arg2, ...msg.obj).sendToTarget();
}// handlers have a what identifier which identify the type of msgswitch (msg.what) {
case ShimmerBluetooth.MSG_IDENTIFIER_DATA_PACKET:/*---------- Handle the data packet message ---------*/handleMsgDataPacket(msg);break;
case Shimmer.MESSAGE_TOAST:Log.d("toast",msg.getData().getString(Shimmer.TOAST));Toast.makeText(graphView.getContext(), ...
msg.getData().getString(Shimmer.TOAST),Toast.LENGTH_SHORT).show();
if (msg.getData().getString(Shimmer.TOAST).equals...("Device connection was lost")){
}break;
case ShimmerBluetooth.MSG_IDENTIFIER_STATE_CHANGE:/*------- Handle the state change message -------*/mShimmer = new Shimmer(graphHandler);
handleMsgStateChange(msg);break;
}};
}
I

A. Appendix 1 - Android code
A.2 Acquiring and Processing Data
...// Data Analysis Variablesfinal double samplingRate = 1024;double shimmerSamplingRate = 0;final int sampleData = 32;int count1 = 0;int count2 = 0;double sumDataArray1 = 0;double sumDataArray2 = 0;double sumARV1 = 0;double sumARV2 = 0;double meanDataArray1 = 0;double meanDataArray2 = 0;double[] dataArrayEMG_CH1 = new double[sampleData];double[] dataArrayEMG_CH2 = new double[sampleData];double dataEMG_CH1, dataEMG_CH2 = 0;double dataRawEMG_CH1, dataRawEMG_CH2 = 0;String dateData = "NaN";String timeData = "NaN";public boolean saveToFile = false;
Filter hpf, bsf;
// Write to CSV variablesprivate FileWriter fw;private BufferedWriter bw;private File file;boolean firstTimeWrite = true;...
public void handleMsgDataPacket(Message msg) {if ((msg.obj instanceof ObjectCluster)) {// within each msg an object can be include, objectclusters are// used to represent the data structure of the shimmer device
ObjectCluster objc = (ObjectCluster) msg.obj;if (mConfigureOnFirstTime) {// ---------------- High-pass Filter initialize ------------try {double[] cutoffHP = {10};double[] cutoffBS = {49, 51};shimmerSamplingRate = shimmerDevice.getSamplingRateShimmer();hpf = new Filter(Filter.HIGH_PASS, shimmerSamplingRate, cutoffHP);bsf = new Filter(Filter.BAND_STOP, shimmerSamplingRate, cutoffBS);} catch (Exception e1) {
// TODO Auto-generated catch blocke1.printStackTrace();
}mConfigureOnFirstTime = false;}
II
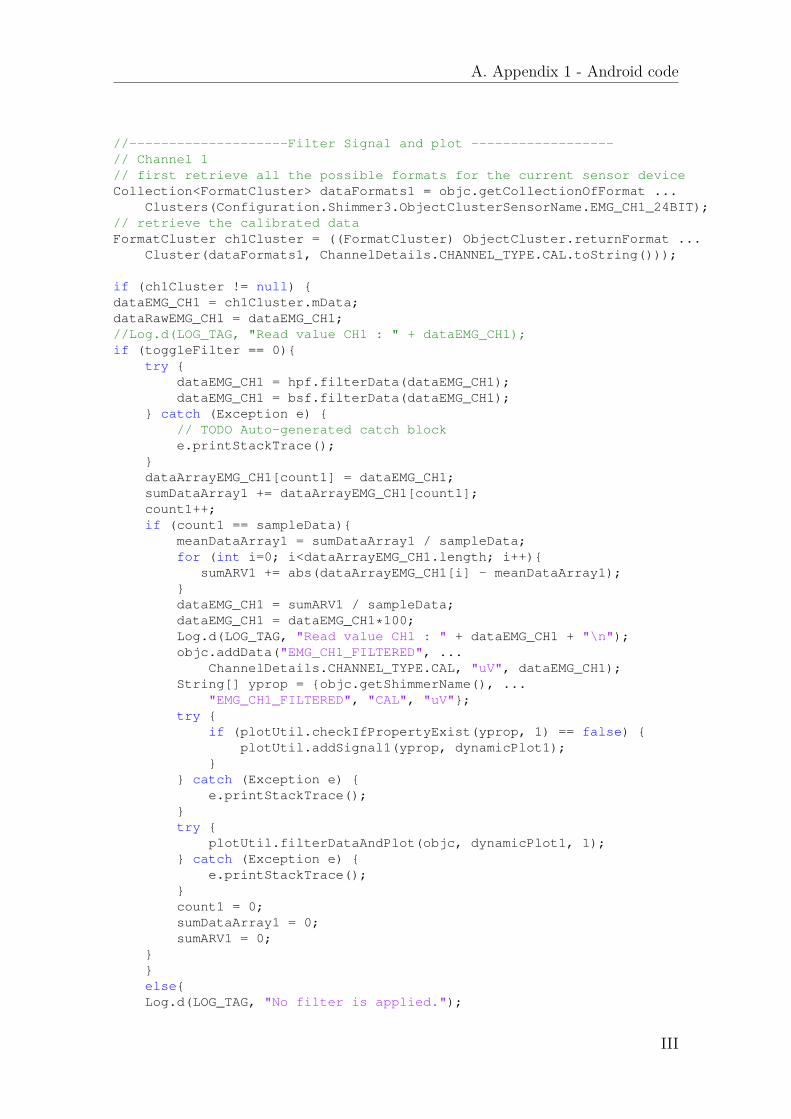
A. Appendix 1 - Android code
//--------------------Filter Signal and plot ------------------// Channel 1// first retrieve all the possible formats for the current sensor deviceCollection<FormatCluster> dataFormats1 = objc.getCollectionOfFormat ...
Clusters(Configuration.Shimmer3.ObjectClusterSensorName.EMG_CH1_24BIT);// retrieve the calibrated dataFormatCluster ch1Cluster = ((FormatCluster) ObjectCluster.returnFormat ...
Cluster(dataFormats1, ChannelDetails.CHANNEL_TYPE.CAL.toString()));
if (ch1Cluster != null) {dataEMG_CH1 = ch1Cluster.mData;dataRawEMG_CH1 = dataEMG_CH1;//Log.d(LOG_TAG, "Read value CH1 : " + dataEMG_CH1);if (toggleFilter == 0){
try {dataEMG_CH1 = hpf.filterData(dataEMG_CH1);dataEMG_CH1 = bsf.filterData(dataEMG_CH1);
} catch (Exception e) {// TODO Auto-generated catch blocke.printStackTrace();
}dataArrayEMG_CH1[count1] = dataEMG_CH1;sumDataArray1 += dataArrayEMG_CH1[count1];count1++;if (count1 == sampleData){
meanDataArray1 = sumDataArray1 / sampleData;for (int i=0; i<dataArrayEMG_CH1.length; i++){
sumARV1 += abs(dataArrayEMG_CH1[i] - meanDataArray1);}dataEMG_CH1 = sumARV1 / sampleData;dataEMG_CH1 = dataEMG_CH1*100;Log.d(LOG_TAG, "Read value CH1 : " + dataEMG_CH1 + "\n");objc.addData("EMG_CH1_FILTERED", ...
ChannelDetails.CHANNEL_TYPE.CAL, "uV", dataEMG_CH1);String[] yprop = {objc.getShimmerName(), ...
"EMG_CH1_FILTERED", "CAL", "uV"};try {
if (plotUtil.checkIfPropertyExist(yprop, 1) == false) {plotUtil.addSignal1(yprop, dynamicPlot1);
}} catch (Exception e) {
e.printStackTrace();}try {
plotUtil.filterDataAndPlot(objc, dynamicPlot1, 1);} catch (Exception e) {
e.printStackTrace();}count1 = 0;sumDataArray1 = 0;sumARV1 = 0;
}}else{Log.d(LOG_TAG, "No filter is applied.");
III

A. Appendix 1 - Android code
count1++;if (count1 == sampleData){
Log.d(LOG_TAG, "Read value CH1 : " + dataEMG_CH1 + "\n");objc.addData("EMG_CH1_FILTERED", ...
ChannelDetails.CHANNEL_TYPE.CAL, "mV", dataEMG_CH1);String[] yprop = {objc.getShimmerName(), ...
"EMG_CH1_FILTERED", "CAL", "mV"};try {
if (plotUtil.checkIfPropertyExist(yprop, 1) == false) {plotUtil.addSignal1(yprop, dynamicPlot1);
}} catch (Exception e) {
e.printStackTrace();}try {
plotUtil.filterDataAndPlot(objc, dynamicPlot1, 1);} catch (Exception e) {
e.printStackTrace();}count1 = 0;}
}} else {
Log.d(LOG_TAG, "FormatCluster Channel 1 is null.-----------");}// Channel 2 ======================================================Collection<FormatCluster> dataFormats2 = objc.getCollectionOf ...
FormatClusters(Configuration.Shimmer3.ObjectClusterSensor ...Name.EMG_CH2_24BIT);
FormatCluster ch2Cluster = ((FormatCluster) ObjectCluster. ...returnFormatCluster(dataFormats2, ...ChannelDetails.CHANNEL_TYPE.CAL.toString()));
if (ch2Cluster != null) {dataEMG_CH2 = ch2Cluster.mData;dataRawEMG_CH2 = dataEMG_CH2;if (toggleFilter == 0){
try {dataEMG_CH2 = hpf.filterData(dataEMG_CH2);dataEMG_CH2 = bsf.filterData(dataEMG_CH2);
} catch (Exception e) {// TODO Auto-generated catch blocke.printStackTrace();
}dataArrayEMG_CH2[count2] = dataEMG_CH2;sumDataArray2 += dataArrayEMG_CH2[count2];count2++;if (count2 == sampleData){
meanDataArray2 = sumDataArray2 / sampleData;for (int i=0; i<dataArrayEMG_CH2.length; i++){
sumARV2 += abs(dataArrayEMG_CH2[i] - meanDataArray2);}dataEMG_CH2 = sumARV2 / sampleData;dataEMG_CH2 = dataEMG_CH2*100;Log.d(LOG_TAG, "Read value CH2 : " + dataEMG_CH2);objc.addData("EMG_CH2_FILTERED", ...
IV
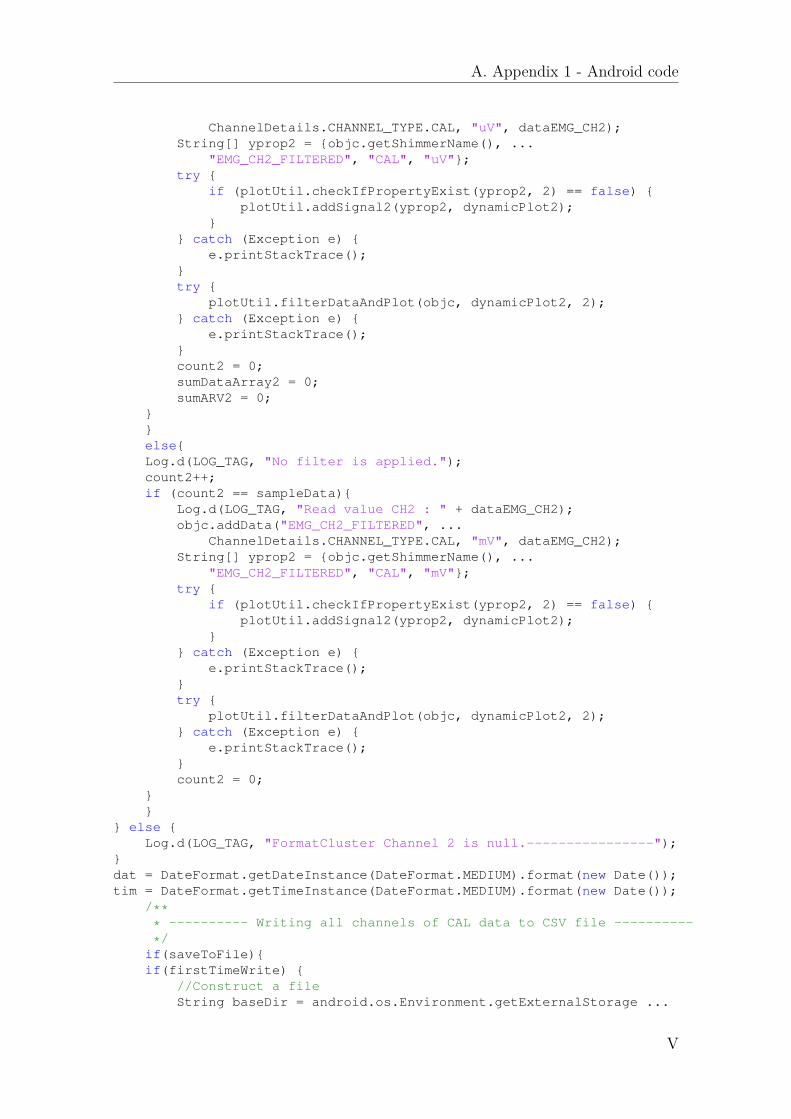
A. Appendix 1 - Android code
ChannelDetails.CHANNEL_TYPE.CAL, "uV", dataEMG_CH2);String[] yprop2 = {objc.getShimmerName(), ...
"EMG_CH2_FILTERED", "CAL", "uV"};try {
if (plotUtil.checkIfPropertyExist(yprop2, 2) == false) {plotUtil.addSignal2(yprop2, dynamicPlot2);
}} catch (Exception e) {
e.printStackTrace();}try {
plotUtil.filterDataAndPlot(objc, dynamicPlot2, 2);} catch (Exception e) {
e.printStackTrace();}count2 = 0;sumDataArray2 = 0;sumARV2 = 0;
}}else{Log.d(LOG_TAG, "No filter is applied.");count2++;if (count2 == sampleData){
Log.d(LOG_TAG, "Read value CH2 : " + dataEMG_CH2);objc.addData("EMG_CH2_FILTERED", ...
ChannelDetails.CHANNEL_TYPE.CAL, "mV", dataEMG_CH2);String[] yprop2 = {objc.getShimmerName(), ...
"EMG_CH2_FILTERED", "CAL", "mV"};try {
if (plotUtil.checkIfPropertyExist(yprop2, 2) == false) {plotUtil.addSignal2(yprop2, dynamicPlot2);
}} catch (Exception e) {
e.printStackTrace();}try {
plotUtil.filterDataAndPlot(objc, dynamicPlot2, 2);} catch (Exception e) {
e.printStackTrace();}count2 = 0;
}}
} else {Log.d(LOG_TAG, "FormatCluster Channel 2 is null.----------------");
}dat = DateFormat.getDateInstance(DateFormat.MEDIUM).format(new Date());tim = DateFormat.getTimeInstance(DateFormat.MEDIUM).format(new Date());
/*** ---------- Writing all channels of CAL data to CSV file ----------
*/if(saveToFile){if(firstTimeWrite) {
//Construct a fileString baseDir = android.os.Environment.getExternalStorage ...
V

A. Appendix 1 - Android code
Directory().getAbsolutePath();String fileName = "EMGbiofeedback Data " + DateFormat.getDate ...
TimeInstance().format(new Date()) + ".csv";String path = baseDir + "/EMGBiofeedBack";String filePath = path + File.separator + fileName;file = new File(path);if(!file.exists()){
file.mkdir();}else {
file = new File(filePath);try {
if (!file.exists()) {file.createNewFile();
}fw = new FileWriter(file.getAbsoluteFile());bw = new BufferedWriter(fw);
} catch (IOException e) {e.printStackTrace();
}}//Write headers on first-timetry {
bw.write("DATE" + "," + "TIME" + "," + ..."EMG Channel 1 (Raw Data)" + "," + ..."EMG Channel 2 (Raw Data)");
bw.write("\n");} catch (IOException e) {
e.printStackTrace();}firstTimeWrite = false;
}else {
try {bw.write(dat + "," + tim + "," + ...
dataRawEMG_CH1 + "," + dataRawEMG_CH2);bw.write("\n");
} catch (IOException e3) {e3.printStackTrace();
}}}}
}
VI
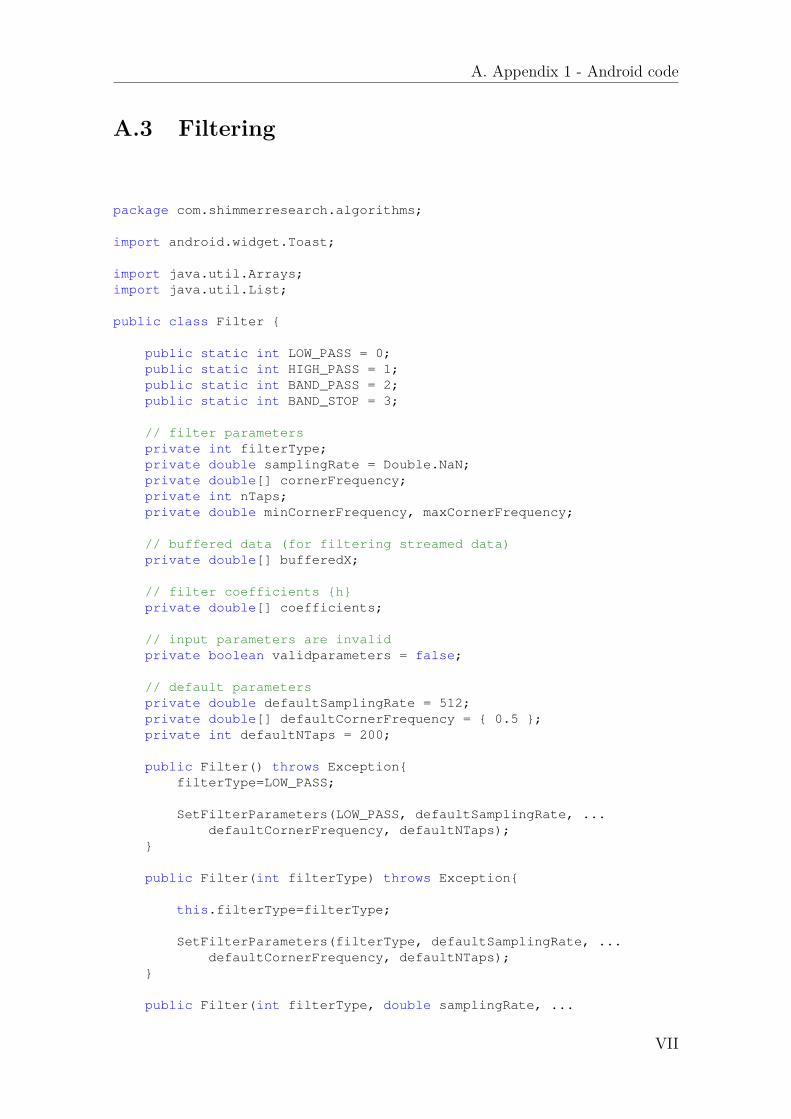
A. Appendix 1 - Android code
A.3 Filtering
package com.shimmerresearch.algorithms;
import android.widget.Toast;
import java.util.Arrays;import java.util.List;
public class Filter {
public static int LOW_PASS = 0;public static int HIGH_PASS = 1;public static int BAND_PASS = 2;public static int BAND_STOP = 3;
// filter parametersprivate int filterType;private double samplingRate = Double.NaN;private double[] cornerFrequency;private int nTaps;private double minCornerFrequency, maxCornerFrequency;
// buffered data (for filtering streamed data)private double[] bufferedX;
// filter coefficients {h}private double[] coefficients;
// input parameters are invalidprivate boolean validparameters = false;
// default parametersprivate double defaultSamplingRate = 512;private double[] defaultCornerFrequency = { 0.5 };private int defaultNTaps = 200;
public Filter() throws Exception{filterType=LOW_PASS;
SetFilterParameters(LOW_PASS, defaultSamplingRate, ...defaultCornerFrequency, defaultNTaps);
}
public Filter(int filterType) throws Exception{
this.filterType=filterType;
SetFilterParameters(filterType, defaultSamplingRate, ...defaultCornerFrequency, defaultNTaps);
}
public Filter(int filterType, double samplingRate, ...
VII
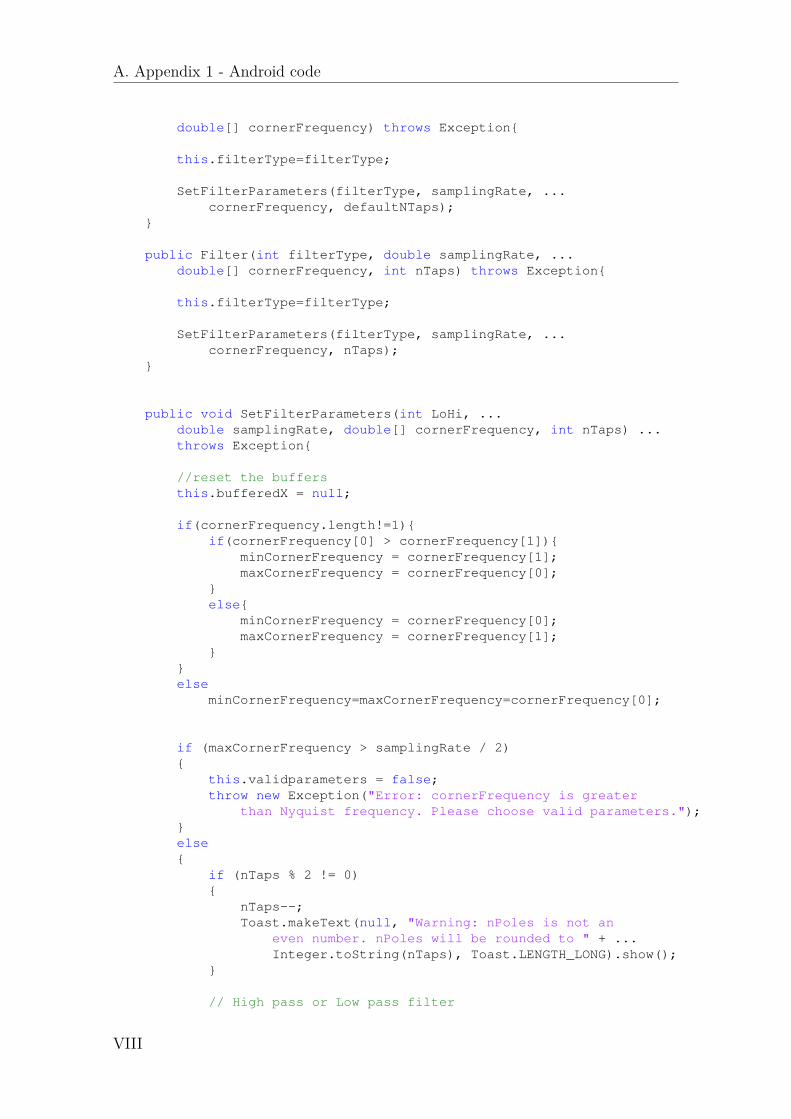
A. Appendix 1 - Android code
double[] cornerFrequency) throws Exception{
this.filterType=filterType;
SetFilterParameters(filterType, samplingRate, ...cornerFrequency, defaultNTaps);
}
public Filter(int filterType, double samplingRate, ...double[] cornerFrequency, int nTaps) throws Exception{
this.filterType=filterType;
SetFilterParameters(filterType, samplingRate, ...cornerFrequency, nTaps);
}
public void SetFilterParameters(int LoHi, ...double samplingRate, double[] cornerFrequency, int nTaps) ...throws Exception{
//reset the buffersthis.bufferedX = null;
if(cornerFrequency.length!=1){if(cornerFrequency[0] > cornerFrequency[1]){
minCornerFrequency = cornerFrequency[1];maxCornerFrequency = cornerFrequency[0];
}else{
minCornerFrequency = cornerFrequency[0];maxCornerFrequency = cornerFrequency[1];
}}else
minCornerFrequency=maxCornerFrequency=cornerFrequency[0];
if (maxCornerFrequency > samplingRate / 2){
this.validparameters = false;throw new Exception("Error: cornerFrequency is greater
than Nyquist frequency. Please choose valid parameters.");}else{
if (nTaps % 2 != 0){
nTaps--;Toast.makeText(null, "Warning: nPoles is not an
even number. nPoles will be rounded to " + ...Integer.toString(nTaps), Toast.LENGTH_LONG).show();
}
// High pass or Low pass filter
VIII
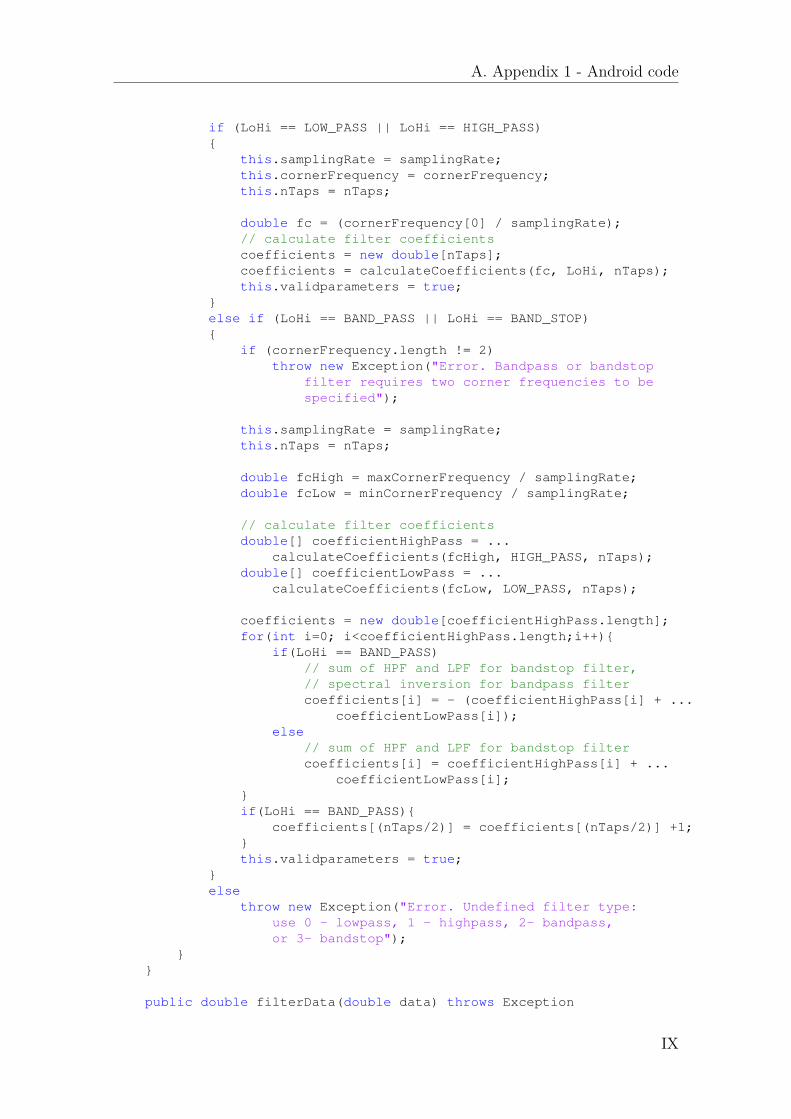
A. Appendix 1 - Android code
if (LoHi == LOW_PASS || LoHi == HIGH_PASS){
this.samplingRate = samplingRate;this.cornerFrequency = cornerFrequency;this.nTaps = nTaps;
double fc = (cornerFrequency[0] / samplingRate);// calculate filter coefficientscoefficients = new double[nTaps];coefficients = calculateCoefficients(fc, LoHi, nTaps);this.validparameters = true;
}else if (LoHi == BAND_PASS || LoHi == BAND_STOP){
if (cornerFrequency.length != 2)throw new Exception("Error. Bandpass or bandstop
filter requires two corner frequencies to bespecified");
this.samplingRate = samplingRate;this.nTaps = nTaps;
double fcHigh = maxCornerFrequency / samplingRate;double fcLow = minCornerFrequency / samplingRate;
// calculate filter coefficientsdouble[] coefficientHighPass = ...
calculateCoefficients(fcHigh, HIGH_PASS, nTaps);double[] coefficientLowPass = ...
calculateCoefficients(fcLow, LOW_PASS, nTaps);
coefficients = new double[coefficientHighPass.length];for(int i=0; i<coefficientHighPass.length;i++){
if(LoHi == BAND_PASS)// sum of HPF and LPF for bandstop filter,// spectral inversion for bandpass filtercoefficients[i] = - (coefficientHighPass[i] + ...
coefficientLowPass[i]);else
// sum of HPF and LPF for bandstop filtercoefficients[i] = coefficientHighPass[i] + ...
coefficientLowPass[i];}if(LoHi == BAND_PASS){
coefficients[(nTaps/2)] = coefficients[(nTaps/2)] +1;}this.validparameters = true;
}else
throw new Exception("Error. Undefined filter type:use 0 - lowpass, 1 - highpass, 2- bandpass,or 3- bandstop");
}}
public double filterData(double data) throws Exception
IX
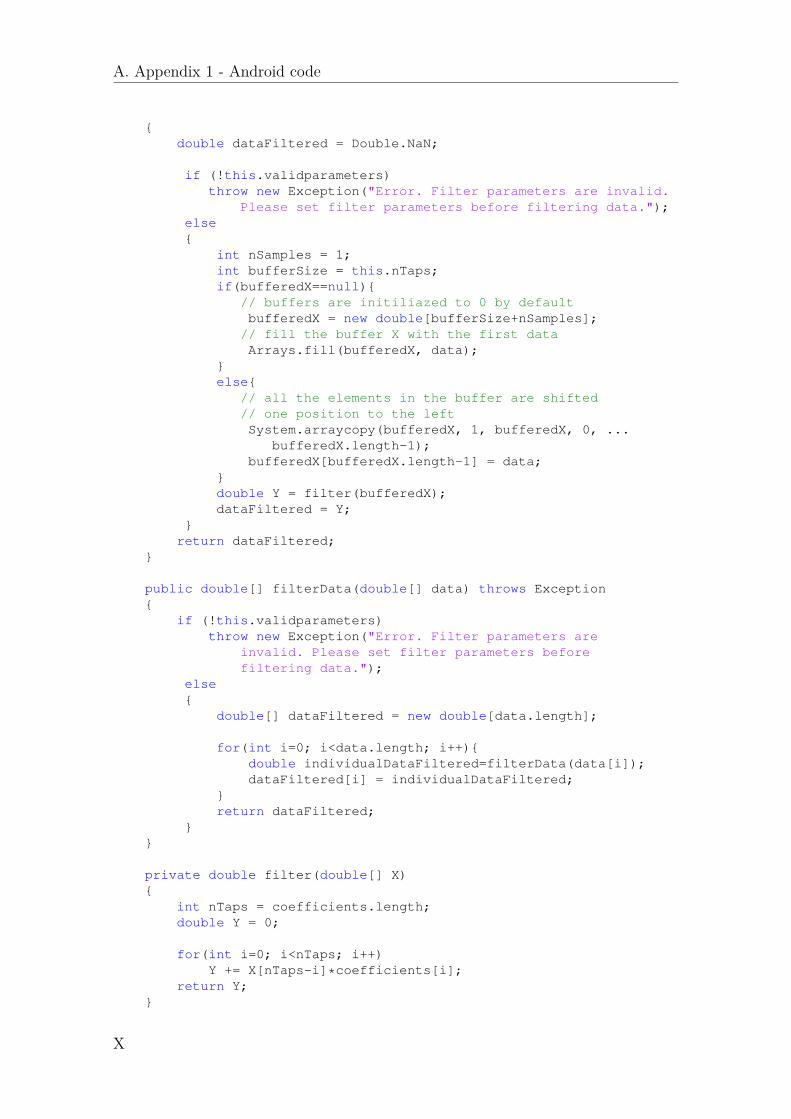
A. Appendix 1 - Android code
{double dataFiltered = Double.NaN;
if (!this.validparameters)throw new Exception("Error. Filter parameters are invalid.
Please set filter parameters before filtering data.");else{
int nSamples = 1;int bufferSize = this.nTaps;if(bufferedX==null){
// buffers are initiliazed to 0 by defaultbufferedX = new double[bufferSize+nSamples];// fill the buffer X with the first dataArrays.fill(bufferedX, data);
}else{
// all the elements in the buffer are shifted// one position to the leftSystem.arraycopy(bufferedX, 1, bufferedX, 0, ...
bufferedX.length-1);bufferedX[bufferedX.length-1] = data;
}double Y = filter(bufferedX);dataFiltered = Y;
}return dataFiltered;
}
public double[] filterData(double[] data) throws Exception{
if (!this.validparameters)throw new Exception("Error. Filter parameters are
invalid. Please set filter parameters beforefiltering data.");
else{
double[] dataFiltered = new double[data.length];
for(int i=0; i<data.length; i++){double individualDataFiltered=filterData(data[i]);dataFiltered[i] = individualDataFiltered;
}return dataFiltered;
}}
private double filter(double[] X){
int nTaps = coefficients.length;double Y = 0;
for(int i=0; i<nTaps; i++)Y += X[nTaps-i]*coefficients[i];
return Y;}
X
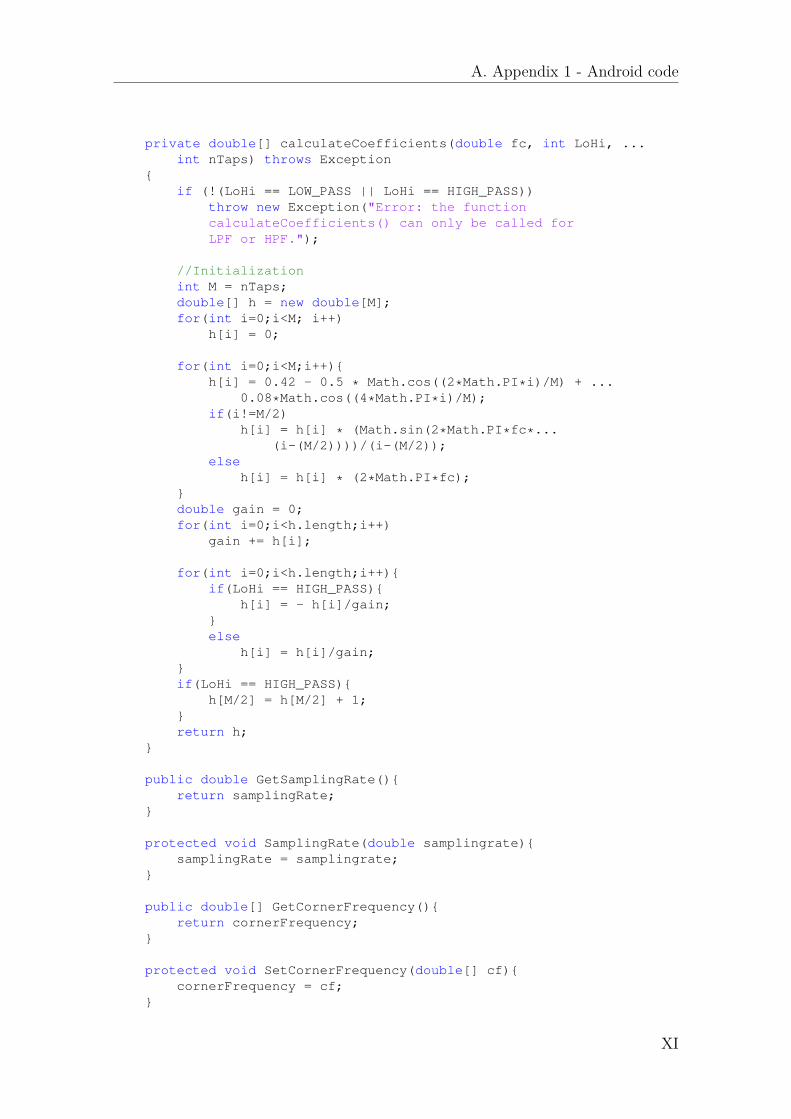
A. Appendix 1 - Android code
private double[] calculateCoefficients(double fc, int LoHi, ...int nTaps) throws Exception
{if (!(LoHi == LOW_PASS || LoHi == HIGH_PASS))
throw new Exception("Error: the functioncalculateCoefficients() can only be called forLPF or HPF.");
//Initializationint M = nTaps;double[] h = new double[M];for(int i=0;i<M; i++)
h[i] = 0;
for(int i=0;i<M;i++){h[i] = 0.42 - 0.5 * Math.cos((2*Math.PI*i)/M) + ...
0.08*Math.cos((4*Math.PI*i)/M);if(i!=M/2)
h[i] = h[i] * (Math.sin(2*Math.PI*fc*...(i-(M/2))))/(i-(M/2));
elseh[i] = h[i] * (2*Math.PI*fc);
}double gain = 0;for(int i=0;i<h.length;i++)
gain += h[i];
for(int i=0;i<h.length;i++){if(LoHi == HIGH_PASS){
h[i] = - h[i]/gain;}else
h[i] = h[i]/gain;}if(LoHi == HIGH_PASS){
h[M/2] = h[M/2] + 1;}return h;
}
public double GetSamplingRate(){return samplingRate;
}
protected void SamplingRate(double samplingrate){samplingRate = samplingrate;
}
public double[] GetCornerFrequency(){return cornerFrequency;
}
protected void SetCornerFrequency(double[] cf){cornerFrequency = cf;
}
XI
A. Appendix 1 - Android code
public static double[] fromListToArray(List<Double> list){
double [] array = new double[list.size()];for(int i=0;i<list.size();i++)
array[i] = list.get(i);
return array;}
public void resetBuffers(){
bufferedX = null;}
public int getFilterType() {return filterType;
}}
XII
A. Appendix 1 - Android code
A.4 Plotting
package com.tng_asus.emgbiofeedback;
import android.graphics.Color;
import com.androidplot.xy.LineAndPointFormatter;import com.androidplot.xy.XYPlot;import com.shimmerresearch.driver.FormatCluster;import com.shimmerresearch.driver.ObjectCluster;import com.shimmerresearch.tools.PlotManagerAndroid;
import java.util.ArrayList;import java.util.Collections;import java.util.Iterator;import java.util.List;
import pl.flex_it.androidplot.XYSeriesShimmer;
public class PlotUtil extends PlotManagerAndroid {
List<XYSeriesShimmer> mListofSeries1 = ...new ArrayList<XYSeriesShimmer>();
List<XYSeriesShimmer> mListofSeries2 = ...new ArrayList<XYSeriesShimmer>();
public List<int[]> mListOfTraceColorsCurrentlyUsed = ...Collections.synchronizedList(new ArrayList<int[]>());
//below is used to identify he signals coming into the filterpublic List<String[]> mListofPropertiestoPlot1 = ...
Collections.synchronizedList(new ArrayList<String[]>());// below is used to identify he signals coming into the filterpublic List<String[]> mListofPropertiestoPlot2 = ...
Collections.synchronizedList(new ArrayList<String[]>());
public void addSignal1(String [] signal, XYPlot chart) ...throws Exception{if (!checkIfPropertyExist(signal)){
// Add the series first, cause the filter might find// the signal before the series is addedint index = mListofSeries1.size();String name = signal[0]+ " " + signal[1]+" " + ...
signal[2] + " " + signal[3];//List<Number> data = new ArrayList<Number>();List<Number> d = new ArrayList<Number>();XYSeriesShimmer xys = new XYSeriesShimmer(d);xys.setTitle(name);xys.setXAxisLimit(mXAxisLimit);xys.setClearGraphatLimit(mClearGraphatLimit);mListofSeries1.add(xys);addSignalGenerateRandomColor(signal, 1);int [] colorrgbaray = ...
mListOfTraceColorsCurrentlyUsed.get(index);LineAndPointFormatter lapf = ...
XIII

A. Appendix 1 - Android code
new LineAndPointFormatter(colorrgbaray[0], ...colorrgbaray[1], colorrgbaray[2]);
lapf = new LineAndPointFormatter(Color.rgb(colorrgbaray[0], ...colorrgbaray[1], colorrgbaray[2]), null, null);
chart.addSeries(mListofSeries1.get(index),lapf);mDynamicPlot = chart;
for (XYSeriesShimmer xy: mListofSeries1){xy.clearData();
}}else {
throw new Exception("Error: " + ...joinChannelStringArray(signal) + ..." Signal/Property already exist.");
}}
public void addSignal2(String [] signal, XYPlot chart) ...throws Exception{if (!checkIfPropertyExist(signal)){
// Add the series first, cause the filter might find// the signal before the series is addedint index = mListofSeries2.size();String name = signal[0]+ " " + signal[1]+" " + ...
signal[2] + " " + signal[3];//List<Number> data = new ArrayList<Number>();List<Number> d = new ArrayList<Number>();XYSeriesShimmer xys = new XYSeriesShimmer(d);xys.setTitle(name);xys.setXAxisLimit(mXAxisLimit);xys.setClearGraphatLimit(mClearGraphatLimit);mListofSeries2.add(xys);addSignalGenerateRandomColor(signal, 2);int [] colorrgbaray = ...
mListOfTraceColorsCurrentlyUsed.get(index);LineAndPointFormatter lapf = ...
new LineAndPointFormatter(colorrgbaray[0], ...colorrgbaray[1], colorrgbaray[2]);
lapf = new LineAndPointFormatter(Color.rgb(colorrgbaray[0], ...colorrgbaray[1], colorrgbaray[2]), null, null);
chart.addSeries(mListofSeries2.get(index),lapf);mDynamicPlot = chart;
for (XYSeriesShimmer xy: mListofSeries2){xy.clearData();
}}else {
throw new Exception("Error: " + ...joinChannelStringArray(signal) + ..." Signal/Property already exist.");
}}
public void filterDataAndPlot (ObjectCluster ojc, XYPlot chart, ...int channelNo) throws Exception {// TODO Auto-generated method stub
XIV

A. Appendix 1 - Android code
List<String[]> toPlot = null;mDynamicPlot = chart;if (channelNo == 1) {
toPlot =mListofPropertiestoPlot1;}else{
toPlot =mListofPropertiestoPlot2;}for (int i=0;i<toPlot.size();i++){
String[] props = toPlot.get(i);if (ojc.getShimmerName().equals(props[0])){
FormatCluster f = ...ObjectCluster.returnFormatCluster(ojc.get...CollectionOfFormatClusters(props[1]), props[2]);
if (f!=null){if (channelNo == 1) {
mListofSeries1.get(i).addData(f.mData);}else{
mListofSeries2.get(i).addData(f.mData);}
} else {throw new Exception("Signal not found");
}}
}if (mDynamicPlot!=null){
mDynamicPlot.redraw();}
}
protected void addSignal(String[] channelStringArray, ...int channelNo){if(channelNo == 1 ) {
mListofPropertiestoPlot1.add(channelStringArray);}else{
mListofPropertiestoPlot2.add(channelStringArray);}
}
protected void addSignalGenerateRandomColor(String [] ...channelStringArray, int channelNo){
addSignalAndUseFixedColor(channelStringArray, ...generateRandomColor(), channelNo);
}
protected void addSignalAndUseFixedColor(String [] ...channelStringArray, int[] rgb, int channelNo){
addSignal(channelStringArray, channelNo);mListOfTraceColorsCurrentlyUsed.add(rgb);
}
public boolean checkIfPropertyExist(String[] ...channelStringArray, int channelNo){
XV

A. Appendix 1 - Android code
List<String[]> toPlot = null;if (channelNo == 1) {
toPlot =mListofPropertiestoPlot1;}else{
toPlot =mListofPropertiestoPlot2;}synchronized(toPlot){
Iterator<String[]> entries = toPlot.iterator();while (entries.hasNext()) {
String[] propertiestoPlot = entries.next();boolean test = true;int lengthToUse = channelStringArray.length> ...
4? 4:channelStringArray.length;for (int p=0; p<lengthToUse; p++){
if((propertiestoPlot[p]==null) && ...(channelStringArray[p]==null)){test = true;
}else if((propertiestoPlot[p]==null) || ...
(channelStringArray[p]==null)){test = false;
}else if (!propertiestoPlot[p].equals...
(channelStringArray[p])){test = false;
}}if (test==true){
return true;}
}}return false;
}}
XVI