
Drug Futures 2025? Modelling Drug Use
76
Drugs Futures 2025? Modelling Drug Use FORESIGHT OFFICE OF SCIENCE AND TECHNOLOGY
Transcript of Drug Futures 2025? Modelling Drug Use

Drugs Futures 2025?
Modelling Drug Use
FORESIGHT
OFFICE OF SCIENCE AND TECHNOLOGY

While the Office of Science and Technology commissioned this report, the views arethose of the authors, are independent of Government and do not constitutegovernment policy.

i
Executive Summary 1
1 Introduction 4
1.1 Contrasting approaches 5
2 Statistical models 11
2.1 Indirect estimation: capture-recapture and back-calculation 122.2 Public health framework 172.3 Routine data sources: measuring drug harms 192.4 Only connect: towards an information strategy 19
3 Case study: transmission of Hepatitis C in London 27
3.1 Introduction to HCV and objectives for analysis 273.2 Methods 283.3 Results 343.4 Discussion 383.5 Conclusions 40
4 Agent-based model: DrugChat case study 48
4.1 Description of the DrugChat model 484.2 Results and Discussion 514.3 Developing the model 63
Conclusions 69
List of publications: Drugs Futures 2025? 70
Contents

1
The authors of this report believe that modelling can lead to better policy making.
Models can help:
estimate the size of a problem
understand what factors might be important in determining the spread ofdiseases or other health problems
assess which prevention strategies result in the greatest gain
shape policy questions, future data collection or research by
– simulating how patterns of behaviour and harm may occur– identifying the greatest uncertainties– determining what evidence may be required to test simulation models.
We present three examples of models – statistical, system-dynamic, and agent-based – intended to illustrate the potential utility and benefits of modelling forunderstanding the dynamics of drug use, the harms associated with it, and its usein supporting policy making. The examples are not exhaustive. Each has limitationsand each presents specific recommendations. But in general they demonstrate thatmodelling can generate useful insights even over a very constrained timescale.
1. Public health surveillance: case study statistical models
Drug use is a behaviour of interest in public health and is associated with socialharms that we want to prevent. Policies should be judged on whether they manageto reduce total harm. There can be no doubt that drug use has increasedsubstantially over the last 30 years, but it is not clear what has driven the increaseor what preventive actions might have been successful in the past or would besuccessful in future. The number of opiate overdose deaths has increased 100-fold,from 9 in 1968 to nearly 1,000 in 2000, and model estimates suggest considerablegrowth in the number of opiate users and injecting drug users (IDUs) in thepopulation, especially in the late 1970s and early 1990s. There can be few othersocial or health problems that have increased as dramatically in the population – tothe extent that in several cities in the UK there may be over 1 in 100 young adultsusing heroin or crack.
Executive Summary
Statistical techniques can transform routine data into estimates of trends in thenumber of problem drug users in the population, for use by policy makers and asparameters for models of the dynamics of drug use and the harms associated withit. However, these methods are unable to provide insights into why or how drug usehas increased, or how it might better be prevented. Modelling new problem drugswill depend first on traditional surveillance and epidemiological studies identifyingthe drug and its potential association with health or social harms. Inevitably thereare information gaps and there is a degree of uncertainty in some of the prevalenceestimates which may limit their utility. This could be addressed by developing a co-ordinated information and surveillance strategy to make the best use of the availabledata and identify ways of closing the gaps in the evidence.
2. Infectious disease modelling among injecting drug users:
case study Hepatitis C transmission in London, UK
The number of new Hepatitis C (HCV) infections in the UK, and the total number ofcases, are largely driven by the behaviour and size of the injecting population.Indeed, over 90% of diagnosed HCV infections are attributed to injecting drug use;and infection rates are increasing among current injectors in the UK. In London, theprevalence of HCV is over 50% and incidence over 30% per year among druginjectors. HCV infection is an important public health concern because of its long-term consequences. After 30 years, approximately half of the people infected withHCV develop cirrhosis of the liver. Once it has developed, 1–5% of individuals peryear progress to liver cancer (hepatocellular carcinoma) which often leads to death(50% after two years). Treatment is available and increasingly effective (over 50%clearing the virus), but expensive. Key questions that could be addressed bymodelling are the amount of HCV morbidity in a population, the future need fortreatment and its cost, and how best to target and increase coverage of interventionsto reduce HCV transmission among IDUs, and therefore future morbidity.
To look at some of these issues, a system-dynamic model was developed of thetransmission of HCV among IDUs. The model divides IDUs into susceptible (not yetinfected); recent, chronic infected; and those who have cleared the virus. It includesinformation on the probability of infection if exposed to the virus through sharing aninfected syringe, and the frequency of injection and sharing. Because of uncertaintyin the behavioural and epidemiological data, the model was run with a range ofdifferent possible parameter values, and fitted against observed data on theprevalence of HCV among IDUs in London for different durations of injecting.The preliminary findings highlighted key uncertainties in both the biological andbehavioural evidence needed to fully understand the transmission of HCV amongIDUs in London. A key question raised by the model which has implications forpublic health action and policy makers, and which requires further information toanswer, is how critical the delivery of injecting equipment and health education isto all injectors at the outset of their injecting career, or to a subgroup of 'high risk'
Drugs Futures 2025?Modelling Drug UseExecutive Summary
2
injectors, in order to have the greatest impact on reducing HCV infection. There isno question that the coverage of interventions needs to be increased to reduceHCV infection, but modelling will help us understand what level it needs to beincreased to, and what specific population groups need to be targeted. Specificrecommendations for improved data collection and future modelling work are given.
3. Agent-based model – DrugChat
In this section, an agent-based model is developed that uses insights fromethnographic research to investigate the role of social networks, choice and socialinfluence on drug use and on transitions from use to dependence. Instead of fittingmodel results to observed data, the simulation model creates findings andhypotheses to be tested against further research to take forward our understandingof how drug use may spread within communities. The model starts with a populationof agents connected through social networks. Agents are either non-users, users, oraddicts. Non-users and users choose to use drugs if they are offered on the basis oftheir attitudes to risk and to taking drugs, which are influenced by members of theirsocial network and by their prior experience. The simulation follows the theoreticalpopulation through and can measure the number and proportion of the populationthat remain non-users, use drugs and become addicts, and changes in their attitudetowards drugs. At the same time, it can illustrate types of individual histories of druguse that may be relevant to future ethnographic work.
The model could be extended to explore what might happen under other hypotheses,such as introducing a change in the probability of having a good experience from usingdrugs with increased use, incorporating the potential harms associated with use, addingdealing and a drug market, or allowing the dynamic creation of deviant networks based onshared attitudes to risk and drug taking. The priority given to these different developmentscould reflect policy interest, synthesis and collection of ethnographic knowledge, and abilityto generate sensible agent biographies and aggregate use statistics.
Finally, modelling can help evidence-based policy by 'organising' data and drawingattention to consequences of social interaction that are hard to envisage. At thesame time, modelling requires additional data in order to deliver these benefits.
June 2005
Edmund Chattoe, Matthew Hickman, Peter VickermanDepartment of Sociology, University of OxfordCentre for Research on Drugs and Health Behaviour, Imperial CollegeHealth Policy Unit, London School of Hygiene and Tropical Medicine
Drugs Futures 2025?Modelling Drug Use
Executive Summary
3
4
Modelling can enhance and contribute to the evidence base for public policy.Models can help:
estimate the size of a problem
understand what factors might be important in determining the spread ofdiseases or other health problems
assess which prevention strategies may result in the greatest gain
shape policy questions, future data collection or research by
– simulating how patterns of behaviour and harm may occur– identifying where the greatest uncertainties lie– determining what evidence may be required to test simulation models.
Current policy-relevant questions that could be informed by modelling areconcerned both with drug use and its harms. Modelling could be used to examineissues such as:
What are the trends in consumption of heroin and crack-cocaine and their impacton crime?
What is the best mix of treatment, criminal justice and other prevention activitiesfor reducing drug-related deaths?
What interventions might be successful in delaying onset or preventingprogression to problematic drug use and the harms associated with drug use?
Equally, future questions will be concerned with how we monitor and prevent thespread of, or the risk of problems associated with, new or previously rare, potentialharmful drugs such as new stimulants or methamphetamine.
What models cannot do, however, is to provide clear answers in the absence ofempirical data or in the presence of great uncertainty about the nature of therelationship between behaviour and harm. Indeed, there is a danger, if theuncertainty is too great, that models may be uninformative and show too wide arange of possible outcomes.
1 Introduction

There are several modelling approaches that can be used to look at these issues –statistical; system-dynamic; agent-based; economic; scenario- or complex system-based – but no ready-made menu about which approach may be best for whichpolicy question. The Drug Policy Modelling Project (DPMP) in Australia provides amore comprehensive assessment of the range of approaches that can be used todescribe the dynamic relationship between drug policy and a mix of interventions –law enforcement, treatment and prevention – on heroin use. Below we give threeillustrations of the potential contribution of modelling: statistical model estimates ofthe prevalence and incidence of opiate use; a system-dynamic or infectious-diseasemodel of a drug-related harm (Hepatitis C transmission and prevention amongIDUs); and an agent-based model of the potential spread of drug use in a population.In addition, we discuss the available epidemiological data in England and Wales.These are only examples. It is important to note that system-dynamic models havebeen used to estimate trends in drug use (for example, cocaine use in the UnitedStates) and agent-based models have been used to assess harms (for example, toassess the dynamics of policing, price and consumption on mortality, and to modelthe transmission of drug-related harms); and other types of model can also be usedto assess the dynamics of the drug-use population, and of harms and policies.
In the next section we give a brief introduction to modelling.
1.1 Contrasting approaches
Different styles of modelling can be characterised by what they assume aboutcause and effect and about the nature of the regularities that can be found in socialsystems. It is a mistake to think that some modelling approaches are more'objective' than others simply because these assumptions are made less explicit.In fact, the applicability of a modelling technique hinges on the evidence we havefor believing that such cause-and-effect relations and regularities occur in the socialsetting that we wish to understand.
This issue can be illustrated by comparing three different modelling approaches interms of their assumptions concerning cause-and-effect and regularity. It isimportant to stress that these approaches are not better or worse in themselves,but are more, or less, appropriate for modelling particular kinds of social behaviour.
First, the main strengths of statistical modelling are its relative simplicity and thelevel of technical confidence that can be placed in the results. Most of thetechniques involved are well established and may be supported by dedicatedsoftware. In its most general form, the task of statistical modelling is to detect andmeasure associations between quantitative variables. In the case studies presentedhere, the tasks of capture-recapture and back-calculation are to estimate hiddenpopulations as accurately as possible from their recorded traces. This application islikely to work well, certainly in the case of capture-recapture, both because the
Drugs Futures 2025?Modelling Drug Use
Introduction
5

technique is being used to measure an association rather than explain it andbecause the association it seeks to measure is relatively free of behaviouralelements. There is no reason to suppose that the different ways in which druguse can come to the attention of the police or hospitals are biased by drug userbehaviour in a way that will systematically distort the measured association,particularly over short timescales. By contrast, the accuracy of the associationsmeasured in the back-calculation analysis is conditional on the assumption that themain determinants of the observed association are 'physiological' (and thusrelatively stable) rather than 'social'. If what 'drives' the system is (as in this case)the logic of a disease, it is reasonable to assume stability in the underlyingparameters. If, by contrast, the system was driven by the evolution of socialpractices in drug use, it seems much less likely that the underlying associationswould be stable enough to be measured with confidence. Effective applications oftechniques such as those presented here can thus be contrasted with moreproblematic ones found elsewhere.
A common approach is to use regression analysis to measure associations betweenpredisposing factors (unemployment, problem family history) and drug use1. In thiscase, there can be little argument with the mere measurement of association butexplanations and predictions derived from these are far less convincing. It is clearthat there is an 'explanation gap' between the observed association and the processthat generates it. If we find an association between coming from a broken homeand drug use, we can easily think of social reasons why this might be so (lack ofcontrol, psychological stress and so on), but the regression analysis does notdifferentiate between these. It is necessary to go away, collect more data on thesevariables, run another regression and hope the insights are confirmed after the fact.At the same time, the kind of explanations that are postulated and confirmed willdetermine the stability of the relationship for predictive purposes. It is reasonablyplausible that psychological stress will always lead to some form of drug use butthe drug choice (legal or illegal, for example) is likely to be a result of factors thatare contextual, social and individual. In these circumstances, patterns of associationfound in statistical models might not constitute meaningful explanations, let alonebe a stable basis for prediction.
Second, the main advantage of 'stocks and flows' approaches to modelling is thatthey recognise some of the key dynamic aspects of social processes while stillretaining simplicity and the ability to use standard software. System dynamics2-6 isthe best-known example of an approach of this kind and is used in the case studypresented here, but other approaches based on equation systems and Markovchains7, 8 operate on the same principles. Instead of static variables, thesetechniques hypothesise flows between states. For example, light drug users mayquit or become heavy drug users, while heavy drug users may quit (with moredifficulty) or die. These transitions define evolving populations of different usertypes and capture key behavioural features of the system and its causal order.In this example, the transition from heavy use to non-use ought to be less common
Drugs Futures 2025?Modelling Drug UseIntroduction
6
than that from light use because it is harder to achieve. As with statistical models,the applicability of this approach hinges on assumptions about how social theprocess is that we are trying to model.
Ethnographic research9-12 suggests that factors such as individual choice andsocial network position play important roles in determining drug-use biographies.In principle, these factors can simply be added to a 'stocks and flows' modelby increasing the number of stocks (for example, 'well connected light user').In practice, however, this leads both to technical problems with sampling andmanagement of the model and doesn't really solve the conceptual difficulty,which is that certain forms of choice and social context are not well approximatedby stocks of homogeneous actors and stable flows between them.
Infectious disease models are an important subset of system-dynamic or 'stocksand flows' models. Given the difficulty of directly measuring the dynamics ofinfections (such as HIV, Hepatitis B and C) among drug users, these provide analternative approach to predicting the dynamics of disease transmission, andcrucially the potential impact and cost-effectiveness of disease preventioninterventions13-18. The power of this form of mathematical modelling lies in its abilityto translate individual risk behaviour into patterns of disease transmission, and toexplore what factors affect the transmission of a dynamic disease within apopulation over different timeframes including possible intervention strategies, andfor different assumptions about risk behaviour, disease progression, behaviourchange and policy intervention19-24. We develop a model of Hepatitis C (HCV), as anexample and because of the central importance of drug use in the transmission andepidemiology of HCV in the UK. The model is used to illustrate possible insights thiskind of model can give, and an extensive discussion is included, withrecommendations, outlining how this modelling could be improved or extended,and what the urgent data needs are to improve its accuracy and power.
In addition, system-dynamic models have successfully modelled the cocaineepidemic in the US8, 25. They estimate consumption and fit rates of initiation,escalation to heavier use, cessation and average time of use to estimated trends inthe prevalence of cocaine use. In one model, it was extended to trends in arrestsand seizures3. We had originally intended to illustrate the use of a similar model forthe UK. However, data from population surveys were not available in time.
Third, agent-based models attempt to tackle the 'explanation gap' discussed aboveby explicitly modelling the internal states, decision processes and social interactionsof individuals. Instead of variables and parameters or 'types' and transitions, thesemodels deal with simulated populations and their interactions. For example, thedecision to use drugs may be influenced by subjectively perceived risk and thatperception of risk may be determined by communication with others who haveused drugs. This means that individuals in different social network positions willevolve potentially unique risk perceptions that will continue to change over time.
Drugs Futures 2025?Modelling Drug Use
Introduction
7
An agent-based model will make explicit assumptions about how these processesof communication and influence occur, based, for example, on ethnographicevidence. Thus, models of this kind are most suitable for helping us to understandsocial processes such as the etiquette of needle sharing discussed in the hepatitiscase study. The downside is that agent-based models are relatively complex andcannot be built simply using standard software. This means that for processesbelieved not to be very 'social' (such as the other two case studies presented), anagent-based model may be a needless refinement. The final issue connected withagent-based modelling is potentially ambiguous as an 'advantage' or 'disadvantage'.Agent-based models require all assumptions about behaviour and interaction to bemade explicit. This contrasts with some of the implicit assumptions about socialregularity which are found in statistical and 'stocks and flows' models. (A profoundbut technical discussion of these in the context of statistical modelling can be foundin Abbot (2001)26.) On one hand, this process is very labour-intensive. On the other,it draws clear attention to things we don't yet know or don't fully understand.
To sum up, when we only want to know what is happening, statistical models maywell be adequate. When we want to know why something is happening, a dynamicmodel will certainly be required. When the reasons why something is happeninginvolve choices and social structure as well as individual attributes, an agent-basedmodel may be required.
Drugs Futures 2025?Modelling Drug UseIntroduction
8

References for Introduction
1. Bahr S, Maughan S, Marcos A, Li B. Family, Religiosity, and the Risk ofAdolescent Drug Use. Journal of Marriage and the Family 1998, 60:979–992.
2. Holder H. Planning for Alcohol-Problem Prevention Through Complex SystemsModelling: Results From SimCom. Substance Use and Misuse 1998,33:669–692.
3. Homer J. A System Dynamics Model for Cocaine Prevalence Estimation andTrend Projection. The Journal of Drug Issues 1993, 23:251–279.
4. Homer J. Projecting the Impact of Law Enforcement on Cocaine Prevalence:A System Dynamics Approach. Journal of Drug Issues 1993, 23:281–295.
5. Jacobsen C, Hanneman R. Illegal Drugs: Past, Present and Possible Futures.The Journal of Drug Issues 1992, 22:105–120.
6. Levin G, Roberts E, Hirsch G. The Persistent Poppy: A Computer-AidedSearch for Heroin Policy. Cambridge, MA: Ballinger Publishing Company;1975.
7. Burattini M, Massad E, Coutinho F, Azevedo-Neto R, Menezes R, Lopes L. AMathematical Model of the Impact of Crack-Cocaine Use on the Prevalenceof HIV/AIDS Among Drug Users. Mathematical and Computer Modelling1998, 28:21–29.
8. Caulkins J, Behrens D, Knoll C, Tragler G, Zuba D. Markov Chain Modelling ofInitiation and Demand: The Case of the US Cocaine Epidemic. Health CareManagement Science 2004, 7:319–329.
9. Agar M. Ripping and Running: A Formal Ethnography of Urban HeroinAddicts, Language, Thought, and Culture Series. New York, NY: SeminarPress; 1973.
10. Bourgois P. Search of Respect: Selling Crack in El Barrio, Structural Analysis inthe Social Sciences. Cambridge: Cambridge University Press; 2003.
11. Friedman S, Curtis R, Neaigus A, Jose B, Des Jarlais D. Social Networks,Drug Injectors' Lives, and HIV/AIDS. In: AIDS Prevention and Mental HealthSeries. New York, NY: Kluwer Academic/Plenum Publishers; 1999.
12. Plant M. Drug Takers in an English Town. London: Social SciencePaperbacks/Tavistock Publications; 1975.
13. Jacobs P, Calder P, Taylor M, Houston S, Saunders LD, Albert T. CostEffectiveness of Streetworks' Needle Exchange Program of Edmonton.Canadian Journal of Public Health 1999, 90:168–171.
14. Laufer FN. Cost-Effectiveness of Syringe Exchange as an HIV PreventionStrategy. Journal of Acquired Immune Deficiency Syndrome 2001,28:273–278.
Drugs Futures 2025?Modelling Drug Use
Introduction
9

15. Kaplan EH, Heimer R. A Circulation Theory of Needle Exchange [editorial].AIDS 1994, 8:567–574.
16. Kumaranayake L, Vickerman P, Walker D, Samoshkin S, Romantsov V,Emelyanova Z, et al. The Cost-Effectiveness of HIV Preventive Measuresamong Injecting Drug Users in Svetlogorsk, Belarus. Addiction 2004,99:1565–1576.
17. Vickerman P, Watts CH. The Impact of an HIV Prevention Intervention forInjecting Drug Users in Svetlogorsk, Belarus: Model Predictions. InternationalJournal of Drug Policy 2002, 13:149–164.
18. Vickerman P, Kumaranayake L, Balakireva O, Guinness L, Artyukh O, SemikopTE, et al. The Cost-Effectiveness of Expanding Harm Reduction Activities forInjecting Drug Users in Odessa, Ukraine. Sexually Transmitted Diseases inpress.
19. Murray JM, Law MG, Gao Z, Kaldor JM. The Impact of Behavioural Changeson the Prevalence of HIV and Hepatitis C Among Injecting Drug Users.International Journal of Epidemiology 2003, 32:708–714.
20. Kretzschmar M, Wiessing L. Modelling the Transmission of Hepatitis C inInjecting Drug Users. In: Hepatitis C and Injecting Drug Use: Impact, Costsand Policy Options. Jager JC, Limburg W, Kretzschmar M, Postma MJ,Wiessing L (eds). Lisbon: European monitoring centre for drugs and drugaddiction; 2004.
21. Pollack HA. Cost-Effectiveness of Harm Reduction in Preventing Hepatitis Camong Injecting Drug Users. Med Decis Making 2001, 21:357–367.
22. Grassly NC, Lowndes CM, Rhodes T, Judd A, Renton A, Garnett GP.Modelling Emerging HIV Epidemics: The Role of Injecting Drug Use andSexual Transmission in the Russian Federation, China and India. InternationalJournal of Drug Policy 2002, (Current issue).
23. Saidel TJ, Des Jarlais D, Peerapatanapokin W, Dorabjee J, Singh S, Brown T.Potential Impact of HIV Among IDUs on Heterosexual Transmission in AsianSettings: The Asian Epidemic Model. International Journal of Drug Policy2003, 14:63–74.
24. Vickerman P, Watts CH. Injecting Drug Use and the Sexual Transmission ofHIV: Simple Model Insights. International Journal of Drug Policy 2003,14:89–93.
25. Everingham S, Rydell C. Modelling the demand for cocaine. RAND; 1994.
26. Abbott A. Transcending General Linear Reality. In: Time Matters: On Theoryand Method. Chicago, IL: The University of Chicago Press; 2001: 37–63.
Drugs Futures 2025?Modelling Drug UseIntroduction
10
11
A key piece of evidence for policy makers, used for targeting interventions andmeasuring total harm, is the prevalence or frequency of the problem. Estimates ofthe prevalence of problem drug use can be essential parameters in modelling thedynamics of the population and population need, and assessing the potential impactof interventions. For instance, modellers in the US have used estimates of theprevalence of light and heavy cocaine use over time to estimate the consumptionof cocaine use, the duration of use, rates of cessation, and escalation between lightand heavy use1, 2. Modellers in Australia and the UK have used estimates of theincidence and prevalence of opiate use (with other information) to estimate thespread of HCV infection in the population and potential future morbidity andmortality from HCV and treatment need3, 4. We have also used information on theprevalence of injecting in models to estimate the impact and cost-effectiveness ofsyringe distribution on HIV transmission, and impact of increasing the coverage ofsyringe distribution on endemic HIV prevalence5, 6.
Smoking, alcohol, cannabis and some other forms of drug use are more thanadequately measured directly through population surveys. This is not the case forinjecting drug use, heroin or crack-cocaine use because of multiple response biases.Injecting drug users or crack-cocaine users are less likely than non-problematic drugusers to live in households included in general household surveys, IDU/crack usersmay be less likely to participate in the survey even if asked, and injection or crackuse may be less likely to be reported than other forms of drug use. For example, in2002 the British Crime Survey, which surveyed about 30,000 subjects, found lessthan 50 subjects reporting heroin or crack use in the last month, which gave anestimate of 33,000 heroin or crack users in Britain7. This is less than the numberof heroin users presenting to specialist drug treatment agencies, and less than anestimate of the number of crack users in London8.
One solution is to develop and use indirect estimation methods9 using routine datasources. Two examples are summarised below, with implications for surveillanceand new problem drugs.
In the US, large-scale population surveys have been available since the 1970s.Data were collected on current and past use and age of first use, which togetherwith year of survey can be used to estimate year of first use and time trends in theincidence and prevalence of drug use10. Such methods have been used to estimate
2 Statistical models

the growth in cannabis use and have been used to estimate trends in cocaine use1, 11,but failed to detect any discernible change in heroin use from 1960 to 1990. This isimplausible given the known, marked changes in heroin use and its harms over thisperiod, and invalidates the method at least for heroin.
2.1 Indirect estimation: capture-recapture and
back-calculation
The rationale for indirect estimation methods, based on statistical models, is thatpopulation surveys (or direct methods) are impracticable or unreliable, and a simplecount of known cases will not suffice because an unknown number and proportionof IDUs and other problem drug users will not be in contact with any data source.
The starting point for indirect estimation is one or preferably many data sources ona sample of problem drug users. The aim of indirect estimation methods is toanalyse the observed data set or combine it with other information to estimate the'proportion of the [problem drug use] target population sampled within the observeddata set', and thereby to arrive at an estimate of the prevalence. In other words,indirect methods use routine data sources as their raw material to estimate thesampling intensity i.e. the proportion of the total number of problem drug usersobserved or recorded by the data sources.
The problem with indirect methods is that they are 'inherently uncertain', ofteninvolving several untestable assumptions about the relationship between subjectsrecorded within the data sources and the underlying population of problem drugusers; and that any statistical uncertainty (expressed in terms of 95% confidenceintervals) is often far outweighed by model uncertainty or mis-specification.
In the next section, we give two examples of statistical models and indirectmethods to highlight our current level of knowledge in order to illustrate bothhow the information might be used in other models and the implications for futuresurveillance of current and new problem drugs.
2.1.1 Case Study 1: Estimating the prevalence of IDU in three citiesin England12
Tables 1–4 show the steps and output of the study. In Table 1, data are collected onproblem IDUs in contact with different services: specialist treatment, police arrests,syringe distribution programmes, accident and emergency (A&E) departments, anda local survey of IDU recruited in the community. Table 2 shows the data sourcesbeing matched to identify subjects who were identified on only one or more thanone of the data sources. All things being equal, the proportion of overlap is anindication of the size of the unobserved population. Statistical models are fitted tothe data set, and the best-fitting model is used to predict or estimate the number of
Drugs Futures 2025?Modelling Drug UseStatistical models
12

IDUs in the population who in that year were not captured or identified by the datasources. Table 3 illustrates the combination of the observed and unobservednumbers of IDUs, which gives an estimate of the total number and prevalence.Then these estimates can be used to provide key public health indicators, such asthe coverage of syringe distribution per IDU and per injection, the proportion of IDUin treatment, and the overdose mortality rate between sites (Table 4).
In this way, the prevalence of IDU and other forms of problem drug use can beestimated for many cities worldwide13-17.
There are a number of observations that can be drawn from these studies.
Prevalence of injecting, heroin, and crack use – at over 1% – among young adultsis no longer rare in the UK cities sampled.
The method works in the UK for heroin and IDU because routine data sources areavailable, these types of problem drug user predominate (especially in certaintreatment and criminal justice data sets) and they have a reasonable probabilityof presenting or being captured by one of the data sources in their life course.
The growth in crack-cocaine use, and the increase in numbers of these users intreatment and in contact with other data sets, means that for the first time wehave been able to use capture-recapture methods to estimate their prevalenceand the overlap with opiate use8.
However, these methods cannot work for drug users who have a very lowprobability of appearing on routine data sets, such as LSD users or even powdercocaine users.
Indirect methods will probably not work for new drugs because they require datasources that identify and record their presence or use by problem drug users, andsufficient users in contact with routine data sources.
Reliance on routine data sources that only ever partially count the total number orprevalence of a disease or public health problem is a general problem, not just forproblem drug use. One solution is to make explicit use of capture-recapturemethodologies and invest in a mix of data sources that together can provide reliableestimates of prevalence18. At the very least, government investment in data sourcesshould follow a common strategy and we strongly encourage (if it cannot beconditional) the provision of common data sets for record linkage and the regularestimation of the prevalence of heroin, IDU and crack use.
Drugs Futures 2025?Modelling Drug UseStatistical models
13
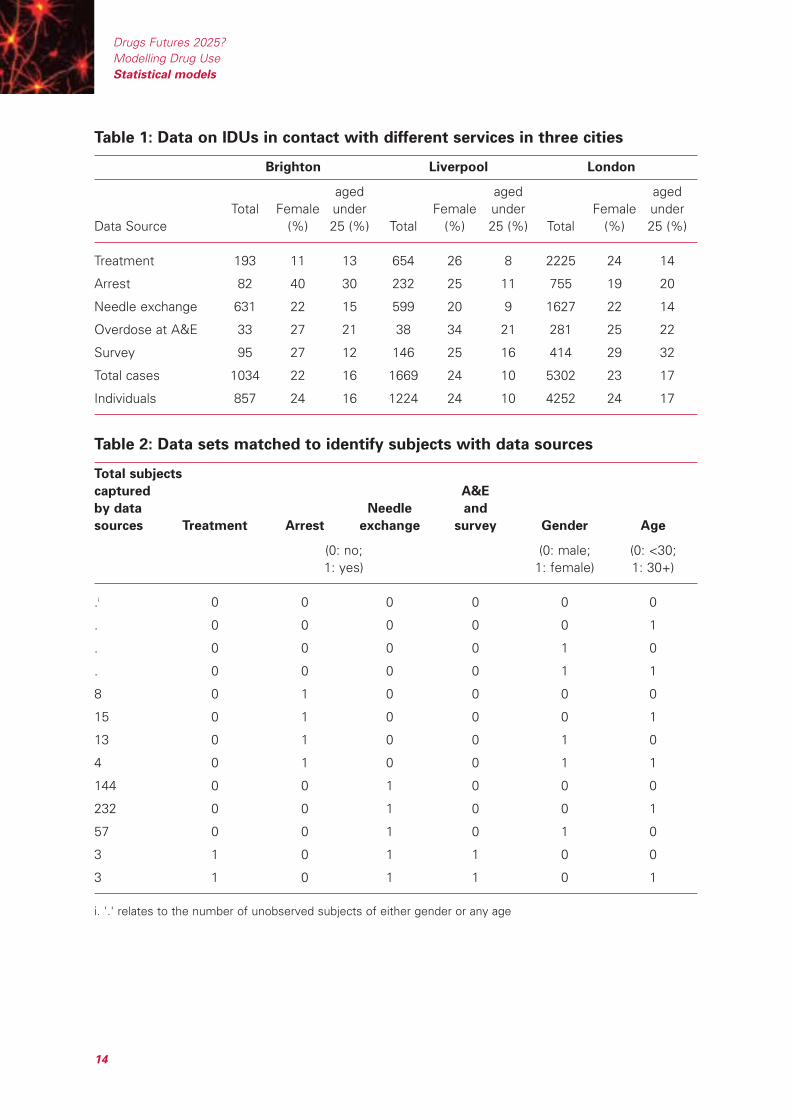
Table 1: Data on IDUs in contact with different services in three cities
Brighton Liverpool London
aged aged aged Total Female under Female under Female under
Data Source (%) 25 (%) Total (%) 25 (%) Total (%) 25 (%)
Treatment 193 11 13 654 26 8 2225 24 14
Arrest 82 40 30 232 25 11 755 19 20
Needle exchange 631 22 15 599 20 9 1627 22 14
Overdose at A&E 33 27 21 38 34 21 281 25 22
Survey 95 27 12 146 25 16 414 29 32
Total cases 1034 22 16 1669 24 10 5302 23 17
Individuals 857 24 16 1224 24 10 4252 24 17
Table 2: Data sets matched to identify subjects with data sources
Total subjects
captured A&E
by data Needle and
sources Treatment Arrest exchange survey Gender Age
(0: no; (0: male; (0: <30; 1: yes) 1: female) 1: 30+)
.i 0 0 0 0 0 0
. 0 0 0 0 0 1
. 0 0 0 0 1 0
. 0 0 0 0 1 1
8 0 1 0 0 0 0
15 0 1 0 0 0 1
13 0 1 0 0 1 0
4 0 1 0 0 1 1
144 0 0 1 0 0 0
232 0 0 1 0 0 1
57 0 0 1 0 1 0
3 1 0 1 1 0 0
3 1 0 1 1 0 1
i. '.' relates to the number of unobserved subjects of either gender or any age
Drugs Futures 2025?Modelling Drug UseStatistical models
14
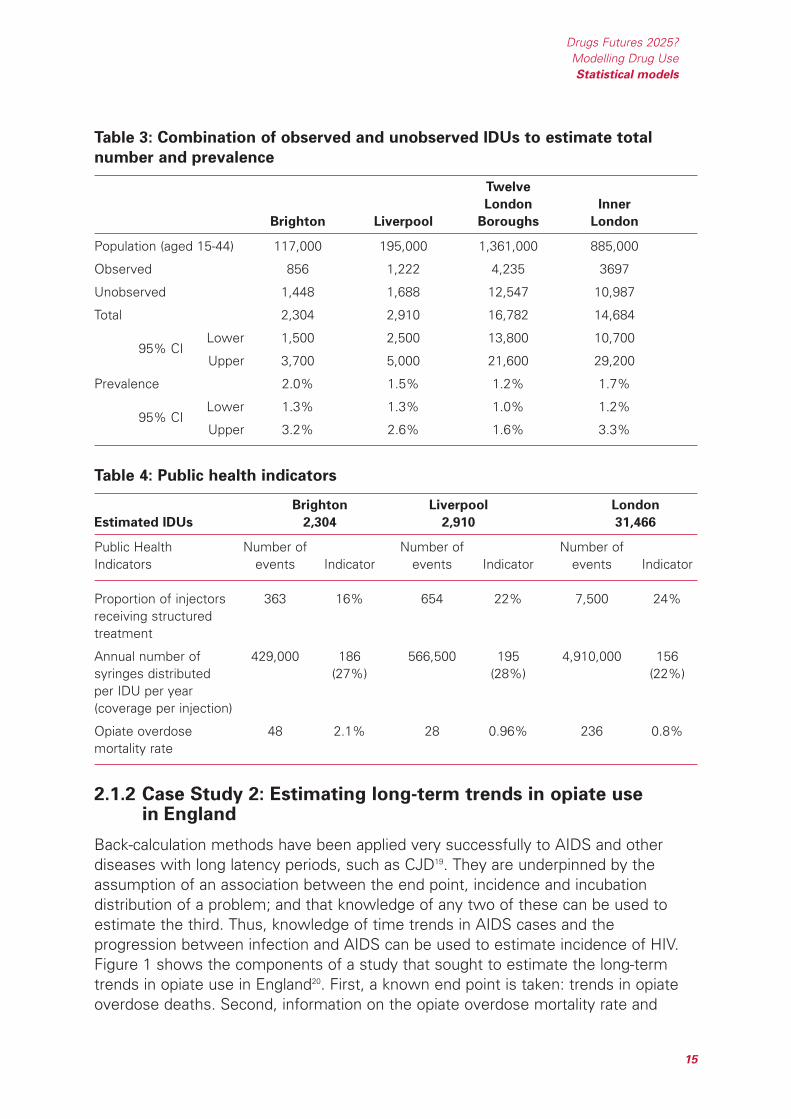
Table 3: Combination of observed and unobserved IDUs to estimate total
number and prevalence
Twelve
London Inner
Brighton Liverpool Boroughs London
Population (aged 15-44) 117,000 195,000 1,361,000 885,000
Observed 856 1,222 4,235 3697
Unobserved 1,448 1,688 12,547 10,987
Total 2,304 2,910 16,782 14,684
95% CILower 1,500 2,500 13,800 10,700
Upper 3,700 5,000 21,600 29,200
Prevalence 2.0% 1.5% 1.2% 1.7%
95% CILower 1.3% 1.3% 1.0% 1.2%
Upper 3.2% 2.6% 1.6% 3.3%
Table 4: Public health indicators
Brighton Liverpool London
Estimated IDUs 2,304 2,910 31,466
Public Health Number of Number of Number of Indicators events Indicator events Indicator events Indicator
Proportion of injectors 363 16% 654 22% 7,500 24%receiving structured treatment
Annual number of 429,000 186 566,500 195 4,910,000 156syringes distributed (27%) (28%) (22%)per IDU per year (coverage per injection)
Opiate overdose 48 2.1% 28 0.96% 236 0.8%mortality rate
2.1.2 Case Study 2: Estimating long-term trends in opiate usein England
Back-calculation methods have been applied very successfully to AIDS and otherdiseases with long latency periods, such as CJD19. They are underpinned by theassumption of an association between the end point, incidence and incubationdistribution of a problem; and that knowledge of any two of these can be used toestimate the third. Thus, knowledge of time trends in AIDS cases and theprogression between infection and AIDS can be used to estimate incidence of HIV.Figure 1 shows the components of a study that sought to estimate the long-termtrends in opiate use in England20. First, a known end point is taken: trends in opiateoverdose deaths. Second, information on the opiate overdose mortality rate and
Drugs Futures 2025?Modelling Drug UseStatistical models
15
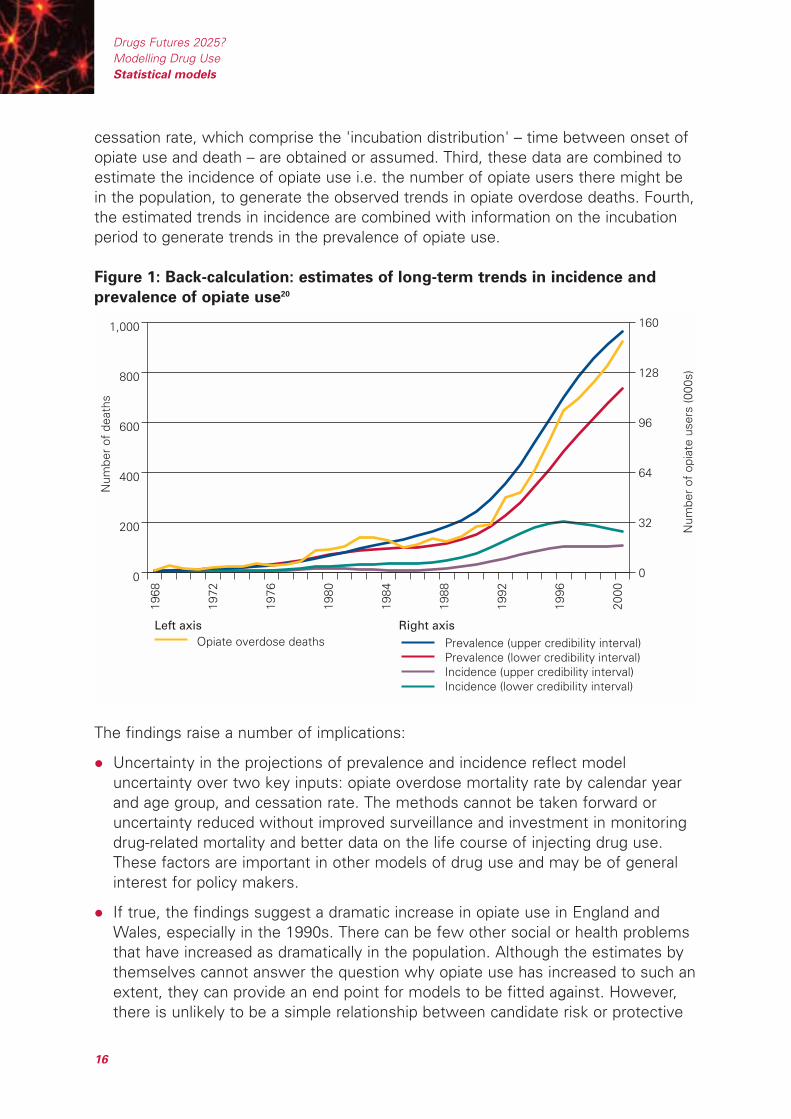
cessation rate, which comprise the 'incubation distribution' – time between onset ofopiate use and death – are obtained or assumed. Third, these data are combined toestimate the incidence of opiate use i.e. the number of opiate users there might bein the population, to generate the observed trends in opiate overdose deaths. Fourth,the estimated trends in incidence are combined with information on the incubationperiod to generate trends in the prevalence of opiate use.
Figure 1: Back-calculation: estimates of long-term trends in incidence and
prevalence of opiate use20
The findings raise a number of implications:
Uncertainty in the projections of prevalence and incidence reflect modeluncertainty over two key inputs: opiate overdose mortality rate by calendar yearand age group, and cessation rate. The methods cannot be taken forward oruncertainty reduced without improved surveillance and investment in monitoringdrug-related mortality and better data on the life course of injecting drug use.These factors are important in other models of drug use and may be of generalinterest for policy makers.
If true, the findings suggest a dramatic increase in opiate use in England andWales, especially in the 1990s. There can be few other social or health problemsthat have increased as dramatically in the population. Although the estimates bythemselves cannot answer the question why opiate use has increased to such anextent, they can provide an end point for models to be fitted against. However,there is unlikely to be a simple relationship between candidate risk or protective
0
32
64
96
128
160
Left axis Right axis
1968
1972
1976
1980
1984
1988
1992
1996
2000
Prevalence (upper credibility interval)Prevalence (lower credibility interval)Incidence (upper credibility interval)Incidence (lower credibility interval)
Opiate overdose deaths
0
200
400
600
800
1,000
Num
ber
of d
eath
s
Num
ber
of o
piat
e us
ers
(000
s)
Drugs Futures 2025?Modelling Drug UseStatistical models
16

factors that could explain the many fold increase in use over the last 30 years31.Knowledge of individual susceptibilities, the impact of increased exposure, andthe interaction between different risk and protective factors are insufficient tobuild an explanatory model.
The back-calculation model estimates a population that, by definition, has a riskof opiate overdose death, and is likely to exclude 'recreational' or one-off users ofopiates. Other methods or data sources – such as the use of population surveys– may be required to estimate this population and the total population that hasused opiates.
Similar output in Australia has been used in models of the transmission of HCVinfection4. In applying these models to England and Wales, we suggest the modelfindings are highly sensitive to a few parameters which themselves are veryuncertain: number and proportion of recreational IDUs and average injectingfrequency.
Back-calculation methods are unlikely to be useful for new or other drugs withouttrends in a specific end point.
2.2 Public health framework
Models also require data and knowledge on the nature and strength of therelationship between drug-using behaviours and specific outcomes, or betweenspecific factors and the progression of problem drug use in order to be informativein assessing the potential impact of different policies. In this section we summarisethe current data sources and evidence available for describing problem drug use.
One conceptual framework of drug use proposes that21:
Total harm = Average harm Prevalence
This also follows the 'public health framework' for examining drug use and harm asoutlined by the Institute of Medicine22. That is: a change in drug policy or specificpublic health intervention should be judged on whether it manages to reduce 'totalharm' through its impact on the 'average harm' or overall 'prevalence' of use.Moreover, within a public health framework, drug use itself is a 'risk factor', thesignificance of which lies in its association with key public health harms (whetherlung cancer, overdose, heart disease, infection, injury and violence, crime, mental andsocial functioning, or loss of earnings).i One theoretical argument brought againstthe 'legalisation' of cannabis or other drugs is that even if 'average harm' is reducedthere may be no impact on total harm – or it may even rise – if there is aproportionally greater increase in prevalence than the decrease in average harm23.
Drugs Futures 2025?Modelling Drug UseStatistical models
17
i Discussion of harms associated with drug use are covered in more detail in other sections.
The concepts within the model also are similar to the public health concept of'attributable risk' and 'population attributable risk'24. The 'attributable fraction(AF)' measures the proportion or fraction of harm among exposed cases, in otherwords, how much harm could be prevented among those exposed. The 'populationattributable fraction (PAF)' or 'etiologic fraction' is a measure of the proportion ofharm in the population caused by the exposure, or of how much harm could beprevented by successfully eliminating the exposure. The information required toestimate AF or PAF is an estimate of the risk of disease given exposure, and theprevalence of exposure in the population. For example, over 90% of lungcancer among those who smoke can be attributed to smoking and approximately80% of lung cancer in the population is due to smoking(http://www.hda.nhs.uk/documents/smoking_epidemic.pdf). Deaths associatedwith illicit drug use also impact greatly on the health of the population. In severalEuropean cities it has been estimated that over 1 in 100 injectors die annually(between 10 and 20 times higher than the general population) and contribute over10% of deaths among young adults aged 15-4425.
Smoking and alcohol use are associated with many diseases24. The quantification ofharm from smoking and alcohol which have been so influential, for example, inAustralia, and also conducted globally for the World Health Organisation (WHO), hasbeen possible because of the availability of several large-scale cohort studies thatfollow up and compare mortality and morbidity among smokers, non-smokers anddrinkers and non-drinkers, and because information on the frequency andprevalence of smoking and drinking is generally available directly from populationsurveys. Public health strategies and interventions that successfully reduce theprevalence of smoking or drinking in the population are likely to reduce the level ofharm in the population, and there is growing evidence on which strategies are likelyto be most successful.
In contrast, the same degree of information (either on the size of the population,the size of the risk associated with public health/social problems, or theeffectiveness of interventions to reduce prevalence) is not as readily available forinjecting or other forms of drug use in the UK or many other countries, limitingestimates of the quantity of harm in the population. Further, it is important that thelevel and proportion of crime, as a key social cost, associated with injecting andother illegal drug use is measured as well as health harms.
Birth cohort studies provide the best means of assessing the problems associatedwith common exposures – such as the link between cannabis use and schoolproblems and adult schizophrenia – as they can adjust and allow for other potentialrisk factors that are related or antecedent to cannabis use26, 27. However, these typesof study are likely to be biased and have insufficient power (due to small samplesize, and differential loss to follow-up) to measure factors associated with injectingor crack use.
Drugs Futures 2025?Modelling Drug UseStatistical models
18
Thus, the complexity in the formulation of total harm, at least for injecting and someother types of problem drug use, lies in the measurement.
2.3 Routine data sources: measuring drug harms
The US has invested in school and general household surveys of problem drug useand other surveys of the consequences of drug use. These include two annualnational surveys (Monitoring the Future, and the National Household Survey on DrugAbuse) and at least two national surveillance systems, one of drug-related crimethrough the Arrestee Drug Monitoring Programme, and the other of drug-relatedproblems at emergency rooms and deaths (Drug Abuse Warning Network), as wellas other one-off or periodic surveys22, 28.
Notwithstanding the wealth of information provided, both the Institute of Medicineand the National Research Council noted a number of gaps in the availableinformation, and made a number of recommendations to improve it. These maybe relevant to the UK and include:
Establish better evidence and monitoring of drug consumption and price.The uncertainty surrounding these data hinder economic models assessingthe effectiveness of strategies to increase price and/or reduce consumption.
Establish the nature of non-response in population surveys. At the moment,interpretation of trends over time requires a strong but unlikely assumption thatnon-responders are similar to responders.
Increase opportunities for record linkage across surveillance systems,to corroborate and enhance the information provided.
Increase effort to evaluate drug prevention initiatives – including evaluatinguniversal versus targeted programmes focusing on initiation or transitions fromuse to abuse and dependence, and on modelling the potential impact of delayingthe onset of drug use.
Develop principles and procedures for information and surveillance systemson illegal drug taking and associated hazards.
Investigate better (with long-term studies) the etiology, risk and protective factorsassociated with transitions to abuse and dependence.
2.4 Only connect: towards an information strategy
We recommend policy makers consider commissioning a similar review (acrossgovernment departments and with multidisciplinary scientific input) to identify keygaps in our information and opportunities for greater integration of currentinformation systems.
Drugs Futures 2025?Modelling Drug UseStatistical models
19
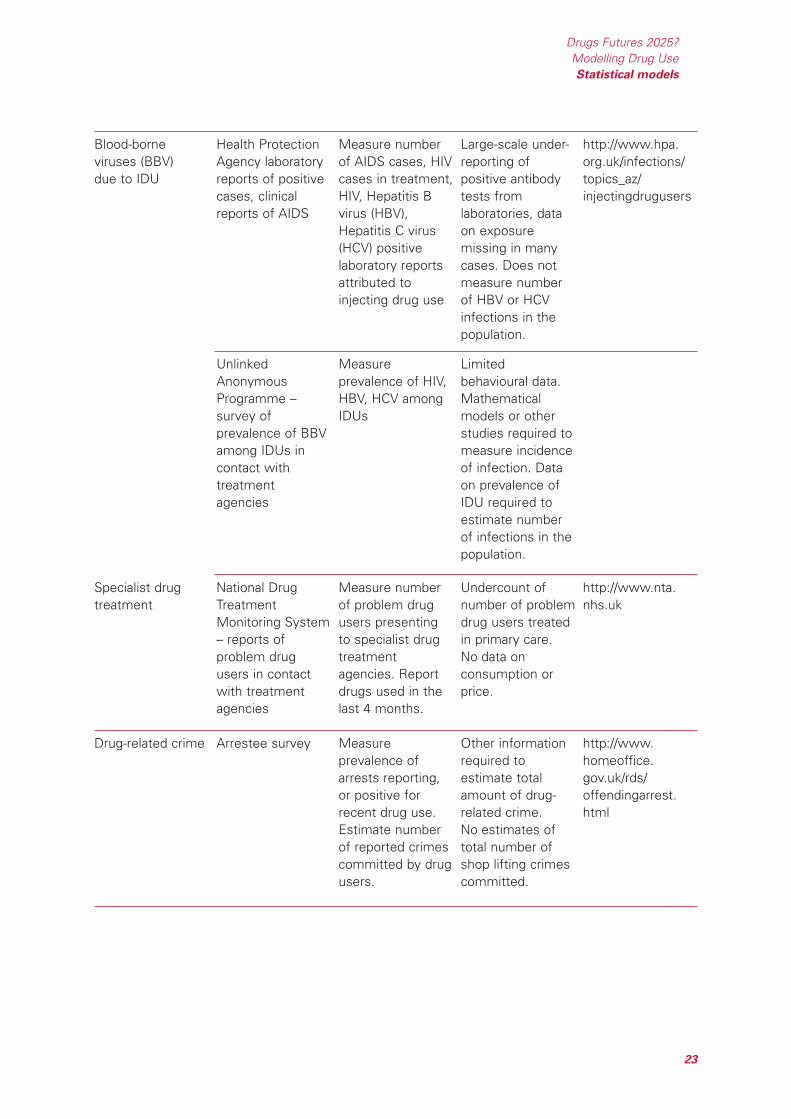
Table 5 outlines some of the data sources available. There are notable absenteesfrom the list. The UK has no ongoing data on the distribution of syringes29, the drug-related mortality rate30, prices and the consumption of drugs, emergency room visitsfor drug-related problems, or the prevalence and incidence of problem drug use.We do not know whether current policies are having an impact on reducing the riskof death among IDUs or what the optimal level of substitution treatment and otherinterventions might be to minimise drug-related mortality. This could be addressedwith a combination of epidemiological and modelling work. Further, we are missingunbiased estimates of a number of parameters, including the probability of arrest,ratio of light to heavy users, and the probability of treatment.
There is already substantial investment in drug-related information and surveillance.Investment in brand-new information systems is unlikely. What is missing,therefore, is an overarching strategy that can make the best of what data arecollected, and to consider modifying existing data sources to provide added value.Some specific suggestions would include:
Establish ongoing record linkage between criminal justice and health data sources:
a Provide raw material for estimating the prevalence of opiate and crack-cocaineuse.
b Generate ongoing prevalence estimates for use in modelling.
c Introduce recording of key event histories to multiple routine data sources,such as frequency and date of last arrest, treatment, imprisonment, HIV/HCVantibody test, overdose managed at A&E, hostel stay.
d Combine the information to allow 'unbiased' estimates of the probability ofthese events among problem drug users, which can be monitored over time.
e Provide raw material for other indirect estimations of prevalence
f Provide parameters for models of the flow of problem drug users from onset,to arrest, imprisonment, treatment etc. and allow scenarios to be tested, forinstance, on the potential impact of reducing time from onset to firsttreatment, increasing arrest.
Establish new records of linkage and cohort studies to estimate mortality rates(based on existing data sources linked to the Office for National Statistics) ofproblem drug users over time:
a Monitor drug-related mortality and whether prevention strategies have beeneffective in reducing the risk of death and the number of deaths
b Estimate and monitor the Standardised Mortality Ratio of problem drug userscompared to the general population, and Population Attributable Fraction ofdrug-related mortality.
Drugs Futures 2025?Modelling Drug UseStatistical models
20
c Provide key parameter for estimating incidence and prevalence of opiate useover time.
d Provide data for the modelling of drug-related mortality and what impactdifferent strategies might have on reducing the number and risk of drug-relateddeaths.
Link questions on population surveys with routine data sources on problem drugusers such as the probability of arrest and treatment, and the frequency andconsumption of the drug:
a Provide parameters for combining direct and indirect estimations of cocaineuse, and other more frequent types of drug use including that ofamphetamine, MDMA.
b Establish trends for models of drug use in the population.
Establish and introduce standard questions on drug consumption and price forongoing surveillance and surveys of problem drug users (including specialist drugtreatment, community surveys, and arrestee monitoring):
a Monitor changes in consumption and price of key drugs over time.
b Provide parameters for economic models of the impact of different policieson price and consumption.
These examples build on or adapt existing data sources to provide more informationon prevalence and incidence, and key events or harms during the life course. Theroutine data sources do not constitute an 'early warning system' per se, thoughmisuse of new drugs will be identified if they lead substantial numbers to die,commit crime or seek treatment. The information derived may support estimatesof the occurrence of drug use – such as the trends in opiate use shown above, orcocaine use – but cannot answer questions about what factors might be driving thechange in numbers. To answer these questions requires further research on thecauses of 'problem' drug use.
Many longitudinal studies have focused on the risks and protective factorsassociated with drug initiation, or with problems associated with cannabis use.There is less information on early-life risk, individual vulnerability and environmentalfactors that might increase exposure to drug use, and the onset of problem druguse such as heroin, crack-cocaine use or injecting. This limits any quantitativemodelling work that could be used to model the dynamics of problem drug use, andhow changes in policy that impact on environmental exposure, community andindividual resilience might reduce future incidence and prevalence.
Drugs Futures 2025?Modelling Drug UseStatistical models
21
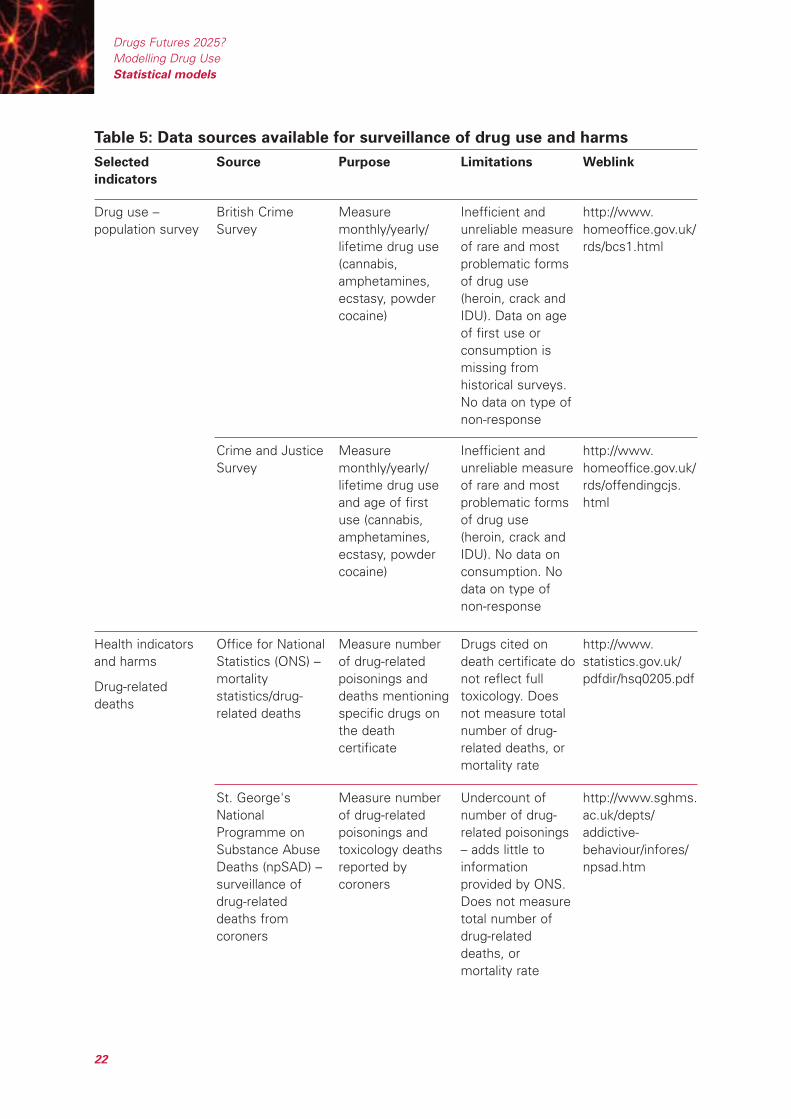
Table 5: Data sources available for surveillance of drug use and harms
St. George'sNationalProgramme onSubstance AbuseDeaths (npSAD) –surveillance ofdrug-relateddeaths fromcoroners
Measure numberof drug-relatedpoisonings andtoxicology deathsreported bycoroners
Undercount ofnumber of drug-related poisonings– adds little toinformationprovided by ONS.Does not measuretotal number ofdrug-relateddeaths, ormortality rate
http://www.sghms.ac.uk/depts/addictive-behaviour/infores/npsad.htm
Health indicatorsand harms
Drug-relateddeaths
Office for NationalStatistics (ONS) –mortalitystatistics/drug-related deaths
Measure numberof drug-relatedpoisonings anddeaths mentioningspecific drugs onthe deathcertificate
Drugs cited ondeath certificate donot reflect fulltoxicology. Doesnot measure totalnumber of drug-related deaths, ormortality rate
http://www.statistics.gov.uk/pdfdir/hsq0205.pdf
Crime and JusticeSurvey
Measuremonthly/yearly/lifetime drug useand age of firstuse (cannabis,amphetamines,ecstasy, powdercocaine)
Inefficient andunreliable measureof rare and mostproblematic formsof drug use(heroin, crack andIDU). No data onconsumption. Nodata on type ofnon-response
http://www.homeoffice.gov.uk/rds/offendingcjs.html
Drug use –population survey
British CrimeSurvey
Measuremonthly/yearly/lifetime drug use(cannabis,amphetamines,ecstasy, powdercocaine)
Inefficient andunreliable measureof rare and mostproblematic formsof drug use(heroin, crack andIDU). Data on ageof first use orconsumption ismissing fromhistorical surveys.No data on type ofnon-response
http://www.homeoffice.gov.uk/rds/bcs1.html
Selected
indicators
Source Purpose Limitations Weblink
Drugs Futures 2025?Modelling Drug UseStatistical models
22
Drug-related crime Arrestee survey Measureprevalence ofarrests reporting,or positive forrecent drug use.Estimate numberof reported crimescommitted by drugusers.
Other informationrequired toestimate totalamount of drug-related crime.No estimates oftotal number ofshop lifting crimescommitted.
http://www.homeoffice.gov.uk/rds/offendingarrest.html
Specialist drugtreatment
National DrugTreatmentMonitoring System– reports ofproblem drugusers in contactwith treatmentagencies
Measure numberof problem drugusers presentingto specialist drugtreatmentagencies. Reportdrugs used in thelast 4 months.
Undercount ofnumber of problemdrug users treatedin primary care.No data onconsumption orprice.
http://www.nta.nhs.uk
UnlinkedAnonymousProgramme –survey ofprevalence of BBVamong IDUs incontact withtreatmentagencies
Measureprevalence of HIV,HBV, HCV amongIDUs
Limitedbehavioural data.Mathematicalmodels or otherstudies required tomeasure incidenceof infection. Dataon prevalence ofIDU required toestimate numberof infections in thepopulation.
Blood-borneviruses (BBV)due to IDU
Health ProtectionAgency laboratoryreports of positivecases, clinicalreports of AIDS
Measure numberof AIDS cases, HIVcases in treatment,HIV, Hepatitis Bvirus (HBV),Hepatitis C virus(HCV) positivelaboratory reportsattributed toinjecting drug use
Large-scale under-reporting ofpositive antibodytests fromlaboratories, dataon exposuremissing in manycases. Does notmeasure numberof HBV or HCVinfections in thepopulation.
http://www.hpa.org.uk/infections/topics_az/injectingdrugusers
Drugs Futures 2025?Modelling Drug UseStatistical models
23
References for Section 2
1. Everingham S, Rydell C. Modelling the Demand for Cocaine. RAND; 1994.
2. Caulkins J, Behrens D, Knoll C, Tragler G, Zuba D. Markov Chain Modelling ofInitiation and Demand: The Case of the US Cocaine Epidemic. Health CareManagement Science 2004, 7:319–329.
3. Law MG, Dore GJ, Bath N, Thompson S, Crofts N, Dolan K, et al. ModellingHepatitis C Virus Incidence, Prevalence and Long-Term Sequelae in Australia,2001. Int J Epidemiol 2003, 32:717–724.
4. Murray JM, Law MG, Gao Z, Kaldor JM. The Impact of Behavioural Changeson the Prevalence of HIV and Hepatitis C among Injecting Drug Users.International Journal of Epidemiology 2003, 32:708–714.
5. Vickerman P, Watts CH. The Impact of an HIV Prevention Intervention forInjecting Drug Users in Svetlogorsk, Belarus: Model Predictions. InternationalJournal of Drug Policy 2002, 13:149–164.
6. Kumaranayake L, Vickerman P, Walker D, Samoshkin S, Romantsov V,Emelyanova Z, et al. The Cost-Effectiveness of HIV Preventive Measuresamong Injecting Drug Users in Svetlogorsk, Belarus. Addiction 2004,99:1565–1576.
7. Aust R, Sharp C, Goulden C. Prevalence of Drug Use: Key Findings from the2001/2002 British Crime Survey. Findings 182. London: Home OfficeResearch, Development and Statistics Directorate; 2002.
8. Hope V, Hickman M, Tilling K. Capturing Crack-Cocaine Use: Estimating thePrevalence of Crack-Cocaine Use in London using Capture-Recapture withCovariates. Addiction in review.
9. Hickman M, Taylor C, Chatterjee A, Degenhardt L, Frischer M, Hay G, et al.Estimating Drug Prevalence: Review of Methods with Special Reference toDeveloping Countries. UN Bulletin on Narcotics 2003, 54:15–32.
10. Johnson EA. Trends in the Incidence of Drug Use in the US. SAMHSA; 1996.
11. ONDCP. What America's Users Spend on Illegal Drugs. 2001.
12. Hickman M, Higgins V, Hope VD, Bellis M, Tilling K, Walker A, et al. InjectingDrug Use in Brighton, Liverpool, and London: Best Estimates of Prevalenceand Coverage of Public Health Indicators. Journal of Epidemiology andCommunity Health 2004, 58:766–771.
13. Domingo Salvany A, Hartnoll R, Maguire A, Suelves J, Anto J. Use ofCapture–Recapture to Estimate the Prevalence of Opiate Addiction inBarcelona, Spain. American Journal of Epidemiology 1995, 141:567–574.
Drugs Futures 2025?Modelling Drug UseStatistical models
24
14. Mastro T, Kitayaporn D, Weniger B, Vanichseni S, Laosunthron V, ThongchaiU, et al. Estimating the Number of HIV-Infected Injecting Drug Users inBangkok: A Capture-Recapture Method. American Journal of Epidemiology1994, 84:1094–1099.
15. Hser Y. Population Estimates of Intravenous Drug Users and HIV Infection inLos Angeles County. Int J Addict 1993, 28:695–709.
16. Larson A, Stevens A, Wardlaw G, 823–831 ISSM. Indirect Estimates of'Hidden' Populations: Capture-Recapture Methods to Estimate the Numbersof Heroin Users in the Australian Capital Territory. Social Science andMedicine 1994, 39:823–831.
17. Platt L, Hickman M, Rhodes T, Mikhailova L, Karavashkin V, Vlasov A, et al.The Prevalence of Injecting Drug Use in a Russian City: Implications for HarmReduction and Coverage. Addiction 2004, 99:1430–1438.
18. Hook E, Regal R. Capture-Recapture Methods in Epidemiology: Methods andLimitations. Epidemiologic Reviews 1995, 17:243–264.
19. Brookmeyer R, Gail M. AIDS Epidemiology: A Quantitative Approach. Oxford:Oxford University Press; 1994.
20. De Angelis D, Hickman M, Yang S. Estimating Long-Term Trends in theIncidence and Prevalence of Opiate/Injecting Drug Use and the Number of Ex-Users: The Use of Back-Calculation Methods and Opiate Overdose Deaths.American Journal of Epidemiology 2004, 160:994–1004.
21. MacCoun R, Reuter P. Drug War Heresies: Learning from Other Vices, Times,and Places. Cambridge: Cambridge University Press; 2001.
22. Institute of Medicine. Pathways of Addiction: Opportunities in Drug AbuseResearch. Washington: National Academy Press; 1996.
23. Hall W, Pacula R. Cannabis Use and Dependence: Public Health and PublicPolicy: Cambridge University Press; 2003.
24. English D, Holman C, Milne E, et al. The Quantification of Drug CausedMorbidity and Mortality in Australia, 1995. Canberra: CommonwealthDepartment of Human Services and Health; 1995.
25. Bargagli A, Hickman M, Davoli M, Perucci C, Schifano P, Buster M, et al.Drug-Related Mortality and its Impact on Adult Mortality in Eight EuropeanCountries. European Journal of Public Health in press.
26. Arseneault L, Cannon M, Witton J, Murray R. Causal Association betweenCannabis and Psychosis: Examination of the Evidence. Br J Psychiatry 2004,184:110–117.
Drugs Futures 2025?Modelling Drug UseStatistical models
25
27. Macleod J, Oakes R, Copello A, Crome I, Egger M, Hickman I, et al. ThePsychosocial Consequences of Use of Cannabis and Other Illicit Drugs:Systematic Review of Longitudinal, General Population Studies. Lancet 2004,363:1579–1588.
28. National Research Council. Informing America's Policy on Illegal Drugs: WhatWe Don't Know Keeps Hurting US. Washington, DC: National AcademyPress; 2001.
29. Parsons J, Hickman M, Turnbull PJ, McSweeney T, Stimson GV, Judd A, et al.Over a Decade of Syringe Exchange: Results from 1997 UK Survey. Addiction2002, 97:845–850.
30. Hickman M, Carnwath Z, Madden P, Farrell M, Rooney R, Ashcroft R, et al.Mortality and Fatal Overdose Risk – Pilot Cohort Study of Heroin UsersRecruited from Specialist Drug Treatment Sites in London. Journal of UrbanHealth 2003, 90:274–287.
31. McKeganey N, Neale J, Lloyd C, Hay G. Sociology and Substance Use.Foresight Brain Science, Addiction and Drugs Project State of ScienceReview. June 2005.
Drugs Futures 2025?Modelling Drug UseStatistical models
26
27
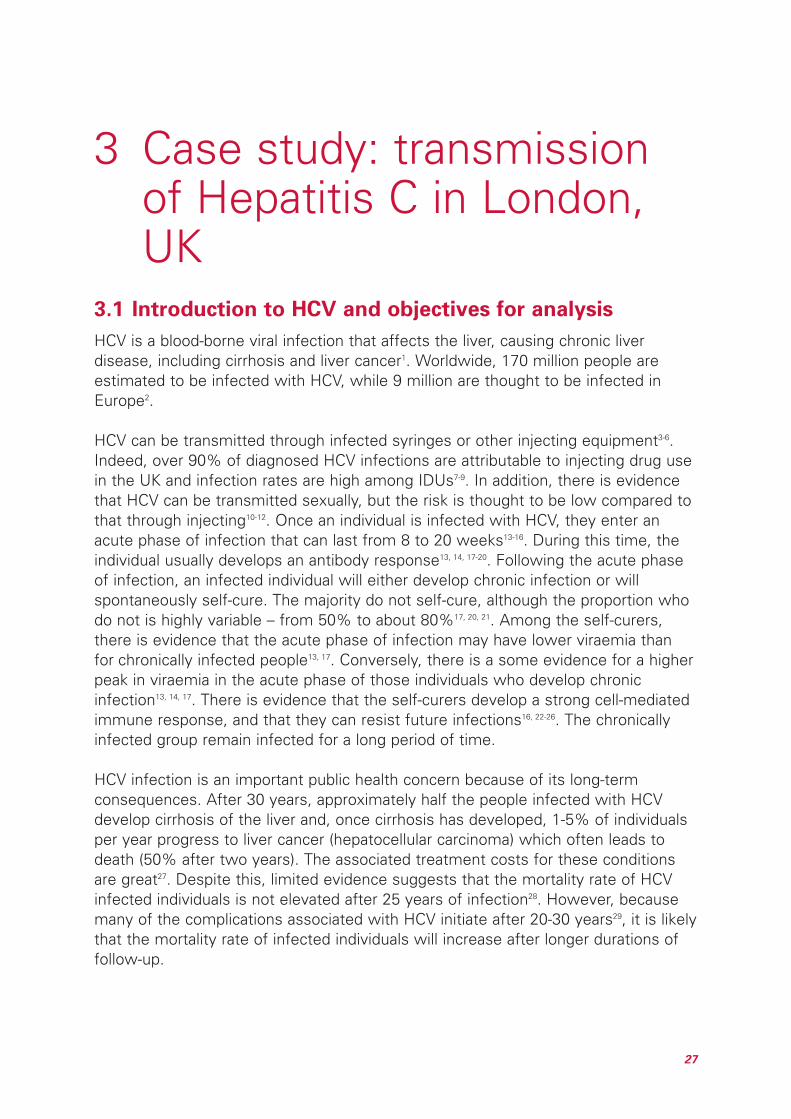
3.1 Introduction to HCV and objectives for analysis
HCV is a blood-borne viral infection that affects the liver, causing chronic liverdisease, including cirrhosis and liver cancer1. Worldwide, 170 million people areestimated to be infected with HCV, while 9 million are thought to be infected inEurope2.
HCV can be transmitted through infected syringes or other injecting equipment3-6.Indeed, over 90% of diagnosed HCV infections are attributable to injecting drug usein the UK and infection rates are high among IDUs7-9. In addition, there is evidencethat HCV can be transmitted sexually, but the risk is thought to be low compared tothat through injecting10-12. Once an individual is infected with HCV, they enter anacute phase of infection that can last from 8 to 20 weeks13-16. During this time, theindividual usually develops an antibody response13, 14, 17-20. Following the acute phaseof infection, an infected individual will either develop chronic infection or willspontaneously self-cure. The majority do not self-cure, although the proportion whodo not is highly variable – from 50% to about 80%17, 20, 21. Among the self-curers,there is evidence that the acute phase of infection may have lower viraemia thanfor chronically infected people13, 17. Conversely, there is a some evidence for a higherpeak in viraemia in the acute phase of those individuals who develop chronicinfection13, 14, 17. There is evidence that the self-curers develop a strong cell-mediatedimmune response, and that they can resist future infections16, 22-26. The chronicallyinfected group remain infected for a long period of time.
HCV infection is an important public health concern because of its long-termconsequences. After 30 years, approximately half the people infected with HCVdevelop cirrhosis of the liver and, once cirrhosis has developed, 1-5% of individualsper year progress to liver cancer (hepatocellular carcinoma) which often leads todeath (50% after two years). The associated treatment costs for these conditionsare great27. Despite this, limited evidence suggests that the mortality rate of HCVinfected individuals is not elevated after 25 years of infection28. However, becausemany of the complications associated with HCV initiate after 20-30 years29, it is likelythat the mortality rate of infected individuals will increase after longer durations offollow-up.
3 Case study: transmissionof Hepatitis C in London,UK

Currently, there is no vaccine for HCV, but treatment is available and increasinglyeffective, with over 50% clearing the virus. However, current treatment regimes areexpensive and long-term, lasting 6-12 months29. Indeed, the cost of treatment orcare for an individual with chronic HCV infection is estimated to be €750 million forthe European Union, and €100 million for the UK27. This emphasises the financialimportance of preventing the transmission of HCV among IDUs.
In this analysis, a mathematical model for the transmission of HCV is developed fora specific setting (London, UK) to look at the impact of different preventionactivities. The model is used to explore what factors affect the transmission of HCVin this setting, to estimate the proportion of IDUs that self-cure, and to explore therelationship between the endemic HCV sero-prevalence of an IDU population andthe rate of syringe sharing. The model builds on previous studies that havedeveloped mathematical models of the epidemiology of HCV30, or have estimatedthe impact of harm-reduction interventions on HCV transmission31. Our analysisfurther illustrates, as did the study by Pollack (2001), how models can be used toguide policy. The strength of this analysis lies in the use of data from a specificsetting, so the conclusions are directly relevant to policy makers from that setting.However, the analysis should be seen as preliminary, to illustrate how modelling canbe used, and to highlight the implications of data uncertainty. Lastly,recommendations are made with regard to how the modelling could be takenforward to answer relevant policy questions, and suggestions are made on how toimprove data collection to increase the accuracy of the modelling.
The basic methods and results and a full discussion of the findings are included inSection 3.4.
3.2 Methods
3.2.1 Background to study population
The prevalence and incidence of HCV among IDUs in London is high, with theprevalence of HCV being 53% in 200332, and the incidence of HCV being 41.8%among new IDUs for 2001-200333. Indeed, there is evidence that the prevalence ofHCV has increased recently, possibly due to an increase in syringe sharing32,especially among newer injectors33, and an increase in crack injecting33. In contrast,the prevalence of HIV among IDUs in London is low, 2.9% in 200332.
IDUs in London inject on average 700 times per year. However, syringe distributiondoes occur, with each IDU receiving on average 143 new syringes each year34. Eachsyringe is used a mean frequency of 3.5 times before disposal (median is 1.5times). While 33% of IDUs report syringe sharing in the last month, 66% reporthaving shared at least once in their life. The risk behaviour of IDUs in London issummarised in Table 6.
Drugs Futures 2025?Modelling Drug UseCase study: transmission of Hepatitis C in London, UK
28
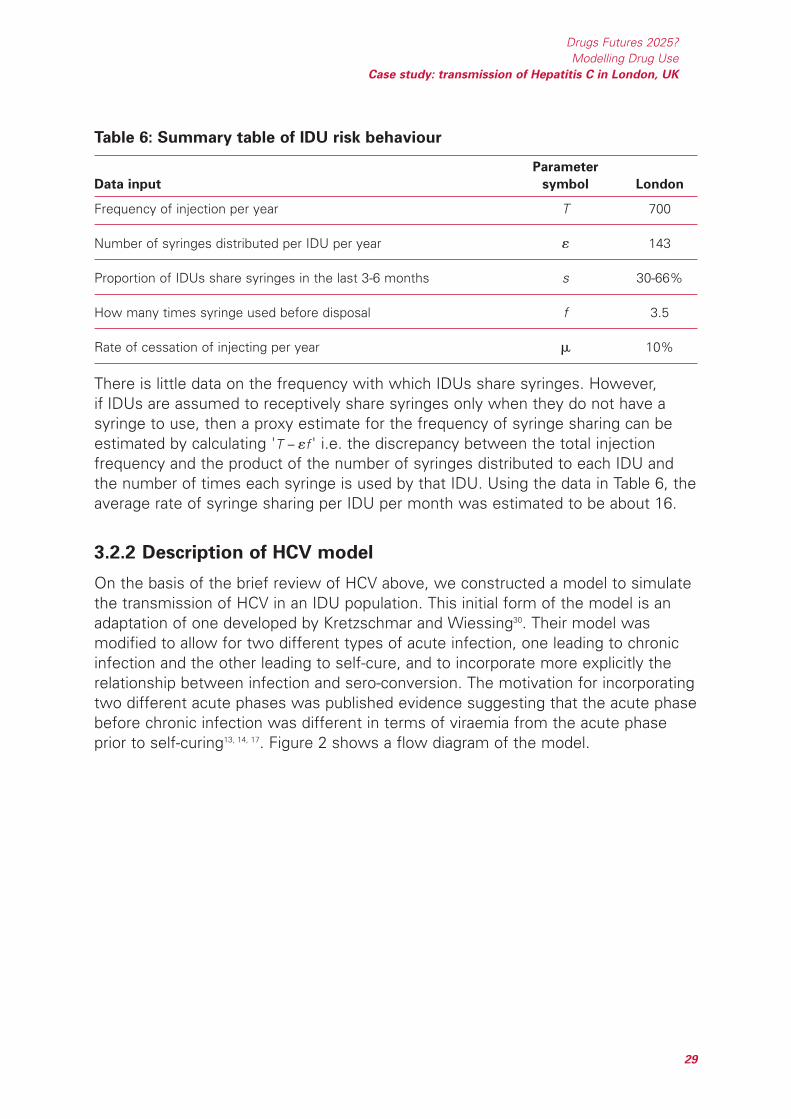
Table 6: Summary table of IDU risk behaviour
Parameter
Data input symbol London
Frequency of injection per year T 700
Number of syringes distributed per IDU per year 143
Proportion of IDUs share syringes in the last 3-6 months s 30-66%
How many times syringe used before disposal f 3.5
Rate of cessation of injecting per year 10%
There is little data on the frequency with which IDUs share syringes. However,if IDUs are assumed to receptively share syringes only when they do not have asyringe to use, then a proxy estimate for the frequency of syringe sharing can beestimated by calculating 'T – f ' i.e. the discrepancy between the total injectionfrequency and the product of the number of syringes distributed to each IDU andthe number of times each syringe is used by that IDU. Using the data in Table 6, theaverage rate of syringe sharing per IDU per month was estimated to be about 16.
3.2.2 Description of HCV model
On the basis of the brief review of HCV above, we constructed a model to simulatethe transmission of HCV in an IDU population. This initial form of the model is anadaptation of one developed by Kretzschmar and Wiessing30. Their model wasmodified to allow for two different types of acute infection, one leading to chronicinfection and the other leading to self-cure, and to incorporate more explicitly therelationship between infection and sero-conversion. The motivation for incorporatingtwo different acute phases was published evidence suggesting that the acute phasebefore chronic infection was different in terms of viraemia from the acute phaseprior to self-curing13, 14, 17. Figure 2 shows a flow diagram of the model.
Drugs Futures 2025?Modelling Drug Use
Case study: transmission of Hepatitis C in London, UK
29

Figure 2: Flow diagram for HCV transmission model
Arrows portray possible transformations of susceptible or infected IDUs, and theparameters next to these arrows are the rate of flow per capita between thesestates.
The IDU population is divided into those who are susceptible to HCV infection (x),those who are recently HCV infected and are in the initial acute phase of infection(h), and those who have progressed into the chronic phase of infection (y) or havebecome immune (z). IDUs are assumed to share syringes at a constant rate andsusceptibles are infected at a per capita rate π, dependent on the number of IDUsthey share syringes with, and the proportion who are in the acute or chronic phaseof infection. The simple assumption regarding syringe sharing was made becauseof the lack of detailed data on syringe-sharing patterns among IDUs in London.All susceptibles who become infected progress to the acute phase of infection.However, a proportion are assumed to progress to the acute phase that leads toself-curing, and the remainder '1 – ' progress to the acute phase that develops intochronic infection. The duration of the different acute phases is 1/, with a subscript1 denoting those that develop chronic infection and a subscript 2 denoting self-curers. The chronically infected are assumed to remain infected until death.Self-curers are assumed to remain immune for life, but may sero-revert after anaverage duration 1/ 26, 35-37.
For simplicity, we have not included behavioural heterogeneity in the initial versionof the model, or allowed for the sexual transmission of HIV because it is not
Transmission probability=B1
Force of infection:Π=(B1h1+B2h2+B3y)/N
Duration of antibody response
Transmission probability=B2
Transmission probability=B3
Acute phaseh1
Chronic phase y
Acute phaseh2
Susceptiblex
Immune with Ab z1
Immune with Ab z2
Πδ
Π(1−δ)σ1
σ2
η
Drugs Futures 2025?Modelling Drug UseCase study: transmission of Hepatitis C in London, UK
30

thought to be a substantial risk10-12. The model in Figure 3 is defined by the followingdifferential equations:
Equation 1
IDUs leave the population at a per capita rate µ due to death or if they stopinjecting, and new susceptible IDUs are recruited at a constant rate . The force ofinfection is dependent on the number of IDUs in the acute and chronic phase ofHCV infection, the probability of HCV transmission per syringe- or equipment-sharing incident for each phase of infection, and the injection-equipment sharingbehaviour of the IDUs:
Equation 2
where m is the number of syringe-sharing partners they have per month, n is thenumber of times they receptively share a syringe with each of these partners, andi is the HCV transmission probability per syringe-sharing act. N is the size of theIDU population.
3.2.3 Biological parameters for the model
Following a review of the literature, estimates were obtained for the biologicalparameters required by the model. Due to the large degree of variation in differentestimates for specific parameters, uncertainty ranges were produced for each.Table 7 shows the model parameter uncertainty ranges. The rate of leaving thepopulation (µ) was assumed to be the sum of the rates of overdose, sepsis and rateof cessation (about 10% per year). For simplicity, the rate of recruitment of newIDUs () was assumed to be equal to the rate of leaving.
[ ] ( )( )nii mBwhereyBBhBhN
βπ −−=++= 11,1
32211
( )
( ) ( )
( )
( )
212
1221
11
222
111 1
zzdt
dz
zhdt
dz
yhdt
dy
hxdt
dh
hxdt
dh
xdtdx
µη
ηµσ
µσ
µσδπ
µσδπ
µπ
−=
+−=
−=
+−=
+−−=
+−Ω=
Drugs Futures 2025?Modelling Drug Use
Case study: transmission of Hepatitis C in London, UK
31

Table 7: Biological parameter values for HCV model
Model parameter Parameter Parameter Specific
definition notation range used estimates References
3
1/3
2/3
1/1
1/2
[21]
[19]
[41]
[20]
[40]
[18]
[13]
[17]
45%
20%
29%
66%
30%
52%
33%
18%
18–66%Proportion ofthoseinfected whoself-cure
Transfusiondata
HCVinfections
withsymptoms
IDUs with nosymptoms
[13]
[18]
[19]
[39]
[40]
[20]
[41]
[15]
[16]
8 weeks
12 weeks
6 weeks
16 weeks
12 weeks
11 weeks
~8 weeks
8–24 weeks
8–22 weeks
6–24 weeksDuration of acute phaseamong self-curers
[13]
[14]
8–16 weeks
~8 weeks
8–16 weeksDuration of acute phaseamong non-self-curers (initialpeak of virus)
[17]
[13]
[18]
~10 times lower
~23% lower
No difference
0.1–1Ratio of initial viraemia peakto viraemia in chronic phasefor self-curers
[17]
[13]
[14]
No difference inviraemia
~3 times higher
>10 times higher
1–10Ratio of initial peak ofviraemia to viraemia inchronic phase
Ratio ofepidemiological data(see Appendix)
For hollow-bore deepinjections [3]
Meta analysis ofneedle-stick risk [38]
Centre for DiseaseControl reviews
1.63*HIVtransmissionprobability
1.32%
2.2%
1.8%
1.32–2.2%Transmission probability persyringe-sharing act inchronic infection phase
Drugs Futures 2025?Modelling Drug UseCase study: transmission of Hepatitis C in London, UK
32
Model parameter Parameter Parameter Specific
definition notation range used estimates References
1/
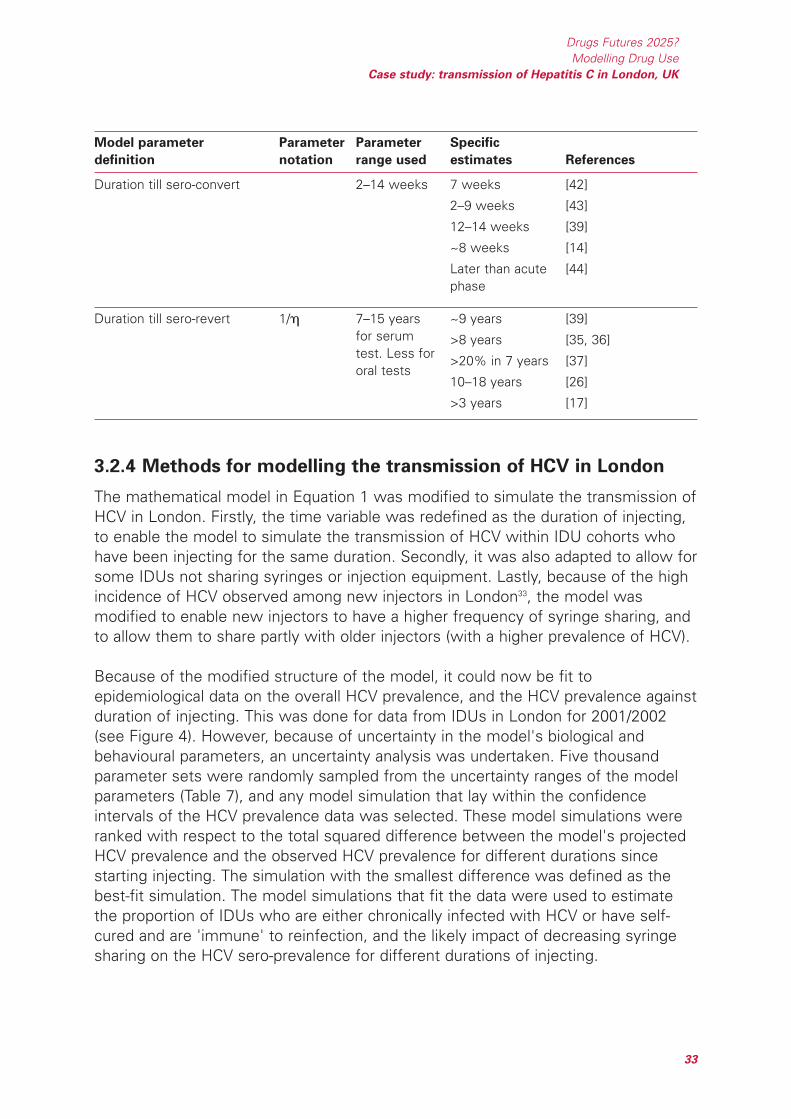
3.2.4 Methods for modelling the transmission of HCV in London
The mathematical model in Equation 1 was modified to simulate the transmission ofHCV in London. Firstly, the time variable was redefined as the duration of injecting,to enable the model to simulate the transmission of HCV within IDU cohorts whohave been injecting for the same duration. Secondly, it was also adapted to allow forsome IDUs not sharing syringes or injection equipment. Lastly, because of the highincidence of HCV observed among new injectors in London33, the model wasmodified to enable new injectors to have a higher frequency of syringe sharing, andto allow them to share partly with older injectors (with a higher prevalence of HCV).
Because of the modified structure of the model, it could now be fit toepidemiological data on the overall HCV prevalence, and the HCV prevalence againstduration of injecting. This was done for data from IDUs in London for 2001/2002(see Figure 4). However, because of uncertainty in the model's biological andbehavioural parameters, an uncertainty analysis was undertaken. Five thousandparameter sets were randomly sampled from the uncertainty ranges of the modelparameters (Table 7), and any model simulation that lay within the confidenceintervals of the HCV prevalence data was selected. These model simulations wereranked with respect to the total squared difference between the model's projectedHCV prevalence and the observed HCV prevalence for different durations sincestarting injecting. The simulation with the smallest difference was defined as thebest-fit simulation. The model simulations that fit the data were used to estimatethe proportion of IDUs who are either chronically infected with HCV or have self-cured and are 'immune' to reinfection, and the likely impact of decreasing syringesharing on the HCV sero-prevalence for different durations of injecting.
[39]
[35, 36]
[37]
[26]
[17]
~9 years
>8 years
>20% in 7 years
10–18 years
>3 years
7–15 yearsfor serumtest. Less fororal tests
Duration till sero-revert
[42]
[43]
[39]
[14]
[44]
7 weeks
2–9 weeks
12–14 weeks
~8 weeks
Later than acutephase
2–14 weeksDuration till sero-convert
Drugs Futures 2025?Modelling Drug Use
Case study: transmission of Hepatitis C in London, UK
33

3.3 Results
3.3.1 General model projections for London
Among the model simulations from the uncertainty analysis, 134 of them fit all theHCV prevalence data. The best-fit simulation and observed HCV prevalence data isshown in Figure 3. The model simulation shows a reasonable fit to data, except itdoes not accurately simulate the observed decreases in HCV prevalence amongIDUs injecting for 30 months or longer than 70 months. However, the significanceof these two decreases in HCV prevalence is ambiguous because data from otheryears in London do not show the same trends.
Figure 3: Observed and model 'best fit' HCV prevalence among IDUs for
different durations of injecting
The different model simulations that fit the HCV prevalence data project that amongIDUs who have injected for 8 years or less, 31% (18%-43%) are infected with HCV,24% (7-38%) have had a self-cured HCV infection (and are assumed to be immune),and 45% (33-58%) are susceptible. This is in a population with an estimated HCVsero-prevalence of 44% (37-46%). Among IDUs who have been injecting for longer,the prevalence of infection and self-curers is higher. For example, among IDUs whohave been injecting for 16 years, 37% (23-50%) and 31% (9-54%) of them areinfected and self-cured respectively. Interestingly, the model projects that theproportion of sero-positive IDUs who are infected varies considerably with theduration of injecting (see Figure 4 for the projections using the best-fit simulation).This is due to some self-curers sero-reverting, and is likely to be more pronouncedin our projections because the sero-reversion rate was assumed to be higher
0
20
40
60
80
0 20 40 60 80 100
Duration of injecting in months
HC
V p
reva
lenc
e (%
)
Observed prevalence Best fit model prevalence
Drugs Futures 2025?Modelling Drug UseCase study: transmission of Hepatitis C in London, UK
34

(average duration till sero-reversion was five years in the best-fit simulation)because antibodies were tested in oral fluids, not serum45. This result implies thatcare should be taken in estimating the proportion of HCV infections that self-curefrom the proportion of sero-positive individuals who are not HCV RNA positive.
Figure 4: Percentage of antibody-positive IDUs who are infected
3.3.2 Uncertainty analysis
Although only a small proportion of the model simulations fit the HCV prevalencedata, they fit the data over a wide range of parameter values, with most parametersvarying across their full uncertainty range. However, from analysing the behaviouralparameter values for the simulations that fit the epidemiological data, they seemto suggest that IDUs have a greater frequency of syringe sharing when they startinjecting (2.5 times greater in first six months), and some new injectors are likelyto share with older IDUs. The reason for the constraints on these behaviouralparameters is due to the rapid increase in HCV prevalence observed shortly afterIDUs initiate injecting (Figure 3). Both these phenomena have been observed inother IDU populations6. However, care should be taken in drawing strongconclusions from this result because the high incidence of HCV among newinjectors could be due to other factors not included in the model. These are likely toinclude the attribute that some IDUs may have a much higher frequency of syringesharing resulting in them becoming infected soon after starting to inject. This andother possible factors will be analysed in future studies, and highlight theimportance of collecting better data on the risk behaviour of IDUs as they progressthrough their injecting career. This will reduce the current uncertainty about the risk
50
60
70
80
90
100
0 50 100 150 200 250 300 350 400
Duration of injecting in months
Ab
posi
tive
IDU
s w
ho a
re in
fect
ed (%
)
Drugs Futures 2025?Modelling Drug Use
Case study: transmission of Hepatitis C in London, UK
35
behaviour of new injectors and the reason for the high incidence of HCV amongnew injectors. This would be an important step forward because, as will be seenlater, it has grave implications for the impact of interventions attempting to preventHCV transmission.
Conversely, all the biological parameters vary across their full uncertainty ranges forthe different model fits. This means that, currently, the model simulations that fitthe data have widely different parameter sets. This highlights the importance offurther studies to obtain more precise values for the different biological andbehavioural parameters in Table 6. The importance of this is further highlighted bynoting that, among the model fits, four of the model parameters are heavilycorrelated with each other. These correlations include a strong negative correlationbetween the proportion of new injectors who share with older injectors and theincrease in syringe sharing among new injectors, so, if one of these parameters ishigh, the other has to be low for the model to fit the data, and a positive correlationbetween the proportion of IDUs who share and the proportion of acute infectionsthat self-cure. If one of these parameters is low, the other has to be high for themodel to fit the data.
If better estimates are obtained for some of these behavioural and biologicalparameters, improved estimates for other parameters can be made.
3.3.3 Impact of decreasing syringe sharing in all IDUs
When the best-fit simulation is used to project the impact on the endemic HCVprevalence of decreasing syringe sharing in all IDUs, the predictions in Figure 6 areobtained for IDUs who have been injecting for different durations.
Figure 5 suggests that a modest decrease in syringe sharing will result in anoticeable decrease in the HCV prevalence among IDUs who have been injectingfor less than eight years. However, among IDUs who have been injecting for longerthan this, syringe sharing has to decrease by at least 50% to result in a 20% relativedecrease in HCV prevalence. For example, among IDUs who have been injecting for16 years, syringe sharing has to decrease by nearly 75%, from 16 to 4 receptivesyringe shares per month, to result in a decrease in HCV prevalence from 45% to32%. To reduce the HCV prevalence to a very low level, say less than 5% among allIDUs who have been injecting for 16 years or less, the rate of receptive syringesharing has to decrease to a very low level – less than once a month. It is importantto note that these projected reductions in HCV prevalence (Figure 5) assume thatthe average syringe-sharing rate was at this reduced level when the individualsstarted injecting. For example, the reduction in syringe sharing will have to havebeen sustained for at least eight years to get the reduction in HCV prevalencepredicted for IDUs injecting for eight years.
Drugs Futures 2025?Modelling Drug UseCase study: transmission of Hepatitis C in London, UK
36

Figure 5: Projected endemic HCV prevalence for different syringe-sharing rates
among IDUs who have been injecting for different durations
The initial level of syringe sharing is 16 per IDU per month in London.
Similar trends to those seen in Figure 5 are found for the effect of reducing syringesharing on the proportion of IDUs infected with HCV or self-cured. This shows thatcare should be taken in maintaining any reduction in syringe sharing, because anyreduction in HCV prevalence will coincide with a reduction in the prevalence of self-cured 'immune' IDUs. If there was an increase in syringe sharing, HCV could quicklyspread through the population again.
For the other model fits from the uncertainty analysis, similar predictions are found,with receptive syringe sharing having to decrease to less than two per month toresult in the HCV prevalence decreasing below 5% in all IDUs who have beeninjecting for 16 years or less.
3.3.4 Impact of decreasing syringe sharing in all IDUs except newinjectors
One of the difficulties for IDU harm-reduction interventions is trying to reach newinjectors. This is of great importance for HCV transmission because many IDUsbecome infected with HCV soon after starting to inject (see Figure 3). Theimportance of reaching these new injectors is emphasised in Figure 6, whichcompares the impact of reducing syringe sharing (from 16 receptive syringe sharesper month) among all IDUs with the impact of only reducing sharing among IDUs
0
10
20
30
40
50
60
0 2 4 6 8 10 12 14 16 18
Syringe-sharing rate per month
HC
V p
reva
len
ce (
%)
Duration since initiating injecting:
prevalence over first 8 yrs
prevalence after 8 yrs
prevalence after 16 yrs
prevalence after 30 yrs
Drugs Futures 2025?Modelling Drug Use
Case study: transmission of Hepatitis C in London, UK
37
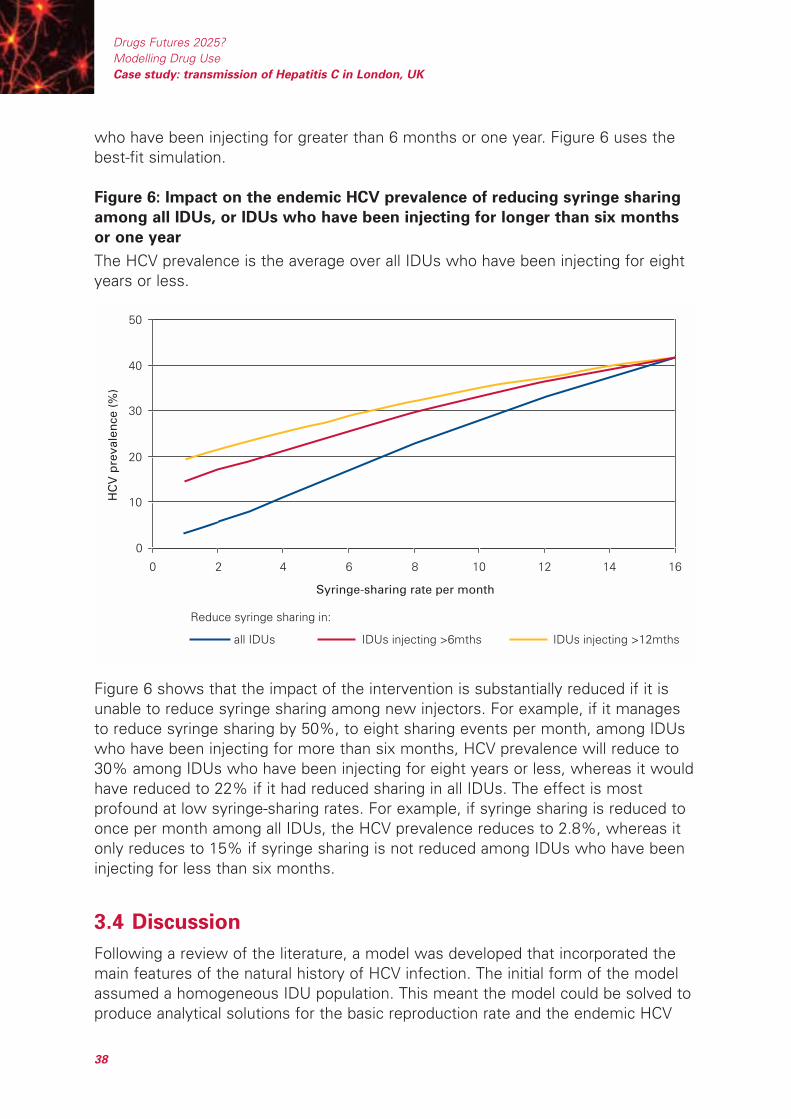
who have been injecting for greater than 6 months or one year. Figure 6 uses thebest-fit simulation.
Figure 6: Impact on the endemic HCV prevalence of reducing syringe sharing
among all IDUs, or IDUs who have been injecting for longer than six months
or one year
The HCV prevalence is the average over all IDUs who have been injecting for eightyears or less.
Figure 6 shows that the impact of the intervention is substantially reduced if it isunable to reduce syringe sharing among new injectors. For example, if it managesto reduce syringe sharing by 50%, to eight sharing events per month, among IDUswho have been injecting for more than six months, HCV prevalence will reduce to30% among IDUs who have been injecting for eight years or less, whereas it wouldhave reduced to 22% if it had reduced sharing in all IDUs. The effect is mostprofound at low syringe-sharing rates. For example, if syringe sharing is reduced toonce per month among all IDUs, the HCV prevalence reduces to 2.8%, whereas itonly reduces to 15% if syringe sharing is not reduced among IDUs who have beeninjecting for less than six months.
3.4 Discussion
Following a review of the literature, a model was developed that incorporated themain features of the natural history of HCV infection. The initial form of the modelassumed a homogeneous IDU population. This meant the model could be solved toproduce analytical solutions for the basic reproduction rate and the endemic HCV
0
10
20
30
40
50
0 2 4 6 8 10 12 14 16
Syringe-sharing rate per month
HC
V p
reva
len
ce (
%)
all IDUs IDUs injecting >6mths IDUs injecting >12mths
Reduce syringe sharing in:
Drugs Futures 2025?Modelling Drug UseCase study: transmission of Hepatitis C in London, UK
38
prevalence. Using basic IDU behavioural data from London, this model was used toexplore the nature of HCV transmission in this setting. However, the model was toosimple to replicate certain aspects of HCV transmission in London.
For the model to portray the observed trends in HCV prevalence against duration ofinjecting, we had to assume that new injectors were more susceptible to infection.Two possible ways this can occur is by either assuming new IDUs share syringesmore than older IDUs, or that there is a core group of higher-frequency syringesharers who become infected soon after initiating injecting. In this initial analysis,we adapted the model to incorporate the first of these possibilities and assumedthat IDUs share more when they have been injecting for less than six months. Thisadaptation of the model could fit the observed HCV prevalence data, but because ofuncertainty in many of the model parameters, numerous model fits were possible.
These model fits were used to explore the relationship between the HCV antibodyprevalence of an IDU population and the likely prevalence of those currently infectedwith HCV and of IDUs who have self-cured. The findings suggested that theprevalence of those infected will be much lower than the HCV antibody prevalencebecause many infected IDUs self-cure, but remain sero-positive for a long timeafter. Indeed, the percentage of sero-positive IDUs who are infected is likely to varywith the duration of injecting. This is due to a higher proportion of those infectedbeing sero-negative among new injectors (in an acute phase of infection), whereas,later, some self-curers sero-revert, increasing the proportion of sero-positive IDUswho are infected. This has implications for estimating the proportion of self-curersfrom the proportion of sero-positive IDUs who do not have the infection, and maypartly explain why there is so much heterogeneity in different estimates for thisparameter (see Table 6). Indeed, for IDUs who have injected for eight years or less,the model predicts that 43.6% of those infected self-cure, but only 30% of sero-positive IDUs are not infected. Depending on what test is used, many self-curersmay not be sero-positive.
The model was also used to explore the impact of increasing the coverage ofcurrent syringe distribution by reducing syringe sharing from its current estimatedlevel of 16 receptive syringe shares per month. If we assume that all IDUs reducetheir syringe sharing, the model suggested that modest reductions in syringesharing will reduce the HCV prevalence in IDUs who have injected for about eightyears. However, among longer-term IDUs (over ten years of injecting), syringesharing has to be reduced substantially before their HCV prevalence reducesnoticeably. In addition, syringe sharing has to become very low for the HCVprevalence to be reduced to 5% or less. This highlights the difficulty in effectivelycontrolling HCV transmission among IDUs.
These results also give insights into how increases in syringe distribution may affectHCV prevalence in London. At best, an increase in syringe distribution will decreasethe frequency of sharing by the number of times that each syringe is safely re-used
Drugs Futures 2025?Modelling Drug Use
Case study: transmission of Hepatitis C in London, UK
39
before disposal. If so, a similar relationship should exist between endemic HCVprevalence and the frequency of syringe distribution, with modest increases havinglittle effect except among newer injectors, and substantial increases being requiredbefore HCV prevalence reduces noticeably among long-standing injectors. However,it is likely that an increase in syringe distribution will also decrease the number oftimes that each syringe is safely re-used46, and so a smaller reduction in syringesharing will result. The implications of this depend on the complex, and largelyunknown, relationship between the level of syringe distribution and the frequencyof syringe sharing and syringe re-use46, 47. More data needs to be collected on thisrelationship to better determine the impact of increases in syringe distribution.
The predictions above assumed that new injectors would reduce their risk behaviourto the same extent as older injectors in response to an increase in syringedistribution. However, it is likely that new injectors will not be reached by outreachservices and so may not reduce their syringe sharing. When this factor wasincorporated into the model simulations, they predicted a much smaller decrease inHCV prevalence for the same decrease in syringe sharing, and suggested thatsyringe sharing would have to be even lower to reduce the HCV prevalence tobelow 5%. This highlights the importance of outreach services reaching all newinjectors, which is not an easy undertaking. However, there is uncertainty overwhether the high HCV incidence among new injectors is due to them having highersyringe-sharing frequencies. If, for example, it is mainly due to a subsection of theIDU population having much higher rates of syringe sharing, outreach serviceswould only have to reach these new injectors to attain nearly the same impact as ifall IDUs were reached. This again highlights the importance of collecting better dataon the risk behaviour of IDUs in London, especially among new injectors and howtheir syringe-sharing patterns change during their injecting career.
3.5 Conclusions
Although the work undertaken so far is preliminary, it gives an idea of the insightsthat this type of modelling can give. It can be used to simulate the transmission ofdifferent diseases associated with drug taking, and estimate the impact of differentintervention strategies. These estimates can be combined with health-treatmentcost data or intervention costs to determine the cost-effectiveness or cost-benefitof different strategies. However, as was the case with this analysis, the insights ofpossible modelling analyses are often limited by data weaknesses, resulting inuncertainty as to the best model structure and the value of some modelparameters.
3.5.1 Dealing with uncertainty in IDU behavioural data
There was uncertainty in the structure of the model because of a lack of data on thepatterns and frequency of syringe sharing, and how it varies within the population
Drugs Futures 2025?Modelling Drug UseCase study: transmission of Hepatitis C in London, UK
40
and with duration of injecting. It was also difficult to estimate the impact of increasesin syringe distribution because there is no data on the relationship between the levelof syringe distribution among different IDUs and the rate of syringe sharing and re-use. It is important that other relevant data sources be compiled and reviewed inorder to collate more data on IDU risk behaviour, specifically on the level of syringesharing. In addition, specific behavioural surveys should be designed and undertakento obtain better data on these aspects of IDU risk behaviour. If this was done, moreaccurate and deeper insights could be obtained.
3.5.2 Dealing with uncertainty in HCV biological data
There were uncertainties in many HCV biological parameters. This resulted in a largenumber of different parameter combinations that produced model fits to the HCVepidemiological data. Some of these will not be valid and so will result in increaseduncertainty in the model predictions. Specific data uncertainties include:
HCV transmission probability for syringe sharing and equipment sharing
the effectiveness of syringe cleaning for HCV
the proportion of acutely infected IDUs who self-cure
the status of protective immunity among IDUs after self-cure.
Better estimates for some of these parameters would improve our modelprojections and indeed our estimation of other parameters, because some of themare highly correlated.
3.5.3 Possible directions for future modelling work
Despite uncertainty in the model structure and the input parameters, the wealth ofepidemiological data available for London and for other cities in the UK means thatmathematical modelling could be used to gain many insights into the factorsaffecting the transmission of HCV among IDUs in the UK. These analyses couldimprove intervention design by helping us understand what factors are important indetermining why some IDU populations have much lower levels of HCVtransmission than others.
The modelling undertaken so far could be extended and improved in a numberof ways:
1. Review other data sources to obtain more data on IDU risk behaviour,specifically on the level of syringe sharing. This would improve the way thatsyringe sharing is represented in the model, and so improve the model'simpact estimates for reductions in syringe sharing and enable it to estimatethe impact of interventions focusing on IDUs with different syringe-sharingbehaviour.
Drugs Futures 2025?Modelling Drug Use
Case study: transmission of Hepatitis C in London, UK
41
2. Incorporate a core group of higher-frequency syringe sharers into the model.This is done for similar reasons to those above, but also to explore whetherthe high incidence among new injectors could be due to a core groupbecoming quickly infected.
3. Extend the analysis to explore the impact of changes in other IDU behaviouralparameters to understand the impact of other types of intervention.Specifically, it would be interesting to estimate the possible impact of:
increases in the cessation of injecting due to methadone treatmentprogrammes
decreases in the recruitment of new IDUs due to active anti-drug publicitycampaigns
increases in the frequency and/or effectiveness of syringe cleaning.
4. Modify the model to incorporate IDUs who have been injecting for differentdurations. This will enable the model to be used to accurately explore theeffect of new IDUs sharing syringes with older IDUs, and to estimate theimpact of interventions targeting new and old injectors.
5. Adapt the model so that it can simulate changes in the cessation orrecruitment rate over time.
6. Fit the model to other HCV prevalence/incidence data for London, such asfrom other years, to obtain better estimates for parameter values and tounderstand the dynamics of HCV infection over time.
7. Use the model to explore what factors determine the differences betweenHCV epidemics in other cities in the UK. This could help us understand whatfactors are protective for HCV infection, giving insights into what to focus onin intervention strategies.
These additional analyses would give important insights and should be given a highpriority.
3.5.4 Recommendations for further data collection
Detailed surveys on the risk behaviour of IDUs need to be undertaken, specificallyfocusing on:
syringe-sharing practices – who people share with and the nature of their sharingnetworks
Drugs Futures 2025?Modelling Drug UseCase study: transmission of Hepatitis C in London, UK
42
the impact of syringe distribution and increases in syringe-distribution coverageon syringe sharing:
– What are the syringe-sharing patterns of IDUs who exchange many syringescompared to those who do not?
– If IDUs are given more syringes, do they just reduce their sharing, or do theystart restricting their sharing to people they know and trust?
– Why do some people exchange fewer syringes than others? What methodscould be used to increase the syringe-exchange rate of these IDUs?
It is also important to emphasise that different data sets need to be comparable.If they are not, it is much harder to discern trends in the data and to use differentdata sets in a modelling analysis. This is important not just over different years forthe same survey, but also for data collected by different institutions.
To fully understand the transmission dynamics of HCV, and to accurately estimatetheir impact on the UK health service and the effectiveness (or cost-effectiveness)of different intervention strategies, in-depth research on specific aspects of HCVepidemiology needs to be undertaken among IDUs:
HCV transmission between IDUs through syringe sharing and equipment sharing.At present, the only HCV transmission estimates are for needle-stick injuries.These are likely to underestimate the HCV transmission probability from needlesharing because greater quantities are frequently involved.
The nature of HCV immunity following self-curing acute HCV infection. Do mostself-cured individuals remain immune to infection, or is the protection partial,short-term, or only for some strains of HCV?
The effectiveness of different methods of syringe cleaning for disinfecting againstHCV. At present, there is only data on the effectiveness of syringe cleaning indisinfecting syringes infected with HIV. These studies need to be replicated forHCV to determine the effectiveness of this possible intervention strategy.
The proportion of those acutely infected who self-cure following HCV infectionfrom syringe and equipment sharing. Our study illustrates the huge uncertainty inthis parameter, and the potential problems in estimating it. Despite this, theestimation of this parameter and the determination of the factors that affect itshould be given a high priority.
Drugs Futures 2025?Modelling Drug Use
Case study: transmission of Hepatitis C in London, UK
43
References for Section 3
1. Wong J, Bennett W, Raymond S, Pauker S. Pretreatment Evaluation ofChronic Hepatitis C. JAMA 1998, 280:2088–2093.
2. WHO. Hepatitis C fact sheet(http://www.who.int/mediacentre/factsheets/fs164/en/). Geneva; 2000.
3. De Carli G, Puro V, Ippolito G. Risk of Hepatitis C Virus Transmission followingPercutaneous Exposure in Healthcare Workers. Infection 2003, 31 Suppl
2:22–27.
4. Thorpe LE, Ouellet LJ, Hershow R, Bailey SL, Williams IT, Williamson J, et al.Risk of Hepatitis C Virus Infection among Young Adult Injecting Drug Userswho Share Injection Equipment. Am J Epidemiol 2002, 155:645–653.
5. Zhou F, Ma ZE, Hu W, Feng ZL, Chen KL, Qin GM, et al. [Study on theRelationship between Hepatitis C Virus Infection and Sharing InjectionEquipment, Sexual Behavior among Injecting Drug Users]. Zhonghua Liu XingBing Xue Za Zhi 2004, 25:329–332.
6. Vidal Trecan GM, Varescon Pousson I, Gagniere B, Tcherny Lessenot S,Madariaga E, Boissonnas A. Association between First Injection RiskBehaviors and Hepatitis C Seropositivity among Injecting Drug Users. AnnMed Interne (Paris) 2002, 153:219–225.
7. Villano SA, Vlahov D, Nelson KE, Lyles CM, Cohn S, Thomas DL. Incidenceand Risk Factors for Hepatitis C among Injecting Drug Users in Baltimore,Maryland. Journal of Clinical Microbiology 1997, 35:3274–3277.
8. Lucidarme D, Bruandet A, Ilef D, Harbonnier J, Jacob C, Decoster A, et al.Incidence and Risk Factors of HCV and HIV Infections in a Cohort ofIntravenous Drug Users in the North and East of France. Epidemiol Infect2004, 132:699–708.
9. Van Ameijden EJ, Van den Hoek JA, Mientjes GH, Coutinho RA. ALongitudinal Study on the Incidence and Transmission Patterns of HIV, HBVand HCV Infection among Drug Users in Amsterdam. Eur J Epidemiol 1993,9:255–262.
10. Sladden TJ, Hickey AR, Dunn TM, Beard JR. Hepatitis C Transmission on theNorth Coast of New South Wales: Explaining the Unexplained. Med J Aust1997, 166:290–293.
11. Roy KM, Goldberg DJ, Hutchinson S, Cameron SO, Wilson K, MacDonald L.Hepatitis C Virus among Self-Declared Non-Injecting Sexual Partners ofInjecting Drug Users. J Med Virol 2004, 74:62–66.
12. Tibbs CJ. Methods of Transmission of Hepatitis C. J Viral Hepat 1995,2:113–119.
Drugs Futures 2025?Modelling Drug UseCase study: transmission of Hepatitis C in London, UK
44
13. Kamal SM, Rasenack JW, Bianchi L, Al Tawil A, El Sayed Khalifa K, Peter T, etal. Acute Hepatitis C Without and With Schistosomiasis: Correlation withHepatitis C-Specific CD4(+) T-Cell and Cytokine Response. Gastroenterology2001, 121:646–656.
14. Yamaguchi K, Tanaka E, Higashi K, Kiyosawa K, Matsumoto A, Furuta S, et al.Adaptation of Hepatitis C Virus for Persistent Infection in Patients with AcuteHepatitis. Gastroenterology 1994, 106:1344–1348.
15. Post JJ, Pan Y, Freeman AJ, Harvey CE, White PA, Palladinetti P, et al.Clearance of Hepatitis C Viremia Associated with Cellular Immunity in theAbsence of Seroconversion in the Hepatitis C Incidence and Transmission inPrisons Study Cohort. J Infect Dis 2004, 189:1846–1855.
16. Lanford RE, Guerra B, Chavez D, Bigger C, Brasky KM, Wang XH, et al.Cross-Genotype Immunity to Hepatitis C Virus. J Virol 2004, 78:1575–1581.
17. Villano SA, Vlahov D, Nelson KE, Cohn S, Thomas DL. Persistence of Viremiaand the Importance of Long-Term Follow-up after Acute Hepatitis C Infection.Hepatology 1999, 29:908–914.
18. Gerlach JT, Diepolder HM, Zachoval R, Gruener NH, Jung MC, UlsenheimerA, et al. Acute Hepatitis C: High Rate of Both Spontaneous and Treatment-Induced Viral Clearance. Gastroenterology 2003, 125:80–88.
19. Hwang SJ, Lee SD, Lu RH, Chu CW, Wu JC, Lai ST, et al. Hepatitis C ViralGenotype Influences the Clinical Outcome of Patients with AcutePosttransfusion Hepatitis C. J Med Virol 2001, 65:505–509.
20. Hofer H, Watkins Riedel T, Janata O, Penner E, Holzmann H, Steindl MundaP, et al. Spontaneous Viral Clearance in Patients with Acute Hepatitis C canbe Predicted by Repeated Measurements of Serum Viral Load. Hepatology2003, 37:60–64.
21. Kenny-Walsh E. Clinical outcomes after Hepatitis C Infection fromContaminated Anti-D Immune Globulin. New England Journal of Medicine1999, 340:1228–1234.
22. Mehta SH, Cox A, Hoover DR, Wang XH, Mao Q, Ray S, et al. Protectionagainst Persistence of Hepatitis C. Lancet 2002, 359:1478–1483.
23. Lauer GM, Barnes E, Lucas M, Timm J, Ouchi K, Kim AY, et al. HighResolution Analysis of Cellular Immune Responses in Resolved andPersistent Hepatitis C Virus infection. Gastroenterology 2004, 127:924–936.
24. Shoukry NH, Grakoui A, Houghton M, Chien DY, Ghrayeb J, Reimann KA, etal. Memory CD8+ T Cells are Required for Protection from PersistentHepatitis C Virus Infection. J Exp Med 2003, 197:1645–1655.
25. Shoukry NH, Cawthon AG, Walker CM. Cell-Mediated Immunity and theOutcome of Hepatitis C Virus Infection. Annu Rev Microbiol 2004, 58:391–424.
Drugs Futures 2025?Modelling Drug Use
Case study: transmission of Hepatitis C in London, UK
45
26. Takaki A, Wiese M, Maertens G, Depla E, Seifert U, Liebetrau A, et al. CellularImmune Responses Persist and Humoral Responses Decrease Two DecadesAfter Recovery from a Single-Source Outbreak of Hepatitis C. Nat Med 2000,6:578–582.
27. Postma MJ, Wiessing L, Jager JC. Updated Healthcare Cost Estimates forDrug-Related Hepatitis C Infections in the European Union. In: Hepatitis C andinjecting Drug Use: Impact, Costs and Policy Options. Jager JC, Limburg W,Kretzschmar M, Postma MJ, Wiessing L (eds). Lisbon: European MonitoringCentre for Drugs and Drug Addiction; 2004: 203–216.
28. Seeff LB, Hollinger FB, Alter HJ, Wright EC, Cain CM, Buskell ZJ, et al. Long-Term Mortality and Morbidity of Transfusion-Associated Non-A, Non-B, andType C Hepatitis: A National Heart, Lung, and Blood Institute collaborativestudy. Hepatology 2001, 33:455–463.
29. Limburg W. Natural History, Treatment and Prevention of Hepatitis C inInjecting Drug Users: An Overview. In: Hepatitis C and Injecting Drug Use:Impact, Costs and Policy Options. Jager JC, Limburg W, Kretzschmar M,Postma MJ, Wiessing L (eds). Lisbon: European Monitoring Centre for Drugsamd Drug Addiction; 2004: 21–40.
30. Kretzschmar M, Wiessing L. Modelling the Transmission of Hepatitis C inInjecting Drug Users. In: Hepatitis C and Injecting Drug Use: Impact, Costsand Policy Options. Jager JC, Limburg W, Kretzschmar M, Postma MJ,Wiessing L (eds). Lisbon: European Monitoring Centre for Drugs and DrugAddiction; 2004.
31. Pollack HA. Cost-Effectiveness of Harm Reduction in Preventing Hepatitis Camong Injecting Drug Users. Med Decis Making 2001, 21:357–367.
32. Health Protection Agency. Shooting Up. Infections among Injecting DrugUsers in the United Kingdom 2003. London; 2004.
33. Judd A, Hickman M, Jones S, McDonald T, Parry JV, Stimson GV, et al.Incidence of Hepatitis C Virus and HIV among New Injecting Drug Users inLondon: Prospective Cohort Study. BMJ 2005, 330:24–25.
34. Hickman M, Higgins V, Hope VD, Bellis M, Tilling K, Walker A, et al. InjectingDrug Use in Brighton, Liverpool, and London: Best Estimates of Prevalenceand Coverage of Public Health Indicators. Journal of Epidemiology andCommunity Health 2004, 58:766–771.
35. Lefrere JJ, Girot R, Lefrere F, Guillaume N, Lerable J, Le Marrec N, et al.Complete or Partial Seroreversion in Immunocompetent Individuals after Self-Limited HCV Infection: Consequences for Transfusion. Transfusion 2004,44:343–348.
Drugs Futures 2025?Modelling Drug UseCase study: transmission of Hepatitis C in London, UK
46
36. Lefrere JJ, Guiramand S, Lefrere F, Mariotti M, Aumont P, Lerable J, et al. Fullor Partial Seroreversion in Patients Infected by Hepatitis C Virus. J Infect Dis1997, 175:316–322.
37. Kondili LA, Chionne P, Costantino A, Villano U, Lo Noce C, Pannozzo F, et al.Infection Rate and Spontaneous Seroreversion of Anti-Hepatitis C Virus duringthe Natural Course of Hepatitis C Virus Infection in the General Population.Gut 2002, 50:693–696.
38. Ross RS, Viazov S, Roggendorf M. Risk of Hepatitis C Transmission fromInfected Medical Staff to Patients: Model-Based Calculations for SurgicalSettings. Arch Intern Med 2000, 160:2313–2316.
39. Farci P, Alter HJ, Wong D, Miller RH, Shih JW, Jett B, et al. A Long-TermStudy of Hepatitis C Virus Replication in Non-A, Non-B Hepatitis. N Engl JMed 1991, 325:98–104.
40. Santantonio T, Sinisi E, Guastadisegni A, Casalino C, Mazzola M, Gentile A, etal. Natural Course of Acute Hepatitis C: A Long-Term Prospective Study. DigLiver Dis 2003, 35:104–113.
41. Spada E, Mele A, Berton A, Ruggeri L, Ferrigno L, Garbuglia AR, et al.Multispecific T Cell Response and Negative HCV RNA Tests during AcuteHCV Infection are Early Prognostic Factors of Spontaneous Clearance. Gut2004, 53:1673–1681.
42. Courouce AM, Le Marrec N, Bouchardeau F, Razer A, Maniez M, Laperche S,et al. Efficacy of HCV Core Antigen Detection During the PreseroconversionPeriod. Transfusion 2000, 40:1198–1202.
43. Logvinoff C, Major ME, Oldach D, Heyward S, Talal A, Balfe P, et al.Neutralizing Antibody Response During Acute and Chronic Hepatitis C VirusInfection. Proc Natl Acad Sci U S A 2004, 101:10149–10154.
44. Garson JA, Tuke PW, Makris M, Briggs M, Machin SJ, Preston FE, et al.Demonstration of Viraemia Patterns in Haemophiliacs Treated with Hepatitis-C-Virus-Contaminated Factor VIII Concentrates. Lancet 1990, 336:1022–1025.
45. Cameron SO, Wilson K, Good T, McMenamin J, McCarron B, Pithie A, et al.Detection of Antibodies Against Hepatitis C Virus in Saliva: A Marker of ViralReplication. Journal of Viral Hepatitus 1999, 6:141–144.
46. Bluthenthal RN, Malik MR, Grau LE, Singer M, Marshall P, Heimer R. SterileSyringe Access Conditions and Variations in HIV Risk Among Drug Injectors inThree Cities. Addiction 2004, 99:1136–1146.
47. Heimer R, Clair S, Teng W, Grau LE, Khoshnood K, Singer M. Effects ofIncreasing Syringe Availability on Syringe-Exchange Use and HIV Risk:Connecticut, 1990–2001. Journal of Urban Health 2002, 79:556–570.
Drugs Futures 2025?Modelling Drug Use
Case study: transmission of Hepatitis C in London, UK
47
48
In this section an agent-based model is developed that uses insights fromethnographic research to investigate the role of social networks, choice and socialinfluence on drug use and on transitions from use to dependence or addiction.Instead of fitting model results to observed data, the agent-based model createshypotheses to be tested against further research in order to take forward ourunderstanding of how drug use may spread within communities.
The model starts with a population of agents connected through social networks.Agents are either non-users, users, or addicts – non-users and users choose to usedrugs if offered on the basis of their attitudes to risk and to taking drugs, which areinfluenced by members of their social network and prior experience. The simulationfollows the evolution of a simulated population and measures the number in thepopulation who remain non-users, use drugs and become addicts, as well aschanges in attitude to drugs. It can also illustrate types of individual histories of druguse that may be compared with existing or future ethnographic work to validate themodel. The model could be developed with additional data to explore othermechanisms. These include changing the probability of having a good experiencefrom using drugs with increased use or facing potential harms associated with use,adding dealing and a drug market, and allowing the dynamic formation of deviantnetworks based on shared attitudes to risk and drug taking. The priority given tothese different developments (or others) could reflect policy interest, synthesis andcollection of ethnographic knowledge, and our ability to generate sensible agentbiographies and aggregate-use statistics that validated the model.
4.1 Description of the DrugChat model
This is an enhanced re-implementation of the DrugTalk model1 written in the LISPprogramming language.ii It is intended to investigate the role of social networks,choice and social influence on drug transitions. It is important to be clear about whatthis model does and does not do and thus how it should be judged. It does notpresent 'best belief' from the literature in all its assumptions. In the time available,
4 Agent-based model:DrugChat case study
ii The original was in the NetLogo language. Replicating a simulation from the published description using adifferent programming language is a very good way both to test the robustness of results andunderstand the programme. More details of the parameter settings used (following Agar's discussionwherever possible) can be found in the Appendix.

calibrating the model in such a way was not feasible.iii So the model cannot beregarded as empirically plausible and its results should not be treated as policyadvice. Instead it makes a complete set of explicit behavioural assumptions abouthow drug use works and shows the dynamic consequences of those assumptions.This is something, for reasons discussed above, that statistical and dynamic modelsdo not, and possibly cannot, do. In some cases, as discussed later, it is necessary tomake untested assumptions because only this modelling technique has been in aposition to draw attention to gaps in our knowledge of the drug-use process,particularly at the behavioural level. However, unlike what happens with statisticaland dynamic models, these untested assumptions are not built in to the approachand could easily be replaced by others established empirically. Gaps in ourknowledge brought to light by the agent-based approach can legitimately be seen asan opportunity rather than a problem.
The model begins with an empirically plausible social network in which a fewagents have many associates but most have a much smaller number. Agents existin three 'types', non-users, users, and addicts. However, unlike statistical and'stocks/flows' modelling the distinctions between these types are not attributes ortransition probabilities but distinctive behaviours and interactions. For example,users and addicts differ in their drug-sharing behaviour while users and non-usersdiffer in the kind of information they transmit about drugs and the amount ofcredibility it has with other agents.
Each cycle of the simulation begins with some 'doses' of the drug being introducedinto the social system by street dealing.iv Addicts will actively seek out such dealsand thus have a high probability of obtaining drugs in each period, but in rather lowquantities, measured in doses.v Users will have some probability (through the kindof company they keep and the places they keep it) to obtain drugs but in somewhatlarger quantities. Non-users have a fairly low chance of encountering street deals.For those still able to choose (users and non-users), the decision about whether totake a drug depends on two cognitive factors, attitude to risk and attitude to drugs.When the value of the 'parameter' for attitude to risk exceeds the 'parameter' forattitude to drugs, the agent will take drugs if they are made available. Theinterpretation of this comparison is that when an agent is badly disposed towardsdrugs, they would have to seem exceedingly safe before they might be taken.By contrast, when the agent is well disposed towards drugs, they are prepared totolerate a greater degree of risk without curtailing drug use. The value of theattitude to risk, based on research in innovation diffusion, is normally distributedaround 50, implying that most people have a 'middling' belief about the risks ofdrugs, while rather fewer have significantly higher or lower perceptions of drugs'
Drugs Futures 2025?Modelling Drug Use
Agent-based model: DrugChat case study
49
iii At the same time, it is based on a model built by someone with many years of ethnographic experienceso it is unlikely that the assumptions chosen are too outlandish.
iv Following Agar, typical populations involve about 500 agents.
v This reflects poverty and other factors such as apparent neediness, appearance and so on.
'riskiness'.vi Attitude to risk is assumed, following the Agar model, to be a fixedcharacteristic of individuals (like a standard statistical attribute). By contrast, attitudeto drugs can change through social interaction. It is initialised at 50 for all agents inthe network reflecting the 'societal view' of a drug prior to widespread experienceof it. This means that initially the population is neither particularly well norparticularly badly disposed to the drug. Each agent has a stock of drugs (the stash)from which they will, in each period, use themselves or share.
In the simplest version of the model, users and addicts are also distinguished bytheir drug-use behaviour. Users will share their stash with individuals they knowwho are willing to try, but keep back at least one dose for personal use in casenobody reciprocates.vii Addicts, by contrast, will not share but use some or all oftheir own stash 'privately' in each period.viii The sharing of drugs by users ('partying')is the main way in which non-users are initiated into use. After drugs have beenshared around, each agent uses some number of doses and evaluates theirexperience. For each dose ingested, there is a probability that the drug will lead to agood experience and another probability that it will lead to bad experience.ix Bothcan occur from the same dose, or neither, reflecting the ambiguous nature of thedrug experience. Agents 'keep count' of all the good and bad experiences they havehad and it is assumed that it makes sense to treat the drug – for now at least – ashaving the same range of effects on everyone. The system also keeps count ofdoses ingested because, after five doses, a user becomes an addict.x In addition,each good and bad experience updates the attitude an agent has to drugs. Theformula for this updating involves adding (1/number of good experiences)20 and(2/number of bad experiences)20 to the current attitude. Early experiences withdrugs change attitudes more than later ones and bad experiences make moreimpression than good ones. Both of these insights are borne out in socialpsychology and experimental economics, with the concept of 'loss aversion'.xi
Drugs Futures 2025?Modelling Drug UseAgent-based model: DrugChat case study
50
vi Both of these parameters have values in the range 0-100.
vii A user is assumed to give out as many doses as they have – keeping one back – as long as they can findassociates willing to use at that moment.
viii In practice, addicts may well share with other addicts but rather seldom with non-addicts. However, thisrefinement will be deferred for reasons discussed later.
ix Following Agar, who is thinking of heroin, the changes for good and bad experiences are 70% and 30%respectively.
x This is Agar's assumption and seems rather deterministic and strong even for heroin. We have alsoexperimented with a fixed probability (10%) per dose of addiction. The analysis presented in Figure 10below suggests that it is the assumption of deterministic addiction that has more impact on outcomesthan the specific number of uses after which it is assumed to have taken place.
xi It might reasonably be thought that all this discussion of numerical attitudes and updating equationsrefutes the earlier claim that agent-based models deal with behaviour rather than parameters. However,the limited choice of agent-based drug-use simulations available as case studies gives a false impression.Agar2 discusses the distinctive role and legitimacy of such parameterisations in his papers and anexample of an agent-based model based almost entirely on decision rules rather than parameters (thoughnot unfortunately in the field of drug use) can be found in Moss3. Thus, we see that even when anagent-based model uses parameters (and it need not), they do not have the same problematic'exogenous' interpretation found in other types of models.
Now agents communicate with each other through their networks. Thiscommunication is divided into three classes. Addicts have no communicativecredibility (as in labelling theory within the sociology of deviance).xii It is their statusas addicts that 'speaks to' those they know and has a strong negative effect on thedrug attitudes of their associates (20 points on the 100-point scale) making theseassociates less willing to consider using.xiii By contrast, the other two modes ofcommunication involve users and non-users saying what they know. Users whohave used in the current period have a direct influence (positive or negative) on theattitudes of associates by 'turning on' or 'turning off'. They are credible by directexperience and possible observation. Thus, the new attitude of the user's associateis the average of the user's attitude and the old attitude of the user's associate:increased congruence of attitude occurs. By contrast, non-users and users whohave not used in this period can only 'gossip' with much lower credibility. In thiscommunication mechanism, agents simply transmit their current counts of good andbad experiences and recipients 'total' all the good and bad experiences of drugsthey hear about through their networks (double-counting the bad experiences asbefore) and then adjust their attitude directly by the net amount. In the Agar model,the fact that gossip has a smaller influence than experience and encounters withusers, using is ensured by a spatial element in the model. In this version, it isassumed that gossip of this kind is less prevalent than the more 'sensational' detailsof use and tends to be driven out by it. By these different and simultaneousinteraction processes, the horrible example of addicts, the credible information ofusers and the wash of less-credible gossip, users and non-users adjust their drugattitudes. However, just as addicts have no credibility, they also have no reason toadjust their attitudes in the light of outside information. They hardly need gossip totell them what they should think about drugs!
For each agent, the programme goes through the list of associates and decides(with a probability) whether the agent will communicate with that associate in thatperiod. If communication occurs, then the effects are, as described above, based ontransmitter status (has used this period or not, is an addict or not) and receiverstatus (is an addict or not).
4.2 Results and discussion
The agent-based approach is quite capable of generating exactly the same kind ofaggregate time-series data produced by other dynamic modelling techniques. Figure7 shows a typical evolution for the number of users and addicts for the entiresimulated population. The number of users grows rapidly, stabilising at 20% of thepopulation. The number of addicts grows slowly at first, then more rapidly andfinally slowly again (displaying the characteristic S-shaped curve of innovation
Drugs Futures 2025?Modelling Drug Use
Agent-based model: DrugChat case study
51
xii The classic statement is found in Becker4.
xiii This mechanism is commonly associated with the work of Musto5 but Agar developed it independentlyon the basis of direct ethnographic evidence.
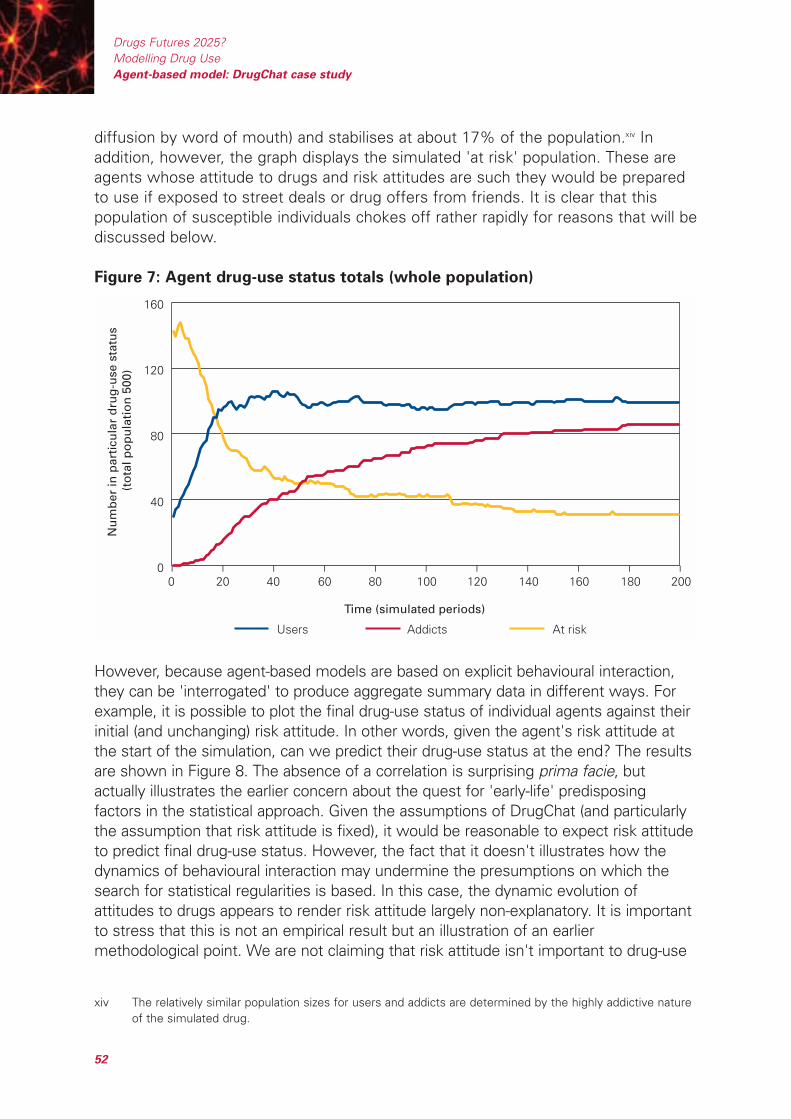
diffusion by word of mouth) and stabilises at about 17% of the population.xiv Inaddition, however, the graph displays the simulated 'at risk' population. These areagents whose attitude to drugs and risk attitudes are such they would be preparedto use if exposed to street deals or drug offers from friends. It is clear that thispopulation of susceptible individuals chokes off rather rapidly for reasons that will bediscussed below.
Figure 7: Agent drug-use status totals (whole population)
However, because agent-based models are based on explicit behavioural interaction,they can be 'interrogated' to produce aggregate summary data in different ways. Forexample, it is possible to plot the final drug-use status of individual agents against theirinitial (and unchanging) risk attitude. In other words, given the agent's risk attitude atthe start of the simulation, can we predict their drug-use status at the end? The resultsare shown in Figure 8. The absence of a correlation is surprising prima facie, butactually illustrates the earlier concern about the quest for 'early-life' predisposingfactors in the statistical approach. Given the assumptions of DrugChat (and particularlythe assumption that risk attitude is fixed), it would be reasonable to expect risk attitudeto predict final drug-use status. However, the fact that it doesn't illustrates how thedynamics of behavioural interaction may undermine the presumptions on which thesearch for statistical regularities is based. In this case, the dynamic evolution ofattitudes to drugs appears to render risk attitude largely non-explanatory. It is importantto stress that this is not an empirical result but an illustration of an earliermethodological point. We are not claiming that risk attitude isn't important to drug-use
0
40
80
120
160
0 20 40 60 80 100 120 140 160 180 200
Time (simulated periods)
Nu
mb
er in
par
ticu
lar
dru
g-u
se s
tatu
s (t
ota
l po
pu
lati
on
500
)
Users Addicts At risk
– – – – – – – – – – –
Drugs Futures 2025?Modelling Drug UseAgent-based model: DrugChat case study
52
xiv The relatively similar population sizes for users and addicts are determined by the highly addictive natureof the simulated drug.
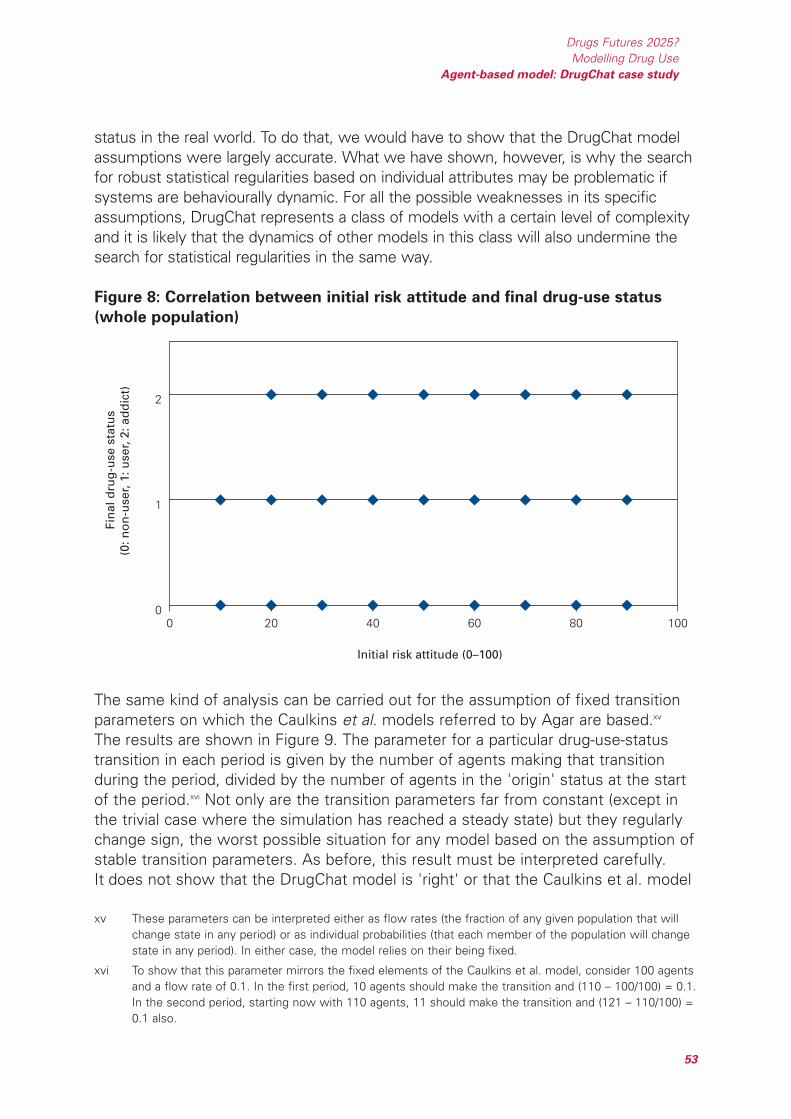
status in the real world. To do that, we would have to show that the DrugChat modelassumptions were largely accurate. What we have shown, however, is why the searchfor robust statistical regularities based on individual attributes may be problematic ifsystems are behaviourally dynamic. For all the possible weaknesses in its specificassumptions, DrugChat represents a class of models with a certain level of complexityand it is likely that the dynamics of other models in this class will also undermine thesearch for statistical regularities in the same way.
Figure 8: Correlation between initial risk attitude and final drug-use status
(whole population)
The same kind of analysis can be carried out for the assumption of fixed transitionparameters on which the Caulkins et al. models referred to by Agar are based.xv
The results are shown in Figure 9. The parameter for a particular drug-use-statustransition in each period is given by the number of agents making that transitionduring the period, divided by the number of agents in the 'origin' status at the startof the period.xvi Not only are the transition parameters far from constant (except inthe trivial case where the simulation has reached a steady state) but they regularlychange sign, the worst possible situation for any model based on the assumption ofstable transition parameters. As before, this result must be interpreted carefully.It does not show that the DrugChat model is 'right' or that the Caulkins et al. model
0 20 40 60 80 1000
1
2
Initial risk attitude (0–100)
Fin
al d
rug
-use
sta
tus
(0: n
on
-use
r, 1:
use
r, 2:
ad
dic
t)
Drugs Futures 2025?Modelling Drug Use
Agent-based model: DrugChat case study
53
xv These parameters can be interpreted either as flow rates (the fraction of any given population that willchange state in any period) or as individual probabilities (that each member of the population will changestate in any period). In either case, the model relies on their being fixed.
xvi To show that this parameter mirrors the fixed elements of the Caulkins et al. model, consider 100 agentsand a flow rate of 0.1. In the first period, 10 agents should make the transition and (110 – 100/100) = 0.1.In the second period, starting now with 110 agents, 11 should make the transition and (121 – 110/100) =0.1 also.
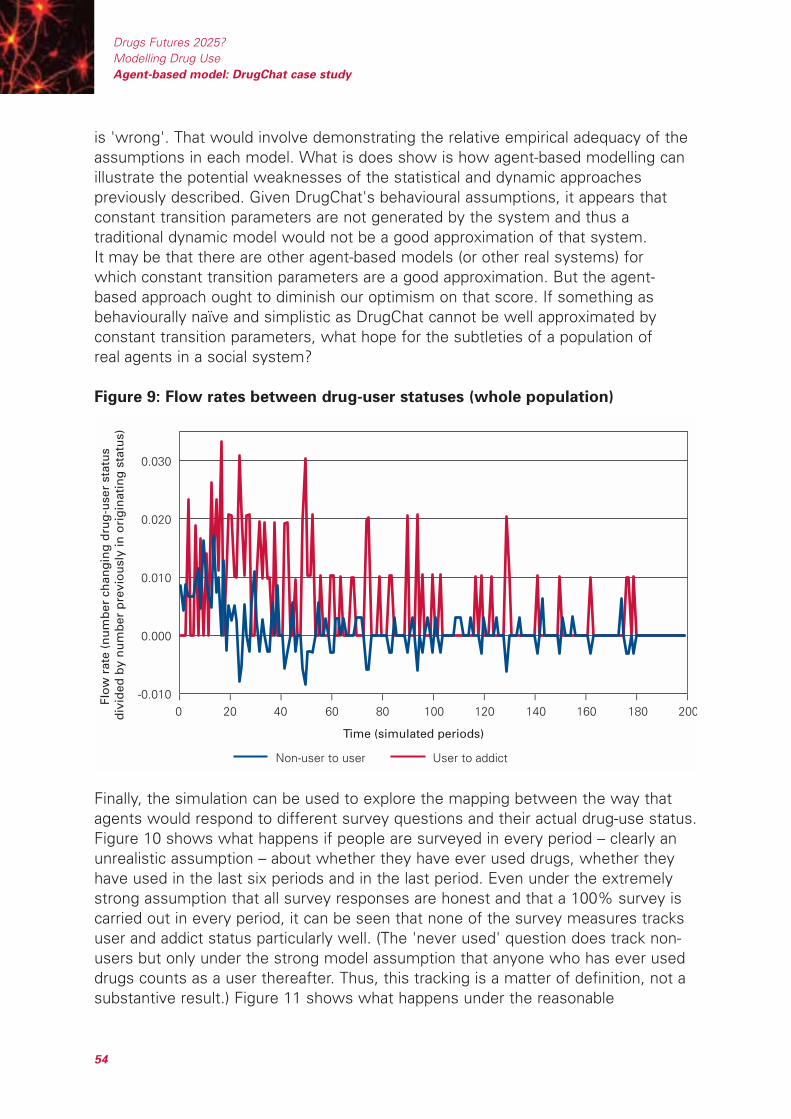
is 'wrong'. That would involve demonstrating the relative empirical adequacy of theassumptions in each model. What is does show is how agent-based modelling canillustrate the potential weaknesses of the statistical and dynamic approachespreviously described. Given DrugChat's behavioural assumptions, it appears thatconstant transition parameters are not generated by the system and thus atraditional dynamic model would not be a good approximation of that system.It may be that there are other agent-based models (or other real systems) forwhich constant transition parameters are a good approximation. But the agent-based approach ought to diminish our optimism on that score. If something asbehaviourally naïve and simplistic as DrugChat cannot be well approximated byconstant transition parameters, what hope for the subtleties of a population ofreal agents in a social system?
Figure 9: Flow rates between drug-user statuses (whole population)
Finally, the simulation can be used to explore the mapping between the way thatagents would respond to different survey questions and their actual drug-use status.Figure 10 shows what happens if people are surveyed in every period – clearly anunrealistic assumption – about whether they have ever used drugs, whether theyhave used in the last six periods and in the last period. Even under the extremelystrong assumption that all survey responses are honest and that a 100% survey iscarried out in every period, it can be seen that none of the survey measures tracksuser and addict status particularly well. (The 'never used' question does track non-users but only under the strong model assumption that anyone who has ever useddrugs counts as a user thereafter. Thus, this tracking is a matter of definition, not asubstantive result.) Figure 11 shows what happens under the reasonable
Time (simulated periods)
Flo
w r
ate
(nu
mb
er c
han
gin
g d
rug
-use
r st
atu
s d
ivid
ed b
y n
um
ber
pre
vio
usl
y in
ori
gin
atin
g s
tatu
s)
Non-user to user User to addict
-0.010
0.000
0.010
0.020
0.030
– – – – – – – – – – –
0 20 40 60 80 100 120 140 160 180 200
Drugs Futures 2025?Modelling Drug UseAgent-based model: DrugChat case study
54

assumption that people are more prepared to own up to ever having used thanhaving used recently and are rather unwilling to report having used very recently.xvii
Under these circumstances, tracking of the actual situation is poorer still, withestimates of the addict population particularly inaccurate.xviii As with the twoprevious examples, this is not an empirical finding because DrugChat is not (yet) anempirically calibrated model. What is does show is how agent-based models can be'interrogated' to deliver different kinds of data that can be compared to real data andhow the approach can explore concerns about the implicit assumptions ofalternative modelling (or, in this case, data collection) techniques.
These analyses suggest a first substantive use for this modelling approach, anexamination of different survey sampling strategies and the plausibility of simplifiedmodelling approaches in capturing the dynamics of social interaction. However,different summary data can also be used to provide a more stringent test (andadditional understanding) of the agent-based model itself. We have already arguedboth that curve-fitting models are hard to falsify because of low information contentin relatively short and inaccurate drug-use time series, and that more matching ofindependent data sources against simulation output improves the chance thatsimulation has captured features of a social process. We now illustrate this claim bylooking at the 'biographies' of simulated agents.
Figure 10: Comparison of reported and actual drug-use status assuming
honest response (whole population)
0
100
200
300
400
500
Time (simulated periods)
Nu
mb
ers
rep
ort
ing
a p
arti
cula
r u
se s
tatu
s an
d a
ctu
ally
in t
hat
sta
tus
Actual non-users Actual users Actual addicts Reported ever used
Reported used in last six periods Reported used in last period
– – – – – – – – – – –
0 20 40 60 80 100 120 140 160 180 200
Drugs Futures 2025?Modelling Drug Use
Agent-based model: DrugChat case study
55
xvii The probabilities for honest reporting are then assumed to be 100%, 80% and 50% respectively. Theseare only indicative figures.
xviii In a more advanced version of the simulation that incorporated criminal activity and medical harms, it wouldalso be possible to explore the accuracy of arrest and hospitalisation records in tracking the hidden population.
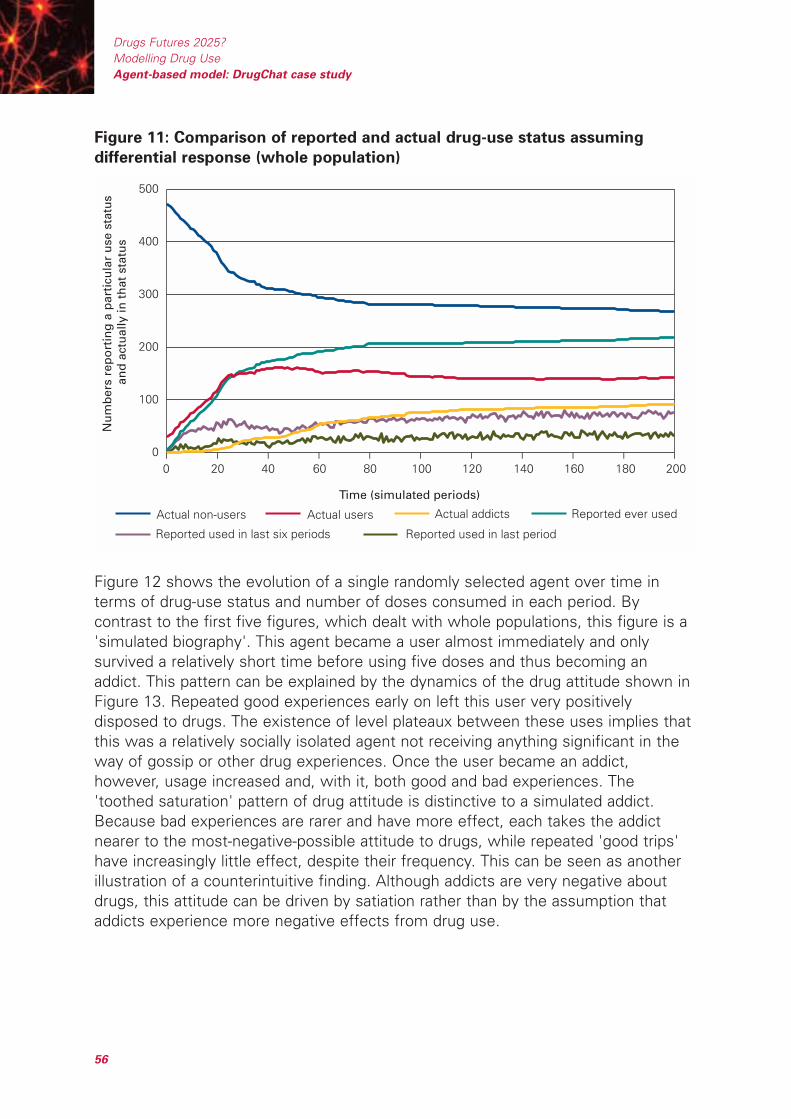
Figure 11: Comparison of reported and actual drug-use status assuming
differential response (whole population)
Figure 12 shows the evolution of a single randomly selected agent over time interms of drug-use status and number of doses consumed in each period. Bycontrast to the first five figures, which dealt with whole populations, this figure is a'simulated biography'. This agent became a user almost immediately and onlysurvived a relatively short time before using five doses and thus becoming anaddict. This pattern can be explained by the dynamics of the drug attitude shown inFigure 13. Repeated good experiences early on left this user very positivelydisposed to drugs. The existence of level plateaux between these uses implies thatthis was a relatively socially isolated agent not receiving anything significant in theway of gossip or other drug experiences. Once the user became an addict,however, usage increased and, with it, both good and bad experiences. The'toothed saturation' pattern of drug attitude is distinctive to a simulated addict.Because bad experiences are rarer and have more effect, each takes the addictnearer to the most-negative-possible attitude to drugs, while repeated 'good trips'have increasingly little effect, despite their frequency. This can be seen as anotherillustration of a counterintuitive finding. Although addicts are very negative aboutdrugs, this attitude can be driven by satiation rather than by the assumption thataddicts experience more negative effects from drug use.
0 20 40 60 80 100 120 140 160 180 2000
100
200
300
400
500
Time (simulated periods)
Nu
mb
ers
rep
ort
ing
a p
arti
cula
r u
se s
tatu
s an
d a
ctu
ally
in t
hat
sta
tus
Actual non-users Actual users Actual addicts Reported ever used
Reported used in last six periods Reported used in last period
– – – – – – – – – – –
Drugs Futures 2025?Modelling Drug UseAgent-based model: DrugChat case study
56

Figure 12: Drug-use status and use levels (first randomly selected single
agent)
Figure 13: Drug attitude (first randomly selected single agent)
Figures 14 and 15 show the corresponding biographical information for a differentsimulated agent also selected at random. This agent remained a non-user for a farlonger period and also survived longer as a user before becoming an addict. Thisdifference can be explained by examining the attitude dynamics in Figure 15. Unlike
0
20
40
60
80
100
120
Time (simulated periods)
Dru
g a
ttit
ud
e
– – – – – – – – – – –
0 20 40 60 80 100 120 140 160 180 200
Time (simulated periods)
Dru
g-u
se s
tatu
s (0
: no
n-u
ser,
1: u
ser,
2: a
dd
ict)
an
d n
um
ber
of
do
ses
use
d
Drug-use status Number of doses used
0
1
2
3
4
5
6
– – – – – – – – – – –
0 20 40 60 80 100 120 140 160 180 200
Drugs Futures 2025?Modelling Drug Use
Agent-based model: DrugChat case study
57
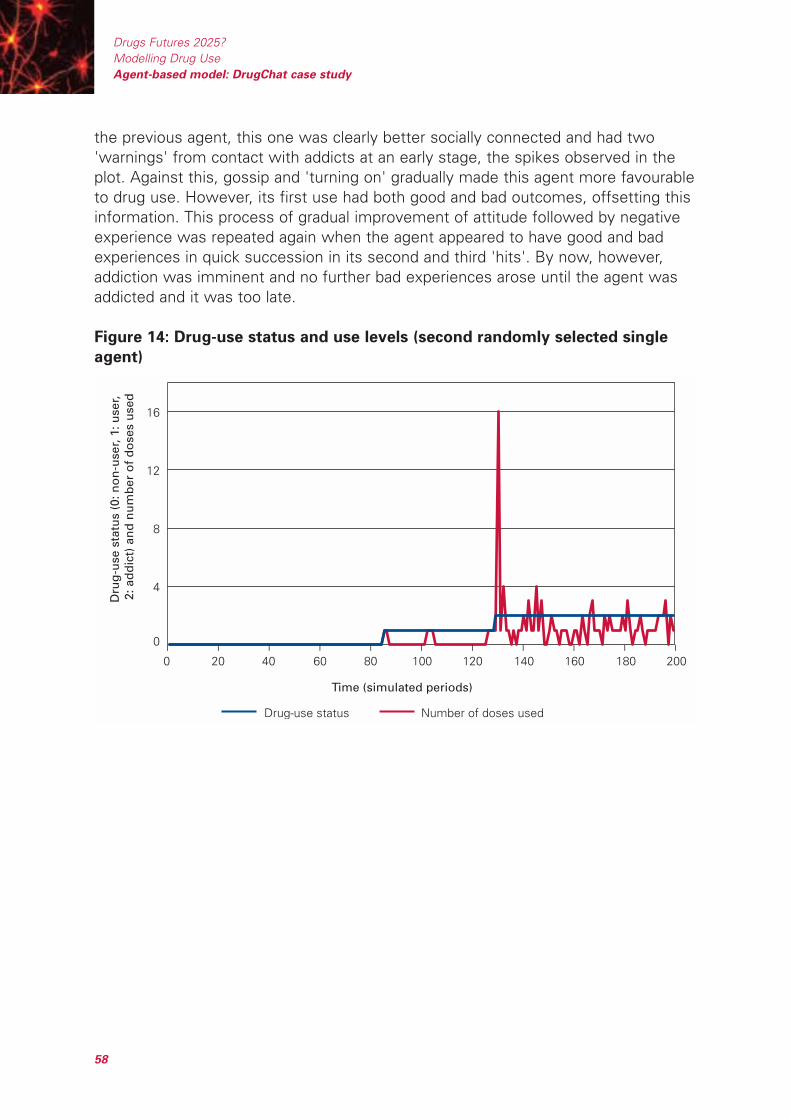
the previous agent, this one was clearly better socially connected and had two'warnings' from contact with addicts at an early stage, the spikes observed in theplot. Against this, gossip and 'turning on' gradually made this agent more favourableto drug use. However, its first use had both good and bad outcomes, offsetting thisinformation. This process of gradual improvement of attitude followed by negativeexperience was repeated again when the agent appeared to have good and badexperiences in quick succession in its second and third 'hits'. By now, however,addiction was imminent and no further bad experiences arose until the agent wasaddicted and it was too late.
Figure 14: Drug-use status and use levels (second randomly selected single
agent)
Time (simulated periods)
Dru
g-u
se s
tatu
s (0
: no
n-u
ser,
1: u
ser,
2: a
dd
ict)
an
d n
um
ber
of
do
ses
use
d
Drug-use status Number of doses used
0
4
8
12
16
– – – – – – – – – – –0 20 40 60 80 100 120 140 160 180 200
Drugs Futures 2025?Modelling Drug UseAgent-based model: DrugChat case study
58
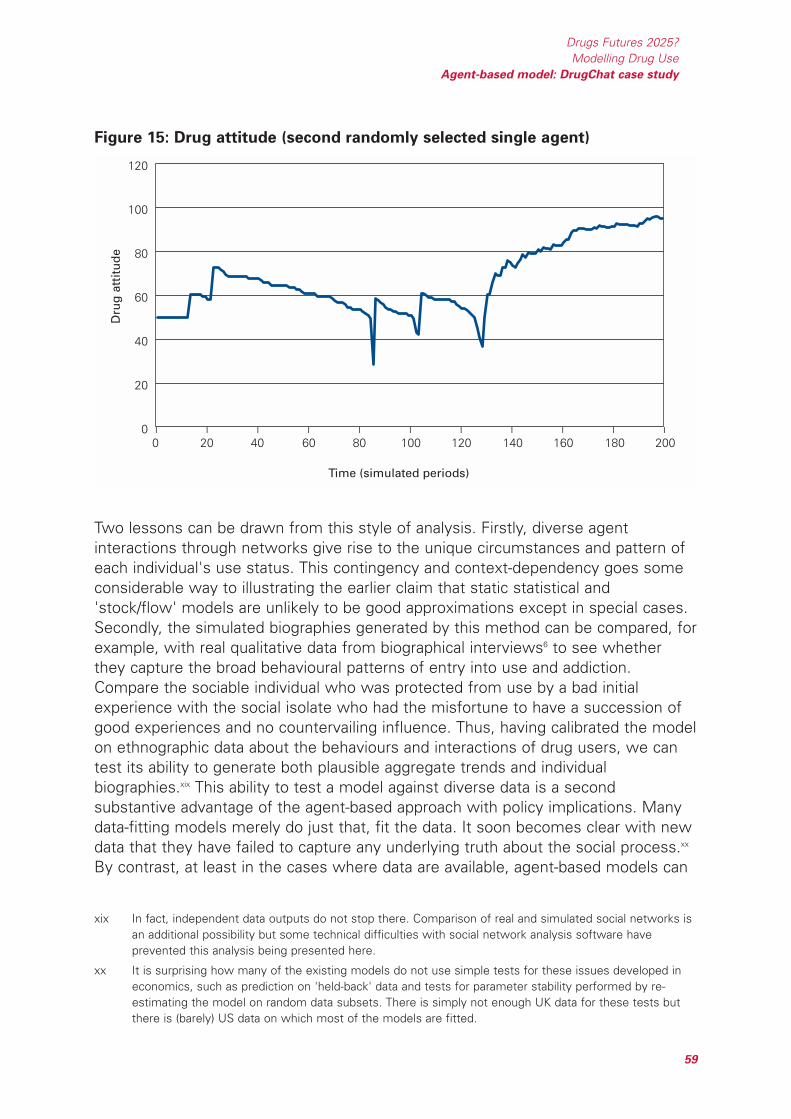
Figure 15: Drug attitude (second randomly selected single agent)
Two lessons can be drawn from this style of analysis. Firstly, diverse agentinteractions through networks give rise to the unique circumstances and pattern ofeach individual's use status. This contingency and context-dependency goes someconsiderable way to illustrating the earlier claim that static statistical and'stock/flow' models are unlikely to be good approximations except in special cases.Secondly, the simulated biographies generated by this method can be compared, forexample, with real qualitative data from biographical interviews6 to see whetherthey capture the broad behavioural patterns of entry into use and addiction.Compare the sociable individual who was protected from use by a bad initialexperience with the social isolate who had the misfortune to have a succession ofgood experiences and no countervailing influence. Thus, having calibrated the modelon ethnographic data about the behaviours and interactions of drug users, we cantest its ability to generate both plausible aggregate trends and individualbiographies.xix This ability to test a model against diverse data is a secondsubstantive advantage of the agent-based approach with policy implications. Manydata-fitting models merely do just that, fit the data. It soon becomes clear with newdata that they have failed to capture any underlying truth about the social process.xx
By contrast, at least in the cases where data are available, agent-based models can
0
20
40
60
80
100
120
Time (simulated periods)
Dru
g a
ttit
ud
e
– – – – – – – – – – –
0 20 40 60 80 100 120 140 160 180 200
Drugs Futures 2025?Modelling Drug Use
Agent-based model: DrugChat case study
59
xix In fact, independent data outputs do not stop there. Comparison of real and simulated social networks isan additional possibility but some technical difficulties with social network analysis software haveprevented this analysis being presented here.
xx It is surprising how many of the existing models do not use simple tests for these issues developed ineconomics, such as prediction on 'held-back' data and tests for parameter stability performed by re-estimating the model on random data subsets. There is simply not enough UK data for these tests butthere is (barely) US data on which most of the models are fitted.

be forced to face far stronger tests before they are trusted for policy analysis, andthose that pass the test should be correspondingly more robust and insightful.
The third substantive use of agent-based simulation is one it shares with the othermodelling techniques – the ability to perform 'thought experiments' at low cost,both as an aid to the understanding of complex systems and to investigate theeffects of different policies on drug use trends. Figure 16 shows one such simpleexperiment, comparing the steady-state number of addicts and users in thepopulation under different assumptions about the addictiveness of the drug. Twointeresting observations are suggested by this figure. Firstly, for the case whereaddiction definitely occurs after a fixed number of doses, the numbers of users andaddicts is relatively insensitive to the actual number of doses involved. (Theaddictiveness is reduced by a factor of four between the extreme conditionsshown.) By contrast, the number of users and addicts under the assumption ofprobabilistic addiction track the corresponding values for deterministic addiction inthe early stages but then diverge quite sharply in the steady state. This implies thatthe early and late addicts (absent in the fixed-period model) are more influential thanthe 'average' addicts in determining the dynamics of the system. This kind ofparameter adjustment (called sensitivity analysis) both provides insight into how thesystem works and allows data gathering and further research to focus on the areasof the model that have the greatest impact on the outputs. A number of theseexperiments suggest how the dynamics of the system unfold and this can beconfirmed by Figure 17. This shows that there is a rapid trend towards a negativedrug attitude in the population as a whole based on gossip, negative experiencesand contact with addicts. This explains the rapid choking-off for the population ofsusceptible agents shown in Figure 7.
Drugs Futures 2025?Modelling Drug UseAgent-based model: DrugChat case study
60
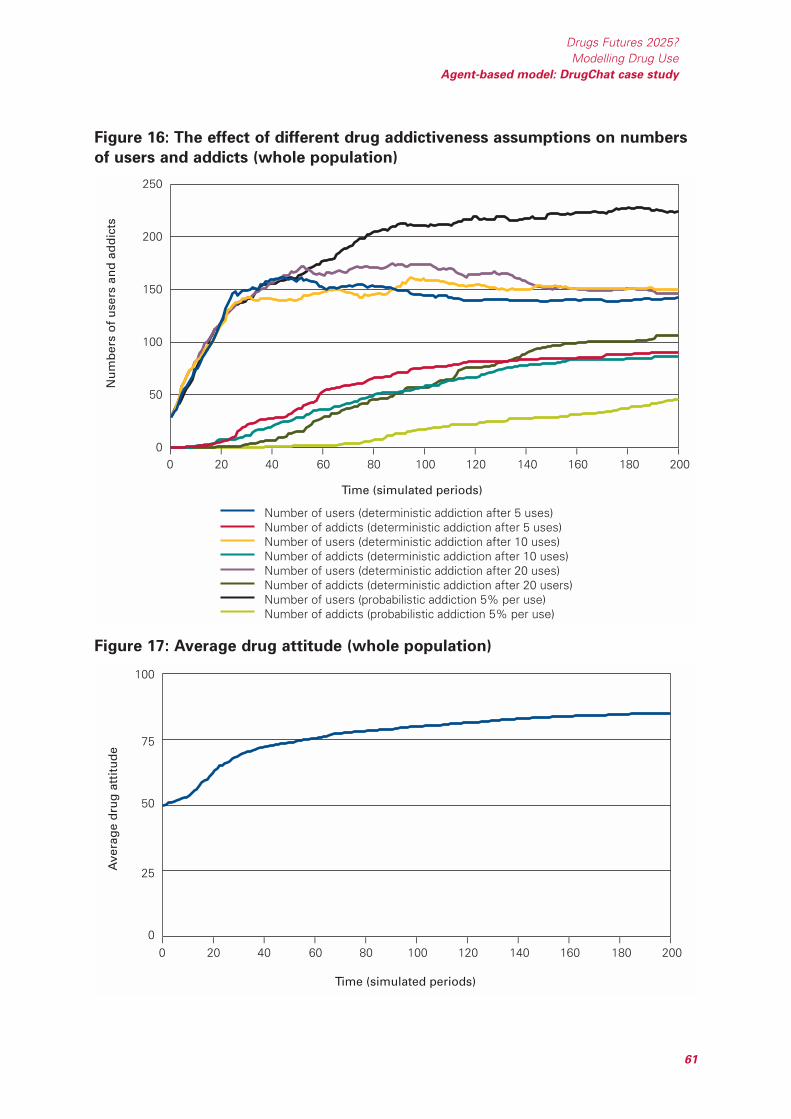
Figure 16: The effect of different drug addictiveness assumptions on numbers
of users and addicts (whole population)
Figure 17: Average drug attitude (whole population)
0
25
50
75
100
Time (simulated periods)
Ave
rag
e d
rug
att
itu
de
– – – – – – – – – – –
0 20 40 60 80 100 120 140 160 180 200
0
50
100
150
200
250
Time (simulated periods)
Nu
mb
ers
of
use
rs a
nd
ad
dic
ts
Number of users (deterministic addiction after 5 uses)Number of addicts (deterministic addiction after 5 uses)Number of users (deterministic addiction after 10 uses)Number of addicts (deterministic addiction after 10 uses)Number of users (deterministic addiction after 20 uses)Number of addicts (deterministic addiction after 20 users)Number of users (probabilistic addiction 5% per use)Number of addicts (probabilistic addiction 5% per use)
– – – – – – – – – – –
0 20 40 60 80 100 120 140 160 180 200
Drugs Futures 2025?Modelling Drug Use
Agent-based model: DrugChat case study
61
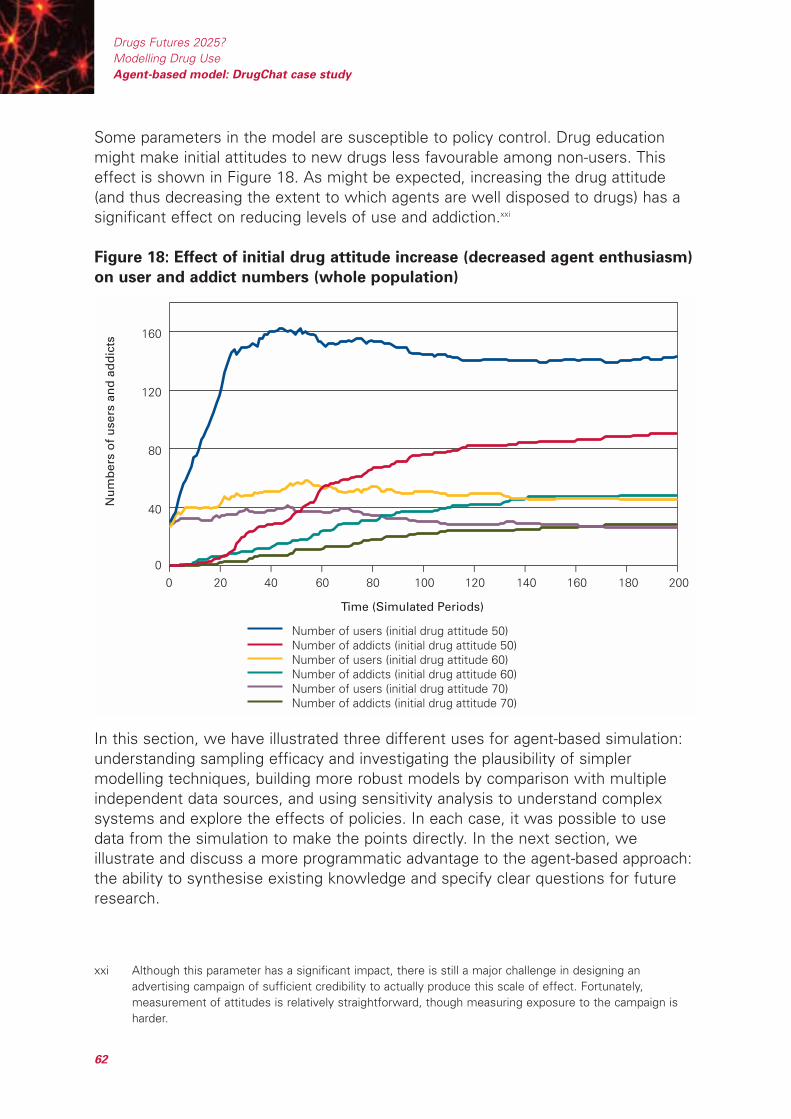
Some parameters in the model are susceptible to policy control. Drug educationmight make initial attitudes to new drugs less favourable among non-users. Thiseffect is shown in Figure 18. As might be expected, increasing the drug attitude(and thus decreasing the extent to which agents are well disposed to drugs) has asignificant effect on reducing levels of use and addiction.xxi
Figure 18: Effect of initial drug attitude increase (decreased agent enthusiasm)
on user and addict numbers (whole population)
In this section, we have illustrated three different uses for agent-based simulation:understanding sampling efficacy and investigating the plausibility of simplermodelling techniques, building more robust models by comparison with multipleindependent data sources, and using sensitivity analysis to understand complexsystems and explore the effects of policies. In each case, it was possible to usedata from the simulation to make the points directly. In the next section, weillustrate and discuss a more programmatic advantage to the agent-based approach:the ability to synthesise existing knowledge and specify clear questions for futureresearch.
0
40
80
120
160
Time (Simulated Periods)
Nu
mb
ers
of
use
rs a
nd
ad
dic
ts
Number of users (initial drug attitude 50)Number of addicts (initial drug attitude 50)Number of users (initial drug attitude 60)Number of addicts (initial drug attitude 60)Number of users (initial drug attitude 70)Number of addicts (initial drug attitude 70)
– – – – – – – – – – –
0 20 40 60 80 100 120 140 160 180 200
Drugs Futures 2025?Modelling Drug UseAgent-based model: DrugChat case study
62
xxi Although this parameter has a significant impact, there is still a major challenge in designing anadvertising campaign of sufficient credibility to actually produce this scale of effect. Fortunately,measurement of attitudes is relatively straightforward, though measuring exposure to the campaign isharder.
4.3 Developing the model
Whatever the merits of the specific assumptions presented in the DrugChat model(chosen mainly for its relative simplicity), it has at least presented them all within asingle framework. This allows for the possibility of an academic division of labour infurther investigation of the subject. Economists and psychologists might contributeto a better understanding of use decisions; public health experts and medicalresearchers to the likely harms of use; sociologists to patterns of drug sharing andsocial interaction, and so on. In addition, discussion around a model can be used asan elicitation technique to establish how experts, policy makers and stakeholdersdiffer in their mental maps of social processes, allowing competing views to becompared or combined. At the same time, any model is only provisional, a steppingstone to new data, more plausible models and better policy advice. In the case ofthe Agar model, understanding it also involves understanding its inevitablelimitations.xxii Exploration of the model shows that the bad example of addicts has asignificant impact in driving the system towards a steady state. Early enthusiasm fora drug rapidly turns to widespread disdain, with those who were 'caught' as earlyaddicts ending up as the victims and agents who survive the initial fad without usingbeing safe thereafter. Thus, any drug epidemic will tend to be choked off by thegrowing 'mass' of addicts it produces: a straightforward negative feedback loop.xxiii
However, this outcome is predicated on two assumptions. Firstly, that the socialnetworks do not change as a result of changes in use status and, secondly, thataddiction leads to no medical harms that might remove addicts from the population,death being the limiting case. It is easy to see how the increasing social isolation ofaddicts (ultimately as a deviant subculture) might reduce their impact among non-users, some of whom may be uncomfortable about associating with recreationalusers.xxiv Changes in social networks resulting from use and addiction would bemeasurable using standard social network analysis techniques, though research inthis domain would be particularly challenging in terms of ethics and access. In theremainder of this section, we discuss three possible extensions to the model andthe issues of data collection that they raise. There are clear parallels here with theinterdisciplinary aspirations of Foresight.
4.3.1 Economics
So far, the model ignores the economic constraints on drug use. Agents areassumed to be able to buy whatever they are offered and to share it freely. At most,poverty is represented by the assumption that addicts tend to access fewer dosesthan users in each buy. It would be straightforward to add per-period disposable
Drugs Futures 2025?Modelling Drug Use
Agent-based model: DrugChat case study
63
xxii All models are simplifications of reality. The trick is to provide adequate simplifications. There would benowhere to unroll a 1:1 scale map of the UK and, even if there were, it would be useless.
xxiii In addition, the fact that users share and addicts don't (under the assumption that street deals fornon-users are rare) also reduces the supply of initiates.
xxiv A countervailing force may be the role of the less-discerning media in broadcasting the worst possible'horror stories' they can find. This can also have undesirable consequences, however7.

income to the attributes of agents. This would have several interestingconsequences. Firstly, agents (particularly addicts) could 'bid' for drugs held byothers, a preliminary representation of the process of small-scale dealing throughnetworks. These network markets (contrasted with standard public legal markets)have interesting properties,xxv as well as policy implications through the 'don't wastetime arresting small dealers' debate. Secondly, dealing might emerge (again,particularly among addicts) as a deliberate way of increasing income. Thirdly,although the processes by which users 'turn to crime' are highly complex, thenumber of users whose costs exceeded disposable income would give an indicativemeasure of those most likely to offend or suffer other harms. These might includebreakdown of family relations through deception, loss of jobs through pilfering orinattention, and so on.
4.3.2 Physiology
So far it has been assumed that the drug affects all agents in the same way and forany use status. Furthermore, the concept of addiction has been represented interms of properties such as sharing behaviour, communication and sizes of deals.In practice, drugs clearly affect different people in different ways and, furthermore,there are reasons to believe that a combination of need and escalating use mightincrease the number of bad experiences through administering drugs carelessly orbeing less discerning about sources. It would be relatively straightforward toaugment the feedback on good and bad effects so that agents required biggerdoses to achieve good effects and, at the same time, started to receive bad effectsfrom failing to take the drug. At present, binges (multiple doses consumed in asingle period) carry no additional harms such as overdose (which would removeaddicts from the system) or increased chances that later doses will have more badeffects than good. The introduction of physiological need is also highly likely to'drive' the kinds of behaviour that lead to drug use becoming problematic: escalatinguse, excessive spending, dealing, breaking of work and family ties through selfishand dishonest actions and so on.
4.3.3 Technology
Since one of the aims of the current Foresight project is to explore the uptake ofnew drugs, another obvious development to the model would be to incorporatemultiple drugs with different properties in terms of good and bad effects andaddictiveness. This would also lead to preliminary modelling of polydrug use. Ahighly topical example would be the crack epidemic and its domination of powdercocaine use via the introduction of a drug which is often cheaper (or at least offersmore 'bang per buck') and easier to make but is also considerably more addictive.So far, the model assumes there is only a single kind of 'goodness' and 'badness'
Drugs Futures 2025?Modelling Drug UseAgent-based model: DrugChat case study
64
xxv Prices are likely to vary far more widely and inventory is stored in the system in a way that may smoothdemand and supply.
but in practice some drugs become substitutes for those that are currentlyunavailable in the network market.xxvi In addition, certain patterns of drug use resultfrom the different physiological effects of drugs: mood management usingalternating 'uppers' and 'downers', for example. These interplay factors may beresponsible for a number of the most serious harms associated with drug use(mixing unfamiliar drugs, dangerous administration methods, increasingly unstablemental state, and so on).
Many of these developments can be added straightforwardly (from a technicalperspective) to the model presented. However, the priority given to each shoulddepend on their policy interest, available data and our ability to test the resultingmodel against real data on networks, aggregate statistics, agent biographies, and soon. The final substantive use of agent-based simulation is therefore a heuristic one.Building models and understanding them helps us to synthesise what we know,identify what we don't know and envision the research that would need to becarried out to enhance existing models in the light of emerging policy concerns.These research questions would also be interesting from the perspective of socialscience. Using the cases above, the following questions suggest themselves.Which drugs do users see as substitutes and why? What motivates polydrug use:availability, disinhibition of use generally, desirable physiological effects,management of undesirable effects or some combination of these? How doesnetwork dealing actually take place? What are the social practices associated withsharing, helping and dealing? Which combination of properties makes a drugparticularly likely to constitute an epidemic hazard? Partial answers to all thesequestions already exist in the literature but the modelling process can sharpen thefocus on both our knowledge and our ignorance.
Drugs Futures 2025?Modelling Drug Use
Agent-based model: DrugChat case study
65
xxvi This is also the insight behind methadone maintenance.
References for Section 4
1. Agar MH. Agents in Living Colour: Towards Emic Agent-Based Models.Journal of Artificial Societies and Social Simulation 2005, 8:<http://www.jasss.soc.surrey.ac.uk/8/1/4.html>
2. Agar, MH. My Kingdom for a Function: Modelling Misadventures of theInnumerate. Journal of Artificial Societies and Social Simulation 2003, 6:<http://www.jasss.soc.surrey.ac.uk/6/3/8.html>
3. Moss, S. Critical Incident Management: An Empirically Derived ComputationalModel. Journal of Artificial Societies and Social Simulation 1998, 1:<http://www.soc.surrey.ac.uk/JASSS/1/4/1.html>
4. Becker, HS. Outsiders: Studies in the Sociology of Deviance, revised edition.New York, NY: Free Press, 1973.
5. Musto, DF. The American Disease. New Haven, CT: Yale University Press,1973.
6. Courtwright D, Joseph H., Des Jarlais D. Addicts Who Survived: An OralHistory of Narcotic Use in America, 1923–1965. Knoxville, TN: The Universityof Tennessee Press, 1989.
7. Cohen, S. Folk Devils and Moral Panics: The Creation of the Mods andRockers, third edition. London: Routledge, 2002
Drugs Futures 2025?Modelling Drug UseAgent-based model: DrugChat case study
66

Appendix
Default parameters for the DrugChat model
Some of these parameters are adjusted to different values in individual simulationruns. These changes are shown in the relevant figures.
Population size: 500.
Distribution of associate numbers: 36% of the population have 2 associates, 20%have 3, 12% have 4, 10% have 5, 6% have 6, 6% have 7, 4% have 8, 4% have 9and 2% have 10.
Initial distribution of use status in the population: 95% non-users, 5% users and0% addicts.
Initial drug attitude for all agents: 50.
Initial risk attitude: Selected from an approximated normal distribution that has a2%-each chance of producing a risk attitude of 10 and 90, 4% each of 20 and 80,8% each of 30 and 70, 16% each of 40 and 60 and 40% of 50.
Maximum number of doses an agent, initialised as a user, is assumed to havetaken 'historically' i.e. before the simulation starts: 5.xxvii
Maximum number of doses an agent, initialised as an addict, is assumed to havetaken 'historically' i.e. before the simulation starts: 25.
Chance of non-users getting 'street' drugs per period: 0%.
Deal size for non-users: 80% chance of 1 dose and 20% chance of 2 doses.
Chance of users getting 'street' drugs per period: 25%.
Deal size for users: 20% chance of 1 dose, 40% chance of 2 doses, 20% chanceof 3 doses, 10% chance of 4 doses and 10% chance of 5 doses. (If non-usersdon't buy on the street then only partying will get them using.)
Chance of addicts getting 'street' drugs per period: 70%. (Because they search.)
Deal size for addicts: 70% chance of 1 dose, 20% chance of 2 doses and 10%chance of 3 doses. (Addicts will be typically poorer and less desirable customers.)
Probability that addict will talk to each of their associates per period and thus actas a horrible example: 50%.
Probability that user who has used will 'turn on' each associate per period andthus significantly influence them: 50%.
Drugs Futures 2025?Modelling Drug Use
Agent-based model: DrugChat case study
67
xxvii This parameter avoids a 'step' in the initialisation process since agents recorded as users or addicts fromthe outset will be at different points in their history of drug use when the simulation starts.
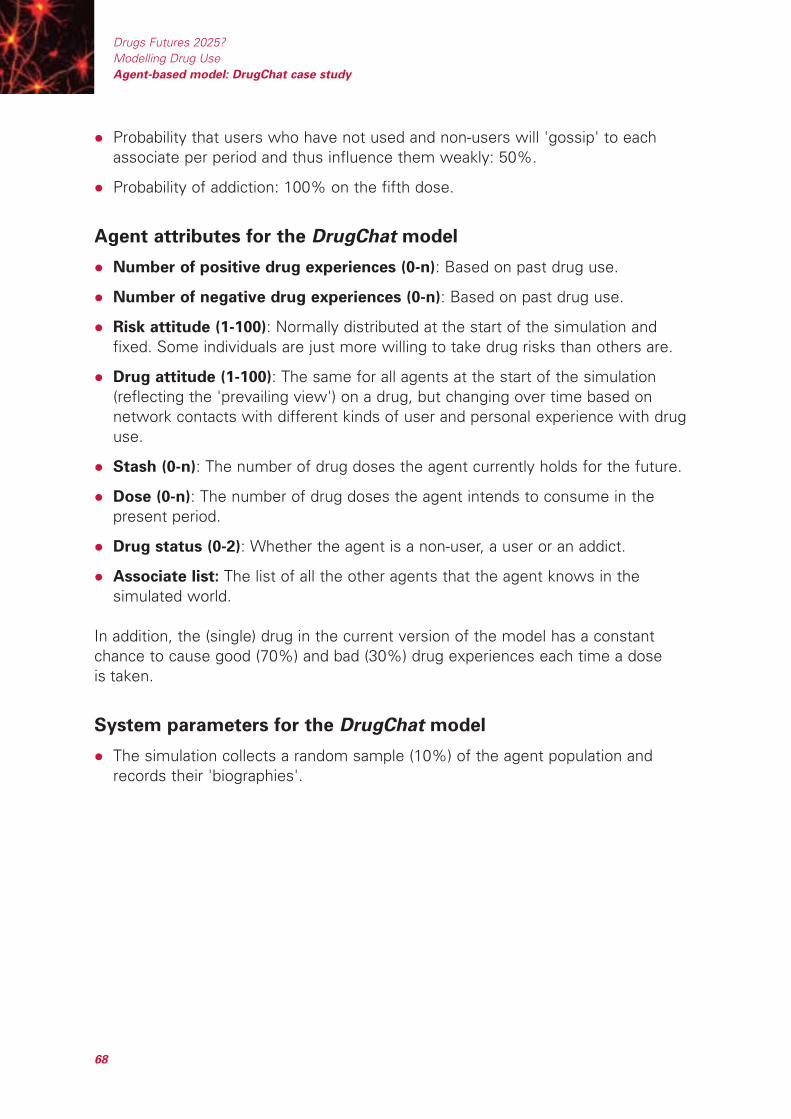
Probability that users who have not used and non-users will 'gossip' to eachassociate per period and thus influence them weakly: 50%.
Probability of addiction: 100% on the fifth dose.
Agent attributes for the DrugChat model
Number of positive drug experiences (0-n): Based on past drug use.
Number of negative drug experiences (0-n): Based on past drug use.
Risk attitude (1-100): Normally distributed at the start of the simulation andfixed. Some individuals are just more willing to take drug risks than others are.
Drug attitude (1-100): The same for all agents at the start of the simulation(reflecting the 'prevailing view') on a drug, but changing over time based onnetwork contacts with different kinds of user and personal experience with druguse.
Stash (0-n): The number of drug doses the agent currently holds for the future.
Dose (0-n): The number of drug doses the agent intends to consume in thepresent period.
Drug status (0-2): Whether the agent is a non-user, a user or an addict.
Associate list: The list of all the other agents that the agent knows in thesimulated world.
In addition, the (single) drug in the current version of the model has a constantchance to cause good (70%) and bad (30%) drug experiences each time a doseis taken.
System parameters for the DrugChat model
The simulation collects a random sample (10%) of the agent population andrecords their 'biographies'.
Drugs Futures 2025?Modelling Drug UseAgent-based model: DrugChat case study
68
69
The three models – statistical, system-dynamic, and agent-based – were intended toillustrate the potential utility and benefits of modelling for understanding thedynamics of drug use and to support policy making. In no way are the examplesexhaustive. Each has limitations and each generates specific recommendations. Butin general they show that useful insights may be generated even within a very shorttimetable. Policy makers will benefit from investing in modelling, and we anticipatethat the Australian Drug Policy Modelling Project*, conducted over a longer period,will provide more detail and other useful examples of models and insights ofrelevance to policy makers in England and Wales.
We have shown that statistical models can enhance routine data sets to estimatethe prevalence and incidence of drug use, but these models could be improved andcould potentially address new drugs, given a co-ordinated surveillance effort. Werecommended that policy makers consider initiating a review across governmentdepartments and with multidisciplinary scientific input to identify key gaps in ourinformation, and opportunities for greater integration of current informationsystems.
In the example of a system-dynamic model, we developed an initial model of thetransmission of Hepatitis C (HCV), which is pertinent given the growing publicfailure to prevent HCV transmission among IDUs. The model implied that earlyintervention is critical to the success of prevention, and can be extended to assesswhether the most effective intervention is achieved by targeting all IDUs or a coresubgroup. Though the model was limited by uncertainty in key behavioural andbiological parameters, it has provided a base for taking research forward to improvethe evidence base and give policy makers greater assurance on the level and typesof intervention required to reduce HCV infections. Recommendations were alsomade for improving data collection in order to aid the accuracy and power of thesemodelling techniques.
In the example of the agent-based simulation, we showed how comparativelysimple rules that could be obtained from ethnographic data can provide a deeperunderstanding of a complex system, and suggested ways in which the model couldbe extended to incorporate additional information so that we understand better howindividuals interact and how drug-use patterns may emerge.
5 Conclusions
* http://www.turningpoint.org.au/research/dm_proj/res_dm_proj.htm
70
All publications are available in hard copy and/or can be downloaded from theForesight website except those marked *** which are available only from thewebsite (www.foresight.gov.uk).
1. Executive summary and project overview
2. State-of-science reviews ***I. Cognition EnhancersII. Drug Testing III. Economics of Addiction and DrugsIV. Ethical Aspects of Developments in Neuroscience and AddictionV. Experimental Psychology and Research into Brain Science and DrugsVI. Problem Gambling and other Behavioural AddictionsVII. GenomicsVIII. History and the Future of Psychoactive SubstancesIX. Life Histories and Narratives of AddictionX. NeuroimagingXI. Neuroscience of Drugs and AddictionXII. Sociology and Substance UseXIII. Social Policy and Psychoactive SubstancesXIV. Psychological Treatment of Substance Abuse and DependenceXV. Pharmacology and Treatments
3. State-of-science reviews (2 page summaries)
4. Ethical issues and addiction overview ***
5. Horizon scan
6. The scenarios
7. Public perspective
8. Perspective of the pharmaceutical industry
9. Modelling drug use
List of publications: Drugs Futures 2025?


Printed in UK on recycled paper with a minimum HMSO score of 75First published July 2005. Department of Trade and Industry. www.dti.gov.uk/
© Crown Copyright. DTI/Pub 7916/3k/07/05/NP. URN 05/1183