Transmission development plan 2016-2025 | Eskom
106
Transmission development plan 2016-2025
-
Upload
khangminh22 -
Category
Documents
-
view
0 -
download
0
Transcript of Transmission development plan 2016-2025 | Eskom

Transmission development plan 2016-2025
A reliable electricity supply of acceptable quality is essential for the enjoyment of the 21st-century lifestyle that so many of us take for granted. Electricity transforms the lives of people in newly electrified areas when the supply is switched on for the first time, giving them access to opportunities they could previously only dream about.Electricity is generated in power stations distributed around South Africa. The bulk of South Africa’s electricity is generated in coal-fired power stations located mainly on the Mpumalanga Highveld. The transmission system plays a pivotal role in the provision of electricity by delivering electricity in bulk from the power stations to load centres located throughout South Africa and the region. From there, the distribution networks owned by Eskom and municipalities deliver electricity to end-users. The transmission system not only requires maintenance to deliver a reliable supply of electricity, but also needs to be strengthened to meet changing customer needs and connect new loads and generating capacity.
Our plans for the transmission system are focused, firstly, on ensuring that the network complies with the minimum reliability criteria specified in the Grid Code for both loads and power stations. Secondly, the new power stations developed by Eskom and Independent Power Producers (IPPs) must be connected to the network. This includes additional IPP baseload and cogeneration plant. Additional large-scale renewable generation (wind and solar energy) is also still being connected to the grid, which will further
diversify the country’s energy mix and reduce our carbon footprint. This will not only create jobs to build and operate the stations, but will also attract development to economically depressed parts of the country. Thirdly, new loads need to be connected to the network, facilitating economic growth and uplifting the lives of all South Africans.
The benefits of a reliable and secure electricity supply to South Africa must be weighed against the cost of providing it to ensure that electricity consumers, who ultimately fund the investments through the tariff, receive fair value for money. I hope that this document will assist in this dialogue and I welcome comments and queries on the content and format.
I would also like to take this opportunity to thank the team that has worked and continues to work on the development of these plans. It is a difficult and complex process, requiring extensive consultation and multiple iterations.
Regards
Thava Govender
GROUP EXECUTIVE (TRANSMISSION AND SUSTAINABILITY)
October 2015
Foreword by Group Executive

Transmission development plan 2016-2025 001
Disclaimer
The purpose of publishing the TDP is to inform stakeholders about the proposed developments in the Eskom transmission network. These plans are subject to change as and when better technical solutions are identified or when more accurate developmental information becomes available. The information contained in the TDP should, therefore, not be used for any purpose other than for sharing this information.
The contents of this document do not constitute advice and Eskom makes no representations regarding the suitability of using the information contained in this document for any purpose. All such information is provided “as is” without warranty of any kind and is subject to change without notice. The entire risk arising from its use remains with the recipient. In no event shall Eskom be liable for any direct, consequential, incidental, special, punitive, or any other damages whatsoever, including, but not limited to, damages for loss of business profits, business interruption, or loss of business information.
Although the TDP is updated periodically, Eskom makes no representation or warranty as to the accuracy, reliability, validity, or completeness of the information contained in this document. Eskom does, however, endeavour to release plans based on the best available information at its disposal at all times to ensure that stakeholders are kept informed about developments in the transmission network. Therefore, the information contained in this document represents the most up-to-date information that was available at the time it was released.
Disclaimer
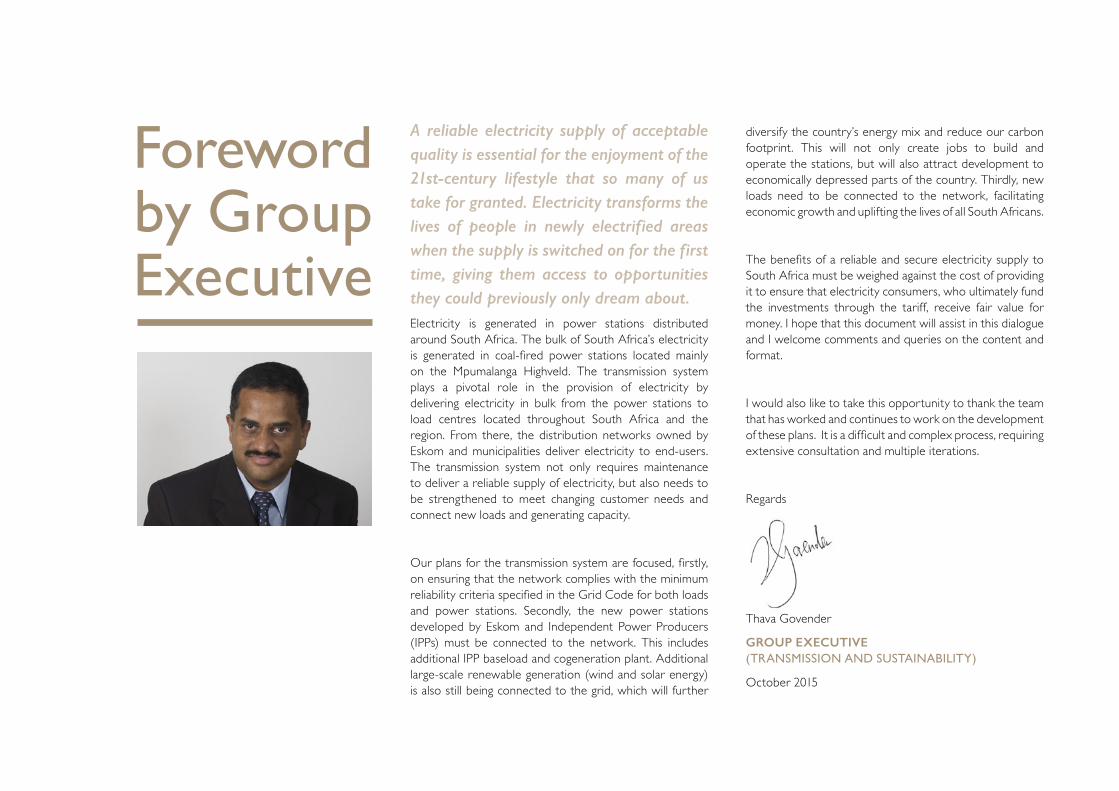
This publication contains information about projects intended to extend or reinforce the transmission system that have been completed in the past year as well as about projects that are planned for the next 10 years. The transmission network is the primary network of interest covered in this publication. This covers electrical networks with voltages ranging from 220 kV to 765 kV and the transmission substations where these networks terminate. A few 88 kV and 132 kV electrical networks are included due to their strategic nature.
Executive summary
Executive summary
Transmission development plan 2016-2025 003
This publication contains information about projects intended to extend or reinforce the transmission system that have been completed in the past year as well as about projects that are planned for the next 10 years. The transmission network is the primary network of interest covered in this publication. This covers electrical networks with voltages ranging from 220 kV to 765 kV and the transmission substations where these networks terminate. A few 88 kV and 132 kV electrical networks are included due to their strategic nature.
The projects covered in this document include the generation integration projects required to ensure that the network is adequate to evacuate and dispatch power to the load centres from the new power stations (conventional and renewable) connecting to the grid. This document also contains the reliability projects required to ensure that the levels of reliability and adequacy of the transmission network as a whole prescribed by the Grid Code are sustained as load demand increases and new sources of generation are connected to the network. The final group of projects is those needed to connect new and growing loads and load centres to the network.
Eskom’s current liquidity position will impact the execution of the Transmission Development Plan and is likely to remain in force at least until the first quar ter of 2018, when Nersa is due to review Eskom’s funding and revenue requirements and announce the Eskom tariff determination for the MYPD4 (four th multi-year price determination) period, commencing 1 April 2018. Until then, the plan will have to be revised each year to fit within the available budget by reprioritising projects to minimise the impact on customers and the national economy of any delays arising from a shortage of funding or delays in obtaining sites and servitudes and environmental and other statutory approvals.
It is regrettable, but unavoidable, that the funding constraints will result in it taking a longer period of time to bring the transmission system into compliance with the reliability and redundancy requirements prescribed by the Grid Code. The effects on customers and the national economy will be minimised through consultation with customers. A public forum will be held with identified stakeholders to disseminate the content of this plan fur ther and get feedback on it. These comments will be taken into account when the plan is revised.
The financial year ended in March 2015 was the first year in which customers (load and generation) were offered the self-build option, in terms of which they could elect to design, procure and construct their own connection to the transmission system instead of Eskom providing the network connection and charging the customer a connection charge. The self-build option was introduced by Eskom Transmission in order to give customers greater control over risk factors affecting their network connection. The self-build option has since been expanded to allow customers to also self-build associated works that will be shared with other customers, subject to approval by Eskom based on an assessment of associated risks to the system and other customers. The option of Eskom constructing the customer’s network connection and the customer paying a connection charge remains available to the customer as before, since the self-build option is purely voluntary.
The costs given in the document are, in general, high-level estimates and can change as global economic conditions change; that is, costs are sensitive to fluctuations in foreign exchange and commodity prices and to global demand. In general, the impact of reliability projects on the customers is to improve availability of supply under normal and contingency operating conditions, whereas
load customer and generation integration projects allow generating plant and the load to be optimally connected to the network.
Eskom Transmission also undertakes capital expenditure in respect of the refurbishment of ageing infrastructure, strategic projects (including facilities), production equipment and strategic capital spares. Strategic projects are those that do not fall into any of the other categories. These include upgrading of the EMS (Energy Management System) used by the System Operator to control the system and respond to emergencies, as well as security measures to combat criminal activity such as theft and vandalism. Acquisition of sites and servitudes and associated EIAs (environmental impact assessments) and other statutory approvals for the construction of transmission infrastructure are also defined in the Grid Code as strategic projects. Facilities consist of buildings and associated works located at sites other than substations, which Transmission uses for offices, the operation and control of the system, or as maintenance depots and workshops. Production equipment consists of office furniture and equipment, computer hardware and software, tools and other equipment used by maintenance staff and vehicles. Strategic capital spares are items not available from suppliers ex stock, for example, large power transformers, circuit-breakers, etc., which are kept as strategic stock to allow units that fail in service and cannot be repaired on site to be replaced as soon as practicable, thereby minimising the risk that customers may experience a lengthy outage. Projects dealing with the refurbishment of ageing infrastructure, facilities, production equipment and strategic capital spares are not explained in greater detail in this document, but a summary of their costs appears in the chapter dealing with capital expenditure.
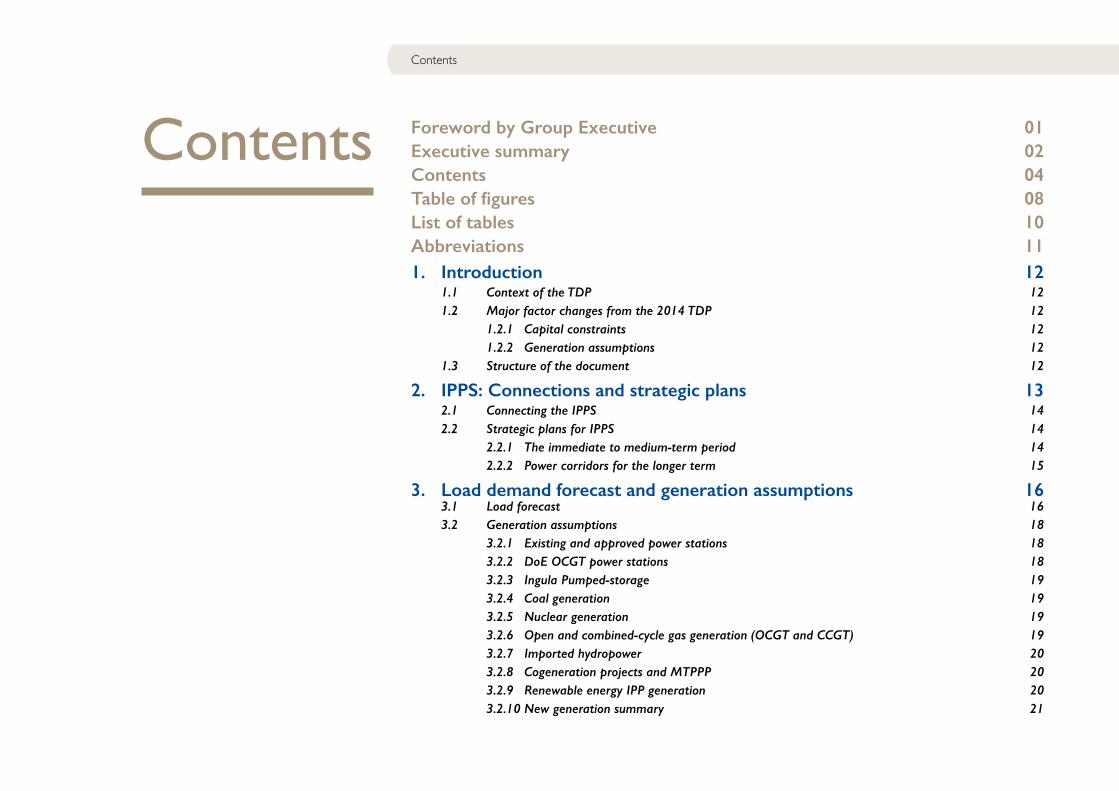
Contents Foreword by Group Executive 01Executive summary 02Contents 04Table of figures 08List of tables 10Abbreviations 111. Introduction 12 1.1 Context of the TDP 12 1.2 Major factor changes from the 2014 TDP 12 1.2.1 Capital constraints 12 1.2.2 Generation assumptions 12 1.3 Structure of the document 12
2. IPPS: Connections and strategic plans 13 2.1 Connecting the IPPS 14 2.2 Strategic plans for IPPS 14 2.2.1 The immediate to medium-term period 14 2.2.2 Power corridors for the longer term 15
3. Load demand forecast and generation assumptions 16 3.1 Load forecast 16 3.2 Generation assumptions 18 3.2.1 Existing and approved power stations 18 3.2.2 DoE OCGT power stations 18 3.2.3 Ingula Pumped-storage 19 3.2.4 Coal generation 19 3.2.5 Nuclear generation 19 3.2.6 Open and combined-cycle gas generation (OCGT and CCGT) 19 3.2.7 Imported hydropower 20 3.2.8 Cogeneration projects and MTPPP 20 3.2.9 Renewable energy IPP generation 20 3.2.10 New generation summary 21
Contents
Transmission development plan 2016-2025 005
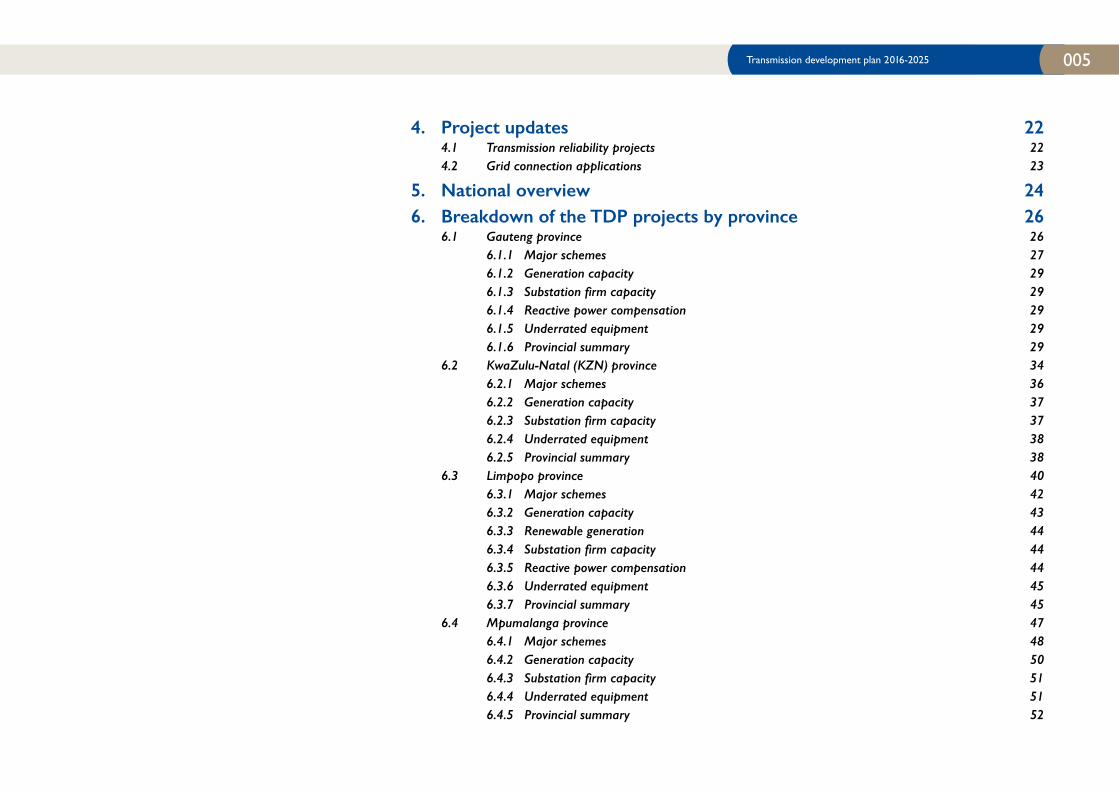
4. Project updates 22 4.1 Transmission reliability projects 22 4.2 Grid connection applications 23
5. National overview 246. Breakdown of the TDP projects by province 26 6.1 Gauteng province 26 6.1.1 Major schemes 27 6.1.2 Generation capacity 29 6.1.3 Substationfirmcapacity 29 6.1.4 Reactive power compensation 29 6.1.5 Underrated equipment 29 6.1.6 Provincial summary 29 6.2 KwaZulu-Natal (KZN) province 34 6.2.1 Major schemes 36 6.2.2 Generation capacity 37 6.2.3 Substationfirmcapacity 37 6.2.4 Underrated equipment 38 6.2.5 Provincial summary 38 6.3 Limpopo province 40 6.3.1 Major schemes 42 6.3.2 Generation capacity 43 6.3.3 Renewable generation 44 6.3.4 Substationfirmcapacity 44 6.3.5 Reactive power compensation 44 6.3.6 Underrated equipment 45 6.3.7 Provincial summary 45 6.4 Mpumalanga province 47 6.4.1 Major schemes 48 6.4.2 Generation capacity 50 6.4.3 Substationfirmcapacity 51 6.4.4 Underrated equipment 51 6.4.5 Provincial summary 52
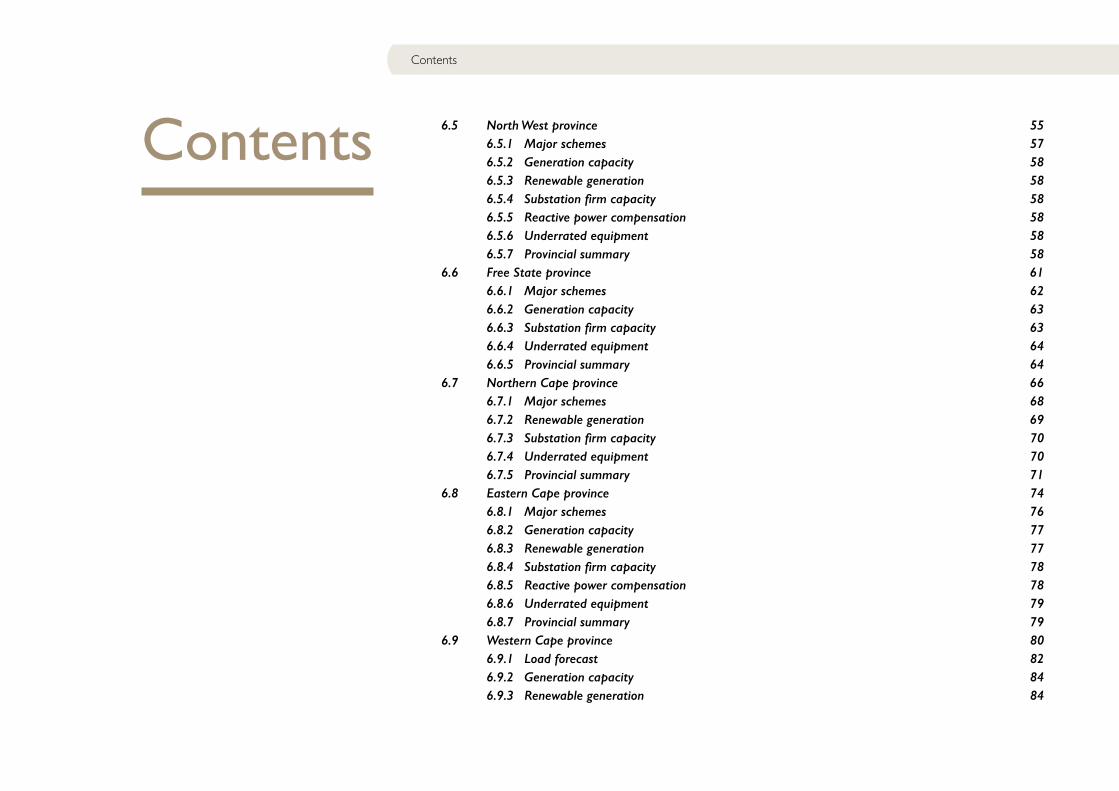
Contents 6.5 North West province 55 6.5.1 Major schemes 57 6.5.2 Generation capacity 58 6.5.3 Renewable generation 58 6.5.4 Substationfirmcapacity 58 6.5.5 Reactive power compensation 58 6.5.6 Underrated equipment 58 6.5.7 Provincial summary 58 6.6 Free State province 61 6.6.1 Major schemes 62 6.6.2 Generation capacity 63 6.6.3 Substationfirmcapacity 63 6.6.4 Underrated equipment 64 6.6.5 Provincial summary 64 6.7 Northern Cape province 66 6.7.1 Major schemes 68 6.7.2 Renewable generation 69 6.7.3 Substationfirmcapacity 70 6.7.4 Underrated equipment 70 6.7.5 Provincial summary 71 6.8 Eastern Cape province 74 6.8.1 Major schemes 76 6.8.2 Generation capacity 77 6.8.3 Renewable generation 77 6.8.4 Substationfirmcapacity 78 6.8.5 Reactive power compensation 78 6.8.6 Underrated equipment 79 6.8.7 Provincial summary 79 6.9 Western Cape province 80 6.9.1 Load forecast 82 6.9.2 Generation capacity 84 6.9.3 Renewable generation 84
Contents

Transmission development plan 2016-2025 007
6.9.4 Substationfirmcapacity 85 6.9.5 Reactive power compensation 85 6.9.6 Underrated equipment 88 6.9.7 Provincial summary 88
7. Grid access for generation beyond 2020 91 7.1 Dispersed renewable energy generation 92 7.1.1 The Eastern Cape 92 7.1.2 The Northern Cape 92 7.1.3 The Western Cape 92 7.2 Concentrated generation 92 7.2.1 The Lephalale area 92 7.2.2 The Port Elizabeth area 92
8. Impact of the DoE generation scenarios 94 8.1 Limpopo scenario (solar PV) 95 8.2 Mpumalanga scenario (coal) 95 8.3 Northern Cape scenario (wind) 95 8.4 Kwazulu-Natal scenario (coal and gas) 96 8.5 Western Cape scenario (wind, gas, and nuclear) 96
9. Capital expenditure plan 9810. Conclusion 99Appendix A: Generation assumptions 100Appendix B: Publication team 103Appendix C: Contact Details 103

Table of figures
Figure 2.1: Generation connection capacity for the immediate to medium term 15
Figure 2.2: Power corridors for the longer term 16
Figure 3.1: The Eskom transmission system demand forecast 17
Figure 3.2: Power station capacity introduction by year 21
Figure 3.3: Planned power station capacity by 2025 21
Figure 5.1: Map showing relative location of the major TDP scheme projects 25
Figure 6.1: Current Gauteng province network diagram 27
Figure 6.2: Gauteng province load forecast 28
Figure 6.3: Future Gauteng province network diagram 34
Figure 6.4: Current KZN province network diagram 35
Figure 6.5: KZN province network diagram 36
Figure 6.6: Future KZN province network diagram 40
Figure 6.7: Current Limpopo province network diagram 41
Figure 6.8: Limpopo province load forecast 42
Figure 6.9: Future Limpopo province network diagram 47
Figure 6.10: Current Mpumalanga province network diagram 48
Figure 6.11: Mpumalanga province load forecast 49
Figure 6.12: Kusile Power Station Integration single-line diagram 50
Figure 6.13: Future Mpumalanga province network diagram 55
Table of figures
Transmission development plan 2016-2025 009
Figure 6.14: Current North West province network diagram 56
Figure 6.15: North West province load forecast 57
Figure 6.16: Future North West province network diagram 61
Figure 6.17: Current Free State province network diagram 62
Figure 6.18: Free State province load forecast 63
Figure 6.19: Future Free State province network diagram 66
Figure 6.20: Current Northern Cape province network diagram 67
Figure 6.21: Northern Cape province load forecast 68
Figure 6.22: Future Northern Cape province network diagram 74
Figure 6.23: Current Eastern Cape province network diagram 75
Figure 6.24: Eastern Cape province load forecast 76
Figure 6.25: Eastern Cape province network diagram 81
Figure 6.26: Current Western Cape province network diagram 82
Figure 6.27: Single-line diagram of the existing Greater Cape transmission network 83
Figure 6.28: Load forecast for the Western Cape province 83
Figure 6.29: Western Cape province network diagram 90
Figure 7.1: Location of collector stations and major corridors beyond 2020 93
Figure 8.1: Overview of the generation scenario location changes 94
Figure 8.2: Overview of the impact of the generation scenarios 97
List of tables
Table 2.1: REIPPPP status 14
Table 4.1: Completed projects FY2014/2015 and 2015/16 22
Table 4.2: Projects planned to be completed by FY2015/2016 23
Table 4.3: Connection applications quoted and accepted 23
Table 5.1: Major TDP transmission assets expected to be installed 26
Table 6.1: Cumulative TDP transmission assets for Gauteng province 30
Table 6.2: Gauteng province – summary of projects and timelines 31
Table 6.3: Cumulative TDP transmission assets for KwaZulu-Natal province 37
Table 6.4: KZN province – summary of projects and timelines 38
Table 6.5: Generation capacity for the Limpopo province 44
Table 6.6: Cumulative TDP transmission assets for Limpopo province 44
Table 6.7: Limpopo province – summary of projects and timelines 45
Table 6.8: Aging generators decommissioning schedule 51
Table 6.9: Cumulative TDP transmission assets for Mpumalanga province 52
Table 6.10: Mpumalanga province – summary of projects and timelines 53
Table 6.11: Cumulative TDP transmission assets for North West province 59
Table 6.12: North West province – summary of projects and timelines 59
Table 6.13: Cumulative TDP transmission assets for Free State province 64
Table 6.14: Free State province – summary of projects and timelines 65
Table 6.15: Approved projects in the Northern Cape under the REIPPPP 69
Table 6.16: Cumulative TDP transmission assets for Northern Cape province 70
Table 6.17: Northern Cape province – summary of projects and timelines 71
Table 6.18: Approved projects in the Eastern Cape under the REIPPPP 77
Table 6.19: Cumulative TDP transmission assets for Eastern Cape province 78
Table 6.20: Summary of Eastern Cape province projects and timelines 79
Table 6.21: Approved projects in the Western Cape under the REIPPPP 85
Table 6.22: Cumulative TDP transmission assets for Western Cape province 86
Table 6.23: Western Cape province – summary of projects and timelines 87
Table 9.1: Capital expenditure per category of projects for FY2016 to 2025 98
Table 9.2: Capital expenditure for expansion projects for FY2016 to 2025 per province 98
List of tables
Transmission development plan 2016-2025 011Abbreviations
Abbreviations
BQ – budget quoteQuotation giving customers costs and scope at an 85% accuracy level.
CCGT – combined-cycle gas turbineOCGT fitted with a waste heat recovery boiler and steam turbines to increase electricity output by using the exhaust gases of the combustion turbine to raise steam.
CoCT – City of Cape Town
CLN – customer load networkThe network within a specific geographical area, which, in turn, is a subdivision of a grid; for example, Johannesburg CLN falls within the Central Grid.
DEA – Department of Environmental Affairs
DoE – Department of Energy
EHV – extra high voltage
EIA – environmental impact assessment
GAU – grid access unit
GCCA – Grid Connection Capacity Assessment
GDP – gross domestic product
GUMP – Gas Utilisation Master Plan
HVDC – high-voltage direct current
ICE – indicative cost estimateCost estimate giving a non-binding indication of the order of magnitude costs.
IDZ – industrial development zone
IPP – independent power producerThese are power stations owned by independent parties other than Eskom.
IRP – Integrated Resource PlanMTPPP – Medium Term Power Purchase Programme
MW – megawattA million watts – a watt is a unit of electrical power production or demand.
MVar – megavolt-ampere reactiveA million volt-amperes reactive – a volt-ampere reactive is a unit of the electrical power required to maintain electromagnetic fields.
MVA – megavolt-ampereA million volt-amperes of apparent power, being the vector sum of real power (MW) and reactive power (MVar).
MYPD3 – Multi-year Price Determination 3The third multi-year price determination for tariff increases awarded to Eskom by Nersa, being 8% per annum over the period 1 April 2013 to 31 March 2018.
MYPD4 – Multi-year Price Determination 4The fourth multi-year price determination for tariff increases awarded to Eskom by Nersa. The annual price increase and period duration will be decided by Nersa by 31 March 2018 and will come into effect from 1 April 2018.
MTS – main transmission substationThese are substations owned and operated by a TNSP.
Nersa – National Energy Regulator of South AfricaThe body established by an Act of Parliament to regulate the production, sale and pricing of electricity, liquid fuels and fuel gas in South Africa.
OCGT – open-cycle gas turbineCombustion turbine fuelled by liquid fuel or gas, used to drive a generator.
PPA – power purchase agreement
RTS – return to serviceA previously mothballed power station undergoing recommissioning.
REIPPPP – Renewable Energy Independent Power Producers Procurement Programme
REBID – Renewable Energy Bids Programme
REDZ – renewable energy development zones
SEA – strategic environmental assessment
STE – Sociedade Nacional de Transporte de Energia (Mozambique Regional Transmission Backbone Project)
TDP – transmission development planA development plan produced annually by Grid Planning detailing how the network will develop in the next 10 years. This comprises the proposed new projects listed in this document as well as the customer projects omitted from this document owing to their commercial sensitivity.
TNSP – transmission network service providerA legal entity that is licensed to own, operate and maintain a transmission network.
TOSP – time of system peak
TS – transmission system
Chapter1 Introduction
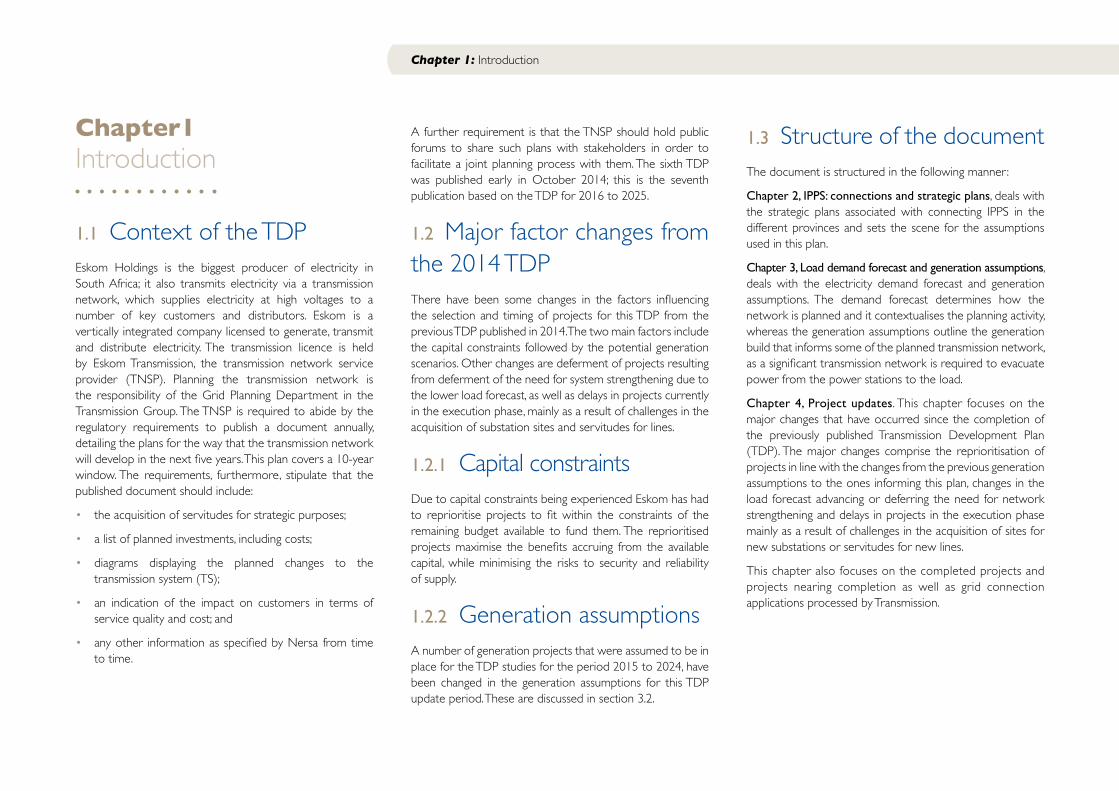
1.1 Context of the TDPEskom Holdings is the biggest producer of electricity in South Africa; it also transmits electricity via a transmission network, which supplies electricity at high voltages to a number of key customers and distributors. Eskom is a vertically integrated company licensed to generate, transmit and distribute electricity. The transmission licence is held by Eskom Transmission, the transmission network service provider (TNSP). Planning the transmission network is the responsibility of the Grid Planning Department in the Transmission Group. The TNSP is required to abide by the regulatory requirements to publish a document annually, detailing the plans for the way that the transmission network will develop in the next five years. This plan covers a 10-year window. The requirements, furthermore, stipulate that the published document should include:
• the acquisition of servitudes for strategic purposes;
• a list of planned investments, including costs;
• diagrams displaying the planned changes to the transmission system (TS);
• an indication of the impact on customers in terms of service quality and cost; and
• any other information as specified by Nersa from time to time.
A further requirement is that the TNSP should hold public forums to share such plans with stakeholders in order to facilitate a joint planning process with them. The sixth TDP was published early in October 2014; this is the seventh publication based on the TDP for 2016 to 2025.
1.2 Major factor changes from the 2014 TDPThere have been some changes in the factors influencing the selection and timing of projects for this TDP from the previous TDP published in 2014. The two main factors include the capital constraints followed by the potential generation scenarios. Other changes are deferment of projects resulting from deferment of the need for system strengthening due to the lower load forecast, as well as delays in projects currently in the execution phase, mainly as a result of challenges in the acquisition of substation sites and servitudes for lines.
1.2.1 Capital constraintsDue to capital constraints being experienced Eskom has had to reprioritise projects to fit within the constraints of the remaining budget available to fund them. The reprioritised projects maximise the benefits accruing from the available capital, while minimising the risks to security and reliability of supply.
1.2.2 Generation assumptionsA number of generation projects that were assumed to be in place for the TDP studies for the period 2015 to 2024, have been changed in the generation assumptions for this TDP update period. These are discussed in section 3.2.
Chapter 1: Introduction
1.3 Structure of the documentThe document is structured in the following manner:
Chapter 2, IPPS: connections and strategic plans, deals with the strategic plans associated with connecting IPPS in the different provinces and sets the scene for the assumptions used in this plan.
Chapter 3, Load demand forecast and generation assumptions, deals with the electricity demand forecast and generation assumptions. The demand forecast determines how the network is planned and it contextualises the planning activity, whereas the generation assumptions outline the generation build that informs some of the planned transmission network, as a significant transmission network is required to evacuate power from the power stations to the load.
Chapter 4, Project updates. This chapter focuses on the major changes that have occurred since the completion of the previously published Transmission Development Plan (TDP). The major changes comprise the reprioritisation of projects in line with the changes from the previous generation assumptions to the ones informing this plan, changes in the load forecast advancing or deferring the need for network strengthening and delays in projects in the execution phase mainly as a result of challenges in the acquisition of sites for new substations or servitudes for new lines.
This chapter also focuses on the completed projects and projects nearing completion as well as grid connection applications processed by Transmission.

Transmission development plan 2016-2025 013
Chapter 5, National overview, deals with the national overview, which gives a high-level explanation of the planned transmission infrastructure. This is intended to give a snapshot of the major projects that are planned for the entire period of the tdp and a high-level summary of the installed transmission infrastructure.
Chapter 6, Breakdown of the tdp projects by province, focuses in detail on the planned projects and the impact they will have on the network. Generation integration and reliability projects are discussed per province. In both instances, sites and servitudes are required to accommodate substations and lines, respectively. In either case, the National Environmental Management Act requires Eskom to conduct an environmental impact assessment (EIA) and obtain environmental approval, which includes consultation with affected stakeholders, prior to construction.
Chapter 7, Grid access, deals with the strategic plan to integrate future generation onto the grid.
Chapter 8, Impact of the doe generation scenarios, deals with the different scenarios that can be expected for future generation in the different provinces and the planned corridors.
Chapter 9, Capital expenditure plan, deals with the forecasted costs of implementing the TDP.
Chapter 10, Conclusion, deals with various conclusions based on the content of this document.
Chapter 2 IPPS: Connections and strategic plans
There has been a significant change in the approach to the planning and implementation of the development of the future transmission grid, which has been driven by the new generation to be connected. The 2010 IRP calls for the connection of new types of generation, particularly renewable energy, which will be spread across wider areas of the country. Traditionally, Eskom integrated large centralised generation plant under its direction and new connections to the grid were primarily load customers. However, the future generation will largely be IPP developments, which are now also connection customers.
Major transmission infrastructure projects could take up to ten years to implement, moving from planning, environmental authorisation, procurement and construction to final commissioning. The IPP developments are of smaller sizes and can be delivered in relatively short periods, but as a result of a competitive process, the location of the successful bidders is only known at a late stage. If new transmission projects are required for the IPPs, it is difficult for them to be delivered within the desired target dates, which provides challenges for the future.
Eskom, especially its Transmission and Distribution Divisions, has been fully committed to meeting these challenges and enabling the integration and connection of the 2010 IRP generation, specifically the REIPPPP. A number of initiatives have been undertaken to facilitate the IPP programmes of the DoE.
These include:
• establishment of the Grid Access Unit (GAU) and the Single Buyer Office to facilitate the connection requests of IPP developers and buy the energy, respectively;
• creation of a simpler, faster connection application process, specifically for all new generation plant, which is applicable to both IPPs and new Eskom power plants;
• update of the applicable Grid Codes and connection agreements to encompass renewable generation plant;
• publication of the Grid Connection Capacity Assessment (GCCA) document to guide stakeholders to available network capacity in relation to the renewable energy resources and across the country for any type of IPP project;
• commitment of resources to work closely with the DoE IPP Office, with the intention of aligning the IPP programme with feasible network expansion plans;
• introduction of a Self-Build Procedure document that provides IPPs with the option to “self-build” their own dedicated connection infrastructure as well as shared network in exceptional cases;
• identification of strategic transmission line routes to unlock network capacity to connect future IPPs and collaborating with the Department of Environmental Affairs (DEA) to complete strategic environmental impact assessments (SEAs) of these routes; and
• participation in several external independent studies to identify the best resource areas for development such as renewable energy development zones (REDZs) and the impact of the integration of large volumes of renewable energy generation.
Chapter 2: IPPS: Connections and strategic plans
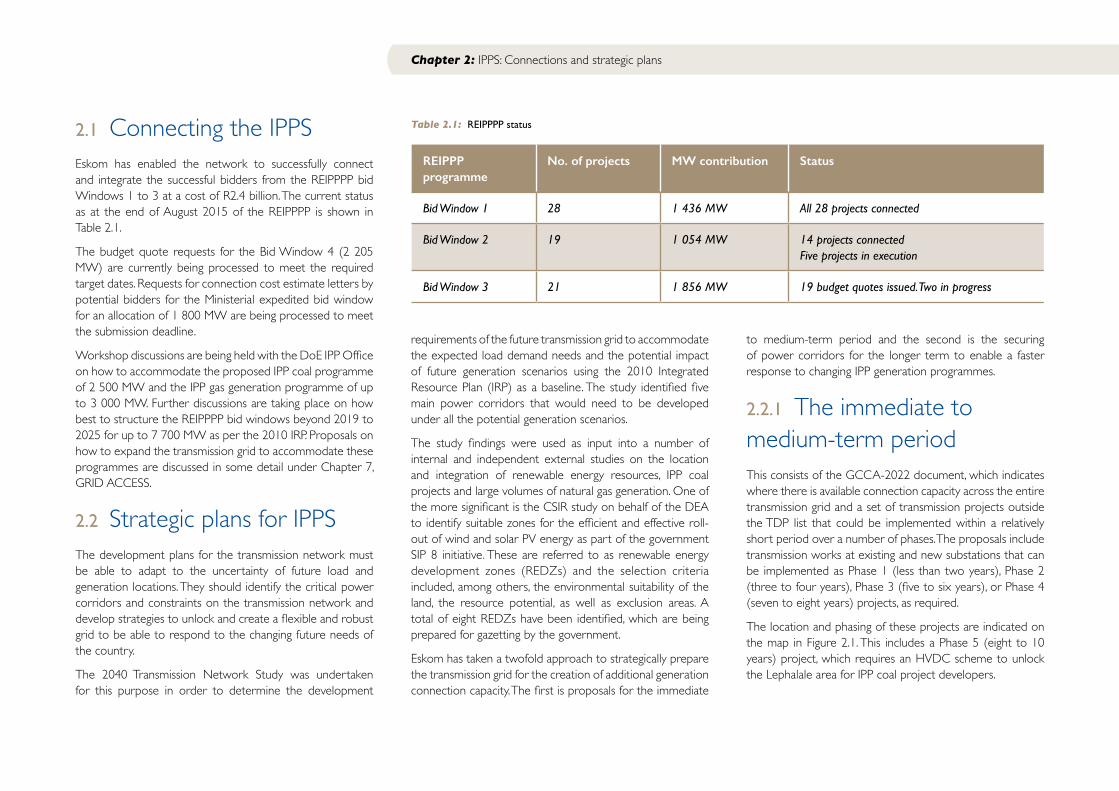
2.1 Connecting the IPPSEskom has enabled the network to successfully connect and integrate the successful bidders from the REIPPPP bid Windows 1 to 3 at a cost of R2.4 billion. The current status as at the end of August 2015 of the REIPPPP is shown in Table 2.1.
The budget quote requests for the Bid Window 4 (2 205 MW) are currently being processed to meet the required target dates. Requests for connection cost estimate letters by potential bidders for the Ministerial expedited bid window for an allocation of 1 800 MW are being processed to meet the submission deadline.
Workshop discussions are being held with the DoE IPP Office on how to accommodate the proposed IPP coal programme of 2 500 MW and the IPP gas generation programme of up to 3 000 MW. Further discussions are taking place on how best to structure the REIPPPP bid windows beyond 2019 to 2025 for up to 7 700 MW as per the 2010 IRP. Proposals on how to expand the transmission grid to accommodate these programmes are discussed in some detail under Chapter 7, GRID ACCESS.
2.2 Strategic plans for IPPSThe development plans for the transmission network must be able to adapt to the uncertainty of future load and generation locations. They should identify the critical power corridors and constraints on the transmission network and develop strategies to unlock and create a flexible and robust grid to be able to respond to the changing future needs of the country.
The 2040 Transmission Network Study was undertaken for this purpose in order to determine the development
requirements of the future transmission grid to accommodate the expected load demand needs and the potential impact of future generation scenarios using the 2010 Integrated Resource Plan (IRP) as a baseline. The study identified five main power corridors that would need to be developed under all the potential generation scenarios.
The study findings were used as input into a number of internal and independent external studies on the location and integration of renewable energy resources, IPP coal projects and large volumes of natural gas generation. One of the more significant is the CSIR study on behalf of the DEA to identify suitable zones for the efficient and effective roll-out of wind and solar PV energy as part of the government SIP 8 initiative. These are referred to as renewable energy development zones (REDZs) and the selection criteria included, among others, the environmental suitability of the land, the resource potential, as well as exclusion areas. A total of eight REDZs have been identified, which are being prepared for gazetting by the government.
Eskom has taken a twofold approach to strategically prepare the transmission grid for the creation of additional generation connection capacity. The first is proposals for the immediate
Chapter 2: IPPS: Connections and strategic plans
to medium-term period and the second is the securing of power corridors for the longer term to enable a faster response to changing IPP generation programmes.
2.2.1 The immediate to medium-term periodThis consists of the GCCA-2022 document, which indicates where there is available connection capacity across the entire transmission grid and a set of transmission projects outside the TDP list that could be implemented within a relatively short period over a number of phases. The proposals include transmission works at existing and new substations that can be implemented as Phase 1 (less than two years), Phase 2 (three to four years), Phase 3 (five to six years), or Phase 4 (seven to eight years) projects, as required.
The location and phasing of these projects are indicated on the map in Figure 2.1. This includes a Phase 5 (eight to 10 years) project, which requires an HVDC scheme to unlock the Lephalale area for IPP coal project developers.
REIPPP programme
No. of projects MW contribution Status
Bid Window 1 28 1 436 MW All 28 projects connected
Bid Window 2 19 1 054 MW 14 projects connectedFive projects in execution
Bid Window 3 21 1 856 MW 19 budget quotes issued. Two in progress
Table 2.1: REIPPPP status

Transmission development plan 2016-2025 015
2.2.2 Power corridors for the longer termThe key to a flexible and robust transmission grid is to secure power corridor routes with most of the rights and approvals in place, so that new transmission lines can be constructed quickly as required when the actual generation is selected and confirmed for integration. To this end, Eskom has been working closely with the DEA on a national SEA study project that is part of the SIP 10 initiative from the National Development Plan of the government.
The objective is to complete all the environmental studies and secure all the required environmental and related approvals for transmission lines and substations within the five identified corridors. The corridors will be 100 km wide and the secured approvals will be valid for extended periods in order to allow the acquisition of line servitudes and substation sites for strategic purposes. The intention is to have these power corridors gazetted in early 2016.
The five transmission power corridors are shown on the map in Figure 2.2.
Chapter 2: IPPS: Connections and strategic plans
Figure 2.1: Generation connection capacity for the immediate to medium term
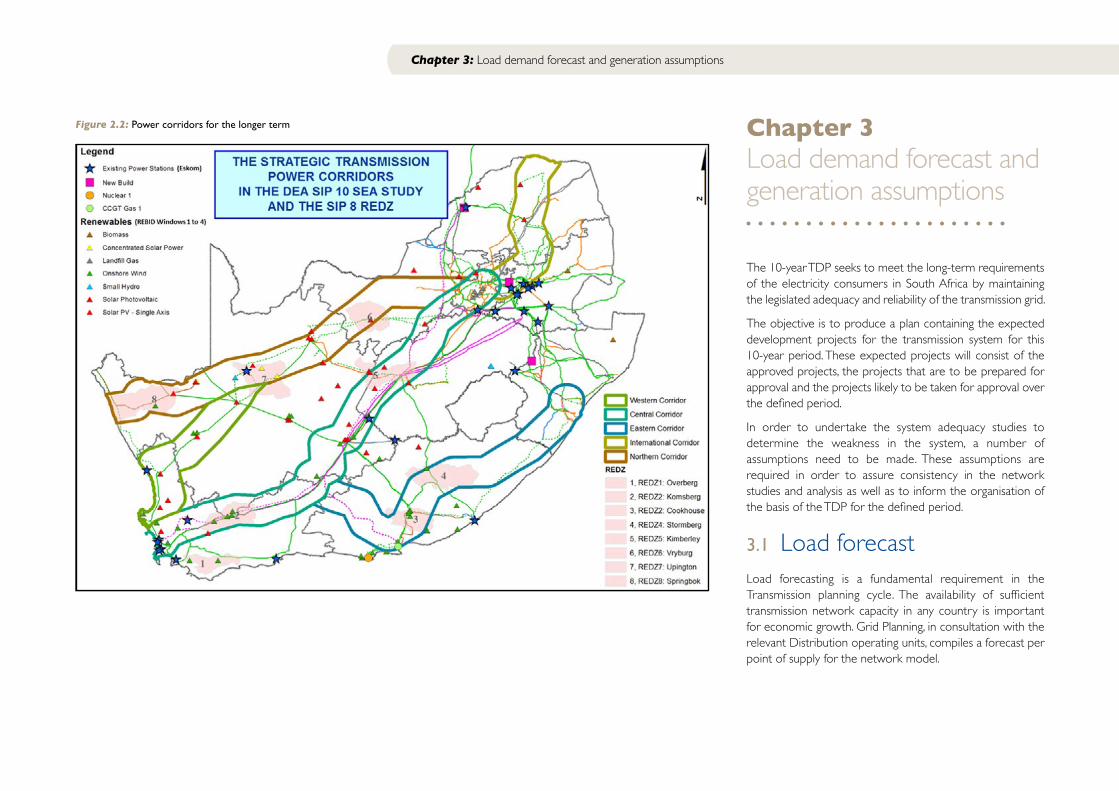
Figure 2.2: Power corridors for the longer term
Chapter 3: Load demand forecast and generation assumptions
Chapter 3 Load demand forecast and generation assumptions
The 10-year TDP seeks to meet the long-term requirements of the electricity consumers in South Africa by maintaining the legislated adequacy and reliability of the transmission grid.
The objective is to produce a plan containing the expected development projects for the transmission system for this 10-year period. These expected projects will consist of the approved projects, the projects that are to be prepared for approval and the projects likely to be taken for approval over the defined period.
In order to undertake the system adequacy studies to determine the weakness in the system, a number of assumptions need to be made. These assumptions are required in order to assure consistency in the network studies and analysis as well as to inform the organisation of the basis of the TDP for the defined period.
3.1 Load forecastLoad forecasting is a fundamental requirement in the Transmission planning cycle. The availability of sufficient transmission network capacity in any country is important for economic growth. Grid Planning, in consultation with the relevant Distribution operating units, compiles a forecast per point of supply for the network model.
Transmission development plan 2016-2025 017
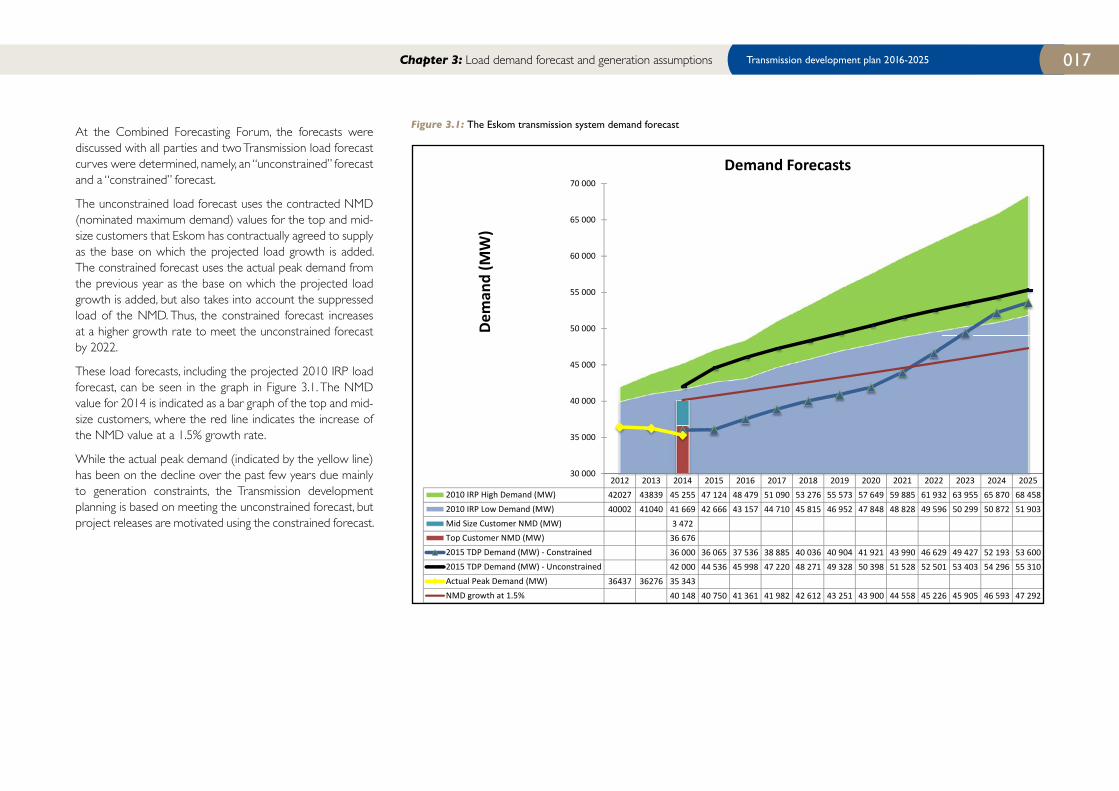
At the Combined Forecasting Forum, the forecasts were discussed with all parties and two Transmission load forecast curves were determined, namely, an “unconstrained” forecast and a “constrained” forecast.
The unconstrained load forecast uses the contracted NMD (nominated maximum demand) values for the top and mid-size customers that Eskom has contractually agreed to supply as the base on which the projected load growth is added. The constrained forecast uses the actual peak demand from the previous year as the base on which the projected load growth is added, but also takes into account the suppressed load of the NMD. Thus, the constrained forecast increases at a higher growth rate to meet the unconstrained forecast by 2022.
These load forecasts, including the projected 2010 IRP load forecast, can be seen in the graph in Figure 3.1. The NMD value for 2014 is indicated as a bar graph of the top and mid-size customers, where the red line indicates the increase of the NMD value at a 1.5% growth rate.
While the actual peak demand (indicated by the yellow line) has been on the decline over the past few years due mainly to generation constraints, the Transmission development planning is based on meeting the unconstrained forecast, but project releases are motivated using the constrained forecast.
Chapter 3: Load demand forecast and generation assumptions
Figure 3.1: The Eskom transmission system demand forecast
2012 2013 2014 2015 2016 2017 2018 2019 2020 2021 2022 2023 2024 20252010 IRP High Demand (MW) 42027 43839 45 255 47 124 48 479 51 090 53 276 55 573 57 649 59 885 61 932 63 955 65 870 68 4582010 IRP Low Demand (MW) 40002 41040 41 669 42 666 43 157 44 710 45 815 46 952 47 848 48 828 49 596 50 299 50 872 51 903Mid Size Customer NMD (MW) 3 472Top Customer NMD (MW) 36 6762015 TDP Demand (MW) - Constrained 36 000 36 065 37 536 38 885 40 036 40 904 41 921 43 990 46 629 49 427 52 193 53 6002015 TDP Demand (MW) - Unconstrained 42 000 44 536 45 998 47 220 48 271 49 328 50 398 51 528 52 501 53 403 54 296 55 310Actual Peak Demand (MW) 36437 36276 35 343NMD growth at 1.5% 40 148 40 750 41 361 41 982 42 612 43 251 43 900 44 558 45 226 45 905 46 593 47 292
30 000
35 000
40 000
45 000
50 000
55 000
60 000
65 000
70 000
Dem
and
(MW
)
Demand Forecasts

3.2 Generation assumptionsThe Department of Energy (DoE) is accountable for the country energy plan. This country energy plan is termed the Integrated Resource Plan (IRP). The IRP is intended to drive all new generation capacity development for South Africa. Nersa will then license new generators according to this determination.
The current IRP is still the “Integrated Resource Plan for Electricity 2010 to 2030”, referred to as the 2010 IRP in this document, which was gazetted on 6 May 2011 by the government. A draft updated IRP version was released in December 2013 for comment and the generation assumptions have taken cognisance of this draft but are still primarily based on the official 2010 IRP document. Consideration has also been given to the proposed IPP programmes of the DoE, such as future REIPPPP bid windows for renewables, a coal IPP programme and a gas generation programme (to be based on the Gas Utilisation Master Plan (GUMP) proposals).
This has produced a “baseline” TDP generation scenario assumption, which is presented below. In addition, discussions
Chapter 3: Load demand forecast and generation assumptions
were held with the DoE regarding possible different IPP generation scenarios to be considered for the TDP period. However, the inclusion of different generation scenarios produces a number of transmission infrastructure projects. Thus, such a TDP will have to contain a large number of potential projects in the last part of the planning period.
The final proposals for generation scenarios from the DoE were tabled close to the end of the planning study cycle for this TDP period. It was therefore agreed that only the potential impact of these possible generation scenarios on the TDP would be identified at a high level.
The generation assumptions for the TDP would therefore be considered as the “baseline” scenario, which was a reasonable representation of the expected future generation for the TDP period. The assumptions for the additional generation scenarios and their potential impact on the TDP project requirements are discussed in Section 8: Impact of the DoE Generation Scenarios.
The generation assumptions for the TDP period were fixed in January 2015 based on what was known and expected at the time, guided by the IRP and are discussed below.
3.2.1 Existing and approved power stationsThe existing generation plant is assumed to be available over the 2016 to 2025 period, except for the units expected to be decommissioned at three power stations by 2025 in line with their decommissioning schedules. New generation will be added to the network over this period, which contains both approved new power stations and proposed “New Build” power stations.
The currently approved new Eskom major power stations are as follows:
• Medupi – 6 x 800 MW units coal-fired – 738 MW sent out per unit
• Kusile – 6 x 800 MW units coal-fired – 738 MW sent out per unit
• Ingula – 4 x 333 MW units pumped-storage – 333 MW sent out per unit
In order to achieve the proposed plan, a number of assumptions regarding size and location of the future planned generation plant had to be made. These assumptions are discussed below and are shown in Tables A1 and A2 in Appendix A.
3.2.2 DoE OCGT power stationsThe Department of Energy (DoE) should have implemented the two OCGT power stations, located at the Dedisa and Avon substations, by 2013 but are assumed to be completed in 2015 in time for the 2016 system peak and. They have been based on 147 MW units; however, the generators to be installed are understood to be 170 MW units. For the TDP
Transmission development plan 2016-2025 019
studies, they have been modelled as follows:
• 2 x 147 MW units at Dedisa
• 5 x 147 MW units at Avon
3.2.3 Ingula Pumped-storageThe Ingula Pumped-storage Power Station is an approved project. The project has been rescheduled, with further delays and has been assumed to only have Units 1 and 2 completed in time for the 2016 system peak, with Unit 3 completed late in 2016 and Unit 4 completed in 2017 in time for the 2017 system peak.
3.2.4 Coal generationBaseload coal (Medupi and Kusile)
The baseload coal power stations at Medupi and Kusile are approved projects. However, both projects have been rescheduled, with Medupi delayed and Kusile brought forward.
The first Medupi unit (unit 6) has been delayed from 2013 to late 2015, with the first unit only available for the 2016 system peak; the last unit will be completed before the 2019 system peak. The first unit at Kusile has been brought forward from 2017 to 2016 and will assist with system peak. The roll-out will be slower than Medupi, with the last unit in place for the 2020 system peak.
No further large Eskom-built base load coal-fired power stations are expected for the ten year period of 2016 to 2025.
New build coal options
The 2010 IRP has provision for new coal-fired power stations under the New Build options. These are smaller than the traditional Eskom base load coal power stations and it has been assumed that these would be IPP coal power stations,
with smaller units to match the 2010 IRP requirements. This is in line with the DoE programme to have a coal IPP procurement programme with a maximum power station size of 600 MW. In order to model the potential integration for this programme, a number of separate IPP coal power stations have been assumed for the TDP analysis.
A total of four new IPPs have been assumed, referred to as Coal IPP 1, Coal IPP 2, Coal IPP 3 and Coal IPP 4. Two are assumed to be the same as for the previous TDP, namely, Coal IPP 1 and Coal IPP 3, except reduced to 400 MW each (2 x 200 MW units each). Coal IPP 1 will be in the Witbank area in 2019 and Coal IPP 3 is modelled as a 400 MW power station in 2020, also in the greater Witbank area.
The other two power stations, Coal IPP 2 and Coal IPP 4, represent the balance of the proposed coal IPP programme. Coal IPP 2 has been allocated as a 1 000 MW power station (4 x 250 MW units) and Coal IPP 4 is a new 1 250 MW (5 x 250 MW) power station, both from 2022. Both are in the Lephalale area and are assumed to be connected to the Massa substation via the 400 kV busbar.
Coal IPP 1 and Coal IPP 3 represent the coal power stations not in Lephalale that can be connected before 2022. Coal IPP 2 and Coal IPP 4 represent the coal power stations that can be connected in the Lephalale area, but only from 2022. This is because the integration of Medupi does not allow for the connection of any new significant generation due to the lack of transmission infrastructure. In order to allow the connection of new generation in the Lephalale area, it is proposed to establish a new HVDC scheme to connect this area into Johannesburg. This will be achieved by having the sending HVDC terminal at the Massa substation and two HVDC terminals at the Juno B and Etna substations. The HVDC capacity will be 3 000 MW, with 2 000 MW under normal operation from 2022 to 2025.
Decommissioning of coal units
The 2010 IRP indicates that the first decommissioning of large coal units will start in 2022. This will be an equivalent of five 380 MW units at Camden in 2022. However, Eskom has started to consider the decommissioning of the older coal-fired power station units. According to the proposed Eskom schedule units will start to be decommissioned at Camden and Hendrina from 2020. In 2022, units will start to be decommissioned at Arnot.
For the purposes of the TDP studies, the proposed Eskom decommissioning has been modelled one year later than what was assumed in the previous TDP period, namely, starting from 2021 instead of 2020, to determine the impact on the transmission grid. The schedule is shown in Table A1 in Appendix A.
3.2.5 Nuclear generationFor this TDP update, the Nuclear 1 Power Station has been included from 2023. It has been assumed to be established at the Thyspunt site near Port Elizabeth. The integration is as modelled in earlier TDP studies, with five 400 kV lines. Three units of 1 600 MW each are assumed.
3.2.6 Open and combined-cycle gas generation (OCGT and CCGT)There are a number of open-cycle gas turbine (OCGT) and combined-cycle gas turbine (CCGT) generation plants proposed as New Build options, giving a total of 711 MW OCGT and 1 614 MW CCGT. Based on the assumption that the CCGT would require an LNG plant and that a minimum of 2 000 MW would be required to make this economically viable, the site has been selected as Dedisa near Coega.
Chapter 3: Load demand forecast and generation assumptions
The unit sizes at Dedisa have been assumed as follows:
• OCGT (2 x 237 MW) from 2019 to 2021
• CCGT (3 x 269 MW) in 2022
• CCGT (3 x 269 MW) in 2025
3.2.7 Imported hydropowerThere is an assumption of 1 143 MW of impor ted hydropower in 2022 and a fur ther 1 183 MW in 2023. The most likely place from which this hydro will come is Northern Mozambique. This will be transported down to the Maputo area via the proposed Mozambique transmission backbone project (referred to as the STE project). This will effectivley relocate the power to Maputo. For the purposes of the TDP studies, this will relieve the Mozal load in Maputo, which Eskom is required to supply. Therefore, the hydro import can be modelled as four 570 MW generators placed at the Maputo 400 kV substation.
3.2.8 Cogeneration projects and MTPPPA total of 390 MW of cogeneration plant was included in the 2010 IRP by 2013. The MTPPP programme, which offered PPA contracts to any generators that fell below a certain price level, was not considered at transmission level, as most were less than 20 MW in size.
3.2.9 Renewable energy IPP generationThe REIPPPP (also referred to as the REBID programme) has
gone out for procurement, with Windows 1 and 2 already completed, Window 3 close to financial close and the Bid Window 4 shortlist about to be announced at the time the TDP studies were started. The REIPPPP allows IPPs to bid tariffs, with maximum tariff limits for the following renewables:
• Wind
• Small hydro
• Landfill gas
• Concentrated solar
• Photovoltaic (PV)
Windows 1 and 2 of the REIPPPP allow for the renewable generation to be connected by the end of 2014 and the end of 2016, respectively. It has been assumed that the successful IPPs for Windows 1 and 2 will be in place for the system peaks of 2015 and 2017, respectively. The Window 3 shortlisted projects have been assumed to be in service as per their bid submission dates between 2016 and 2017. The two CSP plants from Bid Window 3 of 100 MW each are connected at the Ferrum and Olien substations. The best estimate of the potential Bid Window 4 shortlist was made in January 2015.
The IPP renewable generators have been assumed to be connected to the transmission substation that either supplies the distribution network to which they are connected or is the point of connection. The REIPPPP projects and future IPP assumed projects are indicated in the renewable energy generation schedule in Table A2 in Appendix A.
Wind generation
From 2019 onwards to 2025, wind generation has been allocated as 100 MW or 200 MW units to various transmission substations per year to determine the overall impact on the transmission power flows. By 2025, the locations are aligned overall with the expected “wind area” allocation assumed in
the “Assumptions Paper for the 2040 Transmission Network Study”, dated August 2011. In addition, the substation allocations have taken the following study and grid capacity increase proposals into account:
• The proposed REDZ areas from the government SIP 8 project
• The Eskom study to map and quantify RE developer interest
• The Eskom proposals to the DoE for phased transmission projects to increase grid connection capacity for RE generators
The units are connected to the 66 kV or 132 kV busbars of the transmission substations, as appropriate, which are listed in Table A2 in Appendix A.
PV solar generation
A significant amount of PV has been allocated under New Build options in the 2010 IRP, with over 4 900 MW by 2025. The government REIPPPP programme has resulted in a large number of PV solar plants being installed. PV can only operate when there is sunlight and will therefore not be available for the system peak, which occurs in the evening during winter. While PV does not contribute to meeting the peak system demand, it does make a significant contribution to the energy supplied during daylight hours and a reduction in South Africa’s carbon footprint. This in turn will start to have an impact on the transmission grid performance during the day and is the subject of a number of impact studies under way separate from the TDP studies.
Concentrated solar power (CSP) generation
The concentrated solar power (CSP) generation has been set at 1 000 MW. The five successful CSP projects from the REIPPPP windows have been allocated to Upington, Garona, Paulputs, Ferrum and Olien.
Chapter 3: Load demand forecast and generation assumptions
Transmission development plan 2016-2025 021
The balance of the CSP generation is modelled as 100 MW units at Upington, Garona and Ferrum substations. These units will be run at maximum output during both the system peak and the local peak. They will not be run during the low load conditions at night.
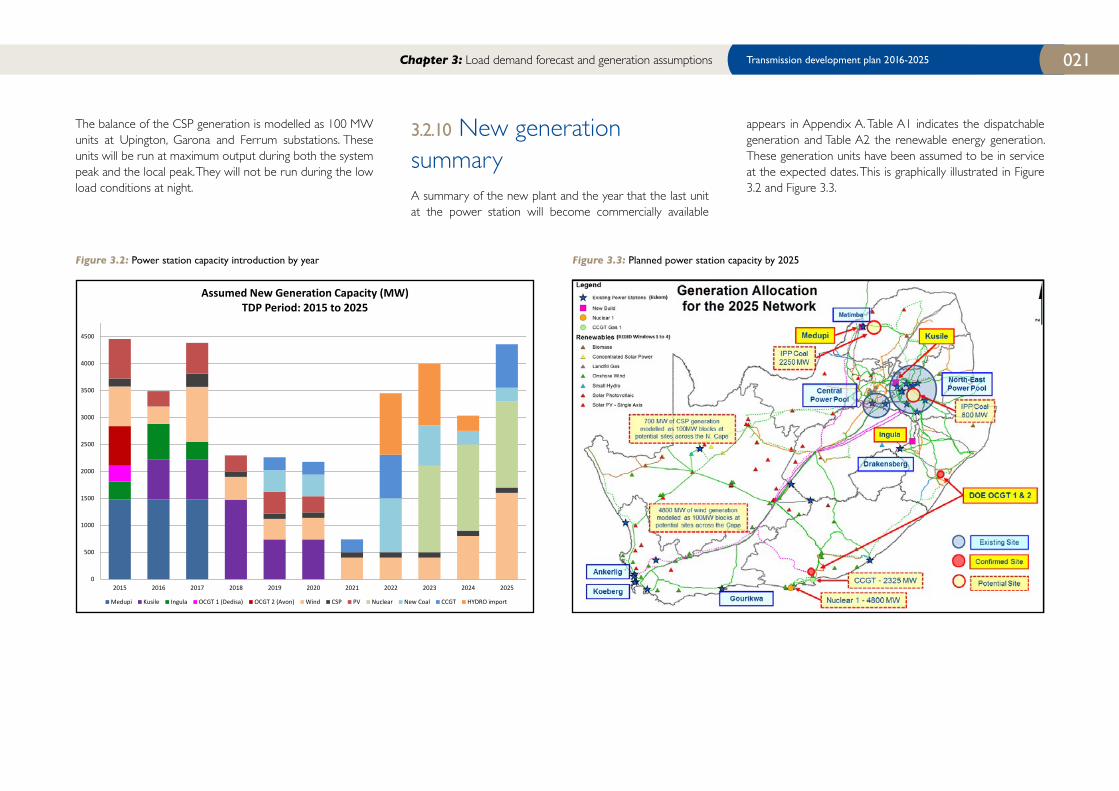
3.2.10 New generation summaryA summary of the new plant and the year that the last unit at the power station will become commercially available
appears in Appendix A. Table A1 indicates the dispatchable generation and Table A2 the renewable energy generation. These generation units have been assumed to be in service at the expected dates. This is graphically illustrated in Figure 3.2 and Figure 3.3.
Figure 3.2: Power station capacity introduction by year Figure 3.3: Planned power station capacity by 2025
Chapter 3: Load demand forecast and generation assumptions
0
500
1000
1500
2000
2500
3000
3500
4000
4500
2015 2016 2017 2018 2019 2020 2021 2022 2023 2024 2025
Assumed New Generation Capacity (MW)TDP Period: 2015 to 2025
Medupi Kusile Ingula OCGT 1 (Dedisa) OCGT 2 (Avon) Wind CSP PV Nuclear New Coal CCGT HYDRO import
PROVINCE PROJECT NAME
Eastern Cape
Neptune-Vuyani 1st 400 kV line
Vuyani (Mthatha) 400/132 kV substation (1st and 2nd 250 MVA transformers)
Eros-Vuyani 1st 400 kV line
Free State Merapi Ext. 3rd 250 MVA 275/132 kV transformer
GautengApollo-Pluto 400 kV loop-in-out Thuso
Thuso 400/132 kV substation (1st and 2nd 250 MVA transformers)
Limpopo
Dinaledi-Spitskop 1st 400 kV line
Dinaledi-Spitskop 2nd 400 kV line
Medupi-Spitskop 1st 400 kV line
Medupi-Marang 1st 400 kV
Medupi 400/132 kV 2 x 250 MVA substation
Mpumalanga Kusile 400 kV loop-in (Apollo-Kendal 1st 400 kV line)
Northern Cape
Mercury-Mookodi (Vryburg) 1st 400 kV line
Ferrum Ext. 1st and 2nd 500 MVA 400/132 kV transformers
Ferrum-Mookodi (Vryburg) 1st 400 kV line
Western Cape
Gamma Ext. 765 kV busbar establishment
Kappa 400 kV loop-ins (Droërivier-Bacchus and Droërivier-Muldersvlei 400 kV lines)
Kappa 765/400 kV substation
Kappa Ext. 400 kV 100 MVar shunt reactor
Gamma-Kappa 1st 765 kV line
Chapter 4 Project updates
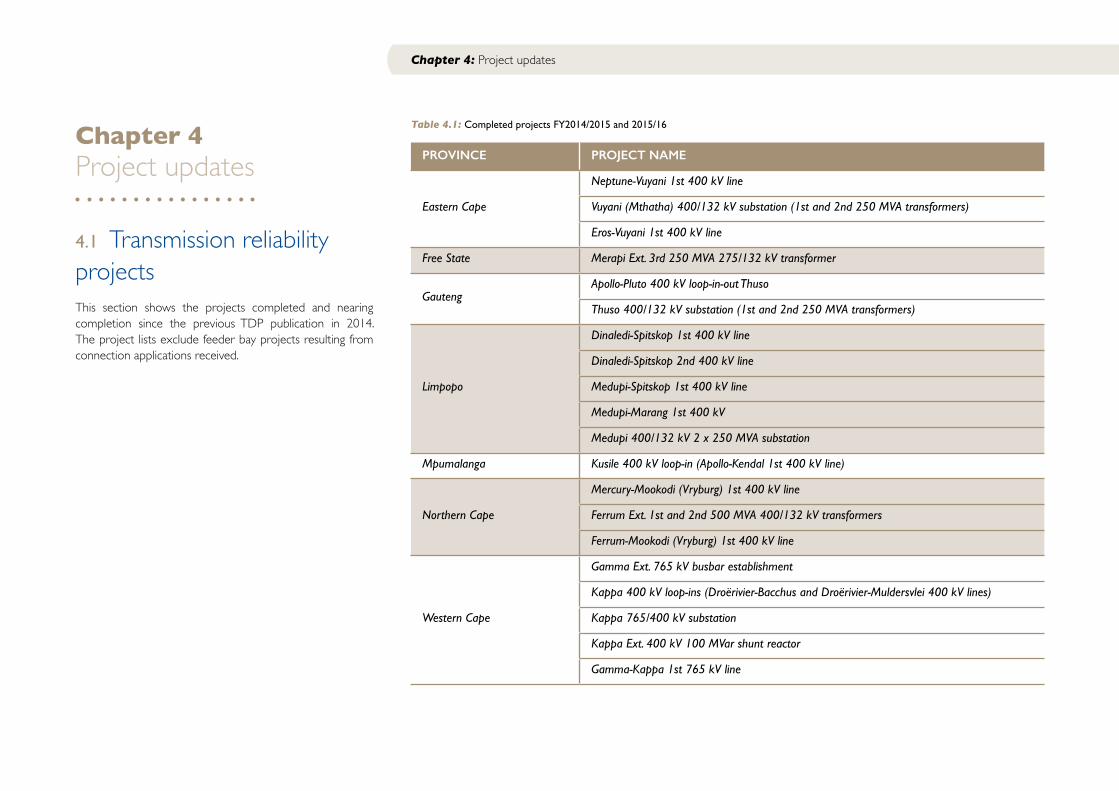
4.1 Transmission reliability projectsThis section shows the projects completed and nearing completion since the previous TDP publication in 2014. The project lists exclude feeder bay projects resulting from connection applications received.
Chapter 4: Project updates
Table 4.1: Completed projects FY2014/2015 and 2015/16
Transmission development plan 2016-2025 023
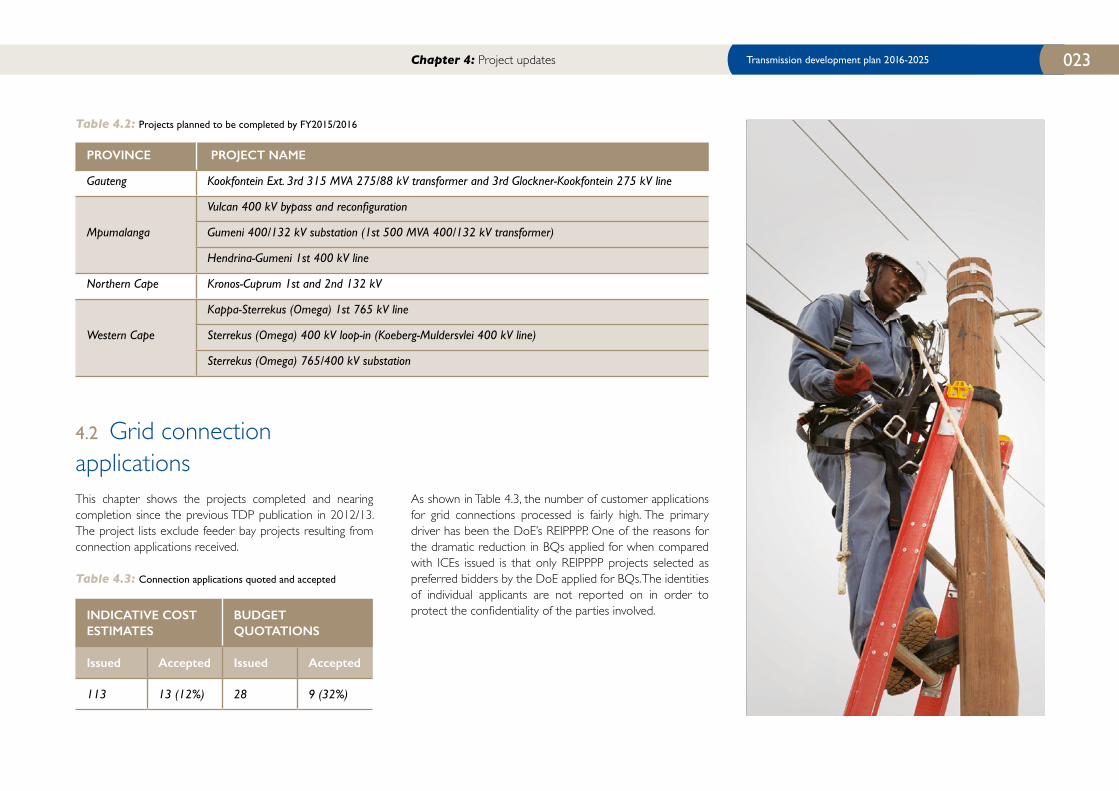
As shown in Table 4.3, the number of customer applications for grid connections processed is fairly high. The primary driver has been the DoE’s REIPPPP. One of the reasons for the dramatic reduction in BQs applied for when compared with ICEs issued is that only REIPPPP projects selected as preferred bidders by the DoE applied for BQs. The identities of individual applicants are not reported on in order to protect the confidentiality of the parties involved.
Chapter 4: Project updates
Table 4.2: Projects planned to be completed by FY2015/2016
PROVINCE PROJECT NAME
Gauteng Kookfontein Ext. 3rd 315 MVA 275/88 kV transformer and 3rd Glockner-Kookfontein 275 kV line
Mpumalanga
Vulcan 400 kV bypass and reconfiguration
Gumeni 400/132 kV substation (1st 500 MVA 400/132 kV transformer)
Hendrina-Gumeni 1st 400 kV line
Northern Cape Kronos-Cuprum 1st and 2nd 132 kV
Western Cape
Kappa-Sterrekus (Omega) 1st 765 kV line
Sterrekus (Omega) 400 kV loop-in (Koeberg-Muldersvlei 400 kV line)
Sterrekus (Omega) 765/400 kV substation
4.2 Grid connection applicationsThis chapter shows the projects completed and nearing completion since the previous TDP publication in 2012/13. The project lists exclude feeder bay projects resulting from connection applications received.
Table 4.3: Connection applications quoted and accepted
INDICATIVE COST ESTIMATES
BUDGET QUOTATIONS
Issued Accepted Issued Accepted
113 13 (12%) 28 9 (32%)

Chapter 5 National overview
Significant lengths of new transmission lines and associated substations and substation equipment are being added to the system. These additions are mainly due to the major 765 kV network reinforcements required for the supply to the Cape and KwaZulu-Natal. The integration of Units 5, 4, 3, 2 and 1 of the new Medupi Power Station in the developing Limpopo West Power Pool requires significant additional lengths of transmission line. The HVDC lines/system required for further generation developments in the Limpopo province
Chapter 5: National overview
are not included, since they will only be required after 2025 and details can only be confirmed once more is known about the size, location and timing of these developments.
The establishment of large-scale renewable energy generation is becoming the primary driver of network development in the three Cape provinces, apart from the Cape Corridor projects, the base metals mining area in the Northern Cape and the established metropolitan load centres of Cape Town, Port Elizabeth and East London. These new transmission lines form part of the long-term strategy to develop a main transmission backbone from which regional power corridors can be supported. These power corridors will connect generation pools to one another and to the major load centres in the country. This backbone and regional power corridor network structure will allow the increasing system demand to be supplied and the power from new
power stations to be integrated more efficiently into the transmission network and distributed, where required, both under system-healthy and system contingency conditions.
The development of the transmission backbone and the associated regional power corridors was reviewed as part of the Strategic Grid Study, which considered the potential development scenarios beyond the 10-year horizon of the TDP. The objective of this strategic study was to align the transmission network with the requirements of the generation future options and those of the growing and future load centres. This Strategic Grid Study has enabled the 10-year TDP to be aligned with the future long-term development of the whole Eskom system. It also ensures that the most appropriate technologies are used for this purpose by testing whether other technologies (for example, HVDC) would likely yield better, more practical and more cost-effective solutions.

Transmission development plan 2016-2025 025
Figure 5.1: Map showing relative location of the major TDP scheme projectsThe additional transformer capacity added to the transmission system is an indication of the increase in load demand and in the firm capacity requirements of the customers, as well as what is required to achieve compliance with the minimum N-1 redundancy requirements contained in the Grid Code.
Additional capacitive support is required to support areas of the network under contingency conditions to ensure that the required voltage levels are maintained and enable more expensive network strengthening such as additional lines to be deferred. It also improves system efficiency by reducing network losses. A number of series compensation projects are also required on the 765 kV and 400 kV lines in order to improve the power transfer capability of the Cape power corridors.
Additional shunt reactors are a direct result of the long lengths of the 765 kV and the 400 kV transmission lines that will be constructed over this period. They are needed to enable safe and secure operation of the system and to prevent overvoltages during light loading conditions. Some projects have associated distribution projects to enable customers to benefit from them. For example, a new substation may require distribution infrastructure to link it to the existing distribution network or to connect new bulk loads. Distribution infrastructure and individual feeder bays to connect distribution infrastructure or bulk loads are not individually included in this report.
The map in Figure 5 1 shows a high-level view of the major TDP scheme projects. The relative location of the new transmission lines and associated transmission substations is indicated schematically in the figure.
Chapter 5: National overview

NATIONAL TRANSMISSION ASSETS
NEW ASSETS EXPECTED IN 2016 - 2020
NEW ASSETS EXPECTED IN 2021 - 2025
TOTAL NEW ASSETS
POWER LINES (KM)
765 kV 350 1 760 2 110
400 kV 2 589 4 915 7 504
275 kV 19 336 355
Total length (km) 2 958 7 011 9 969
TRANSFORMERS
Number of units 71 94 165
Total capacity (MVA) 29 240 46 155 75 395
Capacitors
Number of banks 15 6 21
Total capacity (MVar) 1 308 676 1 984
Reactors
Number of banks 6 15 21
Total capacity (MVar) 667.5 3 100 3 767.5
Table 5.1: Major TDP transmission assets expected to be installed
Chapter 6: Breakdown of the TDP projects by province
Chapter 6 Breakdown of the TDP projects by province
6.1 Gauteng provinceThe Gauteng province is the hub of economic activity in South Africa and accounts for about 27% of electricity consumption in the country. The province is home to the Johannesburg Stock Exchange (JSE), other major financial institutions and large commercial and industrial establishments. Large municipalities (redistributors) are the dominant players, accounting for about 75% of electricity consumption in the province.
The Gauteng transmission network is predominantly connected at 275 kV voltage level, with a few transmission stations connected at 400 kV. Gauteng is primarily supplied by various power stations in the Mpumalanga Power Pool with additional support from Lethabo Power Station in the Free State province and the Songo-Apollo HVDC link that imports power from Mozambique. There are independent power stations, named Kelvin and Rooiwal, in the Johannesburg and Tshwane Municipalities, respectively.
Major transmission network development schemes planned include the Johannesburg East Strengthening, Johannesburg North Strengthening, Tshwane Strengthening, West Rand Strengthening and Vaal Strengthening. The current transmission network is shown in Figure 6.1.
The load forecast for the Gauteng province is shown in Figure 6.2.

Transmission development plan 2016-2025 027
6.1.1 Major schemesThe major TDP schemes for the Gauteng province are as follows:
Johannesburg North Strengthening
The scheme is required to resolve the thermal and low-voltage constraints in the Johannesburg North CLN and to support future loads in the CLN. 2 x 150 MVar capacitor banks will be installed at Lepini 275 kV and the Apollo-Lepini 275 kV line will be built to strengthen supply into Lepini substation. Demeter and Kyalami 400 kV substations will be established south of Lenasia and Kyalami respectively.
Vaal Strengthening
The scheme proposes the construction of 2 x Glockner-Etna 400 kV lines and uprating of underrated terminal equipment in order to deload the overloaded lines in the Vaal and West Rand CLN. Phase 1 of the project, that was completed in 2014 entailed; closing the Hera-Bernina 275 kV link, was completed in 2014. These lines will be energised at 275 kV until the introduction of the 400 kV voltage level at Etna substation.
Simmerpan 275 kV Integration
Simmerpan Strengthening will address unfirm transformation at Jupiter substation and alleviate thermal constraints at the Simmerpan 88 kV distribution substation due to load increases in the Ekurhuleni area. The scope of work includes establishing a 275 kV transmission substation adjacent to the Simmerpan distribution substation and installing 2 x 160 MVA 275/88 kV transformers. Simmerpan 275 kV substation will be energised from the planned Jupiter B substation via the existing Jupiter–Simmerpan 275 kV lines (currently energised at 88 kV). The substation will be extended further to accommodate 2 x 250 MVA 275/132 kV transformers.
Chapter 6: Breakdown of the TDP projects by province
Figure 6.1: Current Gauteng province network diagram

Chapter 6: Breakdown of the TDP projects by province
Soweto Strengthening
The focus of this scheme is to ensure Grid Code compliance for Taunus and Fordsburg substations and address the expected thermal constraints in the Soweto distribution network. The scope of work includes establishing the new Quattro substation that will be equipped with 2 x 315 MVA 275/88 kV transformers belonging to City Power and 2 x 500 MVA 275/132 kV transformers belonging to Eskom. Two 400 kV lines (energised at 275 kV) will be built from Etna, south of Lenasia to Quattro, in the Soweto supply area.
Johannesburg East Strengthening
This scheme will address network constraints in the East Rand and Johannesburg South CLNs. The planned construction of 2 x Apollo-North Rand 400 kV lines (energised at 275 kV) and two Matla-Jupiter B 400 kV lines (energised at 275 kV) will result in an increase in transfer limits in the East Rand and Johannesburg South CLNs. Furthermore, the Sebenza 275/88 kV substation (400/88 kV construction) that City Power is building will deload Prospect Substation and create more capacity in the East Rand.
West Rand Strengthening
This scheme addresses future thermal, substation compliance and distribution network constraints in the West Rand CLN.
• Westgate 400 kV Integration
The project entails establishing 400 kV at Westgate, building the Hera-Westgate 400 kV line and installing a 500 MVA 400/132 kV transformer at Westgate.
• Etna 400 kV Integration
Figure 6.2: Gauteng province load forecast
2015 2016 2017 2018 2019 2020 2021 2022 2023 2024 2025VAAL 1486 1584 1693 1708 1723 1743 1763 1782 1801 1820 1833JHB NORTH 1670 1772 1888 1924 1956 1991 2047 2075 2160 2465 2569EAST RAND 1885 1933 2043 2067 2096 2116 2137 2158 1964 2087 2157WEST RAND 2170 2201 2233 2263 2282 2304 2960 3003 3035 3086 3148TSHWANE 2321 2376 2432 2478 2525 2573 2632 2688 2732 2788 2844JHB SOUTH 2342 2445 2616 2678 2755 2831 2934 3001 3067 3139 3203TOSP 11598 11736 11823 12094 13201 13243 13436 13612 13957 13986 14248
0
2000
4000
6000
8000
10000
12000
14000
16000
Load
(MW
)
Gauteng Province Load Forecast
Transmission development plan 2016-2025 029
The scope of work includes establishing 400 kV at Etna and installing 2 x 800 MVA 400/275 kV and 1 x 315 MVA 400/88 kV transformers. The Etna-Glockner lines will then be operated at 400 kV.
• Taunus 400 kV Integration
The project entails establishing 400 kV at Taunus, building the Etna-Taunus 400 kV line and installing a 500 MVA 400/132 kV transformer at Taunus.
Tshwane Strengthening
The Tshwane strengthening scheme addresses transformation unfirmness due to load increases at substations in the Tshwane CLN. Diphororo (Phoebus) 400/132 kV substation to be equipped with 2 x 500 MVA transformers will cater for load growth in the Garankuwa and Soshanguve areas. Wildebees 400/132 kV substation, to be built in the Mmamelodi area will be equipped with 2 x 315 MVA transformers.
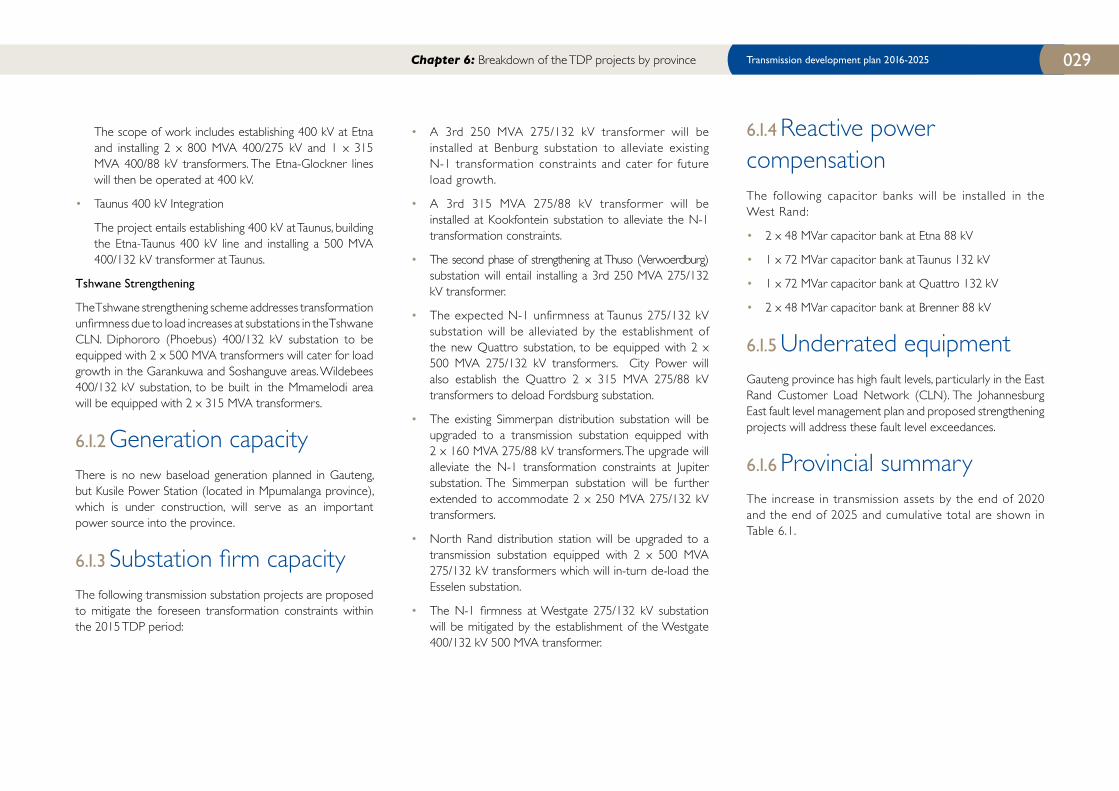
6.1.2 Generation capacityThere is no new baseload generation planned in Gauteng, but Kusile Power Station (located in Mpumalanga province), which is under construction, will serve as an important power source into the province.
6.1.3 Substation firm capacityThe following transmission substation projects are proposed to mitigate the foreseen transformation constraints within the 2015 TDP period:
• A 3rd 250 MVA 275/132 kV transformer will be installed at Benburg substation to alleviate existing N-1 transformation constraints and cater for future load growth.
• A 3rd 315 MVA 275/88 kV transformer will be installed at Kookfontein substation to alleviate the N-1 transformation constraints.
• The second phase of strengthening at Thuso (Verwoerdburg) substation will entail installing a 3rd 250 MVA 275/132 kV transformer.
• The expected N-1 unfirmness at Taunus 275/132 kV substation will be alleviated by the establishment of the new Quattro substation, to be equipped with 2 x 500 MVA 275/132 kV transformers. City Power will also establish the Quattro 2 x 315 MVA 275/88 kV transformers to deload Fordsburg substation.
• The existing Simmerpan distribution substation will be upgraded to a transmission substation equipped with 2 x 160 MVA 275/88 kV transformers. The upgrade will alleviate the N-1 transformation constraints at Jupiter substation. The Simmerpan substation will be further extended to accommodate 2 x 250 MVA 275/132 kV transformers.
• North Rand distribution station will be upgraded to a transmission substation equipped with 2 x 500 MVA 275/132 kV transformers which will in-turn de-load the Esselen substation.
• The N-1 firmness at Westgate 275/132 kV substation will be mitigated by the establishment of the Westgate 400/132 kV 500 MVA transformer.
6.1.4 Reactive power compensationThe following capacitor banks will be installed in the West Rand:
• 2 x 48 MVar capacitor bank at Etna 88 kV
• 1 x 72 MVar capacitor bank at Taunus 132 kV
• 1 x 72 MVar capacitor bank at Quattro 132 kV
• 2 x 48 MVar capacitor bank at Brenner 88 kV
6.1.5 Underrated equipmentGauteng province has high fault levels, particularly in the East Rand Customer Load Network (CLN). The Johannesburg East fault level management plan and proposed strengthening projects will address these fault level exceedances.
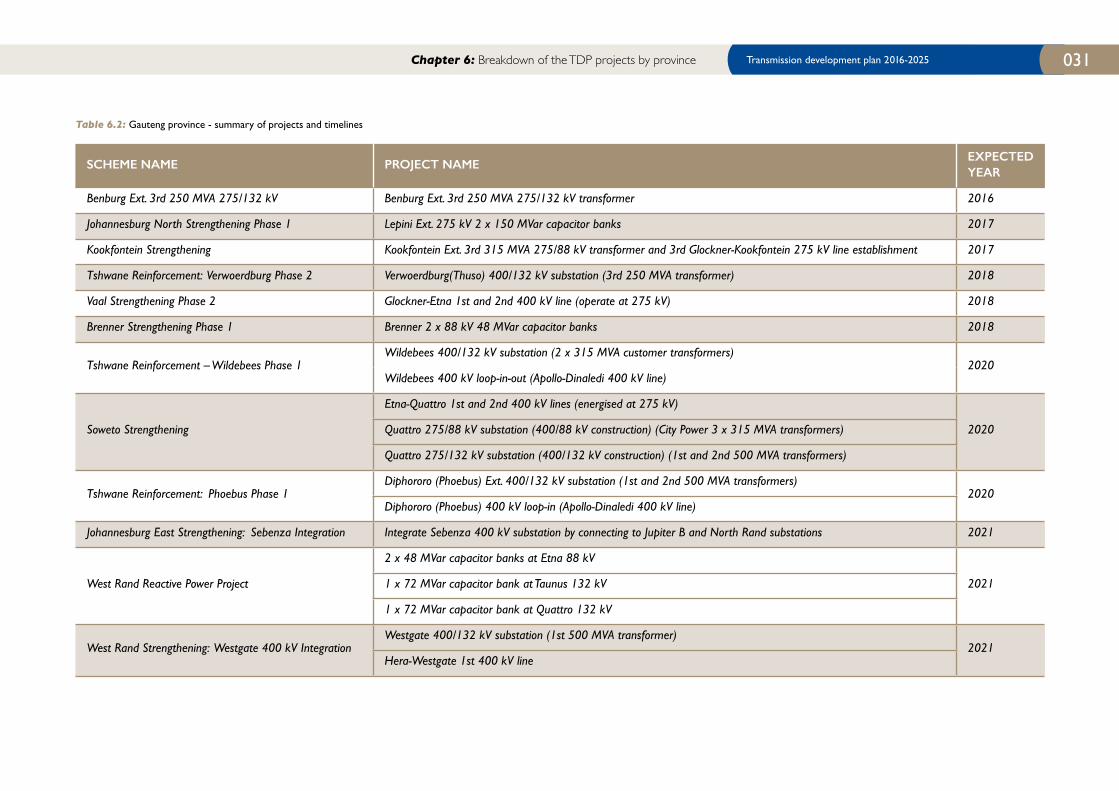
6.1.6 Provincial summaryThe increase in transmission assets by the end of 2020 and the end of 2025 and cumulative total are shown in Table 6.1.
Chapter 6: Breakdown of the TDP projects by province

TRANSMISSION ASSETS FOR GAUTENG PROVINCE
NEW ASSETS EXPECTED IN 2016 - 2020
NEW ASSETS EXPECTED IN 2021 - 2025
TOTAL NEW ASSETS
POWER LINES (KM)
765 kV 0 0 0
400 kV 104 775 879
275 kV 4 78 82
Total length (km) 108 853 561
TRANSFORMERS
Number of units 12 21 33
Total capacity (MVA) 4 355 7 635 11 990
CAPACITORS
Number of banks 4 4 8
Total capacity (MVar) 396 240 636
REACTORS
Number of banks 0 0 0
Total capacity (MVar) 0 0 0
Table 6.1: Cumulative TDP transmission assets for Gauteng province
Chapter 6: Breakdown of the TDP projects by province
Transmission development plan 2016-2025 031
SCHEME NAME PROJECT NAMEEXPECTED YEAR
Benburg Ext. 3rd 250 MVA 275/132 kV Benburg Ext. 3rd 250 MVA 275/132 kV transformer 2016
Johannesburg North Strengthening Phase 1 Lepini Ext. 275 kV 2 x 150 MVar capacitor banks 2017
Kookfontein Strengthening Kookfontein Ext. 3rd 315 MVA 275/88 kV transformer and 3rd Glockner-Kookfontein 275 kV line establishment 2017
Tshwane Reinforcement: Verwoerdburg Phase 2 Verwoerdburg(Thuso) 400/132 kV substation (3rd 250 MVA transformer) 2018
Vaal Strengthening Phase 2 Glockner-Etna 1st and 2nd 400 kV line (operate at 275 kV) 2018
Brenner Strengthening Phase 1 Brenner 2 x 88 kV 48 MVar capacitor banks 2018
Tshwane Reinforcement – Wildebees Phase 1Wildebees 400/132 kV substation (2 x 315 MVA customer transformers)
2020Wildebees 400 kV loop-in-out (Apollo-Dinaledi 400 kV line)
Soweto Strengthening
Etna-Quattro 1st and 2nd 400 kV lines (energised at 275 kV)
2020Quattro 275/88 kV substation (400/88 kV construction) (City Power 3 x 315 MVA transformers)
Quattro 275/132 kV substation (400/132 kV construction) (1st and 2nd 500 MVA transformers)
Tshwane Reinforcement: Phoebus Phase 1Diphororo (Phoebus) Ext. 400/132 kV substation (1st and 2nd 500 MVA transformers)
2020Diphororo (Phoebus) 400 kV loop-in (Apollo-Dinaledi 400 kV line)
Johannesburg East Strengthening: Sebenza Integration Integrate Sebenza 400 kV substation by connecting to Jupiter B and North Rand substations 2021
West Rand Reactive Power Project
2 x 48 MVar capacitor banks at Etna 88 kV
20211 x 72 MVar capacitor bank at Taunus 132 kV
1 x 72 MVar capacitor bank at Quattro 132 kV
West Rand Strengthening: Westgate 400 kV IntegrationWestgate 400/132 kV substation (1st 500 MVA transformer)
2021Hera-Westgate 1st 400 kV line
Table 6.2: Gauteng province - summary of projects and timelines
Chapter 6: Breakdown of the TDP projects by province
Chapter 6: Breakdown of the TDP projects by province
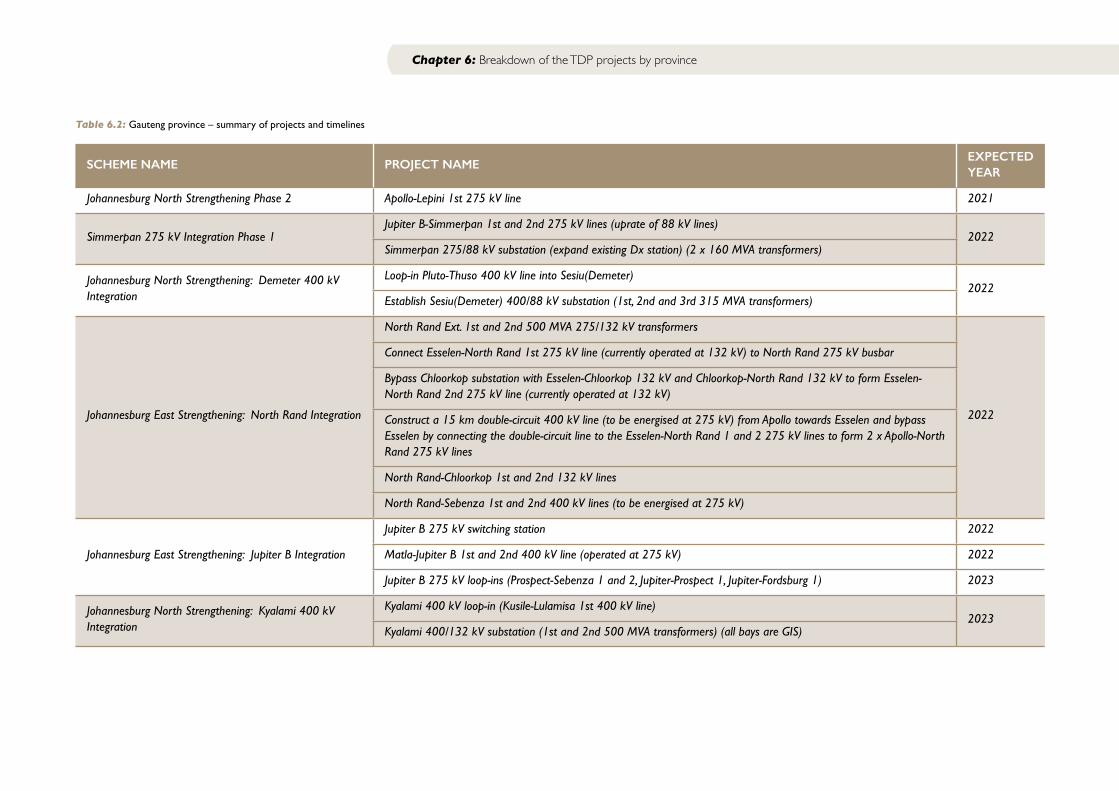
SCHEME NAME PROJECT NAMEEXPECTED YEAR
Johannesburg North Strengthening Phase 2 Apollo-Lepini 1st 275 kV line 2021
Simmerpan 275 kV Integration Phase 1Jupiter B-Simmerpan 1st and 2nd 275 kV lines (uprate of 88 kV lines)
2022Simmerpan 275/88 kV substation (expand existing Dx station) (2 x 160 MVA transformers)
Johannesburg North Strengthening: Demeter 400 kV Integration
Loop-in Pluto-Thuso 400 kV line into Sesiu(Demeter)2022
Establish Sesiu(Demeter) 400/88 kV substation (1st, 2nd and 3rd 315 MVA transformers)
Johannesburg East Strengthening: North Rand Integration
North Rand Ext. 1st and 2nd 500 MVA 275/132 kV transformers
2022
Connect Esselen-North Rand 1st 275 kV line (currently operated at 132 kV) to North Rand 275 kV busbar
Bypass Chloorkop substation with Esselen-Chloorkop 132 kV and Chloorkop-North Rand 132 kV to form Esselen-North Rand 2nd 275 kV line (currently operated at 132 kV)
Construct a 15 km double-circuit 400 kV line (to be energised at 275 kV) from Apollo towards Esselen and bypass Esselen by connecting the double-circuit line to the Esselen-North Rand 1 and 2 275 kV lines to form 2 x Apollo-North Rand 275 kV lines
North Rand-Chloorkop 1st and 2nd 132 kV lines
North Rand-Sebenza 1st and 2nd 400 kV lines (to be energised at 275 kV)
Johannesburg East Strengthening: Jupiter B Integration
Jupiter B 275 kV switching station 2022
Matla-Jupiter B 1st and 2nd 400 kV line (operated at 275 kV) 2022
Jupiter B 275 kV loop-ins (Prospect-Sebenza 1 and 2, Jupiter-Prospect 1, Jupiter-Fordsburg 1) 2023
Johannesburg North Strengthening: Kyalami 400 kV Integration
Kyalami 400 kV loop-in (Kusile-Lulamisa 1st 400 kV line) 2023
Kyalami 400/132 kV substation (1st and 2nd 500 MVA transformers) (all bays are GIS)
Table 6.2: Gauteng province – summary of projects and timelines
Transmission development plan 2016-2025 033
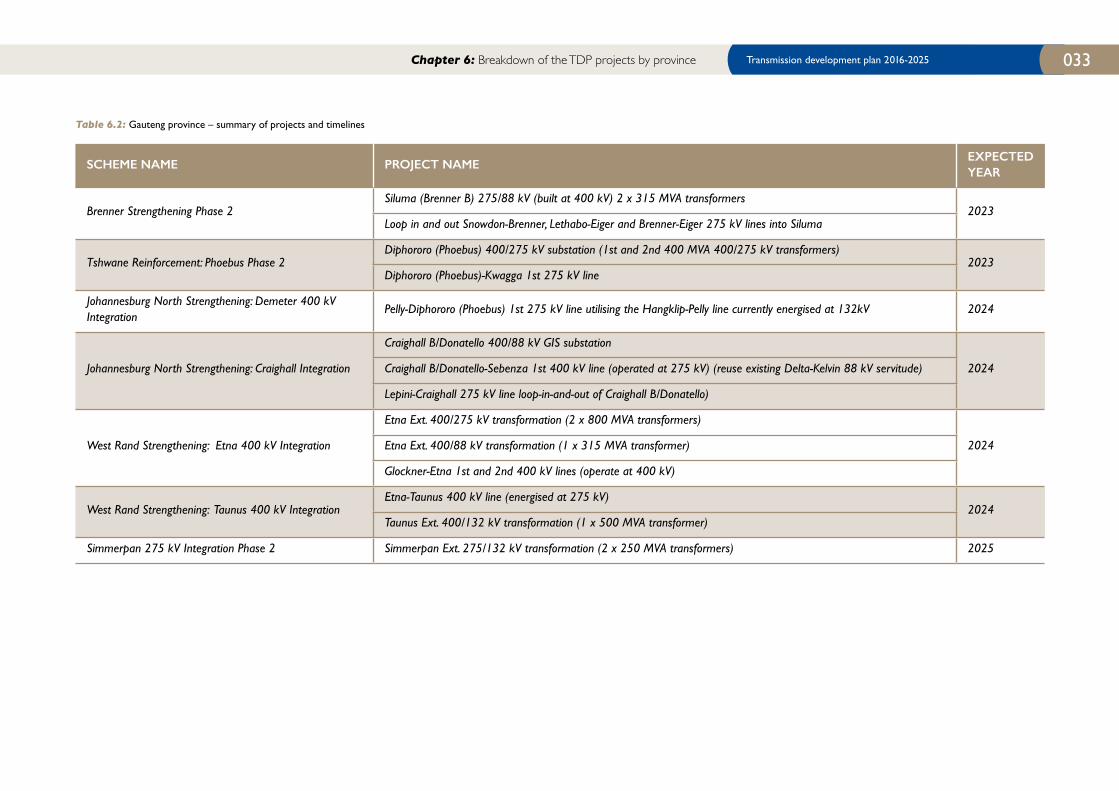
SCHEME NAME PROJECT NAMEEXPECTED YEAR
Brenner Strengthening Phase 2Siluma (Brenner B) 275/88 kV (built at 400 kV) 2 x 315 MVA transformers
2023Loop in and out Snowdon-Brenner, Lethabo-Eiger and Brenner-Eiger 275 kV lines into Siluma
Tshwane Reinforcement: Phoebus Phase 2Diphororo (Phoebus) 400/275 kV substation (1st and 2nd 400 MVA 400/275 kV transformers)
2023Diphororo (Phoebus)-Kwagga 1st 275 kV line
Johannesburg North Strengthening: Demeter 400 kV Integration
Pelly-Diphororo (Phoebus) 1st 275 kV line utilising the Hangklip-Pelly line currently energised at 132kV 2024
Johannesburg North Strengthening: Craighall Integration
Craighall B/Donatello 400/88 kV GIS substation
2024Craighall B/Donatello-Sebenza 1st 400 kV line (operated at 275 kV) (reuse existing Delta-Kelvin 88 kV servitude)
Lepini-Craighall 275 kV line loop-in-and-out of Craighall B/Donatello)
West Rand Strengthening: Etna 400 kV Integration
Etna Ext. 400/275 kV transformation (2 x 800 MVA transformers)
2024Etna Ext. 400/88 kV transformation (1 x 315 MVA transformer)
Glockner-Etna 1st and 2nd 400 kV lines (operate at 400 kV)
West Rand Strengthening: Taunus 400 kV IntegrationEtna-Taunus 400 kV line (energised at 275 kV)
2024Taunus Ext. 400/132 kV transformation (1 x 500 MVA transformer)
Simmerpan 275 kV Integration Phase 2 Simmerpan Ext. 275/132 kV transformation (2 x 250 MVA transformers) 2025
Chapter 6: Breakdown of the TDP projects by province
Table 6.2: Gauteng province – summary of projects and timelines

Chapter 6: Breakdown of the TDP projects by province
A network diagram of the major projects in the Gauteng province network is shown in Figure 6.3.
Figure 6.3: Future Gauteng province network diagram
6.2 Kwazulu-Natal (KZN) provinceThe KwaZulu-Natal province is situated on the eastern seaboard of South Africa. Economic activities in the province are mainly concentrated around the Port of Durban and the capital, Pietermaritzburg, with significant contributions in the Richards Bay-Empangeni area, the Ladysmith-Ezakheni area and the Newcastle-Madadeni regions.
The province has a number of development proposals, which include the Dube Trade Port at La Mercy, the bolstering of the Ermelo-Richards Bay Coal Link, Richards Bay Industrial Development Zone and investment opportunities in tourism in the iSimangaliso (Greater St Lucia) Wetland Park.
The KwaZulu-Natal plans include various projects for much-needed public infrastructure delivery, including household electrification, housing, schools, health facilities and water. These programmes will not only improve services, but will benefit local suppliers and boost the construction sector enormously.
The power supply into the province is mainly from Mpumalanga Power Pool and Drakensberg Pumped-storage Scheme via 400 kV lines. As the demand for electricity in the province increases, the existing transmission infrastructure is becoming heavily loaded and will eventually reach its full capacity. In order to cater for the anticipated growth over the next 10 years, a number of transmission network reinforcements have to be implemented. Major transmission development plans in the province consist of the following projects:
• The main power corridor from the Mpumalanga Power Pool into KwaZulu-Natal must be strengthened. This strengthening entails phased construction of 765 kV and 400 kV transmission lines and substations into the
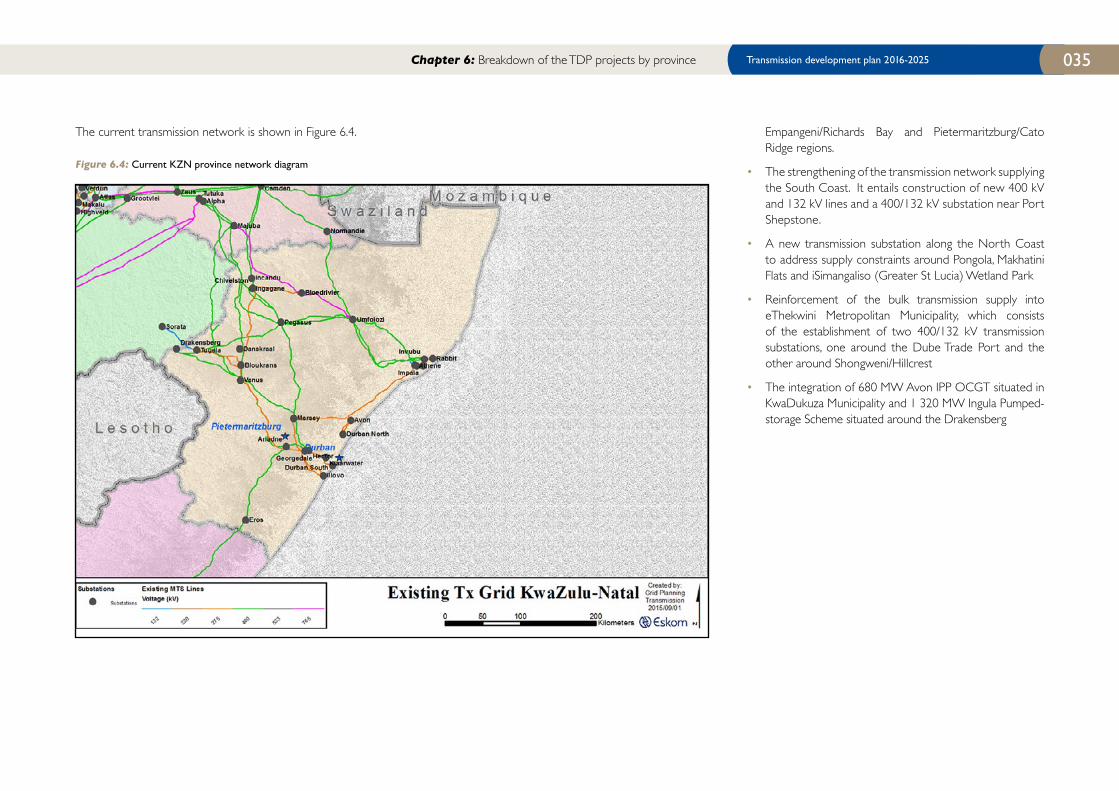
Transmission development plan 2016-2025 035
The current transmission network is shown in Figure 6.4.
Figure 6.4: Current KZN province network diagram
Empangeni/Richards Bay and Pietermaritzburg/Cato Ridge regions.
• The strengthening of the transmission network supplying the South Coast. It entails construction of new 400 kV and 132 kV lines and a 400/132 kV substation near Port Shepstone.
• A new transmission substation along the North Coast to address supply constraints around Pongola, Makhatini Flats and iSimangaliso (Greater St Lucia) Wetland Park
• Reinforcement of the bulk transmission supply into eThekwini Metropolitan Municipality, which consists of the establishment of two 400/132 kV transmission substations, one around the Dube Trade Port and the other around Shongweni/Hillcrest
• The integration of 680 MW Avon IPP OCGT situated in KwaDukuza Municipality and 1 320 MW Ingula Pumped-storage Scheme situated around the Drakensberg
Chapter 6: Breakdown of the TDP projects by province

Chapter 6: Breakdown of the TDP projects by province
6.2.1 Major schemesThe current transmission network is shown in Figure 6.4 below.
The major schemes for KZN province are listed below:
KZN 765 kV Strengthening
The KZN 765 kV Strengthening Project entails establishing 765 kV in the Pinetown and Empangeni areas, which will run from the power pool in the north, integrating it into the 400 kV network in both areas. The Pinetown and Empangeni 765 kV networks will also be linked via two 400 kV lines.
South Coast Strengthening
This includes construction of the 2nd Ariadne-Eros 400 kV and 132 kV multi-circuit line and establishment of St Faiths 400/132 kV substation near Port Shepstone.
Greater East London Strengthening Scheme
This project involves strengthening of the network from KwaZulu-Natal to the Eastern Cape. This includes establishment of Vuyani 400/132 kV substation and construction of the Eros-Vuyani, Vuyani-Neptune and Neptune-Poseidon 400 kV lines. This project provides a much-needed 400 kV injection into the Umtata area. Vuyani-Neptune and Eros-Vuyani were commissioned in 2014 and 2015, respectively.
eThekwini Electricity Network Strengthening
• The establishment of Shongweni 2 x 500 MVA 400/132 kV substation and the construction of two 400 kV lines from Hector to the proposed Shongweni substation to deload Hector-Klaarwater 275 kV lines and Klaarwater substation.
• The establishment of Inyaninga 2 x 500 MVA 400/132 kV substation by looping into one of the planned Isundu Mbewu 400 kV lines to form Isundu-Inyaninga 400 kV line and Inyaninga-Mbewu 400 kV line.
The load forecast for the KZN province is shown in Figure 6.5.
Figure 6.5: KZN province network diagram
2014 2015 2016 2017 2018 2019 2020 2021 2022 2023 2024 2025Pinetown 3472 3446 3523 3623 3721 3807 3861 3959 4052 4149 4246 4341Empangeni 2147 2175 2207 2278 2287 2296 2305 2313 2320 2353 2383 2393Newcastle 720 738 756 774 791 809 826 844 861 877 894 910Ladysmith 460 467 482 488 495 502 508 514 381 387 392 396TOSP 6527 6553 6689 6877 7003 7118 7200 7324 7310 7455 7598 7718
0
1000
2000
3000
4000
5000
6000
7000
8000
9000
Load
(MW
)
Kwa-Zulu Natal Load Forecast
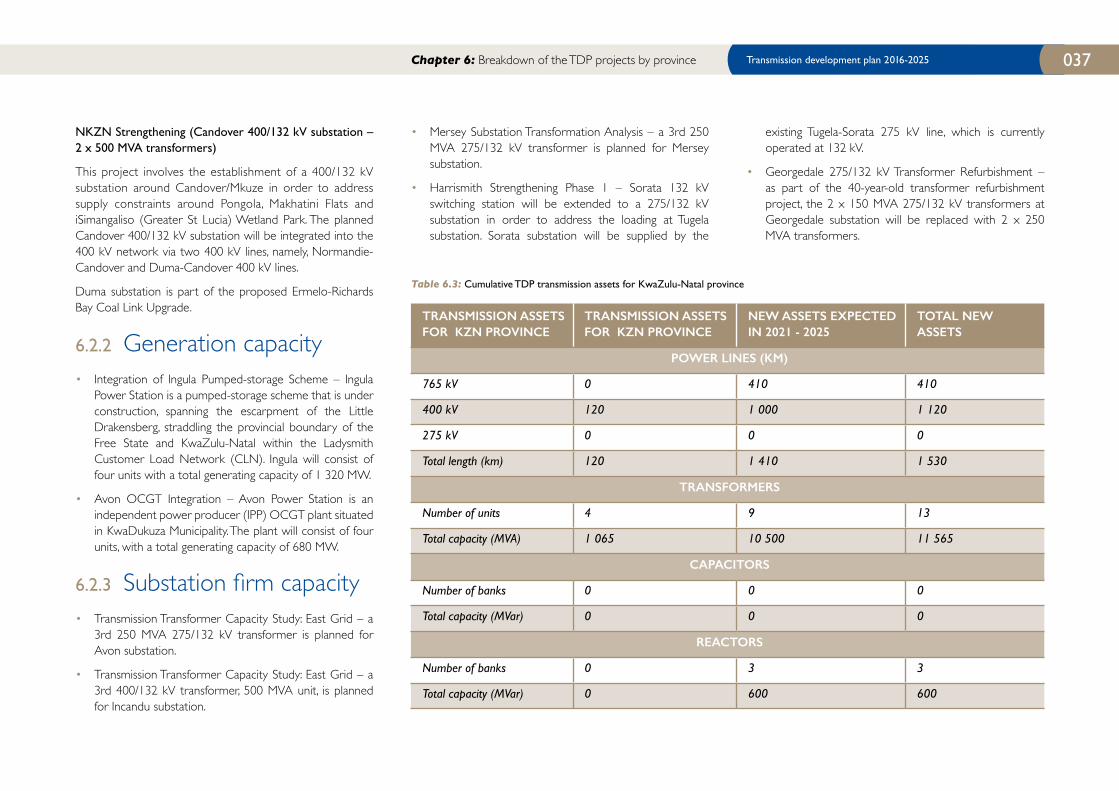
Transmission development plan 2016-2025 037
NKZN Strengthening (Candover 400/132 kV substation – 2 x 500 MVA transformers)
This project involves the establishment of a 400/132 kV substation around Candover/Mkuze in order to address supply constraints around Pongola, Makhatini Flats and iSimangaliso (Greater St Lucia) Wetland Park. The planned Candover 400/132 kV substation will be integrated into the 400 kV network via two 400 kV lines, namely, Normandie-Candover and Duma-Candover 400 kV lines.
Duma substation is part of the proposed Ermelo-Richards Bay Coal Link Upgrade.
6.2.2 Generation capacity• Integration of Ingula Pumped-storage Scheme – Ingula
Power Station is a pumped-storage scheme that is under construction, spanning the escarpment of the Little Drakensberg, straddling the provincial boundary of the Free State and KwaZulu-Natal within the Ladysmith Customer Load Network (CLN). Ingula will consist of four units with a total generating capacity of 1 320 MW.
• Avon OCGT Integration – Avon Power Station is an independent power producer (IPP) OCGT plant situated in KwaDukuza Municipality. The plant will consist of four units, with a total generating capacity of 680 MW.
6.2.3 Substation firm capacity• Transmission Transformer Capacity Study: East Grid – a
3rd 250 MVA 275/132 kV transformer is planned for Avon substation.
• Transmission Transformer Capacity Study: East Grid – a 3rd 400/132 kV transformer, 500 MVA unit, is planned for Incandu substation.
• Mersey Substation Transformation Analysis – a 3rd 250 MVA 275/132 kV transformer is planned for Mersey substation.
• Harrismith Strengthening Phase 1 – Sorata 132 kV switching station will be extended to a 275/132 kV substation in order to address the loading at Tugela substation. Sorata substation will be supplied by the
Table 6.3: Cumulative TDP transmission assets for KwaZulu-Natal province
TRANSMISSION ASSETS FOR KZN PROVINCE
TRANSMISSION ASSETS FOR KZN PROVINCE
NEW ASSETS EXPECTED IN 2021 - 2025
TOTAL NEW ASSETS
POWER LINES (KM)
765 kV 0 410 410
400 kV 120 1 000 1 120
275 kV 0 0 0
Total length (km) 120 1 410 1 530
TRANSFORMERS
Number of units 4 9 13
Total capacity (MVA) 1 065 10 500 11 565
CAPACITORS
Number of banks 0 0 0
Total capacity (MVar) 0 0 0
REACTORS
Number of banks 0 3 3
Total capacity (MVar) 0 600 600
existing Tugela-Sorata 275 kV line, which is currently operated at 132 kV.
• Georgedale 275/132 kV Transformer Refurbishment – as part of the 40-year-old transformer refurbishment project, the 2 x 150 MVA 275/132 kV transformers at Georgedale substation will be replaced with 2 x 250 MVA transformers.
Chapter 6: Breakdown of the TDP projects by province

6.2.4 Underrated equipmentThe underrated equipment at the following substations will be addressed as follows:
• Incandu substation, as par t of the 3rd 400/132 kV transformer (500 MVA unit) project
• Mersey substation, as part of the 3rd 250 MVA 275/132 kV transformer project
6.2.5 Provincial summaryThe increase in transmission assets by the end of 2020 and the end of 2025 and cumulative total are shown in Table 6.3.
The following projects are planned for the 2016 to 2025 period:
Chapter 6: Breakdown of the TDP projects by province
Table 6.4: KZN province – summary of projects and timelines
SCHEME NAME PROJECT NAMEEXPECTED YEAR
Greater East London Strengthening - Phase 1
Eros – Vuyani 1st 400 kV line Energised
Avon 3rd 250 MVA 275/132 kV transformer 2015
Transnet Coal-Line Upgrade
3 of 1 x 160 MVA 400/88 kV substations
2018Loop-in Camden – Normandie 1 400 kV line, Normandie – Umfolozi 1 400 kV line & Pegasus – Athene 1 400 kV line respectively.
Avon IPP IPP OCGT at Avon 275 kV 2016
Ariadne – Venus 2nd 400 kV Line
Ariadne – Venus 2nd 400 kV line (recycle Georgedale – Venus 1 or 2 275 kV line) 2020
Ingula Pumped Storage Power Station Transmission Substation Integration
Ingula 400 kV busbar
2015Loop-in Majuba – Venus 2 400 kV line into Ingula Substation
Ingula – Venus 2nd 400 kV line
Incandu 3rd 400/132 kV transformer upgrade
Incandu 3rd 400/132 kV transformer upgrade 2017
KZN 765 kV Strengthening - Empangeni Integration
Mbewu 1 x 2000 MVA 765/400 kV Substation
2023
Loop-in Athene – Umfolozi 1 400 kV line & Invubu – Umfolozi 1 400 kV line into Mbewu Substation
Umfolozi – Mbewu 765 kV line (extension of Majuba – Umfolozi 1 765 kV line)
Invubu – Mbewu 2nd 400 kV line
KZN 765 kV Strengthening - Lambda Substation
Lambda 2 x 2000 MVA 400/765 kV Substation
2023Majuba – Lambda 1st 400 kV line
Divert Tutuka – Majuba 400 kV line from Majuba Substation to Lambda Substation and form Tutuka – Lambda 1st 400 kV line
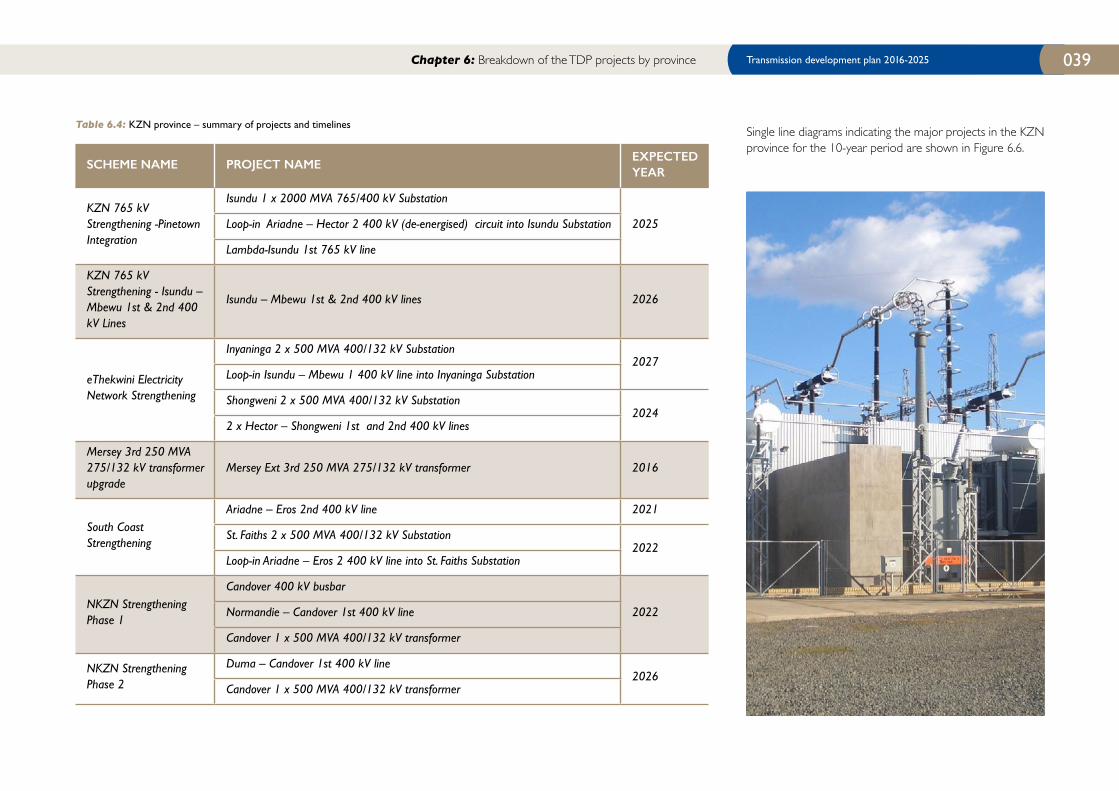
Transmission development plan 2016-2025 039
SCHEME NAME PROJECT NAMEEXPECTED YEAR
KZN 765 kV Strengthening -Pinetown Integration
Isundu 1 x 2000 MVA 765/400 kV Substation
2025Loop-in Ariadne – Hector 2 400 kV (de-energised) circuit into Isundu Substation
Lambda-Isundu 1st 765 kV line
KZN 765 kV Strengthening - Isundu – Mbewu 1st & 2nd 400 kV Lines
Isundu – Mbewu 1st & 2nd 400 kV lines 2026
eThekwini Electricity Network Strengthening
Inyaninga 2 x 500 MVA 400/132 kV Substation2027
Loop-in Isundu – Mbewu 1 400 kV line into Inyaninga Substation
Shongweni 2 x 500 MVA 400/132 kV Substation2024
2 x Hector – Shongweni 1st and 2nd 400 kV lines
Mersey 3rd 250 MVA 275/132 kV transformer upgrade
Mersey Ext 3rd 250 MVA 275/132 kV transformer 2016
South Coast Strengthening
Ariadne – Eros 2nd 400 kV line 2021
St. Faiths 2 x 500 MVA 400/132 kV Substation2022
Loop-in Ariadne – Eros 2 400 kV line into St. Faiths Substation
NKZN Strengthening Phase 1
Candover 400 kV busbar
2022Normandie – Candover 1st 400 kV line
Candover 1 x 500 MVA 400/132 kV transformer
NKZN StrengtheningPhase 2
Duma – Candover 1st 400 kV line2026
Candover 1 x 500 MVA 400/132 kV transformer
Single line diagrams indicating the major projects in the KZN province for the 10-year period are shown in Figure 6.6.
Chapter 6: Breakdown of the TDP projects by province
Table 6.4: KZN province – summary of projects and timelines
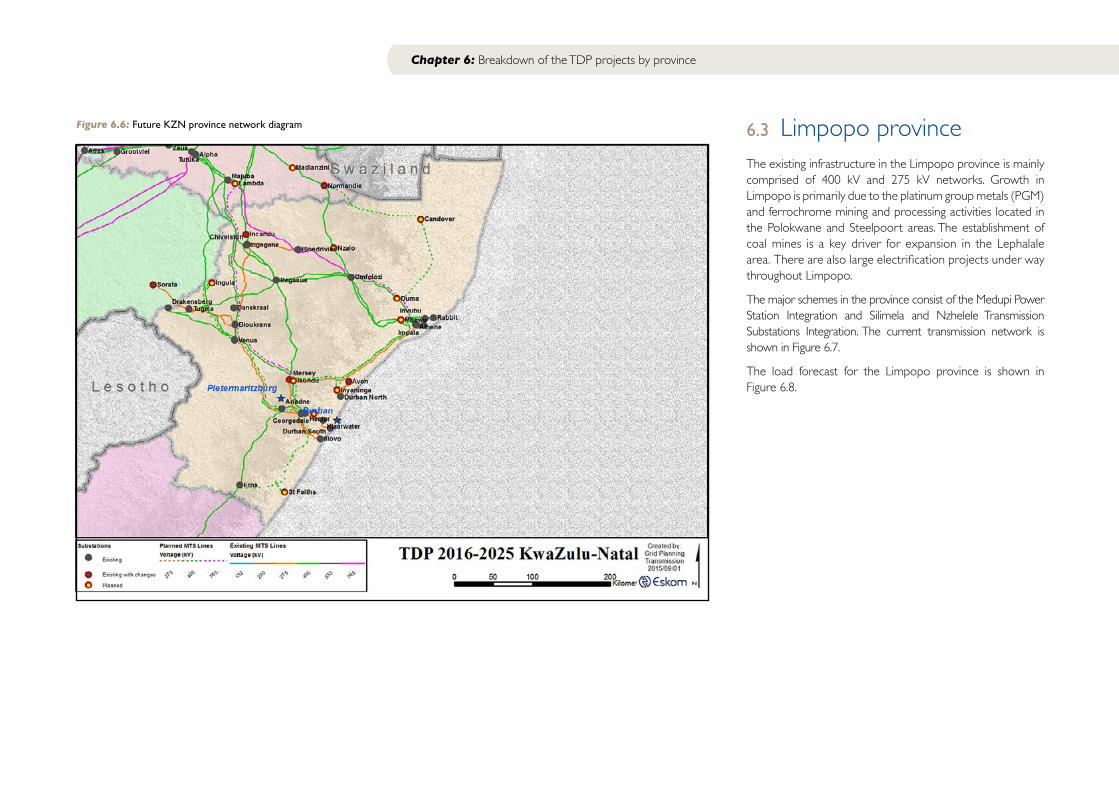
Chapter 6: Breakdown of the TDP projects by province
Figure 6.6: Future KZN province network diagram 6.3 Limpopo provinceThe existing infrastructure in the Limpopo province is mainly comprised of 400 kV and 275 kV networks. Growth in Limpopo is primarily due to the platinum group metals (PGM) and ferrochrome mining and processing activities located in the Polokwane and Steelpoort areas. The establishment of coal mines is a key driver for expansion in the Lephalale area. There are also large electrification projects under way throughout Limpopo.
The major schemes in the province consist of the Medupi Power Station Integration and Silimela and Nzhelele Transmission Substations Integration. The current transmission network is shown in Figure 6.7.
The load forecast for the Limpopo province is shown in Figure 6.8.
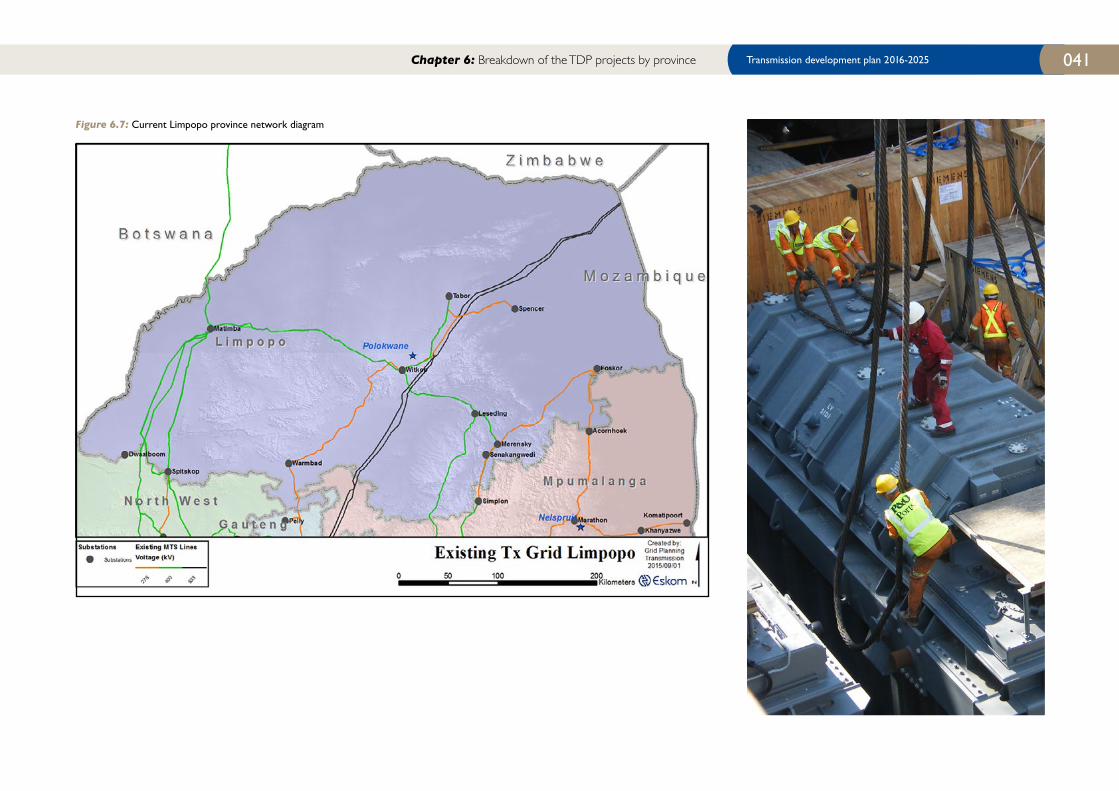
Transmission development plan 2016-2025 041
Figure 6.7: Current Limpopo province network diagram
Chapter 6: Breakdown of the TDP projects by province
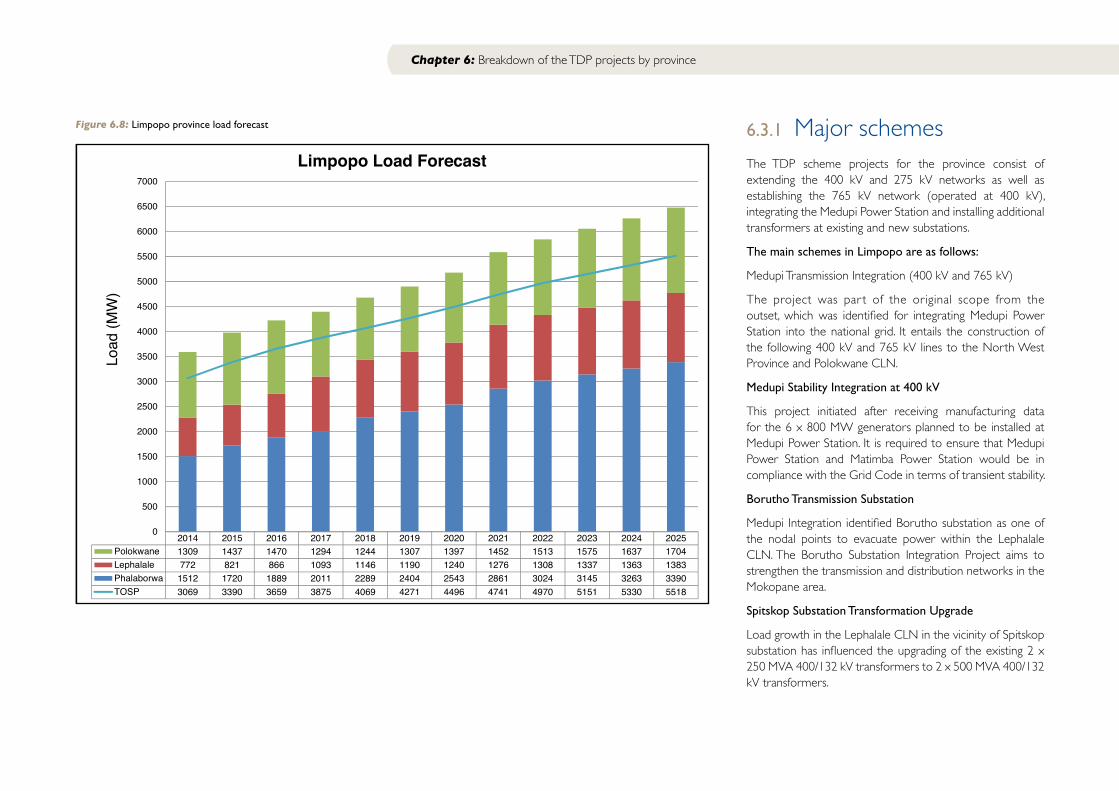
Chapter 6: Breakdown of the TDP projects by province
Figure 6.8: Limpopo province load forecast 6.3.1 Major schemesThe TDP scheme projects for the province consist of extending the 400 kV and 275 kV networks as well as establishing the 765 kV network (operated at 400 kV), integrating the Medupi Power Station and installing additional transformers at existing and new substations.
The main schemes in Limpopo are as follows:
Medupi Transmission Integration (400 kV and 765 kV)
The project was par t of the original scope from the outset, which was identified for integrating Medupi Power Station into the national grid. It entails the construction of the following 400 kV and 765 kV lines to the North West Province and Polokwane CLN.
Medupi Stability Integration at 400 kV
This project initiated after receiving manufacturing data for the 6 x 800 MW generators planned to be installed at Medupi Power Station. It is required to ensure that Medupi Power Station and Matimba Power Station would be in compliance with the Grid Code in terms of transient stability.
Borutho Transmission Substation
Medupi Integration identified Borutho substation as one of the nodal points to evacuate power within the Lephalale CLN. The Borutho Substation Integration Project aims to strengthen the transmission and distribution networks in the Mokopane area.
Spitskop Substation Transformation Upgrade
Load growth in the Lephalale CLN in the vicinity of Spitskop substation has influenced the upgrading of the existing 2 x 250 MVA 400/132 kV transformers to 2 x 500 MVA 400/132 kV transformers.
2014 2015 2016 2017 2018 2019 2020 2021 2022 2023 2024 2025Polokwane 1309 1437 1470 1294 1244 1307 1397 1452 1513 1575 1637 1704Lephalale 772 821 866 1093 1146 1190 1240 1276 1308 1337 1363 1383Phalaborwa 1512 1720 1889 2011 2289 2404 2543 2861 3024 3145 3263 3390TOSP 3069 3390 3659 3875 4069 4271 4496 4741 4970 5151 5330 5518
0
500
1000
1500
2000
2500
3000
3500
4000
4500
5000
5500
6000
6500
7000
Load
(MW
)
Limpopo Load Forecast
Transmission development plan 2016-2025 043
Nzhelele 400 kV Integration
The Nzhelele integration is required to supply loads between the Soutpansberg Mountains and the Zimbabwe border currently fed from Tabor and Spencer. It will be fed via two 400 kV lines from Tabor and Borutho, respectively.
Limpopo East Corridor Strengthening
The project entails building a new 110 km 400 kV line from Foskor substation to Spencer substation and the establishment of 400/132 kV transformation with the installation of 1 x 500 MVA 400/132 kV transformer at Spencer substation. The project will also require the 2nd Merensky-Foskor 275 kV line to be operated at 400 kV, since it will be built at 400 kV specifications. 400/275 kV transformation will be established at Foskor substation.
Silimela (Marble Hall) Transmission Substation
The existing Mapoch/Marble Hall and Mapoch/Wolwekraal 132 kV networks will not be capable of supplying the additional load growth beyond 2015 to 2017. It is also difficult to carry out maintenance work on the 132 kV networks, as the existing networks no longer comply with N-1 criteria.
To solve the network constraints mentioned above, it is proposed that a new transmission substation be constructed next to the existing Wolwekraal distribution substation. The new transmission substation will deload Simplon substation. In addition, the new substation will be able to supply the long-term future load growth in the south-western part of the Phalaborwa CLN.
Senakangwedi B Transmission Substation
According to the load forecast for the Tubatse area, the load growth between 2015 and 2030 is expected to accelerate due to fur ther developments in ferrochrome and platinum mining.
The transmission network supplying Tubatse area was voltage and thermally constrained under various N-1 contingencies until the recent commissioning of the Duvha-Leseding 400 kV line. However, the additional transmission network capacity created is not sufficient to cater for forecasted future load growth – hence, the need for the investigation into further transmission network strengthening plans, which resulted in the proposal of a new transmission substation 10 to 15 km south of the existing Senakangwedi substation. It is, therefore, proposed that a new transmission substation be built next to Uchoba distribution substation in the year 2020.
Foskor and Acornhoek 275/132 kV Transformation Upgrades
In order to ensure that the transmission network has sufficient transformation capacity for the expected 132 kV load growth, the Foskor and Acornhoek 275/132 kV transformer capacities should be upgraded. A 3rd 250 MVA 275/132 kV transformer has been approved for installation at Foskor substation. The existing 2 x 75 MVA 275/132 kV transformers at Acornhoek substation are over 40 years old and approaching the end of their life, so they will be replaced with 2 x 125 MVA 275/132 kV, which will provide the needed extra capacity and extend the useful life of the substation.
A 2nd Foskor-Merensky 275 kV line is proposed to address undervoltage and voltage stability constraints. New developments have recently arisen since the project was proposed; the load growth in the northern direction of Foskor substation, which includes the Tzaneen area (which is supplied by Spencer substation), has shown the need for additional transmission strengthening. The planned Nzhelele substation will slightly deload Spencer substation; hence, a new solution for Spencer substation is required. In order to align with future projects and to phase out the dependency on the 275 kV network in Limpopo province, the EA for the 2nd Merensky-Foskor line will be amended from 275 kV to 400 kV. The line will be built at 400 kV and operated at 275 kV.
Dwarsberg (Dwaalboom) 132 kV Switching Station
This project is required to provide full firm supply to Dwaalboom PPC and improve performance of the supply to the Gaborone area in Botswana. The existing tee-off arrangement supplying Dwaalboom substation will be replaced with a switching station, now called Dwarsberg switching station.
6.3.2 Generation capacityThe baseload generation in Limpopo province is located in the Lephalale area, where the coal reserves are being exploited. The existing Matimba and the new Medupi Coal-fired Power Stations will provide almost 8.5 GW of generation. Imported generation from Botswana is expected to be approximately 150 MW, with the integration of Morupule B Power Station (PS).
Matimba Power Station: the coal-fired power station is designed to generate 4 000 MW; Matimba – the Tsonga word for “power” – is the largest direct dry-cooled power station in the world, with 6 x 665 MW turbo-generator units. The adjacent Grootegeluk Colliery has sufficient coal reserves to guarantee Matimba a minimum lifespan of 35 years, extending to a possible 50 years.
Medupi Power Station: Medupi Power Station will have a nominal generating capacity of 4 800 MW (6 x 800 MW units). On completion, Medupi Power Station will be the largest dry-cooled power station in the world. It will be slightly larger than the existing Matimba Power Station in terms of operation, design and dimensions.
The end-state total generation expected in the Lephalale area will be approximately 20 GW by 2030. This will be possible with the commissioning of two more coal-fired power stations similar in size to Medupi Power Station. Table 6.5 shows a summarised list of generation capacity in Limpopo province.
Chapter 6: Breakdown of the TDP projects by province
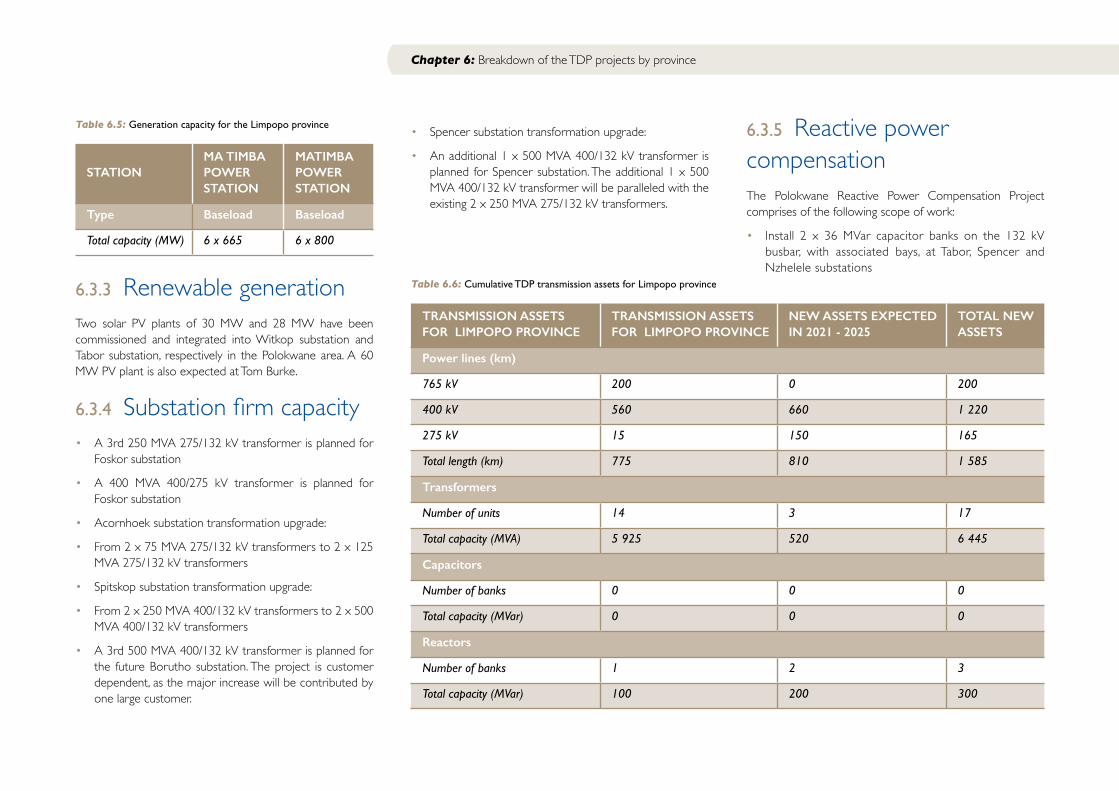
Chapter 6: Breakdown of the TDP projects by province
Table 6.5: Generation capacity for the Limpopo province
STATIONMA TIMBA POWER STATION
MATIMBA POWER STATION
Type Baseload Baseload
Total capacity (MW) 6 x 665 6 x 800
6.3.3 Renewable generationTwo solar PV plants of 30 MW and 28 MW have been commissioned and integrated into Witkop substation and Tabor substation, respectively in the Polokwane area. A 60 MW PV plant is also expected at Tom Burke.
6.3.4 Substation firm capacity• A 3rd 250 MVA 275/132 kV transformer is planned for
Foskor substation
• A 400 MVA 400/275 kV transformer is planned for Foskor substation
• Acornhoek substation transformation upgrade:
• From 2 x 75 MVA 275/132 kV transformers to 2 x 125 MVA 275/132 kV transformers
• Spitskop substation transformation upgrade:
• From 2 x 250 MVA 400/132 kV transformers to 2 x 500 MVA 400/132 kV transformers
• A 3rd 500 MVA 400/132 kV transformer is planned for the future Borutho substation. The project is customer dependent, as the major increase will be contributed by one large customer.
• Spencer substation transformation upgrade:
• An additional 1 x 500 MVA 400/132 kV transformer is planned for Spencer substation. The additional 1 x 500 MVA 400/132 kV transformer will be paralleled with the existing 2 x 250 MVA 275/132 kV transformers.
6.3.5 Reactive power compensationThe Polokwane Reactive Power Compensation Project comprises of the following scope of work:
• Install 2 x 36 MVar capacitor banks on the 132 kV busbar, with associated bays, at Tabor, Spencer and Nzhelele substations
Table 6.6: Cumulative TDP transmission assets for Limpopo province
TRANSMISSION ASSETS FOR LIMPOPO PROVINCE
TRANSMISSION ASSETS FOR LIMPOPO PROVINCE
NEW ASSETS EXPECTED IN 2021 - 2025
TOTAL NEW ASSETS
Power lines (km)
765 kV 200 0 200
400 kV 560 660 1 220
275 kV 15 150 165
Total length (km) 775 810 1 585
Transformers
Number of units 14 3 17
Total capacity (MVA) 5 925 520 6 445
Capacitors
Number of banks 0 0 0
Total capacity (MVar) 0 0 0
Reactors
Number of banks 1 2 3
Total capacity (MVar) 100 200 300
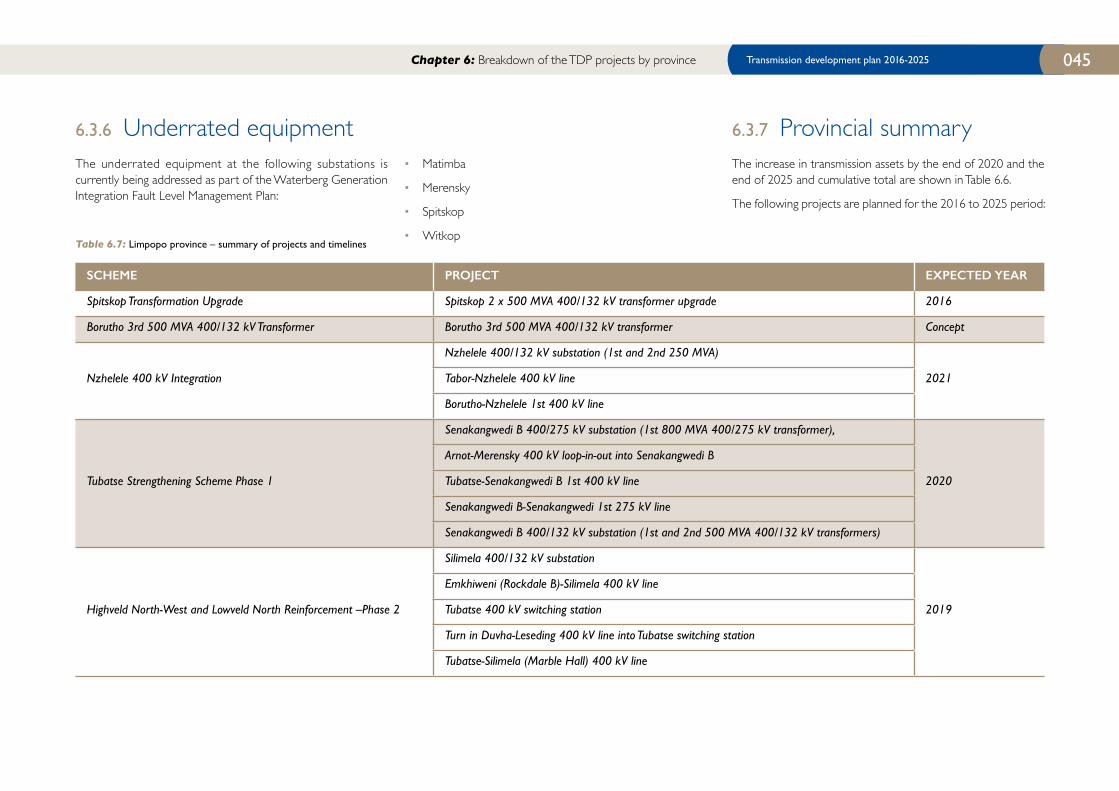
Transmission development plan 2016-2025 045
6.3.6 Underrated equipmentThe underrated equipment at the following substations is currently being addressed as part of the Waterberg Generation Integration Fault Level Management Plan:
• Matimba
• Merensky
• Spitskop
• Witkop
6.3.7 Provincial summaryThe increase in transmission assets by the end of 2020 and the end of 2025 and cumulative total are shown in Table 6.6.
The following projects are planned for the 2016 to 2025 period:
Table 6.7: Limpopo province – summary of projects and timelines
SCHEME PROJECT EXPECTED YEAR
Spitskop Transformation Upgrade Spitskop 2 x 500 MVA 400/132 kV transformer upgrade 2016
Borutho 3rd 500 MVA 400/132 kV Transformer Borutho 3rd 500 MVA 400/132 kV transformer Concept
Nzhelele 400 kV Integration
Nzhelele 400/132 kV substation (1st and 2nd 250 MVA)
2021Tabor-Nzhelele 400 kV line
Borutho-Nzhelele 1st 400 kV line
Tubatse Strengthening Scheme Phase 1
Senakangwedi B 400/275 kV substation (1st 800 MVA 400/275 kV transformer),
2020
Arnot-Merensky 400 kV loop-in-out into Senakangwedi B
Tubatse-Senakangwedi B 1st 400 kV line
Senakangwedi B-Senakangwedi 1st 275 kV line
Senakangwedi B 400/132 kV substation (1st and 2nd 500 MVA 400/132 kV transformers)
Highveld North-West and Lowveld North Reinforcement –Phase 2
Silimela 400/132 kV substation
2019
Emkhiweni (Rockdale B)-Silimela 400 kV line
Tubatse 400 kV switching station
Turn in Duvha-Leseding 400 kV line into Tubatse switching station
Tubatse-Silimela (Marble Hall) 400 kV line
Chapter 6: Breakdown of the TDP projects by province
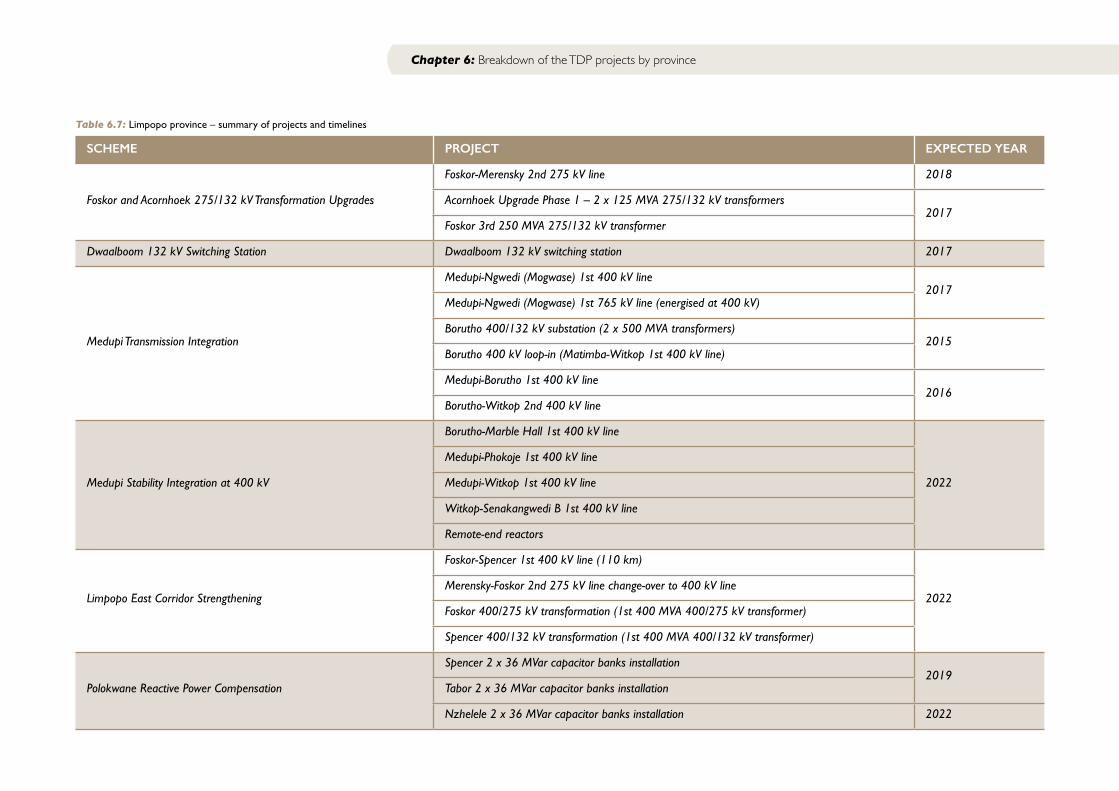
Chapter 6: Breakdown of the TDP projects by province
SCHEME PROJECT EXPECTED YEAR
Foskor and Acornhoek 275/132 kV Transformation Upgrades
Foskor-Merensky 2nd 275 kV line 2018
Acornhoek Upgrade Phase 1 – 2 x 125 MVA 275/132 kV transformers2017
Foskor 3rd 250 MVA 275/132 kV transformer
Dwaalboom 132 kV Switching Station Dwaalboom 132 kV switching station 2017
Medupi Transmission Integration
Medupi-Ngwedi (Mogwase) 1st 400 kV line2017
Medupi-Ngwedi (Mogwase) 1st 765 kV line (energised at 400 kV)
Borutho 400/132 kV substation (2 x 500 MVA transformers)2015
Borutho 400 kV loop-in (Matimba-Witkop 1st 400 kV line)
Medupi-Borutho 1st 400 kV line2016
Borutho-Witkop 2nd 400 kV line
Medupi Stability Integration at 400 kV
Borutho-Marble Hall 1st 400 kV line
2022
Medupi-Phokoje 1st 400 kV line
Medupi-Witkop 1st 400 kV line
Witkop-Senakangwedi B 1st 400 kV line
Remote-end reactors
Limpopo East Corridor Strengthening
Foskor-Spencer 1st 400 kV line (110 km)
2022Merensky-Foskor 2nd 275 kV line change-over to 400 kV line
Foskor 400/275 kV transformation (1st 400 MVA 400/275 kV transformer)
Spencer 400/132 kV transformation (1st 400 MVA 400/132 kV transformer)
Polokwane Reactive Power Compensation
Spencer 2 x 36 MVar capacitor banks installation2019
Tabor 2 x 36 MVar capacitor banks installation
Nzhelele 2 x 36 MVar capacitor banks installation 2022
Table 6.7: Limpopo province – summary of projects and timelines

Transmission development plan 2016-2025 047
The future network diagram for the Limpopo province is shown in Figure 6.9.
Figure 6.9: Future Limpopo province network diagram
6.4 Mpumalanga provinceThe Mpumalanga province is considered the generation hub of South Africa’s electricity network due to the concentration of power stations in this region and their close proximity to the large centres of loads. Currently, 11 of 13 Eskom coal-fired power stations, namely, Arnot, Camden, Duvha, Grootvlei, Hendrina, Kendal, Komati, Kriel, Matla, Majuba and Tutuka are located in the Mpumalanga Province. In addition to the 11 coal-fired power stations, one of the two Eskom power stations that are currently under construction, namely, Kusile Power Station, is located in Mpumalanga.
The Mpumalanga province consists of four customer load networks (CLNs) and each CLN is made up of a number of substations, as follows:
• Highveld South CLN – Sol, Camden, Alpha, Tutuka, Normandie, Majuba, Grootvlei and Zeus
• Lowveld CLN – Marathon, Prairie, Simplon, Komatipoort and Gumeni
• Middleburg CLN – Rockdale, Hendrina, Rockdale B, Duvha, Komati and Arnot
• Witbank CLN – Vulcan, Matla, Kendal, Kriel, Kruispunt and Kusile
Steady load growth is expected in the province as a result of commercial development, electrification and the establishment of the industrial development zone (IDZ). The future load mix is not expected to differ from the existing, which is mainly comprised of redistributors and mining, commercial and industrial customers.
The current transmission network is shown in Figure 6.10.
Chapter 6: Breakdown of the TDP projects by province

Chapter 6: Breakdown of the TDP projects by province
The load forecast for the Mpumalanga province is shown in Figure 6.11.
Several projects and schemes that aim to address the long-term requirements of the network have been initiated in order to accommodate the forecasted load and maintain overall network integrity under normal and contingency operation.
6.4.1 Major schemesThe main schemes in Mpumalanga are as follows:
Highveld North-West and Lowveld North Reinforcement – Phase 1
This scheme entails the establishment the new Emkhiweni 400/132 kV substation.
Highveld South Reinforcement Phase 2: Sol B Integration
This scheme entails the establishment the new Sol B 400/132 kV substation.
Kusile Power Station Integration
Figure 6.12 shows a single-line diagram (SLD) of the full Kusile Power Station Integration plan. The dotted lines represent the new 400 kV lines and new loops in and out from the existing 400 kV lines.
Figure 6.10: Current Mpumalanga province network diagram
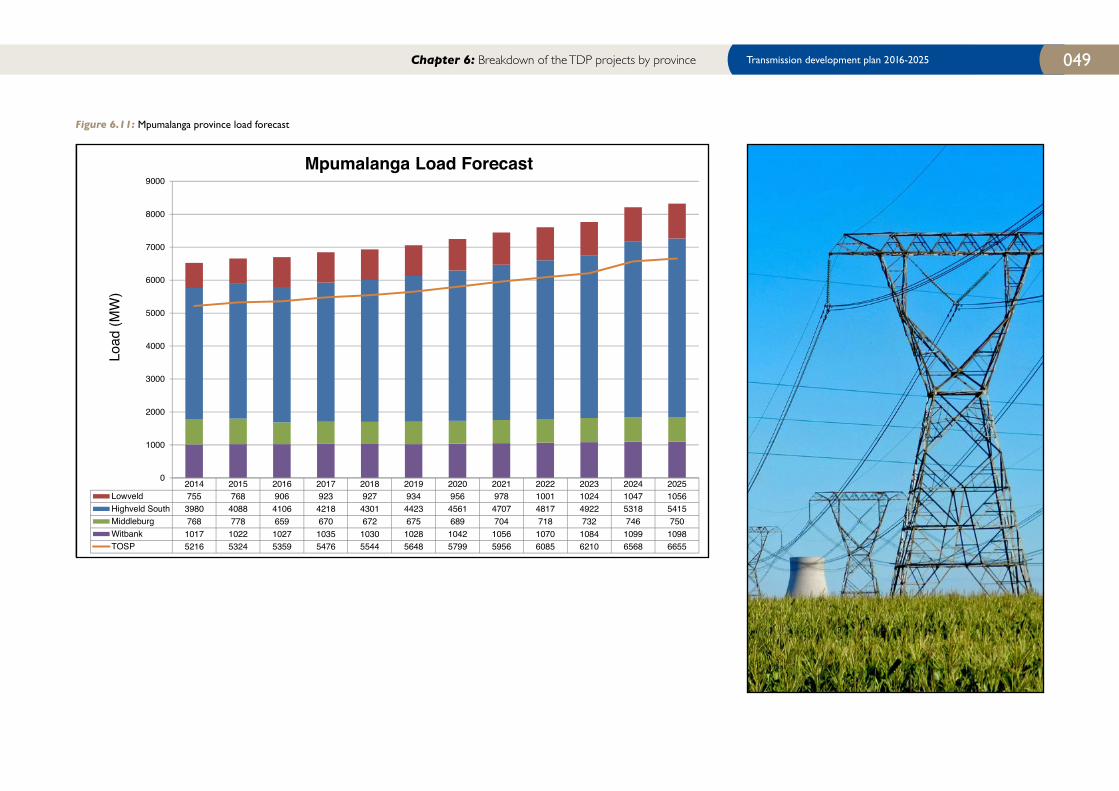
Transmission development plan 2016-2025 049
Figure 6.11: Mpumalanga province load forecast
2014 2015 2016 2017 2018 2019 2020 2021 2022 2023 2024 2025Lowveld 755 768 906 923 927 934 956 978 1001 1024 1047 1056Highveld South 3980 4088 4106 4218 4301 4423 4561 4707 4817 4922 5318 5415Middleburg 768 778 659 670 672 675 689 704 718 732 746 750Witbank 1017 1022 1027 1035 1030 1028 1042 1056 1070 1084 1099 1098TOSP 5216 5324 5359 5476 5544 5648 5799 5956 6085 6210 6568 6655
0
1000
2000
3000
4000
5000
6000
7000
8000
9000
Load
(MW
)
Mpumalanga Load Forecast
Chapter 6: Breakdown of the TDP projects by province
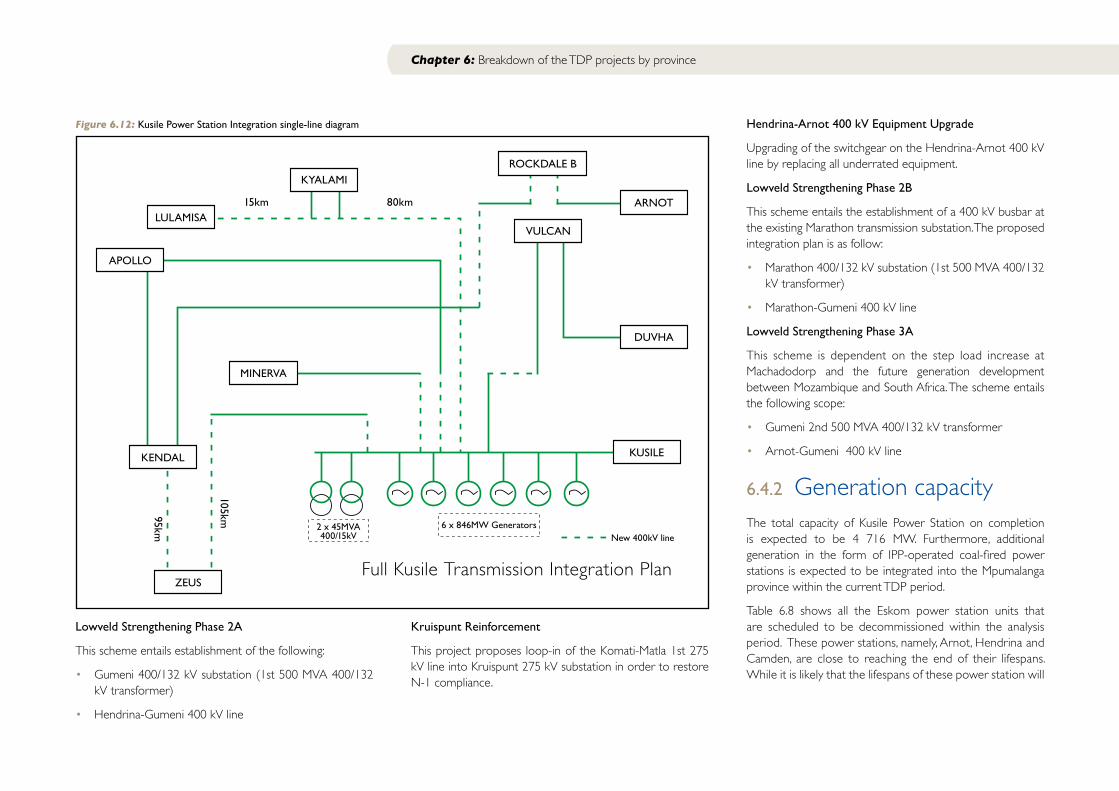
Chapter 6: Breakdown of the TDP projects by province
Lowveld Strengthening Phase 2A
This scheme entails establishment of the following:
• Gumeni 400/132 kV substation (1st 500 MVA 400/132 kV transformer)
• Hendrina-Gumeni 400 kV line
Figure 6.12: Kusile Power Station Integration single-line diagram
Kruispunt Reinforcement
This project proposes loop-in of the Komati-Matla 1st 275 kV line into Kruispunt 275 kV substation in order to restore N-1 compliance.
Hendrina-Arnot 400 kV Equipment Upgrade
Upgrading of the switchgear on the Hendrina-Arnot 400 kV line by replacing all underrated equipment.
Lowveld Strengthening Phase 2B
This scheme entails the establishment of a 400 kV busbar at the existing Marathon transmission substation. The proposed integration plan is as follow:
• Marathon 400/132 kV substation (1st 500 MVA 400/132 kV transformer)
• Marathon-Gumeni 400 kV line
Lowveld Strengthening Phase 3A
This scheme is dependent on the step load increase at Machadodorp and the future generation development between Mozambique and South Africa. The scheme entails the following scope:
• Gumeni 2nd 500 MVA 400/132 kV transformer
• Arnot-Gumeni 400 kV line
6.4.2 Generation capacityThe total capacity of Kusile Power Station on completion is expected to be 4 716 MW. Furthermore, additional generation in the form of IPP-operated coal-fired power stations is expected to be integrated into the Mpumalanga province within the current TDP period.
Table 6.8 shows all the Eskom power station units that are scheduled to be decommissioned within the analysis period. These power stations, namely, Arnot, Hendrina and Camden, are close to reaching the end of their lifespans. While it is likely that the lifespans of these power station will
KYALAMI
VULCAN
ARNOT
DUVHA
KUSILE
ROCKDALE B
LULAMISA
APOLLO
MINERVA
KENDAL
ZEUS
95km
105km
15km 80km
2 x 45MVA400/15kV
6 x 846MW Generators
Full Kusile Transmission Integration Plan
New 400kV line

Transmission development plan 2016-2025 051
be extended, the technical assessment of this TDP is based on the currently available information, which represents the worst-case generation scenario.
6.4.3 Substation firm capacity• Emkhiweni (Rockdale B) substation integration will be
commissioned to support Rockdale substation.
• Sol B substation will be commissioned to mitigate existing transformation constraints at Sol substation.
• The 400/132 kV, 300 MVA and 250 MVA transformers at Vulcan substation will be replaced with 500 MVA transformers.
• Marathon 132/66 kV will be decommissioned.
6.4.4 Underrated equipmentThe underrated equipment at the transmission substations in Mpumalanga will be addressed as follows:
Mpumalanga Underrated Equipment Upgrade Phase 1
• Equipment replacement (circuit-breakers, isolators and CTs) at both ends of the following lines to ensure alignment with line capacity:
• Apollo-Kendal 1 and 2 400 kV line
• Duvha-Minerva 400 kV line
• Duvha-Matla 400 kV line
• Kendal-Minerva 400 kV line
• Kriel-Zeus 400 kV line
• Upgrade of 5.63 km Twin Dinosaur section of the Kriel Zeus 400 kV line to Triple Dinosaur.
YEAR OF DECOMMISSIONING
ARNOT POWER STATION HENDRINA POWERCAMDEN POWER STATION
2021 Unit 4: 190 MW Unit 6: 160 MW
2022Unit 3: 190 MWUnit 5: 180 MW
Unit 7: 170 MWUnit 8: 180 MW
2023Unit 3: 380 MWUnit 2: 380 MW
Unit 2: 190 MWUnit 5: 180 MWUnit 4: 185 MW
2024 Unit 1: 376 MW Unit 1: 376 MWUnit 3: 185 MWUnit 2: 190 MWUnit 1: 190 MW
Table 6.8: Aging generators decommissioning schedule
Mpumalanga Underrated Equipment Upgrade Phase 2
• Upgrade of underrated equipment at the following substations:
• Vulcan 400 kV
• Rockdale 132 kV
• Hendrina 400 kV
• Kruispunt 132 kV
• Komati 275 kV
• Zeus 400 kV
• Arnot 400 kV and 275 kV
• Marathon 275 kV and 132 kV
Mpumalanga Underrated Equipment Upgrade Phase 3
• Reconfigure the transmission network:
• Bypass Tutuka substation by interconnecting the Tutuka ends of the Majuba-Tutuka and Kendal-Tutuka 400 kV lines.
• Equipment upgrades involving the following substations:
• Tutuka 400 kV, Alpha 400 kV, Majuba 400 kV and Matla 275 kV, as well as Matla substation fault-limiting reactors
Hendrina-Arnot 400 kV Equipment Upgrade
• This project will involve upgrading the equipment (isolators) on the Hendrina-Arnot 400 kV line, so that the line operates at its highest rating during emergencies.
Highveld South Reinforcement Phase 1: Sol MTS FCLR and Equipment Replacement
• Sol substation fault-limiting reactors in series with existing 400/132 kV transformers
• Replacement of all underrated equipment at Sol substation
Chapter 6: Breakdown of the TDP projects by province

Chapter 6: Breakdown of the TDP projects by province
6.4.5 Provincial summaryThe increase in transmission assets by the end of 2020 and the end of 2025 and cumulative total are shown in Table 6.9.
TRANSMISSION ASSETS FOR MPUMALANGA PROVINCE
NEW ASSETS EXPECTED IN 2016 - 2020 NEW ASSETS EXPECTED IN 2021 - 2025 TOTAL NEW ASSETS
Power lines (km)
765 kV 0 0 0
400 kV 397 102 499
275 kV 0 0 0
Total length (km) 397 102 499
Transformers
Number of units 6 5 11
Total capacity (MVA) 2750 2800 5550
Capacitors
Number of banks 1 0 1
Total capacity (MVar) 72 0 72
Reactors
Number of banks 0 0 0
Total capacity (MVar) 0 0 0
Table 6.9: Cumulative TDP transmission assets for Mpumalanga province
The following projects are planned for the 2016 to 2025 period:
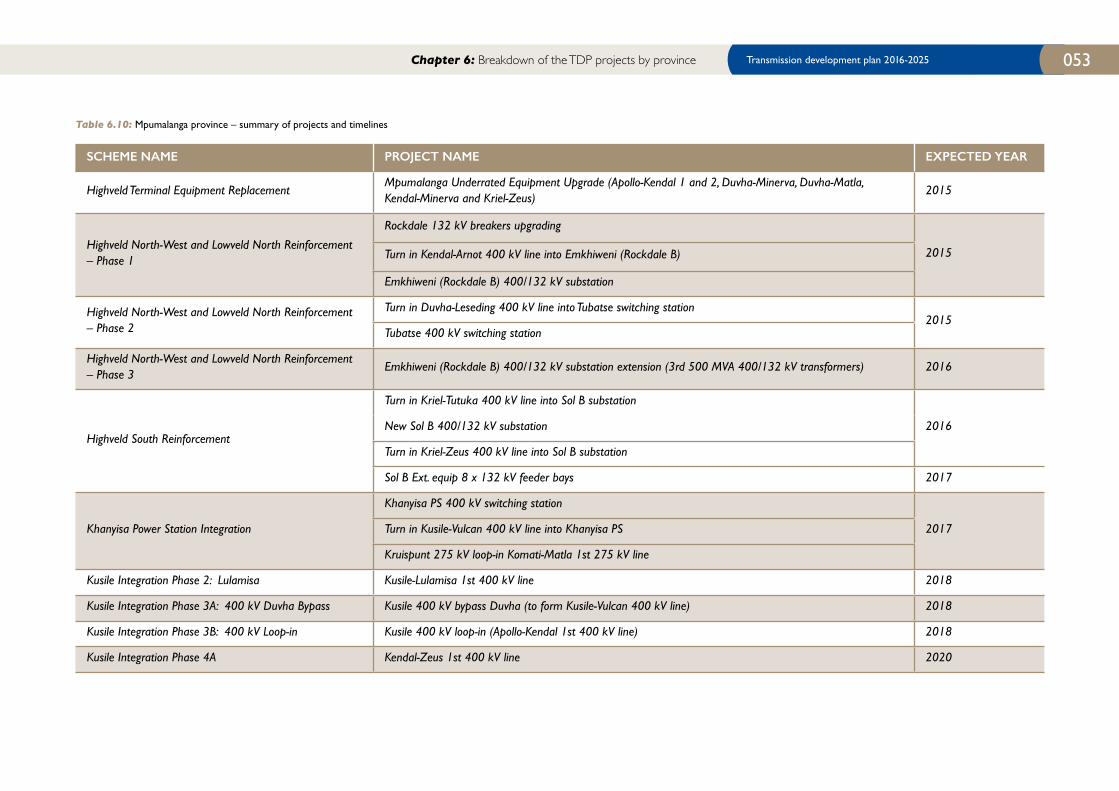
Transmission development plan 2016-2025 053
Table 6.10: Mpumalanga province – summary of projects and timelines
SCHEME NAME PROJECT NAME EXPECTED YEAR
Highveld Terminal Equipment ReplacementMpumalanga Underrated Equipment Upgrade (Apollo-Kendal 1 and 2, Duvha-Minerva, Duvha-Matla, Kendal-Minerva and Kriel-Zeus)
2015
Highveld North-West and Lowveld North Reinforcement – Phase 1
Rockdale 132 kV breakers upgrading
2015Turn in Kendal-Arnot 400 kV line into Emkhiweni (Rockdale B)
Emkhiweni (Rockdale B) 400/132 kV substation
Highveld North-West and Lowveld North Reinforcement – Phase 2
Turn in Duvha-Leseding 400 kV line into Tubatse switching station2015
Tubatse 400 kV switching station
Highveld North-West and Lowveld North Reinforcement – Phase 3
Emkhiweni (Rockdale B) 400/132 kV substation extension (3rd 500 MVA 400/132 kV transformers) 2016
Highveld South Reinforcement
Turn in Kriel-Tutuka 400 kV line into Sol B substation
2016New Sol B 400/132 kV substation
Turn in Kriel-Zeus 400 kV line into Sol B substation
Sol B Ext. equip 8 x 132 kV feeder bays 2017
Khanyisa Power Station Integration
Khanyisa PS 400 kV switching station
2017Turn in Kusile-Vulcan 400 kV line into Khanyisa PS
Kruispunt 275 kV loop-in Komati-Matla 1st 275 kV line
Kusile Integration Phase 2: Lulamisa Kusile-Lulamisa 1st 400 kV line 2018
Kusile Integration Phase 3A: 400 kV Duvha Bypass Kusile 400 kV bypass Duvha (to form Kusile-Vulcan 400 kV line) 2018
Kusile Integration Phase 3B: 400 kV Loop-in Kusile 400 kV loop-in (Apollo-Kendal 1st 400 kV line) 2018
Kusile Integration Phase 4A Kendal-Zeus 1st 400 kV line 2020
Chapter 6: Breakdown of the TDP projects by province

Chapter 6: Breakdown of the TDP projects by province
SCHEME NAME PROJECT NAME EXPECTED YEAR
Kusile Integration Phase 4B
Kusile 400 kV bypass Kendal (Kendal bypass required to form the Kusile-Zeus 400 kV line from Kusile-Kendal and Kendal-Zeus lines)
2020
Kendal-Zeus 2nd 400 kV line 2021
Kusile Integration Phase 4B
Kusile 400 kV bypass Kendal (Kendal bypass required to form the Kusile-Zeus 400 kV line from Kusile-Kendal and Kendal-Zeus lines)
2020
Kendal-Zeus 2nd 400 kV line 2021
Lowveld Strengthening Phase 2BGumeni-Marathon 400 kV line
2023Marathon 400/132 kV substation
Lowveld 400 kV Strengthening – Phase 3AGumeni 2nd 400/132 kV transformer
2023Marathon 400/275 kV substation (2nd transformer)
Lowveld 400 kV Strengthening – Phase 3BGumeni-Marathon 2nd 400 kV line 2024
Marathon 400/275 kV substation (2nd transformer) Customer dependent
Malelane 275 kV Reinforcement – Phase 3Khanyazwe (Malelane)-Marathon 400 kV line (operated as 2nd 275 kV line) Customer dependent
Khanyazwe (Malelane) Ext. 1st 500 MVA 400/132 kV transformer Deferred (2026)
Khanyazwe (Malelane) Reinforcement Phase 2 Khanyazwe (Malelane) 132 kV, 72 MVar capacitor bank Deferred (2026)
Normandie Ext. 2nd 250 MVA 400/132 kV transformer Normandie Ext. 2nd 250 MVA 400/132 kV transformer Deferred (2026)
Hendrina-Arnot 400 kV Equipment Upgrade Hendrina-Arnot 400 kV equipment upgrade Deferred (2026)
Mpumalanga Underrated Equipment Upgrade Phase 2Upgrade underrated equipment at Vulcan 400 kV, Rockdale 132 kV, Hendrina 400 kV, Kruispunt 132 kV, Komati 275 kV, Zeus 400 kV and Arnot 400 kV and 275 kV
Mpumalanga Underrated Equipment Upgrade Phase 3Bypass Tutuka substation by interconnecting the Tutuka ends of the Majuba-Tutuka and Kendal-Tutuka 400 kV lines. Tutuka 400 kV, Alpha 400 kV, Majuba 400 kV and Matla 275 kV equipment upgrade, as well as Matla substation fault-limiting reactors
Table 6.10: Mpumalanga province – summary of projects and timelines
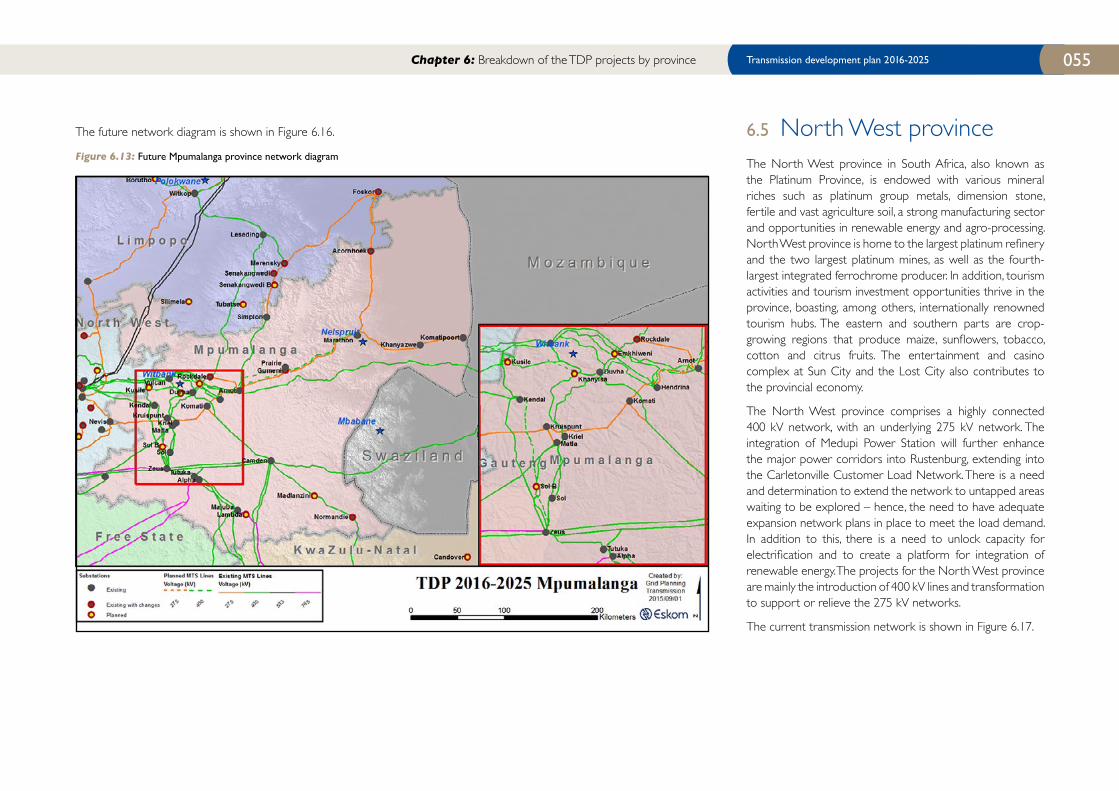
Transmission development plan 2016-2025 055
Figure 6.13: Future Mpumalanga province network diagram
The future network diagram is shown in Figure 6.16. 6.5 North West provinceThe North West province in South Africa, also known as the Platinum Province, is endowed with various mineral riches such as platinum group metals, dimension stone, fertile and vast agriculture soil, a strong manufacturing sector and opportunities in renewable energy and agro-processing. North West province is home to the largest platinum refinery and the two largest platinum mines, as well as the fourth-largest integrated ferrochrome producer. In addition, tourism activities and tourism investment opportunities thrive in the province, boasting, among others, internationally renowned tourism hubs. The eastern and southern parts are crop-growing regions that produce maize, sunflowers, tobacco, cotton and citrus fruits. The entertainment and casino complex at Sun City and the Lost City also contributes to the provincial economy.
The North West province comprises a highly connected 400 kV network, with an underlying 275 kV network. The integration of Medupi Power Station will further enhance the major power corridors into Rustenburg, extending into the Carletonville Customer Load Network. There is a need and determination to extend the network to untapped areas waiting to be explored – hence, the need to have adequate expansion network plans in place to meet the load demand. In addition to this, there is a need to unlock capacity for electrification and to create a platform for integration of renewable energy. The projects for the North West province are mainly the introduction of 400 kV lines and transformation to support or relieve the 275 kV networks.
The current transmission network is shown in Figure 6.17.
Chapter 6: Breakdown of the TDP projects by province

Chapter 6: Breakdown of the TDP projects by province
Figure 6.14: Current North West province network diagram
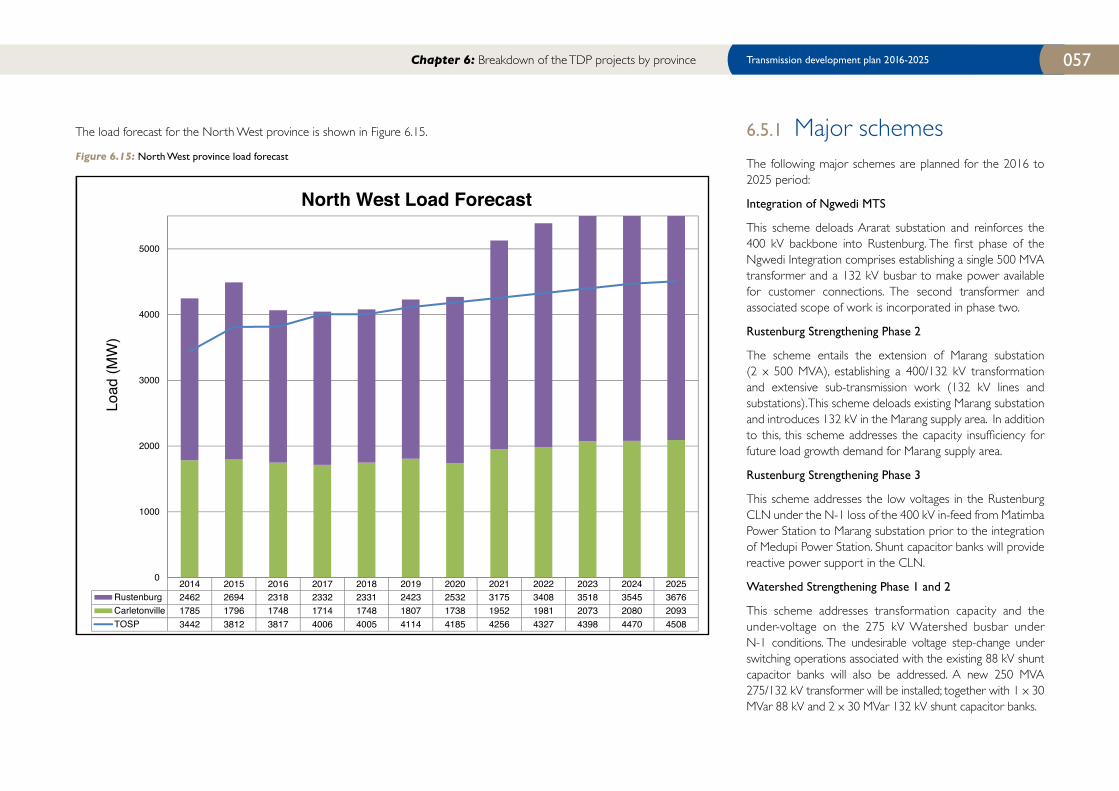
Transmission development plan 2016-2025 057
The load forecast for the North West province is shown in Figure 6.15.
Figure 6.15: North West province load forecast
6.5.1 Major schemesThe following major schemes are planned for the 2016 to 2025 period:
Integration of Ngwedi MTS
This scheme deloads Ararat substation and reinforces the 400 kV backbone into Rustenburg. The first phase of the Ngwedi Integration comprises establishing a single 500 MVA transformer and a 132 kV busbar to make power available for customer connections. The second transformer and associated scope of work is incorporated in phase two.
Rustenburg Strengthening Phase 2
The scheme entails the extension of Marang substation (2 x 500 MVA), establishing a 400/132 kV transformation and extensive sub-transmission work (132 kV lines and substations). This scheme deloads existing Marang substation and introduces 132 kV in the Marang supply area. In addition to this, this scheme addresses the capacity insufficiency for future load growth demand for Marang supply area.
Rustenburg Strengthening Phase 3
This scheme addresses the low voltages in the Rustenburg CLN under the N-1 loss of the 400 kV in-feed from Matimba Power Station to Marang substation prior to the integration of Medupi Power Station. Shunt capacitor banks will provide reactive power support in the CLN.
Watershed Strengthening Phase 1 and 2
This scheme addresses transformation capacity and the under-voltage on the 275 kV Watershed busbar under N-1 conditions. The undesirable voltage step-change under switching operations associated with the existing 88 kV shunt capacitor banks will also be addressed. A new 250 MVA 275/132 kV transformer will be installed; together with 1 x 30 MVar 88 kV and 2 x 30 MVar 132 kV shunt capacitor banks.
2014 2015 2016 2017 2018 2019 2020 2021 2022 2023 2024 2025Rustenburg 2462 2694 2318 2332 2331 2423 2532 3175 3408 3518 3545 3676Carletonville 1785 1796 1748 1714 1748 1807 1738 1952 1981 2073 2080 2093TOSP 3442 3812 3817 4006 4005 4114 4185 4256 4327 4398 4470 4508
0
1000
2000
3000
4000
5000
Load
(MW
)
North West Load Forecast
Chapter 6: Breakdown of the TDP projects by province
Chapter 6: Breakdown of the TDP projects by province
Watershed (Backbone) Strengthening Phase 3
Beyond 2020, further network enhancements are required to address the Watershed insufficient transformation capacity and the poor voltage profile under N-1 contingency of the Pluto-Watershed 275 kV line. There is an additional load of 180 MW expected, approximately 60 km west of Watershed, in Mafikeng. This scheme deloads Watershed substation and introduces 400 kV injection in Mafikeng, via establishment of Pluto-Mafikeng and Mookodi-Mafikeng 400 kV lines and the new Mafikeng (Watershed B) 2 x 500 MVA 400/132 kV substation.
Kimberley Strengthening Phase 2
The transmission scope entails establishment of the 1st Mercury-Mookodi-Ferrum 400 kV line and Mookodi 2 x 250 MVA 400/132 kV substation. Mookodi was recommended for supplying the distribution and municipal networks in the Vryburg and Edwards Dam areas. The substation will deload both Watershed and Boundary substation. This project has been commissioned and is in service; however, the projects for Distribution’s 132 kV lines are delayed due to servitude challenges.
6.5.2 Generation capacityThere are no power stations in the province, which is supplied from both Matimba and the Mpumalanga Power Pool. The load flows will change after the integration of Medupi Power Station and most of the power into the North West province will come from the Waterberg Power Pool.
Medupi Integration will increase fault levels in the transmission networks in close proximity to the power station as well as the neighbouring networks. This will aggravate existing fault level exceedances at some of the substations. The fault level exceedances caused by the integration of Medupi will be addressed by the Waterberg Generation Integration Fault Level Management Plan.
6.5.3 Renewable generationThere are currently no renewable energy plants in the province; however, there is interest in connecting solar PV plants at Mookodi and Watershed substations.
6.5.4 Substation firm capacity• Ngwedi 2 x 500 MVA 400/132 kV substation Integration
is planned to deload Ararat substation. A 3rd 500 MVA 400/132 kV transformer is also planned to restore transformation firm capacity at Ngwedi.
• Rustenburg Strengthening Phase 2, which entails the Marang Extension (2 x 500 MVA 400/132 kV transformers), is planned to deload the Marang 400/88 kV substation.
• A 3rd Dinaledi 500 MVA 400/132 kV transformer is planned to deload Lomond substation.
• Bighorn Extension (2 x 500 MVA 400/132 kV transformers) is planned to deload Bighorn substation.
• A single Watershed 250 MVA 275/132 kV transformer is planned for Watershed substation.
• Mookodi substation (2 x 250 MVA 400/132 kV transformers) is planned to deload Watershed.
• Watershed (Backbone) Strengthening Phase 3 – Mafikeng substation (Watershed B) (2 x 500 MVA 400/132 kV transformers) is planned to deload Watershed substation and support the load demand in Mafikeng.
• There will be a 132 kV load shift from Midas substation to Carmel substation to deload Midas 400/132 kV load. This project will be executed by Distribution.
6.5.5 Reactive power compensationThe following projects will address reactive concerns:
• Watershed substation 132 kV reactive power compensation (2 x 30 MVar shunt capacitor banks)
• Watershed substation 88 kV reactive power compensation (1 x 30 MVar shunt capacitor banks)
• Bighorn reactive power compensation (2 x 72 MVar 132 kV and 3 x 48 MVar 88 kV shunt capacitor banks)
• Marang reactive power compensation (5 x 48 MVar 88 kV shunt capacitor banks)
• Dinaledi reactive power compensation (3 x 72 MVar 88 kV shunt capacitor banks)
6.5.6 Underrated equipmentThe underrated equipment at various substations will be addressed as part of the Waterberg Generation Integration Fault Level Management Plan. The project entails installing fault current limiting reactors at Marang substation, replacing underrated equipment and upgrading earth-mats, where required, at affected substations. In the North West province, the substations and voltage levels requiring work are Ararat 88 kV, Bighorn 88 kV, Marang 88 kV, Trident 88 kV, Hermes 88 kV and 132 kV and Midas 132 kV.
6.5.7 Provincial summaryThe increase in transmission assets by the end of 2020 and the end of 2025 and cumulative total are shown in Table 6.11.
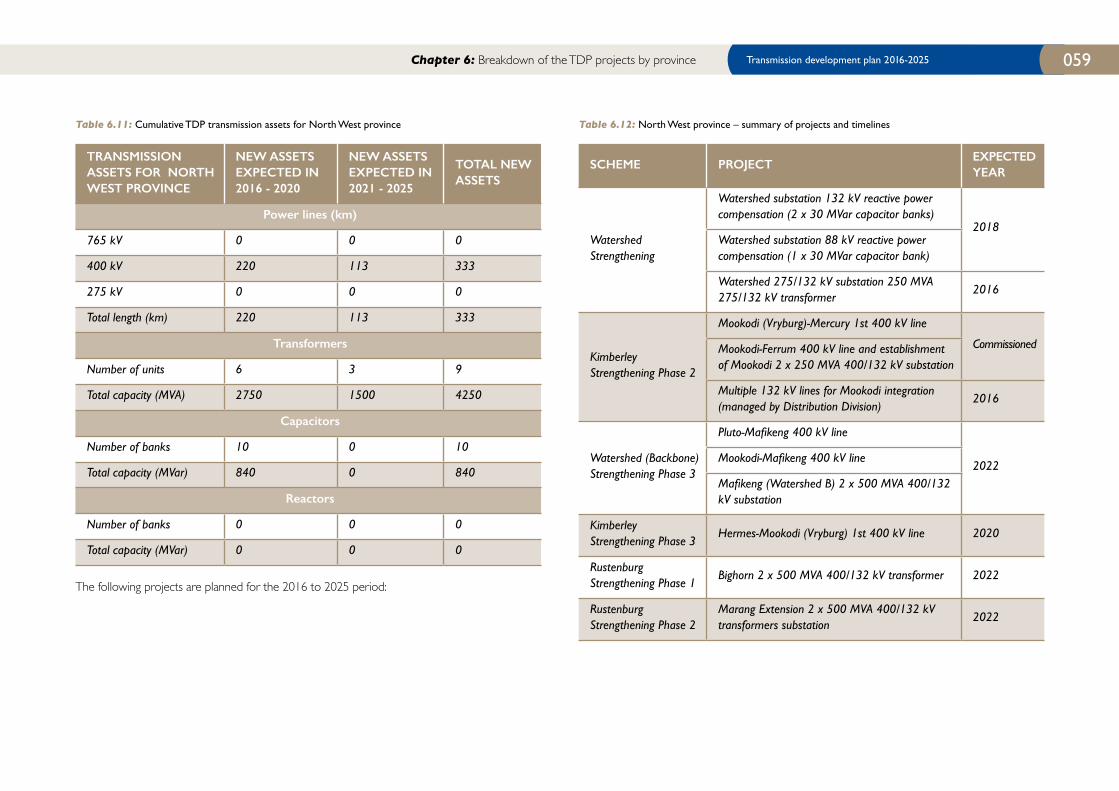
Transmission development plan 2016-2025 059
TRANSMISSION ASSETS FOR NORTH WEST PROVINCE
NEW ASSETS EXPECTED IN 2016 - 2020
NEW ASSETS EXPECTED IN 2021 - 2025
TOTAL NEW ASSETS
Power lines (km)
765 kV 0 0 0
400 kV 220 113 333
275 kV 0 0 0
Total length (km) 220 113 333
Transformers
Number of units 6 3 9
Total capacity (MVA) 2750 1500 4250
Capacitors
Number of banks 10 0 10
Total capacity (MVar) 840 0 840
Reactors
Number of banks 0 0 0
Total capacity (MVar) 0 0 0
Table 6.11: Cumulative TDP transmission assets for North West province
The following projects are planned for the 2016 to 2025 period:
SCHEME PROJECTEXPECTED YEAR
Watershed Strengthening
Watershed substation 132 kV reactive power compensation (2 x 30 MVar capacitor banks)
2018Watershed substation 88 kV reactive power compensation (1 x 30 MVar capacitor bank)
Watershed 275/132 kV substation 250 MVA 275/132 kV transformer
2016
Kimberley Strengthening Phase 2
Mookodi (Vryburg)-Mercury 1st 400 kV line
CommissionedMookodi-Ferrum 400 kV line and establishment of Mookodi 2 x 250 MVA 400/132 kV substation
Multiple 132 kV lines for Mookodi integration (managed by Distribution Division)
2016
Watershed (Backbone) Strengthening Phase 3
Pluto-Mafikeng 400 kV line
2022Mookodi-Mafikeng 400 kV line
Mafikeng (Watershed B) 2 x 500 MVA 400/132 kV substation
Kimberley Strengthening Phase 3
Hermes-Mookodi (Vryburg) 1st 400 kV line 2020
Rustenburg Strengthening Phase 1
Bighorn 2 x 500 MVA 400/132 kV transformer 2022
Rustenburg Strengthening Phase 2
Marang Extension 2 x 500 MVA 400/132 kV transformers substation
2022
Table 6.12: North West province – summary of projects and timelines
Chapter 6: Breakdown of the TDP projects by province

Chapter 6: Breakdown of the TDP projects by province
SCHEME PROJECTEXPECTED YEAR
Rustenburg Strengthening Phase 3
Bighorn reactive compensation (2 x 72 MVar 132 kV and 3 x 48 MVar 88 kV shunt capacitor banks)
2024Marang reactive power compensation (5 x 48 MVar 88 kV shunt capacitor banks)
Dinaledi reactive compensation (3 x 72 MVar 88 kV shunt capacitor banks)
Medupi Integration Phase 2A: Mogwase
Bighorn reactive compensation (2 x 72 MVar 132 kV and 3 x 48 MVar 88 kV shunt capacitor banks)
2024Marang reactive power compensation (5 x 48 MVar 88 kV shunt capacitor banks)
Dinaledi reactive compensation (3 x 72 MVar 88 kV shunt capacitor banks)
Medupi Integration Phase 2A: Mogwase
Ngwedi 2 x 500 MVA 400/132 kV substation
2016 to 2019
Ngwedi 400 kV loop-in (Matimba-Midas and Mara-Midas 400 kV lines)
Medupi-Ngwedi 1st 400 kV line
Medupi-Ngwedi 1st 765 kV line (energised at 400 kV)
Dinaledi Phase 1Dinaledi 3rd 500 MVA 400/132 kV 275 kV transformer
2017
Ngwedi 3rd Transformer
Ngwedi 3rd 500 MVA 400/132 kV transformer 2022
Table 6.12: North West province – summary of projects and timelines
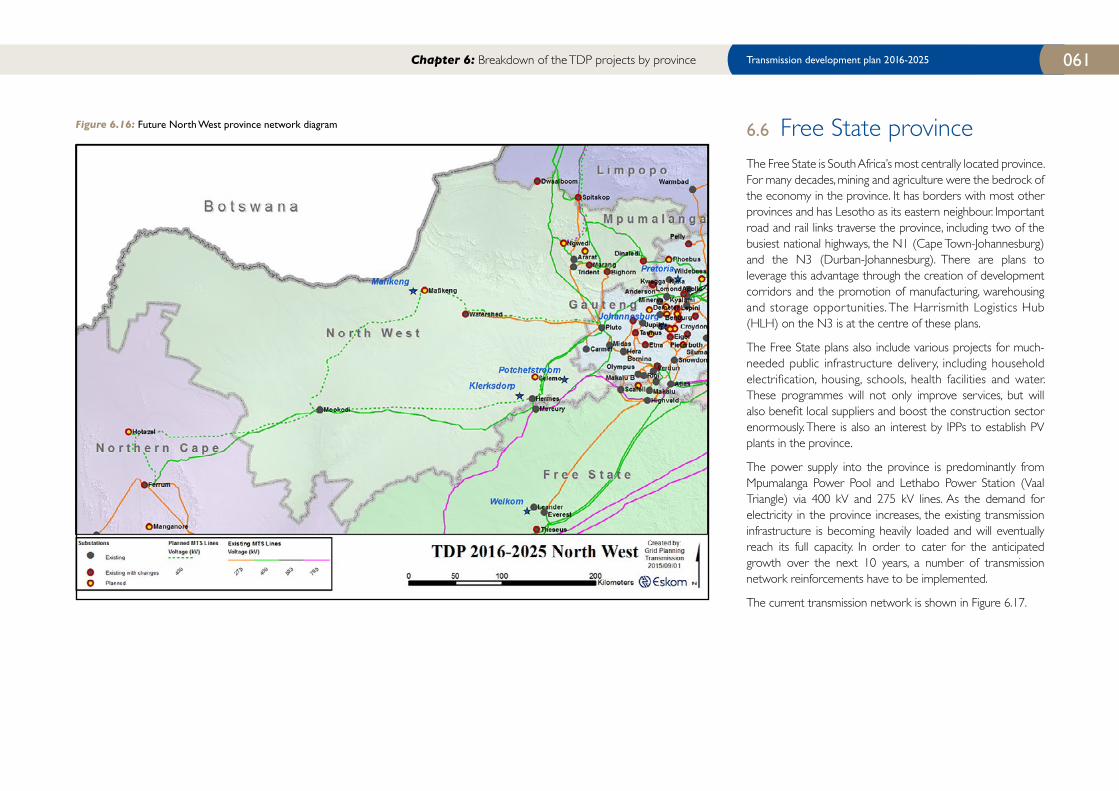
Transmission development plan 2016-2025 061
Figure 6.16: Future North West province network diagram 6.6 Free State provinceThe Free State is South Africa’s most centrally located province. For many decades, mining and agriculture were the bedrock of the economy in the province. It has borders with most other provinces and has Lesotho as its eastern neighbour. Important road and rail links traverse the province, including two of the busiest national highways, the N1 (Cape Town-Johannesburg) and the N3 (Durban-Johannesburg). There are plans to leverage this advantage through the creation of development corridors and the promotion of manufacturing, warehousing and storage opportunities. The Harrismith Logistics Hub (HLH) on the N3 is at the centre of these plans.
The Free State plans also include various projects for much-needed public infrastructure delivery, including household electrification, housing, schools, health facilities and water. These programmes will not only improve services, but will also benefit local suppliers and boost the construction sector enormously. There is also an interest by IPPs to establish PV plants in the province.
The power supply into the province is predominantly from Mpumalanga Power Pool and Lethabo Power Station (Vaal Triangle) via 400 kV and 275 kV lines. As the demand for electricity in the province increases, the existing transmission infrastructure is becoming heavily loaded and will eventually reach its full capacity. In order to cater for the anticipated growth over the next 10 years, a number of transmission network reinforcements have to be implemented.
The current transmission network is shown in Figure 6.17.
Chapter 6: Breakdown of the TDP projects by province
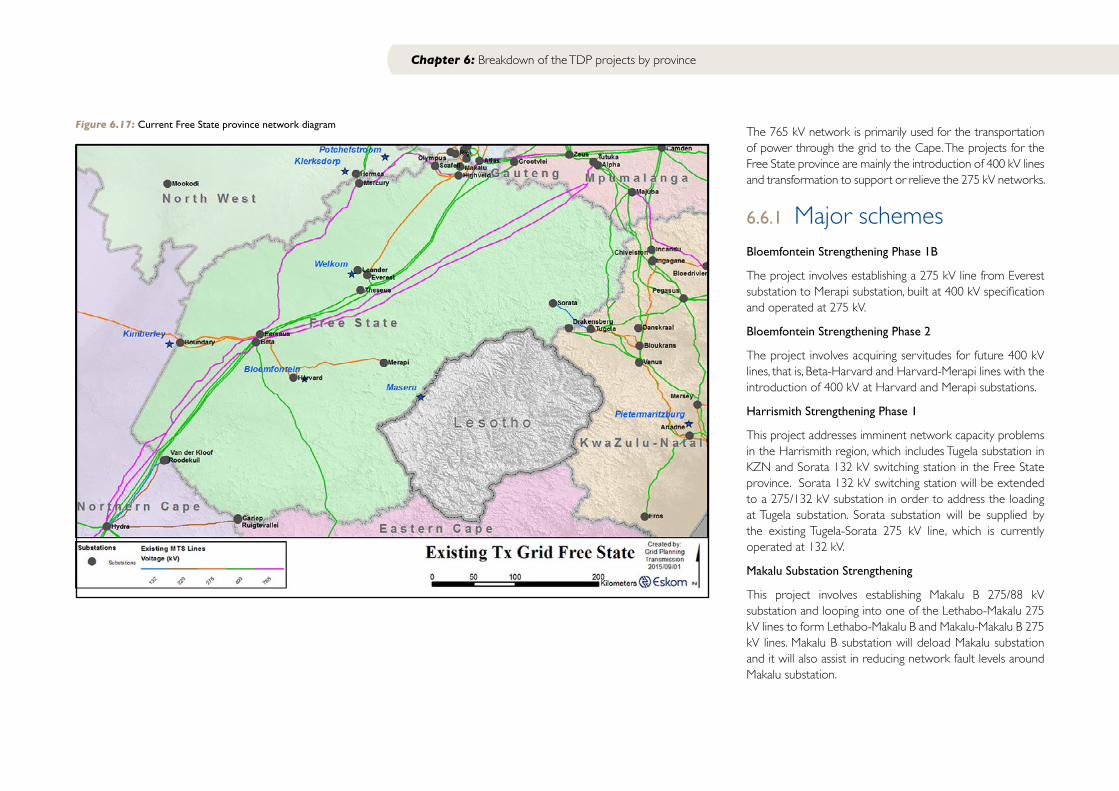
Chapter 6: Breakdown of the TDP projects by province
Figure 6.17: Current Free State province network diagram The 765 kV network is primarily used for the transportation of power through the grid to the Cape. The projects for the Free State province are mainly the introduction of 400 kV lines and transformation to support or relieve the 275 kV networks.
6.6.1 Major schemesBloemfontein Strengthening Phase 1B
The project involves establishing a 275 kV line from Everest substation to Merapi substation, built at 400 kV specification and operated at 275 kV.
Bloemfontein Strengthening Phase 2
The project involves acquiring servitudes for future 400 kV lines, that is, Beta-Harvard and Harvard-Merapi lines with the introduction of 400 kV at Harvard and Merapi substations.
Harrismith Strengthening Phase 1
This project addresses imminent network capacity problems in the Harrismith region, which includes Tugela substation in KZN and Sorata 132 kV switching station in the Free State province. Sorata 132 kV switching station will be extended to a 275/132 kV substation in order to address the loading at Tugela substation. Sorata substation will be supplied by the existing Tugela-Sorata 275 kV line, which is currently operated at 132 kV.
Makalu Substation Strengthening
This project involves establishing Makalu B 275/88 kV substation and looping into one of the Lethabo-Makalu 275 kV lines to form Lethabo-Makalu B and Makalu-Makalu B 275 kV lines. Makalu B substation will deload Makalu substation and it will also assist in reducing network fault levels around Makalu substation.
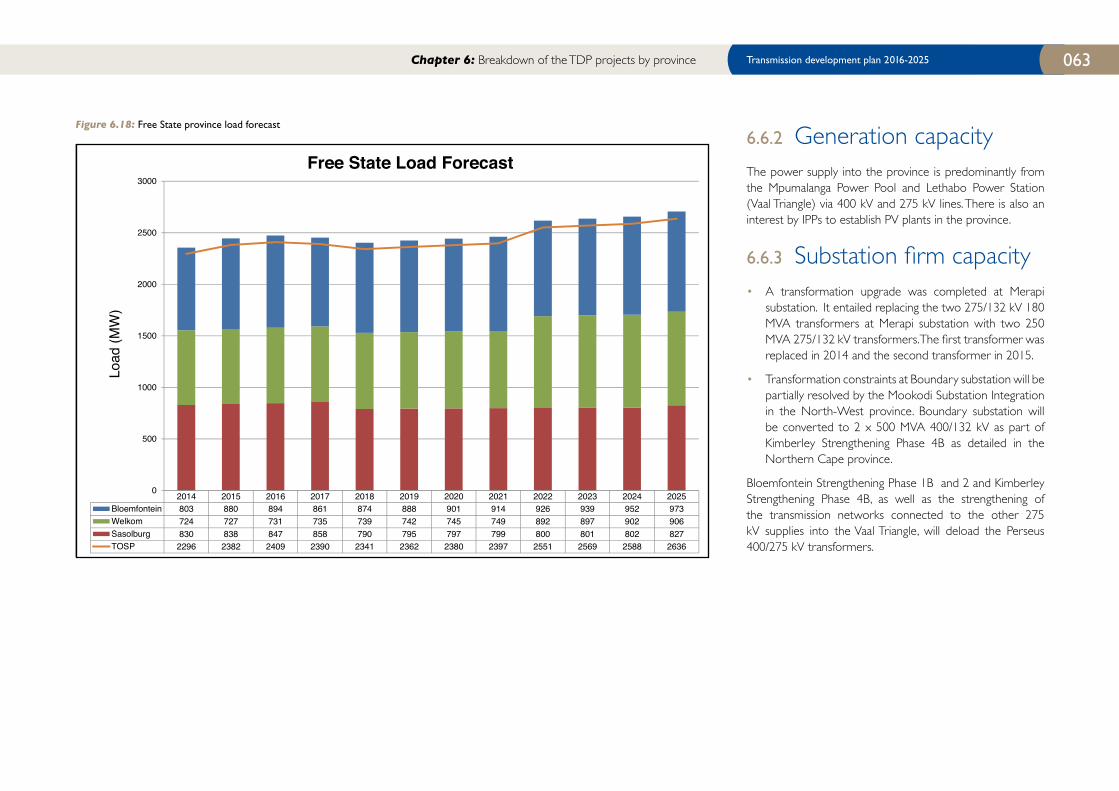
Transmission development plan 2016-2025 063
6.6.2 Generation capacityThe power supply into the province is predominantly from the Mpumalanga Power Pool and Lethabo Power Station (Vaal Triangle) via 400 kV and 275 kV lines. There is also an interest by IPPs to establish PV plants in the province.
6.6.3 Substation firm capacity• A transformation upgrade was completed at Merapi
substation. It entailed replacing the two 275/132 kV 180 MVA transformers at Merapi substation with two 250 MVA 275/132 kV transformers. The first transformer was replaced in 2014 and the second transformer in 2015.
• Transformation constraints at Boundary substation will be partially resolved by the Mookodi Substation Integration in the North-West province. Boundary substation will be converted to 2 x 500 MVA 400/132 kV as part of Kimberley Strengthening Phase 4B as detailed in the Northern Cape province.
Bloemfontein Strengthening Phase 1B and 2 and Kimberley Strengthening Phase 4B, as well as the strengthening of the transmission networks connected to the other 275 kV supplies into the Vaal Triangle, will deload the Perseus 400/275 kV transformers.
2014 2015 2016 2017 2018 2019 2020 2021 2022 2023 2024 2025Bloemfontein 803 880 894 861 874 888 901 914 926 939 952 973Welkom 724 727 731 735 739 742 745 749 892 897 902 906Sasolburg 830 838 847 858 790 795 797 799 800 801 802 827TOSP 2296 2382 2409 2390 2341 2362 2380 2397 2551 2569 2588 2636
0
500
1000
1500
2000
2500
3000
Load
(MW
)
Free State Load Forecast
Figure 6.18: Free State province load forecast
Chapter 6: Breakdown of the TDP projects by province
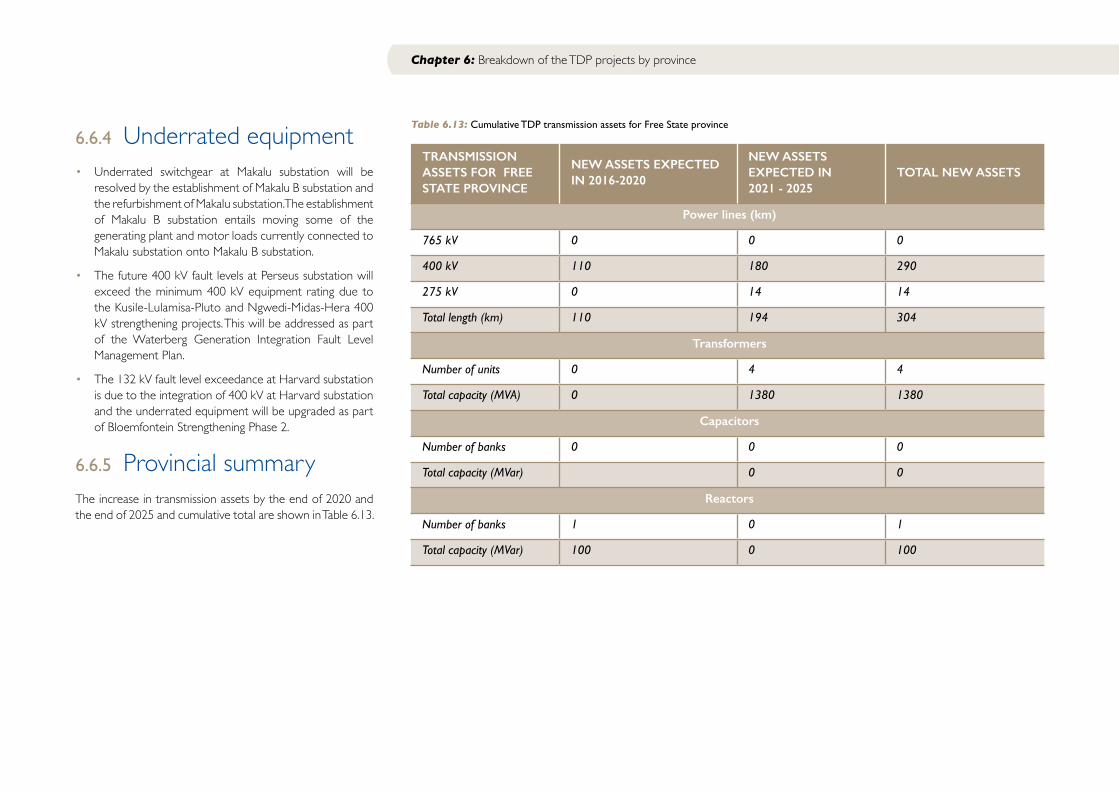
Chapter 6: Breakdown of the TDP projects by province
6.6.4 Underrated equipment• Underrated switchgear at Makalu substation will be
resolved by the establishment of Makalu B substation and the refurbishment of Makalu substation. The establishment of Makalu B substation entails moving some of the generating plant and motor loads currently connected to Makalu substation onto Makalu B substation.
• The future 400 kV fault levels at Perseus substation will exceed the minimum 400 kV equipment rating due to the Kusile-Lulamisa-Pluto and Ngwedi-Midas-Hera 400 kV strengthening projects. This will be addressed as part of the Waterberg Generation Integration Fault Level Management Plan.
• The 132 kV fault level exceedance at Harvard substation is due to the integration of 400 kV at Harvard substation and the underrated equipment will be upgraded as part of Bloemfontein Strengthening Phase 2.
6.6.5 Provincial summaryThe increase in transmission assets by the end of 2020 and the end of 2025 and cumulative total are shown in Table 6.13.
TRANSMISSION ASSETS FOR FREE STATE PROVINCE
NEW ASSETS EXPECTED IN 2016-2020
NEW ASSETS EXPECTED IN 2021 - 2025
TOTAL NEW ASSETS
Power lines (km)
765 kV 0 0 0
400 kV 110 180 290
275 kV 0 14 14
Total length (km) 110 194 304
Transformers
Number of units 0 4 4
Total capacity (MVA) 0 1380 1380
Capacitors
Number of banks 0 0 0
Total capacity (MVar) 0 0
Reactors
Number of banks 1 0 1
Total capacity (MVar) 100 0 100
Table 6.13: Cumulative TDP transmission assets for Free State province
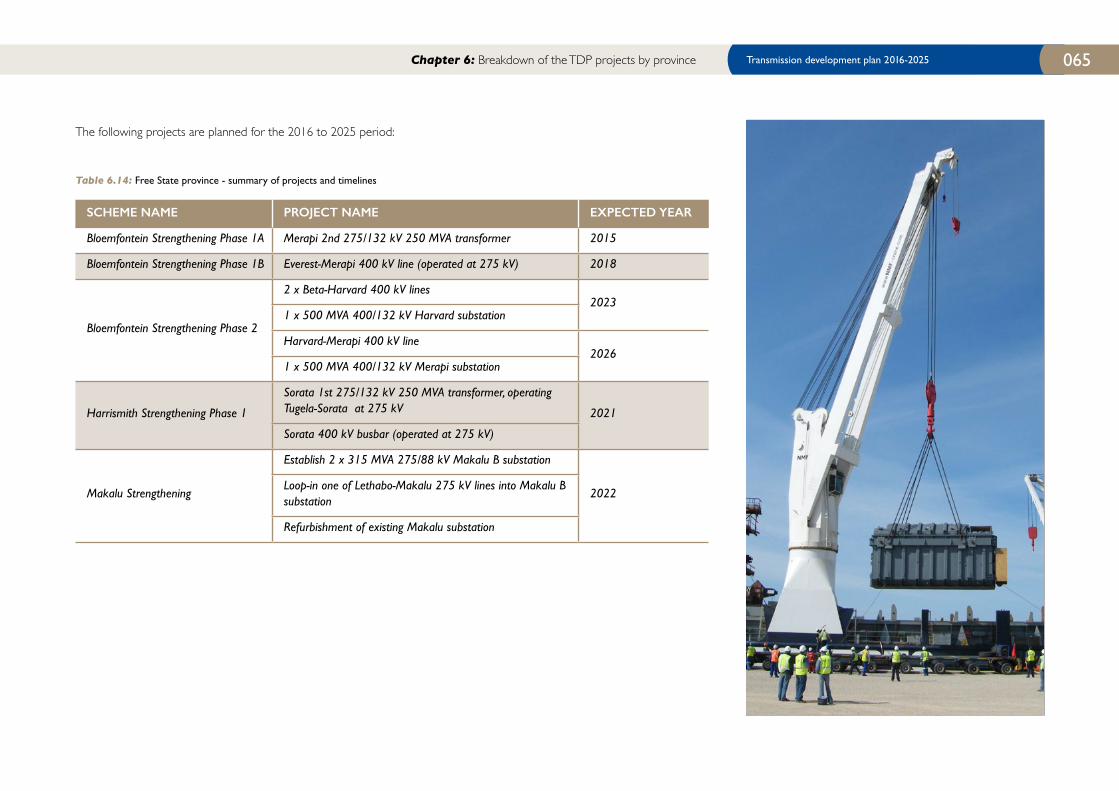
Transmission development plan 2016-2025 065
The following projects are planned for the 2016 to 2025 period:
SCHEME NAME PROJECT NAME EXPECTED YEAR
Bloemfontein Strengthening Phase 1A Merapi 2nd 275/132 kV 250 MVA transformer 2015
Bloemfontein Strengthening Phase 1B Everest-Merapi 400 kV line (operated at 275 kV) 2018
Bloemfontein Strengthening Phase 2
2 x Beta-Harvard 400 kV lines2023
1 x 500 MVA 400/132 kV Harvard substation
Harvard-Merapi 400 kV line2026
1 x 500 MVA 400/132 kV Merapi substation
Harrismith Strengthening Phase 1
Sorata 1st 275/132 kV 250 MVA transformer, operating Tugela-Sorata at 275 kV 2021
Sorata 400 kV busbar (operated at 275 kV)
Makalu Strengthening
Establish 2 x 315 MVA 275/88 kV Makalu B substation
2022Loop-in one of Lethabo-Makalu 275 kV lines into Makalu B substation
Refurbishment of existing Makalu substation
Table 6.14: Free State province - summary of projects and timelines
Chapter 6: Breakdown of the TDP projects by province
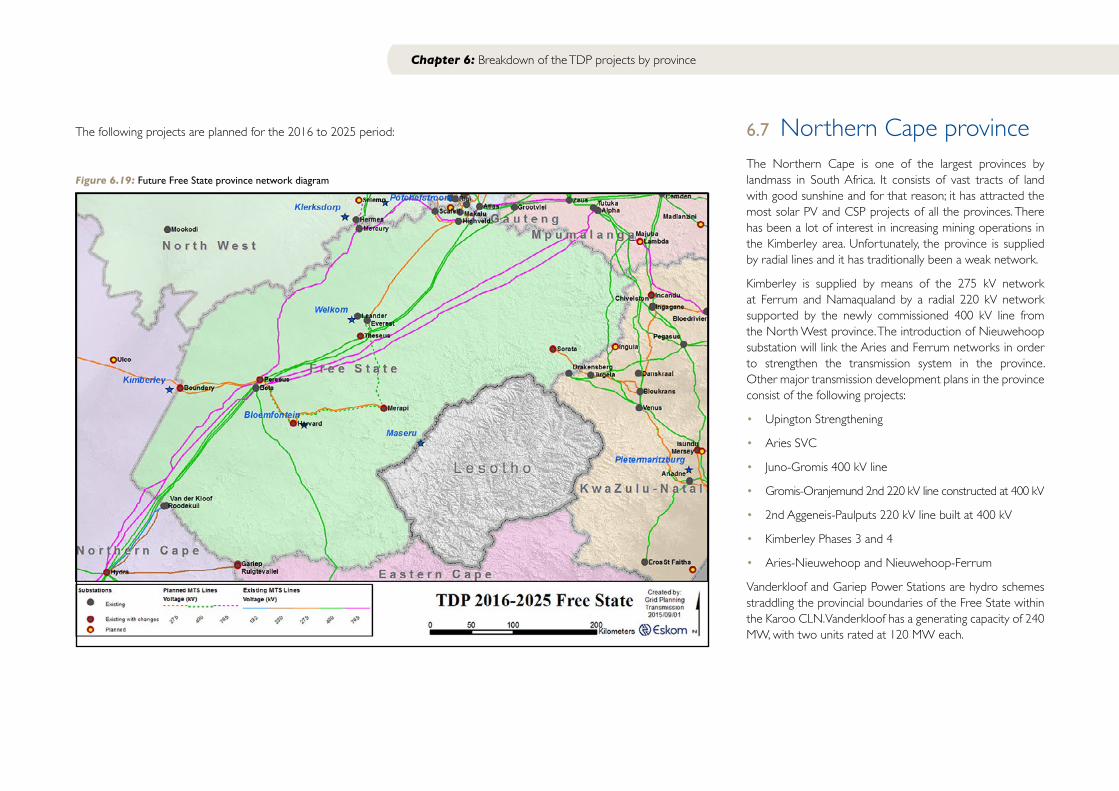
Chapter 6: Breakdown of the TDP projects by province
Figure 6.19: Future Free State province network diagram
The following projects are planned for the 2016 to 2025 period: 6.7 Northern Cape provinceThe Northern Cape is one of the largest provinces by landmass in South Africa. It consists of vast tracts of land with good sunshine and for that reason; it has attracted the most solar PV and CSP projects of all the provinces. There has been a lot of interest in increasing mining operations in the Kimberley area. Unfortunately, the province is supplied by radial lines and it has traditionally been a weak network.
Kimberley is supplied by means of the 275 kV network at Ferrum and Namaqualand by a radial 220 kV network supported by the newly commissioned 400 kV line from the North West province. The introduction of Nieuwehoop substation will link the Aries and Ferrum networks in order to strengthen the transmission system in the province. Other major transmission development plans in the province consist of the following projects:
• Upington Strengthening
• Aries SVC
• Juno-Gromis 400 kV line
• Gromis-Oranjemund 2nd 220 kV line constructed at 400 kV
• 2nd Aggeneis-Paulputs 220 kV line built at 400 kV
• Kimberley Phases 3 and 4
• Aries-Nieuwehoop and Nieuwehoop-Ferrum
Vanderkloof and Gariep Power Stations are hydro schemes straddling the provincial boundaries of the Free State within the Karoo CLN. Vanderkloof has a generating capacity of 240 MW, with two units rated at 120 MW each.
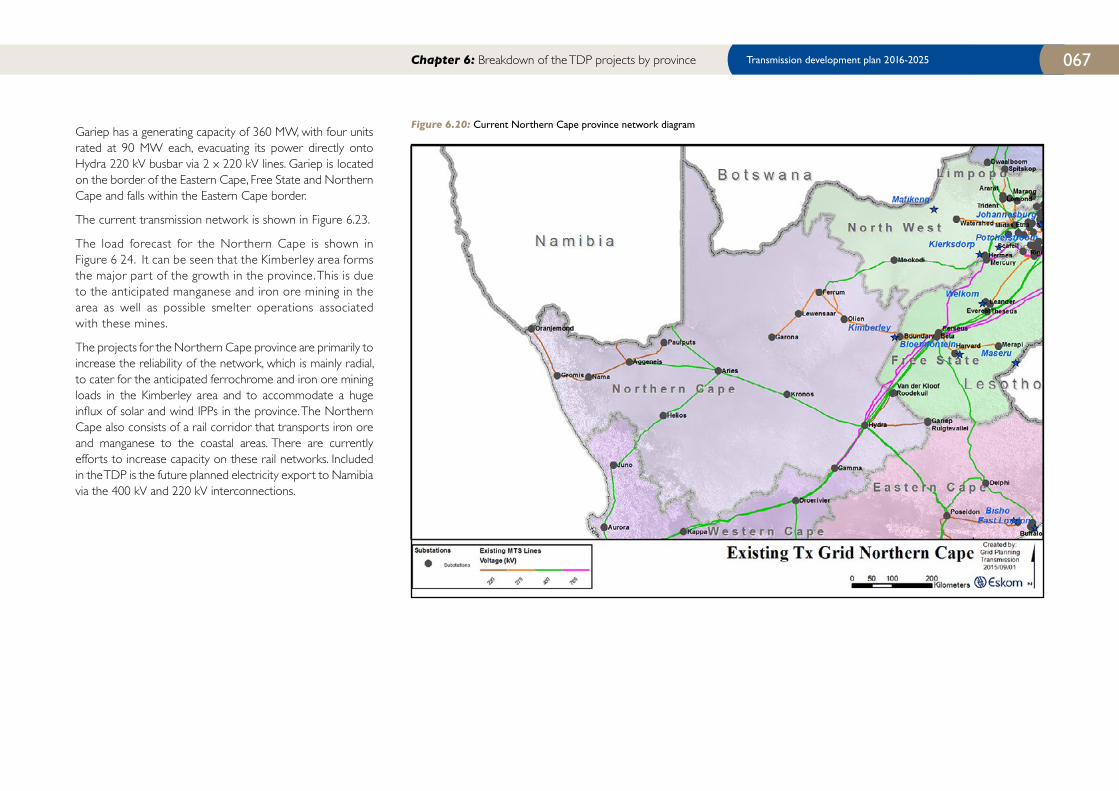
Transmission development plan 2016-2025 067
Gariep has a generating capacity of 360 MW, with four units rated at 90 MW each, evacuating its power directly onto Hydra 220 kV busbar via 2 x 220 kV lines. Gariep is located on the border of the Eastern Cape, Free State and Northern Cape and falls within the Eastern Cape border.
The current transmission network is shown in Figure 6.23.
The load forecast for the Northern Cape is shown in Figure 6 24. It can be seen that the Kimberley area forms the major par t of the growth in the province. This is due to the anticipated manganese and iron ore mining in the area as well as possible smelter operations associated with these mines.
The projects for the Northern Cape province are primarily to increase the reliability of the network, which is mainly radial, to cater for the anticipated ferrochrome and iron ore mining loads in the Kimberley area and to accommodate a huge influx of solar and wind IPPs in the province. The Northern Cape also consists of a rail corridor that transports iron ore and manganese to the coastal areas. There are currently efforts to increase capacity on these rail networks. Included in the TDP is the future planned electricity export to Namibia via the 400 kV and 220 kV interconnections.
Figure 6.20: Current Northern Cape province network diagram
Chapter 6: Breakdown of the TDP projects by province
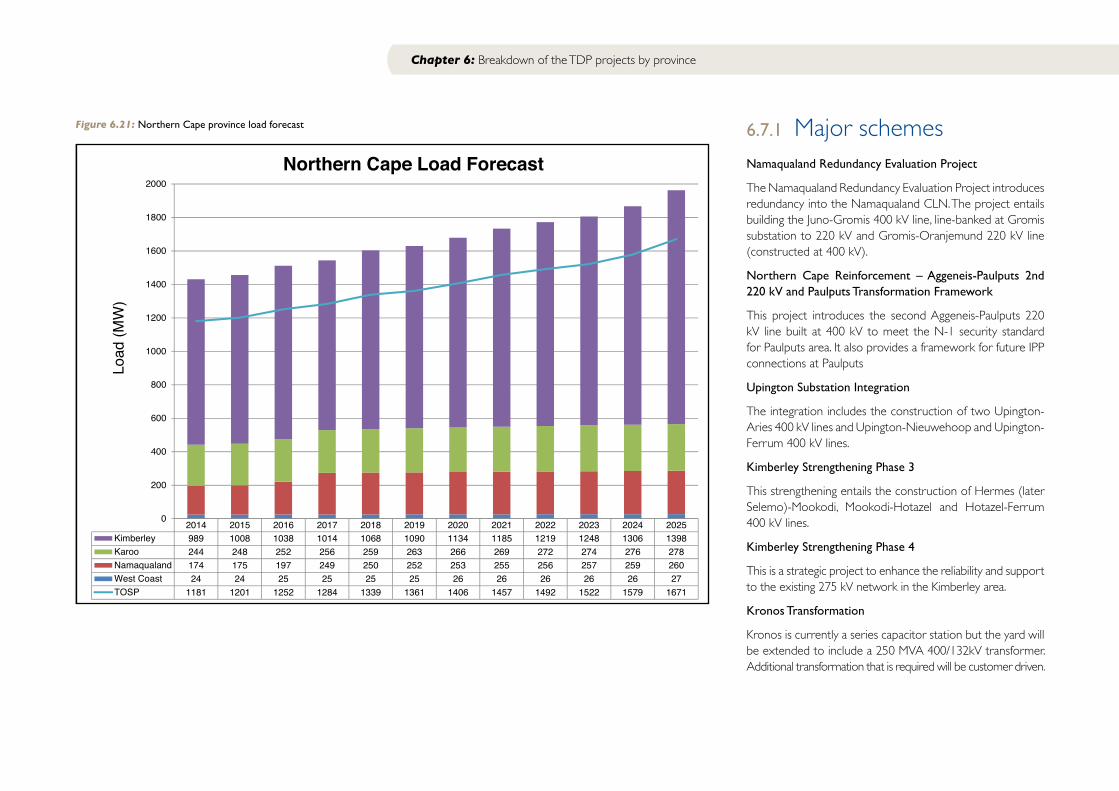
Chapter 6: Breakdown of the TDP projects by province
Figure 6.21: Northern Cape province load forecast 6.7.1 Major schemesNamaqualand Redundancy Evaluation Project
The Namaqualand Redundancy Evaluation Project introduces redundancy into the Namaqualand CLN. The project entails building the Juno-Gromis 400 kV line, line-banked at Gromis substation to 220 kV and Gromis-Oranjemund 220 kV line (constructed at 400 kV).
Northern Cape Reinforcement – Aggeneis-Paulputs 2nd 220 kV and Paulputs Transformation Framework
This project introduces the second Aggeneis-Paulputs 220 kV line built at 400 kV to meet the N-1 security standard for Paulputs area. It also provides a framework for future IPP connections at Paulputs
Upington Substation Integration
The integration includes the construction of two Upington-Aries 400 kV lines and Upington-Nieuwehoop and Upington-Ferrum 400 kV lines.
Kimberley Strengthening Phase 3
This strengthening entails the construction of Hermes (later Selemo)-Mookodi, Mookodi-Hotazel and Hotazel-Ferrum 400 kV lines.
Kimberley Strengthening Phase 4
This is a strategic project to enhance the reliability and support to the existing 275 kV network in the Kimberley area.
Kronos Transformation
Kronos is currently a series capacitor station but the yard will be extended to include a 250 MVA 400/132kV transformer. Additional transformation that is required will be customer driven.
2014 2015 2016 2017 2018 2019 2020 2021 2022 2023 2024 2025Kimberley 989 1008 1038 1014 1068 1090 1134 1185 1219 1248 1306 1398Karoo 244 248 252 256 259 263 266 269 272 274 276 278Namaqualand 174 175 197 249 250 252 253 255 256 257 259 260West Coast 24 24 25 25 25 25 26 26 26 26 26 27TOSP 1181 1201 1252 1284 1339 1361 1406 1457 1492 1522 1579 1671
0
200
400
600
800
1000
1200
1400
1600
1800
2000
Load
(MW
)
Northern Cape Load Forecast

Transmission development plan 2016-2025 069
Paulputs Transformation
This project introduces a 220 kV busbar and a 250 MVA 220/132 kV transformer. This is required to accommodate IPP connections at Paulputs from round 4 and beyond.
Kudu Gas Power Station Integration
This project entails the integration of the 885 MW Kudu gas power station. It integrates into the Eskom network at Oranjemond substation. It introduces 400/220 kV transformation at Oranjemond and the construction of Oranjemond - Aggeneis 400 kV line. This project is dependent on the Juno - Gromis and Gromis - Oranjemond 400 kV line projects.
6.7.2 Renewable generationThe Northern Cape has a high potential for renewables energy due to its climate and proximity to the coastal line. Table 6.15 shows all the approved projects under REIPPPP 1 to 4 in the Northern Cape.
REIPPPP ROUND REIPPPP ROUND CAPACITY (MW)
1
CSP 150
Wind 72
PV 461
REIPPPP 1 capacity 683
2
CSP 50
Wind 3
PV 269
REIPPPP 2 capacity 322
3
CSP 400
Wind 590
PV 225
REIPPPP 3 capacity 1 215
4Wind 794
PV 545
REIPPPP 4 capacity 1 339
Northern Cape total generation capacity 3 559
Table 6.15: Approved projects in the Northern Cape under the REIPPPP
Chapter 6: Breakdown of the TDP projects by province
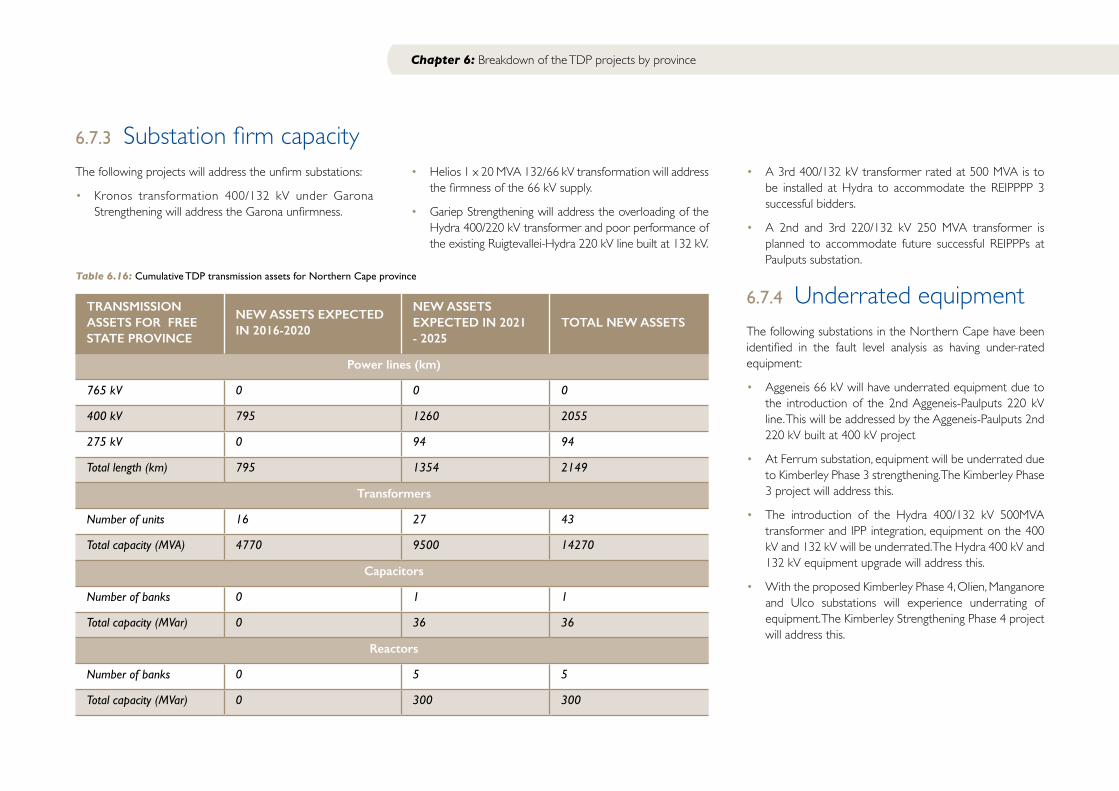
6.7.3 Substation firm capacityThe following projects will address the unfirm substations:
• Kronos transformation 400/132 kV under Garona Strengthening will address the Garona unfirmness.
• Helios 1 x 20 MVA 132/66 kV transformation will address
the firmness of the 66 kV supply.
• Gariep Strengthening will address the overloading of the Hydra 400/220 kV transformer and poor performance of the existing Ruigtevallei-Hydra 220 kV line built at 132 kV.
• A 3rd 400/132 kV transformer rated at 500 MVA is to
be installed at Hydra to accommodate the REIPPPP 3 successful bidders.
• A 2nd and 3rd 220/132 kV 250 MVA transformer is planned to accommodate future successful REIPPPs at Paulputs substation.
6.7.4 Underrated equipmentThe following substations in the Northern Cape have been identified in the fault level analysis as having under-rated equipment:
• Aggeneis 66 kV will have underrated equipment due to the introduction of the 2nd Aggeneis-Paulputs 220 kV line. This will be addressed by the Aggeneis-Paulputs 2nd 220 kV built at 400 kV project
• At Ferrum substation, equipment will be underrated due to Kimberley Phase 3 strengthening. The Kimberley Phase 3 project will address this.
• The introduction of the Hydra 400/132 kV 500MVA transformer and IPP integration, equipment on the 400 kV and 132 kV will be underrated. The Hydra 400 kV and 132 kV equipment upgrade will address this.
• With the proposed Kimberley Phase 4, Olien, Manganore and Ulco substations will experience underrating of equipment. The Kimberley Strengthening Phase 4 project will address this.
Chapter 6: Breakdown of the TDP projects by province
TRANSMISSION ASSETS FOR FREE STATE PROVINCE
NEW ASSETS EXPECTED IN 2016-2020
NEW ASSETS EXPECTED IN 2021 - 2025
TOTAL NEW ASSETS
Power lines (km)
765 kV 0 0 0
400 kV 795 1260 2055
275 kV 0 94 94
Total length (km) 795 1354 2149
Transformers
Number of units 16 27 43
Total capacity (MVA) 4770 9500 14270
Capacitors
Number of banks 0 1 1
Total capacity (MVar) 0 36 36
Reactors
Number of banks 0 5 5
Total capacity (MVar) 0 300 300
Table 6.16: Cumulative TDP transmission assets for Northern Cape province

Transmission development plan 2016-2025 071
• At Upington substation due to IPP integration will experience equipment underrating. The Upington substation is designed from the onset with a split busbar to mitigate for the anticipated high fault levels with great IPP penetration at that substation.
6.7.5 Provincial summaryThe increase in transmission assets by the end of 2020 and the end of 2025 and cumulative total are shown in Table 6.16.
The following projects are planned for the 2016 to 2025 period:
SCHEME NAME PROJECT NAME EXPECTED YEAR
Garona StrengtheningKronos 400/132 kV transformation
2016Kronos-Cuprum 1st and 2nd 132 kV feeder bays
Upington Strengthening Phase 1A
Nieuwehoop-Upington 1st 400 kV line2018
Upington 1st 500 MVA 400/132 kV transformer
Upington 2nd 500 MVA 400/132 kV transformer 2021
Upington Strengthening Phase 1B
Aries-Upington 1st 400 kV line
2023Aries-Upington 2nd 400 kV line
Upington 3rd and 4th 500 MVA 400/132 kV transformers
Upington Strengthening Phase 1CFerrum-Upington 1st 400 kV line
2024Upington 5th 500 MVA 400/132 kV transformer
Kimberley Strengthening Phase 2
Ferrum Ext. 1st and 2nd 500 MVA 400/132 kV transformers
2015Ferrum-Mookodi 1st 400 kV line
Mookodi-Mercury 1st 400 kV line
Table 6.17: Northern Cape province – summary of projects and timelines
Chapter 6: Breakdown of the TDP projects by province
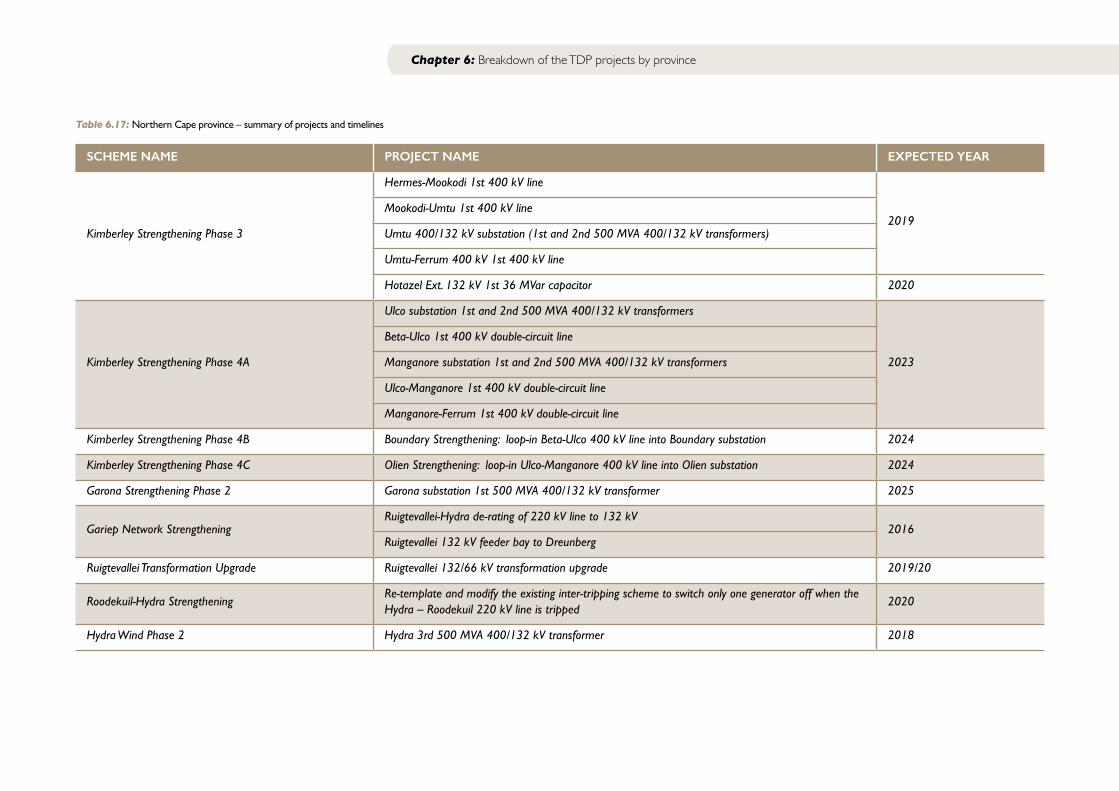
Chapter 6: Breakdown of the TDP projects by province
SCHEME NAME PROJECT NAME EXPECTED YEAR
Kimberley Strengthening Phase 3
Hermes-Mookodi 1st 400 kV line
2019Mookodi-Umtu 1st 400 kV line
Umtu 400/132 kV substation (1st and 2nd 500 MVA 400/132 kV transformers)
Umtu-Ferrum 400 kV 1st 400 kV line
Hotazel Ext. 132 kV 1st 36 MVar capacitor 2020
Kimberley Strengthening Phase 4A
Ulco substation 1st and 2nd 500 MVA 400/132 kV transformers
2023
Beta-Ulco 1st 400 kV double-circuit line
Manganore substation 1st and 2nd 500 MVA 400/132 kV transformers
Ulco-Manganore 1st 400 kV double-circuit line
Manganore-Ferrum 1st 400 kV double-circuit line
Kimberley Strengthening Phase 4B Boundary Strengthening: loop-in Beta-Ulco 400 kV line into Boundary substation 2024
Kimberley Strengthening Phase 4C Olien Strengthening: loop-in Ulco-Manganore 400 kV line into Olien substation 2024
Garona Strengthening Phase 2 Garona substation 1st 500 MVA 400/132 kV transformer 2025
Gariep Network StrengtheningRuigtevallei-Hydra de-rating of 220 kV line to 132 kV
2016Ruigtevallei 132 kV feeder bay to Dreunberg
Ruigtevallei Transformation Upgrade Ruigtevallei 132/66 kV transformation upgrade 2019/20
Roodekuil-Hydra StrengtheningRe-template and modify the existing inter-tripping scheme to switch only one generator off when the Hydra – Roodekuil 220 kV line is tripped
2020
Hydra Wind Phase 2 Hydra 3rd 500 MVA 400/132 kV transformer 2018
Table 6.17: Northern Cape province – summary of projects and timelines
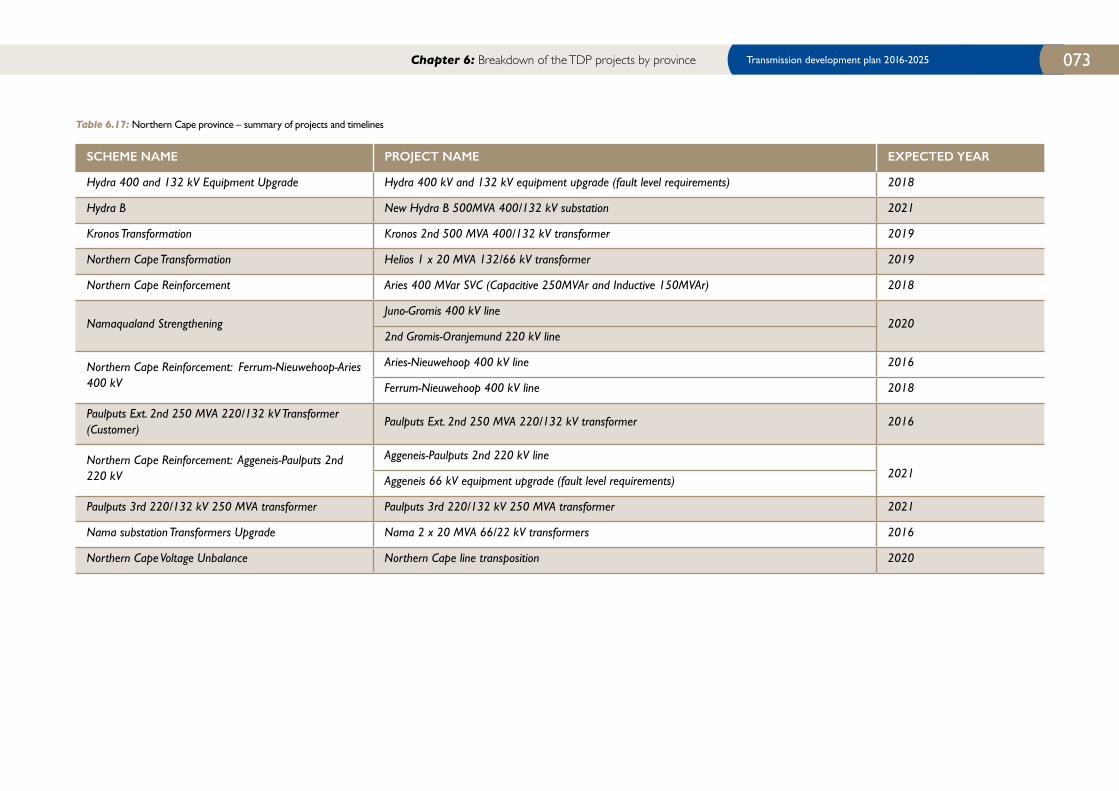
Transmission development plan 2016-2025 073
SCHEME NAME PROJECT NAME EXPECTED YEAR
Hydra 400 and 132 kV Equipment Upgrade Hydra 400 kV and 132 kV equipment upgrade (fault level requirements) 2018
Hydra B New Hydra B 500MVA 400/132 kV substation 2021
Kronos Transformation Kronos 2nd 500 MVA 400/132 kV transformer 2019
Northern Cape Transformation Helios 1 x 20 MVA 132/66 kV transformer 2019
Northern Cape Reinforcement Aries 400 MVar SVC (Capacitive 250MVAr and Inductive 150MVAr) 2018
Namaqualand StrengtheningJuno-Gromis 400 kV line
20202nd Gromis-Oranjemund 220 kV line
Northern Cape Reinforcement: Ferrum-Nieuwehoop-Aries 400 kV
Aries-Nieuwehoop 400 kV line 2016
Ferrum-Nieuwehoop 400 kV line 2018
Paulputs Ext. 2nd 250 MVA 220/132 kV Transformer (Customer)
Paulputs Ext. 2nd 250 MVA 220/132 kV transformer 2016
Northern Cape Reinforcement: Aggeneis-Paulputs 2nd 220 kV
Aggeneis-Paulputs 2nd 220 kV line
2021Aggeneis 66 kV equipment upgrade (fault level requirements)
Paulputs 3rd 220/132 kV 250 MVA transformer Paulputs 3rd 220/132 kV 250 MVA transformer 2021
Nama substation Transformers Upgrade Nama 2 x 20 MVA 66/22 kV transformers 2016
Northern Cape Voltage Unbalance Northern Cape line transposition 2020
Chapter 6: Breakdown of the TDP projects by province
Table 6.17: Northern Cape province – summary of projects and timelines

Chapter 6: Breakdown of the TDP projects by province
Figure 6.22: Future Northern Cape province network diagram
A network diagram of the major projects in the Northern Cape province is shown in Figure 6.24.
6.8 Eastern Cape provinceThe Eastern Cape province is home to two major motor manufacturing hubs in the Nelson Mandela Bay Metro in Port Elizabeth as well as Buffalo City Metro in East London. The provincial load peaked at 1 600 MW in 2014 and it is expected to surge to just above 2 500 MW in 10 years’ time. There is huge potential for development in the Nelson Mandela Bay Metro in terms of load in the Port of Ngqura or Coega, as it is popularly known; hence, most of the load growth in this province is as a result of anticipated loads at Coega.
Overall, the load in the Port Elizabeth area is anticipated to increase from 1 000 MW to just over 1 600 MW in the next 10 years. The bulk of the 600 MW increase will be for industrial development. The Port Elizabeth area is supplied by means of three 400 kV transmission lines and a single 220 kV line, which also supports the manganese traction line.
The East London area has a mixture of rural and urban loads. Most of the rural electrification is anticipated in this area. The anticipated load growth in the East London area is just over 100 MW, which will increase the total load to 900 MW. The recently completed 400 kV line from KwaZulu-Natal to the East London area, as well as the new Vuyani substation in the Mthatha area, can unlock even more electrification in the area. The capacity of Vuyani substation has the potential of unlocking the electrification of more than 125 000 homes. The number of in-feeds into East London consists of two 400 kV lines and a 220 kV line.

Transmission development plan 2016-2025 075
The Eastern Cape province has experienced a huge interest in terms of renewable energy applications from the REIPPPP. The total number of approved projects so far amounts to just over 1 400 MW or close to 90% of the current load. All of these approved projects will be catered for without major upgrades. The interest in connecting renewable projects in this province is expected to continue due to excellent wind resources in the subsequent rounds of the programme. This will trigger major upgrades in the network to cater for this. Currently, the Renewable Energy Strategic Plan envisages that two new substations will be required to cater for this.
There has also been an increase in applications to connect gas generation plants close to the Port of Ngqura, amounting to about 2 500 MW. This is approximately the equivalent of the total anticipated loads of the entire province in 2025. Further generation connections that may materialise in the Eastern Cape include nuclear generation of about 4 800 MW. All the major generation projects mentioned will be integrated by means of huge infrastructure upgrades that are specifically linked to them.
The major anticipated developments in the Eastern Cape are as follows:
• Gamma-Grassridge 765 kV injection in the Port Elizabeth area
• Neptune-Pembroke 400 kV line to improve reliability in the East London area
• Pembroke 400 kV injection to improve the quality of supply in the East London area
• Poseidon-Pembroke 400 kV line to improve reliability of supply as the load increases in the East London area
• Installation of 100 MVar capacitor banks in selected substations
• Thyspunt Integration Project, depending on whether the nuclear project is approved
• Gas Plant Integration Project, depending on whether customers decide to go ahead
• Strategic IPP projects to establish two new substations, depending on IPP appetite
Over and above these projects, there are other local projects to augment transformation at Delphi, Pembroke, Poseidon, Grassridge and Dedisa, starting from 2019. This is to ensure that the substations still meet the requisite reliability criteria, where a single transformer can be lost without affecting supply to customers. The current transmission network is shown in Figure 6.23.
Figure 6.23: Current Eastern Cape province network diagram
Chapter 6: Breakdown of the TDP projects by province

Chapter 6: Breakdown of the TDP projects by province
The load forecast for the Eastern Cape Province is shown in Figure 6.24. The major economic drivers in the Eastern Cape are the manufacturing sector, construction and, in recent times, the renewable IPPs in the form of wind farms. The
load forecast has dropped significantly and as a result, some of the projects have been deferred. The main reason for the decline in load forecast is the slow influx of huge projects in the Coega Industrial Development Zone.
6.8.1 Major schemesGreater East London Strengthening Phases 3 and 4
The re-phasing of the Greater East London Phase 3 scheme into the Greater East London Phase 3 and 4 schemes splits the Poseidon-Neptune 400 kV line project into two phases. The Greater East London Phase 3 scheme entails building a 50 km 400 kV line from Neptune to Pembroke and the introduction of 400 kV into Pembroke.
The 1st 400/132 kV 500 MVA transformer, as well as the 1st 132/66 kV 120 MVA transformer, will be introduced at Pembroke to run in parallel with the existing transformers. In the Greater East London Phase 4 scheme, the 400 kV link between Pembroke and Poseidon will be completed and the second set of transformers will be introduced at 400/132 kV and 132/66 kV voltages. At this stage, the 220 kV infrastructure and the old transformers will be decommissioned.
Southern Grid Strengthening Phase 3
The Gamma-Grassridge 1st 765 kV line is needed to address the growing load and associated voltage constraints in the Port Elizabeth (PE) CLN. Due to the huge amount of generation in the Eastern Cape, a second 765 kV line will be required if Thyspunt and further gas generation at Coega materialise.
PE Strengthening Phase 3
The PE Strengthening Phase 3 scheme entails the installation of 100 MVar shunt capacitor banks at Grassridge, Dedisa, Delphi and Poseidon. The shunt capacitor banks will ensure that voltage limits are not violated as the load increases in the Eastern Cape. An assessment conducted indicated that the PE Strengthening Phase 4 scheme, which would have entailed the installation of a second set of capacitor banks at the same substations, will no longer be required.
Figure 6.24: Eastern Cape province load forecast
2014 2015 2016 2017 2018 2019 2020 2021 2022 2023 2024 2025Port Elizabeth 952 1006 1064 1110 1153 1267 1357 1437 1481 1533 1566 1668East London 705 806 817 827 837 848 858 869 879 889 900 910TOSP 1574 1721 1787 1840 1891 2009 2104 2190 2242 2301 2342 2449
0
500
1000
1500
2000
2500
3000
Load
(MW
)
Eastern Cape Load Forecast

Transmission development plan 2016-2025 077
IPP Integration
There has been a huge interest from wind IPPs in the Eastern Cape, resulting in congestion around Poseidon and Grassridge substations. The long-term strategic plan will ensure that congestion is minimised by making use of collector stations to minimise direct connections at the transmission substations. The approved IPP projects in this province amount to just over 1 400 MW up to Round 4 of the REIPPPP. To accommodate future rounds of the REIPPPP, strategic studies are currently under way to investigate additional substations around Poseidon and Delphi.
Dedisa OCGT
A 373 MW OCGT power station will be commissioned at Dedisa substation in the current year. Construction of this plant has already been concluded and it is currently being tested before full commissioning.
Thyspunt Nuclear Integration
Eskom is conducting a feasibility study of new conventional nuclear generation in the Greater Cape region, with potential sites at Koeberg (Duynefontein), Thyspunt (near Jeffreys Bay) and Bantamsklip (near Pelly Beach). The first phase of this project is called “Nuclear 1”. The preferred location is Thyspunt and the TDP is based on this assumption. The following 400 kV lines of approximately 110 km each are required based on current assumptions:
• Thyspunt-Grassridge 400 kV line
• Thyspunt-Dedisa 400 kV lines 1 and 2
• Thyspunt-PE substation-Grassridge 400 kV line
• Thyspunt-PE substation-Dedisa 400 kV line
The PE substation is required to provide a second injection point from the transmission system into the Port Elizabeth area to the west of the city as well as to integrate Thyspunt.
REIPPPP ROUND TECHNOLOGY CAPACITY (MW)
1 Wind 470
REIPPPP 1 capacity 470
2 Wind 337
REIPPPP 2 capacity 337
3 Wind 197
REIPPPP 3 capacity 197
4 Wind 429
REIPPPP 4 capacity 429
Eastern Cape total generation capacity 1 432
Table 6.18: Approved projects in the Eastern Cape under the REIPPPP
6.8.2 Generation capacityHistorically, the Eastern Cape did not have huge generation capacity. The only sizeable generation in the province was Port Rex with a capacity of 3 x 57 MW which operates as peaking plant. The Gariep Hydropower Station is located on the border of the Northern Cape and Eastern Cape and most of the power is evacuated via the Northern Cape networks. The current power challenges mean that these generators operate as support for baseload plant, even outside the usual peak periods.
There is a possibility of a nuclear power station in the province with a total generation varying from 3 000 MW to about 4 500 MW and preliminary integration plans have already been done to accommodate this capacity.
Other generation plans in the pipeline include the possibility of approximately 2 500 MW of gas generation. If all these generation plans materialise, the Eastern Cape will be a net exporter of energy by a huge margin. A new high capacity interconnection with KwaZulu Natal will be required if all these generation projects materialise to evacuate the excess power, which may either be a 765 kV EHV link or more likely a 600 kV HVDC scheme between Port Elizabeth and the Durban area.
6.8.3 Renewable generationThere has been a proliferation of renewable energy IPPs in the Eastern Cape and most of them have been wind IPPs. The total capacity that has been approved in the Eastern Cape so far amounts to 1 432 MW, comprised of 150 MW in the East London CLN and 1 282 MW in the Port Elizabeth CLN. The composition is shown in Table 6.18.
Chapter 6: Breakdown of the TDP projects by province
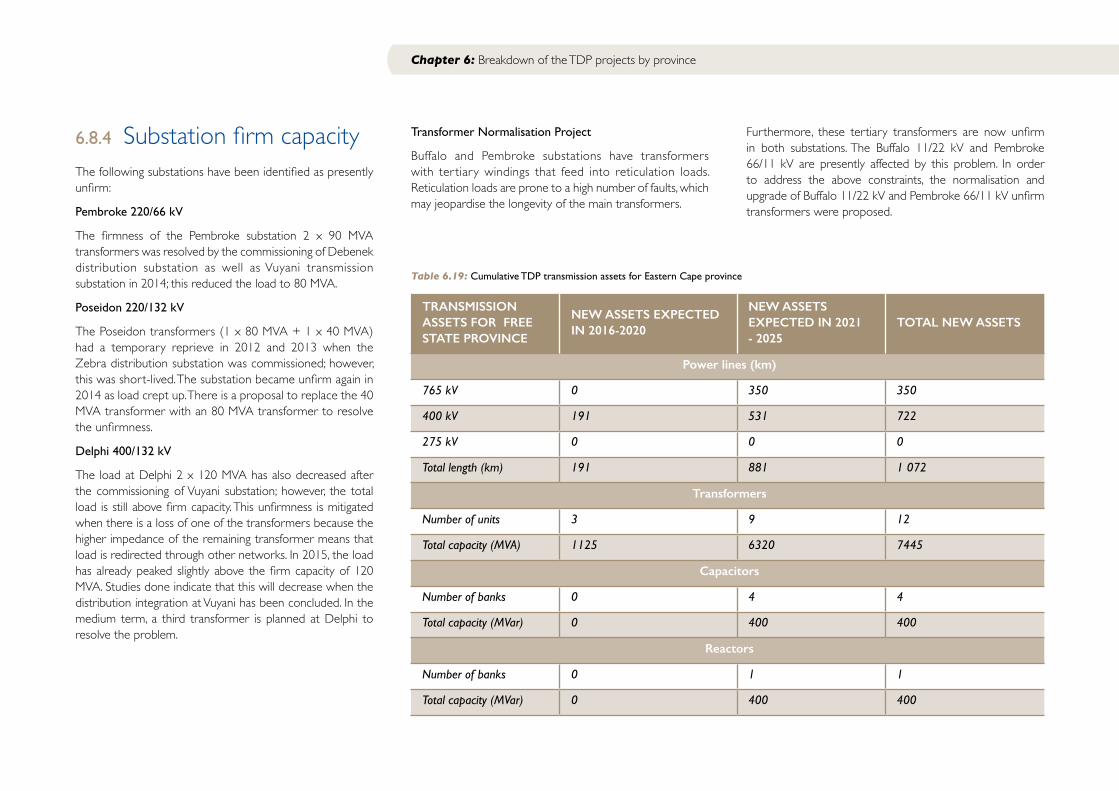
Chapter 6: Breakdown of the TDP projects by province
6.8.4 Substation firm capacityThe following substations have been identified as presently unfirm:
Pembroke 220/66 kV
The firmness of the Pembroke substation 2 x 90 MVA transformers was resolved by the commissioning of Debenek distribution substation as well as Vuyani transmission substation in 2014; this reduced the load to 80 MVA.
Poseidon 220/132 kV
The Poseidon transformers (1 x 80 MVA + 1 x 40 MVA) had a temporary reprieve in 2012 and 2013 when the Zebra distribution substation was commissioned; however, this was short-lived. The substation became unfirm again in 2014 as load crept up. There is a proposal to replace the 40 MVA transformer with an 80 MVA transformer to resolve the unfirmness.
Delphi 400/132 kV
The load at Delphi 2 x 120 MVA has also decreased after the commissioning of Vuyani substation; however, the total load is still above firm capacity. This unfirmness is mitigated when there is a loss of one of the transformers because the higher impedance of the remaining transformer means that load is redirected through other networks. In 2015, the load has already peaked slightly above the firm capacity of 120 MVA. Studies done indicate that this will decrease when the distribution integration at Vuyani has been concluded. In the medium term, a third transformer is planned at Delphi to resolve the problem.
Transformer Normalisation Project
Buffalo and Pembroke substations have transformers with ter tiary windings that feed into reticulation loads. Reticulation loads are prone to a high number of faults, which may jeopardise the longevity of the main transformers.
Furthermore, these tertiary transformers are now unfirm in both substations. The Buffalo 11/22 kV and Pembroke 66/11 kV are presently affected by this problem. In order to address the above constraints, the normalisation and upgrade of Buffalo 11/22 kV and Pembroke 66/11 kV unfirm transformers were proposed.
TRANSMISSION ASSETS FOR FREE STATE PROVINCE
NEW ASSETS EXPECTED IN 2016-2020
NEW ASSETS EXPECTED IN 2021 - 2025
TOTAL NEW ASSETS
Power lines (km)
765 kV 0 350 350
400 kV 191 531 722
275 kV 0 0 0
Total length (km) 191 881 1 072
Transformers
Number of units 3 9 12
Total capacity (MVA) 1125 6320 7445
Capacitors
Number of banks 0 4 4
Total capacity (MVar) 0 400 400
Reactors
Number of banks 0 1 1
Total capacity (MVar) 0 400 400
Table 6.19: Cumulative TDP transmission assets for Eastern Cape province
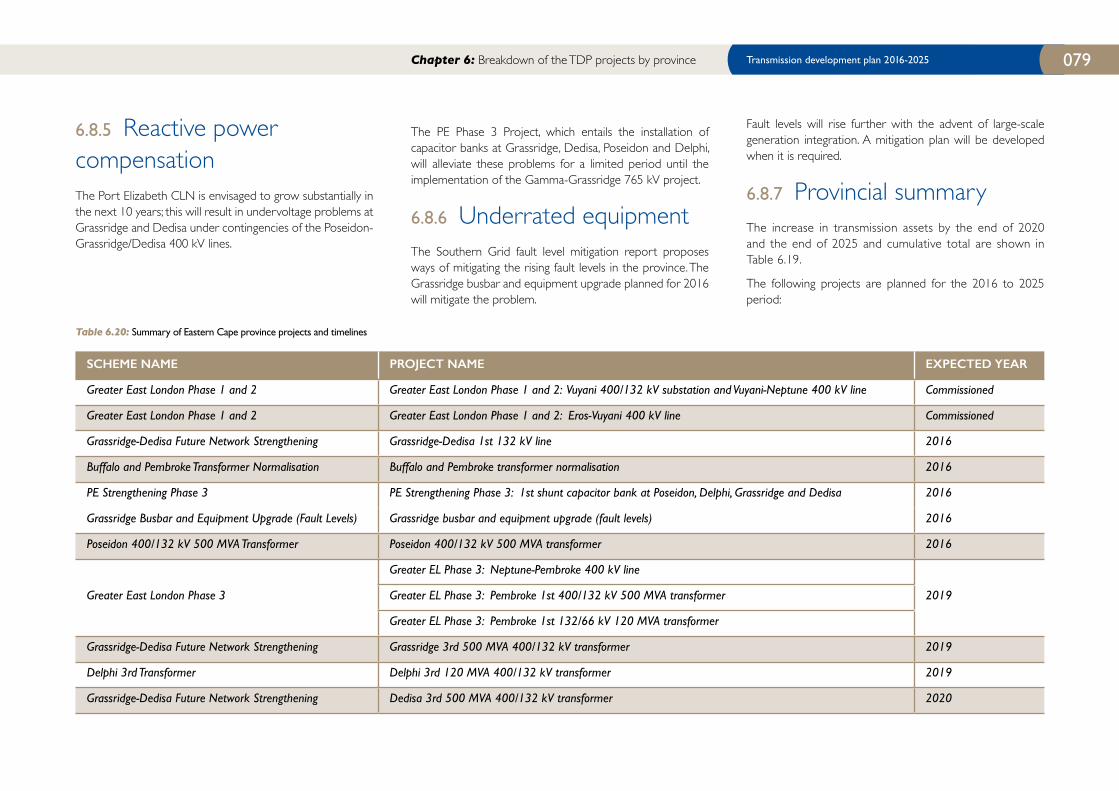
Transmission development plan 2016-2025 079
6.8.5 Reactive power compensationThe Port Elizabeth CLN is envisaged to grow substantially in the next 10 years; this will result in undervoltage problems at Grassridge and Dedisa under contingencies of the Poseidon-Grassridge/Dedisa 400 kV lines.
SCHEME NAME PROJECT NAME EXPECTED YEAR
Greater East London Phase 1 and 2 Greater East London Phase 1 and 2: Vuyani 400/132 kV substation and Vuyani-Neptune 400 kV line Commissioned
Greater East London Phase 1 and 2 Greater East London Phase 1 and 2: Eros-Vuyani 400 kV line Commissioned
Grassridge-Dedisa Future Network Strengthening Grassridge-Dedisa 1st 132 kV line 2016
Buffalo and Pembroke Transformer Normalisation Buffalo and Pembroke transformer normalisation 2016
PE Strengthening Phase 3 PE Strengthening Phase 3: 1st shunt capacitor bank at Poseidon, Delphi, Grassridge and Dedisa 2016
Grassridge Busbar and Equipment Upgrade (Fault Levels) Grassridge busbar and equipment upgrade (fault levels) 2016
Poseidon 400/132 kV 500 MVA Transformer Poseidon 400/132 kV 500 MVA transformer 2016
Greater East London Phase 3
Greater EL Phase 3: Neptune-Pembroke 400 kV line
2019Greater EL Phase 3: Pembroke 1st 400/132 kV 500 MVA transformer
Greater EL Phase 3: Pembroke 1st 132/66 kV 120 MVA transformer
Grassridge-Dedisa Future Network Strengthening Grassridge 3rd 500 MVA 400/132 kV transformer 2019
Delphi 3rd Transformer Delphi 3rd 120 MVA 400/132 kV transformer 2019
Grassridge-Dedisa Future Network Strengthening Dedisa 3rd 500 MVA 400/132 kV transformer 2020
Table 6.20: Summary of Eastern Cape province projects and timelines
The PE Phase 3 Project, which entails the installation of capacitor banks at Grassridge, Dedisa, Poseidon and Delphi, will alleviate these problems for a limited period until the implementation of the Gamma-Grassridge 765 kV project.
6.8.6 Underrated equipmentThe Southern Grid fault level mitigation report proposes ways of mitigating the rising fault levels in the province. The Grassridge busbar and equipment upgrade planned for 2016 will mitigate the problem.
Fault levels will rise further with the advent of large-scale generation integration. A mitigation plan will be developed when it is required.
6.8.7 Provincial summaryThe increase in transmission assets by the end of 2020 and the end of 2025 and cumulative total are shown in Table 6.19.
The following projects are planned for the 2016 to 2025 period:
Chapter 6: Breakdown of the TDP projects by province

SCHEME NAME PROJECT NAME EXPECTED YEAR
Greater East London Phase 4
Greater EL Phase 4: Poseidon-Pembroke 400 kV line
2023Greater EL Phase 4: Pembroke 2nd 400/132 kV 500 MVA transformer
Greater EL Phase 4: Pembroke 2nd 132/66 kV 120 MVA transformer
Southern Grid Phase 3 Southern Grid Phase 3: 1st Gamma-Grassridge 765 kV line 2024
Nuclear 1 IntegrationNuclear 1 Integration: Thyspunt
2024Port Elizabeth SS Integration
Southern Grid Phase 4 Southern Grid Phase 4: 2nd Gamma-Grassridge 765 kV line 2027
PE Strengthening Phase 4 PE Strengthening Phase 4: 2nd shunt capacitor bank at Poseidon, Delphi, Grassridge and Dedisa Cancelled
Table 6.20: Summary of Eastern Cape province projects and timelines
Chapter 6: Breakdown of the TDP projects by province

Transmission development plan 2016-2025 081Chapter 6: Breakdown of the TDP projects by province
6.9 Western Cape provinceThe Western Cape GDP makes the third-highest contribution to the country’s total at around 15% and the province has one of the fastest-growing economies in the country. Industries in the Western Cape are comprised of financial and business services, manufacturing, tourism, agriculture and fishing. The province’s economy is dominated by the City of Cape Town where the vast majority of all non-agricultural economic activity takes place.
The province has shown a huge potential for renewable energy due to its climate and proximity to the coastline. To date, 330 MW of renewable energy plants have been integrated into the Western Cape, one of which is Sere Wind Farm, a 100 MW Eskom wind generating facility, which was completed in January 2015. There has also been considerable interest in gas and oil imports as well as gas generation.
The Western Cape transmission network stretches over a distance of about 550 km from Gamma substation (near Victoria West) to Philippi substation (near Cape Town). Koeberg Power Station is the only baseload power station situated locally. There are also four peaking plants in the Western Cape, consisting of pumped-storage and gas turbine generation, which help to meet the demand.
The deficit between Koeberg generation and the Greater Cape load is offset by the generation pool in the Highveld via the Cape Corridor. The first 765 kV line is planned for completion in 2016 and will increase the Cape Corridor’s capability by approximately 1 500 MW.
Local strengthening is also planned across the province, mainly comprised of 400/132 kV substations. Additional 400 kV line infrastructure is also required, primarily to integrate these substations and to assist with power evacuation from the existing power stations.
Figure 6.25: Eastern Cape province network diagram
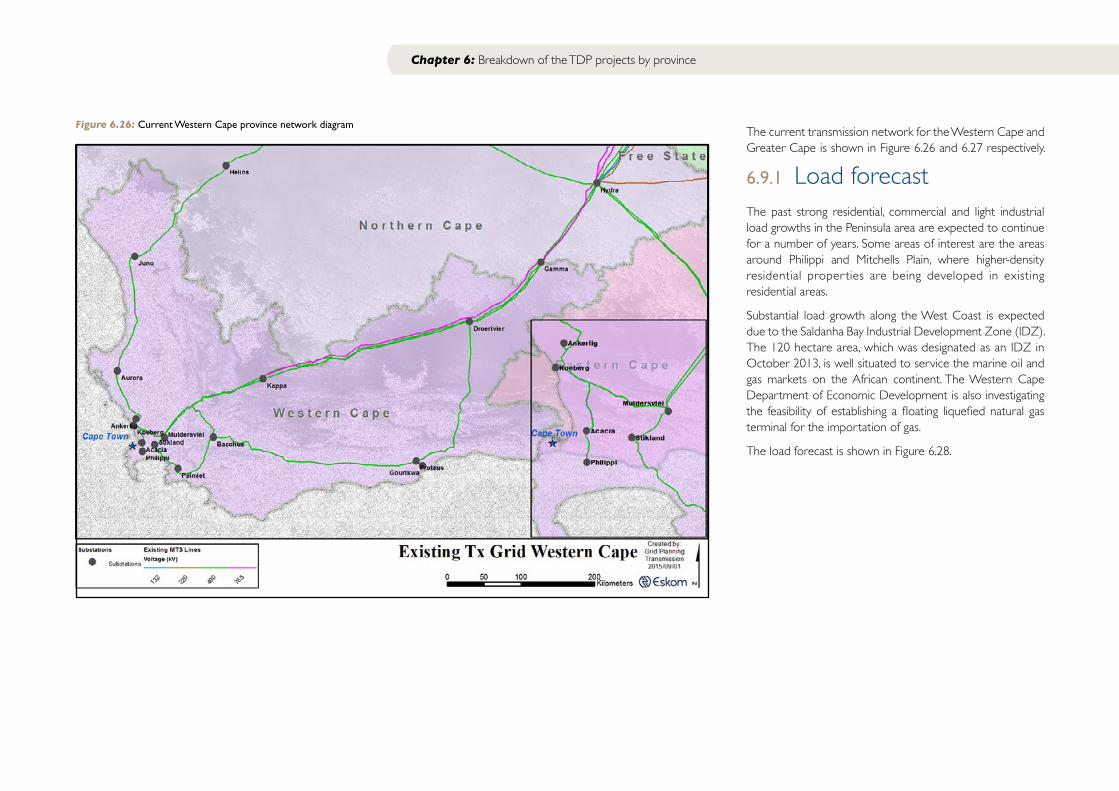
Chapter 6: Breakdown of the TDP projects by province
The current transmission network for the Western Cape and Greater Cape is shown in Figure 6.26 and 6.27 respectively.
6.9.1 Load forecastThe past strong residential, commercial and light industrial load growths in the Peninsula area are expected to continue for a number of years. Some areas of interest are the areas around Philippi and Mitchells Plain, where higher-density residential proper ties are being developed in existing residential areas.
Substantial load growth along the West Coast is expected due to the Saldanha Bay Industrial Development Zone (IDZ). The 120 hectare area, which was designated as an IDZ in October 2013, is well situated to service the marine oil and gas markets on the African continent. The Western Cape Department of Economic Development is also investigating the feasibility of establishing a floating liquefied natural gas terminal for the importation of gas.
The load forecast is shown in Figure 6.28.
Figure 6.26: Current Western Cape province network diagram
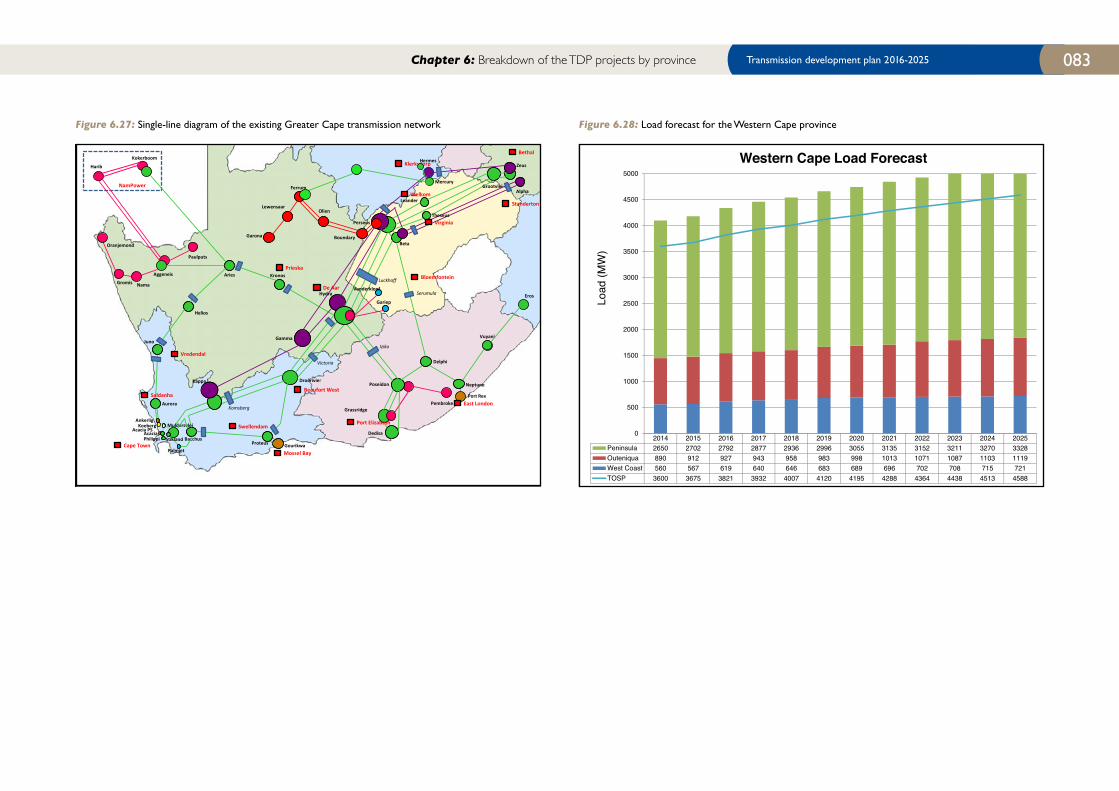
Transmission development plan 2016-2025 083
Figure 6.27: Single-line diagram of the existing Greater Cape transmission network Figure 6.28: Load forecast for the Western Cape province
2014 2015 2016 2017 2018 2019 2020 2021 2022 2023 2024 2025Peninsula 2650 2702 2792 2877 2936 2996 3055 3135 3152 3211 3270 3328Outeniqua 890 912 927 943 958 983 998 1013 1071 1087 1103 1119West Coast 560 567 619 640 646 683 689 696 702 708 715 721TOSP 3600 3675 3821 3932 4007 4120 4195 4288 4364 4438 4513 4588
0
500
1000
1500
2000
2500
3000
3500
4000
4500
5000
Load
(MW
)
Western Cape Load Forecast
Chapter 6: Breakdown of the TDP projects by province
Kokerboom
Harib
NamPower
Zeus
Bethal
Alpha
Standerton
Mercury
Klerksdorp
Leander Welkom
Theseus Virginia Perseus
Kronos Prieska
Hydra De Aar
Grootvlei
Beta
Luckhoff
Serumula
Bloemfontein
Vanderkloof
Gariep
Delphi
Vuyani
Neptune
Pembroke
Poseidon
Dedisa
Grassridge
Port Elizabeth
Port Rex East London
Gamma
Victoria
Iziko
Droërivier
Beaufort West
Komsberg
Bacchus
Swellendam
Proteus Gourikwa Mossel Bay
Muldersvlei
Aries Aggeneis
Helios
Juno
Vredendal
Aurora
Saldanha
Acacia Koeberg
Ankerlig
Acacia PS
Philippi Stikland
Palmiet Cape Town
765 kV
400 kV
220 kV
A. Hansa & P. Ijumba © Eskom 2015
Kappa
Boundary
Olien
Ferrum
Lewensaar
Garona
275 kV
Paulputs
Nama Gromis
Oranjemond
Eros
Stikland
Muldersvlei
Acacia
Koeberg
Palmiet
Ankerlig
Philippi
Acacia PS
Bacchus
Hermes
Chapter 6: Breakdown of the TDP projects by province
Major schemes
The immediate problems in the corridor between Beta, Perseus and Hydra substations have been addressed to a large extent by the strengthening north of De Aar. The Beta-Delphi 400 kV line has also brought additional relief to said corridor. In addition, the OCGT power stations in the Western Cape provide assistance to this corridor during the peak. However, the planned duty cycle for the OCGTs and associated fuel costs of running these generators may not be able to cater for the energy growth.
The Cape Corridor has therefore been strengthened in this regard with the following 765 kV lines that have been commissioned and energised over the last three years:
• Zeus-Mercury and Mercury-Perseus in December 2012
• Hydra-Perseus in July 2013
• Perseus-Gamma and Hydra-Gamma in February 2014
• Gamma-Kappa in April 2015
The Kappa-Sterrekus 765 kV line and its associated 765/400 kV substation are planned for commissioning in 2016. This will provide a sizeable (~ 1 500 MW) improvement in overall power transfer capacity.
Additional strengthening of the Cape Corridor will be provided by the Aries-Nieuwehoop-Ferrum 400 kV line. This will result in network adequacy until 2023, after which the preferred strengthening option will be a second Zeus-Sterrekus 765 kV line.
6.9.2 Generation capacityKoeberg Power Station
Koeberg Power Station is situated at Duynefontein, 27 km north of Cape Town on the Atlantic coast. Koeberg ensures a
reliable supply of electricity to the Western Cape, one of the fastest-growing regions in South Africa. It has operated safely and efficiently for 29 years and has a further active life of about 21 years. Koeberg Power Station has a generating capacity of 1 860 MW. The two units are rated at 930 MW each.
Acacia Power Station
Acacia Power Station forms part of the peaking group of power stations and consists of 3 x 57 MW gas turbine engines, at an installed capacity of 171 MW. Acacia also operates predominantly in synchronous condenser operation (SCO) to regulate the voltage. In addition, it provides an off-site electrical supply to Koeberg Nuclear Power Station as per the National Nuclear Regulator licensing requirement.
Ankerlig and Gourikwa Power Stations
The open-cycle gas turbines (OCGTs) were built to meet the rapidly increasing demand for peaking power on the Eskom grid. The gas turbine engines are similar to those used in the aviation industry and use liquid fuel (diesel). In addition to its generating capabilities, some of the units at these two power stations are also used to regulate network voltages when running in SCO.
Ankerlig Power Station is located at Atlantis in the Western Cape and has an installed capacity of 1 350 MW (9 x 150 MW).
Gourikwa Power Station is located at Mossel Bay and has an installed capacity of 750 MW (5 x 150 MW).
Palmiet Pumped-storage Scheme
Palmiet Pumped-storage Scheme is a joint venture between Eskom and the Department of Water Affairs and Forestry. It is situated in the ecologically sensitive Kogelberg Nature Reserve in the Western Cape near Grabouw.
The power station delivers 400 MW (2 x 200 MW) of
peak power into the Eskom national grid and carries out a frequency and voltage regulating role. It is also part of an intercatchment water transfer project supplying water to Cape Town.
For generating purposes, water flows from an upper reservoir to the machines located in an underground power station. The water is collected in a lower reservoir and pumped back to the upper reservoir during off-peak periods.
6.9.3 Renewable generationKlipheuwel Wind Energy Demonstration Facility
Klipheuwel Wind Energy Demonstration Facility is an Eskom wind generating facility that was completed in February 2003 and has a capacity of 3.16 MW (three wind turbines of 660 kW, 1.75 MW and 750 kW). It is located around 50 km north of Cape Town in Durbanville.
Darling Wind Power
Darling Wind Power generating facility is a Department of Energy demonstrator site that was completed in 2008 and has a capacity of 5.2 MW. It is located 70 km north of Cape Town, between Darling and Yzerfontein on the West Coast of South Africa.
Sere Wind Farm
Sere Wind Farm is an Eskom wind generating facility that was completed in January 2015 and has a capacity of 100 MW. It is located north-west of Vredendal at Skaapvlei, approximately 300 km north of Cape Town.
Several projects have also been approved in the Western Cape under the DoE’s Renewable Energy IPP Procurement Programme (REIPPPP), as per Table 6.21. The integration of these projects will lead to additional transmission infrastructure.

Transmission development plan 2016-2025 085
REIPPPP ROUND
TECHNOLOGYCAPACITY (MW)
1Wind 91
PV 41
REIPPPP 1 capacity 132
2Wind 225
PV 18
REIPPPP 2 capacity 243
3 PV 75
REIPPPP 3 capacity 75
4 Wind 558
REIPPPP 4 capacity 558
Western Cape total RE generation capacity
1 008
Table 6.21: Approved projects in the Western Cape under the REIPPPP 6.9.4 Substation firm capacityThe following strengthening plans are in place to address the capacity or refurbishment requirements at the substations:
• Acacia 66/11 kV – with the establishment of the CoCT’s Richmond Estate 132/11 kV substation, all of the 11 kV load will be transferred off Acacia substation.
• Muldersvlei 400/132 kV – Pinotage substation will be established, which will deload Muldersvlei substation. At Muldersvlei substation, as part of the substation refurbishment project, the 2 x 240 MVA 400/132 kV transformers will be replaced with a single 500 MVA 400/132 kV transformer. Fault-current-limiting reactors (FCLRs) will be installed in series with the 3 x 500 MVA 400/132 kV transformers on the 132 kV side of the transformers.
• Stikland 400/132 kV – the unfirm problem at Stikland substation will be resolved by establishing Pinotage substation, which will deload both Stikland and Muldersvlei substations. Erica substation will be established, which will further deload Stikland substation.
• Philippi 400/132 kV – Erica substation will be established in order to address the loading at Philippi substation. A third 500 MVA 400/132 kV transformer is also planned for Philippi substation, the commissioning to be determined after the establishment of Erica substation.
• Juno 400/132 kV – the 2 x 120 MVA transformers will be replaced with 2 x 500 MVA units. This capacity is mainly required for integration of renewable generation in the area.
• Juno 132/66 kV and 66/22 kV – the remaining transformation capacity at Juno substation will be upgraded by:
• replacing the 2 x 40 MVA 132/66 kV units with 2 x 80 MVA units; and
• installing an additional 20 MVA 66/22 kV unit with the existing 10 MVA unit.
• Bacchus 400/132 kV – the unfirm problem at Bacchus substation will be resolved by establishing Agulhas and Asteria substations.
• Droërivier 400/132 kV – the 120 MVA transformer was replaced with a 250 MVA transformer in April 2015.
• Proteus 400/132 kV – Proteus substation will be deloaded by establishing Narina substation.
6.9.5 Reactive power compensationAdditional capacitor banks will be installed at Aurora 132 kV, Bacchus 132 kV and Proteus 132 kV. The Muldersvlei 132 kV 72 MVar capacitor bank, which formed part of this project, was commissioned in 2015.
As spares are no longer available for the power supply of the control system of the Muldersvlei SVC, it will be decommissioned once the 765 kV network has been completely commissioned and is completely in service. This is anticipated to occur in 2016.
Chapter 6: Breakdown of the TDP projects by province

Chapter 6: Breakdown of the TDP projects by province
6.9.6 Underrated equipmentThe underrated equipment at the substations below will be addressed as follows:
• At Muldersvlei substation, as par t of the substation refurbishment project, the 2 x 240 MVA 400/132 kV transformers will be replaced with a single 500 MVA 400/132 kV transformer. Fault-limiting reactors will be installed in series with the 3 x 500 MVA 400/132 kV transformers on the 132 kV side of the transformers. The 400 kV and 132 kV circuit-breakers at Muldersvlei will also be upgraded as part of a future project.
• At Stikland substation, the 132 kV equipment is being upgraded to 40 kA as part of a distribution refurbishment and upgrade project.
• Refurbishment is planned for Aurora substation, the scope of which will include upgrading the underrated equipment.
• Refurbishment is planned for Acacia substation, the scope of which will include upgrading the 400 kV circuit-breakers to 50 kA.
• A potential fault level exceedance has emerged at Droërivier substation and will be investigated further.
6.9.7 Provincial summaryThe increase in transmission assets by the end of 2020 and the end of 2025 and cumulative total are shown in Table 6.22.
TRANSMISSION ASSETS FOR WC PROVINCE
NEW ASSETS EXPECTED IN 2016-2020
NEW ASSETS EXPECTED IN 2021 - 2025
TOTAL NEW ASSETS
Power lines (km)
765 kV 150 1000 1150
400 kV 92 294 386
275 kV 0 0 0
Total length (km) 242 1294 1536
Transformers
Number of units 10 13 23
Total capacity (MVA) 6500 6000 12500
Capacitors
Number of banks 0 0 0
Total capacity (MVar) 0 0 0
Reactors
Number of banks 4 4 8
Total capacity (MVar) 467.5 1600 2067.5
Table 6.22: Cumulative TDP transmission assets for Western Cape province
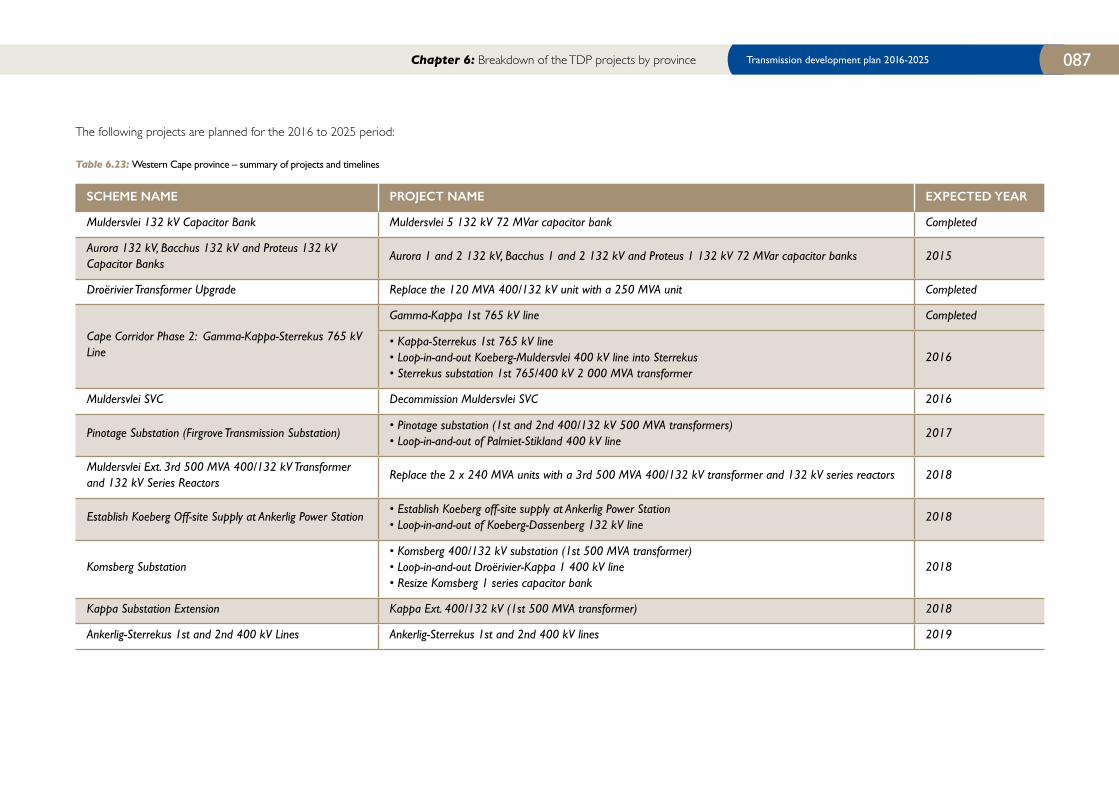
Transmission development plan 2016-2025 087
SCHEME NAME PROJECT NAME EXPECTED YEAR
Muldersvlei 132 kV Capacitor Bank Muldersvlei 5 132 kV 72 MVar capacitor bank Completed
Aurora 132 kV, Bacchus 132 kV and Proteus 132 kV Capacitor Banks
Aurora 1 and 2 132 kV, Bacchus 1 and 2 132 kV and Proteus 1 132 kV 72 MVar capacitor banks 2015
Droërivier Transformer Upgrade Replace the 120 MVA 400/132 kV unit with a 250 MVA unit Completed
Cape Corridor Phase 2: Gamma-Kappa-Sterrekus 765 kV Line
Gamma-Kappa 1st 765 kV line Completed
• Kappa-Sterrekus 1st 765 kV line• Loop-in-and-out Koeberg-Muldersvlei 400 kV line into Sterrekus• Sterrekus substation 1st 765/400 kV 2 000 MVA transformer
2016
Muldersvlei SVC Decommission Muldersvlei SVC 2016
Pinotage Substation (Firgrove Transmission Substation)• Pinotage substation (1st and 2nd 400/132 kV 500 MVA transformers)• Loop-in-and-out of Palmiet-Stikland 400 kV line
2017
Muldersvlei Ext. 3rd 500 MVA 400/132 kV Transformer and 132 kV Series Reactors
Replace the 2 x 240 MVA units with a 3rd 500 MVA 400/132 kV transformer and 132 kV series reactors 2018
Establish Koeberg Off-site Supply at Ankerlig Power Station• Establish Koeberg off-site supply at Ankerlig Power Station• Loop-in-and-out of Koeberg-Dassenberg 132 kV line
2018
Komsberg Substation • Komsberg 400/132 kV substation (1st 500 MVA transformer)• Loop-in-and-out Droërivier-Kappa 1 400 kV line• Resize Komsberg 1 series capacitor bank
2018
Kappa Substation Extension Kappa Ext. 400/132 kV (1st 500 MVA transformer) 2018
Ankerlig-Sterrekus 1st and 2nd 400 kV Lines Ankerlig-Sterrekus 1st and 2nd 400 kV lines 2019
Table 6.23: Western Cape province – summary of projects and timelines
The following projects are planned for the 2016 to 2025 period:
Chapter 6: Breakdown of the TDP projects by province
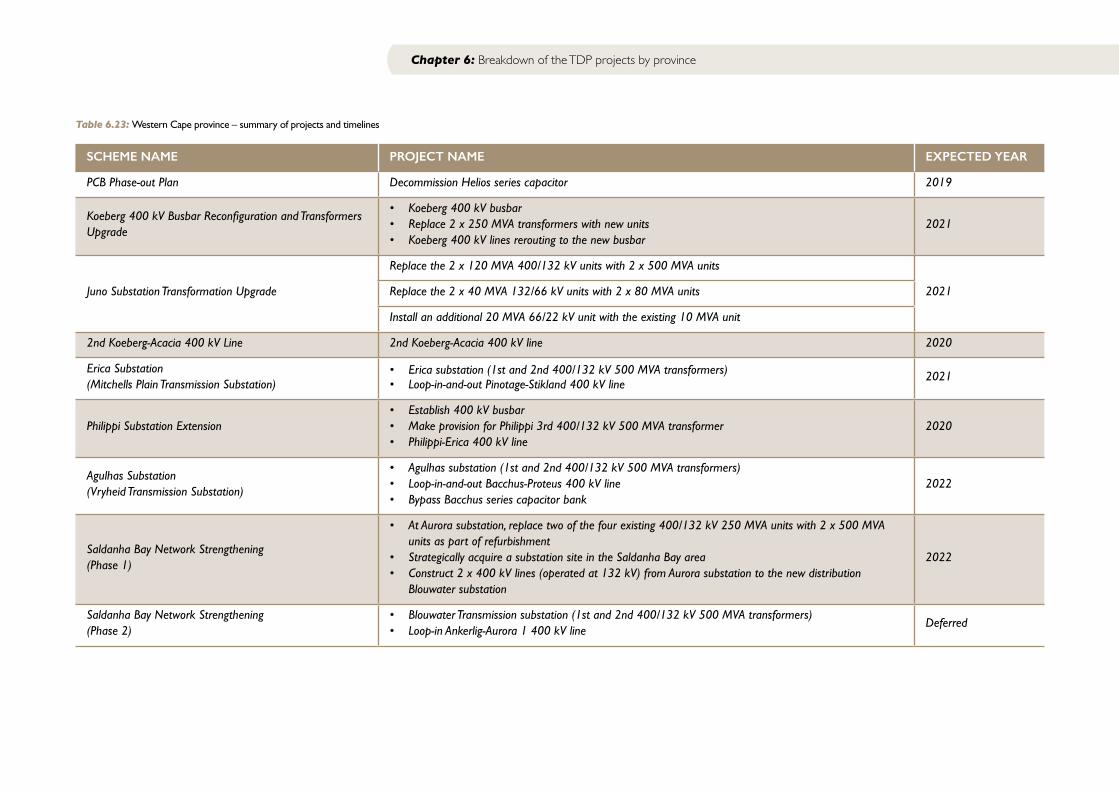
Chapter 6: Breakdown of the TDP projects by province
SCHEME NAME PROJECT NAME EXPECTED YEAR
PCB Phase-out Plan Decommission Helios series capacitor 2019
Koeberg 400 kV Busbar Reconfiguration and Transformers Upgrade
• Koeberg 400 kV busbar • Replace 2 x 250 MVA transformers with new units• Koeberg 400 kV lines rerouting to the new busbar
2021
Juno Substation Transformation Upgrade
Replace the 2 x 120 MVA 400/132 kV units with 2 x 500 MVA units
2021Replace the 2 x 40 MVA 132/66 kV units with 2 x 80 MVA units
Install an additional 20 MVA 66/22 kV unit with the existing 10 MVA unit
2nd Koeberg-Acacia 400 kV Line 2nd Koeberg-Acacia 400 kV line 2020
Erica Substation(Mitchells Plain Transmission Substation)
• Erica substation (1st and 2nd 400/132 kV 500 MVA transformers)• Loop-in-and-out Pinotage-Stikland 400 kV line
2021
Philippi Substation Extension• Establish 400 kV busbar• Make provision for Philippi 3rd 400/132 kV 500 MVA transformer• Philippi-Erica 400 kV line
2020
Agulhas Substation (Vryheid Transmission Substation)
• Agulhas substation (1st and 2nd 400/132 kV 500 MVA transformers)• Loop-in-and-out Bacchus-Proteus 400 kV line• Bypass Bacchus series capacitor bank
2022
Saldanha Bay Network Strengthening(Phase 1)
• At Aurora substation, replace two of the four existing 400/132 kV 250 MVA units with 2 x 500 MVA units as part of refurbishment
• Strategically acquire a substation site in the Saldanha Bay area• Construct 2 x 400 kV lines (operated at 132 kV) from Aurora substation to the new distribution
Blouwater substation
2022
Saldanha Bay Network Strengthening(Phase 2)
• Blouwater Transmission substation (1st and 2nd 400/132 kV 500 MVA transformers)• Loop-in Ankerlig-Aurora 1 400 kV line
Deferred
Table 6.23: Western Cape province – summary of projects and timelines
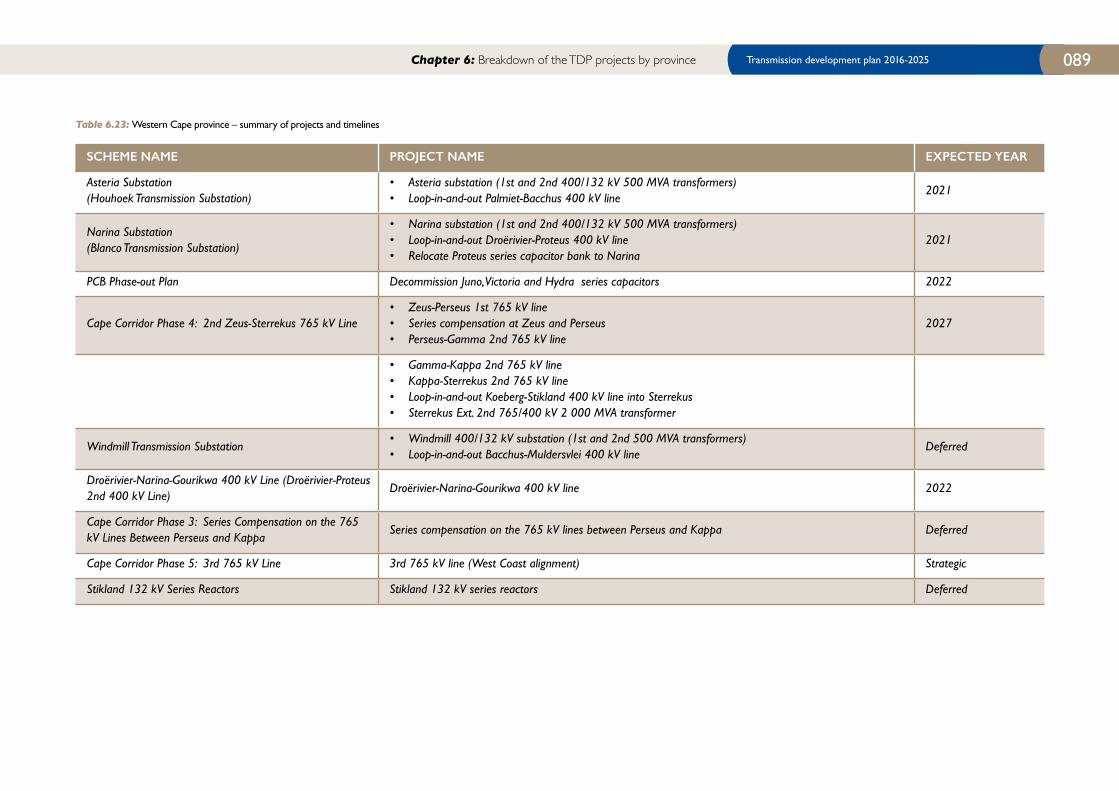
Transmission development plan 2016-2025 089
SCHEME NAME PROJECT NAME EXPECTED YEAR
Asteria Substation(Houhoek Transmission Substation)
• Asteria substation (1st and 2nd 400/132 kV 500 MVA transformers)• Loop-in-and-out Palmiet-Bacchus 400 kV line
2021
Narina Substation (Blanco Transmission Substation)
• Narina substation (1st and 2nd 400/132 kV 500 MVA transformers)• Loop-in-and-out Droërivier-Proteus 400 kV line• Relocate Proteus series capacitor bank to Narina
2021
PCB Phase-out Plan Decommission Juno, Victoria and Hydra series capacitors 2022
Cape Corridor Phase 4: 2nd Zeus-Sterrekus 765 kV Line• Zeus-Perseus 1st 765 kV line• Series compensation at Zeus and Perseus• Perseus-Gamma 2nd 765 kV line
2027
• Gamma-Kappa 2nd 765 kV line• Kappa-Sterrekus 2nd 765 kV line• Loop-in-and-out Koeberg-Stikland 400 kV line into Sterrekus• Sterrekus Ext. 2nd 765/400 kV 2 000 MVA transformer
Windmill Transmission Substation• Windmill 400/132 kV substation (1st and 2nd 500 MVA transformers)• Loop-in-and-out Bacchus-Muldersvlei 400 kV line
Deferred
Droërivier-Narina-Gourikwa 400 kV Line (Droërivier-Proteus 2nd 400 kV Line)
Droërivier-Narina-Gourikwa 400 kV line 2022
Cape Corridor Phase 3: Series Compensation on the 765 kV Lines Between Perseus and Kappa
Series compensation on the 765 kV lines between Perseus and Kappa Deferred
Cape Corridor Phase 5: 3rd 765 kV Line 3rd 765 kV line (West Coast alignment) Strategic
Stikland 132 kV Series Reactors Stikland 132 kV series reactors Deferred
Chapter 6: Breakdown of the TDP projects by province
Table 6.23: Western Cape province – summary of projects and timelines
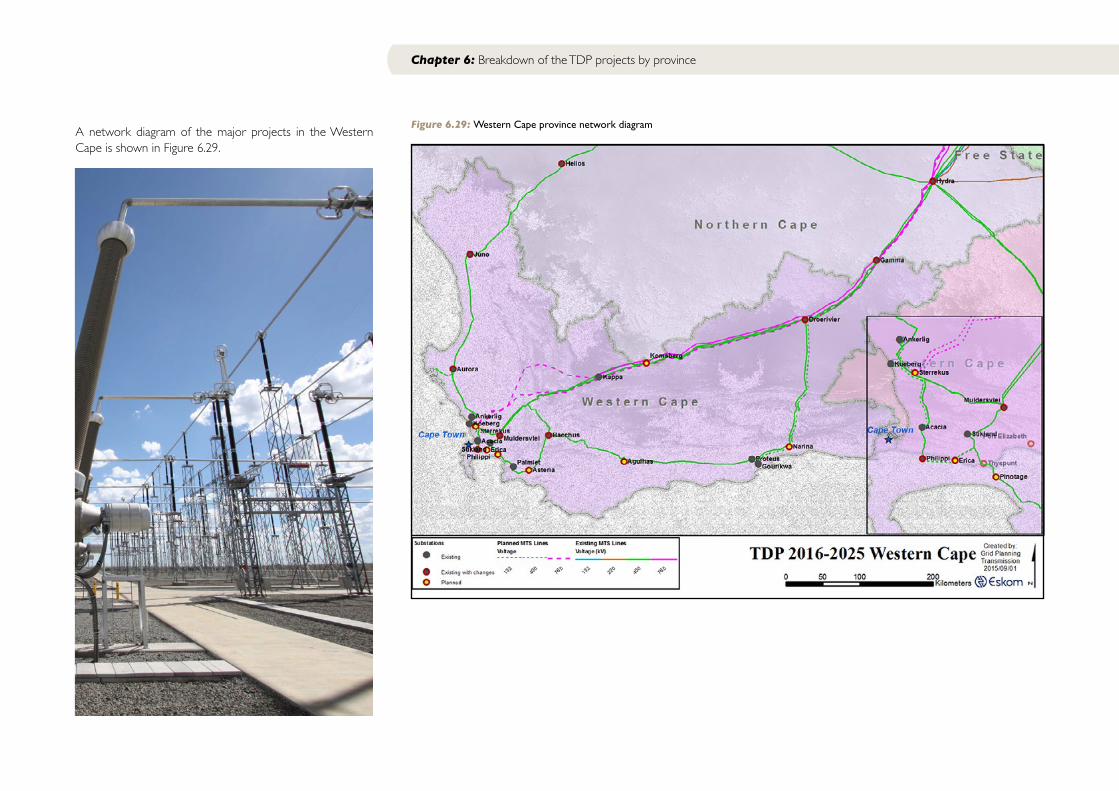
A network diagram of the major projects in the Western Cape is shown in Figure 6.29.
Figure 6.29: Western Cape province network diagram
Chapter 6: Breakdown of the TDP projects by province
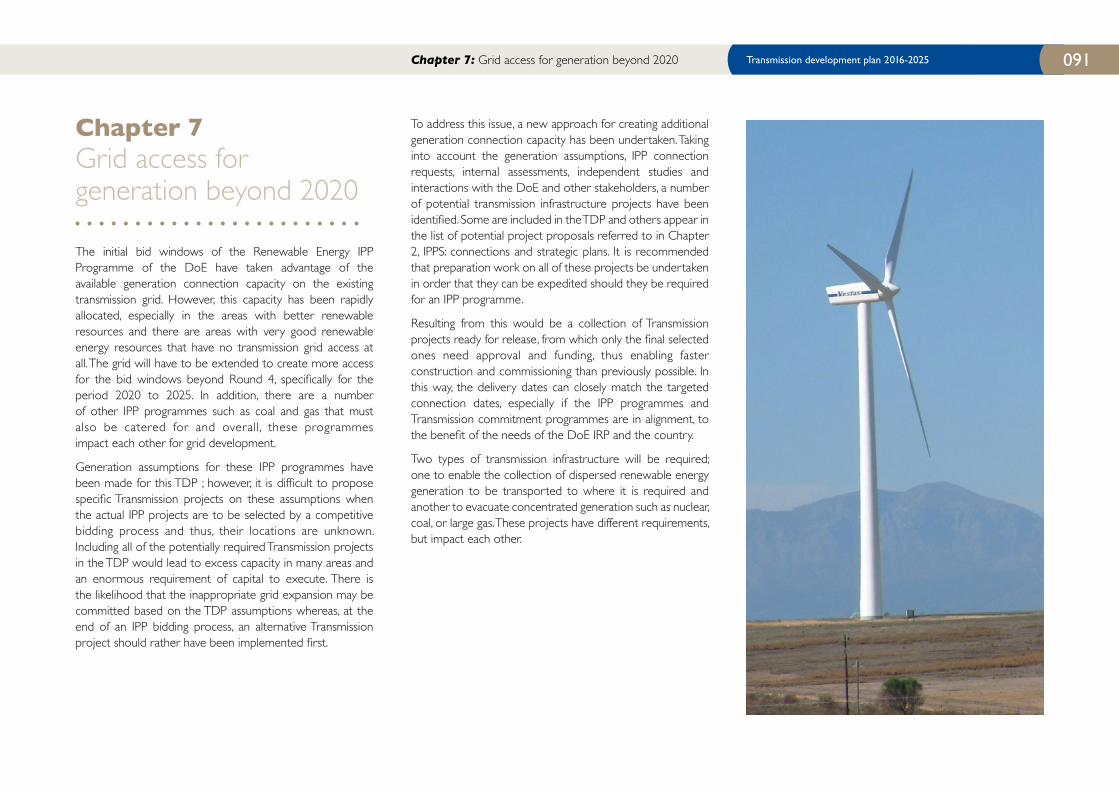
Transmission development plan 2016-2025 091Chapter 7: Grid access for generation beyond 2020
Chapter 7 Grid access for generation beyond 2020
The initial bid windows of the Renewable Energy IPP Programme of the DoE have taken advantage of the available generation connection capacity on the existing transmission grid. However, this capacity has been rapidly allocated, especially in the areas with better renewable resources and there are areas with very good renewable energy resources that have no transmission grid access at all. The grid will have to be extended to create more access for the bid windows beyond Round 4, specifically for the period 2020 to 2025. In addition, there are a number of other IPP programmes such as coal and gas that must also be catered for and overall, these programmes impact each other for grid development.
Generation assumptions for these IPP programmes have been made for this TDP ; however, it is difficult to propose specific Transmission projects on these assumptions when the actual IPP projects are to be selected by a competitive bidding process and thus, their locations are unknown. Including all of the potentially required Transmission projects in the TDP would lead to excess capacity in many areas and an enormous requirement of capital to execute. There is the likelihood that the inappropriate grid expansion may be committed based on the TDP assumptions whereas, at the end of an IPP bidding process, an alternative Transmission project should rather have been implemented first.
To address this issue, a new approach for creating additional generation connection capacity has been undertaken. Taking into account the generation assumptions, IPP connection requests, internal assessments, independent studies and interactions with the DoE and other stakeholders, a number of potential transmission infrastructure projects have been identified. Some are included in the TDP and others appear in the list of potential project proposals referred to in Chapter 2, IPPS: connections and strategic plans. It is recommended that preparation work on all of these projects be undertaken in order that they can be expedited should they be required for an IPP programme.
Resulting from this would be a collection of Transmission projects ready for release, from which only the final selected ones need approval and funding, thus enabling faster construction and commissioning than previously possible. In this way, the delivery dates can closely match the targeted connection dates, especially if the IPP programmes and Transmission commitment programmes are in alignment, to the benefit of the needs of the DoE IRP and the country.
Two types of transmission infrastructure will be required; one to enable the collection of dispersed renewable energy generation to be transported to where it is required and another to evacuate concentrated generation such as nuclear, coal, or large gas. These projects have different requirements, but impact each other.
7.1 Dispersed renewable energy generationThe expected renewable energy generation is spread across the three Cape provinces, excluding solar PV, which could potentially be installed almost anywhere in the country. The locations of the successful and shortlisted bidders in the REIPPPP Windows 1 to 4 are known. The locations of the renewable generation allocated for the period 2020 to 2025 have been assumed and the likely transmission infrastructure required identified.
7.1.1 The Eastern CapeA total of 1 900 MW of wind generation has been assumed, mainly in the Somerset East and Queenstown areas. Much of this would be in the proposed REDZs for this province.
To accommodate this generation, at least two new 400/132 kV substations will be required in the vicinity of the Poseidon and Delphi substations, including additional 400 kV lines, to enable the evacuation of the renewable energy out of the province.
7.1.2 The Northern CapeA total of 1 100 MW of wind generation has been assumed, mainly in the Namaqualand and De Aar areas. Much of this, along with solar PV, would be in the proposed REDZs for this province. A further 600 MW of CSP generation has also been assumed, mainly around Upington and close to Sishen.
To accommodate this generation, at least one new 400/132 kV substation is required in the Hydra substation area and possibly a new 400/132 kV substation around the Nama area, in addition to establishing 400/132 kV at Aggeneis substation. The Hydra area substation will need 400 kV lines to integrate it into the grid and for the Nama area substation, a new Gromis-Aggeneis 400 kV line. The 220 kV network must be either overlaid or replaced with 400 kV to facilitate the evacuation of the renewable energy out of the province.
7.1.3 The Western CapeA total of 1 000 MW of wind generation has been assumed, mainly in the Beaufort West and Laingsburg areas, as well as in the proposed REDZs for this province.
To accommodate this generation, at least one new 400/132 kV substation is required in the Droërivier substation area and the establishment of 400/132 kV transformation at the Komsberg series capacitor site and Kappa substation. This may result in additional 400 kV lines being required to help evacuate the collected generation.
7.2 Concentrated generationThere are two areas that will require the evacuation of concentrated generation into the grid based on the TDP assumptions: the Lephalale area for coal IPP plants and the Port Elizabeth area for nuclear and a large gas power plant. The impact of these generation plants being located elsewhere is addressed in Chapter 8, Impact of the DoE generation scenarios.
7.2.1 The Lephalale areaA total of 2 250 MW of IPP coal generation has been allocated to the Lephalale area from 2022 after the completion of the Medupi Power Station. Due to the available transmission infrastructure in this area, it is unlikely that it will be possible to evacuate more than 600 MW from this area. Servitude constraints would make it short-sighted to create a grid bottleneck by incremental strengthening of the 400 kV network.
To evacuate additional coal generation from this area, it is recommended that a 600 kV HVDC scheme be constructed from the Massa substation into the Johannesburg area, with terminal stations at the Jupiter B and Etna substations, providing a capacity of up to 3 000 MW. This HVDC link will serve a dual purpose with the injection of power into the Gauteng networks, in that it will create a window to allow for the upgrading of sections of the 275 kV networks to 400 kV. The recycling of certain 275 kV lines to 400 kV is needed to meet the increasing load density demands around Johannesburg.
The 600 kV HVDC is not included in the TDP yet, but has been identified as a ring-fenced Transmission project that will require funding should additional connection capacity be needed in the Lephalale area.
7.2.2 The Port Elizabeth areaThe 765 kV infrastructure from Gamma substation to Grassridge substation in Port Elizabeth will be able to evacuate around 4 000 MW of generation. This would be adequate for either nuclear generation at the Thuyspunt site or a large gas generation plant within the Coega area, but not for both.
Chapter 7: Grid access for generation beyond 2020
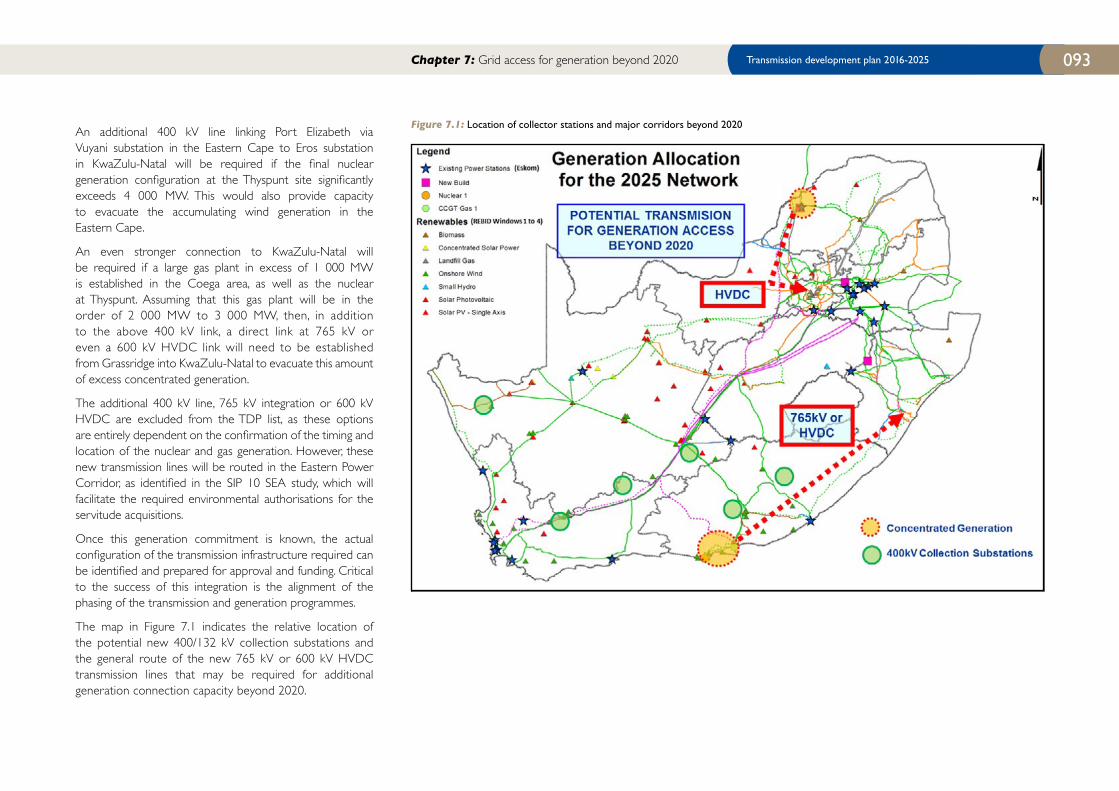
Transmission development plan 2016-2025 093Chapter 7: Grid access for generation beyond 2020
An additional 400 kV line linking Port Elizabeth via Vuyani substation in the Eastern Cape to Eros substation in KwaZulu-Natal will be required if the final nuclear generation configuration at the Thyspunt site significantly exceeds 4 000 MW. This would also provide capacity to evacuate the accumulating wind generation in the Eastern Cape.
An even stronger connection to KwaZulu-Natal will be required if a large gas plant in excess of 1 000 MW is established in the Coega area, as well as the nuclear at Thyspunt. Assuming that this gas plant will be in the order of 2 000 MW to 3 000 MW, then, in addition to the above 400 kV link, a direct link at 765 kV or even a 600 kV HVDC link will need to be established from Grassridge into KwaZulu-Natal to evacuate this amount of excess concentrated generation.
The additional 400 kV line, 765 kV integration or 600 kV HVDC are excluded from the TDP list, as these options are entirely dependent on the confirmation of the timing and location of the nuclear and gas generation. However, these new transmission lines will be routed in the Eastern Power Corridor, as identified in the SIP 10 SEA study, which will facilitate the required environmental authorisations for the servitude acquisitions.
Once this generation commitment is known, the actual configuration of the transmission infrastructure required can be identified and prepared for approval and funding. Critical to the success of this integration is the alignment of the phasing of the transmission and generation programmes.
The map in Figure 7.1 indicates the relative location of the potential new 400/132 kV collection substations and the general route of the new 765 kV or 600 kV HVDC transmission lines that may be required for additional generation connection capacity beyond 2020.
Figure 7.1: Location of collector stations and major corridors beyond 2020
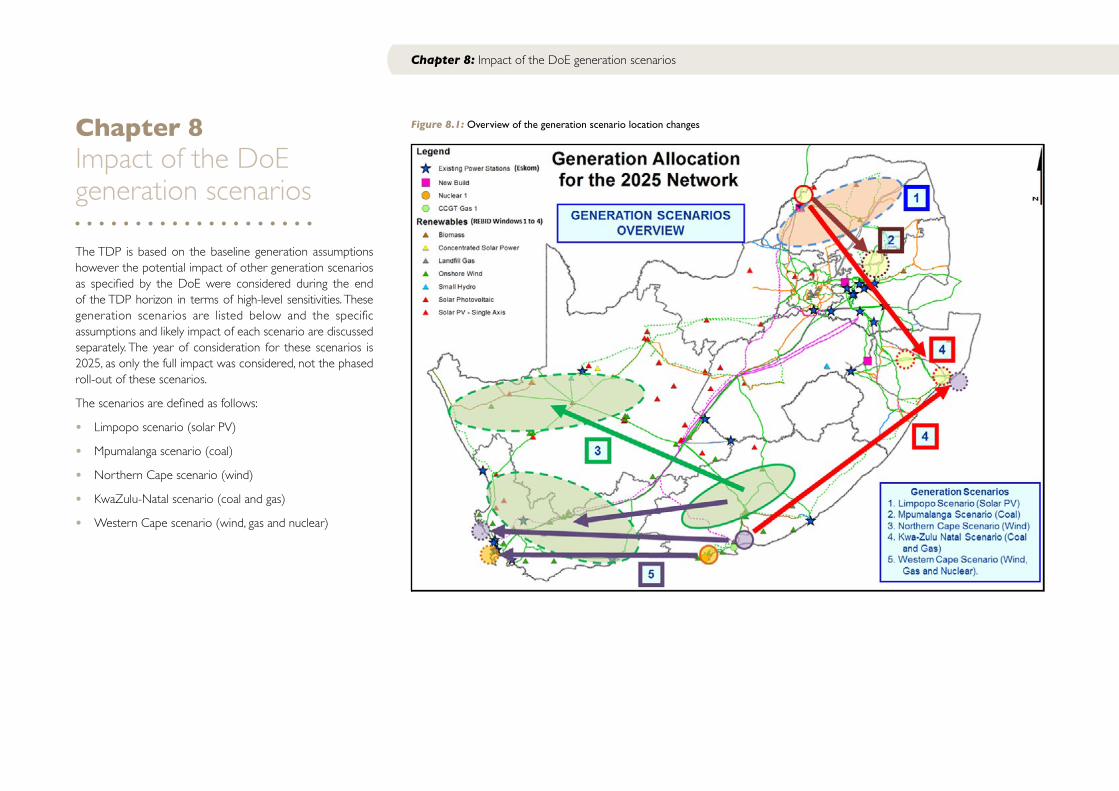
Chapter 8: Impact of the DoE generation scenarios
Chapter 8 Impact of the DoE generation scenarios
The TDP is based on the baseline generation assumptions however the potential impact of other generation scenarios as specified by the DoE were considered during the end of the TDP horizon in terms of high-level sensitivities. These generation scenarios are listed below and the specific assumptions and likely impact of each scenario are discussed separately. The year of consideration for these scenarios is 2025, as only the full impact was considered, not the phased roll-out of these scenarios.
The scenarios are defined as follows:
• Limpopo scenario (solar PV)
• Mpumalanga scenario (coal)
• Northern Cape scenario (wind)
• KwaZulu-Natal scenario (coal and gas)
• Western Cape scenario (wind, gas and nuclear)
Figure 8.1: Overview of the generation scenario location changes
Transmission development plan 2016-2025 095Chapter 8: Impact of the DoE generation scenarios
8.1 Limpopo scenario (solar PV)The purpose of this scenario is to determine the impact on the transmission network within the Limpopo province if 1 000 MW of large solar PV generation is moved from the Northern Cape to Limpopo.
An additional 1 000 MW of future solar PV was allocated to the following substation locations in Limpopo:
• Medupi: 200 MW
• Witkop: 200 MW
• Nzhelele: 200 MW
• Tabor: 200 MW
• Spencer: 200 MW
Impact of the scenario
There is no significant impact of this generation scenario on the Limpopo province. The allocated amounts of solar PV can be absorbed within the local loads and the existing and planned transmission network.
The 200MW PV at Matimba may be difficult to evacuate unless there is a significant load increase in the area around Lephalale. Once this level of PV penetration is reached in the Limpopo province studies will need to be done to determine if there is any negative impact on the operation and stability procedures for the two large coal power stations.
8.2 Mpumalanga scenario (coal)The purpose of this scenario is to determine the impact on the transmission network within Mpumalanga if 1 600 MW of coal generation is moved from the Lephalale/Waterberg area into the Mpumalanga province.
The locations for new coal in Mpumalanga are:
• the Coal IPP 1 site, with an additional 400 MW (total 800 MW);
• the Coal IPP 3 site near Kriel, with an additional 400 MW (total 800 MW);
• Kendal Power Station, with an additional 400 MW (representing a Delmas area IPP); and
• Kruispunt substation, with an additional 400 MW.
Impact of the scenario
There is no significant impact of this generation scenario on the Mpumalanga province. The allocated amounts of coal generation can be absorbed and transported utilising the transmission capacity of the existing and planned networks in the province. Some reconfiguration of the networks may be required to better share the power flows, but this should not require significant transmission infrastructure. There is likely to be fault level constraints, but these can also be resolved with network reconfiguration. Actual requirements will be dependent on the final location and size of the IPP coal plants which can be different to those given above, but are not expected to be limited and any reinforcement required, easily implemented.
8.3 Northern Cape scenario (wind)The purpose of this scenario is to determine the impact on the transmission network within the Northern Cape if 2 500 MW of wind generation is moved from the Eastern Cape into the Northern Cape. This includes some substations in the northern part of the Western Cape.
The locations for new wind generation for this scenario are as follows:
• Nama: 400 MW
• Gromis: 400 MW
• Aggeneis: 400 MW
• Oranjemund: 400 MW
• Hydra: 300 MW
• Kronos: 300 MW
• Gamma: 300 MW
Impact of the scenario
There is a significant impact from this generation scenario on the Northern Cape province.
The 220 kV network in the Namaqualand area, running from Aggeneis-Nama-Gromis-Oranjemond will be overwhelmed with RE generation to be collected and evacuated out of the area. Accommodating this amount of additional IPP generation will require this network to be overlaid with 400 kV. This will entail the construction of the following as a minimum:
Chapter 8: Impact of the DoE generation scenarios
• Energising the new Gromis-Oranjemond 400 kV line
• A new Oranjemond-Aggeneis 400 kV line (300 km)
• A new Gromis-Nama-Aggeneis 400 kV line (200 km)
• A new Aggeneis-Helios 400 kV line (150 km) or 2nd Aggeneis-Aries 400 kV line (150 km)
• A 2nd Aries-Ferrum 400 kV line
• At least one new 400/132 kV collector substation in the Nama-Gromis area, plus the 400 kV lines to integrate it
• A new Ferrum-Olien-Perseus 400 kV line to reinforce the 275 kV link via Kimberley to provide an additional evacuation path for network security.
The Hydra/Kronos/Gamma generation will require the establishment of 400 kV/132 kV at Gamma, an additional substation in the Hydra area (Hydra B) and the extension of Kronos 400/132 kV. A second Hydra-Kronos-Aries 400 kV line (400 km) may be required. The new Hydra B substation may also require additional 400 kV lines for integration.
8.4 Kwazulu-Natal scenario (coal and gas)The purpose of this scenario is to determine the impact on the transmission network within KwaZulu-Natal when coal generation is moved from Lephalale into the KwaZulu-Natal area and gas is moved from Coega to Richards Bay.
This scenario was represented as follows:
Gas (LNG)
All the new gas units (11 in total) were removed from the Dedisa (Coega) site and placed at Invubu substation to represent a Richards Bay gas IPP (3 126 MW).
Coal
The Coal IPP 2 and Coal IPP 4 units at Massa substation were switched off and replaced with additional generator units placed as follows:
• 1 000 MW at Chivelston substation to represent a Colenso coal IPP
• 600 MW at Invubu substation to represent a Richards Bay coal IPP
Impact of the scenarioThere is no significant impact of this generation scenario on the KwaZulu-Natal province.
The allocated coal generation can be absorbed and transported utilising the transmission capacity of the existing and planned networks in the province.
The gas allocation of over 3 000 MW is more of a challenge, but there is significant load in the area and only the excess power will need to be evacuated from Richards Bay. The 765 kV and 400 kV lines can be utilised for this purpose, including the new double-circuit 400 kV line running from Mbewu to Isundu and on to Hector and Ariadne, linking Richards Bay to the greater Durban area. This new 400 kV link will enable development along the coastal areas between the two load centres as well as provide an evacuation route for the excess power.
The allocation of 3 000 MW of gas generation to the Richards Bay area will relieve the requirements from evacuating excess power from the Eastern Cape if it had been placed at the Coega site (Dedisa) instead. Thus the reinforcement of the new transmission corridor to KwaZulu-Natal will be delayed in terms of capacity and timing.
8.5 Western Cape scenario (wind, gas, and nuclear)The purpose of this scenario is to determine the impact on the transmission network within the Western Cape if large gas, nuclear and large wind generation is to be evacuated from this province.
This scenario was represented as follows:
Gas (LNG)
All the new gas units (11 in total) were removed from Dedisa (Coega) and placed at the Aurora substation to represent a Saldanha gas IPP (3 126 MW).
Nuclear
The three nuclear units were removed from Thyspunt and placed at the Sterrekus 400 kV busbar to represent the Duynefontein site (4 800 MW).
Wind generation
A total of 2 500 MW had to be moved from the Eastern Cape to the Western Cape. The additional wind generation had to be added, as listed below. The Eastern Cape wind generation was reduced and the wind in the substations listed below was run at full 100% output:
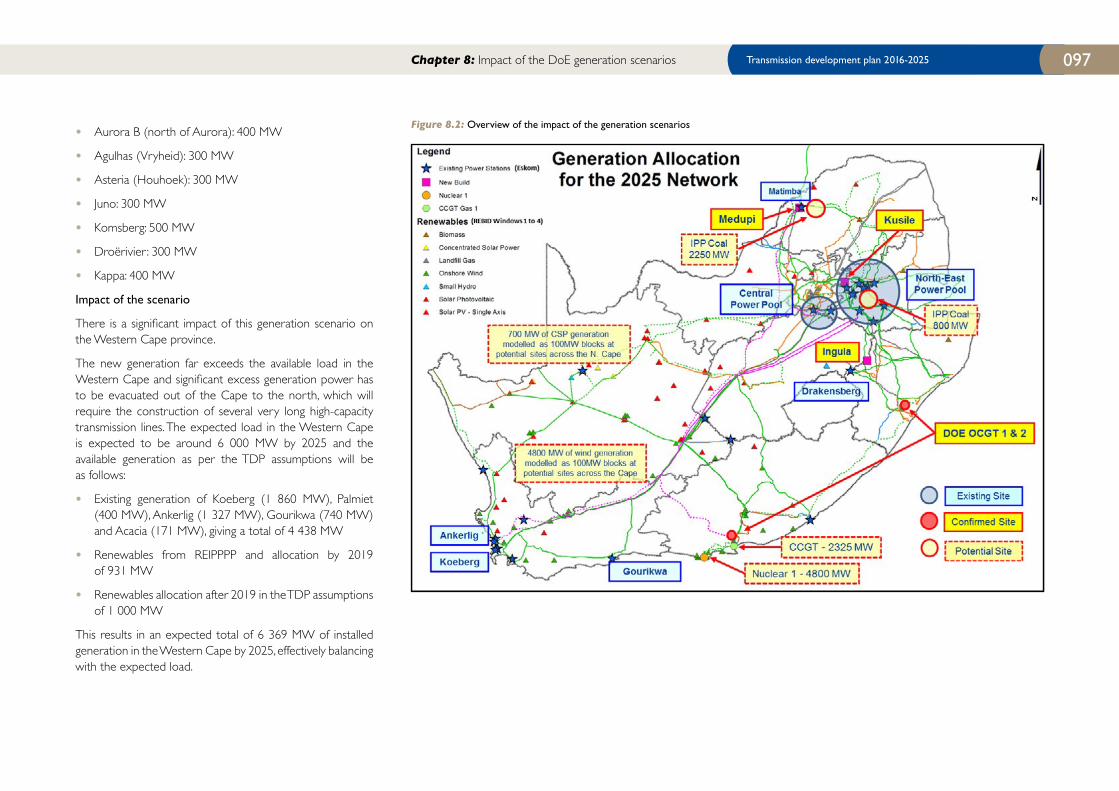
Transmission development plan 2016-2025 097Chapter 8: Impact of the DoE generation scenarios
• Aurora B (north of Aurora): 400 MW
• Agulhas (Vryheid): 300 MW
• Asteria (Houhoek): 300 MW
• Juno: 300 MW
• Komsberg: 500 MW
• Droërivier : 300 MW
• Kappa: 400 MW
Impact of the scenario
There is a significant impact of this generation scenario on the Western Cape province.
The new generation far exceeds the available load in the Western Cape and significant excess generation power has to be evacuated out of the Cape to the north, which will require the construction of several very long high-capacity transmission lines. The expected load in the Western Cape is expected to be around 6 000 MW by 2025 and the available generation as per the TDP assumptions will be as follows:
• Existing generation of Koeberg (1 860 MW), Palmiet (400 MW), Ankerlig (1 327 MW), Gourikwa (740 MW) and Acacia (171 MW), giving a total of 4 438 MW
• Renewables from REIPPPP and allocation by 2019 of 931 MW
• Renewables allocation after 2019 in the TDP assumptions of 1 000 MW
This results in an expected total of 6 369 MW of installed generation in the Western Cape by 2025, effectively balancing with the expected load.
Figure 8.2: Overview of the impact of the generation scenarios

This scenario will result in the installation of an additional 7 926 MW of dispatchable generation, plus an intermittent wind generation of 2 500 MW, in total 10 426 MW. Effectively, almost all of this power will need to be evacuated out of the Western Cape.
Taking into account the intermittency of the wind generation and the operation of Palmiet, Ankerlig, Gourikwa and Acacia as peaking plant, the 765 kV network and 400 kV lines can be used to evacuate most of the power during normal operations. However, to account for baseload operation of the nuclear plants, high utilisation of the CCGT plant and high wind output operating conditions, additional transmission corridors will be required to evacuate between 3 000 MW and 4 000 MW out of the province.
The first objective would be to reinforce the Northern Cape evacuation route. This would entail, as a minimum and effectively, doubling of the 400 kV line route via the Northern Cape to the North West province. Thus, a new Aurora-Juno-Helios-Aries-Ferrum-Mookodi-Mercury 400 kV link, approximately 1 400 km long, plus appropriate compensation, should be constructed. This will also facilitate the collection and evacuation of renewable energy generation in the Northern Cape.
The main component of the additional corridor could either be at 765 kV EHV or 600 kV HVDC to provide a power transfer of around 3 000 MW of power over a distance of at least 1 200 km to where it is required. The main generation in the Eastern Cape has been relocated to the Western Cape and the strategic intention of the grid development is to supply KwaZulu-Natal from the future Cape Power Pool. Therefore, the proposal for this scenario would be to establish a new 600 kV HVDC scheme from the Cape Peninsula area directly to KwaZulu-Natal via the Eastern Cape. This will utilise the identified power corridor routes under the SIP 10 initiative.
The overview of the impact of the Northern Cape scenario and the Western Cape scenario is illustrated in the map in Figure 8-2. Note that for the Western Cape scenario (indicated in red) most of the 400 kV expansion in the Northern Cape scenario (indicated in orange) will also be required.
Chapter 9 Capital expenditure plan
The total capital expenditure for Transmission amounts to R206 798 million. This summary is shown in Table 9.1. It is clear that the majority of the cost will be related to expansion because this relates directly to the strengthening of the network to accommodate new customers as well as new generation.
Refurbishment is required to prolong the life of assets and land acquisition projects are required to purchase the land on which to build the expansion assets.
Table 9.2 shows the provincial split for transmission expansion projects which amount to R146 billion over the next ten years. Projects spanning over multiple provinces were classified as national projects.
Chapter 9: Capital expenditure plan
Categories Rand (millions)
Capital expansion 146 822
Capital expansion for IPPs 30 570
Refurbishment 14 943
Capital spares 2 427
Telecoms 3 698
Aviation 501
Production equipment 596
Other 1 694
Land and rights 5 547
Total 206 798
Table 9.1: Capital expenditure per category of projects for FY2016 to 2025
Province Expansion Cost (millions)
Eastern Cape 14 603
Free state 3 883
Gauteng 19 878
KwaZulu Natal 24 924
Limpopo 14 788
Mpumalanga 8 243
North West 5 264
Northern Cape 24 458
Western Cape 10 741
National 19 898
Table 9.2: Capital expenditure for expansion projects for FY2016 to 2025 per province
Transmission development plan 2016-2025 099Chapter 10: Conclusion
Chapter 10 Conclusion
The most visible difference between this TDP and the 2014 TDP is the re-phasing of projects in the execution phase. The acquisition of servitudes for lines and sites for new substations continues to be a challenge for Eskom Transmission, sometimes necessitating re-phasing. Projects required for the first four rounds of the DoE REIPPPP that are under construction have been added, as well as the projects required for the 13 additional IPP successful bidders announced by the DoE in Round 4. There is an assumed plan for Rounds 5 and 6 of the RE IPP programme based on current estimates of technology, size and location.
The result is a realistic and achievable development plan, within the constraints imposed by funding, site and servitude acquisition and supplier and construction lead times. The slower rate of completion of projects, unfortunately, increases the overall risk to the network. However, this risk can be managed, as the N-1 unfirm refers to the strict deterministic level, which assumes that an N-1 contingency event will happen at the time of the peak loading. In reality, there is a limited chance of this happening and operational mitigation plans will cater for most of the events until the required projects have been completed. Some of the risk mitigation measures under consideration include higher reliance on the following: utilisation of strategic spares, the use of capacitors in the short term for voltage support, as well as emergency preparedness plans. Customers are consulted when compiling or reviewing emergency preparedness plans to ensure that emergencies necessitating load reduction are managed in a way that minimises the impact on customers and South Africa.
Robust and efficient planning requires the timely exchange of credible information between stakeholders. In particular, stakeholders are requested to note that spatial data and information are critical for the effective planning and development of the transmission network. Transmission infrastructure could easily become the critical path in connecting and integrating large new loads and generation due to the long lead times for securing corridors. It is recommend that, for planning purposes, developers should allow for at least seven years’ lead time for new corridors. It should also be noted that, in the EIA process, there are increasing objections from landowners and other stakeholders to proposed power line routes, which may further prolong the time to implement projects. The EIA and environmental approval process is prescribed by law and changes to the relevant environmental legislation can have a significant effect on lead times for new projects.
The transmission projects in this TDP will result in the overall network becoming Grid Code compliant, while catering for increased load growth and the integration of new generation, but at a later date than previously envisaged mainly due to funding constraints. The system will be running at risk in some areas and careful operational mitigation planning will have to be undertaken until the transmission projects and new generation are in place.
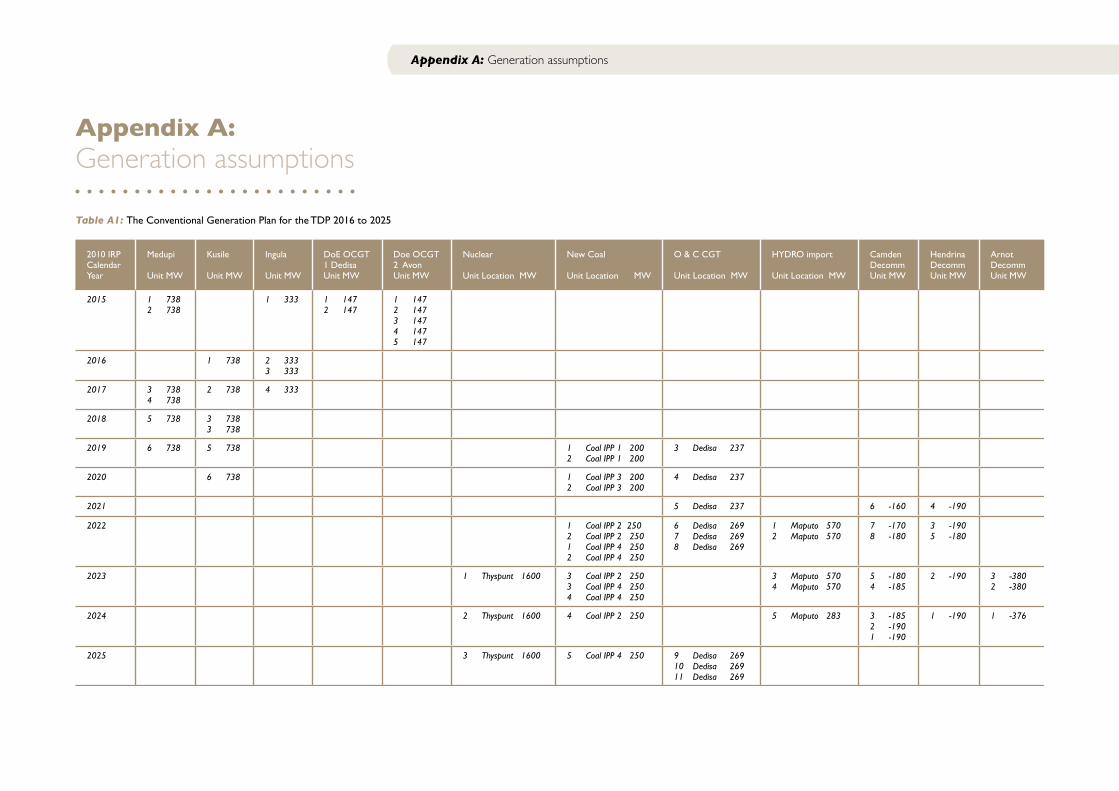
Appendix A: Generation assumptions
Appendix A: Generation assumptions
Table A1: The Conventional Generation Plan for the TDP 2016 to 2025
2010 IRP Calendar Year
Medupi
Unit MW
Kusile
Unit MW
Ingula
Unit MW
DoE OCGT 1 DedisaUnit MW
Doe OCGT 2 AvonUnit MW
Nuclear
Unit Location MW
New Coal
Unit Location MW
O & C CGT
Unit Location MW
HYDRO import
Unit Location MW
Camden DecommUnit MW
Hendrina DecommUnit MW
Arnot DecommUnit MW
2015 1 7382 738
1 333 1 1472 147
1 1472 1473 1474 1475 147
2016 1 738 2 3333 333
2017 3 7384 738
2 738 4 333
2018 5 738 3 7383 738
2019 6 738 5 738 1 Coal IPP 1 2002 Coal IPP 1 200
3 Dedisa 237
2020 6 738 1 Coal IPP 3 2002 Coal IPP 3 200
4 Dedisa 237
2021 5 Dedisa 237 6 -160 4 -190
2022 1 Coal IPP 2 2502 Coal IPP 2 2501 Coal IPP 4 2502 Coal IPP 4 250
6 Dedisa 2697 Dedisa 2698 Dedisa 269
1 Maputo 5702 Maputo 570
7 -1708 -180
3 -1905 -180
2023 1 Thyspunt 1600 3 Coal IPP 2 2503 Coal IPP 4 2504 Coal IPP 4 250
3 Maputo 5704 Maputo 570
5 -1804 -185
2 -190 3 -3802 -380
2024 2 Thyspunt 1600 4 Coal IPP 2 250 5 Maputo 283 3 -1852 -1901 -190
1 -190 1 -376
2025 3 Thyspunt 1600 5 Coal IPP 4 250 9 Dedisa 26910 Dedisa 26911 Dedisa 269
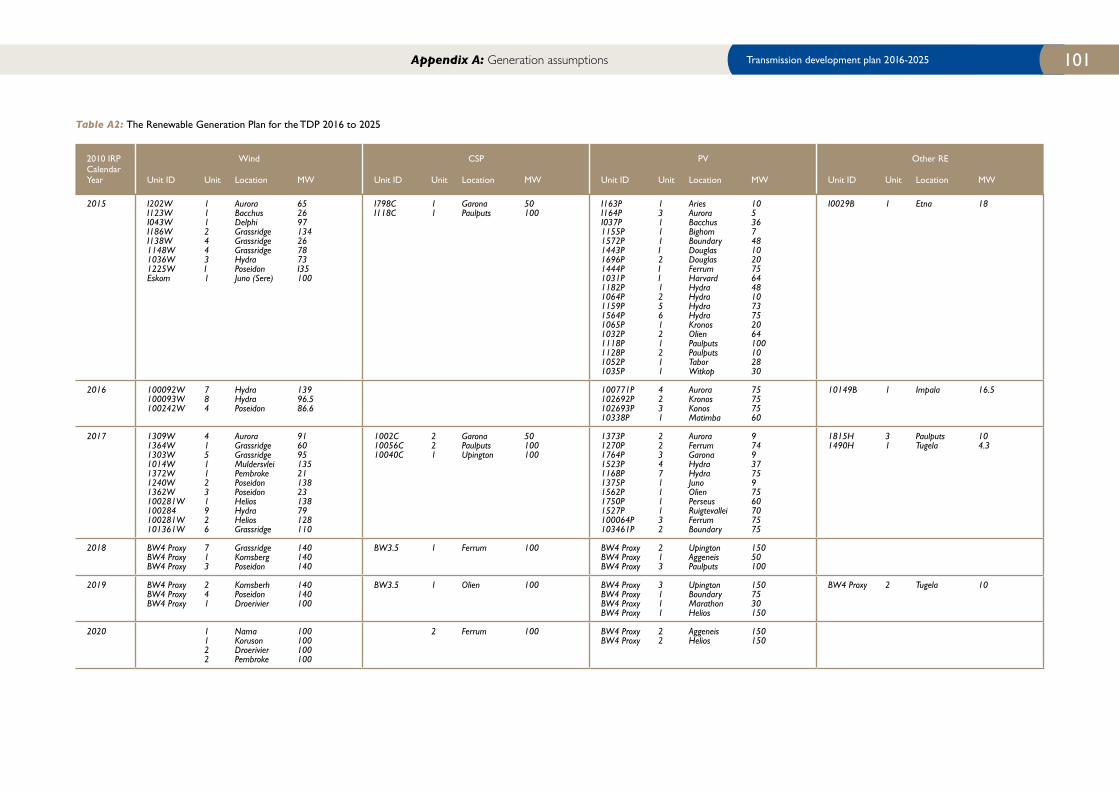
Transmission development plan 2016-2025 101Appendix A: Generation assumptions
Table A2: The Renewable Generation Plan for the TDP 2016 to 2025
2010 IRP CalendarYear
Wind
Unit ID Unit Location MW
CSP
Unit ID Unit Location MW
PV
Unit ID Unit Location MW
Other RE
Unit ID Unit Location MW
2015 I202W 1 Aurora 65I123W 1 Bacchus 26I043W 1 Delphi 97I186W 2 Grassridge 134I138W 4 Grassridge 261148W 4 Grassridge 781036W 3 Hydra 731225W I Poseidon I35Eskom 1 Juno (Sere) 100
I798C 1 Garona 50I118C 1 Paulputs 100
I163P 1 Aries 10I164P 3 Aurora 5I037P 1 Bacchus 361155P 1 Bighom 71572P 1 Boundary 481443P I Douglas 101696P 2 Douglas 201444P I Ferrum 751031P I Harvard 641182P 1 Hydra 481064P 2 Hydra 101159P 5 Hydra 731564P 6 Hydra 751065P 1 Kronos 201032P 2 Olien 641118P 1 Paulputs 1001128P 2 Paulputs 101052P 1 Tabor 281035P 1 Witkop 30
I0029B 1 Etna 18
2016 100092W 7 Hydra 139100093W 8 Hydra 96.5100242W 4 Poseidon 86.6
100771P 4 Aurora 75102692P 2 Kronos 75102693P 3 Konos 7510338P 1 Matimba 60
10149B 1 Impala 16.5
2017 1309W 4 Aurora 911364W 1 Grassridge 601303W 5 Grassridge 951014W 1 Muldersvlei 1351372W 1 Pembroke 211240W 2 Poseidon 1381362W 3 Poseidon 23100281W 1 Helios 138100284 9 Hydra 79100281W 2 Helios 128101361W 6 Grassridge 110
1002C 2 Garona 5010056C 2 Paulputs 10010040C 1 Upington 100
1373P 2 Aurora 91270P 2 Ferrum 741764P 3 Garona 91523P 4 Hydra 371168P 7 Hydra 751375P 1 Juno 91562P 1 Olien 751750P 1 Perseus 601527P 1 Ruigtevallei 70100064P 3 Ferrum 75103461P 2 Boundary 75
1815H 3 Paulputs 101490H 1 Tugela 4.3
2018 BW4 Proxy 7 Grassridge 140BW4 Proxy 1 Komsberg 140BW4 Proxy 3 Poseidon 140
BW3.5 1 Ferrum 100 BW4 Proxy 2 Upington 150BW4 Proxy 1 Aggeneis 50BW4 Proxy 3 Paulputs 100
2019 BW4 Proxy 2 Komsberh 140BW4 Proxy 4 Poseidon 140BW4 Proxy 1 Droerivier 100
BW3.5 1 Olien 100 BW4 Proxy 3 Upington 150BW4 Proxy 1 Boundary 75BW4 Proxy 1 Marathon 30BW4 Proxy 1 Helios 150
BW4 Proxy 2 Tugela 10
2020 1 Nama 100 1 Koruson 100 2 Droerivier 100 2 Pembroke 100
2 Ferrum 100 BW4 Proxy 2 Aggeneis 150BW4 Proxy 2 Helios 150

Appendix A2: Generation assumptions
2010 IRP CalendarYear
Wind
Unit ID Unit Location MW
CSP
Unit ID Unit Location MW
PV
Unit ID Unit Location MW
Other RE
Unit ID Unit Location MW
2021 2 Nama 100 2 Koruson 100 3 Droerivier 100 3 Pembroke 100
4 Upington 100
2022 1 Delphi 100 2 Delphi 100 4 Droerivier 100 3 Pembroke 100
5 Upington 100
2023 5 Poseidon 100 5 Droerivier 100 3 Delphi 100 4 Nama 100
6 Upington 100
2024 6 Droerivier 100 7 Droerivier 100 1 Hydra B 100 2 Hydra B 100 6 Poseidon 100 7 Poseidon 100 4 Delphi 100 5 Delphi 100
4 Garona 100
2025 8 Droerivier 100 1 Thyspunt 200 3 Hydra B 200 4 Hydra B 200 5 Hydra B 200 4 Pembroke 200 8 Doseidon 100 5 Delphi 200 6 Delphi 200
7 Upington 100
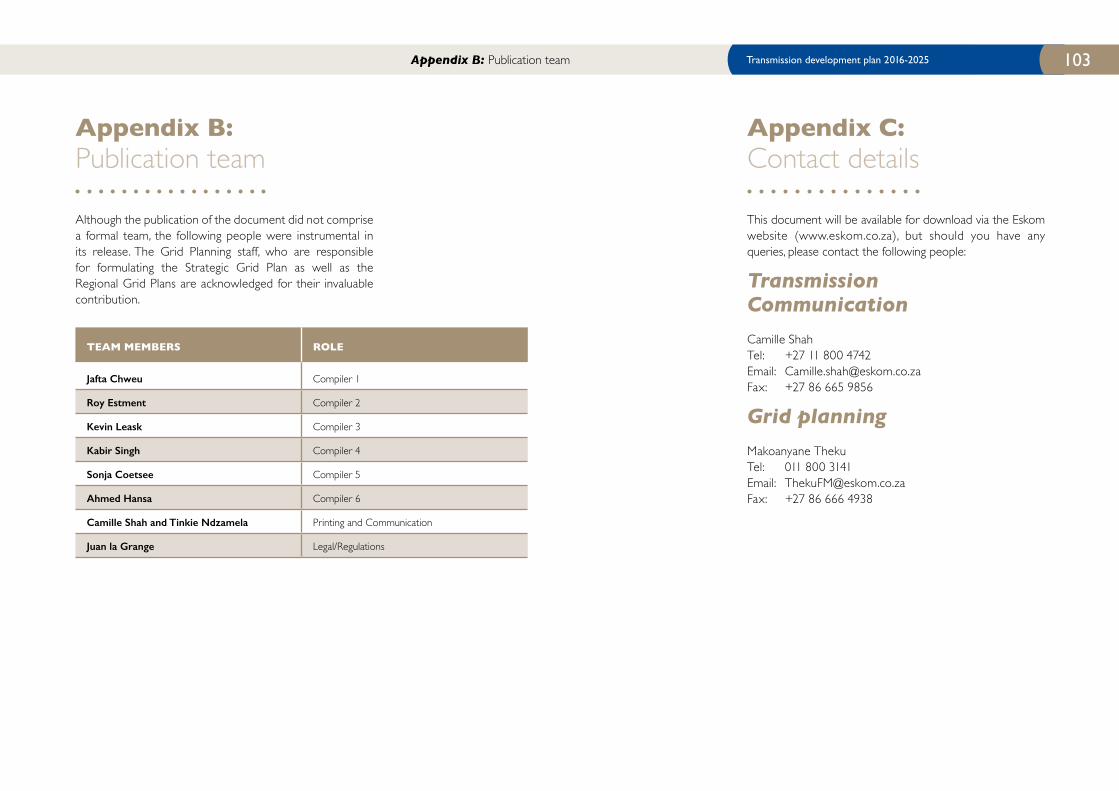
Transmission development plan 2016-2025 103
Appendix B: Publication team
Although the publication of the document did not comprise a formal team, the following people were instrumental in its release. The Grid Planning staff, who are responsible for formulating the Strategic Grid Plan as well as the Regional Grid Plans are acknowledged for their invaluable contribution.
TEAM MEMBERS ROLE
Jafta Chweu Compiler 1
Roy Estment Compiler 2
Kevin Leask Compiler 3
Kabir Singh Compiler 4
Sonja Coetsee Compiler 5
Ahmed Hansa Compiler 6
Camille Shah and Tinkie Ndzamela Printing and Communication
Juan la Grange Legal/Regulations
Appendix B: Publication team
Appendix C: Contact details
This document will be available for download via the Eskom website (www.eskom.co.za), but should you have any queries, please contact the following people:
Transmission Communication Camille Shah Tel: +27 11 800 4742 Email: [email protected] Fax: +27 86 665 9856
Grid planning Makoanyane Theku Tel: 011 800 3141 Email: [email protected] Fax: +27 86 666 4938

Eskom Transmission Group
Megawatt Park Maxwell Drive Sunninghill SandtonPO Box 1091 Johannesburg 2000 SA
www.eskom.co.za
Eskom Holdings SOC Ltd Reg No 2002/015527/30