Forsyth County COMPREHENSIVE PLAN 2004-2025
643
-
Upload
khangminh22 -
Category
Documents
-
view
1 -
download
0
Transcript of Forsyth County COMPREHENSIVE PLAN 2004-2025


FORSYTH COUNTY COMPREHENSIVE PLAN 2004-2025
FORSYTH COUNTY, GEORGIA
Adopted February 23, 2004 Amended December 13, 2004
Board of Commissioners Charles Laughinghouse, District 1
David F. Pritchett, District 2 Jack Conway, Chairman, District 3
Marcie Kreager, District 4 Eddie Taylor, District 5
Planning Commission
Michael Gravitt, District 1 Pam Livesay, District 2
Ralph J. “Pete” Amos, District 3 Mack Sheddan, District 4
Charles R. “Chuck” Perry, District 5
Forsyth County Planning and Development 110 East Main Street
Suite 100 Cumming, Georgia 30040


FORSYTH COUNTY COMPREHENSIVE PLAN i
TABLE OF CONTENTS
TABLE OF CONTENTS ............................................................................... iLIST OF TABLES ........................................................................................ viiLIST OF FIGURES ......................................................................................... xi
CHAPTER 1 POPULATION ELEMENTINTRODUCTION .............................................................................................................. 1-1INVENTORY AND ASSESSMENT ................................................................................... 1-1 Total Population ..................................................................................................... 1-1 Daytime Population ......................................................................................1-4 Households ............................................................................................................ 1-7 Age Distribution ...................................................................................................... 1-7 Racial Composition ................................................................................................ 1-8 Educational Attainment ........................................................................................1-10 Household Income ............................................................................................... 1-11
CHAPTER 2 HOUSING ELEMENTINTRODUCTION .............................................................................................................. 2-1INVENTORY AND ASSESSMENT ................................................................................... 2-1 Types of Housing Units .......................................................................................... 2-1 Seasonal Units .......................................................................................................... 2-2 Age And Condition Of Housing .............................................................................. 2-2 Owner And Renter Occupied Units ........................................................................ 2-3 Cost Of Housing .................................................................................................... 2-4 Cost Burdened Households ................................................................................... 2-5 Housing And Community Characteristics .............................................................. 2-7 Future Housing Needs .......................................................................................... 2-7COMMUNITY GOALS ...................................................................................................... 2-8
CHAPTER 3 ECONOMIC DEVELOPMENT ELEMENTINTRODUCTION .............................................................................................................. 3-1INVENTORY ..................................................................................................................... 3-1 Economic Base ...................................................................................................... 3-1 Employment and Earnings ..................................................................................... 3-1 Wages .................................................................................................................... 3-6 Income ................................................................................................................... 3-6 Major Economic Activity ......................................................................................... 3-8 Unique Economic Activity ....................................................................................... 3-9 Labor Force ........................................................................................................... 3-9 Occupation ............................................................................................................ 3-9 Labor Force Participation ..................................................................................... 3-10 Unemployment ..................................................................................................... 3-11

FORSYTH COUNTY COMPREHENSIVE PLAN ii FORSYTH COUNTY COMPREHENSIVE PLAN iii
Commuting Patterns ........................................................................................... 3-12 Local Economic Development Resources ......................................................... 3-12 Economic Development Agencies ........................................................................ 3-12 Economic Development Programs and Tools ...................................................... 3-12 Education And Training Opportunities ................................................................ 3-14ASSESSMENT OF CURRENT AND FUTURE NEEDS ................................................. 3-14COMMUNITY GOALS ................................................................................................... 3-15
CHAPTER 4 NATURAL RESOURCES ELEMENTINTRODUCTION .............................................................................................................. 4-1INVENTORY AND ASSESSMENT .................................................................................. 4-1 Climate ................................................................................................................... 4-1 Geology and Topography ....................................................................................... 4-1 Soils ....................................................................................................................... 4-2 Minerals ................................................................................................................. 4-2 Steep Slopes .......................................................................................................... 4-3 Protected Mountains ............................................................................................ 4-3 Prime Agricultural Land and Forest Land ............................................................... 4-3 Plant and Animal Habitats ...................................................................................... 4-4 Major Parks, Recreation and Conservation Areas ................................................. 4-4 Significant Landmarks and Vistas .......................................................................... 4-5 Greenspace Acquistion Areas .............................................................................. 4-8 Water Resources ................................................................................................... 4-8 Water-supply Watersheds ...................................................................................... 4-9 Wetlands .............................................................................................................. 4-10 Flood Plains ......................................................................................................... 4-11 Significant Groundwater Recharge Areas ............................................................ 4-11 Protected River Corridor ...................................................................................... 4-16 Summary ............................................................................................................. 4-20COMMUNITY GOALS .................................................................................................... 4-20
CHAPTER 5 CULTURAL RESOURCES ELEMENTINVENTORY ..................................................................................................................... 5-1 Archeological Resources ....................................................................................... 5-1 Historic Resources Survey .................................................................................... 5-2ASSESSMENT ................................................................................................................. 5-4COMMUNITY GOALS ..................................................................................................... 5-4
CHAPTER 6 COMMUNITY FACILITIES AND SERVICES ELEMENT INTRODUCTION .............................................................................................................. 6-1WATER AND SEWER FACILITIES ............................................................................. 6-1 Water Supply and Treatment .............................................................................. 6-1 Water Supply Assessment .................................................................................... 6-2 Sewerage System and Wastewater Treatment ...................................................... 6-4

FORSYTH COUNTY COMPREHENSIVE PLAN ii FORSYTH COUNTY COMPREHENSIVE PLAN iii
Existing Sewer Service Area .................................................................................. 6-4 Existing Wastewater Treatment ............................................................................... 6-5 Sewer System Assessment ................................................................................... 6-5 Future Wastewater Flows to Sewer Systems ........................................................ 6-6SOLID WASTE MANAGEMENT .................................................................................... 6-10 Inventory Of Waste Disposal ............................................................................... 6-10 Recycling Collection ............................................................................................ 6-10 Inventory Of Waste Collection ............................................................................. 6-10 Inventory Of Waste Reduction ............................................................................ 6-11GENERAL GOVERNMENT ........................................................................................... 6-13 Inventory .............................................................................................................. 6-13 Assessment ......................................................................................................... 6-14 SHERIFF’S DEPARTMENT ............................................................................................. 6-14FIRE PROTECTION AND EMS ..................................................................................... 6-14 Assessment .......................................................................................................... 6-18RECREATION FACILITIES ........................................................................................... 6-19 Recreation Sites ................................................................................................... 6-19 School Recreation Areas ..................................................................................... 6-23 Recreation Programs ........................................................................................... 6-24 Assessment Of Recreational Facilities ............................................................. 6-25PUBLIC HEALTH FACILITIES ..................................................................................... 6-25EDUCATIONAL FACILITIES ........................................................................................ 6-27CULTURAL FACILITIES ............................................................................................... 6-30 Sawnee Cultural Arts Center .......................................................................... 6-30 Lanierland ............................................................................................................ 6-30 Forsyth County Library System ............................................................................ 6-30COMMUNITY GOALS ..................................................................................................... 6-31 Sheriff’s Department ............................................................................................ 6-31 Fire Protection And EMS ................................................................................... 6-31 Recreation Facilities ............................................................................................. 6-31 Educational Facilities ............................................................................................ 6-34
CHAPTER 7 LAND USE ELEMENTINTRODUCTION .............................................................................................................. 7-1 Methodology .......................................................................................................... 7-1INVENTORY OF EXISTING CONDITIONS ...................................................................... 7-3 Existing Land Use Map .......................................................................................... 7-3EXISTING LAND USE ASSESSMENT ............................................................................. 7-5 Historical Factors ................................................................................................... 7-5 Land Use Patterns In Relation To Infrastructure .................................................... 7-5 Blighted And Transitional Areas ......................................................................... 7-6 Environmentally Sensitive Or Locally Valued Land ............................................... 7-6 Problems With Existing Development Patterns ................................................ 7-7 Potential Sites For Infill And Traditional Neighborhood Development .................... 7-8

FORSYTH COUNTY COMPREHENSIVE PLAN iv
Local Policies That Could Affect Future Land Use Patterns ................................. 7-9ANALYSIS OF THE FUTURE LAND USE NEEDS .......................................................... 7-10 Development of Community Goals ................................................................. 7-12IMPLEMENTATION PROGRAM .................................................................................... 7-12 Future Land Use Map ........................................................................................ 7-13 Future Land Use Narrative ................................................................................... 7-13 Community Goals ............................................................................................... 7-18
CHAPTER 8 TRANSPORTATION ELEMENTINTRODUCTION ............................................................................................................... 8-1ROAD INVENTORY ......................................................................................................... 8-1 Roadway Functional Classification ........................................................................ 8-1 Functional Classification Assignments .................................................................. 8-2 Highway Infrastructure and Traffic Volumes .......................................................... 8-6 Major Roadways ................................................................................................... 8-6ACCIDENT FREQUENCY ............................................................................................... 8-14SIGNALIZATION AND SIGNAGE ................................................................................. 8-15BRIDGES ...................................................................................................................... 8-16STATE TRANSPORTATION IMPROVEMENT PROGRAM ..................................... 8-19BIKE AND PEDESTRIAN PATHWAYS ......................................................................... 8-19SIGNIFICANT PARKING FACILITIES ......................................................................... 8-19PUBLIC TRANSPORTATION ..................................................................................... 8-19OTHER MODES OF TRANSPORTATION .................................................................... 8-19ASSESSMENT ................................................................................................................ 8-23 Adopted Levels of Service ................................................................................. 8-23 Los Analysis Methodology ................................................................................ 8-24 Land Use ............................................................................................................ 8-31COMMUNITY GOALS .................................................................................................. 8-31
CHAPTER 9 INTERGOVERNMENTAL COORDINATION ELEMENTINTRODUCTION ............................................................................................................. 9-1ADJACENT LOCAL GOVERNMENTS ........................................................................... 9-1 City of Cumming ................................................................................................... 9-1 City of Alpharetta, Fulton County, Cherokee County, and Dawson County ......... 9-2 City of Sugar Hill, Gwinnett County, and Hall County ........................................ 9-2SCHOOL BOARDS ...................................................................................................... 9-2 Forsyth County Board of Education .................................................................. 9-2INDEPENDENT SPECIAL DISTRICTS ....................................................................... 9-2 City of Cumming Water and Sewer .............................................................................. 9-2 U.S. Army Corps of Engineers ................................................................................... 9-3INDEPENDENT DEVELOPMENT AUTHORITIES ........................................................ 9-3 Forsyth County Development Authority ................................................................. 9-3 Cumming-Forsyth County Chamber of Commerce ................................................ 9-3OTHER UNITS OF LOCAL GOVERNMENT AND UTILITY COMPANIES ...................... 9-3

FORSYTH COUNTY COMPREHENSIVE PLAN v
Forsyth County Sheriff’s Office .......................................................................... 9-3 Sawnee Electric Membership Corporation (EMC) and Georgia Power Company ..... 9-3OTHER ORGANIZATIONS .............................................................................................. 9-3 Georgia Mountains Regional Development Center .............................................. 9-3 Atlanta Regional Commission .............................................................................. 9-4 Georgia Regional Transportation Authority ........................................................... 9-4 Georgia Department of Transportation ................................................................. 9-5 Georgia Department of Natural Resources .......................................................... 9-5 Georgia Department of Community Affairs .......................................................... 9-5 Appalachian Regional Commission ..................................................................... 9-5OTHER PROGRAMS AND ACTIVITIES ........................................................................ 9-6 Local Government Service Delivery Strategy Act ................................................. 9-6 Annexation .......................................................................................................... 9-7 Extraterritorial Provision of Water and Sewer ...................................................... 9-7 Land Use Compatibility .......................................................................................... 9-7 The Georgia Community Greenspace Program .................................................... 9-7 Metropolitan North Georgia Water Planning District .............................................. 9-8 The District-wide Watershed Management Plan .................................................... 9-8 The Long-term Wastewater Management Plan ..................................................... 9-9 The Water Supply and Water Conservation Management Plan ..................... 9-10 Big Creek Watershed Study Master Plan ....................................................... 9-12 Watershed Assessment and Management Document ...................................... 9-13 Transportation Requirements for Non-Attainment Areas .................................... 9-14INTERGOVERNMENTAL COORDINATION GOALS .................................................. 9-17 Intergovernmental Goals Related to Coordination .......................................... 9-17 Intergovernmental Goals Related to Transportation ..................................... 9-17 Intergovernmental Goals Related to Natural Resources ............................... 9-17
CHAPTER 10 IMPLEMENTATION PROGRAM INTRODUCTION ............................................................................................................. 10-1COMMUNITY VISION ................................................................................................... 10-1 Forsyth County Vision ........................................................................................ 10-1 Subarea Visions .................................................................................................. 10-1LONG-RANGE OBJECTIVES AND SHORT-RANGE ACTION ITEMS ....................... 10-4 Housing ............................................................................................................... 10-4 Economic Development ...................................................................................... 10-5 Natural and Cultural Resources ......................................................................... 10-5 Community Facilities and Services .................................................................. 10-6 Land Use .................................................................................................. 10-7SHORT TERM WORK PROGRAM ......................................................................... 10-8

FORSYTH COUNTY COMPREHENSIVE PLAN vi
CHAPTER 11 CAPITAL IMPROVEMENTS ELEMENTINTRODUCTION ............................................................................................................ 11-1 Public Safety ....................................................................................................... 11-2 Parks And Recreation ........................................................................................... 11-4 Libraries ................................................................................................................ 11-5GROWTH OF FORSYTH COUNTY .............................................................................. 11-6 Population ............................................................................................................ 11-6 Employment ......................................................................................................... 11-8 Non-residential Land Use ................................................................................... 11-9 Future Land Uses ............................................................................................. 11-9PUBLIC SAFETY OPTIONS .................................................................................... 11-10PUBLIC SAFETY - WITHOUT NEW DETENTION FACILITY ....................................... 11-10 Level Of Service - Sheriff ..................................................................................... 11-10 Level Of Service - Fire & Rescue .................................................................. 11-11 Public Safety Capital Improvement Program .................................................... 11-12PUBIC SAFETY – WITH NEW DETENTION FACILITY ........................................... 11-15 Level of Service - Sherriff ................................................................................. 11-15 Level Of Service - Fire & Rescue ................................................................... 11-17 Public Safety Capital Improvement Program With Detention Facility ................ 11-17PARKS AND RECREATION ......................................................................................... 11-20 Level of Service ............................................................................................... 11-20 Park & Recreation Capital Improvement Program ....................................... 11-20PUBLIC LIBRARIES .................................................................................................... 11-22 Level of Service ................................................................................................ 11-22 Public Library Capital Improvement Program .................................................... 11-24SERVICE AREAS .......................................................................................................... 11-25 Public Safety ..................................................................................................... 11-26 Parks & Recreation .......................................................................................... 11-27 Public Libraries ................................................................................................. 11-27APPENDICES Appendix A: Public Participation Program Appendix B: Greenspace Plan Appendix C: Sewer System Master Plan Appendix D: Subarea Land Use Reports Appendix E: Bike and Pedestrian Plan

FORSYTH COUNTY COMPREHENSIVE PLAN vii
LIST OF TABLES
TABLE 1.1: TOTAL POPULATION AND PERCENT CHANGE 1980 - 2000 .................................. 1-2
TABLE 1.2: TOTAL POPULATION AND CHANGE IN FORSYTH AND SURROUNDING COUNTIES 1980 TO 2000 .......................................................................................... 1-3
TABLE 1.3: PAST POPULATION TRENDS 1980-2000 CITY OF CUMMING AND FORSYTH COUNTY ..................................................................................................... 1-3
TABLE 1.4: FORSYTH COUNTY ANNUAL TOTAL POPULATION PROJECTIONS, 2001-2007 ........... 1-4
TABLE 1.5: FORSYTH COUNTY TOTAL POPULATION PROJECTIONS, 2005-2025 ......................... 1-4
TABLE 1.6: NUMBER OF HOUSEHOLDS AND AVERAGE HOUSEHOLD SIZE ............................... 1-7
TABLE 1.7: HISTORIC AGE DISTRIBUTION ................................................................................... 1-8
TABLE 1.8: PROJECTED AGE DISTRIBUTION ............................................................................... 1-9
TABLE 1.9 : RACIAL COMPOSITION OF FORSYTH COUNTY POPULATION 1980 TO 2000 ......... 1-9
TABLE 1.10: EDUCATIONAL ATTAINMENT OF ADULTS 25 YEARS AND OLDER ....................... 1-10
TABLE 1.11: EDUCATIONAL ATTAINMENT LEVELS OF PERSONS 25 YEARS OR OLDER IN FORSYTH, SURROUNDING COUNTIES AND STATE, YEAR 2000........................ 1-10
TABLE 1.12: FORSYTH COUNTY EDUCATION STATISTICS ........................................................... 1-11
TABLE 1.13: INCOME PER CAPITA AND MEAN HOUSEHOLD INCOME IN FORSYTH AND GEORGIA ....................................................................................................... 1-12
TABLE 1.14: DISTRIBUTION OF HOUSEHOLDS BY INCOME GROUP, 1980 - 2000 ............ 1-12
TABLE 2.1: HISTORIC AND CURRENT HOUSING TYPES .............................................................. 2-1
TABLE 2.2: AGE AND CONDITIONS OF HOUSING IN FORSYTH, THE REGION AND THE STATE, 1980 - 2000 ............................................................................................. 2-3
TABLE 2.3: OWNER AND RENTER OCCUPIED UNITS, FORSYTH, REGION AND STATE ............... 2-4
TABLE 2.4: MEDIAN PROPERTY VALUE AND MEDIAN RENT FORSYTH AND GEORGIA ........... 2-4

FORSYTH COUNTY COMPREHENSIVE PLAN viii FORSYTH COUNTY COMPREHENSIVE PLAN ix
TABLE 2.5: MONTHLY OWNER COSTS AS A PERCENTAGE OF HOUSEHOLD INCOME IN 1999, FORSYTH COUNTY ...................................................................................... 2-5
TABLE 2.6: GROSS RENT AS A PERCENTAGE OF HOUSEHOLD INCOME IN 1999, FORSYTH COUNTY .................................................................................................................... 2-6
TABLE 2.7: GROSS RENT AS A PERCENTAGE OF HOUSEHOLD INCOME IN 1999 BYHOUSING TYPE FORSYTH COUNTY ...................................................................... 2-6
TABLE 2.8: OVERCROWDED HOUSING UNITS ............................................................................. 2-6
TABLE 2.9: FORSYTH COUNTY PROJECTED DWELLING UNITS TO 2025 ..................................... 2-7
TABLE 3.1: EMPLOYMENT BY SECTOR IN FORSYTH COUNTY .................................................... 3-2
TABLE 3.2: PERCENT EMPLOYMENT BY SECTOR FORSYTH AND GEORGIA .............................. 3-3
TABLE 3.3: EARNINGS BY SECTOR IN FORSYTH COUNTY ......................................................... 3-4
TABLE 3.4: PERCENT EARNINGS FORSYTH AND GEORGIA ........................................................ 3-5
TABLE 3.5: FORSYTH AVERAGE WEEKLY WAGES ...................................................................... 3-6
TABLE 3.6: LEVEL OF INCOME EARNED , FORSYTH COUNTY AND GEORGIA ......................... 3-7
TABLE 3.7: PERCENTAGE OF INCOME EARNED, FORSYTH COUNTY AND GEORGIA ............... 3-8
TABLE 3.8: EMPLOYMENT BY OCCUPATION IN FORSYTH, GEORGIA AND THE US .................. 3-9
TABLE 3.9: LABOR FORCE PARTICIPATION ............................................................................... 3-10
TABLE 3.10: UNEMPLOYMENT PERCENTAGES FOR FORSYTH, SURROUNDING COUNTIES, GEORGIA AND THE U.S. .......................................................................................... 3-11
TABLE 3.11 : LABOR FORCE BY PLACE OF WORK ...................................................................... 3-12
TABLE 4.1: PROTECTED SPECIES OF FORSYTH COUNTY .............................................................. 4-4
TABLE 4.2: U.S. ARMY CORPS OF ENGINEERS PARKS AND ACCESS POINTS ON LAKE LANIER IN FORSYTH COUNTY ................................................................................... 4-5
TABLE 6.1: SUMMARY OF EXISTING WASTEWATER TREATMENT AGREEMENTS ........................ 6-6
TABLE 6.2: PRIVATELY OWNED TREATMENT SYSTEMS SERVING RESIDENTS .............................. 6-6
TABLE 6.3: WASTE TRANSPORT COMPANIES ........................................................................... 6-11
TABLE 6.4: SCHOOL CAPACITY ................................................................................................ 6-29

FORSYTH COUNTY COMPREHENSIVE PLAN viii FORSYTH COUNTY COMPREHENSIVE PLAN ix
TABLE 7.1 FORSYTH COUNTY EXISTING LAND USE: 2003 ......................................................... 7-3
TABLE 7.2: FUTURE EMPLOYMENT LAND REQUIREMENTS IN FORSYTH COUNTY, 2005-2025 .... 7-11
TABLE 7.3: TOTAL NEW LAND USE REQUIREMENTS, 2000-2025 ............................................. 7-11
TABLE 7.4: FORSYTH COUNTY FUTURE LAND USE: 2025 ....................................................... 7-13
TABLE 8.1 ROADWAY FUNCTIONAL CLASSIFICATION TABLE .............................................. 8-3
TABLE 8.2: BRIDGE INVENTORY ............................................................................................... 8-17
TABLE 8.3: STIP IMPROVEMENTS FOR FORSYTH COUNTY 2003 - 2005 ................................. 8-20
TABLE 8.4: DRAFT STIP IMPROVEMENTS FOR FORSYTH COUNTY 2004 - 2006 .......................... 8-21
TABLE 8.5: LEVEL OF SERVICE VOLUMES .................................................................................. 8-25
TABLE 8.6: DEFICIENT ROAD SEGMENTS (LOS “E” OR LOS “F’) BY THE YEAR 2005 ..................... 8-26
TABLE 8.7: DEFICIENT ROAD SEGMENTS (LOS “E” OR LOS “F’) BY THE YEAR 2010 ..................... 8-26
TABLE 8.8: DEFICIENT ROAD SEGMENTS (LOS “E” OR LOS “F’) BY THE YEAR 2020 ................. 8-27
TABLE 10.1: FORSYTH COUNTY SHORT TERM WORK PROGRAM 2004 - 2008 ................ 10-9
TABLE 11.1: FORSYTH COUNTY POPULATION 1980 – 2025 ................................................... 11-6
TABLE 11.2: POPULATION, HOUSEHOLDS AND HOUSING 1990 – 2025 ............................. 11-7
TABLE 11.3: EMPLOYMENT PROJECTIONS 2000 – 2025 ........................................................... 11-8
TABLE 11.4: PROJECTED EMPLOYMENT GROWTH BY INDUSTRY 2000 – 2025 .......................... 11-8
TABLE 11.5: PROJECTED NON-RESIDENTIAL DEVELOPMENT 2000 – 2025 .................................... 11-9
TABLE 11.6: LAND USE ASSUMPTIONS 2000 – 2025 ................................................................. 11-9
TABLE 11.7: SHERIFF’S LEVEL OF SERVICE ........................................................................ 11-10
TABLE 11.8: FIRE LEVEL OF SERVICE ..................................................................................... 11-11
TABLE 11.9: EMERGENCY 911 LEVEL OF SERVICE ................................................................ 11-12
TABLE 11.10: PUBLIC SAFETY IMPROVEMENT PROGRAM ...................................................... 11-13
TABLE 11.11: PUBLIC SAFETY COST ASSIGNMENT ................................................................ 11-14
TABLE 11.12: PUBLIC SAFETY GROWTH COSTS ...................................................................... 11-15
TABLE 11.13 SHERRIFF’S LEVEL OF SERVICE WITH DETENTION FACILITY .................................. 11-16

FORSYTH COUNTY COMPREHENSIVE PLAN x
TABLE 11.14: PUBLIC SAFETY CAPITAL IMPROVEMENT PROGRAM .................................... 11-18
TABLE 11.14: PUBLIC SAFETY CAPITAL IMPROVEMENT PROGRAM CON’T .......................... 11-19
TABLE 11.15: PUBLIC SAFETY COST ASSIGNMENT WITH DETENTION FACILITY .................... 11-19
TABLE 11.16: PUBLIC SAFETY GROWTH COSTS INCLUDING DETENTION FACILITY ................ 11-20
TABLE 11.17: PARK AND RECREATION LEVEL OF SERVICE ...................................................... 11-20
TABLE 11.18: PARKS AND RECREATION IMPROVEMENT PROGRAM ..................................... 11-21
TABLE 11.19: PARK AND RECREATION CAPITAL REVENUES ................................................. 11-23
TABLE 11.20: LIBRARY LEVEL OF SERVICE ............................................................................ 11-24
TABLE 11.21: PUBLIC LIBRARY IMPROVEMENT PROGRAM ..................................................... 11-25
TABLE 11.22: LIBRARY CAPITAL REVENUES .......................................................................... 11-25

FORSYTH COUNTY COMPREHENSIVE PLAN xi
LIST OF FIGURES
FIGURE 1.1: GROWTH RATE COMPARISON OF FORSYTH, SURROUNDING COUNTIES AND GEORGIA ................................................................................................................. 1-2
FIGURE 1.2: POPULATION PROJECTIONS METHODOLOGY ...................................................... 1-4
FIGURE 1.3: POPULATION DENSITY BY YEAR 2000 CENSUS BLOCKGROUP ............................. 1-6
FIGURE 1.4: COMPARISON OF EDUCATIONAL ATTAINMENT LEVELS OF PERSONS 25 YEARS, 2000 ....................................................................................................... 1-9
FIGURE 4.1: STEEP SLOPES OF FORSYTH COUNTY ..................................................................... 4-6
FIGURE 4.2: PRIME AGRICULTURAL LAND OF FORSYTH COUNTY ............................................. 4-7
FIGURE 4.3: WATER SUPPLY WATERSHEDS OF FORSYTH COUNTY ........................................... 4-12
FIGURE 4.4: WETLANDS OF FORSYTH COUNTY ....................................................................... 4-13
FIGURE 4.5: FLOOD PLAINS OF FORSYTH COUNTY ............................................................. 4-14
FIGURE 4.6: FORSYTH COUNTY GROUND WATER RECHARGE AREAS .................................... 4-15
FIGURE 4.7: FORSYTH COUNTY PROTECTED RIVER CORRIDORS .......................................... 4-17
FIGURE 4.8: ETOWAH RIVER CORRIDOR PROTECTION PLAN ................................................. 4-18
FIGURE 4.9: NATURAL RESOURCES OF FORSYTH COUNTY..................................................... 4-22
FIGURE 5.1: FORSYTH COUNTY HISTORICAL RESOURCES ......................................................... 5-6
FIGURE 6.1: WATER AND SEWER SERVICE AREA FOR FORSYTH COUNTY .......................... 6-3
FIGURE 6.2: RECOMMENDED SEWER SERVICE PLAN (ALTERNATIVE 10) .................................. 6-9
FIGURE 6.3: LANDFILL AND RECYCLING SITES ......................................................................... 6-12
FIGURE 6.4: FORSYTH COUNTY FIRE STATIONS AND EMS .............................................................. 6-17
FIGURE 6.5: FORSYTH COUNTY PARKS ....................................................................................... 6-22
FIGURE 6.6: FORSYTH COUNTY CURRENT AND FUTURE SCHOOL SITES ................................. 6-28
FIGURE 7.1 SUBAREA LOCATIONS ............................................................................................ 7-2
FIGURE 7.2 EXISTING LAND USE ................................................................................................ 7-4

FORSYTH COUNTY COMPREHENSIVE PLAN xii
FIGURE 7.3: FORSYTH COUNTY FUTURE LAND USE: 2025 ............................................................... 7-17
FIGURE 8.1: FUNCTIONAL CLASSIFICATION SYSTEM .................................................................. 8-7
FIGURE 8.2: 2000 ANNUAL AVERAGE DAILY TRAFFIC (AADT) - BASE YEAR .................................... 8-8
FIGURE 8.3: EXISTING HIGHWAY POSTED SPEED LIMITS .......................................................... 8-9
FIGURE 8.4: EXISTING ROADWAY LANE CONFIGURATION ....................................................... 8-10
FIGURE 8.4: RECOMMENDED ROAD IMPROVEMENTS (2005) ................................................... 8-28
FIGURE 8.5: RECOMMENDED ROAD IMPROVEMENTS (2010) ............................................... 8-29
FIGURE 8.6: RECOMMENDED ROAD IMPROVEMENTS (2020) .............................................. 8-30FIGURE 11.1 POPULATION TO 2025 FORSYTH COUNTY AND CUMMING ....................... 11-7


FORSYTH COUNTY COMPREHENSIVE PLAN 1-1
CHAPTER 1POPULATION ELEMENT
INTRODUCTION
Examining the historic, current and future changes of population in Forsyth County provides the opportunity to inventory and assess trends in growth and demographic characteristics. When combined with the physical opportunities and constraints for future growth found in the natural and historical resources elements, projections can then be made concerning housing, employment opportunities and community facilities needed to support the existing and future population. From these findings, the county vision and land use patterns can be designed to reflect the goals and policies established by the community. This element of the Forsyth County Comprehensive Plan inventories and analyzes past trends, present status, and projected future growth patterns of the population. Breakdowns in composition and characteristics are discussed, and implications for future development are considered.
INVENTORY AND ASSESSMENT
Total PopulationForsyth County experienced periods of both population increase and decrease during the six decades between 1920 and 1980. Prior to 1920, cotton was the main crop grown in the county, and the cotton crash of the 1920s was responsible for the 9.6 percent decrease in population which took place that decade. During the Depression of the 1930s, Forsyth County’s population was boosted by a general exodus from urban centers to rural counties due to the great reductions in urban job opportunities and the appeal of the agrarian economy. The decade of the 1940s and World War II caused a slight drain in the county’s population. Wartime relocations, defense industry job opportunities in large cities, and the rapid urbanization of metropolitan Atlanta caused a general population decrease in many rural Georgia counties.
During the 1950s, there was a gradual rise in the population, followed by greatly accelerated growth during the 1960s and 1970s. The growth factors which contributed to this increase include: improved transportation, the location of industries in the county, and the creation of Lake Lanier. During this twenty year period, Forsyth County began an urbanization process which has steadily gained momentum. Between 1970 and 1980 there was a 65.2% increase in population, and the county was ranked as one of the top nine growth counties in Georgia for the decade. The trend in housing construction shifted from vacation cottages to permanent residences countywide.
Although the demand for the natural features of Lake Lanier was an important influence fostering growth in Forsyth County during the 1980s, the expansion of Atlanta northward became the predominant growth factor. With its 1980 population total of 27,958, the density (persons per square mile) in Forsyth County was 123, which exceeded the State’s total density

FORSYTH COUNTY COMPREHENSIVE PLAN 1-2 FORSYTH COUNTY COMPREHENSIVE PLAN 1-3
P O P U L A T I O N
of 93. This was the first time that the county density surpassed the State total in this century, emphasizing the significance of the county’s progression. The rapid pace of growth continued to increase throughout the next twenty years. Table 1.1 indicates that from 1980 to 1990 there was a 57.7% increase in the county’s population, three times the State average. The 1990s brought about an even higher intensity of growth as accessibility provided by State Route 400 made it feasible to commute to metropolitan Atlanta from all areas in the county. It was during this decade that Forsyth surpassed the adjacent countys’ increase percentages, represented in Figure 1.1. Forsyth County experienced a 123% change over the decade, while Gwinnett’s population increased 66% and Cherokee by 57%. Despite the high numbers in growth, Table 1.2 shows that Forsyth County continues to be lower in population than many of these other fast growing counties. In 2000, Forsyth County’s population was 490,041 less than Gwinnett’s. Even with Forsyth County’s increase of 54,324 residents over the last decade, the county still had a population of only 98,407. Of this number, 95.7% of the county’s population were living in the unincorporated parts of the county, as indicated in Table 1.3.
FIGURE 1.1: GROWTH RATE COMPARISON OF FORSYTH, SURROUNDING COUNTIES AND GEORGIA
TABLE 1.1: TOTAL POPULATION AND PERCENT CHANGE 1980 - 2000 FORSYTH COUNTY AND GEORGIA
1980 1985 1980-1990 1990 1995 1990-2000 2000
Jurisdiction Population % Change Population % Change Population
Forsyth 27,958 33,780 57.7 44,083 59,300 123.2 98,407
Georgia 5,463,105 5,962,720 18.6 6,478,216 7,323,980 26.4 8,229,820
Source: Woods and Pool Economics, Inc..

FORSYTH COUNTY COMPREHENSIVE PLAN 1-2 FORSYTH COUNTY COMPREHENSIVE PLAN 1-3
P O P U L A T I O N
TABLE 1.3: PAST POPULATION TRENDS1980-2000 CITY OF CUMMING AND FORSYTH COUNTY
Jurisdiction 1980 Percent 1990 Percent 2000 Percent
City of Cumming 2,059 7.4% 2,828 6.4% 4,220 4.3%
Unincorporated County 25,899 92.6% 41,255 93.6% 94,187 95.7%
Total Forsyth County 27,958 100% 44,083 100% 98,407 100%
Source: U.S. Bureau of the Census.
The fast growth trend of the county continues into the new century. In 2001, the U.S. Census Bureau declared Forsyth County the fastest-growing county in Georgia and the second-fastest in the United States .
Population projections are shown in Table 1.4 and 1.5. From the year 2000 to 2025, Forsyth County is expected to add 129,412 new residents to its population, reaching a total of 227,819 residents by 2025. This continued increase is fueled by the quantity of developable land and the proximity to many of north Georgia’s assets. Figure 1.2 illustrates the assumptions used in determining these population projections. These factors include birth and death rates, persons per household, new housing units, vacancy rates, birth rates, death rates, and the county and city population distribution.
As Figure 1.3 indicates, the highest population densities of the county are in the south end of the county with additional buildup near the City of Cumming and along Lake Lanier.
TABLE 1.2: TOTAL POPULATION AND CHANGE IN FORSYTH AND SURROUNDING COUNTIES 1980 to 2000
County 1980 1990 2000 Total Change
Cherokee 51,697 90,206 141,903 90,206
Dawson 4,774 9,429 15,999 11,225
Forsyth 27,959 44,082 98,407 70,448
Fulton 589,922 648,949 816,006 226,084
Gwinnett 166,889 352,910 588,448 421,559
Hall 75,409 95,427 139,277 63,868
Source: U.S. Bureau of the Census

FORSYTH COUNTY COMPREHENSIVE PLAN 1-4 FORSYTH COUNTY COMPREHENSIVE PLAN 1-5
P O P U L A T I O N
TABLE 1.5: FORSYTH COUNTY TOTAL POPULATION PROJECTIONS, 2005-2025
Jurisdiction 2005 2010 2015 2020 2025
Forsyth County 131,569 160,219 185,019 206,419 227,819
Source: Jerry Weitz & Associates, Inc. 2002.
TABLE 1.4: FORSYTH COUNTY ANNUAL TOTAL POPULATION PROJECTIONS, 2001-2007
Jurisdiction 2001 2002 2003 2004 2005 2006 2007
Forsyth County 106,096 112,627 119,158 125,689 131,569 137,449 143,329
Source: Jerry Weitz & Associates, Inc. 2002.
Daytime PopulationThe daytime population of Forsyth County is affected by its employment centers and Lake Lanier. Although a large percentage of the county’s residents commute outside the county for their jobs, the county is also gaining reverse commuters. According to the 2000 census data, 21,470 workers enter Forsyth County from the surrounding areas each day. This represents half of the county’s workforce. In the summer months, recreational opportunities on Lake Lanier attracts seasonal daytime visitors to the county.

FORSYTH COUNTY COMPREHENSIVE PLAN 1-4 FORSYTH COUNTY COMPREHENSIVE PLAN 1-5
P O P U L A T I O N
FIGURE 1.2: POPULATION PROJECTIONS METHODOLOGY
The cohort component method of population projections, where future population is a result of natural increase (births minus deaths) plus migration, was used. The following assumptions were used in the projections:
a) Persons per householdYear
1980 1990 2000-2001
2002-2004
2005-2009
2010-2014
2015-2019
2020-2024
Persons Per Household 2.97 2.75 2.83 2.75 2.75 2.70 2.65 2.65
b) New Housing Units per YearYear 1980-
19901990-2000
2000-2001
2002-2004
2005-2009
2010-2014
2015-2019
2020-2024
New Units Per
Year690/year
1,863/year
2,860/year
2,500/year
2,250/year
2,000/year
1,700/year
1,700/year
c) Vacancy Rate = 5% of all units annually
d) Birth Rate = Rate per 1,000 total population annuallyYear 1997-
19992000-2001
2002-2004
2005-2009
2010-2014
2015-2019
2020-2024
Birth Rate per 1000 population 18.7% 18.0% 17.5% 17.0% 17.0% 16.5% 16.5%
Note: 1999 State of Georgia birth rate is 16.3% per 1,000
e) Death Rate = Rate per 1,000 total population annuallyYear 1997-
19992000-2001
2002-2004
2005-2009
2010-2014
2015-2019
2020-2024
Death Rate per 1000 population 5.3% 5.4% 6.0% 6.3% 6.3% 6.5% 6.5%
Note: 1990-1998 State of Georgia death rate is 8.0% per 1,000
f) Forsyth County and City of Cumming Population Distribution
Jurisdiction 1980 % 1990 % 2000 % 2002-2009
2010-2014
2015-2019
2020-2024
City of Cumming 2,059 7.4 2,828 6.4 4,220 4.3 4.0 3.5 3.5 3.5
Unincorporated County 25,899 92.6 41,255 93.6 94,187 95.7 96.0 96.5 96.5 97.0
Total Forsyth County 27,958 100 44,083 100 98,407 100 100 100 100 100
Prepared by: Jerry Weitz & Associates, Inc. 2002.

FORSYTH COUNTY COMPREHENSIVE PLAN 1-6 FORSYTH COUNTY COMPREHENSIVE PLAN 1-7
P O P U L A T I O N
FIGURE 1.3 FORSYTH COUNTY POPULATION DENSITY BY YEAR 2000 CENSUS BLOCKGROUP

FORSYTH COUNTY COMPREHENSIVE PLAN 1-6 FORSYTH COUNTY COMPREHENSIVE PLAN 1-7
P O P U L A T I O N
HouseholdsA household can be defined as a group of people, who may or may not be related, occupy-ing a single housing unit. The number of households in Forsyth County is increasing due to net population increases and declining household size. In 1980, there were a total of 9,470 households in Forsyth County. In 2000, the number households had increased to 35,040. By the year 2025, it is projected that there will be 85,281 households in the county. Table 1.6 lists the past and future projections for the average household size. The average household size has fallen from 2.96 persons per household in 1980, to 2.83 in 2000. Forsyth County will continue to follow the State trend of decreasing household size over the next twenty years, with an average household size of 2.65 by 2025. This is still higher than the State average of 2.63 and U.S. average of 2.58, but indicates there will be an increase in the proportion of individuals and smaller family units living in the county.
It is anticipated that the rate of growth in housing units should meet the future demands of the population. Some of the new housing stock will consist of redevelopment and infill of existing developed areas. There will also be a demand for the conversion of rural areas to suburban development.
TABLE 1.6: FORSYTH COUNTY NUMBER OF HOUSEHOLDS AND AVERAGE HOUSEHOLD SIZE
Year # of Households Household Size
1980 9,470 2.961985 12,421 2.711990 16,034 2.771995 21,605 2.722000 35,040 2.832005 47,460 2.752010 57,795 2.752015 67,977 2.702020 77,270 2.65
2025 85,281 2.65 Source: Jerry Weitz & Associates, Inc. 2002.
Age DistributionThe age distribution figures in Table 1.7 on the following page, indicates the age distribution in Forsyth County is changing. The largest percentage of the population was the 10 to 14 year old category in 1980 with 9.3% of the residents in that category. By 2000, the largest percentage had shifted to 35 to 39 years of age. As the general population continues to age, the percentage of 30 to 39 year olds is expected to decrease, and the 60 years and older to increase. By 2025, it is projected that the largest segment of the population will be 65 and older, as indicated in Table 1.8. The aging of Forsyth County will have an impact on the types of housing and community facilities needed in the county. Smaller homes designed

FORSYTH COUNTY COMPREHENSIVE PLAN 1-8 FORSYTH COUNTY COMPREHENSIVE PLAN 1-9
P O P U L A T I O N
Age Group 1980 1980 % 1990 1990 % 2000 2000 %0 to 4 2,148 7.7 3,377 7.7 9,366 9.55 to 9 2,499 8.9 3,129 7.1 7,977 8.1
10 to 14 2,603 9.3 2,974 6.8 6,734 6.815 to 19 2,493 8.9 3,132 7.1 5,232 5.320 to 24 2,268 8.1 3,099 7 4,171 4.225 to 29 2,362 8.5 3,915 8.9 6,583 6.730 to 34 2,412 8.6 4,262 9.7 9,940 10.135 to 39 2,047 7.3 3,920 8.9 11,012 11.240 to 44 1,705 6.1 3,578 8.1 9,002 9.145 to 49 1,407 5 2,947 6.7 6,958 7.150 to 54 1,328 4.8 2,314 5.2 6,318 6.455 to 59 1,208 4.3 1,892 4.3 4,850 4.960 to 64 1,125 4 1,623 3.7 3,324 3.4
65 + 2,353 8.5 3,921 8.8 6,940 7.1TOTAL 27,958 100 44,083 100 98,407 100
Sources: Compiled from 1980 and 1990 data in Forsyth County Comprehensive Plan, 1994, Table 2.5. 2000 data from www.gadata.org/information_services/sf3ageandsex.htm and from printouts http://factfinder.census.gov*Extrapolated 75-79, 80-84 and 85+ based on U.S. Census data.
TABLE 1.7: HISTORIC AGE DISTRIBUTION
with low maintenance features will increase in popularity, and recreational needs will shift from active sports to more passive forms of exercise. The demand for alternative modes of transportation will also rise. Also, an increase in health-care facilities and associated services should be expected.
Despite the shift in age distribution, the number of school age children will continue to grow. In 2025, it is estimated there will be 47,088 school age children in the county, more than double the amount enrolled in 2000. This will continue the demand for additional classrooms throughout the community.
Racial CompositionIn 1980, there were 170 non-white residents in Forsyth County, as indicated in Table 1.9. By the year 2000, the non-white population had increased to 4,876, or 4.9% of the total population. The black population has shown the largest percent change of 4785.7% from 1990 to 2000. The Hispanic population (regardless of race), has increased by 762.5 percent from 1990 to 2000.
In the future, the non-white population is expected to increase at a faster pace than the white population. The Hispanic population is also expected to continue to expand. However, due to the overall increase of the total population, the percentage of these minority populations is expected to remain low. It is not anticipated that this low percentage of the population should require any special programs.

FORSYTH COUNTY COMPREHENSIVE PLAN 1-8 FORSYTH COUNTY COMPREHENSIVE PLAN 1-9
P O P U L A T I O N
Age Group 2005 2005
% 2010 2010% 2015 2015
% 2020 2020% 2025 2025
%0 to 4 10,634 8.1 12,353 7.7 14,166 7.7 15,710 7.6 17,365 7.6
5 to 9 10,482 8 11,970 7.5 13,432 7.3 14,847 7.2 16,345 7.2
10 to 14 9,879 7.5 11,969 7.5 13,333 7.2 14,465 7 15,728 6.9
15 to 19 7,855 6 10,432 6.5 12,314 6.7 13,751 6.7 15,015 6.6
20 to 24 6,372 4.8 8,722 5.4 10,871 5.9 12,574 6.1 14,021 6.2
25 to 29 7,546 5.7 8,881 5.5 10,465 5.7 12,117 5.9 13,670 6
30 to 34 9,854 7.5 10,284 6.4 11,022 6 12,025 5.8 13,368 5.9
35 to 39 12,652 9.6 12,748 8 12,691 6.9 12,874 6.2 13,637 6
40 to 44 13,299 10.1 14,655 9.1 14,621 7.9 14,275 6.9 14,385 6.3
45 to 49 11,252 8.6 14,146 8.8 15,164 8.2 15,139 7.3 14,990 6.6
50 to 54 9,291 7.1 12,584 7.9 14,701 7.9 15,466 7.5 15,568 6.8
55 to 59 7,347 5.6 10,061 6.3 12,669 6.8 14,333 6.9 15,104 6.6
60 to 64 5,574 4.2 7,904 4.9 10,370 5.6 12,487 6 13,930 6.1
65+ 9,532 7.2 13,510 8.4 19,202 10.4 26,355 12.8 34,693 15.2
TOTAL 131,569 100 160,219 100 185,019 100 206,419 100 227,819 100
Source: Jerry Weitz & Associates, Inc. 2002.
TABLE 1.8: PROJECTED AGE DISTRIBUTION
1980 1990 2000
Population % of Total Population % of
Total%
Change Population % of Total
% Change
TOTAL Population 27,959 NA 44,082 NA NA 98,407 NA NA
White 27,789 99.4 43,573 98.9 56.8 93,531 95.1 114.7
Black 1 0.0 14 0.03 1300.0 684 0.70 4785.7
Native American 127 0.45 98 0.22 -22.8 247 0.25 152.0
Asian or Pacific Islander 12 0.04 81 0.18 575.0 798 0.81 885.2
Other 24 0.09 317 0.72 1220.8 2,236 2.8 605.4
Two or More Races NA NA NA NA NA 911 0.93 NA
Persons of Hispanic Origin (regardless of race)
138 0.49 635 1.4 360.1 5,477 5.6 762.5
Source: U.S. Bureau of the Census
TABLE 1.9 : RACIAL COMPOSITION OF FORSYTH COUNTY POPULATION 1980 TO 2000

FORSYTH COUNTY COMPREHENSIVE PLAN 1-10 FORSYTH COUNTY COMPREHENSIVE PLAN 1-11
P O P U L A T I O N
Education Forsyth Cherokee Dawson Fulton Gwinnett Hall Georgia% Not Completing High School
14.3 15.6 20.5 16 12.7 29.5 21.4
% High School Graduates (including GED)
23.5 27.3 33.2 19.4 22 29.6 28.7
% Some College and/or Associate Degree
21.6 23.7 22.8 18.5 23.9 17.9 20.4
% Bachelor’s Degree or Higher
34.6 27 18.1 41.4 34.1 18.7 24.3
Source: U.S. Bureau of the Census
TABLE 1.11: EDUCATIONAL ATTAINMENT LEVELS OF PERSONS 25 YEARS OR OLDER IN FORSYTH, SURROUNDING COUNTIES AND STATE, YEAR 2000
Category 1990 2000TOTAL Adult Population 25 & Over 28,374 65,027Less than 9th Grade 3,737 3,6179th to 12th Grade (No Diploma) 5,462 5,669High School Graduate (Includes GED) 8,697 15,272Some College (No Degree) 4,676 9,807Associate Degree 1,389 3,917
Bachelor’s Degree 3,159 16,950Graduate or Professional Degree 1,255 5,540
Source: U.S. Bureau of the Census
TABLE 1.10: EDUCATIONAL ATTAINMENT OF ADULTS 25 YEARS AND OLDER IN FORSYTH COUNTY
Educational AttainmentThe educational attainment level of a population can be an indicator of the types of businesses and industries that are appropriate for a community. In the year 2000, 15,272 of Forsyth County residents over 25 years of age had reached high school graduation, while 16,950 held a bachelor’s degree and 5,540 achieved a graduate or professional degree (Table 1.10). In comparison, Table 1.11 and Figure 1.4 indicates that Dawson, Cherokee and Hall had higher percentages of adults attaining high school diplomas only, and lower percentages of residents holding a bachelor’s degree or higher at 18.1%, 27% and 18.7% respectively. The same applies to the State, which has a high school graduation rate of 28.7%, and a bachelor’s degree or higher of 24.3%. As indicated in Table 1.12, the percentage of Forsyth County high school dropouts has been steadily decreasing from 7.7% in 1995, to 4.6% in 2001. The high school graduation test scores in Forsyth County have been consistently higher than the State averages. In 2001, Forsyth students were in the 74 percentile compared to the 65 percentile of the State. Forsyth County’s high level of educational attainment, above average test scores and relatively low dropout rate, indicates that businesses and industries requiring a skilled workforce should be encouraged to develop in this county.

FORSYTH COUNTY COMPREHENSIVE PLAN 1-10 FORSYTH COUNTY COMPREHENSIVE PLAN 1-11
P O P U L A T I O N
Category 1995 1996 1997 1998 1999 2000 2001H.S. Graduation Test Scores (All Components) 88% 85% 79% 79% 80% 84% 74%
H.S. Dropout Rate 7.7% 9.1% 6.2% 5.6% 5.2% 5.7% 4.6%Grads Attending Georgia Public Colleges 31.3% 35.6% 41.9% 41.1% 41.8% NA NA
Grads Attending Georgia Public Technical Schools 5.3% 4.8% 7.0% 4.8% 7.2% 6.4% NA
Source: Georgia Department of Education
FIGURE 1.4: COMPARISON OF EDUCATIONAL ATTAINMENT LEVELS OF PERSONS 25 YEARS OR OLDER IN FORSYTH, SURROUNDING COUNTIES AND GEORGIA, 2000
TABLE 1.12: FORSYTH COUNTY EDUCATION STATISTICS
Household IncomeTable 1.13 compares the per capita income between Forsyth and the State in 1996 dollars, and the mean household income in current dollars. Both the per capita income and the mean household income of Forsyth County continue to be higher than the State.
The distribution of households by income group is compared in Table 1.14. In 1980, the highest percentage of households in Forsyth County, at 16.73%, earned an income of $10,000 to $14,999 annually. This was a greater income amount than the State’s highest percentage of 14.64%, at $5,000 to $9,999. By 2000, the highest percentage of the households in Forsyth County, at 27.24%, earned $100,000 or more. This far exceeded the State’s highest income group of 12.74% at an annual income of $20,000 to $29,999. The high household income can be partially attributed to the rapid development of upscale housing subdivisions with amenity areas and golf courses. Close access to major transportation routes such as Georgia State Route 400 have also allowed skilled workers to commute to their jobs in other counties while enjoying the benefits of the county’s relatively rural feel.

FORSYTH COUNTY COMPREHENSIVE PLAN 1-12
Category 1980 1990 2000
TOTAL HouseholdsForsyth 100.00% 100.00% 100.00%
Georgia 100.00% 100.00% 100.00%
Income less than $5,000Forsyth 12.40% 4.85% NA
Georgia 16.20% 7.90% NA
Income $5,000 - $9,999Forsyth 14.64% 4.40% 4.32%
Georgia 17.10% 8.87% 10.13%
Income $10,000 - $14,999Forsyth 16.73% 6.58% 2.88%
Georgia 16.28% 8.62% 5.85%
Income $15,000 - $19,999Forsyth 15.84% 7.13% 3.26%
Georgia 14.19% 8.87% 5.91%
Income $20,000 - $29,999Forsyth 13.29% 15.27% 7.20%
Georgia 11.53% 17.13% 12.74%
Income $30,000 - $34,999Forsyth 8.70% 9.02% 3.89%
Georgia 8.23% 7.90% 6.22%
Income $35,000 - $39,999Forsyth 6.50% 7.59% 3.93%
Georgia 5.53% 6.77% 5.87%
Income $40,000 - $49,999Forsyth 4.17% 13.77% 8.46%
Georgia 3.36% 11.03% 10.85%
Income $50,000 - $59,999Forsyth 2.00% 10.15% 8.55%
Georgia 2.04% 7.61% 9.24%
Income $60,000 - $74,999Forsyth 1.44% 9.44% 12.70%
Georgia 1.47% 6.85% 10.48%
Income $75,000 - $99,999Forsyth 3.32% 6.61% 17.57%
Georgia 2.57% 4.63% 10.36%
Income $100,000 or moreForsyth 1.02% 5.23% 27.24%
Georgia 1.52% 3.81% 12.34%Source: U.S. Bureau of the Census
TABLE 1.14: DISTRIBUTION OF HOUSEHOLDS BY INCOME GROUP, 1980 - 2000
1980 1985 1990 1995 2000Income Per Capita (1996 $) Forsyth $15,895 $21,177 $21,858 $28,043 $31,484
Georgia $15,353 $18,512 $20,715 $22,287 $25,433Mean Household Income
(current $)Forsyth NA NA $41,876 $51,435 $56,104
Georgia NA NA $33,259 $35,692 $42,158 Source: U.S. Bureau of the Census
TABLE 1.13: INCOME PER CAPITA AND MEAN HOUSEHOLD INCOME IN FORSYTH AND GEORGIA

FORSYTH COUNTY COMPREHENSIVE PLAN 2-1
INTRODUCTION
The housing element provides Forsyth County the opportunity to inventory the existing housing stock and its condition, occupancy and affordability characteristics; to assess its adequacy and suitability for serving current and future population and economic development needs; to articulate community housing goals; and to formulate an associated implementation program for the adequate provision of housing for all sectors of the population.
Housing is an important part of Forsyth County’s land use and economy. The type, location, availability, affordability, and quality of housing will determine what kinds of neighborhoods are contained in Forsyth County. Dilapidated and deteriorated housing can depress entire neighborhoods, as well as provide a location for illegal activities and create conditions for rodent and vermin infestation. On the other hand, attractive, well-designed neighborhoods can foster strong communities and are an asset to the residents of Forsyth County.
Housing can also impact economic development. Commercial development generally follows rooftops, and major employers are concerned about having an available workforce, reasonably close to the job site. Construction of new housing, as well as improvement of existing units, create jobs and foster spending for construction materials and home furnishings. While the housing industry creates positive economic activity, those housing rooftops also represent new demands for government services. New residential development can exacerbate existing traffic, pollution, and water usage problems and creates additional costs to the local government for streets, sewer lines, schools and other infrastructure.
INVENTORY AND ASSESSMENT
Types of Housing UnitsData on the types of housing units provides a measure of the diversity of the housing stock and can provide insight to future community housing needs and goals. The current and historic number of single-family, multifamily, and manufactured dwellings are listed in Table 2.1.
Year Single-Family Multi-Family Manufactured Total# % # % # %
1980 8,299 75.7 407 3.7 2,263 20.6 10,969
1990 13,320 74.5 520 2.9 4,030 22.6 17,8702000 31,921 87.4 795 2.2 3,789 10.4 36,505
Source: U.S. Bureau of the Census
HOUSING ELEMENT CHAPTER 2
TABLE 2.1: HISTORIC AND CURRENT HOUSING TYPES

FORSYTH COUNTY COMPREHENSIVE PLAN 2-2 FORSYTH COUNTY COMPREHENSIVE PLAN 2-3
H O U S I N G
From 1980 to 2000, multifamily units have experienced a slight decline, from 3.7% to 2.2% of the total housing stock. The availability of multifamily units is an essential component of a diversified housing stock. The lack of a diversified housing stock can create challenges to the economic health of the community. One possible outcome is a housing supply that is inconsistent with the incomes of workers in the community. Forsyth County will need to continue to develop policy and procedures that will insure that all those who work in the community have a viable choice or option to live in the community.
Forsyth County has experienced a significant reduction in the number of manufactured dwelling units, as a percentage of the total housing stock. Manufactured dwelling units represented over 23% of the housing stock in 1990 and fell to 10% by the year 2000. A continued decline in the number of manufactured dwelling units, as a percentage of total dwelling units, is anticipated over the 20 year planning horizon. The continued suburbanization of Forsyth County, combined with development regulations requiring increased lot sizes for manufactured homes will be the primary cause of this shift in housing units.
Seasonal UnitsBeginning in the 1950s, the development around Lake Lanier consisted mainly of vacation cottages for seasonal lake users. Over the past two decades, there has been a shift in the growth to year-round housing units. Most of the cottages have also been converted into permanent residences. In 2000, the US Bureau of the Census identified a total of 828 housing units used for seasonal, recreational or occasional uses within the county. This number is too low to be a significant factor in the community.
Age And Condition Of HousingThe age and condition of housing in a community can be an important indicator of housing needs and can assist in identifying housing that requires special attention to continue to provide safe and decent shelter. Declining housing conditions can be an indication of unsafe and inadequate shelter for some residents.
Table 2.2 contains information on the age and condition of housing units in Forsyth County, the Georgia Mountains Regional Development Center’s region, and the State. In 1990, 3% of Forsyth’s housing stock was built prior to 1939. This same figure was 7.3% for the region and 8.0% for the State. In 2000, 1.5% of the housing stock in Forsyth County was built prior to 1939. Over this same period the region fell to 4.5% and the State fell to 5.9%. When compared to the region or the State, Forsyth County has a comparatively low number of housing units that were built prior to 1939.
The housing stock of Forsyth County is comparatively strong when examining the number of units lacking plumbing. In 1990 and 2000, the percentage of housing units in Forsyth County without plumbing was approximately half the number for the region and the State.
Based on the number of units built prior to 1939 and the percentage of units without plumbing, housing conditions in Forsyth County are steadily improving. There are no concentrated

FORSYTH COUNTY COMPREHENSIVE PLAN 2-2 FORSYTH COUNTY COMPREHENSIVE PLAN 2-3
H O U S I N G
1980 1990 2000
Forsyth Region State Forsyth Region State Forsyth Region State
Housing units built prior to 1939
1,013 13994 29,662 530 9800 212,294 545 8629 192,972
% of housing units built prior to 1939
NA NA NA 3.0% 7.3% 8.0% 1.5% 4.5% 5.9%
Housing units lacking plumbing
331 4120 35,769 102 1754 28,462 147 1450 29,540
% of housing units lacking plumbing
NA NA NA 0.6% 1.3% 1.1% 0.4% 0.8% 0.9%
Total housing units NA NA NA 17,870 133476 2,638,418 36,505 191432 3,281,737
Source: U.S. Bureau of the Census
TABLE 2.2: AGE AND CONDITIONS OF HOUSING IN FORSYTH, THE REGION AND THE STATE, 1980 - 2000
Owner And Renter Occupied UnitsForsyth County must contain the right mix of housing units in order to maintain economic vitality and attract and retain residents. In addition to ownership characteristics, an analysis of vacancy rates can help identify whether or not the community should encourage or discourage the development of various types of housing.
Information on owner occupied and renter occupied housing units are displayed in Table 2.3. Compared to the Georgia Mountains Regional Development Center’s region and the State, Forsyth County has experienced a low vacancy rate from renter occupied housing from 1990 to 2000. Since 1990, the owner to renter ratio of vacancy, for Forsyth County, has been much higher than the regional or state ratio. This information suggests Forsyth County lacks a diversified housing stock and likely has too few rental opportunities in the community. To address the lack of rental opportunities, future modifications to the development regulations should attempt to allow greater flexibility for rental units, when appropriate.
areas of substandard housing. However, the elimination of individual cases of substandard and dilapidated housing is an obstacle. The creation of a housing authority could help to address this issue and at the same time ensure that landlords are responsibly managing their property.

FORSYTH COUNTY COMPREHENSIVE PLAN 2-4 FORSYTH COUNTY COMPREHENSIVE PLAN 2-5
H O U S I N G
1980 1990 2000Forsyth Region State Forsyth Region State Forsyth Region State
Owner occupied
units7,807 64,763 1,215,206 13,052 86,057 1,536,759 30,436 130,235 2,029,293
Renter occupied
units1,588 19,705 654,548 2,886 26,512 829,856 4,129 36,052 977,076
Vacancy rate
- owner occupied
NA Na NA 4.0 2.3 2.4 2.2 2.5 2.2
Vacancy rate - renter occupied
Na NA NA 8.8 11.7 12.4 4.1 8.2 8.5
Owner to renter ratio of vacancy
NA NA NA 2.0 0.8 0.3 3.9 1.5 0.5
Source: U.S. Bureau of the Census
TABLE 2.3: OWNER AND RENTER OCCUPIED UNITS, FORSYTH, REGION AND STATE
Cost Of HousingThe cost of housing in a community should be compatible with the income of its residents. If affordable housing is not available in a community, many workers will be forced to live elsewhere and commute to their jobs. Conversely, if there is not an adequate supply of middle and upper-income housing, the future economic development potential of the community may be hindered.
Table 2.4 contains information on current and historic median property values and median rent for Forsyth County, the Georgia Mountains Regional Development Center’s region, the Atlanta Regional Commission Regional Development Center’s region, and the State. Due to Forsyth’s proximity to Atlanta, comparisons between median property values and median rents between Forsyth County and the Georgia Mountains Regional Development Center’s region can be misleading. Data for the Atlanta Regional Commission (ARC) has been added to this table to provide a better comparison for the cost of housing in Forsyth County.
1980 1990 2000Forsyth State Forsyth Region ARC State Forsyth Region ARC State
Median Property
Value$44,700 $23,100 $96,240 $68,848 $93,128 $71,278 $177,900 $114,583 $144,504 $100,600
Median Rent $141 $153 $402 $422 $422 $365 $558 $661 $661 $505
Source: U.S. Bureau of the Census
TABLE 2.4: MEDIAN PROPERTY VALUE AND MEDIAN RENT FORSYTH AND GEORGIA

FORSYTH COUNTY COMPREHENSIVE PLAN 2-4 FORSYTH COUNTY COMPREHENSIVE PLAN 2-5
H O U S I N G
Cost Burdened and Overcrowded HouseholdsThe U.S. Department of Housing and Urban Development (HUD) has determined that households should spend no more than 30% of their incomes on housing. Using definitions established by HUD, cost burden is calculated as gross housing costs, including utility costs, as a percentage of gross income. Households that pay more than 30% of their incomes on housing are considered to be cost burdened; households that pay more than 50% of their incomes are considered to be severely cost burdened. Cost burdened households will find it difficult to meet all their household’s needs; severely cost burdened households may be in danger of homelessness. By considering the number and characteristics of these households, the community can more easily develop a response to the need.
An analysis of the cost of housing compared to household income can provide valuable information on the availability of housing that is affordable to the workforce. Tables 2.5 and 2.6 provide a breakdown of cost burdened and severely cost burdened households for owner occupied and renter occupied housing units. In Forsyth County, renter occupied households are more likely to be cost burdened, or severely cost burdened, than owner occupied households. Over 78% of owner occupied households are not cost burdened and only 64% of renter occupied households fall into this same category. Specifically, within renter occupied households, 21.4% are cost burdened and 14.5% are severely cost burdened.
Table 2.7 provides information on the relationship of cost burdened and severely cost burdened households to the housing type. From this information, it is clear that housing affordability is a major problem in multi-family housing. Specifically, 43.8% of multi-family households fall into the cost burdened or severely cost burdened classifications.
Monthly Owner Costs as a Percentage of Household Income in 1999
Specified Owner-Occupied Housing Units % of Units
Less than 30% (not cost burdened) 20,639 78.830 to 49 percent (cost burdened) 3,656 14.050 percent or more (severely cost burdened) 1,883 7.2Total Specified Owner-Occupied Housing Units 26,178 100.0Median Monthly Owner Cost as a Percentage of Household Income in 1999 19.6 NA
Source: U.S. Bureau of Census, 2000 Census
TABLE 2.5: MONTHLY OWNER COSTS AS A PERCENTAGE OF HOUSEHOLD INCOME IN 1999, FORSYTH COUNTY (SPECIFIED OWNER-OCCUPIED HOUSING UNITS)
The continued suburbanization of Forsyth County has resulted in a significant increase in housing prices over the last 20 years. Outside of the continued expansion of Metro-Atlanta, there are no significant special circumstances that impact the cost of housing in Forsyth County. When compared to the ARC’s data, the cost of housing in Forsyth County is comparable. However, continued increases in the median property values will begin to put Forsyth County outside the average price range of the ARC’s region and will contribute to existing barriers that can prevent the county’s workforce from residing in the community.

FORSYTH COUNTY COMPREHENSIVE PLAN 2-6 FORSYTH COUNTY COMPREHENSIVE PLAN 2-7
H O U S I N G
Gross Rent as a percentage of Household Income in 1999
Specified Renter-Occupied Housing Units
% of Units
Less than 30 percent (not cost burdened) 2,247 64.130 to 49 Percent (cost burdened) 750 21.450 percent or more (severely cost burdened) 507 14.5Total Specified Renter-Occupied Housing Units 3504 100.0Median Gross Rent as a Percentage of Household Income in 1999
NA 23.5
Source: U.S. Census Bureau, 2000 Census, SF 3, Table H69 and H70
TABLE 2.6: GROSS RENT AS A PERCENTAGE OF HOUSEHOLD INCOME IN 1999, FORSYTH COUNTY (SPECIFIED RENTER-OCCUPIED HOUSING UNITS)
Gross Rent as a Percentage of Household Income in 1999
One Family Detached or Attached Multi-Family Mobile Home
Units% Burdened or Severely Burdened
Units% Burdened or Severely Burdened
Units% Burdened or Severely Burdened
30 percent or more (burdened or severely burdened)
597 15.1 301 43.8 359 30.1
Source: U.S. Census Bureau, 2000 Census
TABLE 2.7: GROSS RENT AS A PERCENTAGE OF HOUSEHOLD INCOME IN 1999 BY HOUSING TYPE FORSYTH COUNTY
Occupants Per RoomOwner Occupied Renter Occupied
Units % Units %
1.00 or Less 29,964 98.4 3,738 90.5
1.01 to 1.50 354 1.2 256 6.2
1.51 or more 146 0.4 145 3.5
Source: U.S. Census Bureau, 2000 Census
TABLE 2.8: OVERCROWDED HOUSING UNITS, FORSYTH COUNTY (SPECIFIED RENTER-OCCUPIED HOUSING UNITS)
Typically, units with more than one occupant per room are considered to be crowded. As Table 2.8 illustrates, overcrowding is not an issue with owner occupied housing units, as ninety-eight percent of the housing units have one occupant or less per room. In renter occupied units, six percent of the housing units are overcrowded and three and a half percent are severely overcrowded. This indicates that there is a need for increased rental availability and affordability within Forsyth County.

FORSYTH COUNTY COMPREHENSIVE PLAN 2-6 FORSYTH COUNTY COMPREHENSIVE PLAN 2-7
H O U S I N G Housing And Community CharacteristicsCertain aspects of the population and economy can have a direct impact on current and future housing needs. Information on characteristics of the population that relate to housing needs are included throughout the Comprehensive Plan. Specific areas include age; income; household size; average wages of jobs within the jurisdiction; and data on commuting patterns of the resident and nonresident workforce. Additionally, specific groups with special housing needs include elderly residents; the homeless; victims of domestic violence; migrant workers; persons with disabilities; persons with HIV/AIDS; and those recovering from substance abuse. These special housing needs are provided through a variety of groups. Existing housing for these groups is appropriate to the current and future needs and desires of the community.
Future Housing NeedsFuture housing demand to satisfy projected population growth is a critical component of the comprehensive plan. Housing development is typically market driven, but the market may not be providing the right types of housing for various sectors of the population (such as in-commuting workers) or the market may be straining the local government revenue stream by providing too much of a single type of housing. Table 2.9 contains the historic and projected number of dwelling units from 1990 to 2025. Based on projections in the population and economic development elements, Forsyth County will have to establish policy and procedures to ensure additional dwelling units include a greater level of diversity. The current housing stock lacks affordable housing units as well as renter occupied units.
Forsyth County’s land use patterns, zoning, subdivision ordinances, and infrastructure result in a challenging environment for the development of affordable, renter occupied housing units. Current improvements to the water and sewer system will provide additional opportunities to develop outside of the traditional large lot, single-family housing product. While this will allow a greater number of opportunities for affordable rental units, the county must be cautious of future development that would be poorly served by other infrastructure or make inefficient use of county infrastructure.
Year Dwelling Units1990 17,8692000 36,5052005 49,9572010 60,8372015 71,5542020 81,3362025 89,769
Source: Jerry Weitz & Associates, Inc. 2002.
TABLE 2.9: FORSYTH COUNTY PROJECTED DWELLING UNITS TO 2025 As the county’s population ages, there will
be an increased demand for housing that accommodates the associated change in lifestyle. One story dwellings with minimal outdoor maintenance requirements will likely become more desirable. Neighborhoods that provide close access to everyday goods and services will offer more opportunities to older residents who are no longer comfortable driving in traffic.

FORSYTH COUNTY COMPREHENSIVE PLAN 2-8
COMMUNITY GOALS
• Encourage residential development in locations that are accessible to services, employment, and existing infrastructure.
• Preserve the character of residential areas from encroaching nonresidential development.
• Examine the feasibility of a code enforcement program aimed at reducing dilapidated and substandard property.
• Promote residential development that fosters a sense of community and pedestrian mobility.
• Design quality and long-term value into residential development as a means of maintaining high standards, quality image, and property values.
• Achieve a balanced mix of dwelling types, sizes, and prices in order to meet the diverse needs of the community’s workforce and support desired commercial and industrial growth.
• Preserve existing neighborhoods as a source of affordable housing.• Take advantage of existing state and federal housing programs that address the
identified housing needs and goals of the community.• Consider modifying the development regulations to encourage mixed-income and
mixed-use neighborhoods.• Encourage the creation of housing within walking distance to employment and
commercial centers.• Consider developing policy that would encourage developers of large non-residential
projects to evaluate the need for affordable housing generated by persons to be employed in the proposed development. Developers of large non-residential projects that are determined to create a significant need for affordable housing not currently available within the community should be encouraged to supply moderate income housing.
• Consider amending the UDC to establish a voluntary, incentive-based “inclusionary” housing program where developers of new residential projects are encouraged to set aside a certain percent of the total units in the development for moderate income residents.
Chapter Ten, the Implementation Program, provides the overall strategy for the comprehensive plan implementation. The policy recommendations listed above are merged and coordinated with the policies of the other elements to form the implementation program. The associated Short-Term Work Program designates the actions the county will take in the next five years to achieve these goals. The list is not all-inclusive. There are some actions that may not be addressed due to time, budget and administrative constraints. These items will be included as part of the work program at some point over the twenty-year planning period.

FORSYTH COUNTY COMPREHENSIVE PLAN 3-1
CHAPTER 3ECONOMIC DEVELOPMENT ELEMENT
INTRODUCTION
This element provides the opportunity to inventory and assess Forsyth County’s economic base, labor force characteristics, and local economic development opportunities and resources; to determine economic needs and goals; and to merge this information with data collected in other elements to develop a strategy for the economic well-being of the community.
INVENTORY
Economic BaseForsyth County’s economic base refers to the industries or economic sectors that serve the community as well as those outside of the community. The main theme of economic base theory is that the economic growth of an area is dependent on outside demand. An area’s growth depends on its ability to export goods and services outside of its territorial boundaries. The economic base, or basic sector, is made up of the export industries of the community and the nonbasic, or local service sector, is made up of those industries that service the community’s residents and workers.
The economic base includes items such as employment and earnings rates, economic sectors, wage levels, unique local economic activities, and sources of income. Using this data, it is possible to assess the viability of the local economy and the adequacy of the economic development tools and programs in use.
Employment and EarningsThe total employment in each economic sector in Forsyth County has been identified from 1980 to the present and projected to the year 2025 in Table 3.1. Data for Forsyth County is compared with data for the State of Georgia in Table 3.2. The total number of persons employed in Forsyth County during 1980 was 7,815. By 2000, this number had jumped to 42,942. By 2025, it is expected to increase to 83,167.
Employment and earnings figures help to identify growing and declining job markets, as well as in assessing the types of wages being paid in those sectors. It is important to identify trends in these areas so that local economic developers can strive for a healthy, balanced economy and provide employment opportunities that pay well. Some highlights within Forsyth County include:
• Employment within the farming sector has experienced a steady decrease over the last twenty years. In 1980, the farming sector represented 13.59% of employment in Forsyth County. By 2000, employment within the farming sector had fallen to 1.45%. It is

FORSYTH COUNTY COMPREHENSIVE PLAN 3-2 FORSYTH COUNTY COMPREHENSIVE PLAN 3-3
E C O N O M I C D E V E L O P M E N T
anticipated that the steady suburbanization of Forsyth County will result in a continued decline in this sector.
• Construction employment grew from 1980 to 2000. Total sector employment in 2000 for the construction sector was 6,293 people. Construction employment is expected to remain constant as a percentage of employment.
• The percentage of manufacturing employment declined through the 1980’s and 1990’s and is projected to continue to decline in Forsyth County. In 2000, 17.09% of the people were employed in the manufacturing sector.
• The wholesale trade sector has grown overall, employing 4,040 people in 2000. By 2025, the number of people employed is projected to be 9,740.
• Retail is a significant employer in Forsyth County. In 2000, retail employed approximately 6,151 people. This sector is expected to remain constant averaging 13.76 percent of total employment.
TABLE 3.1: EMPLOYMENT BY SECTOR IN FORSYTH COUNTY EMPLOYMENT 1980 1985 1990 1995 2000 2005 2010 2015 2020 2025
Total 7,815 12,848 18,094 27,500 42,942 51,492 60,053 68,413 76,234 83,167
Farms 1,062 884 806 666 623 646 643 630 613 596Agricultural Services, Other 86 307 473 751 1,088 1,276 1,480 1,676 1,847 1,978
Mining 43 71 71 80 134 140 144 148 152 156
Construction 737 1,565 2,274 3,759 6,293 7,628 8,927 10,149 11,247 12,182
Manufacturing 1,565 2,642 3,666 5,186 7,338 8,312 9,199 9,921 10,435 10,714
Transportation, Communication, Utilities 417 587 747 722 1,159 1,433 1,634 1,792 1,905 1,968
Wholesale Trade 167 306 1,069 2,382 4,040 5,150 6,300 7,483 8,647 9,740
Retail Trade 1,073 2,226 2,819 4,546 6,151 7,217 8,308 9,341 10,268 11,048Finance, Insurance, & Real Estate 615 876 1,028 1,472 2,360 2,719 3,019 3,262 3,437 3,535
Services 878 2,065 3,342 5,682 10,034 12,380 15,088 18,088 21,269 24,491Federal Civilian Government 45 69 95 115 156 186 208 225 237 241
Federal Military Government 116 166 197 257 366 372 376 379 381 382
State & Local Government 1,011 1,084 1,507 1,882 3,200 4,033 4,727 5,319 5,796 6,136
Source: Woods & Pool Economics, Inc.

FORSYTH COUNTY COMPREHENSIVE PLAN 3-2 FORSYTH COUNTY COMPREHENSIVE PLAN 3-3
E C O N O M I C D E V E L O P M E N T
• The service sector is currently the largest employment sector in the County providing 10,034 people employed in 2000. It is estimated that in 2025, the sector will continue to be the largest employer with approximately 24,491 workers.
The total earning in each sector in Forsyth County has been identified from 1980 to the present and projected to the year 2025 in Table 3.3. The percentage of earnings from each sector is identified and compared with the State in Table 3.4. Earnings of employees are the sum of wages and salaries, other labor income and proprietor’s income; they also include personal contributions for social insurance. Earnings are not a measure of company profits.
Over forty percent of earnings in Forsyth County are provided by manufacturing and service
TABLE 3.2: PERCENT EMPLOYMENT BY SECTOR FORSYTH AND GEORGIA (in %)Category 1980 1985 1990 1995 2000 2005 2010 2015 2020 2025
FarmForsyth 13.59 6.88 4.45 2.42 1.45 1.25 1.07 0.92 0.80 0.72
Georgia 3.51 2.55 2.01 1.63 1.39 1.24 1.11 1.00 0.90 0.82
Agricultural Services, Other
Forsyth 1.10 2.39 2.61 2.73 2.53 2.48 2.46 2.45 2.42 2.38Georgia 0.60 0.76 0.85 1.06 1.13 1.15 1.16 1.17 1.17 1.16
MiningForsyth 0.55 0.55 0.39 0.29 0.31 0.27 0.24 0.22 0.20 0.19
Georgia 0.32 0.32 0.29 0.22 0.20 0.18 0.17 0.17 0.16 0.15
ConstructionForsyth 9.43 12.18 12.57 13.67 14.65 14.81 14.87 14.83 14.75 14.65
Georgia 5.07 6.11 5.75 5.58 6.10 6.05 5.94 5.80 5.66 5.52
ManufacturingForsyth 20.03 20.56 20.26 18.86 17.09 16.14 15.32 14.50 13.69 12.88
Georgia 19.25 17.53 15.51 14.27 12.63 12.07 11.56 11.03 10.50 9.97
Trans, Comm, & Public Utilities
Forsyth 5.34 4.57 4.13 2.63 2.70 2.78 2.72 2.62 2.50 2.37Georgia 5.55 5.51 5.86 5.72 6.10 6.17 6.19 6.16 6.09 5.97
Wholesale Trade
Forsyth 2.14 2.38 5.91 8.66 9.41 10.00 10.49 10.94 11.34 11.71Georgia 6.34 6.65 6.18 5.73 5.69 5.74 5.73 5.71 5.69 5.66
Retail TradeForsyth 13.73 17.33 15.58 16.53 14.32 14.02 13.83 13.65 13.47 13.28
Georgia 14.84 16.13 16.44 17.14 16.80 17.08 17.32 17.51 17.65 17.76Finance, Insurance, & Real Estate
Forsyth 7.87 6.82 5.68 5.35 5.50 5.28 5.03 4.77 4.51 4.25Georgia 7.28 6.98 6.64 6.36 7.12 7.05 6.98 6.91 6.83 6.76
ServicesForsyth 11.23 16.07 18.47 20.66 23.37 24.04 25.12 26.44 27.90 29.45
Georgia 18.30 20.61 23.75 26.61 28.63 29.27 30.10 31.07 32.16 33.35
Federal Civilian Government
Forsyth 0.58 0.54 0.53 0.42 0.36 0.36 0.35 0.33 0.31 0.29
Georgia 3.08 2.87 2.79 2.33 1.90 1.76 1.63 1.53 1.43 1.35
Federal Military Government
Forsyth 1.48 1.29 1.09 0.93 0.85 0.72 0.63 0.55 0.50 0.46Georgia 3.36 3.05 2.46 2.24 1.93 1.82 1.71 1.61 1.51 1.42
State & Local Government
Forsyth 12.94 8.44 8.33 6.84 7.45 7.83 7.87 7.77 7.60 7.38Georgia 12.51 10.92 11.46 11.11 10.39 10.44 10.40 10.33 10.22 10.10
Source: Woods & Pool Economics, Inc.

FORSYTH COUNTY COMPREHENSIVE PLAN 3-4 FORSYTH COUNTY COMPREHENSIVE PLAN 3-5
E C O N O M I C D E V E L O P M E N T
jobs. Another 17.5% of earnings come from construction employment. By 2025, earnings within the service sector are projected to represent 28.10% of total earnings within the County. Manufacturing is projected to be the second largest sector with 16.74% of total earnings.
TABLE 3.3: EARNINGS BY SECTOR IN FORSYTH COUNTY EARNINGS (in millions
of dollars) 1980 1985 1990 1995 2000 2005 2010 2015 2020 2025
Total 140.8 264.4 400.8 718.2 1,319.7 1,673.7 2,053.0 2,452.6 2,859.9 3,259.6
Farms 5.3 19.0 22.5 19.8 18.7 21.6 24.0 26.0 28.1 30.1Agricultural Services, Other 1.1 4.6 7.0 12.2 18.8 23.4 28.7 34.2 39.6 44.5
Mining 1.5 2.1 2.1 3.2 5.5 5.8 6.0 6.2 6.5 6.7Construction 18.4 39.0 54.3 118.2 232.0 291.2 351.7 411.9 470.0 523.8
Manufacturing 33.5 64.8 98.2 175.6 274.6 333.2 393.3 451.0 502.8 545.7
Transportation, Communication, Utilities 10.6 16.3 21.3 19.2 38.5 50.7 61.2 70.9 79.2 85.8
Wholesale Trade 4.4 6.6 36.4 111.2 196.0 256.7 322.2 392.2 464.2 535.1
Retail Trade 20.0 39.3 43.7 66.4 107.4 129.2 152.5 175.7 197.8 217.9
Finance, Insurance, & Real Estate 5.3 8.7 12.4 31.7 44.0 55.2 66.3 77.0 86.8 95.0
Services 19.6 34.0 57.2 99.2 267.0 355.6 465.1 596.4 747.8 916.1
Federal Civilian Government 1.9 3.1 3.8 5.1 7.7 9.5 11.0 12.4 13.5 14.2
Federal Military Government 0.8 1.9 2.2 2.9 4.7 5.0 5.3 5.6 5.8 6.1
State & Local Government 18.2 24.9 39.7 53.6 104.8 136.7 165.9 193.3 218.0 238.7
Source: Woods & Pool Economics, Inc.

FORSYTH COUNTY COMPREHENSIVE PLAN 3-4 FORSYTH COUNTY COMPREHENSIVE PLAN 3-5
E C O N O M I C D E V E L O P M E N T
TABLE 3.4: PERCENT EARNINGS FORSYTH AND GEORGIA
Category 1980 1985 1990 1995 2000 2005 2010 2015 2020 2025Farm Forsyth 3.74 7.20 5.61 2.75 1.42 1.29 1.17 1.06 0.98 0.92
Georgia 0.16 1.27 1.36 1.40 0.98 0.93 0.89 0.85 0.82 0.79Agricultural Services, Other
Forsyth 0.81 1.73 1.75 1.69 1.43 1.40 1.40 1.39 1.38 1.36Georgia 0.37 0.41 0.46 0.53 0.59 0.60 0.61 0.62 0.62 0.62
Mining Forsyth 1.10 0.80 0.53 0.44 0.42 0.35 0.29 0.25 0.23 0.21Georgia 0.65 0.48 0.36 0.29 0.27 0.25 0.22 0.21 0.19 0.18
Construction Forsyth 13.06 14.76 13.56 16.45 17.58 17.40 17.13 16.80 16.43 16.07Georgia 5.66 6.57 5.82 5.39 6.00 5.86 5.67 5.46 5.26 5.06
Manufacturing Forsyth 23.82 24.51 24.49 24.44 20.81 19.91 19.16 18.39 17.58 16.74Georgia 22.54 20.03 17.51 16.84 14.86 14.45 14.05 13.59 13.08 12.53
Trans, Comm, & Public Utilities
Forsyth 7.56 6.15 5.30 2.68 2.92 3.03 2.98 2.89 2.77 2.63Georgia 9.33 8.85 8.75 9.43 9.89 9.99 10.01 9.96 9.84 9.63
Wholesale Trade Forsyth 3.09 2.50 9.08 15.48 14.85 15.33 15.69 15.99 16.23 16.42Georgia 8.87 9.04 8.86 8.17 8.44 8.36 8.21 8.05 7.88 7.71
Retail Trade Forsyth 14.25 14.85 10.90 9.25 8.14 7.72 7.43 7.16 6.92 6.68Georgia 10.33 10.64 9.17 9.08 8.99 8.97 8.93 8.87 8.80 8.71
Finance, Insurance, & Real Estate
Forsyth 3.76 3.29 3.09 4.42 3.33 3.30 3.23 3.14 3.03 2.91
Georgia 5.44 5.59 6.43 6.86 7.57 7.66 7.73 7.78 7.81 7.82
Services Forsyth 13.89 12.88 14.27 13.82 20.23 21.24 22.66 24.32 26.15 28.10Georgia 15.63 17.36 21.95 24.33 26.77 27.78 29.02 30.44 32.02 33.73
Federal Civilian Government
Forsyth 1.38 1.18 0.95 0.71 0.58 0.57 0.54 0.50 0.47 0.44Georgia 5.64 5.11 4.66 4.17 3.39 3.11 2.87 2.67 2.49 2.33
Federal Military Government
Forsyth 0.58 0.74 0.54 0.40 0.36 0.30 0.26 0.23 0.20 0.19Georgia 3.72 3.68 2.69 2.49 2.06 1.94 1.83 1.72 1.62 1.53
State & Local Government
Forsyth 12.96 9.43 9.92 7.46 7.94 8.17 8.08 7.88 7.62 7.32Georgia 11.67 10.97 11.97 11.01 10.18 10.10 9.95 9.78 9.58 9.37
Source: Woods & Pool Economics, Inc.

FORSYTH COUNTY COMPREHENSIVE PLAN 3-6 FORSYTH COUNTY COMPREHENSIVE PLAN 3-7
E C O N O M I C D E V E L O P M E N T
TABLE 3.5: FORSYTH AVERAGE WEEKLY WAGES (in dollars)
Category 1989 1990 1991 1992 1993 1994 1995 1996 1997 1998 1999All Industries 347 356 389 414 433 457 487 508 524 562 600Agriculture, Forestry, Fishing NA NA 295 275 315 319 340 388 414 452 455Mining NA NA NA NA 550 570 685 767 812 NA NAConstruction NA 405 415 449 464 501 515 543 575 615 632Manufacturing NA 382 426 451 482 497 519 573 569 629 664Transportation, Comm, Utilities NA 410 432 473 470 488 502 549 629 654 661Wholesale NA 537 580 641 667 761 825 830 800 866 914Retail NA 230 244 252 255 265 274 283 297 310 325Financial, Insurance, Real Estate
NA 382 424 430 476 505 496 524 584 680 695
Services NA 305 343 384 404 422 487 456 484 513 583Federal Government NA NA NA NA NA NA NA NA NA NA NAState Govgovernment NA 417 NA NA NA NA NA 555 557 577 584Local Government NA NA NA NA NA NA 449 478 NA NA NASource: U.S. Bureau of Labor Statistics
WagesData on average weekly wages for employment within Forsyth County helps direct community economic development and labor force development goals. Data on wages by employment sector can provide insight into what segments of the employment base are providing the most economic benefit to workers in the community.
Table 3.5 shows the average weekly wages for Forsyth County and Georgia from 1989 to 1999. In Forsyth County, in 1999, the highest paying sector was wholesale paying on average $914 per week; the lowest was retail at $325. These sectors also represented the highest and lowest paying sectors in Georgia, at $932 and $335 per week.
IncomePersonal income can come from five different sources: wages and salaries; “other labor”; proprietor’s income; dividends, interest, and rent income; and transfer payments. Table 3.6 indicates the level of income earned in Forsyth County and Georgia for each of these sources and Table 3.7 compares the percentages. The figures are income earned and received in the county and Georgia, including income earned by non-residents. Therefore, a “residence adjustment” has been made to show the net flow of personal income in and out of Forsyth County and Georgia. A positive sign means there is a net flow of personal income into Forsyth County and Georgia, a negative sign represents a net out flow.
Personal income in Forsyth County and Georgia is growing. In 2000, total personal income in Forsyth County and Georgia was $3,142,920,000 and $209,309,000,000, respectively. By 2025, total personal income in Forsyth County and Georgia is projected to be $7,669,660,000 and $373,728,000,000, respectively.

FORSYTH COUNTY COMPREHENSIVE PLAN 3-6 FORSYTH COUNTY COMPREHENSIVE PLAN 3-7
E C O N O M I C D E V E L O P M E N T
Category 1980 1985 1990 1995 2000
Total (in 1996 $)Forsyth $447.5 $715.4 $978.4 $1,663.0 $3,142.9Georgia $84,202.1 $110,382.0 $134,782.0 $163,230.0 $209,309.0
Wages & SalariesForsyth $91.6 $168.0 $279.5 $525.2 $1,005.5Georgia $53,972.9 $68,598.8 $81,355.6 $96,422.8 $128,049.0
Other Labor IncomeForsyth $10.4 $20.9 $37.0 $65.8 $93.2Georgia $5,484.9 $9,626.2 $11,702.3 $14,092.0 $14,308.0
Proprietors IncomeForsyth $38.8 $75.6 $84.2 $127.2 $221.0Georgia $5,484.9 $7,694.7 $9,584.3 $12,998.9 $18,105.4
Dividends, Interest, & Rent
Forsyth $50.5 $93.0 $157.2 $282.0 $478.5Georgia $10,987.0 $17,428.3 $23,366.9 $26,625.0 $35,169.0
Transfer Payments to Persons
Forsyth $35.1 $47.0 $70.5 $112.9 $167.7Georgia $9,867.4 $11,841.3 $14,749.8 $20,606.7 $23,300.9
Less: Social Insurance Contributions
Forsyth $6.2 $13.9 $23.4 $45.0 $81.7 Georgia $9,978.2 $4,527.9 $5,839.7 $7,270.3 $9,398.0
Residence AdjustmentForsyth ($227.2) ($324.7) ($373.4) ($594.9) ($1,258.7) Georgia ($211.2) ($279.8) ($136.8) ($245.3) ($224,740.0)
Category 2005 2010 2015 2020 2025
Total (in 1996 $)Forsyth $3,955.7 $4,825.8 $5,747.7 $6,703.3 $7,669.7Georgia $236,962.0 $266,921.0 $299,617.0 $335,164.0 $373,728.0
Wages & SalariesForsyth $1,279.4 $1,573.4 $1,884.4 $2,203.0 $2,517.6Georgia $144,760.0 $162,812.0 $182,588.0 $204,172.0 $227,684.0
Other Labor IncomeForsyth $117.0 $142.0 $167.8 $193.5 $218.2Georgia $15,909.5 $17,605.1 $19,429.5 $21,384.6 $23,476.2
Proprietors IncomeForsyth $277.3 $337.7 $400.5 $463.4 $523.8Georgia $20,196.6 $22,501.7 $25,001.5 $27,696.8 $30,597.4
Dividends, Interest, & Rent
Forsyth $607.0 $747.9 $901.7 $1,068.5 $1,248.3Georgia $39,713.0 $44,582.2 $49,772.6 $55,274.6 $61,073.9
Transfer Payments to Persons
Forsyth $217.0 $274.0 $340.3 $417.4 $507.3
Georgia $26,662.0 $30,514.5 $34,921.9 $39,972.8 $45,770.2
Less: Social Insurance Contributions
Forsyth $108.0 $138.2 $171.3 $206.4 $241.8
Georgia $11,070.6 $12,973.8 $15,086.6 $17,406.5 $19,929.4
Residence AdjustmentForsyth ($1,566.0) ($1,889.0) ($2,224.4) ($2,563.8) ($2,896.4)Georgia ($791.4) ($1,879.2) ($2,989.8) ($4,070.2) ($5,055.3)
Source: Woods & Pool Economics, Inc.
TABLE 3.6: LEVEL OF INCOME EARNED (IN MILLIONS), FORSYTH COUNTY AND GEORGIA

FORSYTH COUNTY COMPREHENSIVE PLAN 3-8 FORSYTH COUNTY COMPREHENSIVE PLAN 3-9
E C O N O M I C D E V E L O P M E N T
From 1980 through 2000, Georgia experienced a net outflow of personal income. Over the course of the study period, Forsyth County has experienced a net inflow ranging from a high of 50.78% in 1980, to a projected low of 37.76% in 2025. This decline is representative of the growing employment base within Forsyth County.
Major Economic ActivityRecent and planned major economic development activities in Forsyth County have helped to diversify the economy and strengthen existing sectors. The most recent example of this is New York Life’s acquisition of property in South Forsyth. On May 5, 2003, the New York Life Insurance Company completed its acquisition of a property at 5965 Cabot Parkway in south Forsyth County for a data center. New York Life plans to employ approximately 100 people initially, including a number of relocated employees, in the 95,000 square foot facility and will begin expanding that facility to meet the company’s needs. Over the next few years, additional hires will bring the total number of employees to more than 140 individuals. The company plans to fill most of the jobs locally.
Continued efforts of the Chamber of Commerce, Development Authority, and Board of Commissioners will ensure that Forsyth County will be successful in attracting new industries. A highly skilled work force, low taxes, and an attractive location are resources to be utilized in promoting Forsyth County.
Category 1980 1985 1990 1995 2000 2005 2010 2015 2020 2025
Total % (in 1996 $)
Forsyth 100.00 100.00 100.00 100.00 100.00 100.00 100.00 100.00 100.00 100.00Georgia 100.00 100.00 100.00 100.00 100.00 100.00 100.00 100.00 100.00 100.00
Wages & Salaries
Forsyth 20.47 23.48 28.57 31.58 31.99 32.34 32.60 32.78 32.87 32.83Georgia 64.10 62.15 60.36 59.07 61.18 61.09 61.00 60.94 60.92 60.92
Other Labor Income
Forsyth 2.32 2.92 3.79 3.95 2.97 2.96 2.94 2.92 2.89 2.84Georgia 8.41 8.72 8.68 8.63 6.84 6.71 6.60 6.48 6.38 6.28
Proprietors Income
Forsyth 8.68 10.57 8.61 7.65 7.03 7.01 7.00 6.97 6.91 6.83Georgia 6.51 6.97 7.11 7.96 8.65 8.52 8.43 8.34 8.26 8.19
Dividends, Interest, & Rent
Forsyth 11.29 13.01 16.06 16.96 15.22 15.34 15.50 15.69 15.94 16.28Georgia 13.05 15.79 17.34 16.31 16.80 16.76 16.70 16.61 16.49 16.34
Transfer Payments to Persons
Forsyth 7.85 6.58 7.20 6.79 5.34 5.48 5.68 5.92 6.23 6.61
Georgia 11.72 10.73 10.94 12.62 11.13 11.25 11.43 11.66 11.93 12.25
Less: Social Insurance Contributions
Forsyth 1.39 1.94 2.39 2.71 2.60 2.73 2.86 2.98 3.08 3.15
Georgia 3.54 4.10 4.33 4.45 4.49 4.67 4.86 5.04 5.19 5.33
Residence Adjustment
Forsyth 50.78 45.39 38.16 35.77 40.05 39.59 39.14 38.70 38.25 37.76Georgia -0.25 -0.25 -0.10 -0.15 -0.11 0.33 0.70 1.00 1.21 1.35
Source: Woods & Pool Economics, Inc.
TABLE 3.7 PERCENTAGE OF INCOME EARNED, FORSYTH COUNTY AND GEORGIA

FORSYTH COUNTY COMPREHENSIVE PLAN 3-8 FORSYTH COUNTY COMPREHENSIVE PLAN 3-9
E C O N O M I C D E V E L O P M E N T
TABLE 3.8: EMPLOYMENT BY OCCUPATION IN FORSYTH, GEORGIA AND THE US (IN %)
Unique Economic ActivityAs the previous analysis indicates, the economy of Forsyth County plays a unique role in Metro-Atlanta. The continued development of the GA 400 corridor will remain a dominant factor in the local economy. The County’s highly skilled labor force will be a major asset as Forsyth County continues to shift from a bedroom community to a source of employment. According to the 2002 Georgia County Guide, 34.6% of residents in Forsyth County have a bachelor’s degree or higher.
Labor ForceLabor force data is used in assessing whether the jobs available in Forsyth County are appropriate for residents in terms of skills, education, commuting patterns and wages.
OccupationTable 3.8 contains current and historic data on employment by occupation for Forsyth County, the State, and the United States. From 1990 to 2000, Forsyth County has experienced a significant increase in employment for the Executive, Administrative and Managerial sector. This is the largest sector within Forsyth County, with 22.51% of the workforce. In Georgia and the United States, the Executive, Administrative and Managerial sector represents 14.03% and 13.45%, respectively.
Within Forsyth County, the Precision Production, Craft, and Repair sector experienced the largest decline from 1990 to 2000. This sector decreased 10.78% in Forsyth County, while
Category1990 2000
Forsyth Georgia US Forsyth Georgia USExecutive, Administrative and Managerial (not Farm)
13.75% 12.26% 12.32% 22.51% 14.03% 13.45%
Professional and Technical Specialty 9.34% 12.39% 14.11% 18.60% 18.68% 20.20%Technicians & Related Support 3.10% 3.58% 3.68% NA NA NASales 13.04% 12.28% 11.79% 14.81% 11.64% 11.25%Clerical and Administrative Support 14.68% 16.00% 16.26% 14.25% 15.14% 15.44%Private Household Services 0.22% 0.51% 0.45% NA NA NAProtective Services 1.16% 1.70% 1.72% NA NA NAService Occupations (not Protective & Household)
7.23% 9.77% 11.04% 9.76% 11.57% 12.01%
Farming, Fishing and Forestry 3.70% 2.20% 2.46% 0.48% 0.64% 0.73%Precision Production, Craft, and Repair 16.05% 11.86% 11.33% 5.27% 9.02% 8.49%Machine Operators, Assemblers & Inspectors
6.98% 8.50% 6.83% 10.96% 10.83% 9.45%
Transportation & Material Moving 5.97% 4.60% 4.08% 3.82% 6.63% 6.14%Handlers, Equipment Cleaners, helpers & Laborers
4.78% 4.34% 3.94% NA NA NA
Source: U.S. Bureau of the Census

FORSYTH COUNTY COMPREHENSIVE PLAN 3-10 FORSYTH COUNTY COMPREHENSIVE PLAN 3-11
E C O N O M I C D E V E L O P M E N T
Georgia and the United States both experienced a 2.84% decline in the Precision Production, Craft, and Repair sector.
Labor Force ParticipationTable 3.9 shows labor force participation for Forsyth County, the State, and the United States. Employment status identifies the numbers of men and women employed in the military and civilian labor forces. Reflective of the rapid population growth, Forsyth County has not experienced a decline in any category.
Category1990 2000
Forsyth Georgia US Forsyth Georgia USTOTAL Males and Females 33,991 4,939,774 191,293,337 73,145 6,250,687 217,168,077
In Labor Force 24,226 3,353,372 124,882,409 52,904 4,129,666 138,820,935
Civilian Labor Force 24,218 3,280,314 123,176,636 52,875 4,062,808 137,668,798
Civilian Employed 23,262 3,092,374 115,431,436 51,779 3,839,756 129,721,512
Civilian Unemployed 956 187,940 7,745,200 1,096 223,052 7,947,286
In Armed Forces 8 73,058 1,705,773 29 66,858 1,152,137
Not in Labor Force 9,765 1,586,402 66,410,928 20,241 2,121,021 78,347,142
TOTAL Males 16,883 2,357,580 91,866,829 36,923 3,032,442 104,982,282
Male In Labor Force 13,780 1,807,053 68,417,853 30,553 2,217,015 74,273,203
Male Civilian Labor Force 13,772 1,741,609 66,897,041 30,524 2,159,175 73,285,305
Male Civilian Employed 13,369 1,652,016 62,639,048 30,013 2,051,523 69,091,443
Male Civilian Unemployed 403 89,593 4,257,993 511 107,652 4,193,862
Male In Armed Forces 8 65,444 1,520,812 29 57,840 987,898
Male Not in Labor Force 3,103 550,527 23,448,976 6,370 815,427 30,709,079
TOTAL Females 17,108 2,582,194 99,426,508 36,222 3,218,245 112,185,795
Female In Labor Force 10,446 1,546,319 56,464,556 22,351 1,912,651 64,547,732
Female Civilian Labor Force 10,446 1,538,705 56,279,595 22,351 1,903,633 64,383,493
Female Civilian Employed 9,893 1,440,358 52,792,388 21,766 1,788,233 60,630,069
Female Civilian Unemployed 553 98,347 3,487,207 585 115,400 3,753,424
Female In Armed Forces - 7,614 184,961 - 9,018 164,239
Female Not in Labor Force 6,662 1,035,875 42,961,952 13,871 1,305,594 47,638,063
Source: U.S. Bureau of the Census
TABLE 3.9 LABOR FORCE PARTICIPATION

FORSYTH COUNTY COMPREHENSIVE PLAN 3-10 FORSYTH COUNTY COMPREHENSIVE PLAN 3-11
E C O N O M I C D E V E L O P M E N T
UnemploymentFrom 1990 to 2000, the unemployment rate in Forsyth County has been consistently lower than Georgia or the United States. Unemployment rates in Forsyth County have steadily decreased from 1990 to 2000. Table 3.10 compares unemployment rates for Forsyth County with surrounding counties, the State, and the United States.
Category 1990 1991 1992 1993 1994 1995 1996 1997 1998 1999 2000
Forsyth County
Labor Force 24,871 25,249 26,630 28,372 31,088 33,592 37,705 42,398 48,703 54,134 55,727
Employed 23,728 24,135 25,157 27,293 30,119 32,568 36,919 41,513 47,833 53,264 54,864
Unemployed 1,143 1,114 1,473 1,079 969 1,024 786 885 870 870 863
Unemployment Rate 4.60% 4.40% 5.50% 3.80% 3.10% 3.00% 2.10% 2.10% 1.80% 1.60% 1.50%
Cherokee CountyUnemployment Rate 4.20% 3.70% 5.30% 4.10% 3.40% 3.50% 2.60% 2.40% 2.20% 2.00% 2.00%
Dawson CountyUnemployment Rate 5.10% 4.50% 6.10% 4.80% 4.00% 3.90% 3.10% 2.60% 2.40% 2.10% 1.60%
Fulton CountyUnemployment Rate 5.70% 5.30% 7.40% 6.40% 5.80% 5.40% 5.00% 4.60% 4.10% 3.90% 3.70%
Gwinnett CountyUnemployment Rate 4.20% 3.80% 5.30% 4.20% 3.70% 3.20% 2.80% 2.60% 2.50% 2.40% 2.30%
GeorgiaUnemployment Rate 5.50% 5.00% 7.00% 5.80% 5.20% 4.90% 4.60% 4.50% 4.20% 4.00% 3.70%
USUnemployment Rate 5.60% 6.80% 7.50% 6.90% 6.10% 5.60% 5.40% 4.90% 4.50% 4.20% 4.00%
Source: U.S. Bureau of Labor Statistics
TABLE 3.9 UNEMPLOYMENT PERCENTAGES FOR FORSYTH, SURROUNDING COUNTIES, GEORGIA AND THE U.S.

FORSYTH COUNTY COMPREHENSIVE PLAN 3-12 FORSYTH COUNTY COMPREHENSIVE PLAN 3-13
E C O N O M I C D E V E L O P M E N T
Commuting PatternsTable 3.11 shows the commuting patterns for Forsyth County from 1990 to 2000. The percentage of residents working inside the countyhas increased slightly from 1990 to 2000. In 1990, only 40% of the labor force worked within the county. This number increased to 42% in 2000.
Category 1990 2000Worked in County of Residence 9,031 21,039 Percent of Labor Force Working in County of Residence
40% 42%
Worked Outside County of Residence 13,696 29,539 Percent of Labor Force Working Outside County of Residence
60% 58%
Source: U.S. Bureau of the Census
TABLE 3.11 : LABOR FORCE BY PLACE OF WORK
Local Economic Development ResourcesLocal economic development resources are essential to a healthy community. Job Training, workforce development, chambers of commerce, and development authorities are just a few of the mechanisms for promoting business, industry and labor force. Ongoing efforts must be made to ensure that these types of programs are updated, advertised, and made available to the public.
Economic Development AgenciesTwo agencies, the Cumming - Forsyth County Chamber of Commerce and the Forsyth County Development Authority, work to improve the economy of Forsyth County. The Chamber of Commerce is comprised of businesses in the county, professionals, local leaders, and other interested individuals who have joined together to promote the economic development of the community by successfully marketing Forsyth County. The Chamber of Commerce’s mission also encompasses enhancing the economic growth and development of Forsyth County and is primarily engaged in business recruitment, business expansions, and retention of businesses currently located in Forsyth County, Georgia. The Chamber of Commerce is the Economic Development Agency for Cumming and Forsyth County, Georgia.
Economic Development Programs and ToolsThe Cumming – Forsyth County Chamber of Commerce organizes monthly lunch meetings for its members with informative speakers to discuss important issues related to the economic growth. The Cumming – Forsyth County Chamber of Commerce launched a public relations and image building campaign that has been very successful. Forsyth County, Georgia has been featured in numerous publications that have real estate professionals and site selection professionals as the target reader audience. The Chamber of Commerce also sponsors events which Showcase Forsyth County to the brokers, agents, site selection professionals and state project managers. Over 200 attended the event last year. A quarterly Developers Roundtable meeting is held with 25-35 attending. This provides a great opportunity to update

FORSYTH COUNTY COMPREHENSIVE PLAN 3-12 FORSYTH COUNTY COMPREHENSIVE PLAN 3-13
E C O N O M I C D E V E L O P M E N T
the Development community on issues of importance and interest. This also provides a great line of communications so that the Chamber is always up to date on business activity, trends, and issues that relate to their plans for future buildings and site development.The Chamber of Commerce is conducting an extensive business retention survey in 2003. Approximately 30 companies will be interviewed to determine future expansion plans. ‘Business After Hours’ provides an opportunity for local business owners and community leaders to network. Throughout the year the Chamber of Commerce promotes a Shop Forsyth County program to encourage more business in the community and thus increase sales tax revenues, jobs, and the tax base. An annual business exposition allows the community to see what products and services are available in Forsyth County and special events are scheduled for visiting government leaders. The Chamber is also active in promoting community development issues such as the extension of the Special Purpose Local Option Sales Tax for community improvements and the passage of the Special Purpose Sales Tax for Education.In addition to the above, the Cumming – Forsyth County Chamber of Commerce is instrumental and actively engaged in the following activities, designed to enhance the economic growth and development of Forsyth County: • Working with the developers to market sites and available space/ buildings and
identify tracts for future development; • Assuring the provision of sufficient water, sewer, electrical, natural gas, and
telecommunication services to serve the needs of the business community through our committees which work hand in hand with the city and county governments;
• Facilitating the training and education of the local labor force through the collaboration of programs presented in conjunction with Lanier Technical College- Forsyth Campus;
• Serving as an advocate for existing business concerns, including taxation, labor, government/industry relationships and other issues;
• Pursues grant opportunities that facilitate a new business location or expansion of an existing corporate citizen;
• Facilitating comprehensive business and community development through the extensive provision of demographic and other information on Forsyth County, a partnership with the Small Business Development Center Program operated by the Small Business Administration and the University of Georgia for the provision of business counseling services for entrepreneurs or existing businesses, as well as a contractual partnership with the Cumming - Forsyth County Chamber of Commerce;
• The Leadership Forsyth program encourages and fosters the development of community leaders by using a formal study program;
• Forsyth County Youth Leadership Program is a community-wide leadership program for high school sophomores, juniors and seniors. The program is designed to develop leadership potential and to acquaint participants with community needs, problems and resources through interaction with community leaders and decision makers.
FORSYTH COUNTY COMPREHENSIVE PLAN 3-14 FORSYTH COUNTY COMPREHENSIVE PLAN 3-15
E C O N O M I C D E V E L O P M E N T
The Forsyth County Development Authority is engaged in the following activities:• Facilitating financing of new and expanded businesses by issuing industrial revenue
bonds. The Authority works in concert with the Chamber of Commerce’s Economic Development program for Forsyth County
Education And Training OpportunitiesThe Forsyth County Public School System, various private schools, Lanier Technical College, and North Georgia College and State University provide education and training opportunities to the local labor force. Assorted job training programs are also available through state agencies.
• Lanier Technical Collegeo Attempts to meet the changing educational and technological needs of business
in Forsyth County through continuing education and industry specific training. o The Service Industry Academy provides training to support work force
development in the service sector.o Georgia’s Quick Start program is also operated through Lanier Technical
College. The program provides high-quality training services at no cost to new and expanding businesses.
• North Georgia College and State Universityo Provides a quality college educational option for Forsyth County residents.
• Public School Systemo All 23 schools are accredited by the Southern Association of Colleges and
Schools and have exceeded the standards as defined and measured by the Georgia Department of Education.
o Georgia Schools of Excellence include three elementary schools: Chattahoochee, Midway and Big Creek; two middle schools: North Forsyth and Otwell; and two high schools: Forsyth Central and North Forsyth. The Schools of Excellence Program began in 1984. The nomination process focuses on several vital areas: student focus and support; school organization and culture; challenging standards and curriculum; active teaching and learning; professional community; leadership and education vitality; school, family and community partnerships; and indicators of success.
o In 2001, Big Creek Elementary was named a National Blue Ribbon School. Otwell Middle was also named a National Blue Ribbon School and a Georgia School of the Future. North Forsyth High School is one of six high schools in the nation to be recognized as “Preparing America’s Future” under the United States Department of Educations’ New American High Schools Program.
ASSESSMENT OF CURRENT AND FUTURE NEEDS
Employment and earnings have remained fairly stable over the last ten years. Exceptions

FORSYTH COUNTY COMPREHENSIVE PLAN 3-14 FORSYTH COUNTY COMPREHENSIVE PLAN 3-15
E C O N O M I C D E V E L O P M E N T
include a significant decline of farm employment and a moderate increase in earnings for the wholesale trades sector. It is essential that Forsyth County continue efforts to ensure a diversified local economy. Due in part to the current growth rate, the construction and wholesale trade sectors represent a high percentage of employment and earnings when compared to the state. Specifically, in Forsyth County and Georgia these sectors represent 24.06% and 11.79% of employment, respectively; and 32.43% and 14.44% of earnings, respectively.
An examination of commuting patterns identifies a mismatch between job and residents. Approximately 58% of the Forsyth County labor force is commuting outside the county for employment. Additionally, the rural atmosphere, convenient location, strong school system, and reasonably priced middle and upper class housing markets make the county attractive for residential development. This has led to extremely high residential growth rates, which has outpaced the development of many employment sectors. Additionally, the lack of affordable housing has forced many workers to reside in surrounding counties. Continued efforts from the Cumming - Forsyth Chamber of Commerce and other economic development organizations will help to alleviate the current jobs/residents mismatch.
The expansion of Metro-Atlanta, specifically the continued development of the GA 400 corridor, will continue to be the primary regional issue to relate to the economy of Forsyth County. As identified in the Land Use Element, goals of Forsyth County must focus on quality economic expansion that minimizes the externalities associated with such activity. Existing local economic development programs and tools have experienced success in attempting to diversify the local economy and add jobs that match the needs of our residents. Continued efforts will be necessary to ensure a well-balanced economy.
COMMUNITY GOALS
The following policies are intended to support community values and to define priorities regarding specific issues and the resources addressed in this element. The purpose of these policies is to provide guidance and direction to local government officials in making land use and capital investment decisions. These are not intended to be action items, or strategies, but rather guidelines to be interpreted at the time of decision-making. The policies work to achieve a growing and balanced economy that equitably benefits all segments of the population.
• Encourage the expansion of existing business/industry and the location on new business/industry to Forsyth in a manner that will:
o Improve the existing quality of life while maintaining the environmento Prevent land use conflictso Provide increased and improved employment opportunities for all segments of
the communityo Expand the nonresidential tax baseo Maximize the return on community expenditureso Diversify the County’s industrial and commercial base
• Use the Forsyth County Land Use Plan as a guide in prioritizing the locations where key

FORSYTH COUNTY COMPREHENSIVE PLAN 3-16
businesses and industries will be encouraged to locate and in coordinating provisions of transportation, utilities, and other support services.
• Encourage landscaping, signage, building design, and other development regulations that enhances the image of Forsyth County and creates value.
• Continue to encourage high quality vocational, high school and college training to increase the numbers of skilled workers, and to train high quality workers in fields with good employment opportunities.
Chapter Ten, the Implementation Program, provides the overall strategy for the comprehensive plan implementation. The policy recommendations listed above are merged and coordinated with the policies of the other elements to form the implementation program. The associated short-term work program designates the actions the county will take in the next five years to achieve these goals. The list is not all-inclusive. There are some actions that may not be addressed due to time, budget and administrative constraints. These items will be included as part of the work program at some point over the twenty-year planning period.

FORSYTH COUNTY COMPREHENSIVE PLAN 4-1
INTRODUCTION
An important aspect of land use planning is the inventory and analysis of the existing physical and biological environment. Growth patterns are inextricably tied to the limitations of the natural environment. Topography, soils and water availability can be assets or hindrances to various types of development. The understanding of the biological patterns and physical processes will allow the determination of the best manner in which to utilize, manage and preserve the natural resources found in a community. The intention of this chapter is to inventory the current status of the county’s natural resources, conduct an “opportunities and constraints assessment” to suggest areas best suited for preservation or for development, and establish the community’s priorities for the needs and goals for conservation.
INVENTORY AND ASSESSMENT
ClimateForsyth County has a humid, continental climate, with an average annual temperature of 60 degrees. The winters are generally mild. The temperature often drops below freezing during the nights of December, January, and February, but seldom remains below the freezing point during the day. While some winter days are warm, summer days are usually hot, with cooler nights.
Annual precipitation is approximately 57 inches, and consists almost entirely of rainfall. An occasional snow may accumulate up to one or two inches. Usually, periods of heavy rainfall occur year-round, and are most common December through April. A dry period generally extends from late summer through fall.
The average freeze-free growing season is 209 days. Frost has occurred as early as October and as late as April, and in some years, crops and fruit have been damaged by late spring frosts.
Geology and TopographyThe county is in the middle and upper parts of the Piedmont province just south of the Appalachian Mountains. The county is underlain by both igneous and metamorphic rocks. Most of the rocks are metamorphic gneiss, schist, and quartzite.
Forsyth County is characterized by a gently sloping terrain, with greater sloping in the northern portion. Sawnee Mountain extends in a southwest to northern direction across the central part of the county. The elevation at the top of the mountain, 1,967 feet above sea level, is the highest in the county. The lowest elevation, less than 900 feet, occurs where the Chattahoochee River crosses the southern boundary of the county. Average elevation is 1,315 feet above sea level.
CHAPTER 4NATURAL RESOURCES ELEMENT

FORSYTH COUNTY COMPREHENSIVE PLAN 4-2 FORSYTH COUNTY COMPREHENSIVE PLAN 4-3
N A T U R A L R E S O U R C E S
SoilsA knowledge of soil properties can be a useful planning tool to help determine the suitability of certain land uses in particular areas. A complete description, classification, and map of soils is available from the Natural Resources Conservation Service.
Although Forsyth County contains a minimum of 14 different soil associations, they can be grouped into five general soil areas, or kinds of soil patterns. The five general areas are discussed below. Best management practices should be used on all soil types, with particular care taken in the development of the highly erodible soil types.
Cecil-Madison: Well-drained, gently sloping and sloping soils on uplands. This general soil area makes up about 74 percent of the county. The soils are well suited to agricultural uses, and have slight limitations for urban and recreational development.Cecil-Louisa: Well-drained, sloping and moderately steep soils on uplands. About five percent of Forsyth County is made up of this soil pattern, which is generally not suitable for crops or building construction. Steep, severely eroded, or shallow, the most desirable uses for this association are woodland, pasture, and wildlife habitat. Cecil-Habersham: Well-drained, sloping and moderately steep soils on uplands. This general soil area makes up about 10 percent of the county. Characterized by permeable, sandy soils, they have severe limitation for urban development and most agricultural uses. Madison-Louisa: Well-drained, sloping and moderately steep soils on uplands. Making up about four percent of county soils, these soils have a fine sandy loam surface soil and a red clay loam subsoil. Because this general area is very susceptible to erosion, little of it is suitable for cultivation or building construction.Congaree-Wickham: Moderately well-drained or well-drained, level or gently sloping soils on flood plains and terraces. This general soil area makes up about five percent of the county. It consists mainly of soils which occur along the larger streams on bottom land and terraces. Most of this area is cleared and cultivated.
MineralsThe only minerals now being extracted in Forsyth County are sand, gravel and crushed stone. Past mining activity, while including such minerals as talc, marble, mica, manganese and iron, centered for many years on gold. Other minerals either prospected or noted in early reconnaissance reports include silver, copper, lead, platinum, building stone, clay, graphite, kyanite, olivine, and semi-precious stones.
Only a few of these known minerals are commercially minable and developable as a resource. The Environmental Protection Division (EPD) lists eight mining operations within the county. Three are dredge operations, four are quarries and one is a pit mine. No precious metal or base metal mining operations are listed with EPD.
Due to the nature of geology in Forsyth County, the likelihood of future large scale mining of base metals and subsurface deposits would be extremely expensive and therefore remote. Gold mining may be economical in the future, but would probably be small scale. The greatest potential for mineral development in the county will continue to be in crushed granite (gravel),

FORSYTH COUNTY COMPREHENSIVE PLAN 4-2 FORSYTH COUNTY COMPREHENSIVE PLAN 4-3
N A T U R A L R E S O U R C E S
and sand. The expected expansion of Atlanta and predicted growth of Forsyth County will lead to an increase in the demand for these products.
Steep SlopesThere are 32,225 acres of steep slopes within Forsyth County as shown in Figure 4.1. Development of these sensitive areas can have an impact on the water quality of the region. When vegetation is removed from steep slopes, the soil surface is more susceptible to erosion. Also, stormwater runoff rates are faster on slopes with greater declines.
The county currently does not have an ordinance prohibiting development on steep slopes. However, due to engineering constraints, it is recommended that development is limited in these areas. In locations such as the Sawnee Mountain ridgeline and the steep banks around Lake Lanier and the Etowah River, low density development or parks may be the most appropriate uses.
Protected MountainsAs defined by Georgia law, a protected mountain is an area of land located at 2,200 feet or more above sea level that has a 25% slope or greater for at least 500 feet horizontally. There are no mountains which fall under the Department of Natural Resources Criteria for Mountain Protection within the county of Forsyth.
Prime Agricultural Land and Forest LandPrime agricultural land was determined by the analyzing the soil types of the county. Typically, these are soils that consist of fine sandy loam and are gently sloping. Figure 4.2 shows 24,442 acres of land suitable to be prime farmland. In 1997, 13,410 acres of the county were actually being used as cropland. This land consisted mainly of hay/alfalfa fields. The majority of agricultural business is in the form of cattle and poultry raising. These practices are not as dependant on the soil quality.
Agricultural practices have been a way of life for generations of Forsyth residents. As development from Atlanta continues to move northward, the pressure to develop agricultural land continues to increase. The county continues to investigate ways to ease this pressure and encourage the continuation of viable agricultural businesses.
Prime forest land is defined by the Natural Resources Conservation Service as land cover that is at least 10 percent stocked by single stemmed forest trees of any size which will be at least 4 meters (13 feet) tall at maturity. The prime forest land canopy cover is 25 percent or greater. Also included are areas bearing evidence of natural regeneration of tree cover (cutover forest or abandoned farmland) and not currently developed for nonforest use. The U.S. Department of Agriculture’s Forest Service conducted a survey of the forest land of Forsyth County in 1998. The survey found 68,200 acres of the total 144,000 acres within the county were forested.
One of the most effective ways to preserve the existing quality of life in Forsyth County is to preserve the existing tree cover and to encourage reforestation practices within new

FORSYTH COUNTY COMPREHENSIVE PLAN 4-4 FORSYTH COUNTY COMPREHENSIVE PLAN 4-5
N A T U R A L R E S O U R C E S
developments. Trees serve many vital functions, including reduction of airborne pollutants, control of stormwater run-off and contribution of food and shelter for wildlife. In recognition of their importance, Forsyth County adopted a tree preservation and replacement ordinance. The ordinance provides standards for the preservation and/or replacement of trees as part of the land development and building construction process.
Plant and Animal HabitatsPrime habitats for the indigenous plants and animals of Forsyth County include streams and riverbeds, bottomland forests, grassy pastures, and upland forests. The ideal landscape mosaic should include large patches of similar habitat and corridors between the patches to allow gene flow. As development continues to spread across the county, habitat fragmentation is becoming an increasing concern. The creation of greenway connections between passive parks should be designed to allow wildlife movement as well as well as human.
The Georgia Department of Natural Resources maintains a working list of protected plants and animals of special concern in Forsyth County. The species are listed on Table 4.1 below.
Protected Species Habitat
Notropis stilbius -Silverstripe Shiner Medium-sized streams and rivers in flowing pools over sandy to rocky substrates
Percina antesella -Amber Darter Riffles & runs of medium-sized rivers
Amorpha nitens -Shining Indigo-bush Rocky, wooded slopes; alluvial woods
Amorpha schwerinii- Schwerin Indigo-bush Rocky upland woods
Aster georgianus -Georgia AsterUpland oak-hickory-pine forests and openings; sometimes with Echinacea laevigata or over amphibolite
Platanthera integrilabia -Monkeyface OrchidRed maple-gum swamps; peaty seeps and streambanks with Parnassia asarifolia and Oxypolis rigidior
Source: Georgia Department of Natural Resources
The Silverstripe Shiner and the Amber Darter are limited to the Etowah River and possibly its tributaries. Best management practices should be used in the Etowah watershed to ensure the river’s water quality is not adversely affected by future development. All sites where a species of special concern are identified will be given priority for protection in the county’s greenspace plan.
Major Parks, Recreation and Conservation AreasThere are several parks within Forsyth County which have regional impacts. The Army Corps of Engineers maintains over 600 acres of recreational sites along Lake Lanier. Sites include boat ramps, playgrounds, picnic tables, beaches and swimming areas. Approximately half of this acreage is devoted to campsites and day use facilities. Table 4.2 lists the names
TABLE 4.1 : PROTECTED SPECIES OF FORSYTH COUNTY

FORSYTH COUNTY COMPREHENSIVE PLAN 4-4 FORSYTH COUNTY COMPREHENSIVE PLAN 4-5
N A T U R A L R E S O U R C E S
TABLE 4.2: U.S. ARMY CORPS OF ENGINEERS PARKS AND ACCESS POINTS ON LAKE LANIER IN FORSYTH COUNTY
NAME GENERAL LOCATIONBuford Dam Park Buford Dam RoadWest Bank Picnic and Shelter Buford Dam RoadSawnee Campground Buford Dam RoadLittle Ridge Park Off Buford Dam RoadHabersham Marina Buford Dam RoadMary Alice Park Habersham RoadBaldridge Marina Baldridge Marina RoadBaldridge Creek Public Use Area Off Sinclair Shores RoadTidwell Access End of Pilgrim Mill RoadYoung Deer Creek Access End of Heard RoadShady Grove Park Shadburn Ferry RoadCharleston Access Off Browns Bridge RoadTwo Mile Creek Access Bethel RoadBethel Park Swiss Air RoadVanns Tavern Access Vanns Tavern RoadAthens Park Athens Park RoadLan Mar Marina Lan Mar RoadLong Hollow Access Bryant RoadKeith Bridge Park Keith Bridge RoadWar Hill Park (part) Near Dawson County
Source: Atlantic Mapping, Inc. Lake Lanier Recreation and Fishing Guide with Topography. 1984, Revised 1989.
and locations of the Corps parks. Just below Buford Dam, Forsyth contains a portion of Bowmans Island Park Unit, which is part of the Chattahoochee River National Recreation Area. The Forsyth County Parks and Recreation has obtained 750 acres on the Sawnee Mountain ridgeline to become the Sawnee Mountain Preserve. This park will include miles of walking trails and historically significant sites.
Conservation areas, such as wetlands, streambanks and floodplains are protected through buffers and best management practices. Further protection should be pursued for these sensitive areas. Additional protection options include conservation easements and fee simple acquisition.
Significant Landmarks and VistasThe rolling topography, Lake Lanier, and the rural character of the northern portion of the county provide many scenic views within the county. The ridgeline of Sawnee Mountain, in the north-central portion of the county, can be seen from a distance in all directions. The Eagle’s Beak formation of the Etowah River, in the northwest corner of the county, holds cultural significance to the Cherokee Indians. The overlook at Buford Dam offers expansive views of Lake Lanier and the Chattahoochee River.
Forsyth County has begun to take steps towards protecting these significant landmarks

FORSYTH COUNTY COMPREHENSIVE PLAN 4-6 FORSYTH COUNTY COMPREHENSIVE PLAN 4-7
N A T U R A L R E S O U R C E S
FIGURE 4.1: STEEP SLOPES OF FORSYTH COUNTY
Source: Forsyth County Planning and Development

FORSYTH COUNTY COMPREHENSIVE PLAN 4-6 FORSYTH COUNTY COMPREHENSIVE PLAN 4-7
N A T U R A L R E S O U R C E S
FIGURE 4.2: PRIME AGRICULTURAL LAND OF FORSYTH COUNTY
Source: Forsyth County Planning and Development

FORSYTH COUNTY COMPREHENSIVE PLAN 4-8 FORSYTH COUNTY COMPREHENSIVE PLAN 4-9
N A T U R A L R E S O U R C E S
and vistas. The county has already purchased 750 acres of land on Sawnee Mountain to create a passive recreation park. The county also plans to update the Forsyth County Greenspace Plan. The updated plan will include consideration of methods to protect these significant areas. The county has also adopted a sign ordinance which restricts the heights of advertising signage throughout the county.
Greenspace Acquisition AreasForsyth County is a participant in the Georgia Greenspace Program. To achieve the Department of Natural Resources goal of 20% of the county permanently preserved in a natural state, 29,000 acres of land must be protected through acquisition, conservation easements and transfer or purchase of development rights. The Forsyth County Greenspace Plan identifies steep slopes, wetlands, A2 zoned land and flood plains as potential greenspace acquisition areas. The county has currently purchased 750 acres of land on Sawnee Mountain to create a passive recreation park as well as 67 acres in South Forsyth. The Community Program Report for the Forsyth County Greenspace Plan is included in Appendix B.
Water ResourcesForsyth County has a variety of water resources available for drinking water supply, wildlife habitat and recreation. These include surface waters, such as lakes, rivers, streams and wetlands, as well as below-ground aquifers. All streams in Forsyth County drain into two major river basins, the Chattahoochee River Basin to the southeast and the Coosa River Basin in the northwest.
The Chattahoochee River Basin is part of the larger Apalachicola-Chattahoochee-Flint (ACF) Rivers Basin, which drains into the Gulf of Mexico. In Forsyth County, the Chattahoochee River Basin can be sub-divided into three watersheds: Lake Lanier, Big Creek and Chattahoochee River. The man-made Lake Lanier, which is the largest lake to be entirely contained in the state of Georgia, occupies more than 38,000 acres in Forsyth County. Several tributaries drain into the lake including Six-mile Creek, Four-Mile Creek, Two-Mile Creek, Taylor Creek, Bald Ridge Creek and Sawnee Creek. Below the dam, water in the southeast portion of the county drains into the Chattahoochee River. These include Haw Creek, James Creek, Dick Creek, Caney Creek and John’s Creek. The Big Creek watershed is in the western portion of the county and drains into the Chattahoochee River below the Roswell water supply intake in Fulton County.
The Etowah River watershed, which flows through the northwest portion of Forsyth, joins the Coosa River northwest of Atlanta, to form the Coosa River Basin. The rivers eventually drain into the Gulf of Mexico as part of the Alabama-Coosa-Tallapoosa (ACT) Rivers Basin. Settingdown Creek watershed flows into the Etowah River just west of Forsyth County. In March 2000, the Community Watershed Assessment and Watershed Management Plan was produced for the county. The purpose of the study was to evaluate the environmental health of county streams and to develop a management plan to control pollution in selected watersheds. This report includes water quality and biological assessments, modeling development, impacts assessment and recommendations for future management.

FORSYTH COUNTY COMPREHENSIVE PLAN 4-8 FORSYTH COUNTY COMPREHENSIVE PLAN 4-9
N A T U R A L R E S O U R C E S
Water-supply Watersheds A water-supply watershed is the area where rainfall runoff drains into a river, stream or reservoir used as a source of public drinking water supply. Protection of these watersheds is important to ensure public health and reduce the amount of purification needed to provide safe drinking water. All five major watersheds found in the county are water-supply watersheds (Figure 4.3). Chapter 391-3-16-.01; Rules for Environmental Planning Criteria in the Rules of Georgia Department Natural Resources Environmental Protection Division, require a set of criteria to be created that allows development of a water-supply watershed without contaminating the water source to a point where it cannot be treated to meet drinking water standards. The criteria to be used is determined by the water-supply watershed size and proximity to a water intake facility. Watersheds of less than 100 square miles in size are considered small water-supply watersheds. If greater than 100 square miles, the watershed is considered a large water-supply watershed. There are additional requirements for the seven mile radius surrounding a water intake facility.
The Big Creek watershed, in the southwest section of the county, is slightly smaller than 100 square miles and therefore considered a small water-supply watershed. The Etowah River, Settingdown Creek and Chattahoochee are large water-supply watersheds outside of the seven mile radius, with no impervious coverage restrictions. Although there is a water-intake site for the City of Cumming and Forsyth County within the Lake Lanier watershed, the Department of Natural Resources criteria does not apply to federal lakes. To protect the county’s and adjacent municipalities’ water supply, Forsyth County has adopted and follows the planning criteria set by the Georgia Department of Natural Resources. Big Creek WatershedAccording to the Department of Natural Resources, the Big Creek Watershed constitutes 96.4 square miles. The City of Roswell withdraws water at an intake that is located less than seven miles south of Forsyth County boundary. For these reasons, the county has adopted a Protected Water Supply Watershed Overlay District for the area. Within the seven-mile radius, Georgia Department of Natural Resources requires the following:•A buffer shall be maintained for a distance of 100 feet on both sides of the stream as measured from the stream banks.•No impervious surface shall be constructed within a 150 foot setback area on both sides of the stream as measured from the stream banks.•Septic tanks and septic tank drainfields are prohibited within the 150 foot setback.
The perennial stream corridors within Big Creek watershed upstream and outside the seven mile radius of the Roswell water intake point are to be protected by the following criteria:•A buffer shall be maintained for a distance of fifty feet on both sides of the stream as measured from the stream banks.•No impervious surface shall be constructed within a seventy-five foot setback area on both sides of the stream as measured from the streambanks.•Septic tanks and septic tank drain fields are prohibited in the setback area on both sides of the stream as measured from the stream banks.

FORSYTH COUNTY COMPREHENSIVE PLAN 4-10 FORSYTH COUNTY COMPREHENSIVE PLAN 4-11
N A T U R A L R E S O U R C E S
In addition to Big Creek itself, these buffer and setback requirements apply to a number of perennial stream tributaries, including, but not limited to: Bentley Creek, Cobb Creek, Harris Creek, Chatham Creek, Kelley Mill Branch, Sawmill Branch, Cumming Twin Lakes, and Bagley Creek.
The following criteria apply at all locations in a small water supply watershed:•New sanitary landfills are allowed only if they have synthetic liners and leachate collection systems.•New hazardous waste treatment or disposal facilities are prohibited.•The impervious surface area, including all public and private structures, utilities, or facilities, of the entire water supply watershed shall be limited to twenty-five (25) percent, or existing use, whichever is greater.•New facilities which handle hazardous materials of the types listed in Section 312 of the Resource Conservation and Recovery Act of 1976 (excluding underground storage tanks), and amounts of 10,000 pounds on any one day or more, shall perform their operations on impermeable surfaces in conformance with any applicable federal spill prevention requirements or the requirements of the Standard Fire Prevention Code.
A limitation of 25% impervious surface within the Big Creek Watershed applies to several jurisdictions. These include: Forsyth County, Cherokee County, Fulton County, the City of Alpharetta, the City of Cumming and the City of Roswell. The Department of Natural Resources suggests two basic approaches local governments can take to implement the limit:1. All the local governments within the boundaries of the watershed may agree among themselves on an allocation program for impervious surfaces that yields a net 25% limitation throughout the watershed. This approach would require all the local governments within the watershed to reach a formal impervious surface allocation agreement, and such an agreement would have to be reflected in the comprehensive plan of each participating local government.2. Each local government within a watershed may apply the 25% limitation to its jurisdiction individually. This approach does not require negotiations for an allocation system with neighboring local governments, since each city or county would operate by the same 25% standard.3. Limit each lot within the watershed to a maximum 25% impervious surface coverage.
WetlandsWetlands are areas with permanently or temporarily saturated soils that influence the unique plant and animal communities living there. They serve valuable ecological functions for the community in terms of flood water retention, soil erosion control, groundwater recharge and pollution filtration. The county has adopted a wetland protection district, and coordinates with the U.S. Army Corps of Engineers for review of projects that may be subject to the Clean Water Act 404 permitting process. The largest areas of wetlands can be found along Big Creek, Settingdown Creek and the Etowah River. Additional wetlands can be found in association with the shoreline of Lake Lanier and in small, man-made farm ponds. The U.S. Fish and Wildlife Service’s National Wetlands Inventory Maps are used to identify potential

FORSYTH COUNTY COMPREHENSIVE PLAN 4-10 FORSYTH COUNTY COMPREHENSIVE PLAN 4-11
N A T U R A L R E S O U R C E S
wetland sites shown in Figure 4.4.
Flood PlainsFlood Plains are fluctuating water level ecosystems. These low-lying lands along streambeds absorb high waters during flooding events. They are ecotones, transitional areas between land and water, that in their natural state, support a high diversity of plants and animals. The flood waters provide rich, highly productive alluvial soil to the surrounding land. In return, flood plains enrich water bodies with high nutrient organic matter, producing the foundation for a healthy aquatic food web.
The 100-year flood plain is defined as the land area with a 1% chance of being flooded every year. Flood plain management is required under the National Flood Insurance Act of 1963 and the Flood Disaster Protection Act of 1973. Figure 4.5 shows flood plains defined by the Federal Emergency Management Agency. No building development is recommended to occur in any 100 year flood plain within the county. To further protect this important resource, floodplains are identified as a potential greenspace acquisition area in the Forsyth County Greenspace Plan.
Significant Groundwater Recharge AreasGroundwater recharge occurs in areas composed of the topography and geology that allow percolation of surface water through the soil into an aquifer. These permeable surfaces raise the groundwater table and slow the flow of water into streams during rain events. They also provide a source of drinking water. If the aquifer becomes polluted, it is virtually impossible to decontaminate it. The groundwater recharge areas were mapped by the Department of Natural Resources (DNR) in Hydrologic Atlas 18 (1989) edition. The mapping was based on outcrop areas, lithology, soil type and thickness, slope, density of lithologic contacts, geologic structure, presence of “karst” topography, and potentiometric surfaces. Hydrologic Atlas 20 Groundwater Pollution Susceptibility Map of Georgia, indicates areas of high, average, and low pollution susceptibility. In the adoption of local ordinances, this map dictates the minimum lot sizes allowable for the construction of new homes and other structures that rely on septic tank systems. Forsyth County has low pollution susceptibility. Figure 4.6 indicates the groundwater recharge areas and pollution susceptibility.
Forsyth County has adopted a list of criteria to be followed within any significant groundwater recharge area:•DNR will not issue permits for sanitary landfills not having synthetic liners and leachate collection systems.•DNR shall not issue permits for the land disposal of hazardous wastes.•DNR shall require all new facilities permitted or to be permitted to treat, store, or dispose of hazardous waste to perform such operations on an impermeable pad having a spill and leak collection system.•New above-ground chemical or petroleum storage tanks, having a minimum volume of 660 gallons, shall have secondary containment for 110% of the volume of such tanks or 110% of the volume of the largest tank in a cluster of tanks. Such tanks used for agricultural purposes are exempt, provided they comply with all federal requirements.

FORSYTH COUNTY COMPREHENSIVE PLAN 4-12 FORSYTH COUNTY COMPREHENSIVE PLAN 4-13
N A T U R A L R E S O U R C E S
FIGURE 4.3: WATER SUPPLY WATERSHEDS AND PUBLIC WATER SUPPLY OF FORSYTH COUNTY
Source: Forsyth County Planning and Development and the Georgia Department of Natural Resources

FORSYTH COUNTY COMPREHENSIVE PLAN 4-12 FORSYTH COUNTY COMPREHENSIVE PLAN 4-13
N A T U R A L R E S O U R C E S
FIGURE 4.4: WETLANDS OF FORSYTH COUNTY
Source: U.S. Fish and Wildlife Service

FORSYTH COUNTY COMPREHENSIVE PLAN 4-14 FORSYTH COUNTY COMPREHENSIVE PLAN 4-15
N A T U R A L R E S O U R C E S
FIGURE 4.5: FLOOD PLAINS OF FORSYTH COUNTY
Source: Federal Emergency Management Agency

FORSYTH COUNTY COMPREHENSIVE PLAN 4-14 FORSYTH COUNTY COMPREHENSIVE PLAN 4-15
N A T U R A L R E S O U R C E S
FIGURE 4.6: GROUND WATER RECHARGE AREAS OF FORSYTH COUNTY
Source: Georgia Department of Natural Resources

FORSYTH COUNTY COMPREHENSIVE PLAN 4-16 FORSYTH COUNTY COMPREHENSIVE PLAN 4-17
N A T U R A L R E S O U R C E S
•New agricultural waste impoundment site should be discouraged in significant groundwater recharge areas, Clay liners should be installed as approved by the U.S. Soil Conservation Service if an agricultural waste impoundment site is located in a significant groundwater recharge area.•New dwellings, including mobile/manufactured homes, if served by septic tank/drain filed systems, should be located on a lot size of 110% of the minimum lot area required by the Georgia Department of Human Resources’ “Manual For On-site Sewage Disposal Systems.” Existing lots of record would be exempted.•Permanent stormwater infiltration basins should be discouraged and should not be constructed in an area with high pollution susceptibility.•Wastewater treatment basins should have liners if constructed in an area of high pollution susceptibility, and wastewater spray irrigation systems in high pollution susceptibility areas should only be permitted subject to approval by Georgia DNR.
Due to the sensitive nature of recharge areas identified in Figure 4.6, it is recommended that development remain at a lower density and intensive industrial uses are avoided in these areas.
Protected River CorridorsForsyth County contains two protected river corridors, the Etowah River and the Chattahoochee River (Figure 4.7). The Department of Natural Resources, in Section 391-3-16-.04 of the Rules for Environmental Planning Criteria defines a “Protected River” as any perennial river or watercourse with an average annual flow of at least 400 cubic feet per second. Local governments which contain protected rivers within their jurisdiction must adopt River Corridor Protection Plans. The Etowah River, along its entire length in Forsyth County, has been determined to fit in the Protected River category. The River Corridor Protection Plan is provided Figure 4.8.
The Chattahoochee River qualifies as a protected river, but is superseded by the Georgia Metropolitan River Protection Act (MRPA). All construction and development actions, clearance, land disturbance, landscaping, occupancy and use of lands within the Chattahoochee River Corridor shall be undertaken in conformance to the provisions of the MRPA. Protection criteria are established for a 2000 foot corridor from the edge of the Chattahoochee River. This includes a 50 foot natural buffer on both sides of the river; a 150 ft building setback; a 35 foot buffer on tributaries; and controls on floodplain development and the extent of impervious surfaces. The Act specifies that local governments review land-disturbing activities and certify that development follows the guidelines for watershed protection.

FORSYTH COUNTY COMPREHENSIVE PLAN 4-16 FORSYTH COUNTY COMPREHENSIVE PLAN 4-17
N A T U R A L R E S O U R C E S
Source: Forsyth County Planning and Development and the Geaorgia Department of Transportation
FIGURE 4.7: FORSYTH COUNTY PROTECTED RIVER CORRIDORS

FORSYTH COUNTY COMPREHENSIVE PLAN 4-18 FORSYTH COUNTY COMPREHENSIVE PLAN 4-19
N A T U R A L R E S O U R C E S
1. Applicability.This plan shall apply to all areas within one hundred (100) feet horizontally on both sides of the Etowah River, in Forsyth County.2. Applicability to State Agencies.This plan shall apply to all state owned or administered land that contains a protected river within its boundaries. All state agencies shall comply with these minimum standards. Failure by a state agency to comply with such standards shall be considered an indicia of a governmental action which may significantly adversely affect the quality of the environment under the Environmental Policy Act (O.C.G.A. 12-16-1 et seq.).3. Prohibited Uses In The River Corridor.3.1. Hazardous waste disposal and handling facilities.3.2. Solid Waste Landfills.3.3. Septic tanks and septic tank drain fields, except that septic tanks only are permitted within the river corridor for single-family dwellings on two acre or larger lots.4.0 Uses Exempt From Natural Buffer Maintenance Requirements.The following uses are permitted, subject to certain conditions, within the one-hundred foot (100’) river corridor, without having to maintain a 100 foot natural vegetative buffer:4.1. Agriculture.Agricultural production and management is permitted within the river corridor, subject to the following conditions:
1) Agricultural activity shall be consistent with best management practices established by the Georgia Soil and Water Conservation Commission;2) Agricultural activity shall not impair the drinking quality of the river water as defined by the federal Clean Water Act, as amended; and3) Agricultural activity shall be consistent with all state and federal laws, and all regulations promulgated by the Georgia Department of Agriculture.4.2. ForestryTimber production and harvesting are permitted within the river corridor, subject to the following conditions:1) Forestry activity shall be consistent with best management practices established by the Georgia Forestry Commission; and2) Forestry activity shall not impair the drinking quality of the river water as defined by the federal Clean Water Act, as amended.4.3. Single-Family Dwellings.Single-family dwellings, including usual accessory structures and appurtenances, are permitted within the river corridor subject to the following conditions:1) The dwelling shall be located on a tract of land containing at least two (2) areas, excluding any property that lies within the banks of the river. This section shall not, however, prohibit the construction of any dwellings on lots less than two (2) acres lawfully existing on record prior to the adoption of regulations implementing this river corridor protection plan.2) There shall be only one such dwelling on each two-acre or larger tract of land.3) A septic tank or tanks serving such a dwelling may be located within the buffer area.
FIGURE 4.8: ETOWAH RIVER CORRIDOR PROTECTION PLAN

FORSYTH COUNTY COMPREHENSIVE PLAN 4-18 FORSYTH COUNTY COMPREHENSIVE PLAN 4-19
N A T U R A L R E S O U R C E S
ETOWAH RIVER CORRIDOR PROTECTION PLAN CON’T4) Septic tank drainfields shall not be located within the buffer area.4.4. Existing Land Uses.Any commercial, industrial, institutional, residential, or other land uses existing within the river corridor prior to the adoption of regulations implementing this river corridor protection plan, provided that:1) They shall not impair the drinking quality of the river water; and2) They shall meet all applicable state and federal environmental rules and regulations.4.5. Mining.Mining activities are allowed, if permitted by the Georgia Department of Natural Resources pursuant to the Georgia Surface Mining Act of 1968, as amended.4.6. Wildlife and Fisheries Management.These activities are allowed if consistent with the purposes of O.C.G.A. 12-2-8.4.7. Waste-Water Treatment and Natural Water Quality Treatment or Purification.4.8. Recreational Uses.Paths, walkways, boat ramps and other recreational uses consistent with maintenance of a natural vegetative buffer or with river dependant recreation, but specifically excluding parking lots and hard-surface tennis courts.4.9. Road Crossings and Utilities.Roads and utilities must meet all requirements of the Erosion and Sedimentation Control Act of 1975, as amended, and any local ordinances on soil erosion and sedimentation control. If utilities cannot feasibly be located outside the river corridor/buffer area, as decided conservatively by the local government, then utilities are allowed subject to the following:1) The utilities shall be located as far from the river bank as reasonably possible;2) Installation and maintenance of the utilities shall be such as to protect the integrity of the buffer area as well as is reasonably possible; and3) Utilities shall not impair the drinking quality of the river water.4.10. Other Uses.Other uses permitted by the Department of Natural Resources or under Section 404 of the Clean Water Act, shall be permitted within the river corridor.5.0 Establishment and Maintenance of Natural Buffer.Except for land uses specifically exempted by Section 4 of this plan, all construction of buildings or structures is prohibited within the river corridor, and the existing natural vegetative buffer within 100 feet of the stream bank shall remain undisturbed.6.0 Assessment of Potential Development on Protected River Corridor.Land development, if consistent with this plan, is not expected to adversely affect: 1) unique/significant flora and fauna (none identified in the corridor); 2) the uses, activities and quality of Etowah River water; 3) fishing or recreational uses (this segment is not a trout stream); 4) historical and archeological sites (none identified in the corridor); nor 5) adjacent sensitive natural areas (none identified except flood plains). Since flood plains are protected by the county’s flood damage prevention ordinance, no adverse effects on flood plains are anticipated either.

FORSYTH COUNTY COMPREHENSIVE PLAN 4-20 FORSYTH COUNTY COMPREHENSIVE PLAN 4-21
N A T U R A L R E S O U R C E S
SummaryThe land resources enjoyed by the residents of Forsyth County are both abundant and varied in nature. However, these represent a finite fund of resources. The number of uses and demands against that fund is large, varied and growing in number and complexity. Allocating decisions among competing uses is becoming increasingly more complex and considerably more difficult. The natural beauty of Sawnee Mountain is threatened from development on all sides and the water quality of Lake Lanier and its feeder streams has been steadily declining. Forsyth County must continue to balance the need for growth while maintaining the integrity of its natural resources. Figure 4.8, on page 4-22, shows an overlay of the natural resources that were used in the assessment and creation of the community goals.
COMMUNITY GOALS
The following policies are recommended to conserve and protect the environmental resources of Forsyth County:
• Prepare a greenway/open space master plan.• Establish standards to identify land in which development impacts should be minimized.• Work toward the acquisition and preservation of greenbelt protected areas, such as the
Chattahoochee River, Etowah River, and Big Creek.• Strengthen appropriate rules, regulations, and ordinances to protect and encourage the
preservation of trees and vegetative cover.• Distribute open space opportunities across the county.• Strictly enforce the sign ordinance to help preserve the scenic features of the county.• Recognize the need for passive recreational spaces.• Develop countywide strategies for improving watershed quality. Modify and improve
upon stormwater management plan to improve water quality.• Create development standards to encourage the linking of conservation lands to create
greenway corridors.• Encourage maximizing open space with density incentives.• The county should work towards exceeding the state standard for greenspace in each
subarea.• Develop a plan to require mixed-use development to have a significant percentage of
the area to remain protected greenspace.• Protect residential areas by encouraging appropriate greenspace buffers around
commercial developments.• Examine measures to improve water quality, such as stream buffer requirements.• Reduce the negative impact of impervious surfaces by studying mitigation factors and
incorporating them into site development.• Encourage the creation of hiking trails which interconnect with other existing greenways
and trails from adjoining counties.
In addition to the goals set by the Countywide Land Use Steering Committee, future goals identified in the Parks and Recreation Masterplan which will work to preserve the county’s natural resources include:
• Additional purchases of land on Sawnee Mountain.

FORSYTH COUNTY COMPREHENSIVE PLAN 4-20 FORSYTH COUNTY COMPREHENSIVE PLAN 4-21
N A T U R A L R E S O U R C E S
• Partner with other large-scale residential and mixed use developments to obtain conservation easements.
• Develop pedestrian trails linking recreation sites that will eventually result in a regional trail system.
• Add additional passive use facilities at Poole’s Mill Park.• Acquire land in the southern portion of the county for a new community park and
greenway, to include passive use opportunities.
Chapter Ten, the Implementation Program, provides the overall strategy for the comprehensive plan implementation. The policy recommendations listed above are merged and coordinated with the policies of the other elements to form the implementation program. The associated short-term work program designates the actions the county will take in the next five years to achieve these goals. The list is not all-inclusive. There are some actions that may not be addressed due to time, budget and administrative constraints. These items will be included as part of the work program at some point over the twenty-year planning period.

FORSYTH COUNTY COMPREHENSIVE PLAN 4-22
FIGURE 4.8: NATURAL RESOURCES OF FORSYTH COUNTY
Source: Forsyth County Planning and Development

FORSYTH COUNTY COMPREHENSIVE PLAN 5-1
CHAPTER 5CULTURAL RESOURCES ELEMENT
INVENTORY Cultural resources includes a variety of structures and sites that contribute to defining a particular community by contributing to its heritage, its economy, its neighborhoods, and its sense of who they are as a community. These resources are typically historical and archaeological resources that can define a people’s way of life both current and past. They can also include those resources that are unique to a particular community, like a landmark or vista. Cultural resources are important because they provide educational and informational services to the general public and they help us to learn about our past. But they are not just about the past. Such cultural characteristics are important definers of the way of life that exists within the community. They provide a living connection to it for people who reside or work there, as well as for those less frequent visitors, who nonetheless form an image of the place based upon what are often unique resources.
Forsyth County has a rich history which dates back to the Creek and Cherokee Nations. Several books have been written of the history of Forsyth County which outline and discuss in detail the events, places and personalties that took part in shaping and directing the development of this area.
Archeological ResourcesForsyth County was part of territory controlled by the Cherokee Nation until their removal in the 1830s. There have been several archeological sites identified within the county. Listed below is an inventory of archaeological sites:
1. Four miles west of Silver City, a petroglyph on granite rock was found. It is now on display at the University of Georgia.2. Indian mound and village in bottomlands of Settingdown Creek, along the north bank enclosed in a deep southward loop, about one mile upstream from the mouth of the Etowah River.3. Indian village at Sawnee Field on Big Creek about 1-1/2 miles north of Cumming, near Sawnee Mountain and Kelly’s Mill.4. Three Indian mounds and possible council circle, out Alpharetta Road west of Cumming, about one mile to the right just before the road forks.6. Indian village out Highway 20 going from Buford, just across bridge on Chattahoochee River on the south side.7. Indian village on west bank of Chattahoochee River at Strickland Ferry Bridge between Buford and Cumming, just north of Dave Creek on left of road going north.8. Indian Seats on the Sawnee Mountain ridge..

FORSYTH COUNTY COMPREHENSIVE PLAN 5-2
C U L T U R A L R E S O U R C E S
FORSYTH COUNTY COMPREHENSIVE PLAN 5-3
C U L T U R A L R E S O U R C E S
9. The Cherokee “Trail of Tears” which started in the Northwest corner of the county near the Etowah River.
Historic Resources SurveyIn 1993, the Forsyth County Board of Commissioners sponsored a survey of the County’s historic resources. The Historic Resources Survey Report was performed as an initial step to identify and document the county’s rich architectural heritage. The survey lists four hundred and ninety historic properties found in unincorporated Forsyth County. The location and addresses for the sites were recorded and the structures were analyzed for period of construction, physical condition and architectural style. The original use was also determined. Most of the sites were single family residences. Other structures were used for general stores, churches, schools, bridges, and commercial structures. Based on this analysis, 57 individual properties were determined to be eligible for the National Register of Historic Places. The following sections breakdown some of the 57 structures identified into the types of uses they served. Figure 5.1 identifies their location throughout the county. Some of these structures may have been removed since the time the survey was completed. Only two sites are on the National Register of Historic Places. Pooles Mill, a covered bridge on Settingdown Creek was added to the register in 1975. The Fowler House, off Atlanta Highway, was accepted into the register in 2003.
Historic CommunitiesDuring the analysis of the Historic Resources Survey Report, an attempt was made to identify districts which may be eligible for National Register listing. Due to the sparsity and limited quality of historic areas, no districts within unincorporated Forsyth were identified as potential historic communities.
Historic ResidencesA majority of the historic structures in the 1993 survey were residential. Examples of sites that could be eligible include:FO-OO-22 Old Clements Home - Located on the northwest corner of Peachtree Parkway; circa 1840 Plantation Plain style in excellent condition.FO-OO-28 Residence - Located on the northwest side of Old Alpharetta Road, north of Caney Road; circa 1912 bungalow in excellent condition.FO-OO-32 Residence - Located on Bagley Drive at Mathis Airport Road; circa 1890 Folk Victorian style in excellent condition.FO-OO-135 Tribble House - Located on the northwest corner of Evans road and Post Road; circa 1905 in good condition.FO-OO-170 Residence - Located on the west side of Karr Road; circa 1910 to 1925 Georgian house in excellent condition.FO-OO-224 A.B. Tollison Home - Wallace Tatum Road west of Burnt Bridge Road; circa 1875-1905 no academic style but in good condition.FO-OO-391 Terry-Settle House - Located on Southers Circle; circa 1830 - 1840 the house was quit-claimed to the Georgia Trust’s Revolving Fund for Historic Preservation.FO-OO-450 A.D. Kellogg House - Located on the west side of Jot’em Down Road, north of Meadowbrook Road; circa 1900 - 1909 pyramid cottage in fair condition.

FORSYTH COUNTY COMPREHENSIVE PLAN 5-2
C U L T U R A L R E S O U R C E S
FORSYTH COUNTY COMPREHENSIVE PLAN 5-3
C U L T U R A L R E S O U R C E S
FO-OO-451 Mitchell Martin House - Located on the north side of Claude Martin Road; circa 1921 new south cottage in fair condition.FO-OO-458 Roy Holtzclaw House - West side of Holtzclaw Road; circa 1889-1899 folk Victorian in excellent condition. FO-OO-477 William David Puckett House - Located on the west side of Campground Road; high style Folk Victorian circa 1890.FO-OO-485 Fowler House - Located on the south side of Atlanta Highway east of Castleberry Road; circa 1910. Added to the National Register of Historic Places in 2003.
Historic Commercial FO-OO-73 Chadwick’s Store - Located on Tribble Gap on the northeast corner of Bramlett Road and Spot Road; circa 1860-1866 one room general store.FO-OO-177 General Store - On the southwest corner of Watson Road and Hurt Bridge Road; circa 1910 one room in poor condition.FO-OO-234 Buffington’s Tavern - Originally located on Old Federal Road, the tavern was moved to the Cumming Fairgrounds to become part of a Cherokee Indian Village display. The date of the building’s construction is unknown, but the tavern was an important part of Forsyth’s history. It was where President James Monroe spent the night while traveling the Federal Highway and the infamous Cherokee Indian James Vann was shot and killed in 1809.FO-OO-252 Grogan’s Grocery- Located on Bannister and Namon Wallace Roads, the circa 1910 - 1919 general store served as a gathering place for long-time residents until it was converted into an office in the 1990s. FO-OO-397 Bagwell Store - Located on the west side of Waldrip Road, south of Bryant Road; It was the only store in the area circa 1900.FO-OO-414 General store - On the northwest corner of Bethel Road and Lake Hollow Drive; circa 1900-1909 in fair condition.FO-OO-420 General Store - Located on the west side of Little Mill Road; circa 1900-1909, fair condition.FO-OO-487 Mill/processing/manufacturing facility - Located on Burrus Mill Road north of Brown’s Bridge Road; the structure is now a single family dwelling in excellent condition.
Historic InstitutionsFO-OO-3 Brookwood Baptist Church - Located on the east side of Brookwood Road; circa 1913 High Victorian Gothic style still in use as church.FO-OO-024 Old Big Creek Courthouse - Located on the north side of Hemrick Road; circa 1917 one room courthouse.FO-OO-108 School - Located on Kelly Circle Road east of Chamblee Gap Road; circa 1920 one room school house.FO-OO-121 Victory Post Office - Located on the north side of Atlanta Highway east of Post Road; circa 1880 in fair condition.FO-OO-237 Mt. Tabor Church - This is the oldest church in the county that still has an active congregation. It was established in 1833.FO-OO-303 Hopewell United Methodist Church - Located on the corner of Hopewell Road and Burrus Road. The circa 1900 church is still in use.

FORSYTH COUNTY COMPREHENSIVE PLAN 5-4 FORSYTH COUNTY COMPREHENSIVE PLAN 5-5
C U L T U R A L R E S O U R C E S
FO-OO-481 Midway United Methodist Church - Located on the southeast corner of Atlanta Highway and Francis Circle; circa 1922 in good condition.FO-OO-410 Bethel Baptist Church - Located on Bethel Road south of Brown’s Bridge Road; circa 1900-1909 the church has some major additions.
Historic LandscapesFO-OO-210 Pooles Mill - Crosses Settingdown Creek. Was used as access from the mill to the communities of Heardsville and Frogtown. The original bridge burnt in 1899. The covered bridge that stands today was built in 1901. It was added to the National Register of Historic Places in 1975 and is part of a passive recreation area run by the county Parks and Recreation.FO-OO-223 Burnt Bridge Road at Settingdown Creek - circa 1925 riveted steel, pony truss bridge.FO-OO-390 Settles Bridge - Crosses the Chattahoochee River. Built circa 1930-1939, the bridge replaced the ferry operation run by the Settles family. It was constructed with handmade steel, the decking has been removed so it can no longer be crossed.
ASSESSMENT
Forsyth County recognizes that the preservation and maintenance of archeological sites and historic structures contribute to the cultural heritage of the county and are therefore in the long-term interest of the county. The historic resources survey conducted in the mid 1990s involved the identification and documentation of all buildings, districts, structures and sites which contribute to the historic character and significance of the area. The survey also examined how those resources identified in the inventory benefit the community and any potential threats to their survival. In response to this concern, Forsyth County has adopted regulations in the Unified Development Code concerning the demolition of historic structures. The regulations apply to those seeking to receive land disturbance permits on sites containing historic structures. Decisions still need to be made on how historic structures should be protected. In addition, many of the archeological sites have not been formally documented. The county should take action to protect these sites before they are destroyed.
COMMUNITY GOALS While the county has begun to work towards the goal of preserving the county’s historic resources, there are additional steps that should be taken. These include:• Adoption of a county-wide historic preservation ordinance in compliance with the Georgia
Historic Preservation act of 1980.• Seek certification as a Certified Local Government under the Historic Preservation Division
of the Georgia Department of Natural Resources.• Investigate preservation incentives such as local property tax freeze or abatement
programs.• Utilize current state and federal programs which provide funding, staff and services in the
area of historic preservation.

FORSYTH COUNTY COMPREHENSIVE PLAN 5-4 FORSYTH COUNTY COMPREHENSIVE PLAN 5-5
C U L T U R A L R E S O U R C E S
• Pursue funding for a survey to identify and document pre-historic and historic archeology in Forsyth County.
Chapter Ten, the Implementation Program, provides the overall strategy for the comprehensive plan implementation. The policy recommendations listed above are merged and coordinated with the policies of the other elements to form the implementation program. The associated short-term work program designates the actions the county will take in the next five years to achieve these goals. The list is not all-inclusive. There are some actions that may not be addressed due to time, budget and administrative constraints. These items will be included as part of the work program at some point over the twenty-year planning period.

FORSYTH COUNTY COMPREHENSIVE PLAN 5-6
C U L T U R A L R E S O U R C E S
FIGURE 5.1: FORSYTH COUNTY HISTORICAL RESOURCES

FORSYTH COUNTY COMPREHENSIVE PLAN 6-1
INTRODUCTION
Community facilities and services are the foundation of a community. They include essential services such as water treatment and distribution, as well as fire and police protection. They add to the quality of life through schools and parks. They may also shape growth, as development must have access to a network of supporting infrastructure and community facilities, such as road frontage, potable water, and waste disposal. Property without these services generally has a lower value in land planning and development. Areas remote from other community services, such as schools and parks, also are less desirable for development. The availability of infrastructure and community services can literally change the landscape of the community by adding to the developable land supply, or postponing or precluding the development of certain land.
The purpose of the Community Facilities and Services chapter is to examine the positive and negative impact such infrastructure has on the county’s land use. This chapter provides an overview of the existing facilities and services available to the Forsyth County community. Following each inventory is an assessment of the adequacy of these facilities to meet the current and future needs of the county and how the availability of these facilities will affect the future growth patterns. The goals for each facility/service type are also provided. These goals were set by the various departments to assure that the county will achieve the level of service needed by the current and future demand of the community.
WATER AND SEWER FACILITIES
The Water and Sewer Department is in charge of the county’s water supply and sewer treatment. The department operates from three facilities. The Forsyth County Administration Building houses the director and the administrative and engineering staff, along with Customer Service, Billing and Meter Services. The Field Operations Center on County Way Road houses the Field and Maintenance staff and is used as the workshop, meter assembly area, warehouse, and work area for the field operations personnel. The Forsyth County Water Treatment Plant on Antioch Road houses its management and operations staff.
The Department employs 60 full time staff (as of 2002) and employs six plant management and operations personnel on a contractual basis, through a private corporation.
Water Supply And TreatmentIn 1987 the City of Cumming and Forsyth County entered into a formal agreement which defines the service areas of each water system Figure 6.1. The contract also established guidelines for a Wholesale Water User’s Agreement for the City to supply water to Forsyth County on a wholesale basis. This agreement is good for a period of 25 years and will expire
COMMUNITY FACILITIES AND SERVICES ELEMENT CHAPTER 6

FORSYTH COUNTY COMPREHENSIVE PLAN 6-2 FORSYTH COUNTY COMPREHENSIVE PLAN 6-3
C O M M U N I T Y F A C I L I T I E S
in 2012. Presently, the county is required by contract to buy just over 4 million gallons per day of treated water. In 2012, when the agreement with the city expires, the county does not expect to renew the contract.
In April 2000, the county brought online the Forsyth County Water Treatment Plant (WTP) which has a current treatable capacity of 11.4 million gallons per day (MGD). The WTP is operated and managed on a contractual basis by Operations Management International (OMI). The county currently has a permit to produce a daily maximum of 16 MGD. In July of 2003, the WTP produced and average of 3.97 MGD, with a daily maximum of 5.66 MGD. The water treated at this plant is supplied by the City of Cumming through a Raw Water Agreement. Ten million gallons per day of raw water withdrawn from the City’s Lake Lanier intake facility is available for use at the county’s treatment plant. The Raw Water Agreement incorporates a sales and operating cost agreement, and has an open-ended contract period for the length of the agreement to sell raw water to the county. Due to estimated water demand projections, the facility is to be upgraded in 2004. The county also has an estimated 670 miles of water lines throughout the county along with 3 elevated storage tanks, 4 ground storage tanks, and 1 standpipe. The current raw water pump station shared with the City of Cumming is able to deliver water to the WTP at one of the following flow rates: 6 gmd, 8 mgd, or 10.2 mgd. The WTP produces water to meet the demands of the consumers and fill the storage tank in the distribution system. However, with the current pumping scheme, Forsyth is unable to receive the 12.9 mgd of raw water from the shared pump station. Due to this situation, and the need for a redundant water source, construction of the new raw water pump station and intake is critical to the continued success of Forsyth County in delivering water to its customers. At the current time, the shared raw water pump station cannot deliver enough water for the WTP to operate at the temporary permit capacity.
Water Supply Assessment Currently, the county is taking appropriate measures to ensure water for the future, including high rate filter studies, conservation efforts, and locating potential future water intake sites. The current water treatment plant was originally designed to be re-rated to higher capacities as demands increase. Currently, OMI ( the WTP managers) is conducting high-rate studies with rates up to 6 gpm/ft2 as the first step in obtaining a capacity re-rating by the Georgia Environmental Protection Division (EPD). The GAEPD Minimum Standards allow up to 4 gpm/ft2 without additional high rate studies. Due to the high quality of the raw water source water (Lake Sidney Lanier), the filters have been designed to operate up to 8 gpm/ft2. Higher filter rates should be studied in the future as demands increase to postpone expansion of the water plant to meet peak demands.
Flow projections show that the county should continue expanding its water production capabilities. The following is a summary of each of the proposed milestones.1. Filter Uprating - Studies are already in progress. Forsyth County has received a temporary increase to 13.94 mgd for use during the peak summer period while the filter study is in progress. The filter uprating studies should be continued and a permanent rerating

FORSYTH COUNTY COMPREHENSIVE PLAN 6-2 FORSYTH COUNTY COMPREHENSIVE PLAN 6-3
C O M M U N I T Y F A C I L I T I E S
FIGURE 6.1: WATER AND SEWER SERVICE AREA FOR FORSYTH COUNTY
WATER AND SEWER SERVICE AREA FOR FORSYTH
COUNTY

FORSYTH COUNTY COMPREHENSIVE PLAN 6-4 FORSYTH COUNTY COMPREHENSIVE PLAN 6-5
C O M M U N I T Y F A C I L I T I E S
requested when the studies are completed.2. New Raw Water Intake - The county water demand may exceed the flow allotted by contractual obligations with the City of Cumming as early as 2004. In order to meet the water demands in the county, the new raw water intake must be upgraded by 2004. Following a temporary pump upgrade in 2003/2004, the next step is for the county to construct a new raw water intake. Typically, a two year construction period and an additional one year design period (including permitting, bidding, and traditional design) would be expected for a structure of this size. In addition, a new raw water main from the raw water intake to the existing WTP will be required. Conceptual design of the raw water intake, pump station , and pipeline was initiated in July 2002. Preliminary design of the raw water station and pipeline should begin in the fall of 2002 to meet this schedule.3. New Raw Water Main - The county will need to examine options for the raw water main routing to the WTP. In addition, the county may be required to obtain additional easements for the raw water main. The design (including securing easements) and construction of the raw water main could be completed in the same time frame as the raw water intake.4. Expansion to Eight Filters - The current projections show that the expansion to a minimum of six filters must be on-line in 2007 to meet the projected maximum day water demands. The expansion will require an upgrade/expansion to the proposed raw water pump station.5. Filter Uprating - Filter uprating studies to investigate increasing the filters to 8 gpm/ft2 should be started in 2010.
Sewerage System and Wastewater TreatmentBy the end of 2002, Forsyth County served 4,729 sewer customers. Sewer customer growth will continue to grow strong, as sewer capacity has become available. Sewer customer growth has averaged around 40 new accounts per month.
Existing Sewer Service AreaThe Forsyth County Sewer Service Area includes most but not all of the area outside the city limits of Cumming shown on Figure 6.1 on the preceding page. The service area is divided into drainage basin boundaries. The major drainage basin boundaries include the following:
•Big Creek Basin, which is located west of the Cumming Service Area and west of SR 141 to the county line.•Chattahoochee River Basin, which is located south of the Cumming Service Area to the border with Fulton County and east of SR 141 to the border with Gwinnett County.•Etowah River Basin, which is located in the northwestern corner of the county with most of the area north of SR 369.•Lake Lanier Basin, which is located in the northeastern quadrant of the county with SR 306 splitting the majority of the area.•Settingdown Creek Basin, which is split in two by the Cumming Service Area. A portion of this basin is located north of the Cumming service area and includes GA 400 and SR 9. The remaining portion of this basin is located west of the Cumming service area to the boundary with Cherokee County and is roughly south of SR 369 and north of SR 20.

FORSYTH COUNTY COMPREHENSIVE PLAN 6-4 FORSYTH COUNTY COMPREHENSIVE PLAN 6-5
C O M M U N I T Y F A C I L I T I E S
Currently, the Forsyth County Water and Sewer Department provides sewer service to a small portion of their service area. The majority of the existing service is located adjacent to the Fulton County line as a result of the explosive growth in that area and a contractual agreement with Fulton County for treatment of the wastewater. The existing wastewater flows in the southern portion of the county are in small, highly developed basins that flow into Fulton County and are metered at the Fulton County Boundary. This portion of Forsyth County is primarily residential with a few commercial customers. A small pocket is also served adjacent to the Cumming service area (near Bethelview Road) which is served by the City under a contractual agreement.
Existing Wastewater TreatmentForsyth County has contractual agreements for wastewater treatment with Fulton County and the City of Cumming, as well as ownership of capacity in two private treatment facilities. As part of these arrangements, Forsyth County collects the wastewater from its customers and discharges it into designated sewers which convey the wastewater to the appropriate treatment facility. Table 6.2 summarizes these agreements.
In addition to the contractual agreements shown in Table 6.1, privately owned treatment facilities also treat wastewater in residential developments. These facilities comprise a significant amount of the existing capacity in the county. There are seven privately owned systems that serve residents. These private systems and their permitted capacities are identified in Table 6.3.
All of the privately owned facilities manage their treated effluent through reuse on golf courses and landscaped areas or through land application on dedicated sites. None of these facilities are permitted to discharge to surface waters. In addition to the existing private treatment plants, a new private plant is currently under design. This new plant will be part of The Manor, a golf course development in Fulton and Forsyth Counties. The plant will be located in one of the sub-basins of the Big Creek Basin, located along the western edge of Forsyth County, north of Highway 9. The plant will be owned by Innovative Water Solutions, LLC and has the capacity of 300,000 gallons per day (gpd) available for Forsyth County to purchase. The ultimate total plant capacity would be 500,000 gpd.
The county is completing construction of its first water reclamation facility, the Fowler WRP. This facility is being designed to treat up to 2.5 MGD on a maximum month basis. The effluent from the facility will be reclaimed for irrigation uses on golf courses and landscaped areas. If these uses are not sufficient to manage all the treated flow from the WRP, then the rest of the flow will be irrigated on the county-owned Threatt site, located in the southeastern corner of Forsyth County along the Chattahoochee River. The Threatt site is an undeveloped tract of land that the county purchased in order to land apply wastewater effluent or build a treatment facility. The Fowler WRP is currently permitted by the Georgia Environmental Protection Division (EPD) to treat 1.25 MGD of wastewater on a maximum month basis.
Sewer System AssessmentIn an area containing predominantly residential and commercial facilities, as is the case

FORSYTH COUNTY COMPREHENSIVE PLAN 6-6 FORSYTH COUNTY COMPREHENSIVE PLAN 6-7
C O M M U N I T Y F A C I L I T I E S
TABLE 6.1: SUMMARY OF EXISTING WASTEWATER TREATMENT AGREEMENTS
System or FacilityContract Limit or Capacity
Owned(MGD)
Current Maximum Month Average Day Forsyth County Flows
(MGD)Fulton County Johns Creek Big Creek Total Fulton County
0.751.252.00
0.520.721.24
City of Cumming Bethelview Road/Hwy 9 NE Holtzclaw Total City of Cumming
0.350.150.50
0.0650.00
0.065Dick’s Creek* 0.60 0.00The Hamptons* 0.50 0.00Total 3.60 1.305
* private facilities
TABLE 6.2: PRIVATELY OWNED TREATMENT SYSTEMS SERVING RESIDENTS
FacilityPermitted Maximum Month Average Day Flow
Capacity(MGD)
Dick’s Creek LAS 0.76Habersham on Lanier LAS 0.11
The Hamptons LAS 0.275The Manor LAS New Facility*
Olde Atlanta Club LAS 0.262Polo Golf and Country Club LAS 0.338
Windermere LAS 0.25* Currently under design with a planned capacity of 0.3 MGD available for purchase by Forsyth County.
in the county’s Sewer Service Area, the wastewater flows can be directly related to the population. Flows from industrial facilities are not easily related to the population. However, industrial facilities that could generate large wastewater flows are not included in the Forsyth County land use plan. Also, with the concern for a potential water supply shortage in the region, adding any large volume water users within the region is not expected and should be discouraged. Therefore, the wastewater flow projections for the Sewer Service Area can be correlated to the future population projections. If any industrial facilities chose to locate in the Sewer Service Area, the availability of sewer and treatment capacity would need to be evaluated on a case-by-case basis.
Future Wastewater Flows to Sewer SystemsIn Forsyth County, the amount of wastewater that enters the public sewer system is much different from the total amount of wastewater that is generated. Of the 71,000 people currently located in the Sewer Service Area, slightly more than 11,000 are served by the county and

FORSYTH COUNTY COMPREHENSIVE PLAN 6-6 FORSYTH COUNTY COMPREHENSIVE PLAN 6-7
C O M M U N I T Y F A C I L I T I E S
nearly 5,000 are served by private treatment plants. This means that the current sewer system collects approximately 22 percent of the total wastewater generated. The remainder is treated by on-site treatment systems, primarily septic tanks at individual homes.
Goals for providing sewer service in the Sewer Service Area established that, in general, 85 percent of the new population would be sewered while 25 percent of the existing unsewered population would be converted to sewers by the year 2025 at a conversion rate of 5 percent per 5 year increment. However, allowances were made to adjust for portions of the service area that are not expected to develop as rapidly, have low projected population densities, or where the installation of sewers would be more difficult. Therefore, a phasing plan was also established as follows:
• Big Creek, Chattahoochee River and Upper Settingdown Creek (Basin 38): A goal of 85 percent of the new population sewered beginning in 2005 and remaining constant through 2025 was established for these basins. The existing unsewered population would be converted to sewers at a rate of 5 percent per 5 year increment.
• Etowah River: Only Basins 28 and 33 are expected to have sewer service by 2025 and these were assumed to be private systems, created as a part of the development of a subdivision.
• Lake Lanier: This drainage basin was split into two portions based on the anticipated growth rates. The first group, consisting of Basins 6, 24, 29, 35, and 39, had a goal of 20 percent of the new population sewered beginning in 2005 and increasing to 85 percent of the new population by 2015 and remaining at the same level through 2025. The existing population would be converted to sewers at a rate of 5 percent per 5 year increment beginning in 2010.
• Settingdown Creek: This drainage basin was split into two portion based on anticipated growth rates. Upper Settingdown Creek (Basin 38) was discussed previously. Lower Settingdown Creek includes Basins 26 and 37, which have a goal of 50 percent of the new population sewered beginning in 2010, increasing to 85 percent by 2015 and remaining constant through 2025. The existing population would be converted to sewers at a rate of 5 percent per 5 year increment beginning in 2010.
The total sewered wastewater flow in the sewer service area is expected to increase from 2.2 MGD to 19.7 MGD over the planning period. However, private systems are expected to continue to play a role in Forsyth County. Over time, these facilities will exceed their useful lives and may develop maintenance problems. When this occurs, these private systems could connect to a nearby Forsyth County sewer and take the treatment facility out of service. Conversely, the opportunity may arise for the County to take over the operation of some of the private facilities with the possibility of expanding them and providing additional service in the area.
In December 2002, a Sewer System Master Plan for the Forsyth County Sewer Service

FORSYTH COUNTY COMPREHENSIVE PLAN 6-8 FORSYTH COUNTY COMPREHENSIVE PLAN 6-9
C O M M U N I T Y F A C I L I T I E S
Area was approved by the Forsyth County Board of Commissioners. This Plan presents alternatives and outlines a recommended strategy for the extension and development of the Forsyth County wastewater collection and treatment system. The Plan recommends the Sewer Service Plan shown in Figure 6.2. The entire document is included in Appendix C.

FORSYTH COUNTY COMPREHENSIVE PLAN 6-8 FORSYTH COUNTY COMPREHENSIVE PLAN 6-9
C O M M U N I T Y F A C I L I T I E S
FIGURE 6.2: RECOMMENDED SEWER SERVICE PLAN (ALTERNATIVE 10)

FORSYTH COUNTY COMPREHENSIVE PLAN 6-10 FORSYTH COUNTY COMPREHENSIVE PLAN 6-11
C O M M U N I T Y F A C I L I T I E S
SOLID WASTE MANAGEMENT
Inventory of Waste DisposalThe Forsyth County Hightower Landfill located on Old Federal Road was closed in July of 2002. During the month of the landfill closing, a privately owned landfill opened its doors to county residents and private haulers for the disposal of household waste, construction and demolition debris, and “white goods”. Forsyth County is host to this privately owned Subtitle D landfill site. The privately owned site is owned by Advanced Disposal/Federal Road, LLC d/b/a Eagle Point Landfill (EPLF). The site is located on Federal Road, adjacent to the closed county landfill site. Total site comprises of 700 acres, with a 163-acre landfill footprint. The State, Georgia Environmental Protection, Land Protection Branch monitor this site. EPLF has the most current federal & state environmental controls in place to protect the environment. EPLF has two agreements with Forsyth County. One agreement provides a preferential disposal rate for ten years for county directed facilities. The second agreement, as required by state law, provides a host fee to Forsyth County. The host fee paid to Forsyth County is calculated at the rate of $1/per ton for each ton deposited in the landfill site. EPLF also provides tonnage deposited in the landfill site to the Georgia EPD.
In February of 2003, Greenleaf Recycling established themselves as a privately owned construction and demolition landfill. The landfill will accept appropriate materials from private waste haulers and individual county residents. Greenleaf landfill has one disposal area for construction and demolition materials and another for “earth-like” products such as plant debris, tree limbs and leaf litter. This landfill is located on Highway 306 (Keith Bridge Road), adjacent to American Proteins.
Recycling CollectionThe County has two manned recycling centers where residents can bring their recyclable material free of charge and residential household waste for twenty-five cents a bag. The Tolbert Street Recycling Center is located at 351 Tolbert Street in downtown Cumming. The Old Atlanta Road Recycling Center is located at 3678 Old Atlanta Road in the south end of the county. Hours for both centers are Monday through Saturday 7:30AM to 5:00 PM and both close on major holidays. Forsyth County hauls the solid waste from the centers to Eagle Point Landfill and the recyclable items are transported to private material recovery and processing facilities.
In 2002, the Forsyth County Recycling Centers collectively received an average of 200 tons of household waste per month, 2090 lbs of aluminum per month, 62,154 lbs of newspapers per month, 10,757 lbs of plastic, 30,128 lbs of glass, 7,740 lbs of office paper, 19,945 lbs of magazines, 6,714 lbs of phonebooks, 38,500 lbs of cardboard, 2,090 lbs of aluminum cans, 3,150 lbs of tin/steel cans, and 718 gallons of oil.
Inventory of Waste CollectionAt present, there are seventeen private collection companies. These companies collect household waste and industrial waste throughout the County. Out of the seventeen, seven offer recycling. The City of Cumming has one (1) waste and industrial waste hauler

FORSYTH COUNTY COMPREHENSIVE PLAN 6-10 FORSYTH COUNTY COMPREHENSIVE PLAN 6-11
C O M M U N I T Y F A C I L I T I E S
and do not offer recycling. These collection companies are required to obtain a county business license and a permit to transport waste to a landfill. Table 6.3 contains a list of the companies that transport waste in Forsyth County*. The locations of the landfills and recycling centers are shown in Figure 6.3.
TABLE 6.3: WASTE TRANSPORT COMPANIESCompany Residential-Recycling Commercial Industrial C&DB&B Waste m yesBFI m yes m m mCaine Sanitation m noHeard Sanitation m noHolbrook m yes m mJones Sanitation m noLonghorn Sanitation m no
McCoy Sanitation m noPatriot Waste m yes m mUnited/Robertson m yes m m mMooney m noWhitemire m noBullDog m mEvans m m
Sanitation Solutions m yesWaste Mgt m yes m m mG&G m m m
* Companies listed are known entities; there may be other companies that are not listed
Inventory of Waste ReductionAt present, Forsyth County’s waste reduction efforts at two (2) county recycling centers include the recycling of newspapers, office paper, phonebooks, magazines, cardboard, aluminum cans, steel/tin cans, #1 and #2 plastic, glass, motor vehicle oil, alkaline batteries, rechargeable batteries and printer cartridges. Additionally, 21 of 23 county schools and six of the Forsyth County Fire Stations accept mixed paper and newspaper for recycling. Several grocery stores in the county accept paper bags, plastic bags and polystyrene trays for recycling. Several office supply stores in the county accept printer cartridges for recycling and allow customers to return polystyrene peanuts. The county Home Depot and Lowe’s Home Improvement Stores accept rechargeable batteries for recycling. The Forsyth County administration building and courthouse recycle all mix papers, office paper, cardboard, magazines and phone books.
To successfully reduce our solid waste, the residents of the county have the opportunity to be educated on the importance of natural resources, conservation and the benefits of recycling. The education programs can be provided to businesses, schools, civic organizations and county citizens. Information and guidelines regarding source reduction and recycling is available from the Resource Coordinator of Keep Forsyth County Beautiful.

FORSYTH COUNTY COMPREHENSIVE PLAN 6-12 FORSYTH COUNTY COMPREHENSIVE PLAN 6-13
C O M M U N I T Y F A C I L I T I E S
FIGURE 6.3: LANDFILL AND RECYCLING SITES

FORSYTH COUNTY COMPREHENSIVE PLAN 6-12 FORSYTH COUNTY COMPREHENSIVE PLAN 6-13
C O M M U N I T Y F A C I L I T I E S
Data for municipal solid waste and recycling collected in Forsyth County are received from Eagle Point Landfill and the Forsyth County Recycling Centers. This data can be helpful for assessing the waste reduction needs of the county. Currently waste haulers who work in the county are not required to report the amount of waste or recycled materials they collect from Forsyth County residents.
The county is currently completing the Solid Waste Management Plan as a separate document. The document was prepared in accordance with the Georgia Comprehensive Solid Waste Management Act outlined in the Minimum Standards and Procedures for Solid Waste Management.
GENERAL GOVERNMENT
InventoryForsyth County Administration Building - Located at 110 East Main Street. The administration building houses the following departments:Voter RegistrationBoard Of CommissionersAdministrationFinanceLaw DepartmentInformation SystemsHuman ResourcesTax CommissionersTax AssessorsPublic RelationsPublic BuildingsPlanning & Development Planning & Development, InspectionsPlanning & Development, Business LicenseEngineering DepartmentWater Business Office & EngineeringForsyth Clean and BeautifulForsyth County Courthouse - Located at 100 Courthouse Square. The courthouse contains the following:Superior CourtClerk of CourtDistrict AttorneyState CourtState Court SolicitorSheriff Court ServicesForsyth County Courthouse Annex - Located at 112 West Maple Street. The annex building contains:Probate CourtJuvenile Court

FORSYTH COUNTY COMPREHENSIVE PLAN 6-14 FORSYTH COUNTY COMPREHENSIVE PLAN 6-15
C O M M U N I T Y F A C I L I T I E S
Clerk of CourtVictim Witness AssistanceDistrict Attorney’s OfficePurchasing Department - Located at 118 Castleberry Rd.Forsyth County Government Building - Located on 101 East Main Street. Contains the following:Pre-Trial ServicesSheriff Dept. Office Administration Dept.Public Relations OfficersCASA OfficesForsyth County Magistrate Court - Located at 121 Dahlonega Street. Forsyth County Extension Service - Located at 101 E. Maple Street. Also houses the Natural Resources and Soil Conservation Service and Emergency Management Service.Forsyth County Sheriff’s Department Jail Detention Center - Located at 202 Veterans Memorial Blvd/202 Old Buford RoadParking Deck - 246 parking spaces in downtown Cumming.Sharon Spring Offices Tag Department - 1950 Sharon Road.Forsyth County Department of Family & Children - 426 Canton Hwy. Forsyth County Mental Health - 125 North Corner Parkway.Forsyth County Public Health - 428 Canton Hwy. Forsyth County Building Shop - 351 Tolbert Street.Forsyth County Senior Citizens Center - 595 Dahlonega StreetForsyth County Fleet Maintenance - 4140 County WayForsyth County Recycling Center - 351 Tolbert Street.Forsyth County Recycling Center - 3678 Old Atlanta RoadSheriff Dept. Firing Range - 524 Haw Creek Road
AssessmentAs the county’s population continues to grow, there will be a demand for more government services. This will lead to an increase in government employees and building space. The county is currently conducting an audit to project facility needs to 2018.
SHERIFF’S DEPARTMENT
The Capital Improvements Element provides an inventory and assessment of the Sheriff’s Department.
FIRE PROTECTION AND EMERGENCY MANAGEMENT SYSTEM
Fire protection for the County is provided by the Forsyth County Fire Department. The fire department is a combination department with both paid and volunteer firefighters. At present there are 78 career firefighters and 100 plus volunteers. Also there are 20 employees working in administration.

FORSYTH COUNTY COMPREHENSIVE PLAN 6-14 FORSYTH COUNTY COMPREHENSIVE PLAN 6-15
C O M M U N I T Y F A C I L I T I E S
The Forsyth County Fire Department operates 15 fire stations throughout the County. Ten of these stations are staffed by paid firefighters along with volunteers and five stations are staffed by volunteers only They also provides fire protection for the City of Cumming Plan review is handled by the Deputy Fire Marshall at Headquarters. The Fire Department Training Division consists of a Training Chief, a part-time Fire Instructor, and a part-time Emergency Medical Instructor. The Training Division is located within the Fire Department Headquarters on Settendown Road. Training facilities include: a classroom for small classes, an auditorium for large classes, library, 2 story live fire training facility, 5 story training tower (for repelling, search/rescue, etc.), a vehicle fire simulator, above/below confined space facilities, ventilation simulator, and a drafting pit.
The Forsyth County Swiftwater Rescue Team is currently operated out of Station 15 on Buford Highway. The team comprised of three engine companies and a rescue. They cover river related rescues on the Chattahoochee River from Buford Dam to McGinnis Ferry Road. There are 23 technician level team members. Rescue equipment includes an IRB or (Inflatable Rescue Boat), with a jet driven 35 horsepower motor and enough hardware to operate three separate rescue operations at once.
The Forsyth County Fire Safety Division is in charge of fire education programs. The Division’s main emphasis gravitates towards school age children. Along with the basic fire safety programs, we have our “Fire Safety House”. With this house we teach children what to do in case there is a fire in their home. The FDFC offers free smoke detectors and installation to senior citizens and lower income families. The staff is also ready and willing to assist any member of the community by checking their smoke detectors and addressing any concerns.
Other programs include:
- Church fire prevention and arson awareness- Pre-School fire safety- Juvenile Fire Setters Program - Fire Station tours- Fire safety for Senior Citizens- Courtesy home fire inspections- Fire extinguisher training
The Rural-Metro Ambulance Service is the emergency ambulance company serving the county. There are four 24-hour vehicles on call and a full-time staff of 12. The EMS service is based out of the fire stations spread across Forsyth County.
The Fire Station and EMS locations are shown of Figure 6.2, and descriptions and coverages are listed below:
Forsyth County Fire Headquarters/Administration3480 Settendown Road

FORSYTH COUNTY COMPREHENSIVE PLAN 6-16 FORSYTH COUNTY COMPREHENSIVE PLAN 6-17
C O M M U N I T Y F A C I L I T I E S
Attached to Fire Station 12. Located at this facility are the Fire Maintenance Shops, the Fire Prevention Bureau, and Fire Training Division.
Station 1212 Veterans Memorial Blvd.This station has 24 hour coverage with 3 firefighters per 24 hour shift. Apparatus housed at this station include: 1 engine, 1 –75 foot tower/ladder, & 1 light/air truck. Battalion 1 operates from this station along with 1 Rural-Metro Ambulance.Station 22633 Atlanta HighwayThis station has 24 hour coverage with 2 firefighters per 24 hour shift. Apparatus housed at this station include: 1 engine, 1 tanker and 1 Rural-Metro Ambulance.Station 3 4125 Dr.. Bramblett This station has 24 hour coverage with 2 firefighters per 24 hour shift. Apparatus housed at this station include: 1 engine and 1 tanker.Station 43805 Canton HighwayThis station has 24 hour coverage with 3 firefighters per 24 hour shift. Apparatus housed at this station include: 1 engine and 1 tanker.Station 52425 Holtzclaw RoadThis station has coverage by volunteer firefighters. A 24 hour staffed station will respond if volunteers are unavailable. Apparatus housed at this station include: 1 engine and 1 tanker.Station 6 5885 Highway 9 NorthThis station has coverage by volunteer firefighters. A 24 hour staffed station will respond if volunteers are unavailable. Apparatus housed at this station include: 1 engine and 1 tanker.Station 7 5775 Dahlonega HighwayThis station has coverage by volunteer firefighters. A 24 hour staffed station will respond if volunteers are unavailable. Apparatus housed at this station include: 1 engine and 1 tanker.Station 86015 Keith Bridge RoadThis station has 24 hour coverage with 2 firefighters per 24 hour shift. Apparatus housed at this station include: 1 engine and 1 tanker.Station 97385 Browns Bridge RoadThis station has 24 hour coverage with 2 firefighters per 24 hour shift. Apparatus housed at this station include: 1 engine, 1 tanker, 1 service truck, and 1 Rural-Metro Ambulance.Station 103680 Old Atlanta RoadThis station has 24 hour coverage with 3 firefighters per 24 hour shift. Apparatus housed at this station include: 1 engine, 1 tanker, and 1 Rural-Metro Ambulance.

FORSYTH COUNTY COMPREHENSIVE PLAN 6-16 FORSYTH COUNTY COMPREHENSIVE PLAN 6-17
C O M M U N I T Y F A C I L I T I E S
FIGURE 6.4: FORSYTH COUNTY FIRE STATIONS AND EMS

FORSYTH COUNTY COMPREHENSIVE PLAN 6-18 FORSYTH COUNTY COMPREHENSIVE PLAN 6-19
C O M M U N I T Y F A C I L I T I E S
Station 118115 Lanier DriveThis station has coverage by volunteer firefighters. A 24 hour staffed station will respond if volunteers are unavailable. Apparatus housed at this station include: 1 engine.
Station 123480 Settendown RoadThis station has 24 hour coverage with 3 firefighters per 24 hour shift. Apparatus housed at this station include: 1 engine, 1 heavy rescue unit, 1 brush truck, 1 pontoon boat with dive trailer, and 1 Rural-Metro Ambulance.
Station 131525 Dr. Bramblett RoadThis station has coverage by volunteer firefighters. A 24 hour staffed station will respond if volunteers are unavailable. The ambulance that responds from this station is staffed by Rural-Metro and provides 24 hour coverage. Apparatus housed at this station include: 1 engine, 1 service truck, and 1 Rural Metro Ambulance.
Station 14800 McFarland RoadThis station has 24 hour coverage with 3 firefighters per 24 hour shift. Apparatus housed at this station include: 1 engine, 1-100 foot ladder truck, and 1 Hazardous Material truck and trailer.
Station 151525 Buford HighwayThis station has 24 hour coverage with 3 firefighters per 24 hour shift. Apparatus housed at this station include: 1 engine and 1 swift water rescue truck and boat.
AssessmentThe Capital Improvements Element provides an assessment of the Fire Department and Emergency Management System.

FORSYTH COUNTY COMPREHENSIVE PLAN 6-18 FORSYTH COUNTY COMPREHENSIVE PLAN 6-19
C O M M U N I T Y F A C I L I T I E S
RECREATION FACILITIES
The Parks and recreation Department oversees all recreational facilities in the county. The Department completed a Comprehensive System-Wide Recreation Master Plan for the years 2001 through 2006. It includes short-term guidelines for upgrading existing recreation facilities and developing new facilities and activities to meet the needs of the community.
Recreation SitesWithin Forsyth County there are eight developed recreation sites and four undeveloped recreation sites owned by Forsyth County and operated by the Parks and Recreation Department. The following paragraphs give a description of each parks, and their locations are shown in Figure 6.6.
Pool’s Mill ParkPoole’s Mill Park is a passive use, historic neighborhood park located on Poole’s Mill Road close to SR 369 in the northwest portion of the county. Constructed in 1995, Poole’s Mill Park occupies a land area of approximately 10 acres. The park is devoted entirely to passive recreation and utilization is low to moderate.
The park is located on a creek and includes a recently restored covered bridge, a walking trail, creek access, a garden area with benches and a monument, playground, a covered pavilion with picnic tables and cooking grills, a horseshoe pit and restrooms. A portion of the site remains undeveloped.
Bennett ParkBennett Park, located on Burris Mill Road is the county’s oldest recreation site, constructed in 1978. The site is 30 acres and is devoted to active use. Facilities within the park include: five youth baseball/softball fields, one football field, two tennis courts, a playground & picnic pavilion.
Central ParkCentral Park, built in 2001, with SPLOST funding, is an 85 acre dynamic sports complex providing a variety of recreational opportunities. In the planning of the park, the Board of Commissioners recognized the need for a large, safe and easy-access playground. The result was a 1 +/- acre playground facility with safe play structures for all ages. The playground is one of the largest in the South. The Recreation Center opened in January, 2003 and provides Forsyth’s first indoor activity center. Facilities at the park include: Five youth baseball/softball fields, four adult softball fields, three soccer fields, eight tennis courts, a twenty-seven hole disc golf course, a playground, picnic pavilion, & recreation center. The recreation center includes two gymnasiums, fitness area, mezzanine walking area, game room, arts & crafts room, dance room, community room with kitchen.
Coal Mountain ParkLocated adjacent to Settingdown Road close to GA 400, Coal Mountain Park is a 26 acre site that is approximately ten years of age. Facilities include

FORSYTH COUNTY COMPREHENSIVE PLAN 6-20 FORSYTH COUNTY COMPREHENSIVE PLAN 6-21
C O M M U N I T Y F A C I L I T I E S
eight youth baseball/softball fields, one soccer field, two tennis courts, two playgrounds, a walking trail & picnic pavilion.
Midway ParkLocated on Post road in western Forsyth County, Midway Park is a 46 acre site constructed in 1985. Except for two acres, this park is devoted to active use. Midway Park contains baseball/softball fields, a football field, batting cages, a multi-purpose field, basketball and tennis courts, a large covered pavilion, community building, a playground and picnic area, a small nature trail, and support facilities. There are 20 acres of additional undeveloped land adjacent to Midway Park.
Sharon Springs ParkConstructed in 1994, Sharon Springs Park was the first sports complex in the county and was built to provide for the remarkable growth the county had undergone. Built with SPLOST funding, the park has had significant additions- a community building to answer indoor programing needs, day camps and cultural activities, and a football/soccer concession building. SSP remains the most consistently used park in the county.
Sawnee Mountain ParkSawnee Mountain Park is defined by its spectacular view of Sawnee Mountain. Built in 1998, this 44 acre park was designed as a sports complex. In 2000, a large playground and community building was added. Facilities include: eight youth baseball/softball fields, one senior baseball field, one football field, one soccer field, outdoor basketball courts, four tennis courts, a playground, walking trail, picnic pavilion, community building/kitchen. Sawnee Mountain Preserve750 acre site that is presently being developed for walking/hiking trails, restrooms & pavilion and parking. The park will blend the scenic surroundings and emphasize the cultural history of the area.
South Forsyth Soccer ComplexThis 31 acre park opened in 2003. It has four lighted soccer fields and one practice field.
Chestatee Community BuildingThe community building is the only special use area in Forsyth County. The building is located on a two-acre site on Keith Bridge Road and is used approximately 12-14 times per year. The building contains one meeting room, a kitchen and restrooms.
Undeveloped ParksThere are two park sites that have been acquired but not developed yet by the Parks and Recreation Department. One 87 acre tract is located in the Windermere mixed-use development. It is being master planned as a community park, with approximately 22 acres to be developed for active use and the remaining 65 acres will be permanently protected as open space under the Forsyth County Greenspace Program.

FORSYTH COUNTY COMPREHENSIVE PLAN 6-20 FORSYTH COUNTY COMPREHENSIVE PLAN 6-21
C O M M U N I T Y F A C I L I T I E S
The other site is adjacent to the future Fowler Water Treatment Facility. The 60 acre tract is anticipated to be developed as a community park, to include a wide range of both active and passive use facilities.

FORSYTH COUNTY COMPREHENSIVE PLAN 6-22 FORSYTH COUNTY COMPREHENSIVE PLAN 6-23
C O M M U N I T Y F A C I L I T I E S
FIGURE 6.5: FORSYTH COUNTY PARKS

FORSYTH COUNTY COMPREHENSIVE PLAN 6-22 FORSYTH COUNTY COMPREHENSIVE PLAN 6-23
C O M M U N I T Y F A C I L I T I E S
School Recreation AreasThere is no universal agreement in place with the Forsyth County School Board for joint-use of all school recreation facilities by the Parks and Recreation Department. Instead, joint-use agreements are negotiated with individual school Principles’ for use of school recreation areas. At present, the Parks and Recreation Department utilizes facilities at eight school sites throughout the county. School recreation areas and the facilities used are as follows:
Midway Elementary SchoolGymnasium is used for gymnastics programs.
North Forsyth Middle SchoolOne indoor basketball court is used for adult men’s basketball.
Otwell Middle SchoolIndoor multi-purpose court is used for adult volleyball (two courts) and adult men’s basketball.
South Forsyth Middle SchoolGymnasium is used for youth basketball.
Vickery Creek Middle SchoolGymnasium is used for gymnastics programs.
Central Forsyth High SchoolThe old gymnasium is used for youth basketball.
North Forsyth High SchoolGymnasium (one court) is used for volleyball.
South Forsyth High SchoolGymnasium (one court) is used for youth basketball.
Corps of Engineers Recreation AreasWithin the Forsyth County portion of Lake Lanier, the COE maintains over 600 acres of recreation sites. Approximately of this acreage is devoted to campsites and day use facilities.
The camping areas include walk-in campsites, showers, boat ramps, playgrounds, group camping areas, picnic tables, swimming areas, restrooms and support facilities. All facilities are accessible to the handicapped.
Day use areas consist of boat ramps, playgrounds, picnic tables, restrooms and support facilities. Some of the day use areas include beaches and permit swimming. Overnight camping is not permitted in day use areas.

FORSYTH COUNTY COMPREHENSIVE PLAN 6-24 FORSYTH COUNTY COMPREHENSIVE PLAN 6-25
C O M M U N I T Y F A C I L I T I E S
Recreation ProgramsThe Forsyth County Parks and Recreation Department offers a wide range of athletic and non-athletic programs to residents and non-residents of the county. Program offerings are well publicized in the Parks and Recreation Department’s brochure, which is published every four months. This brochure contains a complete listing of program offerings including a description of each program, age groups, locations, times, fees, and registration forms.
Youth AthleticsYouth athletic programs are offered on a year around basis and utilize county parks and school athletic facilities. All programs are coordinated through the Parks and Recreation Department and utilize volunteers in the capacity of coaches and team assistants.
Athletic programs for youth generally include ages five through early teen years and include baseball, softball, soccer, football, tennis, basketball, gymnastics and cheer leading. Youth baseball and softball clinics are also offered on a seasonal basis.
The majority of youth athletic programs have not as yet reached capacity. The primary exception is the youth soccer program that is presently at enrollment limits. The gymnastics program uses a wait-list for participants.
Adult SportsThe county’s adult sports program includes organized activities and league play for men’s, women’s and coed teams. These programs utilize county park sites and indoor facilities at several schools.
Sports programs offered for adult participation include: softball, flag football, basketball, indoor/outdoor volleyball and tennis (ALTA/USTA and Inner county Leagues). None of the adult sports programs are presently at enrollment capacity.
Senior CitizensThe Parks and Recreation Department provide several programs for seniors. These programs are passive in nature, and no active senior sports programs are presently being offered. Senior’s programs are generally offered at Midway Park and include bingo, board and card games, arts and crafts instruction and covered dish luncheons. An additional feature of the county’s senior’s program is periodic bus trips for sightseeing and shopping. Senior citizen program enrollment has not yet reached capacity.
CampsThe County’s camp program is two-phased. Camp offerings include Summer Day Camp for children and special interest camps focusing on sports and arts and crafts.
The summer Day Camp program is offered on a first come, first serve basis and is sometimes over-subscribed. The Summer Day Camp program consists of approximately six weekly sessions and is held at Midway Park.

FORSYTH COUNTY COMPREHENSIVE PLAN 6-24 FORSYTH COUNTY COMPREHENSIVE PLAN 6-25
C O M M U N I T Y F A C I L I T I E S
Special interest camps are also held during summer months at county parks and at school recreation sites, the focus of the special interest camps includes tennis, golf, softball, cheer leading, drama, clay modeling, art introduction, history, safety and other activities as interest dictates.
Art, Culture and Special Interest ProgramsThe Parks and recreation Department offers many art, cultural and special interest programs on a seasonal basis. These programs are popular and some require use of a wait list due to interest levels.
Programs offered in these areas include art instruction (drawing, acrylics, clay, Christmas and nature crafts, fabric design stone design, basket weaving, painting, decoupage, quilting, tatting, home decoration and candy making) and dance (clogging, creative dance, ballroom, swing and shag). Special interest programs include kid’s cooking, kid’s night out, horseback riding, dog obedience, first aid/ CPR and coaches clinics and certification programs.
Special EventsThe Parks and Recreation Department sponsors several county wide special events during the year. These are popular and well attended by all age groups. Some of the more popular special events include the Special Olympics, County-Wide Field Day, the County-Wide Track Meet and the “Bark-In-The-Park” dog show event.
Assessment of Recreational FacilitiesAn assessment of the county’s recreational facilities is included in the Capital Improvments Element.
PUBLIC HEALTH FACILITIES
Forsyth County residents have a number of health facilities available to them. Within the City of Cumming limits at 1200 Baptist Medical Center Drive, Northside Hospital–Forsyth (formerly Baptist Medical Center) is a 41-bed acute care hospital. Northside Hospital–Forsyth has a staff of more than 400 employees and 175 physicians and serves Forsyth, Dawson, North Fulton, west Gwinnett, east Cherokee and parts of Hall counties. The facility has ICU, certified trauma emergency room, inpatient and out-patient surgery, radiology and life flight unit. Next to the hospital is a medical office building which houses a cardiac and physical rehabilitation center, home health services, hospice, and ministry.
Other hospitals in the area include:
Northwoods Medical Specialists1230 Bald Ridge Marina Road. This health care facility offers a wide range of diagnostic services, affiliated physician specialists and community health education classes.

FORSYTH COUNTY COMPREHENSIVE PLAN 6-26 FORSYTH COUNTY COMPREHENSIVE PLAN 6-27
C O M M U N I T Y F A C I L I T I E S
Lanier Park Hospital 275 White Sulphur Rd., Gainesville. Lanier Park Hospital is an acute care facility offering a variety of outpatient procedures, 24 hour emergency room, MRI, neurosurgery, pulmonary medicine, pain management and women’s health.
North Fulton Regional Hospital 3000 Hospital Blvd., Roswell. This is a full-service, 167 bed hospital with a women’s health center, imaging center, level II adult trauma center, pain control center, critical care, cardio unit and sleep disorder center.
Northeast Georgia Medical Center 743 Spring Street, Gainesville. A full service hospital with in and out patient services, a cancer care unit, cardiac rehabilitation, home health services, mental health care, women’s health, surgery and diabetes care.
Northside Hospital - Cherokee 201 Hospital Road, Canton
Northside Hospital - Sandy Springs 3400 Old Milton Parkway, Alpharetta
Chestatee Regional Hospital 227 Mountain Drive, Dahlonega
The Forsyth County Health Department is a referral and basic screening facility. They offer a variety of services including family planning, WIC, a woman’s clinic, screening for HIV and STDs, screening for diabetes, giving shots and testing fro tuberculosis. The department’s goal for expanding outreach programs has been met through the hiring of a new nurse and going out into the community and to businesses to test for high blood pressure, diabetes and low blood sugar.
The Forsyth County Mental Health Department has a medical facility for mental health and a rehabilitation center. They also offer classes to educate people about life skills, substance abuse and anger management.
Forsyth County is one of only two counties in Georgia that have more than 100,000 residents and less than 100 beds available in their local hospital. As the population continues to grow, the area hospitals will need to grow as well. Additional beds will be needed as well as an expansion of the current emergency department space, laboratory and inpatient pharmacy. The county’s health departments will also need to expand as the demand for services increases.

FORSYTH COUNTY COMPREHENSIVE PLAN 6-26 FORSYTH COUNTY COMPREHENSIVE PLAN 6-27
C O M M U N I T Y F A C I L I T I E S
EDUCATIONAL FACILITIES
Public School SystemThe Forsyth County Board of Education is the governing body of the Forsyth County School System. The primary role of the Board is the legislation of the school system politics, which are executed under the direction of the school Superintendent. The Forsyth County Board of Education consists of five members who are elected at-large to staggered, four-year terms representing individual districts. Currently, there are twenty-three school facilities including fourteen primary/elementary schools, five middle schools, three high schools and one alternative school. In addition, there are twelve future schools planned across the county. The locations of the existing and proposed school sites are presented on Figure 6.4. For the 2002-2003 school year, five of the county’s schools were over capacity. In Table 6.13, it is projected by the School Board that nine of the County’s thirty-three schools will be over capacity.
The Forsyth County school system maintains a high standard of excellence. All 23 of the existing schools are accredited by the Southern Association of Colleges and Schools and have exceeded the standards as defined and measured by the Georgia Department of Education. Seven schools are Georgia Schools of Excellence including: Chattahoochee, Midway and Big Creek elementary schools; two middle schools: North Forsyth and Otwell; and two high schools: Forsyth Central and North Forsyth. The Schools of Excellence Program began in 1984. The nomination process focuses on several vital areas: student focus and support; school organization and culture; challenging standards and curriculum; active teaching and learning; professional community; leadership and education vitality; school, family and community partnerships; and indicators of success. In 2001, Big Creek Elementary was named a National Blue Ribbon School. Otwell Middle was also named a National Blue Ribbon School and a Georgia School of the Future. North Forsyth High School is one of six high schools in the nation to be recognized as “Preparing America’s Future” under the United States Department of Educations’ New American High Schools Program.
SECONDARY & ELEMENTARY (PRIVATE)In addition to the public school system, Forsyth County residents have access to a number of private schools. These include:Covenant Christian Academy 6905 Post Road Cumming Cornerstone 5040 Shady Grove Road Freehome Elementary Canton Hwy. Canton Greater Atlanta Christian 1575 Indian Trail Lilburn Norcross Horizon Christian Academy 610 Canton Hwy. Canton Ivy League Montesssori 1791 Kelly Mill Road Cumming Lakeview Academy 796 Lakeview Academy Dr.. NE Pinecrest Academy, 955 Peachtree Parkway,Cumming, 30041
UNIVERSITIES & COLLEGESLanier Techincal Institute Forsyth campus is located on Majors Road. In 2003, approximately 1,500 credit and noncredit students were enrolled in the college. The school offers a varie

FORSYTH COUNTY COMPREHENSIVE PLAN 6-28 FORSYTH COUNTY COMPREHENSIVE PLAN 6-29
C O M M U N I T Y F A C I L I T I E S
FIGURE 6.7: FORSYTH COUNTY CURRENT AND FUTURE SCHOOL SITES
Source: http://www.forsyth.k12.ga.us/admin/facilities/countymap.pdf

FORSYTH COUNTY COMPREHENSIVE PLAN 6-28 FORSYTH COUNTY COMPREHENSIVE PLAN 6-29
C O M M U N I T Y F A C I L I T I E S
TABLE 6.12 SCHOOL CAPACITY
Source: http://www.forsyth.k12.ga.us/admin/facilities/countymap.pdf
��������������
��������������������������������������������������������������������������������������
�������� ��������� ��������� ��������� ��������� ��������� ��������� �����������������
������������� ��� ��� ��� ��� ��� ��� ��� ������������������ ���� ���� ���� ��� ��� ��� ��� ����������������� ��� ��� ��� ��� ��� ��� ��� ���
� �������������� ���� ��� ��� ���� ���� �������������� ���� ��� ��� ��� ��� ��� ��� ������������� ��� ��� ��� ��� ��� ��� ��� ������������� ��� ��� ��� ��� ��� ��� ��� ���
� ��������������� ���� ��� ���������������� ���� ��� ��� ���� ���� ���� ��� ��������� ��� ��� ��� ��� ��� ��� ��� ���������� ���� ���� ���� ���� ���� ��� ��� ������������ ��� ��� ��� ��� ��� ��� ��� ���
� ������������ ���� ���� ���� ��� ���� ����� ��������������� ���� ��� ���� ����
��������� ��� ���� ���� ��� ��� ��� ��� ��������������� ���� ���� ���� ��� ���� ���� ��� ����
� ��������������� ���� ��� ������������������ ���� ��� ���� ���� ��� ���� ��� ��������� ���� ���� ���� ���� ���� ���� ���� ����
� ��������������� ���� ���� ���� ���� ����
������ ����� ����� ����� ����� ����� ����� ����� �����
�������� ��������� ��������� ��������� ��������� ��������� ��������� ��������������� ��������
� ������ ���� ��� ��� ��� ��� �������� ���� ���� ���� ��� ��� ��� ��� ����������� ���� ��� ��� ��� ��� ��� ���� ����������������� ���� ��� ��� ���� ��� ��� ��� ���������� ���� ��� ��� ��� ��� ��� ��� ���
� ������ ���� ��� ��� ��� ��������� ���� ��� ��� ��� ��� ��� ��� ������������� ���� ��� ��� ��� ���� ���� ��� ���
� ������ ���� ��� ����
������ ���� ���� ���� ���� ���� ���� ���� ����
�������� ��������� ��������� ��������� ��������� ��������� ��������� �����������������
������������� ���� ���� ���� ���� ���� ���� ���� ����� ������������ ���� ���� ���� ���� ����
��������������� ���� ���� ���� ���� ���� ���� ���� ����������������� ���� ���� ���� ���� ���� ���� ���� ����
� ����������������� ���� ���� ����
������ ���� ���� ���� ���� ���� ���� ���� �����
������������ ����� ����� ����� ����� ����� ����� ����� �����
��������������������
������������������������������
������������
�������������
�����������

FORSYTH COUNTY COMPREHENSIVE PLAN 6-30 FORSYTH COUNTY COMPREHENSIVE PLAN 6-31
C O M M U N I T Y F A C I L I T I E S
of programs in nursing, dental hygiene, auto repair and criminal justice. North Georgia College and State University offers night classes at the Board of Education Building and North Forsyth high School. Other nearby facilities include:Brenau University, GainesvilleDeVry Institute of Technology, AlpharettaGainesville College, Gainesville Masterteach Institute, Gainesville North Ga. College and State, Dahlonega Reinhardt College, Waleska
CULTURAL FACILITIES
Sawnee Cultural Arts CenterThe Sawnee Cultural Arts Center opened in 1992, providing the community with an auditorium and stage for weddings, receptions, banquets, beauty pageants and much more. The center also features kitchen facilities and a number of meeting rooms accommodating 10 to 700 guests.
The Sawnee Cultural Arts Center (SCAC) offers an array of activities for residents of Forsyth County and surrounding areas. SCAC offers quarterly classes on a variety of subjects including art, theatre, dance, gardening and language classes. Each summer children are invited to participate in our week long Art & Drama Camps.SCAC is also home to several non-profit organizations: Saturday on Stage (SoS), A Children’s Theatre; Sawnee Art Association, a visual arts group; and Sounds of Sawnee Community Band.
LanierlandThis 4,346 seat concert theater is located in the north east portion of the county. It hosts seasonal concerts and school graduations.
Forsyth County Library SystemAn inventory and assessment of the Forsyth County library system is included in the Capital Improvements Element.

FORSYTH COUNTY COMPREHENSIVE PLAN 6-30 FORSYTH COUNTY COMPREHENSIVE PLAN 6-31
C O M M U N I T Y F A C I L I T I E S
COMMUNITY GOALS
SHERIFF’S DEPARTMENTThe Sheriff’s Department has adopted the following goal and associated objectives:To serve and protect the citizens and visitors of Forsyth County through dedication, professionalism, active cooperation with community, and respect for human dignity.• Provide the safest environment possible for citizens and others of Forsyth County.• Maintain the professional image, discipline, and morale of assigned personnel.• Enhance techniques in the education of citizens to increase awareness of crime,
techniques in crime avoidance, and operations of the Sheriff’s Office.• Decrease the Average response Time Length (elapsed time form time of dispatch to the
time of arrival) from current 20.41 minutes to the 8 to 10 range.• Increase the ratio of Sworn Law Enforcement Officers per 1,000 population from current
1.47 Officers per 1,000 to 2.0 Officers per 1,000.
FIRE PROTECTION AND EMSThe Fire Department has defined a set of goals as follows:• Prevent incidents from occurring through code enforcement, public education, and fire
prevention activities.• To mitigate hazards by handling all requests for service in i a professional manner.• Provide the highest quality of service in a professional manner.• Encourage and support employee development, enhancing proficiency and
professionalism.• Promote the health and safety of our employees. RECREATION FACILITIESIn 1999, a workshop was held with the Parks and Recreation Steering Committee to provide input that could be translated into goals and objectives. The goals are an expression of the Forsyth County Parks and Recreation Department’s desire to address the needs and demands within the county for recreational opportunities and program delivery.
A mission statement is a statement of overall policy that is used as a guide for the decision-making process to be followed by the Parks and Recreation Department. When developed in the context of system-wide recreation master plan, the departmental mission statement addresses the future provision of recreation sites, facilities and programs as a means to enhance the use of leisure time. Using these principles as guidelines, the following mission statement reflects the aspirations of the Forsyth County Parks and Recreation Department.
The Forsyth County Parks and Recreation Department is dedicated to improving the quality of life for the citizens of Forsyth County by providing quality programs, facilities and opportunities.
Eight goals that were identified and their specific measurable objectives for each, are listed below:

FORSYTH COUNTY COMPREHENSIVE PLAN 6-32 FORSYTH COUNTY COMPREHENSIVE PLAN 6-33
C O M M U N I T Y F A C I L I T I E S
Forsyth County will acquire a minimum of 375 acres of new recreation land by the year 2006.• The county will make advance acquisition of recreation land a priority.• Be within the acreage standard of 6.25 - 10.50 acres of land per 1,000 population by the year 2006.• To locate and purchase three, 70 - 80 acre parcels for development of active and passive parks.• The Parks and Recreation Department will endeavor to enter into a formal relationship with the County School System to acquire single large parcels of land on which to construct schools in conjunction with parks.• The acquisition of land in the southern and eastern portions of the county will be a priority.• The Parks and Recreation Department will investigate the potential to acquire Beaver ruin Park from the Corps of Engineers.• New park land should be acquired at locations where there are compatible, adjacent land uses.
To provide new sites that, when completed will result in adequate geographic coverage and accessibility to all residents of forsyth County• Three new community parks should be constructed in the south, southwest and northern portions of the county.• A least one of the three community parks should be located to the east of GA 400• Enlist the assistance of the Planning and Zoning Department to forecast the future location
of recreation sites.• Periodically update the needs assessment to insure that adequate parks and facilities are
developed to meet the desires of county residents.• System-wide, parks accessibility is to be improved by developing and implementing themed
directional and entryway signage.• Include, as feasible, indoor recreation centers at each new community park.
To broaden the range of recreation opportunities for county residents by providing additional active and passive recreation facilities in existing and new parks.• Expanding the number of soccer fields, ball fields and other programmed athletic facilities.• Constructing four new recreation centers, one of which shall be at a central location.• Constructing an aquatic complex at a central location within the county.• Continue to include walking/jogging trails in existing and future recreation sites.• Providing additional passive use facilities including bikeways, nature trails and interpretive
areas and greenways.• Providing facilities to meet specific needs of special groups including senior citizens and
dog owners.• Developing adequate support facilities including parking, restrooms and concessions at
existing and new parks.• Improving the appearance of existing parks by implementing a landscape program.
To provide an expanded variety of programs and instructional personnel as necessary

FORSYTH COUNTY COMPREHENSIVE PLAN 6-32 FORSYTH COUNTY COMPREHENSIVE PLAN 6-33
C O M M U N I T Y F A C I L I T I E S
to meet the needs of all age groups.• Additional active recreation programs will be provided for adults not participating in
athletics.• New indoor programs will be developed commensurate with the construction of recreation
centers.• Offerings for senior citizens will be expanded to include active recreation program such as
softball, horseshoes, shuffleboard etc.• Additional programs geared to teenagers will be offered.• The Parks and Recreation Department will add program personnel as necessary to meet
demand.• To provide the level of system-wide maintenance necessary to result in superior operation
of parks, equipment and support facilities.• An adequate maintenance staff will be provided to conduct routine and non-routine
maintenance assignments.• Maintenance personnel will receive training and obtain appropriate certifications in their
specific disciplines.• A maintenance program for support facilities will be implemented• Full-service maintenance facilities will be constructed at all new parks.• The Parks and Recreation Department will investigate the feasibility of privatizing some of
the routine maintenance functions such as grass cutting.
To provide appropriate security measures and personnel necessary to maintain a feeling of safety and comfort among park users.• Improve security at Poole’s Mill Park.• Do not locate a criminal detention facility adjacent to Central Park.• Investigate the feasibility of locating future police precincts within, or proximate to county
parks.• Determine the most efficient method of providing long range park security - use of dedicated
county police officers or establishment of a Park Ranger security department as part of the Parks and Recreation Department.
• Insure protection of pedestrians at ballfields by installing screens along foul lines.• Evaluate current traffic levels at existing parks to develop measures to minimize traffic
congestion during peak activity periods.• To investigate and implement innovative methods to fund the acquisition of recreation land
and the development of new facilities.•Utilize the “school-in-a-park” concept as a means to provide new recreation land and
facilities.• Pursue opportunities to lease Corps of Engineers park land at Lake Lanier.• Investigate the feasibility of holding periodic bond referendums as a means of funding future
recreation projects.• Pursue development and implementation of a county impact fee ordinance.• Develop “partnering” agreements with large corporations, industries and the YMCA as a
means of providing more recreation opportunities for county residents.• Using additional SPLOST initiatives as a continuing funding mechanism for land acquisition
and park development.

FORSYTH COUNTY COMPREHENSIVE PLAN 6-34 FORSYTH COUNTY COMPREHENSIVE PLAN 6-35
C O M M U N I T Y F A C I L I T I E S
EDUCATIONAL FACILITIES
In 1992-93, the Cumming-Forsyth County Chamber of Commerce, in response to a member survey, began to address the issue of county growth. Together with the efforts of the Forsyth County Board of Commissioners and the Forsyth County Board of Education, the Vision 20/20 citizens group was formed to address growth, education and the image of the county.In the spring of 1995, using the findings of the Vision 20/20 as a basis, 120 business, education and civic leaders worked diligently to prepare guidelines for policy-making and school administration. This Strategic Plan was adopted by the Board of Education in December 1995. In the plan the community cross section, which included natives and newcomers from all geographic regions of the county, called for a “proactive, accountable system that prepares students to compete successfully in the international market place.”The following 6 goals were established: To function as an effective system; To establish a seamless curriculum with defined benchmarks for highest achievement which serves all students; To develop channels and attitude that insure clear, consistent communication flow; To provide appropriate facilitates; To establish a human resource department; To integrate technology into system-wide management and classroom instruction
As the Forsyth County Schools continue to experience rapid, enormous growth and progress in the new millennium, decisions are constantly focused on a proactive, high-energy, top quality educational process and product as described in the community-developed Strategic Plan. The specific goals and objectives outlined in the original plan continue to be appropriate. The Board of Education, the Superintendent, and staff continue to search for and identify methods to achieve the high standards described by the task forces and steering committee. Following is the latest update to the community on the district’s progress toward the goals of the Strategic Plan.
• Consider a user fee surcharge for teams and players involved in park programs to be dedicated exclusively to maintenance.
• To initiate and implement a mechanism or mechanisms that will incorporate participation of county residents and elected officials in the on-going recreation planning process.
• Keep intact the Steering Committee used to assist in preparing this plan; seeking their input to the decision making process as relates to the development of future recreation facilities and programs.
• Hold semi-annual public meetings to inform the public of the status of proposed system-wide improvements, and to elicit input relative to additional needs.
• Administer a leisure survey similar to the survey used in this plan at least once every two years.
• Post information relative to proposed system-wide improvements and new program offerings in conspicuous locations in every park.

FORSYTH COUNTY COMPREHENSIVE PLAN 6-34 FORSYTH COUNTY COMPREHENSIVE PLAN 6-35
C O M M U N I T Y F A C I L I T I E S
1. TO FUNCTION AS AN EFFECTIVE SYSTEM. • Initiate efforts to insure that each school, program, and area of responsibility should
function as an integral part of the whole system. • Monthly newsletter, Nitty Gritty, posted electronically for all staff from Teaching
and Learning Division • System calendar on intranet • Next year’s calendar developed by the end of January, with staff development
dates determined • Weekly meetings of Teaching and Learning Staff to stay abreast of events and
responsibilities • Regular meetings at all levels; principals, assistant principals, support staff,
instructional areas. • Employ and support leaders who are proactive and foster teamwork.
• Support staff developed comprehensive plans • Leadership trained in components of continuous school improvement (A.I.M.) • Director of Staff Development employed • Comprehensive Professional Development Plan to meet system needs
developed • Continue Leadership development through CLSR continued • Member of ASCD Standards Consortium.
• Encourage every student, parent, employee, and elected official to strive to attain a vision of international excellence.
• Develop assessments grading and reporting against international standards. • Understanding by Design training for CORE Teams • Academic goals communicated • Chattahoochee Elem. and Forsyth Central High School named “Ga. Schools
of Excellence 2001.” • Establish policies to standardize opportunities and routine procedures to insure
equality and accountability. • Teaching and Learning Department realigned to function as support team to
schools • Training opportunities based on school improvement efforts offered to
schools. • Pursue and write grants for funds
• Awarded Foreign Language Model Program Grant • Third year of Next Generation Schools Grant to be implemented • Awarded Children’s Trust Fund Grant to expand Second Step Program • Awarded Abstinence Education Grant • Awarded NE GA Community Services Grant.
• Establish internal audit with online software. • Implement technology-based accountability systems in the form of a new fund
accounting system, TestTrax, to provide longitudinal data on student assessment results.
• Generate comprehensive baseline data for each student, class, and grade level, for both performance and content standards

FORSYTH COUNTY COMPREHENSIVE PLAN 6-36 FORSYTH COUNTY COMPREHENSIVE PLAN 6-37
C O M M U N I T Y F A C I L I T I E S
• Examine student work • Analyze performance data and identify each student’s academic strengths and
weaknesses as well as monitor gains in student proficiency on a continuous basis
• Provide ongoing review and evaluation of all school improvement efforts • Plan new interventions for individual students, groups of students, classes and/
or grade levels using relevant, up-to-date information and provide feedback to instructors regarding the effectiveness of new intervention strategies.
2. TO ESTABLISH A SEAMLESS CURRICULUM WITH DEFINED BENCHMARKS FOR HIGHEST ACHIEVEMENT WHICH SERVES ALL STUDENTS.
• Organize school schedules and instructional programs to support curriculum that ensures students to be internationally and locally competitive.
• Student/teacher ratio continues to be lowered to comply with HB1187 • Appoint Advanced Placement committee to expand classes in all high schools,
requiring the examination be taken at the completion of course • Pilot distance learning courses through Class.com • Begin 9th grade academies in all high schools • Study of alternative calendar by committee • Implement extended learning opportunities at all schools.
• Block Scheduling. • Block Schedules at 3 HS allows for 32 Carnegie units.
• Implement International Baccalauréat curriculum. • IB Program at South Forsyth High School approved by International Committee,
first classes started. • Establish higher-level content specific benchmarks.
• Standards & Benchmarks established for K-12 updated 2000-2001. • Core Team training begins in 2001-2002 school year.
• Allow advanced elem./MS students to move at an accelerated pace. • Students grades K-8 may advance in mathematics and reading.
• Administer annual standardized tests showing progress in each academic subject. • Introduce SAT9 in grades 3, 5, 8 and New Standards Reference Exams at end
of grade 4 and beginning of grade 9 • CRCT, grades K-8 • TestTrax allows longitudinal data to be kept on all students.
• Initiate foreign language instruction at an age that will enable students to communicate in an international environment.
• Expanded middle school foreign language from exploratory to academic program
• Add one Foreign Language in each elem. school (grades K-5, 75 minutes minimum per week)
• Identify and evaluate practices as effective including Core Knowledge and High Schools That Work.
• Midway, Sawnee Elementary, and Mashburn Elementary use elements of Core Knowledge.

FORSYTH COUNTY COMPREHENSIVE PLAN 6-36 FORSYTH COUNTY COMPREHENSIVE PLAN 6-37
C O M M U N I T Y F A C I L I T I E S
• All high schools joined Southern Regional Education Board’s HSTW. • Industry Certification of technical-career courses.
• Pilot Youth Apprenticeship Model in all high schools • Articulated agreements with Lanier Technical College.
• Instructional strategies to raise academic standards. • Teacher evaluation process (PAC) based on teachers designing quality work
for students • Implement CRISS Strategies • Implement Primary Literacy • Implement Core Teams.
• Staff development to enhance professional growth and raise professional Standards. • All staff development offerings based on teacher need/school improvement
plans • Developed comprehensive Professional Development Plan for system • Hired Director of Staff Development.
3. TO DEVELOP CHANNELS AND ATTITUDE THAT INSURE CLEAR, CONSISTENT COMMUNICATION FLOW.
• Establish link to the business community to listen to ideas and insure relevance of curriculum.
• Post updates on Internet site: www.forsyth.k12.ga.us • Workforce development (see action plan) • Study the feasibility of creating an International Center as suggested by the
Forsyth County Changing Demographics Committee • Chamber of Commerce and schools sponsor Classroom Partners, mentorships,
Career Days, Youth Leadership Program and semiannual Bus Tours of Schools
• 100% school membership in Chamber of Commerce. • Charge each school with implementing the school level components of the
Communication Task Force report. • Each school communicates regularly to parents and community through
handbooks, newsletters, website, PTA/PTO/LSC meetings. BOE receives monthly Local School Council (LSC) meeting minutes from each school
• Staff receives “Informed Source,” a brief outline of information from BOE meetings.
• Increase visibility of board members and superintendent at community and school functions.
• Supt. and BOE involved in many community organizations and events – United Way, Relay for Life, Scouts, Council on Youth, and others. Schools and Central Office active in community events: Raised $50,000 United Way, $43,000 for FC Relay for Life, $17,000 for Walk America.
• Superintendent serves on Family Connection State Board. • Appoint a person at each school to serve on a countywide public relations
committee. • Established media contact and procedures. Department directors regularly

FORSYTH COUNTY COMPREHENSIVE PLAN 6-38 FORSYTH COUNTY COMPREHENSIVE PLAN 6-39
C O M M U N I T Y F A C I L I T I E S
provide update articles and special programming to media. • Employed a communications specialist at district level.
• Create a countywide PTA/PTO Council. • The Superintendent meets monthly with PTA/PTO/LSC leadership • PTA Council established 1997.
• Implement a program that fosters communication with parents and their involvement in school.
• Implement “Parent Connect” a web-based system to provide home-school connection that gives parents timely information about their children’s progress (including attendance, discipline and grade information) and a “distributed” student information system, SASI, to provide greater flexibility in scheduling students and allow for comprehensive reporting to monitor student progress across grade levels.
• Parents may access information to digitally interact with their child’s school, communicate with their teachers, and track their progress. School system technology resources have been implemented to individualize instruction through use of online information.
• The district, all schools, and many teachers have websites containing information on issues pertinent to parents and community members.
• Implemented a Supt. Student Advisory with MS & HS representatives from each school.
4. TO PROVIDE APPROPRIATE FACILITIES. • Explore new avenues for providing facilities to keep pace with our growing
population. • Local Bond & State Funding to construct 276 instructional units at existing
schools to maximize their core facilities and two new schools (Matt ES & Otwell MS) with 134 new units total. In addition, more than 320 instructional units were updated, including new mechanical systems at three high schools. New replacement Sawnee Elem. & Cumming Elem. Schools will open Aug. 2002 along with new Middle School in the NW sector. One remaining new elementary school to be constructed & opened in August 2003
• Additional 1997 SPLOST and State Funding to construct 134 additional instructional units beyond the original anticipated building plan.
• Recommended SPLOST Issue because research showed no better way to finance for immediate classroom need.
• Passed 2001 SPLOST to fund 306 new instructional units in two elementary schools, one middle school, and one high school.
• Reuse building plans. • Middle school prototype developed from NFMS used for four additional schools.
The next MS proposed is based on the same plan. ES prototype developed from Matt ES used for the New Cumming ES. Due to overall size in relation to site development cost, a new design is being considered for better site adaptability. New high school plan will be an original plan due to the changes and need assessments for high school.
• Add classrooms to existing schools to house maximum number.

FORSYTH COUNTY COMPREHENSIVE PLAN 6-38 FORSYTH COUNTY COMPREHENSIVE PLAN 6-39
C O M M U N I T Y F A C I L I T I E S
• All schools were reviewed to determine the maximum size allowed by the BOE based on core capacity. Any facilities whose capacity did not meet or exceed this number were identified for new additions. Site was a limiting factor at Big Creek, Midway, Sawnee Primary, and North Forsyth High.
• Fund new central office by Interest on bond proceeds Bond Referendum Certificate of Participation • New BOE / Professional & Development Center was constructed & opened in
November 1999. New Transportation Administration Building is planned under remaining funds from the 1999 Bond.
• Stagger bus schedules. • Stagger school start times.
• Separated Elem. from MS & HS 1996-97. HS and MS now separated in all areas except small section of North. Continue to monitor and modify schedules for efficiency and effectiveness. Buses added are now in state replacement cycle. Since 1995 over $5,153,559 spent to purchase buses.
• Assess and improve utilization (including responsibility) of facilities • Maintenance hired licensed leadmen in areas of HVAC, plumbing, electrical, &
carpentry. Implementing on-line work order system to improve performance & accountability.
• Share facilities with Parks & Rec. • BOE supports use of facilities by Forsyth Co. & Cumming Parks & Rec. &
YMCA. • Establish Purchasing & Central Warehousing. • Warehouse (on Hwy. 20 W) allows Purchasing Dept. to buy in bulk and save
financially. FC Govt. purchases through school board contracts. • Also establishing parts inventory for maintenance to reduce response time on
work orders. • Outsource services
• Outsourcing services that are beyond the capabilities of existing staff, or that can be provided at a cost savings for the school system. Examples are grounds maintenance and infestation.
• Purchase land for five-year building plan recommended by the Facilities Task Force. • Land purchased (Otwell Meadows) for central growth, for Settles Bridge site
on James Burgess Rd., Wallace Tatum Rd. schools. Purchased additional properties with Sept. ’99 Bond for West High School on Drew Road and under negotiations for sites in south and north Forsyth for elementary school placement.
5. TO ESTABLISH A HUMAN RESOURCE DEPARTMENT. • Seek, employ, and retain best personnel.
• Local supplement gives credit for total years experience, 4.5% raise for certified and classified in 2000-01.
• Recruit and hire only the best and most qualified.

FORSYTH COUNTY COMPREHENSIVE PLAN 6-40 FORSYTH COUNTY COMPREHENSIVE PLAN 6-41
C O M M U N I T Y F A C I L I T I E S
• Effective recruitment and retention plan established • Web-based application and review process implemented • Expanded recruitment through on-site job fairs, membership in Metro-Atlanta
Recruitment Consortium (MATReC). • Evaluate compensation and benefits package.
• Accumulated sick leave may be used for retirement, benefits package reevaluated, added flexible spending accounts and a cancer plan
• Increased local contributions to Public School Employee Retirement Program participants
• Expanded local salary supplements to become more competitive with surrounding counties
• Responsibility supplement increase tied to salary increase. • Increase recognition of accomplishments of system employees.
• Implemented REACH Awards program, which recognizes exemplary service, staff accomplishments reported in StaffComm newsletter. Chamber of Commerce sponsors Teacher of the Year banquet
• National Teacher Certification (www.nbpts.org) encouraged. Local NBPTS supplement exceeds state minimum requirement in several ways.
• Design training programs to upgrade the personal and professional skills of employees and complement system-wide goals.
• Annual assessment identifies staff training needs • Extensive staff development focuses on integration of technology into
instruction and providing quality work for students • Personnel evaluation instruments (PAC and LAC) include Professional Growth
Plans. • Master’s degree obtainable in county through Piedmont College Cohort
program • Leadership certification obtainable through Georgia State University cohort
program. • Install position of Human Resource Director.
• Human Resources Department reorganized to focus with service orientation. • Standardize job descriptions, hiring procedures, and evaluations.
• Constantly updating and revising due to growth and program changes. Personnel intake process improved to provide more efficient service
• Job description on line. • Develop manuals for personnel.
• Employee and administrative handbooks developed and on-line.
6. TO INTEGRATE TECHNOLOGY INTO SYSTEM-WIDE MANAGEMENT AND CLASSROOM INSTRUCTION.
• Adopt Technology Task Force plan. • Form system-wide technology committee consisting of school personnel, parents,
and business people. • To focus on integration of technology into daily classroom activities, training
for teachers is being provided through the delivery of the “InTech” professional

FORSYTH COUNTY COMPREHENSIVE PLAN 6-40 FORSYTH COUNTY COMPREHENSIVE PLAN 6-41
C O M M U N I T Y F A C I L I T I E S
development program. The InTech program includes five critical areas: use of modern technologies, curriculum integration, classroom management, pedagogy, and designs for learning.
• A technology skills continuum is used as a framework to provide benchmarks for personal technology fluency. The “Teacher Technology Skills Continuum” is a living document that changes as technology changes. It has four levels: Minimum, User (these have a basic
• functional knowledge of hardware and software and an ability to use them within their instructional program), Demonstrator (capable of incorporating technology into instruction to meet a variety of student needs), and Designer (facilitates and designs student learning that incorporates real life applications while fostering technological growth.
• The MUNIS system, a complete set of integrated applications designed to manage the financial and human resources needs of the school system, is in the implementation stage.
• The Board of Education “Board Book” and agendas are all “on-line.”
Chapter Ten, the Implementation Program, provides the overall strategy for the comprehen-sive plan implementation. The policy recommendations listed above are merged and coor-dinated with the policies of the other elements to form the implementation program. The as-sociated short-term work program designates the actions the county will take in the next five years to achieve these goals. The list is not all-inclusive. There are some actions that may not be addressed due to time, budget and administrative constraints. These items will be included as part of the work program at some point over the twenty-year planning period.
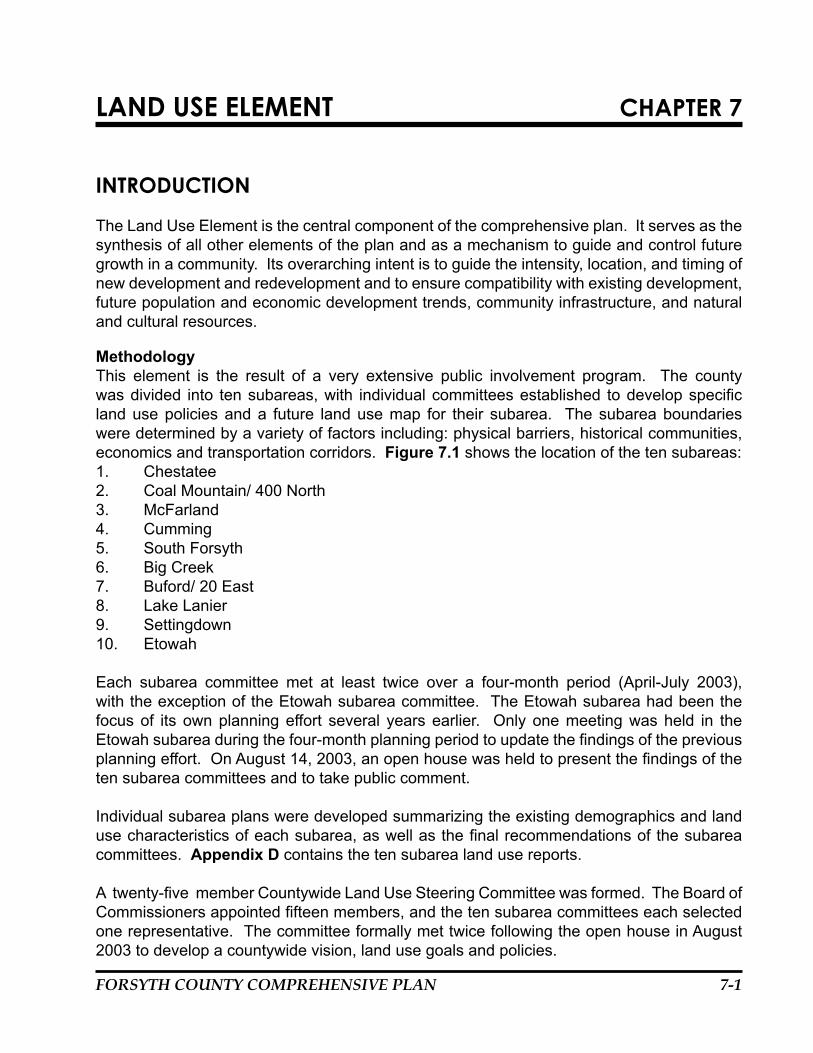
FORSYTH COUNTY COMPREHENSIVE PLAN 7-1
CHAPTER 7LAND USE ELEMENT
INTRODUCTION
The Land Use Element is the central component of the comprehensive plan. It serves as the synthesis of all other elements of the plan and as a mechanism to guide and control future growth in a community. Its overarching intent is to guide the intensity, location, and timing of new development and redevelopment and to ensure compatibility with existing development, future population and economic development trends, community infrastructure, and natural and cultural resources.
MethodologyThis element is the result of a very extensive public involvement program. The county was divided into ten subareas, with individual committees established to develop specific land use policies and a future land use map for their subarea. The subarea boundaries were determined by a variety of factors including: physical barriers, historical communities, economics and transportation corridors. Figure 7.1 shows the location of the ten subareas:1. Chestatee2. Coal Mountain/ 400 North3. McFarland4. Cumming5. South Forsyth6. Big Creek7. Buford/ 20 East8. Lake Lanier9. Settingdown10. Etowah
Each subarea committee met at least twice over a four-month period (April-July 2003), with the exception of the Etowah subarea committee. The Etowah subarea had been the focus of its own planning effort several years earlier. Only one meeting was held in the Etowah subarea during the four-month planning period to update the findings of the previous planning effort. On August 14, 2003, an open house was held to present the findings of the ten subarea committees and to take public comment. Individual subarea plans were developed summarizing the existing demographics and land use characteristics of each subarea, as well as the final recommendations of the subarea committees. Appendix D contains the ten subarea land use reports.
A twenty-five member Countywide Land Use Steering Committee was formed. The Board of Commissioners appointed fifteen members, and the ten subarea committees each selected one representative. The committee formally met twice following the open house in August 2003 to develop a countywide vision, land use goals and policies.

FORSYTH COUNTY COMPREHENSIVE PLAN 7-2
FORSYTH COUNTY COMPREHENSIVE PLAN 7-3
L A N D U S E
FIGURE 7.1 SUBAREA LOCATIONS

FORSYTH COUNTY COMPREHENSIVE PLAN 7-2
FORSYTH COUNTY COMPREHENSIVE PLAN 7-3
L A N D U S E
Inventory of Existing ConditionsExisting Land Use MapA comprehensive land use survey was conducted for Forsyth County in the Summer of 2002 using tax parcel maps, aerial photographs and field review. In April 2003, field surveys and a review of aerial photographs were conducted to verify the land uses in the county. The Georgia Department of Community Affairs (DCA) has established a statewide land use classification system for regional and local government agencies in Georgia. The land uses shown in Figure 7.2 on the following page and summarized in Table 7.1 follow these standards. A breakdown of existing land uses for each subarea can be found in the subarea land use reports, Appendix D.
TABLE 7.1 FORSYTH COUNTY EXISTING LAND USE: 2003
Land Use Acres PercentResidential 55,198 38.1%Undeveloped 39,075 27.0%Agriculture 23,341 16.1%Parks/Recreation/Conservation 9,053 6.3%Road Right-of-way (TCU) 8,762 6.1%Industrial 4,283 2.9%Commercial 2,737 1.9%Institutional/Public 2,297 1.5%Transportation/Communications/Utilities 77 0.1%Total Land Acreage for the County 144,823 100.0%Total Land Sq. Miles for County 226.3 --
Note: County total does not include lake and other water features.
The largest land use category in the county is Residential land, comprising approximately 38 percent of the total land area. Residential development is found throughout the county with the largest concentration in the southern and central portions of the county, and along the Lake Lanier’s perimeter. The predominate form of residential use is single-family homes in subdivisions. There are an estimated 43,847 housing units in the county associated with this residential land, which equates to an overall housing density of 0.79 units per residential acre.
The second largest category is Undeveloped land, which makes up almost 27 percent of the total land area. Undeveloped land is found primarily in northern portions of the county, though it is dispersed throughout the county. For example, in the McFarland subarea in the southwestern corner of the county, undeveloped land is the largest single land use category and comprises over 30 percent of the total land in that subarea. The third largest area is Agriculture, which accounts for just over 16 percent of the total land area. Most of the agricultural land can be found in the northern portions of the county, particularly in the Etowah, Settingdown, Coal Mountain, and Chestatee subareas. There is very little if any crop production in the county. Most of the agricultural uses are poultry and cattle related. There is no active forestry in the county.

FORSYTH COUNTY COMPREHENSIVE PLAN 7-4
FORSYTH COUNTY COMPREHENSIVE PLAN 7-5
L A N D U S E
FIGURE 7.2 EXISTING LAND USE

FORSYTH COUNTY COMPREHENSIVE PLAN 7-4
FORSYTH COUNTY COMPREHENSIVE PLAN 7-5
L A N D U S E
The remaining land uses make up almost 19 percent of the county, and include all commercial, industrial, public/institutional and parklands. Most of the commercial land uses are concentrated along the GA 400 corridor, particularly around Cumming. Industrial uses are concentrated in the southern portions of the county, particularly along the GA 400 and Peachtree Parkway corridors.
EXISTING LAND USE ASSESSMENTHistorical FactorsPrior to the construction of Buford Dam and the creation of Lake Lanier in the mid 1950s, unincorporated Forsyth County was primarily utilized as farmland. After that time and until the widening and construction of GA 400 in the mid 1980s, most of the new growth was associated with the development of lake front homes. Over the last 15 years, however, the growth of metropolitan Atlanta has been the catalyst for further development. In particular, the development of suburban employment centers in Fulton and Gwinnett counties has lead to an explosion of single-family housing, and the development of a strong employment base in Forsyth itself.
The rapid nature of this recent growth is pointed out by comparing the 1996 Existing Land Use Survey prepared for the previous Comprehensive Plan with the 2003 Existing Land Use Survey prepared as part of this plan. In 1996, 36% of the county was undeveloped and 26% was residential, whereas in 2003 those figures have reversed with only 27% of the county being undeveloped and 38% being residential. The other notable change in comparing the existing land use surveys is that agricultural land has decreased from covering 23% of the county in 1996 to only 16% percent today.
Transportation has had a significant impact on Forsyth County’s development pattern. Georgia 400, Peachtree Parkway, and Georgia 20 in particular have served as magnets for development in the county. These roads have made it easier for people to live in Forsyth County and commute into the city of Atlanta.
The availability or lack of availability of sewer has also had a significant impact on Forsyth County’s development patterns. The availability of sewer aids in determining the density of certain developments, and to some extent, the location as well. High-density developments such as apartments, manufacturing, or multi-story facilities require the availability of sewer; whereas, low-density developments can be supported by septic tanks that require relatively large drainage fields. Presently, public sewer service is only available in a small portion of the southern edge of the county and close to the City of Cumming. As a result, residential densities have been kept relatively low compared to the county’s more urbanized neighbors to the south, Fulton and Gwinnett Counties.
Land Use Patterns In Relation To InfrastructureDue to the rapid pace of Forsyth’s recent population and employment growth, the county’s public infrastructure has been placed under considerable strain in its attempts to keep up with

FORSYTH COUNTY COMPREHENSIVE PLAN 7-6
FORSYTH COUNTY COMPREHENSIVE PLAN 7-7
L A N D U S E
the rising demand. In particular, the county has spent considerable resources to improve its transportation network and water and sewer infrastructure in order to keep up with this growth. The rapidly growing southern portions of the county have placed the most demands on the infrastructure, yet the problem really is one that can be considered countywide. As described later under “Needs Assessment”, one key factor that exacerbates this problem is that of the low density, auto-oriented growth patterns that have developed in the county.
Blighted And Transitional AreasThe development in the unincorporated portions of Forsyth County is relatively young. Yet, like most suburban counties in metropolitan Atlanta, Forsyth County has some areas that may be considered to be in transition. In particular these include residential areas in older neighborhoods that are aging and need reinvestment and repair. These transitional neighborhoods are primarily located along the perimeter of Lake Lanier and a few older subdivisions located close to the City of Cumming.
Although the term “transitional” connotes places that are in decline, transition can be a positive sign. The county is experiencing such strong development pressure as a result of the expansion of metropolitan Atlanta that land values are generally on the rise, particularly close to Lake Lanier and GA 400 where most of these transitional areas are located. These areas need development guidelines to ensure that new development is balanced, of high quality, respects environmental resources, and are coordinated with infrastructure improvements.
Environmentally Sensitive Or Locally Valued LandForsyth County is fortunate to possess a number of natural and cultural resources that are worthy of protection. In particular, state and local laws help to protect all the county’s water resources including Lake Lanier, the Chattahoochee River, and the Etowah River. There are approximately 11,814 acres of 100-year floodplains in the county. Development is regulated in this area by the Federal Emergency Management Agency, the Georgia Floodplain Management Program of DNR and by local ordinances. There are 33,593 acres of land associated with groundwater recharge areas in the county. Significant recharge areas have been mapped by the Georgia Department of Natural Resources at the state level. If a significant recharge area is identified, the local government must comply with the Official Code Georgia Annotated 12-2-8. This Code outlines restrictions on locating landfills and hazardous waste facilities, above ground chemical or petroleum storage tanks, agricultural waste, impoundment sites, septic tank drain fields, slow rate land treatment, storm water infiltration basins, and waste treatment basins.
There are 32,225 acres of steep slopes (15% grade or greater) in the county. This amounts to approximately 22 percent of the total land area. Most of these steep slopes are associated with Sawnee Mountain and the major rivers and creeks. Where slopes are greater than 15 percent, greater care must be taken to control erosion and sedimentation and developing the land is more expensive and often cost prohibitive.
Besides natural resources, there are a number of man-made resources that are valued by

FORSYTH COUNTY COMPREHENSIVE PLAN 7-6
FORSYTH COUNTY COMPREHENSIVE PLAN 7-7
L A N D U S E
the community. The most notable of which is Lake Lanier, which serves as the major water source for the region as well as a favorite recreation site. Besides Lake Lanier, there are over 1,100 acres of public parkland in the county, the largest of which is associated with Sawnee Mountain Preserve, which occupies over 725 acres in the north-central portion of the county. There are also a number of archaeological and historic sites in the county. The famous Trail of Tears began in Forsyth County, and there are a few known sites of Cherokee Indian villages and mounds dotted throughout the county. In the mid-1990s a historic resources inventory was completed which identified 490 historic resources in unincorporated Forsyth County. These historic sites are widely scattered.
Problems With Existing Development PatternsForsyth County is like many other rapidly growing suburban counties across the country. It has developed with auto-oriented growth patterns commonly known as “urban sprawl.” There are three commonly recognized types of urban sprawl:1) Large expanses of low-density, single-purpose development;2) Leap-frog development; and3) Unbounded strip commercial development along major highways.
Strip commercial development and expanses of low-density residential development are probably the most prevalent form of urban sprawl in Forsyth County today, particularly in the southern portions of the county and along its major transportation routes, such as GA 20. However, as infrastructure expands, leap-frog development could become perhaps the most costly manifestation of sprawl. Leap-frog development is the premature construction of low-density housing in areas away from existing development. The consequences of this premature development include higher costs of infrastructure. According to a study by the Urban Land Institute (ULI), the costs of providing infrastructure and services to an area that is over 10 miles away from current services is $15,000 more per lot than the cost of providing the same services to a lot close to central facilities and services. In some cases, a community may pay twice for infrastructure and services - once for the infrastructure and services where growth was planned and again where the leap-frog development was permitted.
In addition, the quality and capacity of infrastructure may not be upgraded to suburban standards in the short time frame that motivated the developer to sell houses. Therefore, the lots have to be bigger to accommodate wells, septic tanks, and ditched streets. This means lower “yield” for the developer, but also may cause a lower tax base for the local government to pay the costs of schools and public services. It also reduces the buying power of customers available to the stores and commercial services coming to serve the new area.
These are some of the characteristics of sprawl in terms of its impact on the quality of development. However, urban sprawl also has an important impact on the quantity of land use available for future generations. Sprawling suburban communities all over the country are finding that with each new wave of growth, the amount of land being consumed by

FORSYTH COUNTY COMPREHENSIVE PLAN 7-8
FORSYTH COUNTY COMPREHENSIVE PLAN 7-9
L A N D U S E
development is increasing at a faster rate than is population. For example, recent studies in suburban Atlanta have shown that for every ten percent increase in population, developed land areas increase by up to fifty percent.
Over the long run, this rapid outward expansion puts a squeeze on the quantity of land that a county has available for its future. As the quantity of land required for development expands outward, the residual supply of developable land becomes squeezed tighter and tighter. Eventually, the diminishing supply of developable land drives land prices, causing the price of housing, and even public facilities to grow.
Given its diminishing supply of developable land, Forsyth County should incorporate land use planning tools that direct and orient development patterns and economic incentives away from urban sprawl patterns to ones that support compact development. Compact development is not synonymous with higher residential density. Residential density is a shorthand measure of the quantity of development, or number of housing units per acre. It is not, however, a reliable measure of many more important, qualitative characteristics, such as the amount of open space, impervious area, building mass, or jobs-housing balance. These attributes relate more directly to the quality of living within a community, and relate more to the arrangement of uses, types of uses, and site design factors than on the abstract concept of density.
Compact development manages density and intensity of development through design to conserve land, reduce impacts on traffic and storm water for a given amount of development, and make maximum use of existing infrastructure. It also protects against the negative impacts of urban sprawl by placing varied but complementary land uses in proximity to each other. Compact development promotes a mix and arrangement of land uses that are conducive to pedestrian activity and alternative modes of transportation. With well-designed compact development, more everyday destinations - shops, churches, and schools- are within convenient walking distance. The primary benefits of compact development include: • Reductions in land consumption – preservation of open space, natural resources, and farm and agricultural land; • Lower infrastructure costs; • Balance of supportive land uses; • Distinct neighborhoods with more amenities and higher quality of life; and • Reductions in auto-dependency and promotion of a more pedestrian-friendly environment.
Potential Sites For Infill And Traditional Neighborhood DevelopmentThe American Planning Association defines infill development as:“The construction of a building on a vacant parcel located in a predominately built up area. It also refers to the reuse or change of use of a previously developed parcel or group of parcels, or the intensification of use or change or use by remodeling or renovating an entire structure.” (APA Planning Advisory Service Report Number 491/492.)
Since most of the county’s building stock is relatively new, and since there is a general lack

FORSYTH COUNTY COMPREHENSIVE PLAN 7-8
FORSYTH COUNTY COMPREHENSIVE PLAN 7-9
L A N D U S E
of sewer service that would promote higher density development patterns, there are very few potential sites for infill development. In fact, just the opposite has held true in many of the redeveloping areas around Lake Lanier, where it is common for several smaller residential lots to be consolidated for the construction of a larger single-family home that can meet the current minimum standards for the installation of a septic tank. The opportunities for Traditional Neighborhood Development (TND) are much greater. A TND can be defined as:“An innovative development approach that fosters more compact, walkable communities. TND emphasizes a return to the way we used to build neighborhoods. The planning and urban design of new TND developments take their form from the structure and layout of pre-automobile neighborhoods, with their human, walkable scale and lively mix of uses. TND neighborhoods typically include small-lot single-family homes, multi-family residences and neighborhood commercial developments within easy walking distance of one another.” (Georgia Quality Growth Partnership Web site, www.dca.state.ga.us/toolkit/index.html)In recent years there have been a number of large-scale planned communities approved in the county that come close to fitting the definition of a TND. The best example of which would be the Vickery, a Hedgewood Homes development under construction off of Post Road. It is a mixed-use development with 744 residential units offered in a variety of styles and 73,200 square feet of commercial space on 214 acres. Depending on the success of the Vickery and other developments like it, more TND style developments are likely to be developed in the county. Throughout the public involvement process of this plan, great interest was expressed in developing appropriate guidelines that would promote this style of development.
Local Policies That Could Affect Future Land Use PatternsMarket demand, population growth, economic development, community infrastructure, and the environmental suitability of land are the major factors affecting Forsyth County future land use needs and development patterns. Adopted land use goals and implementation strategies are also influential in defining those patterns. Whether qualitative or quantitative, these factors will play a significant role in guiding the intensity, location, and timing of future growth in the county.
The major growth shapers in a community typically involve the availability of community facilities and services such as roads, water and sewer, schools, social and cultural institutions such as libraries, and fire and police. From both a social and market perspective, land that provides access to a network of supporting infrastructure and community facilities has greater development value. As such, the availability of these facilities and services is key in determining land that is fiscally suitable and desirable for urban development.As previously indicated, current transportation routes in Forsyth County play a significant role in the accessibility of land parcels, and thereby the potential for development. As in most communities, extensions of transportation, water, and sewer infrastructure greatly expand the supply of land for urban development.
Also influential to future growth in Forsyth County are established environmental standards, which have played a more significant role in shaping community growth in the last decade. Recent air and water quality programs at the Federal and State level recognize the connection

FORSYTH COUNTY COMPREHENSIVE PLAN 7-10
FORSYTH COUNTY COMPREHENSIVE PLAN 7-11
L A N D U S E
between land use and environmental quality. At the local level, this is likely to necessitate more sophisticated studies of environmental quality and more precise performance standards for environmentally sensitive lands such as wetlands and floodplains.
Finally, a policy of promoting TND and activity center type developments can have a strong affect on the future land use patterns of the county. Such developments will offer a greater variety of housing choices and help to promote easier access to retail markets and employment opportunities. These types of development also lend a greater sense of character and community identity, which could help distinguish Forsyth from other surrounding counties.
ANALYSIS OF THE FUTURE LAND USE NEEDS
Population, housing, and employment forecasts are helpful in determining the amount of land necessary to accommodate both residential and non-residential future land uses needs. Based on countywide future population projections of 227,819 persons by 2025 as stated in the Population Element and the future housing projection of 89,769 housing units by 2025 identified in the Housing Element, Forsyth County (including the City of Cumming), will likely see construction of 45,922 new housing units from 2002 to 2025. These housing units will need an estimated 58,433 additional acres of land at the current housing density of 0.79 units per residential acre. Many citizens involved in the development of this plan, expressed an interest in a 1 unit per acre goal density. At this higher density, only an additional 34,571 acres of residential land would be needed to accommodate future growth (89,769 future residential acres less 55,198 existing residential acres = 34,571 additional acres). It is reasonable to assume that as the county matures and more people move in that the overall housing density will rise. The determining factor will be at what density future developments are approved at, and the requirements of the county’s Unified Development Code.
Future non-residential land use needs for the economic sector were based on Forsyth County job forecasts presented in the Economic Development Element. As Table 7.2 illustrates a total of approximately 2,688 additional acres of industrial and commercial land are needed to accommodate the projected 2025 employment.
Generally, public uses and rights-of-way occupy around 15% of the total developed land in non-urbanized areas. So assuming 34,571 acres are needed for new residential development and 2,688 acres are needed for employment-based land, 5,589 new acres of public uses and rights-of-way will be needed to accommodate projected growth. Table 7.3 shows that altogether there will be a demand for over 42,634 acres of land development and redevelopment in Forsyth County by 2025. There is no accurate form of estimating the amount of redevelopment versus new development that will occur over the next 20 years, but a very conservative estimate would be around 10%. As land prices continue to rise, and amount of available undeveloped land shrinks, then the finance incentives for redevelopment will become greater.

FORSYTH COUNTY COMPREHENSIVE PLAN 7-10
FORSYTH COUNTY COMPREHENSIVE PLAN 7-11
L A N D U S E
TABLE 7.2: FUTURE EMPLOYMENT LAND REQUIREMENTS IN FORSYTH COUNTY, 2005-2025
Employment Category
Land Use Type
2005 Employment
2025 Employment
Change Employ.
Acres/ Employee*
New Acres
Agricultural Services Office 1,276 1,978 702 0.04 28Construction Industrial 7,628 12,182 4,554 0.125 569Manufacturing Industrial 8,312 10,714 2,402 0.125 300Transportation, Communication, Utilities
Industrial 1,433 1,968 535 0.125 67
Wholesale Trade Warehouse 5,150 9,740 4,590 0.125 574Retail Trade Retail 7,217 11,048 3,831 0.10 383Finance, Insurance, & Real Estate Office 2,719 3,535 816 0.04 32Services Office 12,380 24,491 12,111 0.04 484Federal Civilian Government Office 186 241 55 0.04 38
State & Local Government Office 4,033 6,136 2,103 0.04 84Federal Military Government Industrial 372 382 10 0.125 1
Other (Agriculture, Mining, etc.)
Resource based 786 752 -34 NA NA
Total 51,492 83,167 31,675 2,560Vacancy Adjustment (+5%) 128
Total additional acres required 2,688Source: Jordan, Jones & Goulding, Inc.
* Note: Based on density standards published in Urban Land Use Planning, 4th edition by Edward J. Kaiser, David R. Godschalk, and F. Stuart Chapin, Jr., University of Illinois Press, 1995, p. 331.
Industrial/Warehouse = 8 employees/acre; 1,250 square feet/employee; 10,000 square feet/acreRetail = 10 employees/acre; 1,000 square feet per employee; 10,000 square feet per acreOffice = 25 employees/acre; 320 square feet per employee; 8,000 square feet per acre
TABLE 7.3: TOTAL NEW LAND USE REQUIREMENTS, 2000-2025
Residential Land 34,571 acresEmployment Based Land 2,688 acres
Public/ ROW 5,589 acresTOTAL Used 42,634 acres
Land used for redevelopment (-10%) -4,263 acresTOTAL Planned 38,371 acres
Source: Jordan, Jones & Goulding, Inc.
This is a broad estimate that is intended to provide an order of magnitude appreciation for the amount of land development activity Forsyth should anticipate over the next 20 years. Considering that the existing land use survey indicated that there are 62,000 acres of undeveloped or agricultural based land in 2003, there should be enough space to handle the projected level of growth. In addition to the total land use requirements listed above, the county has accepted the

FORSYTH COUNTY COMPREHENSIVE PLAN 7-12
FORSYTH COUNTY COMPREHENSIVE PLAN 7-13
L A N D U S E
statewide goal of preserving 20% of the total land for greenspace. This 20% would amount to 28,965 acres. According to the Forsyth County Parks and Recreation Department, there are 785 acres currently classified as permanently protected greenspace. That leaves a goal of 28,180 acres of additional greenspace to be acquired.
Development of Community GoalsThe Steering Committee developed the following community goals to help guide future land use decisions in the county. These goals were based on the recommendations of the subarea committees, and public comments.GOAL 1: Encourage responsible development patterns and policies that maximize the resources of both the public and private sector.GOAL 2: Improve opportunities for citizen involvement in the land development process.GOAL 3: Provide an efficient, equitable and compatible land use plan that combines the community’s desire for a high quality of life with respect for private property rights.GOAL 4: Encourage creative and flexible site design to accommodate site-specific conditions.GOAL 5: Protect the natural, historic, and scenic qualities of the county.GOAL 6: Encourage the development of a sustainable tax base through an increase in business/commercial land use.GOAL 7: Ensure consistency of residential development with the subareas’ visions and balance the needs of landowners and residents.
This last goal refers to “subarea’s visions”. As part of the subarea planning process, separate visions for each subarea were developed to reflect their unique character and identity. These individual subarea visions can be found in the implementation element, and Appendix D.
Implementation Program
There are two parts to the implementation program for this element. The first part of this implementation program is the future land use map. The map is parcel based and depicts a 2025 future land use scenario. The future land use map is a policy guide that is taken into account at the time of making land use and capital improvement decisions. The second part is comprised of a list land use of objectives and short-term action items designed to help achieve the long-range vision for the community. This list was developed by the steering committee.
The guiding force behind this implementation program is a vision statement that was developed as a result of the public involvement effort and hard work of the steering committee. The countywide vision statement they recommended reads as follows:
Vision StatementForsyth County will be a dynamic, thriving community, which melds the development of an exemplary quality of life with the preservation of its unique natural and cultural resources. We will continue to build upon and encourage the unique characteristics found throughout
our community while working together towards our common goals.

FORSYTH COUNTY COMPREHENSIVE PLAN 7-12
FORSYTH COUNTY COMPREHENSIVE PLAN 7-13
L A N D U S E
Future Land Use MapThe future land use plan is a central component of the Comprehensive Plan. It is an extension of the goals and values of the community and a culmination of the subarea planning effort. This future land use map is intended to depict a 2025 future land use scenario. The acreages and percentages of each land use are compiled in Table 7.4 below and a map showing the location of future land uses is included in Figure 7.3.
TABLE 7.4: FORSYTH COUNTY FUTURE LAND USE: 2025
Land Use Acres PercentMedium Density Residential (MDR) 54,509 37.6%Low Density Residential (LDR) 41,186 28.4%Road Right-of Way 8,872 6.1%Industrial (IND) 7,861 5.4%General Commercial (GC) 7,490 5.2%High Density Residential (HDR) 5,607 3.9%Conservation (Lake Lanier US Corps land only) 3,750 2.6%Private Park (PRP) 3,389 2.3%Public/Institutional (PI) 1,918 1.3%Public Park (PUP) 1,541 1.1%Activity Center (AC) 1,442 1.0%Landfill 726 0.5%Neighborhood Commercial (NC) 1,014 0.7%Transportation/Communication/Utilities (TCU) 492 0.3%Total Land Acreage for the Unincorporated County 141,485 97.7%Cumming 3,338 2.3%Total Land Acreage for the County 144,823 100.0%Conservation Overlay 17,748 12.3%Note: County total does not include lake and other water features.
Future Land Use NarrativeThere are fourteen land use designations depicted on the future land use map, including three residential designations and six commercial/industrial/mixed-use designations. Below is brief definition of each.
Low Density Residential (LDR) - This category is intended for single-family detached residential dwellings typically on septic sewer systems. Minimum lot size is 30,000 square feet, or the overall density is up to 1.5 units per acre. Institutional uses that are considered complimentary in this area include churches, schools, and libraries.
Medium Density Residential (MDR) - Consists of single-family detached residential dwellings typically on sewer, with overall densities up to 2.5 units per acre. Institutional uses that are considered complimentary in this area include churches, schools, and libraries. Private recreational uses, such as golf courses, tennis courts, walking trails and swimming pools are encouraged in these areas in developments greater than 50 lots.

FORSYTH COUNTY COMPREHENSIVE PLAN 7-14
FORSYTH COUNTY COMPREHENSIVE PLAN 7-15
L A N D U S E
High Density Residential (HDR) - Typical uses include single-family detached and attached dwellings (such as townhouses) as well as multifamily condominiums and apartments, at densities of up to 6 units per acre. These developments should incorporate some amount of central outdoor public space for their residents. A limited number of churches, schools, libraries, other miscellaneous institutional uses and daycare facilities would be complimentary in these areas. An urban-density residential area is usually located near areas of high employment concentration, large commercial nodes, transportation nodes and mixed-use developments. It is essential that these developments include proper buffering between adjacent land uses.
Neighborhood Commercial (NC) – The Neighborhood Commercial category allows a limited range of retail and service activities to serve the everyday needs of local residents. This category includes shopping centers at commercial nodes and limited commercial development along roadways.
In commercial nodes, the site should be designed to encourage the development of neighborhood-scale shopping that offers retail goods, and the furnishing of selected services. Individual commercial establishments are limited to less than 70,000 square feet. Along roadways, the NC land use category is intended to allow for the redevelopment of existing residential structures to commercial or office use. It also allows for new office development that is constructed in a manner consistent with surrounding land uses. Developments in these areas are typically on shallow lots and should not exceed 10 acres in size. Limitations should apply to size, use and design of individual establishments based on surrounding land uses.
General Commercial (GC) - This category includes standard retail and commercial service activities such as shopping centers, general retailers, specialty shops, grocery stores, drug stores, banks, restaurants, theatres, hotels, dry cleaners and entertainment facilities. These establishments should be located on appropriate transportation corridors to easily serve the public. Visual impacts of these developments should be minimized by requiring buffers, landscaping, and architectural controls.
Activity Center (AC) - The Activity Center land use category concentrates an integrated mix of uses in convenient locations. Activity Centers promote efficient patterns of land use as well as reductions in the number and length of auto trips; as such, AC designations should be appropriately spaced apart. The types of uses that are desirable in the AC category should at a minimum combine local and/or regional retail establishments with offices, but may also include entertainment, governmental facilities, and/or medium- and high-density residential. Development proposals shall be designed to promote pedestrian accessiblity. Individual commercial establishments are limited to less than 100,000 square feet. Residential uses shall be considered accessory and should be predominately townhouses or apartments mixed into the commercial establishments.
Corridor Transitional (CT) - The Corridor Transitional category is intended to focus on the portions of major transportation corridors that presently contain a mix of agricultural,

FORSYTH COUNTY COMPREHENSIVE PLAN 7-14
FORSYTH COUNTY COMPREHENSIVE PLAN 7-15
L A N D U S E
residential, and isolated commercial land uses. Such corridors are unlikely to sustain small scale, low-density development over the course of the planning period. Corridor Transitional allows flexibility in future land use determination while ensuring the appropriate gradation between higher-intensity development abutting the major roadway and adjacent properties. To minimize traffic impacts, inter-parcel connectivity and side street access is highly encouraged.
Typical uses include standard retail and commercial service activities such as general retailers, specialty shops, drug stores, banks, restaurants, dry cleaners, entertainment facilities, multiple tenant offices, small single occupant structures, as well as residential development.
The transitional nature of the category is achieved by two primary methods. First, site design should incorporate such features as buffers, landscaping, and architectural controls to minimize the impacts on surrounding lower intensity land uses. Second, gradation of use will be expected in CT designated areas, from higher-intensity along corridors to lower-intensity further away. Thus CT is ideal for mixed-use projects.
Industrial (IND) - The primary purpose of this category is to provide for areas where light industrial uses can be located. These light industrial uses include technology/business parks, light manufacturing, warehousing, wholesale/distribution and assembly. More intensive industrial uses that are characterized by noise, fumes, vibration and other forms of pollution that might be viewed as objectionable by surrounding uses are acceptable only on a case-by-case basis if well screened and buffered from other uses. Limited commercial uses are also allowed in industrial areas if they compliment existing industrial uses, such as cafeterias and day cares.
Public / Institutional (PI) - Includes uses such as schools, colleges, hospitals, municipal community centers, churches, cemeteries, municipal buildings and post offices.
Public Park (PUP) - This category includes land dedicated to active and passive recreation uses. These areas are publicly owned and may include sports fields, recreation areas, greenways, and similar uses.
Private Park (PRP) - Privately owned land that is used for active and passive recreation. This may include subdivision amenities areas, golf courses and Army Corps of Engineers recreation areas.
Conservation (CONS) - This classification includes environmentally sensitive areas that are regulated at the local and state levels. Areas included in this category are the 35 ft. buffer along all county streams, a 100 ft. buffer along the Etowah River and land that is part of the 100-year floodplain of local waterways. This land has the potential to be used as public greenways or multi-purpose paths. Land classified as Conservation alerts government officials and property owners to the presence of environmental conditions that shall be factored into the rezoning and permitting process.

FORSYTH COUNTY COMPREHENSIVE PLAN 7-16
FORSYTH COUNTY COMPREHENSIVE PLAN 7-17
L A N D U S E
Transportation / Communication / Utilities (TCU) - This category includes such uses as landfills, water treatment plants, wastewater treatment plants, power substations, rail yards, mass transit facilities, airports, etc. These uses may be either public or private.
Commercial Nodes - The Future Land Use Map includes ten areas targeted for commercial nodal development:Bethelview Road (S.R. 141) and Castleberry RoadAtlanta Highway (S.R. 9) from Francis Circle to Fowler RoadCanton Highway (S.R. 20) from Hyde Road to Friendship CircleKeith’s Bridge Road (S.R. 306) and State Farm RoadMatt Highway (S.R. 369) and Dahlonega Highway (S.R. 9)Georgia 400 and Jot’em Down RoadMatt Highway (S.R. 369) and Bannister RoadKeith’s Bridge Road (S.R. 306) and Jot’em Down RoadKeith’s Bridge Road (S.R. 306) and Dawsonville Highway (S.R. 53)Dawsonville Highway (S.R. 53) and Westbrook Road
The intent of these nodes is to concentrate commercial and high intensity development into compact patterns, reducing the need for commercial strip or leap-frog development along roadways. Increased flexibility of land use determination within the nodes is allowed. However, developments are expected to transition from the most intensive uses in the center to uses compatible with those found along the perimeter of the node. In addition, particular attention will be paid to a proposal’s projected densities and effects on roads, utilities, and surrounding land uses. Development should coordinate with existing and planned surrounding commercial developments when feasible to encourage transitions, shared parking, shared curb-cuts, landscape quality, and design compatibility. Mixed-use and pedestrian-oriented designs are highly encouraged in these areas.
The future land use map indicates that most of the future development will continue to occur in the southern and central portions of the county, with most of the industrial and commercial growth occurring along the GA 400 corridor. Toward this end, this plan recommends that higher priority be given to infrastructure improvements in these more urbanized areas. Agricultural and forestry uses are notably absent from the map as individual land use features. There is no active forestry in the county, so there was no need to designate such areas for future use. Agriculture on the other hand, will likely still be present 20 years in the future, though it is a declining industry. While the future land use map does offer guidance in land use and capital investment decisions, there are many elements to this plan that the map cannot depict. To address these other elements and recommendations, the next section presents a number of objectives and short-term action items that were developed with the input of the Steering Committee.

FORSYTH COUNTY COMPREHENSIVE PLAN 7-16
FORSYTH COUNTY COMPREHENSIVE PLAN 7-17
L A N D U S E
FIGURE 7.3: FORSYTH COUNTY FUTURE LAND USE: 2025

FORSYTH COUNTY COMPREHENSIVE PLAN 7-18
FORSYTH COUNTY COMPREHENSIVE PLAN 7-19
L A N D U S E
COMMUNITY GOALS
GOAL 1: Encourage responsible development patterns and policies that maximize the resources of both the public and private sector.
Long Range Objectives /Short Term Action Items :• Implement development patterns that would make the extension of public facilities or
services economically feasible.• Increase connectivity between and within commercial, industrial and residential land
uses.• Encourage alternative modes of transportation.• Encourage cooperation between Federal, State and Local government agencies to
maximize the use of public parks and land.• Encourage activity centers at major intersections and discourage land use changes that
lead to “strip development” patterns.• Modify development regulations to require installation of sidewalks, bike paths and trees
along roadways as they are improved or created.• Promote countywide co-location of public facilities.
GOAL 2: Improve opportunities for citizen involvement in the land development process.
Long Range Objectives/Short Term Action Items: • Increase public awareness and education through the use of various media and electronic
forums.• Develop a methodology for the continuation of the subarea planning process.• Continue efforts to have an efficient and adequate level of public participation in the land
development process.• Examine the rezoning process with focus on submittal requirements and the revision
process.
GOAL 3: Provide an efficient, equitable and compatible land use plan that combines the community’s desire for a high quality of life with respect for private property rights.
Long Range Objectives/Short Term Action Items:• Adopt a land use plan that will accommodate the projected population of 227,000 and an
employment base of 79,000 by the year 2025.• Annually review the land use element of the comprehensive plan and consider changes in
response to previously unforeseen opportunities.• Update the Unified Development Code to reflect the future land use plan.• Study the feasibility of transferable development rights (TDRs) and other tools to provide
incentives to preserve green space, open space, and to retain small farms and agricultural related businesses.
• Add additional county staff to enforce development and zoning conditions and erosion control with substantial fines for noncompliance.
• Develop a process to continue public participation in planning issues through appropriate

FORSYTH COUNTY COMPREHENSIVE PLAN 7-18
FORSYTH COUNTY COMPREHENSIVE PLAN 7-19
L A N D U S E
subarea(s) committee(s) and a steering committee.• Create a feasibility study to develop a bubble or corridor specific future land use map.• Continue to use the comprehensive plan as part of the considerations for rezoning requests
and conditional use applications.
GOAL 4: Encourage creative and flexible site design to accommodate site-specific conditions.
Long Range Objectives/Short Term Action Items:• Modify development regulations to encourage mixed-use developments in appropriate
land use designations with appropriate controls. • Establish architectural and design standards with a citizen based design committee.• Non-residential design standards should promote policies to reduce urban heat islands and
minimize light pollution.• Encourage street designs that improve traffic flow and reduce congestion, such as grid
pattern streets.• Study engineering requirements for road improvements and modify as needed to improve
traffic flow and safety.
GOAL 5: Protect the natural, historic, and scenic qualities of the county.
Long Range Objectives/Short Term Action Items:• Prepare a greenway/open space master plan.• Establish standards to identify land in which development impacts should be minimized.• Work toward the acquisition and preservation greenbelt protected areas, such as the
Chattahoochee River, Etowah River, and Big Creek.• Strengthen appropriate rules, regulations, and ordinances to protect and encourage the
preservation of trees and vegetative cover.• Distribute open space opportunities across the county.• Strictly enforce the sign ordinance to help preserve the scenic features of the county.• Recognize the need for passive recreational spaces.• Develop countywide strategies for improving watershed quality. Modify and improve upon
stormwater management plan to improve water quality.• Create development standards to encourage the linking of conservation lands to create greenway corridors.• Encourage maximizing open space with density incentives.• The county should work towards exceeding the state standard for greenspace in each subarea.• Develop a plan to require mixed-use development to have a significant percentage of the
area to remain protected greenspace.• Protect residential areas by encouraging appropriate greenspace buffers around
commercial developments.• Examine measures to improve water quality, such as stream buffer requirements.• Connect activity centers to adjoining residential neighborhoods with sidewalks.

FORSYTH COUNTY COMPREHENSIVE PLAN 7-20
• Reduce the negative impact of impervious surfaces by studying mitigation factors and incorporating them into site development.• Encourage the creation of hiking trails which interconnect with other existing greenways and trails from adjoining counties.
GOAL 6: Encourage the development of a sustainable tax base through an increase in business/commercial land use.
Long Range Objectives/Short Term Action Items:• Achieve a tax base that is approximately 60% residential and 40% nonresidential.• Manage the rate of growth so as to not overburden the county infrastructure.• Encourage the recruitment of clean non-polluting industry. • Encourage the availability of adequate housing opportunities for the county workforce.
GOAL 7: Ensure consistency of residential development with the subareas’ visions and balance the needs of landowners and residents.
Long Range Objectives/Short Term Action Items:§ Protect residential areas from negative impact by incompatible adjoining uses or adverse
environmental conditions.§ Usability of land may be a factor in calculating density.§ Promote and encourage residential densities and designs that ensure a variety of housing types.
GOAL 8: Develop overlay districts.
Long Range Objectives/Short Term Action Items:§ Develop overlay districts for major transportation corridors. The major transportation
corridor study should consider design criteria, alternative development regulations, and increased flexibility in accepted land uses. Develop a procedure for community involvement, such as a community task force.
Chapter Ten, the Implementation Program, provides the overall strategy for the comprehensive plan implementation. The policy recommendations listed above are merged and coordinated with the policies of the other elements to form the implementation program. The associated short-term work program designates the actions the county will take in the next five years to achieve these goals. The list is not all-inclusive. There are some actions that may not be addressed due to time, budget and administrative constraints. These items will be included as part of the work program at some point over the twenty-year planning period.

FORSYTH COUNTY COMPREHENSIVE PLAN 8-1
ROAD INVENTORYRoadway Functional ClassificationThe existing highway and street system in Forsyth County consists of a network of facilities serving multiple uses and functions throughout the region. Highways and streets can be classified according to their respective functions in terms of the character of the transportation service they provide. All roadways in the Forsyth County road network were classified using the following five categories: freeways, major arterials, minor arterials, collectors, and local roads. The functional classification of the highways and streets is important because it identifies the desired or minimum rights-of-way which exist now or may be needed in the future to expand the network as the need materializes over the twenty-year planning period.
FreewaysThis type of highway usually consists of limited access freeways, including interstate highways and other expressways serving high volumes of high speed auto and truck traffic. The major purpose of these facilities is to provide mobility between metropolitan areas, regions or states and generally is not designed to provide access to private property. A
INTRODUCTIONThe transportation element provides the County an opportunity to inventory components of the local transportation network; to assess their adequacy for serving current and future population and economic needs; and to articulate community goals and an associated implementation program for providing the desired level of transportation facilities and services throughout the planning period. A Major Transportation Plan Update was adopted in October of 2002. This plan update has been developed using an inventory of the existing street and highway network, an analysis of socio-economic data for the county, and information about land use, growth trends, and emerging development patterns. Data and information about the existing transportation facilities and their capacity, posted vehicle speeds, average running speed, and traffic volumes have been compiled. All roads with the classification of collector and higher (arterials and freeways) were field inspected to determine the number of lanes, width of road, type of traffic control, and speed limits.
In addition to the information on the existing highway network, the assessment of existing conditions also includes an analysis of employment, population and income in the county. A description of the land use types, their intensity, and their location have been considered in the plan update as well as an analysis of travel demand for the area. In order to predict future transportation needs, it was necessary to determine the capacity of the existing transportation system and to develop and validate the computerized transportation model. Information on current transportation, development, and socio-economic conditions in the Forsyth County area has been compiled, organized for each traffic zone, and summarized for the existing transportation system.
CHAPTER 8TRANSPORTATION ELEMENT

FORSYTH COUNTY COMPREHENSIVE PLAN 8-2
T R A N S P O R T A T I O N
FORSYTH COUNTY COMPREHENSIVE PLAN 8-3
considerable amount of traffic on these facilities consists of through traffic. These highways generally have a minimum of four lanes, with some freeways being much wider, especially in major metro areas. Typical rights-of-way range from 200-400 feet, with medians or barrier walls to separate directional traffic. Major ArterialsThis type of highway or street serves the major activity centers of a metropolitan or urban area and consists mainly of the highest traffic volume corridors. These highways usually carry a high proportion of trips with origins and destinations within the region as well as a considerable amount of through trips. This type of roadway is intended to provide mobility within major metropolitan areas or cities and may provide some access to private property. Controlled access facilities can be classified within this system. Major arterials typically have 100 to 200 feet right-of-way, four or more lanes, and may have a median to improve operational characteristics of the roadway.
Minor ArterialsStreets and highways that interconnect with and complement the major arterials are classified as minor arterials. This system serves trips of moderate length and puts more emphasis on land access than the major arterial system. All arterials not classified as primary are included in this class. Minor arterials will have 80 to 120 feet right-of-way, wider intersections with turning lanes, and may have up to five lanes of traffic.
CollectorsThe main purpose of streets within this system is to collect traffic from local streets in residential areas, major activity centers, and central business districts, and to carry it to the arterial highway system. Thus, collector streets provide a large amount of access to private property and usually go through residential areas to facilitate traffic circulation to commercial, industrial, medical, educational, and other public facility areas. Collectors typically have rights-of-way of 80 to 100 feet with two to four undivided lanes. Local RoadsThis system consists of all other streets within a community or region that are not included in the four classifications described above. The primary purposes of these streets are to provide access to abutting land and connection to the collector streets. These streets can often be found in neighborhoods; thus, through traffic is deliberately discouraged on these roads. Local roads generally have rights-of-way of 50 to 80 feet, and in some cases, will allow on street parking.
Functional Classification AssignmentsTable 8.1 provides a listing of all the existing roadways in Forsyth County with their respective functional classification and typical minimum right-of-way. All roadways not identified in the table are classified as local roads. Figure 8.1 provides a map of Forsyth County showing the functional classification system.

FORSYTH COUNTY COMPREHENSIVE PLAN 8-2
T R A N S P O R T A T I O N
FORSYTH COUNTY COMPREHENSIVE PLAN 8-3
TABLE 8.1 ROADWAY FUNCTIONAL CLASSIFICATION TABLE
Roadway Name From/ToFunctional
Classification
RequiredMinimum R-O-W
A.C. Smith Road SR 9 to Hopewell Road Collector 80Aaron Sosbee Road SR 20 to Bethelview Road Collector 80Antioch Road Pilgrim Mill Road to SR 9 Collector 80Bagley Drive SR 141 to Mathis Airport Road Minor Arterial 100Bagley Road SR 141 to Mathis Airport Road Collector 80Bannister Road SR 369 to SR 9 Minor Arterial 100Bentley Road Campground Road to Post Road Collector 80Bethelview Road SR 9 to Kelly Mill Road Major Arterial 120
Kelly Mill Road to SR 20 Minor Arterial 100Bettis-Tribble Gap Road SR 306 to Spot Road Collector 80
Brannon Road SR 141 to Old Atlanta Road Collector 80Brookwood Road McGinnis Ferry Road to SR 141 Collector 100Buford Dam Road SR 9 to Gwinnett Co. Line Minor Arterial 100Burruss Mill Road SR 369 to Little Mill Road Collector 80Burruss Road SR 9 to Hopewell Road Collector 80Campground Road Cherokee Co. Line to SR 9 Collector 80Caney Road Brookwood Road to Chris. Robin Road Collector 80Castleberry Road SR 9 to W. Main Street Minor Arterial 100Chamblee Gap Road SR 20 to Kelly Mill Road Collector 80Chattahoochee Road Holtzclaw Road to Shady Grove Road Collector 80Christopher Robin Road
McGinnis Ferry Rd. to Old Alpharetta Rd Collector 80
Cross Roads Road SR 400 to Jot-Em-Down Road Collector 80Crystal Cove Trail SR 53 to Lake Lanier Collector 80Dr. Bramblett Road SR 20 to SR 369 Minor Arterial 100Drew Road Cherokee Co. Line to Post Road Collector 80Elmo Road Mt. Tabor Road to SR 369 Collector 80Freedom Parkway SR 306 to Pilgrim Mill Road Minor Arterial 100Fowler Road Mullinax Road to SR 9 Collector 80Francis Road Fulton Co. Line to SR 9 Collector 80Friendship Circle S.R. 20 to Hurt Bridge Road Collector 80GA 400 Fulton Co. Line to Dawson Co. Line Major Arterial VariesHamby Road Fulton Co. Line to SR 9 Collector 80

FORSYTH COUNTY COMPREHENSIVE PLAN 8-4
T R A N S P O R T A T I O N
FORSYTH COUNTY COMPREHENSIVE PLAN 8-5
Heardsville Road SR 20 to Heardsville Circle Collector 80Hendrix Road John Burruss Road to SR 369 Collector 80Holtzclaw Road Pilgrim Mill Road to Shady Grove Rd Collector 80Hopewell Road SR 9 to Dawson Co. Line Collector 80Hubbard Town Road Hopewell Road to SR 400 Collector 80Hurt Bridge Road Friendship Circle to Heardsville Road Collector 80
Hutchinson Road Castleberry Road to SR 9 Collector 80
Hyde Road Drew Road to SR 20 Collector 80James Burgess Road Old Atlanta Road to SR 20 Collector 80John Burruss Road Karr Road to SR 369 Collector 80
Jot-Em-Down Road Hopewell Road to SR 369 Collector 100
Kelly Mill Road SR 371 to Bethelview Road Minor Arterial 100Bethelview Road to SR 20 Minor Arterial 100
Laurel Springs Parkway/Westminster Lane
SR 141 to Old Atlanta Road Collector 80
Little Mill Road SR 369 to SR 306 Collector 80Majors Road Post Road to SR 141 Collector 80Market Place Boulevard SR 20 to Pilgrim Mill Road Major Arterial 100
Market Place ParkwayMartin Road
SR 20 to McGinnis Ferry RoadSR 9 to SR 306
Minor ArterialCollector
100-12080
Mary Alice Park Road SR 9 to Lake Lanier Collector 80Mathis Airport Road SR 141 to SR 20 Minor Arterial 120Mayfield Drive SR 306 to Jot-Em-Down Road Collector 80McFarland Road SR 9 to McGinnis Ferry Road Major Arterial 150McGinnis Ferry Road Fulton Co. Line to Union Hill Road Collector 80
Union Hill Road to McFarland Road Minor Arterial 100McFarland Road to Gwinnett Co. Line Major Arterial 120
Mt. Tabor Road SR 369 to Elmo Road Collector 80Mullinax Road SR 9 to Union Hill Road Collector 100
Oak Grove Circle SR 9 to Riley Road Collector 80Old Atlanta Road McGinnis Ferry Road to Sharon Road Minor Arterial 120
Sharon Road to SR 9 Minor Arterial 100Old Alpharetta Road McGinnis Ferry Road to SR 141 Minor Arterial 100

FORSYTH COUNTY COMPREHENSIVE PLAN 8-4
T R A N S P O R T A T I O N
FORSYTH COUNTY COMPREHENSIVE PLAN 8-5
Old Buford Road SR 9 to Main Street Major Arterial 120Old Keith Bridge Road SR 306 to Lake Lanier Collector 80Parks Road SR 306 to Little Mill Road Collector 80Pea Ridge Road Jot-Em-Down Road to SR 53 Collector 80Pendley Road SR 9 to Old Atlanta Road Collector 80Pilgrim Mill Road Main Street to Lake Lanier Collector 80Piney Grove Road Castleberry Road to SR 9 Collector 80Pittman Road Post Road to Bethelview Road Collector 80Pleasant Grove Road Hurt Bridge Road to Dr. Bramblett
RoadCollector 80
Riley Road Oak Grove Circle to Bannister Road Collector 80
Samples Road SR 20 to Buford Dam Road Collector 80Sanders Road SR 20 to Mary Alice Park Road Collector 80Settingdown Road SR 369 to Cross Roads Road Collector 80Shadburn Road Martin Road to SR 306 Collector 80Sharon Road From SR 141 to Old Atlanta Road Minor Arterial 120Shiloh Road McFarland Road to SR 9 Collector 80Spot Road Dr. Bramblett Road to SR 9 Collector 100Stoney Point Road Shiloh Road to SR 141 Collector 80Strickland Road McGinnis Ferry Road to SR 9 Collector 80SR 9 Fulton Co. Line to Main Street Major Arterial 120
Main Street to SR 369 Major Arterial 100SR 369 to Dawson Co. Line Minor Arterial 100
SR 20 Cherokee Co. Line to Maple Street Major Arterial 120SR 9 to Gwinnett Co. Line Major Arterial 150-200
SR 53 Dawson Co. Line to SR 306 Minor Arterial 100SR 306 to Hall Co. Line Major Arterial 120
SR 141 Fulton County Line to SR 9 Major Arterial 150-200SR 371 Extension SR 20 to SR 369 (Heardsville Road) Minor Arterial 100SR 306 SR 20 to SR 9 (Proposed) Major Arterial 100
SR 9 to GA 400 Major Arterial 120GA 400 to SR 369 Major Arterial 150SR 369 to Hall Co. Line Major Arterial 120
SR 369 Cherokee Co. Line to SR 306 Minor Arterial 100SR 306 to Hall Co. Line Major Arterial 120
SR 371 (Post Road) SR 9 to Kelly Mill Road Minor Arterial 100Kelly Mill Road to SR 20 Major Arterial 120

FORSYTH COUNTY COMPREHENSIVE PLAN 8-6
T R A N S P O R T A T I O N
FORSYTH COUNTY COMPREHENSIVE PLAN 8-7
Highway Infrastructure and Traffic VolumesInventories were also made of the existing transportation road network to determine present number of lanes, present roadway and intersection geometry and their capacity, average travel speed, and present traffic volumes. Average Annual Daily Traffic for the Year 2000 (AADT) was determined from the raw field count data and adjustment factors provided by GDOT.
Figure 8.2 shows 2000 base year AADTs for the major roads in Forsyth County. Figure 8.3 shows the base year speed limits for the major roads. Figure 8.4 shows the current lane configurations (i.e. two-lane, three-lane, etc.).
Major Roadways Several major roadway corridors exist in Forsyth County that are state roads or county facilities. A brief description of each major roadway in Forsyth County follows:
GA 400/U.S. 19State Route (SR) 400/U.S. 19 is the most significant transportation facility in Forsyth County. The four-lane, freeway provides access to the City of Atlanta and Fulton County to the south and Dawson County to the north. Much of the growth and development in Forsyth County and the northern area of Metropolitan Atlanta have occurred and continues to locate near this multi-lane freeway. S.R. 400/U.S. 19 provides access to employment centers and other key activity centers in Fulton County and Atlanta from residential communities in Forsyth County. S.R. 400/U.S. 19 is considered as a high growth corridor in the Greater Atlanta region and is increasingly being used by residents, visitors, and businesses as a major artery in the region.
The GA 400 corridor and its surrounding area (Northern Sub-area) is the subject of a large regional transportation and land use study being undertaken by the Georgia Regional Transportation Authority (GRTA). The study’s short-term focus is the identification of near term highway, transit, traffic operations, intelligent transportation system and related projects which could bring relief to this major congested corridor within the near future. The project is expected to identify short-term improvements for the corridor.
Trammell Road Old Atlanta Road to SR 20 Collector 80Tribble Road SR 20 to Watson Road Collector 80Union Hill Road McGinnis Ferry Road to Mullinax Road Collector 100
Mullinax Road to Shiloh Road Collector 80Vanns-Tavern Road SR 369 to Lake Lanier Collector 80Waldrip Road SR 369 to SR 306 Collector 80Wallace Tatum Road Heardsville Road to SR 369 Collector 80Watson Road Heardsville Road to Hurt Bridge Road Collector 80Westbrook Road SR 306 to SR 53 Collector 80

FORSYTH COUNTY COMPREHENSIVE PLAN 8-6
T R A N S P O R T A T I O N
FORSYTH COUNTY COMPREHENSIVE PLAN 8-7
FIGURE 8.1: FUNCTIONAL CLASSIFICATION SYSTEM

FORSYTH COUNTY COMPREHENSIVE PLAN 8-8
T R A N S P O R T A T I O N
FORSYTH COUNTY COMPREHENSIVE PLAN 8-9
FIGURE 8.2: 2000 ANNUAL AVERAGE DAILY TRAFFIC (AADT) - BASE YEAR

FORSYTH COUNTY COMPREHENSIVE PLAN 8-8
T R A N S P O R T A T I O N
FORSYTH COUNTY COMPREHENSIVE PLAN 8-9
FIGURE 8.3: EXISTING HIGHWAY POSTED SPEED LIMITS

FORSYTH COUNTY COMPREHENSIVE PLAN 8-10
T R A N S P O R T A T I O N
FORSYTH COUNTY COMPREHENSIVE PLAN 8-11
FIGURE 8.4: EXISTING ROADWAY LANE CONFIGURATION

FORSYTH COUNTY COMPREHENSIVE PLAN 8-10
T R A N S P O R T A T I O N
FORSYTH COUNTY COMPREHENSIVE PLAN 8-11
The element of the study focusing on the Northern Sub-area of the Atlanta region is focusing on longer-term land use and development strategies to manage the transportation demand in the future for this vibrant and growing area. The study area is generally defined as: I-75 on the west, I-285 on the south, I-85 on the east, and three miles north of SR 20 on the north. A section of GA 400 between the northern boundary of the study and SR 369 is also included in the study and has eastern and western boundaries that extend three miles in either direction of GA 400. The results of the Northern Sub-area Study were completed in 2003.
S.R. 9SR 9 from SR 20 to Maple Street is currently a three-lane urban arterial leading into the City of Cumming. This section of SR 9 is predominantly fronted by strip commercial development.
SR 9 from SR 141 to SR 20 is currently a two-lane rural arterial running parallel to State Route 400. A significant amount of strip commercial development along SR 9 between SR 20 and SR 141 is expected in the future. The interchange of SR 20 and SR 400 is already a large commercial node while the interchange of SR 400 and SR 141 will be a relatively large commercial node in the near future. Projected traffic volumes will be the result of traffic to and from the commercial uses rather than through traffic. GDOT has identified this section of SR 9 to be widened to four lanes.
SR 9 from the Fulton County line to SR 141 is currently a two-lane arterial. The section of SR 9 from Hamby Road to McFarland Road carries a significant amount of traffic due to through southbound traffic from Cherokee County to GA 400.
SR 9 from Maple Street to SR 306 is currently a two-lane arterial leading into the City of Cumming from the north and running parallel to GA 400. As residential development spreads northward, an increase in roadway capacity will be required for this segment. However, the extension of SR 306, currently programmed by GDOT, will divert through traffic from this section of SR 9.
Hutchinson RoadHutchinson Road is a two-lane minor arterial connecting Castleberry Road and SR 9 along the City of Cumming’s city limits. Hutchinson Road is currently over capacity and provides traffic relief from SR 9. Current plans call for construction of a three-lane section with a center turn lane from Castleberry Road to SR 9. A new alignment will be constructed on about one half of Hutchinson Road East to form a new intersection on SR 9 at Old Atlanta Road.
S.R. 20SR 20 east of GA 400 is currently a two-lane rural arterial connecting GA 400 with I-985 and I-85 in Gwinnett County. This section of SR 20 is currently over capacity. Continued residential and commercial development along this roadway will continue to increase traffic volumes. GDOT has plans to widen SR 20 from GA 400 to Samples Road from two lanes to four lanes with a median. The project is schedule to begin in 2003.

FORSYTH COUNTY COMPREHENSIVE PLAN 8-12
T R A N S P O R T A T I O N
FORSYTH COUNTY COMPREHENSIVE PLAN 8-13
SR 20 west of the City of Cumming to Cherokee County is currently a five/three-lane section with a two-way left turn lane.
S.R. 141SR 141 is currently a two-lane arterial with a center turn lane along much of this section, and connects development in north Fulton County to GA 400. As residential development continues to occur, more commercial development will take place along SR 141 much like the recent commercial center at SR 141 and McGinnis Ferry Road and existing developments in North Fulton County. GDOT has plans to widen SR 141 to four lanes, and has scheduled the widening for fiscal year 2007.
McGinnis Ferry RoadMcGinnis Ferry Road is currently a two-lane arterial running along the county line of Forsyth County and Fulton County. McGinnis Ferry Road bridges the Chattahoochee River and is already four lanes wide with a median in Gwinnett County. This roadway has become a major east-west corridor connecting SR 141 and SR 400 to I-85. Continued residential, industrial and commercial development along this corridor has increased traffic volumes above capacity. Forsyth County, in cooperation with Fulton County, is in the process of widening McGinnis Ferry Road to four lanes with a median west of the Chattahoochee River, to Sargent Road.
McFarland RoadMcFarland Road was recently improved, and is currently a four-lane road with a 44-foot median. McFarland Road connects McGinnis Ferry Road and SR 9 with an interchange at SR 400. McFarland Road has and will continue to experience rapidly growing traffic volumes as the development of industrial parks such as John’s Creek Park, Blue Grass Park, and Windward Park continues. Multifamily residential development along with large office parks near SR 400 combine to create high peak hour levels of traffic congestion on a daily basis. GDOT is planning to improve the interchange at GA 400.
Old Atlanta RoadOld Atlanta Road is a two-lane rural minor arterial providing access from McGinnis Ferry Road to the new Market Place Parkway expansion. There are many major residential developments located on Old Atlanta Road, some of which contain 500 or more homes. Old Atlanta Road runs relatively parallel to SR 141, thus diverting some traffic from that roadway. Sharon RoadSharon Road is currently a two-lane rural minor arterial connecting SR 141 on the west to Old Atlanta Road on the east. As development continues in this portion of Forsyth County, Sharon Road will need to be improved in order to provide better access to SR 141 and SR 400 from residential areas around Old Atlanta Road.
Mathis Airport RoadMathis Airport Road is currently a two-lane rural collector connecting SR 141 to Old Atlanta

FORSYTH COUNTY COMPREHENSIVE PLAN 8-12
T R A N S P O R T A T I O N
FORSYTH COUNTY COMPREHENSIVE PLAN 8-13
Road. Mathis Airport Road will need to be extended from Old Atlanta Road to SR 20 in order to provide a suitable continuous north-south arterial from SR 141 to SR 20.
S.R. 306 SR 306 is a two-lane rural arterial connecting GA 400 with the extreme northeast portion of Forsyth County. Currently, the corridor is operating below capacity. However, the section from GA 400 to SR 369 has reached capacity and must be widened. The Georgia Department of Transportation has proposed to extend SR 306 from SR 20 to SR 9 as a part of its long-range plan. This four-lane roadway with a 44-foot median will provide better east-west cross-county movement and divert traffic from the City of Cumming. GDOT has also programmed the improvement of the intersection of SR 306 and SR 369 for the fiscal year 2003.
S.R. 369SR 369 is a two-lane rural arterial extending through Forsyth County from Cherokee County to Hall County, and has a very high percentage of truck traffic. SR 369 from SR 400 to the Hall County line serves many residential communities located along Lake Lanier. GDOT has programmed the improvement of the SR 306 and SR 369 intersection for the fiscal year 2003.
S.R. 53SR 53 is currently a two-lane rural arterial cutting through the northeast corner of the County. SR 53 primarily provides access between Gainesville and Dawsonville and provides access to residential areas along Lake Lanier. The Hall County Transportation Plan has identified the need for four-lanes on SR 53. Bethelview RoadBethelview Road is a two-lane rural arterial connecting SR 20 from the north to SR 9 and SR 141 to the south. Continued residential and commercial development along Bethelview Road will gradually increase traffic volumes above its current capacity. The County currently has conceptual plans to widen Bethelview Road in the near future. Some intersection improvements in this corridor intended to improve traffic flow have already been implemented or are underway. Kelly Mill RoadKelly Mill Road is currently a two-lane rural collector leading into the City of Cumming from the western portion of the County. Due to extreme horizontal and vertical curves, Kelly Mill Road is currently an operationally substandard road. Increased residential development along this corridor will require Kelly Mill Road to be substantially improved in the future.
Castleberry RoadCastleberry Road is currently a two-lane, rural collector that parallels SR 9 and will continue to see traffic volumes increase as SR 9 becomes more congested. Increased residential development along this corridor will require Castleberry Road to be improved in the future. In the past year, several very large residential developments with frontage on Castleberry Road have been approved for construction.

FORSYTH COUNTY COMPREHENSIVE PLAN 8-14
T R A N S P O R T A T I O N
FORSYTH COUNTY COMPREHENSIVE PLAN 8-15
S.R. 371 (Post Road)SR 371, also known as Post Road, is currently a two-lane rural arterial running parallel to Bethelview Road. It primarily provides access between SR 20 to the north and SR 9 to the south. Residential development is expected to continue along the Post Road corridor, especially along connecting side roads, with pockets of commercial development at other major intersections.
Doc Bramblett RoadDoc Bramblett Road is currently a two-lane rural collector connecting SR 369 to the north and SR 20 to the south. It is a standard rural road with a significant percentage of truck traffic. Currently, there is no adequate access from SR 369 to SR 20 west of SR 9 in Forsyth County. As development gradually increases in this area, Doc Bramblett Road will need to be improved to provide better access in this area.
Collector Road SystemThe collector road system will run parallel to SR 400 from McGinnis Ferry Road to SR 306. This road system will provide alternate access between major east/west arterials as well as a much needed, potential detour route for SR 400 in the event of emergency closings. The section from SR 306 to Pilgrim Mill Road recently opened and the section from SR 20 to SR 141 is in various states of construction and right-of-way acquisition.
ACCIDENT FREQUENCY
The accident history of roadways helps identify intersections and roadways where potential safety improvements should be considered. The Georgia Department of Transportation’s (GDOT) document Intersection Worth Improvement Potential, was based on a safety index that includes 1997 accident frequency, accident rate, and accident severity. According to the document, there are two intersections within Forsyth County that qualify for improvements. SR 400 at Settingdown Circle had experienced eight accidents in 1997, six with injuries. Improvements for this intersection will be let to construction in April of 2004. SR 369 at Shady Grove Road had experienced seven accidents in 1997, three with injuries. Improvements for this intersection are also currently underway, with right-of-way acquisition expected to be complete in 2004 and construction to begin when funded and let to contract by GDOT.
In addition to the GDOT report, the Forsyth County Department of Engineering regularly reviews the traffic incident reports and enters them into a database which is used to determine if roadways or intersections warrant further safety studies. Once the studies are completed, projects are identified and prioritized to be incorporated into the Major Transportation Plan or the Intersection Improvement Program for funding.

FORSYTH COUNTY COMPREHENSIVE PLAN 8-14
T R A N S P O R T A T I O N
FORSYTH COUNTY COMPREHENSIVE PLAN 8-15
SIGNALIZATION AND SIGNAGESignalsForsyth County installed the first county maintained traffic signal in 1998. The following is a list of current traffic signals that are maintained by Forsyth County:1) Bethelview Road @ Castleberry Road2) Pilgrim Mill @ Holtzclaw Road3) Old Atlanta Road @ Three Chimneys4) McFarland Road @ McGinnis Ferry Road5) McFarland Road @ Union Hill Road6) McGinnis Ferry Road @ John’s Creek Parkway7) McGinnis Ferry Road @ New Boyd Road8) Buford Dam Road @ Nuckolls Road9) Buford Dam Road @ Sanders Road10) Old Atlanta Road @ Westminster Lane11) Old Atlanta Road @ James Burgess Road12) Old Atlanta Road @ Sharon Road13) Bethelview Road @ Kelly Mill Road14) McGinnis Ferry Road @ K-Mart Driveway15) McGinnis Ferry Road @ Old Atlanta Road16) Market Place Parkway @ Old Atlanta Road17) Market Place Parkway @ Brannon Road18) Sharon Road @ Kroger19) Freedom Parkway @ Pilgrim Mill Road20) McFarland Road @ Curie Drive21) McFarland Road @ Shiloh Road22) McFarland Road @ Bluegrass Valley23) McFarland Road @ Bluegrass Lakes24) McFarland Road @ McFarland 400 Boulevard25) Freedom Parkway @ Kroger26) McFarland Road @ Trotters Pkwy
Fulton County maintains the signals at:1) McGinnis Ferry @ Sargent Road2) McGinnis Ferry @ Brookwood Road
The City of Cumming maintains the signals at:1) Market Place Blvd at Buford Dam Road2) Market Place Blvd at Kholes/Target Drive3) Tribble Gap Road @ Elm Street4) Tribble Gap Road @ Otwell Middle School Drive
The City of Alpharetta maintains the signal at McGinnis Ferry @ Windward Parkway. The remaining signals are maintained by Georgia Department of Transportation.

FORSYTH COUNTY COMPREHENSIVE PLAN 8-16
FOR
SYTH
CO
UN
TY C
OM
PREH
ENSI
VE P
LAN
8-
17The need for additional signals in Forsyth County is determined by the Georgia Department of Transportation for state routes and the Forsyth County Engineering Department for county roadways. There are no major issues with the conditions of the traffic signals in Forsyth County. The County Traffic Operations Specialist is in charge of maintaining the county controlled traffic signals as needed.
SignageThere are no major issues with the county’s signage. To address regular maintenance needs, a signage program is currently being implemented by Forsyth County Engineering Department. Two traffic control technicians are employed to inventory, erect, replace and repair the county maintained road signage as needed. Signs on state routes are maintained by the Georgia Department of Transportation.
BRIDGES
An inventory of the county’s bridges, including the location and condition is presented on the following pages in Table 8.2. The Forsyth County road system provides many alternative routes throughout the county. Therefore, the county’s bridge system is not significant to evacuation routes in cases of natural disaster.

FOR
SYTH C
OU
NTY C
OM
PREH
ENSIVE PLA
N
8-16
FORSYTH COUNTY COMPREHENSIVE PLAN 8-17
BRIDGE NAME LOCATION TYPE SIZE LENGTH BUILT RATING
ABERDEEN PARKWAY OVER DICK CREEK CULVERT Triple 9’x8’’’’ 136’ 1990 GOODBENNETT ROAD UNNAMED CREEK CULVERT DBL 7’x7’ 52’ 1997 GOODBENTLEY ROAD OVER BENTLEY CREEK CULVERT Triple 10’x8’x36’ 36’ 1973 GOODBETHELVIEW ROAD OVER BIG CREEK BRIDGE STRUCTURE 2-Lane Concrete 111’ 1966/1990 FAIRBETHELVIEW ROAD OVER CHEATHAM CREEK CULVERT Double 10’x9’’76’ 76’ 1960 FAIRBURNT BRIDGE ROAD OVER SETTINGDOWN CREEK BRIDGE STRUCTURE 2-Lane Concrete 61’ 1994 GOODBURRUSS MILL ROAD OVER SIX MILE CREEK BRIDGE STRUCTURE 2-Lane Wooden 60’ 1993 GOODCASTLEBERRY ROAD OVER SAWMILL CREEK CULVERT Triple 8’x6’x50’ 50’ 1998 GOODCHAMBLEE GAP ROAD OVER CHEATHAM CREEK CULVERT Triple 8’x8’x60’ 60’ 1999 GOODDR. BRAMBLETT ROAD OVER SETTINGDOWN CREEK BRIDGE STRUCTURE 2-Lane Concrete 145’ 1958/1989 FAIRDREW CAMPGROUND RD
OVER HARRIS CREEK CULVERT Quad 10’x6’ 58’ 2001
HOPEWELL ROAD OVER SETTINGDOWN CREEK CULVERT 10’X6’33’ 33’ 1941 FAIRHUBERT MARTIN ROAD OVER SETTINGDOWN CREEK CULVERT Triple 9’x9’x34’ 34’ 1983 FAIRHURT BRIDGE ROAD OVER YELLOW CREEK CULVERT Triple 6’x6’ 52’ 1997 GOODJAMES BURGESS ROAD OVER JAMES CREEK CULVERT Quad 10’x7’x96’ 96’ 1989 FAIRJOHN BURRUSS ROAD OVER SETTINGDOWN CREEK CULVERT Quad 10’x9’x36’ 36’ 1978 GOODKELLEY MILL ROAD OVER CHEATHAM CREEK CULVERT Triple 10’x6’x40’ 40’ 1988 GOODKELLY MILL ROAD KELLEY MILL BRANCH CULVERT Quad 8’x6’x40’ 40’ 1979 FAIRMAJORS ROAD OVER BIG CREEK BRIDGE STRUCTURE 2-Lane Concrete 100’ 1996 GOODMCCOY CIRCLE OVER YELLOW CREEK CULVERT DBL 8’x8’x62’ 62’ 1998 GOODMCFARLAND ROAD OVER BIG CREEK BRIDGE STRUCTURE 2-Lane Concrete 160’ 1977/1995 GOODMILFORD ROAD OVER TWO MILE CREEK CULVERT Triple 84” CMP 80’ 1987 GOODMT. TABOR ROAD OVER BREWTON CREEK CULVERT Double 10’x10’x38’ 38’ 1973 GOODNICHOLSON ROAD OVER BANNISTER CREEK CULVERT DBL-DBL 10’x8’x42’ 42’ 1989 FAIROLD ALPHARETTA ROAD OVER BIG CREEK CULVERT Triple 10’x6’ 56’ 2001 GOODOLD ATLANTA ROAD OVER DICK CREEK CULVERT Triple 10’x11’x45’ 45’ 1969 FAIR
TABLE 8.2: BRIDGE INVENTORY

FORSYTH COUNTY COMPREHENSIVE PLAN 8-18
TR
AN
SP
OR
TA
TIO
N
FOR
SYTH C
OU
NTY C
OM
PREH
ENSIVE PLA
N
8-19
OLD ATLANTA ROAD OVER JAMES CREEK CULVERT Triple 10’x11’x51’ 51’ 1992 GOODOLD FEDERAL ROAD OVER ETOWAH RIVER BRIDGE STRUCTURE 2-Lane Concrete 220’ 1984 FAIRPILGRIM MILL ROAD OVER SAWNEE CREEK CULVERT Triple 9’x6’x38’ 38’ 1978 GOODPILGRIM MILL ROAD OVER BALDRIDGE CREEK CULVERT Triple 10’x8’x54’ 54’ 1992 GOODPISGAH ROAD OVER YELLOW CREEK CULVERT DBL 8’x7’x64’ 64’ 1998 GOODPITTMAN ROAD OVER CHEATHAM CREEK CULVERT Quad 10’x6’x40’ 40’ 1979 FAIRPOLO DRIVE OVER BIG CREEK CULVERT DBL-DBL 12’x12’ 64’ 1987 GOODPOOLES MILL ROAD OVER SETTINGDOWN CREEK BRIDGE STRUCTURE 1-Lane Wooden 220’ 1988 GOODSAMPLES ROAD OVER HAW CREEK CULVERT DBL 8’x7’ 65’ 2001SHILOH ROAD OVER BAGLEY CREEK CULVERT DBL-DBL
10’X6’X50’50’ 1998 GOOD
STONEY POINT ROAD OVER BAGLEY CREEK CULVERT DBL-DBL 10’X4’X50’
50’ 1998 GOOD
TRAMMEL ROAD OVER DAVES CREEK BRIDGE STRUCTURE 2-Lane Wooden 50’ 1999 GOODUNION HILL ROAD OVER BIG CREEK CULVERT Five 10’x10’x44’ 44’ 1985 FAIRWALLACE TATUM ROAD OVER SETTINGDOWN CREEK BRIDGE STRUCTURE 2-Lane Concrete 180’ 1987 FAIRWRIGHT BRIDGE ROAD OVER SETTINGDOWN CREEK BRIDGE STRUCTURE 2-Lane Concrete 120’ 1980 FAIR30 - Culverts 11 - Bridge Structures

FOR
SYTH
CO
UN
TY C
OM
PREH
ENSI
VE P
LAN
8-
18
T R A N S P O R T A T I O N
FORSYTH COUNTY COMPREHENSIVE PLAN 8-19
STATE TRANSPORTATION IMPROVEMENT PROGRAMThe State Transportation Improvement Program (STIP) was developed under guidelines provided by the Transportation Equity Act for the 21st Century (TEA-21), passed by Congress in 1998. TEA-21 continues the initiatives started under the Intermodal Surface Transportation Efficiency Act of 1991 (ISTEA). The STIP includes Highway, Bridge, Bicycle, Pedestrian, Transportation Enhancement Activities and Public Transportation (transit) projects.
The State has several projects underway in Forsyth County as part of the 2003-2005 STIP on Table 8.3. The projects that are proposed for the County in the draft 2004-2006 STIP are listed in Table 8.4.
BIKE AND PEDESTRIAN PATHWAYSForsyth County has few existing bicycle and pedestrian facilities. Although the County does not have an ordinance requiring sidewalk installation within developments, many subdivisions have elected to provide interior sidewalks. However, these sidewalks currently do not extend beyond these developments to provide connectivity to schools, parks or employment areas. To address this need, the Forsyth County Bicycle Transportation and Pedestrian Walkways Plan was adopted in April of 2002. This document is included in Appendix E.
SIGNIFICANT PARKING FACILITIESThere are currently no park and ride lots or other significant parking facilities in Forsyth County.
PUBLIC TRANSPORTATIONThere is currently no fixed route transit or intercity bus service in Forsyth County, limiting the county’s transportation options and focusing attention on single occupancy vehicles. However, the County is now within the jurisdiction of the Georgia Regional Transportation Authority and is included in the pending Regional Express Bus Service Plan. As an option to traditional public transportation, the County has created a Dial-A-Ride program to meet the needs of county residents. The Dial-A-Ride program operates three vans, one 14 passenger and two lift vans for wheelchair service, and maintains one van in Forsyth County at all times. The program is classified as ‘on call’, meaning there is no set route and residents make appointments for rides. The current fee schedule includes trips ranging from $1.50 to $4.50. Dial-A-Ride is operated by the Forsyth County Department of Engineering, and is funded by the Board of Commissioners, the Georgia Department of Transportation, and passenger fees.
OTHER MODES OF TRANSPORTATIONThere are no freight or passenger rail lines in Forsyth County. There are currently two private airfields in the southern portion of the County. Stoney Point Airfield and Mathis Road Airfield are private facilities that can accommodate small aircraft. Based on existing land use patterns, the expansion of either facility is unlikely.

FORSYTH COUNTY COMPREHENSIVE PLAN 8-20
T R A N S P O R T A T I O N
FORSYTH COUNTY COMPREHENSIVE PLAN 8-21
STATE TRANSPORTATION IMPROVEMENT PROGRAM
2/3/2003
Forsyth
DOT DISTRICT: 1
122250-Project: Type Work: WideningDescp:
Phase Fund Year Fed Other TotalState
2Lanes: Exist. Prop. 4
PE STP Underway
ROW STP Underway
CST STP 2004 $5,895,000.00 4,716,000.00 1,179,000.00 0.00 2.02Length:
SR 20 FM SR 400 TO SAMPLE ROAD/CR 80
TIP#: FT 004
132940-Project: Type Work: Intersection ImprovementDescp:
Phase Fund Year Fed Other TotalStatePE STP Underway
ROW Local LOCL $300,000.00 0.00 0.00 300,000.00CST STP LUMP $361,000.00 324,900.00 36,100.00 0.00
LUMP SUM PROJECT 0.40Length:
SR 400/US 19 AT SETTINGDOWN ROAD/CR 176 NE OF CUMMING
TIP#: AR 157
141870-Project: Type Work: InterchangeDescp:
Phase Fund Year Fed Other TotalStatePE STP Underway
ROW STP 2003 $3,750,000.00 3,000,000.00 750,000.00 0.00CST STP 2003 $10,799,000.00 8,639,200.00 2,159,800.00 0.00 0.40Length:
SR 400 AT MCFARLAND ROAD INTERCHANGE RECONSTRUCTION
TIP#: FT 007A
141880-Project: Type Work: WideningDescp:
Phase Fund Year Fed Other TotalState
2Lanes: Exist. Prop. 4
PE STP 2003 $5,000.00 4,000.00 1,000.00 0.00ROW STP After 2005
CST STP After 2005 6.11Length:
BETHELVIEW RD/SR 1005 FM SR 9 TO SR 20 INCLUDE SR 20 INT.
TIP#: FT 008
142300-Project: Type Work: Intersection ImprovementDescp:
Phase Fund Year Fed Other TotalStatePE STP Underway
ROW Local LOCL $300,000.00 0.00 0.00 300,000.00CST STP LUMP $1,460,000.00 1,314,000.00 146,000.00 0.00
LUMP SUM PROJECT 0.40Length:
SR 371 AT KELLY MILL ROAD/CR 5
TIP#: AR 157
722020-Project: Type Work: WideningDescp:
Phase Fund Year Fed Other TotalState
4Lanes: Exist. Prop. 8
PE RRB 2004 $1,000,000.00 0.00 1,000,000.00 0.00CST NHS After 2005
11.36Length:
SR 400 FM SR 120/OLD MILTON PKWY/FULTON TO SR 20/FORSYTH
TIP#: FN AR 198
M001752Project: Type Work: Resurface & MaintenanceDescp:
Phase Fund Year Fed Other TotalStateCST NHS LUMP $15,429,836.00 12,343,870.00 3,085,966.00 0.00
LUMP SUM PROJECT 36.19Length:
SR 400 FROM I-285 TO SR 306
TIP#: AR 311
0002317Project: Type Work: SidewalksDescp:
Phase Fund Year Fed Other TotalStateCST STP LUMP $206,250.00 165,000.00 0.00 41,250.00
LUMP SUM PROJECT 0.00Length:
PED. IMPVMENTS TO BEAR CREEK; ADAMS ST; AND CREST DR/LAVONIA
0003898Project: Type Work: LandscapingDescp:
Phase Fund Year Fed Other TotalStateCST STP LUMP $562,000.00 449,600.00 112,400.00 0.00
LUMP SUM PROJECT 1.00Length:
LANDSCAPING ON I-85 IN FRANKLIN AND HART COUNTIES
122080-Project: Type Work: WideningDescp:
Phase Fund Year Fed Other TotalState
2Lanes: Exist. Prop. 4
PE STP Underway
ROW Bond Underway
ROW RRB 2003 $11,500,000.00 0.00 11,500,000.00 0.00CST RRB 2003 $7,500,000.00 0.00 7,500,000.00 0.00
4.30Length:
SR 17 FM SE CR 67/ROSS PL N LAVONIA TO SE STEPHENS CL&BR
Page 8 of 23
TABLE 8.3: STIP IMPROVEMENTS FOR FORSYTH COUNTY 2003 - 2005

FORSYTH COUNTY COMPREHENSIVE PLAN 8-20
T R A N S P O R T A T I O N
FORSYTH COUNTY COMPREHENSIVE PLAN 8-21
STATE TRANSPORTATION IMPROVEMENT PROGRAM8/8/2003
DraftDOT DISTRICT: 1
Forsyth0000810Project: Type Work: Intersection Improvement
Descp: SR 9 AT 6 INTERSECTIONS AND SR 20 AT TRIBBLE RD
Phase Fund Year Federal Other TotalStatePE STP Underway
ROW $664,000 $166,000 $0STP 2005 $830,000CST STP After 2006 2.40Length:
TIP#: AR-157
0000812Project: Type Work: Intersection ImprovementDescp: SR 306/KEITH BRIDGE RD @ SR 53;
SHADBURN/PARKS & WALDRIP RD
Phase Fund Year Federal Other TotalStatePE STP Underway
ROW $1,484,000 $371,000 $0STP 2005 $1,855,000CST STP After 2006 0.80Length:
TIP#: AR-157
0001757Project: Type Work: HOV LanesDescp: SR 400 FROM I-285 TO MCFARLAND
ROAD/FORSYTH CO FOR HOV LANES
Phase Fund Year Federal Other TotalStatePE NHS After 2006
PE $3,200,000 $800,000 $0NHS 2005 $4,000,000ROW NHS After 2006
CST NHS After 2006
17.06Length:
TIP#: *ILLUST AR
0002862Project: Type Work: WideningDescp: SR 20 FROM SR 369/CHEROKEE TO SR
371/FORSYTH
Phase Fund Year Federal Other TotalState
2Lanes: Exist. Prop. 4
PE $1,120,000 $280,000 $0STP 2004 $1,400,000ROW STP After 2006
CST STP After 2006 6.37Length:
TIP#: *NIRTPDON
0003682Project: Type Work: WideningDescp: SR 20 FROM SR 371 TO SR 400
Phase Fund Year Federal Other TotalState
2Lanes: Exist. Prop. 4
PE $1,760,000 $440,000 $0STP 2006 $2,200,000ROW STP After 2006
ROW STP After 2006
ROW STP After 2006
ROW STP After 2006
ROW STP After 2006
CST STP After 2006
8.39Length:
TIP#: *NIRTPDON
0004429Project: Type Work: WideningDescp: MCGINNIS FERRY ROAD FROM SARGENT ROAD
TO CHATTAHOOCHEE RIVER
Phase Fund Year Federal Other TotalStatePE $0 $0 $630,000Local LOCL $630,000ROW $0 $8,000,000 $0Bond 2004 $8,000,000CST $0 $12,600,000 $0Bond 2005 $12,600,000 5.39Length:
TIP#: FN AR 201
121980-Project: Type Work: WideningDescp: SR 141 FM 0.6 MI NORTH OF FULTON CO LINE TO
SR 9
Phase Fund Year Federal Other TotalState
2Lanes: Exist. Prop. 4
PE STP Underway
ROW STP Underway
CST $0 $11,005,000 $0Bond 2005 $11,005,000CST $7,996,000 $1,999,000 $0STP 2005 $9,995,000
6.81Length:
TIP#: FT-002A&B
122250-Project: Type Work: WideningDescp: SR 20 FM SR 400 TO SAMPLE ROAD/CR 80
Phase Fund Year Federal Other TotalState
2Lanes: Exist. Prop. 4
PE STP Underway
ROW STP Underway
CST $4,716,000 $1,179,000 $0STP 2004 $5,895,000 2.02Length:
TIP#: FT-004
132630-Project: Type Work: InterchangeDescp: SR 400 AT SR 20 INTERCHANGE
RECONSTRUCTION
Phase Fund Year Federal Other TotalStateROW NHS Underway
CST $3,989,279 $997,320 $0NHS 2006 $4,986,599 0.40Length:
TIP#: FT-011
132940-Project: Type Work: Intersection ImprovementDescp: SR 400/US 19 AT SETTINGDOWN ROAD/CR 176 NE
OF CUMMING
Phase Fund Year Federal Other TotalStatePE STP Underway
ROW $0 $0 $300,000Local LOCL $300,000CST $324,900 $36,100 $0STP LUMP $361,000
LUMP SUM PROJECT
0.40Length:
TIP#: AR-118
Page 9 of 28
TABLE 8.4: DRAFT STIP IMPROVEMENTS FOR FORSYTH COUNTY 2004 - 2006

FORSYTH COUNTY COMPREHENSIVE PLAN 8-22
T R A N S P O R T A T I O N
FORSYTH COUNTY COMPREHENSIVE PLAN 8-23
STATE TRANSPORTATION IMPROVEMENT PROGRAM8/8/2003
DraftDOT DISTRICT: 1
Forsyth132985-Project: Type Work: Replace Bridge
Descp: SR 20/CUMMING HWY @ CHATTAHOOCHEE RIVER @ FORSYTH CO LINE
Phase Fund Year Federal Other TotalState
2Lanes: Exist. Prop. 4
PE Bridge Underway
ROW $400,000 $100,000 $0STP 2006 $500,000CST Bridge After 2006
CST STP After 2006
0.40Length:
TIP#: GW-288
142260-Project: Type Work: Replace BridgeDescp: SR 369/MATT ROAD @ SETTINGDOWN CREEK 6
MI N OF CUMMING
Phase Fund Year Federal Other TotalStatePE Bridge Underway
ROW $12,000 $3,000 $0Bridge 2006 $15,000CST Bridge After 2006 0.40Length:
TIP#: FT-060
142300-Project: Type Work: Intersection ImprovementDescp: SR 371 AT KELLY MILL ROAD/CR 5
Phase Fund Year Federal Other TotalStatePE STP Underway
ROW $0 $0 $300,000Local LOCL $300,000CST $1,314,000 $146,000 $0STP LUMP $1,460,000
LUMP SUM PROJECT
0.40Length:
TIP#: AR-157
722020-Project: Type Work: WideningDescp: GRTA SR 400 FM HAYNES BRIDGE RD/FULTON TO
SR 20/FORSYTH
Phase Fund Year Federal Other TotalState
4Lanes: Exist. Prop. 8
PE $0 $1,000,000 $0Bond 2004 $1,000,000CST NHS After 2006
11.36Length:
TIP#: FN-AR-198A
Page 10 of 28

FORSYTH COUNTY COMPREHENSIVE PLAN 8-22
T R A N S P O R T A T I O N
FORSYTH COUNTY COMPREHENSIVE PLAN 8-23
ASSESSMENT
Roadway segments and intersections are designed to carry a specific number of vehicles within a specific time period under prevailing conditions. This is referred to as the design capacity for that roadway segment or intersection. Once the roadway or intersection capacity is calculated and the actual number of vehicles using a roadway segment or intersection is determined, it is possible to develop a measure of efficiency for the segment or intersection. This measure is expressed as the Roadway Level of Service (LOS). The LOS is a concept to evaluate the operation of a roadway or intersection using a range of values, from “A” as the best to “F”, as the worst.
Adopted Levels of ServiceThe concept of levels of service (LOS) is defined as a qualitative measure describing operational conditions within a traffic stream, and their perception by motorists and/or passengers.
Level of service A represents free flow conditions. Individual users are virtually unaffected by the presence of others in the traffic stream. Freedom to select desired speeds and to maneuver within the traffic stream is extremely high.
Level of service B is in the range of stable flow, but the presence of other users in the traffic stream begins to be noticeable. Freedom to select desired speeds is relatively unaffected, but there is a slight decline in the freedom to maneuver within the traffic stream from LOS A.
Level of service C is in the range of stable flow, but marks the beginning of the range of flow in which the operation of individual users becomes significantly affected by interactions with others in the traffic stream.
Level of service D represents high density, but stable flow. Speed and freedom to maneuver are severely restricted, and the driver experiences a generally poor level of comfort and convenience.
Level of service E represents operating conditions at or near the capacity level. Freedom to maneuver within the traffic stream is extremely difficult. Comfort and convenience levels are extremely poor, and driver frustration is generally high.
Level of service F is used to define forced or breakdown flows. This condition exists when the amount of traffic approaching a point exceeds the amount that can traverse the point.
Often, a community will “adopt” a level of service to represent a policy decision or goal with respect to the operation of its roadway facilities. Essentially, the adopted level of service expresses, in general terms, how well a community wants its roadway system to function.
The Florida Department of Transportation (FDOT) along with the Transportation Research

FORSYTH COUNTY COMPREHENSIVE PLAN 8-24
T R A N S P O R T A T I O N
FORSYTH COUNTY COMPREHENSIVE PLAN 8-25
Board (TRB) has conducted extensive studies and research on methodologies for calculating highway levels of service. FDOT has developed a manual entitled “Florida’s Level of Service Standards and Guidelines Manual for Planning”. Local governments throughout Florida as well as private entities use the manual to determine the existing and future levels of service for existing and future roadway facilities at the planning level (vs. the more detailed traffic operational level). For planning purposes,
In the previous version of the Major Transportation Plan, the highway Level of Service was calculated using criteria included in the Forsyth County Comprehensive Plan. The roadway capacities used for the previous analysis of capacity deficiencies utilized a blended capacity of both Level of Service “C” and “D”. At LOS “A”, the total number of vehicles per hour or per day would not be greater than 71 percent of the maximum capacity of the roadway, thus giving a Volume to Capacity (v/c) ratio of 0.71. At LOS “B” the v/c ratio is 0.75, at LOS “C” the v/c ratio is 0.80, while at LOS “D” the v/c ratio is 0.92. LOS “E” is the condition when use is equal to 100 percent of capacity or a v/c ratio of 1.00. LOS “F” represents a breakdown of traffic flow with a v/c ratio greater than 1.00.
LOS Analysis MethodologyIn order to account for the differences in functional classification and location and character of the roadway, which can affect its capacity, for the 2002 Plan Update, it was decided that the FDOT level of service methodology would be used to determine the volume-to-capacity (v/c) ratios. Using the FDOT service volumes for LOS “D” and traffic count data from Forsyth County and GDOT, volume-to-capacity (v/c) ratios could be calculated. Once the v/c ratios were calculated for the existing roadway segments, they were compared to the ratios associated with the adopted v/c thresholds from the Major Transportation Plan. Using this method, roadway segments having capacity deficiencies (volume-to-capacity ratios exceeding 1.00) were identified.
Table 8.5 provides a description of service volumes that were used for determining the volume-to-capacity (v/c) ratios for this plan update. It should be noted that the given service volumes are appropriate for planning level analysis. For more detailed operational analysis, these volumes should be adjusted depending on such conditions as variable lateral clearances, horizontal and vertical deficiencies, intersection delay, and many other factors.
The planning study recommends the use of LOS “D” or better as the desirable Level of Service for Forsyth County’s road network. This LOS is more affordable compared to the currently adopted LOS blend of “C” and “D” and is consistent with many other communities with established LOS “D” thresholds in urban areas. Most counties with high rates of growth in traffic like Forsyth County have adopted LOS “D” as the threshold level of service when evaluating roadway segments. LOS “D” still means stable flow and traffic volumes under capacity, but recognizes the financial realities of infrastructure investment in growth areas. The Forsyth County Major Transportation Plan attempted to provide a LOS “D” or better on every roadway segment throughout Forsyth County for both present and future conditions. The 2002 Update recommends the improvement of major and minor arterials with a LOS of “E” or lower as a first priority, followed by collector roads at LOS “E”, then other local roads.

FORSYTH COUNTY COMPREHENSIVE PLAN 8-24
T R A N S P O R T A T I O N
FORSYTH COUNTY COMPREHENSIVE PLAN 8-25
The Forsyth County transportation system will require improvements to accommodate anticipated population and economic growth over the planning horizon. The County has utilized a travel demand forecasting model to identify specific improvements that will be required in order to provide a safe and efficient transportation network and enhance mobility in the future. The improvements are classified between short term (prior to 2005), intermediate term (2005 to 2010), and long term (2010 to 2020). The results of the travel demand forecasting process are listed in Tables 8.6, 8.7, and 8.8. Figures 8.4, 8.5 and 8.6 present the recommended road improvements for 2005, 2010 and 2025 respectively.
In addition to expanding existing transportation facilities, the county has also identified specific actions to optimize the utilization of existing transportation infrastructure. Existing plans have identified high occupancy vehicle facilities, intelligent transportation systems, and bicycle and pedestrian transportation as potential areas to improve transportation efficiency. The alternatives listed can improve the efficiency of the existing transportation system, but will not provide the needed mobility for people and good without system expansions.
High occupancy vehicle facilities can potentially reduce congestion and vehicular demands on roadways by reducing single occupancy vehicle use. Commuters using multiple occupancy means of travel, from carpools to vanpools and commuter (express) bus, are encouraged
TABLE 8.5: LEVEL OF SERVICE VOLUMES
Facility Type “A” “B” “C” “D” “E”Freeway
4 lanes
6 lanes
8 lanes10 lanes
20,90032,10043,80054,700
32,80050,40068,80086,000
49,20075,600
103,200129,000
62,60096,200
131,300164,200
74,500114,500156,300195,400
Major Arterials2 undiv.
4 divided6 divided
---
10,80023,50035,800
15,60033,20049,900
16,60035,00052,500
16,60035,00052,500
Minor Arterials2 undiv.
4 divided6 divided
---
-
--
9,90022,90035,500
14,90032,50048,900
16,20034,30051,700
Collectors
2 undiv.
4 divided6 divided
---
---
8,60019,80030,800
14,60031,70047,800
16,00033,90051,000
Local Streets2 undiv.
4 divided--
--
4,80011,600
10,90023,800
11,90025,400
Note: Blank lines indicate that the level of service cannot be obtained on a corridor basis.

FORSYTH COUNTY COMPREHENSIVE PLAN 8-26
T R A N S P O R T A T I O N
FORSYTH COUNTY COMPREHENSIVE PLAN 8-27
Name of Road From/To Number of New Lanes Needed
SR 9 Sr 20 to Main Street 3
SR 9 McFarland Rd to Hamby Rd 2
SR 9 SR 141 to Pendly Rd 2
McFarland Road McGinnis Ferry Rd to Union Hill Rd 2
McGinnis Ferry Road Gwinnett County to Sargent Rd 2
SR 141 McGinnis Ferry Rd to Aberdeen Rd 2
SR 141 Bagley Rd to SR 9 2
SR 20 Sanders Rd to Gwinnett County 2
SR 20 Dr. Bramblett Rd to Tower Rd 2
SR 306 SR 369 to GA 400 2
Source: Major Transportation Plan 2002 Update
TABLE 8.6: DEFICIENT ROAD SEGMENTS (LOS “E” OR LOS “F’) BY THE YEAR 2005
by the travel time advantages provided. The introduction of high occupancy vehicle facilities should be further examined in Forsyth County, especially on SR 400, to reduce future traffic demands and congestion. Park and ride lots comprise an important element of the region’s transportation system by providing carpooling opportunities and express bus pick-up and drop-off points. There are currently no park and ride lots in Forsyth County. A number of studies and initiatives are underway to determine the potential for park and ride lots.
Intelligent transportation systems (ITS) utilize technology to improve the safety and efficiency of the roadway system without increasing the physical size of roadway facilities. ITS strategies are used to relay information to travelers concerning congestion and incidents, as well as aid emergency vehicles in efficient operation, and provide emergency operational and medical assistance to motorists. Quick detection and better management of incidents minimizes congestion and enhances the overall performance of the network.
Pedestrian and bicycle facilities serve as an integral element of a multimodal transportation network. Improved systems for bicycle and pedestrian transportation can also provide a reduction in congestion and vehicular use on roadways. The Forsyth County Bicycle Transportation and Pedestrian Walkways Plan identifies approximately 58 miles of roadways that could potentially be converted to sign shared roadways. Sign shared roadways provide an opportunity to provide preferred routes for cyclists, with relatively little financial infusion. The physical improvements to an existing road include bicycle safe drainage grates and bridge expansion joints, smooth pavements, signal timing and detector systems that respond to bicycles, and signage to alert motorists that bicycles are likely to be sharing a travel lane.

FORSYTH COUNTY COMPREHENSIVE PLAN 8-26
T R A N S P O R T A T I O N
FORSYTH COUNTY COMPREHENSIVE PLAN 8-27
Name of Road From/To Number of New Lanes Needed
SR 9 Hamby Rd to Post Rd 2SR 9 Fowler Rd to Castleberry Rd 2SR 9 Pendly Rd to Old Atlanta Rd 2McFarland Road SR 9 to Union Hill Rd 2McGinnis Ferry Road Sargent Rd to McFarland Rd 2Old Atlanta Road Mathis Airport Rd to Sharon Rd 2Bethelview Road SR 9 to Kelly Mill Rd 2SR 20 Cherokee County to Hyde Rd 2SR 20 Bethelview Rd to Spot Rd Connector 2SR 306 SR 369 to Shadburn Rd 2SR 369 SR 9 to SR 400 2SR 369 SR 306 to Shady Grove Rd 2
Source: Major Transportation Plan 2002 Update
TABLE 8.7: DEFICIENT ROAD SEGMENTS (LOS “E” OR LOS “F’) BY THE YEAR 2010
Name of Road From/To Number of New Lanes Needed
SR 9 Fulton County to McFarland Rd 2
SR 9 Sawnee Drive to Main Street 2
SR 9 Dunn Rd to SR 306 2
McFarland Road McGinnis Ferry Rd to Union Hill Road 4
McGinnis Ferry Road Union Hill Rd to McFarland Rd 2
McGinnis Ferry Road McFarland Rd to SR 141 4
McGinnis Ferry Road Old Atlanta Rd to Gwinnett County 2
Old Atlanta Road McGinnis Ferry Rd to Sharron Rd 2
SR 20 SR 9 to Samples Rd 4
SR 371/Post Road SR 9 to SR 20 2
SR 306 Shadburn Rd to SR 53 2
SR 369 Shady Grove Rd to Hall County 2
SR 369 Settingdown Rd to GA 400 2
Source: Major Transportation Plan 2002 Update
TABLE 8.8: DEFICIENT ROAD SEGMENTS (LOS “E” OR LOS “F’) BY THE YEAR 2020

FORSYTH COUNTY COMPREHENSIVE PLAN 8-28
T R A N S P O R T A T I O N
FORSYTH COUNTY COMPREHENSIVE PLAN 8-29
FIGURE 8.4: RECOMMENDED ROAD IMPROVEMENTS (2005)

FORSYTH COUNTY COMPREHENSIVE PLAN 8-28
T R A N S P O R T A T I O N
FORSYTH COUNTY COMPREHENSIVE PLAN 8-29
FIGURE 8.5: RECOMMENDED ROAD IMPROVEMENTS (2010)

FORSYTH COUNTY COMPREHENSIVE PLAN 8-30
T R A N S P O R T A T I O N
FORSYTH COUNTY COMPREHENSIVE PLAN 8-31
FIGURE 8.6: RECOMMENDED ROAD IMPROVEMENTS (2020)

FORSYTH COUNTY COMPREHENSIVE PLAN 8-30
T R A N S P O R T A T I O N
FORSYTH COUNTY COMPREHENSIVE PLAN 8-31
Land UseInformation on population densities and the location of employment and shopping centers is necessary for effective transportation planning. The identification and study of population densities is important because minimum density thresholds are needed to support selected types of transportation strategies, such as bus transit. Forsyth County is forecast to continue to be one of the fastest growing counties in the country and population numbers are expected to increase significantly over the planning period.
Based on an analysis of existing and future land use classifications, the long range transportation plan has recommended the continued use and possible expansion of the Forsyth County Dial-A-Ride program. Fixed route bus service was not considered an effective use of funds due to the low population density projected for Forsyth County.
COMMUNITY GOALS
Thoughtful goal setting will ensure a long-range, needs-based perspective that assists in effectively identifying and implementing appropriate transportation initiatives. In addition, the goals and performance measures must be compatible with similar initiatives in neighboring counties in order to develop a transportation network that also addresses regional needs. The goals identified in this element have been incorporated into the implementation chapter as well as the Short Term Work Program.
Forsyth County’s Long Range Transportation Plan has identified the following goals and objectives:
Goal 1: Provide accessibility and mobility of people and goods.Objectives:• Develop and implement functional road classification categories that provide guidelines for future right-of-way requirements, number of lanes, and future travel capacities, based on population growth estimates and anticipated land development.• Protect the safety and traffic-carrying capacity of interchange areas and major thoroughfare corridors from adverse land development and minimize curb cuts along corridors.• Develop a transportation system that will be compatible with existing and future land use patterns.• Ensure the provision of adequate right-of-way for future road improvements based upon the anticipated level of future use.
Goal 2: Support the attainment of air quality in conjunction with neighboring counties.Objectives:• Achieve a transportation system which minimizes traffic congestion and travel time within the region and promotes energy conservation.
Goal 3: Integrate land use decisions with transportation analysis and planning.Objectives:

FORSYTH COUNTY COMPREHENSIVE PLAN 8-32
T R A N S P O R T A T I O N
FORSYTH COUNTY COMPREHENSIVE PLAN 8-33
• Develop and implement functional road classification categories that provide guidelines for future right-of-way requirements, number of lanes, and future travel capacities, based on population growth estimates and anticipated land development.• Develop a transportation system that will be compatible with existing and future land use patterns.• Present a comprehensive transportation system which will provide safe, convenient and efficient service to the general public and will promote and encourage the most desirable timing and patterns of land development.
Goal 4: Improve environment and quality of life.Objectives:• Promote a transportation system which will provide access and movement through and within the county, while limiting potential negative environmental impacts which might result from unplanned development.• Assure that vehicular circulation within development areas functions safely and efficiently.

FORSYTH COUNTY COMPREHENSIVE PLAN 8-32
T R A N S P O R T A T I O N
FORSYTH COUNTY COMPREHENSIVE PLAN 8-33
Bicycle Transportation and Pedestrian Walkways 2025 Plan Goals, Objectives and Strategies
Based on the vision statement approved by the Task Force and the opportunities presented in the strategic planning process, the following goals, objectives and strategies were developed for the Forsyth County Bicycle and Pedestrian Plan.
Goal 1: Provide a Countywide system of safe, convenient and accessible bicycling and pedestrian facilities for all users through the coordinated efforts of governmental agencies, the private sector and the general public.Objective 1: Develop a connected system of bicycle and pedestrian facilities that can serve major origin and destination points, linking such important land uses as residential and commercial zones, educational and employment areas, health care and service centers, natural, cultural and recreational resources.Strategies§ Work with the Board of Commissioners to provide bicycle and pedestrian facilities that connect to Countywide “points of interest” and potential tourist sites;§ Work with the County School Board to coordinate provision of bicycle and pedestrian facilities at existing and proposed school facilities;§ Use the Bike/Pedestrian web site to highlight bicycle and pedestrian activities at local and regional events;• Work with any future CIDs or TMAs for the provision of these facilities in their jurisdictions;• Work with the Parks Department to build sidewalks leading to County parks; and• Work with proposed employment centers to encourage provision of bicycle and pedestrian facilities leading to their sites.Objective 2: Ensure, to the maximum extent possible, that bicycle and pedestrian facilities are integrated and connected to other existing or planned modes of transportation in order to reduce dependence on the private automobile, reduce traffic and improve air quality.Strategies§ Coordinate with regional transit planning efforts to maximize bicycle and pedestrian connections to proposed park and ride lots; and§ Coordinate with on going and future regional planning studies to incorporate the Forsyth Bike/Pedestrian plan recommendations.Objective 3: Ensure that the bicycle and pedestrian system complements the existing transportation network to maximize and preserve the existing system and take advantage of public rights-of-way and corridors such as utility lines, future rail lines, linear waterways, etc. for bicycle and pedestrian facilities in order to minimize public costs.Strategies§ During the comprehensive plan review process, identify utility lines, rail lines, and linear waterways on the future land use map as possible routes for bicycling and walking;§ Coordinate the planned bicycle and pedestrian facilities with proposed improvements of congested corridors in the Forsyth County Transportation Plan; and§ Encourage developments adjacent to waterways to dedicate land for greenways designated on the County plan.

FORSYTH COUNTY COMPREHENSIVE PLAN 8-34
T R A N S P O R T A T I O N
FORSYTH COUNTY COMPREHENSIVE PLAN 8-35
§ Consider pedestrian signal and crossing improvements during intersection redesign.Objective 4: Ensure that the system addresses the safety and needs of different types of users, from experienced cyclists on arterial roadways to school-bound children walking and riding bicycles adjacent to local roads.Strategies§ Encourage the development of educational programs on bicycle and pedestrian safety, usage and benefits that address the different users of bicycle and pedestrian facilities;§ Participate as a community in National Walk to School, National Walk to Work, and National Bike to Work programs;§ Develop a tracking system for bicycle and pedestrian related accidents; and§ Contact established groups such as PEDS for pedestrian safety coordination and guidance§ Conduct a bicycle suitability analysis for roadways in the CountyObjective 5: Establish a maintenance program and maintenance standards that ensure safe and usable bicycle and pedestrian facilities.Strategies§ Work with organizations such as PATH Foundation to determine average maintenance costs for multi-use facilities;§ Work with Public Works staff to coordinate roadway maintenance activities with maintenance of bicycle and pedestrian facilities; and§ Set aside a percentage of funds from the bicycle and pedestrian fund for maintenance activities.Objective 6: Provide ancillary facilities such as bicycle parking and storage, lighting, landscaping, signing, pavement marking and signalization to enhance the value and increase the utility and safety of the bicycle and pedestrian system.Strategies§ Work with employment centers to encourage provision of bicycle parking and storage facilities;§ Coordinate resurfacing and pavement marking activities with potential marking for bicycle friendly facilities; and§ Encourage all public buildings throughout the County to provide bicycle parking facilities.Objective 7: Support and encourage regular and continuing bicycle and pedestrian training and safety programs in conjunction with local institutions, organizations, and bicycle and pedestrian interest groups.Strategies§ Establish the Bicycle and Pedestrian Task Force as a permanent ongoing structure and invite local bicycle and pedestrian groups such as PATH and PEDS to sit on the Task Force;§ Coordinate with local interest groups and the private sector to develop bicycle and pedestrian educational programs on safety and proper usage;§ Encourage the proliferation of “Effective Cycling” courses similar to those offered by the Atlanta Bicycle Campaign and funded with ARC dollars;§ Work with the school board to develop and implement educational programs on bicycle and pedestrian safety and usage in schools; and§ Encourage and provide assistance for the establishment of local advocacy groups, such
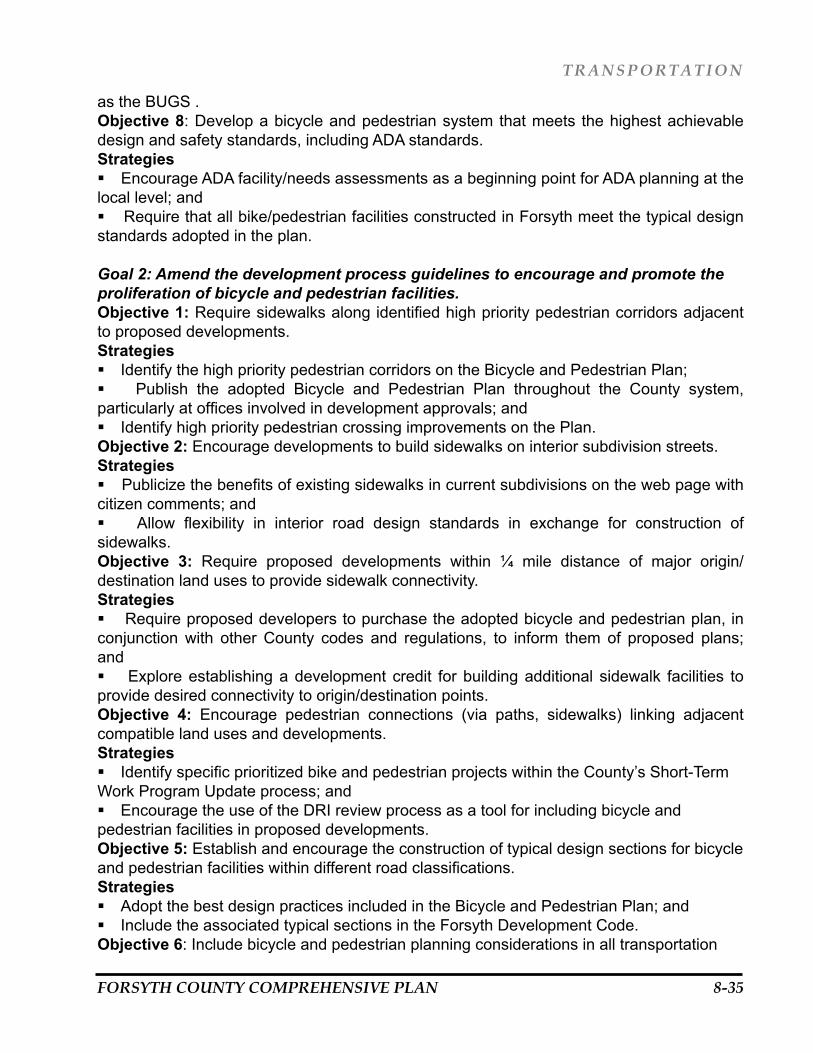
FORSYTH COUNTY COMPREHENSIVE PLAN 8-34
T R A N S P O R T A T I O N
FORSYTH COUNTY COMPREHENSIVE PLAN 8-35
as the BUGS .Objective 8: Develop a bicycle and pedestrian system that meets the highest achievable design and safety standards, including ADA standards.Strategies§ Encourage ADA facility/needs assessments as a beginning point for ADA planning at the local level; and§ Require that all bike/pedestrian facilities constructed in Forsyth meet the typical design standards adopted in the plan.
Goal 2: Amend the development process guidelines to encourage and promote theproliferation of bicycle and pedestrian facilities.Objective 1: Require sidewalks along identified high priority pedestrian corridors adjacent to proposed developments.Strategies§ Identify the high priority pedestrian corridors on the Bicycle and Pedestrian Plan;§ Publish the adopted Bicycle and Pedestrian Plan throughout the County system, particularly at offices involved in development approvals; and§ Identify high priority pedestrian crossing improvements on the Plan.Objective 2: Encourage developments to build sidewalks on interior subdivision streets.Strategies§ Publicize the benefits of existing sidewalks in current subdivisions on the web page with citizen comments; and§ Allow flexibility in interior road design standards in exchange for construction of sidewalks.Objective 3: Require proposed developments within 1⁄4 mile distance of major origin/destination land uses to provide sidewalk connectivity.Strategies§ Require proposed developers to purchase the adopted bicycle and pedestrian plan, in conjunction with other County codes and regulations, to inform them of proposed plans; and§ Explore establishing a development credit for building additional sidewalk facilities to provide desired connectivity to origin/destination points.Objective 4: Encourage pedestrian connections (via paths, sidewalks) linking adjacent compatible land uses and developments.Strategies§ Identify specific prioritized bike and pedestrian projects within the County’s Short-Term Work Program Update process; and§ Encourage the use of the DRI review process as a tool for including bicycle and pedestrian facilities in proposed developments.Objective 5: Establish and encourage the construction of typical design sections for bicycle and pedestrian facilities within different road classifications.Strategies§ Adopt the best design practices included in the Bicycle and Pedestrian Plan; and§ Include the associated typical sections in the Forsyth Development Code.Objective 6: Include bicycle and pedestrian planning considerations in all transportation

FORSYTH COUNTY COMPREHENSIVE PLAN 8-36
T R A N S P O R T A T I O N
FORSYTH COUNTY COMPREHENSIVE PLAN 8-37
improvements (resurfacing, paving, new location, intersection improvements, reconstruction, and maintenance).Strategies§ Encourage the inclusion of low-cost alternatives such as awareness signage and parking facilities in all projects to support the development of a coherent bicycle and pedestrian system; and§ Prioritize road widening and construction projects that include bicycle and pedestrian facilities.Objective 7: Coordinate bicycle and pedestrian planning efforts with countywide recreational and health planning considerations.Strategies§ Work in conjunction with the Centers for Disease Control to develop a tool outlining the health and environmental benefits of bike and pedestrian usage;§ Work with local interest groups and the private sector to develop bicycle and pedestrian programs on the health benefits of bicycle and pedestrian usage; and§ Identify greenspace corridors purchased as part of the Forsyth County Greenspace program on future land use maps and the Bicycle and Pedestrian plan map.
Goal 3: Provide adequate funding and staffing resources for planning, developing and maintaining high quality bicycle and pedestrian systems.Objective 1: Actively pursue all eligible federal and state funds for bicycle and pedestrian planning and development.Strategies§ Develop and distribute a catalogue of potential state and federal assistance for bike and pedestrian projects to relevant County staff and commissioners;§ Identify potential funding sources for the development of pedestrian walking maps and bicycle suitability maps;§ Deliver copies of the adopted Bicycle and Pedestrian Plan to GDOT and the GMRDC for incorporation into the Regional Transportation Planning process; and§ Create a permanent Citizens Bike and Pedestrian Task Force for plan implementation purposes.§ Apply to ARC for funds to conduct a bicycle suitability study and for additional bicycle and pedestrian data collection efforts.Objective 2: Coordinate the development of bicycle and pedestrian projects to maximize use of opportunities for joint development using other public or private resources.Strategies§ Attend ARC Bike and Pedestrian Task Force meetings to maximize coordination and compete for funding; and§ Explore establishing a development credit for proposed developments that include bicycle and pedestrian facilities.Objective 3: Establish a bicycle and pedestrian fund for developer contributions in lieu of construction of such facilities, if such construction is not deemed timely by Forsyth County. Allow private donations to the bicycle and pedestrian fund for construction of these facilities.

FORSYTH COUNTY COMPREHENSIVE PLAN 8-36
T R A N S P O R T A T I O N
FORSYTH COUNTY COMPREHENSIVE PLAN 8-37
Strategies§ Establish average cost estimates for bicycle and pedestrian facilities to use for in lieu contributions; and§ Explore establishing a development credit for developers who donate additional funds to the bicycle and pedestrian fund beyond that required for their development.Objective 4: Include bicycle and pedestrian projects in future local sales tax programs.Strategies§ Collect information on the Bike and Pedestrian web site regarding citizen support of bicycle and pedestrian projects;§ Include a survey question on the Bike and Pedestrian web site regarding support of local sales tax dollars for provision of bicycle and pedestrian facilities; and§ Establish a percentage goal for budget allocation to bicycle and pedestrian facilities.Objective 5: Explore establishing a staff position to act as a technical resource for zoning, land use and roadway design changes to promote bicycle and pedestrian friendly development, as well as for grant writing.Strategies§ Investigate the current duties of the Statewide Bicycle Coordinator and other type positions established in the metro area; and§ Establish a critical mass limit for a certain number of bicycle and pedestrian projects in the implementation process to justify a staff position.
From these goals and the analysis contained within the transportation element, the following goals have been developed:
(1) Ensure that prime commercial/industrial acreage is served with necessary infrastructure;(2) The transportation system should be multi-modal, including transit, automobile, bicycle,
and walking. It should provide safe, energy-efficient, convenient movement of people and goods. It should relate to the interregional transportation systems: air, highway and rail. It should be located and designed to serve but not disrupt existing and future neighborhoods and employment/commercial centers;
(3) Require development-impacted roads to meet minimum level of service of D (somewhat congested but still functioning) in approving new developments;
(4) For road improvement allocations, priority will be given to projects designed to raise levels of service on roads currently below D in level of service;
(5) Continue to encourage mixed use development and other options to allow residents to live in close proximity to their place of employment;
(6) Encourage alternative transportation forms, such as carpooling, to reduce congestion and vehicular demands on roadways by reducing single occupancy vehicle use;
(7) Encourage bicycle and pedestrian travel;(8) Encourage businesses to alter work hours so that their employees can commute during
off-peak periods; and(9) Encouraging the use of telecommuting and video-conferencing to reduce the need for
employee travel.
Chapter Ten, the Implementation Program, provides the overall strategy for the comprehensive

FORSYTH COUNTY COMPREHENSIVE PLAN 8-38
plan implementation. The policy recommendations listed above are merged and coordinated with the policies of the other elements to form the implementation program. The associated short-term work program designates the actions the county will take in the next five years to achieve these goals. The list is not all-inclusive. There are some actions that may not be addressed due to time, budget and administrative constraints. These items will be included as part of the work program at some point over the twenty-year planning period.

FORSYTH COUNTY COMPREHENSIVE PLAN 9-1
INTRODUCTION
The Intergovernmental Coordination Element provides local governments an opportunity to inventory existing intergovernmental coordination mechanisms and processes with other local governments and governmental entities that can have profound impacts on the success of implementing the local government’s comprehensive plan. The purpose of this element is to assess the adequacy and suitability of existing coordination mechanisms to serve the current and future needs of the community and articulate goals and formulate a strategy for effective implementation of community policies and objectives that, in many cases, involve multiple governmental entities.
ADJACENT LOCAL GOVERNMENTS
Forsyth County is bordered by Gwinnett County, the City of Sugar Hill, Fulton County, and the City of Alpharetta to the south, Cherokee County on the west, Dawson County on the north, and Hall County to the east. The City of Cumming is located at the center of the County and is the only incorporated area in Forsyth County. Continued coordination with surrounding local government entities will be essential to the successful implementation of the Comprehensive Plan.
City of CummingCoordination mechanisms with the City of Cumming are essential to the successful implementation of the Comprehensive Plan. All levels of staff and elected officials are involved in the coordination process that is outlined in the Service Delivery Strategy. Specific areas covered in the Service Delivery Strategy for Forsyth County and the City of Cumming include:
• Water and Wastewater• Land Use Compatibility and Provisions for Dispute Resolution• Development Permitting and Inspections• Building Permitting and Inspections• Soil Erosion Permitting and Enforcement• Economic Development• Emergency Management• Fire Services• Law Enforcement• Road and Bridges• Recreation and Parks• Municipal Court• Storm Water Management
CHAPTER 9INTERGOVERNMENTAL COORDINATION ELEMENT

FORSYTH COUNTY COMPREHENSIVE PLAN 9-2 FORSYTH COUNTY COMPREHENSIVE PLAN 9-3
I N T E R G O V E R N M E N T A L
• Tax Assessment and Collection• Garbage Pick-Up• Housing Authority• Alcohol Licenses• Business Licenses• General Administration and Finance
City of Alpharetta, Fulton County, Cherokee County, and Dawson CountyCoordination with City of Alpharetta, Fulton County, Cherokee County, and Dawson County is essential to the planning process. Through the Atlanta Regional Commission and the Georgia Mountains Regional Development Center, all four local governments actively participate in the review process for any development project that qualifies as a development of regional impact (DRI). Coordination within the DRI review process is typically focused on the planning staff. Additionally, the Forsyth County Department of Planning and Development will notify Fulton County, Cherokee County, and Dawson County prior to acting on rezoning requests that are adjacent to the respective local government. The notification package will include the details of the request and procedures for any related comments.
City of Sugar Hill, Gwinnett County, and Hall CountyLake Lanier and/or the Chattahoochee River provide a natural buffer between Forsyth County and the City of Sugar Hill, Gwinnett County, and Hall County. However, coordination remains an essential part of the planning process. Through the Atlanta Regional Commission and the Georgia Mountains Regional Development Center, all four local governments actively participate in the review process for any development project that qualifies as a development of regional impact (DRI). Coordination within the DRI review process is typically focused on the planning staff.
SCHOOL BOARDSForsyth County Board of EducationThe Forsyth County Board of Education is the governing body of the Forsyth County School System. The primary role of the Board is the legislation of the school system politics, which are executed under the direction of the school Superintendent. The provision of quality educational opportunities is an essential service provided in Forsyth County. Joint planning efforts include Board of Education involvement in the review of all residential rezoning requests. This process is carried out through the Department of Planning and Development and the Board of Education. Continued cooperation with the School Board is expected throughout the planning horizon.
INDEPENDENT SPECIAL DISTRICTSCity of Cumming Water and Sewer As identified in the Service Delivery Strategy for Forsyth County and the City of Cumming, the water and sewer district for the City of Cumming extends into unincorporated areas of Forsyth County. The exchange of data on land use and other planning related issues

FORSYTH COUNTY COMPREHENSIVE PLAN 9-2 FORSYTH COUNTY COMPREHENSIVE PLAN 9-3
I N T E R G O V E R N M E N T A L
provides adequate coordination regarding the City of Cumming Water and Sewer service area.
U.S. Army Corps of EngineersThe US Army Corps Of Engineers, Mobile District, Buford, is responsible for the management of Lake Lanier. The Corps’ role in the management of Lake Lanier is far-reaching and includes a multitude of responsibilities that result in joint efforts with Forsyth County. Coordination mechanisms now in place are considered to be adequate.
INDEPENDENT DEVELOPMENT AUTHORITIESForsyth County Development AuthorityThe Forsyth County Development Authority is engaged in facilitating financing of new and expanded businesses by issuing industrial revenue bonds.
Cumming-Forsyth County Chamber of CommerceThe Chamber of Commerce is comprised of businesses in the county, professionals, local leaders, and other interested individuals who have joined together to promote the economic development of the community by successfully marketing Forsyth County. Interaction is typically focused on development applications and the provision of county services. Continued cooperation with the Chamber of Commerce is expected throughout the planning horizon
OTHER UNITS OF LOCAL GOVERNMENT AND UTILITY COMPANIESForsyth County Sheriff’s OfficeThe Forsyth County Sheriff’s Office is charged with the responsibility of serving and protecting citizens and visitors. The Support Division of the Sheriff’s Office enforces ordinances in the county. In relation to the planning process, continued coordination of information and resources will be required to achieve the long-term vision of the community.
Sawnee Electric Membership Corporation (EMC) and Georgia Power CompanySawnee EMC and Georgia Power provide service within Forsyth County. Continued coordination with the county’s permitting staff will be required.
OTHER ORGANIZATIONSGeorgia Mountains Regional Development CenterThe Georgia Mountains Regional Development Center fulfills the particular need of the Georgia mountains region by advocating wise resource management and planning, analyzing both current and potential growth problems, and providing much needed professional technical assistance in developing local and regional objectives, plans, and programs. Work items include both regional and local planning projects. These projects range from transportation, recreation, historic preservation, environmental resource assessment, population, economic analysis and water resources, to comprehensive local and regional plans, reviews of

FORSYTH COUNTY COMPREHENSIVE PLAN 9-4 FORSYTH COUNTY COMPREHENSIVE PLAN 9-5
I N T E R G O V E R N M E N T A L
Developments of Regional Impact (DRI), and large-scale development reviews as authorized by the Georgia Land Sales Act and the Metropolitan River Protection Act (MRPA). Forsyth County is a member of the Georgia Mountains regional development Center.
Atlanta Regional CommissionThe Atlanta Regional Commission (ARC) performs regional planning and coordination for the metropolitan Atlanta area. There are currently ten counties included in the ARC. The commission is dedicated to unifying the region’s collective resources to prepare the metropolitan Atlanta area for a prosperous future. It does so through professional planning initiatives, the provision of objective information and the involvement of the community in collaborative partnerships that encourage healthy economic growth compatible with the environment, improve the region’s quality of life, and foster leadership development.
While Forsyth County is not a member of the ARC, the county’s actions can have serious implications for the entire region. In 1990, due to the passage of the Clean Air Act, the Governor of Georgia reported to the U.S. Environmental Protection Agency that 13 counties in and around Atlanta would be designated as non-attainment area for ground level Ozone. Forsyth County was one of three non-ARC members included as part of the Atlanta non-attainment area for violating the National Ambient Air Quality Standards (NAAQS) for Ozone. Transportation investments in these counties must be included when ARC runs its computer-based travel demand model to ensure the region’s transportation project mix does not add to the air quality problem. Coweta, Forsyth and Paulding counties are represented by the GDOT in the regional planning process. Also, the county chairmen of each county are invited members of ARC’s Transportation and Air Quality Committee (TAQC).
Georgia Regional Transportation AuthorityThe role of the Georgia Regional Transportation Authority (GRTA) is to approve the region’s short-range programs, implement transportation strategies and review developments of regional impact. More specifically, GRTA works with those counties in Georgia that have been designated non-attainment under the Federal Clean Air Act standards. Currently, there are thirteen counties in the metropolitan Atlanta area that are non-attainment. Those counties are Cherokee, Clayton, Cobb, Coweta, DeKalb, Douglas, Fayette, Forsyth, Fulton, Gwinnett, Henry, Paulding and Rockdale.
Developments of Regional Impact (DRIs) are large-scale developments likely to have effects outside of the local government jurisdiction in which they are located. The Georgia Planning Act of 1989 authorizes the Department of Community Affairs (DCA) to establish procedures for intergovernmental review of these large-scale projects. These procedures are designed to improve communication between affected governments and to provide a means of revealing and assessing potential impacts of large-scale developments before conflicts relating to them arise.
GRTA’s legislation also requires that it review DRIs within its jurisdiction. The purpose of GRTA’s review is to approve or disapprove the use of state and federal funds to create transportation services and access that may be required as a result of the DRI. The goals

FORSYTH COUNTY COMPREHENSIVE PLAN 9-4 FORSYTH COUNTY COMPREHENSIVE PLAN 9-5
I N T E R G O V E R N M E N T A L
of the review are: protecting and efficiently allocating limited state and federal resources, promoting compliance with regional transportation plans and air quality standards, and furthering GRTA’s mission and goals. GRTA’s vision statement includes the following items:(1) Work to plan and implement a transportation system that is multi-modal, seamless, and accessible to all citizens;(2) Encourage land use policies that promote efficient use of infrastructure investments;(3) Operate within a decision-making framework that values public participation and connects transportation choices, land use and the overall Quality of Life;(4) Serve the best interests of the region by working in cooperation with other agencies and governments that are involved in planning and transportation; and(5) Measure its effectiveness in improving air quality, traffic, accessibility and land use.
Georgia Department of TransportationThe Georgia Department of Transportation plans, constructs, maintains and improves the state’s road and bridges. Duties also include the provision of planning and financial support for other modes of transportation such as mass transit and airports. Close coordination with the Department of Transportation is required. Forsyth County plans to work cooperatively with the Department of Transportation throughout the planning horizon.
Georgia Department of Natural ResourcesThe mission of the Department of Natural Resources is to sustain, enhance, protect and conserve Georgia’s natural, historic, and cultural resources for present and future generations, while recognizing the importance of promoting the development of commerce and industry that utilize sound environmental practices.
Georgia Department of Community AffairsThe Department of Community Affairs operates a host of state and federal grant programs; serves as the State’s lead agency in housing finance and development; promulgates building codes to be adopted by local governments; provides comprehensive planning, technical and research assistance to local governments; and serves as the lead agency for the state’s solid waste reduction efforts. The Department of Community Affairs also manages the state’s coordinated planning program.
Appalachian Regional CommissionForsyth County is located within the jurisdiction of the Appalachian Regional Commission. The Appalachian Regional Commission’s mission is to be an advocate for and partner with the people of Appalachia to create opportunities for self-sustaining economic development and improved quality of life. The Appalachian Regional Commission was established by Congress in 1965 to support economic and social development in the Appalachian Region.
The Appalachian Regional Commission undertakes projects that address the five goals identified by Appalachian Regional Commission’s strategic plan: (1) Developing a knowledgeable and skilled population(2) Strengthening the Region’s physical infrastructure(3) Building local and regional capacity

FORSYTH COUNTY COMPREHENSIVE PLAN 9-6 FORSYTH COUNTY COMPREHENSIVE PLAN 9-7
I N T E R G O V E R N M E N T A L
(4) Creating a dynamic economic base(5) Fostering healthy people
To meet these goals, the Appalachian Regional Commission helps fund such projects as education and workforce training programs, highway construction, water and sewer system construction, leadership development programs, small business start-ups and expansions, and development of health-care resources. The goals and policies of the Forsyth County Comprehensive Plan are consistent with the Appalachian Regional Commission’s strategic plan.
OTHER PROGRAMS AND ACTIVITIESLocal Government Service Delivery Strategy ActThe 1997 Georgia General Assembly enacted the Local Government Services Delivery Strategy Act (HB 489). The intent of the Act is to provide a flexible framework for local governments and authorities to agree on a plan for delivering services efficiently, effectively and responsively; Minimize any duplication and competition among local governments and authorities providing local services; and, provide a method to resolve disputes among service providers regarding service delivery, funding equity and land use.
The Service Delivery Strategy addresses the following: • Identification of all services presently provided. • Identification of which local government or authority will be responsible for providing which
service in what area of the county in the future. • Identification of funding sources for all services. • Identification of intergovernmental contracts, ordinances, resolutions, etc. to be used in
implementing the strategy, including existing contracts. • Explanation for its existence and a timetable for the elimination of any duplicate services. • Elimination of conflicts in land use plans.• Resolution of land use classification disputes arising over property to be annexed.
The Service Delivery Strategy Manual for the City of Cumming and Forsyth County was adopted May 4, 1998. The manual has provided Forsyth County and the City of Cumming with an opportunity to reach an agreement to deliver services in an effective and cost efficient manner. There are no specific changes or new intergovernmental agreements that are needed to implement this comprehensive plan in the short-term.
The Service Delivery Strategy serves an important role in the local land use coordination among Forsyth County and the City of Cumming. Specific policies relating to annexation, extraterritorial provision of water and sewer, and land use compatibility are included in the document.
AnnexationThe Comprehensive Plan Pertaining to Service Delivery Strategy for Land Use Compatibility and Provisions for Dispute Resolution between Cumming and Forsyth County provides

FORSYTH COUNTY COMPREHENSIVE PLAN 9-6 FORSYTH COUNTY COMPREHENSIVE PLAN 9-7
I N T E R G O V E R N M E N T A L
a method of communication regarding zoning and/or annexation and a procedural guide to resolve land use classification conflicts that may arise between the two governmental entities resulting from proposed rezoning or annexation of those lands which serve as boundaries between the two. The process is comprised of notification via certified mail and a corresponding response of no objection, no objection - stipulating certain conditions, or objection. A response of ‘no objection’ will allow the proposed action to move forward as planned. A response of ‘no objection - stipulating certain conditions’ or ‘objection’ would result in the modification of the proposed action or agreement to attend a joint meeting to further discuss the zoning and/or annexation. If a joint meeting is required, but agreement is not reached, both parties would retain the option of litigation.
Extraterritorial Provision of Water and SewerThe planning staffs for Forsyth County and the City of Cumming have completed an extensive process of data sharing to ensure that extraterritorial water and/or sewer extensions/improvements are consistent with the land use plan and ordinances of the “receiving” jurisdiction. Improvements to the geographic information systems available at each local entity have helped to streamline this process.
Land Use CompatibilityThe planning staffs for Forsyth County and the City of Cumming have held several meeting to discuss future land use plans and have found that the plans are compatible and that no significant conflicts exist between the plans.
The services to be provided by Forsyth County, as identified in the Forsyth County Comprehensive Plan, do not exceed those identified in the agreed upon Service Delivery Strategy. Additionally, the service areas identified for individual services that will be provided by Forsyth County and the City of Cumming are consistent between the Forsyth County Comprehensive Plan and the Service Delivery Strategy.
The Georgia Community Greenspace ProgramThe Georgia Community Greenspace Program was signed into law on April 16, 2000. The program provides an opportunity for urban and rapidly developing counties and their municipalities to preserve at least 20% of the land and water within their communities as permanently protected greenspace by acquiring and protecting land using state appropriated funds and local comprehensive land use planning.
The Georgia Greenspace Trust Fund, which is funded annually by the Georgia General Assembly, grants funds to each participating local government with an approved community greenspace program and which has established a Community Greenspace Trust Fund as specified by the statute. Greenspace grant funds are provided to assist local governments in carrying out their strategies for acquiring and permanently protecting land.
At this time it is anticipated that the primary means of implementing the short term goals of the Forsyth County Greenspace Program will be by fee simple acquisition, conservation easement, conservation subdivisions, partnering with the local development community

FORSYTH COUNTY COMPREHENSIVE PLAN 9-8 FORSYTH COUNTY COMPREHENSIVE PLAN 9-9
I N T E R G O V E R N M E N T A L
and local businesses, leveraging greenspace program funding to secure additional grants for conservation and passive use facilities development, the possible establishment a of transferable development rights program, and the possible implementation of a parks and recreation impact fee.
The Forsyth County Greenspace Plan identifies steep slopes, wetlands, A2 Zoned Land, and floodplains as potential greenspace acquisition areas as presented in Appendix B. There is a high degree of compatibility between the Greenspace Plan’s potential acquisition areas and planned land use patterns. The Forsyth County Future Land Use Map identifies wetlands and floodplain as conservation districts. Additionally, recommendations within the STWP include studying the feasibility of transferable development rights and other methods to bring similar levels of protection to A2 zoned land, steep slopes, and other environmentally sensitive land.
The City of Cumming is not currently participating in the Greenspace Program. Since a city cannot access appropriated funds independently of a county, coordination will be required if the City of Cumming decides to participate in the future.
Metropolitan North Georgia Water Planning DistrictWith limited water resources and a population of nearly 4 million and growing, metropolitan Atlanta faces increasing challenges in managing its vital water resources. The Metropolitan North Georgia Water Planning District was established by the Georgia legislature in 2001 to address the pressing need for comprehensive water resources management in the 16-county area of metropolitan north Georgia. The Metropolitan North Georgia Water Planning District is a planning entity dedicated to developing comprehensive regional and watershed-specific plans to be implemented by the local governments of Bartow, Cherokee, Clayton, Cobb, Coweta, DeKalb, Douglas, Fayette, Fulton, Forsyth, Gwinnett, Hall, Henry, Paulding, Rockdale, and Walton Counties. These counties lie within the boundaries of six major river basins: Chattahoochee, Coosa (which includes the Etowah subbasin), Flint, Ocmulgee, Oconee, and Tallapoosa.
The Metropolitan North Georgia Water Planning District is required to prepare three long-term plans: (1) The District-wide Watershed Management Plan; (2) The Long-Term Wastewater Management Plan; and (3) The Water Supply and Water Conservation Plan. The North Georgia Water Planning District released draft versions of the plans in June of 2003. Upon adoption of the plans, an aggressive implementation program will be required to meet the objectives established by the Metropolitan North Georgia Water Planning District. The recommendations outlined in the three plans have been used in drafting the goal section of this element, the implementation plan, and the STWP for Forsyth County.
The District-wide Watershed Management PlanThe District-wide Watershed Management Plan provides strategies and recommendations for effective watershed management and the control of stormwater runoff. It also includes the specific tasks and milestones for implementing these recommendations, as well as guidance on funding watershed and stormwater management efforts at the local level.

FORSYTH COUNTY COMPREHENSIVE PLAN 9-8 FORSYTH COUNTY COMPREHENSIVE PLAN 9-9
I N T E R G O V E R N M E N T A L
The overall goal of the District-wide Watershed Management Plan (WMP) is to meet and maintain water quality standards and designated uses of streams and other waterbodies within the Metropolitan North Georgia Water Planning District. This District-wide Watershed Management Plan builds upon the existing watershed and stormwater management planning efforts that have taken place in the Metropolitan North Georgia Water Planning District.
Responsibilities for implementation of the District-wide WMP are divided among the local governments, the Metropolitan North Georgia Water Planning District, and the State of Georgia. Local governments will be responsible for implementing most of the recommendations due to the direct connection between stormwater management, land use planning decisions, and infrastructure development and maintenance. Specific responsibilities for local governments include:
(1) Implementation of the Programmatic Watershed Management Strategies - including implementation of the Model Ordinances for stormwater management, additional programmatic management measures, adoption of stormwater management technical criteria, and local Education and Public Awareness activities.(2) Development and Implementation of Total Maximum Daily Load (TMDL) - Implementation Plans Required in watersheds with TMDL - listed waterways to meet TMDL requirements.(3) Implementation of Source Water Protection Strategies - Required in all watersheds (within a local government’s jurisdiction) that are water supply sources.(4) Development and Implementation of Watershed Improvement Plans - Required in those 20 percent of the 12-digit Hydrologic Unit Codes (HUCs) in the District that are substantially impacted due to existing development. These watersheds will require the development of watershed improvement plans, as well as restoration and/or retrofit to meet water quality standards.
The Long-term Wastewater Management PlanThe Long-term Wastewater Management Plan presents a 30-year plan for the newly established Metropolitan North Georgia Water Planning District to address service needs and to balance the uses of water resources. By law, this plan will be reviewed annually by the Metropolitan North Georgia Water Planning District, and updated at least every 5 years. Wastewater flows within the Metropolitan North Georgia Water Planning District are expected to nearly double during this planning horizon. To address this level of need, the Long Term Waste Water Management Plan anticipates a future of large, high performance treatment facilities that produce reusable water. The Long Term Waste Water Management Plan also intends more intensive management of public wastewater collection systems and privately owned septic systems. Finally, the plan includes new policies and programs to foster coordinated wastewater management decisions among the local governments in the Metropolitan North Georgia Water Planning District.
The Long Term Waste Water Management Plan addresses the statewide concern regarding how metropolitan north Georgia manages water resources. The Long Term Waste Water Management Plan is the first comprehensive regional approach to be developed that addresses wastewater management in metropolitan north Georgia. The overall goal

FORSYTH COUNTY COMPREHENSIVE PLAN 9-10 FORSYTH COUNTY COMPREHENSIVE PLAN 9-11
I N T E R G O V E R N M E N T A L
of the Plan is to meet projected wastewater management needs without compromising environmental and downstream needs, thereby helping the Environmental Protection Division make permitting decisions. The Long Term Waste Water Management Plan supports the Metropolitan North Georgia Water Planning District’s companion plans for water supply and conservation, and watershed management by providing a linked strategy for meeting future water needs, while protecting water quality.
While the Metropolitan North Georgia Water Planning District will have prepared the Long-term Wastewater Management Plan, it will be implemented by the local jurisdictions that own and operate the wastewater management systems. The local jurisdictions need to integrate the Long-term Wastewater Management Plan into their own local master plans. Following the framework and goals established by the Metropolitan North Georgia Water Planning District, all jurisdictions should use the local wastewater management plan to refine the Long-term Wastewater Management Plan and to address specific local needs. While flexibility is included in the Long-term Wastewater Management Plan, it is the local jurisdictions’ responsibilities to evaluate the options and to determine their benefits and costs.
Because the Long-term Wastewater Management Plan is regional in breadth, it covers a wide range of topics. The specifics will be developed and/or refined at the local level by the jurisdictions impacted by the Long-term Wastewater Management Plan. Preparation of local plans is an opportunity to demonstrate conformance with the District Long-term Wastewater Management Plan, and/or to provide improvements and innovations to the Plan, based on a more in-depth analysis of local circumstances and factors. Local jurisdictions should develop local plans that, at a minimum, conform to the core principles of the Long-term Wastewater Management Plan, to ensure that wastewater services are developed cost effectively, with a long-term regional perspective while providing good customer service. Specific implementation actions for the local level include: (1) Development of a local wastewater management plan;(2) Review local plans for consistency with District plans.
The Long-term Wastewater Management Plan involves participation by citizens and many levels of government for implementation. The responsibilities of the local jurisdictions include:(1) Own and operate utilities that manage wastewater;(2) Plan and construct infrastructure for wastewater management that implements the Long-term Wastewater Management Plan;(3) Participate in the Metropolitan North Georgia Water Planning District;(4) Implement programs to improve management of collection systems and septic systems; and(5) Lead and guide regional perspectives for wastewater management.
The Water Supply and Water Conservation Management PlanThe Water Supply and Water Conservation Management Plan presents a 30-year plan for the newly established District to address water service needs and to balance the uses of water resources. By law, the Water Supply and Water Conservation Management Plan will

FORSYTH COUNTY COMPREHENSIVE PLAN 9-10 FORSYTH COUNTY COMPREHENSIVE PLAN 9-11
I N T E R G O V E R N M E N T A L
be reviewed annually by the Metropolitan North Georgia Water Planning District, and will be updated at least once every 5 years.
Water supply needs within the Metropolitan North Georgia Water Planning District are expected to nearly double during this planning horizon. To address this level of need, the Water Supply and Water Conservation Management Plan anticipates a future of intensive management of water demands and growing reliance upon recycled water. A program of aggressive water conservation is paramount to the Water Supply and Water Conservation Management Plan, as well as continued development of small reservoirs and sharing of supplies. Finally, the Plan includes new policies and programs to foster coordinated water supply and conservation decisions among the local governments in the Metropolitan North Georgia Water Planning District. The Water Supply and Water Conservation Management Plan addresses statewide concern regarding Metropolitan North Georgia’s management of its water resources. The Water Supply and Water Conservation Management Plan is the first comprehensive regional approach to be developed that addresses water management in Metropolitan North Georgia. The overall goal of the Plan is to meet projected water demands without compromising environmental and downstream needs, thereby helping the Environmental Protection Division make permitting decisions. This Water Supply and Water Conservation Management Plan outlines a balanced, long-term water management strategy for meeting future water needs, while protecting water quality through 2030, and preserving water resources in all five major river basins.
The Water Supply and Water Conservation Management Plan is dependent on the following five strategies to meet water demands over the next three decades, and to provide a small amount of supply in excess of demand to allow for contingencies that may arise over the planning period.(1) Reallocation of Lake Lanier and Lake Allatoona for water supply(2) Intensification of water conservation efforts(3) Construction of at least five planned new reservoirs(4) Sharing of water resources within the Metropolitan North Georgia Water Planning District to meet local needs(5) Reclamation of water by indirect potable reuse through Lake Lanier
While the Metropolitan North Georgia Water Planning District has prepared the Water Supply and Water Conservation Plan, it will be implemented by the local jurisdictions that own and operate the water systems. Local jurisdictions need to integrate the Water Supply and Water Conservation Management Plan into their own master plans. Following the framework and goals established by the Metropolitan North Georgia Water Planning District, planning at the local level is necessary to refine the Water Supply and Water Conservation Management Plan and to address specific local needs. Where flexibility is included in the Plan, it is the local jurisdictions’ responsibility to evaluate the options and to determine their benefits and costs.
The following describes the local government actions required to implement the recommendations associated with developing local water management plans.

FORSYTH COUNTY COMPREHENSIVE PLAN 9-12 FORSYTH COUNTY COMPREHENSIVE PLAN 9-13
I N T E R G O V E R N M E N T A L
(1) Develop local water management plans.(2) Review local plans for consistency with Metropolitan North Georgia Water Planning District Plan.
The Water Supply and Water Conservation Management Plan involves participation by citizens and many levels of government for implementation. The roles of local jurisdictions are summarized below:(1) Own and operate utilities that manage water supply systems and water conservation programs;(2) Plan and construct water supply infrastructure for water supply (note: projects required pursuant to a federal or state court order will take precedence over the recommendations contained in this plan);(3) Participate in the Metropolitan North Georgia Water Planning District;(4) Implement programs to improve water system interconnections; and (5) Lead and guide regional efforts for water resources management.
Big Creek Watershed Study Master PlanThe Big Creek Watershed Study Master Plan, published by the Atlanta Regional Commission, is the result of a cooperative effort between Cherokee, Forsyth, and Fulton Counties as well as the cities of Alpharetta, Cumming, and Roswell to develop a mutually agreeable water quality protection plan for the Big Creek Watershed. The Plan summarizes the work performed, findings, and recommendations for watershed protection measures in the Big Creek Watershed. The plan is intended to address and develop strategies for reducing nonpoint source pollution in the Big Creek Watershed.
The plan addresses watershed quality problems through three methods.(1) Regulations to protect streams and environmentally sensitive areas.(2) Capital improvement projects for establishing of stormwater management Best Management Practices (BMP) facilities, stream channel erosion control, stream stabilization, and restoration.(3) Ongoing operation and maintenance programs such as storm drain inlet cleaning, illicit connection screening, and community outreach efforts.
The recommendations of the watershed management plan for the Big Creek watershed include stream restoration and water quality management options. The primary goals of the Big Creek Watershed Management Plan are to:
(1) Improve/maintain water quality of Big Creek and its tributaries;(2) Maximize recreation potential/value;(3) Minimize flooding, property damage, and stream impacts due to storm water;(4) Educate the watershed’s users about the resource; and(5) Consider a process for intergovernmental cooperation in protecting the watershed.
Continued efforts will be required to meet the objectives established by in the Big Creek Watershed Study Master Plan. The recommendations of the plan have been used in

FORSYTH COUNTY COMPREHENSIVE PLAN 9-12 FORSYTH COUNTY COMPREHENSIVE PLAN 9-13
I N T E R G O V E R N M E N T A L
drafting the goal section of this element, the implementation plan, and the STWP for Forsyth County.
Watershed Assessment and Management DocumentForsyth County, Hall County, and the City of Gainesville have concurred to work together under an inter-governmental agreement to administer the Watershed Assessment and Management Document. Countywide assessments were conducted for Forsyth and Hall Counties to address portions of the counties in watersheds including not only the Chattahoochee Basin and Lake Lanier, but also the Etowah Basin in Forsyth County and the Oconee Basin in Hall County. This collaborative approach was designed to promote consistency in the water quality and biological data, the pollutant runoff and loading estimates, water quality modeling, and ultimate watershed management strategies. An intergovernmental agreement for the watershed assessment was signed on March 25, 1999.
The Georgia Environmental Protection Division requires municipalities to conduct watershed assessments as part of the permitting process for new wastewater discharges and surface water withdrawals. To obtain a new permit, the county or municipality is required to develop a management plan that addresses nonpoint source pollution within the service area of the water or wastewater treatment plants. The four main components of a watershed assessment are:(1) Characterization: evaluate the current conditions within the watershed by collecting water quality and biological data to determine the health of the streams;(2) Modeling: develop a predictive water quality model that is used to evaluate the management scenarios developed for the watershed management plan;(3) Watershed Management: evaluate a set of management scenarios (combinations of land use and best management practices [BMPs]) and recommend the best scenario for managing water resources within the watershed; and(4) Public Involvement: gather input from the public and use the information to shape the development of the management plan.
The Watershed Assessment and Management Document summarizes the findings for all four components as they pertain to Forsyth County’s surface water resources. The document addresses impacts from both point sources, such as water pollution control plants (WPCPs) and industrial discharges, and nonpoint source pollution, such as storm water runoff from urbanization.
The report is assembled as a comprehensive document that provides all of the documentation required to achieve the following three objectives:(1) Evaluate existing conditions in the watersheds in the county;(2) Support the development of implementable watershed protection measures; and(3) Present the recommended watershed management plan for the entire county.
This Management Plan outlines what needs to be done to advance a comprehensive watershed management strategy that is achievable, cost-effective, and supported by the public. The core recommendations for a plan of action are as follows:

FORSYTH COUNTY COMPREHENSIVE PLAN 9-14 FORSYTH COUNTY COMPREHENSIVE PLAN 9-15
I N T E R G O V E R N M E N T A L
(1) Adopt the Watershed Management Plan: The County Board of Commissioners must adopt the plan in principle and agree to support implementation of the recommendations.(2) Revise Existing Ordinances and Policies: Specific ordinances will need to be reviewed and modified, or new ordinances developed, to support implementation of the proposed watershed management program.(3) Enhance Enforcement of Existing and New Ordinances: Many of the existing ordinances for sedimentation and erosion control are not adequately enforced. Success of the management plan will be directly tied to the enforcement of these requirements. Each county department will need to evaluate additional staff requirements to fully implement these recommendations.(4) Develop or Revise Existing Development Review Process: Revisions to the existing development review process are likely to be needed to implement the proposed new development requirements. A more detailed evaluation of the existing processes will need to be completed to define the required process changes.(5) Enhance Infrastructure Maintenance Programs: As the county continues to develop, the maintenance of existing and new sewage collection and treatment facilities, storm water treatment facilities, and on-site septic systems will become increasingly important to overall water quality management.(6) Conduct Reconnaissance Studies: The recommendations for watershed restoration and retrofit will have to be developed after these studies are conducted. Preliminary indications are that significant watershed restoration and retrofits are needed to restore streams to meet their designated uses.(7) Implement Watershed Monitoring Program: Future permits will be tied to documenting the effectiveness for watershed management program and the associated reductions in nonpoint source pollutant loading. An effective monitoring program will be key to achieving the county’s goals.(8) Enhance Public Outreach and Education Program: Public education is one of the most cost-effective methods for minimizing nonpoint source runoff. An educated citizenry is more likely to support water quality improvement programs and assist in their implementation.
A countywide effort will be required to meet the objectives established by in the Watershed Assessment and Management Document. The recommendations of the document have been used in drafting the goal section of this element, the implementation plan, and the STWP for Forsyth County.
Transportation Requirements for Non-Attainment AreasThe State of Georgia is located in Region 4 of the Air Quality Control Regions established by the Clean Air Act. Within the state of Georgia, the Environmental Protection Agency determined the 13 county metro-Atlanta area exceeded the acceptable ambient air levels for ozone (O3) in 1999 and placed the 13 county metro-Atlanta in the ‘serious’ class for non-attainment. This classification was upgraded to ‘severe’ in September of 2003. Forsyth County is included in the 13 county metro-Atlanta area and therefore, the EPA considers Forsyth County a non-attainment area for ozone.
Ozone is a chemical reaction between intense sunlight, NOx (Nitrous Oxides) and VOC

FORSYTH COUNTY COMPREHENSIVE PLAN 9-14 FORSYTH COUNTY COMPREHENSIVE PLAN 9-15
I N T E R G O V E R N M E N T A L
contributes to VOC emissions but not as significantly as NOx emissions. Again in 1999, approximately 26% of the total VOC emissions in Forsyth County came from mobile sources whereas 34% came from non-road sources. The remaining VOC emissions came from point source and area emissions.
Based on the above referenced statistics, automobiles (mobile sources) are a significant contributor to NOx emissions and a moderate contributor to VOC emissions. While other sources contribute to NOx and VOC emissions, it is not difficult to conclude a reduction in vehicle miles traveled (VMT) on a day to day basis would help in reducing the O3 levels in Forsyth County. Forsyth County and the Georgia Department of Transportation confirmed the importance of the reduction of VMT their joint Long Range Transportation Plan issued in December 2002. In this Plan, Forsyth County states it will measure its progress toward attainment by examining the change in VMT. The logical inference, therefore, is a reduction in VMT will result in a reduction of O3 levels.
To reduce O3 levels, the county will adhere to state and federal mandates, but there are many policies and programs Forsyth County can implement to lower O3 levels through a reduction in VMT by county residents. These policies and programs involve a mix of long range land use planning, intergovernmental and interagency cooperation and cooperation between developers, residents and county officials.
The first method to consider is mass transit, both inter and intra county. At this time, Forsyth County has no fixed route bus transit service, and it is highly unlikely the county will ever be able to sustain a fixed route bus transit service. The estimated population density for the county in 2030 is 2.5 persons per acre (insert numbers from our population projections and divide by total acres) which is far below the 25.7 persons per acre needed to sustain a fixed
(Volatile Organic Compounds) and more commonly known as smog. NOx comes from a variety of sources, but one of the major sources is the combustion engine such as those found in automobiles, lawnmowers and boats. According to the 1999 emissions statistics provided by the Georgia Environmental Protection Division, approximately 46% of the total NOx emissions in Forsyth County came from mobile sources, i.e., automobiles, and 48% of the total NOx emission came from non-road sources, i.e., boats, lawnmowers, etc. The combustion engine also

FORSYTH COUNTY COMPREHENSIVE PLAN 9-16 FORSYTH COUNTY COMPREHENSIVE PLAN 9-17
I N T E R G O V E R N M E N T A L
route bus transit service. (Long Range Transportation Plan prepared for Forsyth County and the Georgia Department of Transportation p. 3-8) Though an intracounty fixed route bus service is unlikely, the Regional Express Bus System is a promising rapid transit option for the county. Forsyth County agreed to expand this service into the county in 2002. By developing and participating in an intercounty bus service program, the county can reduce the number of VMT per day by offering commuters an option other than personal vehicles.
In conjunction with mass transit, Forsyth County, in the last few years, started to work with developers and Georgia Regional Transportation Authority (GRTA) to set aside land for transportation alternatives or factor in transportation alternatives when designing a project. The best example of this attempt to engage in long term planning is the Rouse Project. The Rouse Company submitted a rezoning application in 2002 requesting property located in the south end of the county, at McFarland Road and Georgia Highway 400, be rezoned to a commercial district. The Rouse Company plans to construct an upscale shopping mall. During the rezoning process, the county, the Rouse Company, and GRTA worked together to reach a consensus on reducing the number of vehicles traveling to and from the development. Discussions included placing a park and ride lot adjacent to the shopping mall. While the parties involved did not make a firm decision on the issue, in all likelihood, should the mall be constructed, a park and ride lot will be provided. By continuing to address transportation issues at the earliest possible stage of development, the county, developers, citizens and outside agencies can all work together to ensure development plans include methods of reducing VMT.
The second method the county will use to reduce VOC and NOx emissions is the land use planning process. Specifically, the county will encourage developers and people seeking to rezone property to provide for mixed-use development, when appropriate. By combining residential and commercial uses and ensuring the two are within biking/walking distance, the county can achieve a reduction in the VMT. The county is beginning to have some success in this area. In 2002, development started on the Vickery project; a mixed use project combining residential, institutional and commercial elements and designed as a traditional neighborhood. Vickery is designed to be pedestrian friendly and reduce the reliance on automobiles. By combining different uses, it is anticipated the VMT will be reduced as compared to VMT when different uses are separated per zoning requirements.
As the county continues to develop, it will continue to encourage mixed use developments. The county’s current development guidelines are ideally suited to assist in the continued development of mixed use projects. Currently, the county recognizes a mixed use zoning category, Planned Unit Development (PUD). By requesting a PUD zoning classification, a developer is given wide latitude in designing his/her project and is able to combine a variety of land uses, especially commercial and residential. In a properly designed PUD development, a developer can integrate commercial, residential, recreational and institutional uses to limit VMT. If the county and developers work together, projects can be designed to enable residents to walk or bike to retail areas and institutional uses such as schools and churches. In addition to the PUD zoning district, the county also permits a person to set aside 25% of a commercially zoned piece of property for residential uses if a conditional use permit is

FORSYTH COUNTY COMPREHENSIVE PLAN 9-16 FORSYTH COUNTY COMPREHENSIVE PLAN 9-17
I N T E R G O V E R N M E N T A L
granted. Again, by integrating two different uses, the VMT will be reduced as people walk or bike to commercial centers. Additionally, the long term goal of the county will be to locate commercial districts with conditional use permits for residential housing near major arterials. By locating this type of development near arterials, the VMT will be reduced as park and ride lots can be located near the developments and intercounty bus service runs along the arterials.
The third method the county can use to reduce O3 levels is to continue its working relationship with GRTA. Any project qualifying as a development of regional impact (DRI) must go through a GRTA review. GRTA’s recommendations and conditions for project approval help the county identify transportation and design improvements that can reduce the VMT for new projects being developed.
To further reduce VMT, the county needs to expand its pedestrian and bicycle circulation system through the implementation of the Forsyth County Bicycle Transportation and Pedestrian Walkways Plan, which was adopted in 2002.
INTERGOVERNMENTAL COORDINATION GOALSIntergovernmental Goals Related to Coordination• Serve the best interests of the region by working in cooperation with other agencies and
governments. • Resolve conflicts with agencies and governments through established mediation processes
or informal means.• Coordinate with the City of Cumming to identify further opportunities for joint service
delivery.• Encourage the development of policy and procedures that are consistent with adopted
coordination mechanisms and applicable regional and state programs.• Work with the City of Cumming, the Forsyth County Board of Education, and other
local entities to examine the feasibility of establishing a joint processes for collaborative planning and decision-making on population projections, the location and extension of public facilities, and the location of facilities with countywide significance, such as water supply reservoirs, water and wastewater treatment facilities, solid waste disposal facilities, and schools.
Intergovernmental Goals Related to Transportation• Work to plan and implement a transportation system that is multi-modal, seamless, and
accessible to all citizens.• Encourage land use policies that promote efficient use of infrastructure investments.• Operate within a decision-making framework that values public participation and connects
transportation choices, land use and the overall quality of life.Intergovernmental Goals Related to Natural Resources• Work to improve the water quality of Big Creek and its tributaries.• Encourage decisions that maximize the recreation potential of the Big Creek Watershed.• Work to minimize flooding, property damage, and stream impacts, due to storm water, in
the Big Creek Watershed.

FORSYTH COUNTY COMPREHENSIVE PLAN 9-18
• Educate the Big Creek Watershed’s users about the watershed. • Strive for intergovernmental cooperation in protecting the Big Creek Watershed. • Work to adopt the watershed management plan and agree to support implementation of
the recommendations. • Revise existing ordinances and policies to support implementation of the proposed
watershed management program. • Consider methods to enhance the enforcement of ordinances for sedimentation and
erosion control. • Enhance infrastructure maintenance programs to ensure existing and new sewage
collection and treatment facilities, storm water treatment facilities, and on-site septic systems will continue to efficiently protect overall water quality.
• Conduct reconnaissance studies to determine if watershed restoration and retrofits are needed to restore streams to meet their designated uses.
• Implement a watershed monitoring program that requires future permits to document their effectiveness for watershed management and the associated reductions in nonpoint source pollutant loading.
• Enhance public outreach and education programs in an effort to minimize nonpoint source runoff and develop support for water quality improvement programs.
• Participate in the Metropolitan North Georgia Water Planning District. • Own and operate utilities that manage water supply systems, water conservation programs,
and wastewater.• Support regional efforts for water resources management and wastewater management • Encourage programs to improve water system interconnections and the management of
collection systems and septic systems.• Plan and construct water supply infrastructure for water supply and infrastructure for
wastewater management. • Review local plans for consistency with the Long-term Wastewater Management Plan. • Review local plans for consistency with the Water Supply and Water Conservation
Management Plan. • Support the source water protection strategies for any watershed that is a water supply
source. • Follow procedures outlined by the Metro North Georgia Water Planning District to meet
requirements related to TMDL .• Develop and implement a watershed improvement plan. • Continued implementation of the Programmatic Watershed Management Strategies -
including implementation of the model ordinances for stormwater management.
Chapter Ten, the Implementation Program, provides the overall strategy for the comprehensive plan implementation. The policy recommendations listed above are merged and coordinated with the policies of the other elements to form the implementation program. The associated short-term work program designates the actions the county will take in the next five years to achieve these goals. The list is not all-inclusive. There are some actions that may not be addressed due to time, budget and administrative constraints. These items will be included as part of the work program at some point over the twenty-year planning period.

FORSYTH COUNTY COMPREHENSIVE PLAN 10-1
INTRODUCTION
The implementation program is intended to establish Forsyth County’s long-range needs, goals and ambitions and identify how they will be addressed or attained during the planning period. The previous chapters provided an inventory and assessment of the eight elements of the Forsyth County Comprehensive Plan: Population; Housing; Economic Development; Natural and Cultural Resources; Community Facilities and Services; Land Use; Intergovernmental Coordination; and Transportation. This chapter merges and coordinates the policies formed from the separate plan elements into an overall implementation strategy to direct the County over the next 20 years.
COMMUNITY VISION
The vision for Forsyth County is supported by the community goals and implementation program. The Community Vision is intended to portray a complete picture of what the community desires to become. Forsyth County has developed a more generalized overall vision for the community, with more specific and detailed visions for each subarea of the community. Each subarea vision is consistent with the overall vision for the county.
Forsyth County VisionForsyth County will be a dynamic, thriving community, which melds the development of an exemplary quality of life with the preservation of its unique natural and cultural resources. We will continue to build upon and encourage the unique characteristics found throughout our community while working together towards our common goals.
Subarea VisionsSubarea 1 - Chestatee Subarea Vision• The Chestatee subarea will primarily be a residential community with a rural character.• Lake Lanier will continue to be a valuable asset that provides recreational opportunities for local residents and visitors. • Convenient access to commercial services will be located around two nodes on SR
306. One located at Jot-Em-Down Road and the other at Dawsonville Highway. These commercial nodes could contain some county offices and a postal facility.
• A network of greenways will run throughout the subarea with passive parks and connected trails.
• Maintenance of the area’s rural atmosphere and protection of Chestatee’s clean environment will be partially accomplished by prohibiting additional heavy industry and limiting new light industry to the existing industrial area in the southwest portion of the subarea.
Subarea 2 - Coal Mountain Subarea Vision• The Coal Mountain subarea will primarily be a residential community with a rural
IMPLEMENTATION PROGRAM CHAPTER 10

FORSYTH COUNTY COMPREHENSIVE PLAN 10-2 FORSYTH COUNTY COMPREHENSIVE PLAN 10-3
IMPLEMENTATION PROGRAM character.
• GA 400 will continue to be a valuable asset that provides connectivity to employment and shopping opportunities. Future commercial growth should be directed to this corridor.
• Convenient access to commercial services will be located around two activity centers. One adjacent to SR 306 and SR 369 and another located at the intersection of SR 369 and SR 9.
• A network of greenways will run throughout the subarea with passive parks and connected trails.
• The protection of Coal Mountain’s clean environment will be partially accomplished by prohibiting additional heavy industry and limiting new light industry to appropriate locations near GA 400.
Subarea 3 - McFarland Subarea Vision• The McFarland subarea will be the premier employment center for the County.• It will be the site of quality development and business opportunities.• Convenient access to commercial services will be located along major arterial roads, such
as Hwy 9.• A network of greenways will run along the Big Creek with passive parks and connected
trails.
Subarea 4 - Cumming Subarea Vision• The Cumming subarea will primarily be a residential community with close proximity to
jobs and commercial areas.• GA 400 will continue to be a valuable asset that provides connectivity to employment and
shopping opportunities. • Commercial development will take the form of nodes as opposed to “strip commercial”.
It should be directed to the major arterials such as GA 400, SR 9 and SR 20. Adopt appropriate design standards to promote quality development throughout the subarea.
• A network of greenways will run throughout the subarea with passive parks and connected trails.
• Provide areas for water retention along SR 9 that can also serve as passive parks.
Subarea 5 - South Forsyth Subarea Vision• The South Forsyth subarea will offer its residents a high quality of life, opportunities for
employment, shopping and recreation, and a safe environment.• It will be the site of quality development distinctive from other areas of the county and
the rest of the Atlanta region. The subarea will be known to have grown in a responsible manner.
• Available open space with passive parks and connected trails will be one of the area’s prime assets.
• New activity centers will be located along Peachtree Parkway both near its intersection with Old Alpharetta Road and GA 400, offering convenient access to commercial services and employment opportunities.
• A network of well-engineered roads, bike trails and sidewalks will provide circulation alternatives.

FORSYTH COUNTY COMPREHENSIVE PLAN 10-2 FORSYTH COUNTY COMPREHENSIVE PLAN 10-3
IMPLEMENTATION PROGRAM • Sewer will be extended throughout the subarea.• Citizens will have easy access to libraries and other government services.
Subarea 6 - Big Creek Subarea Vision• The Big Creek subarea will primarily be a residential community with close proximity to
jobs and commercial areas.• Residential developments will preserve large amounts of open space.• Commercial development will take the form of nodes as opposed to “strip commercial”.
Commercial development should be directed along SR 20.• Adopt appropriate design standards to promote quality development throughout the
subarea.• A network of greenways will run throughout the subarea with passive parks and connected
trails.• The subarea will offer a variety of lot sizes, but design guidelines will help to preserve the
rural character.• The subarea’s valued natural and cultural resources will be preserved for future
generations.
Subarea 7 - Buford/ 20 East Subarea Vision:• The Buford/ 20 East subarea will primarily have residential character with convenient
access to recreational, shopping and employment opportunities.• The GA 400 and GA 20 highway corridors will continue to be an asset for residents of this
subarea, providing a connection to jobs and commercial areas.• New activity centers will be located near the intersection of GA 20 and Sanders Road and
GA 20 and Windermere Parkway.• Appropriate design standards will be adopted to promote quality development throughout
the subarea.• A network of greenways will run throughout the subarea with passive parks and connected
trails.• The subarea’s valuable natural resources, including Lake Lanier and the Chattahoochee
River, will be preserved for future generations through appropriated buffers and impervious surface restrictions.
Subarea 8 - Lake Lanier Subarea Vision• Lake Lanier will continue to be a valuable asset that provides recreational opportunities for
local residents and visitors.• The Lake Lanier subarea will primarily have a rural and large lot residential character.• Commercial development will be limited in the subarea. Nodal commercial development
will be concentrated in designated areas along the SR 369 corridor.• The GA 400 corridor will continue to be an asset for residents of this subarea, providing a
connection to jobs and commercial areas.• Appropriate design standards will be adopted to promote quality development throughout
the subarea.• A network of greenways will run throughout the subarea with passive parks and connected
trails, in particular connecting U.S. Army Corps of Engineers Land.

FORSYTH COUNTY COMPREHENSIVE PLAN 10-4 FORSYTH COUNTY COMPREHENSIVE PLAN 10-5
IMPLEMENTATION PROGRAM
Subarea 9 - Settingdown Subarea Vision• Settingdown will primarily have a rural and large lot residential character. • The subarea will offer a variety of lot sizes, but design guidelines will help to preserve the
rural character.• The subarea’s valued natural and cultural resources will be preserved for future
generations.• With the exception of Hwy 9, the subarea will not contain any large-scale commercial
areas.• A nodal form of commercial development will develop along Hwy 9, not “strip commercial.”• Limited commercial development will be provided within large planned developments.• A network of greenways will run throughout the subarea with passive parks and connected
trails. Subarea 10 - Etowah Subarea Vision• The subarea’s natural and cultural resources will be protected for future generations.• The subarea will maintain a rural character and retain some agricultural uses.• Conventional subdivisions will be encouraged to locate south of Matt Hwy.• Current larger undeveloped tracts will be developed as conservation subdivisions.
LONG-RANGE OBJECTIVES AND SHORT-RANGE ACTION ITEMS
The long-range objectives and short-range action items described below are derived from the preceding elements and correspond to goals set by the community. The distinction between what constitutes a long-range objective and what constitutes a short-range action item is in the manner in which they are achieved. An objective is a guideline to be followed by government officials in making land use or capital investment decisions aimed at addressing a general goal. An action item calls for some particular action on the part of the county to meet a specified objective. Action items are included in the Short Term Work Program (STWP).
HousingObjective 1:• Protect residential areas by encouraging appropriate open space buffers around commercial developments.•Objective 2: • Encourage measures to achieve a balanced mix of dwelling types, sizes, and prices in order to meet the diverse needs of the community’s workforce and support desired commercial and industrial growth.
Action Items:• Develop policy that would encourage developers of large non-residential projects to evaluate the need for affordable housing generated by persons to be employed in the proposed development. Developers of large non-residential projects that are determined to create a significant need for affordable housing not currently available within the community should be encouraged to supply moderate income housing. • Investigate amending the UDC to establish a voluntary, incentive-based “ set aside a certain percent of the total units in the development for moderate income residents.

FORSYTH COUNTY COMPREHENSIVE PLAN 10-4 FORSYTH COUNTY COMPREHENSIVE PLAN 10-5
IMPLEMENTATION PROGRAM Objective 3: Encourage quality and long-term value in residential development as a means of maintaining high standards, quality image, and property values.
Action Items:• Examine the feasibility of a code enforcement program aimed at reducing dilapidated and substandard property.
Economic DevelopmentObjective 1: Encourage landscaping, signage, building design, and other development regulations that enhance the image of Forsyth County and create value.
Action Items:• Examine the feasibility of architectural and design standards with a citizen based design committee.
Objective 2: Continue to encourage the expansion of existing business/industry and the location on new business/industry to Forsyth in a manner that is consistent with the goals and objectives of the Comprehensive Plan.Objective 3: Continue to support the work of the Forsyth County Chamber of Commerce.
Natural and Cultural ResourcesObjective 1: Work towards exceeding the state standard for greenspace in each subarea.
Action Items:• Prepare a greenway/open space master plan to reflect the goals and objectives of
the Comprehensive Plan.• Work toward the acquisition and preservation greenbelt-protected areas, such as
the Chattahoochee River, Etowah River, and Big Creek.• Partner with large-scale residential and mixed-use developments to obtain
conservation easements.• Acquire land in the southern portion of the county for a new community park and
greenway, to include passive use opportunities.• Study the feasibility of transferable development rights (TDRs) and other tools to
provide incentives to preserve green space, open space, and to retain small farms and agricultural related businesses.
Objective 2: Consider methods to enhance the enforcement of ordinances for sedimentation and erosion control.
Action Items:• Add additional county staff to enforce development and zoning conditions and
erosion control with substantial fines for noncompliance. Objective 3: Support regional efforts for water resources management and wastewater management. Action items:
• Review, and update as necessary, the County’s rules, regulations, and ordinances to ensure that adequate measures are in place to protect water resources.
• Work to adopt the watershed management plan and agree to support implementation of the recommendations.
• Implement a watershed monitoring program that requires future permits to document their effectiveness for watershed management and the associated reductions in

FORSYTH COUNTY COMPREHENSIVE PLAN 10-6 FORSYTH COUNTY COMPREHENSIVE PLAN 10-7
IMPLEMENTATION PROGRAM nonpoint source pollutant loading.
• Enhance public outreach and education programs in an effort to minimize nonpoint source runoff and develop support for water quality improvement programs.
• Participate in the Metropolitan North Georgia Water Planning District. • Follow procedures outlined by the Metropolitan North Georgia Water Planning District to meet requirements related to TMDL
• Examine measures to improve water quality, such as stream buffer requirements.Objective 4: Promote the preservation of the natural and cultural resources of the county.
Action Items:• Revise the permitting and enforcement procedures that are related to the sign
ordinance to help preserve the scenic features of the county. • Review the County’s rules, regulations, and ordinances to ensure that adequate
measures are in place to protect and encourage the preservation of trees and vegetative cover.
• Establish standards to identify land in which development impacts should be minimized.• Appoint a community task force to study the feasibility of a countywide historic preservation
ordinance.• Investigate preservation incentives such as local property tax freeze or abatement
programs.• Utilize current state and federal programs that provide funding, staff and services in the
area of historic preservation.• Pursue funding for a survey to identify and document pre-historic and historic archeology
in Forsyth County.• Seek certification as a Certified Local Government under the Historic Preservation
Division of the Georgia Department of Natural Resources.Objective 5: Continue to support the attainment of air quality in conjunction with neighboring counties. Objective 6: Encourage the creation of hiking trails which interconnect with existing greenways and trails from adjoining counties.
Action Items:• Develop pedestrian trails linking recreation sites that will eventually result in a regional trail system.• Create development standards to encourage the linking of conservation lands to create greenway corridors.
Objective 7: Promote non-residential design that reduces urban heat islands and minimize light pollution. Objective 8: Continue to comply with the Part V Criteria of the Department of Natural Resources Minimum Environmental Standards.
Community Facilities and ServicesObjective 1: Ensure that prime commercial/industrial acreage is served with necessary infrastructure
Action Items:• Own and operate utilities that manage water supply systems, water conservation

FORSYTH COUNTY COMPREHENSIVE PLAN 10-6 FORSYTH COUNTY COMPREHENSIVE PLAN 10-7
IMPLEMENTATION PROGRAM programs, and wastewater.
Objective 2: Encourage street designs that improve traffic flow and reduce congestion, such as grid pattern streets.
Action Items:•Develop overlay districts for major transportation corridors. A major transportation corridor study should consider design criteria, alternative development regulations, and increased flexibility in accepted land uses. Develop a procedure for community involvement, such as a community task force.
Objective 3: Encourage alternative transportation forms, such as carpooling, to reduce congestion and vehicular demands on roadways by reducing single occupancy vehicle use
Action Items:• Modify development regulations to encourage the installation of sidewalks, bike paths and trees along roadways as they are improved or created.
Objective 4: Implement development patterns that would make the extension of public facilities or services economically feasible.
Action Items:• Coordinate with the City of Cumming to identify further opportunities for joint service delivery.• Work with the City of Cumming, the Forsyth County Board of Education, and other local entities to examine the feasibility of establishing a joint processes for collaborative planning and decision-making on population projections, the location and extension of public facilities, and the location of facilities with countywide significance, such as water supply reservoirs, water and wastewater treatment facilities, solid waste disposal facilities, and schools.
Land UseObjective 1: Continue to monitor the development of the County to determine if the goals and objectives of the comprehensive plan are being attained.
Action Items:• Annually review the land use element of the comprehensive plan and consider changes in response to previously unforeseen opportunities. • Develop a methodology for the continuation of the subarea planning process.• Update the Unified Development Code (UDC). Address existing inconsistencies and include modifications to reflect the goals and objectives of the Comprehensive Plan.• Establish procedures for annual review and update of CIE and STWP as required by Impact Fees.
Objective 2: Encourage maximizing open space with density incentives. Action Items:• Develop a plan to require mixed-use development to have a significant percentage of the area to remain protected greenspace.
Objective 3: Consider modifying the development regulations to encourage mixed-income and mixed-use neighborhoods.
Action Items:• Modify development regulations to encourage mixed-use developments in appropriate land use designations with appropriate controls.

FORSYTH COUNTY COMPREHENSIVE PLAN 10-8
FORS
YTH
CO
UN
TY C
OM
PREH
ENSI
VE
PLA
N
10-9Objective 4: Continue efforts to have an efficient and adequate level of public participation
in the land development process. Action Items:
• Examine the rezoning process with focus on submittal requirements and the revision process.
Objective 5: Continue to use the comprehensive plan as part of the considerations for rezoning requests and conditional use applications.
Action Items: • Initiate an annual review and update process for the Comprehensive Plan and
continue to monitor development to determine if the goals and objectives of the plan are being attained.
SHORT TERM WORK PROGRAM
A Short-Term Work Program sets out the specific actions the local government intends to take during each of the next five years to implement the Comprehensive Plan. Each item listed in the STWP includes information on the responsible party, funding source, and estimated cost. The Short-term Work Program for Forsyth County is presented in Table 10.1. Not all action items can be addressed in the next five years. These items will be included as part of the work program at some point over the twenty-year planning period.

FOR
SYTH C
OU
NTY C
OM
PREH
ENSIVE PLA
N
10-8
FORSYTH COUNTY COMPREHENSIVE PLAN 10-9
TABLE 10.1: FORSYTH COUNTYSHORT TERM WORK PROGRAM
2004 - 2008
DescriptionYears
Responsibility Funding Source Estimated Cost2004 2005 2006 2007 2008
GENERAL
Update the Unified Development Code. Address existing inconsistencies and include modifications to reflect the goals and objectives of the Comprehensive Plan.
X Planning Department County $ 150,000
Examine the feasibility of a code enforcement program aimed at reducing dilapidated and substandard property.
X Planning Department County $ 25,000
Investigate measures to achieve a balanced mix of dwelling types, sizes, and prices in order to meet the diverse needs of the community’s workforce and support desired commercial and industrial growth.
X X X X X Planning Department County $8,000/Annual
Revise the permitting and enforcement procedures that are related to the sign ordinance to help preserve the scenic features of the county.
X XPlanning
Department; Sheriff’s Office
County $ 8,000
Prepare a greenway/open space master plan to reflect the goals and objectives of the Comprehensive Plan.
X
Planning Department;
Parks & Rec.; Engineering
County $ 75,000

FORSYTH COUNTY COMPREHENSIVE PLAN 10-10
FORSYTH COUNTY COMPREHENSIVE PLAN 10-11
DescriptionYears
Responsibility Funding Source Estimated Cost2004 2005 2006 2007 2008
Review the County’s rules, regulations, and ordinances to ensure that adequate measures are in place to protect water resources.
X X X X X Planning Department; Water and
Sewer; Engineering
County $10,000/Annual
Initiate an annual review and update process for the Comprehensive Plan and continue to monitor development to determine if the goals and objectives of the plan are being attained.
X X X X X Planning Department
County $30,000/Annual
Study the feasibility of transferable development rights (TDRs) and other tools to provide incentives to preserve green space, open space, and to retain small farms and agricultural related businesses.
X X Planning Department
County $ 100,000
Examine the feasibility of architectural and design standards with a citizen based design committee.
X X Planning Department
County $ 75,000
Appoint a community task force to examine the development of overlay districts for major transportation corridors. The major transportation corridor study should consider design criteria, alternative development regulations, and increased flexibility in accepted land uses.
X X Planning Department; Engineering
County $ 75,000

FORSYTH COUNTY COMPREHENSIVE PLAN 10-10
FORSYTH COUNTY COMPREHENSIVE PLAN 10-11
DescriptionYears
Responsibility Funding Source Estimated Cost2004 2005 2006 2007 2008
Coordinate with the City of Cumming to identify further opportunities for joint service delivery.
X X X X X All Service Providers
Identified in HB489
County $8,000/Annual
Work with the City of Cumming, the Forsyth County Board of Education, and other local entities to examine the feasibility of establishing a joint processes for collaborative planning and decision-making on population projections, the location and extension of public facilities, and the location of facilities with countywide significance, such as water supply reservoirs, water and wastewater treatment facilities, solid waste disposal facilities, and schools.
X X X X X Countywide County $15,000/Annual
Establish and implement procedures for annual review and update of CIE and STWP as required by Impact Fees.
X X X X x Planning Department
County $30,000/Annual
Appoint a community task force to study the feasibility of a county-wide historic preservation ordinance.
X Planning Department
County $ 35,000

FORSYTH COUNTY COMPREHENSIVE PLAN 10-12
FORSYTH COUNTY COMPREHENSIVE PLAN 10-13
Description Years Responsibility Funding Source Estimated Cost2004 2005 2006 2007 2008
PUBLIC SAFETY - Sheriff
New Precinct - North X X Sheriff’s Department County/Impact Fees
$ 2,267,000
Detention Facility X X X X X Sheriff’s Department County/Impact Fees/SPLOST
$ 17,796,410
PUBLIC SAFETY - Fire and RescueNew Fire Station - 1 X X Fire and Rescue County/Impact
Fees $ 1,870,000
New Fire Station - 2 X X Fire and Rescue County/Impact Fees
$ 1,870,000
New Fire Station - 3 X X Fire and Rescue County/Impact Fees
$ 1,870,000
New Ladder Truck X Fire and Rescue County/Impact Fees
$ 750,000
Renovations and Replacements - Ladder Truck
X Fire and Rescue County/SPLOST $ 750,000
Renovations and Replacements - Fire Engines
X X X X X Fire and Rescue County/SPLOST $ 2,100,000
Renovations and Replacements - Station 1 X X X Fire and Rescue County/SPLOST $ 1,570,000
Renovations and Replacements - Station 2 X X Fire and Rescue County/SPLOST $ 670,000
Renovations and Replacements - Station 6 X X Fire and Rescue County/SPLOST $ 920,000
Renovations and Replacements - Station 7 X Fire and Rescue County/SPLOST $ 570,000

FORSYTH COUNTY COMPREHENSIVE PLAN 10-12
FORSYTH COUNTY COMPREHENSIVE PLAN 10-13
Description Years Responsibility Funding Source Estimated Cost
2004 2005 2006 2007 2008
PUBLIC SAFETY - E911 System
E911 - Equipment X X X Fire and Rescue County/Impact Fees/SPLOST
$ 2,750,000
PARKS AND RECREATION
Fowler Park X Parks & Recreation County/SPLOST $ 8,000,000
South Recreation Center X Parks & Recreation County/Impact Fees/SPLOST
$ 6,500,000
Sawnee Mountain Preserve X Parks & Recreation County/Impact Fees/SPLOST
$ 4,000,000
Soccer Complex II X X Parks & Recreation County/Impact Fees/SPLOST
$ 7,000,000
Coal Mountain Park X Parks & Recreation County/SPLOST $ 400,000
Bennett Park X Parks & Recreation County/SPLOST $ 100,000
Community Park X Parks & Recreation County/Impact Fees/SPLOST
$ 1,600,000
Midway Park X Parks & Recreation County/SPLOST $ 400,000
Sawnee Park Facilities X Parks & Recreation County/SPLOST $ 100,000
Skate Park X Parks & Recreation County/Impact Fees/SPLOST
$ 1,000,000
Cumming Aquatic Center X Parks & Recreation County/SPLOST $ 6,000,000

FORSYTH COUNTY COMPREHENSIVE PLAN 10-14
FORSYTH COUNTY COMPREHENSIVE PLAN 10-15
Description Years Responsibility Funding Source Estimated Cost2004 2005 2006 2007 2008
PUBLIC LIBRARIES
Cumming Library Improvements X X Public Libraries County/SPLOST $ 438,287
Headquarters Facility X X Public Libraries County/Impact Fees/SPLOST
$ 1,523,720
TRANSPORTATION - Roads (*Note: If road impact fee program is adopted it will be used as a funding source.)
Atlanta Hwy - McFarland Road to Mullinax X X State/Local State* $ 10,400,000
Atlanta Hwy - Mullinax Rd to Maple St X X State/Local State* $ 40,000,000
Bagley Drive - SR141 to Mathis Airport Rd X X Local Local* $ 1,900,000
Bethelview Road - SR9 to SR20 X X Local Local* $ 30,500,000
Browns Bridge Road - SR306 to Shady Grove Rd
X X State/Local State* $ 4,500,000
Canton Hwy - Tower Rd to Doc Sams Rd X X State/Local State/Local* $ 22,300,000
Castleberry Road - Bethelview Rd to Hutchinson Rd
X X Local Local* $ 10,000,000
Dahlonega Hwy - SR20 to Dunn Rd X X State/Local State* $ 11,000,000
Hutchinson Road - Castleberry to SR9 X X Local Local* $ 1,400,000
Keith Bridge Road - GA400 to SR53 X X State/Local State* $ 26,000,000
Market Place Boulevard - Old Atlanta Rd to SR20
X X Local Local* $ 6,000,000

FORSYTH COUNTY COMPREHENSIVE PLAN 10-14
FORSYTH COUNTY COMPREHENSIVE PLAN 10-15
Description Years Responsibility Funding Source Estimated Cost
2004 2005 2006 2007 2008
Market Place Boulevard - McFarland Rd to Union Hill Rd
X X Local Local* $ 11,200,000
Mathis Airport Road - Old Atlanta Rd to SR141
X X Local Local* $ 12,300,000
Matt Highway - Doc Bramblett Rd to Gravitt Rd
X X State/Local State* $ 9,000,000
McFarland - SR9 to Union Hill Rd X X Local Local* $ 18,000,000
McFarland - Union Hill Rd to McGinnis Ferry Rd
X X Local/Private Privately Funded* $ 12,600,000
McGinnis Ferry Road - Gwinnett Co line to Fulton Co line
X X State/Fulton County/Local
State/Fulton County/Local*
$ 44,000,000
Mulinax Road - Union Hill Rd to Atlanta Hwy
X X Local Local* $ 8,000,000
Old Atlanta Road - McGinnis Ferry Rd to SR9
X X Local Local* $ 33,000,000
Peachtree Parkway - John’s Creek Pkwy to SR9
X X State/Local State* $ 22,000,000
Post Road - SR9 to Majors Rd X X State/Local State* $ 27,000,000 Sharon Road - Old Atlanta Rd to SR141 X X Local Local* $ 12,600,000
Interchange - SR20 at SR400 X X State/Local State* $ 12,000,000 Interchange - SR400 at McFarland Rd X X State/Local State/Local* $ 12,000,000
Union Hill Road - McFarland Road to Mullinax Rd
X X Local Local* $ 1,000,000
Atlanta Highway - Fulton Co line to McFarland Road
X X X State/Local State* $ 8,000,000

FORSYTH COUNTY COMPREHENSIVE PLAN 10-16
FORSYTH COUNTY COMPREHENSIVE PLAN 10-17
Description Years Responsibility Funding Source Estimated Cost2004 2005 2006 2007 2008
Brookwood Road - McGinnis Ferry to SR141
X X X State/Local State/Local* $ 4,500,000
Buford Highway - GA400 to Gwinnett Co line
X X X State/Local State* $ 9,000,000
Canton Hwy - Cherokee County line to Doc Sams Rd
X X X State/Local State* $ 4,300,000
Canton Hwy - Spot Rd to Kelly Mill Rd X X X State/Local State* $ 4,850,000
Dahlonega Hwy - Dunn Rd to Browns Bridge Rd
X X X State/Local State* $ 12,000,000
Dawsonville Road - Dawson County line to Hall County line
X X X State/Local State* $ 14,700,000
Dr. Bramblett Road - SR20 to Roaper Rd X X X State/Local State/Local* $ 5,500,000
GA400 - McFarland Road to Browns Bridge Road
X X X State/Local State* $ 29,000,000
GA400 - Fulton Co line to McFarland Road X X X State/Local State* $ 6,000,000
Keith Bridge Road Extension - Spot Rd to GA400
X X X State/Local State/Local* $ 15,000,000
Kelly Mill Road - SR371 to Bethelview Rd X X X State/Local State/Local* $ 6,000,000
Kelly Mill Road - Bethelview Rd to SR20 X X X State/Local State/Local*
Market Place Boulevard - McGinnis Ferry Rd - SR141
X X X Local Local* $ 42,000,000
Market Place Boulevard - Buford Dam Road to Pilgrim Mill Road
X X X Local Local*

FORSYTH COUNTY COMPREHENSIVE PLAN 10-16
FORSYTH COUNTY COMPREHENSIVE PLAN 10-17
Description Years Responsibility Funding Source Estimated Cost
2004 2005 2006 2007 2008Matt Hwy - Cherokee County Line to Gravitt Road
X X X State/Local State* $ 44,100,000
Old Alpharetta Road - McGinnis Ferry Rd to SR141
X X X State/Local State/Local* $ 11,000,000
Old Buford Road - SR20 to Kelly Mill Rd X X X State/Local State/Local* $ 1,800,000
Peachtree Parkway - McGinnis Ferry Rd to SR9
X X X State/Local State* $ 10,500,000
Pine Grove Road - Shiloh Rd to Old Alpharetta Rd
X X X State/Local State/Local* $ 1,100,000
Post Road - Majors Rd to SR20 X X X State/Local State/Local* $ 26,300,000
Shiloh Road - McFarland Road to Pine Grove Rd
X X X State/Local State/Local* $ 4,500,000
Union Hill Road - McGinnis Ferry Rd to McFarland Rd
X X X State/Local State/Local* $ 9,000,000
Transportation - Bike/Ped - Multi-Use Path
(Note: Listed items have been identified as Short Term (able to be constructed in a 5-year time frame). Construction dates will vary.)
McGinnis Ferry X X X X X Local To be determined: Local/State/
Federal
$ 8,900,000
Transportation - Bike/Ped - sidewalks
(Note: Listed items have been identified as Short Term (able to be constructed in a 5-year time frame). Construction dates will vary.)
Buford Hwy X X X X X Local To be determined: Local/State/
Federal
$ 1,365,000

FORSYTH COUNTY COMPREHENSIVE PLAN 10-18
FORSYTH COUNTY COMPREHENSIVE PLAN 10-19
Description Years Responsibility Funding Source Estimated Cost
2004 2005 2006 2007 2008
McFarland X X X X X Local To be determined: Local/State/
Federal
$ 195,000
Bald Ridge Marina X X X X X Local To be determined: Local/State/
Federal
$ 45,500
Hwy 141 X X X X X Local To be determined: Local/State/
Federal
$ 845,000
Bethelview X X X X X Local To be determined: Local/State/
Federal
$ 2,600,000
Transportation - Bike/Ped - Bike Friendly Shoulder
(Note: Listed items have been identified as Short Term (able to be constructed in a 5-year time frame). Construction dates will vary.)
McFarland X X X X X Local To be determined: Local/State/
Federal
$ 204,000
Old Atlanta Road X X X X X Local To be determined: Local/State/
Federal
$ 400,000
Transportation - Bike/Ped - Signed Shared Roadway
(Note: Listed items have been identified as Short Term (able to be constructed in a 5-year time frame). Construction dates will vary.)
Kelly Mill Trail X X X X X Local To be determined: Local/State/
Federal
$ 35,200

FORSYTH COUNTY COMPREHENSIVE PLAN 10-18
FORSYTH COUNTY COMPREHENSIVE PLAN 10-19
Description Years Responsibility Funding Source Estimated Cost
2004 2005 2006 2007 2008
Holbrook - Karr Link X X X X X Local To be determined: Local/State/
Federal
$ 13,000
Western Loop X X X X X Local To be determined: Local/State/
Federal
$ 55,000
Harris Drive - Burnt Bridge Link X X X X X Local To be determined: Local/State/
Federal
$ 40,000
Govan - Hendrix Link X X X X X Local To be determined: Local/State/
Federal
$ 39,500
Transportation - Bike/Ped - Pedestrian Crossing
(Note: Listed items have been identified as Short Term (able to be constructed in a 5-year time frame). Construction dates will vary.)
Canton Hwy at Post X X X X X Local To be determined: Local/State/
Federal
$ 43,000
Canton Hwy at Bethelview X X X X X Local To be determined: Local/State/
Federal
$ 43,000
Post at Bentley X X X X X Local To be determined: Local/State/
Federal
$ 43,000
Post at Majors X X X X X Local To be determined: Local/State/
Federal
$ 43,000

FORSYTH COUNTY COMPREHENSIVE PLAN 10-20
Description Years Responsibility Funding Source Estimated Cost
2004 2005 2006 2007 2008
Hwy 9 at Pendley X X X X X Local To be determined: Local/State/
Federal
$ 43,000
Fairway Drive at Buford Hwy X X X X X Local To be determined: Local/State/
Federal
$ 43,000
James Burgess at Old Atlanta Road X X X X X Local To be determined: Local/State/
Federal
$ 43,000

FORSYTH COUNTY COMPREHENSIVE PLAN 11-1
INTRODUCTION
Forsyth County, located 40 miles north of Atlanta and 247.4 square miles in size, is preparing for unprecedented growth over the next 10 to 15 years, after already coping for more than a decade of nationally recognized growth. This is evidenced by recent zoning cases approving residential communities, business parks, and retail development throughout the county over the last 36 months. The population for Forsyth County at the 2000 census was 98,407 representing a 123% increase over the 1990 census. This is an average annual increase of 5,532 new residents to Forsyth County. The planning horizon to the years 2010 and 2015, respectively, project the population to increase to a level of 160,219 and 185,019. These projections embody a pace of growth even higher than that of the 1990’s. During the 2000’s, the number of new residents is projected to rise to approximately 6,200 per year and remain at this level for the foreseeable future. These figures are substantial and must be used to prepare and plan for the increased demands of future growth in order to maintain and improve the level of services currently enjoyed by today’s county citizens.
The county relies on its Future Land Use Plan as an important tool not only to guide and direct the county’s future but as a statement of policy. In addition to being a tool for zoning analysis, the Future Land Use Plan also provides predictability to the residential and business community as a tool to better understand how the future of the county is envisioned and how the Plan is to be achieved. This tool is relied upon as a source for all county offices to plan for serving the county’s future population. These same growth projections and patterns for the county’s future are used in budget preparation and planning, both for the short term and long term, by the county so that the community as a whole will be adequately served and that the cost of growth can be managed in a proactive manner rather than a reactive one.
In order to maintain levels of service for the county, the Board of Commissioners (“Board”) must look to and explore multiple funding sources and incorporate these sources as a component in their financial planning. In order to serve the future population, which will demand the same levels of services that the current population enjoys, the county is considering the merits that impact fees would offer. In addition to the customary financial resources made available through property taxes, special assessments, fees, grants, and bonds, the county has decided to formally adopt impact fees as enabled by the Georgia Development Impact Fee Act. The cost of growth should not be a burden to current taxpayers and should be paid by new growth and development in proportion to the costs imposed by such growth and development. With this in mind, Forsyth County has, in accordance with the Development Impact Fee Act, prepared a Capital Improvement Element for Public Safety, including the elements of the Sheriff’s Department (“Sheriff”), Fire and Rescue; Parks and Recreation; and Libraries.
CAPITAL IMPROVEMENTS ELEMENT CHAPTER 11
FORSYTH COUNTY COMPREHENSIVE PLAN 11-2
C A P I T A L I M P R O V E M E N T S
FORSYTH COUNTY COMPREHENSIVE PLAN 11-3
Public SafetySheriffForsyth County is served by its own law enforcement agency that is housed under the Sheriff’s Office. The Sheriff is a countywide elected official. While the Sheriff’s Office is operated through fees and fines, the majority of the operational and capital budget is funded from the county’s general fund and consists of the following divisions and programs: Patrol and Investigations, Detention, Court Services, Special Operations (Specialized Traffic Enforcement Unit, Marine Patrol, Bicycle Patrol, Horse Patrol, School Resource Officers, Animal Control, Ordinance Enforcement, and Community Offered Programs) and Communications including Emergency-911 (“E-911”).
Concerned with the county’s explosive growth and the ability to better plan for serving the future growth (see Table 11.1), the Sheriff’s Office directed a study to review the Office and its operations, as well as, future capital needs. The study was completed in early 2003 and reviews and analyzes the current operations and delivery of service while establishing the framework for preparing for the demands of future growth on the Sheriff’s Office and further outlines specific needs to service existing and future needs. This study was timely and relevant, as it was as an important tool when developing the capital improvement program for the county’s impact fees which was guided by the Sheriff and his office. Clearly, the growth expected as demonstrated in Table 11.1 illustrates a valid concern about meeting the demands of future growth. For example, the future dwelling units are projected to soar to 53,264 by 2025. This alone represents an addition of 2,131 dwellings per year. Additionally, the population will soar and add an additional 129,412 persons, representing 5,176 new persons a year by 2025. The concerns sounded in the Sheriff’s study dated February 10, 2003 are not only critical but are supported by data reflected in Table 11.1. It will be imperative for the county to act now to ready itself for serving and responding to the demand for services.
The Sheriff’s study illustrates four major components. First, efficiencies and execution of service have been compromised in the delivery of current service, which places great challenges in providing the current level of service in the face of substantial future growth. The Sheriff’s Office operates out of twelve separate facilities. The Office has 259 authorized positions, which are made up of civilian and uniformed personnel. The 2003 study urges the consolidation of these separate offices and states that this is an absolute critical need of the Sheriff’s Office in order to better serve the growing community at-large as well as the current population. A second and equally important concern involves the Forsyth County Detention Center. The existing detention center is currently over capacity and the department has had to develop strategic initiatives to service the growing incarcerated population while protecting the general public at the same time.
Third, in addition to the above named divisions and programs, the Sheriff’s Office study calls for two separate precincts in order to maintain response times and provide services county-wide for the future population. The needs and improvements regarding separate precincts are addressed in both Tables 11.10 and 11.14 of the Public Safety Improvement Program.

FORSYTH COUNTY COMPREHENSIVE PLAN 11-2
C A P I T A L I M P R O V E M E N T S
FORSYTH COUNTY COMPREHENSIVE PLAN 11-3
Fourth, communication services are critical to the execution and delivery of services to the county. The county operates an E-911 system. In review of the system, it was determined that, with full support of the Sheriff, the existing E-911 system was incapable for meeting the projected future calls for service and thus needed to be replaced with new state of the art communication equipment and a new building. Current equipment is not sophisticated enough to be integrated into the county’s GIS system. An example of which involved the Sheriff’s Office conducting a manual review and analysis of each and every address where incidents occurred over the last year (2002). The current system could not identify if the service delivered was to a residence or that of a commercial, office, retail or any other nonresidential establishment. In addition to the inadequate sorting of the data the safety of the Sheriff’s Deputies is of great concern. When a call is dispatched now to the deputies the information received on the E-911 is not always reliable and therefore jeopardizes their safety. With the county experiencing the tremendous amount of growth as indicated on Table 11.1, a manual system is no longer a valid approach to verify incident records nor can the current system be relied upon when the safety of the Sheriff’s Office is paramount to the delivery of their services to the population. Currently, the headquarters space for E-911 is housed in a separate building that was built in 1990. The current Level of Service is 0.130 sq. ft. per capita. With the future growth expected as noted in Table 11.1 reaching 185,019 by 2015, the Sheriff has informed the Forsyth County Board of Commissioners that he must have a new facility to accommodate the necessary expansion to house not only equipment but the increase in staff necessary to respond to the demands brought on by future growth. Additionally, the Sheriff has informed the Board of Commissioners that the communication system including but not limited to tower enhancement and repeaters must be installed to provide the necessary safeguards of a reliable communication system. Currently, in several areas of the county the Sheriff’s Office has experienced “deadzones” where there is no ability to communicate by radio and therefore results in an unsafe delivery of public safety services. The existing facility housing E-911 services cannot accommodate any further expansion and therefore it was determined a new state of the art facility of 10,000 sq. ft .must be constructed and would meet the need brought on by future growth. SPLOST funds and the general fund in the amount of $9,338,524 will pay for the existing deficiency and enable the county along with the $5,411,476 coming from new growth funded by impact fees to meet the new Level of Service of 0.189 sq. ft. per capita. As a result an upgraded communication system will be provided along with a newly constructed E-911 facility. Table 11.9 reflects the total $14,750,000 E-911 improvement plan.
Forsyth County is growing rapidly as are the demands placed upon the Sheriff’s Office by the existing population and soon by the future population. This is supported by the level of service reflected in Table 11.7. A proactive stance is critical to the delivery of public safety protection. The capital improvement element for the Sheriff’s Office reflects a proactive stance for meeting the future needs and at the same time will enable the Office to continue to provide the levels of service that the current population enjoys.
Fire Safety and RescueForsyth County is served by a Fire Department made up of both full-time professionals and volunteers. The Fire Department is funded not only by the general fund but enjoys a funding

FORSYTH COUNTY COMPREHENSIVE PLAN 11-4
C A P I T A L I M P R O V E M E N T S
FORSYTH COUNTY COMPREHENSIVE PLAN 11-5
source generated from a special one mill tax which is assigned exclusively to fire safety services. Like the Sheriff’s Department, the Fire Department provides fire protection services as a means to protect the health, safety, and welfare of its citizens. Currently, the Department has 15 stations of which five are staffed with volunteer fire fighters. The remaining ten stations are staffed with full-time paid professional fire fighters. Typical to other fire departments, the Forsyth Fire Department uses the criteria of five road miles from each station to define the territory for service and protection. This criteria is customary with the Insurance Services Office which rates fire departments for insurance purposes and which ultimately determines individual premiums. The citizens of the county have enjoyed a five-minute response time on average based on first on-scene arrival times. In establishing the county’s level of service, it was determined that the existing level of service of one fully equipped station plus a ladder truck for every 16,734 persons would be necessary to continue to meet the future needs of the county. Based on this level of service, the county will need three additional and fully equipped stations for the planning horizon as shown on Table 11.11.
In 2003, the county enjoyed overwhelming approval for a SPLOST initiative. This included funding for fire protection and safety initiatives. In particular, the SPLOST will fund the renovation of seven of the 15 stations. Impact fees will fund three new stations and equip each with a pumper truck, rescue vehicle and other equipment, including Jaws of Life and a ladder truck. Table 11.10 sets forth the improvement program for fire safety and protection.
Parks And RecreationThe county has its own full time professional Parks and Recreation Department and provides recreational services both passive and active countywide. The county’s current inventory includes eight parks with a total of 1,114 acres of land. The county has received funding in terms of grants for the statewide greenspace program and has used these funds in the past to acquire parkland. Like most of the county departments, the Parks and Recreation Department receives most of its funding from the county general fund. However, unlike most county departments, the Parks and Recreation Department is a cost center and does generate fees from recreational services. While this is not enough to fund the department it does aid in offsetting some of the costs in operating the department.
As in the case of public safety, the department will also benefit from the recently approved SPLOST referendum and is budgeted to receive over $15M in new funds (see Table 11.14 ). The county’s current level of service extended by the department is 2.638 acres of active parks per 1,000 population (see Table 11.17) and is valued at $150,000 per acre resulting in $45M of estimated value for all existing Forsyth County parks. This equates to $384.16 per capita and $1,021.21 per dwelling unit (see Table 11.17 entitled Level of Service).
To maintain this level of service, the county intends to improve and build new parks and facilities such as improvements to the soccer complex, Coal Mountain Park, a south county recreation center, Sawnee Mountain Preserve, as well as those listed in the capital improvement plan found in Table 11.18. The capital improvement plan is an aggressive plan but absolutely necessary to maintain the level of service enjoyed by the existing population.

FORSYTH COUNTY COMPREHENSIVE PLAN 11-4
C A P I T A L I M P R O V E M E N T S
FORSYTH COUNTY COMPREHENSIVE PLAN 11-5
With the expected population increase as noted in Table 11.1, the county will have to build today to meet the demands of the future population. As the county grows in the nonresidential land uses, it will be important to monitor the nonresidential activity of the parks system for the possibility in the future to assign costs to this sector of the county.
LibrariesForsyth County has established and provides a full time library service countywide and currently has two facilities operating within the county. Staffed with full time professionals the Library Department serves over 42,000 patrons. While the service is available countywide and is used countywide, 42,000 are those patrons who actually have been issued a library card. The Central Library serves as the current headquarters facility with a branch located in the outlying county. It is planned that the Headquarters facility will be moved out of the Central Library and into a freestanding facility. Space used currently for headquarters in Central will be reallocated for patron and administrative space. Impact fees will not be used to pay for any improvements to the Library Headquarters which is located in the City of Cumming. Funds to improve the space in the headquarters facility will come from the general fund and SPLOST. The current level of service as shown in Table 11.20 indicates 0.388 square feet of library floor space per capita however, the department feels in order to fully serve the current and future population a level of service of 0.5 per capita is necessary. The deficiency will be made up of county funds derived from SPLOST (see Table 11.20). The capital improvement program as shown in Table 11.20 indicates three separate improvements. They include the Hampton Branch, Central Branch (Cumming Library), and the Headquarters Facility. With the growth anticipated and reflected in Table 11.1, it is important to address the needs of the county library system early in order to be able to meet the demands of the future.
Total library improvements planned amount to $6,724,103. This program includes the renovation of the exiting Cumming library, the construction of an over-sized Hampton Brach Library and the construction of headquarters facilities. The present plan is to pay for these capital costs ($6.7 million) out of SPLOST receipts ($4.8 million) and impact fees($1.9 million). The library capital cost allocable to new development in the unincorporated area to 2009 is $2,681,403. The proposed library impact fee before the Board of Commissioners begins with the per dwelling library cost of $197.28 and discounts that cost by $46.31. This amount reflects the SPLOST payments toward library improvements that are attributable to a new dwelling unit in the county. This results in a net cost per dwelling unit of $150.97. The ordinance before the Board would collect this amount as an impact fee (the Board of Commissioners is considering assessing the library impact fee on then basis of the size of a dwelling unit, in square feet of heated area. If the Board elects this option, it would still equal $150.97 for the average dwelling unit).
Between 2003 and 2009 it is expected that there will be 14,421 new dwellings constructed in Forsyth County; 290 in Cumming and 14,131 in the unincorporated area. This means that new developments in the unincorporated area will pay $2,133,314 toward the cost of library improvements at $150.97 each. As shown above, the cost attributable to new development in the unincorporated area is $2,681,403. The cost to be paid by new development is

FORSYTH COUNTY COMPREHENSIVE PLAN 11-6
C A P I T A L I M P R O V E M E N T S
FORSYTH COUNTY COMPREHENSIVE PLAN 11-7
significantly less than the attributable cost. Moreover, Forsyth County will have a surplus in library impact fee collections to carry beyond 2009. This situation is to be expected since the Hampton Branch Library will provide service beyond 2009.
New development in the unincorporated area will pay $2.1 million in library impact fees toward library improvement costs as contracted with attributable costs of $2.7 residential developments in the unincorporated area of Forsyth County are not being disadvantaged by the non-participation of the City of Cumming in the library impact fee program. The use of SPLOST funds ($4.7 million) to pay many of the improvement costs ($6.7 million) assures that new developments are not being assessed more than their pro rata share of library capital costs ($2.7 million).
In the past, the development community has been very supportive of the expansion of the library system and has agreed to work with the county and the reservation of future land and space as they plan their mixed-use developments. This practice should be encouraged to include future libraries so that they are easily accessible to the public which will be a key ingredient to the successful patronage of the facility and the system overall. Impact fees and the funds generated from SPLOST will enable the department to be proactive and ready to respond in a timely manner to address future needs while continuing to serve the existing population without interruption. GROWTH OF FORSYTH COUNTY
PopulationForsyth County’s historic and projected populations are shown in Table 11.1. This is the population that Forsyth County is planning to serve with public safety, parks & recreation and library facilities.
TABLE 11.1: FORSYTH COUNTY POPULATION 1980 – 2025
YEAR COUNTY CUMMING1980 27,958 2,0591990 44,083 2,8282000 98,407 4,2202005 131,569 5,2632010 160,219 5,6082015 185,019 6,4762020 206,418 7,2242025 227,819 7,974
Source: Jerry Weitz & Associates, July 2002.

FORSYTH COUNTY COMPREHENSIVE PLAN 11-6
C A P I T A L I M P R O V E M E N T S
FORSYTH COUNTY COMPREHENSIVE PLAN 11-7
FIGURE 11.1: POPULATION TO 2025 FORSYTH COUNTY AND CUMMING
Table 11.2 converts the projected population into households and needed dwelling units. During 2000 to 2025, Forsyth County is expected to add:• 129,412 persons to its population • 5,176 additional persons per year
• 50,716 new households • 2,029 new households per year
• 53,264 new dwelling units • 2,131 new dwellings per year
Land use planning within Forsyth County will have to identify and provide adequate and efficient sites for these new residences. Additionally, Forsyth County is expected to fund improvements to public safety, public libraries and also to the county’s park & recreation that will accommodate these additional persons. This is a substantial quantity of growth and accommodating this growth will strain Forsyth County’s financial abilities.
TABLE 11.2: POPULATION, HOUSE HOLDS AND HOUSING 1990 – 2025
1990 2000 2005 2010 2015 2020 2025Population 44,083 98,407 131,569 160,219 185,019 206,418 227,819Households 15,938 34,565 47,460 57,795 67,977 77,270 85,281
Persons per HH 2.766 2.847 2.772 2.772 2.722 2.671 2.671Dwelling Units 17,869 36,505 49,957 60,837 71,554 81,336 89,769Occupied DUs 15,938 34,565 47,460 57,795 67,977 77,270 85,281Persons per DU 2.467 2.696 2.634 2.634 2.586 2.538 2.538
Source: Jerry Weitz & Associates, July 2002 and U.S. Bureau of the Census, 1990 and 2000 Census of the Population, Forsyth County at www.census.gov/Americanfactfinder.

FORSYTH COUNTY COMPREHENSIVE PLAN 11-8
C A P I T A L I M P R O V E M E N T S
FORSYTH COUNTY COMPREHENSIVE PLAN 11-9
EmploymentForsyth County employment projections are shown in Tables 11.3 and 11.4.
TABLE 11.3: EMPLOYMENT PROJECTIONS 2000 – 2025
INDUSTRY 2000 2005 2010 2015 2020 2025 Agricultural Service 800 760 720 680 640 600 Mining 60 70 80 90 110 110 Construction 5,000 6,500 7,600 9,500 10,200 10,700 Manufacturing 7,200 8,700 9,500 10,600 11,500 11,900
T.C.U. 1,000 1,200 1,500 1,600 1,700 1,800
Wholesale Trade 3,500 4,700 5,800 6,300 7,400 8,300 Retail Trade 5,400 7,200 8,400 10,300 11,400 12,200 F.I.R.E. 800 1,400 2,000 3,400 3,700 4,000 Services 6,700 8,400 12,600 18,400 22,300 25,000 Government 3,500 3,600 3,800 4,100 4,400 4,500 Total 33,960 42,530 52,000 64,970 73,350 79,110Source: Jerry Weitz & Associates, 2002.T.C.U. – Transportation, Communication and UtilitiesF.I.R.E. – Finance, Insurance and Real Estate
TABLE 11.4: PROJECTED EMPLOYMENT GROWTH BY INDUSTRY 2000 – 2025Industry Total New Jobs % Of all New Jobs Annual Growth Rate
Agricultural Service -200 -0.44% -1.14% Mining 50 0.11% 2.45% Construction 5,700 12.62% 3.09% Manufacturing 4,700 10.41% 2.03% T.C.U. 800 1.77% 2.38% Wholesale Trade 4,800 10.63% 3.51% Retail Trade 6,800 15.06% 3.31% F.I.R.E. 3,200 7.09% 6.65% Services 18,300 40.53% 5.41% Government 1,000 2.21% 1.01%
Total 45,150 100.00% 3.44%Sources: Jerry Weitz & Associates, July 2002, and US Department of Commerce, County Business Patterns, Forsyth County, 1997-2002.
The county is projected to add 1,806 new jobs per year to 2025. While finance, insurance and real estate sectors are expected to experience the most rapid rate of growth, 40% of all new jobs will be in the service sector. Services and trade (both wholesale and retail) account for 30,000 of the 45,000 new jobs (66%). Land use planning will have to identify adequate and efficient sites for these new and expanded employers.

FORSYTH COUNTY COMPREHENSIVE PLAN 11-8
C A P I T A L I M P R O V E M E N T S
FORSYTH COUNTY COMPREHENSIVE PLAN 11-9
Non-Residential Land UseThe projected needs for developed floor area by type of use are shown in Table 11.5. The projected growth of the county will require an estimated 29 million square feet of floor area within 3,464 additional acres of non-residential development.
TABLE 11.5: PROJECTED NON-RESIDENTIAL DEVELOPMENT 2000 – 2025
2000 2005 2010 2015 2020 2025Commercial Acres 1,247 1,613 1,898 2,331 2,543 2,697
Office/Professional Acres 378 492 655 876 1,019 1,122
Industrial Acres 1,143 1,433 1,662 1,974 2,165 2,288
Public & Quasi-Public Acres 438 450 475 513 550 563
Total Non-Residential Acres 3,206 3,987 4,690 5,694 6,276 6,670
Non-Residential Floor Area(Ft) 27,286,858 33,939,867 39,921,037 48,468,331 53,422,710 56,771,544
Source: Urban Land Institute (ULI), Office and Industrial Development Handbook services, various years.
Future Land UsesTable 11.6 sets out the future land use assumptions for Forsyth County. These are the developmental parameters that will be employed in developing capital improvement programs and development impact fees.
TABLE 11.6: LAND USE ASSUMPTIONS 2000 – 2025
2000 2005 2010 2015 2020 2025Population 98,407 131,569 160,219 185,019 206,418 227,819
Households 34,565 47,460 57,795 67,977 77,270 85,281
Persons per HH 2.847 2.772 2.772 2.722 2.671 2.671
Dwelling Units 36,505 49,957 60,837 71,554 81,336 89,769
Occupied Dus 34,565 47,460 57,795 67,977 77,270 85,281
Persons per Dus 2.696 2.634 2.634 2.586 2.538 2.538
Residential Acres 17,383 22,708 25,349 27,521 29,049 29,923
Commercial Acres 1,247 1,613 1,898 2,331 2,543 2,697
Office/Professional Acres 378 492 655 876 1,019 1,122
Industrial Acres 1,143 1,433 1,662 1,974 2,165 2,288
Public & Quasi-Public 438 450 475 513 550 563
Total Developed Acres 20,589 26,695 30,039 33,215 35,325 36,593
Non-Residential Floor Area 27,286,858 33,939,867 39,921,037 48,468,331 53,422,710 56,771,544
Dwelling Units Per Acre 2.100 2.200 2.400 2.600 2.800 3.000
Sources: Tables, 1, 2, 3, 4 and 5 above.

FORSYTH COUNTY COMPREHENSIVE PLAN 11-10
C A P I T A L I M P R O V E M E N T S
FORSYTH COUNTY COMPREHENSIVE PLAN 11-11
PUBLIC SAFETY OPTIONS
The Board of Commissioners is considering two public safety options. These two options are set out below. After deliberation and consideration of public input, the Board will select one of these two options. At this time both options are being considered within the amended Capital Improvement Element, recognizing that one of the two options will be deleted from the final amendments to the Comprehensive Plan.
PUBLIC SAFETY - WITHOUT NEW DETENTION FACILITY
Level Of Service - Sheriff Table 11.7 sets out the existing and future levels of service for Forsyth County Sheriff’s capital facilities. The detention facility is excluded in the level of service set forth below.
TABLE 11.7: SHERIFF’S LEVEL OF SERVICE
Existing Building Area 2003 FUTURE Office 1,452 0 Admin Services 1,400 0 Support 1,300 0 Records 2,883 0 CID 3,452 0 Evidence 2,112 0 UPD 2,139 2,139 Courthouse 524 524 New Facility 32,315TOTAL 15,262 34,978Planning Horizon 2015Target Population 185,019Floor Area per Capita 0.189NEEDED FLOOR AREA 34,978 Serving Existing Community 22,145 Existing Deficiency 19,482 Serving Growth 12,833Sheriff’s Headquarters; $4,316,000 Cost of Existing Deficiency $2,403,955 Cost of Growth $1,912,045South Precinct $2,267,000North Precinct $2,267,000Total Improvements $8,850,000 Total Growth $6,446,045 Assigned to; Residential 60% $3,867,627 New Dwelling Units 27,488 Per Dwelling Unit $140.70 Non-Residential 40% $2,578,418 New Floor Area 17,364,958 Per Foot $0.148

FORSYTH COUNTY COMPREHENSIVE PLAN 11-10
C A P I T A L I M P R O V E M E N T S
FORSYTH COUNTY COMPREHENSIVE PLAN 11-11
Much of the existing Sheriff’s facilities will be replaced with a consolidated new facility. This new facility will service both the existing community and new development. When completed, the level of service for Forsyth County will be 0.189 square feet of building floor area per capita. This ratio is applied equally to the existing developments and to new development and thus constitutes the attribution of need to new development. This LOS constitutes an increase above the existing level of service of 0.130 feet. Of the total new facilities, 19,482 feet (56%) is an existing deficiency, the cost of which should be borne by the existing community. The remainder of the Sheriff’s Headquarters will service the needs of growth to 2015.
The total cost of new Sheriff’s facilities amounts $8,850,000, $6,446,045 (73%) of which is the cost of serving growth. Total growth cost is divided between new residential development and new non-residential development. The division is 60% residential and 40% non-residential. This division is confirmed as reasonable by the Forsyth County Sheriff’s Department based upon Forsyth County experience. The result is a residential assigned cost of $3,867,627. This amounts to $140.70 per additional residential dwelling unit. The non-residential cost of $2,578,418 equates to $0.148 per gross square foot of floor area.
Level Of Service - Fire & RescueThe existing level of service for Forsyth County Fire & Rescue is shown in Table 11.8. These cost assignments are based on a level of service of one fully equipped fire station plus a ladder truck for each 16,734 persons. The need for new facilities attributable to new development is one fully equipped station for each 16,734 additional residents, with the cost for stations to be distributed among residential and non-residential developments on the basis of their calls for service. Like the Sheriff’s facilities, the growth serving costs are divided between residential and non-residential development on a 78% - 22% basis. The proposed three additional fire stations would serve an additional 50,203 residents and would meet the needs of Forsyth County to 2012. The cost per new dwelling is $245.94 and the cost per non-residential foot of floor area is $0.097.
TABLE 11.8: FIRE LEVEL OF SERVICE
Existing Stations 7 Population per Station 16,734 Value per Station $1,870,000Value of Ladder Truck $750,000Total Current Value $13,840,000Assigned to; Residential 78% $10,837,672 Per Dwelling Unit $245.94 Non-Residential 22% $3,002,328 Per Foot of Floor Area $0.097Proposed new Stations 3 Population Served by 3 stations 50,203 Total Population Served 167,342 Planning Horizon 2012

FORSYTH COUNTY COMPREHENSIVE PLAN 11-12
C A P I T A L I M P R O V E M E N T S
FORSYTH COUNTY COMPREHENSIVE PLAN 11-13
The level of service for the E-911 system is shown in Table 11.9. The existing E-911 facilities and equipment do not have the capacities to meet the future needs of Forsyth County and will have to be replaced with equipment and facilities that have the capacity to meet existing and projected public safety needs of Forsyth County.
TABLE 11.9: EMERGENCY 911 LEVEL OF SERVICE
Exiting Level of Service: All existing facilities to be replaced.Proposed Facilities: Building $2,750,000 E911 Equipment $12,000,000 Total $14,750,000Population Served 185,019 Existing Deficiency $9,338,524Growth Cost $5,411,476 Residential 78% $4,237,558 Per Dwelling Unit $154.16 Non-Residential 22% $5,100,966 Per Foot of Floor Area $0.294
Public Safety Capital Improvement ProgramTable 11.10 contains the short-term capital improvement program for Public Safety. Public Safety includes the Sheriff’s Department, the Forsyth County Fire & Rescue Department and the Emergency 911 system. These improvements, planned to be made between 2003-2008, will serve the anticipated growth of Forsyth County to 2015 with Sheriff’s and 911 facilities and to 2012 with fire & rescue stations. The improvements shown in Table 11.10 and the timing of those improvements should be read as the best current thinking of the respective departments and the Impact Fee Advisory Committee (“IFAC”) and not fixed recommendations and most certainly not commitments. The IFAC believes that it is important to couple impact fees with improvements expected to be provided with those fees. Furthermore, the Georgia Development Impact Fee Act, O.C.G.A. §36-71-1, et seq.-?, requires the projection of needed capital improvements for a stated planning horizon and the incorporation of those projections into a Capital Improvements Element of the Forsyth County Comprehensive Plan. For these reason the IFAC is including specific improvements together with the timing of those improvements.

FORSYTH COUNTY COMPREHENSIVE PLAN 11-12
C A P I T A L I M P R O V E M E N T S
FORSYTH COUNTY COMPREHENSIVE PLAN 11-13
TABLE 11.10: PUBLIC SAFETY IMPROVEMENT PROGRAM
2004 2005 2006 2007 2008SHERIFF
Sheriff’s Headquarters $899,000 $1,368,000 $1,368,000 $681,000 $0 Existing Need $500,731 $761,958 $761,958 $379,308 $0 Growth Cost $398,269 $606,042 $606,042 $301,692 $0New Precinct - South $1,191,000 $1,076,000 $0 $0 $0 Existing Need $0 $0 $0 $0 $0 Growth Cost $1,191,000 $1,076,000 $0 $0 $0New Precinct - North $0 $0 $1,729,000 $538,000 $0 Existing Need $0 $0 $0 $0 $0 Growth Cost $0 $0 $1,729,000 $538,000 $0TOTAL $2,090,000 $2,444,000 $3,097,000 $1,219,000 $0 Existing Need $500,731 $761,958 $761,958 $379,308 $0 Growth Cost $1,589,269 $1,682,042 $2,335,042 $839,692 $0
FIRE & RESCUE: New Fire Station-1 $1,500,000 $0 $0 $0 $0 Pumper Truck $0 $250,000 $0 $0 $0 Rescue Vehicle $0 $100,000 $0 $0 $0 Other Equipment $0 $20,000 $0 $0 $0 Sub-Total $1,500,000 $370,000 $0 $0 $0 Existing Need $0 $0 $0 $0 $0 Growth Cost $1,500,000 $370,000 $0 $0 $0 New Fire Station-2 $0 $1,500,000 $0 $0 $0 Pumper Truck $0 $0 $250,000 $0 $0 Rescue Vehicle $0 $0 $100,000 $0 $0 Other Equipment $0 $0 $20,000 $0 $0 Sub-Total $0 $1,500,000 $370,000 $0 $0 Existing Need $0 $0 $0 $0 $0 Growth Cost $0 $1,500,000 $370,000 $0 $0 New Fire Station-3 $0 $0 $1,500,000 $0 $0 Pumper Truck $0 $0 $0 $250,000 $0 Rescue Vehicle $0 $0 $0 $100,000 $0 Other Equipment $0 $0 $0 $20,000 $0 Sub-Total $0 $0 $1,500,000 $370,000 $0 Existing Need $0 $0 $0 $0 $0 Growth Cost $0 $0 $1,500,000 $370,000 $0 New Ladder Truck $0 $0 $0 $0 $750,000 Existing Need $0 $0 $0 $0 $0 Growth Cost $0 $0 $0 $0 $750,000
RENOVATIONS & REPLACEMENTS Ladder Truck $0 $0 $750,000 $0 $0 Fire Engines $700,000 $350,000 $350,000 $350,000 $350,000 Renovate Stn 1 $320,000 $75,000 $1,175,000 $0 $0 Renovate Stn 2 $50,000 $620,000 $0 $0 $0 Renovate Stn 6 $0 $0 $75,000 $845,000 $0 Renovate Stn 7 $0 $0 $0 $570,000 $0 TOTAL $1,070,000 $1,045,000 $2,350,000 $1,765,000 $350,000 SPLOST FUNDED $1,070,000 $1,045,000 $2,350,000 $1,765,000 $350,000 Existing Need $1,070,000 $1,045,000 $2,350,000 $1,765,000 $350,000 Growth Cost $0 $0 $0 $0 $0
TOTAL FIRE & RESCUE $2,570,000 $2,915,000 $4,220,000 $2,135,000 $1,100,000 Existing Need $1,070,000 $1,045,000 $2,350,000 $1,765,000 $350,000 Growth Cost $1,500,000 $1,870,000 $1,870,000 $370,000 $750,000
E911 SYSTEM Building $791,000 $1,308,000 $651,000 $0 $0
Equipment $500,000 $6,000,000 $5,500,000 $0 $0 Total 911 $1,291,000 $7,308,000 $6,151,000 $0 $0
Existing Need $817,358 $4,626,843 $3,894,323 $0 $0 Growth Cost $473,642 $2,681,157 $2,256,677 $0 $0
SPLOST Funded $817,358 $4,626,843 $3,894,323 $0 $0TOTAL PUBLIC SAFETY $5,951,000 $12,667,000 $13,468,000 $3,354,000 $1,100,000
Existing Need $2,388,089 $6,433,801 $7,006,281 $2,144,308 $350,000 Growth Cost $3,562,911 $6,233,199 $6,461,719 $1,209,692 $750,000

FORSYTH COUNTY COMPREHENSIVE PLAN 11-14
C A P I T A L I M P R O V E M E N T S
FORSYTH COUNTY COMPREHENSIVE PLAN 11-15
Table 11.11 sets out the public safety improvement program with respect to the cost assignments. The total public safety improvement program amounts to $36,540,000, 51% of which serves the existing community. The cost of serving growth amounts to $18,217,522.
TABLE 11.11: PUBLIC SAFETY COST ASSIGNMENT
Sheriff Fire & Rescue E 911 TotalIMPROVEMENTS $8,850,000 $12,940,000 $14,750,000 $36,540,000 Serving Existing Community $2,403,955 $6,580,000 $9,338,524 $18,322,478 SPLOST Funded $2,403,955 $6,580,000 $9,338,524 $18,322,478 Other Funded $0 $0 $0 $0 Serving Growth $6,446,045 $6,360,000 $5,411,476 $18,217,522 SPLOST Funded $0 $0 $0 $0COST ASSIGNED TO: Residential $3,867,627 $4,980,317 $4,237,558 $13,085,503 Percentage 60% 78% 78% New Residential Units 27,488 20,851 27,488 Non-Residential $2,578,418 $1,379,683 $1,173,918 $5,132,019 Percentage 40% 22% 22% New Floor Area 17,364,958 12,039,028 17,364,958Cost Per: New Residential Unit $140.70 $238.85 $154.16 $533.71 SPLOST Credit $0.00 $0.00 $104.22 $104.22 Net Residential per Unit $140.70 $238.85 $49.94 $429.49 New Non-Residential per Foot $0.148 $0.115 $0.068 $0.331 SPLOST Credit $0.000 $0.000 $0.081 $0.081 Net Non-Residential per Foot $0.148 $0.115 -$0.013 $0.250REVENUES: TOTAL COST $8,850,000 $12,940,000 $14,750,000 $36,540,000 SPLOST $2,403,955 $6,580,000 $9,338,524 $18,322,478 Impact Fees $6,446,045 $6,360,000 $1,140,942 $13,946,988 County Obligation $0 $0 $4,270,534 $4,270,534 TOTAL REVENUES $8,850,000 $12,940,000 $14,750,000 $36,540,000
Forsyth County plans to expend Special Purpose Local Option Sales Tax (SPLOST) funds on public safety capital improvements. However, a question is whether a credit must be given for SPLOST funds used for public safety capital improvements, as “system improvements” under the Georgia Impact Fee Act. The Georgia Development Impact Fee Act, O.C.G.A. § 36-71-4 (r) requires that:
Development impact fees shall be calculated on a basis which is net of credits for the present value of revenues that will be generated by new growth and development based on historical funding patterns and that are anticipated to be available to pay for system improvements, including taxes, assessments, user fees, and intergovernmental transfers.

FORSYTH COUNTY COMPREHENSIVE PLAN 11-14
C A P I T A L I M P R O V E M E N T S
FORSYTH COUNTY COMPREHENSIVE PLAN 11-15
O.C.G.A. § 36-71-2 (19) defines “system improvements” as “capital improvements that are public facilities and are designed to provide service to the community at large.” The proposed SPLOST funded public safety improvements will serve the community as a whole, but they are expenditures for station renovation and equipment replacement. The definition of “Capital Improvement” under O.C.G.A. § 36-71-2(1) confines capital improvements for purposes of development impact fees to expenditures that increase service capacity. Renovations and replacements do not increase service capacity. Thus, there would seem to be no requirement for a SPLOST credit for the pubic safety improvements that are renovations and replacements because of the lack of an increase in service capacity. However, there would appear to be a requirement that there be a credit for those SPLOST funded capital improvements that expand the service capacity of the E-911 system. This reduction for the SPLOST credit is applied in Table 11.12.
TABLE 11.12: PUBLIC SAFETY GROWTH COSTS
Public Safety Cost Per: Residential Unit $533.71 SPLOST Credit $104.22 Net Cost $429.49 Average Size of a Dwelling Unit 2,611.4 Foot of Residential Floor Area $0.164 Foot of Non-Residential Floor Area $0.331 SPLOST Credit $0.081 Net Cost $0.250
PUBIC SAFETY – WITH NEW DETENTION FACILITY
This alternative presents a public safety impact fee that includes a new detention facility. This alternative is presented separately because of the large deficiency cost that will have to be borne by the county if impact fees are to be collected to pay a portion of the cost for a new facility. The following represents a description of the distinctions and special concerns reflected by including the new detention facility into the calculations and discussion of the analysis.
Level Of Service - SheriffTable 11.13 sets out the existing and future levels of service for Forsyth County Sheriff’s capital facilities. The detention facility is included in the level of service set forth below.

FORSYTH COUNTY COMPREHENSIVE PLAN 11-16
C A P I T A L I M P R O V E M E N T S
FORSYTH COUNTY COMPREHENSIVE PLAN 11-17
TABLE 11.13 SHERRIFF’S LEVEL OF SERVICE WITH DETENTION FACILITY
2003 FUTUREDetention Facility; New Facility (Sq. Ft.) 102,236 Existing Deficiency 70,129 Growth Serving 32,107Existing Building Area; Office 1,452 0 Admin Services 1,400 0 Support 1,300 0 Records 2,883 0 CID 3,452 0 Evidence 2,112 0 UPD 2,139 2,139 Courthouse 524 524 New Facility 32,315TOTAL 15,262 34,978Planning Horizon 2015Target Population 185,019Floor Area per Capita* 0.189NEEDED FLOOR AREA 34,978 Serving Existing Community 22,145 Existing Deficiency 19,482 Serving Growth 12,833DETENTION FACILITY $17,796,410 Existing Deficiency $12,207,455 Growth Serving $5,588,955Sheriff’s Headquarters; $4,316,000 Cost of Existing Deficiency $2,403,955 Cost of Growth $1,912,045South Precinct $2,267,000North Precinct $2,267,000Total Improvements $26,646,410 Total Growth $12,035,001 Assigned to; Residential 60% $7,221,000 New Dwelling Units 27,488 Per Dwelling Unit $262.69 Non-Residential 40% $4,814,000 New Floor Area 17,364,958 Per Foot $0.277
* Floor Area per Capita is the LOS
There is an existing need for a larger detention facility. The proposed new detention facility will be 102,236 square feet. The new facility is designed to house 363 persons, whereas, the existing facility currently houses 249 persons, indicating that 68% of the new facility (70,129 square feet) is to serve the existing community and 32,107 square feet will serve growth.
Much of the existing Sheriff’s headquarters and office facilities will be replaced with a

FORSYTH COUNTY COMPREHENSIVE PLAN 11-16
C A P I T A L I M P R O V E M E N T S
FORSYTH COUNTY COMPREHENSIVE PLAN 11-17
consolidated new facility. This new facility will service both the existing community and new development. When completed, the level of service for Forsyth County will be 0.189 square feet of building floor area per capita. This Level of Service (“LOS”) constitutes an increase above the existing level of service of 0.130 square feet. Of the total new facilities, 19,482 square feet (56%) is an existing deficiency, the cost of which should be borne by the existing community. The remainder of the Sheriff’s Headquarters will service the needs of growth to 2015.
The total cost of new Sheriff’s facilities amounts $26,646,410, $12,035,001 (45%) of which is the cost of serving growth. Total growth cost is divided between new residential development and new non-residential development. The division is 60% residential and 40% non-residential. This division is confirmed as reasonable by the Forsyth County Sheriff’s Department based upon Forsyth County experience. The result is a residential assigned cost of $7,221,000. This amounts to $262.69 per additional residential dwelling unit. The non-residential cost of $4,814,000 equates to $0.277 per gross square foot of floor area.
Level Of Service - Fire & RescueNo change.
Public Safety Capital Improvement Program With Detention FacilityTable 11.14 contains the short-term capital improvement program for Public Safety with the detention facility.

FORSYTH COUNTY COMPREHENSIVE PLAN 11-18
C A P I T A L I M P R O V E M E N T S
FORSYTH COUNTY COMPREHENSIVE PLAN 11-19
TABLE 11.14: PUBLIC SAFETY CAPITAL IMPROVEMENT PROGRAM
2004 2005 2006 2007 2008SHERIFF:
Detention Facility $17,796,410 Existing Need $12,207,455 Growth Cost $5,588,955
Sheriff’s Headquarters $899,000 $1,368,000 $1,368,000 $681,000 $0 Existing Need $500,731 $761,958 $761,958 $379,308 $0 Growth Cost $398,269 $606,042 $606,042 $301,692 $0
New Precinct – South $1,191,000 $1,076,000 $0 $0 $0 Existing Need $0 $0 $0 $0 $0 Growth Cost $1,191,000 $1,076,000 $0 $0 $0
New Precinct - North $0 $0 $1,729,000 $538,000 $0 Existing Need $0 $0 $0 $0 $0 Growth Cost $0 $0 $1,729,000 $538,000 $0TOTAL Sheriff’s $2,090,000 $2,444,000 $3,097,000 $1,219,000 $17,796,410
SPLOST Funded $0 $0 $0 $0 $2,661,476 Existing Need $500,731 $761,958 $761,958 $379,308 $9,545,979 Growth Cost $1,589,269 $1,682,042 $2,335,042 $839,692 $5,588,955
FIRE & RESCUE: New Fire Station-1 $1,500,000 $0 $0 $0 $0
Pumper Truck $0 $250,000 $0 $0 $0 Rescue Vehicle $0 $100,000 $0 $0 $0
Other Equipment $0 $20,000 $0 $0 $0 Sub-Total $1,500,000 $370,000 $0 $0 $0
Existing Need $0 $0 $0 $0 $0 Growth Cost $1,500,000 $370,000 $0 $0 $0
New Fire Station-2 $0 $1,500,000 $0 $0 $0 Pumper Truck $0 $0 $250,000 $0 $0
Rescue Vehicle $0 $0 $100,000 $0 $0 Other Equipment $0 $0 $20,000 $0 $0
Sub-Total $0 $1,500,000 $370,000 $0 $0 Existing Need $0 $0 $0 $0 $0 Growth Cost $0 $1,500,000 $370,000 $0 $0
New Fire Station-3 $0 $0 $1,500,000 $0 $0 Pumper Truck $0 $0 $0 $250,000 $0
Rescue Vehicle $0 $0 $0 $100,000 $0 Other Equipment $0 $0 $0 $20,000 $0
Sub-Total $0 $0 $1,500,000 $370,000 $0 Existing Need $0 $0 $0 $0 $0 Growth Cost $0 $0 $1,500,000 $370,000 $0
New Ladder Truck $0 $0 $0 $0 $750,000 Existing Need $0 $0 $0 $0 $0 Growth Cost $0 $0 $0 $0 $750,000
RENOVATIONS & REPLACEMENTS Ladder Truck $0 $0 $750,000 $0 $0 Fire Engines $700,000 $350,000 $350,000 $350,000 $350,000
Renovate Stn 1 $320,000 $75,000 $1,175,000 $0 $0 Renovate Stn 2 $50,000 $620,000 $0 $0 $0 Renovate Stn 6 $0 $0 $75,000 $845,000 $0 Renovate Stn 7 $0 $0 $0 $570,000 $0
TOTAL $1,070,000 $1,045,000 $2,350,000 $1,765,000 $350,000 SPLOST FUNDED $1,070,000 $1,045,000 $2,350,000 $1,765,000 $350,000 Existing Need $1,070,000 $1,045,000 $2,350,000 $1,765,000 $350,000 Growth Cost $0 $0 $0 $0 $0
TOTAL FIRE & RESCUE $2,570,000 $2,915,000 $4,220,000 $2,135,000 $1,100,000 Existing Need $1,070,000 $1,045,000 $2,350,000 $1,765,000 $350,000 Growth Cost $1,500,000 $1,870,000 $1,870,000 $370,000 $750,000

FORSYTH COUNTY COMPREHENSIVE PLAN 11-18
C A P I T A L I M P R O V E M E N T S
FORSYTH COUNTY COMPREHENSIVE PLAN 11-19
TABLE 11.14: PUBLIC SAFETY CAPITAL IMPROVEMENT PROGRAM CON’T
E911 System Building $791,000 $1,308,000 $651,000 $0 $0
Equipment $500,000 $6,000,000 $5,500,000 $0 $0 Total 911 $1,291,000 $7,308,000 $6,151,000 $0 $0
Existing Need $817,358 $4,626,843 $3,894,323 $0 $0 Growth Cost $473,642 $2,681,157 $2,256,677 $0 $0
SPLOST Funded $817,358 $4,626,843 $3,894,323 $0 $0TOTAL PUBLIC SAFETY $5,951,000 $12,667,000 $13,468,000 $3,354,000 $18,896,410
Existing Need $2,388,089 $6,433,801 $7,006,281 $2,144,308 $9,895,979 Growth Cost $3,562,911 $6,233,199 $6,461,719 $1,209,692 $6,338,955
NOTE: The cost of the detention facility was assigned to 2008, but the timing of any such facility Is not known at this time.
Table 11.15 sets out the public safety capital improvement program with respect to the cost assignments. The total public safety improvement program amounts to $54,336,410, 51% of which serves the existing community. The cost of serving growth amounts to $23,806,477. The cost falling to the county would amount to $16,220,467.
TABLE 11.15: PUBLIC SAFETY COST ASSIGNMENT WITH DETENTION FACILITYSheriff Fire & Rescue E 911 Total
IMPROVEMENTS $26,646,410 $12,940,000 $14,750,000 $54,336,410 Serving Existing Community $11,949,933 $6,580,000 $9,338,524 $27,868,457
SPLOST Funded $2,661,476 $6,580,000 $9,338,524 $18,580,000 Other Funded $0 $0 $0 $0 Serving Growth $12,035,000 $6,360,000 $5,411,476 $23,806,477
SPLOST Funded $0 $0 $0 $0COST ASSIGNED TO:
Residential $7,221,000 $4,980,317 $4,237,558 $16,438,876 Percentage 60% 78% 78%
New Residential Units 27,488 20,851 27,488 Non-Residential $4,814,000 $1,379,683 $1,173,918 $7,367,601 Percentage 40% 22% 22%
New Floor Area 17,364,958 12,039,028 17,364,958Cost Per:
New Residential Unit $262.69 $238.85 $154.16 $655.70 SPLOST Credit $0.00 $0.00 $104.22 $104.22
Net Residential per Unit $262.69 $238.85 $49.94 $551.48 New Non-Residential per
Foot $0.277 $0.115 $0.068 $0.459 SPLOST Credit $0.000 $0.000 $0.081 $0.081
Net Non-Residential per Foot $0.277 $0.115 -$0.013 $0.378
REVENUES: TOTAL COST $26,646,410 $12,940,000 $14,750,000 $54,336,410
SPLOST $2,661,476 $6,580,000 $9,338,524 $18,580,000 Impact Fees $12,035,000 $6,360,000 $1,140,942 $19,535,943
County Obligation $11,949,933 $0 $4,270,534 $16,220,467 TOTAL REVENUES $26,646,410 $12,940,000 $14,750,000 $54,336,410

FORSYTH COUNTY COMPREHENSIVE PLAN 11-20
C A P I T A L I M P R O V E M E N T S
FORSYTH COUNTY COMPREHENSIVE PLAN 11-21
The reduction for the SPLOST credit incorporating the new detention facility is shown in Table 11.16.
TABLE 11.16: PUBLIC SAFETY GROWTH COSTS INCLUDING DETENTION FACILITY
Public Safety Cost Per: Residential Unit $655.70 SPLOST Credit $104.22
Net Cost $551.48 Average Size of a Dwelling Unit 2,611.4 Foot of Residential Floor Area $0.211
Foot of Non-Residential Floor Area $0.459 SPLOST Credit $0.081
Net Cost $0.378
PARKS AND RECREATION
Level of ServiceTable 11.17 sets out the existing level of service for Forsyth County active park and recreation facilities. The existing level of service is 2.638 acres of active parks per 1,000 population. The need for park improvements to service new development is identified by applying the 2.638 acre standard to projected new development. The Forsyth County cost for a community type park is $150,000 per acre, including the cost of land acquisition and development. This per park cost would result in an estimated value of $45 million for all existing Forsyth County parks. This is $384.16 per capita and $1,021.21 per dwelling unit.
TABLE 11.17: PARK AND RECREATION LEVEL OF SERVICE
EXISTING ACTIVE PARKS Number Acres Neighborhood 1 10
Community 6 299 Total 7 309
Existing Population 117,139 Acres per 1,000 2.638
Community Park Cost: Per Acre $150,502
Per Park (50 acres) $7,500,000Replacement Value of Community Parks $45,000,000
Park Value per Capita $384.16Park Value per Dwelling Unit $1,021.21
SPLOST Credit per Dwelling Unit $152.19NET COST $869.02
Park & Recreation Capital Improvement ProgramTable 11.18 contains the short-term capital improvement program for Parks & Recreation. These proposed improvements will meet the needs of the Forsyth County population until 2010 at the existing level of service.

FORSYTH COUNTY COMPREHENSIVE PLAN 11-20
C A P I T A L I M P R O V E M E N T S
FORSYTH COUNTY COMPREHENSIVE PLAN 11-21
TABLE 11.18: PARKS AND RECREATION IMPROVEMENT PROGRAMIMPROVEMENT 2003 2004 2005 2006 2007 2008Fowler Park $0 $0 $0 $0 $8,000,000 $0 SPLOST Funding $0 $0 $0 $0 $8,000,000 $0 Existing Need $0 $0 $0 $0 $8,000,000 $0 Growth Cost $0 $0 $0 $0 $0 $0South Recreation Center $0 $0 $0 $0 $6,500,000 $0
SPLOST Funding $0 $0 $0 $0 $0 $0 Existing Need $0 $0 $0 $0 $2,600,000 $0 Growth Cost $0 $0 $0 $0 $3,900,000 $0Sawnee Mountain Preserve $0 $0 $0 $0 $0 $4,000,000
SPLOST Funding $0 $0 $0 $0 $0 $0 Existing Need $0 $0 $0 $0 $0 $0 Growth Cost $0 $0 $0 $0 $0 $4,000,000Indoor Pool 2010 $0 $0 $0 $0 $0 $0 SPLOST Funding $0 $0 $0 $0 $0 $0 Existing Need $0 $0 $0 $0 $0 $0 Growth Cost $0 $0 $0 $0 $0 $0Soccer Complex Improvements $250,000 $0 $0 $0 $0 $0
SPLOST Funding $250,000 $0 $0 $0 $0 $0 Existing Need $250,000 $0 $0 $0 $0 $0 Growth Cost $0 $0 $0 $0 $0 $0
Soccer Complex II $0 $0 $1,200,000 $5,800,000 $0 $0 SPLOST Funding $0 $0 $0 $0 $0 $0 Existing Need $0 $0 $0 $0 $0 $0 Growth Cost $0 $0 $1,200,000 $5,800,000 $0 $0
Coal Mountain Park $50,000 $400,000 $0 $0 $0 $0
SPLOST Funding $50,000 $400,000 $0 $0 $0 $0 Existing Need $50,000 $400,000 $0 $0 $0 $0 Growth Cost $0 $0 $0 $0 $0 $0Bennett Park $0 $100,000 $0 $0 $0 $0 SPLOST Funding $0 $100,000 $0 $0 $0 $0 Existing Need $0 $100,000 $0 $0 $0 $0 Growth Cost $0 $0 $0 $0 $0 $0Community Park (new 20% of total) $0 $0 $0 $0 $0 $1,600,000
SPLOST Funding $0 $0 $0 $0 $0 $0 Existing Need $0 $0 $0 $0 $0 $0 Growth Cost $0 $0 $0 $0 $0 $1,600,000Midway Park $50,000 $400,000 $0 $0 $0 $0 SPLOST Funding $50,000 $400,000 $0 $0 $0 $0 Existing Need $50,000 $400,000 $0 $0 $0 $0 Growth Cost $0 $0 $0 $0 $0 $0

FORSYTH COUNTY COMPREHENSIVE PLAN 11-22
C A P I T A L I M P R O V E M E N T S
FORSYTH COUNTY COMPREHENSIVE PLAN 11-23
Sharon Springs Park $0 $100,000 $0 $0 $0 $0
SPLOST Funding $0 $100,000 $0 $0 $0 $0 Existing Need $0 $100,000 $0 $0 $0 $0 Growth Cost $0 $0 $0 $0 $0 $0
Cumming Aquatic Facility $6,000,000
Existing Need $0 $0 $0 $0 $0 $6,000,000 SPLOST Funding $200,000 $0 $0 $0 $0 $0 Existing Need $200,000 $0 $0 $0 $0 $0 Growth Cost $0 $0 $0 $0 $0 $0
Skate Park $0 $0 $1,000,000 $0 $0 $0 SPLOST Funding $0 $0 $0 $0 $0 $0 Existing Need $0 $0 $400,000 $0 $0 $0 Growth Cost $0 $0 $600,000 $0 $0 $0
OTHER SPLOST FUNDED Growth Cost $0 $0 $0 $0 $0 $0
TOTAL IMPROVEMENTS $550,000 $1,100,000 $2,200,000 $5,800,000 $14,500,000 $11,600,000
SPLOST Funding $550,000 $1,100,000 $0 $0 $8,000,000 $6,000,000
Existing Need $550,000 $1,100,000 $400,000 $0 $10,600,000 $6,000,000 Growth Cost $0 $0 $1,800,000 $5,800,000 $3,900,000 $5,600,000
Sources:(1) Forsyth County Parks and Recreation Department, March 20, 2003.(2) Forsyth County SPLOST Notice, March 2003.Notes: (1) The Greenspace acquisition programs are not included herein because the parks and creation impact fee program is confined to active recreation.(2) The City of Cumming proposed SPLOST funded improvements are shown for information purposes only and are not a planned improvement of the County nor subject to control by the County.
Table 11.19 sets out Parks and Recreation improvement program with respect to cost sources of revenue. This is a $35.8 million improvement program, $15.7 Million of which will be paid by SPLOST. Because SPLOST funds are available for parks and recreation capital improvements, as defined in the Georgia Development Impact Fee Act, O.C.G.A. § 36-71- 2(1), any Forsyth County parks & recreation impact fee must be net of a SPLOST credit. The data in Table 16 set out a SPLOST credit of $152.19 per dwelling unit.
PUBLIC LIBRARIES
Level of ServiceThe level of service for the Public Library System of Forsyth County is shown in Table 11.20. The existing level of service includes 2 libraries, which serves a population of 117,139. This equates to 0.388 square feet of library floor space per capita. This level of service is below

FORSYTH COUNTY COMPREHENSIVE PLAN 11-22
C A P I T A L I M P R O V E M E N T S
FORSYTH COUNTY COMPREHENSIVE PLAN 11-23
TABLE 11.19: PARK AND RECREATION CAPITAL REVENUES
TOTAL IMPROVEMENT COST $35,750,000SOURCES OF REVENUE:
SPLOST $15,650,000 Available Funds $600,000 Existing Need $18,650,000 Existing Deficiency $3,000,000 Growth Cost $17,100,000 New Residential Units 16,771
Cost per Residential Unit $1,021.21
SPLOST Credit $152.19
Net Cost $869.02 TOTAL COST $35,750,000 SPLOST $15,650,000 Other Funds $600,000 Impact Fees $14,574,760 Deficiency $4,925,240 TOTAL REVENUES $35,750,000
the desired level of 0.5 feet per capita. The need for library facilities to accommodate new development is identified by applying the existing provision of 0.388 square feet to projected population. Based upon plans for the SPLOST funded Hampton library, the cost per square foot of finished, that is turnkey, library floor area is $191.06. This cost is calculated by including only items with a 10-year or greater use life, so as to be consistent with the requirements of the Georgia Development Impact Fee Act, O.C.G.A. § 36-71-2(1). The cost per dwelling unit amounts to $197.28. A SPLOST credit of $46.31 reduces the net cost to $150.97.
The existing library level of service is 0.388 square feet of library floor area per capita. There are 45,500 FT² of existing libraries and a countywide population of 117,139, which results in the ratio of 0.388 feet per capita. During the 2003 – 2009 planning horizon, countywide growth is projected to be 36,890; 719 within the City of Cumming and 36,171 in the unincorporated area. At the existing level of service, 14,313 FT² of library space would be needed; 279 in Cumming and 14,034 in the unincorporated area. The cost of constructing library space is $191.06. It follows that library cost per capita is $74.21 and cost per dwelling unit is $197.28. At this cost, the 2009 library improvement cost attributable to new residential development would be $2,734,703; $53,300 for Cumming and $2,681,403 for the unincorporated area.
The proposed library expansion, the Hampton Brach Library, is located in the unincorporated area and will be 20,500 FT². This means that there will be surplus library capacity for up to two years (2011) after the planning horizon. This is due to the fact that library design dictates the size of the facility. Additional facility improvements are planned. The total library CIP is shown on Table 18.

FORSYTH COUNTY COMPREHENSIVE PLAN 11-24
C A P I T A L I M P R O V E M E N T S
FORSYTH COUNTY COMPREHENSIVE PLAN 11-25
Forsyth County has and will continue to maintain a countywide level of service for libraries. This policy will not work to the detriment of new developments in the unincorporated area that are required to pay library impact fees. This protection is the result of two factors:
1. Library impact fees collected in the unincorporated area will be spent on library improvements in the unincorporated area and therefore of greatest benefit to unincorporated area residents due to that proximity, and
2. The library impact fees to be charged to unincorporated area new residential developments will be less than the pro rata share of library capital costs reasonable attributable to new developments in the unincorporated area.
TABLE 11.20: LIBRARY LEVEL OF SERVICE
Number of Existing Libraries 2.00 Library Floor Area 45,500 Floor Area per Capita 0.388 Library Cost per Foot (turn-key) $191.06Library Cost per Capita $74.21Persons per Dwelling Unit * 2.66 Planning Horizon 2011Cost per Dwelling Unit $197.28 SPLOST Credit $46.31 Net Cost $150.97 Source: Public Library of Forsyth County, March 20, 2003.
Public Library Capital Improvement ProgramTable 11.21 sets out the proposed library capital improvement program. This program will increase the level of service, but it will do so through SPLOST funding rather than development impact fees. The proposal is to fund the construction and equipping of the Hampton library with SPLOST funds and to direct impact fees toward the headquarters addition located at the Cumming library.
Table 11.22 sets out the library improvement program with respect to cost assignments. The total improvement program amounts to $6,723,103, $4,762,000 from the SPLOST and the remainder from development impact fees. The impact fee will generate $215,009 for future library improvements.

FORSYTH COUNTY COMPREHENSIVE PLAN 11-24
C A P I T A L I M P R O V E M E N T S
FORSYTH COUNTY COMPREHENSIVE PLAN 11-25
TABLE 11.21: PUBLIC LIBRARY IMPROVEMENT PROGRAMIMPROVEMENT 2003 2004 2005 2006 2007 2008
Hampton Branch Library $0 $0 $598,696 $4,163,304 $0 $0 SPLOST Funding $0 $0 $598,696 $3,593,428 $0 $0
Net Cost $0 $0 $0 $569,876 $0 $0 Existing Need $0 $0 $0 $0 $0 $0 Growth Cost $0 $0 $0 $569,876 $0 $0
Cumming Library Improvements $0 $0 $6,969 $431,318 $0 $0 SPLOST Funding $0 $0 $6,969 $431,318 $0 $0
Net Cost $0 $0 $0 $0 $0 $0 Existing Need $0 $0 $0 $0 $0 $0 Growth Cost $0 $0 $0 $0 $0 $0
Headquarters Facility $0 $0 $102,312 $1,421,408 $0 $0 SPLOST Funding $0 $0 $0 $131,589 $0 $0
Net Cost $0 $0 $102,312 $1,289,915 $0 $0 Existing Need $0 $0 $0 $0 $0 $0 Growth Cost $0 $0 $102,312 $1,289,915 $0 $0
TOTAL IMPROVEMENTS $0 $0 $707,977 $6,016,126 $0 $0SPLOST FUNDED $0 $0 $605,665 $4,156,335 $0 $0
NET COST $0 $0 $102,312 $1,859,791 $0 $0 Existing Need $0 $0 $0 $0 $0 $0 Growth Cost $0 $0 $102,312 $1,859,791 $0 $0
Source: Forsyth County Public Library, March 20, 2003.
TABLE 11.22: LIBRARY CAPITAL REVENUES
TOTAL LIBRARY CAPITAL COSTS $6,724,103SPLOST FUNDED $4,762,000 Existing Need $0 Growth Cost $1,962,103
COST ASSIGNED TO: Residential $1,962,103
Non-Residential $0New Dwelling Units 14,421
Net Cost per $150.97 TOTAL COST $6,724,103
SPLOST $4,762,000 Impact Fees $2,177,112 Deficiency $0
TOTAL REVENUES $6,939,112 AMOUNT FOR FUTURE $215,009
SERVICE AREAS
Forsyth County is proceeding with a program of development impact fees that will be collected and expended solely within the unincorporated area of Forsyth County. The hope is that the City of Cumming will elect to join with Forsyth County in a countywide program at some time in the future. At this time the county is proposing to calculate impact fees at a countywide level of service and collect and expend those fees within the unincorporated

FORSYTH COUNTY COMPREHENSIVE PLAN 11-26
C A P I T A L I M P R O V E M E N T S
FORSYTH COUNTY COMPREHENSIVE PLAN 11-27
area. This policy will assure that the level of service used to calculate the impact fees will be delivered to those being required to pay the impact fees. There is no way that the county can deny persons or properties within the City of Cumming access to the E-911, response to calls by the Sheriff’s Department or response to fire or medical emergencies. Additionally, it is impractical to attempt to deny individuals from locations other than the unincorporated area access to county parks or libraries. Thus the county must look to a countywide level of service for these facilities. The interests of those persons in the unincorporated area paying impact fees will be protected by (a) expending those funds in the unincorporated area where they are of maximum benefit to unincorporated area residents and (b) use non-impact fee funds, largely SPLOST receipts, to fund other improvements to maintain the countywide level of service. Forsyth County is aware of the recent Cherokee County ruling (Cherokee County v. Greater Atlanta Homebuilders Ass’n, Inc.,255 Ga.App. 764, 566 S.E.2d 470, 2 FCDR 1825, Ga.App., Jun 13, 2002) that recognizes Forsyth County’s authority to expend impact fees collected only in the unincorporated area anywhere within the county. However, Forsyth County has elected to confine the expenditure of impact fees to the unincorporated area in order to provide maximum benefit to those actually paying the development impact fees. Forsyth County further restricts the expenditure of impact fees to defined service areas, which are discussed below.
Public SafetySheriffDue to the nature of the Sheriff’s functions and their county-wide delivery of service, it was determined after consultation with the Sheriff’s Department that a single service district would be adequate in providing benefit to public safety impact fee payers. This is the current practice of the department in that all facilities serve the entire county and are therefore countywide in nature by their delivery. By providing a consolidated headquarters along with a north and south precinct, the Sheriff can continue to serve the entire county with the combination of these facilities and further support their delivery of service countywide. Additionally, these facilities support the response time the current population enjoys and can be maintained with these future three separate and distinct facilities as called out for in the Capital Improvement Element but also as supported by the 2003 Sheriff’s Study and by description from the Sheriff himself. This would mean that public safety impact fees collected anywhere in the county could be expended at any location within the county on Sheriff’s capital facilities.
Fire & RescueThe Fire Department, like the Sheriff’s Department, serves the entire county. However, fire protection services are somewhat different than that of the Sheriff’s and it is important that fire stations with rescue response be strategically located throughout the county in order to afford a minimum response time to calls. The nature of this particular type of service calls for multiple service districts. As a result, two service districts are established and are hereby known as the North District Service Area and South District Service Area. The district line follows that of State Highway 20 and Buford Dam Road. All property north of State Highway 20 and Buford Dam Road will be the North District Service Area and that property to the south is the South District Service Area. Public safety impact fees could only be expended for fire and rescue capital facilities within the service area where they originated.

FORSYTH COUNTY COMPREHENSIVE PLAN 11-26
C A P I T A L I M P R O V E M E N T S
FORSYTH COUNTY COMPREHENSIVE PLAN 11-27
Emergency CommunicationsThe emergency communications system, E911, serves the entire county from a central location. Therefore a single service district would be adequate in providing public safety protection. This would mean that funds collected anywhere in the county could be expended at any location within the county for E911 capital facilities.
Parks & RecreationThe county’s active park and recreation program is located countywide with these types of parks being relatively equal in distance from one end of the county to the other. Additionally, certain activities of these parks are located in particular parks and are not repeated in each park such as evidenced by the soccer complex. Those that participate in the soccer program travel from all points of the county to the south end of the county for this activity. The same if true of the baseball and softball programs in that they are located in one particular area of the county and those that participate come from all points of the county to take advantage of this recreational activity. As a result, it was determined after consultation with the Parks and Recreation Director that it was his desire to continue the countywide delivery of leisure services and therefore it would be best to create a single service district.
Public LibrariesCurrently, there are two libraries within the county, with one being located within the City of Cumming, which is the central branch and headquarters facility and the other being the Sharon Forks Branch located in the south end of the county. The capital improvement element calls for two new libraries, with one including a new headquarters facility. The current headquarters facility contained within the Cumming branch location is planned to be retrofitted for administration and patronage space. In view of the location of the current and future branches, it was determined in consultation with the Director of Libraries that a multiple service district be created. Patronage and access to libraries is a determining factor in usage and it was concluded, given the location of the libraries, a multiple service district would best reflect the delivery of services currently and in the future. The service areas are identical to those of fire protection in that there should be two service districts and the geographic areas are identical. The boundary line of the districts will follow State Highway 20 and Buford Dam Road. The land to the north of this boundary line will be known as the North District Service Area and to the south is called the South District Service Area. Exempted from this restriction would be the use of impact fees on central or headquarters facilities as funds collected from either the North or South Districts could be expended in the central and headquarters improvements pursuant to the established capital improvement element. However, all efforts should be extended to respect the criterion that impact fees expended on library facilities primarily for the benefit of those areas of the county subject to the requirement to pay those fees.


FORSYTH COUNTY COMPREHENSIVE PLAN
Appendix A
PUBLIC PARTICIPATION PROGRAM

FORSYTH COUNTY COMPREHENSIVE PLAN FORSYTH COUNTY COMPREHENSIVE PLAN
Forsyth County has applied a variety of methods to keep the community informed of the major update to the Comprehensive Plan. In October, 2002, the first public hearing was held to explain the process and present a timeline for the completion on the plan. Beginning in April, an executive summary was posted on the Forsyth County web site and has been updated as the plan progressed. In addition, the subarea inventory reports were posted as they became available. All public meetings were advertised in the Forsyth County News, County web site and the County Administration Building. Public hearings were held in October and November, 2003. The public hearings were advertised in accordance with the standard notification procedures.
The formation the community vision and goals was the result of a very extensive public involvement program. The County was divided into ten subareas, with individual committees established to develop specific land use policies and a future land use map for their subarea. Each subarea advisory committee met at least twice over a four-month period (April-July 2003), with the exception of the Etowah subarea committee. The Etowah subarea had been the focus of its own planning effort several years earlier. Only one meeting was held in the Etowah subarea during the four-month planning period to update the findings of the previous planning effort. On August 14, 2003, an open house was held to present the findings of the ten subarea committees and to take public comment. Individual subarea plans were developed summarizing the existing demographics and land use characteristics of each subarea. At the first set of meetings for the subareas, a summary of the document was presented to the subarea committee and the general public. Maps of the existing land use, natural and cultural resources, planned transportation improvements, and a trend scenario map were displayed. The meeting participants were asked to create a list of the strengths, weaknesses and opportunities of the subarea. At the second set of meetings, a draft of the subarea land use map and vision were reviewed and the committee members addressed all public comments.
A twenty-five member Countywide Land Use Steering Committee was formed. The Board of Commissioners appointed fifteen members, and the ten subarea committees each selected one representative. The committee formally met twice following the open house in August 2003 to develop a countywide vision, land use goals and policies.

FORSYTH COUNTY COMPREHENSIVE PLAN FORSYTH COUNTY COMPREHENSIVE PLAN

FORSYTH COUNTY COMPREHENSIVE PLAN
Appendix B
GREENSPACE PLAN

THE GEORGIA GREENSPACE PROGRAM
FORSYTH COUNTY GRANT APPLICATION
COMMUNITY PROGRAM REPORT
NOVEMBER 2000

EXECUTIVE SUMMARY
FORSYTH COUNTY GREENSPACE VISION Forsyth County is the fastest growing county in the State of Georgia. The present population of approximately 97,000 is expected to grow to over 290,000 by the year 2015. As such, the Forsyth County Board of Commissioners is taking the necessary steps to provide a wide range of both active and passive recreation opportunities for residents of all ages and for visitors to the county. Active participation in the Georgia Greenspace Program is a significant step toward achieving this vision. Two significant studies address county wide active and passive recreation needs. The Forsyth County Comprehensive Plan 1994 – 2015 includes several provisions for greenspace protection. In addition, the recently completed Comprehensive System-Wide Recreation Master Plan 2000 – 2006 determines the need for existing and future recreation acreage and facilities and advances recommendations for land acquisition, improvements to existing recreation sites, development of new recreation sites, greenways, trails and bikeways. GROWTH TRENDS The southern portion of Forsyth County is the most rapidly growing area of the county, with areas adjacent to Lake Lanier being among the most densely populated portions of the county. The northern portion of the county is more rural in character and offers the greatest opportunity for greenspace protection. EXISTING GREENSPACE Within the county there are presently 10,781 acres of permanent and non-permanently protected greenspace, including Federal, State, county land and lands owned by private individuals. VISION FOR THE FUTURE It is the goal of the Forsyth County Board of to provide a wide range of recreation opportunities. Specifically, the permanent protection of greenspace is a primary objective of this overall goal and the county is committed to demonstrating continuous progress toward meeting the Georgia Greenspace Program goal of permanently protecting 20 percent of its land area.
2

INTRODUCTION
DESCRIPTION OF THE FORSYTH COUNTY GREENSPACE PROGRAM The Forsyth County Greenspace Program has already begun. On July 20, 2000, the county formally acquired a portion of the Sawnee Mountain property, consisting of 174.1 acres and located north of the City of Cumming. This, and additional Sawnee Mountain property to be acquired is addressed in the Comprehensive System-Wide Recreation Master Plan and is to be utilized in its entirety as a passive use park. In 1999, the Forsyth County Board of Commissioners adopted an update of the Land Use Element of the Comprehensive Plan. Seven of the eleven stated goals and implementation strategies address the conservation and protection of greenspace. It is the intention of the county to continue to identify lands that can be properly and formally protected as greenspace, and to make acquisition where feasible, or to implement other methods of permanently protecting these lands using conservation easements or similar means of accomplishing these ends. GREENSPACE PROGRAM POINT OF CONTACT The Forsyth County Greenspace Program will be a combined effort between the Forsyth County Planning & Development Department and the Forsyth County Parks and Recreation Department. The formal point of contact will be: Jeff Watkins, Director Forsyth County Planning & Development Department 110 E. Main Street Suite 100 Cumming, Georgia 30040 Phone (770) 781-2115 Fax (770) 781-2197 E-Mail [email protected]
COUNTY DESCRIPTION
DISCUSSION OF COUNTY-WIDE GROWTH PATTERNS Forsyth County is a rapidly suburbanizing county located in Northeast Georgia. Forsyth County is presently the fastest growing county in the State of Georgia. The county is contained within the Atlanta Metropolitan Statistical Area (MSA) and consists of approximately 156,864 gross acres, of which approximately 12 percent (12,936 acres) being under water. The base acreage for calculating available greenspace is 143,928 acres (Georgia Department of Natural Resources, 2000). The City of Cumming is the only incorporated area in Forsyth County.
3

The 1998 census estimate places the Forsyth County population at 86,130. It is estimated that the 2000 population is 96,500. The 1998 census estimate for the City of Cumming is 5,132, or six percent of the Forsyth County population. Forsyth County is dissected into northern and southern sections by State Route 20 and into eastern and western sections by Georgia 400. The southern section, which abuts the City of Alpharetta and North Fulton County is the most rapidly developing section of the county. The eastern section, which abuts Lake Lanier, is the most densely developed section of the county. Forsyth County is rapidly rezoning and developing agricultural and undeveloped land. As a “bedroom community,” most of the available land is being developed as single-family residences, particularly in the northern and eastern sections of the county. The southern portion of Forsyth County is experiencing a mix of commercial, industrial and residential growth. OVERVIEW OF POPULATION FORECASTS The Comprehensive Plan for Forsyth County, Georgia (1994 – 2015) includes a Basic Population Element. Within this element, population is forecast through the year 2015. The projections show a year 2000 population of 110,769, a year 2005 population of 160,269, a year 2010 population of 221,102 and a year 2015 population of 290,436. The U.S. Census estimates that the population of Forsyth County as of July 1999 was 96,686. Based upon the U.S. Census estimate, the Forsyth County population has increased 119 percent since 1990. RECREATIONAL LAND USE According to the Update of the Land Use Element of the Forsyth County Comprehensive Plan, approximately 7,274 acres, or 5.29 percent of the county land area is occupied by park, recreation and conservation lands. This acreage includes both active and passive recreation facilities owned and operated by Forsyth County, the Federal government and the U. S. Army Corps of Engineers.
GREENSPACE GOAL
LONG-RANGE VISION It is a desire of Forsyth County to attain the goal of permanently protecting at least 20 percent of the net base acreage land area as greenspace over the coming 20-year time frame. To accomplish this long-range goal will require the protection of 28,786 acres, or approximately 45 square miles. The Update of the Land Use Element of the Forsyth County Comprehensive Plan envisions approximately 10,750 acres of park, recreation and conservation land by the year 2020. This total includes the protected portion of the Chattahoochee River, stream buffers, the Sawnee Mountain conservation zone and existing parks, but
4

does not address greenspace protection that could result from conservation easements, conservation subdivisions, utility easements, greenways, bikeway development, agricultural land, steep slopes, scenic viewsheds, historic/archeological sites and other categories of land that might be protected. The Forsyth County Board of Commissioners realizes that the Comprehensive Plan presently does not reflect the protection of 28,786 acres, and that when the update is completed, the Comprehensive Plan will be reconciled to meet this goal. SHORT-RANGE GOALS As approval of the Forsyth County Greenspace Program encompasses a two- year period, after which the Community Program will be updated, short-range attainable goals are established for greenspace protection. During the coming two years Forsyth County will endeavor to:
• Acquire additional land at Sawnee Mountain • Acquire land for a passive park in the Windermere development • Negotiate with Windermere to obtain conservation easements
for additional permanent open space
• Partner with other large-scale residential land developments to obtain conservation easements
• Develop pedestrian trails linking recreation sites that will eventually result in a regional trail system
• Add additional passive use facilities to Poole’s Mill Park • Acquire land in the southern portion of the county for a new
community park, including passive use areas
• Lease/acquire Beaver Ruin and/or Mary Alice Park from the Corps of Engineers to provide additional passive use Opportunities
PROPOSED METHODS OF IMPLEMENTATION At this time it is anticipated that the primary means of implementing the immediate (short-range) goals of the Forsyth County Greenspace Program will be by fee simple acquisition, conservation easement, conservation subdivisions, partnering with the development community and local businesses, leveraging greenspace program funding to secure additional grants for conservation and passive use facilities development and establishing a Transferable Development
5

Rights (TDR) program. Additional implementation tools that could be utilized to accomplish the long-range (20 year) vision are discussed in the ten-year strategy section of this report.
COMPREHENSIVE PLANNING AND THE GEORGIA GREENSPACE PROGRAM
THE FORSYTH COUNTY COMPREHENSIVE PLAN The most recent edition of the Forsyth County Comprehensive Plan (1994-2015) on file with the Department of Community Affairs makes several provisions for greenspace. In 1999, the Forsyth County Board of Commissioners adopted an Update of the Land Use Element from the county’s Comprehensive Plan. Among the eleven county goals and implementation strategies identified in the Land Use Element, seven apply to the conservation and protection of greenspace. Goals addressing greenspace include: Goal #1 Encourage public/private partnerships Goal #2 Develop strategies for citizen involvement Goal #3 Provide efficient, equitable and compatible land use in harmony with private property rights by, among other strategies, encouraging creative and flexible site design to accommodate site-specific conditions Goal #4 Encourage and develop patterns and practices that strengthen a sense of community Goal #7 Create a system of public recreation and cultural spaces, recognizing the need for passive recreation space Goal #8 Encourage conservation, preservation or redevelopment of buildings, neighborhoods or areas of historical, architectural or cultural significance, by, among other strategies, appointing a Natural Resource Conservation Commission Goal #9 Protect and preserve the beauty and integrity of natural features, i.e. trees, slopes, streams and lakes through the following strategies:
- Purchase and reserve the Chattahoochee River and Etowah River corridors and reserve them as a protected greenbelt area
- Educate the public and promote the use of Best
6

Management Practices
- Establish regulations and ordinances to protect and encourage the preservation of trees and vegetative cover
- Designate scenic roadway corridors
The Forsyth County Comprehensive Plan includes the Georgia Department of Natural Resources’ (DNR) Environmental Planning Criteria (Part V Criteria). Protective policies/plans have been included in the Comprehensive Plan for wetlands, significant groundwater recharge areas, water supply watersheds and the Etowah River. Moreover, the Part V Criteria have been adopted as overlay districts in the Unified Development Code, the county’s zoning and subdivision regulations. The Future Land Use Map designates several areas around the county as “Conservation” and “Park”. These areas total 10,755 acres. Potential park/conservation districts included in this total are: Sawnee Mountain, Corps of Engineers properties adjacent to Lake Lanier, existing parks, buffer areas adjacent to the Chattahoochee River and its tributaries, the Etowah River, and streams within the Big Creek watershed. The Forsyth County Comprehensive Plan requires its ten-year update to be completed by February 2004. It is recognized that the principal conflict between the current Comprehensive Plan and the Georgia Greenspace Program is that the number of acres identified as conservation and parks falls short of the greenspace goal. In early 2001, county staff will commence the updating process and incorporate the adopted County Greenspace Program and the Comprehensive System-Wide Recreation Master Plan as elements in the county’s revised Comprehensive Plan. The update process will also result in the identification of a minimum of 28,786 acres for permanent protection as greenspace, thus reconciling the present difference between the Comprehensive Plan and Georgia Greenspace Program goals. Land presently designated as conservation and parks on the current Future Land Use map will retain this designation when the update is completed. The acquisition and preservation of greenspace will also be included in existing and relevant elements of the Comprehensive Plan, including but not limited to the Natural Resources element, the Short-Term Work Program (STWP) and Capital Improvements Element (CIE).
7

THE COMPREHENSIVE SYSTEM-WIDE RECREATION MASTER PLAN The Comprehensive System-Wide Recreation Master Plan (2000-2006), prepared in 2000 includes an inventory of all active and passive recreation land (249 acres active, 12 acres passive); forecasts present and future recreation acreage and facilities needs; develops goals and measurable objectives; advances recommendations for land acquisition, improvements to existing recreation sites, development of new recreation sites, greenways, trails and bikeways; and includes a financing and implementation section complete with a capital improvements program. The Plan identifies a need for a minimum of 536 new acres of active/passive recreation land by the year 2006, exclusive of greenways, trails and bikeways. Among the goals and objectives directly applicable to greenspace conservation and protection are the following:
- Advance acquisition of land shall be a priority
- Provide adequate geographic coverage and accessibility of active/passive recreation sites for all residents of the county
- Broaden the range of recreation opportunities by
provision of both active and passive recreation facilities
- Provide additional passive use facilities including
bikeways, nature trails, interpretive areas and greenways
- Develop “partnering” agreements with large corporations, industries and the YMCA as a means of providing more recreation opportunities for county residents
The System-Wide Recreation Master Plan was completed prior to the Georgia Greenspace Program and therefore the projected future recreation acreage does not include formally protected greenspace. During the process of updating the Comprehensive Plan the Recreation Element will include recommendations for greenspace that will reconcile these deficits. The Plan specifically recommends that a formal Greenway/Bikeway Plan be prepared and recommends development of greenways along the Chattahoochee River and Etowah River corridors. Three bikeways are recommended (S.R. 369, S.R. 9 and S.R. 20). These bikeways will provide physical linkages between
8

several recreation sites throughout the county. The total acreage to be devoted to greenways and bikeways will be determined when this Plan is developed. PLAN AMENDMENTS AFFECTING GREENSPACE There has only been one major amendment to the Comprehensive Plan affecting Forsyth County greenspace. This amendment in 1999 incorporated the Update of the Land Use Element from the Forsyth County Comprehensive Plan as part of the Comprehensive Plan. The provisions directly affecting greenspace include the seven goals described in a previous part of this section. CONSISTENCY WITH THE GEORGIA GREENSPACE PROGRAM Both the Forsyth County Comprehensive Plan and the Comprehensive System-Wide Recreation Master Plan are highly supportive of the Georgia Greenspace Program in numerous respects. The consensus visions of both plans address the need for greenspace and provide specifically for passive recreation opportunities, the conservation of open space and the development of greenways, trails and bikeways. Each plan envisions the acquisition of passive use lands and provides estimates of quantities and costs of land to be acquired and each contains a detailed capital improvements program addressing passive use, among other recreation improvements.
EXISTING CONDITIONS
UNPROTECTED PUBLIC LANDS While there are several tracts of unprotected public land within Forsyth County, there presently exist two areas of unprotected publicly owned land for which Forsyth County is currently actively seeking greenspace protection status. These examples are described below. Description Sawnee Mountain ridge consists of 1166 acres of land that is presently in an undeveloped condition. Forsyth County has recently acquired 174.1 acres of this property for permanent protection as greenspace. The Comprehensive System-Wide Recreation Master Plan proposes development of this property as a passive use recreation area, to contain trails and interpretive areas and placing it under conservation easement. It is anticipated that under the Georgia Greenspace Program the balance of Sawnee Mountain Ridge will be acquired and protected in a similar fashion. When this is completed, all 1166 acres will meet the goals of the Georgia Greenspace Program.
9

10

The second tract of publicly owned land is within the Windermere multi-use development. The primary tract for which Forsyth County desires to protect as greenspace is an 87-acre parcel that is being donated to the County. It is the intent of the County to utilize approximately 20 +/- acres as a soccer complex, with the remaining acreage being devoted to permanent greenspace. A concept plan has been prepared for this site that includes portions of a regional greenway, multi-purpose trails, open grassed recreation areas, picnic areas and an environmental education opportunity (possibly a constructed wetland). The passive portion of this land will be placed under conservation easement. Preservation Measures The accompanying exhibit titled “Potential Unprotected Public Land Acquisitions” depicts both of the above-mentioned properties. The Sawnee Mountain Ridge property will be acquired by fee simple purchase. Forsyth County has four million dollars set aside for purchase of Sawnee Mountain Ridge properties. The Windermere tract will be acquired by donation. The developer has agreed in principal to consummate this donation prior to the end of the present calendar year. PROTECTED LANDS Within Forsyth County there presently exist protected lands that meet the DNR definition of greenspace. There is permanently protected greenspace within the county that is currently owned by Federal (Corps of Engineers and National Park Service) or State (Heritage Lands) agencies. Forsyth County and private individuals possess greenspace lands that presently are not permanently protected, but are protected by other means such as fee-simple purchase and by implementation of ordinances and regulatory measures designed to protect significant natural resources. Description Lands within Forsyth County that meet the definition of greenspace and that are protected by a public or private entity include: Lake Lanier recreation sites owned by the U.S. Army Corps of Engineers, the Chattahoochee River National Recreation Area just south of Buford Dam owned by the National Park Service, the State Heritage Preserve on Big Creek, Poole’s Mill Park (owned by Forsyth County), land in private ownership within river and stream corridors protected by State and County buffers and setback requirements, Part V Criteria or as State waters. Lands owned by Forsyth County and in private ownership do not presently meet the definition of “permanent protection” at this time. Forsyth County is aware that in the future, as part of participating in the Georgia Greenspace Program formal methods of legal protection must be implemented.
11

The accompanying exhibits titled “Existing Protection Areas By Ownership Type” and “Ownership Agreement” illustrate these lands. The Table that follows (Table 1) depicts the total acreage occupied by lands either presently permanently protected or protected by regulatory measures.
TABLE 1 GREENSPACE PROTECTED
BY PUBLIC OR PRIVATE ENTITY
GREENSPACE OWNERSHIP FORSYTH COUNTY ACREAGE Forsyth County 12.05 U.S. Army Corps of Engineers 4722.11 National Park Service 240.45 State of Georgia (Heritage Preserves) 35.00 State of Georgia (Adjacent To Fish Hatchery) 53.04 Private Lands* 5719.02
TOTAL 10781.67 *Includes all lands in private ownership that are protected by buffer and setback ordinances and regulations, Part V Criteria or by regulations protecting State waters. The “Private Lands” included in Table 1 consist of existing protected greenspace within Forsyth County that is in fee-simple ownership, conservation easements and in agreements that require no net loss of comparable greenspace. The accompanying exhibit titled “Existing Protection Areas By Ownership Agreement” depicts these lands. Of the total of 5062.65 acres in government ownership, 5027.65 acres are available for public access.
TEN YEAR STRATEGY TO ACHIEVE GREENSPACE GOALS
STRATEGIC INITIATIVES To facilitate successful implementation of the Forsyth County Greenspace Program several strategic initiatives are identified to guide the decision-making process. These initiatives address specific elements of the county’s greenspace protection program, and will form the foundation for both the short-range and long-range greenspace acquisition program. Five initiatives are identified as follows:
• Advance acquisition of greenspace land will be a priority in light of rising land costs and developmental pressures
• Greenspace located in areas possessing critical natural
resources such as river corridors, conservation zones or where passive uses can be provided to serve a large segment of the population will receive high priority for
12

13

14

acquisition
• Forsyth County will coordinate greenspace protection with
Federal and State agencies and with local “partners”.
• Greenways, trails and bikeways will be a key element in the Greenspace Program as a means of providing important linkages between county recreation sites and facilities
• The continued use of ordinances, land use policies and
regulatory measures as a means of protecting greenspace will be a key implementation tool of the Greenspace Program
APPROACH TO PROTECTING GREENSPACE It is the intention of Forsyth County to implement the program of greenspace protection contained in this Community Program. Using any or all of the methods outlined in this section, the County will endeavor to continue the policy of permanently protecting greenspace. This section of the Community Program identifies potential greenspace and includes estimates of the amount of land to be protected by type. Existing Forsyth County Greenspace The accompanying exhibits titled “Existing Land Use” from the Forsyth County Comprehensive Plan and “Figure 1 Existing Recreation Sites “ from the Comprehensive System-Wide Recreation Master Plan depict existing recreation and open space within Forsyth County. The existing land use map illustrates the location and extent of park, recreation and conservation land. Geographically, these lands are predominantly located in northern Forsyth County, adjacent to Lake Lanier and to a lesser degree in the extreme southern portion of the County. This map contains Federal and State owned recreation land that is permanently protected. The acreage of these permanently protected Federal and State lands is contained in Table 1. The map of existing recreation sites illustrates the location of all land presently used for both active and passive recreation, including school recreation areas. It is recognized that not all of this land meets the definition of greenspace; however this map is included to illustrate that Forsyth County has taken the step to prepare a system-wide recreation plan to address recreation needs of its residents. While several County parks contain greenspace, Poole’s Mill Park is the only park completely devoted to passive use opportunities.
15

16

17

Lands Possessing Acquisition Potential To determine the location of potential greenspace to be protected under the Georgia Greenspace Program, information contained in the County’s future land use plan, in the recreation master plan recommendations and from an inventory of other potential greenspace acquisition areas were used to target the range of land types from which greenspace can be identified for permanent protection. The accompanying exhibit titled “Generalized Future Land Use (1994 – 2015) illustrates parks, greenway corridors, river and stream buffers and conservation areas. Similarly the accompanying exhibit titled “Recreation Master Plan” depicts the general location of proposed new recreation sites, including passive use parks. The lands designated on each of these maps fall short of the 20 percent greenspace protection goal. Once the Comprehensive Plan is updated, the Georgia Greenspace Program goals will be incorporated, resulting in the identification of at least 28,786 acres to be protected as greenspace. The accompanying map titled “Potential Greenspace Acquisition Areas” portrays the location and extent of steep slopes (4,979 acres), wetlands (2,640 acres), agriculturally zoned land (6,226 acres) and floodplain (9,632 acres), a total of 23,477 acres of potential greenspace. This land, in conjunction with passive parks, greenways, bikeways, private land to be placed under conservation easement and Federal and State land presently under permanent protection will exceed the 28,786 acres that is the Greenspace Program goal for Forsyth County. Acquisition Goals By Land Type The following Table (Table 2) depicts Forsyth County’s targeted acquisition strategy by land type. For each type of land depicted on the foregoing maps, the Table includes the type of land and the approximate percentage of the total goal for greenspace that could be derived from each land type.
TABLE 2 TARGETED ACQUISITION STRATEGY
LAND TYPE TARGET PERCENTAGE
Passive Use Parks 5% (1439 ac.) Greenways 2% (576 ac.) Bikeways .5% (150 ac.) Private Developments 5% (1,439 ac.) Corps of Engineers Sites 16% (4,722 ac.) Steep Slopes 17% (4,979 ac.) Wetlands 9% (2,640 ac.) Agricultural Land 12.5% (3,209 ac.) Floodplains 33% (9,632 ac.)
TOTAL 100.0% (28,786 AC.)
18

19

20

21

ORDINANCES AND POLICIES FOR GREENSPACE PROTECTION In May 2000 Forsyth County adopted the Unified Development Code (UDC) (Ordinance #87), the county’s new zoning and subdivision regulations. Contained within the new ordinance are provisions for Conservation Subdivisions (Chapter 19) and DNR’s Environmental Planning Criteria (Chapter 21). The Georgia Planning Association recently awarded the UDC the “Outstanding Plan Implementation” award. The intent of the Conservation Subdivision regulations is “… to provide for residential subdivisions that are designed based first and foremost on the provision and preservation of open space …(UDC, Chapter 19). Each conservation subdivision is required to set aside 40 percent of its total land area as open space. The minimum amount of open space required in a conservation subdivision is 15 contiguous acres. This open space, set aside as permanent, undivided open space, is then classified as “primary conservation areas” and “secondary conservation areas”. Primary conservation areas include habitats for threatened or endangered species; wetlands; flood plains; shorelines; and adjacent riparian zones or upland buffers; historic, cultural and archaeological sites; and steep mountain slopes. Secondary conservation areas include prime farmlands or open meadows; tree coverage areas and mature woodlands; aquifer recharge areas; steep slopes; scenic views and sites; and designed and newly created open spaces such as neighborhood commons and village greens. Active recreational facilities are prohibited from primary conservation areas, and no more than 25 percent of the required open space may be utilized for active recreation purposes. DNR’s Environmental Planning Criteria for water supply watersheds, groundwater recharge areas, wetlands and the Etowah River (a protected river) have been adopted as overlay districts in the UDC (Chapter 21). These regulations, where applicable, specify permitted uses, minimum lot sizes, protective buffers and increased building setbacks within each of the environmental overlay districts. Other Forsyth County ordinances and regulations currently in place relating to the protection of greenspace include the following:
• Big Creek Flood Plain Ordinance (Ordinance #7) Prohibits The erection of buildings and structures and regulates land Disturbance within the regulated floodplain of Big Creek
• Environmental Review Ordinance (Ordinance #9) Establishes
an ad hoc Environmental Review Committee and charges it with the responsibility for reviewing any proposed land use, project, development or rezoning that may have significant impact on the environment
22

• Tributary Protection Code (Ordinance #14) Establishes a 35
foot undisturbed protective buffer on either side of any stream south of Buford Dam that drains into the Chattahoochee River. The 35 foot protected area also includes lakes and wetlands south of Buford Dam, the waters of which drain into the Chattahoochee River
• Soil Erosion and Sediment Control Ordinance (Ordinance #73
Requires Best Management Practices (BMP’s), as contained in the “Manual for Erosion and Sediment Control in Georgia” be followed for all land-disturbing activities. This ordinance establishes a 25 foot undisturbed protective buffer on all State waters and a 100 foot undisturbed protective buffer on all trout streams
• Tree Preservation and Replacement Ordinance (Ordinance #81)
Requires the maintenance of 15 tree units per acre; prohibits the removal of specimen trees and historic landmark trees without permission from the County Arborist; and establishes standards for the preservation and replacement of trees within the county
Forsyth County recognizes that while these ordinances and regulations are an initial step in protection of greenspace, they do not in, and of themselves provide permanent protection. FUTURE METHODS OF PROTECTING GREENSPACE Additional tools that Forsyth County may use to preserve greenspace as part of the Greenspace Program include the following:
• Acquiring new land in fee simple ownership and formally placing it under permanent legal protection
• Acquiring conservation easements on privately owned land
• Placing conservation easements on conservation, preservation
and recreational lands which do not currently qualify as permanently protected
• Entering into contractual agreements to insure that, if the protected status is discontinued, such land will be replaced by other greenspace of equal or greater monetary and resource protection value
23

• Creating a restrictive covenant in favor of a Federal governmental entity
• Authorizing special-purpose local option sales taxes to fund greenspace protection
• Establishing a stormwater utility to help fund the acquisition of greenspace for permanent protection
• Identifying opportunities to receive gifts of land in fee-simple or of conservation easements
• Identifying Federal, State or private sources of funds which can be used to protect greenspace within the local jurisdiction
• Incorporating the Greenspace Program into the Forsyth County Comprehensive Plan
• Further enacting performance-based zoning, such as conservation zoning, to supplement prescriptive zoning
• Further providing for environmental overlay zones within the county’s existing zoning and subdivision regulations
• Establishing a Transferable Development Rights (TDR) program
• Amending the county’s subdivision regulations to specify the
protection of steep slopes, wetlands, or flood plains and to encourage setting aside recreational greenspace in neighborhoods
• Providing for inter- or intra-jurisdictional linkages of greenspace • Using any other method that ensures that greenspace will remain
forever in uses which further the goals of the Georgia Greenspace Program
BARRIERS TO ACHIEVING GREENSPACE PROTECTION GOALS There are several barriers to achieving greenspace goals that will be evident as Forsyth County moves to implement the Greenspace Program. These include issues of a legal or structural nature (including reconciliation of the Comprehensive Plan with Greenspace Program goals), monetary issues and issues of ownership.
24

Legal/Structural Issues The formal adoption of any amendments proposed to the Forsyth County Comprehensive Plan, to the Unified Development Code or creation of new ordinances that will promote greenspace protection is not assured. The Forsyth County Board of Commissioners will endeavor to incorporate all Greenspace Program goals in the forthcoming update of the Comprehensive Plan. Amendments to these documents require recommendation by the Planning Commission and adoption at a public hearing by the Forsyth County Board of Commissioners. As the county is supportive of the Georgia Greenspace Program and has already enacted several similar measures, it is assumed that the majority of pro-active greenspace measures will receive approval. There is also a need for a formal means of achieving permanent legal protection of greenspace land Statewide, so that local governments have the authority to enact protection measures. To accomplish this, the Georgia General Assembly may have to enact legislation to facilitate this process. Fiscal Issues The rising cost of land, particularly in the southern section of Forsyth County could constrain land acquisition. In recent years, the Forsyth County Board of Commissioners has recognized the need to acquire land for provision of recreation opportunities. Other Issues The legal rights of existing property owners, the complexity of implementing conservation easements and the rapid development of land within the county are other issues that might become barriers. Mitigation Measures Legal and structural barriers are being mitigated at present by the adoption of several of the greenspace related ordinances discussed in a previous section of this report. The adoption of amendments, future ordinances and regulations to protect greenspace can be facilitated at the local level through an educational process. Holding public informational meetings to review the benefits of proposed regulatory measures prior to the required public hearing can help gain support for their adoption. The barrier presented by the Comprehensive Plan not accurately reflecting the goal of 20 percent protected greenspace can be overcome during the updating process by identifying a minimum of 28,786 acres for protection as greenspace, thus reconciling current differences between the present Comprehensive Plan and Greenspace Program goals.
25

In addition, the identification of permanent protection measures at both the State and local levels will assist in mitigation of greenspace protection barriers. Monetary issues can be mitigated in part through the use of greenspace funds to leverage other Federal and State grant programs that support greenspace protection. In addition, the Forsyth County Planning & Development Department and the County’s Recreation Consultant actively pursue grant funds for land acquisition and for the provision of both active and passive recreation opportunities. Issues relating to implementation of conservation easements can also be addressed through a process of educating county residents as to the benefits that will accrue and the enhancement of the quality of life that will occur as result of these measures. It is also possible that in the future, the Georgia General Assembly might have to enact legislation to provide local governments with the authority to permanently protect land. The trend of rapid development can only be mitigated through the comprehensive planning process and implementation of appropriate land use control measures.
SOURCE AND USE OF FUNDS
DESCRIPTION OF ALL POTENTIAL FUNDING MECHANISMS There are a wide range of funding opportunities at the Federal, State and local level applicable to the protection of greenspace. The following is a brief description of the programs affording the greatest opportunities for Forsyth County. Federal The Land and Water Conservation Fund (L&WCF) was created in 1965 and is presently the principal source of Federal funds for park and open space land acquisition and development. Annual funding levels vary greatly from year to year, and in the year 2000, the State of Georgia received less than $900,000, all of which was earmarked for land acquisition. When funding is available, the L&WCF State grant program matches up to 50 percent of project costs, with the remainder funded by the project applicant. The Conservation and Reinvestment Act of 1999 (CARA) has been passed by Congress, but is yet to be funded. It is estimated that funding might be available for fiscal year 2002. This Act will provide funding for land acquisition related to preservation and conservation projects. It is anticipated that if fully funded, CARA will result in approximately $30 million per year to the State of Georgia. The Intermodal Surface Transportation Efficiency Act of 1991 (ISTEA), recently re-authorized as TEA-21 funds transportation enhancement activities and
26

alternative methods of pedestrian movement, including greenways, bikeways and trails. Funding is available for the acquisition and development of greenways, bikeways and pedestrian trails, provided that proposed projects can emphasize the alternative transportation potential of these type of facilities, and not solely their recreation value. TEA-21 provides approximately 80 percent of project planning, design and development funding, with the remaining 20 percent funded by the applicant. State The Local Development Fund (LDF), administered by the Department of Community Affairs provides 50% matching grants that can be used for enhancement activities, including development of recreation sites. The maximum grant award is $10,000, and funding cycles are approximately every six months. Typically, about 35% of grant applications are successful. These funds would have applicability for additional development at recreation sites, or planning or development of new recreation sites. The Recreation Assistance Fund is administered by the Department of Natural Resources and provides matching grants in the range of $8,000 to $10,000. Future Recreation Assistance Fund grants could be used for land acquisition or facilities development. The Line Item Appropriation is funded through the Department of Community Affairs and is applicable to improvements to existing recreation facilities. In FY 1999 there was approximately eight million dollars appropriated in this program. Projects must first be identified by the local legislative delegation, and approved by leadership of the State House and Senate before being submitted to the Governor's staff for approval. The Georgia Greenspace Program establishes a framework for preserving community greenspace within developed and rapidly developing counties and their municipalities. This program designates funds for the acquisition of land contributing to the conservation of land that can be used for informal recreation and natural resource protection. To qualify, a local government must formally adopt a program to protect 20 percent of its land area. Eligible municipalities can receive a share of county funds based upon its proportion of county population. The Chattowah Open Land Trust is a non-profit organization based in Alpharetta that is dedicated to preservation of natural, historic and archaeological open spaces in North Georgia. The Trust has assisted in the preservation of over 400 acres of land to date. The Trust For Public Land (TPL), Southeast Region is currently working to protect the Chattahoochee River and has launched a campaign for natural lands and open space protection stretching from Helen to Columbus (180 river miles).
27

The TPL is actively working with Forsyth County to assist in the protection of open space. The Nature Conservancy of Georgia has as its mission the protection of the State’s diversity of flora and fauna. The Nature Conservancy presently owns and manages 14 preserves and has assisted in protecting over 157,000 acres of habitat in Georgia. Additional greenspace and conservation related programs of a governmental or private sector nature that might have applicability to the Forsyth County Greenspace Program include the following listed by sponsor:
• USDA – Forest Service: Forest Legacy Program
• USDA – Natural Resources Conservation Service: Forestry Incentives Program, Environmental Quality Incentives Program, Wetland Reserve Program and Wildlife Habitat Incentives Program
• Georgia Forestry Commission: Georgia Reforestation to
Enhance Environmental Needs (G.R.E.E.N.) and the Urban & Community Forestry Grant Assistance Program
• U.S. Fish and Wildlife Service: Partners for Fish and Wildlife
• Commodity Credit Corporation: Conservation Reserve Program
• North American Wetlands Conservation Council: Wetland
Conservation Small Grants Program
• U. S. Environmental Protection Agency: Sustainable Development Challenge Grant Program
METHODS OF FUNDING GREENSPACE PLANNING Forsyth County will utilize the aforementioned programs where applicable, and in addition may utilize the following funding mechanisms at the local level:
• Special Purpose Local Option Sales Taxes (SPLOST)
• General Funds
• General Obligation Bond Funds
• Impact Fees
28

• Public/Private Partnerships
• Donations IMPROVEMENTS, OPERATIONS AND MAINTENANCE AND RELATED LAND STEWARDSHIP ACTIVITIES Any necessary improvements, operations and maintenance costs and other stewardship activities related to the Forsyth County Greenspace Program will be funded from one, or more of the aforementioned funding sources. Forsyth County will use its general funds to finance the planning costs for its Greenspace Program.
APPENDICES
CERTIFIED RESOLUTION(S) The attached, certified resolution(s) are made a part of this Forsyth County Community Program:
• Resolution Adopted by the Forsyth County Board of Commissioners
This Resolution establishes a Community Greenspace Trust Fund and identifies the individual authorized to sign grant awards. ALLOCATION OF FUNDS The entirety of greenspace grant funds will be allocated to Forsyth County.
29

SUMMARY OF FORSYTH COUNTY GREENSPACE PUBLIC HEARING On July 24, 2000, the Forsyth County Board of Commissioners held a public hearing to secure input to developing the County’s Community Program for greenspace. Approximately fourteen individuals were in attendance including Mr. Tommy Irvin, the Georgia Commissioner of Agriculture and Gail Hankinson, representing the Department of Natural Resources. Initially, an overview of the Georgia Greenspace Program was presented by the County’s Consultant, followed by an open microphone forum whereby those in attendance had the opportunity to speak. The following is a summary of comments made and suggestions received by those in attendance:
• A question was raised in reference to how the extensive buffer adjacent to Lake Lanier would be accounted for in the Greenspace Program. The DNR representative responded that the final rules regarding treatment of the lake buffer and Corps of Engineers land had not been established as yet.
• Several individuals and Commission members asked
questions about the specific type of lands that will count towards the 20 percent greenspace goal. These questions were responded to by the County’s Consultant and by the DNR representative.
• An individual asked for a clarification of the 20 percent
goal. It was explained that each County participating in the program is to make a “good faith” effort to reach this goal, but DNR realizes that it might not be possible to attain in every County.
• A Commissioner asked if trails counted toward the goal.
The response indicated that multi-purpose trails and other passive use trails will count toward the 20 percent goal.
• Another Commissioner asked if counties could opt out
of the Greenspace Program and was told that the program is not mandatory.
• An individual inquired as to the possibility of counting existing
park acreage toward the goal. It was explained that only passive use parks and passive use portions of existing parks will count.

• An individual requested an explanation of the conservation
subdivision ordinance recently passed by Forsyth County. A detailed summary was provided by the Director of Planning & Development.
• A question was raised as to the amount of funding that
Forsyth County would receive under the Greenspace Program and was told that the initial year’s funding would be $811,000.
It was also mentioned that these monies could be leveraged to secure other grants for protecting greenspace. The public hearing closed with a statement of support from the Board of Commissioners. A copy of the list of those attending the public hearing is attached.

FORSYTH COUNTY COMPREHENSIVE PLAN
SEWER SYSTEM MASTER PLAN
Appendix C

FORSYTH COUNTY COMPREHENSIVE PLAN
SEWER SYSTEM MASTER PLAN
Appendix C

Executive Summary
The Forsyth County Board of Commissioners retained Jordan, Jones & Goulding, Inc. (JJG) to prepare a Sewer System Master Plan (Plan) for the Forsyth County Sewer Service Area. This Plan presents alternatives and outlines a recommended strategy for the extension and development of the Forsyth County wastewater collection and treatment system.
The Sewer System Master Plan has been developed in close coordination with the staff of the Forsyth County Water & Sewer Department and the Board of Commissioners. The Plan is composed of the following elements:
• Population and wastewater flow projections through planning year 2025 • Evaluation of the collection system and treatment options for planning year 2025 • Development and evaluation of alternatives • Recommendations
Population projections through the planning year 2025 were developed from projections made by Street Smarts, who prepared the projections for the Forsyth County Transportation Master Plan. These projections provided the basis for calculating wastewater flows in the Forsyth County Sewer Service Area (Sewer Service Area). Future population and wastewater flows were estimated for each of the county’s five major drainage basins, including Big Creek, Chattahoochee River, Etowah River, Lake Lanier, and Settingdown Creek. Sewer models were developed to assess options for providing wastewater collection within the Sewer Service Area through planning year 2025. One to three options were developed for each of the major drainage basins. Alternatives were then developed for the entire service area by combining various options specific to each basin. A total of 54 alternatives were developed, which were screened to 18 alternatives for further evaluation. These 18 alternatives were evaluated and ranked using weighted criteria, both economic and non-economic, that were established in consultation with the Forsyth County Water & Sewer Department. Based on this evaluation, Alternative 10 is the recommended plan for providing wastewater service to Forsyth County through the planning period. This plan includes the following elements and is presented graphically in Figure 7.1 on page 7-3:
• Gravity sewer through the Upper Big Creek Basin, and a pump station located at MacFarland Road at Big Creek in the Lower Big Creek Basin. The flows from both of these basins are conveyed to the Fowler Water Reclamation Facility (WRF) for treatment. The Fowler WRF, currently under construction, is proposed to be expanded to 9 MGD by 2025. The highly treated effluent from this facility is then pumped to the proposed Threatt WRF for discharge to the Chattahoochee River.
• Gravity sewer along the Chattahoochee River would provide sewer service to the Chattahoochee River Basin. A new WRF would be constructed at the Threatt property, with its capacity reaching 9 MGD by 2025. This facility would be capable of treating all sewered

Executive Summary Page 2
wastewater flows generated in the Chattahoochee River Basin. It would discharge highly treated effluent to the Chattahoochee River.
• In the Settingdown Creek Basin, two service areas would be established. One area would be served by the Hamptons Land Application System (LAS). The remainder of the basin would have its flow routed around the Cumming service area, through the Lower Settingdown Creek Basin and discharged to the Upper Big Creek sewer system. This flow would be treated at the Fowler WRF. With these flows added to the Big Creek Basin flows, the capacity of the Fowler WRF is proposed to be expanded to 9 MGD by 2025.
• In the Lake Lanier Basin, a combination of low pressure sewers, gravity sewers, pump stations and force mains are recommended to convey the flow to the proposed Lanier WRF. The Lanier WRF will need to provide 4-MGD of treatment capacity by 2025 and will most likely discharge to a tributary of Lake Lanier. This facility will require the purchase of a suitable site.
• In the Etowah River Basin, no publicly owned sewer is planned to be installed before 2025. However, privately owned facilities will develop in this area before the end of the planning period.
The estimated total capital cost of implementing Alternative 10 over the next 23 years is $398 million in 2002 dollars. This cost includes construction, easement and site acquisition, engineering, legal, project administration, and contingencies for the trunk sewers, major pumping stations and force mains, treatment plants, and effluent pipelines. When the present worth of operations and maintenance are considered over a 30 year period and combined with the capital costs, the total cost is estimated to be $32.7 per million gallons of wastewater treated. Alternative 10 is the recommended plan to provide sewer service in Forsyth County based on the alternative analysis. However, all the alternatives developed are technically feasible and any one of them could be chosen as the recommended alternative, depending upon the needs of the community and opportunities that may arise.
For areas where wastewater service is planned in the future, it is the goal of the Forsyth County Water & Sewer Department to avoid conflicts with private service systems. In cases where sewer service is planned in the future but not presently available, it may be necessary for a developer to implement a local treatment system. Each private treatment system should be coordinated with the County and sized for future connection to the County collection system once it has expanded into the area. Once the system is completed and operational, it should be turned over to the County for operation. This will allow the County to provide the residents with the most economical solution for providing wastewater collection and treatment services.

Section 1: Introduction
Forsyth County is located in north central Georgia, approximately 30 miles due north of Atlanta. With a land area of 247.4 square miles, Forsyth County is 126th in size of the 169 counties in Georgia. Forsyth County is located in the Piedmont region of Georgia, which is an area of rolling hills and gentle slopes that transition from the Coastal Plain to the Mountains. Sawnee Mountain is the highest point in Forsyth County at 1,967 feet above mean sea level and indicates that Forsyth is at the foothills of the Appalachian Mountains.
Forsyth County drains into two major river basins, the Etowah and the Chattahoochee. The northwestern quadrant of the County and a sliver of the western edge are in the Etowah River basin. The Etowah River begins in the North Georgia mountains and flows through Forsyth County westward to Rome, Georgia, where it combines with the Oostanaula River to form the Coosa River. An impoundment on the Etowah River forms Lake Allatoona, which is west of Forsyth County in Cherokee and Bartow counties.
The Chattahoochee River begins in the mountains near Helen, Georgia and forms the border between Forsyth County and Gwinnett and Hall Counties. From the Gwinnett/Forsyth County boundary, the Chattahoochee River flows in a southwesterly direction through metro Atlanta towards Columbus, Georgia. In 1957, the Chattahoochee River was impounded by Buford Dam near the intersection of the Forsyth, Gwinnett and Hall County boundaries to form Lake Sidney Lanier, which also receives water from the Chestatee and Little Rivers. Lake Lanier is the source of drinking water for Forsyth County and the City of Cumming, as well as Gwinnett County and the City of Gainesville.
Forsyth County is bordered by Fulton County to the south, Hall and Dawson Counties to the north, Hall and Gwinnett Counties to the east, and Cherokee County to the west. Fulton County in which most of the City of Atlanta is located is the most populous county in Georgia. Gwinnett County was one of the fastest growing counties in the United States during the 1980s, and is the fourth most populous county in Georgia. Along with Cherokee and Hall Counties, Forsyth County is now considered to be a part of the metropolitan Atlanta area, and has experienced tremendous growth during the 1990s. This has earned Forsyth the title as one of the fastest growing counties in the United States during the 1990s. Historic populations of Forsyth County from 1900 to 2001 are presented in Table 1.1.

Introduction Page 2
Table 1.1 Population of Forsyth County 1900-2001
Year Population Annualized Change 1900 11,550 1910 11,940 0.33 % 1920 11,755 -0.16 % 1930 10,624 -1.01 % 1940 11,322 0.64 % 1950 11,005 -0.28 % 1960 12,170 1.01 % 1970 16,928 3.36 % 1980 27,958 5.15 % 1990 44,083 4.66 % 1991 46,994 6.60 % 1992 49,748 5.86 % 1993 52,569 5.67 % 1994 56,895 8.23 % 1995 62,225 9.37 % 1996 69,137 11.11 % 1997 76,333 10.41 % 1998 86,409 13.20 % 1999 96,686 11.89 % 2000 98,407 1.78 % 2001 110,296 12.08 %
Source: U.S. Census (10 year increments) and Georgia Office of Planning and Budget (annually) Note: Annual population estimates are corrected with actual census count every ten years. Correction occurred in 2000 that accounts for the low percentage increase between 1999 and 2000.
Several factors have contributed to the appeal of Forsyth County. The main transportation corridor to Forsyth County is Georgia 400, a limited access highway that connects Interstate 285 (I-285) and I-85 near downtown Atlanta to the mountains north of Forsyth County. Perimeter Center, Buckhead and Midtown business districts are located within the Georgia 400 corridor. Georgia State Route (SR) 141 and SR 9 provide north-south access to north Fulton County, west Gwinnett County and the associated business districts including the cities of Alpharetta, Roswell, and Norcross. SR 20 provides major east-west access to the cities of Canton, Cartersville, and Lawrenceville. The recreational appeal and scenic beauty of Lake Lanier and the mountains have lured people to live in Forsyth County, while the transportation corridors have allowed them the easy access to their places of employment.
In 1993, Wiedeman and Singleton, Inc. prepared a Sewerage System Master Plan for Forsyth County. At that time, Forsyth County had sewer service available for a small area adjacent to the Fulton County border, in the Big Creek basin. In 1993, most of the estimated 34,000 people in unincorporated Forsyth County utilized septic tanks for disposal of wastewater. When the 1993 Wiedeman and Singleton Plan was developed, population projections estimated the total 2000 population to be 64,983. As seen in Table 1.1, that population was surpassed in 1995 and the projected 2013 population of 95,667 was reached in 1999.

Section 2: Existing Facilities
Forsyth County currently provides wastewater service to approximately 4,100 customers. However, the system currently does not have an operational treatment facility, although a 1.25-million gallons per day (MGD) facility is under construction with completion scheduled in 2003. Forsyth County has relied on surrounding entities, including Fulton County and the City of Cumming, for treatment of its wastewater. Several private systems also treat wastewater generated in subdivision developments located with the sewer service area.
This section documents where wastewater service is currently located and identifies existing treatment contracts as well as private wastewater systems located in the County.
Sewer Service Area
The Sewer Service Area includes most but not all of the area outside the City Limits of Cumming. Currently, the Forsyth County Water & Sewer Department provides sewer service to a small portion their service area. The majority of the existing service is located adjacent to the Fulton County line as a result of the explosive growth in that area and a contractual agreement with Fulton County for treatment of the wastewater. A small pocket is also served adjacent to the Cumming service area (near Bethelview Road) which is served by the City under a contractual agreement. Figure 2.1 presents the location of the Sewer Service Area.
In addition to the areas served by Forsyth County Water & Sewer Department, there are several private systems located in the Sewer Service Area that are owned and operated by private entities and generally have been constructed as part of the development of a subdivision. These facilities are also shown on Figure 2.1.
Wastewater Treatment
The County is constructing its first water reclamation facility, the Fowler WRF. This facility is being designed to treat up to 2.5 MGD on a maximum month basis. The effluent from the facility will be reclaimed for irrigation uses on golf courses and landscaped areas. If these uses are not sufficient to manage all the treated flow from the WRF, then the rest of the flow will be irrigated on the County-owned Threatt site, located in the southeastern corner of Forsyth County along the Chattahoochee River. The Threatt site is an undeveloped tract of land that the County purchased in order to land apply wastewater effluent or build a treatment facility. The Fowler WRF is currently permitted by the Georgia Environmental Protection Division (EPD) to treat 1.25 MGD of wastewater on a maximum month basis. The Fowler WRF incorporates a biomembrane treatment system, which is state-of-the-art for water reclamation. The treated flow from the plant will be highly polished. The 1.25-million gallons per day (MGD) facility is being provided through a design/build delivery arrangement and is scheduled to be completed in 2003.

Existing Facilities Page 2
Insert Figure 2.1

Existing Facilities Page 3
Forsyth County has contractual agreements for wastewater treatment with Fulton County and the City of Cumming, as well as ownership of capacity in two private treatment facilities. As part of these arrangements, Forsyth County collects the wastewater from its customers and discharges it into designated sewers which convey the wastewater to the appropriate treatment facility. Table 2.1 presents a summary of these agreements.
Table 2.1 Summary of Existing Wastewater Treatment Agreements
System or Facility
Contract Limit or Capacity
Owned (MGD)
Current Maximum Month Average Day
Forsyth County Flows (MGD)
Fulton County Johns Creek Big Creek Total Fulton County
0.75 1.25 2.00
0.52 0.72 1.24
City of Cumming Bethelview Road/Hwy 9 NE Holtzclaw Total City of Cumming
0.35 0.15 0.50
0.065 0.00 0.065
Dick’s Creek* 0.60 0.00
The Hamptons* 0.50 0.00 Total 3.60 1.305
* private facilities
In addition to the contractual agreements shown in Table 2.1, privately owned treatment facilities also treat wastewater in residential developments. These facilities comprise a significant amount of the existing capacity in the county. There are seven privately owned systems that serve residents. These private systems and their permitted capacities are identified in Table 2.2.
Table 2.2 Privately Owned Treatment Systems Serving Residents
Facility
Permitted Maximum Month Average Day Flow Capacity
(MGD)
Dick’s Creek LAS 0.76 Habersham on Lanier LAS 0.11 The Hamptons LAS 0.275 The Manor LAS New Facility* Olde Atlanta Club LAS 0.262 Polo Golf and Country Club LAS 0.338 Windermere LAS 0.25
* Currently under design with a planned capacity of 0.3 MGD available for purchase by Forsyth County.
All of the privately owned facilities manage their treated effluent through reuse on golf courses and landscaped areas or though land application on dedicated sites. None of these facilities are permitted to discharge to surface waters. In addition to the existing private treatment plants, a new private

Existing Facilities Page 4
plant is currently under design. This new plant will be part of The Manor, a golf course development in Fulton and Forsyth counties. The plant will be located in one of the sub-basins of the Big Creek Basin, located along the western edge of Forsyth County, north of Highway 9. The plant will be owned by Innovative Water Solutions, LLC and has a capacity of 300,000 gallons per day (gpd) available for Forsyth County to purchase. The ultimate total plant capacity would be 500,000 gpd. The location of the private facilities is shown in Figure 2.1.

Section 3: Population and Wastewater Flow Projections
Population and wastewater flow projections are the basis for the rest of the planning of service and infrastructure. This section will outline the methodology used to develop the population projections and wastewater flows used in this Plan.
Population Projections
In an effort to be consistent among planning projects, population forecasts for Forsyth County were obtained from Street Smarts, who developed population projections for the Forsyth County Transportation Master Plan, completed in 2001. From that study, the population data were disaggregated into traffic planning increments called traffic analysis zones (TAZ). Using a Geographic Information System (GIS) database, the TAZ population data were grouped into the major drainage basins located in the County. Once this step was complete, the data was refined to include only those areas located within the Sewer Service Area.
Sewer Service Area boundaries and drainage basin boundaries were provided by Forsyth County staff. The major drainage basins located in Forsyth County include the following:
• Big Creek Basin, which is located west of the Cumming Service Area and west of SR 141 to the County Line.
• Chattahoochee River Basin, which is located south of the Cumming Service Area to the border with Fulton County and east of SR 141 to the border with Gwinnett County.
• Etowah River Basin, which is located in the northwestern corner of the County with most of the area north of SR 369.
• Lake Lanier Basin, which is located in the northeastern quadrant of the County with SR 306 splitting the majority of the area.
• Settingdown Creek Basin, which is split in two by the Cumming Service Area. A portion of this basin is located north of the Cumming service area and includes GA 400 and SR 9. The remaining portion of this basin is located west of the Cumming service area to the boundary with Cherokee County and is roughly south of SR 369 and north of SR 20.
In previous studies completed for Forsyth County, the major drainage basins had been broken into smaller planning units, or sub-basins. The sub-basin boundaries and associated numbering scheme were reproduced from the previous studies to maintain consistency, as shown in Figure 3.1.
Population projections developed by Street Smarts included years 2005, 2010, and 2020 projections and three levels of population growth including low, moderate, and high growth. These ranges were extrapolated to the 2025 planning horizon of this study using a declining growth rate. Population projections and the annualized growth rate for each scenario are presented in Table 3.1. The 2000

Population and Wastewater Flow Projections Page 2
Insert Figure 3.1

Population and Wastewater Flow Projections Page 3
Census indicated that the population for Forsyth County was 98,407 with 2.83 persons per household. The 2001 population estimate by the Census Bureau indicated a population of 110,296 in Forsyth County on July 1, 2001.
Table 3.1 Future Population for Forsyth County
Year Low Growth
Scenario
Annualized Growth
Rate
Moderate Growth Scenario
Annualized Growth
Rate
High Growth Scenario
Annualized Growth
Rate 2005 162,700 10.6% 178,300 12.6% 193,300 14.5% 2010 215,700 5.8% 241,100 6.2% 264,100 6.4% 2015 259,900 3.7% 285,300 3.4% 310,600 3.3% 2020 301,900 3.1% 329,100 2.9% 356,500 2.8% 2025 342,900 2.6% 370,900 2.4% 400,600 2.4%
Population figures include City of Cumming and Unincorporated Forsyth County population
These growth scenarios were compared to other population forecasts were obtained from other studies of the Forsyth County area, including studies by the US Census Bureau, the Tri-State Water Compacts, the Metropolitan North Georgia Water Planning District (MNGWPD) study, and the Georgia Mountains Regional Development Center. The comparison of these projections is presented in Table 3.2.
Table 3.2 Forsyth County Population Projections Comparison
Source Population Projection
Year of Projection
State of Georgia Office of Planning & Budget 181,961 2010
Metropolitan North Georgia Water Planning District
303,900 - 349,500 2030
Tri-State Water Compact 378,900 2030 Georgia Mountains RDC 322,384 2020
As mentioned previously, the Sewer Service Area covers most of the unincorporated County area. In order to estimate the population of the County’s Sewer Service Area, the population of the City of Cumming’s Service Area was subtracted from the total Forsyth County population. Using the moderate growth scenario depicted previously in Table 3.1, the total projected population for the Forsyth County Sewer Service Area was calculated and is shown in Table 3.3 (a detailed breakdown of population by sub-basin is included in Appendix A). The decision to use the moderate growth scenario was made in consultation with the Forsyth County Water and Sewer Department staff and the Board of Commissioner’s Water & Sewer Committee.

Population and Wastewater Flow Projections Page 4
Table 3.3 Forsyth County Sewer Service Area Projected Population
Year Projected Population –
Moderate Growth Scenario
2005 129,479 2010 175,052 2015 207,180 2020 239,309 2025 269,740
Wastewater Flow Projections
In an area containing predominantly residential and commercial facilities, as is the case in the Sewer Service Area, the wastewater flows can be directly related to the population. Flows from industrial facilities are not easily related to the population. However, industrial facilities that could generate large wastewater flows are not included in the Forsyth County land use plan. Also, with the concern for a potential water supply shortage in the region, adding any large volume water users within the region is not expected and should be discouraged. Therefore, the wastewater flow projections for the Sewer Service Area can be correlated to the future population projections. If any industrial facilities chose to locate in the Sewer Service Area, the availability of sewer and treatment capacity would need to be evaluated on a case-by-case basis.
Existing Wastewater Flows
Forsyth County currently has approximately 4,100 customers in its sewer system. These customers are primarily located in South Forsyth County near the Fulton County boundary. The existing wastewater flows in the southern portion of the county are in small, highly developed basins that flow into Fulton County and are metered at the Fulton County boundary. This portion of Forsyth County is primarily residential with a few commercial customers.
The monthly metered information for wastewater discharged to Fulton County for calendar years 2000 and 2001 was provided to JJG and is included in Appendix A. In addition, Forsyth County provided the number of customers that are served through each metering location. Based on the records, an average annual daily flow of 1.28 MGD was discharged to Fulton County in 2000.
According to the 2000 Census, there is an average of 2.83 people per household in Forsyth County. Therefore, this number was multiplied by the number of customers to estimate the current population served by the sewer system. The estimated population served is 11,538 people. When the wastewater flow of 1.28 MGD is divided by the estimated population served, a wastewater generation rate per person is calculated to be 111 gallons per capita per day (gpcd). This rate is comparable to those typically seen in north Georgia.
The existing flows also include a wet weather component of the wastewater known as inflow and infiltration (I/I). Inflow consists of water that enters the sewer directly through open manholes or other direct connections. Infiltration consists of water entering the sewer due to high groundwater levels. Therefore, a baseline level of I/I has also been included in the per capita generation rate of 111 gpcd.

Population and Wastewater Flow Projections Page 5
In many cases, the I/I portion of wastewater flow nearly matches the amount of water used outdoors for irrigation, which is not returned to the sewer system. Therefore, the water use per capita rate and the wastewater generation per capita rate can be compared when I/I and outdoor watering are taken into account. The relationship of these two rates was used to further verify the per capita wastewater generation rate calculated in this Plan.
Substantial amounts of data were collected and analyzed for the Metropolitan North Georgia Water Planning District’s (MNGWPD’s) Water Supply and Water Conservation Management Plan regarding existing water use. The MNGWPD information was analyzed on a county basis for all residents and water suppliers. The data indicated that current residential water use in Forsyth County averages 94 gallons per capita per day (gpcd). This includes 66 gpcd of indoor water use and 28 gpcd of outdoor water use. When the usage rate of 94 gpcd was combined with the U.S. Census average 2.83 persons per household, an average usage of 266 gallons per household per day was calculated.
Commercial and industrial water usage and wastewater flows are much more difficult to estimate in general terms. Many various measures have been suggested to relate water usage and wastewater generation to various use types. These include metrics that estimate flows to the number of employees, customers, meals, tons of product produced, square footage of facility, or pieces of equipment in use. In Forsyth County, non-residential water use accounts for an estimated 25 percent of the total water demand. This results in a total annual average day per capita water demand of 126 gpcd.
The MNGWPD’s projected 2030 generated wastewater per capita flow rate is 106 gpcd for Forsyth County, which correlates well to the wastewater generation rate of 111 gpcd calculated in this Plan. Wastewater flow projections for this Plan will be estimated using the calculated 111 gpcd rate. The total projected wastewater generated within the Forsyth County Sewer Service Area is detailed in Table 3.4. An estimate of wastewater flows for various land uses was developed and is presented in Table 3.5.
Table 3.4 Total Annual Average Day Wastewater Generated in the Forsyth Service Area
Year
Forsyth Service Area
(MGD)
Private Systems
Service Area (MGD)
Total (MGD)
2000 7.8 0.9 8.7 2005 13.9 1.4 15.3 2010 18.7 1.8 20.5 2015 22.1 2.0 24.1 2020 25.3 2.4 27.7 2025 28.7 2.6 31.3

Population and Wastewater Flow Projections Page 6
Table 3.5 Forsyth County Sewer Capacity by Land Use
Proposed Land Use Per Units Required Sewer Capacity (GPD)
Apartments Unit 270 Auditorium, Food not Included person, max capacity 10 Bar, Food not Included Seat 50 Beauty/Barber Shop Wet Chair 125 Bowling Alley, Food not Included Lane 125 Campgrounds Space 175 Carwash Bay 750 (Note 1) Church Sanctuary Seat 5 Coin Laundry Machine 400 (Note 1) Commercial Laundry Machine 640 (Note 1) Country club, Food not Included 1000 sq ft 100 Hospital Bed 200 Hospital Employee 25 Industrial, toilet waste and showers (Note 2) Employee 35 Industrial, toilet waste only (Note 2) Employee 25 Mobil Home Park Space 270 Motel, Hotel, Food Not Included Unit 100 Nursing Home Bed 125 Nursing Home Employee 25 Office, Food not Included 1000 sq ft 100 Picnic Area, Park Visitor 10 Picnic Area, Park, with Showers Visitor 25 Police, Fire Station, Food Included Resident Employee 75 Police, Fire Station, no Food Day Employee 25 Residence Single Family, Condo, Townhomes Unit 270 Rest Stop, Comfort Station Employee 25 Rest Stop, Comfort Station Visitor 5 Restaurant Seat 50 Restaurant, Fast Food Seat 30 Restaurant, 24 Hour Service Seat 75 School Student 12 School with Gym Student 16 School with Cafeteria Student 16 School with Gym and Cafeteria Student 20 Service Station Employee (Note 3) Stores, Shopping Center, Retail, Food not Included 1000 sq ft 100 Swimming Pool Swimmer (Note 3) Theater, regular, employees included Seat 5 Warehouse 1000 sq ft 50
Notes 1. For car washes and laundries where water saver or recycle devices are used, flow may be based on calculations
by a Professional Engineer. 2. For Industrial uses, process flow is to be based on a Professional Engineer's calculations. 3. For service stations, swimming pools, or other uses not covered by this chart, flows to be based on a
Professional Engineer's calculations. Calculations are to include a peaking factor and allowance for inflow and infiltration; must be approved by FCDW&S.
4. Fast food is defined as an establishment that provides food service to customers in containers that are disposed of after use (paper, plastic, etc.)
5. Restaurants are defined as any establishment that provides food service to customers with dinnerware that require washing in order to be used more than once.
6. When an office is included in warehouse and is less than 25% total space, then fees are calculated with office space as 25%. For office space greater than 25% total space, fees are to be calculated for actual office area.

Population and Wastewater Flow Projections Page 7
Future Wastewater Flows to Sewer Systems
In Forsyth County, the amount of wastewater that enters the public sewer system is much different from the total amount of wastewater that is generated. Of the 71,000 people currently located in the Sewer Service Area, slightly more than 11,000 are served by the County and nearly 5,000 are served by private treatment plants. This means that the current sewer system collects approximately 22 percent of the total wastewater generated. The remainder is treated by on-site treatment systems, primarily septic tanks at individual homes.
Goals for providing sewer service in the Sewer Service Area were developed by the Forsyth County Water & Sewer Department staff. In general, it is unrealistic to expect the entire population to be served with sewer. Even in the highly developed metropolitan Atlanta area some septic tanks are still in use. Therefore, using the knowledge of development patterns, land use, and projected population densities within each drainage basin, an estimate of the population served was determined.
The goals established that, in general, 85 percent of the new population would be sewered while 25 percent of the existing unsewered population would be converted to sewers by the year 2025 at a conversion rate of 5 percent per 5-year increment. However, allowances were made to adjust for portions of the service area that are not expected to develop as rapidly, have low projected population densities, or where the installation of sewers would be more difficult. Therefore, a phasing plan was also established as follows:
• Big Creek, Chattahoochee River and Upper Settingdown Creek (Basin 38): A goal of 85 percent of the new population sewered beginning in 2005 and remaining constant through 2025 was established for these basins. The existing unsewered population would be converted to sewers at a rate of 5 percent per 5-year increment.
• Etowah River: Only Basins 28 and 33 are expected to have sewer service by 2025 and these were assumed to be private systems, created as a part of the development of a subdivision. A goal of 60 percent of the new population served was established, beginning in 2010 and remaining constant through 2025. No existing population was assumed to have sewer service.
• Lake Lanier: This drainage basin was split into two portions based on the anticipated growth rates. The first group, consisting of Basins 6, 24, 29, 35, and 39, had a goal of 20 percent of the new population sewered beginning in 2005 and increasing to 85 percent of the new population by 2015 and remaining at the same level through 2025. The existing population would be converted to sewers at a rate of 5 percent per 5-year increment. The second grouping, consisting of Basins 9, 10, 12, 20, and 40, had a goal of 20 percent of the new population sewered beginning in 2010 and increasing to 85 percent by 2020. The existing population would be converted to sewers at a rate of 5 percent per 5-year increment beginning in 2010.
• Settingdown Creek: This drainage basin was split into two portions based on anticipated growth rates. Upper Settingdown Creek (Basin 38) was discussed previously. Lower Settingdown Creek includes Basins 26 and 37, which have a goal of 50 percent of the new population sewered beginning in 2010, increasing to 85 percent by 2015 and remaining

Population and Wastewater Flow Projections Page 8
constant through 2025. The existing population would be converted to sewers at a rate of 5 percent per 5-year increment beginning in 2010.
Once the sewer service goals were established they were applied to the total wastewater flow generated to estimate the amount of wastewater that would enter the sewer system. The projected wastewater flows that will be collected in the sewer system for treatment are shown in Table 3.6. The sewered flow to private systems was accounted for and is presented separately. A detailed table that presents the sewered flow for each sub-basin is included in Appendix A.

Population and Wastewater Flow Projections Page 9
Table 3.6 Total Annual Average Day Wastewater Flows
Basin
Forsyth Service (MGD)
Private Systems (MGD)
Total (MGD)
2000 Big Creek 1.0 0.2 1.2 Chattahoochee 0.3 0.6 0.9 Etowah 0.0 0.0 0.0 Lanier 0.0 0.0 0.0 S.D. Creek 0.0 0.1 0.1
Total 1.3 0.9 2.2 2005
Big Creek 2.9 0.2 3.1 Chattahoochee 1.5 0.7 2.2 Etowah 0.0 0.1 0.1 Lanier 0.2 0.0 0.2 S.D. Creek 0.0 0.2 0.2
Total 4.6 1.2 5.8 2010
Big Creek 4.3 0.3 4.6 Chattahoochee 2.5 0.8 3.3 Etowah 0.0 0.2 0.2 Lanier 0.7 0.0 0.7 S.D. Creek 0.4 0.3 0.7
Total 7.9 1.6 9.5 2015
Big Creek 5.4 0.3 5.7 Chattahoochee 3.2 0.9 4.1 Etowah 0.0 0.3 0.3 Lanier 1.4 0.0 1.4 S.D. Creek 1.0 0.5 1.5
Total 11.0 2.0 13.0 2020
Big Creek 6.2 0.3 6.5 Chattahoochee 3.9 1.0 4.9 Etowah 0.0 0.3 0.3 Lanier 2.3 0.0 2.3 S.D. Creek 1.8 0.6 2.4
Total 14.2 2.2 16.4 2025
Big Creek 6.8 0.7 7.5 Chattahoochee 4.7 1.0 5.7 Etowah 0.0 0.4 0.4 Lanier 3.0 0.0 3.0 S.D. Creek 2.4 0.7 3.1
Total 16.9 2.8 19.7
As shown in Table 3.6, the total sewered wastewater flow in the Sewer Service Area is expected to increase from 2.2 MGD to 19.7 MGD over the planning period. The majority of that flow will be in the Forsyth County sewer system. However, private systems are expected to continue to play a role in Forsyth County. Over time, these facilities will exceed their useful lives and may develop

Population and Wastewater Flow Projections Page 10
maintenance problems. When this occurs, these private systems could connect to a nearby Forsyth County sewer and take the treatment facility out of service. Conversely, the opportunity may arise for the County to take over the operation of some of the private facilities with the possibility of expanding them and providing additional service in the area. The options will be explored more thoroughly in the alternative evaluation section of this report.
With the projected wastewater flows to the sewer computed, the development of the sewer evaluation model was begun. The next section discusses how the model was built and used to evaluate the existing and proposed sewer system using the flows developed in this section.

Section 4: Evaluation of the Collection System
In order to evaluate the existing and future Forsyth County collection system, a steady-state spreadsheet model was developed. This model was used to assess different options for providing new sewer service within the County’s service area. This section describes how the model was built and how different options were examined using the model.
Model Development
A steady-state model was built using Microsoft Excel for evaluating the collection system in Forsyth County. A steady-state model provides a snapshot of the system at a particular instant in time, in this case the peak daily demand condition. It provides information on the ability of the system to convey flow, but unlike a dynamic model, it does not have the ability to precisely pinpoint the location of potential overflows. The Manning’s Formula for gravity flow hydraulics is the basis of the model. The first step in developing the model was to produce an initial sewer system layout. Forsyth County staff provided a copy of the existing sewer system maps. The existing sewer mains are located primarily in the area adjacent to Fulton County since most of the County’s wastewater is discharged to Fulton County for treatment. Existing sewer mains over 10-inches in diameter were included in the model. For future sewer mains, a schematic was drawn on a Forsyth County map for each major drainage basin. The initial layout was reviewed and discussed with County staff to resolve any unforeseen problems with routes and to discuss any current plans for sewer extensions. With the staff’s input, the layouts were revised as necessary and then the flows were estimated for each pipe segment. Using the projected 2025 annual average day (AAD) flows presented in Table 3.6 for each basin, sub-basin flows were estimated in order to develop the sewer model network. The sub-basin flows were estimated on the basis of population density and the area of each sub-basin relative to the total area of the drainage basin. This methodology assumes that the population density is uniform throughout the basin.
Sewers are sized based on peak daily flow (PDF); therefore, the projected 2025 AAD flow that was estimated for each pipe must be increased by a peaking factor to adjust it accordingly. In order to apply the peaking factors, the pipes were first divided into two categories based on size and location: collector/peripheral mains and trunk mains. Collector/peripheral mains are large pipes that collect wastewater from smaller lateral sewers that typically serve neighborhoods and commercial developments. The trunk mains are used to convey wastewater from collector/peripheral mains to the wastewater treatment facilities. A different peaking factor was used for each type of sewer main. Trunk mains carry a large amount of flow but have smaller flow fluctuations; therefore, they have a lower PDF to AAD ratio. In this model, a PDF to AAD ratio of 2.0 was used for the trunk mains. Collector/peripheral mains are generally smaller in size and are located in areas where the impact of flow variations is greater. Therefore a higher peaking factor of 3.0 was used in the model for this class of sewers. For each drainage basin, the existing sewer mains, where available, were input into the model. The manhole number, length, diameter, and actual slope were obtained from Forsyth County record

Evaluation of the Collection System Page 2
drawings. Future sewer mains were input into the model using the reviewed and revised system layout map. Minimum slopes, based on a minimum clean-out velocity of 2 feet per second, were input into the model for the future sewer mains. It should be noted that actual slopes, as determined during the design phase, will likely be higher due to the variable topography across the County, potentially resulting in the use of smaller diameter pipes to convey the same amount of flow. Future sewer mains were sized so that with the 2025 PDF they would be flowing at 50 percent full (i.e., at 50 percent of the pipe’s depth). Existing pipes were upgraded when the 2025 PDF exceeded the 75 percent full level. The replacement pipes were sized so that they would be flowing at 50 percent full when conveying the 2025 PDF. Sizing the pipes in this manner allows for additional sewer capacity beyond the planning period. The sewer model is included in Appendix B. Sewer Options For each major drainage basin, at least one option for sewer service has been identified, although most have more than one possibility. Planned and potential treatment locations and pump stations were also included in the model. The potential treatment locations should be viewed in very general terms. These locations were developed for planning purposes only and are not necessarily the designated locations for future treatment. The sewer options developed for each basin will be discussed below. Big Creek Basin Big Creek is a large drainage basin encompassing approximately 27,735 acres and composed of eight sub-basins. Basins 4 and 5 (Caney Creek and John’s Creek, respectively) have existing sewer service in the majority of the area. Extensions of these sewers will be constructed as infill development within these basins continues. The flow in Basin 4, Caney Creek, will continue to discharge to Fulton County for treatment. However, in Basin 5, John’s Creek, the County already has plans under development to collect all of the wastewater where it is currently discharged to Fulton County and pump the wastewater to Chattahoochee Basin 34 for treatment at the Dick’s Creek LAS. Basins 8, 23, and the southern-most portion of Basin 22 will discharge to Fulton County’s Big Creek interceptor sewer for conveyance to treatment. Because of its size, the remainder of the Big Creek Basin was divided into two sections, Upper and Lower Big Creek, split roughly along SR 9 due to the Fowler WRF location. The majority of Lower Big Creek Basin (Basin 30, south of SR 9 and northern portion of Basin 22) has existing sewer. These sewers currently discharge to Fulton County’s sewer system. In the first two options for Lower Big Creek, the basin flow is collected and pumped to the Fowler WRF, currently under construction. Two pump station locations were considered, one at the intersection of the County boundary and Big Creek (Option LBC1) and another located at the intersection of MacFarland Road and Big Creek (Option LBC2). The third option (LBC3) retains the existing practice where all sewer flows discharge to Fulton County, thus eliminating the need for a new pump station (assumes capacity needed from Fulton County is available). In all cases, sewer extensions are required along Big Creek to the Fowler WRF and along a branch of Big Creek that splits just north of Shiloh Road. Existing sewer mains will need to be upgraded to larger diameters to convey the projected flows. The identified

Evaluation of the Collection System Page 3
improvements for Options LBC1 and LBC2 are shown in Figures 4.1 and 4.2. Additional details and schematics for all three of the options are included in Appendix B. In Upper Big Creek (Basin 30 north of SR 9, Basin 31, and Basin 21) there is no existing sewer except the privately owned system at the Polo Fields Golf and Country Club (Polo Fields). However, a sewer is currently being designed that will follow Big Creek from SR 9 northward to the point where the creek splits near Bentley Road. At this point, the sewer will follow Bentley Creek to where it splits into Cobb Creek and Harris Creek. A sewer is also currently in design for a portion of Basin 31 along Cheatham Creek, beginning at Kelly Mill Road and ending at a pump station just north of the Polo Fields. The pump station will pump the wastewater to the sewer currently under design along Bentley Creek. All of the flow in these sewers will be conveyed to the Fowler WRF for treatment. Option UBC1 includes extensions of these planned sewers so that service to the entire basin can be established. Another option considered for the Upper Big Creek Basin consists of replacing the pump station and force main with gravity sewer along Cheatham Creek (Option UBC2). This option would eliminate the need for a pump station and force main with associated maintenance and power costs. Construction of gravity sewers would be difficult, however, due to the presence of wetlands at the confluence of Big Creek and Cheatham Creek and the need to construct through the Polo Fields. Both of the Upper Big Creek options include estimated 2025 flows from the Polo Fields development to ensure adequate sewer capacity in the event that the private system needs to discharge its wastewater to the Forsyth County sewer system. The improvements and options for Upper Big Creek Basin are shown in Figures 4.3 and 4.4. The pipe sizes shown on these two figures include enough capacity to convey the flow from Upper and Lower Settingdown Creek basin. Figures 4.3a and 4.4a represent two sub-options for Upper Big Creek where only the flows from the Lower Settingdown Creek basin are included (flows from the Upper Settingdown Creek basin are directed to the Lanier Basin for treatment). Additional details and schematics for all of the Upper Big Creek basin options are contained in Appendix B.

Evaluation of the Collection System Page 4
Insert Figure 4.1

Evaluation of the Collection System Page 5
Insert Figure 4.2

Evaluation of the Collection System Page 6
Insert Figure 4.3

Evaluation of the Collection System Page 7
Insert Figure 4.4

Evaluation of the Collection System Page 8
Insert Figure 4.3A

Evaluation of the Collection System Page 9
Insert Figure 4.4A

Evaluation of the Collection System Page 10
Chattahoochee River Basin The portion of the Chattahoochee River Basin located in the Sewer Service Area is approximately 18,000 acres and is comprised of eight sub-basins. Basin 19, which includes the St. Marlo development, has existing sewer in the majority of the basin. Basin 34, Dick’s Creek, has a number of private sewer systems located in subdivision developments. The wastewater collected in these sewers is treated at the privately owned Dick’s Creek LAS. Basins 16 and 36 also have some private sewer systems as well, including Olde Atlanta Club LAS and Windermere LAS. Three options were devised and evaluated to provide sewer service in the Chattahoochee Basin. Each of the three options includes flows from private sewer systems so that, if needed in the future, these systems could discharge to Forsyth County for treatment. The first option (Option CHA1) consists of a gravity interceptor sewer along the Chattahoochee River that would collect flow from trunk mains located in each of the sub-basins. The flow would be conveyed to the Threatt property, where a new WRF would be constructed,, for treatment and discharge to the Chattahoochee River. Option CHA1 has several obstacles, including difficulty in obtaining a permit to disturb land next to the Chattahoochee River and obtaining easements along the route, as well as difficult construction due to rock and topography. The difficult construction could be overcome by incorporating more advanced methods such as micro-tunneling. Option CHA1 requires less maintenance and operational issues and provides the opportunity for multi-use projects such as a river walk along the easement and a riparian buffer. This option is presented schematically in Figure 4.5 The second option (Option CHA2) consists of upgrading the private facilities, Windermere and Dick’s Creek LAS, into regional treatment facilities. Land application would be the likely way to manage the effluent from these two facilities; however, land area available at each site may become an issue. In this option, the flows from Basins 26, 7, and the northern portion of 16 would be conveyed to an upgraded Windermere LAS for treatment. Flows from Basins 34, 19, 18, 15, and the southern portion of 16 would be conveyed for treatment at the upgraded Dick’s Creek LAS. Wastewater flow from Big Creek Basin 5 (John’s Creek) will be pumped to Basin 34, where it will flow by gravity to Dick’s Creek for treatment. Five pump stations would be required to redirect the flows to the treatment facilities upon collecting the wastewater from the basins via gravity sewer. Option CHA2 has two primary obstacles which include a larger expenditure on operations and maintenance due to the number of pump stations and the lack of land area at the sites to discharge the effluent. Figure 4.6 presents this option schematically. The third option (Option CHA3) consists of a regional pump station that conveys flow to the proposed Threatt WRF for treatment and discharge to the Chattahoochee River. Under this option, the Dick’s Creek LAS remains in service but only treats the wastewater flow upstream of the facility. Windermere LAS is converted to a regional pump station and collects flow from Basins 7, 36, and 16. Four smaller pump stations are needed to pump flow from basins 16 and 7 to the Windermere Pump Station. Wastewater generated in the southern portion of Basin 34, which includes the flow pumped from Basin 5, along with flows from Basins15, 19, and 18 flows by gravity to the proposed Threatt WRF. Option CHA3 includes a number of pump stations as well as two treatment facilities that will require a larger expenditure for operation and maintenance. . Figure 4.7 presents a schematic of this option.

Evaluation of the Collection System Page 11
Insert Figure 4.5

Evaluation of the Collection System Page 12
Insert Figure 4.6

Evaluation of the Collection System Page 13
Insert Figure 4.7

Evaluation of the Collection System Page 14
Etowah River Basin Based on discussions with County staff, public sewer will not be provided in this basin during the planning period, given the projected population and land use density. Therefore, no options were considered for the Etowah Basin. However, it is assumed that during the planning period, private sewer systems will be installed to provide service to residential developments. Lake Lanier Basin The Lake Lanier basin is the largest basin in the Sewer Service Area with approximately 43,000 acres and 10 sub-basins. Because of the topography of this basin, it is very difficult to provide sewer service. Currently, there are no public or private sewer systems in this basin. All wastewater treatment is of the on-site treatment type, generally septic tanks. Several problems exist with leaving the basin as it is today. Septic tanks are considered a consumptive use by the proposed Apalachicola-Chattahoochee-Flint Basin (ACF) Compact, which means that the water used is not credited as a return to the watershed from which it was withdrawn. Limits on consumptive use, as well as a specified wastewater return ratio, are expected to be specified as part of the ACF Compact. Therefore, in order to comply with the ACF Compact, septic tank use will need to be minimized in the future. With many of the existing septic tanks in this basin located in close proximity to the primary drinking water source, Lake Lanier, contamination is a potential problem. Future regulations may require the removal of septic tanks that are located near drinking water sources to protect the watershed and water supply source. Therefore, a plan was developed to provide sewer service to the Lake Lanier basin. Traditional gravity sewers and force mains were initially considered for this area, but after studying the topography of the area, this approach was found to be too costly and difficult to construct. Therefore, low pressure sewer was considered for much of the area. Low pressure sewer consists of a grinder pump located at each customer’s location. The grinder pump generally operates at a pressure less than 60 pounds per square inch (psi). Wastewater leaves a home or office and instead of entering the septic tank, it enters the wet well of the grinder pump. The grinder pump begins operation when the depth of wastewater in the wet well reaches a predetermined level, and pumping continues until the “off” level is reached. The pump grinds the waste into a slurry that is pumped at low pressure to small force mains, often located in a road right-of-way. The wet well is designed to have adequate excess holding capacity to provide wastewater storage during most electrical power outages. The cost of operating the grinder pump is minimal, around $0.70 per month for each household. An additional benefit to this system is that the County does not have to pay for the initial cost of installing each grinder pump. After the force main is constructed, individual customers pay for the grinder pump installation. Other utilities that have constructed low pressure sewer systems charge their customers a monthly maintenance fee to offset increased costs to service a large number of pumps. A service contract can be made with a pump manufacturer that requires them to take care of the routine maintenance and emergency needs of the customers. Where appropriate, gravity sewer is proposed to convey flow to pump stations, which pumps the wastewater to another sub-basin. Three options were considered for this basin.
Paula Yari
verify

Evaluation of the Collection System Page 15
The first option (Option LAN1) consists of low pressure sewer, gravity sewers, pump stations and force mains to convey the wastewater to the proposed Lanier WRF located in Basin 39. The Lanier WRF location is for planning purposes only; the exact location has not been determined. This option is presented schematically in Figure 4.8. The second option (Option LAN2) consists of collecting all the Lanier Basin flows and discharging them to the City of Cumming’s sewer system for treatment. Cumming is planning a new sewer main that will end near the intersection of SR 369 and SR 306. The Lanier Basin could discharge to this new sewer main. Figure 4.9 presents this option schematically. In the third option (Option LAN3), the Lanier WRF would treat not only the wastewater generated in the Lanier Basin, but also the wastewater generated in Upper Settingdown Creek (south and west portion of Basin 38). Figure 4.10 presents a schematic of this option to provide service to the Lanier Basin.

Evaluation of the Collection System Page 16
Insert Figure 4.8

Evaluation of the Collection System Page 17
Insert Figure 4.9

Evaluation of the Collection System Page 18
Insert Figure 4.10

Evaluation of the Collection System Page 19
Settingdown Creek Settingdown Creek Basin has approximately 25,500 acres and is comprised of three sub-basins. The basin is divided in half by the Cumming service area. The majority of Basin 38 is northeast of the Cumming service area. A small portion of Basin 38 is located west of Cumming’s service area along with Basins 26 and 37, and is referred to as Lower Settingdown Creek. Basin 38 north of the Cumming Service Area was further divided due to the location of the Hamptons LAS, a private treatment facility. Forsyth County owns 0.6 MGD of capacity at this facility. The dividing line for the Hamptons service area is east of Hopewell Road and north of Church Road. This area has a limited amount of existing sewer located in the Hamptons subdivision. For both Settingdown Creek Basin options, the Hamptons LAS will continue to be used for treatment of wastewater generated within its existing and expanded service area. Construction of sewer mains along the major creeks in the expanded service area is proposed, as well as a pump station located east of Hopewell Church Road where it intersects Settingdown Creek. The pump station will collect wastewater west of the existing Hamptons service area and pump it back to the facility for treatment. In Upper Settingdown Creek, which consists of Basin 38 north of the Cumming Service Area and west of the Hamptons service area, there are two options for collecting and treating wastewater flows. Both options include constructing sewer mains along Settingdown and Squattingdown Creeks and their major tributaries. The sewers would flow by gravity to a new pump station located at the intersection of SR 369 (Matt Highway) and Settingdown Creek. In the first option (Option SDC1), the pump station pumps the wastewater to Lower Settingdown Creek (into the lower portion of Basin 38 just east of the intersection of SR 369 and Doctor Bramblett Road) where it will be conveyed to the Fowler WRF. In the second option (Option SDC2), the same pump station conveys wastewater along SR 369 to the Lake Lanier Basin where it can either be treated at the proposed Lanier WRF (as part of Option LAN1 or Option LAN3) or discharged to the City of Cumming for treatment (as part of Option LAN2). For the Lower Settingdown Creek basin, which includes Basins 26, 37 and 38 west of the Cumming Service Area, gravity sewers are proposed along Settingdown Creek, Stair Creek, Yellow Creek and Hurricane Creek. These gravity sewers will convey wastewater to the intersection of the Cherokee County boundary and Settingdown Creek. A pump station is proposed at this location that will pump the wastewater to the gravity sewer along Harris Creek just south of SR 20 in the Upper Big Creek basin (Basin 30). In Option SDC1, the Lower Settingdown Creek flows will be combined with the wastewater flows pumped from the Upper Settingdown Creek basin and conveyed to the Fowler WRF. In Option SDC2, the Upper Settingdown Creek basin flows do not flow into Lower Settingdown Creek, resulting in reduced pipe sizes and pump station capacity necessary to convey the Lower Settingdown Creek flows to the Upper Big Creek basin sewers. The latter option also affects (reduces) pipe sizes in Upper Big Creek basin. Figures 4.11 and 4.12 depict layouts of the two sewer system options for Settingdown Creek Basin. Summary Thirteen options were developed to provide sewer service to the Big Creek, Chattahoochee, Lanier and Settingdown Creek drainage basins. The wastewater treatment options are discussed in the next

Evaluation of the Collection System Page 20
section. In Section 6, the collection system options will be combined with wastewater treatment options to develop alternatives for evaluation.

Evaluation of the Collection System Page 21
Insert Figure 4.11 – label SR 369 and other highways identified in text

Evaluation of the Collection System Page 22
Insert Figure 4.12

Section 5: Wastewater Treatment Options
Treatment options were considered using both the existing facilities and constructing new treatment works. Various methods for management of the treated flow from the facilities were also considered.
Plant Locations and Capacities
For County-owned facilities three locations were considered. The Fowler WRF and the proposed Threatt WRF would be located on land the County presently owns. The proposed Lake Lanier WRF would be located on a yet-to-be-determined site located in the Lake Lanier Basin. If this plant were included in the selected plan, the County would need to identify and purchase an acceptable site. Potential capacities for the various options and locations are shown in Table 5.1.
Table 5.1 Potential County-Owned WRFs
Facility Flow Capacity Considered
(MGD)
Fowler WRF 6, 7.5, 8, 9, 10 Lake Lanier WRF 0, 4, 5 Threatt WRF 6, 7, 7.5, 8, 9, 10
Of the existing facilities that are currently privately owned and would receive flow from the County system, the following were considered for use during the planning period:
Table 5-2 Existing Privately Owned Facilities Considered for Master Plan
Facility
Flow Capacity Considered from Forsyth County
(MGD) Dicks Creek LAS 0, 2, 6 Windemere LAS 0, 4 The Hamptons LAS 1
These existing plants would require expansion to increase the amount of wastewater each facility could treat. Ownership of these facilities could continue to be privately held, in which case the County would contract for wastewater treatment services with the owner. Alternately, the County could purchase the present assets at the plants and take over ownership. The County would then use its own funds for installing expansions and would be responsible for operation. Use of the existing privately held wastewater plants could be implemented to supplement the treatment capacity installed at the County’s major treatment plants, or the capacity could be added to the County’s plants.

Wastewater Treatment Options Page 2
Management of Wastewater Effluent
In all of the options developed, the treatment facilities were planned to be water reclamation facilities that incorporate a high level of treatment, producing a highly polished effluent. The effluent from WRFs has a clear water appearance (due to the low turbidity level) and contains very few solids. A high quality effluent is discharged from WRFs, which allows it to be viewed as a resource that can be used for beneficial purposes. One beneficial use of the treated wastewater effluent is outdoor irrigation. This is currently being practiced within the County on golf courses. This practice can be expanded, as new development provides additional landscaping for irrigation. However, the demand for irrigation water is not expected to grow to the extent that the entire county’s treated flow can be managed by this method. Another beneficial use of the treated effluent is to sustain flow in streams and tributaries. Discharging the flow into streams will provide base flow in the receiving stream. Development often reduces the natural recharge of groundwater, resulting in reduced base flow in streams. Highly treated wastewater flow can be used to supplement the natural flow. Another beneficial use is to return the treated effluent to a source of drinking water supply to increase the natural yield. This practice, which is now becoming more commonplace in the western United States, is termed indirect potable water reuse. For this means of managing treated flow to be viable, the treatment works need to include the highest level of treatment standards, reliability and redundancy available. Discharging treated flow into Lake Lanier, if selected, should be considered as indirect potable water reuse, and the treatment works will need to be developed to meet these standards. A final beneficial use for the treated effluent is to discharge it into the Chattahoochee River to sustain the river’s flow, which would help meet the ACT/ACF Compacts’ proposed return ratios. Communities downstream from Atlanta on the Chattahoochee River and the states of Florida and Alabama have expressed concerns that the metro-Atlanta region is unduly depleting the flow in the Chattahoochee River. Because Forsyth County withdraws water from the Chattahoochee Basin for use as drinking water, returning the treated flow to the river will sustain the resource for other users. The Chattahoochee River, as it flows past Forsyth County, is a valued recreational resource and supports trout fishing. These uses raise special concerns that need to be considered before a discharge into the river is allowed. Management of the treated wastewater flow is regulated by the EPD. EPD included two discharge locations for treated wastewater flow for Forsyth County in its resource allocations which are presented in Table 5.3.

Wastewater Treatment Options Page 3
Table 5.3 EPD’s Resource Planning for Treated Wastewater Flow from Forsyth County
Resource Maximum Month Flow Capacity
(MGD)
Chattahoochee River 2004 and after 2008 and after
10 20
Lake Lanier (Joint with Cumming) 23 These capacities are adequate for the projected flows through the end of the planning period. As for treatment standards for the water quality of the treated wastewater flow, EPD has indicated that planning should be based on the parameters listed in Table 5.4.
Table 5.4 EPD’s Metro-Atlanta Chattahoochee Treatment Standards
Parameter Value Biochemical Oxygen Demand (BOD5) 2.9 mg/L 1 Ammonia-Nitrogen (NH3-N) 0.5 mg/L 1 Organic-Nitrogen 1.5 mg/L 1 Phosphorus (P) 0.13 mg/L Total Suspended Solids (TSS) 5 mg/L Turbidity 3 NTU Fecal Coliform 23 / 100 ml Dissolved Oxygen 7 mg/L PH 6 to 9 SU
1 Seasonal limits are applicable for discharges to the Chattahoochee River and Lake Lanier
These treatment standards include some of the most restrictive limits used anywhere in the State. Treated flow meeting these standards would be appropriate for irrigation uses, as well as discharging to surface waters.

Section 6: Alternative Development and Evaluation
This section presents how alternatives were developed from the options that have been discussed in Sections 4 and 5. Cost estimates and ranking of alternatives based on economic and non-economic factors are also presented.
Alternatives Development
Alternatives to provide wastewater collection throughout the Sewer Service Area were developed by combining options developed for each drainage basin. Initially, 54 alternatives were developed through this process. As this Plan was nearly completed, an opportunity arose for the County to obtain land at the MacFarland Road and Big Creek location (Option LBC2), which caused two of the Lower Big Creek options (Options LBC1 and LBC3) to be dropped from further consideration. As a result, 18 alternatives were retained for further evaluation.
For each alternative, a detailed cost estimate was prepared. The cost estimates include the following information:
• Gravity sewer and force mains: cost to install a particular diameter pipe based on the length of the project, easement acquisition, survey, and engineering and contingency.
• Pump stations: cost to provide the firm pumping capacity required, engineering and contingency, operations and maintenance of the pump station, and energy costs
• Treatment facilities: cost of constructing the facility, effluent pumping, river/lake diffuser or land application site, engineering and contingency, operations and maintenance of the facilities, energy costs, and site purchase if needed.
Table 6.1 presents a summary of the unit costs used to estimate the total project costs for each alternative.

Alternative Development and Evaluation Page 2
Table 6.1 Summary of Unit Costs
Sewer Line Costs Force Main Costs
Diameter
Total Unit Cost Diameter
Total Unit Cost
(in) ($/LF) (in) ($/LF) 8 82 6 42 10 85 8 65 12 90 10 80 15 102 12 95 18 120 16 105 21 143 20 115 24 152 24 125 27 166 N/A N/A 30 180 30 165 36 197 36 175 42 237 42 210 48 266 48 295 54 302 54 325
N/A = not applicable
The total unit cost to install gravity sewers includes the construction cost, design survey, easement acquisition, construction administration, resident inspection, rock, design engineering, and erosion and soil control measures. The total unit cost to install force mains includes all the elements of the gravity sewer plus an additional component for resurfacing roadways and jack and bore.
Table 6.2 presents a summary of the alternatives and their estimated costs. The cost per million gallons of wastewater sewered is also presented in the table to compare the alternatives. More detailed cost estimating information is provided in Appendix C.

Alternative Development and Evaluation Page 3
Table 6.2 Cost Estimate Summary
Millions of Dollars
Alternative Number Description
Total Sewer, Force Main,
& Pump Station
Capital Cost
Total Treatment
Cost Total Capital
Cost
Total Average Annual
O&M Cost
Estimated Service Life
(years)
Total Present Value
(million $)
Marginal Cost,
$/million gallons
1 UBC1 LBC2 CHA1 SDC1 LAN1 $197 $201 $398 $11 30 $553 $32.6 2 UBC1 LBC2 CHA2 SDC1 LAN1 $197 $250 $447 $12 30 $609 $35.9 3 UBC1 LBC2 CHA3 SDC1 LAN1 $205 $214 $419 $12 30 $581 $34.3 4 UBC1 LBC2 CHA1 SDC2 LAN3 $199 $201 $400 $11 30 $556 $32.8 5 UBC1 LBC2 CHA2 SDC2 LAN3 $200 $247 $447 $12 30 $609 $35.9 6 UBC1 LBC2 CHA3 SDC2 LAN3 $208 $214 $422 $12 30 $584 $34.4 7 UBC1 LBC2 CHA1 SDC1 LAN2 $204 $193 $397 $15 30 $598 $35.2 8 UBC1 LBC2 CHA2 SDC1 LAN2 $205 $256 $461 $15 30 $668 $39.4 9 UBC1 LBC2 CHA3 SDC1 LAN2 $213 $206 $419 $15 30 $626 $36.9 10 UBC2 LBC2 CHA1 SDC1 LAN1 $197 $201 $398 $11 30 $554 $32.7 11 UBC2 LBC2 CHA2 SDC1 LAN1 $198 $250 $448 $12 30 $610 $36.0 12 UBC2 LBC2 CHA3 SDC1 LAN1 $206 $214 $420 $12 30 $582 $34.3 13 UBC2 LBC2 CHA1 SDC2 LAN3 $200 $201 $401 $11 30 $557 $32.8 14 UBC2 LBC2 CHA2 SDC2 LAN3 $201 $247 $448 $12 30 $610 $36.0 15 UBC2 LBC2 CHA3 SDC2 LAN3 $209 $214 $423 $12 30 $585 $34.5 16 UBC2 LBC2 CHA1 SDC1 LAN2 $205 $193 $398 $14 30 $593 $35.0 17 UBC2 LBC2 CHA2 SDC1 LAN2 $206 $256 $462 $15 30 $663 $39.1 18 UBC2 LBC2 CHA3 SDC1 LAN2 $214 $206 $420 $15 30 $621 $36.6
Description of Options: UBC1 Gravity sewer through basin to Fowler WRF for treatment UBC2 Pump station and force main north of the Polo Fields; gravity rest of basin to Fowler WRF for treatment LBC2 Lower Big Creek - Option 2: Gravity to Node BC-1-019 (McFarland Rd at Shiloh Rd) PS then pump back to Fowler WRF CHA1 Chattahoochee - Option 1: Gravity along the Chattahoochee River to the Threatt WRF CHA2 Chattahoochee - Option 2: Two Regional Facilities in Chattahoochee Basin (Windermere LAS and Dick's Creek LAS) CHA3 Chattahoochee - Option 3: Regional PS Pumps wastewater to Threatt WRF SDC1 Settingdown Creek - Option 1: Hamptons service area treated at Hamptons LAS; Upper and Lower SDC pumped to Fowler WRF SDC2 Settingdown Creek - Option 2: Hamptons service area treated at Hamptons LAS; Upper SDC pumped to Lanier WRF and Lower SDC pumped to Fowler WRF LAN1 Lake Lanier - Option 1: Combination of gravity, low pressure sewer, and force mains collect wastewater and send to Lanier WRF for treatment LAN2 Lake Lanier - Option 2: Combination of gravity, low pressure sewer, and force mains collect wastewater and send to City of Cumming LAN3 Lake Lanier - Option 3: Combination of gravity, low pressure sewer, and force mains collect wastewater and send to Lanier WRF for treatment Upper SD Creek flows pumped to basin for treatment

Alternative Development and Evaluation Page 4
Alternatives Comparison
Once the cost estimate for each alternative was completed, a ranking system of economic and non-economic factors was developed to screen each alternative. Table 6.3 presents a summary of the economic and non-economic factors and how these were weighted.
Table 6.3 Criteria for Comparing Alternatives
Criterion Rating Scale
Weighting Factor
Maximum Possible Points Definition
Economic Criteria
Marginal Cost 1-10 50 500 Capital and O&M cost per MGD
Provide affordable systems for end users 1-10 5 50
Have a reasonable cost for the typical user
Non-Economic Criteria
Ease of obtaining required permits 1-10 10 100 Ability to obtain required permits for the project
Potential environmental impacts 1-10 10 100 Limit impact on wetlands and other habitats
Compatibility with MNGWPD long-term plan 1-10 5 50
Ease of integration of the sewer master plan with the long-term strategies of the MNGWPD plan
Control consumptive use 1-10 10 100
Reduction or elimination of consumptive use practices to increase streamflow
Be neighborhood friendly 1-10 5 50
Integrate facilities into local neighborhoods so they are community assets
Develop opportunities for multi-purpose projects 1-10 5 50
Identify opportunities where infrastructure can be incorporated into multi-purpose projects (i.e., greenway, riparian buffers, wetlands)
Total 100 1000
For each alternative, a component from each of the five basins is represented. Since the maximum ranking is 10 for each criterion, each basin’s option could score at most 2 points. Therefore, on the rating scale each basin’s option could receive a 0, 1, or a 2 depending on its ability to meet a particular criterion. Take for example the ability to obtain a permit for a particular option. If a basin’s option had a high probability of obtaining a permit then it scored a two (2), if it was neutral then it scored a one, and if it was considered difficult to obtain a permit then it scored a zero. The score for each basin’s option was totaled to compute the rating for each criterion. Each criterion was multiplied by the weighting factor to obtain the total points for each criterion. This process was completed for each of the criteria listed and is presented in Tables 6.4 through 6.10.

Alternative Development and Evaluation Page 5
Provide Affordable Systems for End Users. This criterion evaluated the ability of each alternative to provide an affordable system for the end users. A total cost per person per year was calculated based on the economic information provided in Table 6.2, page 6-3. Table 6.4 presents a summary of the total resident cost per year and its associated ratings. The table has been sorted in descending order to better present the method used to rate each alternative. The following method was used to assign ratings:
• Rating = 10, if cost was less than $240 per year
• Rating = 8, if cost was between $240 and $250 per year
• Rating = 6, if cost was between $250 and $260 per year
• Rating = 4, if cost was between $260 and $270 per year
• Rating = 2 if greater than $270 per year
Table 6.4 Provide Affordable Systems for End Users
Total Resident
Provide Affordable Systems for End Users
Cost per Wt. Factor = 5 Alternative Number Description Year Rating Points
1 UBC1 LBC2 CHA1 SDC1 LAN1 $231 10 50 10 UBC2 LBC2 CHA1 SDC1 LAN1 $231 10 50 4 UBC1 LBC2 CHA1 SDC2 LAN3 $232 10 50 13 UBC2 LBC2 CHA1 SDC2 LAN3 $233 10 50 3 UBC1 LBC2 CHA3 SDC1 LAN1 $243 8 40 12 UBC2 LBC2 CHA3 SDC1 LAN1 $243 8 40 6 UBC1 LBC2 CHA3 SDC2 LAN3 $244 8 40 15 UBC2 LBC2 CHA3 SDC2 LAN3 $244 8 40 16 UBC2 LBC2 CHA1 SDC1 LAN2 $248 8 40 7 UBC1 LBC2 CHA1 SDC1 LAN2 $250 6 30 2 UBC1 LBC2 CHA2 SDC1 LAN1 $254 6 30 5 UBC1 LBC2 CHA2 SDC2 LAN3 $255 6 30 11 UBC2 LBC2 CHA2 SDC1 LAN1 $255 6 30 14 UBC2 LBC2 CHA2 SDC2 LAN3 $255 6 30 18 UBC2 LBC2 CHA3 SDC1 LAN2 $260 4 20 9 UBC1 LBC2 CHA3 SDC1 LAN2 $261 4 20 17 UBC2 LBC2 CHA2 SDC1 LAN2 $277 2 10 8 UBC1 LBC2 CHA2 SDC1 LAN2 $279 2 10

Alternative Development and Evaluation Page 6
Ease of Obtaining Necessary Permits. The first non-economic criterion to be evaluated was the ease of obtaining necessary permits to construct the projects included in each option. The summary of the rating for this criterion is presented below in Table 6.5. This was a qualitative analysis based on current EPD guidelines for permitting. The rankings do not indicate the actual ability of getting the permit, but describe the degree of ease with which those permits could be obtained.
Option UBC1 was ranked lower than Option UBC2 because that option requires a sewer to be constructed through wetlands. Option CHA1 was ranked lower than CHA2 or CHA3 because that option requires a gravity sewer to be constructed along the Chattahoochee River, which makes the permitting more difficult to obtain due to additional regulatory requirements in the Chattahoochee Corridor. Options LAN1 and LAN3 were ranked lower than Option LAN2 because both of those options require the construction of a new WRF that will have a discharge to Lake Lanier. Obtaining a new discharge permit to Lake Lanier will be more difficult than discharging to the City of Cumming’s sewer. Option SDC1 was ranked higher than Option SDC2 because of the location where the wastewater is conveyed for treatment. In Option SDC1 wastewater is treated at the Fowler WRF, which is already permitted; however, in Option SDC2 the wastewater is treated at the Lanier WRF, which will have more difficulty in obtaining a permit.
Table 6.5 Ease of Obtaining Permits
Ease of Obtaining
Permits
Wt. Factor = 10Alternative Number Description UBC LBC CHA SDC LAN Rating Points
1 UBC1 LBC2 CHA1 SDC1 LAN1 1 2 0 2 0 5 50 2 UBC1 LBC2 CHA2 SDC1 LAN1 1 2 1 2 0 6 60 3 UBC1 LBC2 CHA3 SDC1 LAN1 1 2 2 2 0 7 70 4 UBC1 LBC2 CHA1 SDC2 LAN3 1 2 0 1 0 4 40 5 UBC1 LBC2 CHA2 SDC2 LAN3 1 2 1 1 0 5 50 6 UBC1 LBC2 CHA3 SDC2 LAN3 1 2 2 1 0 6 60 7 UBC1 LBC2 CHA1 SDC1 LAN2 1 2 0 2 2 7 70 8 UBC1 LBC2 CHA2 SDC1 LAN2 1 2 1 2 2 8 80 9 UBC1 LBC2 CHA3 SDC1 LAN2 1 2 2 2 2 9 90 10 UBC2 LBC2 CHA1 SDC1 LAN1 2 2 0 2 0 6 60 11 UBC2 LBC2 CHA2 SDC1 LAN1 2 2 1 2 0 7 70 12 UBC2 LBC2 CHA3 SDC1 LAN1 2 2 2 2 0 8 80 13 UBC2 LBC2 CHA1 SDC2 LAN3 2 2 0 1 0 5 50 14 UBC2 LBC2 CHA2 SDC2 LAN3 2 2 1 1 0 6 60 15 UBC2 LBC2 CHA3 SDC2 LAN3 2 2 2 1 0 7 70 16 UBC2 LBC2 CHA1 SDC1 LAN2 2 2 0 2 2 8 80 17 UBC2 LBC2 CHA2 SDC1 LAN2 2 2 1 2 2 9 90 18 UBC2 LBC2 CHA3 SDC1 LAN2 2 2 2 2 2 10 100

Alternative Development and Evaluation Page 7
Potential Environmental Impacts. The next criterion evaluated was the potential for environmental impacts. Evaluation of this criterion was also qualitative based on a particular option’s impact on wetlands or habitat. This analysis does not represent a detailed environmental impact analysis, only a cursory view of the possible effects the projects could have on the environment.
All construction projects temporarily impact the environment in which they are occurring. However, once a sewer or force main is constructed and properly maintained, the long-term environmental impacts will generally be limited. A more lasting effect occurs when wetlands are disturbed or when existing habitats are permanently changed. Since some level of disturbance is associated with each option, none of the options received a score of two; most options received a score of one. However, Options UBC1 and CHA1 scored a zero due to their potential impact on wetlands and riparian habitat. Table 6.6 presents the rating for each option for the potential environmental impacts criterion.
Table 6.6 Potential Environmental Impacts
Potential Environmental
lmpacts Wt. Factor = 10Alternative
Number Description UBC LBC CHA SDC LAN Rating Points
1 UBC1 LBC2 CHA1 SDC1 LAN1 0 1 0 1 1 3 30 2 UBC1 LBC2 CHA2 SDC1 LAN1 0 1 1 1 1 4 40 3 UBC1 LBC2 CHA3 SDC1 LAN1 0 1 1 1 1 4 40 4 UBC1 LBC2 CHA1 SDC2 LAN3 0 1 0 1 1 3 30 5 UBC1 LBC2 CHA2 SDC2 LAN3 0 1 1 1 1 4 40 6 UBC1 LBC2 CHA3 SDC2 LAN3 0 1 1 1 1 4 40 7 UBC1 LBC2 CHA1 SDC1 LAN2 0 1 0 1 1 3 30 8 UBC1 LBC2 CHA2 SDC1 LAN2 0 1 1 1 1 4 40 9 UBC1 LBC2 CHA3 SDC1 LAN2 0 1 1 1 1 4 40 10 UBC2 LBC2 CHA1 SDC1 LAN1 1 1 0 1 1 4 40 11 UBC2 LBC2 CHA2 SDC1 LAN1 1 1 1 1 1 5 50 12 UBC2 LBC2 CHA3 SDC1 LAN1 1 1 1 1 1 5 50 13 UBC2 LBC2 CHA1 SDC2 LAN3 1 1 0 1 1 4 40 14 UBC2 LBC2 CHA2 SDC2 LAN3 1 1 1 1 1 5 50 15 UBC2 LBC2 CHA3 SDC2 LAN3 1 1 1 1 1 5 50 16 UBC2 LBC2 CHA1 SDC1 LAN2 1 1 0 1 1 4 40 17 UBC2 LBC2 CHA2 SDC1 LAN2 1 1 1 1 1 5 50 18 UBC2 LBC2 CHA3 SDC1 LAN2 1 1 1 1 1 5 50

Alternative Development and Evaluation Page 8
Control Consumptive Use. The third criterion evaluated the ability of each option to effectively reduce consumptive use. Those options that reduced the use of septic tanks scored higher. In addition, those options that included wastewater treatment facilities with stream discharges scored higher than those options that relied on land application to manage the effluent from the treatment facilities. Many of the options are interdependent. For example, the alternatives that include Option CHA2 scored lower because they would rely on land application of effluent from the Fowler WRF, Dick’s Creek LAS and Windermere LAS. Since alternatives that include Option CHA2 affect the effluent management of the Fowler WRF as well, the Options UBC1, UBC2, LBC2 and SDC1 options (when coupled with CHA2) also scored a zero. All other options have the majority of their effluent discharged to a stream. All options reduce the use of septic tanks in the County. Table 6.7 presents a summary of the ratings for each alternative under the control consumptive use criterion.
Table 6.7 Control Consumptive Use
Control Consumptive
Use Wt. Factor = 10 Alternative
Number Description UBC LBC CHA SDC LAN Rating Points
1 UBC1 LBC2 CHA1 SDC1 LAN1 2 2 2 2 2 10 100 2 UBC1 LBC2 CHA2 SDC1 LAN1 0 0 0 0 2 2 40 3 UBC1 LBC2 CHA3 SDC1 LAN1 2 2 2 2 2 10 100 4 UBC1 LBC2 CHA1 SDC2 LAN3 2 2 2 2 2 10 100 5 UBC1 LBC2 CHA2 SDC2 LAN3 0 0 0 2 2 4 40 6 UBC1 LBC2 CHA3 SDC2 LAN3 2 2 2 2 2 10 100 7 UBC1 LBC2 CHA1 SDC1 LAN2 2 2 2 2 2 10 100 8 UBC1 LBC2 CHA2 SDC1 LAN2 0 0 0 0 2 2 40 9 UBC1 LBC2 CHA3 SDC1 LAN2 2 2 2 2 2 10 100 10 UBC2 LBC2 CHA1 SDC1 LAN1 2 2 2 2 2 10 100 11 UBC2 LBC2 CHA2 SDC1 LAN1 0 0 0 0 2 2 40 12 UBC2 LBC2 CHA3 SDC1 LAN1 2 2 2 2 2 10 100 13 UBC2 LBC2 CHA1 SDC2 LAN3 2 2 2 2 2 10 100 14 UBC2 LBC2 CHA2 SDC2 LAN3 0 0 0 2 2 4 40 15 UBC2 LBC2 CHA3 SDC2 LAN3 2 2 2 2 2 10 100 16 UBC2 LBC2 CHA1 SDC1 LAN2 2 2 2 2 2 10 100 17 UBC2 LBC2 CHA2 SDC1 LAN2 0 0 0 0 2 2 40 18 UBC2 LBC2 CHA3 SDC1 LAN2 2 2 2 2 2 10 100

Alternative Development and Evaluation Page 9
Compatibility with MNGWPD Long-Term Plans. The ease of integration of the components of this Sewer Master Plan with MNGWPD Long-Term Wastewater Plan was evaluated next. The Long-Term Wastewater Plan is encouraging a reduction in consumptive use, returning effluent to streams, encouraging indirect potable reuse, and efficient utilization of resources. Therefore, those options that were more consistent with these ideas scored higher. Those options that will rely on land application scored lower. Those options that return wastewater to a water supply source, such as the Options LAN1, LAN3, CHA1 and CHA3 scored high. Option LAN2 scored high as well because it consists of two utilities working together and utilizing available capacity efficiently. Table 6.8 presents a summary of the ratings for each alternative for the compatibility with MNGWPD Long-Term Wastewater Plan.
Table 6.8 Compatibility with MNGWPD Long-Term Plans
Compatibility with
MNGWPD Long-Term
Plans Wt. Factor = 5 Alternative
Number Description UBC LBC CHA SDC LAN Rating Points
1 UBC1 LBC2 CHA1 SDC1 LAN1 2 2 2 2 2 10 45 2 UBC1 LBC2 CHA2 SDC1 LAN1 0 0 0 2 2 4 15 3 UBC1 LBC2 CHA3 SDC1 LAN1 2 2 1 2 2 9 40 4 UBC1 LBC2 CHA1 SDC2 LAN3 2 2 2 2 2 10 50 5 UBC1 LBC2 CHA2 SDC2 LAN3 0 0 0 2 2 4 20 6 UBC1 LBC2 CHA3 SDC2 LAN3 2 2 1 2 2 9 45 7 UBC1 LBC2 CHA1 SDC1 LAN2 2 2 2 2 2 10 45 8 UBC1 LBC2 CHA2 SDC1 LAN2 0 0 0 2 2 4 15 9 UBC1 LBC2 CHA3 SDC1 LAN2 2 2 1 2 2 9 40 10 UBC2 LBC2 CHA1 SDC1 LAN1 2 2 2 2 2 10 45 11 UBC2 LBC2 CHA2 SDC1 LAN1 0 0 0 2 2 4 15 12 UBC2 LBC2 CHA3 SDC1 LAN1 2 2 1 2 2 9 40 13 UBC2 LBC2 CHA1 SDC2 LAN3 2 2 2 2 2 11 50 14 UBC2 LBC2 CHA2 SDC2 LAN3 0 0 0 2 2 5 20 15 UBC2 LBC2 CHA3 SDC2 LAN3 2 2 1 2 2 10 45 16 UBC2 LBC2 CHA1 SDC1 LAN2 2 2 2 2 2 10 45 17 UBC2 LBC2 CHA2 SDC1 LAN2 0 0 0 2 2 4 15 18 UBC2 LBC2 CHA3 SDC1 LAN2 2 2 1 2 2 9 40
Paula Yari
may need to add something about larger/fewer facilities

Alternative Development and Evaluation Page 10
Be Neighborhood Friendly. Table 6.9 presents a summary of the ratings for each alternative for the criterion that deals with how well projects can be integrated into communities and neighborhoods. Since the majority of these facilities have not been constructed, with proper planning, each could be integrated into the community so that it would be a beneficial addition. The only options that did not score well under this criterion were Options CHA2 and CHA3 due to the large number of pump station facilities that each requires.
Table 6.9 Be Neighborhood Friendly
Neighborhood Friendly
Wt. Factor = 5 Alternative Number Description UBC LBC CHA SDC LAN Rating Points
1 UBC1 LBC2 CHA1 SDC1 LAN1 2 2 2 2 2 10 50 2 UBC1 LBC2 CHA2 SDC1 LAN1 2 2 0 2 2 8 40 3 UBC1 LBC2 CHA3 SDC1 LAN1 2 2 1 2 2 9 45 4 UBC1 LBC2 CHA1 SDC2 LAN3 2 2 2 2 2 10 50 5 UBC1 LBC2 CHA2 SDC2 LAN3 2 2 0 2 2 8 40 6 UBC1 LBC2 CHA3 SDC2 LAN3 2 2 1 2 2 9 45 7 UBC1 LBC2 CHA1 SDC1 LAN2 2 2 2 2 2 10 50 8 UBC1 LBC2 CHA2 SDC1 LAN2 2 2 0 2 2 8 40 9 UBC1 LBC2 CHA3 SDC1 LAN2 2 2 1 2 2 9 45 10 UBC2 LBC2 CHA1 SDC1 LAN1 2 2 2 2 2 10 50 11 UBC2 LBC2 CHA2 SDC1 LAN1 2 2 0 2 2 8 40 12 UBC2 LBC2 CHA3 SDC1 LAN1 2 2 1 2 2 9 45 13 UBC2 LBC2 CHA1 SDC2 LAN3 2 2 2 2 2 10 50 14 UBC2 LBC2 CHA2 SDC2 LAN3 2 2 0 2 2 8 40 15 UBC2 LBC2 CHA3 SDC2 LAN3 2 2 1 2 2 9 45 16 UBC2 LBC2 CHA1 SDC1 LAN2 2 2 2 2 2 10 50 17 UBC2 LBC2 CHA2 SDC1 LAN2 2 2 0 2 2 8 40 18 UBC2 LBC2 CHA3 SDC1 LAN2 2 2 1 2 2 9 45

Alternative Development and Evaluation Page 11
Opportunities for Multi-Use Projects. Table 6.10 presents a summary of the ratings for each alternative to be used in multiple ways. Since most of the facilities will be new, they could also be planned with other projects in mind. Therefore, the majority of the options scored high in this category, such as Option CHA1, which requires gravity sewer along the Chattahoochee River. Since there is no park land currently along the Chattahoochee River in this area, an easement or right-of-way could be combined with other uses such as a trail system that would not only provide recreational use but also be a buffer area. The only options that did not score high are Options CHA2 and CHA3 due to the large number of facilities that may make it more difficult to implement multi-use projects.
Table 6.10 Opportunities for Multi-Use projects
Opportunities for Multi-Use
projects
Wt. Factor = 5 Alternative Number Description UBC LBC CHA SDC LAN Rating Points
1 UBC1 LBC2 CHA1 SDC1 LAN1 2 2 2 2 2 10 50 2 UBC1 LBC2 CHA2 SDC1 LAN1 2 2 1 2 2 9 45 3 UBC1 LBC2 CHA3 SDC1 LAN1 2 2 1 2 2 9 45 4 UBC1 LBC2 CHA1 SDC2 LAN3 2 2 2 2 1 9 45 5 UBC1 LBC2 CHA2 SDC2 LAN3 2 2 1 2 1 8 40 6 UBC1 LBC2 CHA3 SDC2 LAN3 2 2 1 2 1 8 40 7 UBC1 LBC2 CHA1 SDC1 LAN2 2 2 2 2 2 10 50 8 UBC1 LBC2 CHA2 SDC1 LAN2 2 2 1 2 2 9 45 9 UBC1 LBC2 CHA3 SDC1 LAN2 2 2 1 2 2 9 45 10 UBC2 LBC2 CHA1 SDC1 LAN1 2 2 2 2 2 10 50 11 UBC2 LBC2 CHA2 SDC1 LAN1 2 2 1 2 2 9 45 12 UBC2 LBC2 CHA3 SDC1 LAN1 2 2 1 2 2 9 45 13 UBC2 LBC2 CHA1 SDC2 LAN3 2 2 2 2 1 9 45 14 UBC2 LBC2 CHA2 SDC2 LAN3 2 2 1 2 1 8 40 15 UBC2 LBC2 CHA3 SDC2 LAN3 2 2 1 2 1 8 40 16 UBC2 LBC2 CHA1 SDC1 LAN2 2 2 2 2 2 10 50 17 UBC2 LBC2 CHA2 SDC1 LAN2 2 2 1 2 2 9 45 18 UBC2 LBC2 CHA3 SDC1 LAN2 2 2 1 2 2 9 45
After all the non-economic factors were rated and assigned points based on the weighting factors, the total points for each alternative were summed. The alternatives were then sorted in descending order; the alternative with the highest number of points is the recommended strategy. Table 6.11 presents the ranking of each alternative.

Alternative Development and Evaluation Page 12
Table 6.11 Comparison of Alternatives
Marginal Cost Affordable for
End Users
Ease of Obtaining
Permits Environmental
lmpacts
Compatibility with MNGWPD
Long-Term Plans
Control Consumptive
Use Neighborhood
Friendly
Opportunities for Multi-Use
projects
Wt. Factor = 10 Wt. Factor = 5 Wt. Factor = 10 Wt. Factor = 10 Wt. Factor = 5 Wt. Factor = 10 Wt. Factor = 5 Wt. Factor = 5 Alternative Number Description Rating Points Rating Points Rating Points Rating Points Rating Points Rating Points Rating Points Rating Points
Total Points
10 UBC2 LBC2 CHA1 SDC1 LAN1 10 500 10 50 6 60 4 40 10 50 10 100 10 50 10 50 90013 UBC2 LBC2 CHA1 SDC2 LAN3 10 500 10 50 5 50 4 40 10 50 10 100 10 50 9 45 8851 UBC1 LBC2 CHA1 SDC1 LAN1 10 500 10 50 5 50 3 30 10 50 10 100 10 50 10 50 8804 UBC1 LBC2 CHA1 SDC2 LAN3 10 500 10 50 4 40 3 30 10 50 10 100 10 50 9 45 86512 UBC2 LBC2 CHA3 SDC1 LAN1 8 400 8 40 8 80 5 50 9 45 10 100 9 45 9 45 80515 UBC2 LBC2 CHA3 SDC2 LAN3 8 400 8 40 7 70 5 50 9 45 10 100 9 45 8 40 7903 UBC1 LBC2 CHA3 SDC1 LAN1 8 400 8 40 7 70 4 40 9 45 10 100 9 45 9 45 7856 UBC1 LBC2 CHA3 SDC2 LAN3 8 400 8 40 6 60 4 40 9 45 10 100 9 45 8 40 77016 UBC2 LBC2 CHA1 SDC1 LAN2 4 200 8 40 8 80 4 40 10 50 10 100 10 50 10 50 71014 UBC2 LBC2 CHA2 SDC2 LAN3 6 300 6 30 7 70 3 30 10 50 10 100 10 50 10 50 68011 UBC2 LBC2 CHA2 SDC1 LAN1 6 300 6 30 5 50 4 40 4 20 4 40 8 40 8 40 5607 UBC1 LBC2 CHA1 SDC1 LAN2 4 200 6 30 6 60 4 40 4 20 2 20 8 40 9 45 5555 UBC1 LBC2 CHA2 SDC2 LAN3 6 300 6 30 6 60 5 50 4 20 4 40 8 40 8 40 4802 UBC1 LBC2 CHA2 SDC1 LAN1 6 300 6 30 7 70 5 50 4 20 2 20 8 40 9 45 47518 UBC2 LBC2 CHA3 SDC1 LAN2 2 100 4 20 10 100 5 50 9 45 10 100 9 45 9 45 6059 UBC1 LBC2 CHA3 SDC1 LAN2 2 100 4 20 9 90 4 40 9 45 10 100 9 45 9 45 58517 UBC2 LBC2 CHA2 SDC1 LAN2 2 100 2 10 9 90 5 50 4 20 2 20 8 40 9 45 3758 UBC1 LBC2 CHA2 SDC1 LAN2 2 100 2 10 8 80 4 40 4 20 2 20 8 40 9 45 355

Alternative Development and Evaluation Page 13
As shown in Table 6.11, Alternative 10 ranked higher than all other alternatives and is therefore the recommended plan for providing wastewater collection and treatment in the Sewer Service Area. It should be noted that all of the alternatives developed in this Plan are technically viable; therefore, other alternatives could be selected depending on the specific needs of the community and opportunities that may arise. The components of Alternative 10 are summarized in Section 7.

Section 7: Recommendations
This document presents a plan for providing sewer service to the Sewer Service Area. The service area was broken into major drainage basins and sub-basins to estimate wastewater flows, both total generated and sewered for each area. The flows were based on population projections completed for the Forsyth County Traffic Master Plan.
A sewer system model was developed for each major drainage basin to evaluate the needs of the system and to explore options for serving each basin. Wastewater treatment facilities were also evaluated, including the capacity and type of treatment required. Management of effluent was also discussed.
Alternatives were developed by combining the options for each basin. The alternatives were then ranked based on economic and non-economic factors. Based on this evaluation, Alternative 10 is the recommended plan for providing wastewater service to Forsyth County. Figure 7.1 shows Alternative 10 for all basins. Alternative 10 includes the following components:
• Gravity sewer through the Upper Big Creek Basin (Option UBC2 – Figure 4.4) and a pump station located at MacFarland Road at Big Creek in the Lower Big Creek Basin (Option LBC2 – Figure 4.1). The flows from both of these basins are conveyed to the Fowler WRF for treatment. The highly treated effluent from this facility is then pumped to the proposed Threatt WRF for discharge to the Chattahoochee River. The force main used to transport the effluent from the Fowler WRF could also be designated as a reuse corridor where customers could obtain the effluent for irrigation purposes. However, the cost of constructing a reuse pipe network was not included in this analysis.
• Gravity sewer along the Chattahoochee River (Option CHA1 – Figure 4.5) would provide sewer service to the Chattahoochee River Basin. A new 9-MGD WRF would be constructed at the Threatt property that would discharge highly treated effluent to the Chattahoochee River. This facility would be capable of treating all sewered wastewater flows generated in the Chattahoochee Basin; therefore, the small, private facilities would no longer be required. As these facilities approach the end of their useful lives, a connection to the Forsyth County sewer system could be made, and these facilities would then be taken out of operation.
• In the Settingdown Creek Basin (Option SDC1 – Figure 4.11), two service areas would be delineated. One would be located in the area surrounding the Hamptons LAS while the remainder of the basin would have its flow transported around the Cumming service area, through the Lower Settingdown Creek Basin and discharged to the Upper Big Creek sewer system, which would convey the flow to the Fowler WRF for treatment. With these flows added to the Big Creek flows the capacity of the Fowler WRF needed is 9 MGD.
• In the Lake Lanier Basin (Option LAN1 – Figure 4.8), a combination of low pressure sewers, gravity sewers, pump stations and force mains are recommended to convey the flow to the Lanier WRF. The Lanier WRF will have a 4-MGD capacity and will most likely discharge highly treated effluent to a tributary of Lake Lanier.

Recommendations Page 2
• In the Etowah River Basin, no publicly owned sewer system is planned to be installed before 2025. However, privately owned facilities will develop in this area before the end of the planning period.
For areas where wastewater service is planned in the future, it is the goal of the Forsyth County Water & Sewer Department to avoid conflicts with private service systems. In cases where sewer service is planned in the future but not presently available, it may be necessary for a developer to implement a local treatment system. Each private treatment system should be coordinated with the County and sized for future connection to the County collection system once it has expanded into the area. Once the system is completed and operational, it should be turned over to the County for operation. This will allow the County to provide the residents with the most economical solution for providing wastewater collection and treatment services. All sewer lines installed by developers should be sized according to this Master Plan regardless of the size needed for the development.

FORSYTH COUNTY COMPREHENSIVE PLAN
Appendix D
SUBAREA LAND USE REPORTS

Forsyth County Comprehensive Plan
Chestatee Subarea Land Use Report
September 25, 2003

Table of Contents I. Introduction ................................................................................................................. 1
A) Purpose............................................................................................................ 1 B) Scope............................................................................................................... 1 C) Location ........................................................................................................... 3
II. Inventory of Existing Conditions ................................................................................. 3
A) Description of Existing Land Uses ................................................................... 3 B) Environmentally Sensitive Areas...................................................................... 3
1. Historic Resources................................................................................ 3 2. Water Resources .................................................................................. 5 3. Steep Slope .......................................................................................... 5 4. Conservation & Park Lands .................................................................. 5
C) Historic Development Patterns ........................................................................ 7 1. Demographics....................................................................................... 7 2. Development Activity ............................................................................ 8
D) Future Development Trends ............................................................................ 9 1. Future Infrastructure ............................................................................. 9 2. Transitional Areas............................................................................... 10 3. Current Land Use Policies .................................................................. 10
E) Trend Scenario .............................................................................................. 12 1. Methodology ....................................................................................... 12 2. Trend Scenario Map ........................................................................... 13
III. Subarea Committee Recommendations.................................................................. 15
A) Chestatee Subarea Vision ............................................................................. 15 B) Policy Recommendations............................................................................... 15 C) Chestatee Land Use Plan Map (Updated December 9, 2003)....................... 16
Appendix ....................................................................................................................... 21
Jordan, Jones & Goulding, Inc. Chestatee Subarea Land Use Report i

I. Introduction A) Purpose In preparing the 2003 Update to the Forsyth County Comprehensive Plan, the County initiated an ambitious public involvement process. In order to better analyze the County’s needs and elicit a higher degree of community participation, the county was divided into ten planning subareas (Figure 1) with individual committees established to develop specific land use policies and a future land use map for their subarea. The subarea boundaries were determined by a variety of factors including: physical barriers, historical communities, eco This information was gathered to help enable the commthey got there and where they want to go in the future.from the land use inventory and assessment for the Chrecommendations of the Chestatee Subarea Advisory Ccommittee and the meeting dates can be found in the A B) Scope The following report provides a “snapshot” of the Cheland uses in the subarea is provided, along with an exisfollowed by an inventory of environmentally sensitive athe community to identify those sections of the subarefuture, as well as those areas that should be protected f Following this inventory, there is an examination of theChestatee subarea. This includes a discussion of demoand 2000, as well as an estimate of land consumption dsummary of the historical factors that have led to the c An examination of future development trends is also pfuture sewer and transportation infrastructure needs, asthat could potentially be redeveloped. Forsyth Countyto determine what is allowed to develop under the currthe subarea vision and policy recommendations develoCommittee, and a copy of the future land use map for
Jordan, Jones & Goulding, Inc. 1
Chestatee Elementary School
nomics and transportation corridors.
unity to look at where they are today, how Included in this document are the findings estatee subarea, as well as the ommittee. The membership of the ppendix.
statee subarea. First, a description of existing ting land use map and summary table. This is reas. These two sets of information allow
a that could potentially be developed in the rom development pressures.
historic development patterns in the graphic changes in the subarea between 1900 uring the last decade. There is also a urrent development patterns.
rovided. This includes an assessment of the well as the identification of transitional areas ’s land use polices are also examined in order ent regulations. Finally, this report includes ped by the Chestatee Subarea Advisory the subarea.
Chestatee Subarea Land Use Report

Figure 1 Forsyth County Subarea Locations
Jordan, Jones & Goulding, Inc. Chestatee Subarea Land Use Report 2

C) Location The Chestatee subarea is located in the northeastern corner of Forsyth County. The general boundaries include Dawson County to the north, the Lake Lanier subarea to the south, the Coal Mountain/400 North subarea to the west, and Lake Lanier to the east.
II. Inventory of Existing Conditions A) Description of Existing Land Uses A comprehensive land use survey was conducted for Forsyth County in the Summer of 2002 using tax parcel maps, aerial photographs and field review. In April 2003, the results of the survey were verified by a second field review. These land uses are shown on Figure 2 on the following page and summarized in Figure 3 below.
Chestatee SuLand Use
Residential Undeveloped Agriculture Parks/Recreation/Conservation Road Right-of-way Commercial Institutional/Public Chestatee Total Total Sq. Miles for Sub Area
As indicated in the table above, the largesland, comprising almost 40 percent of theThe second largest category is undevelopeNext is agricultural land, which accounts undeveloped land is spread throughout thaccount for 14 percent of the subarea. Thpublic/institutional and parks/recreation/industrial uses are concentrated along the B) Environmentally Sensitive A 1. Historic Resources In the mid-1990s a historic resources inveResources Survey Report identified 490 hthese, 44 historic sites were located in thelisting on the National Register of Histori
Jordan, Jones & Goulding, Inc.
Figure 3 barea Land Use: 2003
Acres Percent 5,363.99 39.71%3,474.12 25.72%2,753.78 20.39%1,025.45 7.59%
626.20 4.64%106.59 0.79%78.62 0.58%
13,506.90 100.00%21.1 --
t land use category in the Chestatee subarea is residential subarea. Residential uses are concentrated near the lake. d land, which makes up almost 26 percent of the subarea.
for 20 percent of the land area. Both agricultural and e Chestatee subarea. The remaining land uses combined ese uses include commercial, industrial, conservation land. Generally, the commercial and
highways, especially around the major intersections.
reas
ntory was completed for Forsyth County. The Historic istoric resources in unincorporated Forsyth County. Of Chestatee subarea, and 7 of these have the potential for c Places.
Chestatee Subarea Land Use Report 3

Figure 2 Chestatee Existing Land Uses
Jordan, Jones & Goulding, Inc. Chestatee Subarea Land Use Report 4

SR 53 over Lake Lanier
2. Water Resources Lake Lanier, the primary reservoir for the Atlanta region, makes up the eastern boundary of the Chestatee subarea. In addition, there are a number of creeks and streams that drain into Lake Lanier. There are 786 acres of 100-year floodplains around the lake and its tributaries in the Chestatee subarea. Development is regulated in this area by the Federal Emergency Management Agency, the Georgia Floodplain Management Program of DNR and by local ordinances. The Chestatee subarea includes a large groundwater recharge area extending from the intersection of SR 53 and SR 306 eastward to GA 400. Significant recharge areas have been mapped by the Georgia Department of Natural Resources at the state level. If a significant recharge area is identified, the local government must comply with the Official Code Georgia Annotated 12-2-8. This Code outlines restrictions on locating landfills and hazardous waste facilities, above ground chemical or petroleum storage tanks, agricultural waste, impoundment sites, septic tank drain fields, slow rate land treatment, storm water infiltration basins, and waste treatment basins. The portion of this groundwater recharge area that falls within the Chestatee subarea totals 3,360 acres. 3. Steep Slopes The majority of land with steep slopes (exceeding 15% grade) is concentrated along the shores of the lake and are located north of SR 53. Other less concentrated areas of steep slopes can be found along the creeks and streams that feed the lake. Where slopes are greater than 15 percent, greater care must be taken to control erosion and sedimentation and developing the land is more expensive and often cost prohibitive. 4. Conservation & Park Lands Conservation and park lands in the Chestatee subarea are primarily associated with the U.S. Army Corps of Engineers property that surrounds the lake. The other park land in the area includes a golf course located north of SR 306 and Bennett Park in the southwest corner of the subarea. Created in 1978, Bennett Park was the first park in the County and included 19 total acres. After two expansions, the park includes 30 acres. Facilities include five youth baseball/softball fields, one football field, two tennis courts, a playground and a picnic pavilion. The locations of the natural and cultural resources in the Chestatee subarea are shown on the map included as Figure 4. .
Jordan, Jones & Goulding, Inc. Chestatee Subarea Land Use Report 5

Figure 4 Chestatee Natural and Cultural Resources
Jordan, Jones & Goulding, Inc. Chestatee Subarea Land Use Report 6

C) Historic Development Patterns 1. Demographics Prior to the construction of Lake Lanier in the 1950s, the northeast corner of Forsyth County was like many other rural areas of northeast Georgia. Land uses included mostly agricultural and undeveloped land, with only a few homes. After Lake Lanier was created, small vacation cottages began to spring up around the lake, but the landscape of the Chestatee subarea remained rural. During the 1980s and 1990s, residential subdivisions were developed near the lake and also near SR 306 and SR 53, due to the proximity of GA 400In 2000, the Census recorded 5,347 residents in the Chestatee subarea. This is an increase of 91 percent since 1990. Despite this large increase, this part of the County remains one of the least populated areas of Forsyth County. Only the Etowah subarea in northwestern Forsyth County has a smaller population. The population density for the Chestatee area is also one of the lowest in the County with 118 people per square mile. Only the Etowah and Coal Mountain areas have fewer people per square mile. The highest population density is in the South Forsyth subarea, with 373 people per square mile.
Mix of housing near Lake Lanier
The Chestatee subarea is 98 percent white, but did add 150 minority residents during the 1990s. The age distribution figures indicate the majority of residents in this area are 30-49 years of age with children between the ages of 5 and 17. Also, the number of residents 50 to 64 years of age has increased significantly since 1990, totaling 454 in 2000. Figure 5 provides a comparison of the demographic statistics for the area for 1990 and 2000. The number of housing units in the Chestatee subarea has increased significantly during the 1990s. In 1990, there were 1,201 housing units and by 2000 the number of units increased to 2,224, an 85.1 percent increase. During the 1990s the vacancy rate remained essentially unchanged, dropping slightly from 13 percent to 12 percent. The housing units in this area are overwhelmingly owner-occupied, with 85 percent being owner-occupied and 15 percent renter occupied units. These occupancy percentages are almost identical to the 1990 figures.
Jordan, Jones & Goulding, Inc. Chestatee Subarea Land Use Report 7

Figure 5
Chestatee Subarea Demographics 1990 – 2000
1990 2000 Percent Change Total Population 2,797 5,347 91.2%
Racial and Cultural Distribution * White 2,785 5,231 87.8% Black or African American 0 3 300.0% Asian 7 11 52.0% Hispanic or Latino, regardless of race 28 136 389.5%
Age Distribution Under 5 211 408 93.4% 5 to 17 512 1,026 100.5% 18 to 21 173 265 53.1% 22 to 29 357 584 63.4% 30 to 39 505 960 90.2% 40 to 49 412 858 108.4% 50 to 64 387 792 104.5% 65 and over 268 454 69.4%
Housing Total Units 1,201 2,224 85.1% Occupied 1,041 1,959 88.1% Vacancy Rate 160 (13.3%) 265 (11.9%) 65.8% Owner Occupied 902 1,665 84.7% Renter Occupied 140 294 110.3% * Note: The racial and cultural distribution numbers total to a sum larger than the total population. Hispanic is a cultural descriptor and is not exclusive of race.
2. Development Activity The large majority of land consumption that has occurred in the Chestatee subarea is from residential development. It is estimated that since 1990 approximately 1,023 acres have been developed for residential use in this area. Even with this large increase in developed acres, it is estimated there are still nearly 7,000 acres that could be developed in the Chestatee subarea.
Anchor on Lanier Subdivision
One of the tools the JJG team used to evaluate development activity in the
Jordan, Jones & Goulding, Inc. Chestatee Subarea Land Use Report 8

County is the occurrence of Developments of Regional Impact (DRIs) since 1990. A DRI review is required by law to be completed for large-scale developments that are likely to have impacts outside of the jurisdiction(s) where they are located. The Georgia Planning Act of 1989 authorized the Department of Community Affairs (DCA) to establish procedures for intergovernmental review of these large-scale projects. More than 40 DRI reviews have been completed in Forsyth County since 1990, but none within the Chestatee subarea. D) Future Development Trends 1. Future Infrastructure One of the primary drivers of development is the provision for public infrastructure, particularly sewer and roads. The availability of sewer allows for higher density land uses such as apartments or small-lot subdivisions (less than one-half acre lots). Roads are also primary drivers of change because they provide access to desired destinations, such as jobs and shopping. Better access leads to a higher land value and a greater likelihood of high-density uses. Currently, the Chestatee subarea is lacking both the provision of sewer and adequate roads. Sewer is not available in the subarea, and although the area is near GA 400, none of the major routes linking to the highway are wider than two lanes. There are long range plans to provide sewer in the area, and to widen both SR 306 and 53. These improvements are long-term (beyond 10 years), so the impact of their construction on land use patterns is not immediate. The County is currently working on a Sewer System Master Plan that should be approved by the end of 2003. The Chestatee Subarea is in the Lake Lanier drainage basin. Because of the topography of this basin, it is very difficult to provide sewer service. However, due to the threat of contamination from so many septic systems in close proximity to Lake Lanier, a plan was developed to provide sewer service to the Chestatee area by 2025. One of the strongest influences on the future development of the Chestatee subarea will be continued expansion of the Atlanta urbanized area. Over the last ten years, the southern
half of the County has experienced intense development pressure, and this pressure is moving northward along either side of GA 400. Because of this growth pressure, the Chestatee area is likely to see more development in those areas closest to GA 400.
Intersection of SR 53 and SR 306
Jordan, Jones & Goulding, Inc. Chestatee Subarea Land Use Report 9

2. Transitional Areas There are still large tracts of available land for development in the Chestatee subarea, so the likelihood of redevelopment is small. Generally, it is more expensive to tear down or renovate existing structures compared to constructing new, so as long as land is available with the same locational benefits as existing structures, new construction is likely to locate on vacant land. The one major exception to this in the Chestatee subarea is the aging residential structures along Lake Lanier. There are several small vacation homes and manufactured homes close to the lake that are prime candidates for redevelopment. The value of lake front property has been rising steadily over the past ten years, as new residents have been moving into the County. Consequently, it is not unusual to find older manufactured homes located next to a newly constructed high-end single-family home near the lake. It can be expected that over time, most of these older manufactured and small vacation houses will be replaced with new construction. As this transformation takes place, these smaller non-conforming lots will have to be brought up to existing County standards.
Cabin near Lake Lanier
3. Current Land Use Policies The 2015 Future Land Use map for the Chestatee subarea identifies over 80 percent of the area to be developed as large-lot single-family houses. Current land use policy was analyzed by examining the primary tools of land use including the Unified Development Code and the Land Use Element of the Comprehensive Plan. The JJG team also examined the current zoning and Future Land Use maps to determine any implications that might arise from those elements. In order to achieve the future land uses that are envisioned in the 2015 Comprehensive Plan, land would have to be re-zoned in the County. Rezonings would have to occur not only within land use categories, but land would have to be rezoned into entirely different categories. Figure 6 shows the amount of land that would have to be rezoned to provide consistency with the 2015 Future Land Use map.
Jordan, Jones & Goulding, Inc Chestatee Subarea Land Use Report 10

Figure 6 Chestatee Rezonings to Match the 2015 Land Use Plan
Future Land Use Category
4% 95% 0% 0% 1%
Conservation and Park
Single Family Residential
Office/ Institutional Industrial Commercial
78% Agriculture 1% 76% <1% <1% <1%
20% Single-Family Residential 3% 18%
1% Industrial <1% <1% <1%
Cur
rent
Zon
ing
Cat
egor
y
1% Commercial <1% <1% <1%
* Note: Conservation and park land can be associated with any zoning category. Indicates that a rezoning is not required to be consistent with the future Land Use Plan
Indicates potentially difficult rezoning
Indicates rezoning that might be challenging
Indicates potentially easy rezoning
Figure 6 above shows the amount of land within the Chestatee subarea that is intended for conversion from a current zoning category (rows) to a future land use category (columns). Individual cells of the table are currently zoned within a particular category (shown by the row) and intended for a particular future land use category (shown by the column). Percentages within each cell indicate the percentage of total land area that is categorized by a particular zoning category/future land use category combination. The colored areas of the chart indicate land that is currently intended for a future land use that is different from the way the land is currently zoned. At the present time, only approximately 18% of the Chestatee subarea is intended to perform the same use as it is currently allowed by zoning (shown by the white areas). To achieve the land uses shown in the current future land use map, 82% of the land will require significant rezonings. Areas shown in red represent required “downzonings”, zoning changes that are traditionally difficult to perform because they further restrict the use of the land. This comprises approximately 5% of the subarea. Areas shown in green represent required “upzonings”, zoning changes that are traditionally easier to perform because they generally increase the allowable uses of the land. This comprises approximately 77% of the subarea. Approximately 76% of the Chestatee subarea is currently intended to be moved from agricultural zoning to single-family residential use. Although the current land use regulations allow residences on land zoned agricultural, this represents a significant conversion of the land’s purpose. One deficiency in land use policy is the treatment of agricultural lands. Currently, 78 percent of the land area in the Chestatee subarea is zoned for agricultural use, by far the most extensive zoning in the subarea. However, there is no future land use designation for agriculture. This is particularly notable with the existence of the A2 zoning classification that appears to foster the future use of land for agriculture. Most of the current agricultural land
Jordan, Jones & Goulding, Inc Chestatee Subarea Land Use Report 11

appears in the 2015 Future Land Use map as intended for residential use. This represents a large and significant land conversion, and a major loss of open space. The lack of specificity with regard to future commercial land use should also be examined. Currently, there is only one broad land use category to designate commercial uses (“commercial”). However, the Unified Development Code allows commercial districts of all types including: Neighborhood Shopping (NS), Urban Village (UV), Central Business District (CBD) and Office Commercial Multi-Story District (OCMS). These are vastly different types of commercial activities, and range in intensity of use from floor area ratios of 0.46 for Neighborhood Shopping districts to 5.50 for Office Commercial Multi-Story. In order to be effective, the Future Land Use map should include several designations for commercial uses of different intensities and functions. In addition, there is no land use designation for mixed-use districts, which are conditionally allowed in several of the existing zoning districts (such as Office Residential – OR). Over the next 10 to 20 years, the Chestatee area is likely to experience a rapid increase in population. Employment opportunities are likely to take the form of retail and service oriented businesses catering to the needs of future homeowners. The eventual form and density that this future development will take is strongly dependent on the provision of sewer and road improvements. There are no immediate plans now to extend sewer into the area, but the investment in new roads will increase property values and lead to further market interest in single-family residential development. E) Trend Scenario 1. Methodology As part of the JJG team’s examination of current land use policies and their potential impacts, an analysis of current development trends for the Chestatee subarea was performed. It was based upon the existing Future Land Use map, rezoning history, and real estate market preferences. This analysis had no specific time horizon. It is intended to gain an understanding of the ultimate impact of future development, if such development follows existing trends and is guided by existing land use policy. In order to accomplish this analysis, the JJG team made several assumptions including:
Areas that are designated as having future land uses that are different from their existing land uses will be redeveloped; Existing structures that are non-conforming with respect to their current zoning will be redeveloped in a way to bring them into conformance; Future development within broad land use categories (for example, “Commercial”) will consist of a mix of uses and intensities that mirrors the county-wide proportions of land that is currently zoned within that category; Future development restrictions (for example, minimum lot sizes, maximum floor-area-ratios) will be based upon those that are currently expressed in the Unified Development Code; “Density shifting” to accommodate land lying within flood plains will continue to be permitted. In other words, parcels that contain part of their land within flood plains
Jordan, Jones & Goulding, Inc Chestatee Subarea Land Use Report 12

will be allowed to develop at the maximum density permitted, based on the area of the entire parcel, not just the part that is outside the flood plain;
Moderately sloping land (>15% but less than 30%) that is designated residential, will eventually be developed; and Sewer and water services will be extended to all areas that require them.
2. Trend Scenario Map A Trend Scenario map was created in order to illustrate this future land use scenario and it is included on the following page as Figure 7. The future that this map indicates is not a given, but a likely scenario of how the area will develop over the next 20 years. It shows that existing residential developments will spread out and occupy almost the entire subarea, and the existing commercial nodes will similarly spread out along existing transportation routes. The implications of this trend scenario include increased demands on public infrastructure, such as schools, water, sewer, roads, police and fire protection. It also indicates that the dramatic changes that the area has experienced over the past 10 years are only the beginning of additional changes for the area if current trends continue. The question that this planning exercise poses is one that the citizens of the Chestatee area have to answer, and that is “Is this the future that we envision for our community?”
Jordan, Jones & Goulding, Inc Chestatee Subarea Land Use Report 13

Figure 7 Chestatee Trend Scenario Map
Jordan, Jones & Goulding, Inc. Chestatee Subarea Land Use Report 14

III. Subarea Committee Recommendations There were three meetings held from April to June 2003 to discuss the development of a land use plan for the Chestatee subarea. A list of the meeting dates can be found in the Appendix. At the first two meetings the inventory of existing conditions for the subarea was presented, and the participants were asked to help craft a vision for the subarea. At the third meeting, a draft land use plan map was presented along with the draft vision and participants were asked to fill out comments cards, which were presented to the subarea committee for discussion and review. The result of this meeting was a revised land use plan map and a list of policy recommendations that the subcommittee would like to present to the Countywide Land Use Steering Committee for possible inclusion in the county’s Comprehensive Plan. The results of these meetings are presented below. A) Chestatee Subarea Vision
• The Chestatee subarea will primarily be a residential community with a rural character.
• Lake Lanier will continue to be a valuable asset that provides recreational opportunities for local residents and visitors.
• Convenient access to commercial services will be located around two nodes on SR 306. One located at Jot-Em-Down Road and the other at Dawsonville Highway. These commercial nodes could contain some county offices and a postal facility.
• A network of greenways will run throughout the subarea with passive parks and connected trails.
• Maintenance of the area’s rural atmosphere and protection of Chestatee’s clean environment will be partially accomplished by prohibiting additional heavy industry and limiting new light industry to the existing industrial area in the southwest portion of the subarea.
B) Policy Recommendations
• The County needs to prepare a Greenway Master Plan that includes connected greenways throughout the County. Existing natural features such as stream banks and groundwater recharge areas could be utilized.
• The County should provide incentives to retain small farms and agricultural related businesses.
• Prepare a feasibility study on Transfer of Development Rights (TDRs) countywide, in order to preserve open space.
• Need more land in public parks. • Current Tree Ordinance needs to be strengthened, with a focus on preserving
existing trees and requiring more trees in parking lots. • The County needs to prepare a Water Conservation Plan.
Jordan, Jones & Goulding, Inc. Chestatee Subarea Land Use Report 15

• Install sidewalks, bike paths and trees along roads as they are improved. • Widen existing stream buffers from 35 ft. to between 50 - 100 ft. • Overall density of the area should not exceed 1 unit per acre. • Limit industrial land uses to areas that would not disturb environmentally sensitive
areas. Industry should only be clean and high tech. • Developers should fund traffic studies for all residential developments.
C) Chestatee Land Use Plan Map The future land use plan is an extension of the goals and values of the community and a culmination of the subarea planning effort. This future land use map is intended to depict a 2025 future land use scenario. The acreages and percentages of each land use are compiled in Figure 8 and a map showing the location of future land uses is included in Figure 9. There are fourteen land use designations depicted on the future land use map, including three residential designations and six commercial/industrial/mixed-use designations. Below is brief definition of each. Low Density Residential - This category is intended for single-family detached residential dwellings typically on septic sewer systems. Minimum lot size is 30,000 square feet, or the overall density is up to 1.5 units per acre. Institutional uses that are considered complimentary in this area include churches, schools, and libraries. Medium Density Residential - Consists of single-family detached residential dwellings typically on sewer, with overall densities from 1.5 to 2.5 units per acre. Institutional uses that are considered complimentary in this area include churches, schools, and libraries. Private recreational uses, such as golf courses, tennis courts, walking trails and swimming pools are encouraged in these areas in developments greater than 50 lots. High Density Residential - Typical uses include single-family detached and attached dwellings (such as townhouses) as well as multifamily condominiums and apartments, at densities of up to 6 units per acre. These developments should incorporate some amount of central outdoor public space for their residents. A limited number of churches, schools, libraries, other miscellaneous institutional uses and daycare facilities would be complimentary in these areas. An urban-density residential area is usually located near areas of high employment concentration, large commercial nodes, transportation nodes and mixed-use developments. It is essential that these developments include proper buffering between adjacent land uses. Office Transitional - The Office Transitional category is intended to allow for the redevelopment or transition of residential uses along major roadways to office professional uses. It also allows for new office development that is constructed in a manner consistent and in keeping with the surrounding residential uses. The physical character and design of proposed new structures should be compatible with existing establishments. This category includes small single occupant structures for doctors and or accountants, as well as larger offices with multiple tenants. Businesses that are allowed in this category may provide a
Jordan, Jones & Goulding, Inc. Chestatee Subarea Land Use Report 16

product directly to customers on the premises as an accessory to the service, but do not, as a primary activity, involve the manufacture, storage, or distribution of products. These areas should provide employment opportunities in close proximity to residential areas while providing a transition between the more intense commercial areas and residential neighborhoods. Neighborhood Commercial - This category includes a limited range of retail and service activities to serve the everyday needs of local residents. Limitations should apply to both size and character of individual establishments. The basic character of this category is one that encourages and assures a compatible mixture of residential, office and retail types of land uses. Businesses in this land use category should be designed to encourage the development of neighborhood scale shopping that offers both goods and products, and the furnishing of selected services. General Commercial - This category includes standard retail and commercial service activities such as shopping centers, general retailers, specialty shops, grocery stores, drug stores, banks, restaurants, theatres, hotels, dry cleaners and entertainment facilities. These establishments should be located on appropriate transportation corridors to easily serve the public. Visual impacts of these developments should be minimized by requiring buffers, landscaping, and architectural controls. Activity Center - The Activity Center land use category includes commercial, entertainment, limited residential, and public/institutional land uses typically found in a central business district. The commercial business district (CBD) and urban village (UV) zoning classifications are considered appropriate for developments proposed within the Activity Center classification. Developments within the Activity Center classification may be encouraged to consider additional zoning classifications, based on future revisions to the Forsyth County Unified Development Code. The types of uses that are desirable in this area would be restaurants, specialty retail, governmental offices, low-intensity offices (e.g. accountant or real estate office) and appropriate parking. Uses should be complemented with walking, biking and transit opportunities to provide alternative modes of transportation. Also, any roadway improvements that are considered for this area should carefully consider the scale of the area. Residential uses shall be considered accessory and limited to townhouses or apartments mixed into the commercial establishments. Commercial uses must be developed or present first in comparable scale before residential uses can be permitted for construction. Corridor Commercial - The Corridor Commercial category is intended to focus on major transportation corridors, which presently contain a mix of agricultural, residential, commercial, and industrial land uses. Such corridors are unlikely to experience small scale, low or medium density residential development over the course of the planning period. Developments within the corridor commercial classification will focus on land uses of varying intensity that will allow for the appropriate transition between high-intensity development abutting the transportation corridor as well as provide for a continued decrease of intensity as the development moves away from the transportation corridor. The physical character and design of proposed developments should be compatible with surrounding
Jordan, Jones & Goulding, Inc. Chestatee Subarea Land Use Report 17

uses. Inter-parcel connectivity and side street access should be encouraged to minimize curb cuts and improve traffic flow. Typical uses include standard retail and commercial service activities such as shopping centers, general retailers, specialty shops, grocery stores, drug stores, banks, restaurants, theatres, hotels, dry cleaners, entertainment facilities, multiple tenant offices, small single occupant structures, and entrances to residential subdivisions located outside the corridor commercial designation. The transitional nature of the category should be supported through the use of buffers, landscaping, and architectural controls to minimize the impacts on lower intensity land uses. Industrial - The primary purpose of this category is to provide for areas where light industrial uses can be located. These light industrial uses include light manufacturing, warehousing, wholesale/distribution and assembly. More intensive industrial uses that are characterized by noise, fumes, vibration and other forms of pollution that might be viewed as objectionable by surrounding uses are acceptable only on a case-by-case basis if well screened and buffered from other uses. Limited commercial uses are also allowed in industrial areas if they compliment existing industrial uses, such as cafeterias and day cares. Public / Institutional - Includes uses such as schools, colleges, hospitals, municipal community centers, churches, cemeteries, municipal buildings and post offices. Public Park - This category includes land dedicated to active and passive recreation uses. These areas are publicly owned and may include sports fields, recreation areas, greenways, and similar uses. Private Park - Privately owned land that is used for active and passive recreation. This may include subdivision amenities areas, golf courses and Army Corps of Engineers recreation areas. Conservation - This classification includes environmentally sensitive areas that are regulated at the local and state levels. Areas included in this category are the 35 ft. buffer along all county streams, a 100 ft. buffer along the Etowah River and land that is part of the 100-year floodplain of local waterways. This land has the potential to be used as public greenways or multi-purpose paths. Land classified as Conservation alerts government officials and property owners to the presence of environmental conditions that shall be factored into the rezoning and permitting process. Transportation / Communication / Utilities (TCU) - This category includes such uses as landfills, water treatment plants, wastewater treatment plants, power substations, rail yards, mass transit facilities, airports, etc. These uses may be either public or private.
Jordan, Jones & Goulding, Inc. Chestatee Subarea Land Use Report 18

Land Use Acres Percent Low Density Residential 7,805 57.8%Medium Density Residential 3,443 25.5%Road Right-of Way (TCU) 625 4.6%Conservation (Lake Lanier US Corps land only) 617 4.6%Private Park 285 2.1%Corridor Commercial 242 1.8%General Commercial 155 1.1%Industrial 104 0.8%Public/Institutional 67 0.5%Activity Center (Commercial) 57 0.4%Neighborhood Commercial 54 0.4%Public Park 28 0.2%Office-Transitional 19 0.1%High Density Residential 0 0.0%
Chestatee Total Land Acreage 13,501 100.0%
Jordan, Jones & Goulding, Inc. Chestatee Subarea Land Use Report 19

Figure 9 Chestatee 2025 Future Land Use Plan
Jordan, Jones & Goulding, Inc. Chestatee Subarea Land Use Report 20

Appendix A. Chestatee Subarea Advisory Committee Charles Cantrell Captain Mark Hoffman John Heard Anne White Hilda Thomas
B. Meeting Dates Chestatee Subarea Public Visioning Workshop – April 24th at 5:30 PM in the Chestatee Community Building
Chestatee Subarea 2nd Public Visioning Workshop – May 22nd at 6:30 PM in the Deer Creek Shores Presbyterian Church
Chestatee Subarea Advisory Committee Meeting- June 5th at 6:30PM in the Chestatee Community Building
Jordan, Jones & Goulding, Inc Chestatee Subarea Land Use Report
21

Forsyth County Comprehensive Plan
Coal Mountain/400 North Subarea Land Use Report
September 25, 2003

Table of Contents I. Introduction ................................................................................................................. 1
A) Purpose............................................................................................................ 1 B) Scope............................................................................................................... 1 C) Location ........................................................................................................... 1
II. Inventory of Existing Conditions ................................................................................. 3
A) Description of Existing Land Uses ................................................................... 3 B) Environmentally Sensitive Areas...................................................................... 5
1. Historic Resources................................................................................ 5 2. Water Resources .................................................................................. 7 3. Steep Slope .......................................................................................... 5 4. Conservation & Park Lands .................................................................. 5
C) Historic Development Patterns ........................................................................ 6 1. Demographics....................................................................................... 6 2. Development Activity ............................................................................ 8
D) Future Development Trends ............................................................................ 9 1. Future Infrastructure ............................................................................. 9 2. Transitional Areas................................................................................. 9 3. Current Land Use Policies .................................................................. 10
E) Trend Scenario .............................................................................................. 12 1. Methodology ....................................................................................... 12 2. Trend Scenario Map ........................................................................... 13
III. Subarea Committee Recommendations.................................................................. 15
A) Coal Mountain Subarea Vision....................................................................... 15 B) Policy Recommendations............................................................................... 15 C) Coal Mountain Land Use Plan Map (Updated December 9, 2003) ................ 15
Appendix ....................................................................................................................... 20
Jordan, Jones & Goulding, Inc. Coal Mountain Subarea Land Use Reporti

I. Introduction A) Purpose
Haddow Hall
In preparing the 2003 Update to the Forsyth County Comprehensive Plan, the County initiated an ambitious public involvement process. In order to better analyze the County’s needs and elicit a higher degree of community participation, the county was divided into ten planning subareas (Figure 1) with individual committees established to develop specific land use policies and a future land use map for their subarea. The subarea boundaries were determined by a variety of factors including: physical barriers, historical communities, economics and transportation corridors. This information was gathered to help enable the community to look at where they are today, how they got there and where they want to go in the future. Included in this document are the findings from the land use inventory and assessment for the Coal Mountain/400 North subarea, as well as the recommendations of the Coal Mountain/400 North Subarea Advisory Committee. The membership of the committee and the meeting dates can be found in the Appendix. B) Scope The following report provides a current “snapshot” of the Coal Mountain/400 North subarea. First, a description of existing land uses in the subarea is provided, along with an existing land use map and summary table. This is followed by an inventory of environmentally sensitive areas. These two sets of information allow the community to identify those sections of the subarea that could potentially be developed in the future, as well as those areas that should be protected from development pressures. Following this inventory, there is an examination of the historic development patterns in the Coal Mountain/400 North subarea. This includes a discussion of demographic changes in the subarea between 1990 and 2000, as well as an estimate of land consumption during the last decade. There is also a summary of the historical factors that have led to the current development patterns. An examination of future development trends is also provided. This includes an assessment of the future sewer and transportation infrastructure needs, as well as the identification of transitional areas that could potentially be redeveloped. Forsyth County’s land use polices are also examined in order to determine what is allowed to develop under the current regulations. Finally, this report includes the subarea vision and policy recommendations developed by the Coal Mountain/400 North Subarea Advisory Committee, and a copy of the future land use map for the subarea. C) Location The Coal Mountain/400 North subarea is located in north central Forsyth County. GA 400 cuts through this subarea from south to north. The general boundaries include Dawson County to the north, the Settingdown and Cumming subareas to the south, the Etowah subarea to the west, and the Chestatee and Lake Lanier subareas to the east.
Jordan, Jones & Goulding, Inc Coal Mountain Subarea Land Use Report 1

Figure 1 Forsyth County Subarea Locations
Jordan, Jones & Goulding, Inc Coal Mountain Subarea Land Use Report 2

II. Inventory of Existing Conditions A) Description of Existing Land Uses A comprehensive land use survey was conducted for Forsyth County in the Summer of 2002 using tax parcel maps, aerial photographs and field review In April 2003, the results of the survey were verified by a second field review. These land uses are shown on Figure 2 on the following page and summarized in Figure 3 below.
Figure 3 Coal Mountain/400 North Subarea Land Use: 2003
As indicated in thresidential land, cevenly throughousouthwest corner26 percent of theBoth undevelope
Residential UndevelopedAgriculture Road Right-oParks/RecreIndustrial Commercial Institutional/P
CoaTotal Sq. Mil
The remaining laway, commercialthe commercial uthe exception of
Jordan, Jones & Gould
Land Use Acres Percent 6,988.34 36.19%
5,036.61 26.08%4,478.48 23.19%
f-way 1,141.99 5.91%ation/Conservation 456.56 2.36%
451.26 2.34%410.34 2.12%
ublic 347.55 1.80%l Mountain Total 19,311.12 100.00%es for Sub Area 30.2 --
e table above, the largest land use category in the Coal Mountain subarea is omprising 36 percent of the subarea. Most of the residential land is distributed t the subarea. There is a slight concentration of residential development in the of the subarea. The second largest category is undeveloped land, which makes up subarea. Next is agricultural land, accounting for 23 percent of the land area. d and agriculture land are distributed evenly throughout the subarea.
nd uses make up less than 15 percent of the total area. These uses include right-of-, industrial, public/institutional and parks/recreation/conservation land. Generally, ses are concentrated along GA400, especially around the major intersections. With one large parcel in the east, industrial land use is limited to a few small parcels.
ing, Inc Coal Mountain Subarea Land Use Report3

Figure 2 Coal Mountain/400 North Existing Land Use
Jordan, Jones & Goulding, Inc. Coal Mountain Subarea Land Use Report 4

B) Environmentally Sensitive Areas 1. Historic Resources In the mid-1990s a historic resources inventory was completed for Forsyth County. The Historic Resources Survey Report identified 490 historic resources in unincorporated Forsyth County. Seventy-five (75) of these historic sites were located in the Coal Mountain subarea, and four (4) of these have the potential for listing on the National Register of Historic Places. 2. Water Resources There are 937 acres of 100-year floodplains in the Coal Mountain subarea. Development is regulated in this area by the Federal Emergency Management Agency, the Georgia Floodplain Management Program of DNR and by local ordinances. Of the 33,593 acres of groundwater recharge in Forsyth County, almost one-quarter is located in the Coal Mountain subarea. Groundwater recharge areas are any portions of the earth’s surface where water infiltrates into the ground to replenish an aquifer. An aquifer is a system of rock and bedrock that contains water. Significant groundwater recharge areas have been mapped by the Georgia Department of Natural Resources at the State level. If a significant recharge area is identified, then the local government must comply with the applicable state law (O.C.G.A. 12-2-8). This code outlines restrictions on siting landfills and hazardous waste facilities, above ground petroleum or chemical storage tanks, agricultural waste, impoundment sites, septic tank drainfields, slow rate land treatment, stormwater infiltration basins and waste treatment basins. Two primary groundwater recharge areas are located in the Coal Mountain area and cover 7,417 acres. One groundwater recharge area covers the southern one-third of the subarea. This large recharge area crosses into the Settingdown, Chestatee, and Lake Lanier subareas. The second, smaller recharge area is located in the eastern portion of the subarea bordering the Lake Lanier subarea. 3. Steep Slopes There are 3,072 acres of steep slopes (15% grade or greater) in the Coal Mountain subarea. The majority of steep slopes are concentrated in the eastern portion of the subarea on Coal Mountain. Where slopes are greater than 15 percent, greater care must be taken to control erosion and sedimentation and developing the land is more expensive and often cost prohibitive. 4. Conservation & Park Lands There are two parks in the Coal Mountain subarea. Central Park is located near the Intersection of GA400 and SR 306. The park has many amenities including a recreation center and frisbee golf course. Coal Mountain Park is located north of Central Park off of GA400. This 25-acre park has three baseball fields, a walking trail, and playground.
Jordan, Jones & Goulding, Inc. 5
Central Park
Coal Mountain Subarea Land Use Report

The locations of the natural and cultural resources in the Coal Mountain subarea are shown on the map included as Figure 4. C) Historic Development Patterns 1. Demographics Similar to other parts of northern Forsyth County, this area has historically been characterized by farms, open land and single-family residences. Upon completion of GA 400, the area has become more attractive for residential subdivisions, primarily near GA 400 and along SR 369. The area has a large employment node along SR 306 that includes American Proteins, one of the County’s largest employers. Also, there are two emerging commercial nodes, the intersection of GA 400 and SR 306 and the intersection of SR 306 and SR 369. The Coal Mountain/400 North subarea is well connected with roadways including GA 400, SR 369 and SR 306. GA 400 is a four-lane divided highway with limited access from the Fulton County line north to its interchange with SR 306. From that point northward, GA 400 has several at-grade road crossings. SR 369 and SR 306 within this subarea area were historically farm to market roads, but these routes are now serving commuters and other regional traffic moving across north Georgia. In 2000, the population of the Coal Mountain/400 North subarea totaled 6,279. This is an increase of 57 percent since 1990. This area along with the Etowah and Chestatee subareas are the least populated areas of the County. The population density of the area is 209 people per square mile. Similar to total population, the Etowah and Chestatee areas are the only areas with fewer people per square mile, with 175 and 118 people respectively. In contrast, the highest number of people per square mile is in the South Forsyth subarea, with 701 people per square mile. The Coal Mountain/400 North subarea is 98 percent white. However, during the 1990s the area added 103 Hispanic residents. The age distribution figures indicate the majority of residents in this area are 30-39 years of age with children between the ages of 5 and 17 ranking second. The largest increase in age distribution has been for the groups 5 and under and 50 to 64 years of age. Figure 5 provides a comparison of the demographic statistics for the area for 1990 and 2000. The number of housing units in the Coal Mountain/400 North subarea increased notably during the 1990s. In 1990, there were 1,579 housing units and by 2000 the number of units increased to 2,351, a 49 percent increase. During the 1990s the vacancy rate was cut in half, dropping from 8 percent in 1990 to 4 percent in 2000. The housing units in this area are largely owner-occupied, with 83 percent being owner-occupied and 13 percent renter occupied units. The number of owner-occupied units increased by 60 percent during the 1990s.
Jordan, Jones & Goulding, Inc. Coal Mountain Subarea Land Use Report6

Figure 4 Coal Mountain/400 North Natural and Cultural Resources
Jordan, Jones & Goulding, Inc. Coal Mountain Subarea Land Use Report 7

Figure 5 Coal Mountain/400 North Subarea Demographics
1990 – 2000
1990 2000 Percent Change Total Population 3,989 6,279 57.4%
Racial and Cultural Distribution * White 3,972 6,171 55.4% Black or African American 2 2 25.5% Asian 4 9 134.7% Hispanic or Latino, regardless of race 31 134 331.0%
Age Distribution Under 5 295 552 87.2% 5 to 17 759 1,158 52.5% 18 to 21 241 220 -8.8% 22 to 29 523 692 32.2% 30 to 39 716 1,265 76.7% 40 to 49 584 915 56.6% 50 to 64 532 988 85.6% 65 and over 369 489 32.6%
Housing Total Units 1,579 2,351 48.9% Occupied 1,454 2,262 55.6% Vacancy Rate 125 89 -28.8% Owner Occupied 1,224 1,963 60.4% Renter Occupied 230 299 30.0% * Note: The racial and cultural distribution numbers total to a sum larger than the total population. Hispanic is a cultural descriptor and is not exclusive of race.
B) Development Activity The large majority of land consumption that has occurred in the Coal Mountain/400 North subarea is from residential development. It is estimated that since 1990 approximately 600 acres have been developed for residential use in this area. Even with this large increase in developed acres, it is estimated there are still nearly 9,500 acres that could be developed in the Coal Mountain/400 North subarea. One of the tools the JJG team used to evaluate development activity in the County is the occurrence of Developments of Regional Impact (DRIs) since 1990. A DRI review is required by law to be completed for large-scale developments that are likely to have impacts outside of the jurisdiction(s) where they are located. The Georgia Planning Act of 1989 authorized the Department of Community Affairs (DCA) to establish procedures for intergovernmental review of these large-scale projects. More than 40 DRI reviews have been completed in Forsyth County since 1990, with one of these located in the Coal Mountain/400 North subarea. Specifically, it is located southwest of the intersection of GA 400 and SR 369 (Browns Bridge Road). The development, known as
Jordan, Jones & Goulding, Inc. Coal Mountain Subarea Land Use Report 8

Bridgetown, will include a variety of housing types totaling 919 units and 72,000 square-feet of commercial space. D) Future Development Trends 1. Future Infrastructure One of the primary drivers of development is the provision for public infrastructure, particularly sewer and roads. The availability of sewer allows for higher density land uses such as apartments or small-lot subdivisions (less than one-half acre lots). Roads are also primary drivers of change because they provide access to desired destinations, such as jobs and shopping. Better access leads to a higher land value and a greater likelihood of more intensive uses. 2002 Update of the County’s Major Transportation Plan highlights the planned transportation improvements for 2005, 2010 and 2020 in the County. In the short-term (by 2010), road widenings are planned for SR 306 and SR 369. Additional short-term projects include a new road connecting Pilgrim Mill Road to SR 306 and improving the interchange of GA 400 and SR 306. Some of the long-range projects (beyond 2011) include widening GA 400 to six lanes, widening SR 369 west of GA 400 to six lanes and adding express bus service from the intersection of SR 369 and SR 306 south along GA 400. Sewer is available in the subarea along GA 400 up to the GA 400/SR 369 intersection. Also, sewer service exists along SR 369 from GA 400 west to the intersection of SR 369 and John Burruss Road. The County is currently working on a Sewer System Master Plan that should be approved by the end of 2003. The Plan shows sewer service extended further north along GA 400 to the Dawson County line, as well as throughout much of the Coal Mountain area. These improvements are likely long-term, so the impact of their construction on land use patterns is not immediate. One of the strongest influences on the future development of the Coal Mountain/400 North subarea will be continued expansion of the Atlanta urbanized area. Over the last ten years, the southern half of the County has experienced intense development pressure, and this pressure is moving northward along either side of GA 400. Because of this growth pressure, the Coal Mountain/400 North area is likely to see more development in those areas closest to GA 400. B) Transitional Areas There are still large tracts of available land for development in the Coal Mountain subarea, so the likelihood of redevelopment is small. Generally, it is more expensive to tear down or renovate existing structures compared to constructing new, so as long as land is available with the same locational benefits as existing structures, new construction is likely to locate on vacant land. One of the key transitional areas in the Coal Mountain subarea is located in a triangular shape, bounded by three intersections including GA 400/SR 306, GA 400/SR 369 and SR 369/SR 306. This area is currently made up of three commercial nodes that will be growing together in the future to form one large commercial node. Also, the GA 400 corridor is considered a transitional area as residential and commercial growth continues to spread northward up this fast growing corridor. Additional pressure will be placed on the undeveloped land that is located along GA 400 to be converted to commercial and higher-end residential uses.
Jordan, Jones & Goulding, Inc. Coal Mountain Subarea Land Use Report 9

3. Current Land Use Policies The 2015 Future Land Use map for the Coal Mountain/400 North subarea identifies over 80 percent of the area to be developed as large-lot single-family houses. Current land use policy was analyzed by examining the primary tools of land use including the Unified Development Code and the Land Use Element of the Comprehensive Plan. The JJG team also examined the current zoning and Future Land Use maps to determine any implications that might arise from those elements. A difference exists between the way land is currently zoned in Forsyth County and the 2015 Future Land Use map. In order to achieve the future land uses that are envisioned in the Comprehensive Plan, large amounts of land would have to be re-zoned. Rezonings would have to occur not only within land use categories, but significant amounts of land would have to be rezoned into entirely different categories. Figure 6 on the following page shows the amount of land that would have to be rezoned to provide consistency with the 2015 Future Land Use map. For example, Figure 6 shows that 74 percent of the land is zoned for agricultural use, but 45 percent of this land would need to be rezoned for single-family residential use to be consistent with the Future Land Use map. The chart included as Figure 6 shows the amount of land within the Coal Mountain subarea that is intended for conversion from a current zoning category (rows), to a future land use category (columns). Individual cells of the table are currently zoned within a particular category (shown by the row) and intended for a particular future land use category (shown by the column). Percentages within each cell indicate the percentage of total land area that is categorized by a particular zoning category/future land use category combination. The colored areas of the chart indicate land that is currently intended for a future land use that is different from the way the land is currently zoned. At the present time, only approximately 15% of the Coal Mountain subarea is intended to perform the same use as it is currently allowed by zoning (shown by the white areas). To achieve the land uses shown in the current future land use map, 85% of the land will require significant rezonings. Areas shown in red represent required “downzonings” – zoning changes that are traditionally difficult to perform because they further restrict the use of the land. This comprises approximately 17% of the subarea. Areas shown in green represent required “upzonings” – zoning changes that are traditionally easier to perform because they generally increase the allowable uses of the land. This comprises approximately 66% of the subarea. Approximately 62% of the Coal Mountain subarea is currently intended to be moved away from agricultural zoning, to a mixture of residential (54%), and other uses (8%). Twelve percent of land currently zoned agricultural is intended for conservation and/or park use (primarily flood plain). Although the current land use regulations allow single-family residences on land zoned agricultural, this represents a significant conversion of the land’s purpose. Over the next 10 to 20 years, the Coal Mountain/400 North area is likely to experience a rapid increase in population. Employment opportunities are likely to take the form of retail and service oriented businesses catering to the needs of future homeowners. The eventual form and density that this future development will take is strongly dependent on the provision of sewer and road improvements. There are no immediate plans now to extend sewer into the area, but the investment in new roads will increase property values and lead to further market interest in single-family residential development.
Jordan, Jones & Goulding, Inc. Coal Mountain Subarea Land Use Report 10

Figure 6 Coal Mountain/400 North Rezonings to Match the 2015 Future Land Use Plan
Future Land Use Category
15% 60% 11% 2% 10% 2%
Conservation and
Park Single Family Residential
Multi-Family Residential
Office/ Institutional Industrial Commercial
74% Agriculture 12% 45% 9% 1% 7% <1%
19% Single-Family Residential 2% 14% 2% <1% <1% <1%
1% Multi-Family Residential <1% <1% <1%
2% Industrial <1% <1% <1% <1% <1% <1%
Cur
rent
Zon
ing
Cat
egor
y
4% Commercial 1% <1% <1% <1% 2% <1% * Note: Conservation and park land can be associated with any zoning category.
Indicates that a rezoning is not required to be consistent with the future Land Use Plan
Indicates potentially difficult rezoning
Indicates rezoning that might be moderately difficult
Indicates potentially easy rezoning
Jordan, Jones & Goulding, Inc. Coal Mountain Subarea Land Use Report 11

Another deficiency in land use policy is the treatment of agricultural lands. Currently, 74 percent of the land area in the Coal Mountain/400 North subarea is zoned for agricultural use, by far the most extensive zoning in the subarea. However, there is no future land use designation for agriculture. This is particularly notable with the existence of the A2 zoning classification that appears to foster the future use of land for agriculture. Most of the current agricultural land appears in the Future Land Use map as intended for residential use. This represents a large and significant land conversion, and a major loss of open space. The lack of specificity with regard to future commercial land use should also be examined. Currently, there is only one broad land use category to designate commercial uses (“commercial”). However, the Unified Development Code allows commercial districts of all types including: Neighborhood Shopping (NS), Urban Village (UV), Central Business District (CBD) and Office Commercial Multi-Story District (OCMS). These are vastly different types of commercial activities, and range in intensity of use from floor area ratios of 0.46 for Neighborhood Shopping districts to 5.50 for Office Commercial Multi-Story. In order to be effective, the Future Land Use map should include several designations for commercial uses of different intensities and functions. In addition, there is no land use designation for mixed-use districts, which are conditionally allowed in several of the existing zoning districts (such as Office Residential – OR). E) Trend Scenario 1. Methodology As part of the JJG team’s examination of current land use policies and their potential impacts, an analysis of current development trends for the Coal Mountain/400 North subarea was performed. It was based upon the existing Future Land Use map, rezoning history, and real estate market preferences. This analysis had no specific time horizon. It is intended to gain an understanding of the ultimate impact of future development, if such development follows existing trends and is guided by existing land use policy. In order to accomplish this analysis, the JJG team made several assumptions including:
Areas that are designated as having future land uses that are different from their existing land uses will be redeveloped; Existing structures that are non-conforming with respect to their current zoning will be redeveloped in a way to bring them into conformance; Future development within broad land use categories (for example, “Commercial”) will consist of a mix of uses and intensities that mirrors the county-wide proportions of land that is currently zoned within that category; Future development restrictions (for example, minimum lot sizes, maximum floor-area-ratios) will be based upon those that are currently expressed in the Unified Development Code; “Density shifting” to accommodate land lying within flood plains will continue to be permitted. In other words, parcels that contain part of their land within flood plains will be allowed to develop at the maximum density permitted, based on the area of the entire parcel, not just the part that is outside the flood plain; Moderately sloping land (>15% but less than 30%) that is designated residential, will eventually be developed; and Sewer and water services will be extended to all areas that require them.
Jordan, Jones & Goulding, Inc. Coal Mountain Subarea Land Use Report 12

2. Trend Scenario Map A Trend Scenario map was created in order to illustrate this future land use scenario and it is included on the following page as Figure 7. The future that this map indicates is not a given, but a likely scenario of how the area will develop over the next 20 years. It shows that existing residential developments will spread out and occupy a large amount of the subarea, and the existing commercial nodes will similarly spread out along existing transportation routes. Also as previously mentioned, three commercial nodes will grow into one large commercial node in the SR 306 and GA 400 area. The implications of this trend scenario include increased demands on public infrastructure, such as schools, water, sewer, roads, police and fire protection. It also indicates that the dramatic changes that the area has experienced over the past 10 years are only the beginning of additional changes for the area if current trends continue. The question that this planning exercise poses is one that the citizens of the Coal Mountain/400 North area have to answer, and that is “Is this the future that we envision for our community?”
Jordan, Jones & Goulding, Inc. Coal Mountain Subarea Land Use Report 13

Figure 7 Coal Mountain/400 North Trend Scenario
Jordan, Jones & Goulding, Inc. Coal Mountain Subarea Land Use Report 14

III. Subarea Committee Recommendations There were two meetings held from May to June 2003 to discuss the development of a land use plan for the Coal Mountain/400 North subarea. A list of the meeting dates can be found in the Appendix. At the first meeting the inventory of existing conditions for the subarea was presented, and the participants were asked to help craft a vision for the subarea. At the second meeting, a draft land use plan map was presented along with the draft vision and participants were asked to fill out comments cards, which were presented to the subarea committee for discussion and review. The result of this meeting was a revised land use plan map and a list of policy recommendations that the subcommittee would like to present to the Countywide Land Use Steering Committee for possible inclusion in the county’s Comprehensive Plan. The results of these meetings are presented below. A) Coal Mountain/400 North Subarea Vision
• The Coal Mountain subarea will primarily be a residential community with a rural character. • GA 400 will continue to be a valuable asset that provides connectivity to employment and
shopping opportunities. Future commercial growth should be directed to this corridor. • Convenient access to commercial services will be located around two activity centers. One
adjacent to SR 306 and SR 369 and another located at the intersection of SR 369 and SR 9. • A network of greenways will run throughout the subarea with passive parks and connected
trails. • The protection of Coal Mountain’s clean environment will be partially accomplished by
prohibiting additional heavy industry and limiting new light industry to appropriate locations near GA 400.
B) Policy Recommendations
• Update the Unified Development Code to reflect the Future Land Use Plan. • The County needs to prepare a Greenway Master Plan that includes connected greenways
throughout the County. Existing natural features such as stream banks and groundwater recharge areas could be utilized.
• Need more land in public parks. • Prepare a Feasibility Study on Transfer of Development Rights (TDRs) countywide, in order
to preserve open space. • Link conservation subdivisions with conservation corridors. • Need more conservation subdivisions. • Overall density of the area should not exceed 1 unit per acre. • Limit impervious surfaces and/or stormwater runoff in groundwater recharge areas. • Have infrastructure in place in advance of rezonings.
C) Coal Mountain/400 North Land Use Plan Map The future land use plan is an extension of the goals and values of the community and a culmination of the subarea planning effort. This future land use map is intended to depict a 2025 future land use
Jordan, Jones & Goulding, Inc Coal Mountain Subarea Land Use Report 15

scenario. The acreages and percentages of each land use are compiled in Figure 8 and a map showing the location of future land uses is included in Figure 9. There are fourteen land use designations depicted on the future land use map, including three residential designations and six commercial/industrial/mixed-use designations. Below is brief definition of each. Low Density Residential - This category is intended for single-family detached residential dwellings typically on septic sewer systems. Minimum lot size is 30,000 square feet, or the overall density is up to 1.5 units per acre. Institutional uses that are considered complimentary in this area include churches, schools, and libraries. Medium Density Residential - Consists of single-family detached residential dwellings typically on sewer, with overall densities from 1.5 to 2.5 units per acre. Institutional uses that are considered complimentary in this area include churches, schools, and libraries. Private recreational uses, such as golf courses, tennis courts, walking trails and swimming pools are encouraged in these areas in developments greater than 50 lots. High Density Residential - Typical uses include single-family detached and attached dwellings (such as townhouses) as well as multifamily condominiums and apartments, at densities of up to 6 units per acre. These developments should incorporate some amount of central outdoor public space for their residents. A limited number of churches, schools, libraries, other miscellaneous institutional uses and daycare facilities would be complimentary in these areas. An urban-density residential area is usually located near areas of high employment concentration, large commercial nodes, transportation nodes and mixed-use developments. It is essential that these developments include proper buffering between adjacent land uses. Office Transitional - The Office Transitional category is intended to allow for the redevelopment or transition of residential uses along major roadways to office professional uses. It also allows for new office development that is constructed in a manner consistent and in keeping with the surrounding residential uses. The physical character and design of proposed new structures should be compatible with existing establishments. This category includes small single occupant structures for doctors and or accountants, as well as larger offices with multiple tenants. Businesses that are allowed in this category may provide a product directly to customers on the premises as an accessory to the service, but do not, as a primary activity, involve the manufacture, storage, or distribution of products. These areas should provide employment opportunities in close proximity to residential areas while providing a transition between the more intense commercial areas and residential neighborhoods. Neighborhood Commercial - This category includes a limited range of retail and service activities to serve the everyday needs of local residents. Limitations should apply to both size and character of individual establishments. The basic character of this category is one that encourages and assures a compatible mixture of residential, office and retail types of land uses. Businesses in this land use category should be designed to encourage the development of neighborhood scale shopping that offers both goods and products, and the furnishing of selected services. General Commercial - This category includes standard retail and commercial service activities such as shopping centers, general retailers, specialty shops, grocery stores, drug stores, banks, restaurants,
Jordan, Jones & Goulding, Inc Coal Mountain Subarea Land Use Report 16

theatres, hotels, dry cleaners and entertainment facilities. These establishments should be located on appropriate transportation corridors to easily serve the public. Visual impacts of these developments should be minimized by requiring buffers, landscaping, and architectural controls. Activity Center - The Activity Center land use category includes commercial, entertainment, limited residential, and public/institutional land uses typically found in a central business district. The commercial business district (CBD) and urban village (UV) zoning classifications are considered appropriate for developments proposed within the Activity Center classification. Developments within the Activity Center classification may be encouraged to consider additional zoning classifications, based on future revisions to the Forsyth County Unified Development Code. The types of uses that are desirable in this area would be restaurants, specialty retail, governmental offices, low-intensity offices (e.g. accountant or real estate office) and appropriate parking. Uses should be complemented with walking, biking and transit opportunities to provide alternative modes of transportation. Also, any roadway improvements that are considered for this area should carefully consider the scale of the area. Residential uses shall be considered accessory and limited to townhouses or apartments mixed into the commercial establishments. Commercial uses must be developed or present first in comparable scale before residential uses can be permitted for construction. Corridor Commercial - The Corridor Commercial category is intended to focus on major transportation corridors, which presently contain a mix of agricultural, residential, commercial, and industrial land uses. Such corridors are unlikely to experience small scale, low or medium density residential development over the course of the planning period. Developments within the corridor commercial classification will focus on land uses of varying intensity that will allow for the appropriate transition between high-intensity development abutting the transportation corridor as well as provide for a continued decrease of intensity as the development moves away from the transportation corridor. The physical character and design of proposed developments should be compatible with surrounding uses. Inter-parcel connectivity and side street access should be encouraged to minimize curb cuts and improve traffic flow. Typical uses include standard retail and commercial service activities such as shopping centers, general retailers, specialty shops, grocery stores, drug stores, banks, restaurants, theatres, hotels, dry cleaners, entertainment facilities, multiple tenant offices, small single occupant structures, and entrances to residential subdivisions located outside the corridor commercial designation. The transitional nature of the category should be supported through the use of buffers, landscaping, and architectural controls to minimize the impacts on lower intensity land uses. Industrial - The primary purpose of this category is to provide for areas where light industrial uses can be located. These light industrial uses include light manufacturing, warehousing, wholesale/distribution and assembly. More intensive industrial uses that are characterized by noise, fumes, vibration and other forms of pollution that might be viewed as objectionable by surrounding uses are acceptable only on a case-by-case basis if well screened and buffered from other uses. Limited commercial uses are also allowed in industrial areas if they compliment existing industrial uses, such as cafeterias and day cares.
Jordan, Jones & Goulding, Inc Coal Mountain Subarea Land Use Report 17

Public / Institutional - Includes uses such as schools, colleges, hospitals, municipal community centers, churches, cemeteries, municipal buildings and post offices. Public Park - This category includes land dedicated to active and passive recreation uses. These areas are publicly owned and may include sports fields, recreation areas, greenways, and similar uses. Private Park - Privately owned land that is used for active and passive recreation. This may include subdivision amenities areas, golf courses and Army Corps of Engineers recreation areas. Conservation - This classification includes environmentally sensitive areas that are regulated at the local and state levels. Areas included in this category are the 35 ft. buffer along all county streams, a 100 ft. buffer along the Etowah River and land that is part of the 100-year floodplain of local waterways. This land has the potential to be used as public greenways or multi-purpose paths. Land classified as Conservation alerts government officials and property owners to the presence of environmental conditions that shall be factored into the rezoning and permitting process. Transportation / Communication / Utilities (TCU) - This category includes such uses as landfills, water treatment plants, wastewater treatment plants, power substations, rail yards, mass transit facilities, airports, etc. These uses may be either public or private. .
Coal Mountain/400 North Future Land Use, 2025
Land Use Acres Percent Low Density Residential 6,516 33.7%Medium Density Residential 5,643 29.2%General Commercial 2,241 11.6%High Density Residential 1,541 8.0%Industrial 1,183 6.1%Road Right-of Way (TCU) 1,151 6.0%Public/Institutional 310 1.6%Private Park 240 1.2%Public Park 179 0.9%Activity Center (Commercial) 103 0.5%Neighborhood Commercial 93 0.5%Corridor Commercial 68 0.4%Office-Transitional 45 0.2%Transportation/Communication/Utilities 0 0.0%Conservation (Lake Lanier US Corps land only) 0 0.0%Total Land Acreage 19,313 100.0%
Jordan, Jones & Goulding, Inc Coal Mountain Subarea Land Use Report 18

Figure 9 Coal Mountain/400 North 2025 Future Land Use Plan
J
ordan, Jones & Goulding, Inc Coal Mountain Subarea Land Use Report 19
Appendix A. Coal Mountain/400 North Subarea Advisory Committee Ruby Cook Jim Custer Mike Gilbert Jim Grogan Cindy Mills
B. Meeting Dates Coal Mountain Subarea Public Visioning Workshop – May 1st at 5:30 PM in the Sawnee Cultural Center.
Coal Mountain Subarea Advisory Committee Meeting – June 10th at 7:00 PM in the Sawnee Cultural Center.
Jordan, Jones & Goulding, Inc Coal Mountain Subarea Land Use Report 20

Forsyth County Comprehensive Plan
McFarland Subarea Land Use Report
September 25, 2003

Table of Contents I. Introduction ................................................................................................................. 1
A) Purpose............................................................................................................ 1 B) Scope............................................................................................................... 1 C) Location ........................................................................................................... 1
II. Inventory of Existing Conditions ................................................................................. 3
A) Description of Existing Land Uses ................................................................... 3 B) Environmentally Sensitive Areas...................................................................... 5
1. Historic Resources................................................................................ 5 2. Water Resources .................................................................................. 5 3. Steep Slope .......................................................................................... 5 4. Conservation & Park Lands .................................................................. 5
C) Historic Development Patterns ........................................................................ 7 1. Demographics....................................................................................... 7 2. Development Activity ............................................................................ 8
D) Future Development Trends ............................................................................ 9 1. Future Infrastructure ............................................................................. 9 2. Transitional Areas............................................................................... 10 3. Current Land Use Policies .................................................................. 10
E) Trend Scenario .............................................................................................. 12 1. Methodology ....................................................................................... 12 2. Trend Scenario Map ........................................................................... 13
III. Subarea Committee Recommendations.................................................................. 15
A) McFarland Subarea Vision............................................................................. 15 B) Policy Recommendations............................................................................... 15 C) McFarland Land Use Plan Map (Updated December 9, 2003) ...................... 15
Appendix ....................................................................................................................... 21
Jordan, Jones & Goulding, Inc. McFarland Subarea Land Use Report i

I. Introduction A) Purpose In preparing the 2003 Update to the Forsyth County Comprehensive Plan, the County initiated an ambitious public involvement process. In order to better analyze the County’s needs and elicit a higher degree of community participation, the county was divided into ten planning subareas (Figure 1) with individual committees established to develop specific land use policies and a future land use map for their subarea. The subarea boundaries were determined by a variety of factors including: physical barriers, historical communities, economics and transportation corridors. This information was gathered to help enable the communitythey got there and where they want to go in the future. Inclufrom the land use inventory and assessment for the McFarlanrecommendations of McFarland Subarea Advisory Committeand the meeting dates can be found in the Appendix. B) Scope The following report provides a current “snapshot” of the Mof existing land uses in the subarea is provided, along with antable. This is followed by an inventory of environmentally seinformation allow the community to identify those sections odeveloped in the future, as well as those areas that should be Following this inventory, there is an examination of the histoMcFarland subarea. This includes a discussion of demograph1990 and 2000, as well as an estimate of land consumption dusummary of the historical factors that have led to the current An examination of future development trends is also providefuture sewer and transportation infrastructure needs, as well that could potentially be redeveloped. Forsyth County’s landto determine what is allowed to develop under the current rethe subarea vision and policy recommendations developed byCommittee, and a copy of the future land use map for the su C) Location The McFarland subarea is located in the southwest corner ofdiagonally through this subarea from southwest to northeast.Fulton County to the west and south, South Forsyth subareaCumming subareas to the north.
Jordan, Jones & Goulding, Inc. 1
Bluegrass Business Park
to look at where they are today, how ded in this document are the findings d subarea, as well as the e. The membership of the committee
cFarland subarea. First, a description existing land use map and summary nsitive areas. These two sets of f the subarea that could potentially be protected from development pressures.
ric development patterns in the ic changes in the subarea between ring the last decade. There is also a
development patterns.
d. This includes an assessment of the as the identification of transitional areas use polices are also examined in order gulations. Finally, this report includes the McFarland Subarea Advisory
barea.
Forsyth County. GA 400 cuts The general boundaries include to the east, and Big Creek and
McFarland Subarea Land Use Report

Figure 1 Forsyth County Subarea Locations
Jordan, Jones & Goulding, Inc. McFarland Subarea Land Use Report 2

II. Inventory of Existing Conditions A) Description of Existing Land Uses A comprehensive land use survey was conducted for Forsyth County in the Summer of 2002 using tax parcel maps, aerial photographs and field review. In April 2003, JJG conducted a field review and a review of aerial photographs to verify the land uses in the McFarland subarea. These land uses are shown on Figure 2 on the following page and summarized in Figure 3 below.
LUndeveloped Residential Industrial Agriculture Road Right-ofCommercial Parks/RecreaInstitutional/PuMcFarland ToTotal Sq. Mile
As indicated in theundeveloped land, throughout the arecategory is residenland is located alonRoad. The third laThe McFarland arethere are two promMcFarland Road, temployer, Siemens The remaining landcommercial, publicthe commercial useAtlanta Highway (G
Jordan, Jones & Gouldin
Figure 3: McFarland Existing Land Use, 2003 and Use Acres Percent
3,879.34 31.17%3,859.22 31.00%1,461.06 11.74%1,393.39 11.19%
-way 923.44 7.42%403.22 3.24%
tion/Conservation 323.09 2.60%blic 164.45 1.32%tal 12,447.41 100.00%
s for Sub Area 19.4 --
table above, the largest land use category in the McFarland subarea is comprising 31.17 percent of the subarea. Undeveloped land is scattered a, though the largest concentration is located along Big Creek. The second largest tial land, which also makes up 31 percent of the subarea. Most of the residential g the outer edges of the subarea, along Atlanta Highway and Old Alpharetta rgest area is industrial land, which accounts for nearly 12 percent of the land area. a contains the largest concentration of industrial land in the county. In particular inent business parks in the area located on either side of GA 400 off of he Meadows and Bluegrass. The Meadows is the location of the County’s largest , which employs over 1,600 employees.
uses make up less than 26 percent of the total area. These uses include /institutional, parks/recreation/conservation, and agricultural land. Generally, s are concentrated along GA Hwy 9, especially between the intersections of A 9) with McFarland Road and Post Road.
g, Inc. McFarland Subarea Land Use Report 3

Jordan, Jones & Goulding, Inc. McFarland Subarea Land Use Report
Figure 2 McFarland Subarea Existing Land Use
4

B). Environmentally Sensitive Areas 1) Historic Resources In the mid-1990s a historic resources inventory was completed for Forsyth County. The Historic Resources Survey Report identified 490 historic resources in unincorporated Forsyth County. Thirty-seven (37) of these historic sites were located in the McFarland subarea. One of these sites, the Fowler Family Farm, was recently listed on the National Register of Historic Places. The Fowler Farm is located off Atlanta Highway, on the site of new county park and will be preserved for cultural benefit of the community. According to the Survey Report at least four other sites have potential for National Register listing. 2) Water Resources There are 1,456 acres of 100-year floodplains in the McFarland subarea. Development is regulated in this area by the Federal Emergency Management Agency, the Georgia Floodplain Management Program of DNR and by local ordinances. Most of the floodplain associated with the McFarland area is located along Big Creek and its tributaries. There are only 652 acres of land associated with groundwater recharge areas in the McFarland subarea. Significant recharge areas have been mapped by the Georgia Department of Natural Resources at the state level. If a significant recharge area is identified, the local government must comply with the Official Code Georgia Annotated 12-2-8. This Code outlines restrictions on locating landfills and hazardous waste facilities, above ground chemical or petroleum storage tanks, agricultural waste, impoundment sites, septic tank drain fields, slow rate land treatment, storm water infiltration basins, and waste treatment basins. The largest recharge area in the McFarland subarea is located in the southern tip of the subarea along Old Alpharetta Road. Most of this area is used for residential land uses, so detrimental impact to the recharge area should be minimal. 3) Steep Slopes There are 1,443 acres of steep slopes (15% grade or greater) in the McFarland subarea. This amounts to approximately 12 percent of the total land area in the subarea. Most of these steep slopes are located in the eastern portion of the subarea between GA Hwy 141 and Big Creek, and are associated with the stream banks. Steep slopes is not a significant deterrent to further construction in the McFarland subarea. 4) Conservation & Park Lands There are no active parks within the McFarland area, though the county has purchased a large tract of land along Big Creek just south Atlanta Highway (GA 9). The site will contain a new water treatment facility and a recreation park. The amenities that are planned to be constructed in the park include: 3 soccer fields, 3 ballfields, 12 tennis courts, 2 pavilions, and a recreation center. There will also be a 1.3-mile walking trail that circles the parks. The improvements will be constructed using approximately $8 million in SPLOST funds. The locations of the natural and cultural resources in the McFarland subarea are shown on the map included as Figure 4.
Jordan, Jones & Goulding, Inc. McFarland Subarea Land Use Report 5

C) Historic Development Patterns 1. Demographics In 2000, the population of the McFarland subarea totaled 7,845. This is an increase of 116% percent since 1990. The population density of the area is 403 people per square mile. In comparison, the highest number of people per square mile is in the South Forsyth subarea, with 701 people per square m
Bluegrass Promenade and surrounding homes
ile.
of
64
00.
The McFarland subarea is 89 percent white. The age distribution figures indicate the majorityresidents in this area are 30-39 years of age with children between the ages of 5 and 17 ranking second. The largest increase in age distribution has been for the groups 5 and under and 50 to years of age. Figure 5 provides a comparison of the demographic statistics for the area for 1990 and 20 The number of housing units in the McFarland subarea increased notably during the 1990s. In 1990, there were 1,375 housing units and by 2000 the number of units increased to 2,740, a 99.3 percent increase. During the 1990s the vacancy rate was cut in half, dropping from 5.28 percent in 1990 to 2.6 percent in 2000. The housing units in this area are largely owner-occupied, with 81 percent being owner-occupied and 13 percent renter occupied units. The number of owner-occupied units increased by 60 percent during the 1990s.
Jordan, Jones & Goulding, Inc. McFarland Subarea Land Use Report 6

Jordan, Jones & Goulding, Inc. McFarland Subarea Land Use Report
Figure 4 McFarland Natural and Cultural Resources
7

Figure 5 McFarland Subarea Demographics
1990 – 2000
1990 2000 Percent Change Total Population 3,631 7,845 116.1%
Racial and Cultural Distribution * White 3,606 6,977 93.5% Black or African American 2 128 5,464.2% Asian 11 86 688.2% Hispanic or Latino, regardless of race 51 1,078 2,000.3%
Age Distribution Under 5 316 808 155.4% 5 to 17 673 1324 96.6% 18 to 21 196 331 68.9% 22 to 29 489 913 86.7% 30 to 39 743 1788 140.7% 40 to 49 563 1206 114.2% 50 to 64 453 1049 131.7% 65 and over 249 426 71.1%
Housing Total Units 1,375 2,740 99.3% Occupied 1,303 2,669 104.8% Vacancy Rate 5.2% 2.6% -2.6% Owner Occupied 1,115 2,374 112.9% Renter Occupied 188 295 56.8% * Note: The racial and cultural distribution numbers total to a sum larger than the total population. Hispanic is a cultural descriptor and is not exclusive of race.
2. Development Activity It is estimated that since 1990 approximately one-fourth of the land (3000 acres) in the McFarland subarea has been developed. Almost half of this development has been for industrial uses. Even with this large increase in developed acres, it is estimated there are still another 3,000 acres that could be developed in the future in the McFarland subarea. One of the tools the JJG team used to evaluate development activity in the County is the occurrence of Developments of Regional Impact (DRIs) since 1990. A DRI review is required by law to be completed for large-scale developments that are likely to have impacts outside of the jurisdiction(s) where they are located. The Georgia Planning Act of 1989 authorized the Department of Community Affairs (DCA) to establish procedures for intergovernmental review of these large-scale projects. More than 40 DRI reviews have been completed in Forsyth County since 1990, with one of these located in the McFarland subarea, a proposed regional mall and accessory uses by the Rouse Company.
Jordan, Jones & Goulding, Inc. McFarland Subarea Land Use Report 8

The first phase of the Rouse project is anticipated to be completed in 2006, though construction has not started yet. The entire project will total 2.3 million square feet on 177 acres located on GA 400 between the McFarland and Union Hill exits. Besides a commercial mall, it will include offices, a hotel, and luxury apartments or condos. Part of the construction of the project will include a new 4 to 6 lane roadway connecting Union Hill and McFarland Roads. The Rouse Company recently announced that it was preparing an alternative plan for the site, due to the fact it was having problems attracting major retail anchors. Only Neiman Marcus has committed to the project, at this time.
D) Future Development Trends 1. Future Infrastructure One of the primary drivers of development is the provision for public infrastructure, particularly sewer and roads. The availability of sewer allows for higher density land uses such as apartments or small-lot subdivisions (less than one-half acre lots). Roads are also primary drivers of change because they provide access to desired destinations, such as jobs and shopping. Better access leads to a higher land value and a greater likelihood of more intense uses. The update of the County’s Major Transportation Plan indicates there are numerous transportation improvements planned for the McFarland subarea. This includes the construction of frontage road on the southeastern side of GA 400 to provide better access to the proposed regional mall and the business parks along the highway. Other short-term improvements include the widening of Post Road, Mullinax Road, Atlanta Highway (GA Hwy 9), Peachtree Parkway (GA Hwy 141), and McGinnis Ferry Road from 2 to 4 lanes. McFarland Road, from Union Hill to McGinnis Ferry, is scheduled to be improved from 2 to 6 lanes, including the GA 400 overpass. By 2010, GA 400, Peachtree Parkway, and McGinnis Ferry Road are planned to be further widened to 6 lanes. Union Hill Road and Old Alpharetta Road are also planned to be widened to 4 lanes during this period. In the long term, by 2020, GA 400 is planned to be further widened to 8 lanes, and portions of GA Hwy 9 and McFarland Road are planned to be widened to 6 lanes. Sewer is available throughout most of the southern portion of the McFarland subarea. The County’s Sewer System Master Plan shows that a new water treatment facility will be constructed on Big Creek, just south of GA Highway 9 next to the new Fowler Park. Construction of this new plant will also coincide with the construction of new gravity sewer to serve the northern portion of the subarea. These improvements are a high priority on the plan and will likely be constructed within the next 5 years.
Jordan, Jones & Goulding, Inc. McFarland Subarea Land Use Report 9

One of the strongest influences on the future development of the McFarland subarea will be continued expansion of the Atlanta urbanized area. Over the last ten years, this southern half of the County has experienced intense development pressure, and this pressure is moving northward along either side of GA 400. Because of this growth pressure, land values in the southern portion of the county are likely to continue to rise making it more economical for higher density development, particularly for those areas closest to GA 400. 2. Transitional Areas There are still large tracts of available land for development in the McFarland subarea, so the likelihood of redevelopment is small. Generally, it is more expensive to tear down or renovate existing structures compared to constructing new, so as long as land is available with the same locational benefits as existing structures, new construction is likely to locate on vacant land. 3. Land Use Policies The current Future Land Use map for the McFarland subarea identifies over 55 percent of the area to be developed as large-lot single-family houses, 21 percent to be developed as industrial uses, and 19 percent to be conserved as parkland and open space. Current land use policy was analyzed by examining the primary tools of land use including the Unified Development Code and the Land Use Element of the Comprehensive Plan. The JJG team also examined the current zoning and Future Land Use maps to determine any implications that might arise from those elements. A difference exists between the way land is currently zoned in Forsyth County and the Future Land Use map. In order to achieve the future land uses that are envisioned in the Comprehensive Plan, large amounts of land would have to be re-zoned. Rezonings would have to occur not only within land use categories, but significant amounts of land would have to be rezoned into entirely different categories. Figure 6 on the following page shows the amount of land that would have to be rezoned to provide consistency with the Future Land Use map. For example, Figure 6 shows that 45 percent of the land is zoned for agricultural use, although the current Agricultural zoning standards allow 1-acre single-family residences, 37 percent of this land would need to be rezoned for single-family residential use to be consistent with the Land Use Plan. .
Jordan, Jones & Goulding, Inc. McFarland Subarea Land Use Report 10

Jordan, Jones & Goulding, Inc. McFarland Subarea Land Use Report
Figure 6 McFarland Rezonings to Match the 2015 Future Land Use Plan
Future Land Use Category
19% 55% 0% 1% 21% 4%
Conservation
and Park Single Family Residential
Multi-Family Residential
Office/ Institutional Industrial Commercial
47% Agriculture 10% 34% <1% 2% 1%
19% Single-Family Residential 3% 14% <1% 1% <1%
1% Multi-Family Residential <1% <1% <1%
1% Office Institutional <1% <1% <1% <1%
25% Industrial 5% 5% 15% <1%
Cur
rent
Zon
ing
Cat
egor
y
7% Commercial <1% 2% <1% 2% 2% * Note: Conservation and park land can be associated with any zoning category.
Indicates that a rezoning is not required to be consistent with the future Land Use Plan
Indicates potentially difficult rezoning
Indicates rezoning that might be moderately difficult
Indicates potentially easy rezoning
11

The chart included as Figure 6 shows the amount of land within the McFarland subarea that is intended for conversion from a current zoning category (rows), to a future land use category (columns). Individual cells of the table are currently zoned within a particular category (shown by the row) and intended for a particular future land use category (shown by the column). Percentages within each cell indicate the percentage of total land area that is categorized by a particular zoning category/future land use category combination. The colored areas of the chart indicate land that is currently intended for a future land use that is different from the way the land is currently zoned. At the present time, approximately 31% of the McFarland subarea is intended to perform the same use as it is currently allowed by zoning (shown by the white areas). To achieve the land uses shown in the current future land use map, 69% of the land will require rezonings. Areas shown in red represent required “downzonings” – zoning changes that are traditionally difficult to perform because they further restrict the use of the land. This comprises approximately 17% of the subarea. Areas shown in green represent required “upzonings” – zoning changes that are traditionally easier to perform because they generally increase the allowable uses of the land. This comprises approximately 50% of the subarea. Approximately 37% of the McFarland subarea is currently intended to be moved away from agricultural zoning, to a mixture of residential (34%), and other uses (3%). Ten percent of the land, currently zoned agricultural, is intended for conservation and/or park use (primarily flood plain). Although the current land use regulations allow single-family residences on land zoned agricultural, this represents a conversion of the land’s purpose. E) Trend Scenario 1) Methodology As part of the JJG team’s examination of current land use policies and their potential impacts, an analysis of current development trends for the McFarland subarea was performed. It was based upon the existing Future Land Use map, rezoning history, and real estate market preferences. This analysis had no specific time horizon. It is intended to gain a understanding of the ultimate impact of future development, if such development follows existing trends and is guided by existing land use policy. In order to accomplish this analysis, the JJG team made several assumptions including:
Areas that are designated as having future land uses that are more intensive than their existing land uses will be redeveloped; Future development within broad land use categories (for example, “Commercial”) will consist of a mix of uses and intensities that mirrors the county-wide proportions of land that is currently zoned within that category; Future development restrictions (for example, minimum lot sizes, maximum floor-area-ratios) will be based upon those that are currently expressed in the Unified Development Code; “Density shifting” to accommodate land lying within flood plains will continue to be permitted. In other words, parcels that contain part of their land within flood plains will be
Jordan, Jones & Goulding, Inc. McFarland Subarea Land Use Report 12

allowed to develop at the maximum density permitted, based on the area of the entire parcel, not just the part that is outside the flood plain;
Moderately sloping land (>15% but less than 30%) that is designated residential, will eventually be developed; and Sewer and water services will be extended to all areas that require them.
2) Trend Scenario Map A Trend Scenario map was created in order to illustrate this future land use scenario and it is included on the following page as Figure 7. The future that this map indicates is not a given, but a likely scenario of how the area will develop over the next 20 years. It shows that existing residential developments will spread out and occupy most of the land in the subarea, the business parks on either side of GA 400 will continue to expand, and a major commercial center will develop around the proposed Rouse Mall site. The map also indicates additional commercial development along GA Hwy 9. The implications of this trend scenario include increased demands on public infrastructure, such as schools, water, sewer, roads, police and fire protection. It also indicates that the dramatic changes that the area has experienced over the past 10 years are only the beginning of additional changes for the area if current trends continue. The question that this planning exercise poses is one that the citizens of the McFarland area have to answer, and that is “Is this the future that we envision for our community?”
Jordan, Jones & Goulding, Inc. McFarland Subarea Land Use Report 13

Jordan, Jones & Goulding, Inc. McFarland Subarea Land Use Report
Figure 7 McFarland Trend Scenario
14

III. Subarea Committee Recommendations There were two meetings held from May to June 2003 to discuss the development of a land use plan for the McFarland subarea. A list of the meeting dates can be found in the Appendix. At the first meeting the inventory of existing conditions for the subarea was presented, and the participants were asked to help craft a vision for the subarea. At the second meeting, a draft land use plan map was presented along with the draft vision and participants were asked to fill out comments cards, which were presented to the subarea committee for discussion and review. The result of this meeting was a revised land use plan map and a list of policy recommendations that the subcommittee would like to present to the Countywide Land Use Steering Committee for possible inclusion in the county’s Comprehensive Plan. The results of these meetings are presented below. A) McFarland Subarea Vision
• The McFarland subarea will be the premier employment center for the County. • It will be the site of quality development and business opportunities. • Convenient access to commercial services will be located along major arterial roads, such as
Hwy 9. • A network of greenways will run along the Big Creek with passive parks and connected
trails. B) Policy Recommendations
• The County needs to prepare a Greenway Master Plan that includes connected greenways throughout the County. Existing natural features such as stream banks and groundwater recharge areas could be utilized.
• Need more land in public parks. • Create hiking trails along Big Creek and connect with North Fulton County. • Future expansions of stream buffers should include appropriate compensation. • Control the amount of multi-family residential that is allowed. Use the area north of
Windward Pkwy. and east of GA 400 as an example of the appropriate mixture of residential.
• Need design standards for McFarland Blvd. And SR 9, but not strict architectural standards or architectural review board.
• Provide incentives for constructing mixed-use developments. • Create more grid pattern streets in large developments. • Transportation improvements are needed to serve the Future Land Use Plan. • Need better public safety services, library and post office.
C) McFarland Land Use Plan Map The future land use plan is an extension of the goals and values of the community and a culmination of the subarea planning effort. This future land use map is intended to depict a 2025 future land use
Jordan, Jones & Goulding, Inc McFarland Subarea Land Use Report 15

scenario. The acreages and percentages of each land use are compiled in Figure 8 and a map showing the location of future land uses is included in Figure 9. There are fourteen land use designations depicted on the future land use map, including three residential designations and six commercial/industrial/mixed-use designations. Below is brief definition of each. Low Density Residential - This category is intended for single-family detached residential dwellings typically on septic sewer systems. Minimum lot size is 30,000 square feet, or the overall density is up to 1.5 units per acre. Institutional uses that are considered complimentary in this area include churches, schools, and libraries. Medium Density Residential - Consists of single-family detached residential dwellings typically on sewer, with overall densities from 1.5 to 2.5 units per acre. Institutional uses that are considered complimentary in this area include churches, schools, and libraries. Private recreational uses, such as golf courses, tennis courts, walking trails and swimming pools are encouraged in these areas in developments greater than 50 lots. High Density Residential - Typical uses include single-family detached and attached dwellings (such as townhouses) as well as multifamily condominiums and apartments, at densities of up to 6 units per acre. These developments should incorporate some amount of central outdoor public space for their residents. A limited number of churches, schools, libraries, other miscellaneous institutional uses and daycare facilities would be complimentary in these areas. An urban-density residential area is usually located near areas of high employment concentration, large commercial nodes, transportation nodes and mixed-use developments. It is essential that these developments include proper buffering between adjacent land uses. Office Transitional - The Office Transitional category is intended to allow for the redevelopment or transition of residential uses along major roadways to office professional uses. It also allows for new office development that is constructed in a manner consistent and in keeping with the surrounding residential uses. The physical character and design of proposed new structures should be compatible with existing establishments. This category includes small single occupant structures for doctors and or accountants, as well as larger offices with multiple tenants. Businesses that are allowed in this category may provide a product directly to customers on the premises as an accessory to the service, but do not, as a primary activity, involve the manufacture, storage, or distribution of products. These areas should provide employment opportunities in close proximity to residential areas while providing a transition between the more intense commercial areas and residential neighborhoods. Neighborhood Commercial - This category includes a limited range of retail and service activities to serve the everyday needs of local residents. Limitations should apply to both size and character of individual establishments. The basic character of this category is one that encourages and assures a compatible mixture of residential, office and retail types of land uses. Businesses in this land use category should be designed to encourage the development of neighborhood scale shopping that offers both goods and products, and the furnishing of selected services. General Commercial - This category includes standard retail and commercial service activities such as shopping centers, general retailers, specialty shops, grocery stores, drug stores, banks, restaurants,
Jordan, Jones & Goulding, Inc McFarland Subarea Land Use Report 16

theatres, hotels, dry cleaners and entertainment facilities. These establishments should be located on appropriate transportation corridors to easily serve the public. Visual impacts of these developments should be minimized by requiring buffers, landscaping, and architectural controls. Activity Center - The Activity Center land use category includes commercial, entertainment, limited residential, and public/institutional land uses typically found in a central business district. The commercial business district (CBD) and urban village (UV) zoning classifications are considered appropriate for developments proposed within the Activity Center classification. Developments within the Activity Center classification may be encouraged to consider additional zoning classifications, based on future revisions to the Forsyth County Unified Development Code. The types of uses that are desirable in this area would be restaurants, specialty retail, governmental offices, low-intensity offices (e.g. accountant or real estate office) and appropriate parking. Uses should be complemented with walking, biking and transit opportunities to provide alternative modes of transportation. Also, any roadway improvements that are considered for this area should carefully consider the scale of the area. Residential uses shall be considered accessory and limited to townhouses or apartments mixed into the commercial establishments. Commercial uses must be developed or present first in comparable scale before residential uses can be permitted for construction. Corridor Commercial - The Corridor Commercial category is intended to focus on major transportation corridors, which presently contain a mix of agricultural, residential, commercial, and industrial land uses. Such corridors are unlikely to experience small scale, low or medium density residential development over the course of the planning period. Developments within the corridor commercial classification will focus on land uses of varying intensity that will allow for the appropriate transition between high-intensity development abutting the transportation corridor as well as provide for a continued decrease of intensity as the development moves away from the transportation corridor. The physical character and design of proposed developments should be compatible with surrounding uses. Inter-parcel connectivity and side street access should be encouraged to minimize curb cuts and improve traffic flow. Typical uses include standard retail and commercial service activities such as shopping centers, general retailers, specialty shops, grocery stores, drug stores, banks, restaurants, theatres, hotels, dry cleaners, entertainment facilities, multiple tenant offices, small single occupant structures, and entrances to residential subdivisions located outside the corridor commercial designation. The transitional nature of the category should be supported through the use of buffers, landscaping, and architectural controls to minimize the impacts on lower intensity land uses. Industrial - The primary purpose of this category is to provide for areas where light industrial uses can be located. These light industrial uses include light manufacturing, warehousing, wholesale/distribution and assembly. More intensive industrial uses that are characterized by noise, fumes, vibration and other forms of pollution that might be viewed as objectionable by surrounding uses are acceptable only on a case-by-case basis if well screened and buffered from other uses. Limited commercial uses are also allowed in industrial areas if they compliment existing industrial uses, such as cafeterias and day cares.
Jordan, Jones & Goulding, Inc McFarland Subarea Land Use Report 17

Public / Institutional - Includes uses such as schools, colleges, hospitals, municipal community centers, churches, cemeteries, municipal buildings and post offices. Public Park - This category includes land dedicated to active and passive recreation uses. These areas are publicly owned and may include sports fields, recreation areas, greenways, and similar uses. Private Park - Privately owned land that is used for active and passive recreation. This may include subdivision amenities areas, golf courses and Army Corps of Engineers recreation areas. Conservation - This classification includes environmentally sensitive areas that are regulated at the local and state levels. Areas included in this category are the 35 ft. buffer along all county streams, a 100 ft. buffer along the Etowah River and land that is part of the 100-year floodplain of local waterways. This land has the potential to be used as public greenways or multi-purpose paths. Land classified as Conservation alerts government officials and property owners to the presence of environmental conditions that shall be factored into the rezoning and permitting process. Transportation / Communication / Utilities (TCU) - This category includes such uses as landfills, water treatment plants, wastewater treatment plants, power substations, rail yards, mass transit facilities, airports, etc. These uses may be either public or private.
Jordan, Jones & Goulding, Inc McFarland Subarea Land Use Report 18

Figure 8 McFarland Future Land Use, 2025
Land Use Acres Percent Medium Density Residential 3,769 30.3%Industrial 3,388 27.2%Low Density Residential 1,830 14.7%General Commercial 1,077 8.7%Road Right-of Way (TCU) 938 7.5%High Density Residential 460 3.7%Transportation/Communication/Utilities 204 1.6%Corridor Commercial 171 1.4%Public/Institutional 141 1.1%Neighborhood Commercial 137 1.1%Activity Center (Commercial) 115 0.9%Office-Transitional 80 0.6%Private Park 72 0.6%Public Park 65 0.5%Total Land Acreage 12,447 100.0%
Jordan, Jones & Goulding, Inc McFarland Subarea Land Use Report 19

Figure 9 McFarland 2025 Future Land Use Plan
Jordan, Jones & Goulding, Inc McFarland Subarea Land Use Report 20

Appendix A. McFarland Subarea Advisory Committee Grant Nintzel Jay Land Barbara Edwards Phil Bettis Dennis Anderson
B. Meeting Dates McFarland Subarea Public Visioning Workshop – May 13th at 7:30 PM in the West Hall Cafeteria, South Forsyth High School McFarland Subarea Advisory Committee Meeting – June 12th at 6:30 PM in the West Hall Cafeteria, South Forsyth High School
Jordan, Jones & Goulding, Inc McFarland Subarea Land Use Report 21

Forsyth County Comprehensive Plan
Cumming Subarea Land Use Report
September 25, 2003

Table of Contents I. Introduction ................................................................................................................. 1
A) Purpose............................................................................................................ 1 B) Scope............................................................................................................... 1 C) Location ........................................................................................................... 1
II. Inventory of Existing Conditions ................................................................................. 3
A) Description of Existing Land Uses ................................................................... 3 B) Environmentally Sensitive Areas...................................................................... 5
1. Historic Resources................................................................................ 5 2. Water Resources .................................................................................. 5 3. Steep Slope .......................................................................................... 5 4. Conservation & Park Lands .................................................................. 5
C) Historic Development Patterns ........................................................................ 7 1. Demographics....................................................................................... 7 2. Development Activity ............................................................................ 8
D) Future Development Trends ............................................................................ 9 1. Future Infrastructure ............................................................................. 9 2. Transitional Areas................................................................................. 9 3. Current Land Use Policies .................................................................... 9
E) Trend Scenario .............................................................................................. 10 1. Methodology ....................................................................................... 10 2. Trend Scenario Map ........................................................................... 12
III. Subarea Committee Recommendations.................................................................. 14
A) Cumming Subarea Vision .............................................................................. 14 B) Policy Recommendations............................................................................... 14 C) Cumming Land Use Plan Map (Updated December 9, 2003)........................ 15
Appendix ....................................................................................................................... 20
Jordan, Jones & Goulding, Inc. Cumming Subarea Land Use Report i

I. Introduction A) Purpose
Greenwood Acres
In preparing the 2003 Update to the Forsyth County Comprehensive Plan, the County initiated an ambitious public involvement process. In order to better analyze the County’s needs and elicit a higher degree of community participation, the county was divided into ten planning subareas (Figure 1) with individual committees established to develop specific land use policies and a future land use map for their subarea. The subarea boundaries were determined by a variety of factors including: physical barriers, historical communities, economics and transportation corridors. This information was gathered to help enable the community to look at where they are today, how they got there and where they want to go in the future. Included in this document are the findings from the land use inventory and assessment for the Cumming subarea, as well as the recommendations of the Cumming Subarea Advisory Committee. The membership of the committee and the meeting dates can be found in the Appendix. B) Scope The following report provides a current “snapshot” of the Cumming subarea. First, a description of existing land uses in the subarea is provided, along with an existing land use map and summary table. This is followed by an inventory of environmentally sensitive areas. These two sets of information allow the community to identify those sections of the subarea that could potentially be developed in the future, as well as those areas that should be protected from development pressures. Following this inventory, there is an examination of the historic development patterns in the Cumming subarea. This includes a discussion of demographic changes in the subarea between 1990 and 2000, as well as an estimate of land consumption during the last decade. There is also a summary of the historical factors that have led to the current development patterns. An examination of future development trends is also provided. This includes an assessment of the future sewer and transportation infrastructure needs, as well as the identification of transitional areas that could potentially be redeveloped. Forsyth County’s land use polices are also examined in order to determine what is allowed to develop under the current regulations. Finally, this report includes the subarea vision and policy recommendations developed by the Cumming Subarea Advisory Committee, and a copy of the future land use map for the subarea. C) Location The Cumming subarea is located in the center of the County, primarily including land west of the Cumming city limits to Bethelview Road. Land falling within the Cumming city limits is not included as part of this study. This subarea also includes a small portion of land immediately east of the Bald Ridge Marina Road exit on GA 400.
Jordan, Jones & Goulding, Inc. Cumming Subarea Land Use Report 1

Jordan, Jones & Goulding, Inc Cumming Subarea Land Use Report
Figure 1 Forsyth County Subarea Locations
2

II. Inventory of Existing Conditions A) Description of Existing Land Uses A comprehensive land use survey was conducted for Forsyth County in the Summer of 2002 using tax parcel maps, aerial photographs and field review. In April 2003, JJG conducted a field review and a review of aerial photographs to verify the land uses in the Cumming subarea. These land uses are shown on Figure 2 on the following page and summarized in Figure 3 below. The subarea does not include the City of Cumming. There is a large amount of commercial, industrial, and institutional/public land concentrated in the City. This landuse inventory focuses on the area outside of the City limits.
LResidential Undeveloped Road Right-ofAgriculture Commercial Institutional/PuIndustrial Cumming ToTotal Sq. Mile
As indicated in theland, comprising 3throughout the subland, which makesevenly throughoutlargest category is raccounts for almosCumming area, the The remaining landcommercial, industcommercial and inthe northernmost p
Jordan, Jones & Gouldin
Figure 3: Cumming Existing Land Use, 2003 and Use Acres Percent
5,155.72 38.32%4,117.20 30.60%
-way 1,173.43 8.72%1,057.19 7.86%
699.60 5.20%blic 504.62 3.75%
375.15 2.79%tal 13,453.18 100.00%s for Sub Area 21.0 --
table above, the largest land use category in the Cumming subarea is residential 8 percent of the subarea. Most of the residential land is distributed evenly area, outside the City of Cumming. The second largest category is undeveloped
up 31 percent of the subarea. The majority of the undeveloped land is spread the subarea, with a concentration around Big Creek and its flood plain. The next ight-of-way/other, accounting for 9 percent of the land area. Agricultural land t 8 percent of the subarea. There are three large agricultural tracts in the largest of which is located in the northwest part of the subarea.
uses make up less than 11 percent of the total area. These uses include rial, public/institutional and parks/recreation/conservation land. The dustrial uses are concentrated along SR 9 south of Cumming and along SR 20 in art of the subarea.
g, Inc. Cumming Subarea Land Use Report 3

Jordan, Jones & Goulding, Inc. Cumming Subarea Land Use Report
Figure 2 Cumming Existing Land Use
4

B) Environmentally Sensitive Areas 1. Historic Resources In the mid-1990s a historic resources inventory was completed for Forsyth County. The Historic Resources Survey Report identified 490 historic resources in unincorporated Forsyth County. Thirty-five of these historic sites were located in the Cumming subarea, and 13 of these have the potential for listing on the National Register of Historic Places. 2. Water Resources There are 881 acres of 100-year floodplains in the Cumming subarea. Development is regulated in this area by the Federal Emergency Management Agency, the Georgia Floodplain Management Program of DNR and by local ordinances. The majority of the floodplains are around Big Creek. Big Creek is a Small Water Supply Watershed and therefore must meet the Part 5 Minimum Environmental Planning Criteria established by the Georgia Department of Community Affairs. These are state standards set for the protection of natural resources in the County, such as water supply watersheds, stream buffers, floodplains, wetlands and groundwater recharge areas. Once these environmental resources are mapped and protected with policies in the Comprehensive Plan, local governments are required to implement the policies through amendments to their zoning ordinances and subdivision regulations. Forsyth County already protects the Big Creek Watershed with a 50-foot buffer on both sides of the creek. Additionally, a 25-foot impervious surface setback has been added to the established buffer. Of the 33,593 acres of groundwater recharge in Forsyth County, 2,941 are located in the Cumming subarea. The acres of groundwater recharge are located in one area in the southern portion of the subarea, following GA 400 and SR 9. 3. Steep Slopes There are 2,883 acres of steep slopes (15% or greater) in the Cumming subarea. The majority of steep slopes are concentrated in the northern portion of the subarea on the mountain, or around the subarea’s streams. 4. Conservation & Park Lands There are 67 acres of parks in the Cumming subarea. These parks are small and distributed evenly throughout the subarea. The locations of the natural and cultural resources in the Cumming subarea are shown on the map included as Figure 4.
Jordan, Jones & Goulding, Inc Cumming Subarea Land Use Report 5

Jordan, Jones & Goulding, Inc. Cumming Subarea Land Use Report
Figure 4 Cumming Natural and Cultural Resources
6

C) Historic Development Patterns 1. Demographics The Cumming subarea is comprised of the unincorporated area adjacent to the City of Cumming. Similar to other parts of Forsyth County, this area has historically been characterized by farms, open land and single-family residences. However, upon completion of GA 400, the City of Cumming and the Cumming subarea has become more attractive for residential subdivisions and other development. The Cumming subarea is well connected with roadways including GA 400, SR 20 and SR 9. GA 400 is a four-lane divided highway with limited access from the Fulton County line through the subarea. Beyond the subarea, at SR 306, GA 400 has several at-grade road crossings. The major highways within this subarea serve commuters and other regional traffic moving across north Georgia. Additionally, the majority of the commercial and industrial development within the subarea has developed along the corridors of SR 20 and SR 9. The City of Cumming serves as the county hub for commerce and industry. The Cumming subarea serves as a residential base for the City of Cumming and the employment areas to the south. In 2000, the population of the Cumming subarea totaled 13,445. This is an increase of nearly 100% percent since 1990. The population density of the area is 622 people per square mile. This makes it among the most densely populated areas of the county. By comparison, the most densely populated subarea is the South Forsyth subarea, with 701 people per square mile. The Cumming subarea is 91 percent white. However, the Hispanic population in the subarea grew dramatically in the 1990s. In 1990, Hispanics accounted for 4% of the population. By 2000, this number had grown to nearly 13%. During the 1990s, the area also added 266 black residents. The age distribution figures indicate the majority of residents in this area are 30-39 years of age, which was the fastest growing category in the 1990s. The second largest group is children between the ages of 5 and 17. The next fastest growing category is older adults, ages 50 to 64 years of age. Figure 5 provides a comparison of the demographic statistics for the area for 1990 and 2000. The number of housing units in the Cumming subarea increased considerably during the 1990s. In 1990, there were 2,631 housing units and by 2000 the number of units increased to 4,948, an 88 percent increase. While the total number of vacant housing units increased in the 1990s, the vacancy rate decreased by two-thirds, dropping from 7.6 percent in 1990 to 4.8 percent in 2000. Nearly three-quarters of the housing units in this area are owner-occupied, with 24 percent being renter occupied. The overall trend is for an increase in the share of owner occupied units.
Jordan, Jones & Goulding, Inc Cumming Subarea Land Use Report 7

Figure 5: Cumming Subarea Demographics
1990 – 2000 1990 2000 Percent Change Total Population 6,795 13,445 97.9%
Racial and Cultural Distribution * White 6,767 12,238 80.8% Black or African American 0 266 N/A Asian 12 52 322.7% Hispanic or Latino, regardless of race 291 1,699 484.5%
Age Distribution Under 5 543 1,069 97.0% 5 to 17 1,306 2,320 77.7% 18 to 21 449 641 42.7% 22 to 29 1,023 1,541 50.7% 30 to 39 1,132 2,591 128.8% 40 to 49 999 1,950 95.1% 50 to 64 814 1,843 126.3% 65 and over 819 1,490 81.9%
Housing Total Units 2,631 4,948 88.1% Occupied 2,430 4,711 93.9% Vacancy Rate 7.6% 4.7% -2.9% Owner Occupied 1,644 3,521 114.1% Renter Occupied 786 1,190 51.5% * Note: The racial and cultural distribution numbers total to a sum larger than the total population. Hispanic is a cultural descriptor and is not exclusive of race.
B) Development Activity The large majority of land consumption that has occurred in the Cumming subarea is from residential development. Even with the large increase in developed acres, it is estimated there are still over 5,000 acres that could be developed. About 18 percent of these developable acres are currently agriculture lands. One of the tools the JJG team used to evaluate development activity in the County is the occurrence of Developments of Regional Impact (DRIs) since 1990. A DRI review is required by law to be completed for large-scale developments that are likely to have impacts outside of the jurisdiction(s) where they are located. The Georgia Planning Act of 1989 authorized the Department of Community Affairs (DCA) to establish procedures for intergovernmental review of these large-scale projects. More than 40 DRI reviews have been completed in Forsyth County since 1990. Two of these are located in the Cumming subarea.
Jordan, Jones & Goulding, Inc Cumming Subarea Land Use Report 8

The first DRI was Manchester Park. This development was approved in 1998 and is comprised of 478 residential units on 95 acres. The second is the Beazer Homes Planned Unit Development. This is a mixed use Planned Unit Development Community on 217 acres. The development consists of cluster housing, townhouses, offices and other facilities. D) Future Development Trends 1. Future Infrastructure One of the primary drivers of development is the provision for public infrastructure, particularly sewer and roads. The availability of sewer allows for higher density land uses such as apartments or small-lot subdivisions (less than one-half acre lots). Roads are also primary drivers of change because they provide access to desired destinations, such as jobs and shopping. Better access leads to a higher land value and a greater likelihood of more intensive uses. highlight the planned transportation improvements for 2005, 2010 and 2020 in the County. These maps were originally created as part of the 2002 Update of the county’s Major Transportation Plan. As the maps indicate, there are numerous transportation improvements planned for the Cumming subarea. The 2002 Update of the county’s Major Transportation Plan list of improvements planned for 2005 and 2010 include the widening of Canton Hwy./SR 20, Dahlonega Hwy./SR 9, Castleberry Road, Hutchinson Road and Kelly Mill Road. Also planned for 2010 is the extension of Keith Bridge Road from SR 9 west to SR 20. By 2020, plans show a portion of SR 20 within the Cumming subarea to be widened from 4 to 6 lanes. Also, the 2020 plan shows widening GA 400 from 6 lanes to 8 lanes. Most all of the land within the Cumming subarea falls within the City of Cumming’s service area for sewer service. As a result, homes and businesses already have access to sanitary sewer service. No plans exist for the County to serve any part of this area with sewer service. 2. Transitional Areas With the high amount of steep slopes associated with Sawnee Mountain and the creeks within the Cumming subarea, developing the land can be challenging. Other than preserving much of this steep terrain, residential development is the recommended use of the land since residential uses can be designed to fit the terrain and not cause extensive land disturbance. There are still large tracts of available land for development in the Cumming subarea, so the likelihood of redevelopment is small. Generally, it is more expensive to tear down or renovate existing structures compared to constructing new, so as long as land is available with the same locational benefits as existing structures, new construction is likely to locate on vacant land. 3. Land Use Policies The 2015 Future Land Use map for the Cumming subarea identifies over 59 percent of the area to be developed as large-lot single-family houses. Current land use policy was analyzed by examining the primary tools of land use including the Unified Development Code and the Land Use Element of the Comprehensive Plan. The JJG team also examined the current zoning and 2015 Future Land Use maps to determine any implications that might arise from those elements.
Jordan, Jones & Goulding, Inc Cumming Subarea Land Use Report 9

A difference exists between the way land is currently zoned in Forsyth County and the 2015 Future Land Use map. In order to achieve the future land uses that are envisioned in the Comprehensive Plan, large amounts of land would have to be re-zoned. Rezonings would have to occur not only within land use categories, but significant amounts of land would have to be rezoned into entirely different categories. Figure 6 shows the amount of land that would have to be rezoned to provide consistency with the 2015 Future Land Use map. For example, Figure 6 shows that 38 percent of the land is zoned for agricultural use. Although the current agricultural zoning standards allow one acre single-family residences, but 26 percent of this land would need to be rezoned for single-family residential use to be consistent with the Future Land Use map. The chart included as Figure 6 shows the amount of land within the Cumming subarea that is intended for conversion from a current zoning category (rows), to a future land use category (columns). Individual cells of the table are currently zoned within a particular category (shown by the row) and intended for a particular future land use category (shown by the column). Percentages within each cell indicate the percentage of total land area that is categorized by a particular zoning category/future land use category combination. The colored areas of the chart indicate land that is currently intended for a future land use that is different from the way the land is currently zoned. At the present time, only approximately 33% of the Cumming subarea is intended to perform the same use as it is currently allowed by zoning (shown by the white areas). To achieve the land uses shown in the current future land use map, 67% of the land will require significant rezonings. Areas shown in red represent required “downzonings” – zoning changes that are traditionally difficult to perform because they further restrict the use of the land. This comprises approximately 19% of the subarea. Areas shown in green represent required “upzonings” – zoning changes that are traditionally easier to perform because they generally increase the allowable uses of the land. This comprises approximately 46% of the subarea. Approximately 28% of the Cumming subarea is currently intended to be moved away from agricultural zoning, to a mixture of residential (27%), and other uses (1%). Ten percent of land currently zoned agricultural is intended for conservation and/or park use (primarily flood plain). Although the current land use regulations allow single-family residences on land zoned agricultural, this represents a significant conversion of the land’s purpose. E) Trend Scenario 1. Methodology As part of the JJG team’s examination of current land use policies and their potential impacts, an analysis of current development trends for the Cumming subarea was performed. It was based upon the existing 2015 Future Land Use map, rezoning history, and real estate market preferences. This analysis had no specific time horizon. It is intended to gain an understanding of the ultimate impact of future development, if such development follows existing trends and is guided by existing land use policy.
Jordan, Jones & Goulding, Inc Cumming Subarea Land Use Report 10

Jordan, Jones & Goulding, Inc. Cumming Subarea Land Use Report
Figure 6 Cumming Rezonings to Match the 2015 Future Land Use Plan
11
Future Land Use Category
21% 59% 9% 0% 3% 7%
Conservation
and Park Single Family Residential
Multi-Family Residential
Office/ Institutional Industrial Commercial
38% Agriculture 10% 26% 1% <1% <1% <1%
44% Single-Family Residential 11% 27% 4% <1% <1% 2%
5% Multi-Family Residential <1% 1% 2% <1% <1%
0% Office/Institutional <1%
4% Industrial <1% 1% 1% 1% <1%
Cur
rent
Zon
ing
Cat
egor
y
9% Commercial <1% 3% 1% 1% 3%
Indicates that a rezoning is not required to be consistent with the Future Land Use Plan
Indicates potentially difficult rezoning
Indicates rezoning that might be moderately difficult
Indicates potentially easy rezoning

In order to accomplish this analysis, the JJG team made several assumptions including:
Areas that are designated as having future land uses that are different from their existing land uses will be redeveloped; Existing structures that are non-conforming with respect to their current zoning will be redeveloped in a way to bring them into conformance; Future development within broad land use categories (for example, “Commercial”) will consist of a mix of uses and intensities that mirrors the county-wide proportions of land that is currently zoned within that category; Future development restrictions (for example, minimum lot sizes, maximum floor-area-ratios) will be based upon those that are currently expressed in the Unified Development Code; “Density shifting” to accommodate land lying within flood plains will continue to be permitted. In other words, parcels that contain part of their land within flood plains will be allowed to develop at the maximum density permitted, based on the area of the entire parcel, not just the part that is outside the flood plain; Moderately sloping land (>15% but less than 30%) that is designated residential, will eventually be developed; and Sewer and water services will be extended to all areas that require them.
2. Trend Scenario Map A Trend Scenario map was created in order to illustrate this future land use scenario and it is included on the following page as Figure 7. The future that this map indicates is not a given, but a likely scenario of how the area will develop over the next 20 years. It shows that existing suburban residential development will spread out and occupy a large amount of the subarea. Continued commercial growth will occur along SR 20, SR 9 and GA 400. The implications of this trend scenario include increased demands on public infrastructure, such as schools, water, sewer, roads, police and fire protection. It also indicates that the dramatic changes that the area has experienced over the past 10 years are only the beginning of additional changes for the area if current trends continue. The question that this planning exercise poses is one that the citizens of the Cumming area have to answer and that is, “Is this the future we envision for our community?”
Jordan, Jones & Goulding, Inc Cumming Subarea Land Use Report 12

Jordan, Jones & Goulding, Inc. Cumming Subarea Land Use Report
Figure 7 Cumming Trend Scenario
13

III. Subarea Committee Recommendations There were two meetings held from May to June 2003 to discuss the development of a land use plan for the Cumming subarea. A list of the meeting dates can be found in the Appendix. At the first meeting the inventory of existing conditions for the subarea was presented, and the participants were asked to help craft a vision for the subarea. At the second meeting, a draft land use plan map was presented along with the draft vision and participants were asked to fill out comments cards, which were presented to the subarea committee for discussion and review. The result of this meeting was a revised land use plan map and a list of policy recommendations that the subcommittee would like to present to the Countywide Land Use Steering Committee for possible inclusion in the county’s Comprehensive Plan. The results of these meetings are presented below. A) Cumming Subarea Vision
• The Cumming subarea will primarily be a residential community with close proximity to jobs and commercial areas.
• GA 400 will continue to be a valuable asset that provides connectivity to employment and shopping opportunities.
• Commercial development will take the form of nodes as opposed to “strip commercial”. It should be directed to the major arterials such as GA 400, SR 9 and SR 20. Adopt appropriate design standards to promote quality development throughout the subarea.
• A network of greenways will run throughout the subarea with passive parks and connected trails.
• Provide areas for water retention along SR 9 that can also serve as passive parks. B) Policy Recommendations
• Provide public participation earlier in the development process per the Municipal Code. • The County needs to prepare a Greenway Master Plan that includes connected greenways
throughout the County. Existing natural features such as stream banks and groundwater recharge areas could be utilized.
• Results of the Greenway Master Plan should be added to the Future Land Use Map. • Identify potential greenspace now and approach property owners with fair market offer for
their property. • Need more land in public parks. • Consider Northern Arc right-of-way as part of a Greenway Master Plan. • Current Tree Ordinance needs to be strengthened, with a focus on preserving existing trees
and requiring more trees in parking lots. • Establish architectural and design standards with citizen based design commission to review
plans. • Provide greenspace buffers around commercial developments. • Connect Activity Centers to residential neighborhoods with sidewalks. • Limit impervious surfaces and/or stormwater runoff in groundwater recharge areas. • Need to provide for alternate modes of transportation, such as a trolley, to access
commercial areas.
Jordan, Jones & Goulding, Inc Cumming Subarea Land Use Report 14

C) Cumming Land Use Plan Map The future land use plan is an extension of the goals and values of the community and a culmination of the subarea planning effort. This future land use map is intended to depict a 2025 future land use scenario. The acreages and percentages of each land use are compiled in Figure 8 and a map showing the location of future land uses is included in Figure 9. There are fourteen land use designations depicted on the future land use map, including three residential designations and six commercial/industrial/mixed-use designations. Below is brief definition of each. Low Density Residential - This category is intended for single-family detached residential dwellings typically on septic sewer systems. Minimum lot size is 30,000 square feet, or the overall density is up to 1.5 units per acre. Institutional uses that are considered complimentary in this area include churches, schools, and libraries. Medium Density Residential - Consists of single-family detached residential dwellings typically on sewer, with overall densities from 1.5 to 2.5 units per acre. Institutional uses that are considered complimentary in this area include churches, schools, and libraries. Private recreational uses, such as golf courses, tennis courts, walking trails and swimming pools are encouraged in these areas in developments greater than 50 lots. High Density Residential - Typical uses include single-family detached and attached dwellings (such as townhouses) as well as multifamily condominiums and apartments, at densities of up to 6 units per acre. These developments should incorporate some amount of central outdoor public space for their residents. A limited number of churches, schools, libraries, other miscellaneous institutional uses and daycare facilities would be complimentary in these areas. An urban-density residential area is usually located near areas of high employment concentration, large commercial nodes, transportation nodes and mixed-use developments. It is essential that these developments include proper buffering between adjacent land uses. Office Transitional - The Office Transitional category is intended to allow for the redevelopment or transition of residential uses along major roadways to office professional uses. It also allows for new office development that is constructed in a manner consistent and in keeping with the surrounding residential uses. The physical character and design of proposed new structures should be compatible with existing establishments. This category includes small single occupant structures for doctors and or accountants, as well as larger offices with multiple tenants. Businesses that are allowed in this category may provide a product directly to customers on the premises as an accessory to the service, but do not, as a primary activity, involve the manufacture, storage, or distribution of products. These areas should provide employment opportunities in close proximity to residential areas while providing a transition between the more intense commercial areas and residential neighborhoods. Neighborhood Commercial - This category includes a limited range of retail and service activities to serve the everyday needs of local residents. Limitations should apply to both size and character of individual establishments. The basic character of this category is one that encourages and assures a compatible mixture of residential, office and retail types of land uses. Businesses in this land use
Jordan, Jones & Goulding, Inc Cumming Subarea Land Use Report 15

category should be designed to encourage the development of neighborhood scale shopping that offers both goods and products, and the furnishing of selected services. General Commercial - This category includes standard retail and commercial service activities such as shopping centers, general retailers, specialty shops, grocery stores, drug stores, banks, restaurants, theatres, hotels, dry cleaners and entertainment facilities. These establishments should be located on appropriate transportation corridors to easily serve the public. Visual impacts of these developments should be minimized by requiring buffers, landscaping, and architectural controls. Activity Center - The Activity Center land use category includes commercial, entertainment, limited residential, and public/institutional land uses typically found in a central business district. The commercial business district (CBD) and urban village (UV) zoning classifications are considered appropriate for developments proposed within the Activity Center classification. Developments within the Activity Center classification may be encouraged to consider additional zoning classifications, based on future revisions to the Forsyth County Unified Development Code. The types of uses that are desirable in this area would be restaurants, specialty retail, governmental offices, low-intensity offices (e.g. accountant or real estate office) and appropriate parking. Uses should be complemented with walking, biking and transit opportunities to provide alternative modes of transportation. Also, any roadway improvements that are considered for this area should carefully consider the scale of the area. Residential uses shall be considered accessory and limited to townhouses or apartments mixed into the commercial establishments. Commercial uses must be developed or present first in comparable scale before residential uses can be permitted for construction. Corridor Commercial - The Corridor Commercial category is intended to focus on major transportation corridors, which presently contain a mix of agricultural, residential, commercial, and industrial land uses. Such corridors are unlikely to experience small scale, low or medium density residential development over the course of the planning period. Developments within the corridor commercial classification will focus on land uses of varying intensity that will allow for the appropriate transition between high-intensity development abutting the transportation corridor as well as provide for a continued decrease of intensity as the development moves away from the transportation corridor. The physical character and design of proposed developments should be compatible with surrounding uses. Inter-parcel connectivity and side street access should be encouraged to minimize curb cuts and improve traffic flow. Typical uses include standard retail and commercial service activities such as shopping centers, general retailers, specialty shops, grocery stores, drug stores, banks, restaurants, theatres, hotels, dry cleaners, entertainment facilities, multiple tenant offices, small single occupant structures, and entrances to residential subdivisions located outside the corridor commercial designation. The transitional nature of the category should be supported through the use of buffers, landscaping, and architectural controls to minimize the impacts on lower intensity land uses. Industrial - The primary purpose of this category is to provide for areas where light industrial uses can be located. These light industrial uses include light manufacturing, warehousing, wholesale/distribution and assembly. More intensive industrial uses that are characterized by noise, fumes, vibration and other forms of pollution that might be viewed as objectionable by surrounding
Jordan, Jones & Goulding, Inc Cumming Subarea Land Use Report 16

uses are acceptable only on a case-by-case basis if well screened and buffered from other uses. Limited commercial uses are also allowed in industrial areas if they compliment existing industrial uses, such as cafeterias and day cares. Public / Institutional - Includes uses such as schools, colleges, hospitals, municipal community centers, churches, cemeteries, municipal buildings and post offices. Public Park - This category includes land dedicated to active and passive recreation uses. These areas are publicly owned and may include sports fields, recreation areas, greenways, and similar uses. Private Park - Privately owned land that is used for active and passive recreation. This may include subdivision amenities areas, golf courses and Army Corps of Engineers recreation areas. Conservation - This classification includes environmentally sensitive areas that are regulated at the local and state levels. Areas included in this category are the 35 ft. buffer along all county streams, a 100 ft. buffer along the Etowah River and land that is part of the 100-year floodplain of local waterways. This land has the potential to be used as public greenways or multi-purpose paths. Land classified as Conservation alerts government officials and property owners to the presence of environmental conditions that shall be factored into the rezoning and permitting process. Transportation / Communication / Utilities (TCU) - This category includes such uses as landfills, water treatment plants, wastewater treatment plants, power substations, rail yards, mass transit facilities, airports, etc. These uses may be either public or private.
Jordan, Jones & Goulding, Inc Cumming Subarea Land Use Report 17

Figure 8 Cumming Future Land Use, 2025
Land Use Acres PercentMedium Density Residential 4,274 31.7%Cumming 2,802 20.8%Low Density Residential 1,896 14.1%Road Right-of Way (TCU) 1,192 8.8%High Density Residential 929 6.9%General Commercial 952 7.1%Industrial 454 3.4%Corridor Commercial 201 1.5%Conservation (Lake Lanier US Corps land only) 162 1.2%Private Park 154 1.1%Neighborhood Commercial 147 1.1%Office-Transitional 135 1.0%Public/Institutional 105 0.8%Activity Center (Commercial) 72 0.5%Public Park 0 0.0%Transportation/Communication/Utilities 0 0.0%Total Land Acreage 13,475 100.0%
Jordan, Jones & Goulding, Inc Cumming Subarea Land Use Report 18

Figure 9
Cumming 2025 Future Land Use Plan
Jordan, Jones & Goulding, Inc Cumming Subarea Land Use Report 19

Appendix A. Cumming Subarea Advisory Committee Lisa Hoxie Lynn Bayles Richard Webb Teddy Dumont Reva Jennings
B. Meeting Dates Cumming Area Subarea Public Visioning Workshop – May 8th at 6:00 PM in the Sawnee Cultural Center Cumming Area Subarea Advisory Committee Meeting – June 17th at 7:00 PM in the Sawnee Cultural Center
Jordan, Jones & Goulding, Inc Cumming Subarea Land Use Report 20

Forsyth County Comprehensive Plan
South Forsyth Subarea Land Use Report
September 25, 2003

Table of Contents I. Introduction ................................................................................................................. 1
A) Purpose............................................................................................................ 1 B) Scope............................................................................................................... 1 C) Location ........................................................................................................... 1
II. Inventory of Existing Conditions ................................................................................. 3
A) Description of Existing Land Uses ................................................................... 3 B) Environmentally Sensitive Areas...................................................................... 5
1. Historic Resources................................................................................ 5 2. Water Resources .................................................................................. 5 3. Steep Slope .......................................................................................... 5 4. Conservation & Park Lands .................................................................. 5
C) Historic Development Patterns ........................................................................ 6 1. Demographics....................................................................................... 6 2. Development Activity ............................................................................ 8
D) Future Development Trends ............................................................................ 9 1. Future Infrastructure ............................................................................. 9 2. Transitional Areas............................................................................... 10 3. Current Land Use Policies .................................................................. 10
E) Trend Scenario .............................................................................................. 13 1. Methodology ....................................................................................... 13 2. Trend Scenario Map ........................................................................... 13
III. Subarea Committee Recommendations.................................................................. 15
A) South Forsyth Subarea Vision ....................................................................... 15 B) Policy Recommendations............................................................................... 15 C) South Forsyth Land Use Plan Map (Updated December 9, 2003)................. 16
Appendix ....................................................................................................................... 21
Jordan, Jones & Goulding, Inc. South Forsyth Subarea Land Use Report i

I. Introduction A) Purpose In preparing the 2003 Update to the Forsyth County Comprehensive Plan, the County initiated an ambitious public involvement process. In order to better analyze the County’s needs and elicit a higher degree of community participation, the county was divided into ten planning subareas (Figure 1) with individual committees established to develop specific land use policies and a future land use map for their subarea. The subarea boundaries were determined by a variety of factors including: physical barriers, historical communities, economics and transportation corridors. This information was gathered to help enable the community to look at where they are today, how they got there and where they want to go in the future. Included in this document are the findings from the land use inventory and assessment for the South Forsyth subarea, as well as the recommendations of the South Forsyth Subarea Advisory Committee. The membership of the committee and the meeting dates can be found in the Appendix. B) Scope The following report provides a current “snapshot” of the South Forsyth subarea. First, a description of existing land uses in the subarea is provided, along with an existing land use map and summary table. This is followed by an inventory of environmentally sensitive areas. These two sets of information allow the community to identify those sections of the subarea that could potentially be developed in the future, as well as those areas that should be protected from development pressures. Following this inventory is an examination of the historic development patterns in the South Forsyth subarea. This includes a discussion of demographic changes in the subarea between 1990 and 2000, as well as an estimate of land consumption during the last decade. There is also a summary of the historical factors that have led to the current development patterns. An examination of future development trends is also provided. This includes an assessment of the future sewer and transportation infrastructure needs, as well as the identification of transitional areas that could potentially be redeveloped. Forsyth County’s land use polices are also examined in order to determine what is allowed to develop under the current regulations. Finally, this report includes the subarea vision and policy recommendations developed by the South Forsyth Subarea Advisory Committee, and a copy of the future land use map for the subarea. C) Location The South Forsyth subarea is located in the southeast corner of Forsyth County. GA 400 cuts diagonally along the northwest border of this subarea. The general boundaries include Fulton County to the south, Gwinnett County to the east, the McFarland subarea to the west, the Cumming subarea to the north, and the Buford/GA Hwy 20 subarea to the northeast.
Jordan, Jones & Goulding, Inc. South Forsyth Subarea Land Use Report 1

Figure 1 Forsyth County Subarea Locations
Jordan, Jones & Goulding, Inc. South Forsyth Subarea Land Use Report 2

II. Inventory of Existing Conditions A) Description of Existing Land Uses A comprehensive land use survey was conducted for Forsyth County in the Summer of 2002 using tax parcel maps, aerial photographs and field review. In April 2003, JJG conducted a field review and a review of aerial photographs to verify the land uses in the South Forsyth subarea. These land uses are shown on Figure 2 on the following page and summarized in Figure 3 below.
Residential UndevelopeAgriculture Road RightIndustrial Parks/RecreInstitutionalCommerciaSouth ForsTotal Sq. M
As indicated in residential, comsingle-family ho The second largUndeveloped lathe eastern bord The remaining lvariety of land uis worth noting total land area. county. Only thuses is John’s CPeachtree Parkw
Jordan, Jones & Gou
Figure 3: South Forsyth Existing Land Use, 2003 Land Use Acres Percent
7,063.73 37.83%d 5,028.08 26.93%
1,871.69 10.02%-of-way 1,432.73 7.67%
1,394.02 7.47%ation/Conservation 1,028.84 5.51%
/Public 456.10 2.44%l 380.39 2.04%yth Total 18,673.14 100.00%iles for Sub Area 29.2 --
the table above, the largest land use category in the South Forsyth subarea is prising 38 percent of the subarea. Practically all of this residential land is made up of mes. The average lot size is little more than one acre.
est category is undeveloped land, which makes up 27 percent of the subarea. nd is scattered throughout the area, though the largest concentration is located along er of the subarea, that area farthest away from GA 400 and Peachtree Parkway.
and uses make up 35 percent of the total area of the subarea. These uses include a se categories, such as agriculture, industrial, parks, institutional and commercial. It that though industrial uses only account for approximately 1,400 acres or 7% of the South Forsyth does contain the second largest concentration of industrial uses in the e McFarland subarea contains more industrial land. The most prominent of these
reek, a business park located around the intersection of McGinnis Ferry Road and ay.
lding, Inc. South Forsyth Subarea Land Use Report 3

Jordan, Jones & Goulding, Inc.
South Forsyth
Figure 2 Existing Land Use Map
South Forsyth Subarea Land Use Report 4

B) Environmentally Sensitive Areas 1. Historic Resources In the mid-1990s a historic resources inventory was completed for Forsyth County. The Historic Resources Survey Report identified 490 historic resources in unincorporated Forsyth County. Sixty-five (65) of these historic sites were located in the South Forsyth subarea. According to the Survey Report at least ten of these sites have potential for National Register listing. 2. Water Resources There are 676 acres of 100-year floodplains in the South Forsyth subarea. Development is regulated in this area by the Federal Emergency Management Agency, the Georgia Floodplain Management Program of DNR and by local ordinances. Most of the floodplain associated with the South Forsyth area is located along Dick Creek and James Creek, tributaries of the Chattahoochee River. There are 4,863 acres of land associated with groundwater recharge areas in the South Forsyth subarea. Significant recharge areas have been mapped by the Georgia Department of Natural Resources at the state level. If a significant recharge area is identified, the local government must comply with the Official Code Georgia Annotated 12-2-8. This Code outlines restrictions on locating landfills and hazardous waste facilities, above ground chemical or petroleum storage tanks, agricultural waste, impoundment sites, septic tank drain fields, slow rate land treatment, storm water infiltration basins, and waste treatment basins. There are two large recharge areas located in the South Forsyth subarea. One is located along both sides of GA 400, and the other is located east of Peachtree Parkway between the headwaters of the Dick and James Creeks. 3. Steep Slopes There are 4,213 acres of steep slopes (15% grade or greater) in the South Forsyth subarea. This amounts to approximately 22 percent of the total land area in the subarea. Most of these steep slopes are located in the eastern portion of the subarea and are associated with the stream banks of Dick and James Creeks. The vast majority of this area is dedicated to residential land uses, so steep slope is not a major deterrent to future land development of the area. 4. Conservation & Park Lands There is only one active county park located in the South Forsyth subarea, Sharon Springs Park. The park includes seven youth baseball/softball fields, a senior baseball field, a football field, a soccer field, outdoor basketball courts, eight tennis courts, a playground, a walking trail, a picnic pavilion, and a community building/kitchen. It was constructed in 1994, and was the first sports complex in the county. Built with SPLOST funding, the park has had significant additions--a community building to answer indoor programming needs, day camps and cultural activities, and a football/soccer concession building. Sharon Springs Park remains the most consistently used park in the county. The county is building another park on a 20-acre site on Kemp Road, which will be known as the South Forsyth Soccer Complex. It is scheduled to be opened in the Fall of 2003, and will include four lighted soccer fields and a practice field.
Jordan, Jones & Goulding, Inc. South Forsyth Subarea Land Use Report 5

The locations of the natural and cultural resources in the South Forsyth subarea are shown on the map included as Figure 4. C) Historic Development Patterns 1. Demographics Forsyth County is one of the fastest growing counties in the United States, and South Forsyth is the fastest growing subarea in the county. In 2000, the population of the South Forsyth subarea totaled 20,554. This is an increase of 378% percent since 1990. The population density of the area is 701 people per square mile. That represents the highest population density of any subarea in the county.
hic statistics for the area for 1990 and 2000.
New housing construction off of Peachtree Parkway
The South Forsyth subarea is 94 percent white. The age distribution figures indicate the majority of residents in this area are 30-39 years of age. The second largest age category is children between the ages of 5 and 17. The largest increase in age distribution has been for the groups 5 and under and 30 to 39 years of age. Figure 5 provides a comparison of the demograp The number of housing units in the South Forsyth subarea exploded during the 1990s. In 1990, there were 1,665 housing units and by 2000 the number of units increased to 7,008, a 321 percent increase. During the 1990s the vacancy rate was cut in half, dropping from 6.1 percent in 1990 to 2.8 percent in 2000. The housing units in this area are largely owner-occupied, with 94 percent being owner-occupied and 6 percent renter occupied units. The number of owner-occupied units increased by 400 percent during the 1990s.
Jordan, Jones & Goulding, Inc. South Forsyth Subarea Land Use Report 6

Jordan, Jones & Goulding, Inc.
South Forsyth Natur
Figure 4 al and Cultural Resources Map
South Forsyth Subarea Land Use Report 7

Figure 5 South Forsyth Subarea Demographics
1990 – 2000
1990 2000 Percent Change Total Population 4,298 20,554 378.2%
Racial and Cultural Distribution* White 4,274 19,432 354.7% Black or African-American 2 163 8,050.0% Asian 10 426 4,160.0% Hispanic or Latino of any race 65 842 1,195.4%
Age Distribution Under 5 358 2,554 613.4% 5 to 17 805 3,900 384.5% 18 to 21 234 523 123.5% 22 to 29 590 1,439 143.9% 30 to 39 864 5,157 496.9% 40 to 49 659 3,410 417.5% 50 to 64 542 2,760 409.2% 65 and over 311 811 160.8%
Housing Total Units 1,665 7,008 320.9% Occupied 1,564 6,811 335.6% Vacancy Rate 6.1% 2.8% -3.3% Owner Occupied 1,290 6,455 400.4% Renter Occupied 274 356 29.9% * Note: The racial and cultural distribution numbers total to a sum larger than the total population. Hispanic is a cultural descriptor and is not exclusive of race. In other words, many who consider themselves Hispanic also consider themselves White.
2. Development Activity It is estimated that since 1990 approximately one-third of the land (6,000 acres) in the South Forsyth subarea has been developed. Most of this construction has been for residential uses. Even with this large increase in developed acres, it is estimated there are still another 5,700 acres that could be developed in the South Forsyth subarea. One of the tools the JJG team used to evaluate development activity in the county is the occurrence of Developments of Regional Impact (DRIs) since 1990. A DRI review is required by law to be completed for large-scale developments that are likely to have impacts outside of the jurisdiction(s) where they are located. The Georgia Planning Act of 1989 authorized the Department of Community Affairs (DCA) to establish procedures for intergovernmental review of these large-scale projects. More than 40 DRI reviews have been completed in Forsyth County since 1990, with nine
Jordan, Jones & Goulding, Inc. South Forsyth Subarea Land Use Report 8

of these located in the South Forsyth subarea. This is the largest concentration of DRIs in the county. The South Forsyth DRIs include the following:
• Grand Cascade - Housing: 560 single-family residences with river front community recreation facility.
• Laurel Springs - Housing: 854 single-family homes, 18-hole golf course. • Windermere - Mixed Use: Office, commercial, housing, and recreational facilities. • The Paddocks - Mixed Use: Mostly office and supportive uses for office developments. • Omni Developments - Mixed Use: Office and industrial. • Harrison - Mixed Use: Retail and other commercial uses; office, office distribution and
multi-family residential. • Orby Group - Housing: Multi-family residential development; Park and Residential (2
units/acre). • Riverbrooke Properties - Mixed Use: Single-family detached residential development with
amenities, including park, commercial and industrial land use. • James Creek Community - Housing: Proposed development of 343.34 acres of land as a
PUD. There will be 1028 attached and detached homes. Applicant also proposes to develop seven of the acres as commercial.
D) Future Development Trends 1. Future Infrastructure One of the primary drivers of development is the provision for public infrastructure, particularly sewer and roads. The availability of sewer allows for higher density land uses such as apartments or small-lot subdivisions (less than one-half acre lots). Roads are also primary drivers of change because they provide access to desired destinations, such as jobs and shopping. Better access leads to a higher land value and a greater likelihood of more intensive land uses. The following paragraphs list the planned transportation improvements for 2005, 2010 and 2020 in the county as defined in the 2002 Update of the county’s Major Transportation Plan. There are numerous transportation improvements planned for the South Forsyth subarea. In the short-term several key roadways are planned to be widened from two to four lanes, including:
• Peachtree Parkway (GA Hwy 141) • Bagley Drive • Mathis Airport Road • Old Atlanta Road • Atlanta Highway (GA Hwy 9)
Two new four lane roads are also planned to be constructed by 2005, namely Market Place Parkway, a frontage road that will run parallel to GA 400, and Mathis Airport Road Extension which will link Peachtree Parkway (GA Hwy 141) with Buford Hwy (GA Hwy 20).
Jordan, Jones & Goulding, Inc. South Forsyth Subarea Land Use Report 9

By 2010, GA 400 and Peachtree Parkway are planned to be further widened to six lanes, and Old Alpharetta Road is planned to be widened to four lanes. In the long term, by 2020, GA 400 is planned to be widened to eight lanes, and Laurel Springs Parkway is planned to be widened to four lanes from Peachtree Parkway to Old Atlanta Road. Sewer is available throughout most of the southern portion of the South Forsyth subarea. The county’s Sewer System Master Plan shows that a new water reclamation facility (WRF) will be constructed at the southern tip of the county close to the Chattahoochee River, the Threatt WRF. In addition, gravity sewer lines are planned to be constructed in the short-term to provide sewer to the rest of the subarea. These improvements are a high priority on the plan and will likely be constructed within the next five to ten years. One of the strongest influences on the future development of the South Forsyth subarea will be continued expansion of the Atlanta urbanized area. Over the last ten years, the southern half of the county has experienced intense development pressure, and this pressure is moving northward along either side of GA 400. Because of this growth pressure, land values in the southern portion of the county are likely to continue to rise, making it more economical for higher density development, particularly for those areas closest to GA 400. 2. Transitional Areas There are still large tracts of available land for development in the South Forsyth subarea, so the likelihood of redevelopment is small. Generally, it is more expensive to tear down or renovate existing structures compared to constructing new, so as long as land is available with the same locational benefits as existing structures, new construction is likely to locate on vacant land. 3. Current Land Use Policies The 2015 Future Land Use map for the South Forsyth subarea identifies over 67 percent of the area to be developed as large-lot single-family houses, 7 percent to be developed as industrial uses, and 17 percent to be conserved as parkland and open space. Current land use policy was analyzed by examining the primary tools of land use including the Unified Development Code and the Land Use Element of the Comprehensive Plan. The JJG team also examined the current zoning and 2015 Future Land Use maps to determine any implications that might arise from those elements. A difference exists between the way land is currently zoned in Forsyth County and the 2015 Future Land Use map. In order to achieve the future land uses that are envisioned in the Comprehensive Plan, large amounts of land would have to be re-zoned. Rezonings would have to occur not only within land use categories, but significant amounts of land would have to be rezoned into entirely different categories. Figure 6 on the following page shows the amount of land that would have to be rezoned to provide consistency with the 2015 Future Land Use map. For example, Figure 9 shows that seven percent of the land is zoned for commercial use and four percent of this land (or 57% of the commercial zoned property) would need to be rezoned for single-family residential use to be consistent with the Land Use Plan. The chart included as Figure 6 shows the amount of land within the South Forsyth subarea that is intended for conversion from a current zoning category (rows), to a future land use category (columns). Individual cells of the table are currently zoned within a particular category (shown by the row) and intended for a particular future land use category (shown by the column). Percentages
Jordan, Jones & Goulding, Inc. South Forsyth Subarea Land Use Report 10

within each cell indicate the percentage of total land area that is categorized by a particular zoning category/future land use category combination. The colored areas of the chart indicate land that is currently intended for a future land use that is different from the way the land is currently zoned. At the present time, approximately 53% of the South Forsyth subarea is intended to perform the same use as it is currently allowed by zoning (shown by the white areas). To achieve the land uses shown in the current future land use map, 47% of the land will require rezonings. Areas shown in red represent required “downzonings” – zoning changes that are traditionally difficult to perform because they further restrict the use of the land. This comprises approximately 17% of the subarea. Areas shown in green represent required “upzonings” – zoning changes that are traditionally easier to perform because they generally increase the allowable uses of the land. This comprises approximately 30% of the subarea. Approximately 30% of the South Forsyth subarea is currently intended to be moved away from agricultural zoning, to a mixture of residential (27%), and other uses (3%). Seven percent of the land currently zoned agricultural is intended for conservation and/or park use (primarily flood plain) and as such would not require a rezoning to be consistent with the Land Use Plan. Although the current land use regulations allow single-family residences on land zoned agricultural, this represents a significant conversion of the land’s purpose.
Jordan, Jones & Goulding, Inc. South Forsyth Subarea Land Use Report 11

Figure 6 South Forsyth Rezonings to Match Future Lan
Plan
Future Land Use C
17% 67% 3%
Conservation
and Park * Single Family Residential
Multi-Family Residential Ins
37% Agriculture 7% 27% 2%
39% Single-Family Residential 8% 29% <1%
3% Multi-Family Residential <1% <1% <1%
1% Office Institutional <1% <1%
13% Industrial 1% 4%
Cur
rent
Zon
ing
Cat
egor
y
7% Commercial <1% 4% * Note: Conservation and park land can be associated with any zoning category.
Indicates that a rezoning is not required to be consistent with the future Land Us
Indicates potentially difficult rezoning
Indicates rezoning that might be moderately difficult
Indicates potentially easy rezoning
Jordan, Jones & Goulding, Inc. 12
d Use
ategory
1% 7% 5%
Office/ titutional Industrial Commercial
<1% <1% <1%
<1% <1% <1%
<1% <1
<1% <1%
5% <1%
<1% <1% 2%
e Plan
South Forsyth Subarea Land Use Report

E) Trend Scenario 1. Methodology As part of the JJG team’s examination of current land use policies and their potential impacts, an analysis of current development trends for the South Forsyth subarea was performed. It was based upon the existing Future Land Use map, rezoning history, and real estate market preferences. This analysis had no specific time horizon. It is intended to gain an understanding of the ultimate impact of future development, if such development follows existing trends and is guided by existing land use policy. In order to accomplish this analysis, the JJG team made several assumptions including:
Areas that are designated as having future land uses that are more intensive than their existing land uses will be redeveloped; Future development within broad land use categories (for example, “Commercial”) will consist of a mix of uses and intensities that mirrors the county-wide proportions of land that are currently zoned within that category; Future development restrictions (for example, minimum lot sizes, maximum floor-area-ratios) will be based upon those that are currently expressed in the Unified Development Code; “Density shifting” to accommodate land lying within flood plains will continue to be permitted. In other words, parcels that contain part of their land within flood plains will be allowed to develop at the maximum density permitted, based on the area of the entire parcel, not just the part that is outside the flood plain; Moderately sloping land (>15% but less than 30%) that is designated residential, will eventually be developed; and Sewer and water services will be extended to all areas that require them.
2. Trend Scenario Map A Trend Scenario map was created in order to illustrate this future land use scenario and it is included on the following page as Figure 7. The future that this map indicates is not a given, but a likely scenario of how the area will develop over the next twenty years. It shows that existing residential developments will spread out and occupy most of the land in the subarea, and additional commercial development along Peachtree Parkway (GA Hwy 141). The implications of this trend scenario include increased demands on public infrastructure, such as schools, water, sewer, roads, police and fire protection. It also indicates that the dramatic changes that the subarea has experienced over the past ten years are only the beginning. The question that this planning exercise poses is one that the citizens of the South Forsyth area have to answer, and that is “Is this the future that we envision for our community?”
Jordan, Jones & Goulding, Inc South Forsyth Subarea Land Use Report 13

Jordan, Jones & Goulding, Inc.
South Forsy
Figure 7 th Trend Scenario Map
South Forsyth Subarea Land Use Report 14

III. Subarea Committee Recommendations There were two meetings held from May to June 2003 to discuss the development of a land use plan for the South Forsyth subarea. A list of the meeting dates can be found in the Appendix. At the first meeting the inventory of existing conditions for the subarea was presented, and the participants were asked to help craft a vision for the subarea. At the second meeting, a draft land use plan map was presented along with the draft vision and participants were asked to fill out comments cards, which were presented to the subarea committee for discussion and review. The result of this meeting was a revised land use plan map and a list of policy recommendations that the subcommittee would like to present to the Countywide Land Use Steering Committee for possible inclusion in the county’s Comprehensive Plan. The results of these meetings are presented below. A) South Forsyth Subarea Vision
• The South Forsyth subarea will offer its residents a high quality of life, opportunities for employment, shopping and recreation, and a safe environment.
• It will be the site of quality development distinctive from other areas of the county and the rest of the Atlanta region. The subarea will be known to have grown in a responsible manner.
• Available open space with passive parks and connected trails will be one of the area’s prime assets.
• New activity centers will be located along Peachtree Parkway both near its intersection with Old Alpharetta Road and GA 400, offering convenient access to commercial services and employment opportunities.
• A network of well-engineered roads, bike trails and sidewalks will provide circulation alternatives.
• Sewer will be extended throughout the subarea. • Citizens will have easy access to libraries and other government services.
B) Policy Recommendations
• Land Use Plan should be coordinated with the latest SPLOST. • The County needs to prepare a Greenway Master Plan that includes connected greenways
throughout the County. Existing natural features such as stream banks and groundwater recharge areas could be utilized.
• Need more land in public parks. • Consider Northern Arc right-of-way as part of a Greenway Master Plan. • Current Tree Ordinance needs to be strengthened, with a focus on preserving existing trees
and requiring more trees in parking lots. • Widen existing stream buffers from 35 ft. to between 50 - 100 ft. • Prepare a Feasibility Study on Transfer of Development Rights (TDRs) countywide, in order
to preserve open space. • Need to protect 30% of South Forsyth subarea for open space. • Densities used for Future Land Use should be lowered.
Jordan, Jones & Goulding, Inc South Forsyth Subarea Land Use Report 15

• Establish architectural and design standards with citizen based design commission to review plans.
• Limit industrial land uses to areas that would not disturb environmentally sensitive areas. Industry should only be clean and high tech.
• Office parks in the county should be pedestrian friendly. • Have infrastructure in place in advance of rezonings. • Subarea plans should reflect infrastructure plans. • Create more grid pattern streets in large developments.
C) South Forsyth Land Use Plan Map The future land use plan is an extension of the goals and values of the community and a culmination of the subarea planning effort. This future land use map is intended to depict a 2025 future land use scenario. The acreages and percentages of each land use are compiled in Figure 8 and a map showing the location of future land uses is included in Figure 9. There are fourteen land use designations depicted on the future land use map, including three residential designations and six commercial/industrial/mixed-use designations. Below is brief definition of each. Low Density Residential - This category is intended for single-family detached residential dwellings typically on septic sewer systems. Minimum lot size is 30,000 square feet, or the overall density is up to 1.5 units per acre. Institutional uses that are considered complimentary in this area include churches, schools, and libraries. Medium Density Residential - Consists of single-family detached residential dwellings typically on sewer, with overall densities from 1.5 to 2.5 units per acre. Institutional uses that are considered complimentary in this area include churches, schools, and libraries. Private recreational uses, such as golf courses, tennis courts, walking trails and swimming pools are encouraged in these areas in developments greater than 50 lots. High Density Residential - Typical uses include single-family detached and attached dwellings (such as townhouses) as well as multifamily condominiums and apartments, at densities of up to 6 units per acre. These developments should incorporate some amount of central outdoor public space for their residents. A limited number of churches, schools, libraries, other miscellaneous institutional uses and daycare facilities would be complimentary in these areas. An urban-density residential area is usually located near areas of high employment concentration, large commercial nodes, transportation nodes and mixed-use developments. It is essential that these developments include proper buffering between adjacent land uses. Office Transitional - The Office Transitional category is intended to allow for the redevelopment or transition of residential uses along major roadways to office professional uses. It also allows for new office development that is constructed in a manner consistent and in keeping with the surrounding residential uses. The physical character and design of proposed new structures should be compatible with existing establishments. This category includes small single occupant structures
Jordan, Jones & Goulding, Inc South Forsyth Subarea Land Use Report 16

for doctors and or accountants, as well as larger offices with multiple tenants. Businesses that are allowed in this category may provide a product directly to customers on the premises as an accessory to the service, but do not, as a primary activity, involve the manufacture, storage, or distribution of products. These areas should provide employment opportunities in close proximity to residential areas while providing a transition between the more intense commercial areas and residential neighborhoods. Neighborhood Commercial - This category includes a limited range of retail and service activities to serve the everyday needs of local residents. Limitations should apply to both size and character of individual establishments. The basic character of this category is one that encourages and assures a compatible mixture of residential, office and retail types of land uses. Businesses in this land use category should be designed to encourage the development of neighborhood scale shopping that offers both goods and products, and the furnishing of selected services. General Commercial - This category includes standard retail and commercial service activities such as shopping centers, general retailers, specialty shops, grocery stores, drug stores, banks, restaurants, theatres, hotels, dry cleaners and entertainment facilities. These establishments should be located on appropriate transportation corridors to easily serve the public. Visual impacts of these developments should be minimized by requiring buffers, landscaping, and architectural controls. Activity Center - The Activity Center land use category includes commercial, entertainment, limited residential, and public/institutional land uses typically found in a central business district. The commercial business district (CBD) and urban village (UV) zoning classifications are considered appropriate for developments proposed within the Activity Center classification. Developments within the Activity Center classification may be encouraged to consider additional zoning classifications, based on future revisions to the Forsyth County Unified Development Code. The types of uses that are desirable in this area would be restaurants, specialty retail, governmental offices, low-intensity offices (e.g. accountant or real estate office) and appropriate parking. Uses should be complemented with walking, biking and transit opportunities to provide alternative modes of transportation. Also, any roadway improvements that are considered for this area should carefully consider the scale of the area. Residential uses shall be considered accessory and limited to townhouses or apartments mixed into the commercial establishments. Commercial uses must be developed or present first in comparable scale before residential uses can be permitted for construction. Corridor Commercial - The Corridor Commercial category is intended to focus on major transportation corridors, which presently contain a mix of agricultural, residential, commercial, and industrial land uses. Such corridors are unlikely to experience small scale, low or medium density residential development over the course of the planning period. Developments within the corridor commercial classification will focus on land uses of varying intensity that will allow for the appropriate transition between high-intensity development abutting the transportation corridor as well as provide for a continued decrease of intensity as the development moves away from the transportation corridor. The physical character and design of proposed developments should be compatible with surrounding uses. Inter-parcel connectivity and side street access should be encouraged to minimize curb cuts and improve traffic flow.
Jordan, Jones & Goulding, Inc South Forsyth Subarea Land Use Report 17

Typical uses include standard retail and commercial service activities such as shopping centers, general retailers, specialty shops, grocery stores, drug stores, banks, restaurants, theatres, hotels, dry cleaners, entertainment facilities, multiple tenant offices, small single occupant structures, and entrances to residential subdivisions located outside the corridor commercial designation. The transitional nature of the category should be supported through the use of buffers, landscaping, and architectural controls to minimize the impacts on lower intensity land uses. Industrial - The primary purpose of this category is to provide for areas where light industrial uses can be located. These light industrial uses include light manufacturing, warehousing, wholesale/distribution and assembly. More intensive industrial uses that are characterized by noise, fumes, vibration and other forms of pollution that might be viewed as objectionable by surrounding uses are acceptable only on a case-by-case basis if well screened and buffered from other uses. Limited commercial uses are also allowed in industrial areas if they compliment existing industrial uses, such as cafeterias and day cares. Public / Institutional - Includes uses such as schools, colleges, hospitals, municipal community centers, churches, cemeteries, municipal buildings and post offices. Public Park - This category includes land dedicated to active and passive recreation uses. These areas are publicly owned and may include sports fields, recreation areas, greenways, and similar uses. Private Park - Privately owned land that is used for active and passive recreation. This may include subdivision amenities areas, golf courses and Army Corps of Engineers recreation areas. Conservation - This classification includes environmentally sensitive areas that are regulated at the local and state levels. Areas included in this category are the 35 ft. buffer along all county streams, a 100 ft. buffer along the Etowah River and land that is part of the 100-year floodplain of local waterways. This land has the potential to be used as public greenways or multi-purpose paths. Land classified as Conservation alerts government officials and property owners to the presence of environmental conditions that shall be factored into the rezoning and permitting process. Transportation / Communication / Utilities (TCU) - This category includes such uses as landfills, water treatment plants, wastewater treatment plants, power substations, rail yards, mass transit facilities, airports, etc. These uses may be either public or private.
Jordan, Jones & Goulding, Inc South Forsyth Subarea Land Use Report 18

Jordan, Jones & Goulding, Inc South Forsyth Subarea Land Use Report 19
Figure 8 South Forsyth Future Land Use, 2025
Land Use Acres Percent Medium Density Residential 7,793 41.7% Low Density Residential 2,737 14.7% Industrial 2,376 12.7% General Commercial 1,530 8.2% Road Right-of Way (TCU) 1,439 7.7% High Density Residential 789 4.2% Private Park 783 4.2% Public/Institutional 597 3.2% Transportation/Communication/Utilities 281 1.5% Activity Center (Commercial) 94 0.5% Office-Transitional 92 0.5% Public Park 87 0.5% Neighborhood Commercial 44 0.2% Landfill 35 0.2% Corridor Commercial 0 0.0% Total Land Acreage 18,677 100.0%

Figure 9 South Forsyth 2025 Future Land Use Plan
Jordan, Jones & Goulding, Inc South Forsyth Subarea Land Use Report 20

Appendix A. South Forsyth Subarea Advisory Committee Andy Walker John Pickering Michael Humber Joseph Moore Lamar Wakefield
B. Meeting Dates South Forsyth Subarea Public Visioning Workshop – May 13th at 5:30 PM in the West Hall Cafeteria, South Forsyth High School South Forsyth Subarea Advisory Committee Meeting – June 19th at 6:30 PM in the West Hall Cafeteria, South Forsyth High School
Jordan, Jones & Goulding, Inc South Forsyth Subarea Land Use Report 21

Forsyth County Comprehensive Plan
Big Creek Subarea Land Use Report
September 25, 2003

Table of Contents I. Introduction ................................................................................................................. 1
A) Purpose............................................................................................................ 1 B) Scope............................................................................................................... 1 C) Location ........................................................................................................... 3
II. Inventory of Existing Conditions ................................................................................. 3
A) Description of Existing Land Uses ................................................................... 3 B) Environmentally Sensitive Areas...................................................................... 3
1. Historic Resources................................................................................ 3 2. Water Resources .................................................................................. 5 3. Steep Slope .......................................................................................... 5 4. Conservation & Park Lands .................................................................. 5
C) Historic Development Patterns ........................................................................ 5 1. Demographics....................................................................................... 5 2. Development Activity ............................................................................ 8
D) Future Development Trends ............................................................................ 8 1. Future Infrastructure ............................................................................. 8 2. Transitional Areas................................................................................. 9 3. Current Land Use Policies .................................................................... 9
E) Trend Scenario .............................................................................................. 10 1. Methodology ....................................................................................... 10 2. Trend Scenario Map ........................................................................... 12
III. Subarea Committee Recommendations.................................................................. 14
A) Big Creek Subarea Vision .............................................................................. 14 B) Policy Recommendations............................................................................... 14 C) Big Creek Land Use Plan Map (Updated December 9, 2003) ....................... 14
Appendix ....................................................................................................................... 20
Jordan, Jones & Goulding, Inc. Big Creek Subarea Land Use Report i

I. Introduction A) Purpose In preparing the 2003 Update to the Forsyth County Comprehensive Plan, the County initiated an ambitious public involvement process. In order to better analyze the County’s needs and elicit a higher degree of community participation, the county was divided into ten planning subareas (Figure 1) with individual committees established to develop specific land use policies and a future land use map for their subarea. The subarea boundaries were determined by a variety of factors including: physical barriers, historical communities, economics and transportation corridors. This information was gathered to help enable the community to look at where they are today, how they got there and where they win this document are the findings from the land use inventory and subarea, as well as the recommendations of the Big Creek Subarea membership of the committee and the meeting dates can be found
B) Scope The following report provides a current “snapshot” of the Big Creexisting land uses in the subarea is provided, along with an existingThis is followed by an inventory of environmentally sensitive areasallow the community to identify those sections of the subarea that the future, as well as those areas that should be protected from dev Following this inventory, there is an examination of the historic deCreek subarea. This includes a discussion of demographic changes2000, as well as an estimate of land consumption during the last dethe historical factors that have led to the current development patt An examination of future development trends is also provided. Thfuture sewer and transportation infrastructure needs, as well as thethat could potentially be redeveloped. Forsyth County’s land use pto determine what is allowed to develop under the current regulatiothe subarea vision and policy recommendations developed by the BCommittee, and a copy of the future land use map for the subarea. C) Location The Big Creek subarea is located in the western part of the CountyFulton counties to the west, the Settingdown subarea to the north,and the McFarland subarea to the south.
Jordan, Jones & Goulding, Inc 1
Vickery
ant to go in the future. Included assessment for the Big Creek Advisory Committee. The in the Appendix.
ek subarea. First, a description of land use map and summary table. . These two sets of information could potentially be developed in elopment pressures.
velopment patterns in the Big in the subarea between 1990 and cade. There is also a summary of erns.
is includes an assessment of the identification of transitional areas olices are also examined in order ns. Finally, this report includes ig Creek Subarea Advisory
, bounded by Cherokee and the Cumming subarea to the east.
Big Creek Subarea Land Use Report

Figure 1 Forsyth County Subarea Locations
Jordan, Jones & Goulding, Inc. Big Creek Subarea Land Use Report 2

II. Inventory of Existing Conditions A) Description of Existing Land Uses A comprehensive land use survey was conducted for Forsyth County in the Summer of 2002 using tax parcel maps, aerial photographs and field review. In April 2003, JJG conducted a field review and a review of aerial photographs to verify the land uses in the Big Creek subarea. These land uses are shown on Figure 2 on the following page and summarized in Figure 3 below.
LResidential Agriculture Undeveloped Road Right-ofParks/RecreaCommercial Institutional/PuIndustrial Big Creek ToTotal Sq. Mile
As indicated in theland, comprising 4subarea. The secoNext is undevelopeagriculture land are The remaining landway, commercial, ithe commercial an B) Environme 1. Historic ReIn the mid-1990s aResources Survey RForty-nine of theseReport at least thre
Jordan, Jones & Gouldin
Figure 3: Big Creek Existing Land Use, 2003 and Use Acres Percent
5,941.69 44.32%3,739.16 27.89%2,184.62 16.30%
-way 749.25 5.59%tion/Conservation 446.97 3.33%
144.86 1.08%blic 129.44 0.97%
69.03 0.51%tal 13,405.01 100.00%s for Sub Area 20.9 --
table above, the largest land use category in the Big Creek subarea is residential 4 percent of the subarea. The residential land is distributed evenly throughout the nd largest category is agriculture, which makes up 28 percent of the subarea. d land, accounting for 16 percent of the land area. Both undeveloped and distributed evenly throughout the subarea.
uses make up less than 12 percent of the total area. These uses include right-of-ndustrial, public/institutional and parks/recreation/conservation land. Generally, d industrial uses are concentrated along SR 20.
ntally Sensitive Areas
sources historic resources inventory was completed for Forsyth County. The Historic eport identified 490 historic resources in unincorporated Forsyth County. historic structures are located in the Big Creek subarea. According to the Survey e of these sites have potential for National Register listing.
g, Inc. Big Creek Subarea Land Use Report 3

Figure 2 Big Creek Existing Land Use
Jordan, Jones & Goulding, Inc. Big Creek Subarea Land Use Report 4

2. Water Resources There are 1,521 acres of 100-year floodplains in the Big Creek subarea. All of the floodplains in the subarea are associated with areas around streams. Development is regulated in this area by the Federal Emergency Management Agency, the Georgia Floodplain Management Program of DNR and by local ordinances. There are 33,593 acres of groundwater recharge in Forsyth County, with 5,396 acres located in the Big Creek subarea. All the groundwater recharge acres are located in one area stretching from the middle of the subarea northward. This large area is shared with the Settingdown subarea to the north. Significant recharge areas have been mapped by the Georgia Department of Natural Resources at the state level. If a significant recharge area is identified, the local government must comply with the Official Code of Georgia Annotated 12-2-8. This Code outlines restrictions on locating landfills and hazardous waste facilities, above ground chemical or petroleum storage tanks, agricultural waste, impoundment sites, septic tank drain fields, slow rate land treatment, storm water infiltration basins, and waste treatment basins. 3. Steep Slopes There are 1,019 acres of steep slopes (15% grade or greater) in the Big Creek subarea. These steep slopes are spread evenly throughout the subarea. Since the majority of this area is dedicated to residential land uses, steep slopes are not a major deterrent to future land development. 4. Conservation & Park Lands There are 381 acres of park, recreation, and/or conservation land in the subarea. The subarea includes Midway Park, which is a 40-acre sports complex located at 5100 Post Road/SR 371. The park includes seven youth baseball/softball fields, one football field, one soccer field, two tennis courts, a playground, a walking trail, a picnic pavilion and a community building.
Farmland in the Big Creek subarea
The locations of the natural and cultural resources in the Big Creek subarea are shown on the map included as Figure 4. C) Historic Development Patterns 1. Demographics The Big Creek subarea has historically been characterized by farms, open land and single-family residences. As metro Atlanta began rapidly spreading northward in the 1980s, the Big Creek area became an attractive location for suburban residential development. In addition to the rural character of the area and affordable home prices, the northern reaches of Atlanta are easily accessible via GA 400 from this area.
Jordan, Jones & Goulding, Inc. Big Creek Subarea Land Use Report 5

Figure 4 Big Creek Natural and Cultural Resources
Jordan, Jones & Goulding, Inc. Big Creek Subarea Land Use Report 6

SR 20 and 371 provide local and regional connectivity within the Big Creek area. These major highways within this subarea serve commuters and other regional traffic moving across north Georgia. Additionally, the majority of the commercial and industrial development within the subarea has developed along the SR 20 corridor. In 2000, the population of the Big Creek subarea totaled 11,705. The population has almost tripled since 1990. The population density of the subarea is 622 people per square mile. This density is the same as the Cumming subarea and makes it among the most densely populated areas of the County. In comparison, the most densely populated subarea is South Forsyth, with 701 people per square mile. The Big Creek subarea is 97 percent white. The age distribution figures indicate the majority of residents in this area are adults 30 to 39 years of age, and children ages 5 to 17 rank second. The fastest growth in population has been for children under 5. Figure 5 provides a comparison of the demographic statistics for the area for 1990 and 2000.
Figure 5 Big Creek Subarea Demographics
1990 – 2000 1990 2000 Percent ChangeTotal Population 4,016 11,705 191.5%
Racial Distribution White 3,999 11,350 183.8% Black or African-American 0 29 6380.4% Asian 9 72 663.2% Hispanic or Latino of any race 23 333 1347.6%
Age Distribution Under 5 332 1,183 255.9% 5 to 17 760 2,242 195.1% 18 to 21 210 327 55.7% 22 to 29 509 946 86.0% 30 to 39 804 2,561 218.6% 40 to 49 599 1,966 228.4% 50 to 64 555 1,764 218.1% 65 and over 271 716 164.3%
Housing Total Units 1,549 4,168 169.1% Occupied 1,422 4,053 185.0% Vacancy Rate 127 115 -9.6% Owner Occupied 1,244 3,776 203.7% Renter Occupied 178 277 55.3% * Note: The racial and cultural distribution numbers total to a sum larger than the total population. Hispanic is a cultural descriptor and is not exclusive of race. In other words, many who consider themselves Hispanic also consider themselves White.
Jordan, Jones & Goulding, Inc. Big Creek Subarea Land Use Report 7

The number of housing units in the Big Creek subarea increased notably during the 1990s. In 1990, there were 1,549 housing units and by 2000 the number of units increased to 4,168, a 169 percent increase. Between 1990 and 2000 the vacancy rate decreased from 8 percent to 3 percent. The housing units in this area are largely owner-occupied, with 91 percent being owner-occupied and 7 percent renter occupied units. The number of owner-occupied units more than doubled during the 1990s. 2. Development Activity Residential development is responsible for the large majority of land consumption that has occurred in the Big Creek subarea. Even with the large increase in developed acres, it is estimated there are still nearly 6,000 acres that could be developed in the Big Creek area. Almost two-thirds of these developable acres are currently agricultural lands. One of the tools the JJG team used to evaluate development activity in the County is the occurrence of Developments of Regional Impact (DRIs) since 1990. A DRI review is required by law to be completed for large-scale developments that are likely to have impacts outside of the jurisdiction(s) where they are located. The Georgia Planning Act of 1989 authorized the Department of Community Affairs (DCA) to establish procedures for intergovernmental review of these large-scale projects. More than 40 DRI reviews have been completed in Forsyth County since 1990, three of these being located in the Big Creek subarea. The first DRI, Fox Creek, was approved in 1997. The Fox Creek development includes a golf course with 481 single-family homes. The second, Vickery, was approved in 2000. It is a mixed-use development with 744 units and 73,200 square feet of commercial space on 214 acres. Finally, Eagle Land Group, Inc. is in the process of completing a DRI for a 529-acre development. Two separate development scenarios are still being evaluated. The first plan consists of an 836 lot residential subdivision with a golf course. The second consists of a 1,115 lot residential subdivision with green space. The land where this development is proposed is currently being used for agricultural purposes. D) Future Development Trends 1. Future Infrastructure One of the primary drivers of development is the provision for public infrastructure, particularly sewer and roads. The availability of sewer allows for higher density land uses such as apartments or small-lot subdivisions (less than one-half acre lots). Roads are also primary drivers of change because they provide access to desired destinations, such as jobs and shopping. Better access leads to a higher land value and a greater likelihood of more intensive uses. There are numerous transportation improvements planned for the Big Creek subarea, as indicated in the 2002 Update of the county’s Major Transportation Plan. Improvements planned for 2005 in the Big Creek area include the widening of Canton Hwy/SR 20. The portion east of SR 371 will be widened from 2 to 4 lanes. Widening from 3 to 4 lanes will occur on the portion west of SR 371 to Doc Sams Road. By 2010, SR 371 will be widened to 4 lanes from Majors Road north to SR 20. Also, Kelly Mill Road will be widened to 6 lanes and SR 20 will be widened to 4 lanes west of Doc Sams Road. The only transportation improvements shown for the Big Creek subarea in 2020 are the widening of both SR 20 and Majors Road to 6 lanes.
Jordan, Jones & Goulding, Inc. Big Creek Subarea Land Use Report 8

Sanitary sewer is currently not available in the Big Creek subarea. However, the County’s Sewer Service Master Plan shows plans to extend sewer lines into this area along Bentley Creek, Cheatam Creek and their tributaries. The lines will lead to the Fowler Wastewater Reclamation Facility, south of Highway 9. With the high rate of growth in this area, the extension of sewer lines will be a high priority for the County and will likely be constructed within the next 5 years. 2. Transitional Areas There are still large tracts of available land for development in the Big Creek subarea, so the likelihood of redevelopment is small. Generally, it is more expensive to tear down or renovate existing structures compared to constructing new, so as long as land is available with the same locational benefits as existing structures, new construction is likely to locate on vacant or agricultural land. The large tracts of agriculture lands along SR 371 may transition to residential subdivisions as property values increase. 3. Land Use Policies The current Future Land Use Map for the Big Creek subarea identifies over 59 percent of the area to be developed as large-lot single-family houses and 21 percent to be conserved as parkland and open space. Current land use policy was analyzed by examining the primary tools of land use including the Unified Development Code and the Land Use Element of the Comprehensive Plan. The JJG team also examined the current zoning and Future Land Use maps to determine any implications that might arise from those elements. A difference exists between the way land is currently zoned in Forsyth County and the Future Land Use Map. In order to achieve the future land uses that are envisioned in the Comprehensive Plan, large amounts of land would have to be re-zoned. Rezonings would have to occur not only within land use categories, but significant amounts of land would have to be rezoned into entirely different categories. Figure 6 on page 11 shows the amount of land that would have to be rezoned to provide consistency with the Future Land Use Map. For example, Figure 6 shows that 38 percent of the land is zoned for agricultural use, but 26 percent of this land would need to be rezoned for single-family residential use to be consistent with the Future Land Use Map. The chart included as Figure 6 shows the amount of land within the Big Creek subarea that is intended for conversion from a current zoning category (rows), to a future land use category (columns). Individual cells of the table are currently zoned within a particular category (shown by the row) and intended for a particular future land use category (shown by the column). Percentages within each cell indicate the percentage of total land area that is categorized by a particular zoning category/future land use category combination. The colored areas of the chart indicate land that is currently intended for a future land use that is different from the way the land is currently zoned. At the present time, approximately 33% of the Big Creek subarea is intended to perform the same use as it is currently allowed by zoning (shown by the white areas). To achieve the land uses shown in the current future land use map, 67% of the land will require significant rezonings. Areas shown in red represent required “downzonings” – zoning changes that are traditionally difficult to perform because they further restrict the use of the land. This comprises approximately 19% of the subarea. Areas shown in green represent required
Jordan, Jones & Goulding, Inc. Big Creek Subarea Land Use Report 9

“upzonings” – zoning changes that are traditionally easier to perform because they generally increase the allowable uses of the land. This comprises approximately 46% of the subarea. Approximately 28% of the Big Creek subarea is currently intended to be moved away from agricultural zoning, to a mixture of residential (27%), and other uses (1%). Ten percent of land currently zoned agricultural is intended for conservation and/or park use (primarily flood plain). Although the current land use regulations allow single-family residences on land zoned agricultural, this represents a conversion of the land’s purpose.
E) Trend Scenario 1. Methodology As part of the JJG team’s examination of current land use policies and their potential impacts, an analysis of current development trends for the Big Creek subarea was performed. It was based upon the existing 2015 Future Land Use map, rezoning history, and real estate market preferences. This analysis had no specific time horizon. It is intended to gain an understanding of the ultimate impact of future development, if such development follows existing trends and is guided by existing land use policy.
Jordan, Jones & Goulding, Inc. Big Creek Subarea Land Use Report 10

Figure 6 Big Creek Rezonings to Match the 2015 Future Land Use Plan
Future Land Use Category
21% 59% 9% 0% 3% 7%
Conservation
and Park * Single Family Residential
Multi-Family Residential
Office/ Institutional Industrial Commercial
38% Agriculture 10% 26% 1% <1% <1% <1%
44% Single-Family Residential 11% 27% 4% <1% <1% 2%
5% Multi-Family Residential <1% 1% 2% <1% <1%
0% Office Institutional <1%
4% Industrial <1% 1% 1% 1% <1%
Cur
rent
Zon
ing
Cat
egor
y
9% Commercial <1% 3% 1% 1% 3% * Note: Conservation and park land can be associated with any zoning category.
Indicates that a rezoning is not required to be consistent with the future Land Use Plan
Indicates potentially difficult rezoning
Indicates rezoning that might be moderately difficult
Indicates potentially easy rezoning
Jordan, Jones & Goulding, Inc. Big Creek Subarea Land Use Report 11

In order to accomplish this analysis, the JJG team made several assumptions including:
Areas that are designated as having future land uses that are different from their existing land uses will be redeveloped; Existing structures that are non-conforming with respect to their current zoning will be redeveloped in a way to bring them into conformance; Future development within broad land use categories (for example, “Commercial”) will consist of a mix of uses and intensities that mirrors the county-wide proportions of land that is currently zoned within that category; Future development restrictions (for example, minimum lot sizes, maximum floor-area-ratios) will be based upon those that are currently expressed in the Unified Development Code; “Density shifting” to accommodate land lying within flood plains will continue to be permitted. In other words, parcels that contain part of their land within flood plains will be allowed to develop at the maximum density permitted, based on the area of the entire parcel, not just the part that is outside the flood plain; Moderately sloping land (>15% but less than 30%) that is designated residential, will eventually be developed; and Sewer and water services will be extended to all areas that require them.
B) Trend Scenario Map A Trend Scenario Map was created in order to illustrate this future land use scenario and is included on the following page as Figure 7. The future that this map indicates is not a given, but a likely scenario of how the area will develop over the next 20 years. It shows that existing suburban residential development will spread out and occupy a large amount of the subarea. Continued commercial growth will occur along SR 20, with smaller commercial nodes at SR 371 and Kelly Mill Road and at SR 371 and Majors Road. The implications of this trend scenario include increased demands on public infrastructure, such as schools, water, sewer, roads, police and fire protection. It also indicates that the dramatic changes that the area has experienced over the past 10 years are only the beginning of additional changes for the area if current trends continue. The question that this planning exercise poses is one that the citizens of the Big Creek area have to answer and that is, “Is this the future we envision for our community?”
Jordan, Jones & Goulding, Inc. Big Creek Subarea Land Use Report 12

Figure 7 Big Creek Trend Scenario
Jordan, Jones & Goulding, Inc. Big Creek Subarea Land Use Report 13

III. Subarea Committee Recommendations There were two meetings held from May to July 2003 to discuss the development of a land use plan for the Big Creek subarea. A list of the meeting dates can be found in the Appendix. At the first meeting the inventory of existing conditions for the subarea was presented, and the participants were asked to help craft a vision for the subarea. At the second meeting, a draft land use plan map was presented along with the draft vision and participants were asked to fill out comments cards, which were presented to the subarea committee for discussion and review. The result of this meeting was a revised land use plan map and a list of policy recommendations that the subcommittee would like to present to the Countywide Land Use Steering Committee for possible inclusion in the county’s Comprehensive Plan. The results of these meetings are presented below. A) Big Creek Subarea Vision
• The Big Creek subarea will primarily be a residential community with close proximity to jobs and commercial areas.
• Residential developments will preserve large amounts of open space. • Commercial development will take the form of nodes as opposed to “strip commercial”.
Commercial development should be directed along SR 20. • Adopt appropriate design standards to promote quality development throughout the
subarea. • A network of greenways will run throughout the subarea with passive parks and connected
trails. • The subarea will offer a variety of lot sizes, but design guidelines will help to preserve the
rural character. • The subarea’s valued natural and cultural resources will be preserved for future generations.
B) Policy Recommendations
• The County needs to prepare a Greenway Master Plan that includes connected greenways throughout the County. Existing natural features such as stream banks and groundwater recharge areas could be utilized.
• Need more land in public parks. • Prepare a Feasibility Study on Transfer of Development Rights (TDRs) countywide, in order
to preserve open space. • Install sidewalks, bike paths and trees along roads as they are improved.
• Density calculations should include environmentally sensitive land.
C) Big Creek Land Use Plan Map The future land use plan is an extension of the goals and values of the community and a culmination of the subarea planning effort. This future land use map is intended to depict a 2025 future land use scenario. The acreages and percentages of each land use are compiled in Figure 8 and a map showing the location of future land uses is included in Figure 9.
Jordan, Jones & Goulding, Inc Big Creek Subarea Land Use Report 14

There are fourteen land use designations depicted on the future land use map, including three residential designations and six commercial/industrial/mixed-use designations. Below is brief definition of each. Low Density Residential - This category is intended for single-family detached residential dwellings typically on septic sewer systems. Minimum lot size is 30,000 square feet, or the overall density is up to 1.5 units per acre. Institutional uses that are considered complimentary in this area include churches, schools, and libraries. Medium Density Residential - Consists of single-family detached residential dwellings typically on sewer, with overall densities from 1.5 to 2.5 units per acre. Institutional uses that are considered complimentary in this area include churches, schools, and libraries. Private recreational uses, such as golf courses, tennis courts, walking trails and swimming pools are encouraged in these areas in developments greater than 50 lots. High Density Residential - Typical uses include single-family detached and attached dwellings (such as townhouses) as well as multifamily condominiums and apartments, at densities of up to 6 units per acre. These developments should incorporate some amount of central outdoor public space for their residents. A limited number of churches, schools, libraries, other miscellaneous institutional uses and daycare facilities would be complimentary in these areas. An urban-density residential area is usually located near areas of high employment concentration, large commercial nodes, transportation nodes and mixed-use developments. It is essential that these developments include proper buffering between adjacent land uses. Office Transitional - The Office Transitional category is intended to allow for the redevelopment or transition of residential uses along major roadways to office professional uses. It also allows for new office development that is constructed in a manner consistent and in keeping with the surrounding residential uses. The physical character and design of proposed new structures should be compatible with existing establishments. This category includes small single occupant structures for doctors and or accountants, as well as larger offices with multiple tenants. Businesses that are allowed in this category may provide a product directly to customers on the premises as an accessory to the service, but do not, as a primary activity, involve the manufacture, storage, or distribution of products. These areas should provide employment opportunities in close proximity to residential areas while providing a transition between the more intense commercial areas and residential neighborhoods. Neighborhood Commercial - This category includes a limited range of retail and service activities to serve the everyday needs of local residents. Limitations should apply to both size and character of individual establishments. The basic character of this category is one that encourages and assures a compatible mixture of residential, office and retail types of land uses. Businesses in this land use category should be designed to encourage the development of neighborhood scale shopping that offers both goods and products, and the furnishing of selected services. General Commercial - This category includes standard retail and commercial service activities such as shopping centers, general retailers, specialty shops, grocery stores, drug stores, banks, restaurants, theatres, hotels, dry cleaners and entertainment facilities. These establishments should be located on appropriate transportation corridors to easily serve the public. Visual impacts of these developments should be minimized by requiring buffers, landscaping, and architectural controls.
Jordan, Jones & Goulding, Inc Big Creek Subarea Land Use Report 15

Activity Center - The Activity Center land use category includes commercial, entertainment, limited residential, and public/institutional land uses typically found in a central business district. The commercial business district (CBD) and urban village (UV) zoning classifications are considered appropriate for developments proposed within the Activity Center classification. Developments within the Activity Center classification may be encouraged to consider additional zoning classifications, based on future revisions to the Forsyth County Unified Development Code. The types of uses that are desirable in this area would be restaurants, specialty retail, governmental offices, low-intensity offices (e.g. accountant or real estate office) and appropriate parking. Uses should be complemented with walking, biking and transit opportunities to provide alternative modes of transportation. Also, any roadway improvements that are considered for this area should carefully consider the scale of the area. Residential uses shall be considered accessory and limited to townhouses or apartments mixed into the commercial establishments. Commercial uses must be developed or present first in comparable scale before residential uses can be permitted for construction. Corridor Commercial - The Corridor Commercial category is intended to focus on major transportation corridors, which presently contain a mix of agricultural, residential, commercial, and industrial land uses. Such corridors are unlikely to experience small scale, low or medium density residential development over the course of the planning period. Developments within the corridor commercial classification will focus on land uses of varying intensity that will allow for the appropriate transition between high-intensity development abutting the transportation corridor as well as provide for a continued decrease of intensity as the development moves away from the transportation corridor. The physical character and design of proposed developments should be compatible with surrounding uses. Inter-parcel connectivity and side street access should be encouraged to minimize curb cuts and improve traffic flow. Typical uses include standard retail and commercial service activities such as shopping centers, general retailers, specialty shops, grocery stores, drug stores, banks, restaurants, theatres, hotels, dry cleaners, entertainment facilities, multiple tenant offices, small single occupant structures, and entrances to residential subdivisions located outside the corridor commercial designation. The transitional nature of the category should be supported through the use of buffers, landscaping, and architectural controls to minimize the impacts on lower intensity land uses. Industrial - The primary purpose of this category is to provide for areas where light industrial uses can be located. These light industrial uses include light manufacturing, warehousing, wholesale/distribution and assembly. More intensive industrial uses that are characterized by noise, fumes, vibration and other forms of pollution that might be viewed as objectionable by surrounding uses are acceptable only on a case-by-case basis if well screened and buffered from other uses. Limited commercial uses are also allowed in industrial areas if they compliment existing industrial uses, such as cafeterias and day cares. Public / Institutional - Includes uses such as schools, colleges, hospitals, municipal community centers, churches, cemeteries, municipal buildings and post offices.
Jordan, Jones & Goulding, Inc Big Creek Subarea Land Use Report 16

Public Park - This category includes land dedicated to active and passive recreation uses. These areas are publicly owned and may include sports fields, recreation areas, greenways, and similar uses. Private Park - Privately owned land that is used for active and passive recreation. This may include subdivision amenities areas, golf courses and Army Corps of Engineers recreation areas. Conservation - This classification includes environmentally sensitive areas that are regulated at the local and state levels. Areas included in this category are the 35 ft. buffer along all county streams, a 100 ft. buffer along the Etowah River and land that is part of the 100-year floodplain of local waterways. This land has the potential to be used as public greenways or multi-purpose paths. Land classified as Conservation alerts government officials and property owners to the presence of environmental conditions that shall be factored into the rezoning and permitting process. Transportation / Communication / Utilities (TCU) - This category includes such uses as landfills, water treatment plants, wastewater treatment plants, power substations, rail yards, mass transit facilities, airports, etc. These uses may be either public or private.
Jordan, Jones & Goulding, Inc Big Creek Subarea Land Use Report 17

Figure 8 Big Creek Future Land Use, 2025
Land Use Acres Percent Medium Density Residential 6,001 44.8%Low Density Residential 5,280 39.4%Road Right-of Way (TCU) 754 5.6%Private Park 360 2.7%General Commercial 296 2.2%Corridor Commercial 198 1.5%Public/Institutional 214 1.6%Industrial 152 1.1%Public Park 43 0.3%Activity Center (Commercial) 35 0.3%Office-Transitional 28 0.2%High Density Residential 23 0.2%Neighborhood Commercial 23 0.2%Transportation/Communication/Utilities 0 0.0%Total Land Acreage 13,407 100.0%
Jordan, Jones & Goulding, Inc Big Creek Subarea Land Use Report 18

Figure 9 Big Creek 2025 Future Land Use Plan
Jordan, Jones & Goulding, Inc Big Creek Subarea Land Use Report 19

Appendix A. Big Creek Subarea Advisory Committee Katherine Lindaman Tony Gulla Barry Russell Linda Stewart Bob Charles
B. Meeting Dates Big Creek Subarea Public Visioning Workshop – May 15th at 5:30 PM in the Sawnee Mountain Park Community Building Big Creek Subarea Advisory Committee Meeting - July 22nd at 6:00 PM in the Cumming Library.
Jordan, Jones & Goulding, Inc Big Creek Subarea Land Use Report 20

Forsyth County Comprehensive Plan
Buford/GA 20 East Subarea Land Use Report
September 25, 2003

Table of Contents I. Introduction ................................................................................................................. 1
A) Purpose............................................................................................................ 1 B) Scope............................................................................................................... 1 C) Location ........................................................................................................... 1
II. Inventory of Existing Conditions ................................................................................. 3
A) Description of Existing Land Uses ................................................................... 3 B) Environmentally Sensitive Areas...................................................................... 5
1. Historic Resources................................................................................ 5 2. Water Resources .................................................................................. 5 3. Steep Slope .......................................................................................... 5 4. Conservation & Park Lands .................................................................. 6
C) Historic Development Patterns ........................................................................ 6 1. Demographics....................................................................................... 6 2. Development Activity ............................................................................ 8
D) Future Development Trends ............................................................................ 9 1. Future Infrastructure ............................................................................. 9 2. Transitional Areas............................................................................... 10 3. Current Land Use Policies .................................................................. 10
E) Trend Scenario .............................................................................................. 13 1. Methodology ....................................................................................... 13 2. Trend Scenario Map ........................................................................... 13
III. Subarea Committee Recommendations.................................................................. 15
A) Buford/GA 20 East Subarea Vision................................................................ 15 B) Policy Recommendations............................................................................... 15 C) Buford/GA 20 East Land Use Plan Map (Updated December 9, 2003) ......... 16
Appendix ....................................................................................................................... 21
Jordan, Jones & Goulding, Inc. Buford Subarea Land Use Report i

I. Introduction A) Purpose
Residential Development by Lake Lanier
In preparing the 2003 Update to the Forsyth County Comprehensive Plan, the County initiated an ambitious public involvement process. In order to better analyze the County’s needs and elicit a higher degree of community participation, the county was divided into ten planning subareas (Figure 1) with individual committees established to develop specific land use policies and a future land use map for their subarea. The subarea boundaries were determined by a variety of factors including: physical barriers, historical communities, economics and transportation corridors. This information was gathered to help enable the community to look at where they are today, how they got there and where they want to go in the future. Included in this document are the findings from the land use inventory and assessment for the Buford/GA 20 East subarea, as well as the recommendations of the Buford/GA 20 East Subarea Advisory Committee. The membership of the committee and the meeting dates can be found in the Appendix. B) Scope The following report provides a current “snapshot” of the Buford/ GA 20 East subarea. First, a description of existing land uses in the subarea is provided, along with an existing land use map and summary table. This is followed by an inventory of environmentally sensitive areas. These two sets of information allow the community to identify those sections of the subarea that could potentially be developed in the future, as well as those areas that should be protected from development pressures. Following this inventory, there is an examination of the historic development patterns in the Buford/GA 20 East subarea. This includes a discussion of demographic changes in the subarea between 1990 and 2000, as well as an estimate of land consumption during the last decade. There is also a summary of the historical factors that have led to the current development patterns. An examination of future development trends is also provided. This includes an assessment of the future sewer and transportation infrastructure needs, as well as the identification of transitional areas that could potentially be redeveloped. Forsyth County’s land use polices are also examined in order to determine what is allowed to develop under the current regulations. Finally, this report includes the subarea vision and policy recommendations developed by the Buford/ GA 20 East Subarea Advisory Committee, and a copy of the future land use map for the subarea. C) Location The Buford/20 East subarea is located on the eastern side of Forsyth County. Buford Highway (GA Hwy 20) cuts diagonally through the center of the subarea. The general boundaries
Jordan, Jones & Goulding, Inc. Buford Subarea Land Use Report 1

Figure 1 Forsyth County Subarea Locations
Jordan, Jones & Goulding, Inc. Buford Subarea Land Use Report 2

include the Chattahoochee River and Gwinett County to the east, the South Forsyth subarea to the south, the Cumming subarea to the northwest, and the Lake Lanier subarea to the northeast.
II. Inventory of Existing Conditions A) Description of Existing Land Uses A comprehensive land use survey was conducted for Forsyth County in the Summer of 2002 using tax parcel maps, aerial photographs and field review. In April 2003, JJG conducted a field review and a review of aerial photographs to verify the land uses in the Buford/GA 20 East subarea. These land uses are shown on Figure 2 on the following page and summarized in Figure 3 below.
ResidentiaUndevelopParks/RecrRoad RighCommerciaAgricultureInstitutionaBuford/20 Total Sq. M
As indicated in thresidential land, coconcentrated on tnearly all lake fron The second largesUndeveloped landCountry Club. Mdevelopment. The third largest aland owned by theparks in the area. abundant in the wCumming form a the southern end Overall, this subaramount of new redeveloped for mathe North Fulton
Jordan, Jones & Gouldi
Figure 3: Buford/ 20 East Existing Land Use, 2003 Land Use Acres Percent
l 3,981.00 45.07%ed 2,333.95 26.42%eation/Conservation 1,089.95 12.34%t-of-way 736.95 8.34%l 298.42 3.38%
233.32 2.64%l/Public 158.98 1.80%East Total 8,833.03 100.00%iles for Sub Area 13.8 --
e table above, the largest land use category in the Buford/GA 20 East subarea is mprising almost 45 percent of the subarea. Residential development is largely
he northern part of the subarea, particularly along the lake’s perimeter. In fact, tage parcels are either residential development or public conservation lands.
t category is undeveloped land, which makes up almost 26 percent of the subarea. is found primarily south of I-20 near Windermere Park and the Windermere uch of this land will soon be developed as part of the Windermere mixed use
rea is Parks/Recreation/Conservation which accounts for the large amount of U.S. Army Corps of Engineers around Lake Lanier, and other private and public
There is very little land in agriculture or industrial uses. Commercial uses are estern part of the subarea where the interchange of GA 400 and GA 20 in commercial hub. Some commercial development has moved down GA 20 toward of the subarea, but this development is widely scattered along the corridor.
ea has more of a bedroom community than other subareas, with its extensive sidential growth. This is largely due to the impact of the lake, which has been well ny years. Future growth in the area will likely be caused by spillover growth from and Gwinnett areas.
ng, Inc. Buford Subarea Land Use Report 3

J
Figure 2 Buford/GA 20 East Subarea Existing
Land Use
ordan, Jones & Goulding, Inc Buford Subarea Land Use Report 4

B) Environmentally Sensitive Areas 1. Historic Resources In the mid-1990s a historic resources inventory was completed for Forsyth County. The Historic Resources Survey Report identified 490 historic resources in unincorporated Forsyth County. Eleven (11) of these historic resources were located in the Buford/GA 20 East subarea. None of these sites are on the National Register of Historic Places. 2. Water Resources There are 782 acres of 100-year floodplains in the Buford/GA 20 East subarea. Development in these floodplains is regulated in this area by the Federal Emergency Management Agency, the Georgia Floodplain Management Program of DNR and by local ordinances. Most of the floodplain associated with the Buford/GA 20 East area is located along tributaries of the Chattahoochee River, such as Haw Creek and Daves Creek. There are only 1,804 acres of land associated with groundwater recharge areas in the Buford/GA 20 East subarea. Significant recharge areas have been mapped by the Georgia Department of Natural Resources at the state level. If a significant recharge area is identified, the local government must comply with the Official Code Georgia Annotated 12-2-8. This Code outlines restrictions on locating landfills and hazardous waste facilities, above ground chemical or petroleum storage tanks, agricultural waste, impoundment sites, septic tank drain fields, slow rate land treatment, storm water infiltration basins, and waste treatment basins. The largest recharge area in the Buford/GA 20 East subarea is located in the central portion of the subarea on either side of GA 20 near its intersection with Echols Road. This area boasts the majority of the subarea’s agricultural land, but is primarily residential and undeveloped land. Since Forsyth relies on Lake Lanier for drinking water, the possibility of ground water contamination does not pose a significant threat to public safety. 3. Steep Slopes There are 2,992 acres of steep slopes (15% grade or greater) in the Buford/GA 20 East subarea. These slopes are found mostly along the periphery of the subarea funneling water into the subarea’s streams. Larger concentrations of steep slopes are found in the southern and eastern portions of the study area.
Jordan, Jones & Goulding, Inc. 5
View from Buford Dam Road
Buford Subarea Land Use Report

4. Conservation & Park Lands There are several parks in this subarea, with the majority of them located near the older residential development by the lake. These parks include Lower Pool Park, West Bank Park, Powerhouse Park, Sawnee Campground and Little Ridge Park. Windermere Park is located in the southern portion of the subarea along James Creek, the only park not bordering the lake in the subarea. There are also two golf courses, the Windermere Golf and Country Club to the south and the Lanier Golf Course to the north. The locations of the natural and cultural resources in the Buford/GA 20 East subarea are shown on the map included as Figure 4. C) Historic Development Patterns 1. Demographics In 2000, the population of the Buford/GA 20 East subarea totaled 8,711. This is an increase of 118% percent since 1990, very similar to the county as a whole which grew at a rate of 123%. The population density of the area is 567 people per square mile, somewhat more dense than the county as a whole which has 436 people per square mile . The Buford/GA 20 East subarea is 96 percent white, similar to the county which is 95 percent white. The age distribution figures indicate the majority of residents in this area are between 30-39 years (nearly 20 percent) with the 5 to 17, 40 to 49 and 50 to 64 age cohorts all very close behind. The largest increase in age distribution has been for the 50 to 64 age cohort, with children under 5 coming in second. The 40 to 49 and 5 to 17 age cohorts are also experiencing large growth rates. By contrast, the slowest increase of any age cohort was the 22 to 29 group which grew by less than 5 percent. Figure 5 provides a comparison of the demographic statistics for the area for 1990 and 2000. The number of housing units in the Buford/GA 20 East subarea increased notably during the 1990s. In 1990, there were 1,764 housing units and by 2000 the number of units increased to 3,287, an 86 percent increase. While the population increased at nearly the same rate as the county (118 percent compared to 123 percent), housing units lagged slightly behind in proportion as the county housing unit growth rate exceeds 116 percent and Buford/GA 20 East stands at 86 percent. This suggests that in comparison to the county, housing sizes are becoming slightly larger, an expected phenomenon given the amount of families in the subarea. During the 1990s the vacancy rate was more than cut in half, dropping from 13.3 percent in 1990 to 4.9 percent.
Jordan, Jones & Goulding, Inc. 6
New Housing at Windermere
Buford Subarea Land Use Report

J
Figure 4 Buford/GA 20 East Natural and Cultural
Resources
ordan, Jones & Goulding, Inc Buford Subarea Land Use Report 7

Figure 5 Buford/GA 20 East Subarea Demographics
1990 – 2000 1990 2000 Percent Change Total Population 3,990 8,711 118.3% Racial and Cultural Distribution* White 3,973 8,451 112.7% Black or African-American 1 37 4,301.1% Asian 6 44 612.0% Hispanic or Latino of any race 48 256 438.2% Age Distribution Under 5 326 758 132.7% 5 to 17 670 1,635 144.0% 18 to 21 183 241 31.9% 22 to 29 557 582 4.4% 30 to 39 825 1,729 109.5% 40 to 49 660 1,579 139.4% 50 to 64 515 1,555 202.0% 65 and over 302 632 109.1% Housing Total Units 1,764 3,287 86.3% Occupied 1,529 3,125 104.4% Vacancy Rate 13.3% 4.9% -8.4%% Owner Occupied 1,260 2,888 129.2% Renter Occupied 269 237 -11.9% * Note: The racial and cultural distribution numbers total to a sum larger than the total population. Hispanic is a cultural descriptor and is not exclusive of race.
in 2000. The housing units in this area are largely owner-occupied at 92 percent, while the remaining 8 percent are renter-occupied. The number of owner-occupied units increased by 104 percent during the 1990s. 2. Development Activity It is estimated that since 1990 approximately 15 percent, or 1500 acres have been developed in this subarea. The majority of this development has been residential. Within the city limits of Cumming, some new big box commercial and the hospital have also been built around the intersection of GA 20 and GA 400. One of the tools the JJG team used to evaluate development activity in the County is the occurrence of Developments of Regional Impact (DRIs) since 1990. A DRI review is required by law to be completed for large-scale developments that are likely to have impacts outside of the jurisdiction(s) where they are located. The Georgia Planning Act of 1989 authorized the Department of Community Affairs (DCA) to establish procedures for intergovernmental review of these large-scale projects. More than 40 DRI reviews have been completed in Forsyth County since 1990, with two of these developments slated to occur in the Buford/GA 20 East subarea. One of these
Jordan, Jones & Goulding, Inc. Buford Subarea Land Use Report 8

developments, the Windermere project, is a mixed-use project with office, commercial, housing and recreational uses proposed. This project will take up much of the undeveloped land in the southern tip of the subarea. The second development is the Chattahoochee River Club, a single-family housing development near River Park Court in the southeastern section of the subarea. D) Future Development Trends 1. Future Infrastructure One of the primary drivers of development is the provision for public infrastructure, particularly sewer and roads. The availability of sewer allows for higher density land uses such as apartments or small-lot subdivisions (less than one-half acre lots). Roads are also primary drivers of change because they provide access to desired destinations, such as jobs and shopping. Better access leads to a higher land value and a greater likelihood of more intense uses. There are several transportation improvements planned for the Buford/GA 20 East subarea. By 2005, the eastern section of GA 20 will be expanded to four lanes, the middle section (between Samples Road and Nuckolls Road) will be expanded to six lanes, while the remaining section stretching to GA 400 will go from four to six lanes. No further improvements are expected until 2020, when the section of GA 20 east of Samples Road will be upgraded again, this time to six lanes.
Currently, only the area northeast of GA Hwy 20 in the Buford/GA 20 East subarea has sewer service. This well developed northern half of the subarea falls within the Cumming sewer service area. The southern half of the subarea falls under the county’s sewer service area and is slated for sewer expansion over the next five to ten years.
Traffic Along GA 20 Near GA 400
Jordan, Jones & Goulding, Inc. Buford Subarea Land Use Report 9

One of the strongest influences on the future development of the Buford/GA 20 East subarea will be continued expansion of the Atlanta urbanized area. Over the last ten years, this southern half of the County has experienced intense development pressure, and this pressure is moving northward along either side of GA 400. Because of this growth pressure, land values in the southern portion of the county are likely to continue to rise making it more economical for higher density development, particularly for those areas closest to GA 400. The residential component of the subarea should continue to thrive as GA 20 provides good east-west access and access to GA 400. As undeveloped land becomes scarcer in the subarea and the southern portion of the county, the demand for more intensive residential development will intensify. 2. Transitional Areas There are still large tracts of available land for development in the Buford/GA 20 East subarea, so the likelihood of redevelopment is small. Generally, it is more expensive to tear down or renovate existing structures compared to constructing new, so as long as land is available with the same locational benefits as existing structures, new construction is likely to locate on vacant land. The one major exception to this in the Buford subarea is the aging residential structures along Lake Lanier. There are several small older homes close to the lake that are likely to be redeveloped in the future. The value of lake front property has been rising steadily over the past ten years, as new residents have been moving into the County. Consequently, it is not unusual to find older homes located next to a newly constructed high-end single-family home near the lake. It can be expected that over time, most of these older houses will be replaced with new construction. As this transformation takes place, these smaller non-conforming lots will have to be brought up to existing County standards. 3. Land Use Policies The 2015 Future Land Use map for the Buford/GA-400 subarea identifies over 60 percent of the area to be developed as large-lot single-family houses, 15 percent to be developed as commercial, industrial, and office/institutional uses, and 25 percent to be conserved as parkland and open space. Current land use policy was analyzed by examining the primary tools of land use including the Unified Development Code and the Land Use Element of the Comprehensive Plan. The JJG team also examined the current zoning and 2015 Future Land Use maps to determine any implications that might arise from those elements. A difference exists between the way land is currently zoned in Forsyth County and the Future Land Use map. In order to achieve the future land uses that are envisioned in the Comprehensive Plan, large amounts of land would have to be re-zoned. Rezonings would have to occur not only within land use categories, but significant amounts of land would have to be rezoned into entirely different categories. Figure 6 on the following page shows the amount of land that would have to be rezoned to provide consistency with the 2015 Future Land Use map.
Jordan, Jones & Goulding, Inc. Buford Subarea Land Use Report 10

Figure 6 Buford/GA-400 Rezonings to Match the 2015 Future Land Use Plan
Future Land Use Category
25% 60% 3% 5% 7%
Conservation and
Park * Single Family Residential Office/ Institutional Industrial Commercial
36% Agriculture 8% 26% 1% <1% <1%
55% Single-Family Residential 15% 31% <1% 3% 5%
2% Multi-family Residential <1% 1% <1%
1% Office Institutional <1% <1% <1% <1%
Cur
rent
Zon
ing
Cat
egor
y
6% Commercial 1% 2% 1% 1% <1% * Note: Conservation and park land can be associated with any zoning category.
Indicates that a rezoning is not required to be consistent with the future Land Use Plan
Indicates potentially difficult rezoning
Indicates rezoning that might be moderately difficult
Indicates potentially easy rezoning
Jordan, Jones & Goulding, Inc. Buford Subarea Land Use Report 11

The chart included as Figure 6 shows the amount of land within the Buford/GA 20 East subarea that is intended for conversion from a current zoning category (rows), to a future land use category (columns). Individual cells of the table are currently zoned within a particular category (shown by the row) and intended for a particular future land use category (shown by the column). Percentages within each cell indicate the percentage of total land area that is categorized by a particular zoning category/future land use category combination. The colored areas of the chart indicate land that is currently intended for a future land use that is different from the way the land is currently zoned. At the present time, approximately 57% of the Buford/GA 20 East subarea is intended to perform the same use as it is currently allowed by zoning (shown by the white areas). To achieve the land uses shown in the current future land use map, 5% of the land will require significant rezonings. Areas shown in red represent required “downzonings” – zoning changes that are traditionally difficult to perform because they further restrict the use of the land. This comprises approximately 38% of the subarea. Areas shown in green represent required “upzonings” – zoning changes that are traditionally easier to perform because they generally increase the allowable uses of the land. This comprises approximately 40% of the subarea. Approximately 36% of the Buford/GA 20 East subarea is currently intended to be moved away from agricultural zoning, to a mixture of residential (26%) and other uses (2%). Eight percent of the land, currently zoned agricultural, is intended for conservation and/or park use (primarily flood plain). Although the current land use regulations allow single-family residences on land zoned agricultural, this represents a significant conversion of the land’s purpose. Over the next 10 to 20 years, the Buford/GA-400 area is likely to experience a rapid increase in population. Employment opportunities are likely to take the form of retail and service oriented businesses catering to the needs of future homeowners. The eventual form and density that this future development will take is strongly dependent on the provision of sewer and road improvements. There are no immediate plans now to extend sewer into the area, but the investment in new roads will increase property values and lead to further market interest in single-family residential development. .
Jordan, Jones & Goulding, Inc. Buford Subarea Land Use Report 12

E) Trend Scenario 1. Methodology As part of the JJG team’s examination of current land use policies and their potential impacts, an analysis of current development trends for the Buford/GA 20 East subarea was performed. It was based upon the existing 2015 Future Land Use map, rezoning history, and real estate market preferences. This analysis had no specific time horizon. It is intended to gain an understanding of the ultimate impact of future development, if such development follows existing trends and is guided by existing land use policy. In order to accomplish this analysis, the JJG team made several assumptions including:
Areas that are designated as having future land uses that are more intensive than their existing land uses will be redeveloped; Future development within broad land use categories (for example, “Commercial”) will consist of a mix of uses and intensities that mirror the county-wide proportions of land that are currently zoned within that category; Future development restrictions (for example, minimum lot sizes, maximum floor-area-ratios) will be based upon those that are currently expressed in the Unified Development Code; “Density shifting” to accommodate land lying within flood plains will continue to be permitted. In other words, parcels that contain part of their land within flood plains will be allowed to develop at the maximum density permitted, based on the area of the entire parcel, not just the part that is outside the flood plain; Moderately sloping land (>15% but less than 30%) that is designated residential, will eventually be developed; and Sewer and water services will be extended to all areas that require them.
2. Trend Scenario Map A Trend Scenario map was created in order to illustrate this future land use scenario and it is included on the following page as Figure 7. The future that this map indicates is not a given, but a likely scenario of how the area will develop over the next 20 years. This map shows that commercial areas will continue to expand along GA 20, filling in most of this route north of Echols Road and up to GA 400. Little additional commercial growth is likely along the southern strip of GA 20. Residential development will continue to take place along vacant parcels near GA 20, and will begin to fill in the lesser developed southern half of the subarea. As land becomes more scarce in the southern half of the county over the next couple of decades, some of this development may take place at higher densities, particularly as sewer is made available. However, the county is likely more than a decade away from seeing this trend begin. The implications of this trend scenario include increased demands on public infrastructure, such as schools, water, sewer, roads, police and fire protection. It also indicates that the dramatic changes that the area has experienced over the past ten years are only the beginning of additional changes for the area if current trends continue. The question that this planning exercise poses is one that the citizens of the Buford/GA 20 East area have to answer, and that is “Is this the future that we envision for our community?”
Jordan, Jones & Goulding, Inc. Buford Subarea Land Use Report 13

Jor
Figure 7 Buford/GA 20 East Trend Scenario
dan, Jones & Goulding, Inc Buford Subarea Land Use Report 14

III. Subarea Committee Recommendations There were two meetings held from May to July 2003 to discuss the development of a land use plan for the Buford/GA 20 East subarea. A list of the meeting dates can be found in the Appendix. At the first meeting the inventory of existing conditions for the subarea was presented, and the participants were asked to help craft a vision for the subarea. At the second meeting, a draft land use plan map was presented along with the draft vision and participants were asked to fill out comments cards, which were presented to the subarea committee for discussion and review. The result of this meeting was a revised land use plan map and a list of policy recommendations that the subcommittee would like to present to the Countywide Land Use Steering Committee for possible inclusion in the county’s Comprehensive Plan. The results of these meetings are presented below. A) Buford/GA 20 East Subarea Vision
• The Buford/ 20 East subarea will primarily have residential character with convenient access to recreational, shopping and employment opportunities.
• The GA 400 and GA 20 highway corridors will continue to be an asset for residents of this subarea, providing a connection to jobs and commercial areas.
• New activity centers will be located near the intersection of GA 20 and Sanders Road and GA 20 and Windermere Parkway.
• Appropriate design standards will be adopted to promote quality development throughout the subarea.
• A network of greenways will run throughout the subarea with passive parks and connected trails.
• The subarea’s valuable natural resources, including Lake Lanier and the Chattahoochee River, will be preserved for future generations through appropriated buffers and impervious surface restrictions.
B) Policy Recommendations
• Update the Unified Development Code to reflect the Future Land Use Plan. • The County needs to prepare a Greenway Master Plan that includes connected greenways
throughout the County. Existing natural features such as stream banks and groundwater recharge areas could be utilized.
• Need more land in public parks. • Current Tree Ordinance needs to be strengthened, with a focus on preserving existing trees
and requiring more trees in parking lots. • Control the quality of development along SR 20 with design standards. • Connect Activity Centers to residential neighborhoods with sidewalks. • Limit impervious surfaces, promote pervious surfaces. • Design standards should promote light colored roof tops to reduce urban heat islands and
require lighting to face downward.
Jordan, Jones & Goulding, Inc Buford Subarea Land Use Report 15

C) Buford/GA 20 East Land Use Plan Map The future land use plan is an extension of the goals and values of the community and a culmination of the subarea planning effort. This future land use map is intended to depict a 2025 future land use scenario. The acreages and percentages of each land use are compiled in Figure 8 and a map showing the location of future land uses is included in Figure 9. There are fourteen land use designations depicted on the future land use map, including three residential designations and six commercial/industrial/mixed-use designations. Below is brief definition of each. Low Density Residential - This category is intended for single-family detached residential dwellings typically on septic sewer systems. Minimum lot size is 30,000 square feet, or the overall density is up to 1.5 units per acre. Institutional uses that are considered complimentary in this area include churches, schools, and libraries. Medium Density Residential - Consists of single-family detached residential dwellings typically on sewer, with overall densities from 1.5 to 2.5 units per acre. Institutional uses that are considered complimentary in this area include churches, schools, and libraries. Private recreational uses, such as golf courses, tennis courts, walking trails and swimming pools are encouraged in these areas in developments greater than 50 lots. High Density Residential - Typical uses include single-family detached and attached dwellings (such as townhouses) as well as multifamily condominiums and apartments, at densities of up to 6 units per acre. These developments should incorporate some amount of central outdoor public space for their residents. A limited number of churches, schools, libraries, other miscellaneous institutional uses and daycare facilities would be complimentary in these areas. An urban-density residential area is usually located near areas of high employment concentration, large commercial nodes, transportation nodes and mixed-use developments. It is essential that these developments include proper buffering between adjacent land uses. Office Transitional - The Office Transitional category is intended to allow for the redevelopment or transition of residential uses along major roadways to office professional uses. It also allows for new office development that is constructed in a manner consistent and in keeping with the surrounding residential uses. The physical character and design of proposed new structures should be compatible with existing establishments. This category includes small single occupant structures for doctors and or accountants, as well as larger offices with multiple tenants. Businesses that are allowed in this category may provide a product directly to customers on the premises as an accessory to the service, but do not, as a primary activity, involve the manufacture, storage, or distribution of products. These areas should provide employment opportunities in close proximity to residential areas while providing a transition between the more intense commercial areas and residential neighborhoods. Neighborhood Commercial - This category includes a limited range of retail and service activities to serve the everyday needs of local residents. Limitations should apply to both size and character of individual establishments. The basic character of this category is one that encourages and assures a compatible mixture of residential, office and retail types of land uses. Businesses in this land use
Jordan, Jones & Goulding, Inc Buford Subarea Land Use Report 16

category should be designed to encourage the development of neighborhood scale shopping that offers both goods and products, and the furnishing of selected services. General Commercial - This category includes standard retail and commercial service activities such as shopping centers, general retailers, specialty shops, grocery stores, drug stores, banks, restaurants, theatres, hotels, dry cleaners and entertainment facilities. These establishments should be located on appropriate transportation corridors to easily serve the public. Visual impacts of these developments should be minimized by requiring buffers, landscaping, and architectural controls. Activity Center - The Activity Center land use category includes commercial, entertainment, limited residential, and public/institutional land uses typically found in a central business district. The commercial business district (CBD) and urban village (UV) zoning classifications are considered appropriate for developments proposed within the Activity Center classification. Developments within the Activity Center classification may be encouraged to consider additional zoning classifications, based on future revisions to the Forsyth County Unified Development Code. The types of uses that are desirable in this area would be restaurants, specialty retail, governmental offices, low-intensity offices (e.g. accountant or real estate office) and appropriate parking. Uses should be complemented with walking, biking and transit opportunities to provide alternative modes of transportation. Also, any roadway improvements that are considered for this area should carefully consider the scale of the area. Residential uses shall be considered accessory and limited to townhouses or apartments mixed into the commercial establishments. Commercial uses must be developed or present first in comparable scale before residential uses can be permitted for construction. Corridor Commercial - The Corridor Commercial category is intended to focus on major transportation corridors, which presently contain a mix of agricultural, residential, commercial, and industrial land uses. Such corridors are unlikely to experience small scale, low or medium density residential development over the course of the planning period. Developments within the corridor commercial classification will focus on land uses of varying intensity that will allow for the appropriate transition between high-intensity development abutting the transportation corridor as well as provide for a continued decrease of intensity as the development moves away from the transportation corridor. The physical character and design of proposed developments should be compatible with surrounding uses. Inter-parcel connectivity and side street access should be encouraged to minimize curb cuts and improve traffic flow. Typical uses include standard retail and commercial service activities such as shopping centers, general retailers, specialty shops, grocery stores, drug stores, banks, restaurants, theatres, hotels, dry cleaners, entertainment facilities, multiple tenant offices, small single occupant structures, and entrances to residential subdivisions located outside the corridor commercial designation. The transitional nature of the category should be supported through the use of buffers, landscaping, and architectural controls to minimize the impacts on lower intensity land uses. Industrial - The primary purpose of this category is to provide for areas where light industrial uses can be located. These light industrial uses include light manufacturing, warehousing, wholesale/distribution and assembly. More intensive industrial uses that are characterized by noise, fumes, vibration and other forms of pollution that might be viewed as objectionable by surrounding
Jordan, Jones & Goulding, Inc Buford Subarea Land Use Report 17

uses are acceptable only on a case-by-case basis if well screened and buffered from other uses. Limited commercial uses are also allowed in industrial areas if they compliment existing industrial uses, such as cafeterias and day cares. Public / Institutional - Includes uses such as schools, colleges, hospitals, municipal community centers, churches, cemeteries, municipal buildings and post offices. Public Park - This category includes land dedicated to active and passive recreation uses. These areas are publicly owned and may include sports fields, recreation areas, greenways, and similar uses. Private Park - Privately owned land that is used for active and passive recreation. This may include subdivision amenities areas, golf courses and Army Corps of Engineers recreation areas. Conservation - This classification includes environmentally sensitive areas that are regulated at the local and state levels. Areas included in this category are the 35 ft. buffer along all county streams, a 100 ft. buffer along the Etowah River and land that is part of the 100-year floodplain of local waterways. This land has the potential to be used as public greenways or multi-purpose paths. Land classified as Conservation alerts government officials and property owners to the presence of environmental conditions that shall be factored into the rezoning and permitting process. Transportation / Communication / Utilities (TCU) - This category includes such uses as landfills, water treatment plants, wastewater treatment plants, power substations, rail yards, mass transit facilities, airports, etc. These uses may be either public or private.
Jordan, Jones & Goulding, Inc Buford Subarea Land Use Report 18

Figure 8 Buford/20 East Future Land Use, 2025
Land Use Acres PercentMedium Density Residential 4,039 45.7%Low Density Residential 946 10.7%Road Right-of Way (TCU) 742 8.4%General Commercial 568 6.4%Cumming 508 5.8%Private Park 507 5.7%High Density Residential 403 4.6%Activity Center (Commercial) 365 4.1%Public Park 260 2.9%Conservation (Lake Lanier US Corps land only) 302 3.4%Corridor Commercial 85 1.0%Public/Institutional 53 0.6%Office-Transitional 40 0.5%Neighborhood Commercial 9 0.1%Transportation/Communication/Utilities 6 0.1%Industrial 0 0.0%Total Land Acreage 8,833 100.0%
Jordan, Jones & Goulding, Inc Buford Subarea Land Use Report 19

Figure 9 Buford/GA 20 East 2025 Future Land Use Plan
Jordan, Jones & Goulding, Inc Buford Subarea Land Use Report 20

Appendix A. Buford/GA 20 East Subarea Advisory Committee Michael Ecols Steve Carter Chuck Perry Prescott Eaton
B. Meeting Dates Buford Hwy/20 Subarea Public Visioning Workshop – May 20th at 6:30 PM in the West Hall Cafeteria, South Forsyth High School Buford Subarea Advisory Committee Meeting - July 24th at 6:00 PM in the Deer Creek Shores Presbyterian Church Fellowship Hall.
Jordan, Jones & Goulding, Inc Buford Subarea Land Use Report 21

Forsyth County Comprehensive Plan
Lake Lanier Subarea Land Use Report
September 25, 2003

Table of Contents I. Introduction ................................................................................................................. 1
A) Purpose............................................................................................................ 1 B) Scope............................................................................................................... 1 C) Location ........................................................................................................... 1
II. Inventory of Existing Conditions ................................................................................. 3
A) Description of Existing Land Uses ................................................................... 3 B) Environmentally Sensitive Areas...................................................................... 3
1. Historic Resources................................................................................ 3 2. Water Resources .................................................................................. 5 3. Steep Slope .......................................................................................... 5 4. Conservation & Park Lands .................................................................. 5
C) Historic Development Patterns ........................................................................ 7 1. Demographics....................................................................................... 7 2. Development Activity ............................................................................ 8
D) Future Development Trends ............................................................................ 9 1. Future Infrastructure ............................................................................. 9 2. Transitional Areas................................................................................. 9 3. Current Land Use Policies .................................................................. 10
E) Trend Scenario .............................................................................................. 12 1. Methodology ....................................................................................... 12 2. Trend Scenario Map ........................................................................... 12
III. Subarea Committee Recommendations.................................................................. 14
A) Lake Lanier Subarea Vision ........................................................................... 14 B) Policy Recommendations............................................................................... 14 C) Lake Lanier Land Use Plan Map (Updated December 9, 2003) .................... 15
Appendix ....................................................................................................................... 20
Jordan, Jones & Goulding, Inc. Lake Lanier Subarea Land Use Report i

I. Introduction A) Purpose In preparing the 2003 Update to the Forsyth County Comprehensive Plan, the County initiated an ambitious public involvement process. In order to better analyze the County’s needs and elicit a higher degree of community participation, the county was divided into ten planning subareas (Figure 1) with individual committees established to develop specific land use policies and a future land use map for their subarea. The subarea boundaries were determined by a variety of factors including: physical barriers, historical communities, economics and transportation corridors. This information was gathered to help enable the community tthey got there and where they want to go in the future. Includefrom the land use inventory and assessment for the Lake Lanierecommendations of the Lake Lanier Subarea Advisory Commcommittee and the meeting dates can be found in the Appendi B) Scope The following report provides a current “snapshot” of the Lakof existing land uses in the subarea is provided, along with an etable. This is followed by an inventory of environmentally sensinformation allow the community to identify those sections of developed in the future, as well as those areas that should be pr Following this inventory, there is an examination of the historiLanier subarea. This includes a discussion of demographic cha2000, as well as an estimate of land consumption during the lasthe historical factors that have led to the current development p An examination of future development trends is also provided.future sewer and transportation infrastructure needs, as well asthat could potentially be redeveloped. Forsyth County’s land uto determine what is allowed to develop under the current reguthe subarea vision and policy recommendations developed by tCommittee, and a copy of the future land use map for the suba C) Location The Lake Lanier subarea is located in the eastern part of Forsytinclude the Chestatee subarea to the north, Lake Lanier to the and the Cumming and Coal Mountain subareas to the west. .
Jordan, Jones & Goulding, Inc. 1
Lake Lanier
o look at where they are today, how d in this document are the findings r subarea, as well as the ittee. The membership of the x.
e Lanier subarea. First, a description xisting land use map and summary itive areas. These two sets of
the subarea that could potentially be otected from development pressures.
c development patterns in the Lake nges in the subarea between 1990 and t decade. There is also a summary of atterns.
This includes an assessment of the the identification of transitional areas se polices are also examined in order lations. Finally, this report includes he Lake Lanier Subarea Advisory rea.
h County. The general boundaries east, the Buford subarea to the south
Lake Lanier Subarea Land Use Report

Figure 1 Forsyth County Subarea Locations
J
ordan, Jones & Goulding, Inc. Lake Lanier Subarea Land Use Report 2
II. Inventory of Existing Conditions A) Description of Existing Land Uses A comprehensive land use survey was conducted for Forsyth County in the summer of 2002 using tax parcel maps, aerial photographs and field review. In April 2003, JJG conducted a field review and a review of aerial photographs to verify the land uses in the Lake Lanier subarea. These land uses are shown on Figure 2 on the following page and summarized in Figure 3 below.
Residential Parks/RecreaUndevelopedAgriculture Road Right-oCommercial Institutional/PIndustrial Lake Lanier Total Sq. Mile
As indicated in the tawhich makes up 41pconservation land acthe park acreage arou20 percent of the sub The remaining land uagriculture, commercGenerally, the commsubarea. Industrial la B) Environmen 1. Historic ResIn the mid-1990s a hResources Survey Rethree of these historiat least 15 of these si
Jordan, Jones & Goulding,
Figure 3: Lake Lanier Existing Land Use, 2003 Land Use Acres Percent
6,009.54 41.08%tion/Conservation 3,618.33 24.74% 2,942.59 20.12%
930.71 6.36%f-way 854.19 5.84%
178.80 1.22%ublic 82.78 0.57%
9.77 0.07%Total 14,627.72 100.00%s for Sub Area 22.9 --
ble above, the largest land use category in the Lake Lanier subarea is residential, ercent of the subarea. The second largest category is parks/ recreation/ counting for 24 percent of the total area. This land use category includes all of nd the lake. The third largest category is undeveloped land, which makes up area. Undeveloped land is scattered throughout the area.
ses make up just over 14 percent of the total area. These uses include ial, public/institutional, industrial and transportation/communication/utilities. ercial uses are concentrated along SR 369, especially in the eastern part of the nd use is limited to a few small parcels.
tally Sensitive Areas
ources istoric resources inventory was completed for Forsyth County. The Historic port identified 490 historic resources in unincorporated Forsyth County. Fifty-c sites are located in the Lake Lanier subarea. According to the Survey Report tes have potential for National Register listing.
Inc Lake Lanier Subarea Land Use Report 3

Jordan, Jones & Goulding, Inc. Lake Lanier Subarea Land Use Report 4
Figure 2 Lake Lanier Subarea Existing Land Use

2. Water Resources Lake Lanier, the primary reservoir for the Atlanta region, makes up the eastern boundary of the Lake Lanier subarea. In addition, there are a number of creeks and streams that drain into Lake Lanier. There are 2,469 acres of 100-year floodplains around the lake and its tributaries. Development on these floodplains is regulated in this area by the Federal Emergency Management Agency, the Georgia Floodplain Management Program of DNR and by local ordinances. Of the 33,593 acres of groundwater recharge in Forsyth County, 1,520 acres are located in the Lake Lanier subarea. The recharge area is located in the northeast section of the subarea, along the border with the Coal Mountain subarea. Significant recharge areas have been mapped by the Georgia Department of Natural Resources at the state level. If a significant recharge area is identified, the local government must comply with the Official Code of Georgia Annotated 12-2-8. This Code outlines restrictions on locating landfills and hazardous waste facilities, above ground chemical or petroleum storage tanks, agricultural waste, impoundment sites, septic tank drain fields, slow rate land treatment, storm water infiltration basins and waste treatment basins.
Park on Lake Lanier
3. Steep Slopes There are 5,261 acres of steep slopes (15% grade or greater) in the Lake Lanier subarea. The majority of steep slopes are located around Lake Lanier and its tributaries. Since the majority of this area is dedicated to residential land uses, steep slopes are not a major deterrent to future land development. 4. Conservation & Park Lands There are no County parks in the subarea. However much of the lakefront is owned by the Army Corp of Engineers and has boat launches, picnic areas and campsites available for public use. The locations of the natural and cultural resources in the Lake Lanier subarea are shown on the map included as Figure 4.
Jordan, Jones & Goulding, Inc. Lake Lanier Subarea Land Use Report 5

Jordan, Jones & Goulding, Inc. Lake Lanier Subarea Land Use Report
Figure 4 Lake Lanier Natural and Cultural Resources
6

C) Historic Development Patterns 1. Demographics Development around Lake Lanier began nearly 50 years ago with mainly vacation and cottage homes. Over the past two decades, there has been a high amount of residential growth near the lake for year round residents. With the job opportunities located further south in the County, this area is highly desirable and easily accessible via GA 400. As indicated by the land use statistics, there has been very little non-residential development in the Lake Lanier subarea. In 2000, the Census recorded 11,251 residents in the Lake Lanier subarea. This is an increase of 85 percent since 1990. While this increase is large, the area did not grow as fast as many other areas in Forsyth County. The population density for the Lake Lanier area is about average for the County with 292 people per square mile. The highest population density is in the South Forsyth subarea, with 373 people per square mile. The Lake Lanier subarea is 96 percent white, but did add almost 500 minority residents during the 1990s. The majority of new minority residents are Hispanic or Latino. In 1990, the subarea had only 50 Hispanic or Latino residents. By 2000, this number had grown to 486, or 4 percent of the total population. The age distribution figures indicate the majority of residents in this area are 30-64 years of age. However, the fastest growing age category is young children under 5. Also, the number of residents 40-49 years of age has more than doubled since 1990, totaling 18 percent in 2000. Figure 5 provides a comparison of the demographic statistics for the area for 1990 and 2000. The number of housing units in the Lake Lanier subarea increased significantly during the 1990s. In 1990, there were 3,106 housing units and by 2000 the number of units increased to 4,952, a 59 percent increase. During the 1990s the vacancy rate declined 13 percent, dropping from 13 to 23 percent. The housing units in this area are mostly owner-occupied. The percent of owner-occupied units increased from 65 percent in 1990 to 75 percent in 2000.
Jordan, Jones & Goulding, Inc. Lake Lanier Subarea Land Use Report 7

Figure 5
Lake Lanier Subarea Demographics 1990 – 2000
1990 2000 Percent ChangeTotal Population 6,079 11,251 85.1%
Racial Distribution White 6,057 10,852 79.2% Black or African-American 0 32 N/A Asian 11 30 184.4% Hispanic or Latino of any race 50 486 877.2%
Age Distribution Under 5 396 840 112.4% 5 to 17 974 1,868 91.8% 18 to 21 286 388 35.8% 22 to 29 722 1,078 49.3% 30 to 39 1,160 2,111 82.0% 40 to 49 931 1,969 111.5% 50 to 64 1,018 1,965 93.0% 65 and over 642 1,032 60.8%
Housing Total Units 3,106 4,952 59.4% Occupied 2,395 4,335 81.0% Vacancy Rate 22.3% 12.4% -9.9% Owner Occupied 2,034 3,716 82.7% Renter Occupied 361 619 71.6% * Note: The racial and cultural distribution numbers total to a sum larger than the total population. Hispanic is a cultural descriptor and is not exclusive of race. In other words, many who consider themselves Hispanic also consider themselves White.
2. Development Activity The large majority of land consumption that has occurred in the Lake Lanier subarea is from residential development. Even with the large increase in developed acres, it is estimated there are still over 6,600 acres that could be developed in the Lake Lanier subarea. One of the tools the JJG team used to evaluate development activity in the County is the occurrence of Developments of Regional Impact (DRIs) since 1990. A DRI review is required by law to be completed for large-scale developments that are likely to have impacts outside of the jurisdiction(s) where they are located. The Georgia Planning Act of 1989 authorized the Department of Community Affairs (DCA) to establish procedures for intergovernmental review of these large-scale projects. More than 40 DRI reviews have been completed in Forsyth County since 1990, but none within the Lake Lanier subarea.
Jordan, Jones & Goulding, Inc. Lake Lanier Subarea Land Use Report 8

D) Future Development Trends 1. Future Infrastructure One of the primary drivers of development is the provision for public infrastructure, particularly sewer and roads. The availability of sewer allows for higher density land uses such as apartments or small-lot subdivisions (less than one-half acre lots). Roads are also primary drivers of change because they provide access to desired destinations, such as jobs and shopping. Better access leads to a higher land value and a greater likelihood of more intense uses. The only planned transportation improvement for the Lake Lanier subarea is the widening of SR 369. In 2005, SR 369 will be widened to four lanes from Keith Bridge Road to Circle Shores Road. By 2010, SR 369 will be widened to four lanes from Circle Shores Road east to the Hall County line. The majority of land within the subarea is not served by public sewer. However, the property located immediately east of GA 400 falls within the City of Cumming’s service area and does have access to sewer. The County’s Sewer System Master Plan shows that a new water treatment facility will be constructed east of SR 306, near its intersection with SR 369. Construction of this new plant and the extension of sewer lines into the Lake Lanier subarea are likely long-term projects for the County. 2. Transitional Areas There are still large tracts of available land for development in the Lake Lanier subarea, so the likelihood of redevelopment is small. Generally, it is more expensive to tear down or renovate existing structures compared to constructing new, so as long as land is available with the same locational benefits as existing structures, new construction is likely to locate on vacant land. The one major exception to this in the Lake Lanier subarea is the aging residential structures along Lake Lanier. There are several small older homes close to the lake that are likely to be redeveloped in the future. The value of lake front property has been rising steadily over the past ten years, as new residents have been moving into the County. Consequently, it is not unusual to find older manufactured homes located next to a newly constructed high-end, single-family home near the lake. It can be expected that over time, most of these older manufactured and small vacation houses will be replaced with new construction. As this transformation takes place, these smaller non-conforming lots will have to be brought up to existing County standards.
Jordan, Jones & Goulding, Inc. Lake Lanier Subarea Land Use Report 9

3. Land Use Policies The 2015 Future Land Use map for the Lake Lanier subarea identifies 87 percent of the area to be developed as large-lot single-family houses, 12 percent to be conserved as parkland and open space and only 1 percent to be developed as commercial space. Current land use policy was analyzed by examining the primary tools of land use including the Unified Development Code and the Land Use Element of the Comprehensive Plan. The JJG team also examined the current zoning and 2015 Future Land Use maps to determine any implications that might arise from those elements. A difference exists between the way land is currently zoned in Forsyth County and the 2015 Future Land Use map. In order to achieve the future land uses that are envisioned in the Comprehensive Plan, large amounts of land would have to be re-zoned. Rezonings would have to occur not only within land use categories, but significant amounts of land would have to be rezoned into entirely different categories. Figure 6 on the following page shows the amount of land that would have to be rezoned to provide consistency with the 2015 Future Land Use map. For example, Figure 6 shows that 17 percent of the land is zoned for agricultural use, but 16 percent of this land would need to be rezoned for single-family residential use to be consistent with the 2015 Future Land Use Map. It is important to note that single-family residences are permitted on land zoned agricultural, but this use is different from the intended purpose of the agricultural district. The chart included as Figure 6 shows the amount of land within the Lake Lanier subarea that is intended for conversion from a current zoning category (rows), to a future land use category (columns). Individual cells of the table are currently zoned within a particular category (shown by the row) and intended for a particular future land use category (shown by the column). Percentages within each cell indicate the percentage of total land area that is categorized by a particular zoning category/future land use category combination. The colored areas of the chart indicate land that is currently intended for a future land use that is different from the way the land is currently zoned. At the present time, approximately 68% of the Lake Lanier subarea is intended to perform the same use as it is currently allowed by zoning (shown by the white areas). The colored areas of the chart indicate land that is currently intended for a future land use that is different from the way the land is currently zoned. To achieve the land uses shown in the current future land use map, 31% of the land will require rezonings. Areas shown in red represent required “downzonings” – zoning changes that are traditionally difficult to perform because they further restrict the use of the land. This comprises approximately 13% of the subarea. Areas shown in green represent required “upzonings” – zoning changes that are traditionally easier to perform because they generally increase the allowable uses of the land. This comprises approximately 18% of the subarea. Approximately 17% of the Lake Lanier subarea is intended to be moved away from agricultural zoning, to a mixture of residential (16%), and other uses (1%). Although the current land use regulations allow single-family residences on land zoned agricultural, this represents a significant conversion of the land’s purpose.
Jordan, Jones & Goulding, Inc. Lake Lanier Subarea Land Use Report 10

Jordan, Jones & Goulding, Inc. Lake Lanier Subarea Land Use Report
Figure 6 Lake Lanier Rezonings to Match Future Land Use Plan
Future Land Use Category
12% 87% 1%
nservation and
Park Single Family Residential Commercial
17% Agriculture <1% 16% <1%
80% Single-Family Residential 11% 68% <1%
0% Multi-Family Residential <1%
0% Industrial <1%
Cur
rent
Zon
ing
Cat
egor
y
3% Commercial <1% 2% <1%
Indicates that a rezoning is not required to be consistent with the Future Land Use Plan
Indicates potentially difficult rezoning
Indicates rezoning that might be moderately difficult
Indicates potentially easy rezoning
Co
11

E) Trend Scenario 1. Methodology As part of the JJG team’s examination of current land use policies and their potential impacts, an analysis of current development trends for the Lake Lanier subarea was performed. It was based upon the existing Future Land Use map, rezoning history, and real estate market preferences. This analysis had no specific time horizon. It is intended to gain an understanding of the ultimate impact of future development, if such development follows existing trends and is guided by existing land use policy. In order to accomplish this analysis, the JJG team made several assumptions including:
Areas that are designated as having future land uses that are more intensive than their existing land uses will be redeveloped; Future development within broad land use categories (for example, “Commercial”) will consist of a mix of uses and intensities that mirrors the county-wide proportions of land that is currently zoned within that category; Future development restrictions (for example, minimum lot sizes, maximum floor-area-ratios) will be based upon those that are currently expressed in the Unified Development Code; “Density shifting” to accommodate land lying within flood plains will continue to be permitted. In other words, parcels that contain part of their land within flood plains will be allowed to develop at the maximum density permitted, based on the area of the entire parcel, not just the part that is outside the flood plain; Moderately sloping land (>15% but less than 30%) that is designated residential, will eventually be developed; and Sewer and water services will be extended to all areas that require them.
2. Trend Scenario Map A Trend Scenario map was created in order to illustrate this future land use scenario and it is included on the following page as Figure 7. The future that this map indicates is not a given, but a likely scenario of how the area will develop over the next 20 years. It shows that existing residential developments will continue to spread out and occupy most of the land in the subarea. Commercial growth is anticipated to continue along Browns Bridge Road/SR 369, Keiths Bridge Road/SR 306 and at the intersection of Freedom Parkway and Pilgrim Mill Road. The implications of this trend scenario include increased demands on public infrastructure, such as schools, water, sewer, roads, police and fire protection. It also indicates that the dramatic changes that the area has experienced over the past ten years are only the beginning of additional changes for the area if current trends continue. The question that this planning exercise poses is one that the citizens of the Lake Lanier area have to answer, and that is “Is this the future that we envision for our community?”
Jordan, Jones & Goulding, Inc. Lake Lanier Subarea Land Use Report 12

Jordan, Jones & Goulding, Inc.
Lake Lan
Figure 7 ier Trend ScenarioLake Lanier Subarea Land Use Report
13

III. Subarea Committee Recommendations There were two meetings held from May to July 2003 to discuss the development of a land use plan for the Lake Lanier subarea. A list of the meeting dates can be found in the Appendix. At the first meeting the inventory of existing conditions for the subarea was presented, and the participants were asked to help craft a vision for the subarea. At the second meeting, a draft land use plan map was presented along with the draft vision and participants were asked to fill out comments cards, which were presented to the subarea committee for discussion and review. The result of this meeting was a revised land use plan map and a list of policy recommendations that the subcommittee would like to present to the Countywide Land Use Steering Committee for possible inclusion in the county’s Comprehensive Plan. The results of these meetings are presented below. A) Lake Lanier Subarea Vision
• Lake Lanier will continue to be a valuable asset that provides recreational opportunities for local residents and visitors.
• The Lake Lanier subarea will primarily have a rural and large lot residential character. • Commercial development will be limited in the subarea. Nodal commercial development
will be concentrated in designated areas along the SR 369 corridor. • The GA 400 corridor will continue to be an asset for residents of this subarea, providing a
connection to jobs and commercial areas. • Appropriate design standards will be adopted to promote quality development throughout
the subarea. • A network of greenways will run throughout the subarea with passive parks and connected
trails, in particular connecting U.S. Army Corps of Engineers Land.
B) Policy Recommendations • Continue to educate the public on planning issues through continuation of the Subarea
Subcommittees and Steering Committee. • Reconsider the Future Land Use Plan on a regular basis. • County needs additional staff for enforcement of erosion control and other development
standards. • The County needs to prepare a Greenway Master Plan that includes connected greenways
throughout the County. Existing natural features such as stream banks and groundwater recharge areas could be utilized.
• Consider establishing performance standards and enforcement criteria to protect areas around Lake Lanier.
• Need more land in public parks. • Current Tree Ordinance needs to be strengthened, with a focus on preserving existing trees
and requiring more trees in parking lots. • Prepare a Feasibility Study on Transfer of Development Rights (TDRs) countywide, in order
to preserve open space. • Install sidewalks, bike paths and trees along roads as they are improved.
Jordan, Jones & Goulding, Inc Lake Lanier Subarea Land Use Report 14

• Stormwater issues need to be addressed as they relate to water quality. • Establish architectural and design standards with citizen based design commission to review
plans. • Look at the feasibility of offering tax or impact fee incentives for reducing density.
C) Lake Lanier Land Use Plan Map The future land use plan is an extension of the goals and values of the community and a culmination of the subarea planning effort. This future land use map is intended to depict a 2025 future land use scenario. The acreages and percentages of each land use are compiled in Figure 8 and a map showing the location of future land uses is included in Figure 9. There are fourteen land use designations depicted on the future land use map, including three residential designations and six commercial/industrial/mixed-use designations. Below is brief definition of each. Low Density Residential - This category is intended for single-family detached residential dwellings typically on septic sewer systems. Minimum lot size is 30,000 square feet, or the overall density is up to 1.5 units per acre. Institutional uses that are considered complimentary in this area include churches, schools, and libraries. Medium Density Residential - Consists of single-family detached residential dwellings typically on sewer, with overall densities from 1.5 to 2.5 units per acre. Institutional uses that are considered complimentary in this area include churches, schools, and libraries. Private recreational uses, such as golf courses, tennis courts, walking trails and swimming pools are encouraged in these areas in developments greater than 50 lots. High Density Residential - Typical uses include single-family detached and attached dwellings (such as townhouses) as well as multifamily condominiums and apartments, at densities of up to 6 units per acre. These developments should incorporate some amount of central outdoor public space for their residents. A limited number of churches, schools, libraries, other miscellaneous institutional uses and daycare facilities would be complimentary in these areas. An urban-density residential area is usually located near areas of high employment concentration, large commercial nodes, transportation nodes and mixed-use developments. It is essential that these developments include proper buffering between adjacent land uses. Office Transitional - The Office Transitional category is intended to allow for the redevelopment or transition of residential uses along major roadways to office professional uses. It also allows for new office development that is constructed in a manner consistent and in keeping with the surrounding residential uses. The physical character and design of proposed new structures should be compatible with existing establishments. This category includes small single occupant structures for doctors and or accountants, as well as larger offices with multiple tenants. Businesses that are allowed in this category may provide a product directly to customers on the premises as an accessory to the service, but do not, as a primary activity, involve the manufacture, storage, or distribution of products. These areas should provide employment opportunities in close proximity to residential areas while providing a transition between the more intense commercial areas and residential neighborhoods.
Jordan, Jones & Goulding, Inc Lake Lanier Subarea Land Use Report 15

Neighborhood Commercial - This category includes a limited range of retail and service activities to serve the everyday needs of local residents. Limitations should apply to both size and character of individual establishments. The basic character of this category is one that encourages and assures a compatible mixture of residential, office and retail types of land uses. Businesses in this land use category should be designed to encourage the development of neighborhood scale shopping that offers both goods and products, and the furnishing of selected services. General Commercial - This category includes standard retail and commercial service activities such as shopping centers, general retailers, specialty shops, grocery stores, drug stores, banks, restaurants, theatres, hotels, dry cleaners and entertainment facilities. These establishments should be located on appropriate transportation corridors to easily serve the public. Visual impacts of these developments should be minimized by requiring buffers, landscaping, and architectural controls. Activity Center - The Activity Center land use category includes commercial, entertainment, limited residential, and public/institutional land uses typically found in a central business district. The commercial business district (CBD) and urban village (UV) zoning classifications are considered appropriate for developments proposed within the Activity Center classification. Developments within the Activity Center classification may be encouraged to consider additional zoning classifications, based on future revisions to the Forsyth County Unified Development Code. The types of uses that are desirable in this area would be restaurants, specialty retail, governmental offices, low-intensity offices (e.g. accountant or real estate office) and appropriate parking. Uses should be complemented with walking, biking and transit opportunities to provide alternative modes of transportation. Also, any roadway improvements that are considered for this area should carefully consider the scale of the area. Residential uses shall be considered accessory and limited to townhouses or apartments mixed into the commercial establishments. Commercial uses must be developed or present first in comparable scale before residential uses can be permitted for construction. Corridor Commercial - The Corridor Commercial category is intended to focus on major transportation corridors, which presently contain a mix of agricultural, residential, commercial, and industrial land uses. Such corridors are unlikely to experience small scale, low or medium density residential development over the course of the planning period. Developments within the corridor commercial classification will focus on land uses of varying intensity that will allow for the appropriate transition between high-intensity development abutting the transportation corridor as well as provide for a continued decrease of intensity as the development moves away from the transportation corridor. The physical character and design of proposed developments should be compatible with surrounding uses. Inter-parcel connectivity and side street access should be encouraged to minimize curb cuts and improve traffic flow. Typical uses include standard retail and commercial service activities such as shopping centers, general retailers, specialty shops, grocery stores, drug stores, banks, restaurants, theatres, hotels, dry cleaners, entertainment facilities, multiple tenant offices, small single occupant structures, and entrances to residential subdivisions located outside the corridor commercial designation. The transitional nature of the category should be supported through the use of buffers, landscaping, and architectural controls to minimize the impacts on lower intensity land uses.
Jordan, Jones & Goulding, Inc Lake Lanier Subarea Land Use Report 16

Industrial - The primary purpose of this category is to provide for areas where light industrial uses can be located. These light industrial uses include light manufacturing, warehousing, wholesale/distribution and assembly. More intensive industrial uses that are characterized by noise, fumes, vibration and other forms of pollution that might be viewed as objectionable by surrounding uses are acceptable only on a case-by-case basis if well screened and buffered from other uses. Limited commercial uses are also allowed in industrial areas if they compliment existing industrial uses, such as cafeterias and day cares. Public / Institutional - Includes uses such as schools, colleges, hospitals, municipal community centers, churches, cemeteries, municipal buildings and post offices. Public Park - This category includes land dedicated to active and passive recreation uses. These areas are publicly owned and may include sports fields, recreation areas, greenways, and similar uses. Private Park - Privately owned land that is used for active and passive recreation. This may include subdivision amenities areas, golf courses and Army Corps of Engineers recreation areas. Conservation - This classification includes environmentally sensitive areas that are regulated at the local and state levels. Areas included in this category are the 35 ft. buffer along all county streams, a 100 ft. buffer along the Etowah River and land that is part of the 100-year floodplain of local waterways. This land has the potential to be used as public greenways or multi-purpose paths. Land classified as Conservation alerts government officials and property owners to the presence of environmental conditions that shall be factored into the rezoning and permitting process. Transportation / Communication / Utilities (TCU) - This category includes such uses as water treatment plants, wastewater treatment plants, power substations, rail yards, mass transit facilities, airports, etc. These uses may be either public or private.
Jordan, Jones & Goulding, Inc Lake Lanier Subarea Land Use Report 17

Lake Lanier Land Use
Medium Density Residential Conservation (Lake Lanier US Coonly) Low Density Residential Private Park (PRC) Road Right-of Way (TCU) General Commercial Public/Institutional Neighborhood Commercial Industrial Corridor Commercial High Density Residential Office-Transitional Transportation/Communication/UtActivity Center (Commercial) Public Park (PRC) Lake Lanier Total
Jordan, Jones & Goulding, Inc
Figure 8 Future Land Use, 2025
Acres Percent 7,799 53.4%
rps land 2,669 18.3%1,850 12.7%
926 6.3%887 6.1%251 1.7%109 0.7%75 0.5%25 0.2%
9 0.1%6 0.0%7 0.0%
ilities 1 0.0%0 0.0%0 0.0%
14,615 100.0%
Lake Lanier Subarea Land Use Report 18

Figure 9 Lake Lanier 2025 Future Land Use Plan
Jordan, Jones & Goulding, Inc Lake Lanier Subarea Land Use Report 19

Appendix A. Lake Lanier Subarea Advisory Committee Ronnie Pinson Gray Smith Chuck Jonaitis Lillian Zwald Jim Callison
B. Meeting Dates Lake Lanier Subarea Public Visioning Workshop – May 22nd at 6:30 PM in the Deer Creek Shores Presbyterian Church Lake Lanier Subarea Advisory Committee Meeting - July 24th at 6:00 PM in the Deer Creek Shores Presbyterian Church Fellowship Hall.
Jordan, Jones & Goulding, Inc Lake Lanier Subarea Land Use Report 20

Forsyth County Comprehensive Plan
Settingdown Subarea Land Use Report
September 25, 2003

Table of Contents I. Introduction ................................................................................................................. 1
A) Purpose............................................................................................................ 1 B) Scope............................................................................................................... 1 C) Location ........................................................................................................... 1
II. Inventory of Existing Conditions ................................................................................. 3
A) Description of Existing Land Uses ................................................................... 3 B) Environmentally Sensitive Areas...................................................................... 5
1. Historic Resources................................................................................ 5 2. Water Resources .................................................................................. 5 3. Steep Slope .......................................................................................... 5 4. Conservation & Park Lands .................................................................. 6
C) Historic Development Patterns ........................................................................ 6 1. Demographics....................................................................................... 6 2. Development Activity ............................................................................ 8
D) Future Development Trends ............................................................................ 9 1. Future Infrastructure ............................................................................. 9 2. Transitional Areas............................................................................... 10 3. Current Land Use Policies .................................................................. 10
E) Trend Scenario .............................................................................................. 12 1. Methodology ....................................................................................... 12 2. Trend Scenario Map ........................................................................... 12
III. Subarea Committee Recommendations.................................................................. 15
A) Settingdown Subarea Vision .......................................................................... 15 B) Policy Recommendations............................................................................... 15 C) Settingdown Land Use Plan Map (Updated December 9,2003) .................... 15
Appendix ....................................................................................................................... 20
Jordan, Jones & Goulding, Inc. Settingdown Subarea Land Use Report i

I. Introduction A) Purpose In preparing the 2003 Update to the Forsyth County Comprehensive Plan, the County initiated an ambitious public involvement process. In order to better analyze the County’s needs and elicit a higher degree of community participation, the county was divided into ten planning subareas (Figure 1) with individual committees established to develop specific land use policies and a future land use map for their subarea. The subarea boundaries were determined by a variety of factors including: physical barriers, historical communities, economics and transportation corridors. Farmland in the Settingdown area This information was gathered to help enable the community to look at where they are today, how they got there and where they want to go in the future. Included in this document are the findings from the land use inventory and assessment for the Settingdown subarea, as well as the recommendations of the Settingdown Subarea Advisory Committee. The membership of the committee and the meeting dates can be found in the Appendix. B) Scope The following report provides a current “snapshot” of the Settingdown subarea. First, a description of existing land uses in the subarea is provided, along with an existing land use map and summary table. This is followed by an inventory of environmentally sensitive areas. These two sets of information allow the community to identify those sections of the subarea that could potentially be developed in the future, as well as those areas that should be protected from development pressures. Following this inventory, there is an examination of the historic development patterns in the Settingdown subarea. This includes a discussion of demographic changes in the subarea between 1990 and 2000, as well as an estimate of land consumption during the last decade. There is also a summary of the historical factors that have led to the current development patterns. An examination of future development trends is also provided. This includes an assessment of the future sewer and transportation infrastructure needs, as well as the identification of transitional areas that could potentially be redeveloped. Forsyth County’s land use polices are also examined in order to determine what is allowed to develop under the current regulations. Finally, this report includes the subarea vision and policy recommendations developed by the Settingdown Subarea Advisory Committee, and a copy of the future land use map for the subarea. C) Location The Settingdown subarea is located near the northwest corner of Forsyth County. Highway 9 cuts through the eastern side of the subarea, running north/south. The general boundaries include Cherokee County to the west, Settingdown creek to the north, and the Cumming and Big Creek subareas to the south.
Jordan, Jones & Goulding, Inc. Settingdown Subarea Land Use Report 1

Figure 1 Forsyth County Subarea Locations
Jordan, Jones & Goulding, Inc. Settingdown Subarea Land Use Report 2

II. Inventory of Existing Conditions A) Description of Existing Land Uses A comprehensive land use survey was conducted for Forsyth County in the Summer of 2002 using tax parcel maps, aerial photographs and field review. In April 2003, JJG conducted a field review and a review of aerial photographs to verify the land uses in the Settingdown subarea. These land uses are shown on Figure 2 on the following page and summarized in Figure 3 below.
As indicated in thresidential land, csubarea, with lessside. Commerciain the eastern quall land uses in thpart, is surroundeof all land uses inthe eastern portio
Residential UndevelopedAgriculture Road Right-oParks/RecreInstitutional/PCommercial Industrial SettingdowTotal Sq. Mil
Jordan, Jones & Gould
Figure 3: Settingdown Existing Land Use, 2003 Land Use Acres Percent
6,555.54 42.72% 4,177.84 27.23%
3,023.85 19.71%f-way 642.78 4.19%
ation/Conservation 579.47 3.78%ublic 239.91 1.56%
83.13 0.54%41.07 0.27%
n Total 15,343.59 100.00%es for Sub Area 24.0 --
e table above, the largest land use category in the Settingdown subarea is omprising 43 percent of the subarea. Residential land is scattered throughout the er concentrations in the eastern portion and greater concentrations on the western l land uses are few and far between and are mostly concentrated along Highway 9
arter of the subarea. In total, commercial land uses comprise less than 1 percent of e subarea. The majority of agriculture in the area is spread out, and for the most d by residential development. While undeveloped lands account for over a quarter the Settingdown subarea, much of this land is located along Sawnee Mountain in n of the subarea.
ing, Inc. Settingdown Subarea Land Use Report 3

Jordan, Jones & Goulding, Inc. Settingdown Subarea Land Use Report
Figure 2 Settingdown Subarea Existing Land Use
4

B) Environmentally Sensitive Areas 1. Historic Resources In the mid-1990s a historic resources inventory was completed for Forsyth County. The Historic Resources Survey Report identified 490 historic resources in unincorporated Forsyth County. Sixty-six (66) of these historic sites were located in the Settingdown subarea. One of these sites, the Settingdown Creek Covered Bridge on Pool’s Mill Road was listed in the National Register of Historic Places in 1975. This covered bridge is considered a historically significant transportation route witnessing its greatest importance in the first quarter of the 20th century. 2. Water Resources There are 943 acres of 100-year floodplains in the Settingdown subarea. Development is regulated in this area by the Federal Emergency Management Agency, the Georgia Floodplain Management Program of DNR and by local ordinances. Most of the floodplain associated with the Settingdown area is located along Settingdown Creek and its tributaries including Hurricane Creek, Thally Creek, Yellow Creek and Stark Creek. There are 3,133 acres of land associated with groundwater recharge areas in the Settingdown subareabeen mapped by the Georgia Department of Natural Rsignificant recharge area is identified, the local governmCode Georgia Annotated 12-2-8. This Code outlines rhazardous waste facilities, above ground chemical or pewaste, impoundment sites, septic tank drain fields, slowinfiltration basins, and waste treatment basins. There are two large groundwater recharge areas in the Snortheastern corner of the area west of Highway 9. Lacommercial, residential and public, thus posing little thsecond area is in the central portion of the subarea norrecharge area has a significant amount of agricultural laexcessive fertilizers are used, may pose groundwater cothat Forsyth gets most of its drinking water from Lake small portion of the constituency that depends on well 3. Steep Slopes There are 3,075 acres of steep slopes (15% grade or greThis amounts to approximately 20 percent of the total these steep slopes are located in the eastern portion of and in the western portion of the county along Hurrica
Jordan, Jones & Goulding, Inc. 5
Settingdown Creek
. Significant recharge areas have esources at the state level. If a ent must comply with the Official
estrictions on locating landfills and troleum storage tanks, agricultural rate land treatment, storm water
ettingdown subarea. One is in the nd uses in this area are mostly reat to the health of the aquifer. The th and south of Watson Road. This nd within it, and if pesticides or ntamination threats. Due to the fact Lanier, this poses threats only to the s for drinking water.
ater) in the Settingdown subarea. land area in the subarea. Most of the subarea along Sawnee Mountain, ne Creek. Where slopes are greater
Settingdown Subarea Land Use Report

than 15 percent, greater care must be taken to control erosion and sedimentation and developing the land is more expensive and often cost prohibitive. 4. Conservation & Park Lands There are several parks within the Settingdown subarea, but none as large as the Sawnee Mountain Preserve. The preserve is currently about 725 acres. Another park in the subarea with a similar name is the Sawnee Mountain Park. This facility covers 44 acres and is dedicated to active recreational needs including nine baseball and softball fields, four tennis courts, one football field, one soccer field, outdoor basketball courts, a picnic pavilion, playground and walking trail. Sawnee Mountain Park is located on Watson Road. Other parks in the area include Ducktown Ballfields and Friendship Park.
View From Sawnee Mountain
The locations of the natural and cultural resources in the Settingdown subarea are shown on the map included as Figure 4. C) Historic Development Patterns 1. Demographics In 2000, the population of the Settingdown subarea totaled 8,647. This is an increase of 66.8% percent since 1990. This is considerably slower than the growth rate for Forsyth County, which was 123.2 percent during the 1990’s (one of the fastest county growth rates in the country). The subarea is slightly less dense than the county as a whole, at 358 and 436 persons per square mile, respectively. Following countywide trends, the Settingdown subarea is mostly white at 96 percent. The age distribution figures indicate the majority of residents in this area are 30-39 years of age with children between the ages of 5 and 17 ranking second. The largest increase in age distribution has been for the groups 5 and under and 40 to 49 years of age. Figure 5 provides a comparison of the demographic statistics for the area for 1990 and 2000. The number of housing units in the Settingdown subarea increased moderately in comparison to other subareas during the 1990s. In 1990, there were 1,995 housing units and by 2000 the number of units increased to 3,103, a 55.5 percent increase. During the 1990s the vacancy rate was cut in half, dropping from 7.7 percent in 1990 to 3.4 percent in 2000. The housing units in this area are largely owner-occupied, with 85 percent being owner-occupied and 12 percent renter occupied units. The number of owner-occupied units increased by 72 percent during the 1990s compared to an increase of only 12 percent for renter-occupied housing.
Jordan, Jones & Goulding, Inc. Settingdown Subarea Land Use Report 6

Jordan, Jones & Goulding, Inc. Settingdown Subarea Land Use Report
Figure 4 Settingdown Natural and Cultural Resources
7

Figure 5 Settingdown Subarea Demographics
1990 – 2000
1990 2000 Percent Change
Population 5,185 8,647 66.8% Racial and Cultural Distribution* White 5,165 8,307 60.8% Black or African American 1 22 2875.8% Asian 9 34 284.6% Hispanic or Latino, regardless of race 33 378 1060.3% Age Distribution Under 5 405 775 91.6% 5 to 17 1,018 1,719 68.8% 18 to 21 293 339 15.7% 22 to 29 704 859 22.0% 30 to 39 968 1,782 84.1% 40 to 49 739 1,387 87.8% 50 to 64 654 1,189 81.8% 65 and over 437 597 36.5% Housing Housing Units 1,995 3,103 55.5% Occupied 1,840 2,998 62.9% Vacancy Rate 7.7% 3.4% 4.3% Owner Occupied 1,526 2,627 72.1% Renter Occupied 314 371 18.2% * Note: The racial and cultural distribution numbers total to a sum larger than the total population. Hispanic is a cultural descriptor and is not exclusive of race.
2. Development Activity It is estimated that since 1990 approximately one-eighth of the land (1,600 acres) in the Settingdown subarea has been developed. Almost all of this development has been for residential uses. Nearly half of the subarea is either undeveloped or used for agriculture, so the potential for future growth in the subarea is large. One of the tools the JJG team used to evaluate development activity in the County is the occurrence of Developments of Regional Impact (DRIs) since 1990. A DRI review is required by law to be completed for large-scale developments that are likely to have impacts outside of the jurisdiction(s) where they are located. The Georgia Planning Act of 1989 authorized the Department of Community Affairs (DCA) to establish procedures for intergovernmental review of these large-scale projects. More than 40 DRI reviews have been completed in Forsyth County since 1990, but none of these developments are slated to occur in the Settingdown subarea.
Jordan, Jones & Goulding, Inc. Settingdown Subarea Land Use Report 8

D) Future Development Trends 1. Future Infrastructure One of the primary drivers of development is the provision for public infrastructure, particularly sewer and roads. The availability of sewer allows for more intensive land uses such small-lot subdivisions (less than one-half acre lots). Roads are also primary drivers of change because they provide access to desired destinations, such as jobs and shopping. Better access leads to a higher land value and a greater likelihood of more intense uses. The 2002 Update of the County’s Major Transportation Plan indicates there is only one transportation improvement planned for the Settingdown subarea by 2005. Highway 9 is slated to be upgraded from two to four lanes along the southern most section of the road. By 2010, the northern section of Highway 9 will be also be expanded to four lanes while a new four lane road will extend Keith’s Bridge Road to Highway 9. By 2020, Doctor Bramblett Road is expected to be upgraded to a two-lane road with new left turn lanes. Except for some areas close to the Hwy 9, sewer is not currently available in the subarea. Most of the eastern half of the subarea lies within the Cumming service area and would be served by City service if it were available. The western half falls within county sewer service area, yet no service is currently offered in that portion of the subarea. The County’s Sewer System Master Plan shows future sewer service extended throughout much of the western portions of the subarea. These improvements are likely long-term, so the impact of their construction on land use patterns is not immediate. Growth pressures in the Settingdown subarea are expected to remain less significant than that of the southern portion of the county. As the Atlanta metro area, and particularly the Alpharetta and Windward areas continue to grow, there will be significant growth pressures continuing in the southern portions of the county. As the southern subareas begin to be built out, there will certainly be increased pressures on northern subareas to accommodate additional growth. However, the substantial amounts of steep slopes and floodplains will serve to limit future nonresidential development.
Jordan, Jones & Goulding, Inc. Settingdown Subarea Land Use Report 9

2. Transitional Areas There are still large tracts of available land for development in the Settingdown subarea, so the likelihood of redevelopment is small. Generally, it is more expensive to tear down or renovate existing structures compared to constructing new, so as long as land is available with the same locational benefits as existing structures, new construction is likely to locate on vacant land. 3. Land Use Policies The 2015 Future Land Use map for the Settingdown subarea identifies over 77 percent of the area to be developed as large-lot single-family houses, one percent to be developed as multi-family and commercial uses, and 21 percent to be conserved as parkland and open space. Current land use policy was analyzed by examining the primary tools of land use including the Unified Development Code and the Land Use Element of the Comprehensive Plan. The JJG team also examined the current zoning and 2015 Future Land Use maps to determine any implications that might arise from those elements. A difference exists between the way land is currently zoned in Forsyth County and the 2015 Future Land Use map. In order to achieve the future land uses that are envisioned in the Comprehensive Plan, some of the land would have to be re-zoned. Rezonings would have to occur not only within land use categories, but also some amounts of land would have to be rezoned into entirely different categories. Figure 6 on the following page shows the amount of land that would have to be rezoned to provide consistency with the 2015 Future Land Use map. The chart included as Figure 6 shows the amount of land within the Settingdown subarea that is intended for conversion from a current zoning category (rows), to a future land use category (columns). Individual cells of the table are currently zoned within a particular category (shown by the row) and intended for a particular future land use category (shown by the column). Percentages within each cell indicate the percentage of total land area that is categorized by a particular zoning category/future land use category combination. The colored areas of the chart indicate land that is currently intended for a future land use that is different from the way the land is currently zoned. At the present time, approximately 37% of the Settingdown subarea is intended to perform the same use as it is currently allowed by zoning (shown by the white areas). To achieve the land uses shown in the current 2015 Future Land Use map, 63% of the land will require significant rezonings. Areas shown in red represent required “downzonings” – zoning changes that are traditionally difficult to perform because they further restrict the use of the land. This comprises approximately 1% of the subarea. Areas shown in green represent required “upzonings” – zoning changes that are traditionally easier to perform because they generally increase the allowable uses of the land. This comprises approximately 78% of the subarea.
Jordan, Jones & Goulding, Inc. Settingdown Subarea Land Use Report 10

Figure 6 Settingdown Rezonings to Match the 2015Future Land Use Plan
Future Land Use Category
21% 77% 1% 1%
Conservation and
Park * Single Family Residential
Multi-family Residential Commercial
78% Agriculture 16% 60% 1% <1%
21% Single-Family Residential 4% 16% <1% <1%
<1% Multi-family Residential <1% <1%
<1% Industrial <1% <1% <1% <1%
Cur
rent
Zon
ing
Cat
egor
y
<1% Commercial <1% <1% <1% <1% * Note: Conservation and park land can be associated with any zoning category.
Indicates that a rezoning is not required to be consistent with the future Land Use Plan
Indicates potentially difficult rezoning
Indicates rezoning that might be moderately difficult
Indicates potentially easy rezoning
Jordan, Jones & Goulding, Inc Settingdown Subarea Land Use Report 11

Approximately 78% of the Settingdown subarea is currently intended to be moved away from agricultural zoning, to a mixture of residential (61%), and other uses (<1%). Sixteen percent of the land, currently zoned agricultural, is intended for conservation and/or park use (primarily flood plain). Although the current land use regulations allow single-family residences on land zoned agricultural, this represents a conversion of the land’s purpose. Over the next 10 to 20 years, the Settingdown area is likely to experience a rapid increase in population. Employment opportunities are likely to take the form of retail and service oriented businesses catering to the needs of future homeowners. The eventual form and density that this future development will take is strongly dependent on the provision of sewer and road improvements. There are no immediate plans now to extend sewer into the area, but the investment in new roads will increase property values and lead to further market interest in single-family residential development. E) Trend Scenario 1. Methodology As part of the JJG team’s examination of current land use policies and their potential impacts, an analysis of current development trends for the Settingdown subarea was performed. It was based upon the existing Future Land Use map, rezoning history, and real estate market preferences. This analysis had no specific time horizon. It is intended to gain an understanding of the ultimate impact of future development, if such development follows existing trends and is guided by existing land use policy. In order to accomplish this analysis, the JJG team made several assumptions including:
Areas that are designated as having future land uses that are more intensive than their existing land uses will be redeveloped; Future development within broad land use categories (for example, “Commercial”) will consist of a mix of uses and intensities that mirror the county-wide proportions of land that are currently zoned within that category; Future development restrictions (for example, minimum lot sizes, maximum floor-area-ratios) will be based upon those that are currently expressed in the Unified Development Code; “Density shifting” to accommodate land lying within flood plains will continue to be permitted. In other words, parcels that contain part of their land within flood plains will be allowed to develop at the maximum density permitted, based on the area of the entire parcel, not just the part that is outside the flood plain; Moderately sloping land (>15% but less than 30%) that is designated residential, will eventually be developed; and Sewer and water services will be extended to all areas that require them.
2. Trend Scenario Map A Trend Scenario map was created in order to illustrate this future land use scenario and it is included on the following page as Figure 7. The future that this map indicates is not a given, but a
Jordan, Jones & Goulding, Inc. Settingdown Subarea Land Use Report 12

likely scenario of how the area will develop over the next 20 years. It shows that existing residential developments will spread out and occupy most of the land in the subarea. The map also indicates additional commercial development along GA Hwy 9. The implications of this trend scenario include increased demands on public infrastructure, such as schools, water, sewer, roads, police, and fire protection. It also indicates that the dramatic changes that the area has experienced over the past 10 years are only the beginning of additional changes for the area if current trends continue. The question that this planning exercise poses is one that the citizens of the Settingdown area have to answer, and that is “Is this the future that we envision for our community?”
Jordan, Jones & Goulding, Inc. Settingdown Subarea Land Use Report 13

Jordan, Jones & Goulding, Inc.
Figure 7 Settingdown Trend Scenario
14
Settingdown Subarea Land Use Report
III. Subarea Committee Recommendations There were two meetings held from May to July 2003 to discuss the development of a land use plan for the Settingdown subarea. A list of the meeting dates can be found in the Appendix. At the first meeting the inventory of existing conditions for the subarea was presented, and the participants were asked to help craft a vision for the subarea. At the second meeting, a draft land use plan map was presented along with the draft vision and participants were asked to fill out comments cards, which were presented to the subarea committee for discussion and review. The result of this meeting was a revised land use plan map and a list of policy recommendations that the subcommittee would like to present to the Countywide Land Use Steering Committee for possible inclusion in the county’s Comprehensive Plan. The results of these meetings are presented below. A) Settingdown Subarea Vision
• Settingdown will primarily have a rural and large lot residential character. • The subarea will offer a variety of lot sizes, but design guidelines will help to preserve the
rural character. • The subarea’s valued natural and cultural resources will be preserved for future generations. • With the exception of Hwy 9, the subarea will not contain any large-scale commercial areas. • A nodal form of commercial development will develop along Hwy 9, not “strip
commercial.” • Limited commercial development will be provided within large planned developments. • A network of greenways will run throughout the subarea with passive parks and connected
trails. B) Policy Recommendations
• The County needs to prepare a Greenway Master Plan that includes connected greenways throughout the County. Existing natural features such as stream banks and groundwater recharge areas could be utilized.
• Need more land in public parks. • Provide incentives for open space preservation through density bonuses. • Provide large buffers around developments in environmentally sensitive areas such as
around the Sawnee Mountain Preserve.
C) Settingdown Land Use Plan Map The future land use plan is an extension of the goals and values of the community and a culmination of the subarea planning effort. This future land use map is intended to depict a 2025 future land use scenario. The acreages and percentages of each land use are compiled in Figure 8 and a map showing the location of future land uses is included in Figure 9.
Jordan, Jones & Goulding, Inc Settingdown Subarea Land Use Report t 15

There are fourteen land use designations depicted on the future land use map, including three residential designations and six commercial/industrial/mixed-use designations. Below is brief definition of each. Low Density Residential - This category is intended for single-family detached residential dwellings typically on septic sewer systems. Minimum lot size is 30,000 square feet, or the overall density is up to 1.5 units per acre. Institutional uses that are considered complimentary in this area include churches, schools, and libraries. Medium Density Residential - Consists of single-family detached residential dwellings typically on sewer, with overall densities from 1.5 to 2.5 units per acre. Institutional uses that are considered complimentary in this area include churches, schools, and libraries. Private recreational uses, such as golf courses, tennis courts, walking trails and swimming pools are encouraged in these areas in developments greater than 50 lots. High Density Residential - Typical uses include single-family detached and attached dwellings (such as townhouses) as well as multifamily condominiums and apartments, at densities of up to 6 units per acre. These developments should incorporate some amount of central outdoor public space for their residents. A limited number of churches, schools, libraries, other miscellaneous institutional uses and daycare facilities would be complimentary in these areas. An urban-density residential area is usually located near areas of high employment concentration, large commercial nodes, transportation nodes and mixed-use developments. It is essential that these developments include proper buffering between adjacent land uses. Office Transitional - The Office Transitional category is intended to allow for the redevelopment or transition of residential uses along major roadways to office professional uses. It also allows for new office development that is constructed in a manner consistent and in keeping with the surrounding residential uses. The physical character and design of proposed new structures should be compatible with existing establishments. This category includes small single occupant structures for doctors and or accountants, as well as larger offices with multiple tenants. Businesses that are allowed in this category may provide a product directly to customers on the premises as an accessory to the service, but do not, as a primary activity, involve the manufacture, storage, or distribution of products. These areas should provide employment opportunities in close proximity to residential areas while providing a transition between the more intense commercial areas and residential neighborhoods. Neighborhood Commercial - This category includes a limited range of retail and service activities to serve the everyday needs of local residents. Limitations should apply to both size and character of individual establishments. The basic character of this category is one that encourages and assures a compatible mixture of residential, office and retail types of land uses. Businesses in this land use category should be designed to encourage the development of neighborhood scale shopping that offers both goods and products, and the furnishing of selected services. General Commercial - This category includes standard retail and commercial service activities such as shopping centers, general retailers, specialty shops, grocery stores, drug stores, banks, restaurants, theatres, hotels, dry cleaners and entertainment facilities. These establishments should be located on
Jordan, Jones & Goulding, Inc Settingdown Subarea Land Use Report t 16

appropriate transportation corridors to easily serve the public. Visual impacts of these developments should be minimized by requiring buffers, landscaping, and architectural controls. Activity Center - The Activity Center land use category includes commercial, entertainment, limited residential, and public/institutional land uses typically found in a central business district. The commercial business district (CBD) and urban village (UV) zoning classifications are considered appropriate for developments proposed within the Activity Center classification. Developments within the Activity Center classification may be encouraged to consider additional zoning classifications, based on future revisions to the Forsyth County Unified Development Code. The types of uses that are desirable in this area would be restaurants, specialty retail, governmental offices, low-intensity offices (e.g. accountant or real estate office) and appropriate parking. Uses should be complemented with walking, biking and transit opportunities to provide alternative modes of transportation. Also, any roadway improvements that are considered for this area should carefully consider the scale of the area. Residential uses shall be considered accessory and limited to townhouses or apartments mixed into the commercial establishments. Commercial uses must be developed or present first in comparable scale before residential uses can be permitted for construction. Corridor Commercial - The Corridor Commercial category is intended to focus on major transportation corridors, which presently contain a mix of agricultural, residential, commercial, and industrial land uses. Such corridors are unlikely to experience small scale, low or medium density residential development over the course of the planning period. Developments within the corridor commercial classification will focus on land uses of varying intensity that will allow for the appropriate transition between high-intensity development abutting the transportation corridor as well as provide for a continued decrease of intensity as the development moves away from the transportation corridor. The physical character and design of proposed developments should be compatible with surrounding uses. Inter-parcel connectivity and side street access should be encouraged to minimize curb cuts and improve traffic flow. Typical uses include standard retail and commercial service activities such as shopping centers, general retailers, specialty shops, grocery stores, drug stores, banks, restaurants, theatres, hotels, dry cleaners, entertainment facilities, multiple tenant offices, small single occupant structures, and entrances to residential subdivisions located outside the corridor commercial designation. The transitional nature of the category should be supported through the use of buffers, landscaping, and architectural controls to minimize the impacts on lower intensity land uses. Industrial - The primary purpose of this category is to provide for areas where light industrial uses can be located. These light industrial uses include light manufacturing, warehousing, wholesale/distribution and assembly. More intensive industrial uses that are characterized by noise, fumes, vibration and other forms of pollution that might be viewed as objectionable by surrounding uses are acceptable only on a case-by-case basis if well screened and buffered from other uses. Limited commercial uses are also allowed in industrial areas if they compliment existing industrial uses, such as cafeterias and day cares.
Jordan, Jones & Goulding, Inc Settingdown Subarea Land Use Report t 17

Public / Institutional - Includes uses such as schools, colleges, hospitals, municipal community centers, churches, cemeteries, municipal buildings and post offices. Public Park - This category includes land dedicated to active and passive recreation uses. These areas are publicly owned and may include sports fields, recreation areas, greenways, and similar uses. Private Park - Privately owned land that is used for active and passive recreation. This may include subdivision amenities areas, golf courses and Army Corps of Engineers recreation areas. Conservation - This classification includes environmentally sensitive areas that are regulated at the local and state levels. Areas included in this category are the 35 ft. buffer along all county streams, a 100 ft. buffer along the Etowah River and land that is part of the 100-year floodplain of local waterways. This land has the potential to be used as public greenways or multi-purpose paths. Land classified as Conservation alerts government officials and property owners to the presence of environmental conditions that shall be factored into the rezoning and permitting process. Transportation / Communication / Utilities (TCU) - This category includes such uses as landfills, water treatment plants, wastewater treatment plants, power substations, rail yards, mass transit facilities, airports, etc. These uses may be either public or private.
Figure 8: Settingdown Future Land Use, 2025 Land Use Acres Percent
Low Density Residential 10,519 68.5%Medium Density Residential 2,706 17.6%Public Park 773 5.0%Road Right-of Way (TCU) 661 4.3%General Commercial 187 1.2%Public/Institutional 163 1.1%High Density Residential 94 0.6%Corridor Commercial 75 0.5%Industrial 71 0.5%Private Park 36 0.2%Cumming 28 0.2%Neighborhood Commercial 27 0.2%Office-Transitional 6 0.0%Activity Center 0 0.0%Transportation/Communication/Utilities 0 0.0%Settingdown Total 15,346 100.0%
Jordan, Jones & Goulding, Inc Settingdown Subarea Land Use Report t 18

Jordan, Jones & Goulding, Inc
Figure 9 Settingdown 2025 Future Land U
19
Settingdown Subarea Land Use Reportse Plan

Appendix A. Settingdown Subarea Advisory Committee Patty Durand Dan Wolf Jason May Pam Bowman Mark Tressler
B. Meeting Dates Settingdown Subarea Advisory Committee Meeting- May 29th at 6:30PM in the Cumming Library. Settingdown Subarea Advisory Committee Meeting- July 22nd at 6:00PM in the Cumming Library.
Jordan, Jones & Goulding, Inc Settingdown Subarea Land Use Report 20

Forsyth County Comprehensive Plan
Etowah Subarea Land Use Report
September 25, 2003

Table of Contents I. Introduction ................................................................................................................. 1
A) Purpose............................................................................................................ 1 B) Scope............................................................................................................... 3 C) Location ........................................................................................................... 3
II. Inventory of Existing Conditions ................................................................................. 4
A) Description of Existing Land Uses ................................................................... 4 B) Environmentally Sensitive Areas...................................................................... 6
1. Historic Resources................................................................................ 6 2. Water Resources .................................................................................. 6 3. Steep Slope .......................................................................................... 7 4. Conservation & Park Lands .................................................................. 7
C) Historic Development Patterns ........................................................................ 9 1. Demographics....................................................................................... 9 2. Development Activity .......................................................................... 10
D) Future Development Trends .......................................................................... 10 1. Future Infrastructure ........................................................................... 10 2. Transitional Areas............................................................................... 11 3. Current Land Use Policies .................................................................. 11
III. Subarea Committee Recommendations.................................................................. 14
A) Etowah Subarea Vision.................................................................................. 14 B) Policy Recommendations............................................................................... 14 C) Etowah Land Use Plan Map (Updated December 9, 2003) ........................... 14
Appendix ....................................................................................................................... 19
Jordan, Jones & Goulding, Inc. Etowah Subarea Land Use Report i

I. Introduction A) Purpose In preparing the 2003 Update to the Forsyth County Comprehensive Plan, the County initiated an ambitious public involvement process. In order to better analyze the County’s needs and elicit a higher degree of community participation, the county was divided into ten planning subareas (Figure 1) with individual committees established to develop specific land use policies and a future land use map for their subarea. The subarea boundaries were determined by a variety of factors including: physical barriers, historical communities, economics and transportation corridors. Farmland in the Etowah area Included in this document are the findings from the land use inventory and assessment for the Etowah subarea. The adequacy of the area’s resources will be assessed further based on input from residents, appointed officials, County staff and elected officials. The information gathered at this stage enables the community to look at where they are today, how they got there and where they want to go in the future. At the outset of the planning process, owners of parcels 25 acres and larger were identified as stakeholders and invited to participate in a special planning exercise. After a presentation on the planning process and four possible alternative development scenarios for the subarea, participating landowners sketched out their recommendations for land use on a blank map of the subarea and also provided written comments. The maps prepared by stakeholders were used to produce maximum and minimum coverages for each major type of land use (agricultural, residential, commercial). Using this information and considering all other relevant land use information (zoning, sensitive lands, etc.), a first draft of a land use plan for the subarea was produced. In a second meeting, stakeholders were shown, via a Geographic Information System demonstration, the results of their recommendations and a draft future land use map that incorporated their suggestions. The resulting land use plan included a “balance” of input from the public and the planning staff. Prior to the public hearings in front of the Planning Commission and Board of Commissioners, two additional meetings were held with the general public. The format of these meetings included a staff presentation of the plan, general citizen input, and a question and answer period. JJG has reviewed the Policy and Implementation Guide and the Support Document that contains the inventory data for the Etowah subarea. This information was gathered to help enable the community to look at where they are today, how they got there and where they want to go in the future. Included in this document are the findings from the land use inventory and assessment for the Etowah subarea, as well as the recommendations of the Etowah Subarea Advisory Committee. The membership of the committee and the meeting dates can be found in the Appendix. .
Jordan, Jones & Goulding, Inc. Etowah Subarea Land Use Report 1

Figure 1 Forsyth County Subarea Locations
Jordan, Jones & Goulding, Inc. Etowah Subarea Land Use Report 2

B) Scope The following report provides a current “snapshot” of the Etowah subarea. First, a description of existing land uses in the subarea is provided, along with an existing land use map and summary table. This is followed by an inventory of environmentally sensitive areas. These two sets of information allow the community to identify those sections of the subarea that could potentially be developed in the future, as well as those areas that should be protected from development pressures. Following this inventory, there is an examination of the historic development patterns in the Etowah subarea. This includes a discussion of demographic changes in the subarea between 1990 and 2000, as well as an estimate of land consumption during the last decade. There is also a summary of the historical factors that have led to the current development patterns. An examination of future development trends is also provided. This includes an assessment of the future sewer and transportation infrastructure needs, as well as the identification of transitional areas that could potentially be redeveloped. Forsyth County’s land use polices are also examined in order to determine what is allowed to develop under the current regulations. Finally, this report includes the subarea vision and policy recommendations developed by the Etowah Subarea Advisory Committee, and a copy of the future land use map for the subarea. C) Location The Etowah subarea is located in the northwest corner of Forsyth County. Cherokee County forms a boundary to the west, while Dawson County lies to the north. The southern boundary of the Etowah subarea is formed by Etowah Creek and the eastern boundary runs north south just east of John Burrus Road.
Jordan, Jones & Goulding, Inc. Etowah Subarea Land Use Report 3

II. Inventory of Existing Conditions A) Description of Existing Land Uses A comprehensive land use survey was conducted for Forsyth County in the Summer of 2002 using tax parcel maps, aerial photographs and field review. In April 2003, JJG conducted a field review and a review of aerial photographs to verify the land uses in the Etowah subarea. These land uses are shown on Figure 3 on the following page and summarized in Figure 2 below.
LaUndeveloped Residential Agriculture Road Right-of-wIndustrial Institutional/PubParks/RecreatioCommercial Etowah Total Total Sq. Miles
As indicated in the taland at nearly 38 persuabareas in the counUndeveloped land casubarea. The majoriwithin the floodplainsouthern boundariesexact. Commercial land Bannister Road.of land dedicated to than 1 percent of all areas in the county cwhile lacking new resubarea preserves an
Jordan, Jones & Goulding,
Figure 2: Etowah Existing Land Use, 2003 nd Use Acres Percent
5,888.59 38.72%4,279.63 28.14%3,859.27 25.37%
ay 481.12 3.16%402.69 2.65%
lic 134.94 0.89%n/Conservation 132.21 0.87%
31.42 0.21%15,209.87 100.00%
for Sub Area 23.8 --
ble above, the largest land use category in the Etowah subarea is undeveloped cent of the subarea. That makes this subarea one of the least developed ty, and certainly, far less developed than subareas to the south or east. n be found in mass around the two landfills in the northwest corner of the ty of this undeveloped land is heavily forested and either on steep slopes or of the Etowah River. Residential land is concentrated on the eastern and of the subarea and constitutes over a quarter of the area, 28 percent to be and uses are few and far between found primarily at the intersection of GA 369 At less than one-half of one percent, the Etowah subarea has the least amount commercial uses in the county. In total, commercial land uses comprise less land uses in the subarea. What the Etowah subarea does have that few other an lay claim to is a substantial amount of agricultural lands, at 25 percent. Thus, sidential and commercial development relative to other subareas, the Etowah d displays the rural character that defines Forsyth County’s heritage.
Inc. Etowah Subarea Land Use Report 4

Jordan, Jones & Goulding, Inc.
Figure 3 Etowah Subarea Existing Lan
5
Etowah Subarea Land Use Reportd Use

B) Environmentally Sensitive Areas 1. Historic Resources In the mid-1990s a historic resources inventory was completed for Forsyth County. The Historic Resources Survey Report identified 490 historic resources in unincorporated Forsyth County. Thirty nine of these historic sites are located in the Etowah subarea. The Etowah Subarea Plan Support Document produced in 2001 details four of these sites in detail: Old Federal Road: Prior to White settlement, Forsyth County was part of the Cherokee Indian Territory. In the early 1800s, the Cherokee Federal Road was constructed across Northwest Georgia following the old Cherokee Middle Path. The Federal Road served as an emigrant artery to West Tennessee and northern Alabama and was eventually used as a postal route, stage route, and for transporting farm goods to market. The Old Federal Road was also significant in that it was used in the 1830s for the removal of the Cherokee Indians from the area (i.e., the “Trail of Tears”). Segments of the Old Federal Road survive today in northern Forsyth County, particularly in the northwest corner of the County within the Etowah subarea boundary. Vann’s Tavern, one of Forsyth County’s most notable historic resources, was located in the subarea near the Etowah River along the Old Federal Road; however, it was relocated to Gordon County. Mt. Tabor Church: This historic resource is reportedly the oldest active church in Forsyth County today (1833). This site, which is located on the west side of Mt. Tabor Road approximately one mile north of Matt Highway (SR 369), also includes a cemetery. Buffington’s Tavern: This early 1800’s structure is located on the north side of Old Federal Road, 0.7 miles west of the Etowah River. This structure was found in the survey report to be important to local history but in poor condition. Poole’s Mill Covered Bridge: This covered bridge across Settingdown Creek at Old Poole's Mill Road was constructed in 1901. It was an important transportation route in the first quarter of the 20th century, and is now a county park. The bridge was listed individually on the National Register of Historic Places in 1975. 2. Water Resources There are 1363 acres of 100-year floodplains in the Etowah subarea. Development is regulated in this area by the Federal Emergency Management Agency, the Georgia Floodplain Management Program of DNR and by local ordinances. Most of the floodplain associated with the Etowah area comes from the portions of Settingdown Creek that fall within the southern boundary of the subarea, and the Etowah River, located in the western half of the subarea. The Etowah River has been designated by the State of Georgia as a protected river corridor and as such has a required 100 foot vegetated buffer that is to be maintained on either side of the river. There are 2506 acres of land associated with groundwater recharge areas in the Etowah subarea. Significant recharge areas have been mapped by the Georgia Department of Natural Resources at the state level. If a significant recharge area is identified, the local government must comply with the Official Code Georgia Annotated 12-2-8. This Code outlines restrictions on locating landfills and hazardous waste facilities, above ground chemical or petroleum storage tanks, agricultural waste,
Jordan, Jones & Goulding, Inc. Etowah Subarea Land Use Report 6

impoundment sites, septic tank drain fields, slow rate land treatment, storm water infiltration basins, and waste treatment basins. There are two large groundwater recharge areas in the Etowah subarea. One is in the northeastern corner of the area where agriculture, residential and undeveloped land parcels are found. The only threat to groundwater may come from the agricultural uses, but given the fact that the county relies heavily on surface water, this is more of long term concern if groundwater stocks were to be needed on a wider basis in the future. The second recharge area is significantly smaller, located on the southern border of the study area, south of GA 369 and in the vicinity of Wright Bridge Road. This recharge area has less agricultural lands associated with it, and thus, poses little threat to groundwater sources. 3. Steep Slopes There are 3814 acres of steep slopes (15% grade or greater) in the Etowah subarea. This amounts to approximately 25 percent of the total land area in the subarea. Most of these steep slopes are in the western half of the subarea, particularly around the Etowah River. These slopes are found in the eastern portion of the study area, but to a lesser extent, and are practically nonexistent in the well-developed southeast corner. 4. Conservation & Park Lands There are no public lands in the Etowah subarea, due to both the lack of population in the area and perhaps, the presence of scenic open lands. In light of the fact that there is little population to help drive the need for recreation spaces, it may be more important to preserve open spaces and scenic views to provide for passive recreational opportunities and scenic beauty. The Etowah Subarea Plan Support Document from 2001 outlines several areas of scenic beauty in this subarea.
“Matt Highway within the subarea is designated as a scenic corridor according to the comprehensive plan. Another potential scenic route worthy of protection is Spot Road-McCoy Road-John Burrus Road, although portions of this route are outside the Etowah subarea.” “There are several views of Sawnee Mountain to the south from vantage points in the Etowah subarea, especially along Dr. Bramblett Road just south of its intersection with Matt Highway. There are also views of the distant mountain horizon at certain vantage points along Matt Highway and Whitmire Road going westbound. Along Mocking Bird Road, there are significant views of scenic resources looking north and south. There are some spectacular views of the distant mountain range and the Etowah River valley from the River Hill subdivision located north of the high ridgeline of Matt Highway, prior to its descent into Cherokee County. Furthermore, there are a number of views of the subarea’s rural and farm resources.”
The locations of the natural and cultural resources in the Etowah subarea are shown on the map included as Figure 4.
Jordan, Jones & Goulding, Inc. Etowah Subarea Land Use Report 7

Jordan, Jones & Goulding, Inc.
Figure 4 Etowah Natural and Cultural R
8
Etowah Subarea Land Use Reportesources

C) Historic Development Patterns 1. Demographics In 2000, the population of the Etowah subarea totaled 4,188. This is an increase of 57.1% percent since 1990. This is considerably slower than the growth rate for Forsyth County, which was 123.2 percent during the 1990’s (the second fastest county growth rate in the country). It also makes Etowah the least populated of the subareas, and the slowest growing. Coal Mountain to the east had a similar growth rate of 57.4% from 1990 to 2000, but has a population of about 6300. Following countywide trends, the Etowah subarea is mostly white at 98 percent. The age distribution figures indicate the majority of residents in this area are 30-39 years of age with children between the ages of 5 and 17 ranking second. The largest increase in age distribution has been for the groups age 30 to 39, and 5 and under. Figure 5 provides a comparison of the demographic statistics for the area for 1990 and 2000.
Figure 5 Etowah Subarea Demographics
1990 – 2000
1990 2000 Percent Change
Population 2,666 4,188 57.1% Racial and Cultural Distribution * White 2,656 4,101 54.4% Black or African American 1 2 64.0% Asian 1 19 1369.8% Hispanic or Latino, regardless of race 16 105 543.8% Age Distribution Under 5 196 380 94.3% 5 to 17 518 850 64.0% 18 to 21 165 166 0.9% 22 to 29 349 419 20.1% 30 to 39 465 929 99.8% 40 to 49 380 636 67.4% 50 to 64 358 552 54.3% 65 and over 252 256 1.5% Housing Housing Units 1,002 1,541 53.7% Occupied 959 1,463 52.5% Vacancy Rate 43 78 80.7% Owner Occupied 813 1,327 63.3% Renter Occupied 146 136 -7.2% * Note: The racial and cultural distribution numbers total to a sum larger than the total population. Hispanic is a cultural descriptor and is not exclusive of race.
Jordan, Jones & Goulding, Inc. Etowah Subarea Land Use Report 9

The number of housing units in the Etowah subarea increased moderately in comparison to other subareas during the 1990s. In 1990, there were 1,002 housing units and by 2000 the number of units increased to 1,541, a 53.7% percent increase. During the 1990s the vacancy rate actually rose, from 4.3 percent to 5.1 percent in 2000. Etowah is the only subarea in the county that had an increasing vacancy rate from 1990 to 2000. The housing units in this area are mostly owner-occupied, with 92.4 percent being owner-occupied and 7.6 percent renter occupied units. The number of owner-occupied units increased by 129 percent during the 1990s compared to a decrease of nearly 12 percent for renter-occupied housing. 2. Development Activity It is estimated that since 1990 approximately 10 percent (1,500 acres) in the Etowah subarea has been developed. Almost all of this development has been for residential uses, with lots ranging from a minimum of one-half acre to more than five acres. Nearly half of the subarea is either undeveloped or used for agriculture, so the potential for future growth in the subarea is obvious. Some of these pressures have come to fruition, as the once rural landscape is now dotted with new, large lot suburban homes, interrupting a once comprehensive country-like setting. Many times, these new estates lie immediately next to older, abandoned farm houses and structures, a juxtaposition that symbolizes the trend that has taken place over the past several years in the Etowah subarea. Despite these recent changes, development in the Etowah subarea has lagged behind that of other subareas and the county as a whole. Population increased 57.1 percent and housing units increased by 53.7 percent from 1990, compared to countywide increases of 123.2 percent in population and 116.9 percent in housing units. The subarea with the highest growth rates during the decade was in South Forsyth where population and housing units more than tripled. These growth rates in the South Forsyth subarea are more than six times the growth rates in this northwestern subarea. D) Future Development Trends 1. Future Infrastructure One of the primary drivers of development is the provision for public infrastructure, particularly sewer and roads. The availability of sewer allows for more intensive land uses such small-lot subdivisions (less than one-half acre lots). Roads are also primary drivers of change because they provide access to desired destinations, such as jobs and shopping. Better access leads to a higher land value and a greater likelihood of more intense uses. There are four transportation improvement planned for the Etowah subarea by 2020. By 2005, it is recommended that the portion of GA 369 up to Byers Road will be upgraded to a two-lane road with left turn lanes. The next improvements are slated to take place by 2010, as this same portion of GA 369 will be further upgraded to a four-lane road, as will the rest of the route to the west. Come 2020, Dr. Bramblett Road is expected to be expanded to a two-lane road with left turn lanes. Currently, the entire Etowah subarea is served by water, but is not served with sewer. Although there are plans to put sewer in the area, these plans currently do not fall within a 20-year time frame.
Jordan, Jones & Goulding, Inc. Etowah Subarea Land Use Report 10

Growth pressures in the Etowah subarea are expected to remain less significant than that of the southern portion of the county. As the Atlanta metro area, and particularly the Alpharetta and Windward areas continue to grow, there will be significant growth pressures continuing in the southern portions of the county. As the southern subareas begin to be built out, there will certainly be increased pressures on northern subareas to accommodate additional growth. This theory has already begun to play out as the southern border of the subarea along Settingdown Creek has developed far quicker than other parts of the subarea. However, the substantial amounts of steep slopes and floodplains may serve to limit this growth, as will the presence of the two landfills in the northwest corner of the subarea. 2. Transitional Areas While transitional areas in the southern part of the county will be more concerned with older residential areas intensifying (in terms of density), transition areas in the Etowah subarea will continue to be focused on the conversion of forested land, and more importantly perhaps, agricultural land, into higher intensity residential and commercial uses. However, given the substantial amount of undeveloped land in the subarea, it is reasonable to assume that the majority of incoming growth can be accommodated on undeveloped parcels, without directly impacting agricultural parcels in the near future. 3. Current Land Use Policies The 2015 Future Land Use map for the Etowah subarea identifies over 84 percent of the area to be developed as large-lot single-family houses, 1 percent to be developed as commercial uses, and 15 percent to be conserved as parkland and open space. Current land use policy was analyzed by examining the primary tools of land use including the Unified Development Code and the Land Use Element of the Comprehensive Plan. The JJG team also examined the current zoning and 2015 Future Land Use maps to determine any implications that might arise from those elements. A difference exists between the way land is currently zoned in Forsyth County and the 2015 Future Land Use map. In order to achieve the future land uses that are envisioned in the Comprehensive Plan, large amounts of land would have to be re-zoned. Rezonings would have to occur not only within land use categories, but significant amounts of land would have to be rezoned into entirely different categories. Figure 6 on the following page shows the amount of land that would have to be rezoned to provide consistency with the 2015 Future Land Use map. For example, Figure 6 shows that 75 percent of the land is zoned for agricultural use, but over four-fifths of this land would need to be rezoned for single-family residential use to be consistent with the 2015 Future Land Use map.
Jordan, Jones & Goulding, Inc Etowah Subarea Land Use Report 11

Figure 6 Etowah Rezonings to Match Future the 2015 Land Use Plan
Future Land Use Category
15% 84% 1%
Conservation and
Park * Single Family Residential Commercial
75% Agriculture 12% 63% <1%
24% Single-Family Residential 3% 21% <1%
1% Industrial 0% <1% <1%
Cur
rent
Zon
ing
Cat
egor
y
<1% Commercial 0% <1% <1% * Note: Conservation and park land can be associated with any zoning category.
Indicates that a rezoning is not required to be consistent with the future Land Use Plan
Indicates potentially difficult rezoning
Indicates rezoning that might be moderately difficult
Indicates potentially easy rezoning
Jordan, Jones & Goulding, Inc. Etowah Subarea Land Use Report 12

The chart included as Figure 6 shows the amount of land within the Etowah subarea that is intended for conversion from a current zoning category (rows), to a future land use category (columns). Individual cells of the table are currently zoned within a particular category (shown by the row) and intended for a particular future land use category (shown by the column). Percentages within each cell indicate the percentage of total land area that is categorized by a particular zoning category/future land use category combination. The colored areas of the chart indicate land that is currently intended for a future land use that is different from the way the land is currently zoned. At the present time, approximately 21% of the Etowah subarea is intended to perform the same use as it is currently allowed by zoning (shown by the white areas). To achieve the land uses shown in the current future land use map, 79% of the land will require significant rezonings. Areas shown in red represent required “downzonings” – zoning changes that are traditionally difficult to perform because they further restrict the use of the land. This comprises approximately 4% of the subarea. Areas shown in green represent required “upzonings” – zoning changes that are traditionally easier to perform because they generally increase the allowable uses of the land. This comprises approximately 75% of the subarea. Approximately 75% of the Etowah subarea is currently intended to be moved away from agricultural zoning, to a mixture of residential (63%), and other uses (less than 1%). Twelve percent of the land, currently zoned agricultural, is intended for conservation and/or park use (primarily flood plain). Although the current land use regulations allow single-family residences on land zoned agricultural, this represents a significant conversion of the land’s purpose. Over the next 10 to 20 years, the Etowah area is likely to experience a rapid increase in population. Employment opportunities are likely to take the form of retail and service oriented businesses catering to the needs of future homeowners. The eventual form and density that this future development will take is strongly dependent on the provision of sewer and road improvements. There are no immediate plans now to extend sewer into the area, but the investment in new roads will increase property values and lead to further market interest in single-family residential development. Another deficiency in land use policy is the treatment of agricultural lands. Currently, 47 percent of the land area in the Etowah subarea is zoned for agricultural use, the most extensive zoning in the subarea. However, there is no future land use designation for agriculture. This is particularly notable with the existence of the A2 zoning classification that appears to foster the future use of land for agriculture. Most of the current agricultural land appears in the Future Land Use map as intended for residential use. This represents a large and significant land conversion, and a major loss of open space.
Jordan, Jones & Goulding, Inc Etowah Subarea Land Use Report 13

III. Subarea Committee Recommendations There one meeting held on June 3, 2003 to discuss the development of a land use plan for the Etowah subarea. At the meeting the inventory of existing conditions for the subarea was presented, and the participants were asked to help craft a vision for the subarea. A draft land use plan map was presented along with the draft vision and participants were asked to fill out comments cards, which were presented to the subarea committee for discussion and review. The result of this meeting was a revised land use plan map and a list of policy recommendations that the subcommittee would like to present to the Countywide Land Use Steering Committee for possible inclusion in the county’s Comprehensive Plan. The results of the meeting are presented below. A) Etowah Subarea Vision
• The subarea’s natural and cultural resources will be protected for future generations. • The subarea will maintain a rural character and retain some agricultural uses. • Conventional subdivisions will be encouraged to locate south of Matt Hwy. • Current larger undeveloped tracts will be developed as conservation subdivisions.
B) Policy Recommendations
• In favor of a looser plan, more flexibility in the land use categories and density. • The County needs to prepare a Greenway Master Plan that includes connected greenways
throughout the County. Existing natural features such as stream banks and groundwater recharge areas could be utilized.
• Need more land in public parks. • Limit lifecycle housing to urbanized areas • Require large buffers around landfills
C) Etowah Land Use Plan Map The future land use plan is an extension of the goals and values of the community and a culmination of the subarea planning effort. This future land use map is intended to depict a 2025 future land use scenario. The acreages and percentages of each land use are compiled in Figure 7 and a map showing the location of future land uses is included in Figure 8. There are fourteen land use designations depicted on the future land use map, including three residential designations and six commercial/industrial/mixed-use designations. Below is brief definition of each. Low Density Residential - This category is intended for single-family detached residential dwellings typically on septic sewer systems. Minimum lot size is 30,000 square feet, or the overall density is up to 1.5 units per acre. Institutional uses that are considered complimentary in this area include churches, schools, and libraries.
Jordan, Jones & Goulding, Inc Etowah Subarea Land Use Report 14

Medium Density Residential - Consists of single-family detached residential dwellings typically on sewer, with overall densities from 1.5 to 2.5 units per acre. Institutional uses that are considered complimentary in this area include churches, schools, and libraries. Private recreational uses, such as golf courses, tennis courts, walking trails and swimming pools are encouraged in these areas in developments greater than 50 lots. High Density Residential - Typical uses include single-family detached and attached dwellings (such as townhouses) as well as multifamily condominiums and apartments, at densities of up to 6 units per acre. These developments should incorporate some amount of central outdoor public space for their residents. A limited number of churches, schools, libraries, other miscellaneous institutional uses and daycare facilities would be complimentary in these areas. An urban-density residential area is usually located near areas of high employment concentration, large commercial nodes, transportation nodes and mixed-use developments. It is essential that these developments include proper buffering between adjacent land uses. Office Transitional - The Office Transitional category is intended to allow for the redevelopment or transition of residential uses along major roadways to office professional uses. It also allows for new office development that is constructed in a manner consistent and in keeping with the surrounding residential uses. The physical character and design of proposed new structures should be compatible with existing establishments. This category includes small single occupant structures for doctors and or accountants, as well as larger offices with multiple tenants. Businesses that are allowed in this category may provide a product directly to customers on the premises as an accessory to the service, but do not, as a primary activity, involve the manufacture, storage, or distribution of products. These areas should provide employment opportunities in close proximity to residential areas while providing a transition between the more intense commercial areas and residential neighborhoods. Neighborhood Commercial - This category includes a limited range of retail and service activities to serve the everyday needs of local residents. Limitations should apply to both size and character of individual establishments. The basic character of this category is one that encourages and assures a compatible mixture of residential, office and retail types of land uses. Businesses in this land use category should be designed to encourage the development of neighborhood scale shopping that offers both goods and products, and the furnishing of selected services. General Commercial - This category includes standard retail and commercial service activities such as shopping centers, general retailers, specialty shops, grocery stores, drug stores, banks, restaurants, theatres, hotels, dry cleaners and entertainment facilities. These establishments should be located on appropriate transportation corridors to easily serve the public. Visual impacts of these developments should be minimized by requiring buffers, landscaping, and architectural controls. Activity Center - The Activity Center land use category includes commercial, entertainment, limited residential, and public/institutional land uses typically found in a central business district. The commercial business district (CBD) and urban village (UV) zoning classifications are considered appropriate for developments proposed within the Activity Center classification. Developments within the Activity Center classification may be encouraged to consider additional zoning classifications, based on future revisions to the Forsyth County Unified Development Code. The types of uses that are desirable in this area would be restaurants, specialty retail, governmental offices, low-intensity offices (e.g. accountant or real estate office) and appropriate parking. Uses
Jordan, Jones & Goulding, Inc Etowah Subarea Land Use Report 15

should be complemented with walking, biking and transit opportunities to provide alternative modes of transportation. Also, any roadway improvements that are considered for this area should carefully consider the scale of the area. Residential uses shall be considered accessory and limited to townhouses or apartments mixed into the commercial establishments. Commercial uses must be developed or present first in comparable scale before residential uses can be permitted for construction. Corridor Commercial - The Corridor Commercial category is intended to focus on major transportation corridors, which presently contain a mix of agricultural, residential, commercial, and industrial land uses. Such corridors are unlikely to experience small scale, low or medium density residential development over the course of the planning period. Developments within the corridor commercial classification will focus on land uses of varying intensity that will allow for the appropriate transition between high-intensity development abutting the transportation corridor as well as provide for a continued decrease of intensity as the development moves away from the transportation corridor. The physical character and design of proposed developments should be compatible with surrounding uses. Inter-parcel connectivity and side street access should be encouraged to minimize curb cuts and improve traffic flow. Typical uses include standard retail and commercial service activities such as shopping centers, general retailers, specialty shops, grocery stores, drug stores, banks, restaurants, theatres, hotels, dry cleaners, entertainment facilities, multiple tenant offices, small single occupant structures, and entrances to residential subdivisions located outside the corridor commercial designation. The transitional nature of the category should be supported through the use of buffers, landscaping, and architectural controls to minimize the impacts on lower intensity land uses. Industrial - The primary purpose of this category is to provide for areas where light industrial uses can be located. These light industrial uses include light manufacturing, warehousing, wholesale/distribution and assembly. More intensive industrial uses that are characterized by noise, fumes, vibration and other forms of pollution that might be viewed as objectionable by surrounding uses are acceptable only on a case-by-case basis if well screened and buffered from other uses. Limited commercial uses are also allowed in industrial areas if they compliment existing industrial uses, such as cafeterias and day cares. Public / Institutional - Includes uses such as schools, colleges, hospitals, municipal community centers, churches, cemeteries, municipal buildings and post offices. Public Park - This category includes land dedicated to active and passive recreation uses. These areas are publicly owned and may include sports fields, recreation areas, greenways, and similar uses. Private Park - Privately owned land that is used for active and passive recreation. This may include subdivision amenities areas, golf courses and Army Corps of Engineers recreation areas. Conservation - This classification includes environmentally sensitive areas that are regulated at the local and state levels. Areas included in this category are the 35 ft. buffer along all county streams, a 100 ft. buffer along the Etowah River and land that is part of the 100-year floodplain of local waterways. This land has the potential to be used as public greenways or multi-purpose paths. Land
Jordan, Jones & Goulding, Inc Etowah Subarea Land Use Report 16

classified as Conservation alerts government officials and property owners to the presence of environmental conditions that shall be factored into the rezoning and permitting process. Transportation / Communication / Utilities (TCU) - This category includes such uses as landfills, water treatment plants, wastewater treatment plants, power substations, rail yards, mass transit facilities, airports, etc. These uses may be either public or private.
Etowah FuLand Use
Low Density Residential Medium Density Residential Landfill (Industrial) Road Right-of Way (TCU) General Commercial Public/Institutional Industrial Public Park (PRC) Private Park (PRC) Office-Transitional High Density Residential Corridor Commercial Neighborhood Commercial Activity Center (Commercial) Transportation/Communication/UtEtowah Total
Jordan, Jones & Goulding, Inc
Figure 9 ture Land Use, 2025
Acres Percent 9,032 59.4%4,273 28.1%
691 4.5%483 3.2%294 1.9%159 1.0%133 0.9%106 0.7%26 0.2%12 0.1%
0 0.0%0 0.0%0 0.0%0 0.0%
ilities 0 0.0%15,209 100.0%
Etowah Subarea Land Use Report 17

Jordan, Jones & Goulding, Inc Etowah Subarea Land Use Report
Figure 8 Etowah 2025 Future Land Use Plan
18

Appendix A. Etowah Subarea Advisory Committee Dennis Whittle Joyce Neuner John Pearson Michael Gravitt Roger Markle
B. Meeting Date Etowah Subarea Advisory Committee Meeting – June 3rd at 6:30 PM in the Sawnee Mountain Park Community Building
Jordan, Jones & Goulding, Inc Etowah Subarea Land Use Report 19

FORSYTH COUNTY COMPREHENSIVE PLAN FORSYTH COUNTY COMPREHENSIVE PLAN
Appendix E
BIKE AND PEDESTRIAN PLAN

Forsyth CountyBicycle Transportationand Pedestrian Walkways2025 Plan

Forsyth County Bicycle Transportation and Pedestrian Walkways 2025 Plan 1
Forsyth County Bicycle Transportation and Pedestrian Walkways 2025 Plan
Table of Contents
Executive Summary……………………………………………………………………….. 4 Section 1 Introduction…………………………………………………………..……. 8
1.1 Forsyth County Bicycle and Pedestrian Plan Task Force…….…… 8 1.2 Public Involvement………………………………………….…….. 9
1.2.1 Coordination………………………………………………. 10 1.2.2 Outreach…………………………………………………… 11 1.2.3 Involvement………………………………….……………. 12 1.2.4 Measures of Effectiveness………………………………… 13
Section 2 Existing Conditions………………………………………………………… 15 2.1 Federal Strategy Implementation Analysis………………………… 15
2.1.1 Mainstreaming Non-motorized Transportation…….……… 16 2.1.2 General Funding Requirements…….……………………….. 16
2.1.3 Safety…………….…………………………………………..17 2.1.4 Streamlining Implementation Procedures….……………….. 17 2.1.5 Recommendations.………………………………………….. 18
2.2 Current Trends……………………………………………………... 18
2.2.1 Benefits of a Bicycle and Pedestrian Transportation Plan….. 19 2.2.2 Regional, State and National Trends…….…………………. 19 2.2.3 Local Trends………..……………………………………… 22 2.2.4 Within Forsyth County……..………………………………. 24
Section 3 Strategic Planning Process………………………………………………… 27
3.1 Bicycle and Pedestrian Planning in Relation to the Larger Land Use, Transportation and Environmental Planning Framework.……………. 27
3.1.1 Local Land Use Planning………..…………………………. 27 3.1.2 Regional Planning………………………………………….. 28 3.1.3 Statewide Planning……..…………………………………... 29
3.2 Bicycle and Pedestrian issues within the Political and Technical Environments………………………………………………. 30
3.2.1 Technical Environment……….………………………….. 30 3.2.2 Political Environment…………………………………….. 32
Section 4 Goals, Objectives and Strategies………………………………………….. 35 Section 5 Alternatives Analysis………………………..……………………………. 41
5.1 Best Practices for Bicycle and Pedestrian Facility Design……….. 41 5.1.1 Cyclists and Pedestrians…………………………………. 41 5.1.2 Facility Descriptions…………………………………….. 43 5.1.3 Motorist/Pedestrian Conflicts…..……………………….. 48

Forsyth County Bicycle Transportation and Pedestrian Walkways 2025 Plan 2
5.1.4 Congestion Analysis……………………………… …….. 48 Section 6 Plan Recommendations…………………………………………………… 56 By Facility Type……………………………………………………. …….. 56 Short, Mid, Long Term Priorities………………………………….. …….. 64 List of Tables Table 1 Generalized Level of Service1…………………………………………… 51
Table 2 Planned Transportation Projects for Congested Roadways……………… 52
List of Figures
Figure 1 Proposed Bicycle and Pedestrian Plan
Figure 2 Roadway Facility Types
Figure 3 2000 Average Daily Traffic Counts
Figure 4 Level of Service
Appendices
Appendix A
Facility Type A – Signed Shared Roadway
Facility Type B – Bicycle Friendly Shoulder
Facility Type C – Bike Lane
Facility Type D – Local Sidewalk
Facility Type E – Multi-Use Path/Arterial Sidewalk
Facility Type F - Greenway
1 1998 Level of Service Handbook, Florida Department of Transportation

Forsyth County Bicycle Transportation and Pedestrian Walkways 2025 Plan 3
MEMBERS OF THE BOARD OF COMMISSIONERS
John Kieffer District 1 Chairman
Michael Bennett District 3 Member
David "AJ"Pritchett District 2 Secretary
Marcie Kreager District 4 Vice-Chair
Eddie Taylor District 5 Member
Stevie P. Mills
Administrator
John Cunard
Director of Engineering
Tim Allen
Assistant Director of Engineering

Forsyth County Bicycle Transportation and Pedestrian Walkways 2025 Plan 4
Executive Summary Currently, Forsyth County is in the final stages of updating their Comprehensive Transportation Plan (CTP) to guide their current and future efforts regarding roadway enhancements throughout the County. In a similar effort, the County desired to develop a Bicycle Transportation and Pedestrian Walkways Plan (Bicycle and Pedestrian Plan) to guide their efforts regarding the proliferation of these facilities in the County. The Plan development effort was coordinated with information contained in the CTP. The Plan development process specifically consisted of the following: § Establishment of a Bicycle and
Pedestrian Task Force; § Development of a Countywide vision
statement regarding the Plan; § Reviewing the Federal guidance with
respect to developing Bicycle and Pedestrian plans;
§ Incorporating task force comments and federal guidance into the development of goals, objectives and strategies;
§ Development of a public involvement plan;
§ Summarizing existing conditions and current trends as the baseline for future planning;
§ Developing performance measures to analyze future progress towards goal attainment;
§ Identifying issues and opportunities for plan implementation and developing key strategies;
§ Identifying potential projects consistent with the County CTP and a congestion analysis; and
§ Selecting alternative projects § Prioritizing and costing potential
projects. The process was completed in eight months due to the consistent work effort of County staff and the Bicycle and Pedestrian Task Force members.
Task Force Compilation The Task Force personnel were appointed by the County and represented an array of different perspectives. Inclusion of personnel from the Departments of Engineering, Parks and Planning assured project coordination with other County efforts. Moreover, both private and homeowner interests were also represented. Below are the Task Force member representatives who met on a monthly basis to review all work products and whose input was invaluable to the final product: National Parks: Wallace Britian Corps of Engineers: Russ Lundstrom, Ranger Keep Forsyth County Clean and Beautiful: Diana Dean Forsyth County Department of Engineering: Tim Allen Forsyth County Dept. of Planning and Development: Jeff Watkins Forsyth County Parks and Recreation Board: Catherine Ferrugia Georgia Department of Transportation: Brent Cook Forsyth County Board of Commissioners: Marcie Kreager Chamber of Commerce: Kenneth Flanagan Hedgewood Properties: Pam Sessions Forsyth County Department of Parks and Recreation: Jim Brennan Forsyth County Federation of Homeowners: Richard Spreen Existing Conditions The Task Force was presented with extensive information regarding existing conditions in an effort to establish a baseline for future planning. A current trends report was produced, which highlighted the history of bicycle and pedestrian planning in the region. The majority of these planning efforts have been concentrated in the Atlanta Regional Commission (ARC) jurisdiction. Performance measurement criteria used in past ARC efforts was documented for use and consideration by the Task Force. The

Forsyth County Bicycle Transportation and Pedestrian Walkways 2025 Plan 5
current trends report also detailed State, local and Georgia Mountains Regional Development Center efforts in bicycle and pedestrian planning. Lastly, federal guidance available to local jurisdictions for bicycle and pedestrian planning efforts were documented and presented to the Task Force as a guide for the Forsyth County planning effort. Based on the Task Force’s understanding of these issues, a public involvement plan tailored to Forsyth County was developed. The public involvement plan included the development of a project web page linked directly to the County’s home page. The web page provided a public input survey to assist the Task Force in identifying important issues to address during the planning process. The web page was also key to receiving public input regarding the process and alternative projects recommended. Strategic Planning Once a baseline condition of available resources was established to the County, the Task Force finalized goals, objectives and strategies to meet the County’s vision. The vision statement reads as follows: “To foster the development of an interconnected network of bicycle and pedestrian facilities that meets Forsyth County’s future transportation mobility, serves recreation needs, promotes alternative means of transportation, and enhances the County’s overall quality of life” The goals, objectives and strategies identified were based on an analysis of various issues. One was the relation of bicycle and pedestrian planning in the larger land use, transportation and environmental framework existing in the region, as well as locally. The other was the relation of bicycle and pedestrian planning to the existing political and technical environments
both in the region and locally. It was recognized that, although Forsyth County is not in the ARC jurisdiction, some of the same land use, technical and political issues affecting ARC will impact the County in the future. Therefore, the Task Force agreed to proactively address these issues in their plan development. Specific challenges and opportunities were identified within Forsyth County’s environmental, land use and political context with respect to bicycle and pedestrian planning. The strategies developed for the Forsyth Plan were intended to take advantage of existing opportunities and to overcome the obstacles and challenges identified. Alternatives Analysis As indicated in the information compiled for the Plan development, there are few existing and proposed bicycle and pedestrian facilities in Forsyth County. Similarly, very few local jurisdictions adjacent to Forsyth County have existing and proposed bicycle and pedestrian facilities. Therefore, the process for selecting alternatives was a true beginning for Forsyth County and the surrounding area. Information regarding employment density, population density, destinations, and the location of public facilities was used as a base for selecting alternatives. Moreover, prior to selecting alternatives, the Task Force was presented with various available typical sections that represented best practices for bicycle and pedestrian facility design. In reviewing these typical sections, the Task Force agreed that only certain facilities would be applicable to Forsyth County. A specific type of facility was recommended as the alternatives were selected. Considerations included in the process of selecting the alternatives are listed below. § Adjacent local plans, including the
GDOT Statewide Plan, were secured to assure connectivity was maximized to areas outside of Forsyth County;

Forsyth County Bicycle Transportation and Pedestrian Walkways 2025 Plan 6
§ Park’s Department future plans were identified;
§ Greenspace program plans were identified;
§ Known utility and water/sewer easements were considered;
§ Mapping was produced depicting employment density by Census Tract;
§ Mapping was produced depicting population density by Census Tract;
§ Mapping was produced depicting the location of all schools, parks, public facilities and points of interest;
§ Proposed developments were reviewed and considered;
§ Proposed roadway improvement plans were considered for potential bicycle and pedestrian opportunities;
§ Potential connections to enhance the development of a network were considered; and
§ Input was received from local bike groups regarding preferred travel routes and/or bicycle touring routes.
In addition, a Congestion Analysis report was produced to assist in selecting alternatives. The report included an analysis of congested roadway facilities in the County, a determination of whether the CTP addressed improvements on these roadways, and a recommendation that bicycle and pedestrian facilities be implemented, as a congestion mitigation solution, in conjunction with these road improvements. In this manner, the improvement would not only address vehicle congestion but would also address bicycle and pedestrian needs. Alternative routes to the congested facilities
were also considered for potential parallel bicycle and pedestrian facility construction. Ultimately a Draft 2025 Bicycle Transportation and Pedestrian Walkways Plan was produced from the alternatives analysis. Input was received from the public regarding the draft. Opportunities for input included the web site and a public meeting. Several changes and additions were made to the draft plan in response to public input and the result is the 2025 Bicycle Transportation and Pedestrian Walkways Plan depicted on Figure 1. Plan Recommendations Based on public input and additional analysis, a list of recommended projects was finalized. The Task Force prioritized the list in terms of implementation schedules. Short-term improvements were identified as those that could be completed in 1-5 years, Mid- term improvements in 5-10 years and Long- term improvements in 11 years or more. The prioritization of projects included considerations regarding the type of project, the coordination of the project with roadway improvement schedules, constructability and funding issues. For instance a low cost signing and marking project could be implemented in the short term, whereas, a new multi-use facility requiring right-of-way acquisition and funding identification in order to build would be long term. Cost estimates for the plan recommendations were developed and used in the prioritization process.

Forsyth County Bicycle Transportation and Pedestrian Walkways 2025 Plan 7
The Plan recommendations are generalized as follows:
Approximate Miles Approximate Cost Greenway 29 miles $ 30,800,000
Multi-Use Path 34 miles $ 35,300,000
Sidewalk 60 miles $ 20,432,750
Bicycle Friendly Shoulder 16 miles $ 3,308,000
Signed Shared Roadway 58 miles $ 303,100
Pedestrian Crossing 8 Total Crossings $ 344,000
Total 197 Miles $ 90,487,850

Forsyth County Bicycle Transportation and Pedestrian Walkways 2025 Plan 8
Section 1. Introduction Forsyth County is located in the north central part of Georgia and contains approximately 247 square miles. The County is bordered by Gwinnett and Fulton counties on the south, Cherokee County on the west, Dawson County on the north and Hall County to the east. Forsyth County is the home of Lake Lanier, constructed in 1957 by the Corps of Engineers, which is the most visited Corps recreational lake in the country. The City of Cumming is the county seat and the only incorporated area. The City is responsible for government services and activities within their limits. Since 1980, Forsyth County has ranked as one of Georgia’s fastest growing counties, with an overall growth rate of over 200 percent. The 1999 Census Bureau estimates Forsyth County’s population at 96,686. This estimate is a 119 Percent increase since 1990, making the county the 24th largest in the State. The rapid growth rate will continue as the adjacent Atlanta metropolitan area expands to the north. The Counties growth is not only measured by their population increase, but also by their employment base increase, land development, transportation infrastructure needs, community facility needs (schools, parks etc.) and general overall quality of life needs. Because Forsyth County is in close proximity to the Atlanta metropolitan area, air quality has also become a quality of life issue pertinent to the County’s growth and development. The County is officially included in the 13 county non-attainment area for clean air as designated by the Environmental Protection Agency. Therefore, transportation infrastructure needs for the County are modeled by the Atlanta Regional Commission, which is the designated local planning agency for the Atlanta 10 County region. However, the County continues to be the responsible agency for meeting their own growth and
development needs and has undertaken several efforts in this regard. For example, a new Comprehensive Transportation Plan has been developed to guide future transportation investment decisions. The County’s Land Development Code has recently been updated with progressive regulations to meet the challenging land development growth needs. Additionally, an aggressive Parks Master Plan has been developed which includes plans for acquiring greenspace as part of the Governor’s greenspace initiative. Lastly, the County has been instrumental in the development of the Bicycle Transportation and Pedestrian Walkways Plan to guide development of these facilities now and until the year 2025. This document outlines, in detail, the process undertaken to develop the plan. 1.1 Forsyth County Bicycle and Pedestrian Plan Task Force The first step in the development of the plan was the creation of a Task Force with representatives from different County departments and from the community. The Task Force’s contributions were essential throughout the project process. The Task Force met on a monthly basis, reviewed all work products, made substantial changes to the work products based on their specific knowledge, coordinated departmental efforts, participated in the alternatives analysis and strategic planning process for project selection, and disseminated critical information in their respective areas. The Task Force members appointed by the County were identified in the Executive Summary. The Task Force’s initial step was to establish a vision statement for the development of the Bicycle and Pedestrian Plan. This vision statement was then supported by a series of goals, objectives

Forsyth County Bicycle Transportation and Pedestrian Walkways 2025 Plan 9
and strategies that are compiled in Section 4 of the plan. The agreed upon vision statement for the plan is as follows:
Foster the development of an interconnected network of bicycle and pedestrian facilities that meets Forsyth County’s future transportation mobility, serves recreation needs, promotes alternative means of transportation, and enhances the County’s overall quality of life.
The Task Force’s next step was to develop a public involvement plan that could be implemented at the onset of the project through its completion. The Task Force was considered a key link for the dissemination of information to the public and the respective interests they represented. 1.2 Public Involvement Plan The Forsyth County Bicycle Transportation and Pedestrian Walkways Plan was developed to address and plan for increased bicycle and pedestrian facilities in and around Forsyth County. In order to ensure that it is supported throughout the County, an intensive public involvement process was implemented. Public involvement ensures that the public is a partner in the process of determining strategies to be undertaken by a government entity where there are multiple and competing needs. The purpose of the Public Involvement Plan was to create a Forsyth County Bicycle Transportation and Pedestrian Walkways Plan that meets countywide needs and is feasible to implement. The Public Involvement Plan was a framework for all activities taken toward involving the public in the Bicycle Transportation and Pedestrian Walkways Plan, from development of goals and objectives to the selection of projects. Though Forsyth County is not bound by federal legislation to include a certain level
of public involvement in the development of long-range transportation plans, they followed the spirit of this overall goal and developed the following Plan. Federal regulations that provided guidance to this plan included the National Environmental Policy Act, Americans with Disabilities Act, and the Transportation Equity Act for the 21st Century. The following goals, as demonstrated in the Forsyth County Transportation Public Involvement Plan, were used as guidelines throughout the process: § Raise the level of understanding of the
transportation planning process in the county and identify how interested citizens can become involved;
§ Provide the public with opportunities for involvement in the transportation planning process;
§ Maintain timely contact with key stakeholders throughout the process; and
§ Identify and involve traditionally underserved communities (those communities with a high concentration of minority, low-income or elderly populations) in the transportation planning process.
Building understanding of and consensus on the goals and policies of the plan was the ultimate goal of the Public Involvement Plan. The initial step in building consensus is creating trust among all stakeholders and the agency responsible for making the final decisions. This trust was built through coordination with stakeholders, as well as outreach and involvement. This plan is tailored to the scope of the project at hand and the effective and widespread public involvement necessary for its success. The following outlines specific activities undertaken during plan development, including coordination, outreach, involvement and evaluation. Forsyth County staff or Bicycle and Pedestrian Task Force members conducted some of these

Forsyth County Bicycle Transportation and Pedestrian Walkways 2025 Plan 10
activities. PBS&J completed the remaining tasks. 1.2.1 Coordination
The Forsyth County Bicycle and Pedestrian Plan was coordinated with local bicycle and pedestrian group programs, County transportation and recreational master plans, other adjacent county plans and efforts of the Atlanta Regional Commission (ARC), the Georgia Regional Transportation Authority (GRTA), and the Georgia
Mountains Regional Development Center (GMRDC). 1. Bicycle and Pedestrian Task Force
The Bicycle and Pedestrian Task Force consists of countywide representatives, nonprofit representatives such as Keep Forsyth County Beautiful and the Forsyth County Federation of Homeowners, and private sector organizations such as Hedgewood Properties. It was created to assist in the development of a Bicycle Facilities and Pedestrian Walkways Plan. This group will continue to meet in an effort to coordinate bicycle and pedestrian planning on a countywide basis. The Bike and Pedestrian Task Force was the primary coordination vehicle because of its nature and its enviable position as a planning team for the development and implementation of the Forsyth County Bicycle and Pedestrian Plan. All aspects of the plan were coordinated and approved by the Task Force. 2. Regional Coordination In addition to the Bicycle and Pedestrian Task Force, the consultant team coordinated efforts concerning the Bicycle and Pedestrian Plan with other planning efforts at the Georgia Mountains Regional Development Center (GMRDC), Atlanta Regional Commission (ARC) and the Georgia Regional Transportation Authority
(GRTA). Both the GMRDC and ARC are currently updating their Regional Transportation Plans. GRTA is currently working with Citizens Advisory Groups to develop standard designs for bicycle and pedestrian facilities in the region. Coordination took place throughout the process, starting with a review of the bicycle and pedestrian goals and objectives. The consultant team provided an overview of existing and possible methods to coordinate the selection of priority projects with Forsyth County’s Comprehensive Transportation Plan. 3. Local Jurisdictions and TMA Initiatives Several jurisdictions and TMAs within the North Metro Atlanta region have already initiated projects that could impact the Forsyth County Bicycle and Pedestrian Plan. As part of this Public Involvement Plan, these projects were reviewed to ensure regional coordination and inclusion in the Bicycle and Pedestrian Plan. The consultant team provided a summary of these projects, including local comprehensive transportation plans, for the Bicycle and Pedestrian Task Force to review for regional coordination. 4. Local Bicycle and Pedestrian Group Programs The consultant team and the Task Force provided information about the project, scope, timelines and events for distribution to local groups and other stakeholders. Groups contacted included Bicycle User Groups (BUG) in close proximity to Forsyth County and local bike shops. Coordinating and receiving information from the following groups may help Forsyth County establish their own groups to further the bicycle and pedestrian plan goals:
• BIKECOBB • North Fulton County BUG • Bicycle Users in Gwinnett • Silver Comet Trail BUG

Forsyth County Bicycle Transportation and Pedestrian Walkways 2025 Plan 11
1.2.2 Outreach Outreach included ongoing notification (newsletters and web sites) of all events related to the study, community forum displays and media outreach. Every effort was made to coordinate outreach activities with existing Forsyth County community meetings and events. The desired end result of all outreach activities was to provide the community segment that was interested in bicycle and pedestrian facilities within the Forsyth County area with the knowledge and education necessary for meaningful involvement. 1. Web Pages/Community Newsletters Forsyth County developed a Project Specific Web Site (PSWS) for the Bicycle and Pedestrian Plan. The web site is directly linked to the County’s home page. Included in the website was a survey of bicycle and pedestrian needs that individuals could e-mail to the County webmaster. This information became very important in the selection and prioritization of projects. In addition to posting the work products during the plan development process, the website included a map of the alternative projects being considered for inclusion in the plan. Individuals were encouraged to submit comments regarding the alternative projects. Community and organizational newsletters, and their respective web pages, were also used to provide information regarding milestones of the Bicycle and Pedestrian Plan. All announcements of the plan provided information regarding opportunities for public involvement. Following is a list of web pages and newsletters contacted for distribution of information relating to the Forsyth County Bicycle and Pedestrian Plan. This list includes governments and organizations that stated an interest in having links to the Forsyth County Bicycle and Pedestrian Plan on their web site. Forsyth County - www.forsythcounty.com
Georgia Mountains Regional Development
Center - www.gmrdc.org
Path Foundation - www.pathfoundation.org
PEDS - www.peds.org
Southern Bicycle League, Inc.-
www.bikesbl.org
Georgia Regional
Transportation
Authority -
www.grta.org
Forsyth County News -
www.forsythnews.com
Lake Lanier
Association -
www.lakelanier.org
Cumming-Forsyth Chamber of Commerce -
www.forsythchamber.org
Accessnorthga.com -
www.accessnorthga.com
Federation of Forsyth County Homeowners - www.forsythco.com 2. Media Outreach In order to reach the largest segment of the general public as possible, Forsyth County provided direction in terms of media contacts available to reach the community. Media contacts included the Forsyth County News, Gainesville Times, the Atlanta Journal and Constitution and media outlets serving low-income and minority groups and interest groups. The following list of potential media contacts was developed for the distribution of information regarding the Forsyth County Bicycle and Pedestrian Plan. The media was also used to publicize the public meeting held for the project: Atlanta Journal-Constitution

Forsyth County Bicycle Transportation and Pedestrian Walkways 2025 Plan 12
Gainesville Times Creative Loafing Atlanta Daily World Forsyth County News Forsyth Herald / Lake Lanier Herald WWEV Radio WDUN News/Talk 55 Accessnorthga.com Additional activities Forsyth County staff pursued with assistance from the consultant team and the Bicycle and Pedestrian Task Force included the following:
• Forsyth County Web Page ? Plan updates ? Survey
• Community/Organization Newsletters
? Cumming-Forsyth Chamber of Commerce
? Leadership Forsyth ? Sawnee Center
• Television Stations • Athletic Centers
? Lanier Athletic Center ? Gold’s Gym ? Lanier 400 ? County Park Offices (Sharon
Springs Park & Central Park) • Radio stations
? WDUN News/Talk 55 (WGGA AM 1240 & MAJIC 102.9 FM)
? WCON 99.3 FM/1450 AM ? WKHC ? WNGC ? LAKE 102.3 FM ? WPPL 103.9 FM ? WMLB AM 1170
• Fliers/Posters • Bicycle and Pedestrian System Maps
for Community • Organization Newsletters
? Path ? Pedestrians Educating
Drivers for Safety (PEDS) ? Southern Bicycle League, Inc
• Bike Shops
• Jurisdictional Bike/Ped Plan Updates ? GMRDC ? ARC
• Pedestrian and Bicycle Related Events
? Relay For Life (annual) • Local Festivals
? Cumming Country Fair & Festival (annual)
• Holiday Related Promotions and Events
? Fourth of July ? Memorial Day
1.2.3 Involvement Involvement of the community was achieved through the Bike and Pedestrian Task Force, surveys, a planned public meeting and other avenues identified by the Task Force. 1. Surveys The consultant developed a web site survey that included questions relevant to planning initiatives. The survey is available to the public on the Forsyth County web site. Questions related to bike and pedestrian use were included in these surveys. The information provided an understanding of local opportunities and challenges facing the community and was presented to the Bike and Pedestrian Task Force for its consideration in the development of the Plan. 2. Public Meetings A public meeting to receive additional input was held on March 13, 2002. Every effort was made to include information regarding the goals, progress and results of the Bicycle and Pedestrian Plan at this meeting. The consultant provided all display materials for the public meeting, including displays that help portray the project efforts and accurately frame input and involvement opportunities.

Forsyth County Bicycle Transportation and Pedestrian Walkways 2025 Plan 13
1.2.4 Measures of Effectiveness As with any process, effectiveness of public involvement activities is difficult to measure. However, the consultant team recommended using both quantitative and qualitative measures as a means to evaluate public involvement activities. Quantitative measures are useful in providing information concerning type and level of involvement, as well as the reach across the community. Qualitative measures are useful in determining the level of change that has occurred regarding education and awareness of the Bicycle and Pedestrian Plan and the quality of response to this involvement, as well as providing a mechanism to track these changes. In turn, this information was used to correct the type of public involvement forums being used, if they were deemed not effective. Each of these measures relate to the techniques used for public involvement, as well as the goals for public involvement.
1. Quantitative Measures § Number of opportunities for public
involvement; § Number of community newsletters
containing articles on the Bicycle and Pedestrian Plan ;
§ Number of bicycle- and pedestrian-related press releases;
§ Number of responses to surveys; § Attendance at public meetings; § Number of bike/pedestrian projects
submitted per year; and § Requests to add to the bike/pedestrian
mailing list. 2. Qualitative Measures § Quality of public involvement
opportunities; § Public awareness of the Bicycle and
Pedestrian Plan; § Plan changes from public comments; § Quality of response to public comments; § Availability of information regarding the
Bicycle and Pedestrian Plan; and § Quality of bicycle and pedestrian
projects submitted.
Public Involvement Matrix Below is a matrix assessing the public involvement efforts of the plan. Number of opportunities for public involvement Facilitated and advertised public meeting that was held March 13, 2002
Distributed over 300 paper fliers advertising participation opportunities to the public
Number of community newsletters containing articles on the Bicycle and Pedestrian Plan North Fulton County Bicycle Users Groups (BUG) posted information in the online group newsletter
Number of bicycle- and pedestrian-related press releases An article was written in the Forsyth County News about the development of the Bike/Ped Plan
A full page article was written in the Forsyth County News about the progress of the Forsyth County Bike/Ped Plan An article was published in the Forsyth County News to advertise the public meeting held March 13, 2002
Number of responses to surveys Twenty surveys were filled out and returned to Forsyth County staff members
Approximately forty surveys where filled out on the Forsyth County Bike/Ped Plan web page

Forsyth County Bicycle Transportation and Pedestrian Walkways 2025 Plan 14
Attendance at public meetings Seventeen community members attended the March 13, 2002 public meeting
Requests to add to bike/pedestrian mailing list Approximately thirteen requests were made to be added to the Forsyth Bike/Ped Plan mailing list
Number of web sites posting link to Forsyth Bike/Ped web site Six regional transportation related organizations posted links to the Forsyth County Bike/Ped Plan web page from their main web sites
Public comments in response to the DRAFT Forsyth County Bicycle and Pedestrian Plan 1) Connect Pilgrim Mill sidewalks to two Core parks at end of road, Tidwell Park 2) Construct mountain bike trails in some parks: Sawnee Mtn. 3) Facilitate Lake Lanier Campgrounds for use during winter months 4) Be aware of and take advantage of funding resources and new transportation projects 5) There is an existing lack of sidewalks 6) Construct bike lanes, paved trails, multi-use trails such as with the Silver Comet 7) Develop facilities mainly in Southwest Forsyth 8) Create extension of Big Creek Greenway 9) Construct sidewalks on Castleberry 10) Place street lights along sidewalk areas 11) Place lights in day use areas to be used at night 12) Develop family oriented trails around lake 13) Develop large, safe lanes or facilities around schools, parks and libraries 14) The value and safety of bicycle friendly shoulders is questionable

Forsyth County Bicycle Transportation and Pedestrian Walkways 2025 Plan 15
Section 2. Existing Conditions Subsequent to the development of the Task Force, its vision statement and the public involvement plan, it was important to grasp the baseline condition for bicycle and pedestrian planning in Forsyth County. To assist the Task Force in this effort, an analysis of the federal guidance with respect to bicycle and pedestrian planning was presented and a current trends report detailing similar efforts in the region was used to generate potential ideas for Forsyth County’s plan development. 2.1 Federal Strategy Implementation Analysis To develop a successful Forsyth County Bicycle and Pedestrian Plan, which eventually could be substantially funded with federal funds, it was important to review the federal strategies for promoting the use and proliferation of bicycle and pedestrian facilities and the TEA-21 Planning Factors for guidance and compliance. Recommendations that allow Forsyth County to implement their plan consistent with the TEA-21 Planning Factors and federal regulations were developed and incorporated into the plan. The latest federal guidance on Bicycle and Pedestrian Provisions of the Federal Aid program was issued on February 24, 1999. The following are the federally recommended elements for a statewide or regional bicycle and pedestrian element of the long-range plan. Although these focus on regional and state agencies, it provides an appropriate framework for the development of the Forsyth County plan. 1. Vision and goal statements and network
performance criteria; 2. Assessment of current conditions and
needs;
3. Identification of activities required to
meet the vision and goals developed above;
4. Implementation of bicycle and
pedestrian elements into a Regional Transportation Plan (RTP) and a Transportation Improvement Program (TIP);
5. Evaluation of progress; and 6. Public involvement. The development of the Forsyth County Bicycle and Pedestrian Plan was based on this federal guidance and included each of the federally recommended elements. Furthermore, the development of the Plan will be integrated into the Regional Transportation Planning process, which sets direction for transportation investments, including bicycle and pedestrian facilities. To effectuate this coordination, a copy of the plan document will be submitted to the Georgia Department of Transportation (GDOT) as the designated transportation planning agent for Forsyth County and to the GMRDC. The plan draft goals and objectives reflect federal guidelines and TEA-21 planning factors. TEA-21 is the Transportation Equity Act for the 21st Century. It is the legislation that authorizes all national transportation funding. The TEA-21 Planning Factors are as follows: § Increase the accessibility and mobility
options available to people and for freight;
§ Enhance the integration and connectivity
of the transportation system, across and between modes, for people and freight;

Forsyth County Bicycle Transportation and Pedestrian Walkways 2025 Plan 16
§ Protect and enhance the environment, promote energy conservation and improve quality of life;
§ Promote efficient system management
and operation; § Emphasize the preservation of the
existing transportation system; § Support the economic vitality of the
metropolitan area, by enabling global competitiveness while increasing productivity and efficiency; and
§ Increase the safety and security of the
transportation system for motorized and non-motorized users.
TEA-21 states that Metropolitan Planning Organizations (MPO), such as the ARC, are required to plan for “the development and integrated management and operation of transportation systems and facilities (including pedestrian walkways and bicycle transportation facilities) that will function as an intermodal transportation system…” (Section 1203 and 1204 of TEA 21). Although Forsyth County does not have to meet this requirement since it is not an MPO, the county’s Bicycle and Pedestrian Plan development process meets the spirit of the federal legislation. Federal guidance outlines four main themes that should be addressed in the planning, development and construction of all federal aid transportation bicycle and pedestrian projects and programs: the mainstreaming, funding, safety, and implementation of bicycle and pedestrian projects. 2.1.1 Mainstreaming Non-motorized Transportation The federal guidance strongly encourages bicycle and pedestrian facilities to become the norm rather than the exception in planning, developing and constructing a transportation system. Each project funded
with federal funds should include bicycle and pedestrian facilities, unless they are not permitted. Federal guidance further states that an alternative route on parallel surface streets should be identified and implemented where bicycle and pedestrian use are either prohibited or made incompatible. The federal guidance outlines many simple and cost-effective ways to integrate non-motorized users into the design and operation of the transportation system. The methods include: § Providing paved shoulders on new and
reconstructed roads; § Restriping roads (either as a stand alone
project or after a resurfacing or reconstruction project) to create a wider outline lane or striped bike lane;
§ Building sidewalks and trails, and
requiring new transit vehicles to have bicycle racks and/or hooks already installed.
2.1.2 General Funding Requirements As stated in the federal guidance, “Bicycle and walking contribute to many of the goals for the transportation system we have at Federal Highway Administration (FHWA) and at the state and local levels. Increasing bicycling and walking offers the potential for cleaner air, healthier people, reduced congestion, more livable communities, and more efficient use of precious road space and resources. That is why funds in programs such as Congestion Mitigation and Air Quality Improvement (CMAQ), Transportation Enhancements (TE), and the National Highway System (NHS) are eligible to be used for bicycling and walking improvements that will encourage the use of the two modes.” All the major transportation funding programs can be used for bicycle and

Forsyth County Bicycle Transportation and Pedestrian Walkways 2025 Plan 17
pedestrian programs, so there is no federal barrier in implementing bicycle and pedestrian projects, either as stand-alone projects or in conjunction with other federally funded transportation projects. To date NHS funds have only been used once in the Atlanta region for a pedestrian facility that was not included in a road project. CMAQ is currently under a great deal of scrutiny by state and local agencies who might request that the funds be diverted to other modes of transportation, instead of the current funding levels given to bicycle and pedestrian facilities. Current regional funding levels are not creating a bicycle and pedestrian system that can provide some of the rewards mentioned in the federal guidance. Federal guidance makes it clear that the choice on how to use funds rests with the state; however, there is nothing in TEA-21 or federal transportation legislation that limits the funding, either by the amount or funding category, for bicycle and pedestrian funding. The one restriction in funding guidance is the requirement that bicycle projects funded in Surface Transportation Program (STP), Congestion Mitigation Air Quality (CMAQ), National Highway System (NHS) or Federal Lands Highway Program be “principally for transportation rather than recreation purposes.” Federal provisions also do not allow motorized vehicle use on trails and pedestrian walkways. This may preclude the funding of “cart paths” that has received federal funding in the past. Forsyth County must be aware of the federal funding opportunities and restraints as plans are made for a bicycle and pedestrian system. The system will be implemented more quickly if local funds are leveraged with State and Federal dollars.
2.1.3 Safety The federal guidance states, “We also have a responsibility to improve the safety of bicycling and walking because the two modes represent more than 14 percent of the 41,000 traffic fatalities the nation endures each year…TEA-21 has opened up the Hazard Elimination Program to a broader array of bicycle, pedestrian and traffic calming projects that will improve dangerous locations.” CMAQ, STP and State Community Highway Safety Grant Program funds are also available for non-construction activities or safety programs. To date the Atlanta region has not used funds from the Safety and Hazard Elimination Program to improve the safety of locations for bicycle and pedestrian use, unless it was combined with other road or intersection improvements. The Atlanta region has committed CMAQ funding to two safety programs: the Effective Cycling Classes offered by the Atlanta Bicycle Campaign and the Walking School Bus Program offered by Pedestrian Educating Drivers for Safety (PEDS). A pedestrian safety campaign was funded and conducted by the City of Atlanta. Forsyth County included coordination with local organizations to implement educational and safety programs with available federal funds as part of their Bike/Ped Plan goals and objectives. 2.1.4 Streamlining Implementation
Procedures Federal guidance states, “It makes no sense for activities such as crosswalk striping, bicycle parking installation and bike-line marking – which usually require no additional right-of-way and cause no negative environmental impact – to have the same approval process as a multi-lane highway project. States and MPOs are

Forsyth County Bicycle Transportation and Pedestrian Walkways 2025 Plan 18
encouraged to…take any additional steps they can to speed up the implementation of projects that improve conditions for bicycling and walking.” Currently design for the construction of bicycle facilities and sidewalks could take one year or more and, with the exception of TE projects, goes through the same approval process as multi-lane highway projects. In prioritizing bicycle and pedestrian projects, Forsyth County assessed the implementation and construction aspects of a project in relation to the need for the project. Immediate safety needs, coordination with imminent road projects and low cost striping projects, were identified for streamlined implementation in the Forsyth plan. 2.1.5 Recommendations The development of the Forsyth County Bicycle and Pedestrian Plan provided an opportunity to promote and implement federal strategies for the provision of bicycle and pedestrian facilities consistent with the TEA-21 planning factors. The following specific recommendations were included in the development of plan goals and objectives. § Provide for a safe, convenient and
accessible bicycling and pedestrian environment;
§ Provide interconnection of bicycle and pedestrian facilities between origin and destination land uses, linking residential and commercial zones, education and employment areas, health care and service centers, natural, cultural and recreation resources;
§ Build bicycle and pedestrian planning decisions into every phase of the transportation process, such as planning, construction and maintenance;
§ Implement and coordinate bicycle and pedestrian planning goals through the
development review process where feasible;
§ Explore maximizing local opportunities to fund bicycle and pedestrian projects in conjunction with other projects/programs; and
§ Coordinate bicycle and pedestrian system planning with other countywide efforts such as park and greenway planning
2.2 Current Trends While recreational cycling is still the primary use of bicycles in this country, people nationwide are recognizing the energy efficiency, cost effectiveness, health benefits, and environmental advantages of bicycling for transportation purposes. Nationwide, communities are organizing bicycle and pedestrian master plans to prepare for the needs of commuters who choose to bicycle and/or walk to work. More funding sources have become available, and bicycle and pedestrian facilities are becoming more popular in the North Georgia Region. Examples of dedicated bicycle and pedestrian corridors within the Region that have become success stories and models for the community include the following:
1. The Silver Comet Trail; 2. The GDOT Statewide Bicycle
Network; 3. The Stone Mountain to Atlanta
Trail; 4. Alpharetta’s Big Creek
Greenway; 5. Powder Springs’ Wildhorse
Creek and Lucille Creek Greenways; and
6. Roswell’s Riverside Drive trails and bike lanes.
Many communities are currently planning or constructing additional bicycle and pedestrian corridors that will be opened in the near future. As more and more bicycle

Forsyth County Bicycle Transportation and Pedestrian Walkways 2025 Plan 19
and pedestrian corridors are created, people in Forsyth County will realize the benefits of using these facilities for recreation and for commuting. By wisely planning for, and actively implementing a network of bicycle and pedestrian facilities, Forsyth County will enjoy the benefits of having alternative modes of transportation. 2.2.1 Benefits of a Bicycle and Pedestrian Transportation Plan The development of a Bicycle and Pedestrian plan is essential to getting the funding secured to build proposed improvements within Forsyth County. However, there are other important benefits that arise from establishing a Bicycle and Pedestrian Plan:
• Connectivity may be provided between schools, parks, libraries and other areas of interest. This connectivity in turn reduces the reliance on the automobile and increases interactions between community members;
• Bicycle and pedestrian facilities will double as recreational amenities, not only serving bicyclists and those who walk, but also for those who run, skate and love nature. The additional recreational outlets will provide the community with an arena for physical activity and the health benefits associated with exercise;
• Groups such as PEDS can work with the County for the purpose of improving pedestrian safety; and
• BUGs can be formed to promote safe cycling.
As Forsyth County continues to grow and as the potential for transit improvements grow, it becomes essential to consider increasing the availability of bicycle and pedestrian facilities along potential future transit routes and between points of interest within Forsyth County. In order to advertise the
benefits of walking and bicycling the following programs were included as strategies for implementation: 1. Educational programs for cyclists, pedestrians, and motorists, to promote safety;
2. Promotional campaign to promote usage of expanded facilities; 3. Programs to enforce laws as they apply to bicycles and pedestrians; 4. Methods to provide safe, clearly designated facilities for bicycles and pedestrians; and 5. Maintenance programs to keep the facilities clear of vegetation and debris. 2.2.2 Regional, State and National Trends 1. Regional Bicycle and pedestrian transportation became an important issue in the North Georgia Region nearly thirty years ago. In 1973, the ARC adopted a document entitled The Bicycle: A Plan and Program for its use as a Mode of Transportation and Recreation. The following were the plan’s objectives:
1. Assess current bike trends; 2. Develop a conceptual bike facility
plan that identified corridors with the most potential for facilities;
3. Select and evaluate types of facilities;
4. Determine potential funding sources; 5. Research legal constraints to
providing facilities; 6. Suggest education and registration to
reduce accidents and thievery; and 7. Select a demonstration project to
illustrate the utility of facilities.

Forsyth County Bicycle Transportation and Pedestrian Walkways 2025 Plan 20
The report made the following recommendations:
1. Pursue Federal funds to implement these projects;
2. Develop bikeways in more areas, which are coordinated at a regional level;
3. GDOT petition the state legislature for bikeway funds, and
4. Allocate additional staff time at all levels be allocated to bike planning.
In 1979, ARC published a technical memorandum entitled Bicycle Planning & Implementation in the Atlanta Region. This document was an evaluation of Atlanta’s bicycle and pedestrian transportation facilities. The next significant development in bicycle and pedestrian transportation planning did not occur until 1991 when the United States Congress adopted the Intermodal Surface Transportation Efficiency Act, also known as ISTEA. This legislation placed new emphasis on bicycle and pedestrian facilities as legitimate transportation options. Higher levels of federal funding were made available for the design and construction of bicycle and pedestrian facilities. In response to the new emphasis on bicycle and pedestrian planning, ARC created the Bicycle and Pedestrian Planning Task Force in 1992 to assist in the development of a regional Bike/Ped Plan. In 1993, ARC published the Bicycle Transportation and Pedestrian Walkways Plan that represented a primary shift in focus to explicitly include pedestrian issues in addition to bike issues. However, the effort fell short because the plan was a compilation of local plans with little regional coordination or cross-jurisdictional integration. In 1995, ARC published an update to the Bicycle Transportation and Pedestrian Walkways Plan. The update focused only on revising the projects in the 1993 plan. The
new plan laid the foundation for the development of the bicycle and pedestrian section of the 2025 RTP. Although the ARC region’s bicycle and pedestrian planning efforts are progressive in comparison to other parts of the State, there are still many safety and funding issues left unresolved. In terms of pedestrian safety, the Atlanta area had the second highest pedestrian fatality rate in the nation. Moreover, due to congestion and air quality problems, bicycle and pedestrian planning in the region has typically not been a priority. The history of bicycle and pedestrian planning in the ARC region, its successes and shortcomings, is very useful for the development and implementation of Forsyth County’s bicycle and pedestrian planning efforts. Forsyth County has not been directly involved in these efforts since it belongs to the GMRDC. The counties in this Regional Development Center include Banks, Dawson, Franklin, Habersham, Hall, Hart, Lumpkin, Rabun, Stephens, Towns, Union and White. Due to the rural nature of the counties in this region, and because the GMRDC has limited funding for transportation planning, little attention has been given to bicycle and pedestrian planning efforts at the regional level. The GMRDC does review Developments of Regional Impact (DRI’s), as does ARC, to determine compliance with the regional plans. In this effort, bicycle and pedestrian facilities are generally recommended for inclusion in developments. Moreover, the GMRDC is in the process of updating its RTP, which may include a bicycle and pedestrian element.

Forsyth County Bicycle Transportation and Pedestrian Walkways 2025 Plan 21
In recent years, there has been a greater emphasis on bicycle and pedestrian mobility at the regional scale. Non-motorized transportation has become a more legitimate transportation alternative to the single occupancy vehicle (SOV) in the North Georgia area. New attitudes, more funding, and better planning are helping to shape a friendlier atmosphere for those who chose to use bike lanes and sidewalks as an alternative form of transportation. 2. State GDOT has also established a new set of policies and mindset that is more bicycle and pedestrian friendly. The State’s Bicycle Coordinator works with all counties and RDCs to maximize and coordinate facility construction. In the case of Forsyth County, the Statewide Bicycle Coordinator can be instrumental in the implementation of facilities since GDOT helps to program County projects in the RTP. Projects that are identified in the Forsyth Plan will, therefore, be delivered and communicated to GDOT for funding and implementation. GDOT created a bicycle master plan for the State of Georgia. This master plan proposes a network of 14 named and numbered routes, totaling 2,943 miles that are, or will be, particularly well suited for bicycle use. Six of the routes, totaling 265 miles, will pass through the ARC Region. The Northern Crescent Route passes along the southern end of Forsyth County, along the Gwinnett County – Chattahoochee River boundary. Signing of the network is expected to take five years. As sections of these routes are improved through GDOT normal road improvement projects, they will be upgraded with wide curb lanes, bike lanes, paved shoulders, and/or sidewalks. The Statewide improvements within the ARC Region are already in the RTP. GDOT recently adopted and is implementing a more visible crosswalk standard. The new standard is appearing on
roads that are controlled by the state, and also on many that are not. The new crosswalks are boldly striped, and give pedestrians more visibility on Georgia’s roadways. GRTA was created in 1999 by the Legislature to promote regional cooperation in transportation. GRTA encourages better planning by government at all levels with involvement by citizens. One way that GRTA is encouraging public input into the transportation system is through its Citizen’s Academy, which is divided into four groups. One group concentrates on transportation greenways, which are defined as linear linkages from origin to destination. The greenways may or may not include motorized transportation, but emphasize linear bicycle and pedestrian transportation linkages between origins and destinations. The group is also beginning to access the existing regional greenway network in the hopes of creating a true network of greenways to better serve non-motorized transportation options. Another group of GRTA’s Citizen’s Academy is investigating alternative street designs. They are concentrating on ways to design roads to better accommodate bicyclists, pedestrians, and transit users. The group is encouraging jurisdictions to base their design guidelines on context sensitive design. The group is also looking at road design characteristics, such as bump outs, shelters, and better signage to increase the accessibility of Georgia’s roadways to non-motorized and transit-oriented transportation alternatives. 3. National Bicycle and pedestrian issues are taking greater precedence across the nation. As

Forsyth County Bicycle Transportation and Pedestrian Walkways 2025 Plan 22
development trends change to better integrate land use and transportation planning, pedestrian and bicycle facilities are more feasible. The trends that are attempting to combat “urban sprawl” in the United States favors construction of bicycle and pedestrian friendly corridors. For instance, the Regional Development Process (RDP) began in the state of California and is now used nationwide. The RDP encourages an integrated planning system that links transportation improvements to non-transportation improvements such as land development. The United States Department of Transportation published the National Bicycle and Walking Study in 1994. The study expresses a renewed interest in non-motorized transportation. The study also sets two goals, to double the percentage of trips made by foot and bicycle while simultaneously reducing the number of crashes involving bicyclists by ten percent. The Transportation Equity Act of the 21st Century (TEA-21) was signed into law by President Clinton on June 9, 1998. TEA-21 continues funding to integrate bicycling and walking into the overall transportation system. It also provides opportunities for communities to sponsor projects that will improve the safety and mobility for cyclists and pedestrians. FHWA has reacted positively to bicycle and pedestrian facility planning. Officials at FHWA are becoming more aware of and better prepared to handle bicycle and pedestrian issues. In August of 1998, FHWA convened a Task Force to seek advice on how to proceed with developing design guidance for bicycle and pedestrian facilities. After reviewing the numerous planning and technical manuals on designing pedestrian and bicycle facilities, the Task Force concluded that another set of guidelines was not necessary. The Task Force helped develop a set of policies.
In 1999, the American Association of State Highway and Transportation Officials (AASHTO) published the Guide of the Development of Bicycle Facilities. This guide book helps communities and planners in the development of bicycle and pedestrian facilities. The document recognizes the historic role of bicycles in transportation and underscores the notion that a bicycle is a viable transportation mode. Like FHWA, AASHTO Guide supports the use of bicycles on all highways, “except those where cyclists are legally prohibited.” AASHTO mandates that “all highways should be designed and constructed under the assumption that they will be used by cyclists. Therefore, bicycles should be considered in all phases of transportation planning, new roadway design, roadway reconstruction, and capacity improvement and transit projects.” AASHTO recognizes that “safe, convenient and well-designed facilities are essential to encourage bicycle use.” AASHTO is currently producing a guide for pedestrian facilities, which is expected to give the same support to pedestrian facilities as it does to bicycle facilities. There has been a shift in the way that bicycle and pedestrian facilities and the people who use those facilities are viewed. Regionally, more funding and importance is given to non-motorized transportation. From a state viewpoint, bicycles and pedestrians are being better accommodated. Nationally, sidewalks and bicycle facilities are being seen as important additions to the overall transportation system. There is an obvious attempt to balance the needs of non-motorized transportation with those of the broader community. 2.2.3 Local Trends Many cities and counties within the ARC and GMRDC regions currently have, or are planning to create, a bicycle and pedestrian master plan. Some are well organized and

Forsyth County Bicycle Transportation and Pedestrian Walkways 2025 Plan 23
professionally planned documents, while others are less aggressive plans developed by staff members. Regardless of who prepared the plans or how detailed they are, many communities in the Forsyth County Region are attempting to accommodate bicyclists and pedestrians in their transportation systems. Below is a summary of jurisdictional efforts to plan for bicycle and pedestrian facilities in communities near Forsyth County. The summary attempts to detail which jurisdictions do or do not have bicycle and pedestrian master plans in place, and which communities plan to do so. These plans have been analyzed for ideas and strategies to implement in the Forsyth County plan. 1. Neighboring Counties within the GMRDC: Dawson, Hall and Lumpkin counties do not have bicycle and pedestrian master plans. Hall County does require sidewalk construction with new developments. 2. Other Neighboring Counties:
Cherokee County does not have a bicycle and pedestrian master plan. However, the County uses its Land Development Policies (LDP) to require developers to contribute to bicycle and pedestrian facilities. Cobb County has a bicycle and pedestrian master plan. The county has also begun to provide bicycle friendly shoulders. DeKalb County has a bicycle and pedestrian master plan. The county GDOT’s Local Assistance Resurfacing Program (LARP) includes striping wider outside lanes for bicycle traffic where possible. Fulton County included a bicycle and pedestrian master plan as part of its transportation master plan. This plan was adopted in 2000. Fulton County has provisions to require sidewalks.
Opportunities for Forsyth County to connect to Fulton County facilities were maximized.
Gwinnett County does not have a specific bicycle and pedestrian master plan, however, they have compiled a list of bicycle and pedestrian projects as part of their CTP and included them for Special Option Sales Tax (SPLOST) funding.
Pickens County does not have a bicycle and pedestrian master plan.
3. Representative Regional Cities: City of Alpharetta (Fulton County) adopted a bicycle and pedestrian master plan in the Spring of 1996. The city is currently addressing bicycle and pedestrian facilities as part of the development of a CTP. The city has a sidewalk ordinance, requiring sidewalks adjacent to all roadways. City of Atlanta (Fulton County) has a greenway plan that addresses bicycle and pedestrian issues. The city has a sidewalk ordinance.
City of Canton (Cherokee County) has a bicycle and pedestrian master plan for the downtown. Canton also has the Etowah River Greenway master plan, which provides bicycle and pedestrian connections from downtown Canton to newer commercial and residential neighborhoods. The city also has an ambitious sidewalk program to enhance major corridors. The city requires sidewalks to be constructed as part of its development regulations.
City of Gainesville (Hall County) does not have a bicycle and pedestrian master plan. However, the city requires sidewalks through their sidewalk ordinance.
City of Lawrenceville (Gwinnett County) does not have a bicycle and pedestrian master plan. Lawrenceville’s sidewalk ordinance requires sidewalks within all

Forsyth County Bicycle Transportation and Pedestrian Walkways 2025 Plan 24
major residential and non-residential subdivisions.
City of Marietta (Cobb County) does not have a bicycle and pedestrian master plan. The city requires sidewalks through their sidewalk ordinance.
City of Powder Springs (Cobb County) has a comprehensive bicycle and pedestrian master plan, as part of its Community Enhancement Master Plan, which was adopted in 1996. The city has a sidewalk ordinance, which requires sidewalks on one side of the street. City of Roswell (Fulton County) adopted a comprehensive bicycle and pedestrian master plan, as part of its overall transportation plan in 2000. The city of Roswell has a sidewalk ordinance. City of Woodstock (Cherokee County) adopted a bicycle and pedestrian master plan in 1999. A sidewalk ordinance in Woodstock requires sidewalks on at least one side of the street. 4. Community Improvement Districts (CID) Community Improvement Districts are special taxing districts created by Counties to generate funds for improvements within specified non-residential areas. Typically, business interests are the catalyst for creating these districts. They self impose an additional tax that they have control over and use to match federal funds for projects or for funding other improvements. CID’s have been formed in many areas of the region and some have used their resources for implementing bicycle and pedestrian projects. Cumberland CID (Cobb County) has a bicycle and pedestrian master plan that was completed in 1999. The CID has been instrumental in building sidewalks around
Cumberland Mall and in helping to fund a pedestrian bridge across Cobb Parkway.
Town Center CID (Cobb County) completed a bicycle and pedestrian master plan in 1999. The Dekalb Perimeter Center CID completed a sidewalk master plan and bicycle suitability map for roadways in their area. Construction of sidewalk projects is ongoing.
Cherokee County, Gwinnett County, Fulton County, have all recently created CID’s. 5. Transportation Management Associations (TMA) TMA’s are organizations usually funded with CID dollars that promote the use of alternative transportation within their special tax districts. Cobb Rides (Town Center Area) does not have a bicycle and pedestrian master plan. They intend to design a plan for future use. Cumberland Transportation Network (Cobb County) does not have a bicycle and pedestrian master plan. They do not intend to design one at this time.
Gwinnett County TMA does not have a bicycle and pedestrian master plan.
2.2.4 Within Forsyth County Forsyth County’s growth and development have proven to be a challenge for all transportation infrastructure. The County’s roadway network, particularly in the southern portion of the County, is in need of widening and there are several widening projects currently under design. In addition to roadway improvements, the County must also keep pace with the need for bicycle and pedestrian transportation needs. Although the County does not have a specific

Forsyth County Bicycle Transportation and Pedestrian Walkways 2025 Plan 25
ordinance to require sidewalk installation within developments, many of the subdivisions in the County have constructed sidewalks interior to the developments. Key to planning for the future bicycle and pedestrian network in the County was linking these existing neighborhood sidewalks to activity destinations. In addition, although the County currently does not have any existing bicycle facilities, future roadway improvement plans were analyzed to determine the possibility of including some form of bicycle facility infrastructure within these plans. Currently, there is not any public transit in Forsyth County. The only form of public transit is a Dial-A-Ride demand/response system, which is currently underutilized. This deficiency limits the County’s transportation options and focuses attention on SOV. However, the County has negotiated with GRTA to improve certain roadways for transit access. GRTA’s Northern Sub Area Study is also recommending construction of park and ride lot facilities in the County. The future bicycle and pedestrian network must be coordinated with the potential for expanded transit use in the County. The following documents are being updated by the County. The status of bicycle and pedestrian planning issues within these documents is outlined. The County’s Comprehensive Transportation Plan 2001 Update- The County has recently completed an update of their comprehensive plan, which clearly outlines roadway needs now and in the future. There is no specific bicycle and pedestrian element in this document. However, the development of the Bicycle and Pedestrian Plan was closely coordinated with the CTP. The County’s Comprehensive - Future Land Use Plan (1994-2015 – updated 1997-98)
recommends development of a pedestrian circulation system that extends beyond the Village Center to link with County neighborhoods. The plan recommends that walkway improvements should be planned along major road corridors that include Peachtree Parkway, Buford Highway, Dahlonega Highway, Canton Highway, McFarland Road, Bethelview Road, Post Road, Atlanta Highway, and McGinnis Ferry Road. This plan also recommends that the pedestrian circulation system be linked with the County’s schools. The County’s Unified Development Code includes design guidelines for village type residential and commercial development that encourages pedestrian friendly communities. Developments encouraged under these design guidelines have yet to be proposed in Forsyth County. In 2000, Forsyth County published the Georgia Greenspace Program – Forsyth County Grant Application – Community Program Report. The report was developed in an effort to gain grant money provided by the Georgia Greenspace Program. These funds will assist the County in purchasing and preserving designated greenspace. Among the goals and objectives listed in this plan is to develop pedestrian trails linking recreation sites that will eventually result in a regional trail system. An acquisition strategy has been developed under the Community Program, which targets acquiring a minimum of 2% (576 acres) for greenways and 0.5% (150 acres) for bikeways. The Comprehensive System-Wide Recreation Master Plan (2000-2006) was also developed in 2000. Among its goals is to provide additional passive use facilities including linking nature trails, interpretation areas and greenways. The plan recommends greenway development of two river corridors and one stream corridor. The Chattahoochee River corridor is the subject of interest from a preservation standpoint. A greenway extending to the south from Lake

Forsyth County Bicycle Transportation and Pedestrian Walkways 2025 Plan 26
Lanier through the Twin Branches Unit of the Chattahoochee River National Recreation Area would be a viable project. The Etowah River corridor in northwest Forsyth County offers a second opportunity for greenway development. The city of Canton in Cherokee County is beginning development of a greenway along the Etowah, and it is quite feasible that Cherokee County will continue the greenway through the northeast portion of the county. James Creek and some of its tributaries offer a third opportunity. The development plan for Windermere incorporates a multi-purpose trail for approximately two miles throughout the 87 acres park property. Three bikeways are also recommended (S.R. 369, S.R. 9 and S.R. 20). In reviewing the federal guidance for bicycle and pedestrian planning, Forsyth County and the Task Force agreed to tailor the plan development process to be consistent with the goals of TEA-21, particularly to maximize federal funding opportunities for the plan. In addition, current trends reviewed allow the task force to consider ideas for bicycle and pedestrian planning that would be applicable to Forsyth County. However, to plan for a 25 year horizon, the task force also had to assess current and future challenges and opportunities in the context of the larger land use, environmental and transportation framework of the region. The feasibility of implementing the plan was also deemed dependent on the political and technical environments. Therefore, at the start of the strategic planning process to select alternatives, these issues were also analyzed and addressed.

Forsyth County Bicycle Transportation and Pedestrian Walkways 2025 Plan 27
Section 3. Strategic Planning Process As stated previously, the vision for the Forsyth County Bicycle and Pedestrian Plan is to: foster the development of an interconnected network of bicycle and pedestrian facilities that meets Forsyth County’s future transportation mobility, serves recreation needs, promotes alternative means of transportation and enhances the County’s overall quality of life. The strategic planning process was used to identify issues and opportunities pertinent for the implementation of the stated plan vision. As part of this process, existing levels of service were assessed, regional land use, transportation and environmental planning efforts and processes were reviewed for possible coordination opportunities, and the technical and political environments were analyzed for their influence on successful implementation of bicycle and pedestrian systems. The strategic planning process detailed the potential challenges and opportunities to successful bicycle and pedestrian planning in Forsyth County and developed ideas for overcoming such obstacles. These ideas were formulated into specific strategies for action outlined in Section 4. Ultimately, these strategies formed the basis for identifying potential bicycle and pedestrian alternatives to include in the 2025 Bicycle and Pedestrian Plan. 3.1 Bicycle and pedestrian planning in relation to the larger Land use, Transportation and Environmental planning framework 3.1.1 Local Land Use Planning 1. Local Comprehensive Planning In 1989 the Georgia Planning Act was passed, establishing a planning program providing local governments with a guide for minimum standards and procedures for
local comprehensive planning. The local comprehensive plan is intended to highlight community goals and objectives, as well as determine how the government proposes to achieve those goals and objectives. It is intended that the comprehensive plan be used to guide local government decision-making on a daily basis. In order to maintain eligibility for certain state grant programs, local governments are required to adhere to the Minimum Standards and Procedures for Local Comprehensive Planning, which are administered by the Department of Community Affairs (DCA). The County’s Planning Department is responsible for the development of the Land Use Plan consistent with the DCA guidelines. The adopted Land Use Plan goals and strategies include: § Encouraging alternate modes of
transportation; § Encouraging village center type
developments around key corridors. These centers are meant to include cultural and social activities in a pedestrian friendly setting (urban village zoning district);
§ Recommending a pedestrian circulation system that extends beyond village centers to County neighborhoods;
§ Development of a Countywide plan for bike paths and bike lanes; and
§ Development of a countywide sidewalk system connecting areas such as schools, residential neighborhoods and village activity centers.
The County’s Engineering Department is responsible for the development of the Transportation element of the comprehensive plan. Recently, a CTP was developed for Forsyth County, which outlines future roadway needs. These needs are included in updates to the comprehensive plan. Future bicycle and pedestrian needs will be formulated with the

Forsyth County Bicycle Transportation and Pedestrian Walkways 2025 Plan 28
development of the Bicycle and Pedestrian Plan and included in updates to the comprehensive plan. 3.1.2 Regional Planning 1. RDC Forsyth County is a member of the GMRDC. The RDC provides assistance to counties within their jurisdiction in the areas of transportation, land use and environment. Regional Transportation Element The RDC develops a comprehensive regional plan pursuant to DCA guidelines. There is a transportation element in the plan, which is a compilation of transportation plans and programs developed by the GDOT for the County’s in the region. Regional Land Use Element In the comprehensive regional plan, a set of development guidelines regarding land use has been adopted by the RDC. These guidelines do not include any reference to bicycle and pedestrian planning. There are some guidelines that encourage the coordination of land use and transportation planning. DRI State law requires that developments above a certain threshold be reviewed and approved by the RDC. GMRDC reviews major developments in Forsyth County and makes specific recommendations for improvements. Some of these recommendations may include the provision of bicycle and pedestrian facilities. Environmental Coordination The RDC provides technical guidance for developments along the Chattahoochee River. They also conduct watershed planning studies within the Lake Lanier and Etowah Basins. The GMRDC also assisted the local jurisdictions with development of their greenspace programs.
2. ARC The EPA designated a 13 county metropolitan Atlanta area in serious non-attainment for air quality standards pursuant to the Clean Air Act. Forsyth County is included in the 13 county non-attainment area. Therefore, transportation projects of regional significance in Forsyth County are included in the ARC conformity determination and travel demand modeling processes. Forsyth County projects are also programmed through the ARC short term TIP. Due to Forsyth County’s inclusion in the non-attainment area, the County is bound by restrictions to capacity enhancing projects when the ARC region reaches conformity lapses. Currently, there is an approved long-range plan in conformity with federal regulations. Forsyth’s inclusion in the non-attainment area also makes them eligible for CMAQ funds. CMAQ funds are a primary source of bicycle and pedestrian project funding and are selected and programmed through the ARC. 3. GRTA In 1999, the Governor created a new agency to address regional land use and transportation issues in areas considered in non-attainment of air quality standards. GRTA’s land use responsibilities include reviewing DRI’s and approval of any use of federal funds for road projects within DRI’s. During the DRI review process, GRTA has the ability to require inclusion of bicycle and pedestrian facilities in proposed developments in order to mitigate negative transportation impacts of the development. GRTA has also established an Alternative Street Design Citizens Academy that focuses on best practices and design for bicycle and pedestrian facilities. A report is due in May 2002 that will be used by GRTA and others to encourage local governments in the region, as well as GDOT, to adopt these best practices. Additionally, GRTA has expedited implementation of additional transit in the region, which will need to be supported by pedestrian systems.

Forsyth County Bicycle Transportation and Pedestrian Walkways 2025 Plan 29
4.Metropolitan North Georgia Water Planning District In April 2001, the Georgia legislature created a new Water Planning District whose main function is to develop regional and watershed specific plans for storm water management, wastewater management and water supply for an 18 county area in North Georgia. Forsyth County is included in this area. The District Board is working closely with the RDC’s in their start up process. Several consultant contracts will be awarded to develop these plans. In the development of these types of plans, the amount of existing transportation infrastructure, including bicycle, pedestrian and non-motorized facilities, is needed to determine amounts of water runoff. 3.1.3 Statewide Planning 1.Georgia Department of Transportation (GDOT) Local Planning Agency GDOT is the local planning agency for Forsyth County. As such, transportation projects of regional significance included in the ARC plans are implemented by GDOT. GDOT also coordinates with Forsyth County to include their transportation needs in the STIP. With respect to bicycle and pedestrian facilities, GDOT cannot, by law, separately fund construction of these facilities with gas tax dollars. However, they are currently implementing the Statewide Bicycle Route plan and do include these type of facilities in their roadway design plans, if the facilities are included in adopted local plans. Statewide Plan implementation is the full time responsibility of the State’s Bicycle and Pedestrian Coordinator. Five County Study GDOT is currently establishing a transportation planning process for Forsyth County, and four other non-attainment counties, similar to the ARC process. The process will provide the necessary
transportation planning tools, public involvement process guidelines and travel demand modeling processes to be consistent with federal regulations. The travel demand model will be consistent with the ARC models and will also have an air quality component so that conformity determinations can be performed for the five county area. The new model process refines the analysis area in Forsyth County, thereby, allowing a more detailed county level analysis potential for projects. However, there are no plans to include a non-motorized component to the model. 2. Governor’s Office of Highway Safety (GOHS) GOHS is a statewide agency that currently provides an average of $250,000 a year in grants to local jurisdictions to promote pedestrian and bicycle education programs. Most of the dollars are expended on pedestrian programs. This amount is approximately 1% of their total budget and includes funds expended throughout Georgia. 3. Georgia Conservancy The Georgia Conservancy is a statewide agency that continues to coordinate with communities to master plan large areas pursuant to smart growth policies. Typically, these smart growth policies have included the improvement of the pedestrian and bicycle environments. 4. Trust for Public Land (TPL) The Trust for Public Land is another organization that works with local governments and citizens to implement bicycle and pedestrian facilities in close proximity to green spaces and rivers. TPL participates in technical advisory committees established by the GMRDC. 5. Greenspace Planning In April of 2000 the Governor approved the Georgia Greenspace Program. The program awards grants to counties throughout

Forsyth County Bicycle Transportation and Pedestrian Walkways 2025 Plan 30
Georgia who have undertaken a plan to set aside 20% of their land for greenspace. Greenspace planning efforts have traditionally been coordinated with the implementation of bicycle and pedestrian facilities, particularly if some of the designated greenspace are accessible greenways. Although the greenspace program does not allow the purchase of land for bicycle and pedestrian transportation facilities, promotion of a coordinated and connected system could be achieved with the addition of greenspace trails. Challenges/Opportunities: The challenges for the County relate to the general area of transportation planning. Currently, the majority of the transportation planning function is conducted by agencies other than Forsyth County. For example, GDOT coordinates project planning and programming in Forsyth County, as does ARC, due to the County’s inclusion in the non-attainment area. On the opposite end of the scale, the GMRDC, of which Forsyth County is a member jurisdiction, performs very little transportation planning at the regional level. This disconnect in the transportation planning arena makes bicycle and pedestrian plan coordination more difficult. However, the County has risen to the challenge. The response to the accelerated growth in the County has allowed the establishment of progressive and sophisticated planning at the local level. For example, the comprehensive plan already includes policies to further the construction of bicycle and pedestrian facilities. Also, the development of the County’s first Bicycle and Pedestrian Plan is underway. With the adoption of the plan there will be many opportunities to apply for funding and to coordinate with local groups and agencies, such as GRTA, TPL and the Georgia Conservancy, to further plan implementation. The environmental framework also provides opportunities for implementation of non-motorized transportation. With watershed planning
studies underway, the impact of roadway investments on runoff and water quality will be quantified. In an effort to minimize the negative impacts of such runoff, agencies will encourage mobility that is provided by bicycle and pedestrian enhancements and minimize roadway construction for vehicles. 3.2 Bicycle and Pedestrian issues within the political and technical environments 3.2.1 Technical Environment 1. Adequacy of existing levels of service There are currently no recognized or designated bicycle facilities in Forsyth County. Data on existing pedestrian facilities indicates that many subdivision developments have interior sidewalks. However, these sidewalks currently do not provide desired connectivity to schools, parks or employment areas.
2. Potential connections to points outside Forsyth County (Cherokee, Dawson, Fulton, Gwinnett, Hall, Lumpkin and Pickens) Bicycle and pedestrian facilities have been investigated for points outside of Forsyth County in order to assure coordination in the strategic planning process. Particular points of interest include the counties of Cherokee, Dawson, Fulton, Gwinnett, Hall, Lumpkin and Pickens. The associated RDC and Planning Departments for each county were contacted for information on Bicycle and Pedestrian Facility Master Plans. GDOT was also used as a resource for future planned projects. When developing the alternatives analysis, the available plans were consulted and opportunities for connections were maximized. City of Canton and Cherokee County have the Etowah River Greenway master plan, which provides bicycle and pedestrian connections from downtown Canton to newer commercial and residential neighborhoods. The Etowah River Greenway extends from Canton to the

Forsyth County Bicycle Transportation and Pedestrian Walkways 2025 Plan 31
eastern county border where the river enters Forsyth County. A proposed greenway along the Etowah River in Forsyth was included in the Plan.
Fulton County. The best opportunity for connecting facilities to the Fulton County plan is found in the City of Alpharetta. The Big Creek Greenway trail is a recent successful greenway project that runs north to the Forsyth County line. The 2000 plan also includes a proposed greenway along the Chattahoochee River corridor, which extends north to the county line. Sidewalks and bike lanes are proposed for Medlock Bridge Road, which offers linkage northward to Peachtree Parkway. The proposed Georgia Statewide Bicycle Network extends east to west through Fulton County. The Northern Crescent route follows the Fulton/Forsyth County line along McGinnis Ferry Road, from the southeastern corner of Forsyth County to Sargent Road. Proposed greenways along the Chattahoochee River and Big Creek were recommended in the Forsyth plan. Forsyth County’s Bicycle and Pedestrian Plan development will also be coordinated with the Georgia Department of Transportation Statewide Bicycle and Pedestrian Plan. There are fourteen routes within the network that comprise approximately 2,943 miles. These routes were developed to complement other bicycle and pedestrian facilities that are planned or are underway. There are not any plans to dedicate funds to this plan; however, internal procedures will require designers to incorporate bicycle and pedestrian facilities elements into programmed improvement projects. This process would allow the entire network to be nearly completed within the next 20 years. Forsyth County’s plan was coordinated with the State’s Northern Crescent route.
3. ARC Region Technical Capabilities Non-motorized model ARC currently has a consultant contract that will assist in the design and implementation of a non-motorized travel demand model for the region. This effort will include an identification of possible pedestrian environment variable measures to use in the region. The actual calibration of the non-motorized models will require information on travel patterns that will only be available from the home interview survey presently being conducted by ARC. However, this data will not be available until the spring of 2002; therefore, the non-motorized models will not be available until the end of the year. This update can be coordinated with the GDOT Five County Study. CMAQ Bikeway/Walkway Project Evaluation In order for bikeway and walkway projects to qualify for CMAQ funding, quantitative tools are required by the Federal Highway Administration to project emission reductions that would result from proposed projects. Currently, bicycle and pedestrian modes are not included in the ARC model and, as stated above, cannot be included until the end of 2002. An interim approach was needed to evaluate CMAQ project’s air quality benefits, therefore, a sketch-modeling tool, which can be used to estimate the vehicle miles traveled reductions for both individual projects and for the overall program was developed. A bicycle trip sketch modeling tool, as well as a pedestrian projection modeling tool, was developed for this purpose and will continue to be used by ARC until the development of their non-motorized models by the end of the year. Forsyth County is eligible for CMAQ dollars and has applied for funds through the GDOT. However, the County has yet to receive any CMAQ dollars for implementation of bicycle and pedestrian facilities.

Forsyth County Bicycle Transportation and Pedestrian Walkways 2025 Plan 32
Bicycle Suitability Mapping process ARC currently has a consultant contract to develop a bicycle suitability map for the region. The map identified roadways with different levels of suitability for bicycle use. The suitability map is oriented toward intermediate or experienced bicyclists who are familiar with the roads and rules of cycling. The criterion assessed included traffic volumes, shoulder widths, posted speeds and pavement conditions. Based on this criteria, ratings of excellent, good, fair and poor were identified for well traveled routes leading to major origins and destinations. The routes will be identified by the Task Force, public involvement process, and BUGs throughout the region. Forsyth County is not included in this mapping process. However, future bicycle and pedestrian planning efforts in the County can include a suitability mapping process. Project Development and Implementation process Forsyth County applies for funding of bicycle and pedestrian projects through the ARC. Applications are submitted on ARC Project Evaluation forms, which are designed to prioritize projects that meet Regional Bicycle and Pedestrian Plan goals and further the ARC Regional Development Plan policies. Project evaluation forms also attempt to secure as much technical information as possible from the local governments. Data Collection Data collection efforts in Forsyth County should be coordinated with ARC efforts. For example, ARC has developed a regionwide Geographical Information Systems (GIS) database of existing and planned bicycle facilities. An additional database will consist of a regionwide
Bicycle Suitability Map. However, as previously mentioned, Forsyth County is not included in these efforts. The County should work with the GMRDC to explore expanded data collection assistance in the area of bicycle and pedestrian facilities. 3.2.2 Political Environment 1. ARC Region The ARC region has been placing greater emphasis on land use and transportation coordination issues with the adoption of new Regional Development Plan policies. Many of these policies encourage the provision of bicycle and pedestrian facilities. The Livable Centers Initiative Program grants funds to jurisdictions that make the land use/transportation connection. ARC is also providing technical assistance to member jurisdictions for the provision of such facilities. Although Forsyth County is not bound by these land use/transportation coordination issues currently, there is a potential that this same issue will become pertinent in future planning efforts in the area.
2. GRTA As mentioned previously, GRTA is also emphasizing the coordination of land use and transportation. Bicycle and Pedestrian facilities are typically characterized as a tool for enhancing the land use and transportation connection. Forsyth County is politically under the jurisdiction of GRTA due to its inclusion in the non-attainment area. GRTA’s role includes some land use authority with respect to DRI reviews.
3. GDOT By way of the five-County study, GDOT proposes to establish a transportation planning process similar to the ARC region. However, this process does not include the establishment of a regional Bicycle and Pedestrian Plan for GMRDC, nor does it include the establishment of a database of bicycle and pedestrian facilities. A bicycle

Forsyth County Bicycle Transportation and Pedestrian Walkways 2025 Plan 33
suitability mapping project, similar to ARC’s, seems years away in the GMRDC. Lastly, the travel-demand modeling process being established for the five-County area will not include non-motorized analysis capabilities as planned for in the ARC model. However, the five-County study is an excellent first step in establishing a regional process that will in the future become sophisticated to the point whereby bicycle and pedestrian facility planning can become as advanced in the GMRDC as in the ARC region. 4. GMRDC As mentioned previously, GMRDC does provide many services to Forsyth County; however, they do not have the staff, funding or authority to conduct planning at the same level as the ARC since they are not a designated MPO. The amount of continued growth in the region has rekindled discussions with the State regarding the designation of the GMRDC as an MPO. In the meantime, most of the transportation planning functions for Forsyth are conducted by GDOT. 5. BUGs The Atlanta Bicycle Campaign started creating BUG’s in 1995. The groups have been very active in furthering bicycle facility planning by coordinating with local governments, applying for federal funds for project implementation, and sponsoring bicycle rides in their respective areas. There are currently 14 BUGs throughout the ARC region and the number continues to grow. Efforts at establishing BUGS in Forsyth County should be explored. 6. Pedestrians Educating Drivers for Safety (PEDS) PEDS is a member based advocacy organization founded in 1996 and has become a major catalyst for change in Metro Atlanta’s pedestrian environment. PEDS publicizes the deficiency in the pedestrian system by using the media and political
process effectively. PEDS can be a significant resource to Forsyth County in the implementation of a pedestrian system. 7. PATH Foundation This organization was founded in 1991 as a non-profit whose main goal was to help build a metro wide trail system. They have been very successful in raising private dollars to match public funds for the construction of such trails. Actual implementation of trails has led to many individuals in the region to become advocates for these facilities and support further construction. Most recently, PATH spearheaded the implementation of the Silver Comet Trail in Cobb and Paulding counties, which has been extremely successful and high profile project. 8. Trust for Public Land (TPL) TPL continues to work with local communities, the National Park Service and others to build greenway trails throughout the metro area. Challenges/Opportunities: A major challenge for Forsyth County will continue to be in the area of bicycle and pedestrian planning coordination with the various agencies that do and do not perform transportation planning activities for the County. Until the GMRDC enters the transportation planning arena there will be a disconnect between the identified County needs and the programming of those needs through the GDOT as opposed to the RDC. An additional challenge is the competition for federal funding at the adjacent ARC region level for implementation of these types of facilities. Many of the counties in the ARC region have received CMAQ funding in the past and are familiar with the process, whereas, Forsyth County must apply for those funds through GDOT. Fortunately, the opportunities in the technical and political arena are multiple. A good transportation planning process base will be established for the GMRDC region

Forsyth County Bicycle Transportation and Pedestrian Walkways 2025 Plan 34
through the GDOT five-County study. The Forsyth County bicycle and pedestrian planning efforts can build on this base. Moreover, this technical base is necessary in order to achieve some of the advancements in bicycle and pedestrian planning currently being achieved by the ARC region. Data collection, non-motorized model development, mapping and suitability identification efforts can all be next steps in the work plan for the development of bicycle and pedestrian planning in Forsyth County and the GMRDC region. Lastly, the successful implementation of these facilities, with potential assistance from interested organizations, will only lead to further proliferation of bicycle and pedestrian facilities in Forsyth County.

Forsyth County Bicycle Transportation and Pedestrian Walkways 2025 Plan 35
Section 4. Goals, Objectives and Strategies All efforts at analyzing existing conditions and strategic planning to identify issues and opportunities leads to one of the key components in the Bicycle and Pedestrian Plan development process: establishing a set of goals to guide the Plan and a set of performance measures to evaluate the Plan. Goals are a generalized expression of a desired end-state or direction for the Bicycle and Pedestrian transportation system. Objectives are specific quantitative or qualitative targets, which can be used to measure the degree of attainment of a specific goal. Strategies are individual actions that lead to accomplishment of objectives. Lastly, performance measures are attributes of alternative transportation systems that can be used to evaluate how well an alternative supports the study goals and objectives. Performance measures are designed to provide information to the transportation planning process for the purpose of decision-making. Performance measures can assist the County in making choices among which facilities to build and in making choices about priorities for facility construction. Based on the vision statement approved by the Task Force and the opportunities presented in the strategic planning process, the following goals, objectives and strategies were developed for the Forsyth County Bicycle and Pedestrian Plan. Performance measure criteria were also developed for each goal in order to better assess their attainment. The goals, objectives and performance measure criteria were critical in the development of the alternatives selected for implementation. The strategies developed are consistent with federal guidance and with strategies being implemented throughout the region that are applicable to Forsyth County.
enhances the County’s overall quality of life. Goal 1: Provide a Countywide system of safe, convenient and accessible bicycling and pedestrian facilities for all users through the coordinated efforts of governmental agencies, the private sector and the general public. Objective 1: Develop a connected system of bicycle and pedestrian facilities that can serve major origin and destination points, linking such important land uses as residential and commercial zones, educational and employment areas, health care and service centers, natural, cultural and recreational resources. Strategies § Work with the Board of Commissioners
to provide bicycle and pedestrian facilities that connect to Countywide “points of interest” and potential tourist sites;
§ Work with the County School Board to coordinate provision of bicycle and pedestrian facilities at existing and proposed school facilities;
§ Use the Bike/Pedestrian web site to highlight bicycle and pedestrian activities at local and regional events;
• Work with any future CIDs or TMAs for the provision of these facilities in their jurisdictions;
• Work with the Parks Department to build sidewalks leading to County parks; and
• Work with proposed employment centers to encourage provision of bicycle and pedestrian facilities leading to their sites.
Objective 2: Ensure, to the maximum extent possible, that bicycle and pedestrian facilities are integrated and connected to other existing or planned modes of transportation in order to reduce dependence on the private automobile, reduce traffic and improve air quality.

Forsyth County Bicycle Transportation and Pedestrian Walkways 2025 Plan 36
Strategies § Coordinate with regional transit planning
efforts to maximize bicycle and pedestrian connections to proposed park and ride lots; and
§ Coordinate with on going and future regional planning studies to incorporate the Forsyth Bike/Pedestrian plan recommendations.
Objective 3: Ensure that the bicycle and pedestrian system complements the existing transportation network to maximize and preserve the existing system and take advantage of public rights-of-way and corridors such as utility lines, future rail lines, linear waterways, etc. for bicycle and pedestrian facilities in order to minimize public costs. Strategies § During the comprehensive plan review
process, identify utility lines, rail lines, and linear waterways on the future land use map as possible routes for bicycling and walking;
§ Coordinate the planned bicycle and pedestrian facilities with proposed improvements of congested corridors in the Forsyth County Transportation Plan; and
§ Encourage developments adjacent to waterways to dedicate land for greenways designated on the County plan.
§ Consider pedestrian signal and crossing improvements during intersection redesign.
Objective 4: Ensure that the system addresses the safety and needs of different types of users, from experienced cyclists on arterial roadways to school-bound children walking and riding bicycles adjacent to local roads. Strategies § Encourage the development of
educational programs on bicycle and
pedestrian safety, usage and benefits that address the different users of bicycle and pedestrian facilities;
§ Participate as a community in National Walk to School, National Walk to Work, and National Bike to Work programs;
§ Develop a tracking system for bicycle and pedestrian related accidents; and
§ Contact established groups such as PEDS for pedestrian safety coordination and guidance
§ Conduct a bicycle suitability analysis for roadways in the County
Objective 5: Establish a maintenance program and maintenance standards that ensure safe and usable bicycle and pedestrian facilities. Strategies § Work with organizations such as PATH
Foundation to determine average maintenance costs for multi-use facilities;
§ Work with Public Works staff to coordinate roadway maintenance activities with maintenance of bicycle and pedestrian facilities; and
§ Set aside a percentage of funds from the bicycle and pedestrian fund for maintenance activities.
Objective 6: Provide ancillary facilities such as bicycle parking and storage, lighting, landscaping, signing, pavement marking and signalization to enhance the value and increase the utility and safety of the bicycle and pedestrian system. Strategies § Work with employment centers to
encourage provision of bicycle parking and storage facilities;
§ Coordinate resurfacing and pavement marking activities with potential marking for bicycle friendly facilities; and

Forsyth County Bicycle Transportation and Pedestrian Walkways 2025 Plan 37
§ Encourage all public buildings throughout the County to provide bicycle parking facilities.
Objective 7: Support and encourage regular and continuing bicycle and pedestrian training and safety programs in conjunction with local institutions, organizations, and bicycle and pedestrian interest groups. Strategies § Establish the Bicycle and Pedestrian
Task Force as a permanent ongoing structure and invite local bicycle and pedestrian groups such as PATH and PEDS to sit on the Task Force;
§ Coordinate with local interest groups and the private sector to develop bicycle and pedestrian educational programs on safety and proper usage;
§ Encourage the proliferation of “Effective Cycling” courses similar to those offered by the Atlanta Bicycle Campaign and funded with ARC dollars;
§ Work with the school board to develop and implement educational programs on bicycle and pedestrian safety and usage in schools; and
§ Encourage and provide assistance for the establishment of local advocacy groups, such as the BUGS .
Objective 8: Develop a bicycle and pedestrian system that meets the highest achievable design and safety standards, including ADA standards. Strategies § Encourage ADA facility/needs
assessments as a beginning point for ADA planning at the local level; and
§ Require that all bike/pedestrian facilities constructed in Forsyth meet the typical design standards adopted in the plan.
Goal 1 Performance Measures:
1. Miles of shared use facilities on road bicycle facilities and sidewalks.
2. Percent of employment within a
five (5) mile distance from on-road bicycle facilities and shared use facilities.
3. Percent of households within a two
(2) mile walking distance on a sidewalk to schools, parks, and community facilities.
Goal 2: Amend the development process guidelines to encourage and promote the proliferation of bicycle and pedestrian facilities. Objective 1: Require sidewalks along identified high priority pedestrian corridors adjacent to proposed developments. Strategies § Identify the high priority pedestrian
corridors on the Bicycle and Pedestrian Plan;
§ Publish the adopted Bicycle and Pedestrian Plan throughout the County system, particularly at offices involved in development approvals; and
§ Identify high priority pedestrian crossing improvements on the Plan.
Objective 2: Encourage developments to build sidewalks on interior subdivision streets. Strategies § Publicize the benefits of existing
sidewalks in current subdivisions on the web page with citizen comments; and
§ Allow flexibility in interior road design standards in exchange for construction of sidewalks.

Forsyth County Bicycle Transportation and Pedestrian Walkways 2025 Plan 38
Objective 3: Require proposed developments within ¼ mile distance of major origin/destination land uses to provide sidewalk connectivity. Strategies § Require proposed developers to purchase
the adopted bicycle and pedestrian plan, in conjunction with other County codes and regulations, to inform them of proposed plans; and
§ Explore establishing a development credit for building additional sidewalk facilities to provide desired connectivity to origin/destination points.
Objective 4: Encourage pedestrian connections (via paths, sidewalks) linking adjacent compatible land uses and developments.
Strategies § Identify specific prioritized bike and
pedestrian projects within the County’s Short-Term Work Program Update process; and
§ Encourage the use of the DRI review process as a tool for including bicycle and pedestrian facilities in proposed developments.
Objective 5: Establish and encourage the construction of typical design sections for bicycle and pedestrian facilities within different road classifications. Strategies § Adopt the best design practices included
in the Bicycle and Pedestrian Plan; and § Include the associated typical sections in
the Forsyth Development Code. Objective 6: Include bicycle and pedestrian planning considerations in all transportation improvements (resurfacing, paving, new location, intersection improvements, reconstruction, and maintenance).
Strategies § Encourage the inclusion of low-cost
alternatives such as awareness signage and parking facilities in all projects to support the development of a coherent bicycle and pedestrian system; and
§ Prioritize road widening and construction projects that include bicycle and pedestrian facilities.
Objective 7: Coordinate bicycle and pedestrian planning efforts with countywide recreational and health planning considerations. Strategies § Work in conjunction with the Centers for
Disease Control to develop a tool outlining the health and environmental benefits of bike and pedestrian usage;
§ Work with local interest groups and the private sector to develop bicycle and pedestrian programs on the health benefits of bicycle and pedestrian usage; and
§ Identify greenspace corridors purchased as part of the Forsyth County Greenspace program on future land use maps and the Bicycle and Pedestrian plan map.
Goal 2 Performance Measures:
1. Number of new developments with sidewalks.
2. Number of developments that
construct sidewalks that connect to existing public facilities or activity centers within ¼ mile of the development
Goal 3: Provide adequate funding and staffing resources for planning, developing and maintaining high quality bicycle and pedestrian systems.

Forsyth County Bicycle Transportation and Pedestrian Walkways 2025 Plan 39
Objective 1: Actively pursue all eligible federal and state funds for bicycle and pedestrian planning and development. Strategies § Develop and distribute a catalogue of
potential state and federal assistance for bike and pedestrian projects to relevant County staff and commissioners;
§ Identify potential funding sources for the development of pedestrian walking maps and bicycle suitability maps;
§ Deliver copies of the adopted Bicycle and Pedestrian Plan to GDOT and the GMRDC for incorporation into the Regional Transportation Planning process; and
§ Create a permanent Citizens Bike and Pedestrian Task Force for plan implementation purposes.
§ Apply to ARC for funds to conduct a bicycle suitability study and for additional bicycle and pedestrian data collection efforts.
Objective 2: Coordinate the development of bicycle and pedestrian projects to maximize use of opportunities for joint development using other public or private resources. Strategies § Attend ARC Bike and Pedestrian Task
Force meetings to maximize coordination and compete for funding; and
§ Explore establishing a development credit for proposed developments that include bicycle and pedestrian facilities.
Objective 3: Establish a bicycle and pedestrian fund for developer contributions in lieu of construction of such facilities, if such construction is not deemed timely by Forsyth County. Allow private donations to the bicycle and pedestrian fund for construction of these facilities.
Strategies § Establish average cost estimates for
bicycle and pedestrian facilities to use for in lieu contributions; and
§ Explore establishing a development credit for developers who donate additional funds to the bicycle and pedestrian fund beyond that required for their development.
Objective 4: Include bicycle and pedestrian projects in future local sales tax programs. Strategies § Collect information on the Bike and
Pedestrian web site regarding citizen support of bicycle and pedestrian projects;
§ Include a survey question on the Bike and Pedestrian web site regarding support of local sales tax dollars for provision of bicycle and pedestrian facilities; and
§ Establish a percentage goal for budget allocation to bicycle and pedestrian facilities.
Objective 5: Explore establishing a staff position to act as a technical resource for zoning, land use and roadway design changes to promote bicycle and pedestrian friendly development, as well as for grant writing. Strategies § Investigate the current duties of the
Statewide Bicycle Coordinator and other type positions established in the metro area; and
§ Establish a critical mass limit for a certain number of bicycle and pedestrian projects in the implementation process to justify a staff position.
Goal 3 Performance Measures:
1. Number of staff dedicated to bicycle
and pedestrian facility development and coordination issues.

Forsyth County Bicycle Transportation and Pedestrian Walkways 2025 Plan 40
2. Amount of federal dollars received
for bicycle and pedestrian project implementation.
3. Amount of County local match
dollars applied to bicycle and pedestrian project implementation.
4. Miles of developer constructed
bicycle and pedestrian facilities

Forsyth County Bicycle Transportation and Pedestrian Walkways 2025 Plan 41
Section 5. Alternatives Analysis Armed with established goals, objectives and strategies and with a compilation of the best available information regarding bicycle and pedestrian planning at all levels of government, the Task Force was able to identify a list of recommended facilities. The facility recommendations were based on a 25-year planning period. The alternative facilities recommended constitute Forsyth County’s 2025 Bicycle Transportation and Pedestrian Walkways Plan and are represented on Figure 1. The facility descriptions on the map correspond to the typical sections described below. Each typical section is best suited for different types of cyclists and pedestrians, as is indicated in the graphic presentations for the typical sections in Appendix A. Recommendations on designing these facilities are included as “best practices” for Forsyth County and should be incorporated into the County’s Land Development Code. Once the facilities were identified, an additional analysis to help refine and prioritize the proposals was conducted. The analysis consisted of analyzing traffic congestion along the County roadways and integrating any solutions with the proposed Bicycle and Pedestrian Plan. Consistent with the goals and objectives, the Bicycle and Pedestrian Plan, if implemented, can play a crucial role in the mitigation of transportation congestion. A successful plan works to create an environment that promotes safe walking and bicycling within a community. By providing this type of environment, a community has an effective transportation alternative that improves the interaction between motorists, bicyclists and pedestrians. Additionally, the improved interaction works to relieve traffic congestion and improve air quality. The analysis conducted helped to identify where bicycle and pedestrian improvements could be coordinated with roadway improvements along congested areas. It also identified
potential less congested routes for bicycle and pedestrian use. 5.1 Best practices for bicycle and pedestrian facility design A successful network of bicycle and pedestrian facilities must include facilities for all types of users if it is to be successful as a viable transportation network. It should also be noted that every roadway, unless prohibited by law, is a viable transportation option for cyclists. Many streets and transportation corridors that have no improvements or facilities specifically for
bicycles are commonly used as
transportation corridors for non-
motorized transportation. The facilities described herein are
proposed improvements to a standard road and range from
minimal improvements, to facilitate the ease of use, to completely separate non-motorized facilities. The following guidelines should be established for the implementation of the proposed bicycle and pedestrian facilities in Forsyth County. 5.1.1 Cyclists and Pedestrians In order to produce a viable transportation network, the potential users must be considered when developing a plan. AASHTO’s Guide for the Development of Bicycle Facilities defines three types of cyclists. Facilities that accommodate a very confident adult cyclist who regularly commutes to work may not be very appropriate for a child on his/her way to school, and vice versa. AASHTO has not defined types of pedestrians. For the purposes of this study,

Forsyth County Bicycle Transportation and Pedestrian Walkways 2025 Plan 42
pedestrians will be defined into four groups: Adult Pedestrians, Child Pedestrians, Environmental Justice Community Pedestrians, and Pedestrians with Disabilities. A definition of each type of cyclist and pedestrian is provided below. Type A Cyclists: Advanced adult cyclists best describe the Type A Cyclist. These cyclists are aware of the rules of the road and are skilled at maneuvering a bicycle through vehicular traffic. Typically, these cyclists are commuters or cyclists who are confident with their skills and more interested in reaching a destination in the shortest time possible than they are in scenery or the added safety of less-traveled routes. These cyclists will use any road legally open to bicycle traffic. Type B Cyclists: A typical adult qualifies as a Type B Cyclist. These cyclists know the rules of the road and know how to ride a bicycle. The main distinction is that they prefer less traveled routes to and from their destinations and are less confident in high volumes of vehicular traffic and are less likely to be found competing with motorists for space on a busy road. These cyclists may use facilities for transportation purposes, but will forego the most direct and fastest route in favor of less traveled, safer, or more scenic routes. Type B Cyclists need facilities that are safer and less intimidating than those required by Type A Cyclists. Type C Cyclists: Children are the prototypical Type C Cyclists. These cyclists may be very skilled cyclists. However, they are unaware of the rules of the road because they have never legally driven a motorized vehicle in traffic. These cyclists ride for both recreation and transportation; the most obvious destination is an academic institution, such as an elementary school, middle school, high school, or library. Type C Cyclists should not travel with motorized vehicles.
Adult Pedestrians: Adult Pedestrians use pedestrian facilities for commuting, recreation, and exercise. Adult Pedestrians are aware of the rules of vehicular traffic. Adult Pedestrians can have difficulty crossing high speed, multi-lane streets that lack median refuge islands or pedestrian signals, or where reckless drivers threaten their safety. Child Pedestrians: Child Pedestrians see and hear the world differently than adults. Children often have trouble judging traffic speed, gaps in traffic, or whether a car is coming, going or standing still. Children are shorter than adults, and have limited peripheral vision. Facilities that reduce traffic speed, calm traffic, and provide separation from the travel lane are types of facilities needed by Child Pedestrians. Neighborhood streets with sidewalks and shared-use facilities can accommodate Child Pedestrians. Environmental Justice (EJ) Community Pedestrians: Many counties within the North Georgia area house numerous citizens from a host of international countries. Many parts of the Forsyth County and Metropolitan Atlanta area are home to concentrations of new residents of the United States. Several areas have a concentration of people who do not necessarily read the English language well and may not be able to read warning signs that are written in English. Therefore, in these known EJ areas, safety and directional signage should be shown in symbols rather than written words. The Manual on Uniform Traffic Control Devices (MUTCD) offers several options for regulating the flow of vehicular and pedestrian traffic. Many Environmental Justice Community Pedestrians are unable to drive, and rely on walking as a primary mode of transportation. These Pedestrians rely on safe sidewalks and safe, easy to use pedestrian crossings. Facilities in

Forsyth County Bicycle Transportation and Pedestrian Walkways 2025 Plan 43
neighborhoods which have a high population of Environmental Justice Community Pedestrians should be numerous and provide connections from residential neighborhoods to destinations such as employment centers, shopping areas, and public and semi-private institutions. Pedestrians with Disabilities: The ADA prohibits discrimination to pedestrians with disabilities. Pedestrians who are blind, deaf, or who rely on wheelchairs have needs that are very specific to those types of disabilities. For instance, people who are deaf need visible warnings about crossing vehicular traffic. People with vision impairments need tactile indications that they are approaching an intersection or other hazard. Since they cannot see safety signs, they need audible indicators to inform them of proper times to cross the street. Pedestrians in wheelchairs are unable to mount curbs or maneuver through rough, narrow, or steep surfaces; therefore, provision must be accounted for in the design process. It is expected that all design solutions for recommendations in this plan will be consistent with ADA standards. The FHWA publication, Designing Sidewalks and Trails for Access: Best Practices Design Guide offers many details that cater to Pedestrians with Disabilities. Guidelines in this publication will prove helpful and should be considered on every facility proposed in this plan. 5.1.2 Facility Descriptions The facilities described below are ideal designs, based on best practices. AASHTO’s Guide for the Development of Bicycle Facilities, 1999, encourages many of the elements in the bicycle facilities. These guidelines have been tailored to meet conditions within the Forsyth County area. It should be noted that guidelines and best
practices might need to be altered to fit individual sites and conditions. Pedestrian facilities tend to be more diverse and are not well defined by AASHTO. The FHWA and GDOT have no detailed best practices for sidewalks. The FHWA is publishing the second part of a two part series entitled Designing Sidewalks and Trail for Access, Best Practices Design Guide. This guide discusses many alternatives for designing for persons with disabilities. The pedestrian facilities outlined below are based on the best existing facilities currently used in metropolitan areas. Design features in the typical sections will better facilitate pedestrian safety and comfort. See Appendix A for typical sections of the types of facilities listed below. Facility Type A – Signed Shared Roadways: Type A Cyclists will use all legally open streets for transportation purposes. Many of the streets and roads will have hazards to cyclists that are not considered to be hazardous to motorists, these include streets that have drainage grates, bridge expansion joints, railroad crossings, rough pavement, and signal timing designed with only motorists in mind. An opportunity to provide preferred routes for cyclists, with relatively little financial infusion is the Signed Shared Roadway. The physical improvements to an existing road or street may include bicycle-safe drainage grates and bridge expansion joints, improved railroad crossings, smooth pavements, and signal timing and detector systems that respond to bicycles. Once these types of improvements are made, the route should be signed, both to alert

Forsyth County Bicycle Transportation and Pedestrian Walkways 2025 Plan 44
motorists that bicycles are likely to be sharing a travel lane and to direct cyclists that the signed route has advantages over other routes. Directional signage is also encouraged. Destination arrows can be added to sign poles to help cyclists maneuver through the safest routes to and from major destinations. In a Signed Shared Roadway facility, the cyclist shares a lane with motorized vehicles. As lane widths will vary, wider existing lane widths will be one consideration when choosing a route. Slower speeds are preferred over faster moving traffic routes. A relatively low traffic volume is also desired to minimize the potential for conflicts between cyclists and motorists. Long sight distances will also be desirable as cyclists and motorists will be sharing a lane. Many examples of this type of facility can be found in the Metro Atlanta area. For example, the Stone Mountain to Atlanta path has several sections of Signed Shared Roadways, which, due to the high traffic volume and speed, are more appropriate for a Type A Cyclist. In downtown Powder Springs, Dillard Street is currently being signed to provide part of an important connection between the Silver Comet Trail and the historic downtown. In this particular case, specimen trees close to the road and limited right-of-way precluded a more intensive improvement, but because traffic volume and speed are relatively low and because sight distance is unlimited, a Signed Shared Roadway with both safety and directional signage will serve Type A Cyclists, Type B Cyclists, and Type C Cyclists with the guidance of adults. Facility Type B – Bicycle Friendly Shoulders: Bicycle friendly shoulders may be incorporated into the roadway by either the addition of wide outside lanes or by striping a paved shoulder to increase safety for bicycle users and motorists.
1. Wide Outside Lane: A way to provide more maneuvering room is to provide increased lane width. Lanes wider than twelve feet can better accommodate both bicycles and motor vehicles in the same lane. Providing a wider curb lane may allow motorists to pass a cyclist without changing lanes. This option still requires safety and directional signage and the removal of hazards. Wide Outside Lanes can provide a cost-effective option for areas where there is inadequate width for bike lanes, but where there is the opportunity to gain additional width or simply to re-stripe the road. Fourteen feet of useable width is optimal along straight, relatively flat stretches of road. Fifteen feet may be desirable in some cases, such as where site distance is limited or on steep inclines or where on-street parking effectively reduces useable width.
As important as it is to provide continuity within the bicycle system, long, uninterrupted stretches of wide curb lane may be improperly used as two lanes in congested urban or suburban areas. This possibility should be
considered when designing the facility. In more urban situations where a continuous lane width of fifteen feet may be available, it may be more effective to re-stripe the lane to provide a designated bike lane. 2. Paved Shoulder: Adding or improving Paved Shoulders can often be the most effective way to provide better bicycling facilities, especially in rural areas. Paved Shoulders provide areas where cyclists can pull off the travel lane if needed, or can ride more slowly on steep inclines or sharp curves. Paved Shoulders also add safety for motorists by increasing the durability of the travel lane and providing an emergency pull-off area. The additional width can be

Forsyth County Bicycle Transportation and Pedestrian Walkways 2025 Plan 45
beneficial for improved safety and mobility for both cyclists and motorists. Paved Shoulders should be at least four feet wide and should not be painted as a bike lane. If guardrails or other roadside hazards exist, then five feet of useable width is recommended. The edge of the pavement should be well maintained to avoid hazards that would minimize the available useable width. Care should be taken to keep debris off Paved Shoulders, as gravel and leaves often accumulate on these types of facilities. Facility Type C – Bike Lane: The County should consider the user when incorporating either of these types of facilities. The Bike Lane/Sidewalk should be used where more non-motorized transportation is encouraged. Bike lanes are sufficient in those areas where pedestrian use is more likely to be discouraged.
1. Bike Lane/Sidewalk: The combination of bike lanes and sidewalks is often desirable for corridors where non-motorized transportation options are specifically encouraged. Often, through an urban setting, bike lanes and sidewalks will be parallel. It is important to provide both vertical and horizontal separation between motorists and pedestrians. The bike lane helps to provide horizontal separation, and a two-foot vegetated strip and six-inch curb help to separate pedestrians from cyclists. Since a more limited vegetated strip is required, streetlights, signage, and amenities can appear directly behind the walk, as space allows.
2. Bike Lane: It may be desirable to incorporate Bike Lanes into a roadway design in urban areas or where bicycle use is expected to be more frequent. Bike Lanes
provide delineated road space for preferential use by bicyclists and therefore makes their movements more predictable. Cyclists are more confident that motorists will not swerve into their travel space. Motorists are less likely to swerve out of their lane while passing a cyclist traveling in a designated bike lane. Bike Lanes should always be one-way facilities and should travel in the same direction as vehicular traffic. Bike Lanes should be placed to the right of the vehicular lanes. Where on-street parking exists, the Bike Lane should be located between the travel lane and parking lane. The desired width will vary depending on the exact situation, but generally four feet of useable width will be sufficient. Gutter width should not be considered a part of the required four-foot width. If on-street parking, guardrails, or other roadside hazards are present, Bike Lanes should be five feet wide. Bike Lanes are most successful if they are continuous. Their presence encourages bicycle traffic. Many Type B Cyclists who would otherwise be intimidated to attempt a ride on a heavily traveled street or road will be much more likely to use a facility that includes Bike Lanes. In many instances throughout the Metro Atlanta area, bike lanes stop when the road narrows, has steep inclines, or approaches an intersection. When cyclists need the most protection and direction, and when predictability is the most vulnerable, they are all too often left to their own resources on an unimproved vehicular travel lane. Bicycle Lanes that are not continuous may be more dangerous than providing no bicycle facilities at all. Intersection designs should always accommodate bike lanes. AASHTO’s Guide for the Development of Bicycle Facilities (1999) provides adequate design guidelines to accommodate individual intersection designs.

Forsyth County Bicycle Transportation and Pedestrian Walkways 2025 Plan 46
Facility Type D – Interior Sidewalk: Town centers are candidates for the urban sidewalk, which provides physical separation between the active roadways and pedestrian areas but also allows quick access between parking and sidewalks. The neighborhood sidewalk creates a greater physical separation between roadway and sidewalk in areas where access to the street is less a necessity. 1. Urban Sidewalk: While AASHTO does not currently provide design guidelines for sidewalks, it is necessary to develop standards for the safety of pedestrians. Urban conditions exist in many places throughout the Metro Atlanta Area. Most town centers have areas that will require a design similar to the Urban Sidewalk. Pedestrian facilities should provide as much separation from vehicular traffic as possible. This is important for both motorists and pedestrians. As pedestrians are not insulated from weather, amenities such as shade trees are desirable whenever possible. Safety can be significantly enhanced with pedestrian lighting. Amenities such as trash receptacles, directional signage, streetlights and benches enhance both a pedestrian safety and experience. ADA standards such as handicapped ramps should be provided in all cases. The Urban Sidewalk Typical Section attempts to achieve these goals. Pedestrians occasionally need to access the sidewalk from the parking lane or even from the travel lane on quiet streets. Therefore, a paved and textured ‘amenity zone’ should be provided to allow horizontal separation from vehicles. The amenity zone also allows room for utilities such as fire hydrants, utility poles, and street signs and amenities such as trash receptacles, benches, and directional signage without compromising the clear path for pedestrians. The widths for pedestrian clear zones will vary depending on need. Six feet is
recommended as a minimum in urban conditions. Wider clear zones will be necessary on particularly busy streets and may be desired for aesthetic considerations. A four-foot amenity zone is recommended for most situations. Six-inch curbs are recommended in all cases to provide for vertical separation from travel and/or parking lanes. There are areas within the Metro Atlanta area where existing conditions will not allow for the ten-foot combination of pedestrian and amenity zones. In these instances, as much room as possible should be allocated for sidewalks and a narrowed amenity zone and a minimum five-foot clear zone should still be provided. 2. Neighborhood Sidewalk: Many areas within Forsyth County can accommodate pedestrians with the Neighborhood Sidewalk. As with the Urban Sidewalk, maximum vertical and horizontal separation are still recommended. Because there is less need to access the sidewalk from a parking lane or travel lane, a four-foot vegetated amenity zone will accommodate utilities and amenities. The pedestrian clear zone is recommended to be a minimum of five feet in width. There will be areas where the need will dictate a wider pedestrian clear zone. In areas where space is limited, the vegetated amenity zone can be limited to a minimum of two feet. In instances where the amenity zone is only two feet wide, trees should not be included and a more creative and site specific solution for providing shade trees will be required. All sidewalks must meet minimum ADA requirements. Facility Type E – Multi-use path/arterial sidewalk: There are situations in Forsyth County where it may be necessary to provide connections between bicycle

Forsyth County Bicycle Transportation and Pedestrian Walkways 2025 Plan 47
facilities along high speed or heavily traveled roadways having inadequate space for bicyclists. In limited locations, which are uninterrupted by driveways and intersections for long distances, it may be acceptable to provide a wide sidewalk that can be used for both bicycles and pedestrians. Since this facility is off-road, bicycle traffic can occur in both directions. Pedestrians and cyclists can use the same facility similar to the way a shared use path is used.
One side of the travel corridor should be a wide sidewalk, which allows bicycle use. The other side of the corridor should contain a five-foot sidewalk and be used for pedestrians only. Safety signage should be posted to limit
conflicts between pedestrians and cyclists using this type of facility. This type of facility has many opportunities for conflicts between vehicles and bicycles and bicycles and pedestrians. Therefore, all other options, including alternate routes, should be considered before planning a wide sidewalk used for bicycles and pedestrians. Consult AASHTO’s Guide for Development of Bicycle Facilities for more information and other design considerations. Facility Type F – Shared Use Path: Opportunities to provide transportation options that can serve all non-motorized populations exist in the form of Shared Use Paths. This type of facility is typically located on an exclusive right-of-way such as an abandoned rail corridor, utility easements, or along rivers, streams, and lakes. Shared Use Paths have many commonly used names, such as mixed-use path, trail, and off-road facility. All types of cyclists and all types of pedestrians use Shared Use Paths. They can provide short cuts through residential neighborhoods by connecting cul-de-sac streets, act as
connections between major destinations, such as schools and neighborhoods, and can serve as a regional off-road corridor linking pedestrian and bicycle networks in towns and cities, forming a safer and more comprehensive regional network. Because Shared Use Paths do not share the right-of-way with vehicular traffic and often cross streets at grade separations, they are ideal for all types of users. Children and adults alike can use Shared Use Paths for transportation with little fear of vehicular conflicts. Type A Cyclists often prefer to avoid Shared Use Paths in favor of more direct, on-street routes, which are currently available. Shared Use Paths generally serve the bulk of the general population who require safer, less congested routes for cycling and walking. In most instances Shared Use Paths should be paved. The minimum width that will accommodate both cyclists and pedestrians traveling in two directions is eight feet. By providing better separation between users and making passing easier, ten feet is the recommended minimum width for Shared Use Paths. These paths can also be wider, if a high amount of use is anticipated. While it is recommended that Shared Use Paths be paved with either concrete or asphalt, it is possible to construct a successful path that is not paved. The National Park Service no longer allows any kind of hard pavement in their facilities. Often, National Parks provide land for important, off-road connections. For instance, the Chattahoochee River National Recreation Area at Powers Ferry is a gravel facility up to thirty-foot wide in some locations. The path follows the Chattahoochee River and is very well used by the public. Although this particular path is primarily used for recreation, it links neighborhoods that are remote by the road

Forsyth County Bicycle Transportation and Pedestrian Walkways 2025 Plan 48
system and can be used to facilitate non-motorized transportation. Also, the wide, unpaved path easily accommodates numerous representatives of every type of user. 5.1.3 Motorist/Pedestrian Conflicts Pedestrians and motorists conflict most often when pedestrians attempt to cross a street. Unsignalized intersections on high speed, multi-lane streets are common throughout Metro Atlanta and pose serious risk for pedestrians. Marked crosswalks need to be supplemented by medians, refuge islands, overhead signs and/or lights, bulb-outs, and/or pedestrian activated signals. Pedestrian signage can help motorists know that there are pedestrians needing to cross streets. School zones should always be signed as such. Since there is likely to be an increase in pedestrian activity at and near schools, crossings near these locations should be as visible and safely designed as possible. Several road design practices can help increase pedestrian safety. While travel lane design is out of the scope of the bicycle and pedestrian plan, several key points should be noted. Traffic calming can be an important addition to pedestrian safety, especially for Child Pedestrians. Lane widths of eleven-feet should be implemented where possible on local and neighborhood streets, to reduce the speed of motorized travel and reduce the length of the pedestrian crossing. Access points to businesses should utilize shared curb-cuts to minimize potential conflict points between motorists and pedestrians. The sidewalk’s paving pattern should cross curb cuts and driveway aprons to give a more continuous surface for pedestrians and to provide a visual reminder to motorists that they are crossing a pedestrian route. There is no single facility or facility type that will work for every user and every existing site condition. The best practices
outlined above and illustrated in Appendix A serve as ideal designs in ideal situations. Every travel corridor will have its own constraints and opportunities. It is important to use judgment and creativity in increasing safety and ease of mobility for all types of cyclists and pedestrians. 5.1.4 Congestion Analysis Federal legislation requires that MPOs prepare Congestion Management Systems (CMS). The adjacent MPO, ARC, has an adopted CMS. Because the GMRDC is not an MPO they are not required to prepare a CMS. However, the basic purpose of a congestion management system is to identify congested corridors, identify the causes of congestion, and recommend potential solutions or mitigation strategies to relieve the congestion based on the causes. In many established congestion management systems, bicycle and pedestrian facilities are considered potential mitigation strategies. Although Forsyth County nor the GMRDC are required to prepare a CMS, the County expressed an interest in analyzing the current congestion levels on their roadway in relation to the proposed Bicycle and Pedestrian Plan. Recommendations were prepared that coordinated proposed bicycle and pedestrian facilities with identified congested roadways. Moreover, the congestion analysis helped to refine and prioritize the alternative facilities identified in the plan. Traffic congestion results from a need for additional capacity on a roadway, which can be influenced by many factors. The identification of these factors is important for the purpose of providing congestion mitigation measures. Congestion mitigation comes in many different forms, with bicycle and pedestrian facilities being an identified congestion mitigation strategy. Including bicycle and pedestrian projects as a congestion relief strategy along with proposed improvements along congested

Forsyth County Bicycle Transportation and Pedestrian Walkways 2025 Plan 49
corridors will help to improve the effectiveness of Forsyth’s improvement strategies. Causes of Congestion in Forsyth County Several specific causes of congestion are pertinent to bicycle and pedestrian issues: • Heavy vehicle volumes; • Heavy peak period volumes; • Heavy intersection volumes; • Heavy pedestrian volumes; • Too many driveways; • Poor signal timing coordination; and • Poor intersection geometrics. Heavy vehicle volumes, peak volumes and intersection volumes are found in the southern and eastern portion of Forsyth County where residential and commercial development continues to expand. The roadways serving these areas were designed to service mainly rural needs and their improvement has not kept pace with the fast growing County. Typically, experienced cyclists use roads with heavy vehicle volumes as they provide the most direct routes from origins and destinations. Therefore, facilities such as bicycle friendly shoulders and bike lanes should be accommodated along these roadways. At intersections with heavy vehicle volumes, pedestrian improvements should be considered.
Heavy pedestrian volumes are typically found within the vicinity of major activity centers, such as the City of Cumming, schools and parks. The identification of these areas was used to prioritize sidewalk facilities and pedestrian crossings. Roads with multiple driveways not only contribute to traffic congestion but also present an unfriendly pedestrian environment. A possible solution to this type of congestion can have a positive impact both vehicular and pedestrian traffic. For instance, sidewalk construction projects can be implemented along major arterial
roadways that are targeted for driveway curb-cut closures. Signal timing coordination is another source of congestion that relates to bicycle and pedestrian issues. Signal timing improvements should include pedestrian signal/crossing improvements and possibly signal detection devices for bicycle crossings at intersections. Another frequent cause of congestion involves poor intersection geometrics. An intersection with poor geometrics is not only a safety hazard for vehicles, but also for pedestrians. Future intersection improvements should address ADA standards, pedestrian signals and crossings. Possible Congestion Mitigation Strategies Congestion mitigation strategies can be grouped into four categories. These are trip elimination strategies, trip reduction strategies, existing system optimization and capacity addition strategies. With guidance from the ARC’s CMS, these strategies were evaluated regarding the strategy’s potential impact on mobility. In this analysis, required data was identified to measure the strategy’s impact in the future. Trip Elimination Strategies Trip elimination strategies include modifications to the land use mix and site design. Under site design, provision of inter-connecting sidewalks between offices and commercial areas can be identified as a strategy. In combination with a strategy to provide inter-parcel access, this approach has the potential to impact or reduce trips by 3%. Data required to measure this impact includes accident rates and intersection volumes. For shorter trips, bicycle and pedestrian facilities should be included as a potential trip elimination strategy.

Forsyth County Bicycle Transportation and Pedestrian Walkways 2025 Plan 50
Trip Reduction Strategies Trip reduction strategies include preferential treatment strategies, administrative measures and economic measures. Under preferential treatment, provision of bicycle and pedestrian facilities and the provision of bicycle access to transit were included as potential trip reduction strategies. Provision of bicycle/pedestrian facilities has a 0.2% potential reduction in trips and bicycle access to transit had no impact as a stand-alone strategy. Required data to measure this impact includes bicycle/pedestrian counts. Existing System Optimization Strategies These strategies include ATMS technology application, freeway management, access management, traffic signalization and intersection geometric improvements. From the analysis with respect to causes of congestion and their relationship to bicycle and pedestrian issues, sidewalk construction should be added as a strategy under access management in conjunction with closing driveways. Pedestrian signals/crossing and ADA improvements should be added as a strategy under intersection geometric improvements and bicycle and pedestrian signal improvements should also be added under traffic signalization strategies.
Capacity Addition Strategies This strategy includes building new roadways, roadway widening and provision of more bus and rail service. Bicycle and pedestrian provisions should be included in roadway and transit capacity projects. In terms of strategic planning for the Bicycle and Pedestrian Plan, it is also important to identify non-congested parallel facilities that are direct links between origins and destinations. These facilities are important to identify since they can be considered attractive direct alternate routes for the bicyclist. For example, greenway corridors
can be considered as an alternative to congested facilities if they are somewhat direct and connect origins and destinations. Definition of Congestion in Forsyth County - As previously stated, Forsyth County does not currently have a CMS. Such a system would allow the county to identify roadway facilities that are deficient. In order to generally define congestion in Forsyth County, capacity thresholds for each facility type in a roadway network must be identified. The general facility types analyzed for this study are presented in Figure 2. These facility types include a freeway, major arterials, minor arterials and collectors. For the purposes of this study, congestion will be identified based on the current level of service (LOS) associated with the major transportation network in Forsyth County. The LOS of a roadway is a qualitative measure of the road user’s perception of traffic flow. The letters A through E represent the LOS of a transportation facility. The letter “A” represents the most favorable driving conditions, while the letter “E” represents a congested facility. A generalized LOS table, presented as Table 1, helps to explain the definitions of LOS in terms of capacity. The LOS of a facility in this analysis was based on the facility type and its associated average daily traffic (ADT). There was no attempt to forecast congestion levels in the future. The County’s CTP performed an analysis of future travel demand on County roadways. The current congestion analysis provides a snapshot of current congestion levels to assist in the development of the Bicycle and Pedestrian Plan. The current snapshot of congestion was validated with information provided in the County’s CTP existing conditions analysis.

Forsyth County Bicycle Transportation and Pedestrian Walkways 2025 Plan 51
Table 1
Generalized Level of Service2
Facility Type Levels of Service Volumes Freeway A B C D E 4 lanes 20,900 32,800 49,200 62,600 74,500 6 lanes 32,100 50,400 75,600 96,200 114,500 8 lanes 43,800 68,800 103,200 131,300 156,300 10 lanes 54,700 86,000 129,000 164,200 195,400
Major Arterials 2 undivided - 10,800 15,600 16,600 16,600
4 divided - 23,500 33,200 35,000 35,000 6 divided - 35,800 49,900 52,500 52,500
Minor Arterials 2 undivided - - 9,900 14,900 16,200
4 divided - - 22,900 32,500 34,300 6 divided - - 35,500 48,900 51,700 Collectors
2 undivided - - 8,600 14,600 16,000 4 divided - - 19,800 31,700 33,900 6 divided - - 30,800 47,800 51,000
Local Streets 2 undivided - - 4,800 10,900 11,900
4 divided - - 11,600 23,800 25,400 Note: Blank lines indicate that the level of service cannot be obtained on a corridor basis.
2 1998 Level of Service Handbook, Florida Department of Transportation
Congested Facilities The ADT counts that were collected by GDOT along Forsyth County roads for the year 2000 are presented in Figure 3. These counts were obtained from an online database of traffic count coverage’s that is produced by GDOT for each county in the State. The congestion analysis for this study only included the major roadways within Forsyth County. The consultant identified the congested roadways by applying a LOS to the analyzed segments. Most of the congested traffic is located in the southern portion of Forsyth County, with the exception of Browns Bridge Road in the northeast portion of the county. Otherwise, the northern portion of the county has an
adequate roadway system. The most congested roadways include Georgia State Route 400 (GA 400), McFarland Road, State Route 20 (SR 20), McGinnis Ferry Road and a portion of State Route 9 (SR 9). The analysis results are displayed in Figure 4. As indicated above, a generalized LOS “E” represents a congested facility. Roadways identified in Table 2 were identified as currently congested for the purposes of this analysis. Table 2 also identifies the proposed improvements in various plans to address the congestion. The Proposed Bicycle and Pedestrian Plan improvements, and specific type of improvements, were coordinated with the planned roadway projects.

Forsyth County Bicycle Transportation and Pedestrian Walkways 2025 Plan 52
Table 2 Planned Transportation Projects for Congested Roadways
Project Source Location From/To Type of Improvement
II-3 CTP Browns Bridge Road
Gravitt Rd. to Hall County Line
Widen from 2/3 to 4 lanes
I-12 CTP Keith Bridge Road GA 400 to Dawsonville Hwy. Widen from 2 to 4
lanes
II-12 CTP Keith Bridge Road Spot Rd. to GA 400 Extension
FT 007A RTP GA 400 GA 400 @ McFarland Rd. Bridge Construction
FT 011 RTP GA 400 GA 400 @ SR 20 Interchange Reconstruction
I-30 CTP GA 400 GA 400 @ McFarland Rd. Interchange Replacement
II-10 CTP GA 400 McFarland Rd. to Browns Bridge Rd.
Widen from 4 to 6 lanes
II-11 CTP GA 400 Fulton County Line to McFarland Rd.
Widen from 4 to 6 lanes with HOV
III-6 CTP GA 400 McFarland Rd. to Browns Bridge Rd.
Widen from 4 to 6 lanes
III-7 CTP GA 400 Browns Bridge Rd. to Dawson County Line
Widen from 4 to 6 lanes
III-14 CTP GA 400 At McGinnis Ferry Rd. New Interchange III-15 CTP GA 400 At Majors Rd. New Interchange
FT 007 RTP McFarland Rd. SR 9 to GA 400 Widen from 2 to 4 lanes
FT 015 RTP McFarland Rd. McGinnis Ferry Rd. to GA 400 Widen from 2 to 4 lanes
I-20 CTP McFarland Rd. Atlanta Hwy. To Union Hill Rd.
Widen from 2 to 4 lanes
I-21 CTP McFarland Rd. Union Hill Rd. to McGinnis Ferry Rd.
Widen from 2 to 6 lanes
III-12 CTP McFarland Rd. Union Hill Rd. to Atlanta Hwy.
Widen from 4 to 6 lanes
FT 004 RTP SR 20 From GA 400 to Samples Rd. Widen from 2 to 4 lanes
FT 006 RTP SR 20 From 0.5 miles north of Greenwood Acres Dr. to Kelly Mill Rd.
Widen from 2 to 4 lanes
I-6 CTP SR 20 Gwinnett County Line to Samples Rd.
Widen from 2/3 to 4 lanes
I-7 CTP SR 20 Samples Rd. to Atlanta Hwy.. Widen from 2/5 to 6 lanes
I-8 CTP SR 20 Kelly Mill Rd. to Doc Sams Rd.
Widen from 2/3 to 4 lanes
I-29 CTP SR 20 @ GA 400 Interchange Replacement n/a

Forsyth County Bicycle Transportation and Pedestrian Walkways 2025 Plan 53
II-4 CTP SR 20 GA 400 to Gwinnett County Line
Widen from 4 to 6 lanes
II-5 CTP SR 20 Cherokee County Line to Doc Sams Rd.
Widen from 2/3 to 4 lanes
II-6 CTP SR 20 Spot Rd. to Kelley Mill Rd. Widen from 4 to 6 lanes
Project Source Location From/To Type of Improvement
III-2 CTP SR 20 Cherokee County line to north of Spot Rd.
Widen from 4 to 6 lanes
FT 001 RTP SR 9 SR 141 to SR 20 Widen from 2 to 4 lanes
FT 009 RTP SR 9 SR 20 to SR 306 Widen from 2 to 4 lanes
FT 023A RTP SR 9 McFarland Rd. to SR 371 Widen from 2 to 4
lanes FT
023B RTP SR 9 SR 371 to SR 141 Widen from 2 to 4 lanes
I-1 CTP SR 9 McFarland Rd. to Mullinax Rd.
Widen from 2 to 4 lanes
I-2 CTP SR 9 Mullinax Rd. to Maple St. Widen from 2/3 to 4 lanes
I-10 CTP SR 9 Main St. to Dunn Rd. Widen from 2 to 4 lanes
I-22 CTP McGinnis Ferry Road
Gwinnett Co. line to Cherokee County line
Widen from 2 to 4 lanes
II-1 CTP SR 9 Cherokee County Line to McFarland Rd.
Widen from 2 to 4 lanes
II-18 CTP McGinnis Ferry Road
McFarland Road to Brookwood Road
Widen from 4 to 6 lanes
II-7 CTP SR 9 Dunn Rd. to Browns Bridge Rd.
Widen from 2 to 4 lanes
III-13 CTP McGinnis Ferry Road
Brookwood Road to Gwinnett Co. line
Widen from 4 to 6 lanes
III-1 CTP SR 9 McFarland Rd. to Mullinax Rd.
Widen from 4 to 6 lanes
Browns Bridge Road is a two-lane major arterial that is congested from Keith Bridge Road to approximately Little Mill Road. Additional capacity has been recommended for this facility in the CTP, with the proposed improvement being a four-lane facility. Keith Bridge Road is also congested within this area from Browns Bridge Road to GA 400 and the CTP recommends additional capacity. The
Bicycle and Pedestrian Plan proposes multi-use paths and sidewalks along these roads.
GA 400 is a deficient roadway as it enters Forsyth County from the south and improves as it extends north. Additional capacity is being planned along this state highway and there are various interchange improvements that are planned or are under construction. The Bicycle and Pedestrian Plan

Forsyth County Bicycle Transportation and Pedestrian Walkways 2025 Plan 54
recommends a parallel multi-use path, possibly, following utility easements. Pedestrian improvements are recommended at the interchange crossings.
McFarland Road is a deficient roadway north of GA 400. This roadway is a major arterial with termini at McGinnis Ferry Road and SR 9. North of GA 400, the average daily traffic count is 21,848 vehicles per day (vpd). This roadway is a two-lane facility from McGinnis Ferry Road to Union Hill Road, which at this point, turns into a four-lane facility. Additional capacity is being planned for this roadway in the CTP that proposes for the facility to be a six-lane roadway. Bicycle friendly shoulders and sidewalks are recommended along this roadway.
Currently, SR 20 in Forsyth County has a variable number of lanes. However, the arterial is predominately a two-lane state highway. This facility is congested south of GA 400. Both the CTP and the Regional Transportation Plan have numerous roadway projects for this facility that will add additional capacity. Sidewalk improvements are recommended along this roadway. McGinnis Ferry Road is a two lane facility that serves Forsyth, Fulton and Gwinnett County traffic. It is considered a major east-west regional corridor. The road is congested from the Gwinnett County line to McFarland Road. Provisions to widen the roadway are in the County’s CTP. A proposed multi-use path is being designed along with the roadway improvement.
Lastly, SR 9 is congested as it enters Forsyth County from the west. The average daily traffic count north of McFarland Road is 22,000 vehicles. Provisions for additional capacity along this facility have been provided in the CTP. Bicycle friendly shoulders are recommended along this facility.
As traffic volumes in Forsyth County increase, the need for both safety and capacity becomes apparent. Elements from the Proposed Bicycle and Pedestrian Plan have been strategically placed in areas help to relieve traffic congestion. Forsyth County currently does not have a transit system and there are not any rail connections. However, park and ride lots are being proposed at certain GA 400 interchanges and discussions are underway with the Georgia Regional Transportation Authority (GRTA) to improve certain arterials for potential use of buses. Additionally, GRTA is proposing to operate express buses along GA 400 from proposed park and ride lots to MARTA stations. Proposed bicycle and pedestrian improvements have been coordinated with these efforts in order to maximize the potential use of transit in Forsyth County. Direct improvements from the Proposed Bicycle and Pedestrian Plan include projects, such as the addition of bicycle friendly shoulders to a congested roadway. This type of improvement can be seen on SR 141, which has a LOS “D” south of Old Alpharetta Hwy. An indirect improvement to a congested corridor can be seen through the use of greenways that connect the county’s park system or in the multi-use path that runs parallel to the GA 400 corridor. Each of these improvements is intended to compliment each other and offer the citizens of Forsyth with alternate modes of transportation. A comparison of the proposed bicycle and pedestrian improvements with the planned transportation projects ensures maximum performance from a system wide congestion relief program. Coordination of these efforts is essential for an efficient transportation system and for future long range planning efforts.

Forsyth County Bicycle Transportation and Pedestrian Walkways 2025 Plan 55
Integrating the Congestion Analysis with the Proposed Bicycle and Pedestrian Plan Update - Based on the analysis that has been prepared for Forsyth County and its relationship to the Proposed Bicycle and Pedestrian Plan, the following additional strategies were recommended and included in Section 4 (Goals, Objectives and Strategies. These strategies ill strengthen the relationship between the transportation and the bicycle and pedestrian needs of the residents:
1. In the Bicycle and Pedestrian strategic planning process, consider sidewalk projects along congested corridors with “too many driveways” in combination with origin/destination information.
2. Include a strategy in the Bicycle and Pedestrian plan that requires bicycle friendly signal timing/detection improvements along congested corridors with signal timing problems that are also identified as suitable for bicycling in the suitability analysis.
3. Consider pedestrian signal and pedestrian crossing improvements for corridors that are experiencing signal timing and poor intersection geometric problems.
4. Include a strategy in the Bicycle and Pedestrian plan that requires intersection improvement projects that rectify congested intersection geometric problems to include bicycle and pedestrian design elements.
5. Include the provision of bicycle facilities as a potential trip elimination strategy in future congestion analysis and updates to the Comprehensive Transportation Plan.
6. Include data collection regarding bicycle and pedestrian in future congestion data collection efforts, i.e., bike counts, pedestrian counts,
etc. Use bicycle and pedestrian information to quantify bicycle and pedestrian benefits in the Bicycle and Pedestrian Plan update.

Forsyth County Bicycle Transportation and Pedestrian Walkways 2025 Plan 56
Section 6. Plan Recommendations The following are the specific facilities recommended in the 2025 Forsyth County Bicycle Transportation and Pedestrian Walkways Plan.
These estimates are construction costs only and do not include engineering or right-of-way. The facilities are identified by facility type and by priority.
BIKE/PED PROJECTS By Facility Type
PROPOSED GREENWAY
Road Name: Area Description: Facility Description: Preliminary Estimate of Cost:
Approximate Linear Feet:
Big Creek Extension Phase I Park off of Hwy 9 to McGinnis Ferry 10'-12' Shared-Use Path $4,200,000 21,000'
Big Creek Extension Phase II Atlanta Hwy to Majors 10'-12' Shared-Use Path $1,400,000 7,000'
Etowah Greenway Extension Cherokee Co. Border to Dawson Co. Border 10'-12' Shared-Use Path $6,200,000 31,000'
Sawnee Mountain Greenway Pooles Mill Park to Swanee Mountain Park 10'-12' Shared-Use Path $9,000,000 45,000'
Chattahoochee River Buford Dam Road to McGinnis Ferry 10'-12' Shared-Use Path $10,000,000 50,000'
TOTAL GREENWAY: $30,800,000 154,000'

Forsyth County Bicycle Transportation and Pedestrian Walkways 2025 Plan 57
MULTI-USE PATH
Road Name: Area Description: Facility Description: Preliminary Estimate of Cost:
Approximate Linear Feet:
Hwy 371 Kelly Mill to Atlanta Hwy 8'-10' Walk/Bikeway $4,200,000 21,000'
McGinnis Ferry Chattahoochee River to Old Alpharetta 8’-10’ Walk/Bikeway $8,900,000 44,500'
Hwy 400 McGinnis Ferry to Buford Hwy 8’-10’ Walk/Bikeway $9,000,000 45,000'
Browns Bridge Keith Bridge to Waldrip Circle 8’-10’ Walk/Bikeway $6,400,000 32,000'
Keith Bridge Waldrip to Browns Bridge 8’-10’ Walk/Bikeway $6,800,000 34,000'
TOTAL MULTI-USE PATH: $35,300,000 176,500'

Forsyth County Bicycle Transportation and Pedestrian Walkways 2025 Plan 58
SIDEWALKS
Road Name: Area Description: Facility Description: Preliminary Estimate of Cost:
Approximate Linear Feet:
Canton Road Bethelview to City Limits 5' Concrete Walk $1,072,500 16,500'
Ridgefield and Shiloh East Loop around back to McFarland 5' Concrete Walk $1,235,,000 19,000'
James Burgess Old Atlanta to River Mist 5' Concrete Walk $910,000 14,000'
Haw Creek Old Atlanta to Buford Hwy 5' Concrete Walk $520,000 8,000'
Gilbert Road Old Atlanta to Trammel 5' Concrete Walk $390,000 6,000'
Trammel Buford Hwy to Old Atlanta 5' Concrete Walk $1,300,000 20,000'
Buford Hwy Tribble Gap to Chamonix Drive 5' Concrete Walk $1,365,000 21,000'
Echols Buford Hwy to Hudgins 5' Concrete Walk $396,500 6,100'
Hudgins Buford Hwy to New College Way 5' Concrete Walk $390,000 6,000'
Fairway Buford Hwy to School 5' Concrete Walk $325,000 5,000'
Buford Dam Road Sanders to Chattahoochee River 5' Concrete Walk $1,365,000 21,000'
Pilgrim Mill City Limits to Tidwell Park 5' Concrete Walk $1,683,500 25,900'
Browns Bridge Keith Bridge to Hendrix 5' Concrete Walk $1,235,000 19,000'

Forsyth County Bicycle Transportation and Pedestrian Walkways 2025 Plan 59
McFarland Jones to GA 400 5' Concrete Walk $195,000 3,000'
New Proposed Access Road Hwy 141 to City Limits and Market Place Blvd. 5' Concrete Walk $1,495,000 23,000'
Bald Ridge Marina Exit Bridge 5' Concrete Walk $45,500 700'
Dahlonega Hwy Rte 9 to proposed Pilgrim Mill Access Road 5' Concrete Walk $390,000 6,000'
Castleberry Rte 9 to Bethelview 5' Concrete Walk $637,000 9,800'
Peachtree Pkwy Mathis Airport to McGinnis Ferry 5' Concrete Walk $487,500 7,500'
Proposed Pilgrim Mill Access Road Pilgrim Mill to Browns Bridge 5' Concrete Walk $731,250 11,250'
Brookwood Peachtree Pkwy to Fulton County Border 5' Concrete Walk $364,000 5,600'
Hwy 141 Majors to Mathis Airport 5' Concrete Walk $845,000 13,000'
Pooles Mill Link Poole Mill Park to Etowah River Greenway 5' Concrete Walk $455,000 7,000'
Bethelview Canton Hwy to Majors 5' Concrete Walk $2,600,000 40,000'
TOTAL SIDEWALK: $20,432,750 314,350'

Forsyth County Bicycle Transportation and Pedestrian Walkways 2025 Plan 60
Bicycle Friendly Shoulder
Road Name: Area Description: Facility Description: Preliminary Estimate of Cost: Approximate Linear Feet:
Atlanta Hwy Hwy 371 to Bethelview Additional Shoulder Width $804,000 20,100'
Sharon Hwy 141 to Old Atlanta Additional Shoulder Width $224,000 5,600'
Jones Bluegrass Lakes Pkwy to Dalesford Drive Additional Shoulder Width $200,000 5,000'
McFarland GA 400 to McGinnis Ferry Additional Shoulder Width $204,000 5,100'
Old Atlanta Road Brannon to Haw Creek Additional Shoulder Width $400,000 10,000'
Pilgrim Mill Proposed Access Road to Tidwell Park Additional Shoulder Width $676,000 16,900'
Waldrep Keith Bridge to Browns Bridge Additional Shoulder Width $800,000 20,000'
TOTAL BICYCLE SHOULDERS: $3,308,000 82,700'

Forsyth County Bicycle Transportation and Pedestrian Walkways 2025 Plan 61
Signed Shared Roadway
Project Name: Area Description: Facility Description: Preliminary Estimate of Cost: Approximate Linear Feet:
Bentley Trail Kelly Mill to Cherokee County Border Bicycle Traffic Signage $26,000 26,000'
Kelly Mill Trail Cherokee County Border to City limits Bicycle Traffic Signage $35,200 35,200'
Northern Trail City Limits to Karr to John Burris to Elmo to Westray to Dawson
County Bicycle Traffic Signage $50,000 50,000'
Holbrook - Karr Link Burnt Bridge to John Burruss Bicycle Traffic Signage $13,000 13,000'
Western Loop Pleasant Grove to Watson to Heardsville to Hurt Bridge to
Holbrook Bicycle Traffic Signage $55,000 55,000'
Harris Drive - Burnt Bridge Link Burnt Bridge to Wallace Tatum to
Whitmire to Mount Taber to Harris
Bicycle Traffic Signage $40,000 40,000'
Govan - Hendrix Link Hendrix to 369 to Hubert Mathis to Riley to Dawson County Bicycle Traffic Signage $39,500 39,500'
Tribble Trail Watson to Kelly Mill Bicycle Traffic Signage $16,900 16,900'
Spot Trail Bettis Tribble Gap to Dahlonega Hwy Bicycle Traffic Signage $17,500 17,500'

Forsyth County Bicycle Transportation and Pedestrian Walkways 2025 Plan 62
Heardsville Circle Heardsville Circle Bicycle Traffic Signage $10,000 10,000'
TOTAL SIGNED SHARED ROAD: $303,100 303,100'
Pedestrian Crossing
Project Name: Facility Description: Preliminary Estimate of Cost:
Canton Hwy @ Post Pedestrian Signal and Crosswalk $43,000
Canton Hwy @ Bethelview Pedestrian Signal and Crosswalk $43,000
Post @ Bentley Pedestrian Signal and Crosswalk $43,000
Post @ Majors Pedestrian Signal and Crosswalk $43,000
Post @ Dickerson Pedestrian Signal and Crosswalk $43,000
Hwy 9 @ Pendley Pedestrian Signal and Crosswalk $43,000
Fairway Drive @ Buford Hwy Pedestrian Signal and Crosswalk $43,000
James Burgess @ Old Atlanta Road Pedestrian Signal and Crosswalk $43,000
TOTAL PEDESTRIAN CROSSING: $344,000

Forsyth County Bicycle Transportation and Pedestrian Walkways 2025 Plan 63
Preliminary Estimate of
Cost: Approximate Linear Feet:
PROGRAM TOTAL FORSYTH COUNTY $90,487,850 1,030,650'

Forsyth County Bicycle Transportation and Pedestrian Walkways 2025 Plan 64
These facilities were prioritized based on the potential for receiving funding, their ability to be constructed along with a road project, cost, proximity to high population and employment densities, proximity to destinations such as schools and parks, and
feasibility. Short-term projects are those that can be built in a 5- year time frame. Mid-term projects are those that can be built between 5 and 10 years. Long-term projects are those that are anticipated to be constructed beyond the 11 year period.
SHORT-TERM PROJECTS
(1-5 years)
Project Name: Area Description: Facility Description: Preliminary Estimate of Cost: Approximate Linear Feet:
MULTI-USE PATH
McGinnis Ferry Road Chattahoochee River to Old Alpharetta 8’-10’ Walk/Bikeway $8,900,000 44,500'
TOTAL: $8,900,000 44,500'

Forsyth County Bicycle Transportation and Pedestrian Walkways 2025 Plan 65
SIDEWALKS
Buford Hwy Tribble Gap to Chamonix Drive 5' Concrete Walk $1,365,000 21,000'
Buford Dam Road Sanders to Chattahoochee River 5' Concrete Walk $1,365,000 21,000'
McFarland Road Jones to GA 400 5' Concrete Walk $195,000 3,000'
Bald Ridge Marina Exit Bridge 5' Concrete Walk $45,500 700'
Hwy 141 Majors to Mathis Airport 5' Concrete Walk $845,000 13,000'
Bethelview Road Canton Hwy to Majors 5' Concrete Walk $2,600,000 40,000'
TOTAL: $6,415,500 98,700'
Bicycle Friendly Shoulder
McFarland Road GA 400 to McGinnis Ferry Additional Shoulder Width $204,000 5,100'
Old Atlanta Road Brannon to Haw Creek Additional Shoulder Width $400,000 10,000'
TOTAL: $604,000 15,100'

Forsyth County Bicycle Transportation and Pedestrian Walkways 2025 Plan 66
Signed Shared Roadway
Kelly Mill Trail Cherokee County Border to City limits Bicycle Traffic Signage $35,200 35,200'
Northern Trail City Limits to Karr to John
Burris to Elmo to Westray to Dawson County
Bicycle Traffic Signage $50,000 50,000'
Holbrook - Karr Link Burnt Bridge to John Burruss Bicycle Traffic Signage $13,000 13,000'
Western Loop Pleasant Grove to Watson to Heardsville to Hurt Bridge to
Holbrook Bicycle Traffic Signage $55,000 55,000'
Harris Drive - Burnt Bridge Link
Burnt Bridge to Wallace Tatum to Whitmire to Mount Taber to
Harris Bicycle Traffic Signage $40,000 40,000'
Govan - Hendrix Link Hendrix to 369 to Hubert
Mathis to Riley to Dawson County
Bicycle Traffic Signage $39,500 39,500'
TOTAL: $232,700 232,700'

Forsyth County Bicycle Transportation and Pedestrian Walkways 2025 Plan 67
Pedestrian Crossing
Canton Hwy @ Post Road Pedestrian Signal and Crosswalk $43,000
Canton Hwy @ Bethelview Road Pedestrian Signal and Crosswalk $43,000
Post Road @ Bentley Road Pedestrian Signal and Crosswalk $43,000
Post Road @ Majors Road Pedestrian Signal and Crosswalk $43,000
Post Road @ Dickerson Road Pedestrian Signal and Crosswalk $43,000
Hwy 9 @ Pendley Road Pedestrian Signal and Crosswalk $43,000
Fairway Drive @ Buford Hwy Pedestrian Signal and Crosswalk $43,000
James Burgess @ Old Atlanta Road Pedestrian Signal and Crosswalk $43,000
TOTAL: $344,000
Preliminary Estimate of Cost: Approximate Linear Feet:
SHORT-TERM PRIORITY PROJECT TOTALS $16,496,200 391,000'

Forsyth County Bicycle Transportation and Pedestrian Walkways 2025 Plan 68
MID-TERM PROJECTS
(5-10 years)
Project Name: Area Description: Facility Description: Preliminary Estimate of Cost: Approximate Linear Feet:
MULTI-USE PATH
Hwy 371 Kelly Mill to Atlanta Hwy 8'-10' Walk/Bikeway $4,200,000 21,000'
TOTAL: $4,200,000 21,000'
SIDEWALKS
Road Name: Area Description: Facility Description: Preliminary Estimate of Cost: Approximate Linear Feet:
Canton Road Bethelview to City Limits 5' Concrete Walk $1,072,500 16,500'
Ridgefield and Shiloh East Loop around back to McFarland 5' Concrete Walk $1,235,000 19,000'
James Burgess Old Atlanta to River Mist 5' Concrete Walk $910,000 14,000'
Haw Creek Old Atlanta to Buford Hwy 5' Concrete Walk $520,000 8,000'
Trammel Buford Hwy to Old Atlanta 5' Concrete Walk $1,300,000 20,000'
Hudgins Buford Hwy to New College Way 5' Concrete Walk $390,000 6,000'
Fairway Buford Hwy to School 5' Concrete Walk $325,000 5,000'

Forsyth County Bicycle Transportation and Pedestrian Walkways 2025 Plan 69
Pilgrim Mill City Limits to Tidwell Park 5' Concrete Walk $1,683,500 25,900'
Browns Bridge Keith Bridge to Hendrix 5' Concrete Walk $1,235,000 19,000'
New Proposed Access Road Hwy 141 to City Limits and Market Place Blvd. 5' Concrete Walk $1,495,000 23,000'
Dahlonega Hwy Rte 9 to proposed Pilgrim Mill Access Road 5' Concrete Walk $390,000 6,000'
Peachtree Pkwy Mathis Airport to McGinnis Ferry 5' Concrete Walk $487,500 7,500'
Proposed Pilgrim Mill Access Road Pilgrim Mill to Browns Bridge 5' Concrete Walk $731,250 11,250'
Brookwood Peachtree Pkwy to Fulton County Border 5' Concrete Walk $364,000 5,600'
TOTAL: $12,138,750 186,750'
Bicycle Friendly Shoulder
Road Name: Area Description: Facility Description: Preliminary Estimate of Cost: Approximate Linear Feet:
Atlanta Hwy Hwy 371 to Bethelview Additional Shoulder Width $804,000 20,100'
Sharon Road Hwy 141 to Old Atlanta Additional Shoulder Width $224,000 5,600'
Jones Road Bluegrass Lakes Pkwy to Dalesford Drive Additional Shoulder Width $200,000 5,000'
TOTAL: $1,228,000 30,700'

Forsyth County Bicycle Transportation and Pedestrian Walkways 2025 Plan 70
Signed Shared Roadway
Project Name: Area Description: Facility Description: Preliminary Estimate of Cost: Approximate Linear Feet:
Bentley Trail Kelly Mill to Cherokee County Border Bicycle Traffic Signage $26,000 26,000'
Tribble Trail Watson to Kelly Mill Bicycle Traffic Signage $6,900 16,900'
Spot Trail Bettis Tribble Gap to Dahlonega Hwy Bicycle Traffic Signage $17,500 17,500'
TOTAL: $60,400 60,400'
Preliminary Estimate of Cost: Approximate Linear Feet:
MID-TERM PRIORITY PROJECT TOTALS $17,627,150 298,850'

Forsyth County Bicycle Transportation and Pedestrian Walkways 2025 Plan 71
LONG-TERM PROJECTS
(+11 years)
Project Name: Area Description: Facility Description: Preliminary Estimate of Cost: Approximate Linear Feet:
PROPOSED GREENWAY
Big Creek Extension Phase I Park off of Hwy 9 to McGinnis Ferry 10'-12' Shared-Use Path $4,200,000 21,000'
Big Creek Extension Phase II Atlanta Hwy to Majors 10'-12' Shared-Use Path $1,400,000 7,000'
Etowah Greenway Extension Cherokee Co. Border to Dawson Co. Border 10'-12' Shared-Use Path $6,200,000 31,000'
Sawnee Mountain Greenway Pooles Mill Park to Swanee Mountain Park 10'-12' Shared-Use Path $9,000,000 45,000'
Chattahoochee River Buford Dam Road to McGinnis Ferry 10'-12' Shared-Use Path $10,000,000 50,000'
TOTAL: $30,800,000 154,000'
MULTI-USE PATH
Hwy 400 McGinnis Ferry to Buford Hwy 8’-10’ Walk/Bikeway $9,000,000 45,000'
Browns Bridge Road Keith Bridge to Waldrip Circle 8’-10’ Walk/Bikeway $6,400,000 32,000'
Keith Bridge Road Waldrip to Browns Bridge 8’-10’ Walk/Bikeway $6,800,000 34,000'
TOTAL: $22,200,000 111,000'

Forsyth County Bicycle Transportation and Pedestrian Walkways 2025 Plan 72
SIDEWALKS
Gilbert Road Old Atlanta to Trammel 5' Concrete Walk $390,000 6,000'
Echols Buford Hwy to Hudgins 5' Concrete Walk $396,500 6,100'
Castleberry Rte 9 to Bethelview 5' Concrete Walk $637,000 9,800'
Pooles Mill Link Poole Mill Park to Etowah River Greenway 5' Concrete Walk $455,000 7,000'
TOTAL: $1,878,500 28,900'
Bicycle Friendly Shoulder
Pilgrim Mill Proposed Access Road to Tidwell Park Additional Shoulder Width $676,000 16,900'
Waldrep Keith Bridge to Browns Bridge Additional Shoulder Width $800,000 20,000'
TOTAL: $1,476,000 36,900'

Forsyth County Bicycle Transportation and Pedestrian Walkways 2025 Plan 73
Signed Shared Roadway
Heardsville Circle Heardsville Circle Bicycle Traffic Signage $10,000 10,000'
TOTAL: $10,000 10,000'
Preliminary Estimate of Cost: Approximate Linear Feet:
LONG-TERM PRIORITY PROJECT TOTALS $56,364,500 340,800'

Forsyth County Bicycle Transportation and Pedestrian Walkways 2025 Plan 74

Forsyth County Bicycle Transportation and Pedestrian Walkways 2025 Plan 75

Forsyth County Bicycle Transportation and Pedestrian Walkways 2025 Plan 76

Forsyth County Bicycle Transportation and Pedestrian Walkways 2025 Plan 77