2025 Local Shelter Plan - Caloocan City 2017
127
-
Upload
khangminh22 -
Category
Documents
-
view
3 -
download
0
Transcript of 2025 Local Shelter Plan - Caloocan City 2017

Caloocan City 2017 – 2025 Local Shelter Plan
i
Caloocan City 2017 – 2025 Local Shelter Plan
ii
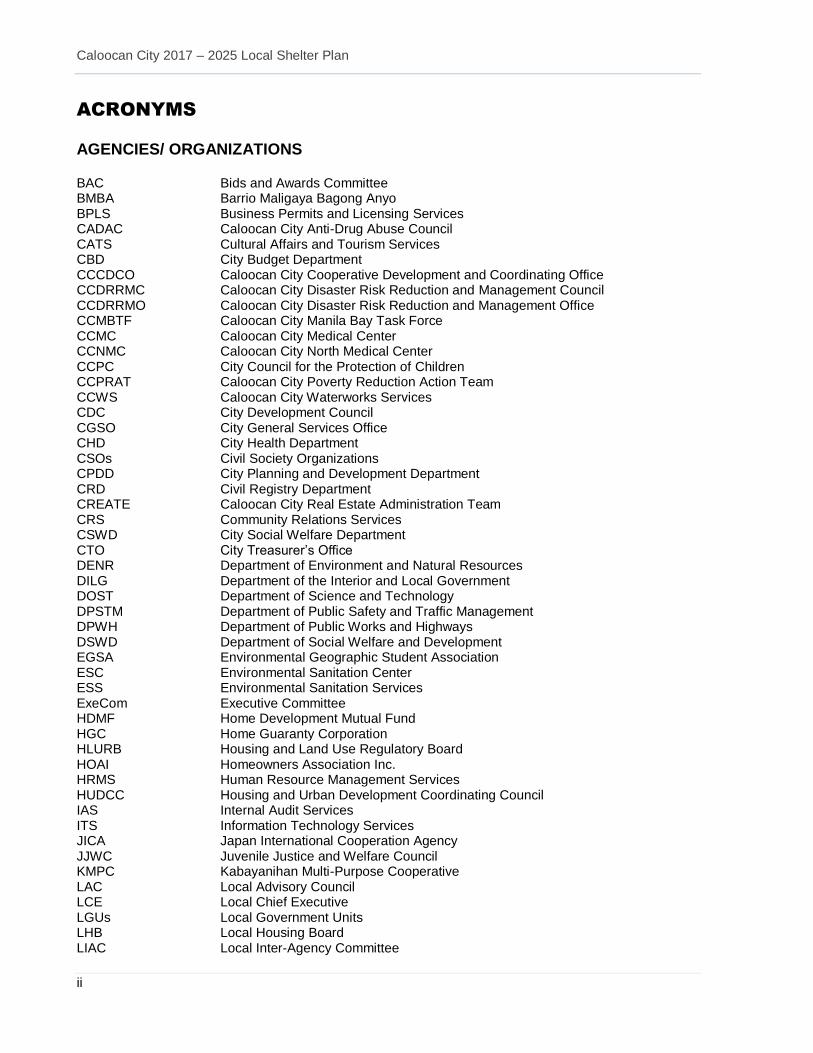
ACRONYMS
AGENCIES/ ORGANIZATIONS
BAC Bids and Awards Committee BMBA Barrio Maligaya Bagong Anyo BPLS Business Permits and Licensing Services CADAC Caloocan City Anti-Drug Abuse Council CATS Cultural Affairs and Tourism Services CBD City Budget Department CCCDCO Caloocan City Cooperative Development and Coordinating Office CCDRRMC Caloocan City Disaster Risk Reduction and Management Council CCDRRMO Caloocan City Disaster Risk Reduction and Management Office CCMBTF Caloocan City Manila Bay Task Force CCMC Caloocan City Medical Center CCNMC Caloocan City North Medical Center CCPC City Council for the Protection of Children CCPRAT Caloocan City Poverty Reduction Action Team CCWS Caloocan City Waterworks Services CDC City Development Council CGSO City General Services Office CHD City Health Department CSOs Civil Society Organizations CPDD City Planning and Development Department CRD Civil Registry Department CREATE Caloocan City Real Estate Administration Team CRS Community Relations Services CSWD City Social Welfare Department CTO City Treasurer’s Office DENR Department of Environment and Natural Resources DILG Department of the Interior and Local Government DOST Department of Science and Technology DPSTM Department of Public Safety and Traffic Management DPWH Department of Public Works and Highways DSWD Department of Social Welfare and Development EGSA Environmental Geographic Student Association ESC Environmental Sanitation Center ESS Environmental Sanitation Services ExeCom Executive Committee HDMF Home Development Mutual Fund HGC Home Guaranty Corporation HLURB Housing and Land Use Regulatory Board HOAI Homeowners Association Inc. HRMS Human Resource Management Services HUDCC Housing and Urban Development Coordinating Council IAS Internal Audit Services ITS Information Technology Services JICA Japan International Cooperation Agency JJWC Juvenile Justice and Welfare Council KMPC Kabayanihan Multi-Purpose Cooperative LAC Local Advisory Council LCE Local Chief Executive LGUs Local Government Units LHB Local Housing Board LIAC Local Inter-Agency Committee

Caloocan City 2017 – 2025 Local Shelter Plan
iii
AGENCIES/ ORGANIZATIONS (continuation) LIRS Labor and Industrial Relations Services LMB Land Management Bureau LTO Land Transportation Office MERALCO Manila Electric Company MMA Metropolitan Manila Authority MMC Metropolitan Manila Council MMDA Metropolitan Manila Development Authority MNTC Manila North Tollways Corporation MWSI Maynilad Water Services, Inc. NAI Neighborhood Association, Inc. NAMRIA National Mapping and Resources Information Authority NCR National Capital Region NGAs National Government Agencies NGOs Non-Government Organizations NHA National Housing Authority NHMFC National Home Mortgage Finance Corporation NPA New People’s Army NPC National Power Corporation NSCB National Statistical Coordination Board NSO National Statistics Office OCBO Office of the City Building Official OCM Office of the City Mayor OCV Office of the City Veterinarian OLUZA Office of the Land Use and Zoning Administrator OSCA Office of the Senior Citizens Affairs OUP Office for the Urban Poor Pag-IBIG Pagtutulungan sa Kinabukasan: Ikaw, Bangko, Industria at Gobyerno PCUP Presidential Commission for the Urban Poor PHHC People’s Homesite and Housing Corporation PHIVOLCS Philippine Institute of Volcanology and Seismology PLDT Philippine Long Distance Telephone Company PLEB People’s Law Enforcement Board PMT Performance Management Team PNP Philippine National Police PNR Philippine National Railways POC Peace and Order Council PSA Philippine Statistics Administration PSB Personnel Selection Board SAMAKASAWATA Samahan ng Magkakapitbahay sa SAWATA SHFC Social Housing Finance Corporation SP Sangguniang Panlungsod SWMB Solid Waste Management Board TLRC Technology Livelihood Resource Center TMMED Third Metro Manila Engineering District TWG Technical Working Group UCC University of Caloocan City UN United Nations UNCHS United Nations Centre for Human Settlements USNAI United Settler Neighborhood Association Inc. WB-IFC World Bank - International Finance Corporation
Caloocan City 2017 – 2025 Local Shelter Plan
iv
OTHERS AIDS Acquired Immune Deficiency Syndrome BSRP Bagong Silang Resettlement Project BuB Bottom-Up Budgeting CAMANAVA Caloocan-Malabon-Navotas-Valenzuela CBD Central Business District CCA Climate Change Adaptation CCCAP City Climate Change Action Plan CCDRRMP Caloocan City Disaster Risk Reduction and Management Program CCGFPS Caloocan City Gender and Development Focal Point System CBDs Central Business Districts CDs Compact Discs CIPH City Investment Plan for Health CLUP Comprehensive Land Use Plan CMP Community Mortgage Program CPH Census of Population and Housing CSCAND Collective Strengthening for Community Awareness on Natural Disasters DDDP Dagat-Dagatan Development Project DRR Disaster Risk Reduction DU Dwelling Units EDSA Epifanio de los Santos Avenue ELA Executive-Legislative Agenda EO Executive Order FIES Family Income and Expenditure Survey FY Fiscal Year GAD Gender and Development GMMA Greater Metropolitan Manila Area GMMA Ready Project Enhancing Greater Metro Manila’s Institutional Capacities for Effective
Disaster/ Climate Risk Management towards Sustainable Development GSS Gender Sensitivity Seminar HDHP High Density Housing Program HHs Households HUC Highly Urbanized City IRA Internal Revenue Allotment ISFs Informal Settler Families LCMP Localized Community Mortgage Program LGC Local Government Code LGPMS Local Governance Performance Management System LOG Letter of Guaranty LRB Low Rise Building LRT Light Rail Transit M&E Monitoring and Evaluation MBCRP Manila Bay Clean-up, Rehabilitation and Preservation MDG FACES Millennium Development Goals Family-based Actions for Children and
their Environs in the Slums MOA Memorandum of Agreement MRFs Materials Recovery Facilities
MMEIRS Metro Manila Earthquake Impact Reduction Study MRB Medium Rise Building NLEx North Luzon Expressway PCF Performance Challenge Fund PEIS PHIVOLCS Earthquake Intensity Scale
Caloocan City 2017 – 2025 Local Shelter Plan
v
OTHERS (continuation) R&D Research and Development RA Republic Act RAE Rizal Avenue Extension RPT Real Property Tax RROWs Road Right-of-Ways SLEx South Luzon Expressway UDHA Urban Development and Housing Act UNDP United Nations Development Programme VFS Valley Fault System 4Ps Pantawid Pamilyang Pilipino Program
Caloocan City 2017 – 2025 Local Shelter Plan
vi
TABLE OF CONTENTS
1 OVERVIEW
1.1 RATIONALE ...................................................................................................................... 1
1.1.1 LEGAL BASIS ............................................................................................................. 2
1.1.1.1 THE 1987 CONSTITUTION .................................................................................. 2
1.1.1.2 THE LOCAL GOVERNMENT CODE OF 1991 ........................................................ 2
1.1.1.3 THE URBAN DEVELOPMENT AND HOUSING ACT OF 1992................................. 3
1.1.1.4 REPUBLIC ACT NO. 10121 .................................................................................. 4
1.1.1.5 SUPREME COURT DECISIONS IN G.R. NOS. 171947 – 171948 ........................... 4
1.1.2 VISION ........................................................................................................................ 5
1.1.3 GOAL .......................................................................................................................... 5
1.1.4 SHELTER PLANNING OBJECTIVES ......................................................................... 5
1.2 TARGET POPULATION .................................................................................................... 6
1.3 SHELTER PLANNING PROCESS .................................................................................... 6
1.3.1 ROLES AND RESPONSIBILITIES .............................................................................. 6
1.3.2 PLANNING AND FORMULATION .............................................................................. 8
1.3.3 STRUCTURE AND TIME FRAME OF THE PLAN ...................................................... 9
2 CITY PROFILE
2.1 GEOGRAPHIC LOCATION AND FEATURES ................................................................ 10
2.1.1 GEOGRAPHY AND LOCATION ............................................................................... 10
2.1.2 CLIMATE ................................................................................................................... 10
2.1.2.1 RAINFALL ......................................................................................................... 10
2.1.2.2 MAXIMUM OCCURRENCE................................................................................ 11
2.1.2.3 WIND DIRECTION ............................................................................................ 12
2.1.3 TOPOGRAPHY AND GEOMORPHOLOGY ............................................................. 13
2.1.3.1 GEOLOGY ......................................................................................................... 14
2.1.3.2 GEOMORPHOLOGY .......................................................................................... 15
2.1.4 HAZARD VULNERABILITY PROFILE ...................................................................... 18
2.1.4.1 SEISMIC HAZARD ............................................................................................. 18
2.1.4.2 GROUND SHAKING .......................................................................................... 18
2.1.4.3 LIQUEFACTION ................................................................................................ 19
Caloocan City 2017 – 2025 Local Shelter Plan
vii
2.1.4.4 TSUNAMI ......................................................................................................... 19
2.2 URBAN DEVELOPMENT TRENDS ................................................................................ 23
2.2.1 POPULATION ........................................................................................................... 23
2.2.1.1 HISTORICAL GROWTH ..................................................................................... 23
2.2.1.2 POPULATION DISTRIBUTION ........................................................................... 25
2.2.1.3 POPULATION SIZE............................................................................................ 26
2.2.1.4 HOUSEHOLD POPULATION, HOUSEHOLD SIZE AND POPULATION DENSITY ... 26
2.2.1.5 AGE, SEX COMPOSITION ................................................................................. 32
2.2.1.6 POPULATION BY MARITAL STATUS ................................................................. 33
2.2.2 FAMILY INCOME AND EXPENDITURE ................................................................... 33
2.2.3 TRADE AND INDUSTRY .......................................................................................... 36
2.2.4 EMPOYMENT BY MAJOR SECTOR ........................................................................ 36
2.2.5 LAND USES .............................................................................................................. 37
2.2.5.1 GROWTH OF COMMERCIAL AND BUSINESS CENTERS ALONG MAJOR ............ 37
TRANSIT POINTS AND CORRIDORS ................................................................................. 37
2.2.5.2 EXPANSION OF INDUSTRIAL AREAS WITHIN EXISTING INDUSTRIAL ZONES .... 38
2.2.5.3 RAPID INCREASE OF RESIDENTIAL LAND AREA IN NORTH CALOOCAN ............ 38
2.2.5.4 GROWTH CORRIDORS ..................................................................................... 39
2.2.6 LAND USE PLAN ...................................................................................................... 43
2.2.6.1 LAND SUPPLY – DEMAND BALANCE ................................................................ 43
2.2.6.2 SOUTH CALOOCAN .......................................................................................... 44
2.2.6.3 NORTH CALOOCAN CITY .................................................................................. 47
2.2.7 INFRASTRUCTURE AND UTILITIES ....................................................................... 49
2.2.7.1 ROAD INVENTORY ........................................................................................... 49
2.2.7.2 PUBLIC TRANSPORTATION SERVICES .............................................................. 50
2.2.7.3 WATER SERVICES ............................................................................................. 50
2.2.7.4 POWER SERVICES ............................................................................................ 51
2.2.7.5 TELECOMMUNICATION ................................................................................... 52
2.2.7.6 SOLID WASTE MANAGEMENT ......................................................................... 52
2.2.8 INSTITUTIONAL ADMINISTRATION ....................................................................... 54
2.2.8.1 “TAO ANG UNA” (PEOPLE FIRST) POLICY OF GOVERNANCE ............................ 54
2.2.8.2 ORGANIZATIONAL ADMINISTRATION ............................................................. 54
Caloocan City 2017 – 2025 Local Shelter Plan
viii
2.2.8.3 SEAT OF GOVERNMENT - NORTH AND SOUTH CALOOCAN CITY HALLS .......... 58
2.2.9 LOCAL ECONOMY ................................................................................................... 59
2.2.9.1 INCOME GENERATION ..................................................................................... 59
2.2.9.2 RESOURCE ALLOCATION .................................................................................. 62
3 SHELTER NEEDS
3.1 BASIC DATA AND ASSUMPTIONS ............................................................................... 64
3.2 CURRENT HOUSING SITUATION ................................................................................. 66
3.2.1 BACKLOG ................................................................................................................. 68
3.2.2 ASSESSING FUTURE NEEDS ................................................................................. 73
3.2.2.1 SUMMARY OF SHELTER NEEDS ........................................................................ 73
3.2.3 UPGRADING NEEDS ............................................................................................... 74
3.2.3.1 TENURE UPGRADING ....................................................................................... 74
4 AFFORDABILITY
5 RESOURCES FOR SHELTER
6 WORK AND FINANCIAL PLAN
7 MONITORING AND EVALUATION SCHEMES
7.1 MEANS OF IMPLEMENTATION ..................................................................................... 94
7.2 MONITORING AND EVALUATION OF THE FRAMEWORK .......................................... 94
8 SANGGUNIANG PANLUNGSOD APPROVAL
ANNEXES
BIBLIOGRAPHY........................................................................................................................... 95
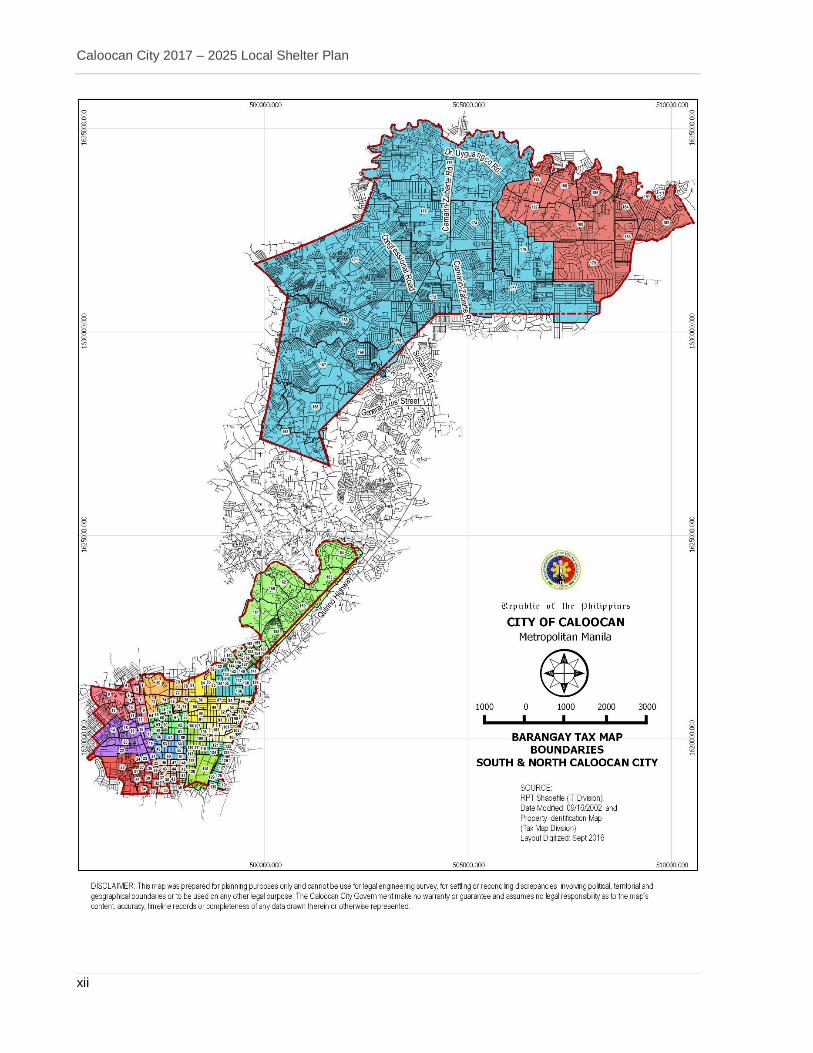
REFERENCE MAPS .................................................................................................................... 97
DOCUMENTATIONS ................................................................................................................. 111
Caloocan City 2017 – 2025 Local Shelter Plan
ix
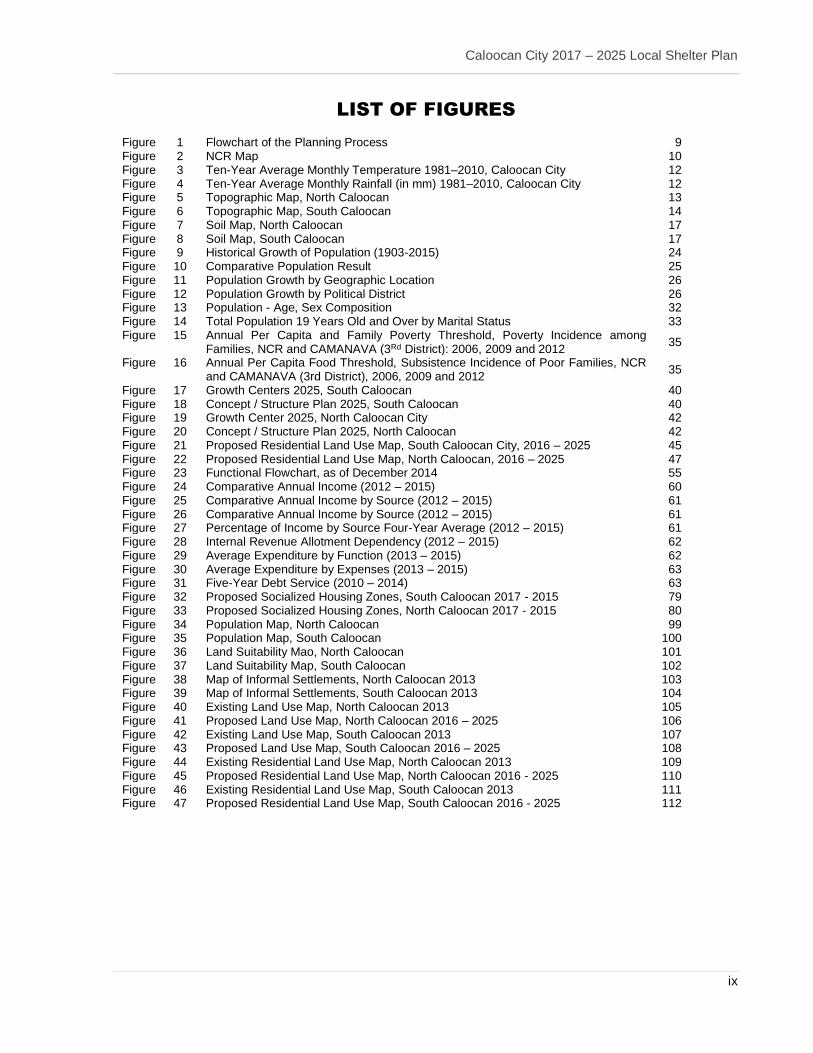
LIST OF FIGURES
Figure 1 Flowchart of the Planning Process 9 Figure 2 NCR Map 10 Figure 3 Ten-Year Average Monthly Temperature 1981–2010, Caloocan City 12 Figure 4 Ten-Year Average Monthly Rainfall (in mm) 1981–2010, Caloocan City 12 Figure 5 Topographic Map, North Caloocan 13 Figure 6 Topographic Map, South Caloocan 14 Figure 7 Soil Map, North Caloocan 17 Figure 8 Soil Map, South Caloocan 17 Figure 9 Historical Growth of Population (1903-2015) 24 Figure 10 Comparative Population Result 25 Figure 11 Population Growth by Geographic Location 26 Figure 12 Population Growth by Political District 26 Figure 13 Population - Age, Sex Composition 32 Figure 14 Total Population 19 Years Old and Over by Marital Status 33 Figure 15 Annual Per Capita and Family Poverty Threshold, Poverty Incidence among
Families, NCR and CAMANAVA (3Rd District): 2006, 2009 and 2012 35
Figure 16 Annual Per Capita Food Threshold, Subsistence Incidence of Poor Families, NCR and CAMANAVA (3rd District), 2006, 2009 and 2012
35
Figure 17 Growth Centers 2025, South Caloocan 40 Figure 18 Concept / Structure Plan 2025, South Caloocan 40 Figure 19 Growth Center 2025, North Caloocan City 42 Figure 20 Concept / Structure Plan 2025, North Caloocan 42 Figure 21 Proposed Residential Land Use Map, South Caloocan City, 2016 – 2025 45 Figure 22 Proposed Residential Land Use Map, North Caloocan, 2016 – 2025 47 Figure 23 Functional Flowchart, as of December 2014 55 Figure 24 Comparative Annual Income (2012 – 2015) 60 Figure 25 Comparative Annual Income by Source (2012 – 2015) 61 Figure 26 Comparative Annual Income by Source (2012 – 2015) 61 Figure 27 Percentage of Income by Source Four-Year Average (2012 – 2015) 61 Figure 28 Internal Revenue Allotment Dependency (2012 – 2015) 62 Figure 29 Average Expenditure by Function (2013 – 2015) 62 Figure 30 Average Expenditure by Expenses (2013 – 2015) 63 Figure 31 Five-Year Debt Service (2010 – 2014) 63 Figure 32 Proposed Socialized Housing Zones, South Caloocan 2017 - 2015 79 Figure 33 Proposed Socialized Housing Zones, North Caloocan 2017 - 2015 80 Figure 34 Population Map, North Caloocan 99 Figure 35 Population Map, South Caloocan 100 Figure 36 Land Suitability Mao, North Caloocan 101 Figure 37 Land Suitability Map, South Caloocan 102 Figure 38 Map of Informal Settlements, North Caloocan 2013 103 Figure 39 Map of Informal Settlements, South Caloocan 2013 104 Figure 40 Existing Land Use Map, North Caloocan 2013 105 Figure 41 Proposed Land Use Map, North Caloocan 2016 – 2025 106 Figure 42 Existing Land Use Map, South Caloocan 2013 107 Figure 43 Proposed Land Use Map, South Caloocan 2016 – 2025 108 Figure 44 Existing Residential Land Use Map, North Caloocan 2013 109 Figure 45 Proposed Residential Land Use Map, North Caloocan 2016 - 2025 110 Figure 46 Existing Residential Land Use Map, South Caloocan 2013 111 Figure 47 Proposed Residential Land Use Map, South Caloocan 2016 - 2025 112
Caloocan City 2017 – 2025 Local Shelter Plan
x
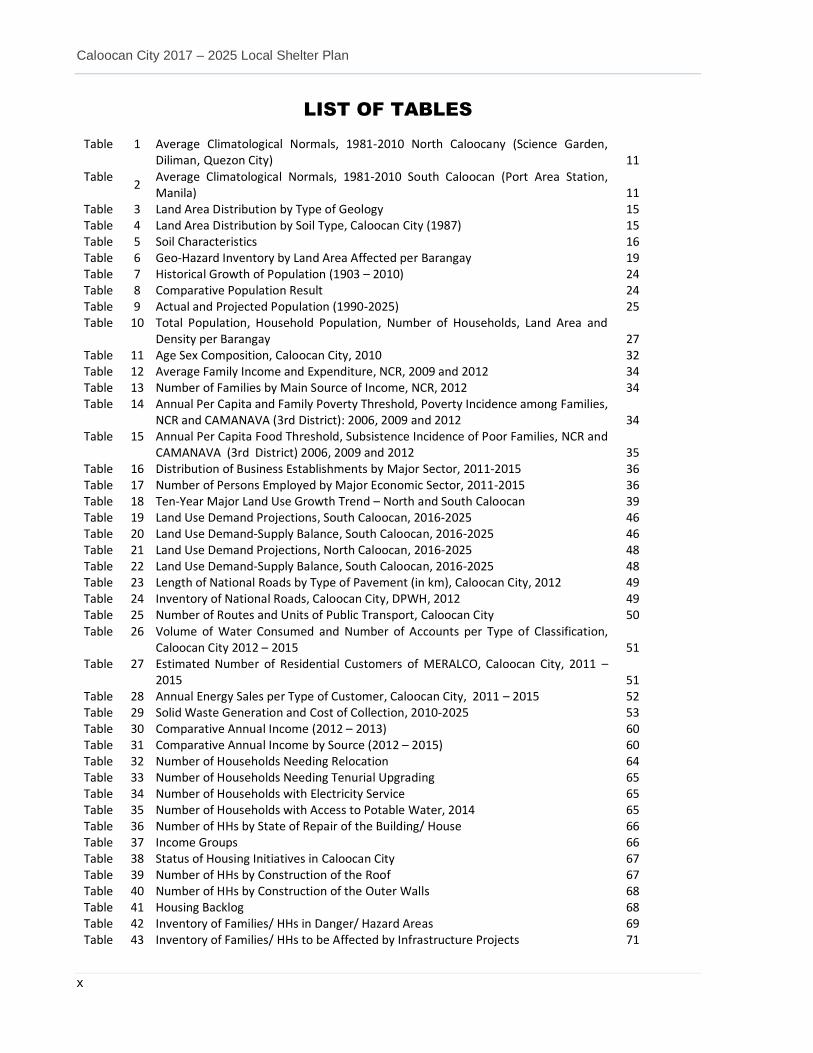
LIST OF TABLES
Table 1 Average Climatological Normals, 1981-2010 North Caloocany (Science Garden, Diliman, Quezon City) 11
Table 2
Average Climatological Normals, 1981-2010 South Caloocan (Port Area Station, Manila) 11
Table 3 Land Area Distribution by Type of Geology 15 Table 4 Land Area Distribution by Soil Type, Caloocan City (1987) 15 Table 5 Soil Characteristics 16 Table 6 Geo-Hazard Inventory by Land Area Affected per Barangay 19 Table 7 Historical Growth of Population (1903 – 2010) 24 Table 8 Comparative Population Result 24 Table 9 Actual and Projected Population (1990-2025) 25 Table 10 Total Population, Household Population, Number of Households, Land Area and
Density per Barangay 27 Table 11 Age Sex Composition, Caloocan City, 2010 32 Table 12 Average Family Income and Expenditure, NCR, 2009 and 2012 34 Table 13 Number of Families by Main Source of Income, NCR, 2012 34 Table 14 Annual Per Capita and Family Poverty Threshold, Poverty Incidence among Families,
NCR and CAMANAVA (3rd District): 2006, 2009 and 2012 34 Table 15 Annual Per Capita Food Threshold, Subsistence Incidence of Poor Families, NCR and
CAMANAVA (3rd District) 2006, 2009 and 2012 35 Table 16 Distribution of Business Establishments by Major Sector, 2011-2015 36 Table 17 Number of Persons Employed by Major Economic Sector, 2011-2015 36 Table 18 Ten-Year Major Land Use Growth Trend – North and South Caloocan 39 Table 19 Land Use Demand Projections, South Caloocan, 2016-2025 46 Table 20 Land Use Demand-Supply Balance, South Caloocan, 2016-2025 46 Table 21 Land Use Demand Projections, North Caloocan, 2016-2025 48 Table 22 Land Use Demand-Supply Balance, South Caloocan, 2016-2025 48 Table 23 Length of National Roads by Type of Pavement (in km), Caloocan City, 2012 49 Table 24 Inventory of National Roads, Caloocan City, DPWH, 2012 49 Table 25 Number of Routes and Units of Public Transport, Caloocan City 50 Table 26 Volume of Water Consumed and Number of Accounts per Type of Classification,
Caloocan City 2012 – 2015 51 Table 27 Estimated Number of Residential Customers of MERALCO, Caloocan City, 2011 –
2015 51 Table 28 Annual Energy Sales per Type of Customer, Caloocan City, 2011 – 2015 52 Table 29 Solid Waste Generation and Cost of Collection, 2010-2025 53 Table 30 Comparative Annual Income (2012 – 2013) 60 Table 31 Comparative Annual Income by Source (2012 – 2015) 60 Table 32 Number of Households Needing Relocation 64 Table 33 Number of Households Needing Tenurial Upgrading 65 Table 34 Number of Households with Electricity Service 65 Table 35 Number of Households with Access to Potable Water, 2014 65 Table 36 Number of HHs by State of Repair of the Building/ House 66 Table 37 Income Groups 66 Table 38 Status of Housing Initiatives in Caloocan City 67 Table 39 Number of HHs by Construction of the Roof 67 Table 40 Number of HHs by Construction of the Outer Walls 68 Table 41 Housing Backlog 68 Table 42 Inventory of Families/ HHs in Danger/ Hazard Areas 69 Table 43 Inventory of Families/ HHs to be Affected by Infrastructure Projects 71
Caloocan City 2017 – 2025 Local Shelter Plan
xi
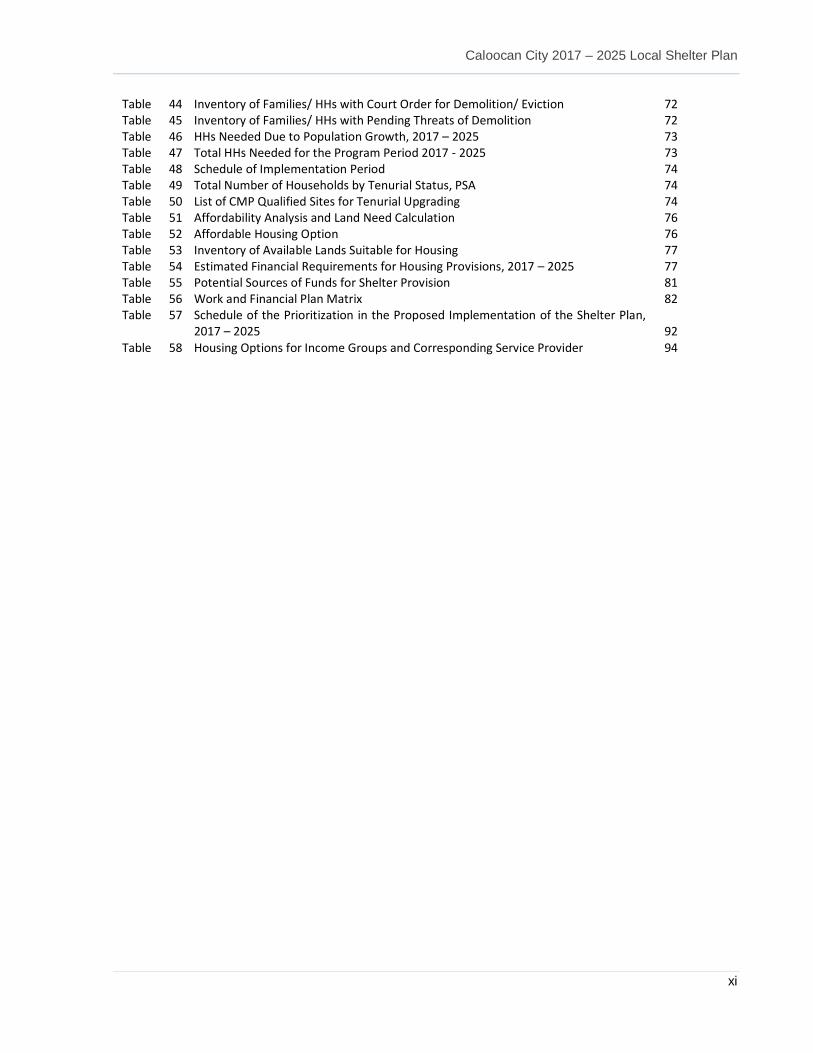
Table 44 Inventory of Families/ HHs with Court Order for Demolition/ Eviction 72 Table 45 Inventory of Families/ HHs with Pending Threats of Demolition 72 Table 46 HHs Needed Due to Population Growth, 2017 – 2025 73 Table 47 Total HHs Needed for the Program Period 2017 - 2025 73 Table 48 Schedule of Implementation Period 74 Table 49 Total Number of Households by Tenurial Status, PSA 74 Table 50 List of CMP Qualified Sites for Tenurial Upgrading 74 Table 51 Affordability Analysis and Land Need Calculation 76 Table 52 Affordable Housing Option 76 Table 53 Inventory of Available Lands Suitable for Housing 77 Table 54 Estimated Financial Requirements for Housing Provisions, 2017 – 2025 77 Table 55 Potential Sources of Funds for Shelter Provision 81 Table 56 Work and Financial Plan Matrix 82 Table 57 Schedule of the Prioritization in the Proposed Implementation of the Shelter Plan,
2017 – 2025 92 Table 58 Housing Options for Income Groups and Corresponding Service Provider 94
Caloocan City 2017 – 2025 Local Shelter Plan
xii
Caloocan City 2017 – 2025 Local Shelter Plan
1 | P a g e
1 OVERVIEW
1.1 RATIONALE Caloocan City, classified as one of the country’s highly urbanized cities, has transformed itself into an investment panorama owing to its strategic location and vast emergent land area in its northern part. South Caloocan, in particular, has acclimatized to the transformations brought by a commercial revolution. The demands of trade have been met in terms of business expectations. The city now boasts of being the country’s Motorcycle Capital, which is substantiated by a booming motorcycle industry along the Rizal Avenue and 10th Avenue areas. For the past three years, the local government prided itself in the construction and improvement of infrastructures such as school buildings, hospitals, parks and similar structures that aims to improve the lives of its constituency. Roads and other accesses were improved, providing ease in transport. North Caloocan is swiftly transforming into a formidable investment district. It has significantly grown and has viably progressed into an income-generating locality. Challenging these endeavors is the continuous growth of the populace. Caloocan City is ranked as the third most populated city in the National Capital Region (NCR). The deficiency in housing facilities is caused mainly by the influx of migrates -- displaced families affected by government projects, and the intermittent increases in birth rate. These constrain the delivery of basic services and create a vacuum that derails the implementation of the city’s public service agenda. Nevertheless, the local government is always on-hand and capable of conveying assistance to the citizenry in the assurance of providing proper and adequate shelter facilities. The Local Government Code (LGC) of 1991 (Republic Act No. 7160) and the Urban Development and Housing Act (UDHA) of 1992 (RA 7279) mandated the local government units (LGUs) to implement programs and projects on low cost housing and other socialized dwellings especially for the underprivileged and homeless. However, due to the scarcity of urban resources, the private sector is thereby encouraged to participate and collaborate with the LGUs in the housing projects in compliance to Executive Order (EO) No. 90 - Identifying the Government Agencies Essential for the National Shelter Program and Defining their Mandates, Creating the Housing and Urban Development Coordinating Council (HUDCC), Rationalizing Funding Sources and Lending Mechanisms for Home Mortgages and for Other Purposes; and RA 7279 - An Act to Provide for a Comprehensive and Continuing Urban Development and Housing Program, Establish the Mechanism for its Implementation, and for Other Purposes. Evident to these efforts are the assenting and constructive effects the city has achieved in confronting housing issues. In a resolute attempt to lessen and/ or eliminate this predominant state and augment the city’s shelter situation; and utilize the resources more effectively and efficiently, the formulation of the Caloocan City 2017-2025 Shelter Plan is put into fore. In the preparation of this plan, all aspects were taken into consideration. Concerned city government offices and departments and national government agencies (NGAs) were consulted in congruence to its feasibility. The assurance of proper allocation, the accountability of the agencies involve will all be imperative components in the effectivity of this nine-year plan to foster improvements in the city’s current state of shelter accessibility.
Caloocan City 2017 – 2025 Local Shelter Plan
P a g e | 2
1.1.1 LEGAL BASIS The National Government issued a mandate to every LGU for the provision of housing services in their respective territorial jurisdiction. The legal basis is found on the following statutes and issuances: 1.1.1.1 THE 1987 CONSTITUTION Art. 13. Social Justice and Human Rights Sec. 9. The State shall, by law and for the common good undertake, in cooperation with the private sector, a continuing program of urban land reform and housing which will make available and affordable cost decent housing and basic services to underprivileged and homeless citizens in urban centers and resettlement areas. It shall also promote adequate employment opportunities to citizens. In the implementation of such programs the State shall respect the rights of small property owners.
Sec. 10. Urban or rural poor dwellers shall not be evicted nor their dwellings demolished, except in accordance with law and in a just and humane manner. No resettlement of urban or rural dwellers shall be undertaken without adequate consultation with the parties affected and the communities to where they will be relocated.
1.1.1.2 THE LOCAL GOVERNMENT CODE OF 1991 (Republic Act No. 7160) Every LGU is mandated to safeguard and ensure the general welfare of its constituency. Among the enumerated basic services and facilities that the LGU needs to provide to its people are programs and projects for low-cost housing. SEC. 16. General Welfare. - Every local government unit shall exercise the powers expressly granted, those necessarily implied therefrom, as well as powers necessary, appropriate, or incidental for its efficient and effective governance, and those which are essential to the promotion of the general welfare. Within their respective territorial jurisdictions, local government units shall ensure and support, among other things, the preservation and enrichment of culture, promote health and safety, enhance the right of the people to a balanced ecology, encourage and support the development of appropriate and self-reliant scientific and technological capabilities, improve public morals, enhance economic prosperity and social justice, promote full employment among their residents, maintain peace and order, and preserve the comfort and convenience of their inhabitants. SEC. 17. Basic Services and Facilities. - (a) Local government units shall endeavor to be self-
reliant and shall continue exercising the powers and discharging the duties and functions currently vested upon them. They shall also discharge the functions and responsibilities of national agencies and offices devolved to them pursuant to this Code. Local government units shall likewise exercise such other powers and discharge such other functions and responsibilities as are necessary, appropriate, or incidental to efficient and effective provision of the basic services and facilities enumerated herein. x x x
Caloocan City 2017 – 2025 Local Shelter Plan
3 | P a g e
1.1.1.3 THE URBAN DEVELOPMENT AND HOUSING ACT OF 1992 (Republic Act No. 7279)
The UDHA law also stipulates the mandate of LGUs to provide for the housing needs of their homeless constituents, thus justifying the need for them to implement their respective local housing programs. The specific tasks of LGUs mandated in RA 7279 are as follows: 1. Prepare a Comprehensive Land Use Plan (CLUP) for their respective localities aimed at
achieving the objectives of the UDHA; (Sec. 6 and 39) 2. Conduct an inventory of all lands and improvements thereon within their respective localities
in coordination with the Housing and Land Use Regulatory Board (HLURB) and assistance of appropriate government agencies; (Sec. 7)
3. Furnish HUDCC with a copy of its inventory, which shall be updated every three years,
necessary for development planning purposes; (Sec. 7) 4. Identify lands for socialized housing and resettlement areas for immediate and future needs
of the underprivileged and homeless in the urban areas, in coordination with the National Housing Authority (NHA), HLURB, National Mapping and Resources Information Authority (NAMRIA), and the Land Management Bureau (LMB) under the Department of Environment and Natural Resources (DENR); (Sec. 8)
5. Certify as to the blighted status of lands, which shall be considered as one of the factors in
the evaluation of the market value of land for socialized housing; (Sec. 13) 6. Identify and register all qualified socialized housing beneficiaries within their respective
localities; (Sec. 17) 7. Enter into joint venture projects with private developers, in pursuit of a balanced housing
development; (Sec. 18) 8. Provide basic services and facilities (potable water, power/ electricity and an adequate power
distribution system, sewerage facilities and an adequate solid waste disposal system; and access to primary roads and transportation facilities) in the socialized housing or resettlement areas in cooperation with the private sector and concerned agencies; (Sec. 21)
9. Provide the program beneficiaries or their duly designated representatives, the opportunity to
be heard and to participate in the decision-making process over matters involving the protection and promotion of their legitimate collective interest, in coordination with the Presidential Commission for the Urban Poor (PCUP) and concerned agencies; (Sec. 23)
10. Adopt measures to identify and effectively curtail the illegal operation of professional squatters
and squatting syndicates, in cooperation with the Philippine National Police (PNP) and the PCUP-accredited urban poor organizations in the area. (Sec. 27)
11. Implement, in coordination with NHA, the prescribed procedures and guidelines on the
execution of eviction and demolition orders involving the underprivileged and homeless citizens; and the provision of adequate relocation. Should relocation be not possible within the
Caloocan City 2017 – 2025 Local Shelter Plan
P a g e | 4
prescribed period, financial assistance in the amount equivalent to the prevailing minimum daily wage multiplied by sixty days shall be extended to the affected families; (Sec. 28)
12. Implement, in coordination with NHA, the relocation and resettlement of persons living in
danger areas such as esteros, railroad tracks, garbage dumps, riverbanks, shorelines, waterways and in other public places such as sidewalks, roads, parks and playgrounds; (Sec.29)
13. Provide, in coordination with NHA, relocation or resettlement sites with basic services and
facilities, and access to employment and livelihood opportunities sufficient to meet the basic needs of affected families; (Sec. 29)
14. Prevent the construction of any kind of illegal dwelling units or structures within their respective
localities; (Sec. 30) 15. Assist the National Home Mortgage Finance Corporation (NHMFC) in initiating the
organization of Community Mortgage Program (CMP) beneficiaries; (Sec. 33) 16. Promote, in coordination with NHA, the Technology Livelihood Resource Center (TLRC);
Department of Science and Technology (DOST), HUDCC, and other concerned agencies in the production and use of indigenous, alternative, and low-cost construction materials and technologies for socialized housing; (Sec. 34)
17. Submit, together with HUDCC, a detailed annual report, with respect to the implementation of
the Act, to the President and House of Representatives; (Sec. 41) 1.1.1.4 REPUBLIC ACT NO. 10121
“An Act Strengthening the Philippine Disaster Risk Reduction and Management System, Providing for the National Disaster Risk Reduction and Management Framework and Institutionalizing the National Disaster Risk Reduction and Management Plan, Appropriating Funds therefor and for other Purposes.” The act dictates the integration of Disaster Risk Reduction (DRR) and Climate Change Adaptation (CCA) in the formulation of development plans to address and assess the vulnerabilities brought about by these conditions; inclusive of these is the City Shelter Plan. It shall be the policy of the state: x x x (g) Mainstream disaster risk reduction and climate change in development processes such as policy formulation, socio-economic development planning, budgeting, and governance, particularly in the areas of environment, agriculture, water, energy, health, education, poverty reduction, land use and urban planning, and public infrastructure and housing, among others.
1.1.1.5 SUPREME COURT DECISIONS IN G.R. NOS. 171947 – 171948 (DECEMBER 18, 2008)
The ruling is referred to as the “Mandamus” ordering petitioners or the ten government agencies to clean up, rehabilitate and preserve Manila Bay in their different capacities. x x x
Caloocan City 2017 – 2025 Local Shelter Plan
5 | P a g e
(8) The Metro Manila Development Authority (MMDA), as the lead agency and implementer of programs and projects for flood control projects and drainage services in Metro Manila, in coordination with the Department of Public Works and Highways (DPWH), Department of the Interior and Local Government (DILG), affected LGUs, PNP Maritime Group, HUDCC, and other agencies, shall dismantle and remove all structures, constructions, and other encroachments established or built in violation of RA 7279, and other applicable laws along the Pasig-Marikina-San Juan Rivers, the NCR (Parañaque - Zapote, Las Piñas) Rivers, the Navotas-Malabon-Tullahan-Tenejeros Rivers, and connecting waterways and esteros in Metro Manila. x x x
1.1.2 VISION
“The historic City of Caloocan, center of sustainable economic growth, peopled by resilient,
peace-loving and dynamic communities, living in a safe and ecologically balanced environment, served by a government that gives the highest value to the needs of the citizens.”
1.1.3 GOAL
To provide decent, affordable and disaster resilient and climate change adaptive shelter that has adequate facilities towards the formation of a livable and socially responsible residential community.
1.1.4 SHELTER PLANNING OBJECTIVES
1. To acquire/ access/ develop 123.13 hectares of land for housing and resettlement from 2017 until 2025;
2. To reduce the doubled-up households (HHs) by building no less than 613 units annually between 2020-2025;
3. To relocate the 42,309 displaced HHs from 2017 to 2025 (refer to Table 33 for the annual targets );
4. To facilitate the provision of security of tenure to 16,451 HHs needing land tenure upgrading from 2017 until 2025;1
5. To upgrade the power facility of HHs from 2017 until 2025;
6. To upgrade/ provide access to potable water to 100% of the total number of HHs starting 2017;
7. To upgrade/ provide sanitation facility of 100% of the total number of HHs from 2017 until 2025;
8. To upgrade existing roads or provide access roads to 100% of the total number of HHs from 2017 until 2025;
9. To upgrade existing drainage system or provide drainage to 100% of the total number of HHs from 2017 until 2025;
10. To aggressively advocate for structural upgrading of dilapidated HHs starting 2017 onwards, to be resilient to hazards brought by climate change;
1 Office for the Urban Poor (OUP)
Caloocan City 2017 – 2025 Local Shelter Plan
P a g e | 6
11. To put in place local policies, local institutions, and institute the necessary mechanism to implement the Caloocan City 2017-2025 Shelter Plan to address the housing needs of the constituents;
12. To institute proper monitoring and evaluation of the implementation of the Caloocan City 2017-
2025 Shelter Plan; 13. To facilitate access to employment and income-generating activities of HH -beneficiaries.
1.2 TARGET POPULATION 2015 Population : 1,583,978 (Source: PSA 2015) Households/ Dwelling Unit : 1.05 (Source: NSO 2010) Annual Population Growth (%) : 1.18% (Source: PSA 2015) Household Size : 4.3% (Source: PSA 2015) Housing Stock : 350,640 (Source: PSA 2015e) There are 62,315 HHs identified as informal settlers. Living in dangerous areas is recorded at 8,603 HHs -- 4,510 near waterways; 394 along landslide prone areas; 2,775 along road right-of-ways (RROWs); 500 inside cemeteries; and 424 under the National Power Corporation (NPC) lines in Barangay 165, Phases 1-12. Also identified are 4,096 HHs affected by infrastructure projects of the national government, and 32,970 facing potential eviction -- 25,795 have pending threat of demolition; and 7,175 with court orders. There are also 16,451 HHs needing tenurial upgrading. Homeless HHs are registered at 195. HHs that were considered as informal settlers in private lands, or rent free/ with consent category are recorded at 40,145. Housing needs due to population growth is estimated at 45,850 by year 2025.
1.3 SHELTER PLANNING PROCESS
1.3.1 ROLES AND RESPONSIBILITIES Enumerated below are the primary actors and their respective involvement or roles in the formulation and/ or crafting of the Local Shelter Plan: Local Chief Executive (LCE)
Instigates the formulation of the Local Shelter Plan;
Ensures the technical capability of all personnel involved through participation in enhancement seminars/ workshops facilitated by partners agencies under the umbrella of the HUDCC;
Build a strong partnership with the Key Shelter Agencies -- NHA, NHMFC, Home Guaranty Corporation (HGC), HLURB, Home Development Mutual Fund (HDMF) or the Pag-IBIG (Pagtutulungan sa Kinabukasan: Ikaw, Bangko, Industria at Gobyerno) Fund to accelerate housing production through land use and local shelter planning, land inventory and creation of Local Housing Boards (LHBs);
Caloocan City 2017 – 2025 Local Shelter Plan
7 | P a g e
Allot development funds for local housing projects; and
Set aside lands for socialized housing in accordance with UDHA. Sangguniang Panlungsod (SP)
Responsible for the review and approval of the local shelter plan. Caloocan City Local Housing Board
Adopt or formulate a continuing plan for the city-wide housing or shelter program and urban development by establishing a database on population, land use, classification and utilization of properties within the city to cope with the urban problems related to housing and development;
Define areas suitable for priority housing and urban development, acquire by sale, by grant or by expropriation by the City Government, lands and to dispose the same, to identify and ascertain sources of adequate financing, adopt planning for urban resettlement, and identify and define qualified beneficiaries of the urban development and housing programs, particularly the poor and low-income families in Caloocan City;
Formulate and provide technical and financial support in building, repairing, extending and undertaking complete or incremental house construction;
Identify and tap adequate sources of financing and to define or device cost effective financing schemes or modes which will assist the beneficiaries of the housing and urban development program to acquire affordable, adequate and healthful housing;
Undertake relocation and/ or resettlement of families residing in danger areas, such as along esteros, riverbanks, waterways, railroad tracks, and in public places or lands devoted for needed infrastructure projects, jointly and/ or in coordination with the agencies, department and boards of the national government tasked to perform these functions with the objectives of providing adequate and affordable housing to the families that will be relocated or resettled;
Adopt and/ or install devices and mechanisms for the regular review and updating of the housing needs of the city residents and to ensure preparedness in dealing with emergency resettlements or housing, such as those arising from the effects of natural disasters and to ensure environmental protection conservation and urban renewal; and
Propose to the SP the budgetary requirement for each fiscal year (FY) in order to achieve its priority housing and development programs and projects as well as to finance its day to day operations.
HUDCC and the NCR Key Shelter Agencies
Consolidate the housing agencies under the umbrella of the HUDCC -- NHA, NHMFC, (HGC), HLURB, and HDMF or the Pag-IBIG Fund - which extensively orients the local government on the available programs, and technical and financing assistance through loans and grants;
Caloocan City 2017 – 2025 Local Shelter Plan
P a g e | 8
Put greater focus in empowering the LGUs as efficient urban managers with the capacity to develop plans and deliver services to their growing urban population by rendering necessary technical assistance through the conduct of a training workshop on the formulation of the Local Shelter Plan; and
Offer innovative housing solutions through the Key Shelter Agencies.
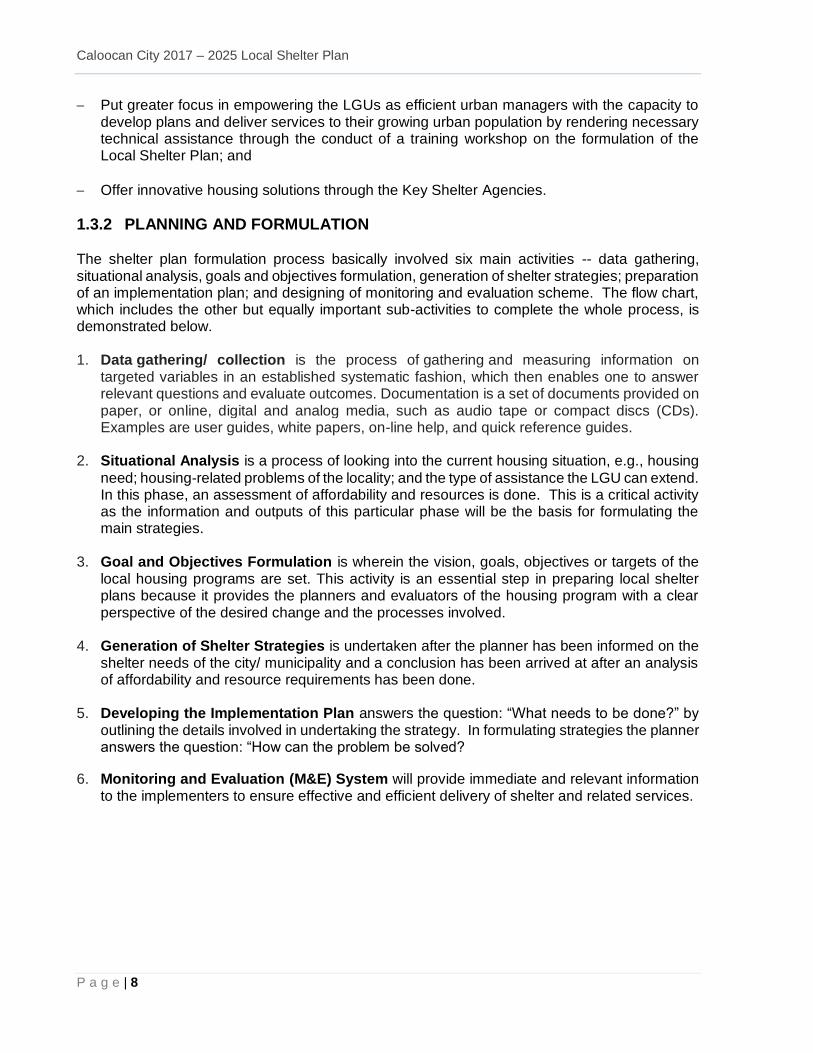
1.3.2 PLANNING AND FORMULATION The shelter plan formulation process basically involved six main activities -- data gathering, situational analysis, goals and objectives formulation, generation of shelter strategies; preparation of an implementation plan; and designing of monitoring and evaluation scheme. The flow chart, which includes the other but equally important sub-activities to complete the whole process, is demonstrated below. 1. Data gathering/ collection is the process of gathering and measuring information on
targeted variables in an established systematic fashion, which then enables one to answer relevant questions and evaluate outcomes. Documentation is a set of documents provided on paper, or online, digital and analog media, such as audio tape or compact discs (CDs). Examples are user guides, white papers, on-line help, and quick reference guides.
2. Situational Analysis is a process of looking into the current housing situation, e.g., housing
need; housing-related problems of the locality; and the type of assistance the LGU can extend. In this phase, an assessment of affordability and resources is done. This is a critical activity as the information and outputs of this particular phase will be the basis for formulating the main strategies.
3. Goal and Objectives Formulation is wherein the vision, goals, objectives or targets of the local housing programs are set. This activity is an essential step in preparing local shelter plans because it provides the planners and evaluators of the housing program with a clear perspective of the desired change and the processes involved.
4. Generation of Shelter Strategies is undertaken after the planner has been informed on the
shelter needs of the city/ municipality and a conclusion has been arrived at after an analysis of affordability and resource requirements has been done.
5. Developing the Implementation Plan answers the question: “What needs to be done?” by
outlining the details involved in undertaking the strategy. In formulating strategies the planner answers the question: “How can the problem be solved?
6. Monitoring and Evaluation (M&E) System will provide immediate and relevant information to the implementers to ensure effective and efficient delivery of shelter and related services.
Caloocan City 2017 – 2025 Local Shelter Plan
9 | P a g e
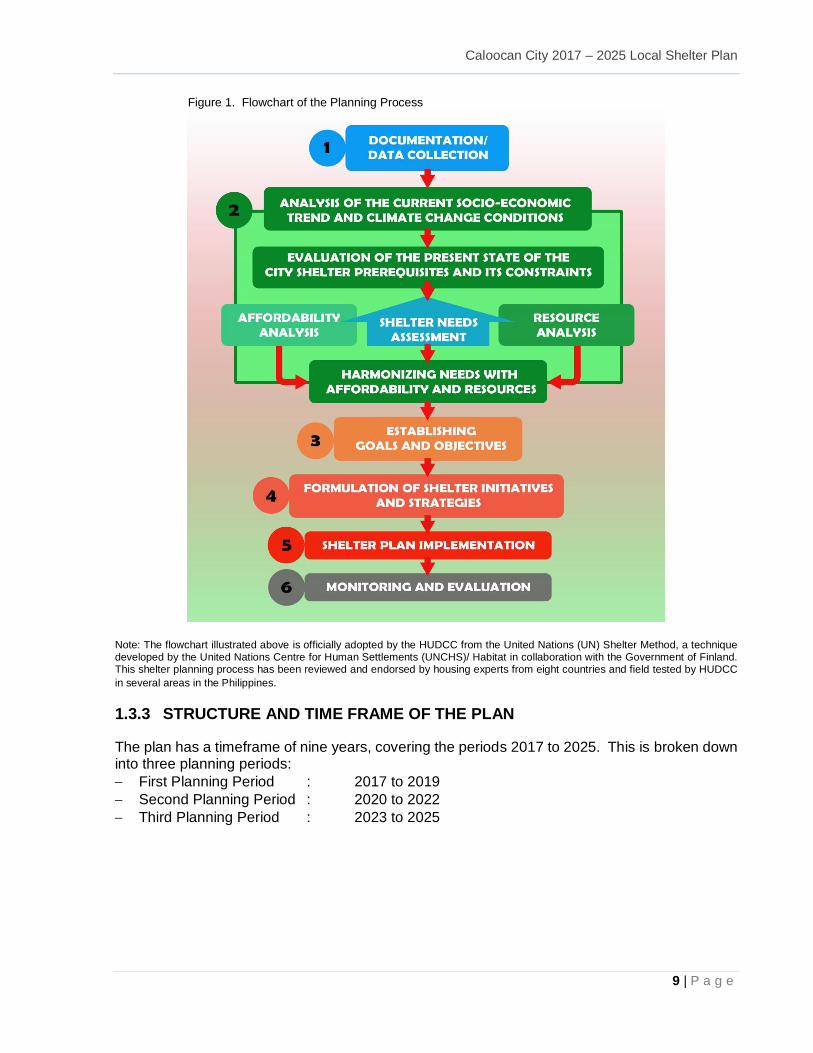
Figure 1. Flowchart of the Planning Process
Note: The flowchart illustrated above is officially adopted by the HUDCC from the United Nations (UN) Shelter Method, a technique developed by the United Nations Centre for Human Settlements (UNCHS)/ Habitat in collaboration with the Government of Finland. This shelter planning process has been reviewed and endorsed by housing experts from eight countries and field tested by HUDCC
in several areas in the Philippines.
1.3.3 STRUCTURE AND TIME FRAME OF THE PLAN
The plan has a timeframe of nine years, covering the periods 2017 to 2025. This is broken down into three planning periods:
First Planning Period : 2017 to 2019
Second Planning Period : 2020 to 2022
Third Planning Period : 2023 to 2025
Caloocan City 2017 – 2025 Local Shelter Plan
P a g e | 10
2 CITY PROFILE
2.1 GEOGRAPHIC LOCATION AND FEATURES
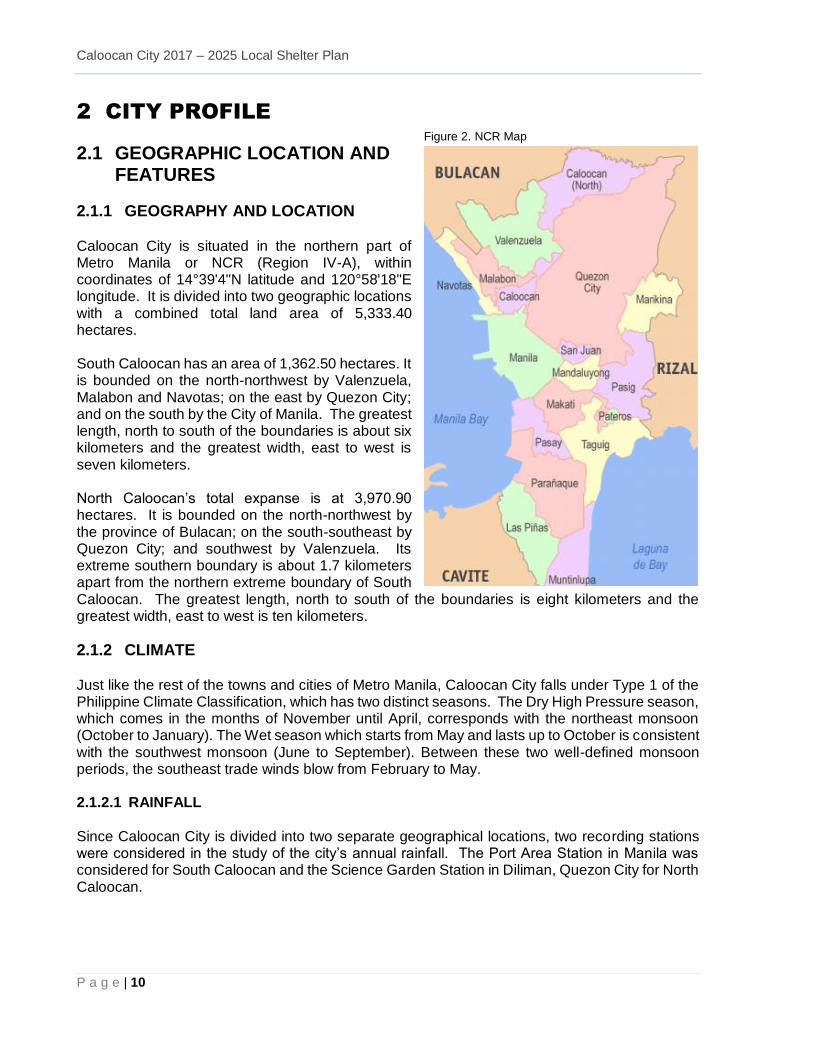
2.1.1 GEOGRAPHY AND LOCATION Caloocan City is situated in the northern part of Metro Manila or NCR (Region IV-A), within coordinates of 14°39'4"N latitude and 120°58'18"E longitude. It is divided into two geographic locations with a combined total land area of 5,333.40 hectares. South Caloocan has an area of 1,362.50 hectares. It is bounded on the north-northwest by Valenzuela, Malabon and Navotas; on the east by Quezon City; and on the south by the City of Manila. The greatest length, north to south of the boundaries is about six kilometers and the greatest width, east to west is seven kilometers. North Caloocan’s total expanse is at 3,970.90 hectares. It is bounded on the north-northwest by the province of Bulacan; on the south-southeast by Quezon City; and southwest by Valenzuela. Its extreme southern boundary is about 1.7 kilometers apart from the northern extreme boundary of South Caloocan. The greatest length, north to south of the boundaries is eight kilometers and the greatest width, east to west is ten kilometers.
2.1.2 CLIMATE Just like the rest of the towns and cities of Metro Manila, Caloocan City falls under Type 1 of the Philippine Climate Classification, which has two distinct seasons. The Dry High Pressure season, which comes in the months of November until April, corresponds with the northeast monsoon (October to January). The Wet season which starts from May and lasts up to October is consistent with the southwest monsoon (June to September). Between these two well-defined monsoon periods, the southeast trade winds blow from February to May. 2.1.2.1 RAINFALL Since Caloocan City is divided into two separate geographical locations, two recording stations were considered in the study of the city’s annual rainfall. The Port Area Station in Manila was considered for South Caloocan and the Science Garden Station in Diliman, Quezon City for North Caloocan.
Map No. G-2
Figure 2. NCR Map
Caloocan City 2017 – 2025 Local Shelter Plan
11 | P a g e
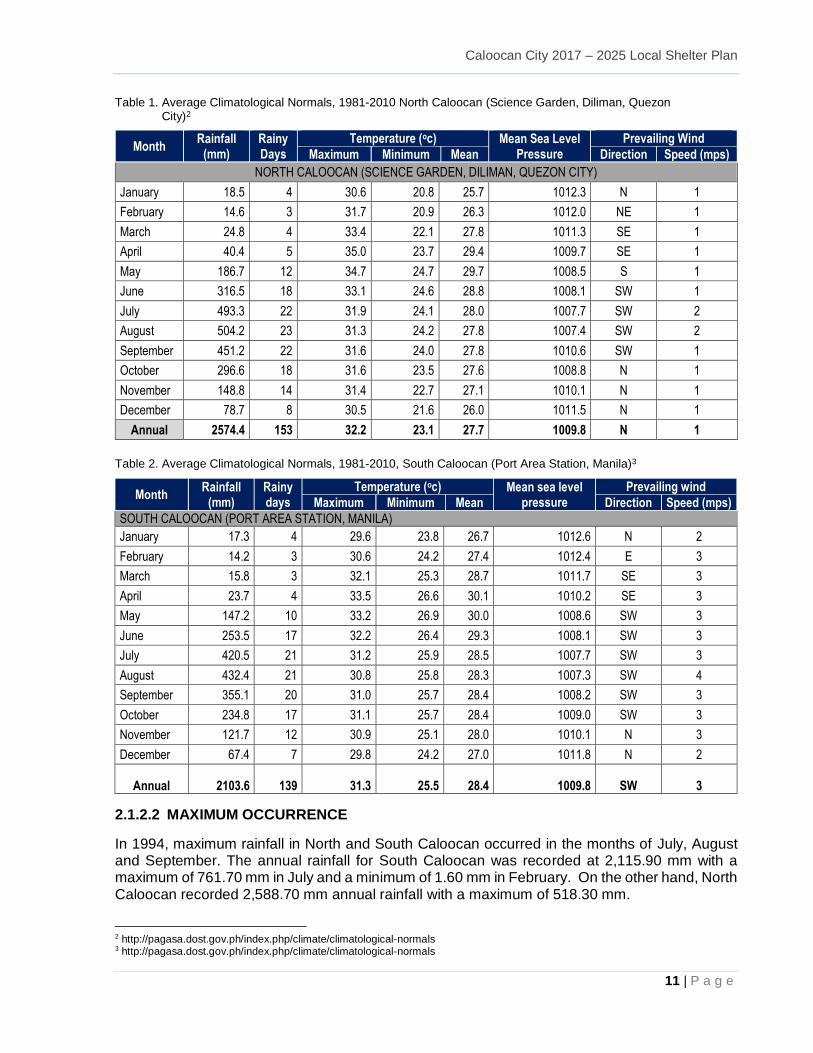
Table 1. Average Climatological Normals, 1981-2010 North Caloocan (Science Garden, Diliman, Quezon City)2
Month Rainfall
(mm) Rainy Days
Temperature (oc) Mean Sea Level Pressure
Prevailing Wind
Maximum Minimum Mean Direction Speed (mps)
NORTH CALOOCAN (SCIENCE GARDEN, DILIMAN, QUEZON CITY)
January 18.5 4 30.6 20.8 25.7 1012.3 N 1
February 14.6 3 31.7 20.9 26.3 1012.0 NE 1
March 24.8 4 33.4 22.1 27.8 1011.3 SE 1
April 40.4 5 35.0 23.7 29.4 1009.7 SE 1
May 186.7 12 34.7 24.7 29.7 1008.5 S 1
June 316.5 18 33.1 24.6 28.8 1008.1 SW 1
July 493.3 22 31.9 24.1 28.0 1007.7 SW 2
August 504.2 23 31.3 24.2 27.8 1007.4 SW 2
September 451.2 22 31.6 24.0 27.8 1010.6 SW 1
October 296.6 18 31.6 23.5 27.6 1008.8 N 1
November 148.8 14 31.4 22.7 27.1 1010.1 N 1
December 78.7 8 30.5 21.6 26.0 1011.5 N 1
Annual 2574.4 153 32.2 23.1 27.7 1009.8 N 1
Table 2. Average Climatological Normals, 1981-2010, South Caloocan (Port Area Station, Manila)3
Month Rainfall
(mm) Rainy days
Temperature (oc) Mean sea level pressure
Prevailing wind
Maximum Minimum Mean Direction Speed (mps)
SOUTH CALOOCAN (PORT AREA STATION, MANILA)
January 17.3 4 29.6 23.8 26.7 1012.6 N 2
February 14.2 3 30.6 24.2 27.4 1012.4 E 3
March 15.8 3 32.1 25.3 28.7 1011.7 SE 3
April 23.7 4 33.5 26.6 30.1 1010.2 SE 3
May 147.2 10 33.2 26.9 30.0 1008.6 SW 3
June 253.5 17 32.2 26.4 29.3 1008.1 SW 3
July 420.5 21 31.2 25.9 28.5 1007.7 SW 3
August 432.4 21 30.8 25.8 28.3 1007.3 SW 4
September 355.1 20 31.0 25.7 28.4 1008.2 SW 3
October 234.8 17 31.1 25.7 28.4 1009.0 SW 3
November 121.7 12 30.9 25.1 28.0 1010.1 N 3
December 67.4 7 29.8 24.2 27.0 1011.8 N 2
Annual 2103.6 139 31.3 25.5 28.4 1009.8 SW 3
2.1.2.2 MAXIMUM OCCURRENCE
In 1994, maximum rainfall in North and South Caloocan occurred in the months of July, August and September. The annual rainfall for South Caloocan was recorded at 2,115.90 mm with a maximum of 761.70 mm in July and a minimum of 1.60 mm in February. On the other hand, North Caloocan recorded 2,588.70 mm annual rainfall with a maximum of 518.30 mm.
2 http://pagasa.dost.gov.ph/index.php/climate/climatological-normals 3 http://pagasa.dost.gov.ph/index.php/climate/climatological-normals
Caloocan City 2017 – 2025 Local Shelter Plan
P a g e | 12
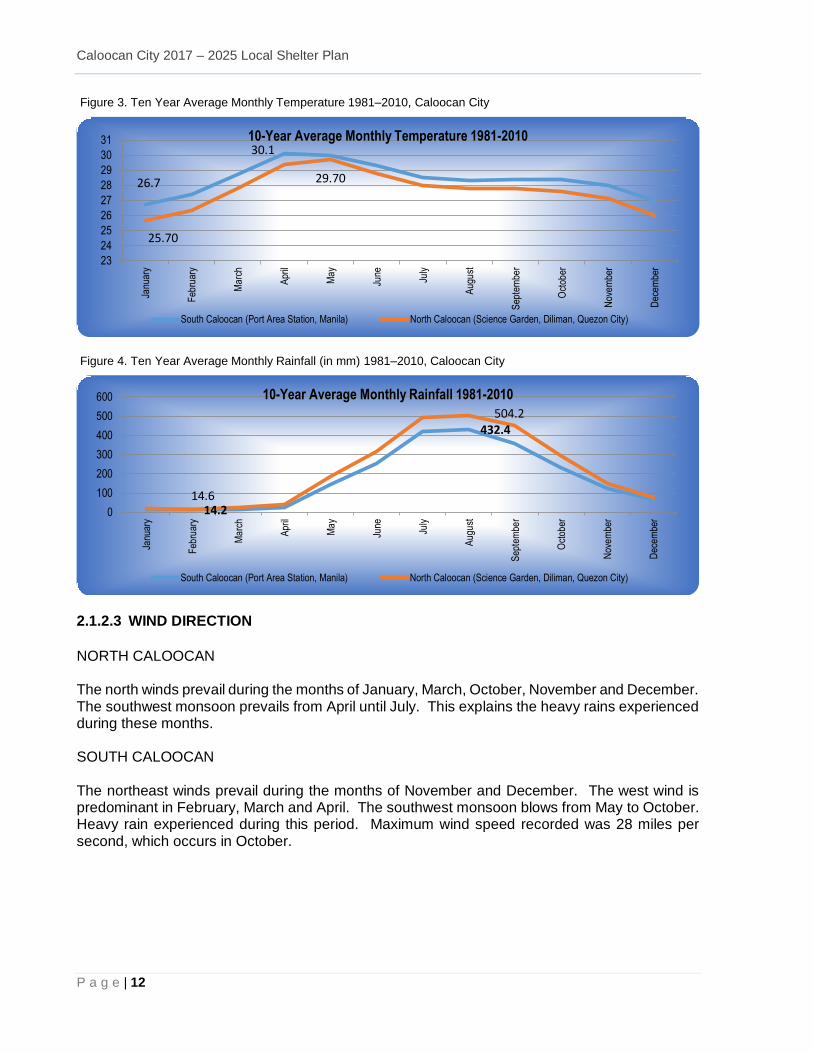
Figure 3. Ten Year Average Monthly Temperature 1981–2010, Caloocan City
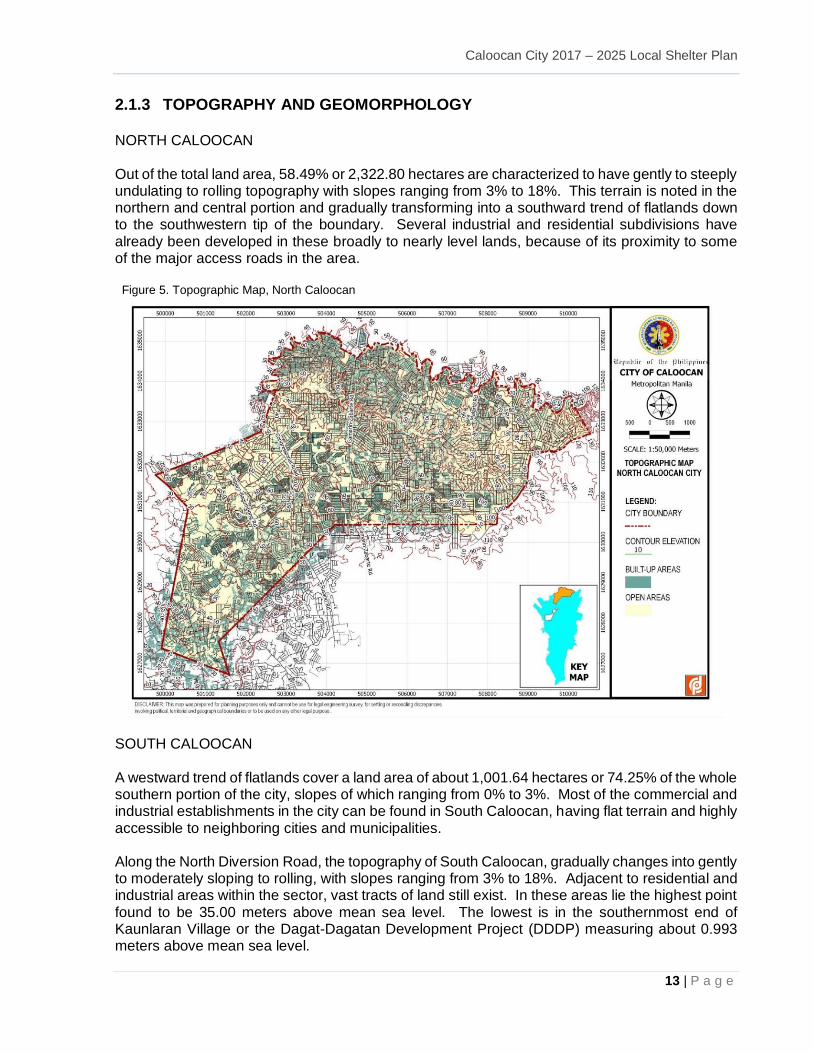
Figure 4. Ten Year Average Monthly Rainfall (in mm) 1981–2010, Caloocan City
2.1.2.3 WIND DIRECTION
NORTH CALOOCAN The north winds prevail during the months of January, March, October, November and December. The southwest monsoon prevails from April until July. This explains the heavy rains experienced during these months. SOUTH CALOOCAN The northeast winds prevail during the months of November and December. The west wind is predominant in February, March and April. The southwest monsoon blows from May to October. Heavy rain experienced during this period. Maximum wind speed recorded was 28 miles per second, which occurs in October.
26.7
30.1
25.70
29.70
23
24
25
26
27
28
29
30
31Ja
nuar
y
Feb
ruar
y
Ma
rch
Apr
il
Ma
y
June
July
Aug
ust
Sep
tem
ber
Oct
ober
Nov
em
ber
Dec
em
ber
10-Year Average Monthly Temperature 1981-2010
South Caloocan (Port Area Station, Manila) North Caloocan (Science Garden, Diliman, Quezon City)
14.2
432.4
14.6
504.2
0
100
200
300
400
500
600
Janu
ary
Feb
ruar
y
Ma
rch
Apr
il
Ma
y
June
July
Aug
ust
Sep
tem
ber
Oct
ober
Nov
em
ber
Dec
em
ber
10-Year Average Monthly Rainfall 1981-2010
South Caloocan (Port Area Station, Manila) North Caloocan (Science Garden, Diliman, Quezon City)
Caloocan City 2017 – 2025 Local Shelter Plan
13 | P a g e
2.1.3 TOPOGRAPHY AND GEOMORPHOLOGY
NORTH CALOOCAN
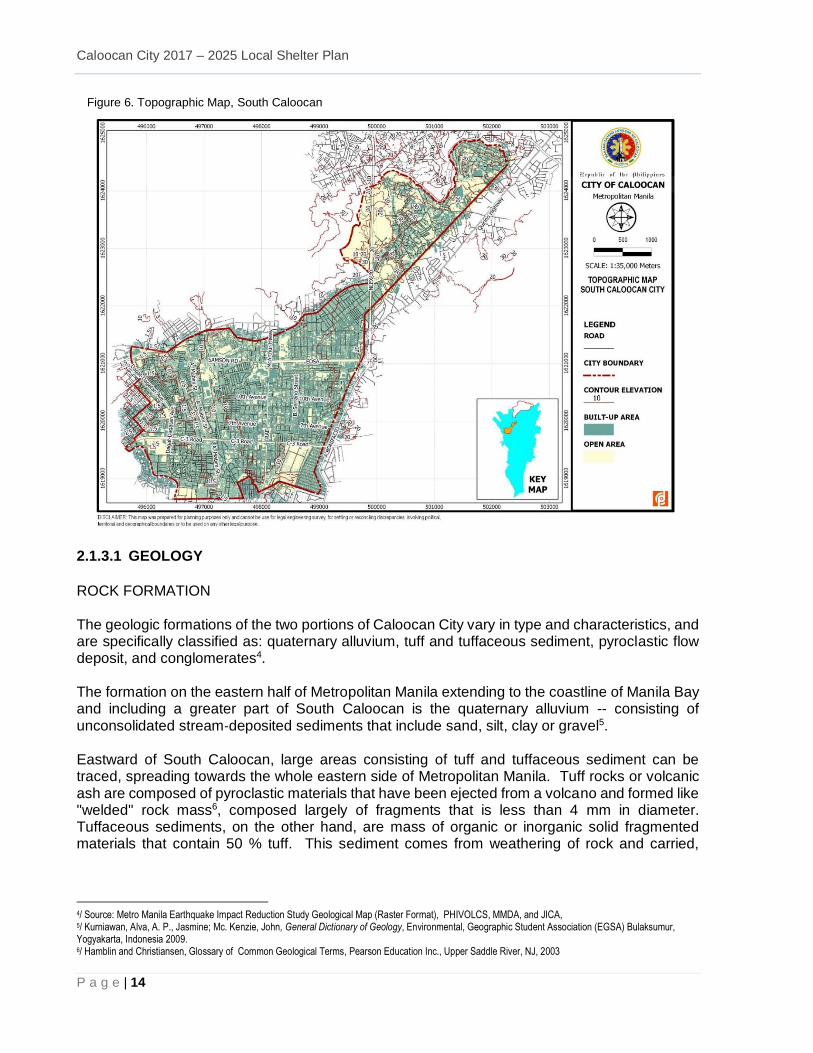
Out of the total land area, 58.49% or 2,322.80 hectares are characterized to have gently to steeply undulating to rolling topography with slopes ranging from 3% to 18%. This terrain is noted in the northern and central portion and gradually transforming into a southward trend of flatlands down to the southwestern tip of the boundary. Several industrial and residential subdivisions have already been developed in these broadly to nearly level lands, because of its proximity to some of the major access roads in the area. Figure 5. Topographic Map, North Caloocan
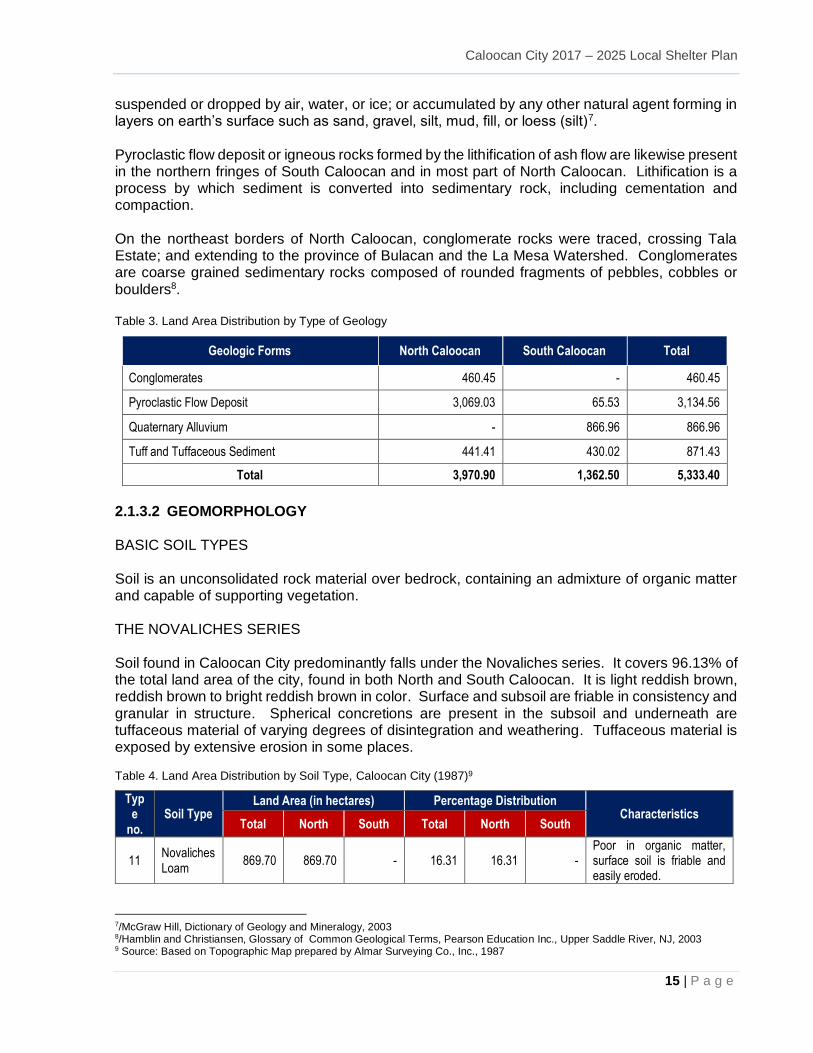
SOUTH CALOOCAN A westward trend of flatlands cover a land area of about 1,001.64 hectares or 74.25% of the whole southern portion of the city, slopes of which ranging from 0% to 3%. Most of the commercial and industrial establishments in the city can be found in South Caloocan, having flat terrain and highly accessible to neighboring cities and municipalities. Along the North Diversion Road, the topography of South Caloocan, gradually changes into gently to moderately sloping to rolling, with slopes ranging from 3% to 18%. Adjacent to residential and industrial areas within the sector, vast tracts of land still exist. In these areas lie the highest point found to be 35.00 meters above mean sea level. The lowest is in the southernmost end of Kaunlaran Village or the Dagat-Dagatan Development Project (DDDP) measuring about 0.993 meters above mean sea level.
Caloocan City 2017 – 2025 Local Shelter Plan
P a g e | 14
Figure 6. Topographic Map, South Caloocan
2.1.3.1 GEOLOGY
ROCK FORMATION The geologic formations of the two portions of Caloocan City vary in type and characteristics, and are specifically classified as: quaternary alluvium, tuff and tuffaceous sediment, pyroclastic flow deposit, and conglomerates4. The formation on the eastern half of Metropolitan Manila extending to the coastline of Manila Bay and including a greater part of South Caloocan is the quaternary alluvium -- consisting of unconsolidated stream‐deposited sediments that include sand, silt, clay or gravel5. Eastward of South Caloocan, large areas consisting of tuff and tuffaceous sediment can be traced, spreading towards the whole eastern side of Metropolitan Manila. Tuff rocks or volcanic ash are composed of pyroclastic materials that have been ejected from a volcano and formed like "welded" rock mass6, composed largely of fragments that is less than 4 mm in diameter. Tuffaceous sediments, on the other hand, are mass of organic or inorganic solid fragmented materials that contain 50 % tuff. This sediment comes from weathering of rock and carried,
4/ Source: Metro Manila Earthquake Impact Reduction Study Geological Map (Raster Format), PHIVOLCS, MMDA, and JICA, 5/ Kurniawan, Alva, A. P., Jasmine; Mc. Kenzie, John, General Dictionary of Geology, Environmental, Geographic Student Association (EGSA) Bulaksumur, Yogyakarta, Indonesia 2009. 6/ Hamblin and Christiansen, Glossary of Common Geological Terms, Pearson Education Inc., Upper Saddle River, NJ, 2003
Caloocan City 2017 – 2025 Local Shelter Plan
15 | P a g e
suspended or dropped by air, water, or ice; or accumulated by any other natural agent forming in layers on earth’s surface such as sand, gravel, silt, mud, fill, or loess (silt)7. Pyroclastic flow deposit or igneous rocks formed by the lithification of ash flow are likewise present in the northern fringes of South Caloocan and in most part of North Caloocan. Lithification is a process by which sediment is converted into sedimentary rock, including cementation and compaction. On the northeast borders of North Caloocan, conglomerate rocks were traced, crossing Tala Estate; and extending to the province of Bulacan and the La Mesa Watershed. Conglomerates are coarse grained sedimentary rocks composed of rounded fragments of pebbles, cobbles or boulders8. Table 3. Land Area Distribution by Type of Geology
Geologic Forms North Caloocan South Caloocan Total
Conglomerates 460.45 - 460.45
Pyroclastic Flow Deposit 3,069.03 65.53 3,134.56
Quaternary Alluvium - 866.96 866.96
Tuff and Tuffaceous Sediment 441.41 430.02 871.43
Total 3,970.90 1,362.50 5,333.40
2.1.3.2 GEOMORPHOLOGY BASIC SOIL TYPES Soil is an unconsolidated rock material over bedrock, containing an admixture of organic matter and capable of supporting vegetation. THE NOVALICHES SERIES Soil found in Caloocan City predominantly falls under the Novaliches series. It covers 96.13% of the total land area of the city, found in both North and South Caloocan. It is light reddish brown, reddish brown to bright reddish brown in color. Surface and subsoil are friable in consistency and granular in structure. Spherical concretions are present in the subsoil and underneath are tuffaceous material of varying degrees of disintegration and weathering. Tuffaceous material is exposed by extensive erosion in some places.
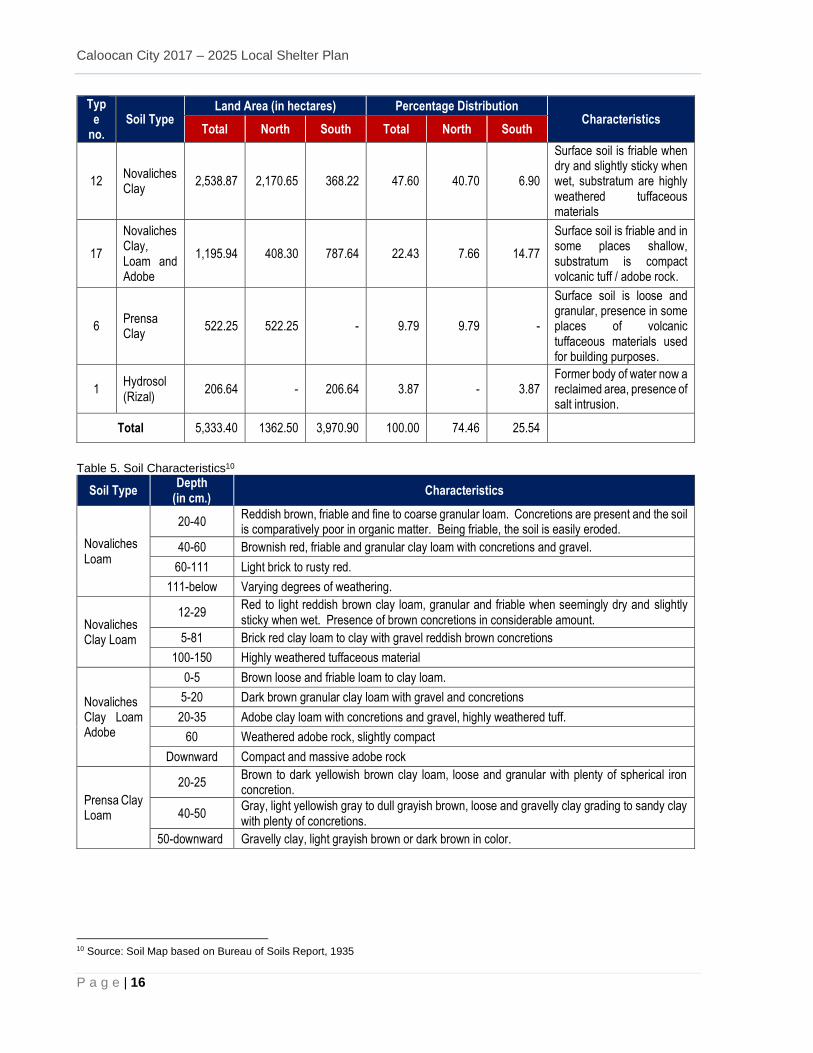
Table 4. Land Area Distribution by Soil Type, Caloocan City (1987)9
Type
no. Soil Type
Land Area (in hectares) Percentage Distribution Characteristics
Total North South Total North South
11 Novaliches Loam
869.70 869.70 - 16.31 16.31 - Poor in organic matter, surface soil is friable and easily eroded.
7/McGraw Hill, Dictionary of Geology and Mineralogy, 2003 8/Hamblin and Christiansen, Glossary of Common Geological Terms, Pearson Education Inc., Upper Saddle River, NJ, 2003 9 Source: Based on Topographic Map prepared by Almar Surveying Co., Inc., 1987
Caloocan City 2017 – 2025 Local Shelter Plan
P a g e | 16
Type
no. Soil Type
Land Area (in hectares) Percentage Distribution Characteristics
Total North South Total North South
12 Novaliches Clay
2,538.87 2,170.65 368.22 47.60 40.70 6.90
Surface soil is friable when dry and slightly sticky when wet, substratum are highly weathered tuffaceous materials
17
Novaliches Clay, Loam and Adobe
1,195.94 408.30 787.64 22.43 7.66 14.77
Surface soil is friable and in some places shallow, substratum is compact volcanic tuff / adobe rock.
6 Prensa Clay
522.25 522.25 - 9.79 9.79 -
Surface soil is loose and granular, presence in some places of volcanic tuffaceous materials used for building purposes.
1 Hydrosol (Rizal)
206.64 - 206.64 3.87 - 3.87 Former body of water now a reclaimed area, presence of salt intrusion.
Total 5,333.40 1362.50 3,970.90 100.00 74.46 25.54
Table 5. Soil Characteristics10
Soil Type Depth
(in cm.) Characteristics
Novaliches Loam
20-40 Reddish brown, friable and fine to coarse granular loam. Concretions are present and the soil is comparatively poor in organic matter. Being friable, the soil is easily eroded.
40-60 Brownish red, friable and granular clay loam with concretions and gravel.
60-111 Light brick to rusty red.
111-below Varying degrees of weathering.
Novaliches Clay Loam
12-29 Red to light reddish brown clay loam, granular and friable when seemingly dry and slightly sticky when wet. Presence of brown concretions in considerable amount.
5-81 Brick red clay loam to clay with gravel reddish brown concretions
100-150 Highly weathered tuffaceous material
Novaliches Clay Loam Adobe
0-5 Brown loose and friable loam to clay loam.
5-20 Dark brown granular clay loam with gravel and concretions
20-35 Adobe clay loam with concretions and gravel, highly weathered tuff.
60 Weathered adobe rock, slightly compact
Downward Compact and massive adobe rock
Prensa Clay Loam
20-25 Brown to dark yellowish brown clay loam, loose and granular with plenty of spherical iron concretion.
40-50 Gray, light yellowish gray to dull grayish brown, loose and gravelly clay grading to sandy clay with plenty of concretions.
50-downward Gravelly clay, light grayish brown or dark brown in color.
10 Source: Soil Map based on Bureau of Soils Report, 1935
Caloocan City 2017 – 2025 Local Shelter Plan
17 | P a g e
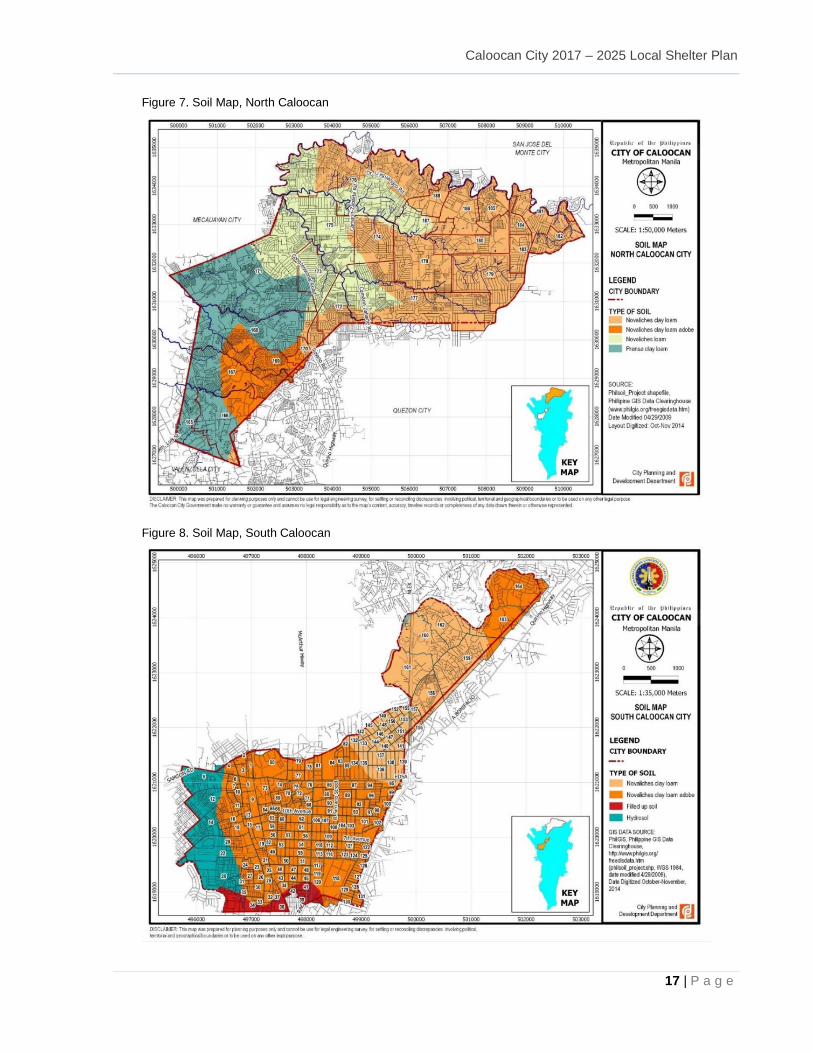
Figure 7. Soil Map, North Caloocan
Figure 8. Soil Map, South Caloocan
Caloocan City 2017 – 2025 Local Shelter Plan
P a g e | 18
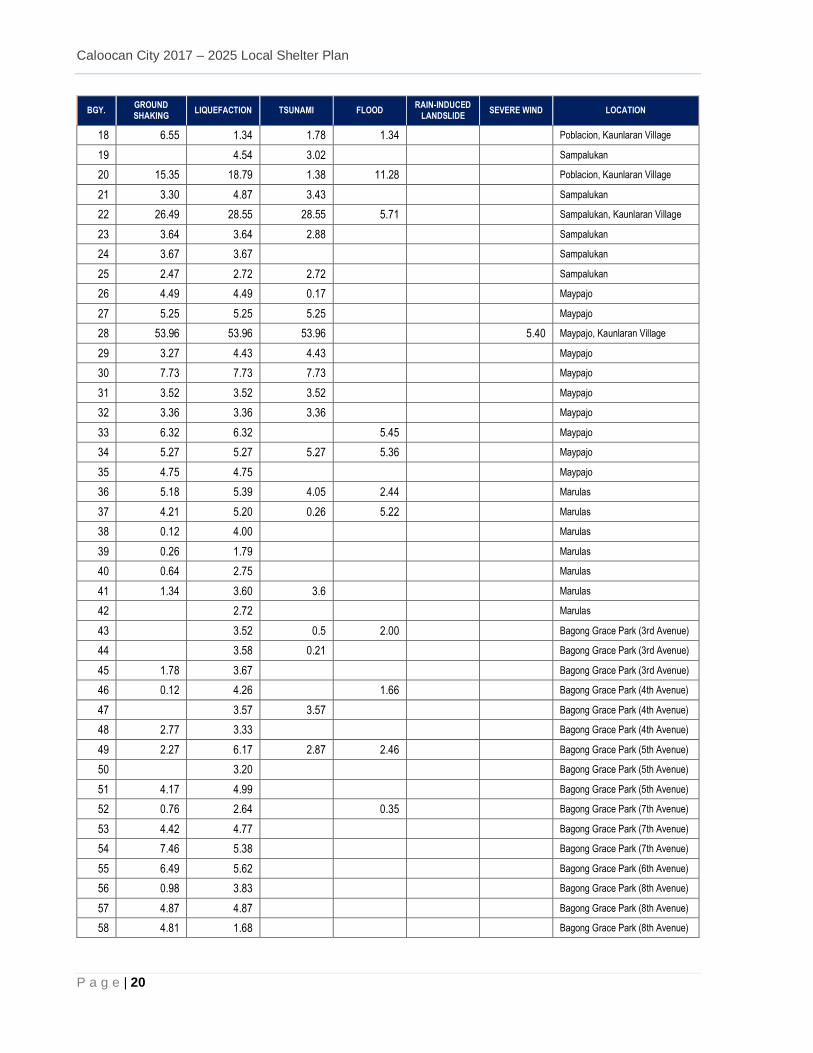
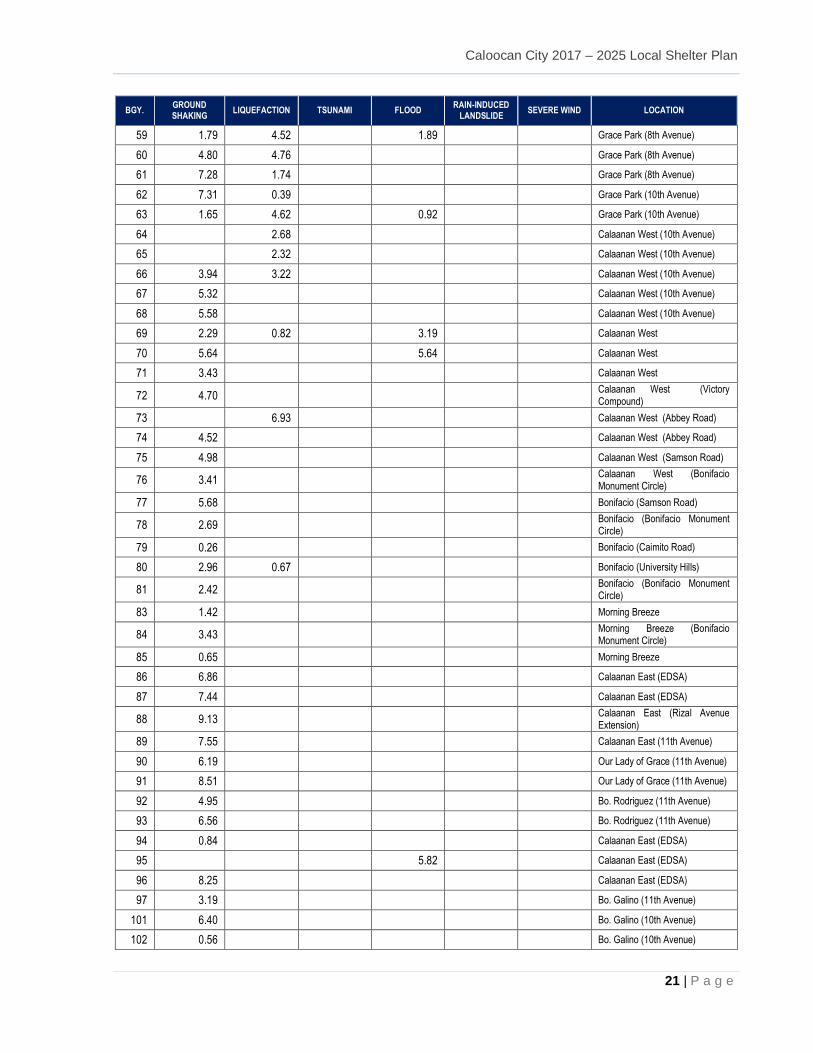
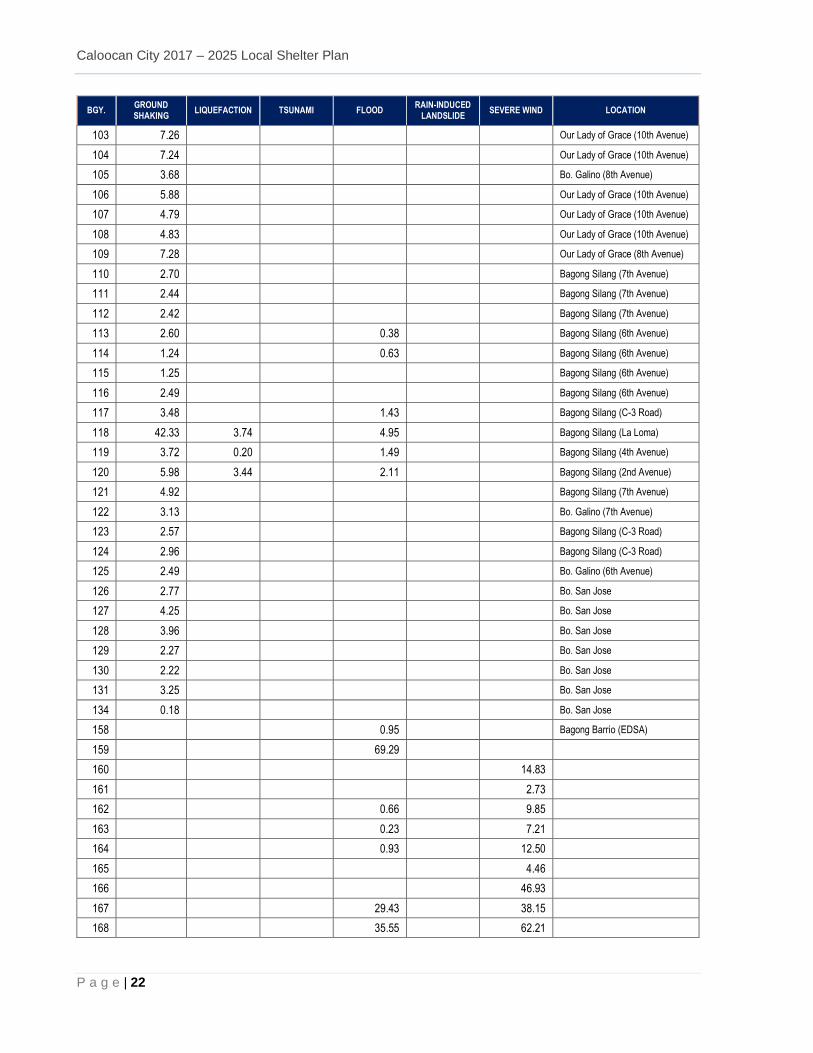
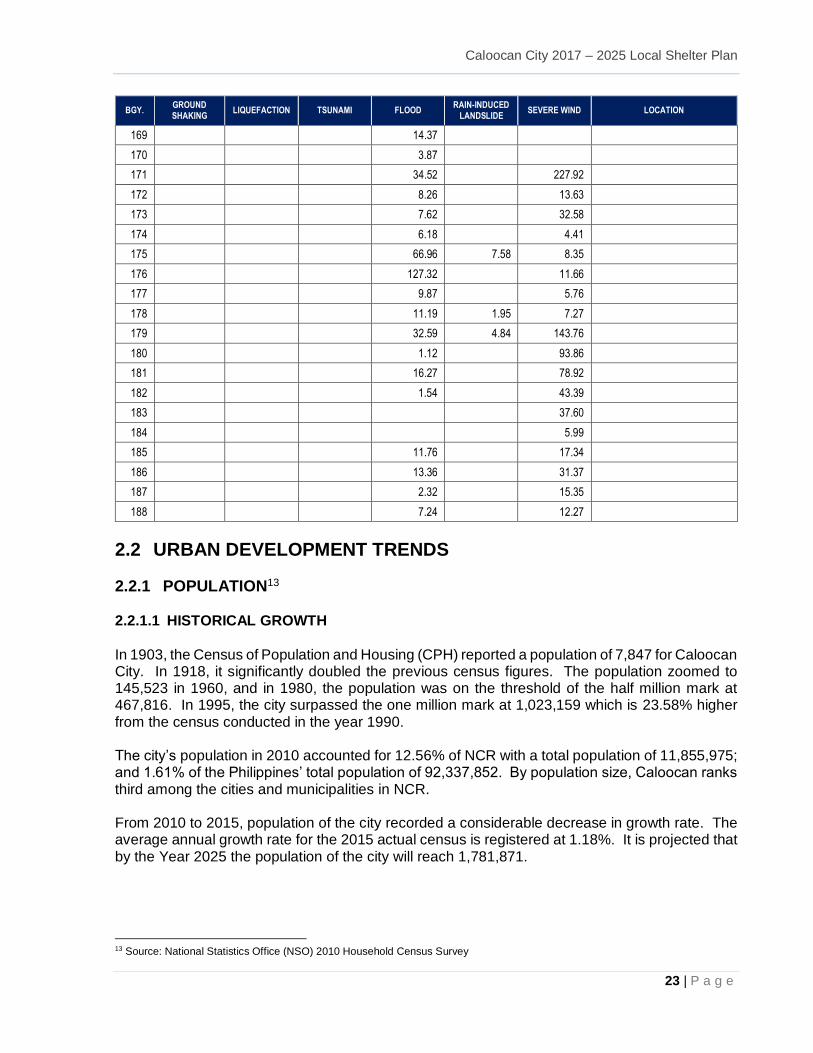
2.1.4 HAZARD VULNERABILITY PROFILE Enhancing Greater Metro Manila’s Institutional Capacities for Effective Disaster/ Climate Risk Management towards Sustainable Development or the GMMA Ready Project that started in 2011 identified at least six major natural hazards that could eventually affect the Greater Metropolitan Manila Area in the future. Hazards identified during the implementation of the project are flooding, rain-induced landslide, severe wind, ground shaking, liquefaction and tsunami. The project, a multi-lateral aid granted to Collective Strengthening for Community Awareness on Natural Disasters (CSCAND) agencies, conducted the Hazard Profiling and Risk Assessments within the project boundaries and provided related technical assistance to LGUs, concerned NGAs, academic institutions, and civil society organizations (CSOs). The project aims to decrease the vulnerability of the Greater Metro Manila Area (GMMA) to natural hazards and increase the resilience of concerned agencies by strengthening their institutional capacities in managing disaster and climate change risks.11 Based from the results of the project study, only 28 among the 188 barangays in Caloocan City, have the lowest risks to adverse impact of imminent disasters, while the remaining 160 barangays have to contend with high to very high levels of susceptibility from natural hazards. 2.1.4.1 SEISMIC HAZARD
Seismic hazard is a natural phenomenon characterized by ground shaking, fault rupture, or soil liquefaction generated by an earthquake. The hazards identified by the GMMA Ready Project due to earthquake that would readily cause significant impacts on the city are ground shaking, soil liquefaction and tsunami. 2.1.4.2 GROUND SHAKING Ground shaking from earthquakes is the primary cause of damage to man-made structures. Numerous geologic faults that could trigger earthquakes exist within and around Metropolitan Manila such as the Valley Fault System (VFS), Philippine Fault, Lubang Fault, Manila Trench, and Casiguran Fault. Among these faults, VFS has the highest potential to cause severe earthquakes in GMMA including Caloocan City. The latest major earthquake triggered by the West Valley Fault occurred in August 19, 1658 with a magnitude of 7.2. The succeeding earthquake event occurred in February 1, 1771 triggered by the East Valley Fault with a magnitude of 6.3. The GMMA Ready Project Ground Shaking Map indicates that active phases of the VFS that directly affect Caloocan City could result from a major earthquake with a magnitude scenario of 7.2, and ground shakes of PHIVOLCS Earthquake Intensity Scale (PEIS) 8.0 to 8.5. The measurements of ground shake boundaries were derived from numerical modeling and seismic micro-zoning techniques conducted by the Philippine Institute of Volcanology and Seismology (PHIVOLCS) in the past years. Likewise, the extent of land area where the highest intensity of PEIS 8.5 ground shakes could occur covers up to 623 hectares (6.23 square km) in South Caloocan which involves 110 barangays. Barangay 28, having one of the largest barangay jurisdictions in South Caloocan with a land area of 54 hectares (0.54 sq. km), would be most widely affected. The rest of the 110 barangays are located within the old districts of Sangandaan, Poblacion, Sampalukan, Maypajo,
11 United Nations Development Programme-UNDP, 2011
Caloocan City 2017 – 2025 Local Shelter Plan
19 | P a g e
reclaimed area of Kaunlaran Village, Marulas, Bagong Grace Park (3Rd to 8th Avenue - West), Grace Park (8th to 10th Avenue - West), Calaanan-West, Bonifacio, Morning Breeze, Calaanan-East, and Our Lady of Grace (8th to 11th Avenue-East). 2.1.4.3 LIQUEFACTION Moderate to high susceptibility to liquefaction would possibly occur in 71 barangays all over the city. The total area vulnerable to this hazard would reach up to 447 hectares, with Barangay 28 as the most to be affected. 2.1.4.4 TSUNAMI
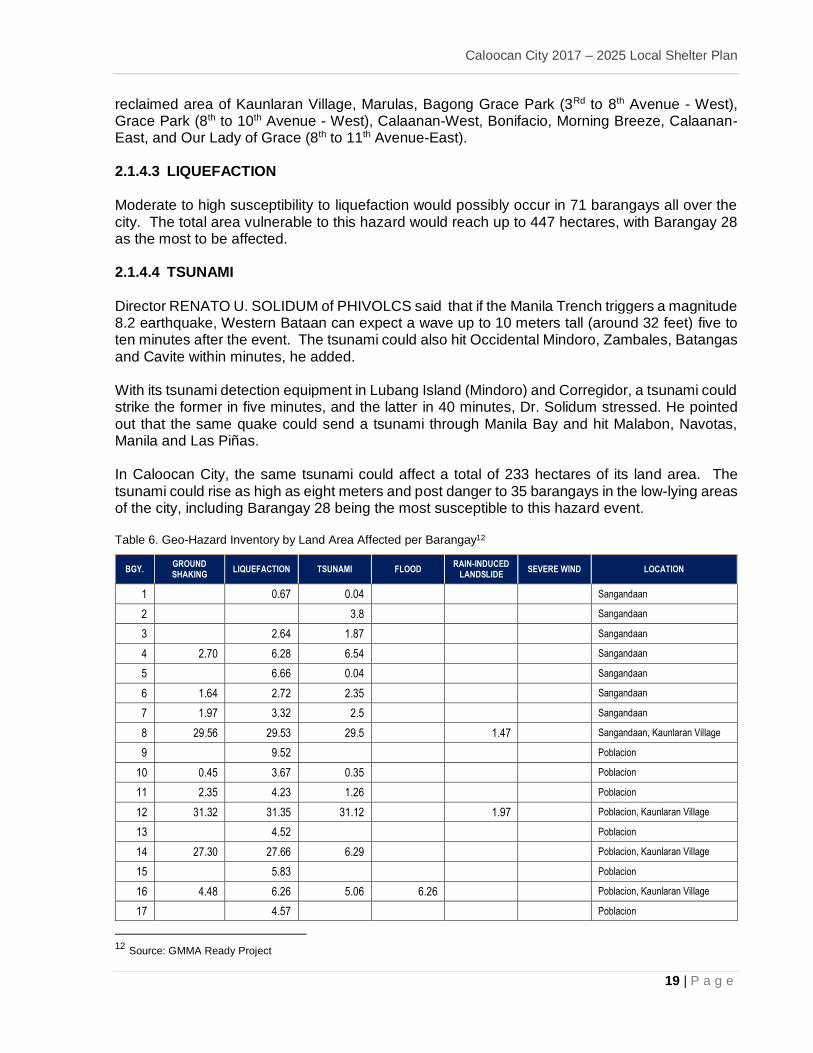
Director RENATO U. SOLIDUM of PHIVOLCS said that if the Manila Trench triggers a magnitude 8.2 earthquake, Western Bataan can expect a wave up to 10 meters tall (around 32 feet) five to ten minutes after the event. The tsunami could also hit Occidental Mindoro, Zambales, Batangas and Cavite within minutes, he added. With its tsunami detection equipment in Lubang Island (Mindoro) and Corregidor, a tsunami could strike the former in five minutes, and the latter in 40 minutes, Dr. Solidum stressed. He pointed out that the same quake could send a tsunami through Manila Bay and hit Malabon, Navotas, Manila and Las Piñas. In Caloocan City, the same tsunami could affect a total of 233 hectares of its land area. The tsunami could rise as high as eight meters and post danger to 35 barangays in the low-lying areas of the city, including Barangay 28 being the most susceptible to this hazard event. Table 6. Geo-Hazard Inventory by Land Area Affected per Barangay12
BGY. GROUND SHAKING
LIQUEFACTION TSUNAMI FLOOD RAIN-INDUCED
LANDSLIDE SEVERE WIND LOCATION
1 0.67 0.04 Sangandaan
2 3.8 Sangandaan
3 2.64 1.87 Sangandaan
4 2.70 6.28 6.54 Sangandaan
5 6.66 0.04 Sangandaan
6 1.64 2.72 2.35 Sangandaan
7 1.97 3.32 2.5 Sangandaan
8 29.56 29.53 29.5 1.47 Sangandaan, Kaunlaran Village
9 9.52 Poblacion
10 0.45 3.67 0.35 Poblacion
11 2.35 4.23 1.26 Poblacion
12 31.32 31.35 31.12 1.97 Poblacion, Kaunlaran Village
13 4.52 Poblacion
14 27.30 27.66 6.29 Poblacion, Kaunlaran Village
15 5.83 Poblacion
16 4.48 6.26 5.06 6.26 Poblacion, Kaunlaran Village
17 4.57 Poblacion
12 Source: GMMA Ready Project
Caloocan City 2017 – 2025 Local Shelter Plan
P a g e | 20
BGY. GROUND SHAKING
LIQUEFACTION TSUNAMI FLOOD RAIN-INDUCED
LANDSLIDE SEVERE WIND LOCATION
18 6.55 1.34 1.78 1.34 Poblacion, Kaunlaran Village
19 4.54 3.02 Sampalukan
20 15.35 18.79 1.38 11.28 Poblacion, Kaunlaran Village
21 3.30 4.87 3.43 Sampalukan
22 26.49 28.55 28.55 5.71 Sampalukan, Kaunlaran Village
23 3.64 3.64 2.88 Sampalukan
24 3.67 3.67 Sampalukan
25 2.47 2.72 2.72 Sampalukan
26 4.49 4.49 0.17 Maypajo
27 5.25 5.25 5.25 Maypajo
28 53.96 53.96 53.96 5.40 Maypajo, Kaunlaran Village
29 3.27 4.43 4.43 Maypajo
30 7.73 7.73 7.73 Maypajo
31 3.52 3.52 3.52 Maypajo
32 3.36 3.36 3.36 Maypajo
33 6.32 6.32 5.45 Maypajo
34 5.27 5.27 5.27 5.36 Maypajo
35 4.75 4.75 Maypajo
36 5.18 5.39 4.05 2.44 Marulas
37 4.21 5.20 0.26 5.22 Marulas
38 0.12 4.00 Marulas
39 0.26 1.79 Marulas
40 0.64 2.75 Marulas
41 1.34 3.60 3.6 Marulas
42 2.72 Marulas
43 3.52 0.5 2.00 Bagong Grace Park (3rd Avenue)
44 3.58 0.21 Bagong Grace Park (3rd Avenue)
45 1.78 3.67 Bagong Grace Park (3rd Avenue)
46 0.12 4.26 1.66 Bagong Grace Park (4th Avenue)
47 3.57 3.57 Bagong Grace Park (4th Avenue)
48 2.77 3.33 Bagong Grace Park (4th Avenue)
49 2.27 6.17 2.87 2.46 Bagong Grace Park (5th Avenue)
50 3.20 Bagong Grace Park (5th Avenue)
51 4.17 4.99 Bagong Grace Park (5th Avenue)
52 0.76 2.64 0.35 Bagong Grace Park (7th Avenue)
53 4.42 4.77 Bagong Grace Park (7th Avenue)
54 7.46 5.38 Bagong Grace Park (7th Avenue)
55 6.49 5.62 Bagong Grace Park (6th Avenue)
56 0.98 3.83 Bagong Grace Park (8th Avenue)
57 4.87 4.87 Bagong Grace Park (8th Avenue)
58 4.81 1.68 Bagong Grace Park (8th Avenue)
Caloocan City 2017 – 2025 Local Shelter Plan
21 | P a g e
BGY. GROUND SHAKING
LIQUEFACTION TSUNAMI FLOOD RAIN-INDUCED
LANDSLIDE SEVERE WIND LOCATION
59 1.79 4.52 1.89 Grace Park (8th Avenue)
60 4.80 4.76 Grace Park (8th Avenue)
61 7.28 1.74 Grace Park (8th Avenue)
62 7.31 0.39 Grace Park (10th Avenue)
63 1.65 4.62 0.92 Grace Park (10th Avenue)
64 2.68 Calaanan West (10th Avenue)
65 2.32 Calaanan West (10th Avenue)
66 3.94 3.22 Calaanan West (10th Avenue)
67 5.32 Calaanan West (10th Avenue)
68 5.58 Calaanan West (10th Avenue)
69 2.29 0.82 3.19 Calaanan West
70 5.64 5.64 Calaanan West
71 3.43 Calaanan West
72 4.70 Calaanan West (Victory Compound)
73 6.93 Calaanan West (Abbey Road)
74 4.52 Calaanan West (Abbey Road)
75 4.98 Calaanan West (Samson Road)
76 3.41 Calaanan West (Bonifacio Monument Circle)
77 5.68 Bonifacio (Samson Road)
78 2.69 Bonifacio (Bonifacio Monument Circle)
79 0.26 Bonifacio (Caimito Road)
80 2.96 0.67 Bonifacio (University Hills)
81 2.42 Bonifacio (Bonifacio Monument Circle)
83 1.42 Morning Breeze
84 3.43 Morning Breeze (Bonifacio Monument Circle)
85 0.65 Morning Breeze
86 6.86 Calaanan East (EDSA)
87 7.44 Calaanan East (EDSA)
88 9.13 Calaanan East (Rizal Avenue Extension)
89 7.55 Calaanan East (11th Avenue)
90 6.19 Our Lady of Grace (11th Avenue)
91 8.51 Our Lady of Grace (11th Avenue)
92 4.95 Bo. Rodriguez (11th Avenue)
93 6.56 Bo. Rodriguez (11th Avenue)
94 0.84 Calaanan East (EDSA)
95 5.82 Calaanan East (EDSA)
96 8.25 Calaanan East (EDSA)
97 3.19 Bo. Galino (11th Avenue)
101 6.40 Bo. Galino (10th Avenue)
102 0.56 Bo. Galino (10th Avenue)
Caloocan City 2017 – 2025 Local Shelter Plan
P a g e | 22
BGY. GROUND SHAKING
LIQUEFACTION TSUNAMI FLOOD RAIN-INDUCED
LANDSLIDE SEVERE WIND LOCATION
103 7.26 Our Lady of Grace (10th Avenue)
104 7.24 Our Lady of Grace (10th Avenue)
105 3.68 Bo. Galino (8th Avenue)
106 5.88 Our Lady of Grace (10th Avenue)
107 4.79 Our Lady of Grace (10th Avenue)
108 4.83 Our Lady of Grace (10th Avenue)
109 7.28 Our Lady of Grace (8th Avenue)
110 2.70 Bagong Silang (7th Avenue)
111 2.44 Bagong Silang (7th Avenue)
112 2.42 Bagong Silang (7th Avenue)
113 2.60 0.38 Bagong Silang (6th Avenue)
114 1.24 0.63 Bagong Silang (6th Avenue)
115 1.25 Bagong Silang (6th Avenue)
116 2.49 Bagong Silang (6th Avenue)
117 3.48 1.43 Bagong Silang (C-3 Road)
118 42.33 3.74 4.95 Bagong Silang (La Loma)
119 3.72 0.20 1.49 Bagong Silang (4th Avenue)
120 5.98 3.44 2.11 Bagong Silang (2nd Avenue)
121 4.92 Bagong Silang (7th Avenue)
122 3.13 Bo. Galino (7th Avenue)
123 2.57 Bagong Silang (C-3 Road)
124 2.96 Bagong Silang (C-3 Road)
125 2.49 Bo. Galino (6th Avenue)
126 2.77 Bo. San Jose
127 4.25 Bo. San Jose
128 3.96 Bo. San Jose
129 2.27 Bo. San Jose
130 2.22 Bo. San Jose
131 3.25 Bo. San Jose
134 0.18 Bo. San Jose
158 0.95 Bagong Barrio (EDSA)
159 69.29
160 14.83
161 2.73
162 0.66 9.85
163 0.23 7.21
164 0.93 12.50
165 4.46
166 46.93
167 29.43 38.15
168 35.55 62.21
Caloocan City 2017 – 2025 Local Shelter Plan
23 | P a g e
BGY. GROUND SHAKING
LIQUEFACTION TSUNAMI FLOOD RAIN-INDUCED
LANDSLIDE SEVERE WIND LOCATION
169 14.37
170 3.87
171 34.52 227.92
172 8.26 13.63
173 7.62 32.58
174 6.18 4.41
175 66.96 7.58 8.35
176 127.32 11.66
177 9.87 5.76
178 11.19 1.95 7.27
179 32.59 4.84 143.76
180 1.12 93.86
181 16.27 78.92
182 1.54 43.39
183 37.60
184 5.99
185 11.76 17.34
186 13.36 31.37
187 2.32 15.35
188 7.24 12.27
2.2 URBAN DEVELOPMENT TRENDS
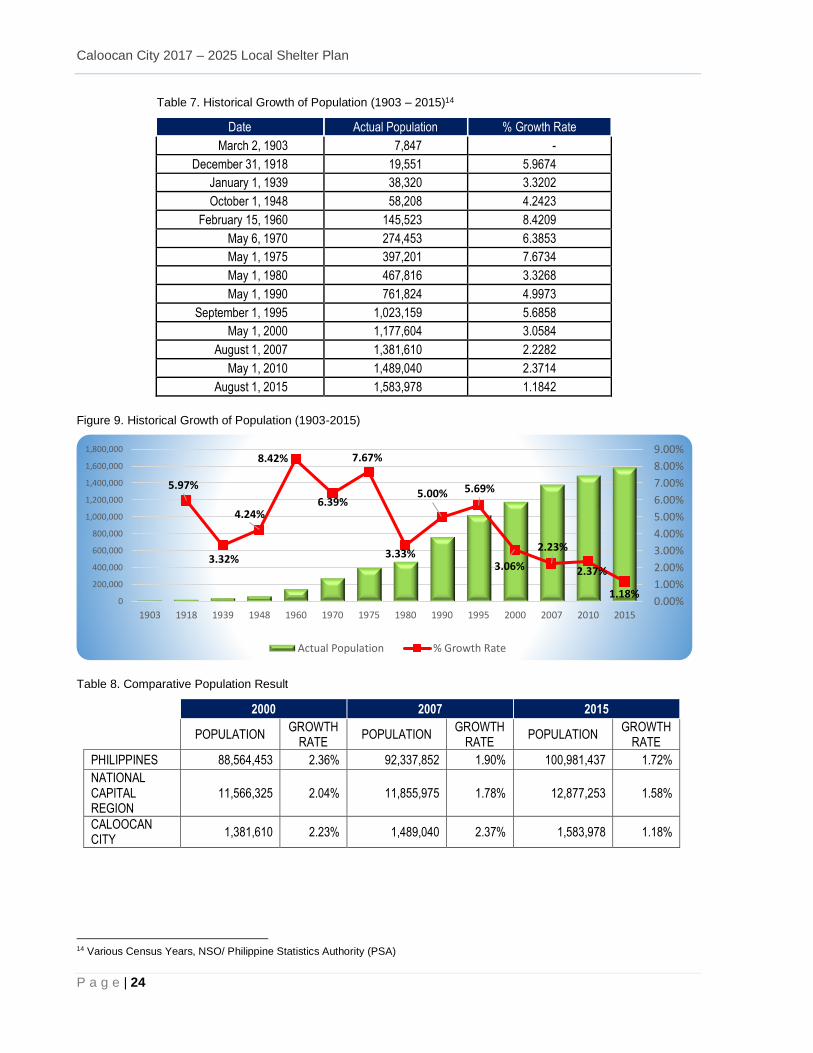
2.2.1 POPULATION13 2.2.1.1 HISTORICAL GROWTH In 1903, the Census of Population and Housing (CPH) reported a population of 7,847 for Caloocan City. In 1918, it significantly doubled the previous census figures. The population zoomed to 145,523 in 1960, and in 1980, the population was on the threshold of the half million mark at 467,816. In 1995, the city surpassed the one million mark at 1,023,159 which is 23.58% higher from the census conducted in the year 1990. The city’s population in 2010 accounted for 12.56% of NCR with a total population of 11,855,975; and 1.61% of the Philippines’ total population of 92,337,852. By population size, Caloocan ranks third among the cities and municipalities in NCR. From 2010 to 2015, population of the city recorded a considerable decrease in growth rate. The average annual growth rate for the 2015 actual census is registered at 1.18%. It is projected that by the Year 2025 the population of the city will reach 1,781,871.
13 Source: National Statistics Office (NSO) 2010 Household Census Survey
Caloocan City 2017 – 2025 Local Shelter Plan
P a g e | 24
Table 7. Historical Growth of Population (1903 – 2015)14
Date Actual Population % Growth Rate
March 2, 1903 7,847 -
December 31, 1918 19,551 5.9674
January 1, 1939 38,320 3.3202
October 1, 1948 58,208 4.2423
February 15, 1960 145,523 8.4209
May 6, 1970 274,453 6.3853
May 1, 1975 397,201 7.6734
May 1, 1980 467,816 3.3268
May 1, 1990 761,824 4.9973
September 1, 1995 1,023,159 5.6858
May 1, 2000 1,177,604 3.0584
August 1, 2007 1,381,610 2.2282
May 1, 2010 1,489,040 2.3714
August 1, 2015 1,583,978 1.1842
Figure 9. Historical Growth of Population (1903-2015)
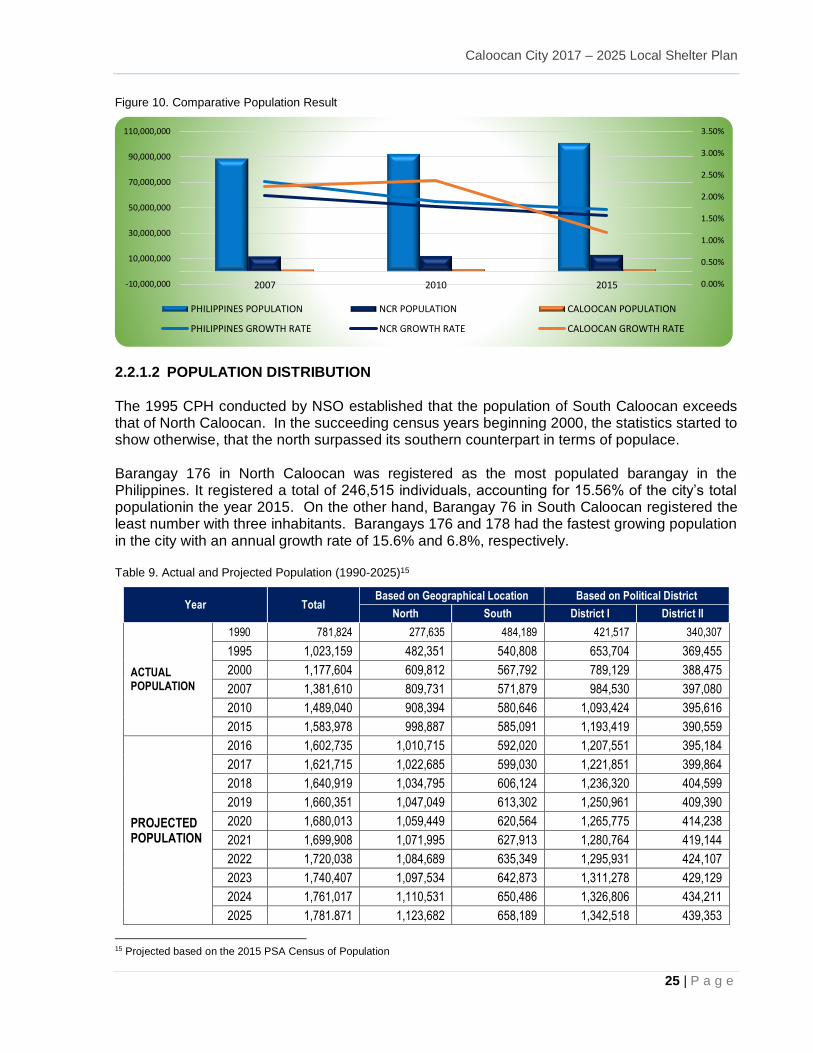
Table 8. Comparative Population Result
2000 2007 2015
POPULATION GROWTH
RATE POPULATION
GROWTH RATE
POPULATION GROWTH
RATE
PHILIPPINES 88,564,453 2.36% 92,337,852 1.90% 100,981,437 1.72%
NATIONAL CAPITAL REGION
11,566,325 2.04% 11,855,975 1.78% 12,877,253 1.58%
CALOOCAN CITY
1,381,610 2.23% 1,489,040 2.37% 1,583,978 1.18%
14 Various Census Years, NSO/ Philippine Statistics Authority (PSA)
5.97%
3.32%
4.24%
8.42%
6.39%
7.67%
3.33%
5.00% 5.69%
3.06%
2.23%
2.37%
1.18%0.00%
1.00%
2.00%
3.00%
4.00%
5.00%
6.00%
7.00%
8.00%
9.00%
0
200,000
400,000
600,000
800,000
1,000,000
1,200,000
1,400,000
1,600,000
1,800,000
1903 1918 1939 1948 1960 1970 1975 1980 1990 1995 2000 2007 2010 2015
Actual Population % Growth Rate
Caloocan City 2017 – 2025 Local Shelter Plan
25 | P a g e
Figure 10. Comparative Population Result
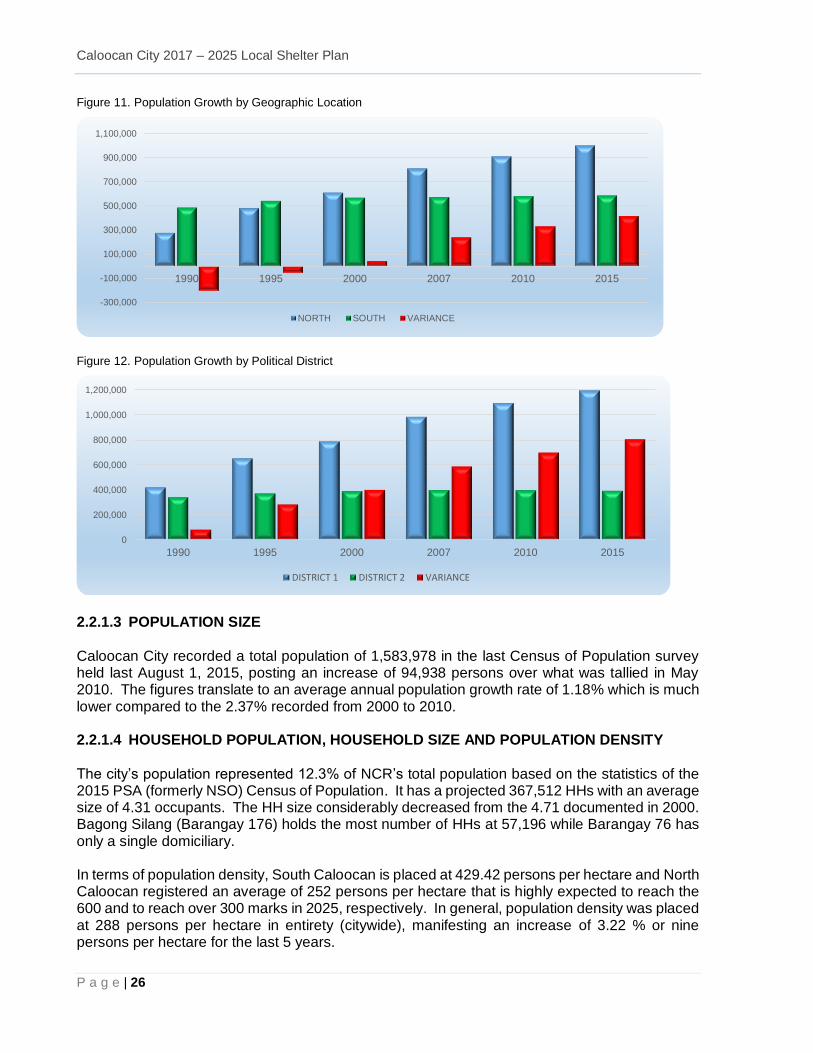
2.2.1.2 POPULATION DISTRIBUTION The 1995 CPH conducted by NSO established that the population of South Caloocan exceeds that of North Caloocan. In the succeeding census years beginning 2000, the statistics started to show otherwise, that the north surpassed its southern counterpart in terms of populace. Barangay 176 in North Caloocan was registered as the most populated barangay in the Philippines. It registered a total of 246,515 individuals, accounting for 15.56% of the city’s total populationin the year 2015. On the other hand, Barangay 76 in South Caloocan registered the least number with three inhabitants. Barangays 176 and 178 had the fastest growing population in the city with an annual growth rate of 15.6% and 6.8%, respectively. Table 9. Actual and Projected Population (1990-2025)15
Year Total Based on Geographical Location Based on Political District
North South District I District II
ACTUAL POPULATION
1990 781,824 277,635 484,189 421,517 340,307
1995 1,023,159 482,351 540,808 653,704 369,455
2000 1,177,604 609,812 567,792 789,129 388,475
2007 1,381,610 809,731 571,879 984,530 397,080
2010 1,489,040 908,394 580,646 1,093,424 395,616
2015 1,583,978 998,887 585,091 1,193,419 390,559
PROJECTED POPULATION
2016 1,602,735 1,010,715 592,020 1,207,551 395,184
2017 1,621,715 1,022,685 599,030 1,221,851 399,864
2018 1,640,919 1,034,795 606,124 1,236,320 404,599
2019 1,660,351 1,047,049 613,302 1,250,961 409,390
2020 1,680,013 1,059,449 620,564 1,265,775 414,238
2021 1,699,908 1,071,995 627,913 1,280,764 419,144
2022 1,720,038 1,084,689 635,349 1,295,931 424,107
2023 1,740,407 1,097,534 642,873 1,311,278 429,129
2024 1,761,017 1,110,531 650,486 1,326,806 434,211
2025 1,781.871 1,123,682 658,189 1,342,518 439,353
15 Projected based on the 2015 PSA Census of Population
0.00%
0.50%
1.00%
1.50%
2.00%
2.50%
3.00%
3.50%
-10,000,000
10,000,000
30,000,000
50,000,000
70,000,000
90,000,000
110,000,000
2007 2010 2015
PHILIPPINES POPULATION NCR POPULATION CALOOCAN POPULATION
PHILIPPINES GROWTH RATE NCR GROWTH RATE CALOOCAN GROWTH RATE
Caloocan City 2017 – 2025 Local Shelter Plan
P a g e | 26
Figure 11. Population Growth by Geographic Location
Figure 12. Population Growth by Political District
2.2.1.3 POPULATION SIZE Caloocan City recorded a total population of 1,583,978 in the last Census of Population survey held last August 1, 2015, posting an increase of 94,938 persons over what was tallied in May 2010. The figures translate to an average annual population growth rate of 1.18% which is much lower compared to the 2.37% recorded from 2000 to 2010. 2.2.1.4 HOUSEHOLD POPULATION, HOUSEHOLD SIZE AND POPULATION DENSITY The city’s population represented 12.3% of NCR’s total population based on the statistics of the 2015 PSA (formerly NSO) Census of Population. It has a projected 367,512 HHs with an average size of 4.31 occupants. The HH size considerably decreased from the 4.71 documented in 2000. Bagong Silang (Barangay 176) holds the most number of HHs at 57,196 while Barangay 76 has only a single domiciliary. In terms of population density, South Caloocan is placed at 429.42 persons per hectare and North Caloocan registered an average of 252 persons per hectare that is highly expected to reach the 600 and to reach over 300 marks in 2025, respectively. In general, population density was placed at 288 persons per hectare in entirety (citywide), manifesting an increase of 3.22 % or nine persons per hectare for the last 5 years.
-300,000
-100,000
100,000
300,000
500,000
700,000
900,000
1,100,000
1990 1995 2000 2007 2010 2015
NORTH SOUTH VARIANCE
0
200,000
400,000
600,000
800,000
1,000,000
1,200,000
1990 1995 2000 2007 2010 2015
DISTRICT 1 DISTRICT 2 VARIANCE
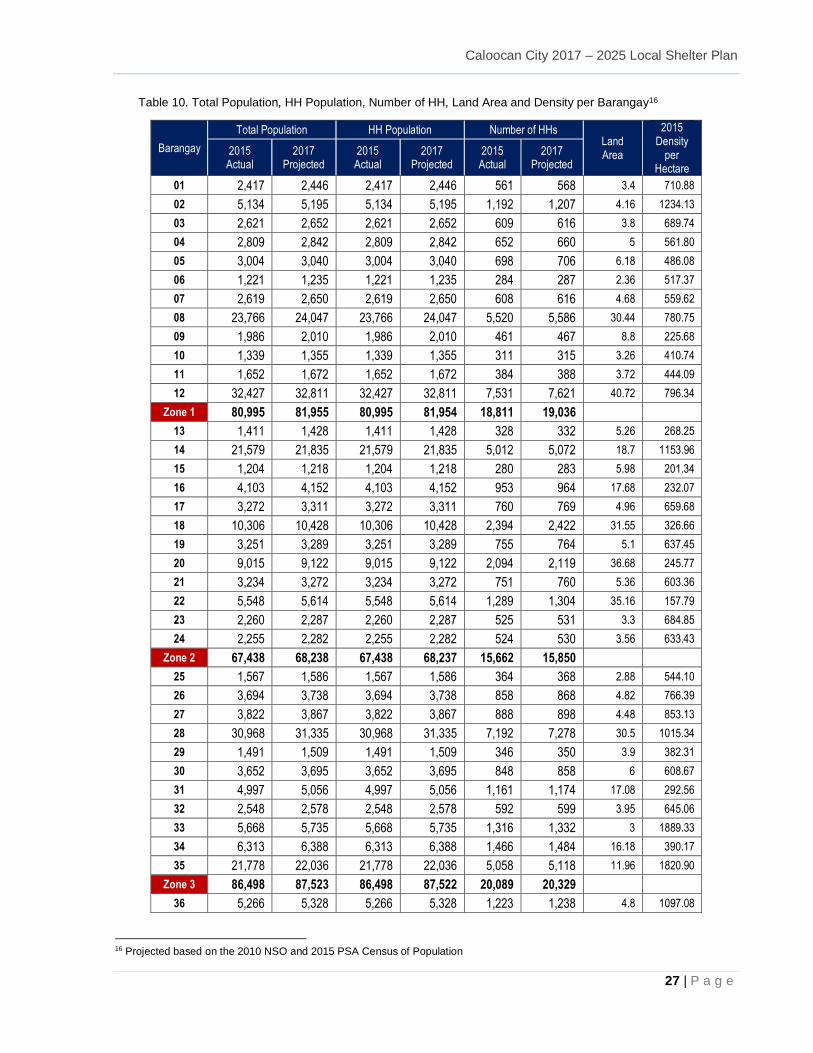
Caloocan City 2017 – 2025 Local Shelter Plan
27 | P a g e
Table 10. Total Population, HH Population, Number of HH, Land Area and Density per Barangay16
Barangay
Total Population HH Population Number of HHs Land Area
2015 Density
per Hectare
2015 Actual
2017 Projected
2015 Actual
2017 Projected
2015 Actual
2017 Projected
01 2,417 2,446 2,417 2,446 561 568 3.4 710.88
02 5,134 5,195 5,134 5,195 1,192 1,207 4.16 1234.13
03 2,621 2,652 2,621 2,652 609 616 3.8 689.74
04 2,809 2,842 2,809 2,842 652 660 5 561.80
05 3,004 3,040 3,004 3,040 698 706 6.18 486.08
06 1,221 1,235 1,221 1,235 284 287 2.36 517.37
07 2,619 2,650 2,619 2,650 608 616 4.68 559.62
08 23,766 24,047 23,766 24,047 5,520 5,586 30.44 780.75
09 1,986 2,010 1,986 2,010 461 467 8.8 225.68
10 1,339 1,355 1,339 1,355 311 315 3.26 410.74
11 1,652 1,672 1,652 1,672 384 388 3.72 444.09
12 32,427 32,811 32,427 32,811 7,531 7,621 40.72 796.34
Zone 1 80,995 81,955 80,995 81,954 18,811 19,036
13 1,411 1,428 1,411 1,428 328 332 5.26 268.25
14 21,579 21,835 21,579 21,835 5,012 5,072 18.7 1153.96
15 1,204 1,218 1,204 1,218 280 283 5.98 201.34
16 4,103 4,152 4,103 4,152 953 964 17.68 232.07
17 3,272 3,311 3,272 3,311 760 769 4.96 659.68
18 10,306 10,428 10,306 10,428 2,394 2,422 31.55 326.66
19 3,251 3,289 3,251 3,289 755 764 5.1 637.45
20 9,015 9,122 9,015 9,122 2,094 2,119 36.68 245.77
21 3,234 3,272 3,234 3,272 751 760 5.36 603.36
22 5,548 5,614 5,548 5,614 1,289 1,304 35.16 157.79
23 2,260 2,287 2,260 2,287 525 531 3.3 684.85
24 2,255 2,282 2,255 2,282 524 530 3.56 633.43
Zone 2 67,438 68,238 67,438 68,237 15,662 15,850
25 1,567 1,586 1,567 1,586 364 368 2.88 544.10
26 3,694 3,738 3,694 3,738 858 868 4.82 766.39
27 3,822 3,867 3,822 3,867 888 898 4.48 853.13
28 30,968 31,335 30,968 31,335 7,192 7,278 30.5 1015.34
29 1,491 1,509 1,491 1,509 346 350 3.9 382.31
30 3,652 3,695 3,652 3,695 848 858 6 608.67
31 4,997 5,056 4,997 5,056 1,161 1,174 17.08 292.56
32 2,548 2,578 2,548 2,578 592 599 3.95 645.06
33 5,668 5,735 5,668 5,735 1,316 1,332 3 1889.33
34 6,313 6,388 6,313 6,388 1,466 1,484 16.18 390.17
35 21,778 22,036 21,778 22,036 5,058 5,118 11.96 1820.90
Zone 3 86,498 87,523 86,498 87,522 20,089 20,329
36 5,266 5,328 5,266 5,328 1,223 1,238 4.8 1097.08
16 Projected based on the 2010 NSO and 2015 PSA Census of Population
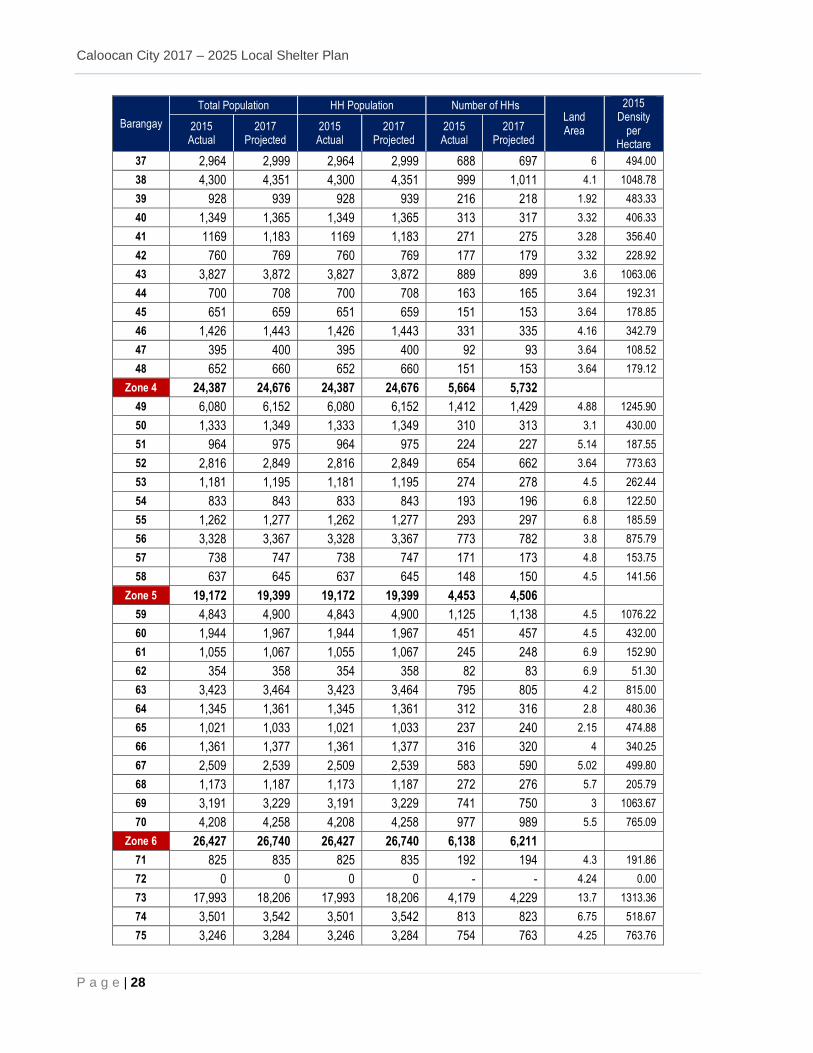
Caloocan City 2017 – 2025 Local Shelter Plan
P a g e | 28
Barangay
Total Population HH Population Number of HHs Land Area
2015 Density
per Hectare
2015 Actual
2017 Projected
2015 Actual
2017 Projected
2015 Actual
2017 Projected
37 2,964 2,999 2,964 2,999 688 697 6 494.00
38 4,300 4,351 4,300 4,351 999 1,011 4.1 1048.78
39 928 939 928 939 216 218 1.92 483.33
40 1,349 1,365 1,349 1,365 313 317 3.32 406.33
41 1169 1,183 1169 1,183 271 275 3.28 356.40
42 760 769 760 769 177 179 3.32 228.92
43 3,827 3,872 3,827 3,872 889 899 3.6 1063.06
44 700 708 700 708 163 165 3.64 192.31
45 651 659 651 659 151 153 3.64 178.85
46 1,426 1,443 1,426 1,443 331 335 4.16 342.79
47 395 400 395 400 92 93 3.64 108.52
48 652 660 652 660 151 153 3.64 179.12
Zone 4 24,387 24,676 24,387 24,676 5,664 5,732
49 6,080 6,152 6,080 6,152 1,412 1,429 4.88 1245.90
50 1,333 1,349 1,333 1,349 310 313 3.1 430.00
51 964 975 964 975 224 227 5.14 187.55
52 2,816 2,849 2,816 2,849 654 662 3.64 773.63
53 1,181 1,195 1,181 1,195 274 278 4.5 262.44
54 833 843 833 843 193 196 6.8 122.50
55 1,262 1,277 1,262 1,277 293 297 6.8 185.59
56 3,328 3,367 3,328 3,367 773 782 3.8 875.79
57 738 747 738 747 171 173 4.8 153.75
58 637 645 637 645 148 150 4.5 141.56
Zone 5 19,172 19,399 19,172 19,399 4,453 4,506
59 4,843 4,900 4,843 4,900 1,125 1,138 4.5 1076.22
60 1,944 1,967 1,944 1,967 451 457 4.5 432.00
61 1,055 1,067 1,055 1,067 245 248 6.9 152.90
62 354 358 354 358 82 83 6.9 51.30
63 3,423 3,464 3,423 3,464 795 805 4.2 815.00
64 1,345 1,361 1,345 1,361 312 316 2.8 480.36
65 1,021 1,033 1,021 1,033 237 240 2.15 474.88
66 1,361 1,377 1,361 1,377 316 320 4 340.25
67 2,509 2,539 2,509 2,539 583 590 5.02 499.80
68 1,173 1,187 1,173 1,187 272 276 5.7 205.79
69 3,191 3,229 3,191 3,229 741 750 3 1063.67
70 4,208 4,258 4,208 4,258 977 989 5.5 765.09
Zone 6 26,427 26,740 26,427 26,740 6,138 6,211
71 825 835 825 835 192 194 4.3 191.86
72 0 0 0 0 - - 4.24 0.00
73 17,993 18,206 17,993 18,206 4,179 4,229 13.7 1313.36
74 3,501 3,542 3,501 3,542 813 823 6.75 518.67
75 3,246 3,284 3,246 3,284 754 763 4.25 763.76
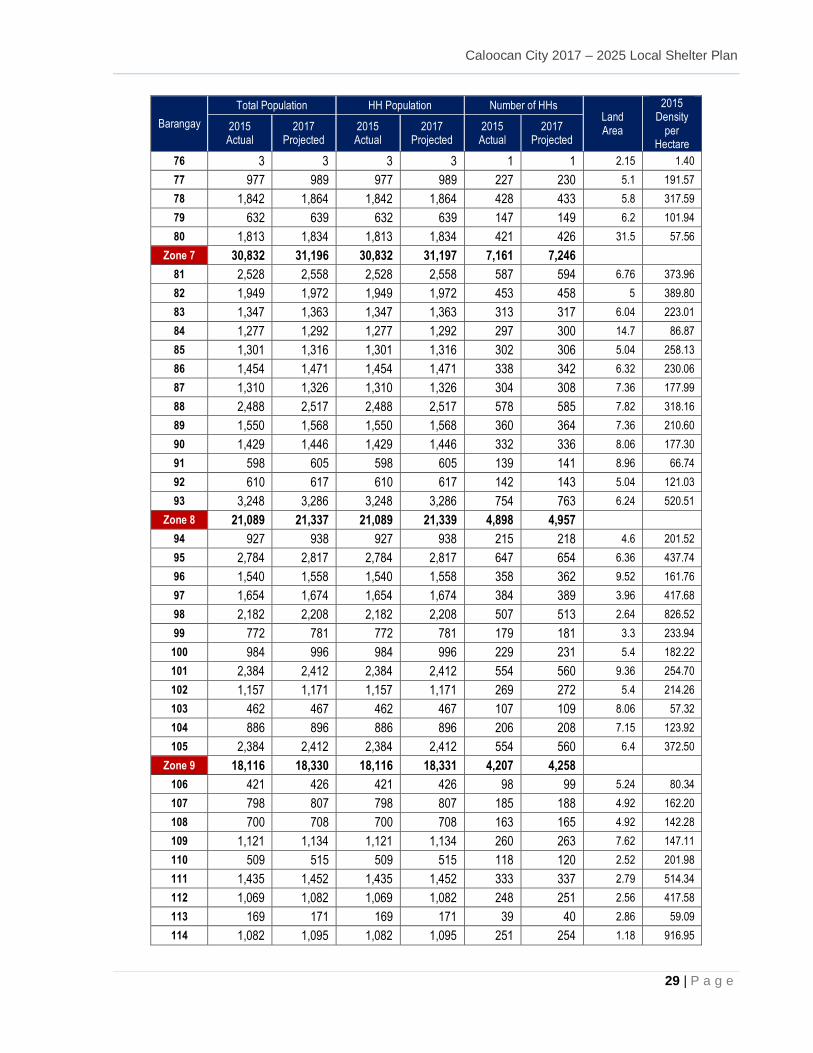
Caloocan City 2017 – 2025 Local Shelter Plan
29 | P a g e
Barangay
Total Population HH Population Number of HHs Land Area
2015 Density
per Hectare
2015 Actual
2017 Projected
2015 Actual
2017 Projected
2015 Actual
2017 Projected
76 3 3 3 3 1 1 2.15 1.40
77 977 989 977 989 227 230 5.1 191.57
78 1,842 1,864 1,842 1,864 428 433 5.8 317.59
79 632 639 632 639 147 149 6.2 101.94
80 1,813 1,834 1,813 1,834 421 426 31.5 57.56
Zone 7 30,832 31,196 30,832 31,197 7,161 7,246
81 2,528 2,558 2,528 2,558 587 594 6.76 373.96
82 1,949 1,972 1,949 1,972 453 458 5 389.80
83 1,347 1,363 1,347 1,363 313 317 6.04 223.01
84 1,277 1,292 1,277 1,292 297 300 14.7 86.87
85 1,301 1,316 1,301 1,316 302 306 5.04 258.13
86 1,454 1,471 1,454 1,471 338 342 6.32 230.06
87 1,310 1,326 1,310 1,326 304 308 7.36 177.99
88 2,488 2,517 2,488 2,517 578 585 7.82 318.16
89 1,550 1,568 1,550 1,568 360 364 7.36 210.60
90 1,429 1,446 1,429 1,446 332 336 8.06 177.30
91 598 605 598 605 139 141 8.96 66.74
92 610 617 610 617 142 143 5.04 121.03
93 3,248 3,286 3,248 3,286 754 763 6.24 520.51
Zone 8 21,089 21,337 21,089 21,339 4,898 4,957
94 927 938 927 938 215 218 4.6 201.52
95 2,784 2,817 2,784 2,817 647 654 6.36 437.74
96 1,540 1,558 1,540 1,558 358 362 9.52 161.76
97 1,654 1,674 1,654 1,674 384 389 3.96 417.68
98 2,182 2,208 2,182 2,208 507 513 2.64 826.52
99 772 781 772 781 179 181 3.3 233.94
100 984 996 984 996 229 231 5.4 182.22
101 2,384 2,412 2,384 2,412 554 560 9.36 254.70
102 1,157 1,171 1,157 1,171 269 272 5.4 214.26
103 462 467 462 467 107 109 8.06 57.32
104 886 896 886 896 206 208 7.15 123.92
105 2,384 2,412 2,384 2,412 554 560 6.4 372.50
Zone 9 18,116 18,330 18,116 18,331 4,207 4,258
106 421 426 421 426 98 99 5.24 80.34
107 798 807 798 807 185 188 4.92 162.20
108 700 708 700 708 163 165 4.92 142.28
109 1,121 1,134 1,121 1,134 260 263 7.62 147.11
110 509 515 509 515 118 120 2.52 201.98
111 1,435 1,452 1,435 1,452 333 337 2.79 514.34
112 1,069 1,082 1,069 1,082 248 251 2.56 417.58
113 169 171 169 171 39 40 2.86 59.09
114 1,082 1,095 1,082 1,095 251 254 1.18 916.95
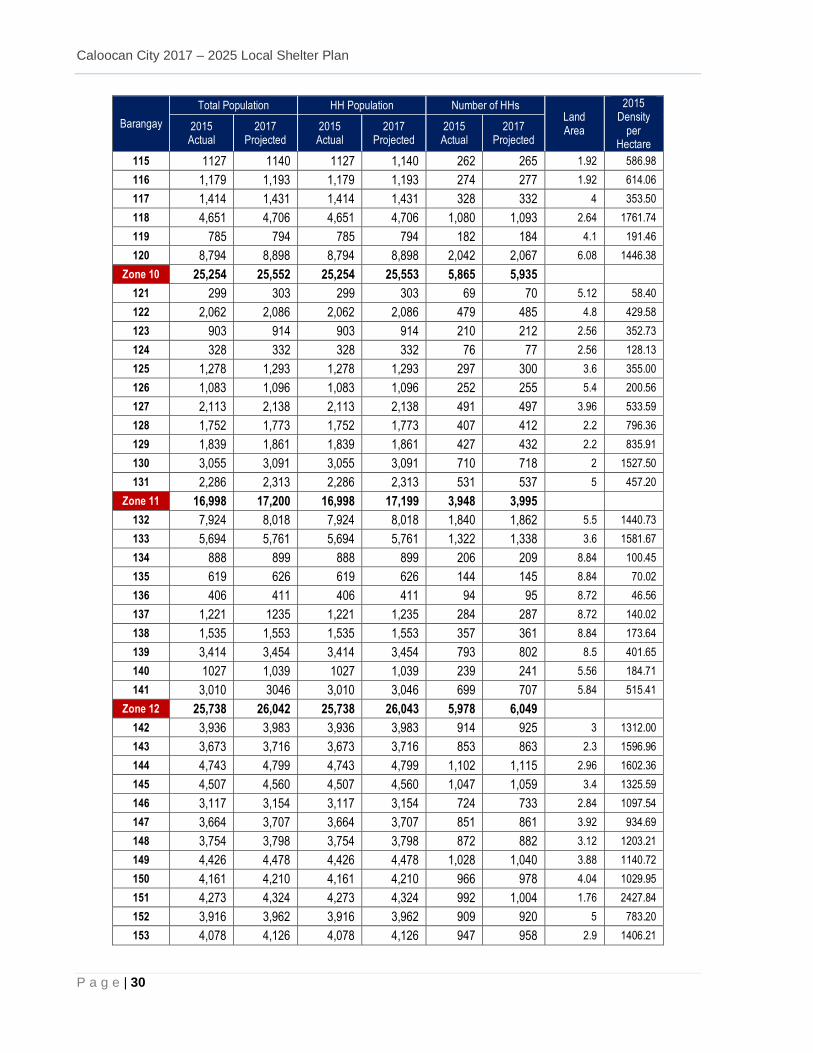
Caloocan City 2017 – 2025 Local Shelter Plan
P a g e | 30
Barangay
Total Population HH Population Number of HHs Land Area
2015 Density
per Hectare
2015 Actual
2017 Projected
2015 Actual
2017 Projected
2015 Actual
2017 Projected
115 1127 1140 1127 1,140 262 265 1.92 586.98
116 1,179 1,193 1,179 1,193 274 277 1.92 614.06
117 1,414 1,431 1,414 1,431 328 332 4 353.50
118 4,651 4,706 4,651 4,706 1,080 1,093 2.64 1761.74
119 785 794 785 794 182 184 4.1 191.46
120 8,794 8,898 8,794 8,898 2,042 2,067 6.08 1446.38
Zone 10 25,254 25,552 25,254 25,553 5,865 5,935
121 299 303 299 303 69 70 5.12 58.40
122 2,062 2,086 2,062 2,086 479 485 4.8 429.58
123 903 914 903 914 210 212 2.56 352.73
124 328 332 328 332 76 77 2.56 128.13
125 1,278 1,293 1,278 1,293 297 300 3.6 355.00
126 1,083 1,096 1,083 1,096 252 255 5.4 200.56
127 2,113 2,138 2,113 2,138 491 497 3.96 533.59
128 1,752 1,773 1,752 1,773 407 412 2.2 796.36
129 1,839 1,861 1,839 1,861 427 432 2.2 835.91
130 3,055 3,091 3,055 3,091 710 718 2 1527.50
131 2,286 2,313 2,286 2,313 531 537 5 457.20
Zone 11 16,998 17,200 16,998 17,199 3,948 3,995
132 7,924 8,018 7,924 8,018 1,840 1,862 5.5 1440.73
133 5,694 5,761 5,694 5,761 1,322 1,338 3.6 1581.67
134 888 899 888 899 206 209 8.84 100.45
135 619 626 619 626 144 145 8.84 70.02
136 406 411 406 411 94 95 8.72 46.56
137 1,221 1235 1,221 1,235 284 287 8.72 140.02
138 1,535 1,553 1,535 1,553 357 361 8.84 173.64
139 3,414 3,454 3,414 3,454 793 802 8.5 401.65
140 1027 1,039 1027 1,039 239 241 5.56 184.71
141 3,010 3046 3,010 3,046 699 707 5.84 515.41
Zone 12 25,738 26,042 25,738 26,043 5,978 6,049
142 3,936 3,983 3,936 3,983 914 925 3 1312.00
143 3,673 3,716 3,673 3,716 853 863 2.3 1596.96
144 4,743 4,799 4,743 4,799 1,102 1,115 2.96 1602.36
145 4,507 4,560 4,507 4,560 1,047 1,059 3.4 1325.59
146 3,117 3,154 3,117 3,154 724 733 2.84 1097.54
147 3,664 3,707 3,664 3,707 851 861 3.92 934.69
148 3,754 3,798 3,754 3,798 872 882 3.12 1203.21
149 4,426 4,478 4,426 4,478 1,028 1,040 3.88 1140.72
150 4,161 4,210 4,161 4,210 966 978 4.04 1029.95
151 4,273 4,324 4,273 4,324 992 1,004 1.76 2427.84
152 3,916 3,962 3,916 3,962 909 920 5 783.20
153 4,078 4,126 4,078 4,126 947 958 2.9 1406.21
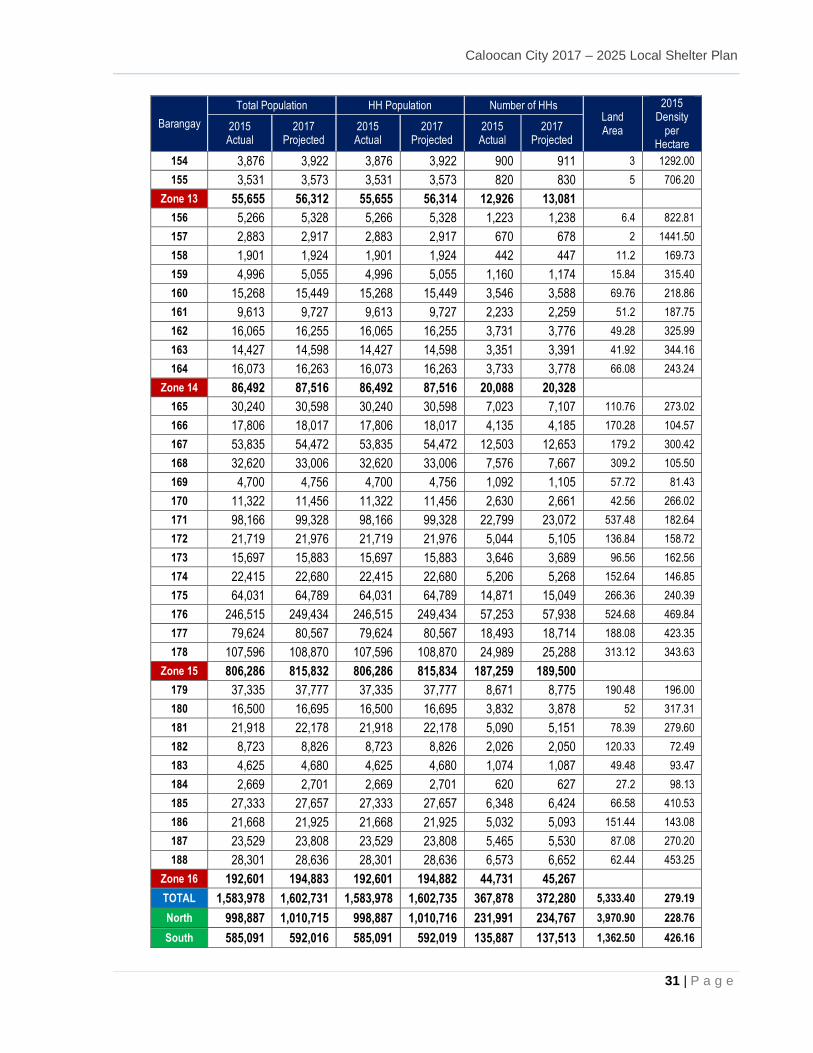
Caloocan City 2017 – 2025 Local Shelter Plan
31 | P a g e
Barangay
Total Population HH Population Number of HHs Land Area
2015 Density
per Hectare
2015 Actual
2017 Projected
2015 Actual
2017 Projected
2015 Actual
2017 Projected
154 3,876 3,922 3,876 3,922 900 911 3 1292.00
155 3,531 3,573 3,531 3,573 820 830 5 706.20
Zone 13 55,655 56,312 55,655 56,314 12,926 13,081
156 5,266 5,328 5,266 5,328 1,223 1,238 6.4 822.81
157 2,883 2,917 2,883 2,917 670 678 2 1441.50
158 1,901 1,924 1,901 1,924 442 447 11.2 169.73
159 4,996 5,055 4,996 5,055 1,160 1,174 15.84 315.40
160 15,268 15,449 15,268 15,449 3,546 3,588 69.76 218.86
161 9,613 9,727 9,613 9,727 2,233 2,259 51.2 187.75
162 16,065 16,255 16,065 16,255 3,731 3,776 49.28 325.99
163 14,427 14,598 14,427 14,598 3,351 3,391 41.92 344.16
164 16,073 16,263 16,073 16,263 3,733 3,778 66.08 243.24
Zone 14 86,492 87,516 86,492 87,516 20,088 20,328
165 30,240 30,598 30,240 30,598 7,023 7,107 110.76 273.02
166 17,806 18,017 17,806 18,017 4,135 4,185 170.28 104.57
167 53,835 54,472 53,835 54,472 12,503 12,653 179.2 300.42
168 32,620 33,006 32,620 33,006 7,576 7,667 309.2 105.50
169 4,700 4,756 4,700 4,756 1,092 1,105 57.72 81.43
170 11,322 11,456 11,322 11,456 2,630 2,661 42.56 266.02
171 98,166 99,328 98,166 99,328 22,799 23,072 537.48 182.64
172 21,719 21,976 21,719 21,976 5,044 5,105 136.84 158.72
173 15,697 15,883 15,697 15,883 3,646 3,689 96.56 162.56
174 22,415 22,680 22,415 22,680 5,206 5,268 152.64 146.85
175 64,031 64,789 64,031 64,789 14,871 15,049 266.36 240.39
176 246,515 249,434 246,515 249,434 57,253 57,938 524.68 469.84
177 79,624 80,567 79,624 80,567 18,493 18,714 188.08 423.35
178 107,596 108,870 107,596 108,870 24,989 25,288 313.12 343.63
Zone 15 806,286 815,832 806,286 815,834 187,259 189,500
179 37,335 37,777 37,335 37,777 8,671 8,775 190.48 196.00
180 16,500 16,695 16,500 16,695 3,832 3,878 52 317.31
181 21,918 22,178 21,918 22,178 5,090 5,151 78.39 279.60
182 8,723 8,826 8,723 8,826 2,026 2,050 120.33 72.49
183 4,625 4,680 4,625 4,680 1,074 1,087 49.48 93.47
184 2,669 2,701 2,669 2,701 620 627 27.2 98.13
185 27,333 27,657 27,333 27,657 6,348 6,424 66.58 410.53
186 21,668 21,925 21,668 21,925 5,032 5,093 151.44 143.08
187 23,529 23,808 23,529 23,808 5,465 5,530 87.08 270.20
188 28,301 28,636 28,301 28,636 6,573 6,652 62.44 453.25
Zone 16 192,601 194,883 192,601 194,882 44,731 45,267
TOTAL 1,583,978 1,602,731 1,583,978 1,602,735 367,878 372,280 5,333.40 279.19
North 998,887 1,010,715 998,887 1,010,716 231,991 234,767 3,970.90 228.76
South 585,091 592,016 585,091 592,019 135,887 137,513 1,362.50 426.16
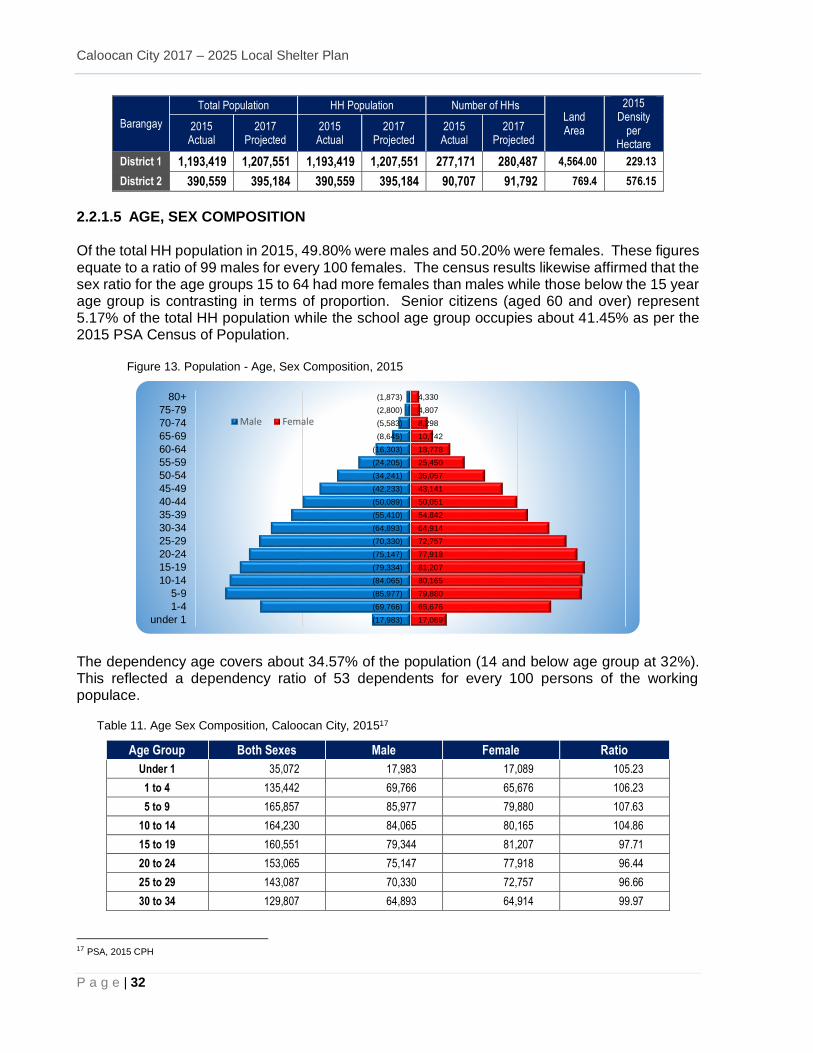
Caloocan City 2017 – 2025 Local Shelter Plan
P a g e | 32
Barangay
Total Population HH Population Number of HHs Land Area
2015 Density
per Hectare
2015 Actual
2017 Projected
2015 Actual
2017 Projected
2015 Actual
2017 Projected
District 1 1,193,419 1,207,551 1,193,419 1,207,551 277,171 280,487 4,564.00 229.13
District 2 390,559 395,184 390,559 395,184 90,707 91,792 769.4 576.15
2.2.1.5 AGE, SEX COMPOSITION Of the total HH population in 2015, 49.80% were males and 50.20% were females. These figures equate to a ratio of 99 males for every 100 females. The census results likewise affirmed that the sex ratio for the age groups 15 to 64 had more females than males while those below the 15 year age group is contrasting in terms of proportion. Senior citizens (aged 60 and over) represent 5.17% of the total HH population while the school age group occupies about 41.45% as per the 2015 PSA Census of Population. Figure 13. Population - Age, Sex Composition, 2015
The dependency age covers about 34.57% of the population (14 and below age group at 32%). This reflected a dependency ratio of 53 dependents for every 100 persons of the working populace. Table 11. Age Sex Composition, Caloocan City, 201517
Age Group Both Sexes Male Female Ratio
Under 1 35,072 17,983 17,089 105.23
1 to 4 135,442 69,766 65,676 106.23
5 to 9 165,857 85,977 79,880 107.63
10 to 14 164,230 84,065 80,165 104.86
15 to 19 160,551 79,344 81,207 97.71
20 to 24 153,065 75,147 77,918 96.44
25 to 29 143,087 70,330 72,757 96.66
30 to 34 129,807 64,893 64,914 99.97
17 PSA, 2015 CPH
(17,983)
(69,766)
(85,977)
(84,065)
(79,334)
(75,147)
(70,330)
(64,893)
(55,410)
(50,089)
(42,233)
(34,241)
(24,205)
(16,303)
(8,645)
(5,583)
(2,800)
(1,873)
17,089
65,676
79,880
80,165
81,207
77,918
72,757
64,914
54,842
50,051
43,141
35,057
25,450
18,778
10,742
8,298
4,807
4,330
under 1
1-4
5-9
10-14
15-19
20-24
25-29
30-34
35-39
40-44
45-49
50-54
55-59
60-64
65-69
70-74
75-79
80+
Male Female
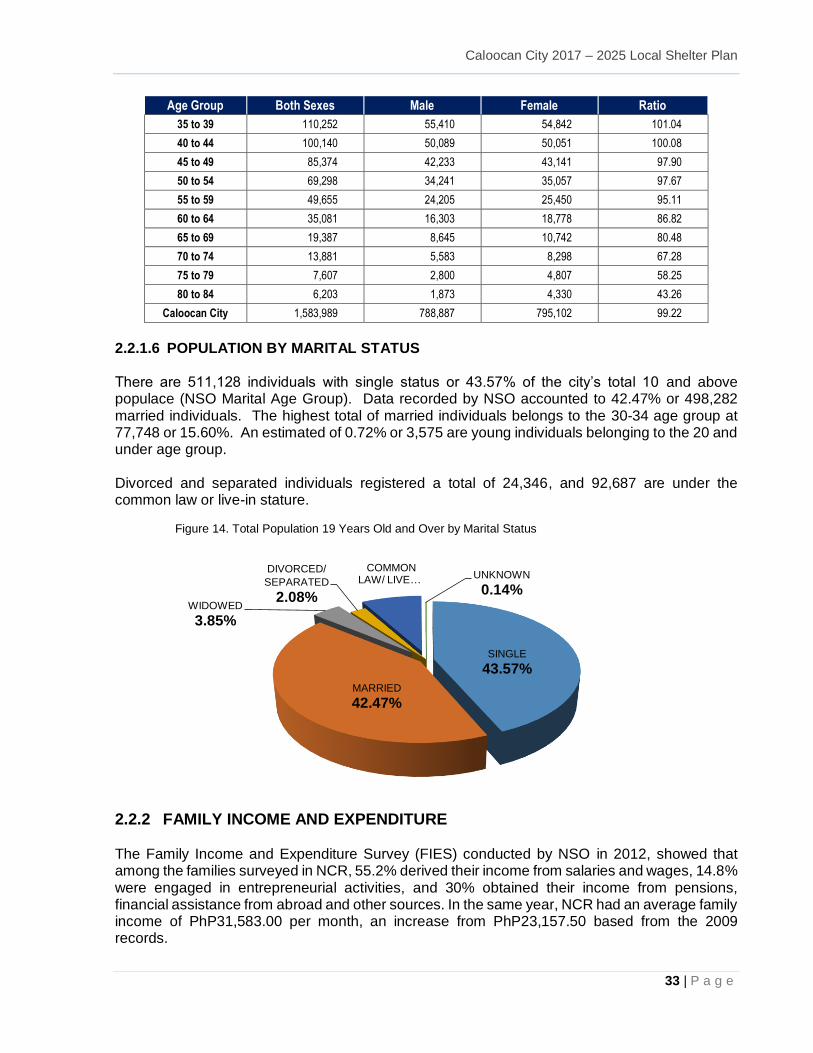
Caloocan City 2017 – 2025 Local Shelter Plan
33 | P a g e
Age Group Both Sexes Male Female Ratio
35 to 39 110,252 55,410 54,842 101.04
40 to 44 100,140 50,089 50,051 100.08
45 to 49 85,374 42,233 43,141 97.90
50 to 54 69,298 34,241 35,057 97.67
55 to 59 49,655 24,205 25,450 95.11
60 to 64 35,081 16,303 18,778 86.82
65 to 69 19,387 8,645 10,742 80.48
70 to 74 13,881 5,583 8,298 67.28
75 to 79 7,607 2,800 4,807 58.25
80 to 84 6,203 1,873 4,330 43.26
Caloocan City 1,583,989 788,887 795,102 99.22
2.2.1.6 POPULATION BY MARITAL STATUS There are 511,128 individuals with single status or 43.57% of the city’s total 10 and above populace (NSO Marital Age Group). Data recorded by NSO accounted to 42.47% or 498,282 married individuals. The highest total of married individuals belongs to the 30-34 age group at 77,748 or 15.60%. An estimated of 0.72% or 3,575 are young individuals belonging to the 20 and under age group.
Divorced and separated individuals registered a total of 24,346, and 92,687 are under the common law or live-in stature. Figure 14. Total Population 19 Years Old and Over by Marital Status
2.2.2 FAMILY INCOME AND EXPENDITURE The Family Income and Expenditure Survey (FIES) conducted by NSO in 2012, showed that among the families surveyed in NCR, 55.2% derived their income from salaries and wages, 14.8% were engaged in entrepreneurial activities, and 30% obtained their income from pensions, financial assistance from abroad and other sources. In the same year, NCR had an average family income of PhP31,583.00 per month, an increase from PhP23,157.50 based from the 2009 records.
SINGLE
43.57%
MARRIED
42.47%
WIDOWED
3.85%
DIVORCED/
SEPARATED
2.08%
COMMON LAW/ LIVE … UNKNOWN
0.14%
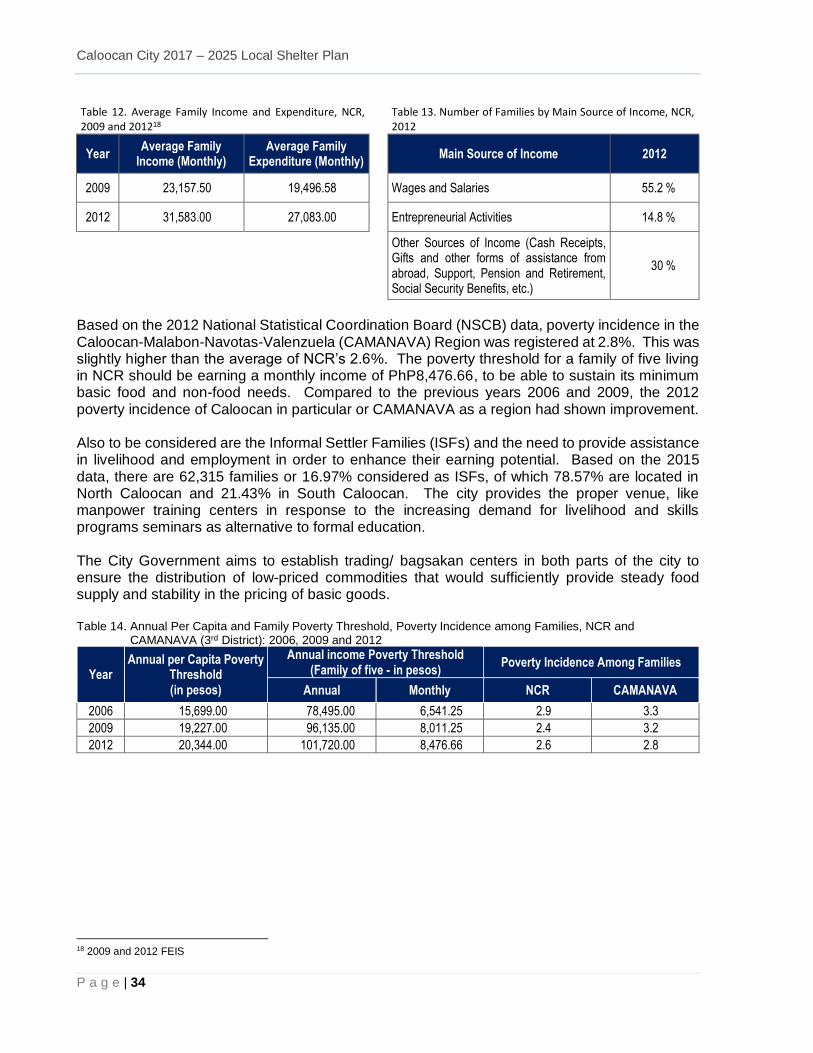
Caloocan City 2017 – 2025 Local Shelter Plan
P a g e | 34
Table 12. Average Family Income and Expenditure, NCR, 2009 and 201218
Table 13. Number of Families by Main Source of Income, NCR, 2012
Year Average Family
Income (Monthly) Average Family
Expenditure (Monthly) Main Source of Income 2012
2009 23,157.50 19,496.58
Wages and Salaries 55.2 %
2012 31,583.00 27,083.00
Entrepreneurial Activities 14.8 %
Other Sources of Income (Cash Receipts, Gifts and other forms of assistance from abroad, Support, Pension and Retirement, Social Security Benefits, etc.)
30 %
Based on the 2012 National Statistical Coordination Board (NSCB) data, poverty incidence in the Caloocan-Malabon-Navotas-Valenzuela (CAMANAVA) Region was registered at 2.8%. This was slightly higher than the average of NCR’s 2.6%. The poverty threshold for a family of five living in NCR should be earning a monthly income of PhP8,476.66, to be able to sustain its minimum basic food and non-food needs. Compared to the previous years 2006 and 2009, the 2012 poverty incidence of Caloocan in particular or CAMANAVA as a region had shown improvement. Also to be considered are the Informal Settler Families (ISFs) and the need to provide assistance in livelihood and employment in order to enhance their earning potential. Based on the 2015 data, there are 62,315 families or 16.97% considered as ISFs, of which 78.57% are located in North Caloocan and 21.43% in South Caloocan. The city provides the proper venue, like manpower training centers in response to the increasing demand for livelihood and skills programs seminars as alternative to formal education. The City Government aims to establish trading/ bagsakan centers in both parts of the city to ensure the distribution of low-priced commodities that would sufficiently provide steady food supply and stability in the pricing of basic goods. Table 14. Annual Per Capita and Family Poverty Threshold, Poverty Incidence among Families, NCR and CAMANAVA (3rd District): 2006, 2009 and 2012
Year Annual per Capita Poverty
Threshold (in pesos)
Annual income Poverty Threshold (Family of five - in pesos)
Poverty Incidence Among Families
Annual Monthly NCR CAMANAVA
2006 15,699.00 78,495.00 6,541.25 2.9 3.3
2009 19,227.00 96,135.00 8,011.25 2.4 3.2
2012 20,344.00 101,720.00 8,476.66 2.6 2.8
18 2009 and 2012 FEIS
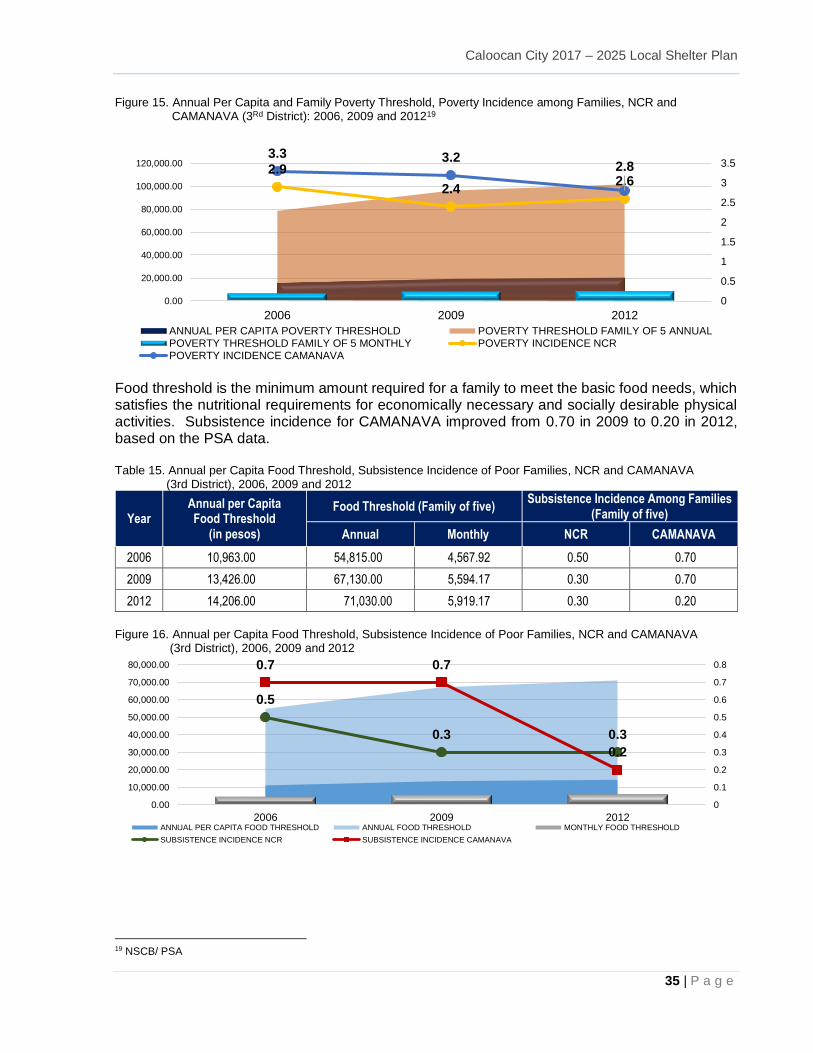
Caloocan City 2017 – 2025 Local Shelter Plan
35 | P a g e
Figure 15. Annual Per Capita and Family Poverty Threshold, Poverty Incidence among Families, NCR and CAMANAVA (3Rd District): 2006, 2009 and 201219
Food threshold is the minimum amount required for a family to meet the basic food needs, which satisfies the nutritional requirements for economically necessary and socially desirable physical activities. Subsistence incidence for CAMANAVA improved from 0.70 in 2009 to 0.20 in 2012, based on the PSA data. Table 15. Annual per Capita Food Threshold, Subsistence Incidence of Poor Families, NCR and CAMANAVA
(3rd District), 2006, 2009 and 2012
Year Annual per Capita Food Threshold
(in pesos)
Food Threshold (Family of five) Subsistence Incidence Among Families
(Family of five)
Annual Monthly NCR CAMANAVA
2006 10,963.00 54,815.00 4,567.92 0.50 0.70
2009 13,426.00 67,130.00 5,594.17 0.30 0.70
2012 14,206.00 71,030.00 5,919.17 0.30 0.20
Figure 16. Annual per Capita Food Threshold, Subsistence Incidence of Poor Families, NCR and CAMANAVA
(3rd District), 2006, 2009 and 2012
19 NSCB/ PSA
2.9
2.42.6
3.3 3.22.8
0
0.5
1
1.5
2
2.5
3
3.5
0.00
20,000.00
40,000.00
60,000.00
80,000.00
100,000.00
120,000.00
2006 2009 2012
ANNUAL PER CAPITA POVERTY THRESHOLD POVERTY THRESHOLD FAMILY OF 5 ANNUALPOVERTY THRESHOLD FAMILY OF 5 MONTHLY POVERTY INCIDENCE NCRPOVERTY INCIDENCE CAMANAVA
0.5
0.3 0.3
0.7 0.7
0.2
0
0.1
0.2
0.3
0.4
0.5
0.6
0.7
0.8
0.00
10,000.00
20,000.00
30,000.00
40,000.00
50,000.00
60,000.00
70,000.00
80,000.00
2006 2009 2012ANNUAL PER CAPITA FOOD THRESHOLD ANNUAL FOOD THRESHOLD MONTHLY FOOD THRESHOLD
SUBSISTENCE INCIDENCE NCR SUBSISTENCE INCIDENCE CAMANAVA
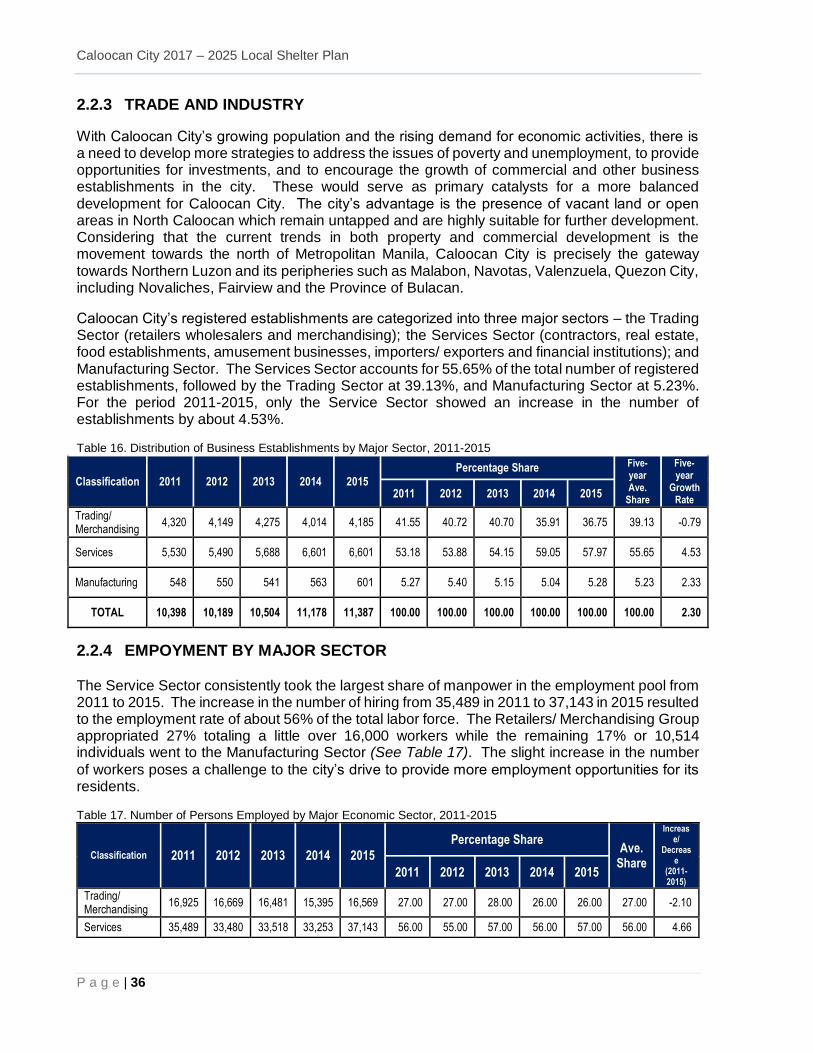
Caloocan City 2017 – 2025 Local Shelter Plan
P a g e | 36
2.2.3 TRADE AND INDUSTRY
With Caloocan City’s growing population and the rising demand for economic activities, there is a need to develop more strategies to address the issues of poverty and unemployment, to provide opportunities for investments, and to encourage the growth of commercial and other business establishments in the city. These would serve as primary catalysts for a more balanced development for Caloocan City. The city’s advantage is the presence of vacant land or open areas in North Caloocan which remain untapped and are highly suitable for further development. Considering that the current trends in both property and commercial development is the movement towards the north of Metropolitan Manila, Caloocan City is precisely the gateway towards Northern Luzon and its peripheries such as Malabon, Navotas, Valenzuela, Quezon City, including Novaliches, Fairview and the Province of Bulacan.
Caloocan City’s registered establishments are categorized into three major sectors – the Trading Sector (retailers wholesalers and merchandising); the Services Sector (contractors, real estate, food establishments, amusement businesses, importers/ exporters and financial institutions); and Manufacturing Sector. The Services Sector accounts for 55.65% of the total number of registered establishments, followed by the Trading Sector at 39.13%, and Manufacturing Sector at 5.23%. For the period 2011-2015, only the Service Sector showed an increase in the number of establishments by about 4.53%. Table 16. Distribution of Business Establishments by Major Sector, 2011-2015
Classification 2011 2012 2013 2014 2015 Percentage Share Five-
year Ave.
Share
Five-year
Growth Rate
2011 2012 2013 2014 2015
Trading/ Merchandising
4,320 4,149 4,275 4,014 4,185 41.55 40.72 40.70 35.91 36.75 39.13 -0.79
Services 5,530 5,490 5,688 6,601 6,601 53.18 53.88 54.15 59.05 57.97 55.65 4.53
Manufacturing 548 550 541 563 601 5.27 5.40 5.15 5.04 5.28 5.23 2.33
TOTAL 10,398 10,189 10,504 11,178 11,387 100.00 100.00 100.00 100.00 100.00 100.00 2.30
2.2.4 EMPOYMENT BY MAJOR SECTOR
The Service Sector consistently took the largest share of manpower in the employment pool from 2011 to 2015. The increase in the number of hiring from 35,489 in 2011 to 37,143 in 2015 resulted to the employment rate of about 56% of the total labor force. The Retailers/ Merchandising Group appropriated 27% totaling a little over 16,000 workers while the remaining 17% or 10,514 individuals went to the Manufacturing Sector (See Table 17). The slight increase in the number
of workers poses a challenge to the city’s drive to provide more employment opportunities for its residents. Table 17. Number of Persons Employed by Major Economic Sector, 2011-2015
Classification 2011 2012 2013
2014
2015
Percentage Share Ave.
Share
Increase/
Decrease
(2011-2015)
2011 2012 2013 2014 2015
Trading/ Merchandising
16,925 16,669 16,481 15,395 16,569 27.00 27.00 28.00 26.00 26.00 27.00 -2.10
Services 35,489 33,480 33,518 33,253 37,143 56.00 55.00 57.00 56.00 57.00 56.00 4.66
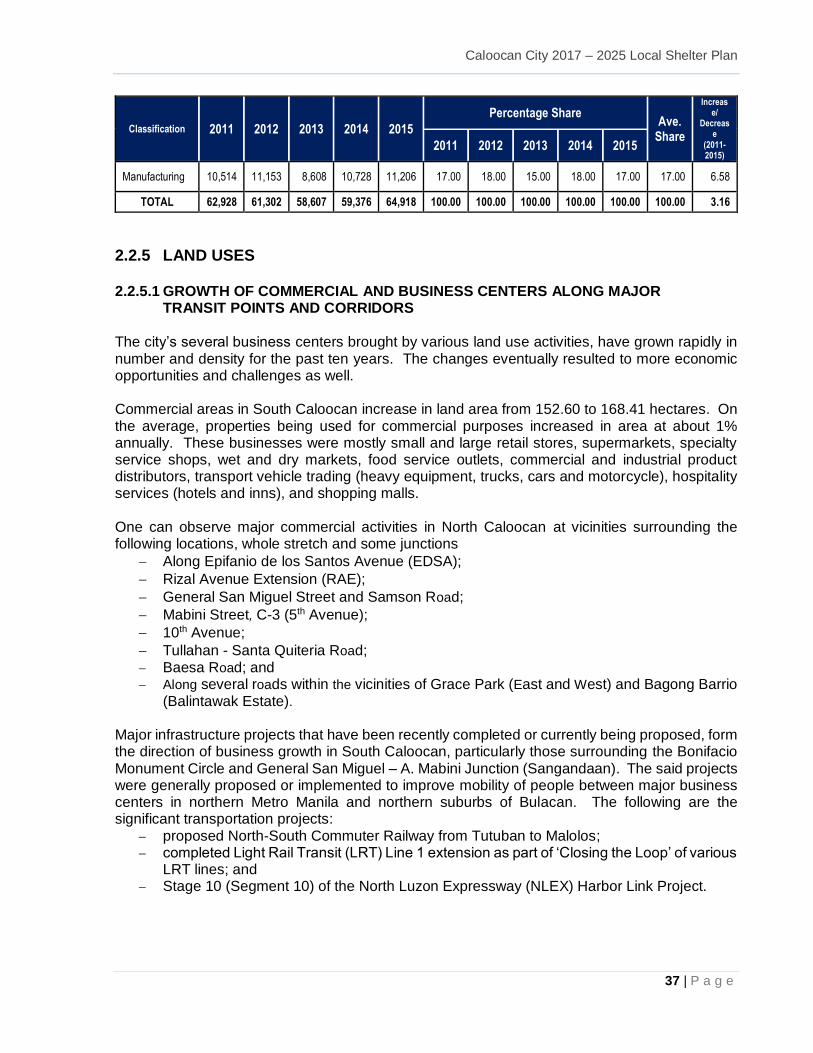
Caloocan City 2017 – 2025 Local Shelter Plan
37 | P a g e
Classification 2011 2012 2013
2014
2015
Percentage Share Ave.
Share
Increase/
Decrease
(2011-2015)
2011 2012 2013 2014 2015
Manufacturing 10,514 11,153 8,608 10,728 11,206 17.00 18.00 15.00 18.00 17.00 17.00 6.58
TOTAL 62,928 61,302 58,607 59,376 64,918 100.00 100.00 100.00 100.00 100.00 100.00 3.16
2.2.5 LAND USES
2.2.5.1 GROWTH OF COMMERCIAL AND BUSINESS CENTERS ALONG MAJOR TRANSIT POINTS AND CORRIDORS
The city’s several business centers brought by various land use activities, have grown rapidly in number and density for the past ten years. The changes eventually resulted to more economic opportunities and challenges as well. Commercial areas in South Caloocan increase in land area from 152.60 to 168.41 hectares. On the average, properties being used for commercial purposes increased in area at about 1% annually. These businesses were mostly small and large retail stores, supermarkets, specialty service shops, wet and dry markets, food service outlets, commercial and industrial product distributors, transport vehicle trading (heavy equipment, trucks, cars and motorcycle), hospitality services (hotels and inns), and shopping malls. One can observe major commercial activities in North Caloocan at vicinities surrounding the following locations, whole stretch and some junctions
Along Epifanio de los Santos Avenue (EDSA);
Rizal Avenue Extension (RAE);
General San Miguel Street and Samson Road;
Mabini Street, C-3 (5th Avenue);
10th Avenue;
Tullahan - Santa Quiteria Road; Baesa Road; and
Along several roads within the vicinities of Grace Park (East and West) and Bagong Barrio (Balintawak Estate).
Major infrastructure projects that have been recently completed or currently being proposed, form the direction of business growth in South Caloocan, particularly those surrounding the Bonifacio Monument Circle and General San Miguel – A. Mabini Junction (Sangandaan). The said projects were generally proposed or implemented to improve mobility of people between major business centers in northern Metro Manila and northern suburbs of Bulacan. The following are the significant transportation projects:
proposed North-South Commuter Railway from Tutuban to Malolos; completed Light Rail Transit (LRT) Line 1 extension as part of ‘Closing the Loop’ of various
LRT lines; and
Stage 10 (Segment 10) of the North Luzon Expressway (NLEX) Harbor Link Project.
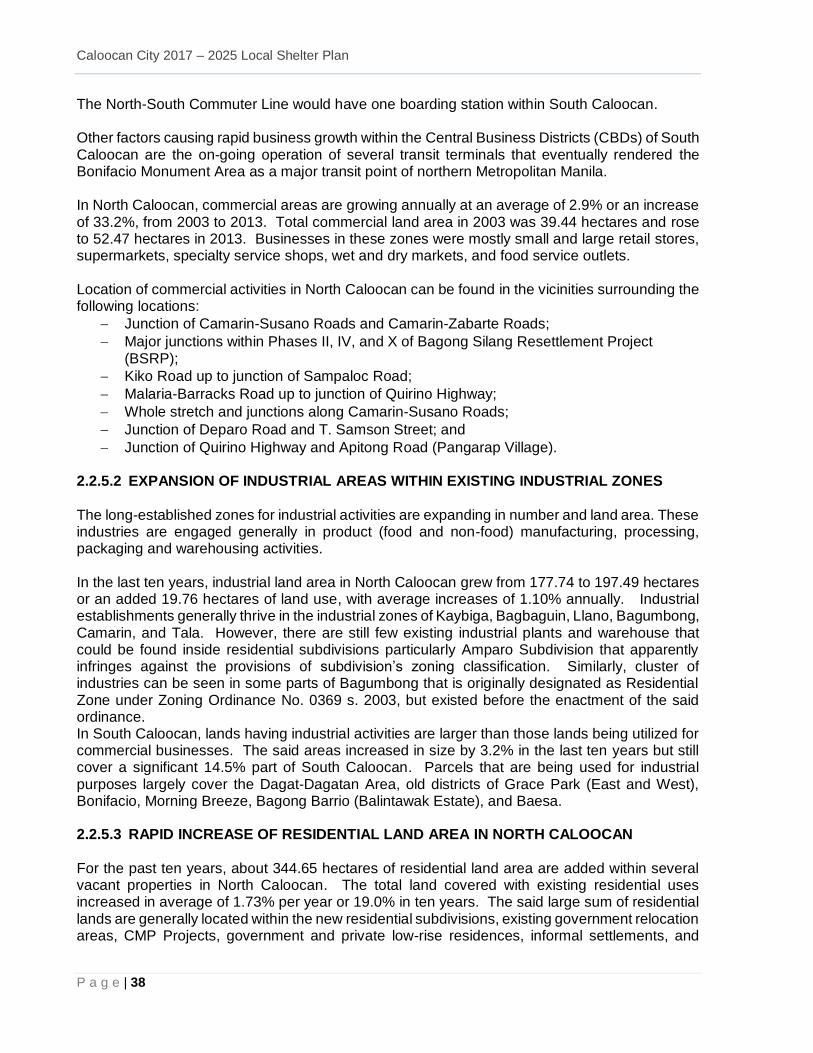
Caloocan City 2017 – 2025 Local Shelter Plan
P a g e | 38
The North-South Commuter Line would have one boarding station within South Caloocan. Other factors causing rapid business growth within the Central Business Districts (CBDs) of South Caloocan are the on-going operation of several transit terminals that eventually rendered the Bonifacio Monument Area as a major transit point of northern Metropolitan Manila. In North Caloocan, commercial areas are growing annually at an average of 2.9% or an increase of 33.2%, from 2003 to 2013. Total commercial land area in 2003 was 39.44 hectares and rose to 52.47 hectares in 2013. Businesses in these zones were mostly small and large retail stores, supermarkets, specialty service shops, wet and dry markets, and food service outlets. Location of commercial activities in North Caloocan can be found in the vicinities surrounding the following locations:
Junction of Camarin-Susano Roads and Camarin-Zabarte Roads;
Major junctions within Phases II, IV, and X of Bagong Silang Resettlement Project (BSRP);
Kiko Road up to junction of Sampaloc Road;
Malaria-Barracks Road up to junction of Quirino Highway;
Whole stretch and junctions along Camarin-Susano Roads;
Junction of Deparo Road and T. Samson Street; and
Junction of Quirino Highway and Apitong Road (Pangarap Village). 2.2.5.2 EXPANSION OF INDUSTRIAL AREAS WITHIN EXISTING INDUSTRIAL ZONES
The long-established zones for industrial activities are expanding in number and land area. These industries are engaged generally in product (food and non-food) manufacturing, processing, packaging and warehousing activities. In the last ten years, industrial land area in North Caloocan grew from 177.74 to 197.49 hectares or an added 19.76 hectares of land use, with average increases of 1.10% annually. Industrial establishments generally thrive in the industrial zones of Kaybiga, Bagbaguin, Llano, Bagumbong, Camarin, and Tala. However, there are still few existing industrial plants and warehouse that could be found inside residential subdivisions particularly Amparo Subdivision that apparently infringes against the provisions of subdivision’s zoning classification. Similarly, cluster of industries can be seen in some parts of Bagumbong that is originally designated as Residential Zone under Zoning Ordinance No. 0369 s. 2003, but existed before the enactment of the said ordinance. In South Caloocan, lands having industrial activities are larger than those lands being utilized for commercial businesses. The said areas increased in size by 3.2% in the last ten years but still cover a significant 14.5% part of South Caloocan. Parcels that are being used for industrial purposes largely cover the Dagat-Dagatan Area, old districts of Grace Park (East and West), Bonifacio, Morning Breeze, Bagong Barrio (Balintawak Estate), and Baesa. 2.2.5.3 RAPID INCREASE OF RESIDENTIAL LAND AREA IN NORTH CALOOCAN
For the past ten years, about 344.65 hectares of residential land area are added within several vacant properties in North Caloocan. The total land covered with existing residential uses increased in average of 1.73% per year or 19.0% in ten years. The said large sum of residential lands are generally located within the new residential subdivisions, existing government relocation areas, CMP Projects, government and private low-rise residences, informal settlements, and
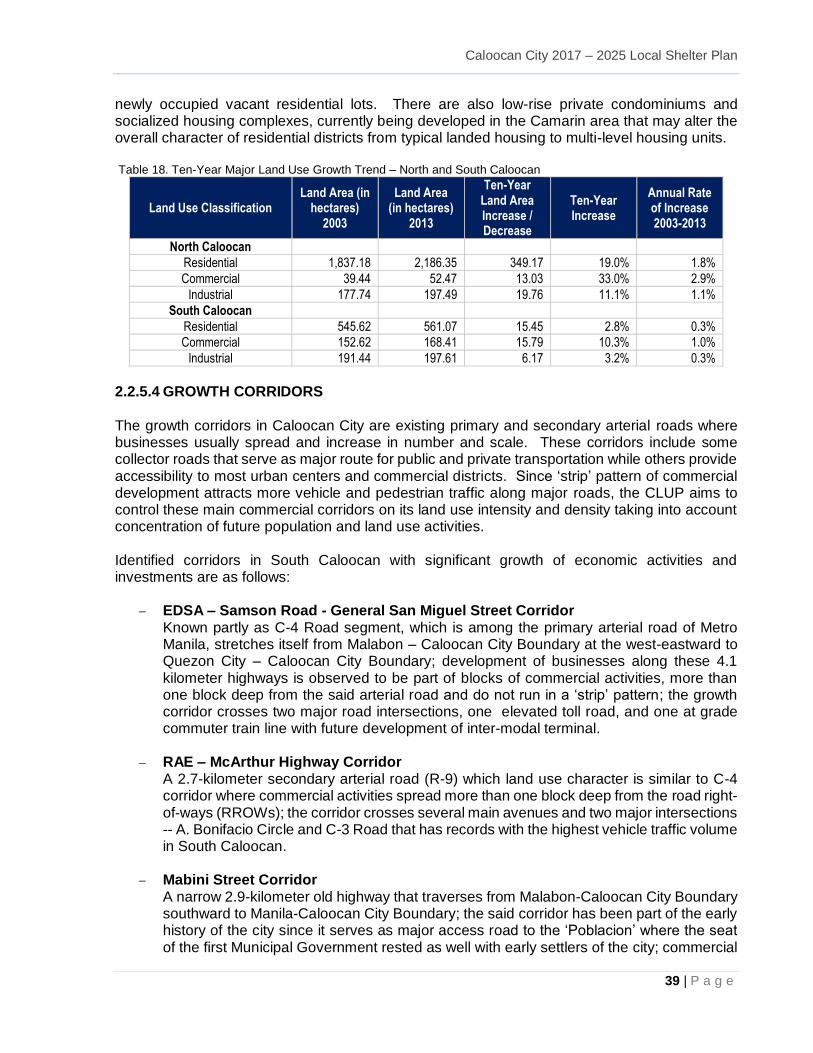
Caloocan City 2017 – 2025 Local Shelter Plan
39 | P a g e
newly occupied vacant residential lots. There are also low-rise private condominiums and socialized housing complexes, currently being developed in the Camarin area that may alter the overall character of residential districts from typical landed housing to multi-level housing units. Table 18. Ten-Year Major Land Use Growth Trend – North and South Caloocan
Land Use Classification Land Area (in
hectares) 2003
Land Area (in hectares)
2013
Ten-Year Land Area Increase / Decrease
Ten-Year Increase
Annual Rate of Increase 2003-2013
North Caloocan
Residential 1,837.18 2,186.35 349.17 19.0% 1.8%
Commercial 39.44 52.47 13.03 33.0% 2.9%
Industrial 177.74 197.49 19.76 11.1% 1.1%
South Caloocan
Residential 545.62 561.07 15.45 2.8% 0.3%
Commercial 152.62 168.41 15.79 10.3% 1.0%
Industrial 191.44 197.61 6.17 3.2% 0.3%
2.2.5.4 GROWTH CORRIDORS
The growth corridors in Caloocan City are existing primary and secondary arterial roads where businesses usually spread and increase in number and scale. These corridors include some collector roads that serve as major route for public and private transportation while others provide accessibility to most urban centers and commercial districts. Since ‘strip’ pattern of commercial development attracts more vehicle and pedestrian traffic along major roads, the CLUP aims to control these main commercial corridors on its land use intensity and density taking into account concentration of future population and land use activities. Identified corridors in South Caloocan with significant growth of economic activities and investments are as follows:
EDSA – Samson Road - General San Miguel Street Corridor Known partly as C-4 Road segment, which is among the primary arterial road of Metro Manila, stretches itself from Malabon – Caloocan City Boundary at the west-eastward to Quezon City – Caloocan City Boundary; development of businesses along these 4.1 kilometer highways is observed to be part of blocks of commercial activities, more than one block deep from the said arterial road and do not run in a ‘strip’ pattern; the growth corridor crosses two major road intersections, one elevated toll road, and one at grade commuter train line with future development of inter-modal terminal.
RAE – McArthur Highway Corridor
A 2.7-kilometer secondary arterial road (R-9) which land use character is similar to C-4 corridor where commercial activities spread more than one block deep from the road right-of-ways (RROWs); the corridor crosses several main avenues and two major intersections -- A. Bonifacio Circle and C-3 Road that has records with the highest vehicle traffic volume in South Caloocan.
Mabini Street Corridor
A narrow 2.9-kilometer old highway that traverses from Malabon-Caloocan City Boundary southward to Manila-Caloocan City Boundary; the said corridor has been part of the early history of the city since it serves as major access road to the ‘Poblacion’ where the seat of the first Municipal Government rested as well with early settlers of the city; commercial
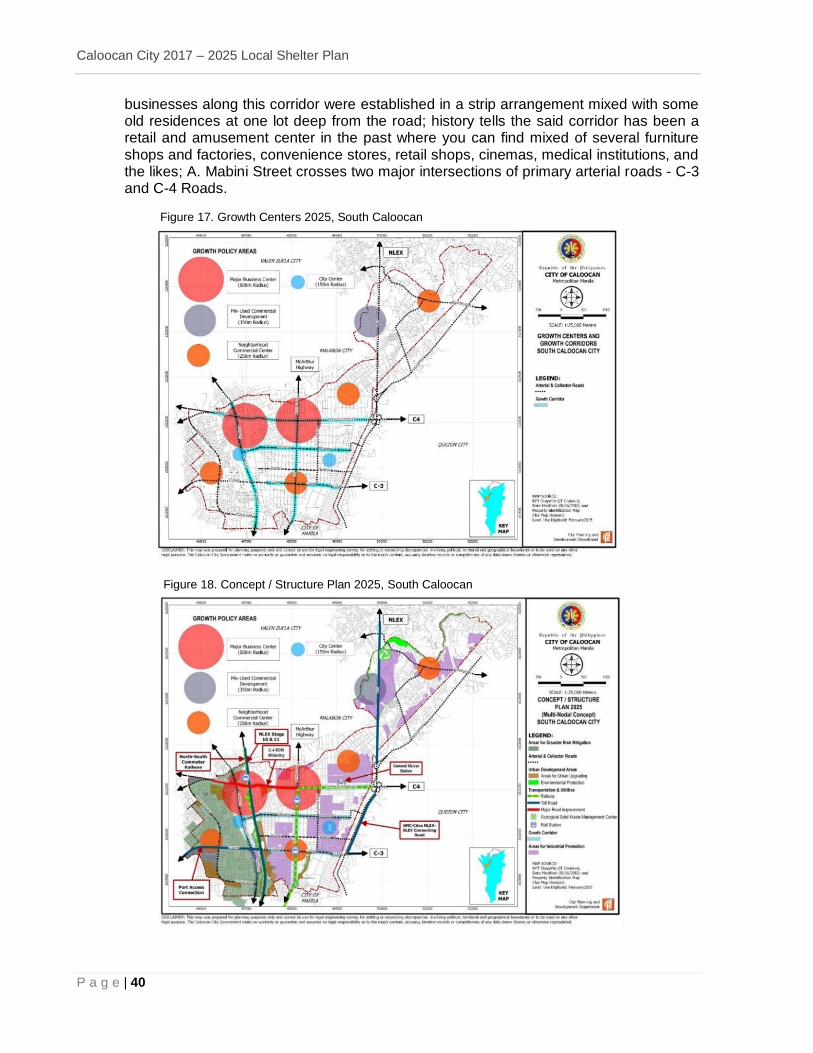
Caloocan City 2017 – 2025 Local Shelter Plan
P a g e | 40
businesses along this corridor were established in a strip arrangement mixed with some old residences at one lot deep from the road; history tells the said corridor has been a retail and amusement center in the past where you can find mixed of several furniture shops and factories, convenience stores, retail shops, cinemas, medical institutions, and the likes; A. Mabini Street crosses two major intersections of primary arterial roads - C-3 and C-4 Roads.
Figure 17. Growth Centers 2025, South Caloocan
Figure 18. Concept / Structure Plan 2025, South Caloocan
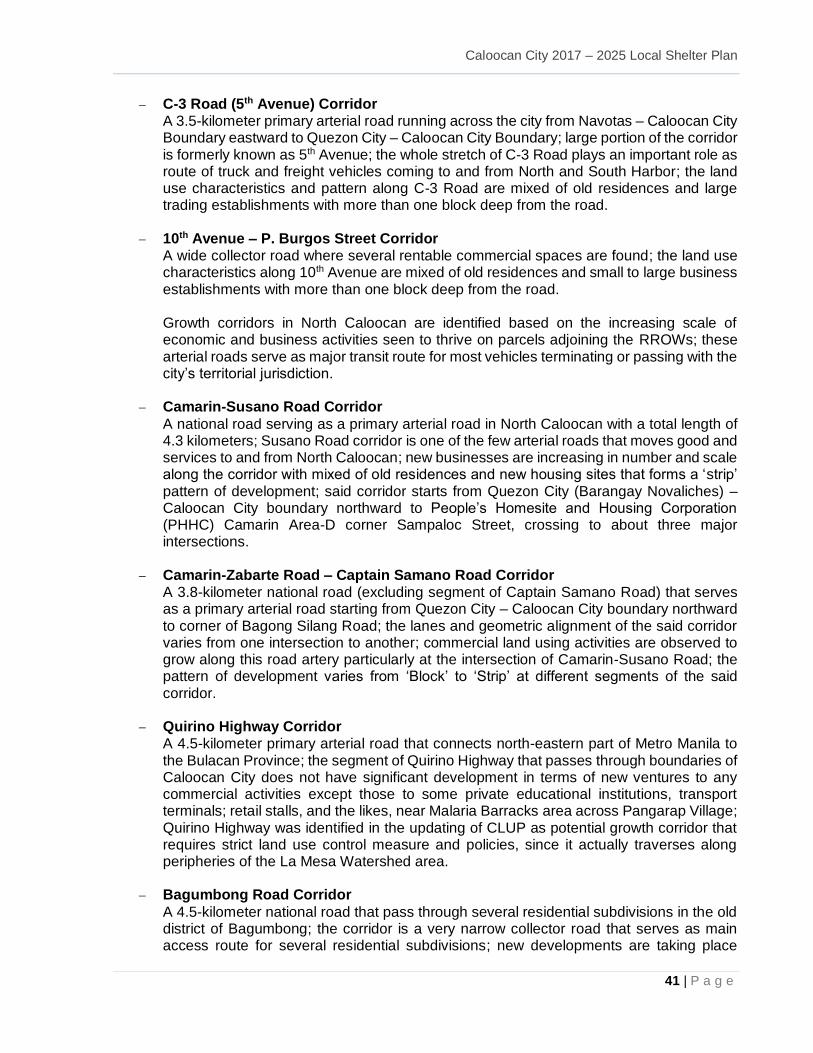
Caloocan City 2017 – 2025 Local Shelter Plan
41 | P a g e
C-3 Road (5th Avenue) Corridor A 3.5-kilometer primary arterial road running across the city from Navotas – Caloocan City Boundary eastward to Quezon City – Caloocan City Boundary; large portion of the corridor is formerly known as 5th Avenue; the whole stretch of C-3 Road plays an important role as route of truck and freight vehicles coming to and from North and South Harbor; the land use characteristics and pattern along C-3 Road are mixed of old residences and large trading establishments with more than one block deep from the road.
10th Avenue – P. Burgos Street Corridor
A wide collector road where several rentable commercial spaces are found; the land use characteristics along 10th Avenue are mixed of old residences and small to large business establishments with more than one block deep from the road.
Growth corridors in North Caloocan are identified based on the increasing scale of economic and business activities seen to thrive on parcels adjoining the RROWs; these arterial roads serve as major transit route for most vehicles terminating or passing with the city’s territorial jurisdiction.
Camarin-Susano Road Corridor
A national road serving as a primary arterial road in North Caloocan with a total length of 4.3 kilometers; Susano Road corridor is one of the few arterial roads that moves good and services to and from North Caloocan; new businesses are increasing in number and scale along the corridor with mixed of old residences and new housing sites that forms a ‘strip’ pattern of development; said corridor starts from Quezon City (Barangay Novaliches) – Caloocan City boundary northward to People’s Homesite and Housing Corporation (PHHC) Camarin Area-D corner Sampaloc Street, crossing to about three major intersections.
Camarin-Zabarte Road – Captain Samano Road Corridor
A 3.8-kilometer national road (excluding segment of Captain Samano Road) that serves as a primary arterial road starting from Quezon City – Caloocan City boundary northward to corner of Bagong Silang Road; the lanes and geometric alignment of the said corridor varies from one intersection to another; commercial land using activities are observed to grow along this road artery particularly at the intersection of Camarin-Susano Road; the pattern of development varies from ‘Block’ to ‘Strip’ at different segments of the said corridor.
Quirino Highway Corridor
A 4.5-kilometer primary arterial road that connects north-eastern part of Metro Manila to the Bulacan Province; the segment of Quirino Highway that passes through boundaries of Caloocan City does not have significant development in terms of new ventures to any commercial activities except those to some private educational institutions, transport terminals; retail stalls, and the likes, near Malaria Barracks area across Pangarap Village; Quirino Highway was identified in the updating of CLUP as potential growth corridor that requires strict land use control measure and policies, since it actually traverses along peripheries of the La Mesa Watershed area.
Bagumbong Road Corridor
A 4.5-kilometer national road that pass through several residential subdivisions in the old district of Bagumbong; the corridor is a very narrow collector road that serves as main access route for several residential subdivisions; new developments are taking place
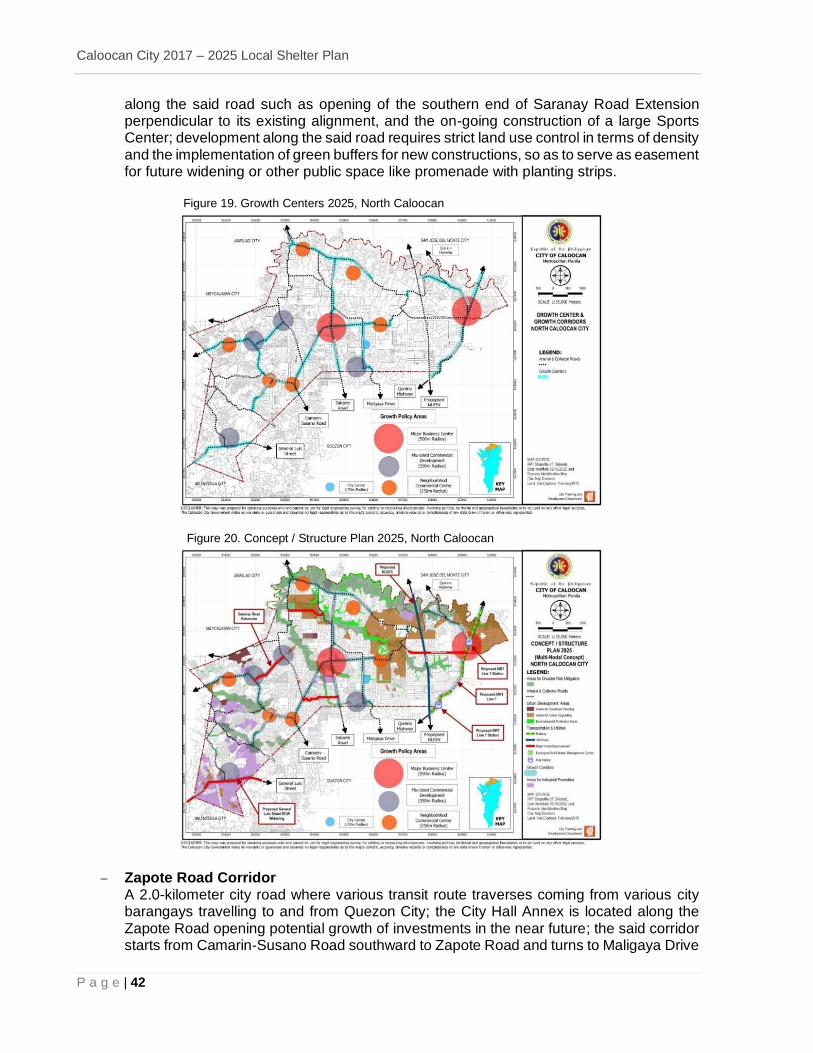
Caloocan City 2017 – 2025 Local Shelter Plan
P a g e | 42
along the said road such as opening of the southern end of Saranay Road Extension perpendicular to its existing alignment, and the on-going construction of a large Sports Center; development along the said road requires strict land use control in terms of density and the implementation of green buffers for new constructions, so as to serve as easement for future widening or other public space like promenade with planting strips.
Figure 19. Growth Centers 2025, North Caloocan
Figure 20. Concept / Structure Plan 2025, North Caloocan
Zapote Road Corridor A 2.0-kilometer city road where various transit route traverses coming from various city barangays travelling to and from Quezon City; the City Hall Annex is located along the Zapote Road opening potential growth of investments in the near future; the said corridor starts from Camarin-Susano Road southward to Zapote Road and turns to Maligaya Drive
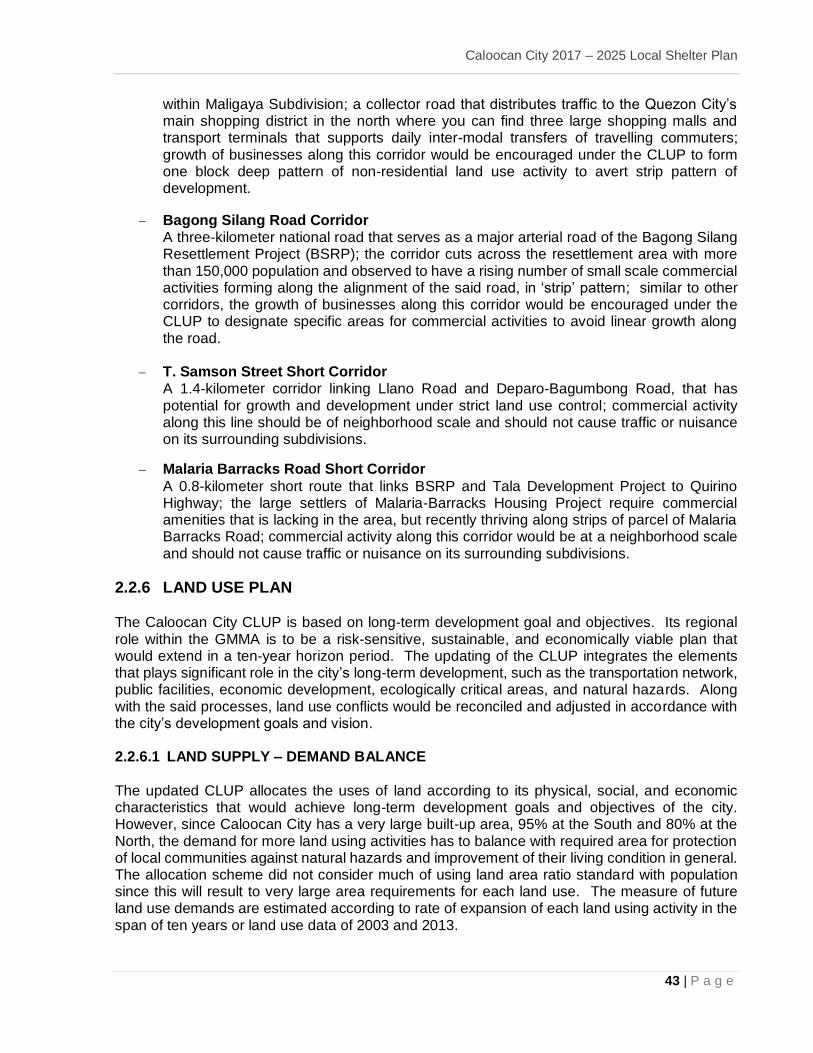
Caloocan City 2017 – 2025 Local Shelter Plan
43 | P a g e
within Maligaya Subdivision; a collector road that distributes traffic to the Quezon City’s main shopping district in the north where you can find three large shopping malls and transport terminals that supports daily inter-modal transfers of travelling commuters; growth of businesses along this corridor would be encouraged under the CLUP to form one block deep pattern of non-residential land use activity to avert strip pattern of development.
Bagong Silang Road Corridor
A three-kilometer national road that serves as a major arterial road of the Bagong Silang Resettlement Project (BSRP); the corridor cuts across the resettlement area with more than 150,000 population and observed to have a rising number of small scale commercial activities forming along the alignment of the said road, in ‘strip’ pattern; similar to other corridors, the growth of businesses along this corridor would be encouraged under the CLUP to designate specific areas for commercial activities to avoid linear growth along the road.
T. Samson Street Short Corridor
A 1.4-kilometer corridor linking Llano Road and Deparo-Bagumbong Road, that has potential for growth and development under strict land use control; commercial activity along this line should be of neighborhood scale and should not cause traffic or nuisance on its surrounding subdivisions.
Malaria Barracks Road Short Corridor
A 0.8-kilometer short route that links BSRP and Tala Development Project to Quirino Highway; the large settlers of Malaria-Barracks Housing Project require commercial amenities that is lacking in the area, but recently thriving along strips of parcel of Malaria Barracks Road; commercial activity along this corridor would be at a neighborhood scale and should not cause traffic or nuisance on its surrounding subdivisions.
2.2.6 LAND USE PLAN The Caloocan City CLUP is based on long-term development goal and objectives. Its regional role within the GMMA is to be a risk-sensitive, sustainable, and economically viable plan that would extend in a ten-year horizon period. The updating of the CLUP integrates the elements that plays significant role in the city’s long-term development, such as the transportation network, public facilities, economic development, ecologically critical areas, and natural hazards. Along with the said processes, land use conflicts would be reconciled and adjusted in accordance with the city’s development goals and vision. 2.2.6.1 LAND SUPPLY – DEMAND BALANCE
The updated CLUP allocates the uses of land according to its physical, social, and economic characteristics that would achieve long-term development goals and objectives of the city. However, since Caloocan City has a very large built-up area, 95% at the South and 80% at the North, the demand for more land using activities has to balance with required area for protection of local communities against natural hazards and improvement of their living condition in general. The allocation scheme did not consider much of using land area ratio standard with population since this will result to very large area requirements for each land use. The measure of future land use demands are estimated according to rate of expansion of each land using activity in the span of ten years or land use data of 2003 and 2013.
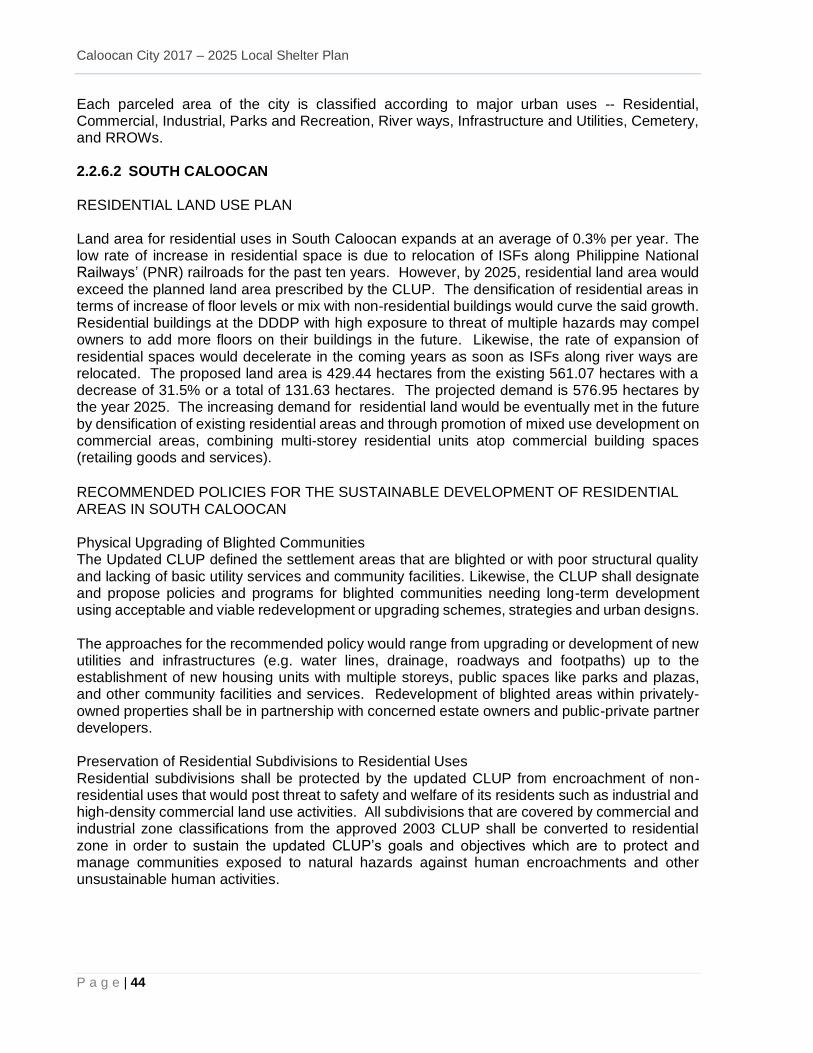
Caloocan City 2017 – 2025 Local Shelter Plan
P a g e | 44
Each parceled area of the city is classified according to major urban uses -- Residential, Commercial, Industrial, Parks and Recreation, River ways, Infrastructure and Utilities, Cemetery, and RROWs. 2.2.6.2 SOUTH CALOOCAN RESIDENTIAL LAND USE PLAN Land area for residential uses in South Caloocan expands at an average of 0.3% per year. The low rate of increase in residential space is due to relocation of ISFs along Philippine National Railways’ (PNR) railroads for the past ten years. However, by 2025, residential land area would exceed the planned land area prescribed by the CLUP. The densification of residential areas in terms of increase of floor levels or mix with non-residential buildings would curve the said growth. Residential buildings at the DDDP with high exposure to threat of multiple hazards may compel owners to add more floors on their buildings in the future. Likewise, the rate of expansion of residential spaces would decelerate in the coming years as soon as ISFs along river ways are relocated. The proposed land area is 429.44 hectares from the existing 561.07 hectares with a decrease of 31.5% or a total of 131.63 hectares. The projected demand is 576.95 hectares by the year 2025. The increasing demand for residential land would be eventually met in the future by densification of existing residential areas and through promotion of mixed use development on commercial areas, combining multi-storey residential units atop commercial building spaces (retailing goods and services).
RECOMMENDED POLICIES FOR THE SUSTAINABLE DEVELOPMENT OF RESIDENTIAL AREAS IN SOUTH CALOOCAN Physical Upgrading of Blighted Communities The Updated CLUP defined the settlement areas that are blighted or with poor structural quality and lacking of basic utility services and community facilities. Likewise, the CLUP shall designate and propose policies and programs for blighted communities needing long-term development using acceptable and viable redevelopment or upgrading schemes, strategies and urban designs. The approaches for the recommended policy would range from upgrading or development of new utilities and infrastructures (e.g. water lines, drainage, roadways and footpaths) up to the establishment of new housing units with multiple storeys, public spaces like parks and plazas, and other community facilities and services. Redevelopment of blighted areas within privately-owned properties shall be in partnership with concerned estate owners and public-private partner developers. Preservation of Residential Subdivisions to Residential Uses Residential subdivisions shall be protected by the updated CLUP from encroachment of non-residential uses that would post threat to safety and welfare of its residents such as industrial and high-density commercial land use activities. All subdivisions that are covered by commercial and industrial zone classifications from the approved 2003 CLUP shall be converted to residential zone in order to sustain the updated CLUP’s goals and objectives which are to protect and manage communities exposed to natural hazards against human encroachments and other unsustainable human activities.
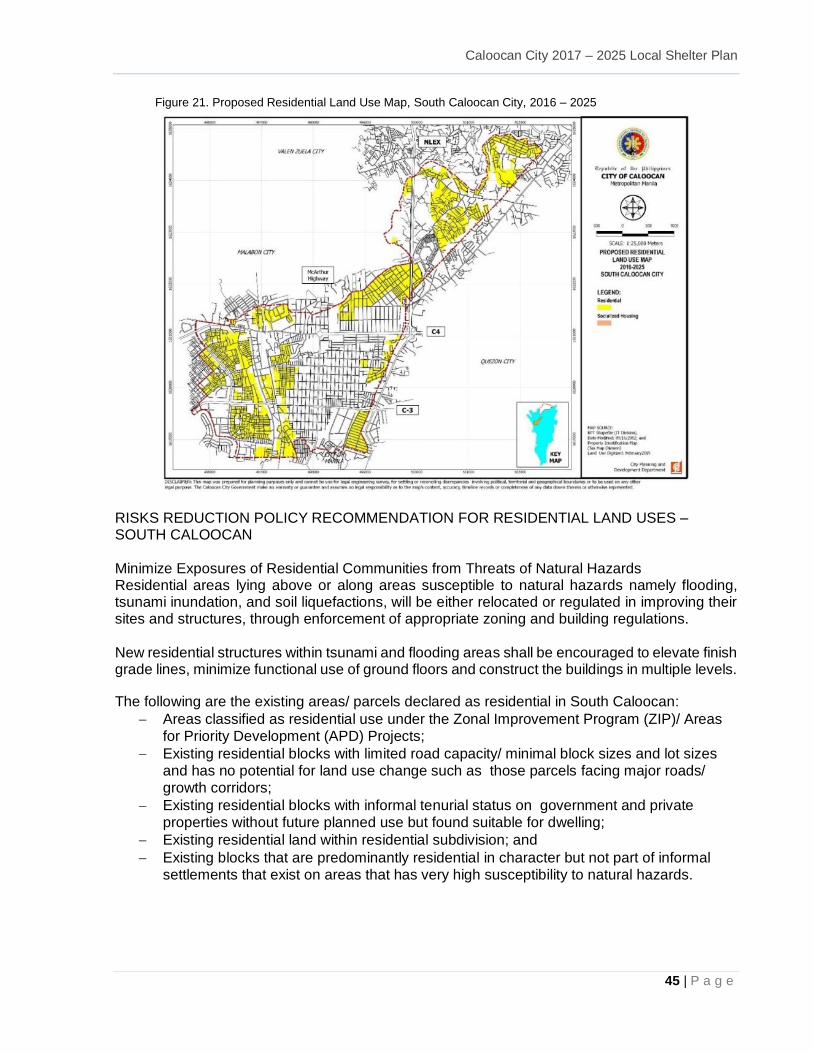
Caloocan City 2017 – 2025 Local Shelter Plan
45 | P a g e
Figure 21. Proposed Residential Land Use Map, South Caloocan City, 2016 – 2025
RISKS REDUCTION POLICY RECOMMENDATION FOR RESIDENTIAL LAND USES – SOUTH CALOOCAN Minimize Exposures of Residential Communities from Threats of Natural Hazards Residential areas lying above or along areas susceptible to natural hazards namely flooding, tsunami inundation, and soil liquefactions, will be either relocated or regulated in improving their sites and structures, through enforcement of appropriate zoning and building regulations. New residential structures within tsunami and flooding areas shall be encouraged to elevate finish grade lines, minimize functional use of ground floors and construct the buildings in multiple levels.
The following are the existing areas/ parcels declared as residential in South Caloocan:
Areas classified as residential use under the Zonal Improvement Program (ZIP)/ Areas for Priority Development (APD) Projects;
Existing residential blocks with limited road capacity/ minimal block sizes and lot sizes and has no potential for land use change such as those parcels facing major roads/ growth corridors;
Existing residential blocks with informal tenurial status on government and private properties without future planned use but found suitable for dwelling;
Existing residential land within residential subdivision; and
Existing blocks that are predominantly residential in character but not part of informal settlements that exist on areas that has very high susceptibility to natural hazards.
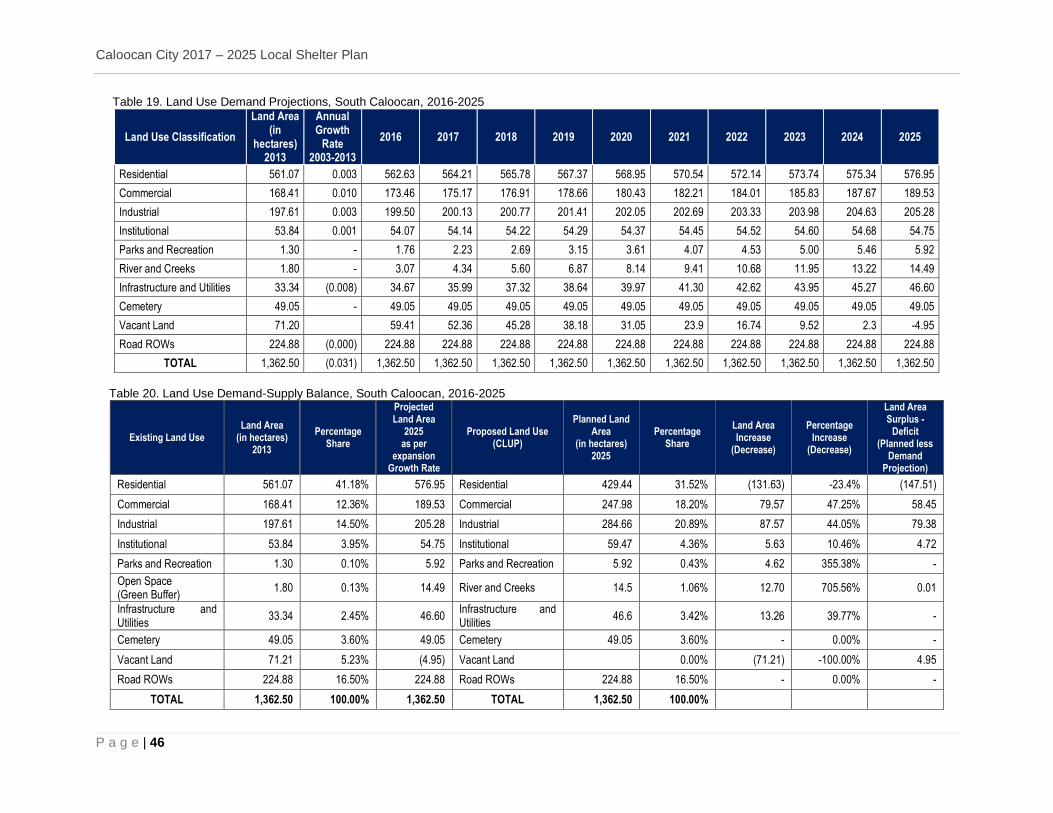
Caloocan City 2017 – 2025 Local Shelter Plan
P a g e | 46
Table 19. Land Use Demand Projections, South Caloocan, 2016-2025
Land Use Classification
Land Area (in
hectares) 2013
Annual Growth
Rate 2003-2013
2016 2017 2018 2019 2020 2021 2022 2023 2024 2025
Residential 561.07 0.003 562.63 564.21 565.78 567.37 568.95 570.54 572.14 573.74 575.34 576.95
Commercial 168.41 0.010 173.46 175.17 176.91 178.66 180.43 182.21 184.01 185.83 187.67 189.53
Industrial 197.61 0.003 199.50 200.13 200.77 201.41 202.05 202.69 203.33 203.98 204.63 205.28
Institutional 53.84 0.001 54.07 54.14 54.22 54.29 54.37 54.45 54.52 54.60 54.68 54.75
Parks and Recreation 1.30 - 1.76 2.23 2.69 3.15 3.61 4.07 4.53 5.00 5.46 5.92
River and Creeks 1.80 - 3.07 4.34 5.60 6.87 8.14 9.41 10.68 11.95 13.22 14.49
Infrastructure and Utilities 33.34 (0.008) 34.67 35.99 37.32 38.64 39.97 41.30 42.62 43.95 45.27 46.60
Cemetery 49.05 - 49.05 49.05 49.05 49.05 49.05 49.05 49.05 49.05 49.05 49.05
Vacant Land 71.20 59.41 52.36 45.28 38.18 31.05 23.9 16.74 9.52 2.3 -4.95
Road ROWs 224.88 (0.000) 224.88 224.88 224.88 224.88 224.88 224.88 224.88 224.88 224.88 224.88
TOTAL 1,362.50 (0.031) 1,362.50 1,362.50 1,362.50 1,362.50 1,362.50 1,362.50 1,362.50 1,362.50 1,362.50 1,362.50
Table 20. Land Use Demand-Supply Balance, South Caloocan, 2016-2025
Existing Land Use Land Area
(in hectares) 2013
Percentage Share
Projected Land Area
2025 as per
expansion Growth Rate
Proposed Land Use (CLUP)
Planned Land Area
(in hectares) 2025
Percentage Share
Land Area Increase
(Decrease)
Percentage Increase
(Decrease)
Land Area Surplus -
Deficit (Planned less
Demand Projection)
Residential 561.07 41.18% 576.95 Residential 429.44 31.52% (131.63) -23.4% (147.51)
Commercial 168.41 12.36% 189.53 Commercial 247.98 18.20% 79.57 47.25% 58.45
Industrial 197.61 14.50% 205.28 Industrial 284.66 20.89% 87.57 44.05% 79.38
Institutional 53.84 3.95% 54.75 Institutional 59.47 4.36% 5.63 10.46% 4.72
Parks and Recreation 1.30 0.10% 5.92 Parks and Recreation 5.92 0.43% 4.62 355.38% -
Open Space (Green Buffer)
1.80 0.13% 14.49 River and Creeks 14.5 1.06% 12.70 705.56% 0.01
Infrastructure and Utilities
33.34 2.45% 46.60 Infrastructure and Utilities
46.6 3.42% 13.26 39.77% -
Cemetery 49.05 3.60% 49.05 Cemetery 49.05 3.60% - 0.00% -
Vacant Land 71.21 5.23% (4.95) Vacant Land 0.00% (71.21) -100.00% 4.95
Road ROWs 224.88 16.50% 224.88 Road ROWs 224.88 16.50% - 0.00% -
TOTAL 1,362.50 100.00% 1,362.50 TOTAL 1,362.50 100.00%
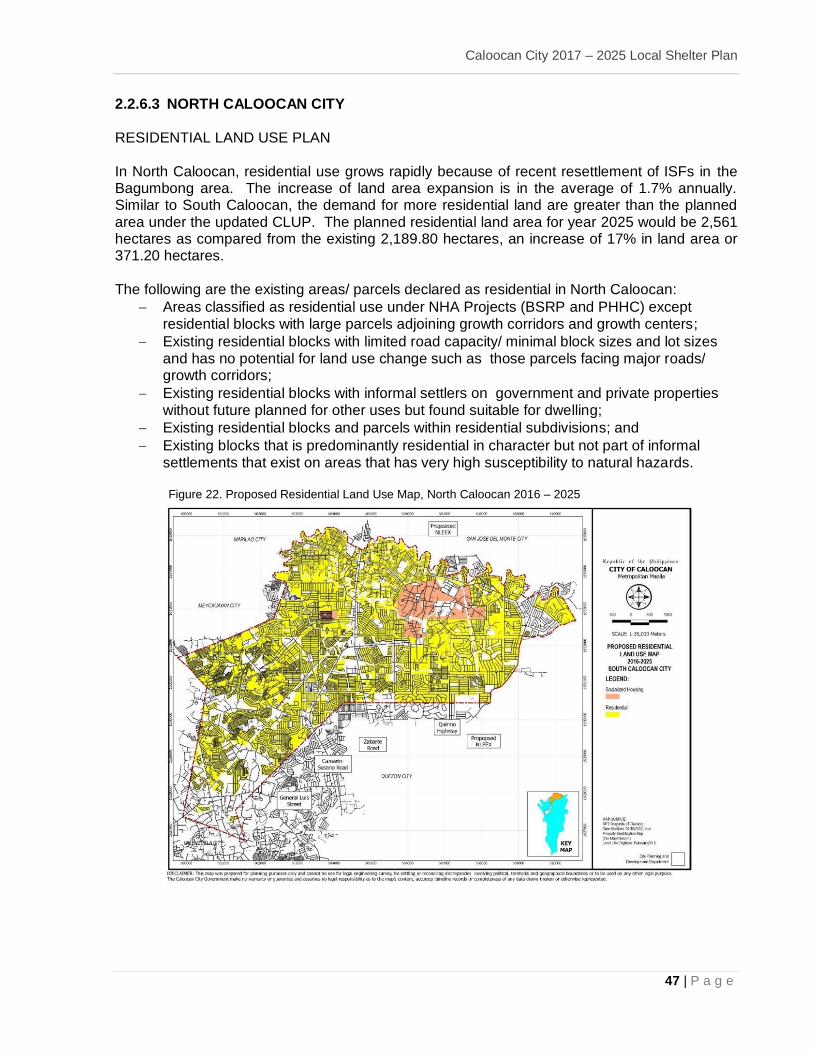
Caloocan City 2017 – 2025 Local Shelter Plan
47 | P a g e
2.2.6.3 NORTH CALOOCAN CITY RESIDENTIAL LAND USE PLAN In North Caloocan, residential use grows rapidly because of recent resettlement of ISFs in the Bagumbong area. The increase of land area expansion is in the average of 1.7% annually. Similar to South Caloocan, the demand for more residential land are greater than the planned area under the updated CLUP. The planned residential land area for year 2025 would be 2,561 hectares as compared from the existing 2,189.80 hectares, an increase of 17% in land area or 371.20 hectares.
The following are the existing areas/ parcels declared as residential in North Caloocan:
Areas classified as residential use under NHA Projects (BSRP and PHHC) except residential blocks with large parcels adjoining growth corridors and growth centers;
Existing residential blocks with limited road capacity/ minimal block sizes and lot sizes and has no potential for land use change such as those parcels facing major roads/ growth corridors;
Existing residential blocks with informal settlers on government and private properties without future planned for other uses but found suitable for dwelling;
Existing residential blocks and parcels within residential subdivisions; and
Existing blocks that is predominantly residential in character but not part of informal settlements that exist on areas that has very high susceptibility to natural hazards.
Figure 22. Proposed Residential Land Use Map, North Caloocan 2016 – 2025
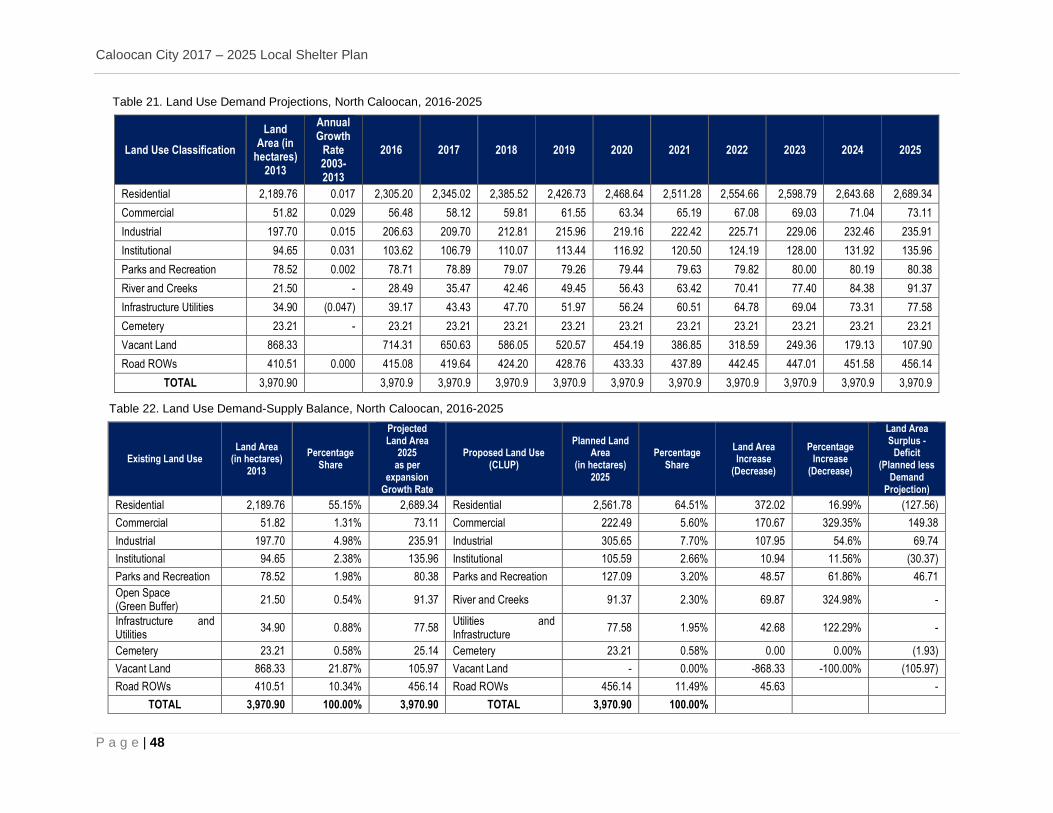
Caloocan City 2017 – 2025 Local Shelter Plan
P a g e | 48
Table 21. Land Use Demand Projections, North Caloocan, 2016-2025
Land Use Classification
Land Area (in
hectares) 2013
Annual Growth
Rate 2003-2013
2016 2017 2018 2019 2020 2021 2022 2023 2024 2025
Residential 2,189.76 0.017 2,305.20 2,345.02 2,385.52 2,426.73 2,468.64 2,511.28 2,554.66 2,598.79 2,643.68 2,689.34
Commercial 51.82 0.029 56.48 58.12 59.81 61.55 63.34 65.19 67.08 69.03 71.04 73.11
Industrial 197.70 0.015 206.63 209.70 212.81 215.96 219.16 222.42 225.71 229.06 232.46 235.91
Institutional 94.65 0.031 103.62 106.79 110.07 113.44 116.92 120.50 124.19 128.00 131.92 135.96
Parks and Recreation 78.52 0.002 78.71 78.89 79.07 79.26 79.44 79.63 79.82 80.00 80.19 80.38
River and Creeks 21.50 - 28.49 35.47 42.46 49.45 56.43 63.42 70.41 77.40 84.38 91.37
Infrastructure Utilities 34.90 (0.047) 39.17 43.43 47.70 51.97 56.24 60.51 64.78 69.04 73.31 77.58
Cemetery 23.21 - 23.21 23.21 23.21 23.21 23.21 23.21 23.21 23.21 23.21 23.21
Vacant Land 868.33 714.31 650.63 586.05 520.57 454.19 386.85 318.59 249.36 179.13 107.90
Road ROWs 410.51 0.000 415.08 419.64 424.20 428.76 433.33 437.89 442.45 447.01 451.58 456.14
TOTAL 3,970.90 3,970.9 3,970.9 3,970.9 3,970.9 3,970.9 3,970.9 3,970.9 3,970.9 3,970.9 3,970.9
Table 22. Land Use Demand-Supply Balance, North Caloocan, 2016-2025
Existing Land Use Land Area
(in hectares) 2013
Percentage Share
Projected Land Area
2025 as per
expansion Growth Rate
Proposed Land Use (CLUP)
Planned Land Area
(in hectares) 2025
Percentage Share
Land Area Increase
(Decrease)
Percentage Increase
(Decrease)
Land Area Surplus -
Deficit (Planned less
Demand Projection)
Residential 2,189.76 55.15% 2,689.34 Residential 2,561.78 64.51% 372.02 16.99% (127.56)
Commercial 51.82 1.31% 73.11 Commercial 222.49 5.60% 170.67 329.35% 149.38
Industrial 197.70 4.98% 235.91 Industrial 305.65 7.70% 107.95 54.6% 69.74
Institutional 94.65 2.38% 135.96 Institutional 105.59 2.66% 10.94 11.56% (30.37)
Parks and Recreation 78.52 1.98% 80.38 Parks and Recreation 127.09 3.20% 48.57 61.86% 46.71
Open Space (Green Buffer)
21.50 0.54% 91.37 River and Creeks 91.37 2.30% 69.87 324.98% -
Infrastructure and Utilities
34.90 0.88% 77.58 Utilities and Infrastructure
77.58 1.95% 42.68 122.29% -
Cemetery 23.21 0.58% 25.14 Cemetery 23.21 0.58% 0.00 0.00% (1.93)
Vacant Land 868.33 21.87% 105.97 Vacant Land - 0.00% -868.33 -100.00% (105.97)
Road ROWs 410.51 10.34% 456.14 Road ROWs 456.14 11.49% 45.63 -
TOTAL 3,970.90 100.00% 3,970.90 TOTAL 3,970.90 100.00%
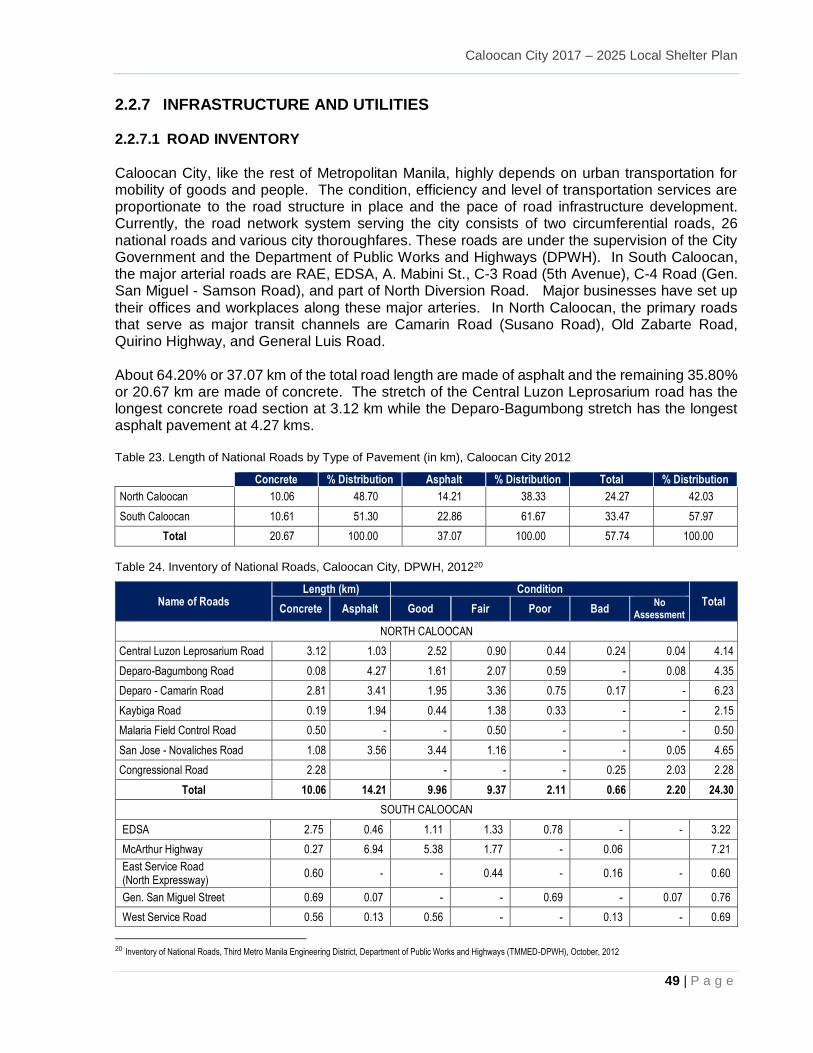
Caloocan City 2017 – 2025 Local Shelter Plan
49 | P a g e
2.2.7 INFRASTRUCTURE AND UTILITIES 2.2.7.1 ROAD INVENTORY
Caloocan City, like the rest of Metropolitan Manila, highly depends on urban transportation for mobility of goods and people. The condition, efficiency and level of transportation services are proportionate to the road structure in place and the pace of road infrastructure development. Currently, the road network system serving the city consists of two circumferential roads, 26 national roads and various city thoroughfares. These roads are under the supervision of the City Government and the Department of Public Works and Highways (DPWH). In South Caloocan, the major arterial roads are RAE, EDSA, A. Mabini St., C-3 Road (5th Avenue), C-4 Road (Gen. San Miguel - Samson Road), and part of North Diversion Road. Major businesses have set up their offices and workplaces along these major arteries. In North Caloocan, the primary roads that serve as major transit channels are Camarin Road (Susano Road), Old Zabarte Road, Quirino Highway, and General Luis Road. About 64.20% or 37.07 km of the total road length are made of asphalt and the remaining 35.80% or 20.67 km are made of concrete. The stretch of the Central Luzon Leprosarium road has the longest concrete road section at 3.12 km while the Deparo-Bagumbong stretch has the longest asphalt pavement at 4.27 kms. Table 23. Length of National Roads by Type of Pavement (in km), Caloocan City 2012
Concrete % Distribution Asphalt % Distribution Total % Distribution
North Caloocan 10.06 48.70 14.21 38.33 24.27 42.03
South Caloocan 10.61 51.30 22.86 61.67 33.47 57.97
Total 20.67 100.00 37.07 100.00 57.74 100.00
Table 24. Inventory of National Roads, Caloocan City, DPWH, 201220
Name of Roads Length (km) Condition
Total Concrete Asphalt Good Fair Poor Bad
No Assessment
NORTH CALOOCAN
Central Luzon Leprosarium Road 3.12 1.03 2.52 0.90 0.44 0.24 0.04 4.14
Deparo-Bagumbong Road 0.08 4.27 1.61 2.07 0.59 - 0.08 4.35
Deparo - Camarin Road 2.81 3.41 1.95 3.36 0.75 0.17 - 6.23
Kaybiga Road 0.19 1.94 0.44 1.38 0.33 - - 2.15
Malaria Field Control Road 0.50 - - 0.50 - - - 0.50
San Jose - Novaliches Road 1.08 3.56 3.44 1.16 - - 0.05 4.65
Congressional Road 2.28 - - - 0.25 2.03 2.28
Total 10.06 14.21 9.96 9.37 2.11 0.66 2.20 24.30
SOUTH CALOOCAN
EDSA 2.75 0.46 1.11 1.33 0.78 - - 3.22
McArthur Highway 0.27 6.94 5.38 1.77 - 0.06 7.21
East Service Road (North Expressway)
0.60 - - 0.44 - 0.16 - 0.60
Gen. San Miguel Street 0.69 0.07 - - 0.69 - 0.07 0.76
West Service Road 0.56 0.13 0.56 - - 0.13 - 0.69
20 Inventory of National Roads, Third Metro Manila Engineering District, Department of Public Works and Highways (TMMED-DPWH), October, 2012
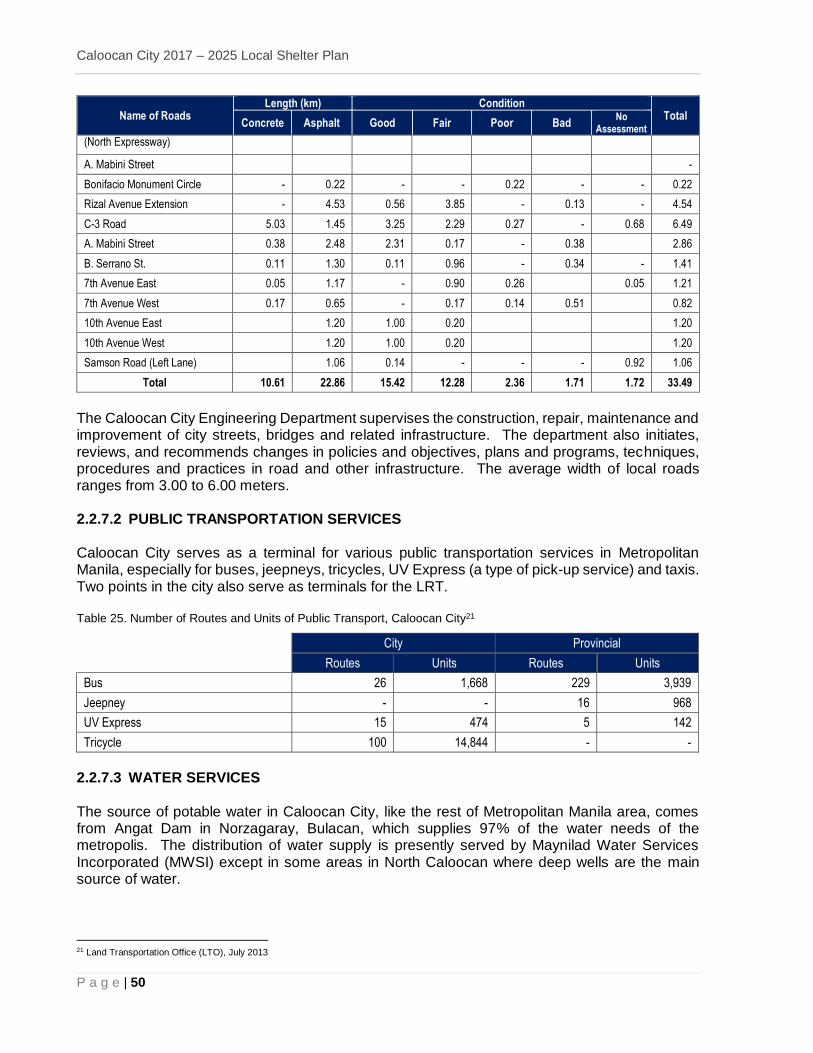
Caloocan City 2017 – 2025 Local Shelter Plan
P a g e | 50
Name of Roads Length (km) Condition
Total Concrete Asphalt Good Fair Poor Bad
No Assessment
(North Expressway)
A. Mabini Street -
Bonifacio Monument Circle - 0.22 - - 0.22 - - 0.22
Rizal Avenue Extension - 4.53 0.56 3.85 - 0.13 - 4.54
C-3 Road 5.03 1.45 3.25 2.29 0.27 - 0.68 6.49
A. Mabini Street 0.38 2.48 2.31 0.17 - 0.38 2.86
B. Serrano St. 0.11 1.30 0.11 0.96 - 0.34 - 1.41
7th Avenue East 0.05 1.17 - 0.90 0.26 0.05 1.21
7th Avenue West 0.17 0.65 - 0.17 0.14 0.51 0.82
10th Avenue East 1.20 1.00 0.20 1.20
10th Avenue West 1.20 1.00 0.20 1.20
Samson Road (Left Lane) 1.06 0.14 - - - 0.92 1.06
Total 10.61 22.86 15.42 12.28 2.36 1.71 1.72 33.49
The Caloocan City Engineering Department supervises the construction, repair, maintenance and improvement of city streets, bridges and related infrastructure. The department also initiates, reviews, and recommends changes in policies and objectives, plans and programs, techniques, procedures and practices in road and other infrastructure. The average width of local roads ranges from 3.00 to 6.00 meters. 2.2.7.2 PUBLIC TRANSPORTATION SERVICES Caloocan City serves as a terminal for various public transportation services in Metropolitan Manila, especially for buses, jeepneys, tricycles, UV Express (a type of pick-up service) and taxis. Two points in the city also serve as terminals for the LRT. Table 25. Number of Routes and Units of Public Transport, Caloocan City21
City Provincial
Routes Units Routes Units
Bus 26 1,668 229 3,939
Jeepney - - 16 968
UV Express 15 474 5 142
Tricycle 100 14,844 - -
2.2.7.3 WATER SERVICES
The source of potable water in Caloocan City, like the rest of Metropolitan Manila area, comes from Angat Dam in Norzagaray, Bulacan, which supplies 97% of the water needs of the metropolis. The distribution of water supply is presently served by Maynilad Water Services Incorporated (MWSI) except in some areas in North Caloocan where deep wells are the main source of water.
21 Land Transportation Office (LTO), July 2013
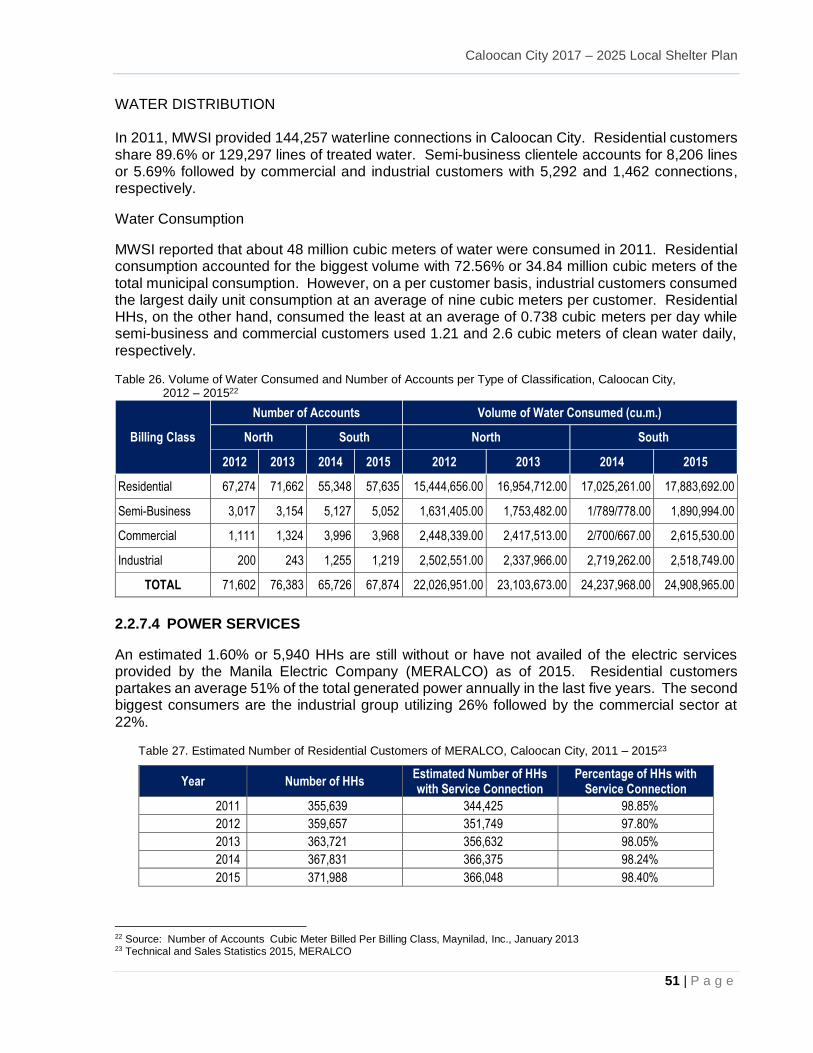
Caloocan City 2017 – 2025 Local Shelter Plan
51 | P a g e
WATER DISTRIBUTION In 2011, MWSI provided 144,257 waterline connections in Caloocan City. Residential customers share 89.6% or 129,297 lines of treated water. Semi-business clientele accounts for 8,206 lines or 5.69% followed by commercial and industrial customers with 5,292 and 1,462 connections, respectively.
Water Consumption
MWSI reported that about 48 million cubic meters of water were consumed in 2011. Residential consumption accounted for the biggest volume with 72.56% or 34.84 million cubic meters of the total municipal consumption. However, on a per customer basis, industrial customers consumed the largest daily unit consumption at an average of nine cubic meters per customer. Residential HHs, on the other hand, consumed the least at an average of 0.738 cubic meters per day while semi-business and commercial customers used 1.21 and 2.6 cubic meters of clean water daily, respectively.
Table 26. Volume of Water Consumed and Number of Accounts per Type of Classification, Caloocan City, 2012 – 201522
Billing Class
Number of Accounts Volume of Water Consumed (cu.m.)
North South North South
2012 2013 2014 2015 2012 2013 2014 2015
Residential 67,274 71,662 55,348 57,635 15,444,656.00 16,954,712.00 17,025,261.00 17,883,692.00
Semi-Business 3,017 3,154 5,127 5,052 1,631,405.00 1,753,482.00 1/789/778.00 1,890,994.00
Commercial 1,111 1,324 3,996 3,968 2,448,339.00 2,417,513.00 2/700/667.00 2,615,530.00
Industrial 200 243 1,255 1,219 2,502,551.00 2,337,966.00 2,719,262.00 2,518,749.00
TOTAL 71,602 76,383 65,726 67,874 22,026,951.00 23,103,673.00 24,237,968.00 24,908,965.00
2.2.7.4 POWER SERVICES
An estimated 1.60% or 5,940 HHs are still without or have not availed of the electric services provided by the Manila Electric Company (MERALCO) as of 2015. Residential customers partakes an average 51% of the total generated power annually in the last five years. The second biggest consumers are the industrial group utilizing 26% followed by the commercial sector at 22%. Table 27. Estimated Number of Residential Customers of MERALCO, Caloocan City, 2011 – 201523
Year Number of HHs Estimated Number of HHs with Service Connection
Percentage of HHs with Service Connection
2011 355,639 344,425 98.85%
2012 359,657 351,749 97.80%
2013 363,721 356,632 98.05%
2014 367,831 366,375 98.24%
2015 371,988 366,048 98.40%
22 Source: Number of Accounts Cubic Meter Billed Per Billing Class, Maynilad, Inc., January 2013 23 Technical and Sales Statistics 2015, MERALCO
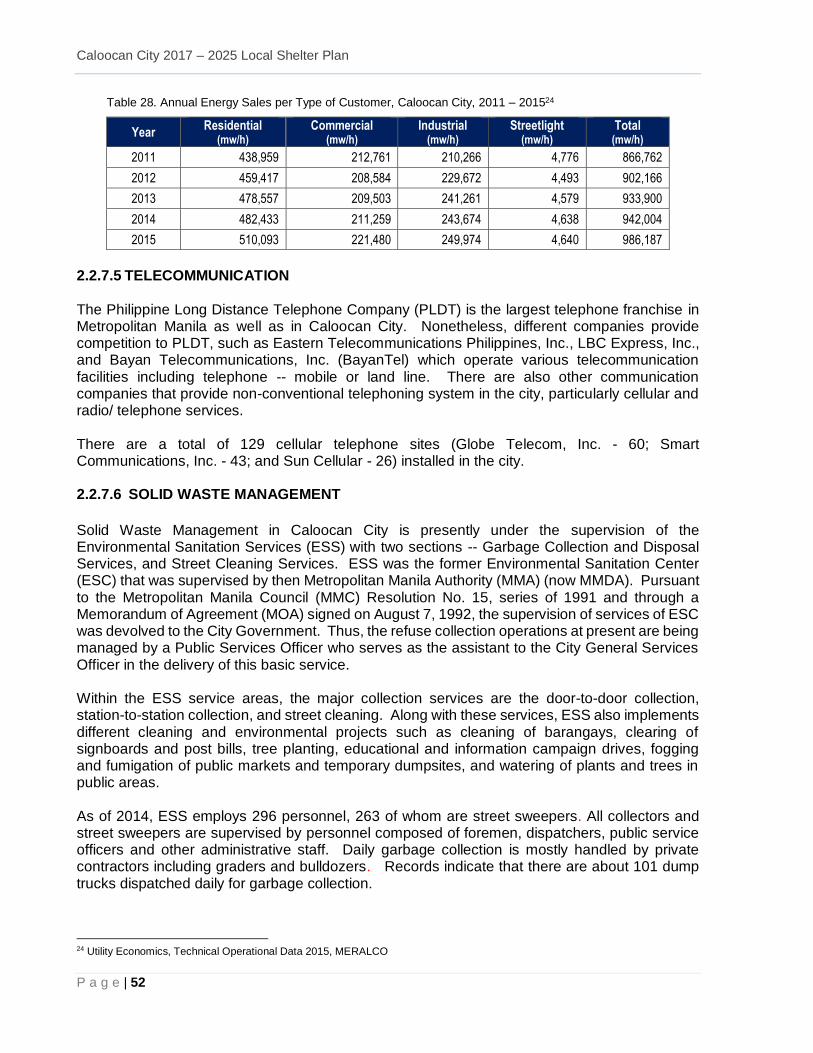
Caloocan City 2017 – 2025 Local Shelter Plan
P a g e | 52
Table 28. Annual Energy Sales per Type of Customer, Caloocan City, 2011 – 201524
Year Residential
(mw/h) Commercial
(mw/h) Industrial
(mw/h) Streetlight
(mw/h) Total
(mw/h)
2011 438,959 212,761 210,266 4,776 866,762
2012 459,417 208,584 229,672 4,493 902,166
2013 478,557 209,503 241,261 4,579 933,900
2014 482,433 211,259 243,674 4,638 942,004
2015 510,093 221,480 249,974 4,640 986,187
2.2.7.5 TELECOMMUNICATION The Philippine Long Distance Telephone Company (PLDT) is the largest telephone franchise in Metropolitan Manila as well as in Caloocan City. Nonetheless, different companies provide competition to PLDT, such as Eastern Telecommunications Philippines, Inc., LBC Express, Inc., and Bayan Telecommunications, Inc. (BayanTel) which operate various telecommunication facilities including telephone -- mobile or land line. There are also other communication companies that provide non-conventional telephoning system in the city, particularly cellular and radio/ telephone services. There are a total of 129 cellular telephone sites (Globe Telecom, Inc. - 60; Smart Communications, Inc. - 43; and Sun Cellular - 26) installed in the city. 2.2.7.6 SOLID WASTE MANAGEMENT
Solid Waste Management in Caloocan City is presently under the supervision of the Environmental Sanitation Services (ESS) with two sections -- Garbage Collection and Disposal Services, and Street Cleaning Services. ESS was the former Environmental Sanitation Center (ESC) that was supervised by then Metropolitan Manila Authority (MMA) (now MMDA). Pursuant to the Metropolitan Manila Council (MMC) Resolution No. 15, series of 1991 and through a Memorandum of Agreement (MOA) signed on August 7, 1992, the supervision of services of ESC was devolved to the City Government. Thus, the refuse collection operations at present are being managed by a Public Services Officer who serves as the assistant to the City General Services Officer in the delivery of this basic service. Within the ESS service areas, the major collection services are the door-to-door collection, station-to-station collection, and street cleaning. Along with these services, ESS also implements different cleaning and environmental projects such as cleaning of barangays, clearing of signboards and post bills, tree planting, educational and information campaign drives, fogging and fumigation of public markets and temporary dumpsites, and watering of plants and trees in public areas.
As of 2014, ESS employs 296 personnel, 263 of whom are street sweepers. All collectors and street sweepers are supervised by personnel composed of foremen, dispatchers, public service officers and other administrative staff. Daily garbage collection is mostly handled by private contractors including graders and bulldozers. Records indicate that there are about 101 dump trucks dispatched daily for garbage collection.
24 Utility Economics, Technical Operational Data 2015, MERALCO
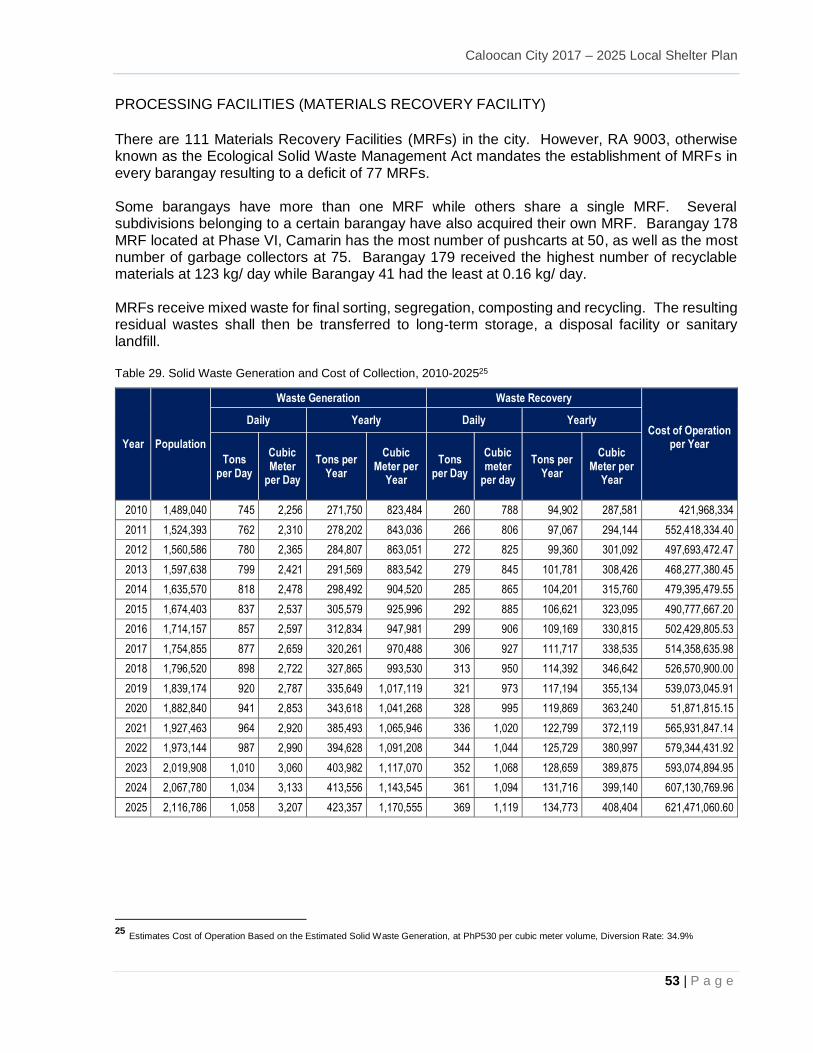
Caloocan City 2017 – 2025 Local Shelter Plan
53 | P a g e
PROCESSING FACILITIES (MATERIALS RECOVERY FACILITY)
There are 111 Materials Recovery Facilities (MRFs) in the city. However, RA 9003, otherwise known as the Ecological Solid Waste Management Act mandates the establishment of MRFs in every barangay resulting to a deficit of 77 MRFs. Some barangays have more than one MRF while others share a single MRF. Several subdivisions belonging to a certain barangay have also acquired their own MRF. Barangay 178 MRF located at Phase VI, Camarin has the most number of pushcarts at 50, as well as the most number of garbage collectors at 75. Barangay 179 received the highest number of recyclable materials at 123 kg/ day while Barangay 41 had the least at 0.16 kg/ day. MRFs receive mixed waste for final sorting, segregation, composting and recycling. The resulting residual wastes shall then be transferred to long-term storage, a disposal facility or sanitary landfill. Table 29. Solid Waste Generation and Cost of Collection, 2010-202525
Year Population
Waste Generation Waste Recovery
Cost of Operation per Year
Daily Yearly Daily Yearly
Tons per Day
Cubic Meter
per Day
Tons per Year
Cubic Meter per
Year
Tons per Day
Cubic meter
per day
Tons per Year
Cubic Meter per
Year
2010 1,489,040 745 2,256 271,750 823,484 260 788 94,902 287,581 421,968,334
2011 1,524,393 762 2,310 278,202 843,036 266 806 97,067 294,144 552,418,334.40
2012 1,560,586 780 2,365 284,807 863,051 272 825 99,360 301,092 497,693,472.47
2013 1,597,638 799 2,421 291,569 883,542 279 845 101,781 308,426 468,277,380.45
2014 1,635,570 818 2,478 298,492 904,520 285 865 104,201 315,760 479,395,479.55
2015 1,674,403 837 2,537 305,579 925,996 292 885 106,621 323,095 490,777,667.20
2016 1,714,157 857 2,597 312,834 947,981 299 906 109,169 330,815 502,429,805.53
2017 1,754,855 877 2,659 320,261 970,488 306 927 111,717 338,535 514,358,635.98
2018 1,796,520 898 2,722 327,865 993,530 313 950 114,392 346,642 526,570,900.00
2019 1,839,174 920 2,787 335,649 1,017,119 321 973 117,194 355,134 539,073,045.91
2020 1,882,840 941 2,853 343,618 1,041,268 328 995 119,869 363,240 51,871,815.15
2021 1,927,463 964 2,920 385,493 1,065,946 336 1,020 122,799 372,119 565,931,847.14
2022 1,973,144 987 2,990 394,628 1,091,208 344 1,044 125,729 380,997 579,344,431.92
2023 2,019,908 1,010 3,060 403,982 1,117,070 352 1,068 128,659 389,875 593,074,894.95
2024 2,067,780 1,034 3,133 413,556 1,143,545 361 1,094 131,716 399,140 607,130,769.96
2025 2,116,786 1,058 3,207 423,357 1,170,555 369 1,119 134,773 408,404 621,471,060.60
25 Estimates Cost of Operation Based on the Estimated Solid Waste Generation, at PhP530 per cubic meter volume, Diversion Rate: 34.9%
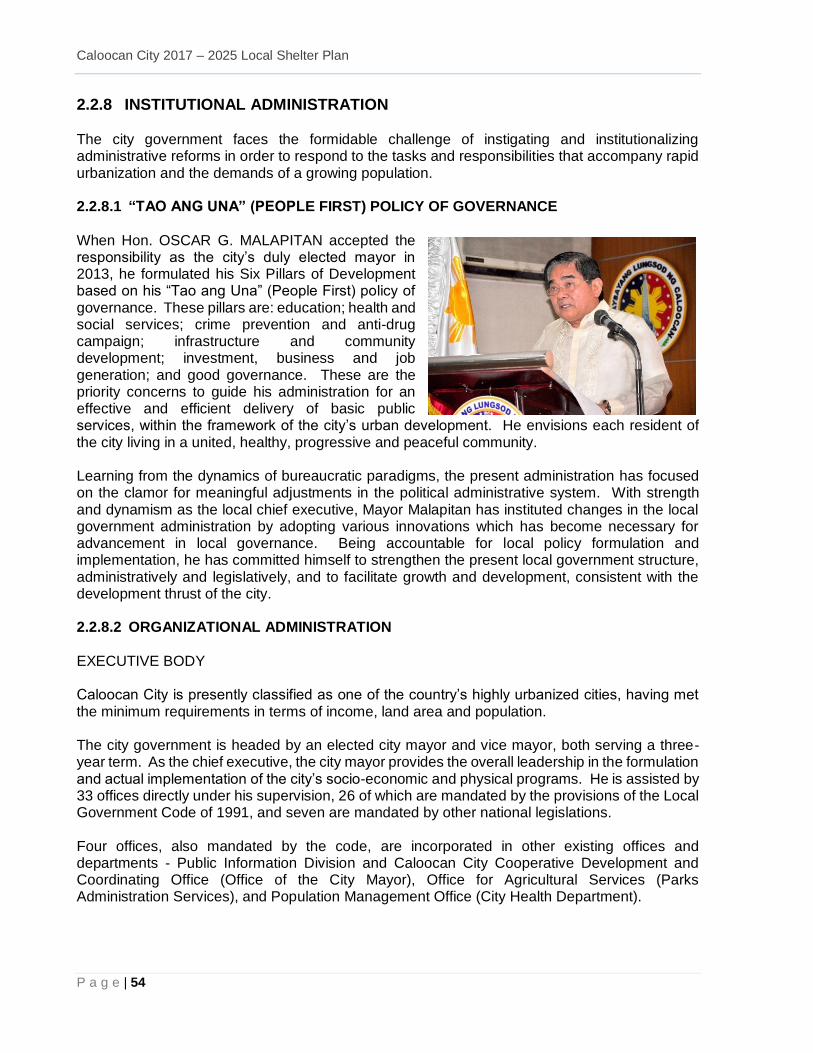
Caloocan City 2017 – 2025 Local Shelter Plan
P a g e | 54
2.2.8 INSTITUTIONAL ADMINISTRATION The city government faces the formidable challenge of instigating and institutionalizing administrative reforms in order to respond to the tasks and responsibilities that accompany rapid urbanization and the demands of a growing population. 2.2.8.1 “TAO ANG UNA” (PEOPLE FIRST) POLICY OF GOVERNANCE
When Hon. OSCAR G. MALAPITAN accepted the responsibility as the city’s duly elected mayor in 2013, he formulated his Six Pillars of Development based on his “Tao ang Una” (People First) policy of governance. These pillars are: education; health and social services; crime prevention and anti-drug campaign; infrastructure and community development; investment, business and job generation; and good governance. These are the priority concerns to guide his administration for an effective and efficient delivery of basic public services, within the framework of the city’s urban development. He envisions each resident of the city living in a united, healthy, progressive and peaceful community. Learning from the dynamics of bureaucratic paradigms, the present administration has focused on the clamor for meaningful adjustments in the political administrative system. With strength and dynamism as the local chief executive, Mayor Malapitan has instituted changes in the local government administration by adopting various innovations which has become necessary for advancement in local governance. Being accountable for local policy formulation and implementation, he has committed himself to strengthen the present local government structure, administratively and legislatively, and to facilitate growth and development, consistent with the development thrust of the city. 2.2.8.2 ORGANIZATIONAL ADMINISTRATION
EXECUTIVE BODY Caloocan City is presently classified as one of the country’s highly urbanized cities, having met the minimum requirements in terms of income, land area and population. The city government is headed by an elected city mayor and vice mayor, both serving a three-year term. As the chief executive, the city mayor provides the overall leadership in the formulation and actual implementation of the city’s socio-economic and physical programs. He is assisted by 33 offices directly under his supervision, 26 of which are mandated by the provisions of the Local Government Code of 1991, and seven are mandated by other national legislations. Four offices, also mandated by the code, are incorporated in other existing offices and departments - Public Information Division and Caloocan City Cooperative Development and Coordinating Office (Office of the City Mayor), Office for Agricultural Services (Parks Administration Services), and Population Management Office (City Health Department).
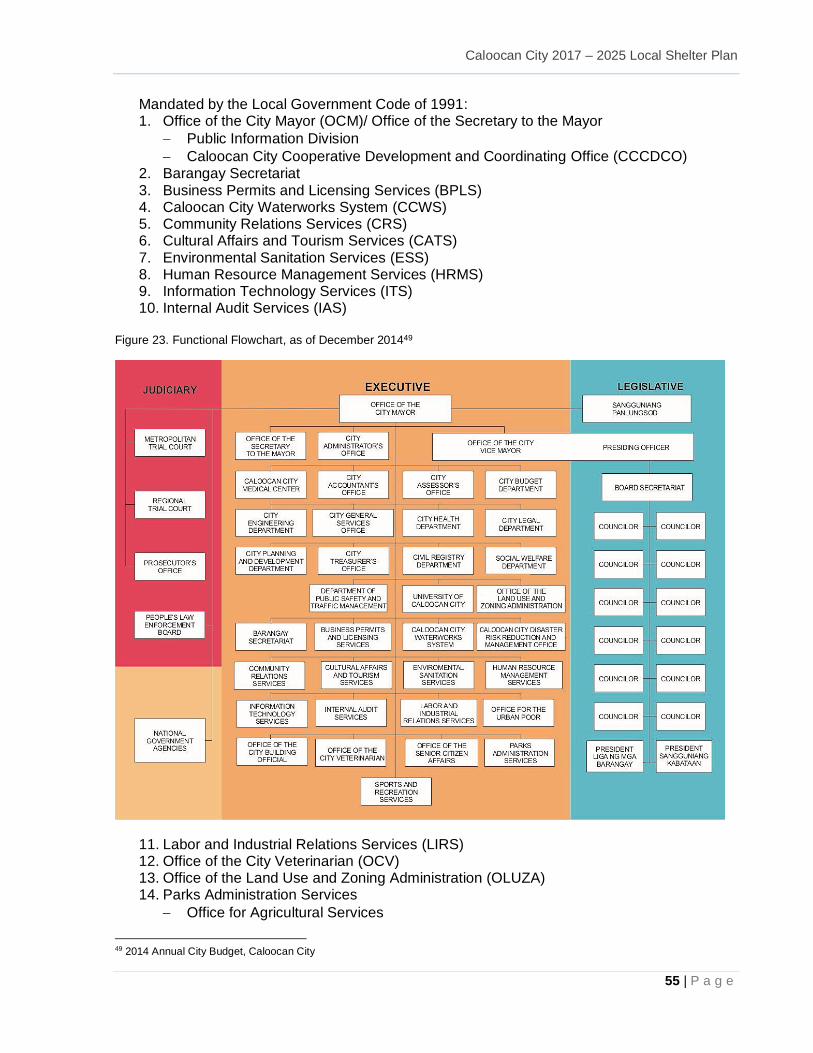
Caloocan City 2017 – 2025 Local Shelter Plan
55 | P a g e
Mandated by the Local Government Code of 1991: 1. Office of the City Mayor (OCM)/ Office of the Secretary to the Mayor
Public Information Division
Caloocan City Cooperative Development and Coordinating Office (CCCDCO) 2. Barangay Secretariat 3. Business Permits and Licensing Services (BPLS) 4. Caloocan City Waterworks System (CCWS) 5. Community Relations Services (CRS) 6. Cultural Affairs and Tourism Services (CATS) 7. Environmental Sanitation Services (ESS) 8. Human Resource Management Services (HRMS) 9. Information Technology Services (ITS) 10. Internal Audit Services (IAS)
Figure 23. Functional Flowchart, as of December 201449
11. Labor and Industrial Relations Services (LIRS) 12. Office of the City Veterinarian (OCV) 13. Office of the Land Use and Zoning Administration (OLUZA) 14. Parks Administration Services
Office for Agricultural Services
49 2014 Annual City Budget, Caloocan City
Caloocan City 2017 – 2025 Local Shelter Plan
P a g e | 56
15. Sports and Recreation Services 16. City Accountant’s Office 17. City Administrator’s Office 18. City Assessor’s Office 19. City Budget Department (CBD) 20. City Engineering Department 21. City General Services Office (CGSO) 22. City Health Department (CHD)
Population Management Office 23. City Legal Department 24. City Planning and Development Department (CPDD) 25. City Treasurer’s Office (CTO) 26. Civil Registry Department (CRD) 27. City Social Welfare Department (CSWD)
Mandated by other national legislations:
28. Caloocan City Disaster Risk Reduction and Management Office (CCDRRMO) 29. Caloocan City Medical Center (CCMC) 30. Department of Public Safety and Traffic Management (DPSTM) 31. Office for the Urban Poor (OUP) 32. Office of the City Building Official (OCBO) 33. Office of the Senior Citizens Affairs (OSCA) 34. University of Caloocan City (UCC)
SANGGUNIANG PANLUNGSOD The Sangguniang Panlungsod, as the legislative body of the city, is headed by the City Vice-Mayor as the presiding officer. It has 12 elected councilors and two appointed sectoral representatives as its members, who are all serving the same term with that of the city mayor. The Secretariat Services of the Sangguniang Panlungsod provides assistance to the Legislative Services in its task of pursuing a legislative agenda. Through legislative research and further enactment of ordinances and passage of resolutions, such agenda ensures that matters tackled by the Sangguniang Panlungsod are responsive to the needs of the constituents. COMMITTEES, COUNCILS, BOARDS, TECHNICAL WORKING GROUPS (TWGs), TEAMS AND TASK FORCES To facilitate coordination and linkage systems between and among the different offices and departments, the city mayor had reorganized several multi-sectoral committees and local special bodies, each to undertake specific functions and activities. Most of these are project development, whose objectives are geared towards maximum utilization of the city's resources. The mandatory councils as per LGC of 1991 -- Bids and Awards Committee (BAC), City Development Council (CDC), City Health Board, City Peace and Order Council (POC), and City School Board, are all reorganized and reconstituted in accordance with the provisions of its respective republic acts. One of the important council created was the Caloocan City Disaster Risk Reduction and Management Council (CCDRRMC), it was organized pursuant to the provisions of RA No. 10121,
also known as the Philippine Disaster Risk Reduction and Management Act of 2010, which was passed on July 27, 2009. The council shall approve, monitor and evaluate the implementation of
Caloocan City 2017 – 2025 Local Shelter Plan
57 | P a g e
the Caloocan City Disaster Risk Reduction and Management Program (CCDRRMP). It would also ensure the integration of disaster risk reduction and climate change adaptation (DRR/ CCA) into the local development plans, programs and budgets. The following are the committees, councils, boards, technical working groups, teams and task forces created/ organized/ reorganized to perform specific functions through issuance of executive orders by the city mayor:
Social Development Sector
City People’s Law Enforcement Board (PLEB)
Caloocan City Acquired Immune Deficiency Syndrome (AIDS) Council
Caloocan City Anti-Drug Abuse Council (CADAC)
Caloocan City Barangay Bottom-Up Budgeting (BuB) Assessment Team
Caloocan City Census Coordinating Board
Caloocan City Committee on Subdivision, Housing and Memorial Park
Caloocan City Comprehensive Local Integration Program for Former New People’s Army (NPA) Rebels
Caloocan City Council for the Protection of Children (CCPC)
Caloocan City Gender GAD Focal Point System (CCGFPS)
Caloocan City GAD M&E Team
Caloocan City Health Board
Caloocan City Juvenile Justice and Welfare Council (JJWC) Project Management Team
Caloocan City Housing and Urban Development Board
Caloocan City Millennium Development Goals Family-based Actions for Children and their Environs in the Slums (MDG FACES) Project Team
Caloocan City Nutrition Committee and Caloocan City Nutrition Cluster
Caloocan City POC
Caloocan City Poverty Reduction Action Team (CCPRAT)
City Reach Out to Street Children Grievance Committee
Local Advisory Council (LAC) for the Implementation of the Pantawid Pamilyang Pilipino Program (4Ps)
Local Inter-Agency Committee (LIAC) for the Clearing and Relocation of Affected Families along the Waterways and Other Danger Areas in the City of Caloocan
LIAC for the Disposal and Proper Distribution of Non-Core Real Properties of the PNR located in Grace Park, Caloocan City
LIAC for the Disposal and Proper Distribution of Non-Core Real Properties of the PNR located in Sagrada Familia, Barangay 46, Caloocan City
LIAC for the Disposition of the Camarin Phase 1 and 2 Project for Socialized Housing to the Qualified Bonafide Occupants
LIAC for the Disposition of the Excluded 14 Hectares Socialized Housing Site from the Parcel of Land Reserved as Civic Center located in Camarin, Caloocan City
LIAC for the Disposition of the Manotok Property to Qualified Informal Settler Beneficiaries
LIAC to Provide the Overall Implementation of Mindanao Avenue Extension Segment 2C ROW Project in Caloocan City
LIAC to Provide the Overall Implementation of the NLEx, Harbor Link Segment 10 Exit Ramp in the City of Caloocan
LIAC to Provide the Overall Implementation of the NLEx, Phase 2 Project ROW and C-5 North Link Project Segment 10 in the City of Caloocan
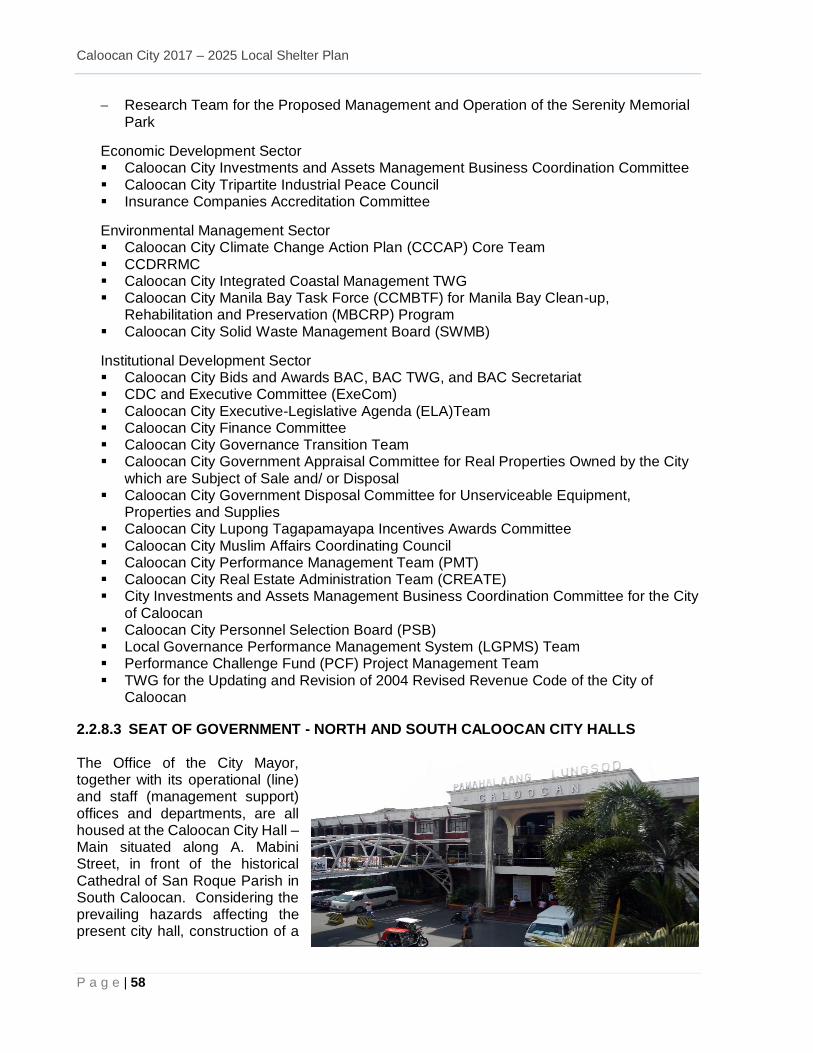
Caloocan City 2017 – 2025 Local Shelter Plan
P a g e | 58
Research Team for the Proposed Management and Operation of the Serenity Memorial Park
Economic Development Sector Caloocan City Investments and Assets Management Business Coordination Committee Caloocan City Tripartite Industrial Peace Council Insurance Companies Accreditation Committee
Environmental Management Sector Caloocan City Climate Change Action Plan (CCCAP) Core Team CCDRRMC Caloocan City Integrated Coastal Management TWG Caloocan City Manila Bay Task Force (CCMBTF) for Manila Bay Clean-up,
Rehabilitation and Preservation (MBCRP) Program Caloocan City Solid Waste Management Board (SWMB)
Institutional Development Sector Caloocan City Bids and Awards BAC, BAC TWG, and BAC Secretariat CDC and Executive Committee (ExeCom) Caloocan City Executive-Legislative Agenda (ELA)Team Caloocan City Finance Committee Caloocan City Governance Transition Team Caloocan City Government Appraisal Committee for Real Properties Owned by the City
which are Subject of Sale and/ or Disposal Caloocan City Government Disposal Committee for Unserviceable Equipment,
Properties and Supplies Caloocan City Lupong Tagapamayapa Incentives Awards Committee Caloocan City Muslim Affairs Coordinating Council Caloocan City Performance Management Team (PMT) Caloocan City Real Estate Administration Team (CREATE) City Investments and Assets Management Business Coordination Committee for the City
of Caloocan Caloocan City Personnel Selection Board (PSB) Local Governance Performance Management System (LGPMS) Team Performance Challenge Fund (PCF) Project Management Team TWG for the Updating and Revision of 2004 Revised Revenue Code of the City of
Caloocan
2.2.8.3 SEAT OF GOVERNMENT - NORTH AND SOUTH CALOOCAN CITY HALLS The Office of the City Mayor, together with its operational (line) and staff (management support) offices and departments, are all housed at the Caloocan City Hall – Main situated along A. Mabini Street, in front of the historical Cathedral of San Roque Parish in South Caloocan. Considering the prevailing hazards affecting the present city hall, construction of a
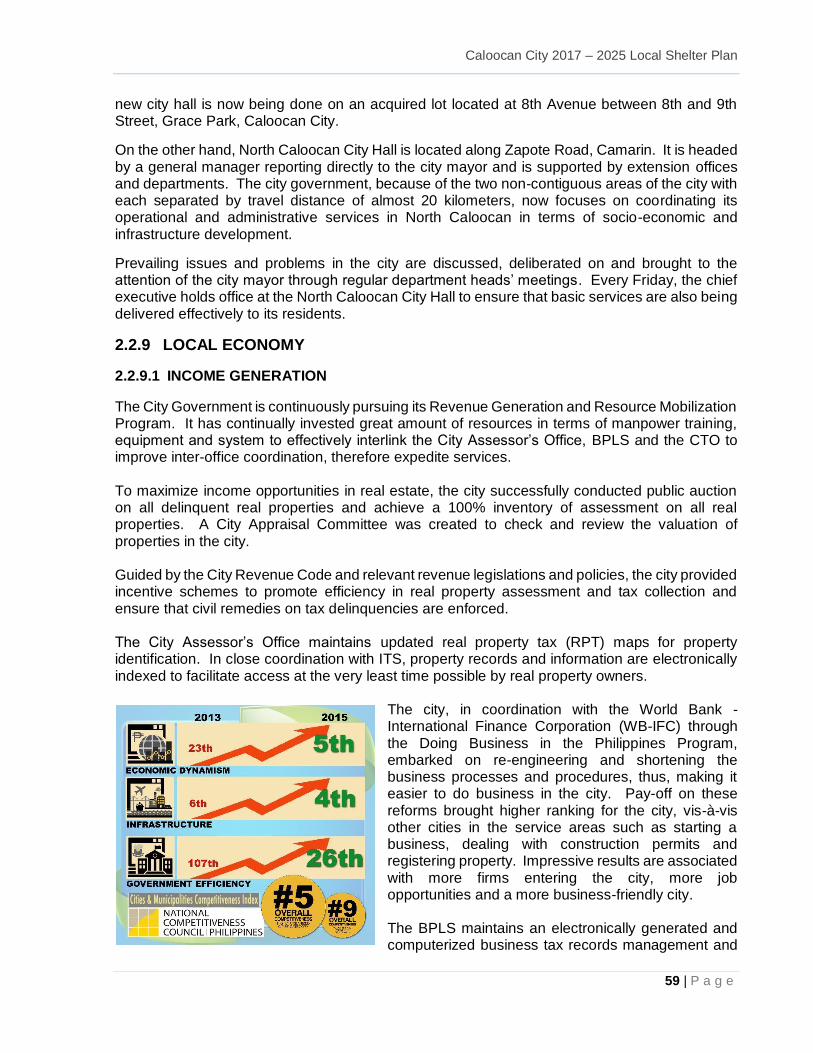
Caloocan City 2017 – 2025 Local Shelter Plan
59 | P a g e
new city hall is now being done on an acquired lot located at 8th Avenue between 8th and 9th Street, Grace Park, Caloocan City.
On the other hand, North Caloocan City Hall is located along Zapote Road, Camarin. It is headed by a general manager reporting directly to the city mayor and is supported by extension offices and departments. The city government, because of the two non-contiguous areas of the city with each separated by travel distance of almost 20 kilometers, now focuses on coordinating its operational and administrative services in North Caloocan in terms of socio-economic and infrastructure development.
Prevailing issues and problems in the city are discussed, deliberated on and brought to the attention of the city mayor through regular department heads’ meetings. Every Friday, the chief executive holds office at the North Caloocan City Hall to ensure that basic services are also being delivered effectively to its residents.
2.2.9 LOCAL ECONOMY
2.2.9.1 INCOME GENERATION
The City Government is continuously pursuing its Revenue Generation and Resource Mobilization Program. It has continually invested great amount of resources in terms of manpower training, equipment and system to effectively interlink the City Assessor’s Office, BPLS and the CTO to improve inter-office coordination, therefore expedite services. To maximize income opportunities in real estate, the city successfully conducted public auction on all delinquent real properties and achieve a 100% inventory of assessment on all real properties. A City Appraisal Committee was created to check and review the valuation of properties in the city. Guided by the City Revenue Code and relevant revenue legislations and policies, the city provided incentive schemes to promote efficiency in real property assessment and tax collection and ensure that civil remedies on tax delinquencies are enforced. The City Assessor’s Office maintains updated real property tax (RPT) maps for property identification. In close coordination with ITS, property records and information are electronically indexed to facilitate access at the very least time possible by real property owners.
The city, in coordination with the World Bank - International Finance Corporation (WB-IFC) through the Doing Business in the Philippines Program, embarked on re-engineering and shortening the business processes and procedures, thus, making it easier to do business in the city. Pay-off on these reforms brought higher ranking for the city, vis-à-vis other cities in the service areas such as starting a business, dealing with construction permits and registering property. Impressive results are associated with more firms entering the city, more job opportunities and a more business-friendly city. The BPLS maintains an electronically generated and computerized business tax records management and
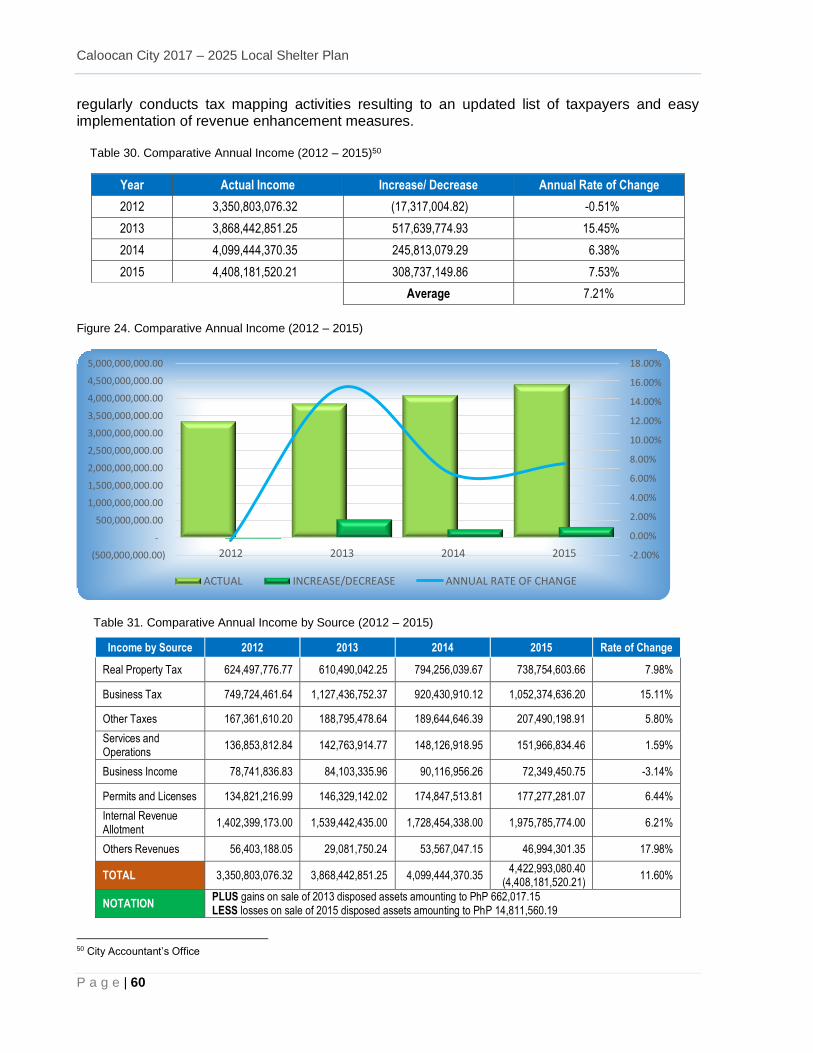
Caloocan City 2017 – 2025 Local Shelter Plan
P a g e | 60
regularly conducts tax mapping activities resulting to an updated list of taxpayers and easy implementation of revenue enhancement measures. Table 30. Comparative Annual Income (2012 – 2015)50
Year Actual Income Increase/ Decrease Annual Rate of Change
2012 3,350,803,076.32 (17,317,004.82) -0.51%
2013 3,868,442,851.25 517,639,774.93 15.45%
2014 4,099,444,370.35 245,813,079.29 6.38%
2015 4,408,181,520.21 308,737,149.86 7.53%
Average 7.21%
Figure 24. Comparative Annual Income (2012 – 2015)
Table 31. Comparative Annual Income by Source (2012 – 2015)
Income by Source 2012 2013 2014 2015 Rate of Change
Real Property Tax 624,497,776.77 610,490,042.25 794,256,039.67 738,754,603.66 7.98%
Business Tax 749,724,461.64 1,127,436,752.37 920,430,910.12 1,052,374,636.20 15.11%
Other Taxes 167,361,610.20 188,795,478.64 189,644,646.39 207,490,198.91 5.80%
Services and Operations
136,853,812.84 142,763,914.77 148,126,918.95 151,966,834.46 1.59%
Business Income 78,741,836.83 84,103,335.96 90,116,956.26 72,349,450.75 -3.14%
Permits and Licenses 134,821,216.99 146,329,142.02 174,847,513.81 177,277,281.07 6.44%
Internal Revenue Allotment
1,402,399,173.00 1,539,442,435.00 1,728,454,338.00 1,975,785,774.00 6.21%
Others Revenues 56,403,188.05 29,081,750.24 53,567,047.15 46,994,301.35 17.98%
TOTAL 3,350,803,076.32 3,868,442,851.25 4,099,444,370.35 4,422,993,080.40
(4,408,181,520.21) 11.60%
NOTATION PLUS gains on sale of 2013 disposed assets amounting to PhP 662,017.15 LESS losses on sale of 2015 disposed assets amounting to PhP 14,811,560.19
50 City Accountant’s Office
-2.00%
0.00%
2.00%
4.00%
6.00%
8.00%
10.00%
12.00%
14.00%
16.00%
18.00%
(500,000,000.00)
-
500,000,000.00
1,000,000,000.00
1,500,000,000.00
2,000,000,000.00
2,500,000,000.00
3,000,000,000.00
3,500,000,000.00
4,000,000,000.00
4,500,000,000.00
5,000,000,000.00
2012 2013 2014 2015
ACTUAL INCREASE/DECREASE ANNUAL RATE OF CHANGE
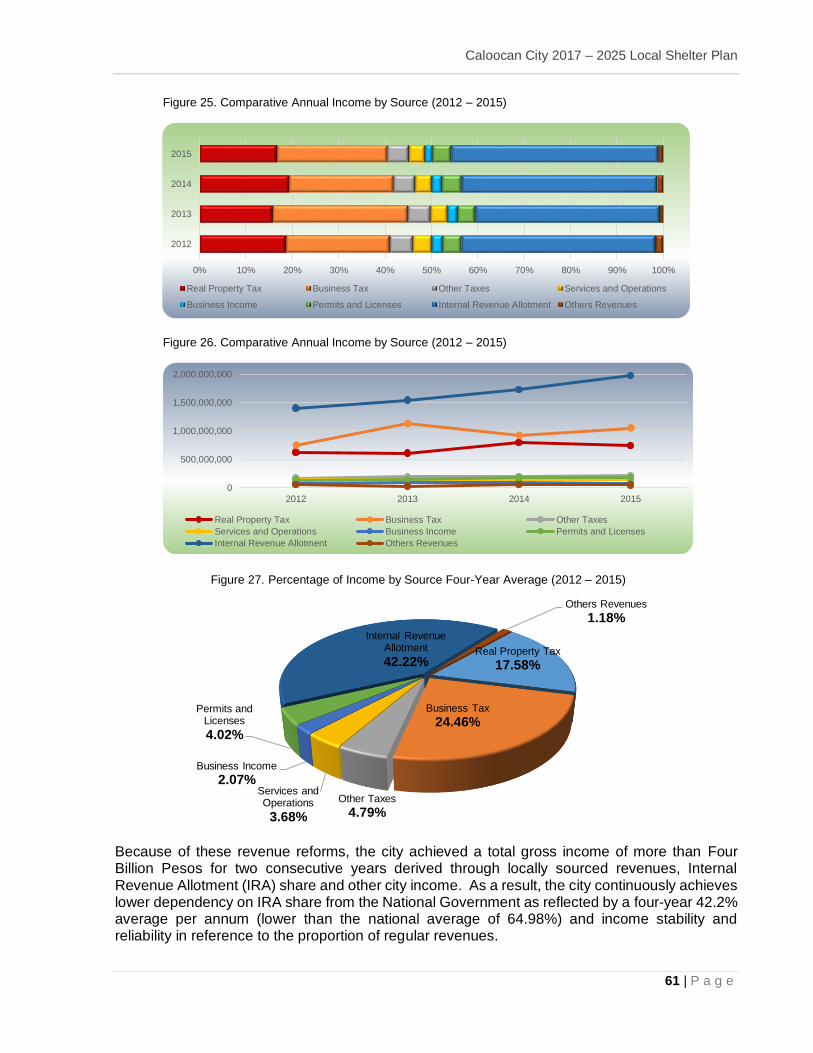
Caloocan City 2017 – 2025 Local Shelter Plan
61 | P a g e
Figure 25. Comparative Annual Income by Source (2012 – 2015)
Figure 26. Comparative Annual Income by Source (2012 – 2015)
Figure 27. Percentage of Income by Source Four-Year Average (2012 – 2015)
Because of these revenue reforms, the city achieved a total gross income of more than Four Billion Pesos for two consecutive years derived through locally sourced revenues, Internal Revenue Allotment (IRA) share and other city income. As a result, the city continuously achieves lower dependency on IRA share from the National Government as reflected by a four-year 42.2% average per annum (lower than the national average of 64.98%) and income stability and reliability in reference to the proportion of regular revenues.
0% 10% 20% 30% 40% 50% 60% 70% 80% 90% 100%
2012
2013
2014
2015
Real Property Tax Business Tax Other Taxes Services and Operations
Business Income Permits and Licenses Internal Revenue Allotment Others Revenues
0
500,000,000
1,000,000,000
1,500,000,000
2,000,000,000
2012 2013 2014 2015
Real Property Tax Business Tax Other Taxes
Services and Operations Business Income Permits and Licenses
Internal Revenue Allotment Others Revenues
Real Property Tax
17.58%
Business Tax
24.46%
Other Taxes
4.79%
Services and Operations
3.68%
Business Income
2.07%
Permits and Licenses
4.02%
Internal Revenue Allotment
42.22%
Others Revenues
1.18%
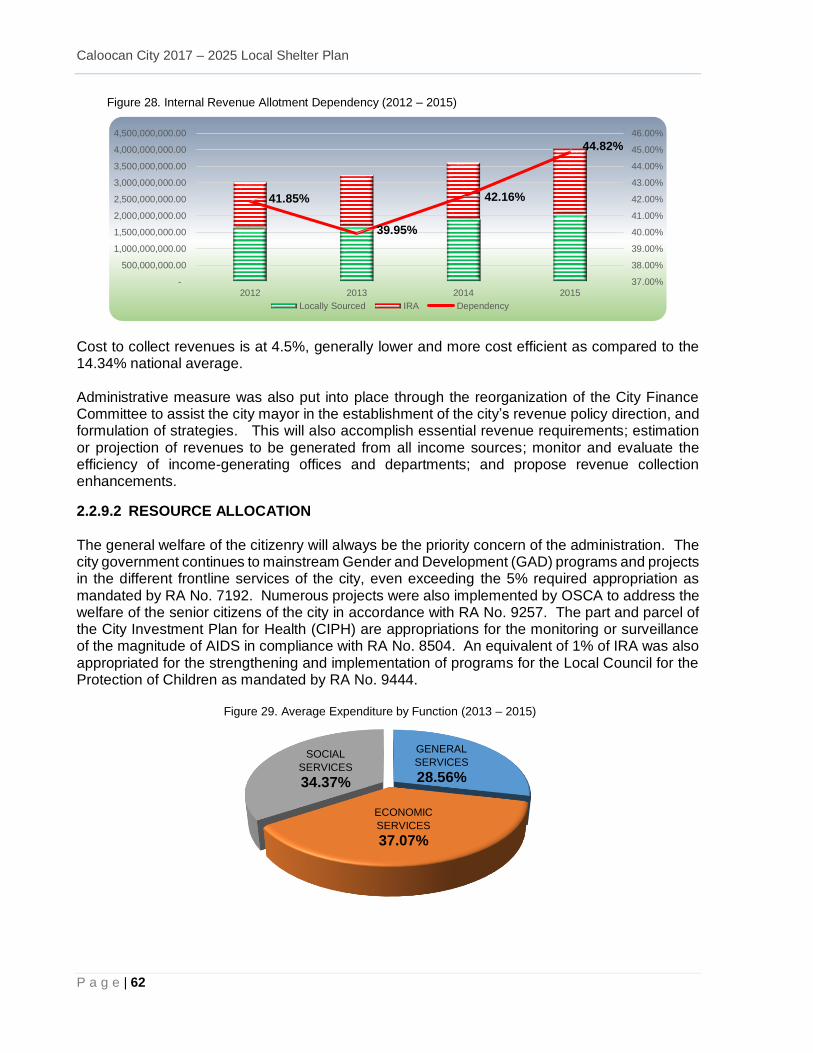
Caloocan City 2017 – 2025 Local Shelter Plan
P a g e | 62
Figure 28. Internal Revenue Allotment Dependency (2012 – 2015)
Cost to collect revenues is at 4.5%, generally lower and more cost efficient as compared to the 14.34% national average. Administrative measure was also put into place through the reorganization of the City Finance Committee to assist the city mayor in the establishment of the city’s revenue policy direction, and formulation of strategies. This will also accomplish essential revenue requirements; estimation or projection of revenues to be generated from all income sources; monitor and evaluate the efficiency of income-generating offices and departments; and propose revenue collection enhancements.
2.2.9.2 RESOURCE ALLOCATION The general welfare of the citizenry will always be the priority concern of the administration. The city government continues to mainstream Gender and Development (GAD) programs and projects in the different frontline services of the city, even exceeding the 5% required appropriation as mandated by RA No. 7192. Numerous projects were also implemented by OSCA to address the welfare of the senior citizens of the city in accordance with RA No. 9257. The part and parcel of the City Investment Plan for Health (CIPH) are appropriations for the monitoring or surveillance of the magnitude of AIDS in compliance with RA No. 8504. An equivalent of 1% of IRA was also appropriated for the strengthening and implementation of programs for the Local Council for the Protection of Children as mandated by RA No. 9444.
Figure 29. Average Expenditure by Function (2013 – 2015)
41.85%
39.95%
42.16%
44.82%
37.00%
38.00%
39.00%
40.00%
41.00%
42.00%
43.00%
44.00%
45.00%
46.00%
-
500,000,000.00
1,000,000,000.00
1,500,000,000.00
2,000,000,000.00
2,500,000,000.00
3,000,000,000.00
3,500,000,000.00
4,000,000,000.00
4,500,000,000.00
2012 2013 2014 2015
Locally Sourced IRA Dependency
GENERAL
SERVICES
28.56%
ECONOMIC
SERVICES
37.07%
SOCIAL
SERVICES
34.37%
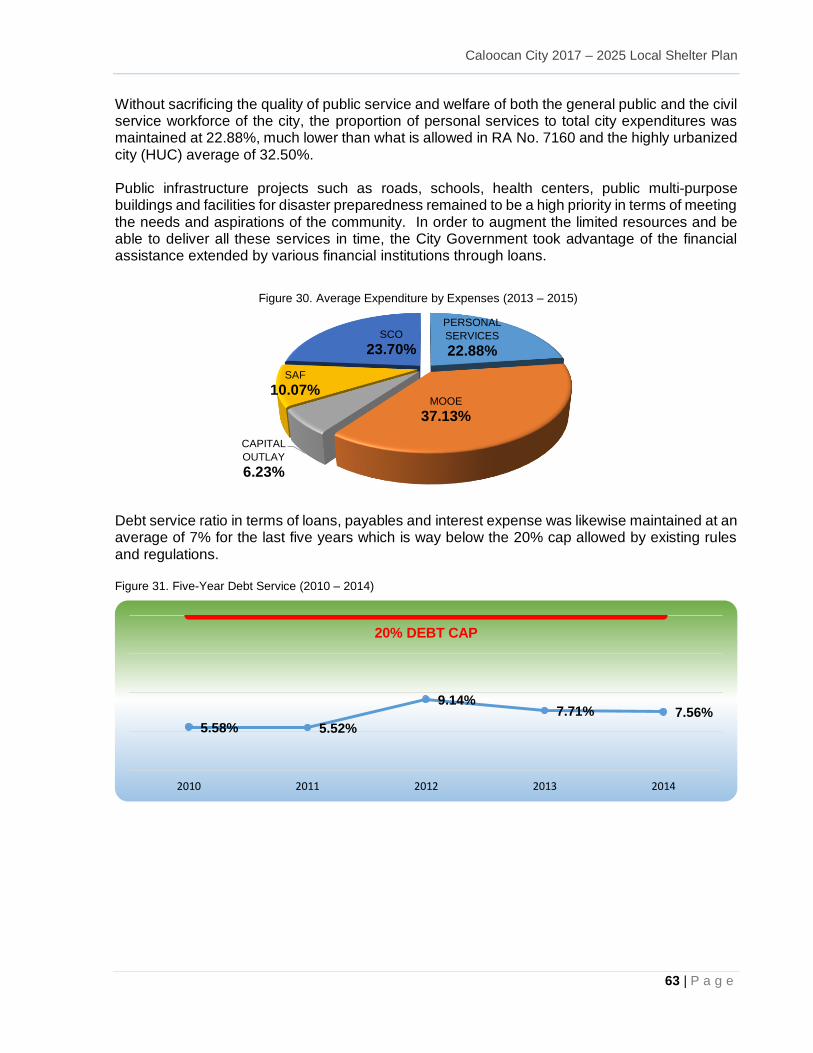
Caloocan City 2017 – 2025 Local Shelter Plan
63 | P a g e
Without sacrificing the quality of public service and welfare of both the general public and the civil service workforce of the city, the proportion of personal services to total city expenditures was maintained at 22.88%, much lower than what is allowed in RA No. 7160 and the highly urbanized city (HUC) average of 32.50%. Public infrastructure projects such as roads, schools, health centers, public multi-purpose buildings and facilities for disaster preparedness remained to be a high priority in terms of meeting the needs and aspirations of the community. In order to augment the limited resources and be able to deliver all these services in time, the City Government took advantage of the financial assistance extended by various financial institutions through loans.
Figure 30. Average Expenditure by Expenses (2013 – 2015)
Debt service ratio in terms of loans, payables and interest expense was likewise maintained at an average of 7% for the last five years which is way below the 20% cap allowed by existing rules and regulations. Figure 31. Five-Year Debt Service (2010 – 2014)
PERSONAL
SERVICES
22.88%
MOOE
37.13%
CAPITAL
OUTLAY
6.23%
SAF
10.07%
SCO
23.70%
5.58% 5.52%
9.14%7.71% 7.56%
20% DEBT CAP
2010 2011 2012 2013 2014
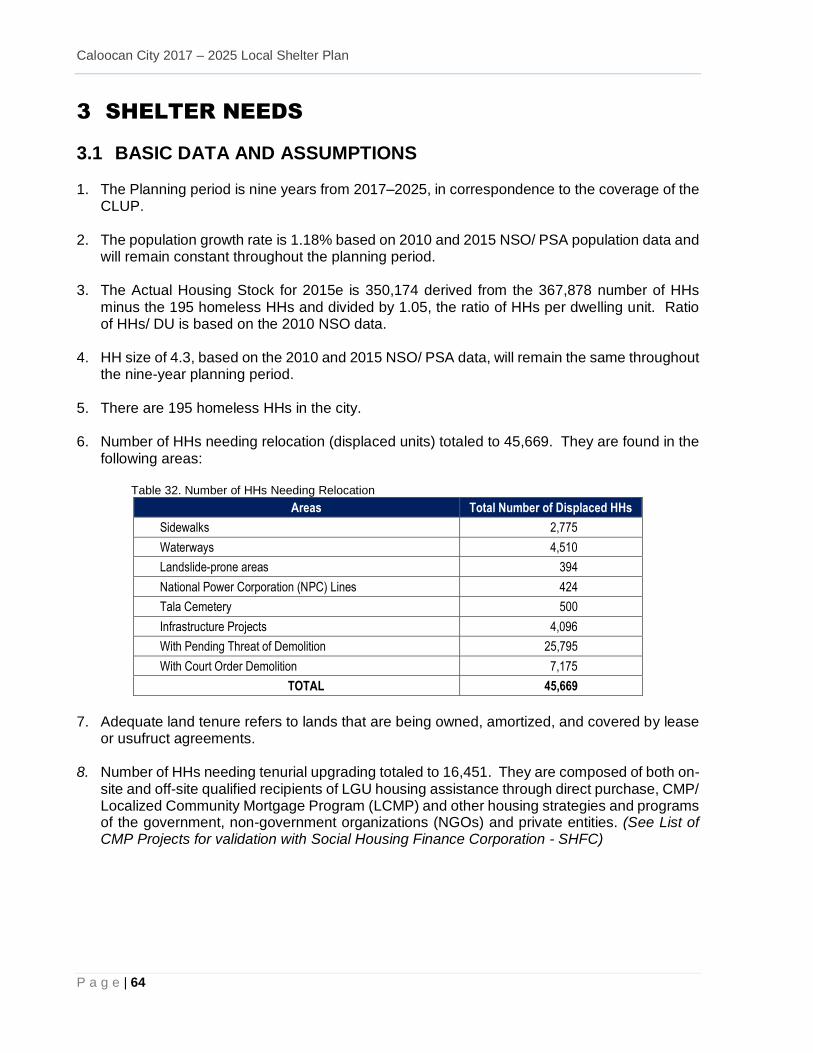
Caloocan City 2017 – 2025 Local Shelter Plan
P a g e | 64
3 SHELTER NEEDS
3.1 BASIC DATA AND ASSUMPTIONS 1. The Planning period is nine years from 2017–2025, in correspondence to the coverage of the
CLUP.
2. The population growth rate is 1.18% based on 2010 and 2015 NSO/ PSA population data and will remain constant throughout the planning period.
3. The Actual Housing Stock for 2015e is 350,174 derived from the 367,878 number of HHs
minus the 195 homeless HHs and divided by 1.05, the ratio of HHs per dwelling unit. Ratio of HHs/ DU is based on the 2010 NSO data.
4. HH size of 4.3, based on the 2010 and 2015 NSO/ PSA data, will remain the same throughout
the nine-year planning period. 5. There are 195 homeless HHs in the city. 6. Number of HHs needing relocation (displaced units) totaled to 45,669. They are found in the
following areas:
Table 32. Number of HHs Needing Relocation
Areas Total Number of Displaced HHs
Sidewalks 2,775
Waterways 4,510
Landslide-prone areas 394
National Power Corporation (NPC) Lines 424
Tala Cemetery 500
Infrastructure Projects 4,096
With Pending Threat of Demolition 25,795
With Court Order Demolition 7,175
TOTAL 45,669
7. Adequate land tenure refers to lands that are being owned, amortized, and covered by lease
or usufruct agreements.
8. Number of HHs needing tenurial upgrading totaled to 16,451. They are composed of both on-site and off-site qualified recipients of LGU housing assistance through direct purchase, CMP/ Localized Community Mortgage Program (LCMP) and other housing strategies and programs of the government, non-government organizations (NGOs) and private entities. (See List of CMP Projects for validation with Social Housing Finance Corporation - SHFC)
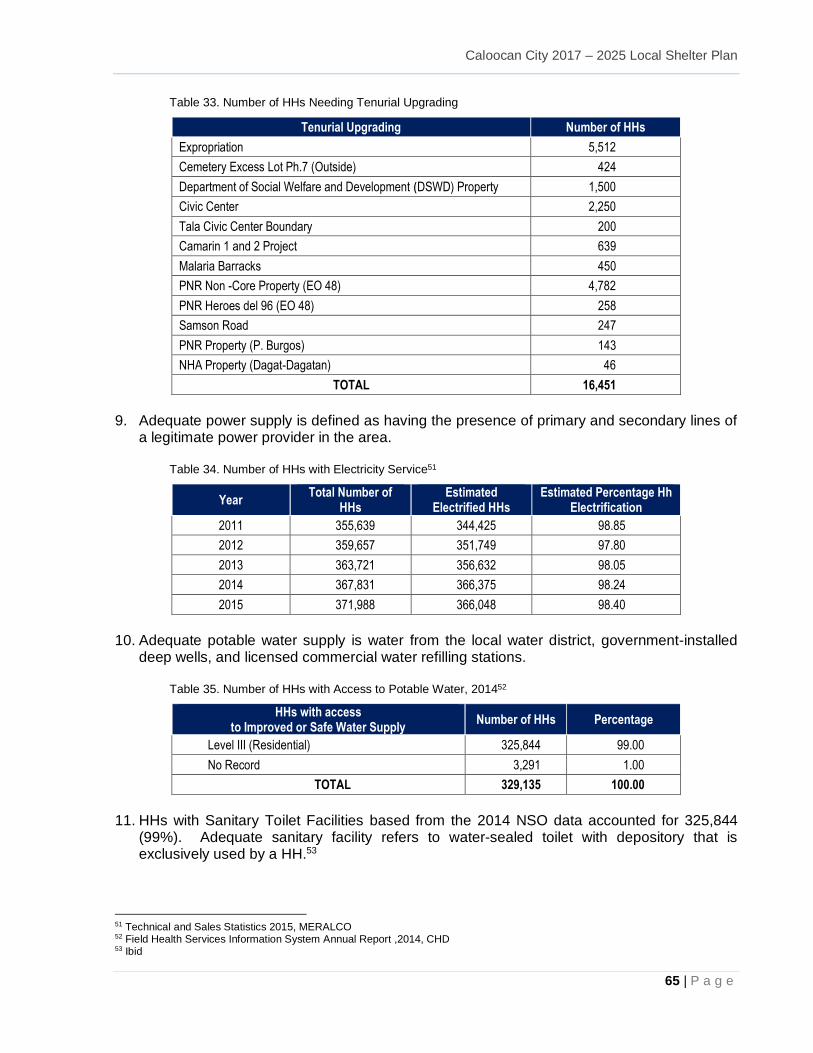
Caloocan City 2017 – 2025 Local Shelter Plan
65 | P a g e
Table 33. Number of HHs Needing Tenurial Upgrading
Tenurial Upgrading Number of HHs
Expropriation 5,512
Cemetery Excess Lot Ph.7 (Outside) 424
Department of Social Welfare and Development (DSWD) Property 1,500
Civic Center 2,250
Tala Civic Center Boundary 200
Camarin 1 and 2 Project 639
Malaria Barracks 450
PNR Non -Core Property (EO 48) 4,782
PNR Heroes del 96 (EO 48) 258
Samson Road 247
PNR Property (P. Burgos) 143
NHA Property (Dagat-Dagatan) 46
TOTAL 16,451
9. Adequate power supply is defined as having the presence of primary and secondary lines of
a legitimate power provider in the area.
Table 34. Number of HHs with Electricity Service51
Year Total Number of
HHs Estimated
Electrified HHs Estimated Percentage Hh
Electrification
2011 355,639 344,425 98.85
2012 359,657 351,749 97.80
2013 363,721 356,632 98.05
2014 367,831 366,375 98.24
2015 371,988 366,048 98.40
10. Adequate potable water supply is water from the local water district, government-installed
deep wells, and licensed commercial water refilling stations.
Table 35. Number of HHs with Access to Potable Water, 201452
HHs with access to Improved or Safe Water Supply
Number of HHs Percentage
Level III (Residential) 325,844 99.00
No Record 3,291 1.00
TOTAL 329,135 100.00
11. HHs with Sanitary Toilet Facilities based from the 2014 NSO data accounted for 325,844
(99%). Adequate sanitary facility refers to water-sealed toilet with depository that is exclusively used by a HH.53
51 Technical and Sales Statistics 2015, MERALCO 52 Field Health Services Information System Annual Report ,2014, CHD 53 Ibid
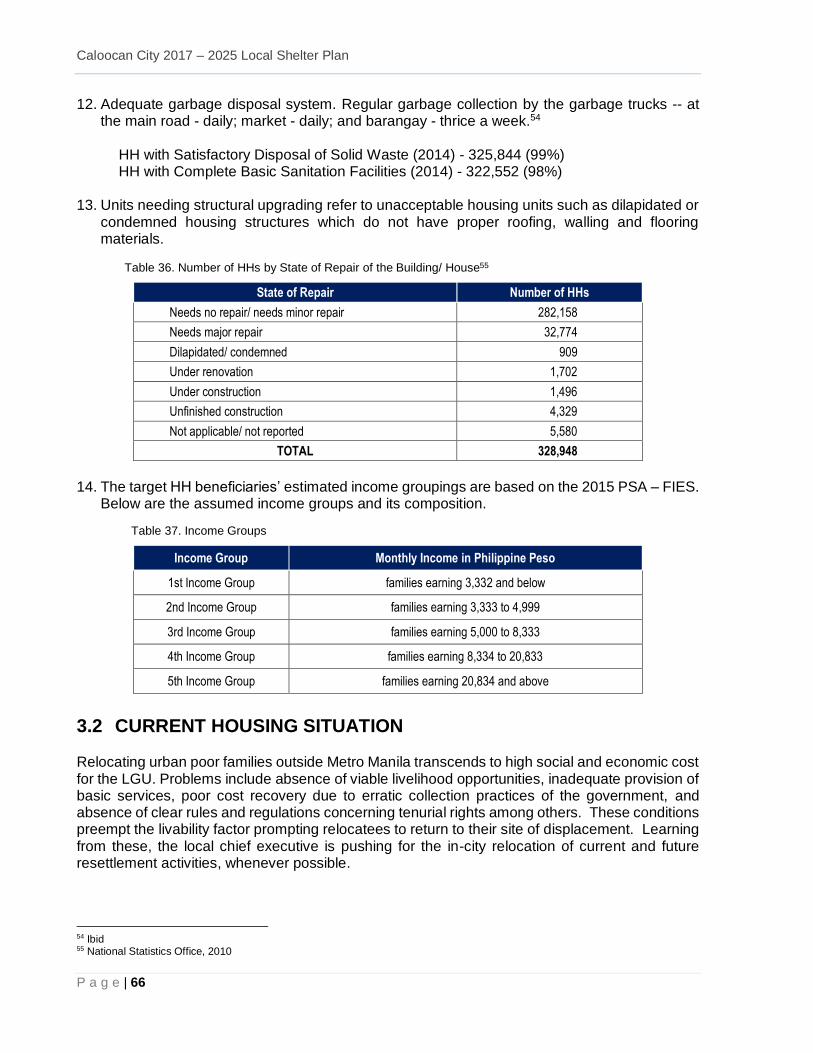
Caloocan City 2017 – 2025 Local Shelter Plan
P a g e | 66
12. Adequate garbage disposal system. Regular garbage collection by the garbage trucks -- at the main road - daily; market - daily; and barangay - thrice a week.54
HH with Satisfactory Disposal of Solid Waste (2014) - 325,844 (99%) HH with Complete Basic Sanitation Facilities (2014) - 322,552 (98%)
13. Units needing structural upgrading refer to unacceptable housing units such as dilapidated or condemned housing structures which do not have proper roofing, walling and flooring materials.
Table 36. Number of HHs by State of Repair of the Building/ House55
State of Repair Number of HHs
Needs no repair/ needs minor repair 282,158
Needs major repair 32,774
Dilapidated/ condemned 909
Under renovation 1,702
Under construction 1,496
Unfinished construction 4,329
Not applicable/ not reported 5,580
TOTAL 328,948
14. The target HH beneficiaries’ estimated income groupings are based on the 2015 PSA – FIES.
Below are the assumed income groups and its composition.
Table 37. Income Groups
Income Group Monthly Income in Philippine Peso
1st Income Group families earning 3,332 and below
2nd Income Group families earning 3,333 to 4,999
3rd Income Group families earning 5,000 to 8,333
4th Income Group families earning 8,334 to 20,833
5th Income Group families earning 20,834 and above
3.2 CURRENT HOUSING SITUATION Relocating urban poor families outside Metro Manila transcends to high social and economic cost for the LGU. Problems include absence of viable livelihood opportunities, inadequate provision of basic services, poor cost recovery due to erratic collection practices of the government, and absence of clear rules and regulations concerning tenurial rights among others. These conditions preempt the livability factor prompting relocatees to return to their site of displacement. Learning from these, the local chief executive is pushing for the in-city relocation of current and future resettlement activities, whenever possible.
54 Ibid 55 National Statistics Office, 2010
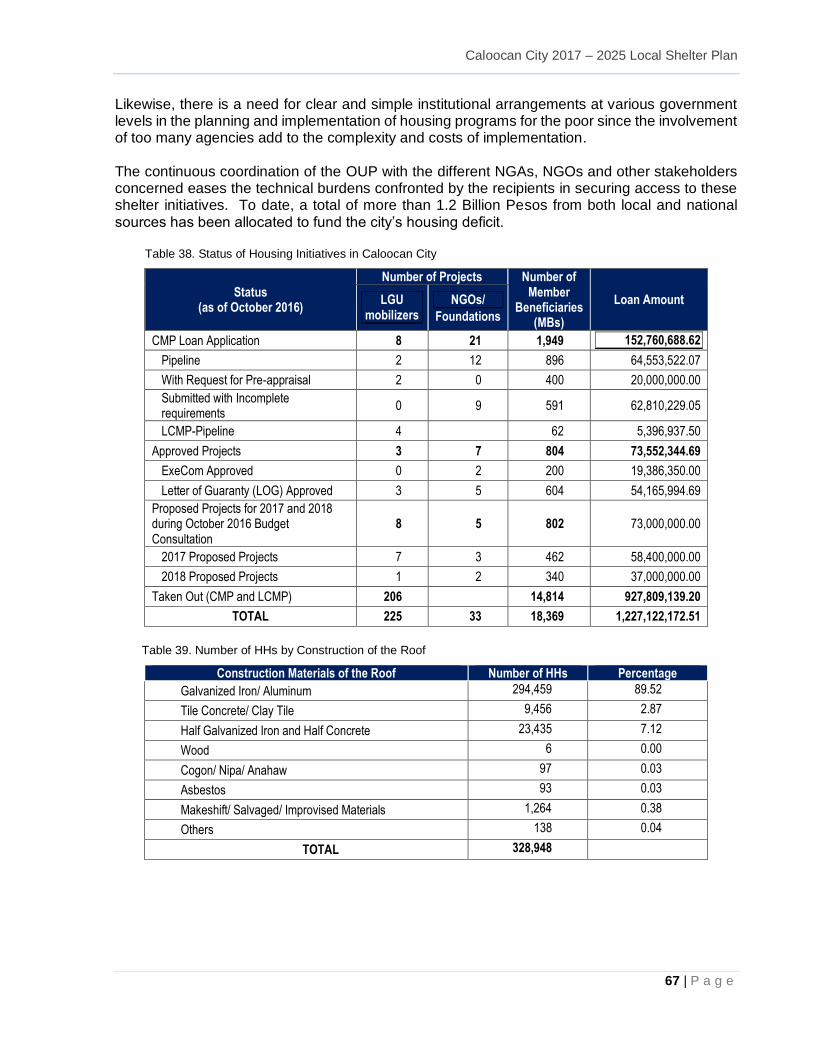
Caloocan City 2017 – 2025 Local Shelter Plan
67 | P a g e
Likewise, there is a need for clear and simple institutional arrangements at various government levels in the planning and implementation of housing programs for the poor since the involvement of too many agencies add to the complexity and costs of implementation. The continuous coordination of the OUP with the different NGAs, NGOs and other stakeholders concerned eases the technical burdens confronted by the recipients in securing access to these shelter initiatives. To date, a total of more than 1.2 Billion Pesos from both local and national sources has been allocated to fund the city’s housing deficit. Table 38. Status of Housing Initiatives in Caloocan City
Status (as of October 2016)
Number of Projects Number of Member
Beneficiaries (MBs)
Loan Amount LGU mobilizers
NGOs/
Foundations
CMP Loan Application 8 21 1,949 152,760,688.62
Pipeline 2 12 896 64,553,522.07
With Request for Pre-appraisal 2 0 400 20,000,000.00
Submitted with Incomplete requirements
0 9 591 62,810,229.05
LCMP-Pipeline 4 62 5,396,937.50
Approved Projects 3 7 804 73,552,344.69
ExeCom Approved 0 2 200 19,386,350.00
Letter of Guaranty (LOG) Approved 3 5 604 54,165,994.69
Proposed Projects for 2017 and 2018 during October 2016 Budget Consultation
8 5 802 73,000,000.00
2017 Proposed Projects 7 3 462 58,400,000.00
2018 Proposed Projects 1 2 340 37,000,000.00
Taken Out (CMP and LCMP) 206 14,814 927,809,139.20
TOTAL 225 33 18,369 1,227,122,172.51
Table 39. Number of HHs by Construction of the Roof
Construction Materials of the Roof Number of HHs Percentage
Galvanized Iron/ Aluminum 294,459 89.52
Tile Concrete/ Clay Tile 9,456 2.87
Half Galvanized Iron and Half Concrete 23,435 7.12
Wood 6 0.00
Cogon/ Nipa/ Anahaw 97 0.03
Asbestos 93 0.03
Makeshift/ Salvaged/ Improvised Materials 1,264 0.38
Others 138 0.04
TOTAL 328,948
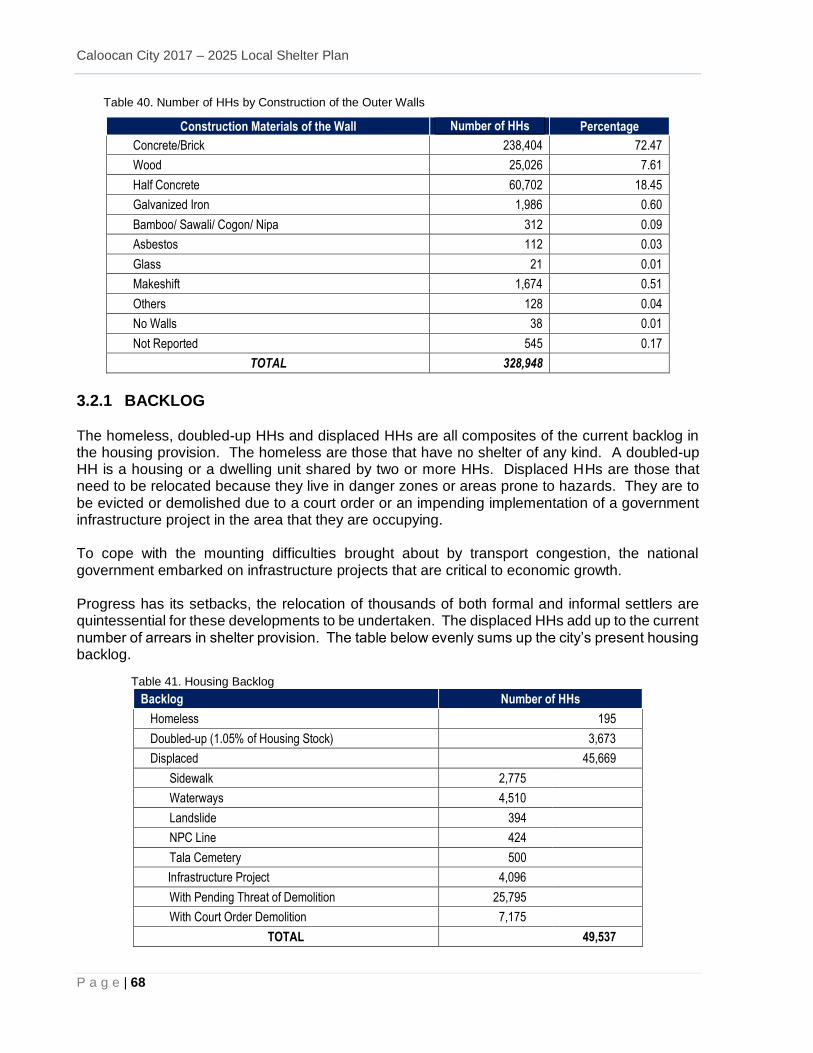
Caloocan City 2017 – 2025 Local Shelter Plan
P a g e | 68
Table 40. Number of HHs by Construction of the Outer Walls
Construction Materials of the Wall Number of HHs Percentage
Concrete/Brick 238,404 72.47
Wood 25,026 7.61
Half Concrete 60,702 18.45
Galvanized Iron 1,986 0.60
Bamboo/ Sawali/ Cogon/ Nipa 312 0.09
Asbestos 112 0.03
Glass 21 0.01
Makeshift 1,674 0.51
Others 128 0.04
No Walls 38 0.01
Not Reported 545 0.17
TOTAL 328,948
3.2.1 BACKLOG The homeless, doubled-up HHs and displaced HHs are all composites of the current backlog in the housing provision. The homeless are those that have no shelter of any kind. A doubled-up HH is a housing or a dwelling unit shared by two or more HHs. Displaced HHs are those that need to be relocated because they live in danger zones or areas prone to hazards. They are to be evicted or demolished due to a court order or an impending implementation of a government infrastructure project in the area that they are occupying. To cope with the mounting difficulties brought about by transport congestion, the national government embarked on infrastructure projects that are critical to economic growth. Progress has its setbacks, the relocation of thousands of both formal and informal settlers are quintessential for these developments to be undertaken. The displaced HHs add up to the current number of arrears in shelter provision. The table below evenly sums up the city’s present housing backlog.
Table 41. Housing Backlog
Backlog Number of HHs
Homeless 195
Doubled-up (1.05% of Housing Stock) 3,673
Displaced 45,669
Sidewalk 2,775
Waterways 4,510
Landslide 394
NPC Line 424
Tala Cemetery 500
Infrastructure Project 4,096
With Pending Threat of Demolition 25,795
With Court Order Demolition 7,175
TOTAL 49,537
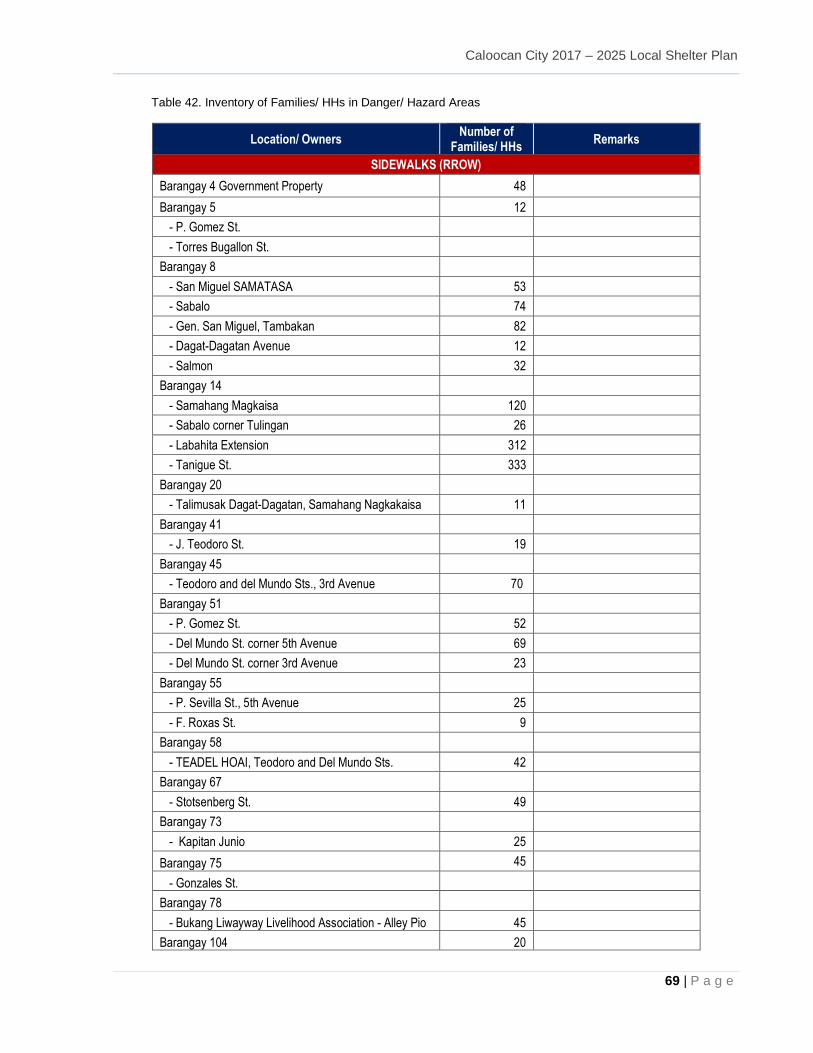
Caloocan City 2017 – 2025 Local Shelter Plan
69 | P a g e
Table 42. Inventory of Families/ HHs in Danger/ Hazard Areas
Location/ Owners Number of
Families/ HHs Remarks
SIDEWALKS (RROW)
Barangay 4 Government Property 48
Barangay 5 12
- P. Gomez St.
- Torres Bugallon St.
Barangay 8
- San Miguel SAMATASA 53
- Sabalo 74
- Gen. San Miguel, Tambakan 82
- Dagat-Dagatan Avenue 12
- Salmon 32
Barangay 14
- Samahang Magkaisa 120
- Sabalo corner Tulingan 26
- Labahita Extension 312
- Tanigue St. 333
Barangay 20
- Talimusak Dagat-Dagatan, Samahang Nagkakaisa 11
Barangay 41
- J. Teodoro St. 19
Barangay 45
- Teodoro and del Mundo Sts., 3rd Avenue 70
Barangay 51
- P. Gomez St. 52
- Del Mundo St. corner 5th Avenue 69
- Del Mundo St. corner 3rd Avenue 23
Barangay 55
- P. Sevilla St., 5th Avenue 25
- F. Roxas St. 9
Barangay 58
- TEADEL HOAI, Teodoro and Del Mundo Sts. 42
Barangay 67
- Stotsenberg St. 49
Barangay 73
- Kapitan Junio 25
Barangay 75 45
- Gonzales St.
Barangay 78
- Bukang Liwayway Livelihood Association - Alley Pio 45
Barangay 104 20
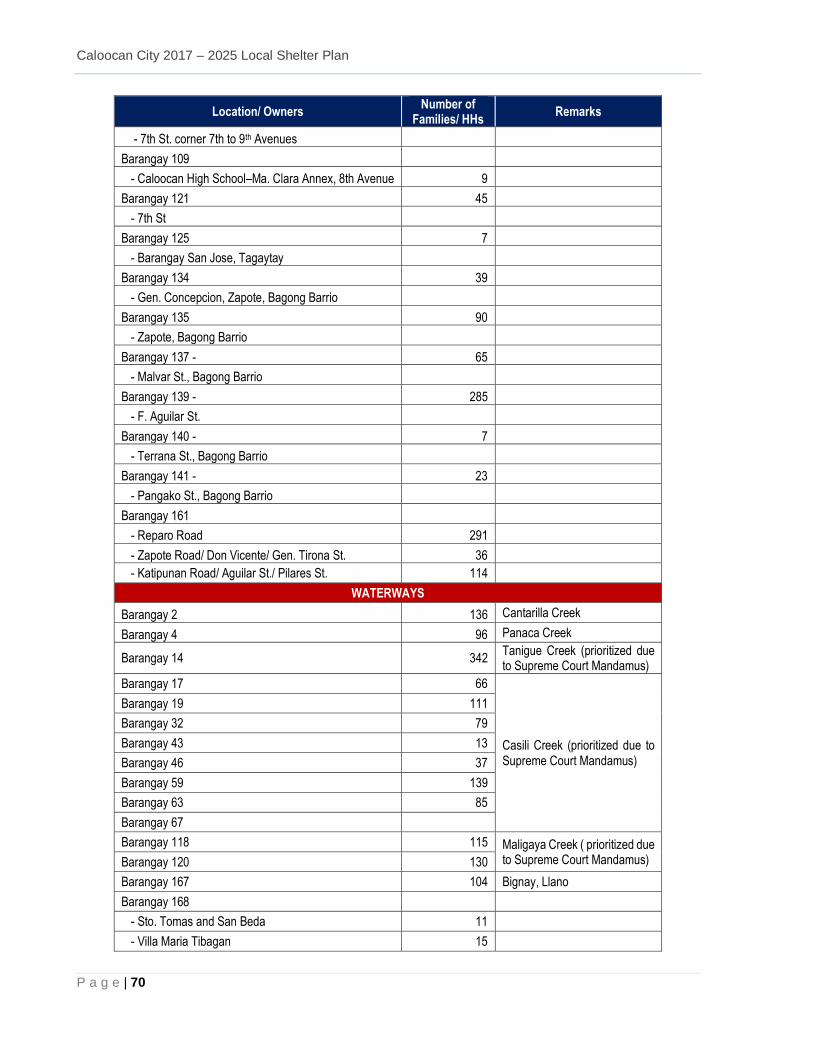
Caloocan City 2017 – 2025 Local Shelter Plan
P a g e | 70
Location/ Owners Number of
Families/ HHs Remarks
- 7th St. corner 7th to 9th Avenues
Barangay 109
- Caloocan High School–Ma. Clara Annex, 8th Avenue 9
Barangay 121 45
- 7th St
Barangay 125 7
- Barangay San Jose, Tagaytay
Barangay 134 39
- Gen. Concepcion, Zapote, Bagong Barrio
Barangay 135 90
- Zapote, Bagong Barrio
Barangay 137 - 65
- Malvar St., Bagong Barrio
Barangay 139 - 285
- F. Aguilar St.
Barangay 140 - 7
- Terrana St., Bagong Barrio
Barangay 141 - 23
- Pangako St., Bagong Barrio
Barangay 161
- Reparo Road 291
- Zapote Road/ Don Vicente/ Gen. Tirona St. 36
- Katipunan Road/ Aguilar St./ Pilares St. 114
WATERWAYS
Barangay 2 136 Cantarilla Creek
Barangay 4 96 Panaca Creek
Barangay 14 342 Tanigue Creek (prioritized due to Supreme Court Mandamus)
Barangay 17 66
Casili Creek (prioritized due to Supreme Court Mandamus)
Barangay 19 111
Barangay 32 79
Barangay 43 13
Barangay 46 37
Barangay 59 139
Barangay 63 85
Barangay 67
Barangay 118 115 Maligaya Creek ( prioritized due to Supreme Court Mandamus) Barangay 120 130
Barangay 167 104 Bignay, Llano
Barangay 168
- Sto. Tomas and San Beda 11
- Villa Maria Tibagan 15
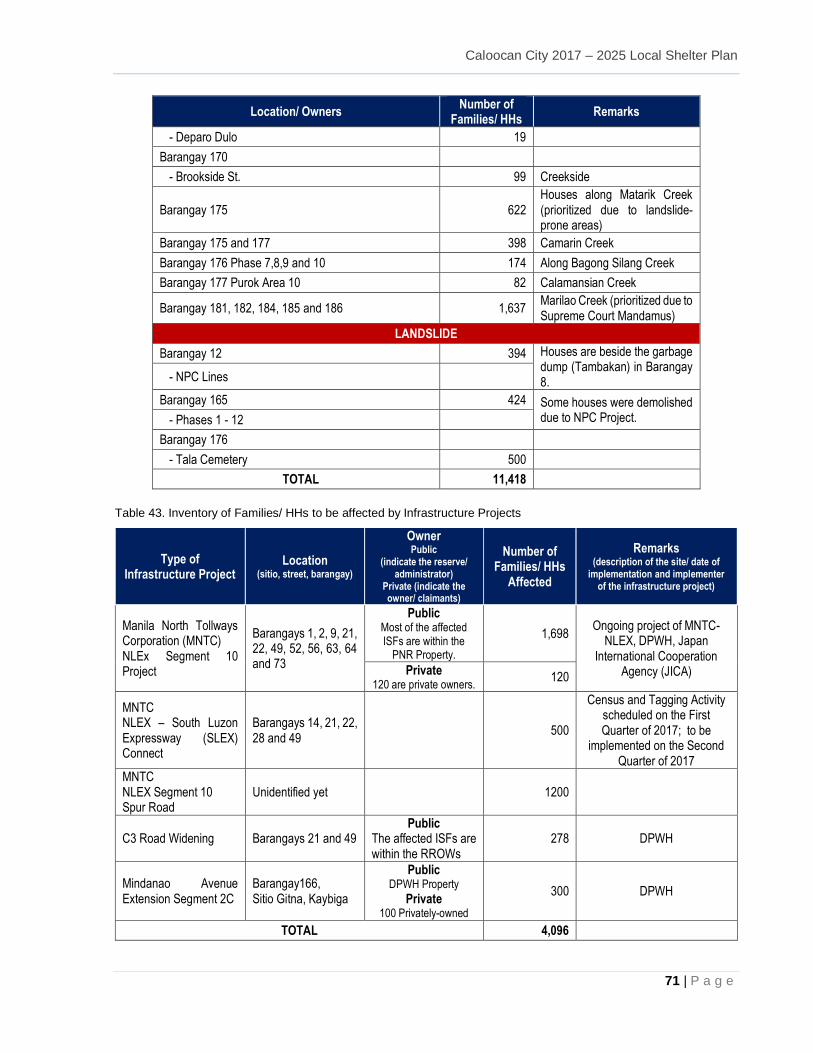
Caloocan City 2017 – 2025 Local Shelter Plan
71 | P a g e
Location/ Owners Number of
Families/ HHs Remarks
- Deparo Dulo 19
Barangay 170
- Brookside St. 99 Creekside
Barangay 175 622 Houses along Matarik Creek (prioritized due to landslide-prone areas)
Barangay 175 and 177 398 Camarin Creek
Barangay 176 Phase 7,8,9 and 10 174 Along Bagong Silang Creek
Barangay 177 Purok Area 10 82 Calamansian Creek
Barangay 181, 182, 184, 185 and 186 1,637 Marilao Creek (prioritized due to Supreme Court Mandamus)
LANDSLIDE
Barangay 12 394 Houses are beside the garbage dump (Tambakan) in Barangay 8. - NPC Lines
Barangay 165 424 Some houses were demolished due to NPC Project. - Phases 1 - 12
Barangay 176
- Tala Cemetery 500
TOTAL 11,418
Table 43. Inventory of Families/ HHs to be affected by Infrastructure Projects
Type of Infrastructure Project
Location (sitio, street, barangay)
Owner Public
(indicate the reserve/ administrator)
Private (indicate the owner/ claimants)
Number of Families/ HHs
Affected
Remarks (description of the site/ date of
implementation and implementer of the infrastructure project)
Manila North Tollways Corporation (MNTC) NLEx Segment 10 Project
Barangays 1, 2, 9, 21, 22, 49, 52, 56, 63, 64 and 73
Public Most of the affected ISFs are within the
PNR Property.
1,698 Ongoing project of MNTC-
NLEX, DPWH, Japan International Cooperation
Agency (JICA) Private 120 are private owners.
120
MNTC NLEX – South Luzon Expressway (SLEX) Connect
Barangays 14, 21, 22, 28 and 49
500
Census and Tagging Activity scheduled on the First Quarter of 2017; to be
implemented on the Second Quarter of 2017
MNTC NLEX Segment 10 Spur Road
Unidentified yet 1200
C3 Road Widening Barangays 21 and 49 Public
The affected ISFs are within the RROWs
278 DPWH
Mindanao Avenue Extension Segment 2C
Barangay166, Sitio Gitna, Kaybiga
Public DPWH Property
Private 100 Privately-owned
300 DPWH
TOTAL 4,096
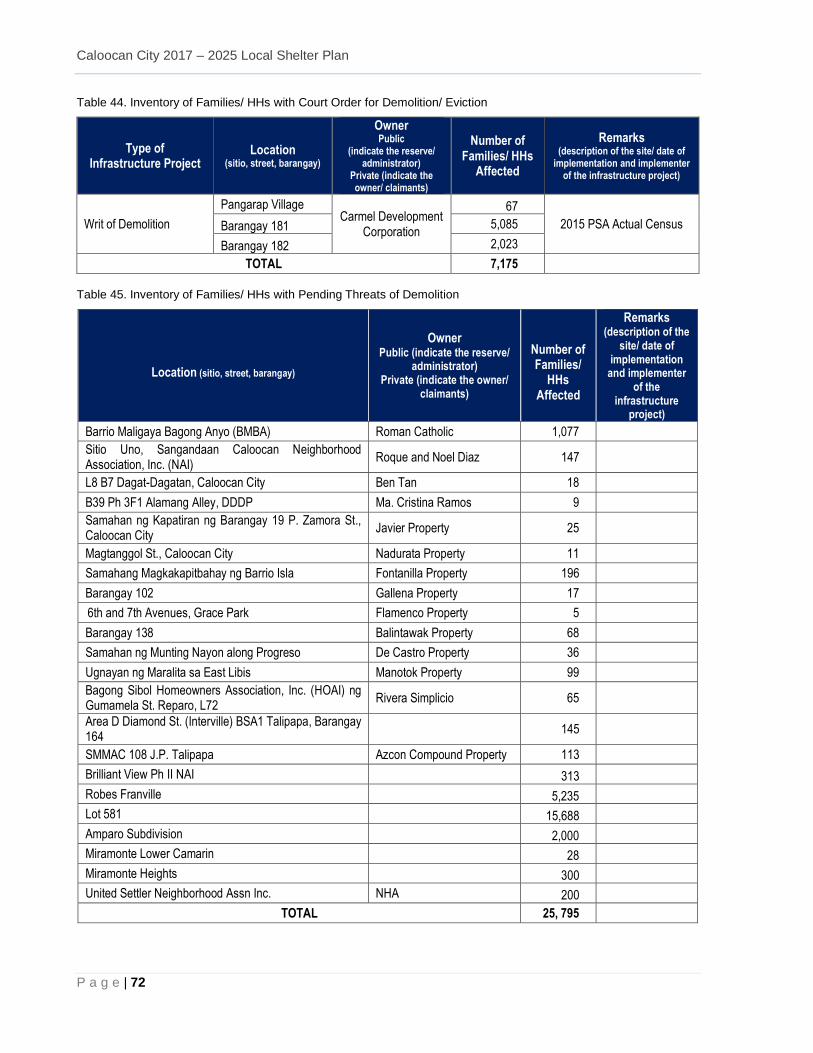
Caloocan City 2017 – 2025 Local Shelter Plan
P a g e | 72
Table 44. Inventory of Families/ HHs with Court Order for Demolition/ Eviction
Type of Infrastructure Project
Location (sitio, street, barangay)
Owner Public
(indicate the reserve/ administrator)
Private (indicate the owner/ claimants)
Number of Families/ HHs
Affected
Remarks (description of the site/ date of
implementation and implementer of the infrastructure project)
Writ of Demolition
Pangarap Village Carmel Development
Corporation
67
2015 PSA Actual Census Barangay 181 5,085
Barangay 182 2,023
TOTAL 7,175
Table 45. Inventory of Families/ HHs with Pending Threats of Demolition
Location (sitio, street, barangay)
Owner Public (indicate the reserve/
administrator) Private (indicate the owner/
claimants)
Number of Families/
HHs Affected
Remarks (description of the
site/ date of implementation
and implementer of the
infrastructure project)
Barrio Maligaya Bagong Anyo (BMBA) Roman Catholic 1,077
Sitio Uno, Sangandaan Caloocan Neighborhood Association, Inc. (NAI)
Roque and Noel Diaz 147
L8 B7 Dagat-Dagatan, Caloocan City Ben Tan 18
B39 Ph 3F1 Alamang Alley, DDDP Ma. Cristina Ramos 9
Samahan ng Kapatiran ng Barangay 19 P. Zamora St., Caloocan City
Javier Property 25
Magtanggol St., Caloocan City Nadurata Property 11
Samahang Magkakapitbahay ng Barrio Isla Fontanilla Property 196
Barangay 102 Gallena Property 17 6th and 7th Avenues, Grace Park Flamenco Property 5
Barangay 138 Balintawak Property 68
Samahan ng Munting Nayon along Progreso De Castro Property 36
Ugnayan ng Maralita sa East Libis Manotok Property 99
Bagong Sibol Homeowners Association, Inc. (HOAI) ng Gumamela St. Reparo, L72
Rivera Simplicio 65
Area D Diamond St. (Interville) BSA1 Talipapa, Barangay 164
145
SMMAC 108 J.P. Talipapa Azcon Compound Property 113
Brilliant View Ph II NAI 313
Robes Franville 5,235
Lot 581 15,688
Amparo Subdivision 2,000
Miramonte Lower Camarin 28
Miramonte Heights 300
United Settler Neighborhood Assn Inc. NHA 200
TOTAL 25, 795
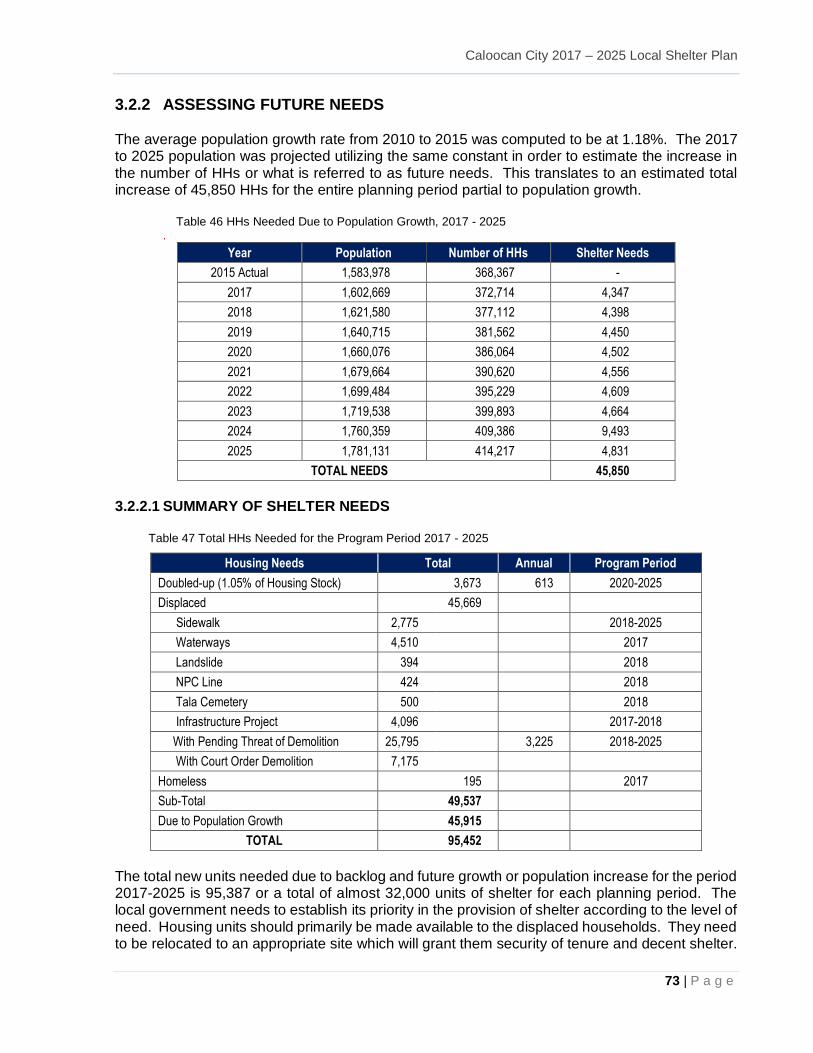
Caloocan City 2017 – 2025 Local Shelter Plan
73 | P a g e
3.2.2 ASSESSING FUTURE NEEDS The average population growth rate from 2010 to 2015 was computed to be at 1.18%. The 2017 to 2025 population was projected utilizing the same constant in order to estimate the increase in the number of HHs or what is referred to as future needs. This translates to an estimated total increase of 45,850 HHs for the entire planning period partial to population growth.
Table 46 HHs Needed Due to Population Growth, 2017 - 2025 .
Year Population Number of HHs Shelter Needs
2015 Actual 1,583,978 368,367 -
2017 1,602,669 372,714 4,347
2018 1,621,580 377,112 4,398
2019 1,640,715 381,562 4,450
2020 1,660,076 386,064 4,502
2021 1,679,664 390,620 4,556
2022 1,699,484 395,229 4,609
2023 1,719,538 399,893 4,664
2024 1,760,359 409,386 9,493
2025 1,781,131 414,217 4,831
TOTAL NEEDS 45,850
3.2.2.1 SUMMARY OF SHELTER NEEDS Table 47 Total HHs Needed for the Program Period 2017 - 2025
Housing Needs Total Annual Program Period
Doubled-up (1.05% of Housing Stock) 3,673 613 2020-2025
Displaced 45,669
Sidewalk 2,775 2018-2025
Waterways 4,510 2017
Landslide 394 2018
NPC Line 424 2018
Tala Cemetery 500 2018
Infrastructure Project 4,096 2017-2018
With Pending Threat of Demolition 25,795 3,225 2018-2025
With Court Order Demolition 7,175
Homeless 195 2017
Sub-Total 49,537
Due to Population Growth 45,915
TOTAL 95,452
The total new units needed due to backlog and future growth or population increase for the period 2017-2025 is 95,387 or a total of almost 32,000 units of shelter for each planning period. The local government needs to establish its priority in the provision of shelter according to the level of need. Housing units should primarily be made available to the displaced households. They need to be relocated to an appropriate site which will grant them security of tenure and decent shelter.
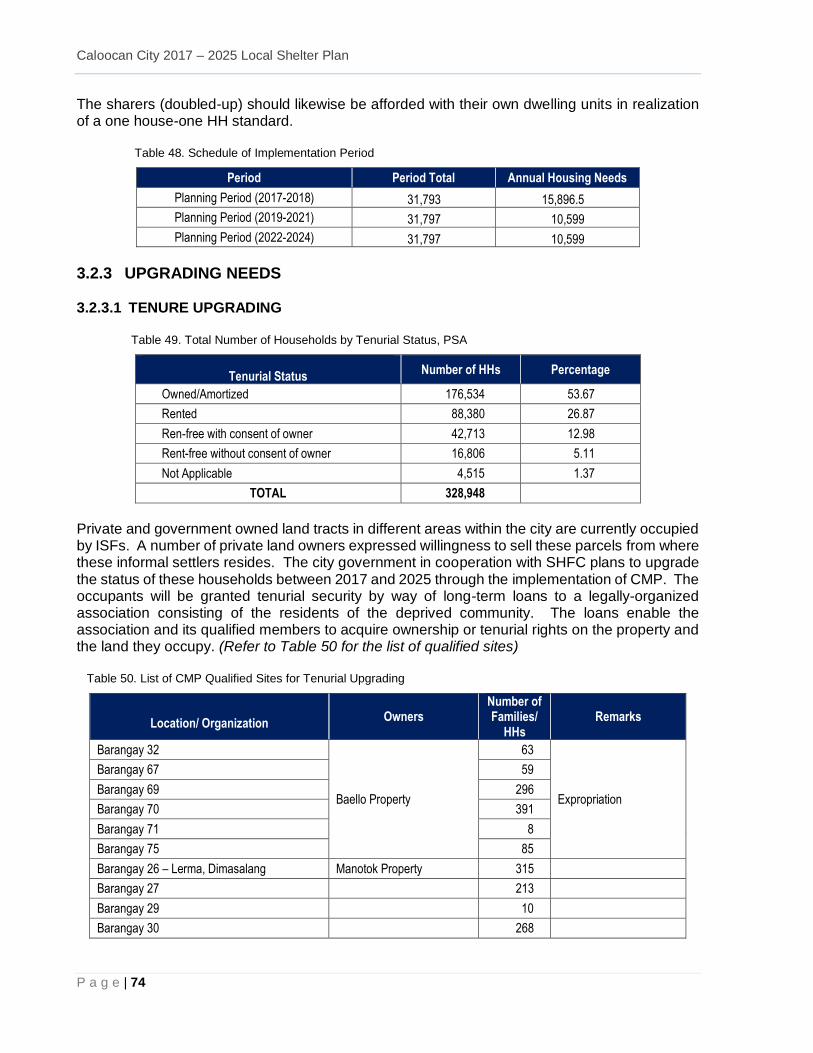
Caloocan City 2017 – 2025 Local Shelter Plan
P a g e | 74
The sharers (doubled-up) should likewise be afforded with their own dwelling units in realization of a one house-one HH standard. Table 48. Schedule of Implementation Period
Period Period Total Annual Housing Needs
Planning Period (2017-2018) 31,793 15,896.5
Planning Period (2019-2021) 31,797 10,599
Planning Period (2022-2024) 31,797 10,599
3.2.3 UPGRADING NEEDS 3.2.3.1 TENURE UPGRADING
Table 49. Total Number of Households by Tenurial Status, PSA
Tenurial Status Number of HHs Percentage
Owned/Amortized 176,534 53.67
Rented 88,380 26.87
Ren-free with consent of owner 42,713 12.98
Rent-free without consent of owner 16,806 5.11
Not Applicable 4,515 1.37
TOTAL 328,948
Private and government owned land tracts in different areas within the city are currently occupied by ISFs. A number of private land owners expressed willingness to sell these parcels from where these informal settlers resides. The city government in cooperation with SHFC plans to upgrade the status of these households between 2017 and 2025 through the implementation of CMP. The occupants will be granted tenurial security by way of long-term loans to a legally-organized association consisting of the residents of the deprived community. The loans enable the association and its qualified members to acquire ownership or tenurial rights on the property and the land they occupy. (Refer to Table 50 for the list of qualified sites) Table 50. List of CMP Qualified Sites for Tenurial Upgrading
Location/ Organization Owners
Number of Families/
HHs Remarks
Barangay 32
Baello Property
63
Expropriation
Barangay 67 59
Barangay 69 296
Barangay 70 391
Barangay 71 8
Barangay 75 85
Barangay 26 – Lerma, Dimasalang Manotok Property 315
Barangay 27 213
Barangay 29 10
Barangay 30 268
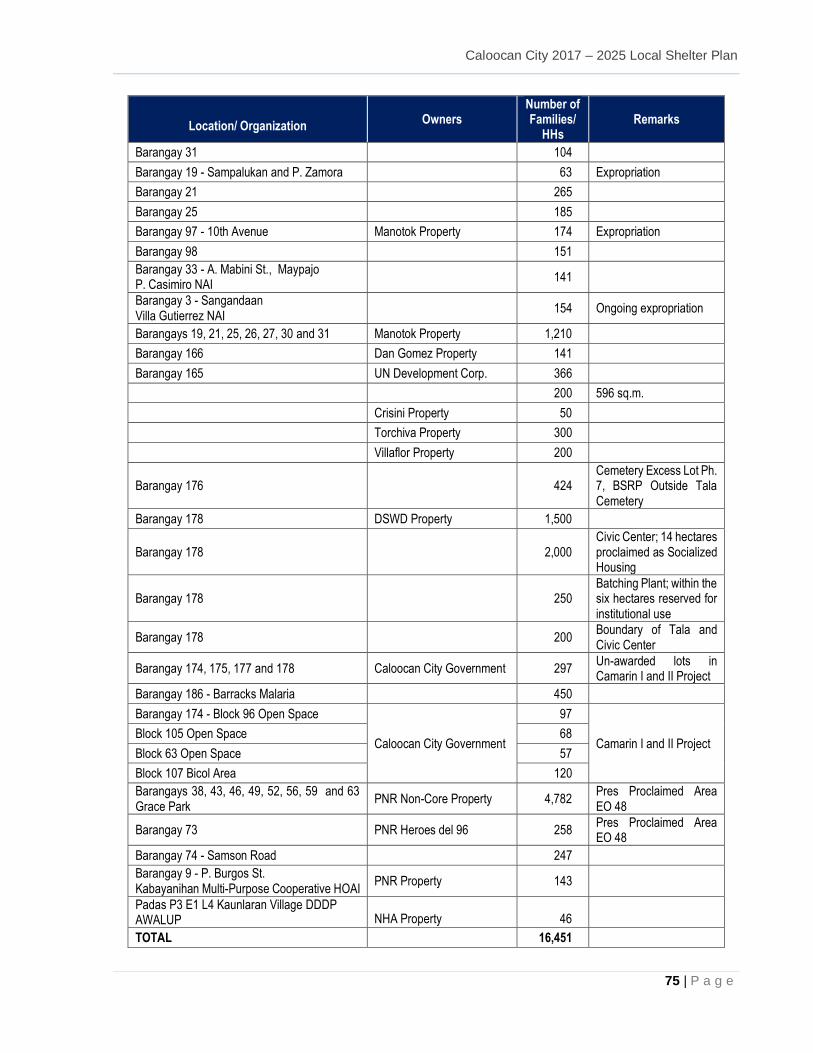
Caloocan City 2017 – 2025 Local Shelter Plan
75 | P a g e
Location/ Organization Owners
Number of Families/
HHs Remarks
Barangay 31 104
Barangay 19 - Sampalukan and P. Zamora 63 Expropriation
Barangay 21 265
Barangay 25 185
Barangay 97 - 10th Avenue Manotok Property 174 Expropriation
Barangay 98 151
Barangay 33 - A. Mabini St., Maypajo P. Casimiro NAI
141
Barangay 3 - Sangandaan Villa Gutierrez NAI
154 Ongoing expropriation
Barangays 19, 21, 25, 26, 27, 30 and 31 Manotok Property 1,210
Barangay 166 Dan Gomez Property 141
Barangay 165 UN Development Corp. 366
200 596 sq.m.
Crisini Property 50
Torchiva Property 300
Villaflor Property 200
Barangay 176 424 Cemetery Excess Lot Ph. 7, BSRP Outside Tala Cemetery
Barangay 178 DSWD Property 1,500
Barangay 178 2,000 Civic Center; 14 hectares proclaimed as Socialized Housing
Barangay 178 250 Batching Plant; within the six hectares reserved for institutional use
Barangay 178 200 Boundary of Tala and Civic Center
Barangay 174, 175, 177 and 178 Caloocan City Government 297 Un-awarded lots in Camarin I and II Project
Barangay 186 - Barracks Malaria 450
Barangay 174 - Block 96 Open Space
Caloocan City Government
97
Camarin I and II Project Block 105 Open Space 68
Block 63 Open Space 57
Block 107 Bicol Area 120
Barangays 38, 43, 46, 49, 52, 56, 59 and 63 Grace Park
PNR Non-Core Property 4,782 Pres Proclaimed Area EO 48
Barangay 73 PNR Heroes del 96 258 Pres Proclaimed Area EO 48
Barangay 74 - Samson Road 247
Barangay 9 - P. Burgos St. Kabayanihan Multi-Purpose Cooperative HOAI
PNR Property 143
Padas P3 E1 L4 Kaunlaran Village DDDP AWALUP NHA Property 46
TOTAL 16,451
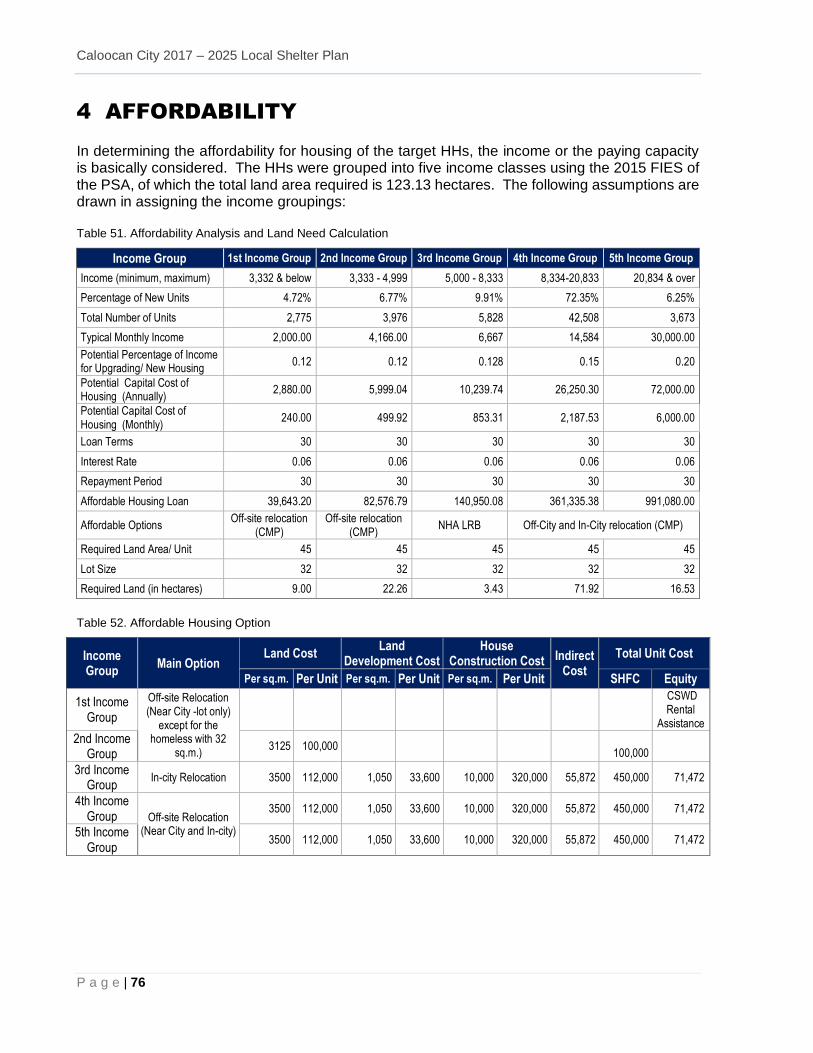
Caloocan City 2017 – 2025 Local Shelter Plan
P a g e | 76
4 AFFORDABILITY
In determining the affordability for housing of the target HHs, the income or the paying capacity is basically considered. The HHs were grouped into five income classes using the 2015 FIES of the PSA, of which the total land area required is 123.13 hectares. The following assumptions are drawn in assigning the income groupings: Table 51. Affordability Analysis and Land Need Calculation
Income Group 1st Income Group 2nd Income Group 3rd Income Group 4th Income Group 5th Income Group
Income (minimum, maximum) 3,332 & below 3,333 - 4,999 5,000 - 8,333 8,334-20,833 20,834 & over
Percentage of New Units 4.72% 6.77% 9.91% 72.35% 6.25%
Total Number of Units 2,775 3,976 5,828 42,508 3,673
Typical Monthly Income 2,000.00 4,166.00 6,667 14,584 30,000.00
Potential Percentage of Income for Upgrading/ New Housing
0.12 0.12 0.128 0.15 0.20
Potential Capital Cost of Housing (Annually)
2,880.00 5,999.04 10,239.74 26,250.30 72,000.00
Potential Capital Cost of Housing (Monthly)
240.00 499.92 853.31 2,187.53 6,000.00
Loan Terms 30 30 30 30 30
Interest Rate 0.06 0.06 0.06 0.06 0.06
Repayment Period 30 30 30 30 30
Affordable Housing Loan 39,643.20 82,576.79 140,950.08 361,335.38 991,080.00
Affordable Options Off-site relocation
(CMP) Off-site relocation
(CMP) NHA LRB Off-City and In-City relocation (CMP)
Required Land Area/ Unit 45 45 45 45 45
Lot Size 32 32 32 32 32
Required Land (in hectares) 9.00 22.26 3.43 71.92 16.53
Table 52. Affordable Housing Option
Income Group
Main Option Land Cost
Land Development Cost
House Construction Cost Indirect
Cost
Total Unit Cost
Per sq.m. Per Unit Per sq.m. Per Unit Per sq.m. Per Unit SHFC Equity
1st Income Group
Off-site Relocation (Near City -lot only)
except for the homeless with 32
sq.m.)
CSWD Rental
Assistance
2nd Income Group
3125 100,000
100,000
3rd Income Group
In-city Relocation 3500 112,000 1,050 33,600 10,000 320,000 55,872 450,000 71,472
4th Income Group Off-site Relocation
(Near City and In-city)
3500 112,000 1,050 33,600 10,000 320,000 55,872 450,000 71,472
5th Income Group
3500 112,000 1,050 33,600 10,000 320,000 55,872 450,000 71,472
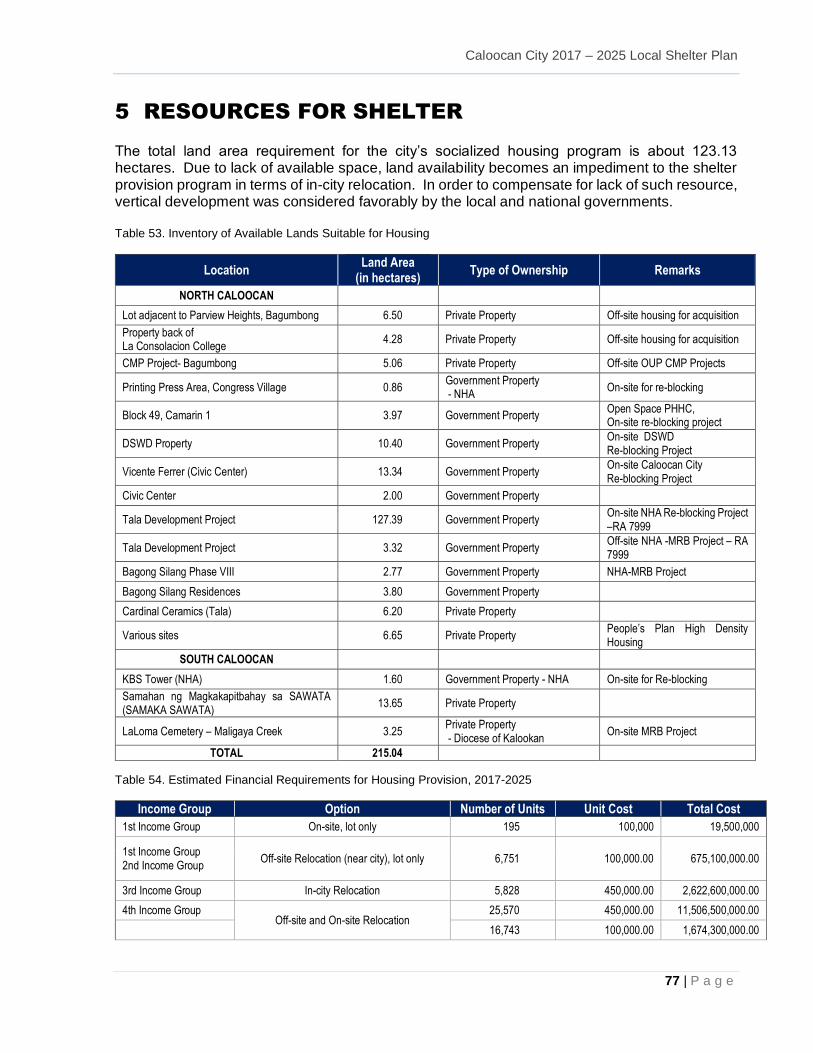
Caloocan City 2017 – 2025 Local Shelter Plan
77 | P a g e
5 RESOURCES FOR SHELTER
The total land area requirement for the city’s socialized housing program is about 123.13 hectares. Due to lack of available space, land availability becomes an impediment to the shelter provision program in terms of in-city relocation. In order to compensate for lack of such resource, vertical development was considered favorably by the local and national governments. Table 53. Inventory of Available Lands Suitable for Housing
Location Land Area
(in hectares) Type of Ownership Remarks
NORTH CALOOCAN
Lot adjacent to Parview Heights, Bagumbong 6.50 Private Property Off-site housing for acquisition
Property back of La Consolacion College
4.28 Private Property Off-site housing for acquisition
CMP Project- Bagumbong 5.06 Private Property Off-site OUP CMP Projects
Printing Press Area, Congress Village 0.86 Government Property - NHA
On-site for re-blocking
Block 49, Camarin 1 3.97 Government Property Open Space PHHC, On-site re-blocking project
DSWD Property 10.40 Government Property On-site DSWD Re-blocking Project
Vicente Ferrer (Civic Center) 13.34 Government Property On-site Caloocan City Re-blocking Project
Civic Center 2.00 Government Property
Tala Development Project 127.39 Government Property On-site NHA Re-blocking Project –RA 7999
Tala Development Project 3.32 Government Property Off-site NHA -MRB Project – RA 7999
Bagong Silang Phase VIII 2.77 Government Property NHA-MRB Project
Bagong Silang Residences 3.80 Government Property
Cardinal Ceramics (Tala) 6.20 Private Property
Various sites 6.65 Private Property People’s Plan High Density Housing
SOUTH CALOOCAN
KBS Tower (NHA) 1.60 Government Property - NHA On-site for Re-blocking
Samahan ng Magkakapitbahay sa SAWATA (SAMAKA SAWATA)
13.65 Private Property
LaLoma Cemetery – Maligaya Creek 3.25 Private Property - Diocese of Kalookan
On-site MRB Project
TOTAL 215.04
Table 54. Estimated Financial Requirements for Housing Provision, 2017-2025
Income Group Option Number of Units Unit Cost Total Cost
1st Income Group On-site, lot only 195 100,000 19,500,000
1st Income Group 2nd Income Group
Off-site Relocation (near city), lot only 6,751 100,000.00 675,100,000.00
3rd Income Group In-city Relocation 5,828 450,000.00 2,622,600,000.00
4th Income Group Off-site and On-site Relocation
25,570 450,000.00 11,506,500,000.00
16,743 100,000.00 1,674,300,000.00
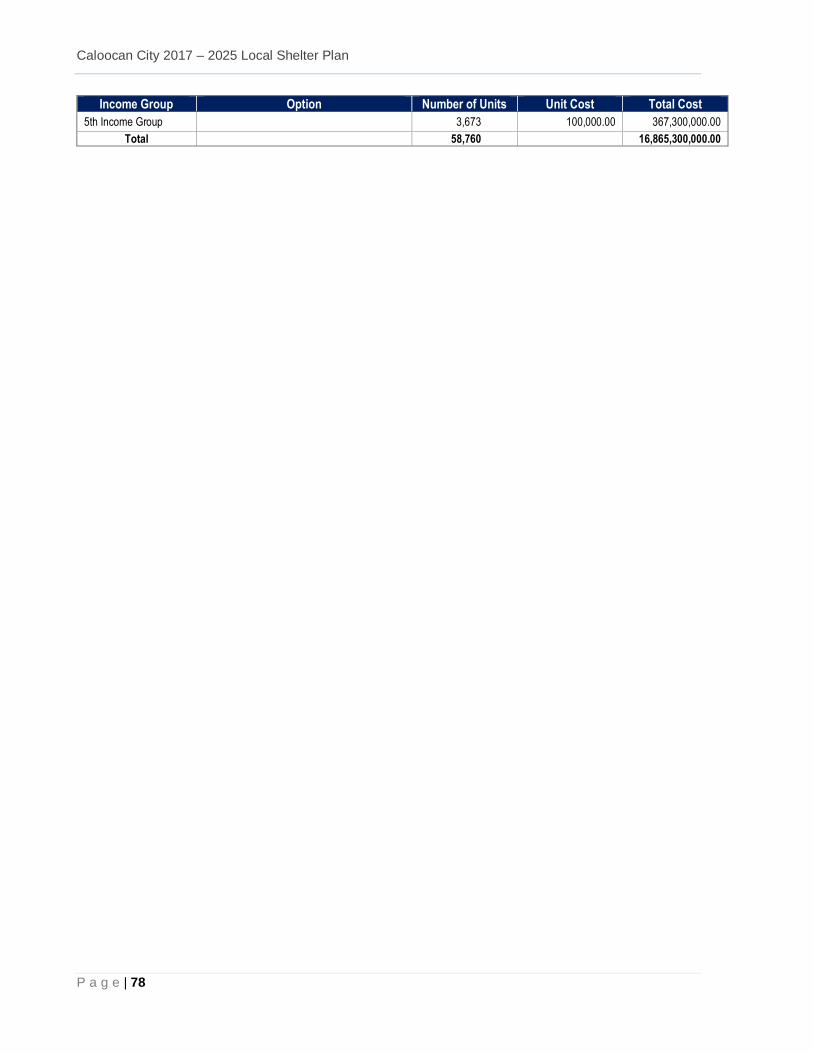
Caloocan City 2017 – 2025 Local Shelter Plan
P a g e | 78
Income Group Option Number of Units Unit Cost Total Cost
5th Income Group 3,673 100,000.00 367,300,000.00
Total 58,760 16,865,300,000.00
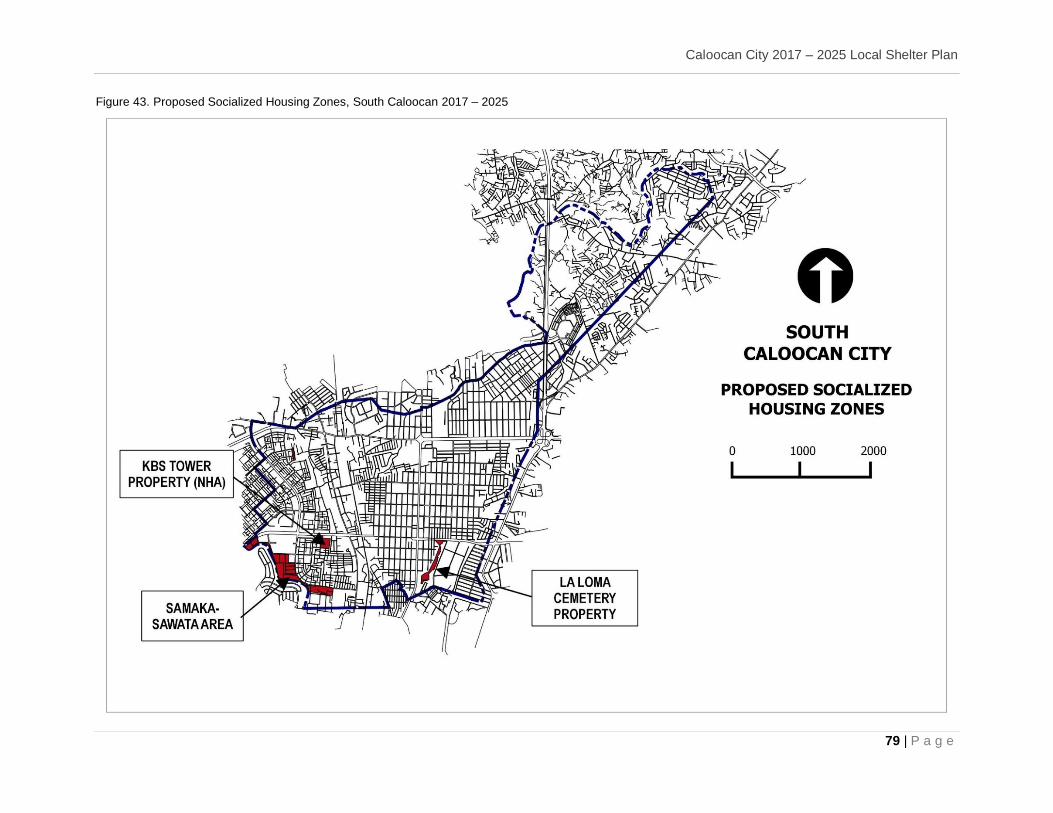
Caloocan City 2017 – 2025 Local Shelter Plan
79 | P a g e
Figure 43. Proposed Socialized Housing Zones, South Caloocan 2017 – 2025
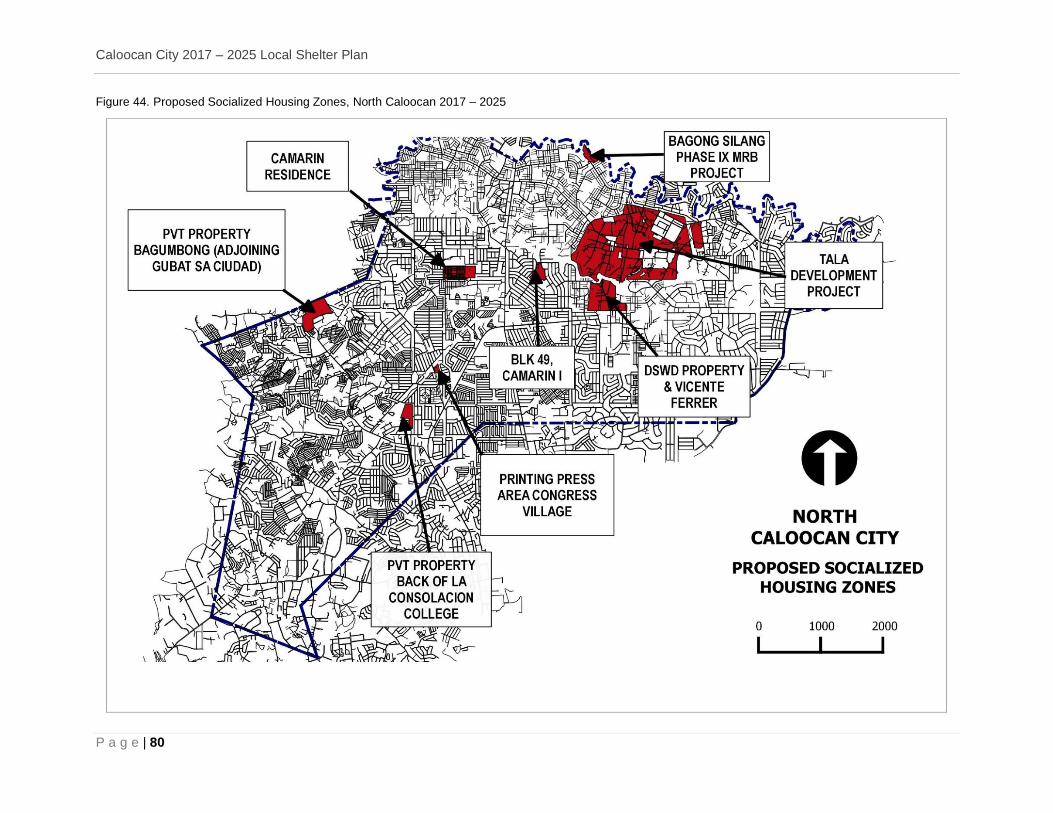
Caloocan City 2017 – 2025 Local Shelter Plan
P a g e | 80
Figure 44. Proposed Socialized Housing Zones, North Caloocan 2017 – 2025

Caloocan City 2017 – 2025 Local Shelter Plan
81 | P a g e
Table 55. Potential Sources of Funds for Shelter Provision, 2017
Agency/ Organization Name of Program Component Cost
(In Million PhP)
NHA
Low-rise Building (LRB) Bagong Silang II
- Site Development - Housing (360 units)
261.36
LRB Bagong Silang III
- Site Development - Housing (420 units)
304.92
Five-storey LRB Bagong Silang Residences
- Site Development - Housing(780 units)
468.00
LRB Camarin Residences 4
- Site Development - Housing(240 units)
108.00
LRB Tala Residences 3
- Site Development - Housing(60 units)
27.00
Caloocan City LGU Acquisition of lands for Socialized Housing Programs (Cardinal Ceramic Sites)
- Land Acquisition
222.00
Civic Center Property (2.0 Ha) - Site Survey - Site Development
1.00
Public - Private Partnership
CMP - Land Acquisition (3,555
Member Beneficiaries) - Site Development
299.19
People’s Plan
- Land Acquisition - Site Development - High Density Housing
(3,103 Beneficiaries)
1,396.35
TOTAL 3,087.82
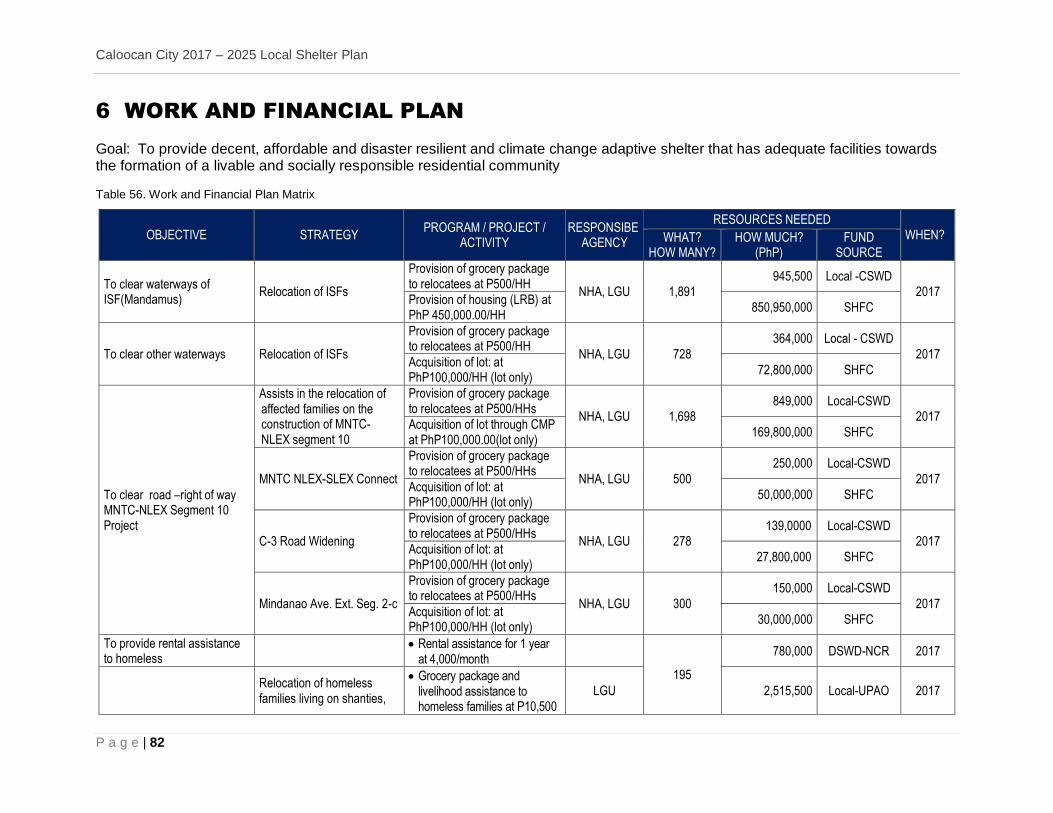
Caloocan City 2017 – 2025 Local Shelter Plan
P a g e | 82
6 WORK AND FINANCIAL PLAN
Goal: To provide decent, affordable and disaster resilient and climate change adaptive shelter that has adequate facilities towards the formation of a livable and socially responsible residential community Table 56. Work and Financial Plan Matrix
OBJECTIVE STRATEGY PROGRAM / PROJECT /
ACTIVITY RESPONSIBE
AGENCY
RESOURCES NEEDED WHEN? WHAT?
HOW MANY? HOW MUCH?
(PhP) FUND
SOURCE
To clear waterways of ISF(Mandamus)
Relocation of ISFs
Provision of grocery package to relocatees at P500/HH
NHA, LGU 1,891 945,500 Local -CSWD
2017 Provision of housing (LRB) at PhP 450,000.00/HH
850,950,000 SHFC
To clear other waterways Relocation of ISFs
Provision of grocery package to relocatees at P500/HH
NHA, LGU 728
364,000 Local - CSWD
2017 Acquisition of lot: at PhP100,000/HH (lot only)
72,800,000 SHFC
To clear road –right of way MNTC-NLEX Segment 10 Project
Assists in the relocation of affected families on the construction of MNTC- NLEX segment 10
Provision of grocery package to relocatees at P500/HHs
NHA, LGU 1,698 849,000 Local-CSWD
2017 Acquisition of lot through CMP at PhP100,000.00(lot only)
169,800,000 SHFC
MNTC NLEX-SLEX Connect
Provision of grocery package to relocatees at P500/HHs
NHA, LGU 500
250,000 Local-CSWD
2017 Acquisition of lot: at PhP100,000/HH (lot only)
50,000,000 SHFC
C-3 Road Widening
Provision of grocery package to relocatees at P500/HHs
NHA, LGU 278 139,0000 Local-CSWD
2017 Acquisition of lot: at PhP100,000/HH (lot only)
27,800,000 SHFC
Mindanao Ave. Ext. Seg. 2-c
Provision of grocery package to relocatees at P500/HHs
NHA, LGU 300
150,000 Local-CSWD
2017 Acquisition of lot: at PhP100,000/HH (lot only)
30,000,000 SHFC
To provide rental assistance to homeless
Rental assistance for 1 year
at 4,000/month
195
780,000 DSWD-NCR 2017
Relocation of homeless families living on shanties,
Grocery package and livelihood assistance to homeless families at P10,500
LGU 2,515,500 Local-UPAO 2017
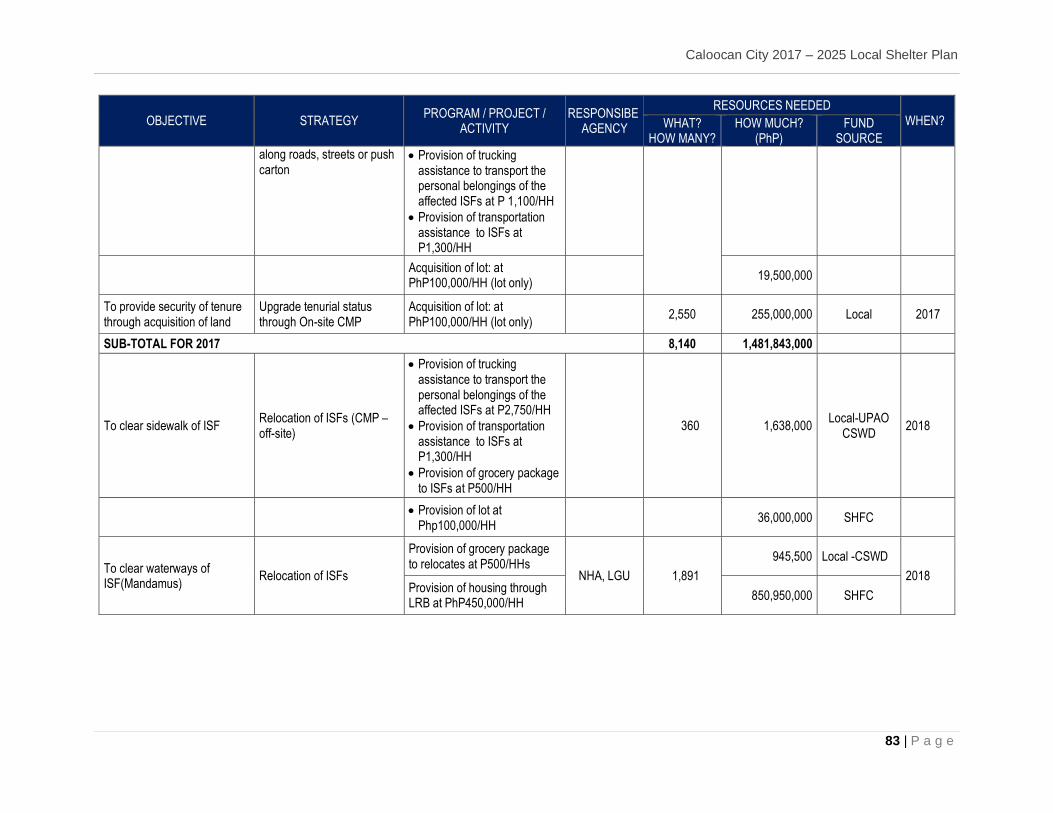
Caloocan City 2017 – 2025 Local Shelter Plan
83 | P a g e
OBJECTIVE STRATEGY PROGRAM / PROJECT /
ACTIVITY RESPONSIBE
AGENCY
RESOURCES NEEDED WHEN? WHAT?
HOW MANY? HOW MUCH?
(PhP) FUND
SOURCE
along roads, streets or push carton
Provision of trucking assistance to transport the personal belongings of the affected ISFs at P 1,100/HH
Provision of transportation assistance to ISFs at P1,300/HH
Acquisition of lot: at PhP100,000/HH (lot only)
19,500,000
To provide security of tenure through acquisition of land
Upgrade tenurial status through On-site CMP
Acquisition of lot: at PhP100,000/HH (lot only)
2,550 255,000,000 Local 2017
SUB-TOTAL FOR 2017 8,140 1,481,843,000
To clear sidewalk of ISF Relocation of ISFs (CMP – off-site)
Provision of trucking assistance to transport the personal belongings of the affected ISFs at P2,750/HH
Provision of transportation assistance to ISFs at P1,300/HH
Provision of grocery package to ISFs at P500/HH
360 1,638,000 Local-UPAO
CSWD 2018
Provision of lot at
Php100,000/HH 36,000,000 SHFC
To clear waterways of ISF(Mandamus)
Relocation of ISFs
Provision of grocery package to relocates at P500/HHs
NHA, LGU 1,891
945,500 Local -CSWD
2018 Provision of housing through LRB at PhP450,000/HH
850,950,000 SHFC
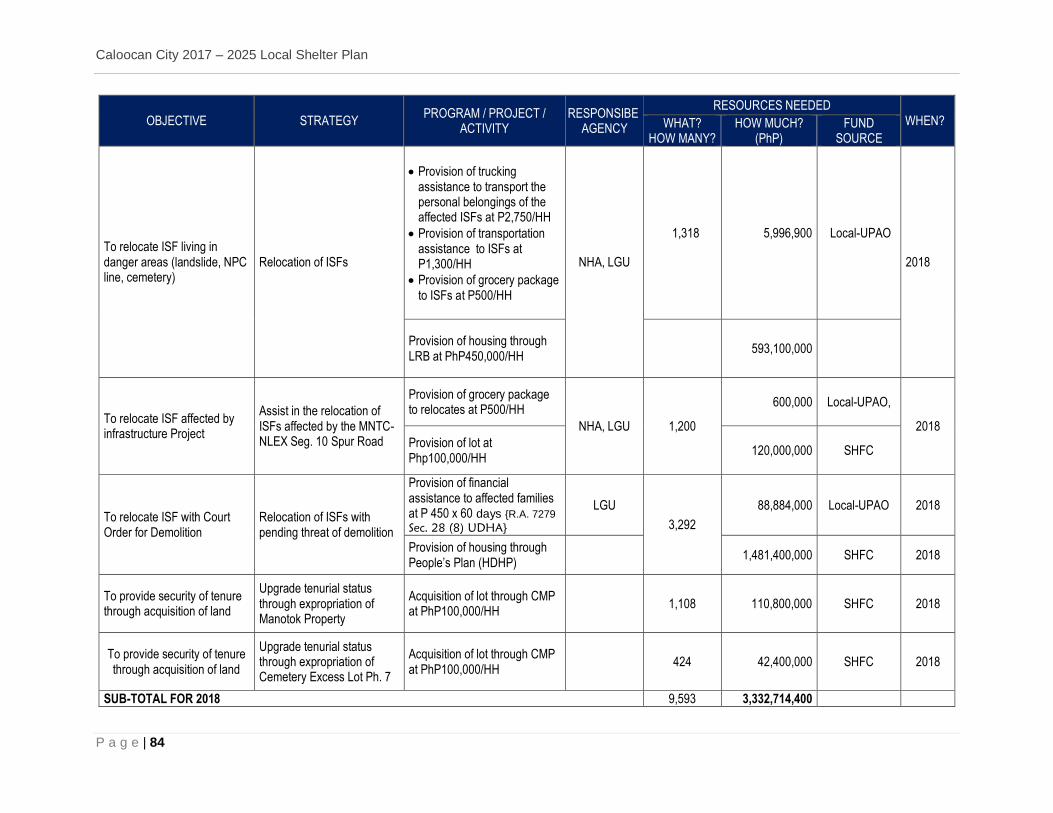
Caloocan City 2017 – 2025 Local Shelter Plan
P a g e | 84
OBJECTIVE STRATEGY PROGRAM / PROJECT /
ACTIVITY RESPONSIBE
AGENCY
RESOURCES NEEDED WHEN? WHAT?
HOW MANY? HOW MUCH?
(PhP) FUND
SOURCE
To relocate ISF living in danger areas (landslide, NPC line, cemetery)
Relocation of ISFs
Provision of trucking assistance to transport the personal belongings of the affected ISFs at P2,750/HH
Provision of transportation assistance to ISFs at P1,300/HH
Provision of grocery package to ISFs at P500/HH
NHA, LGU
1,318 5,996,900 Local-UPAO
2018
Provision of housing through LRB at PhP450,000/HH
593,100,000
To relocate ISF affected by infrastructure Project
Assist in the relocation of ISFs affected by the MNTC-NLEX Seg. 10 Spur Road
Provision of grocery package to relocates at P500/HH
NHA, LGU 1,200
600,000 Local-UPAO,
2018
Provision of lot at Php100,000/HH
120,000,000 SHFC
To relocate ISF with Court Order for Demolition
Relocation of ISFs with pending threat of demolition
Provision of financial assistance to affected families at P 450 x 60 days {R.A. 7279
Sec. 28 (8) UDHA}
LGU
3,292
88,884,000 Local-UPAO 2018
Provision of housing through People’s Plan (HDHP)
1,481,400,000 SHFC 2018
To provide security of tenure through acquisition of land
Upgrade tenurial status through expropriation of Manotok Property
Acquisition of lot through CMP at PhP100,000/HH
1,108 110,800,000 SHFC 2018
To provide security of tenure through acquisition of land
Upgrade tenurial status through expropriation of Cemetery Excess Lot Ph. 7
Acquisition of lot through CMP at PhP100,000/HH
424 42,400,000 SHFC 2018
SUB-TOTAL FOR 2018 9,593 3,332,714,400
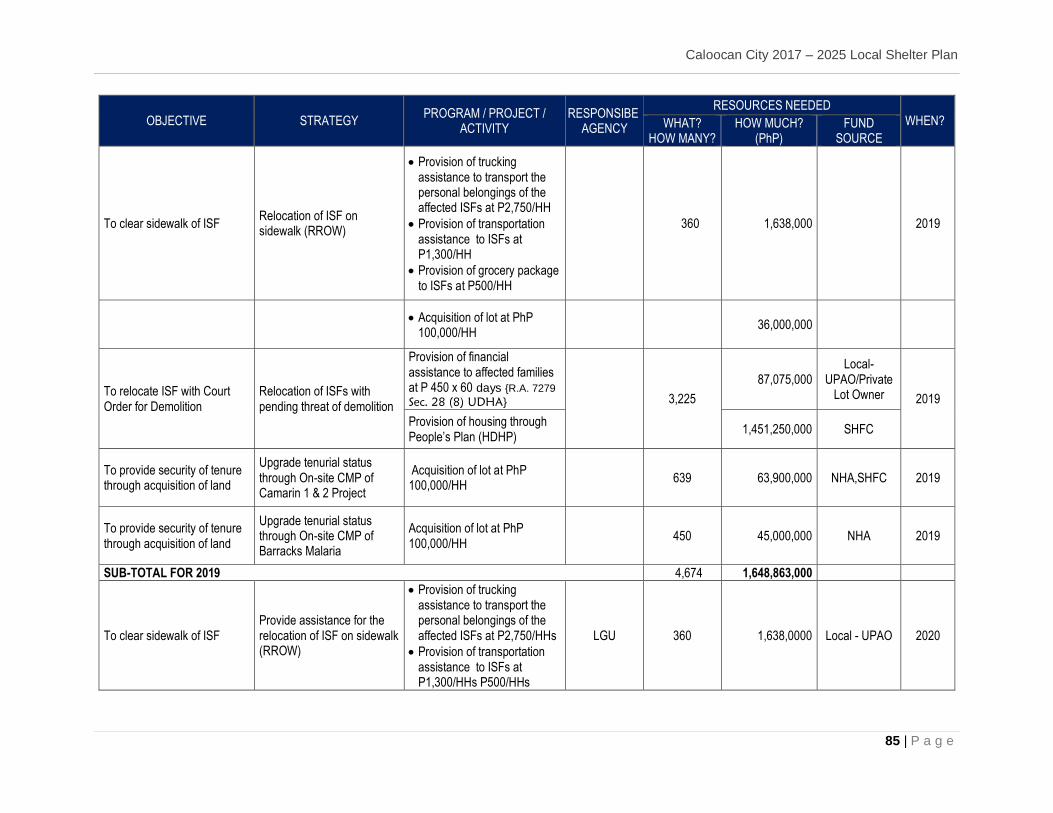
Caloocan City 2017 – 2025 Local Shelter Plan
85 | P a g e
OBJECTIVE STRATEGY PROGRAM / PROJECT /
ACTIVITY RESPONSIBE
AGENCY
RESOURCES NEEDED WHEN? WHAT?
HOW MANY? HOW MUCH?
(PhP) FUND
SOURCE
To clear sidewalk of ISF Relocation of ISF on sidewalk (RROW)
Provision of trucking assistance to transport the personal belongings of the affected ISFs at P2,750/HH
Provision of transportation assistance to ISFs at P1,300/HH
Provision of grocery package to ISFs at P500/HH
360 1,638,000
2019
Acquisition of lot at PhP
100,000/HH 36,000,000
To relocate ISF with Court Order for Demolition
Relocation of ISFs with pending threat of demolition
Provision of financial assistance to affected families at P 450 x 60 days {R.A. 7279
Sec. 28 (8) UDHA}
3,225
87,075,000 Local-
UPAO/Private Lot Owner 2019
Provision of housing through People’s Plan (HDHP)
1,451,250,000 SHFC
To provide security of tenure through acquisition of land
Upgrade tenurial status through On-site CMP of Camarin 1 & 2 Project
Acquisition of lot at PhP 100,000/HH
639 63,900,000 NHA,SHFC 2019
To provide security of tenure through acquisition of land
Upgrade tenurial status through On-site CMP of Barracks Malaria
Acquisition of lot at PhP 100,000/HH
450 45,000,000 NHA 2019
SUB-TOTAL FOR 2019 4,674 1,648,863,000
To clear sidewalk of ISF Provide assistance for the relocation of ISF on sidewalk (RROW)
Provision of trucking assistance to transport the personal belongings of the affected ISFs at P2,750/HHs
Provision of transportation assistance to ISFs at P1,300/HHs P500/HHs
LGU 360 1,638,0000 Local - UPAO 2020
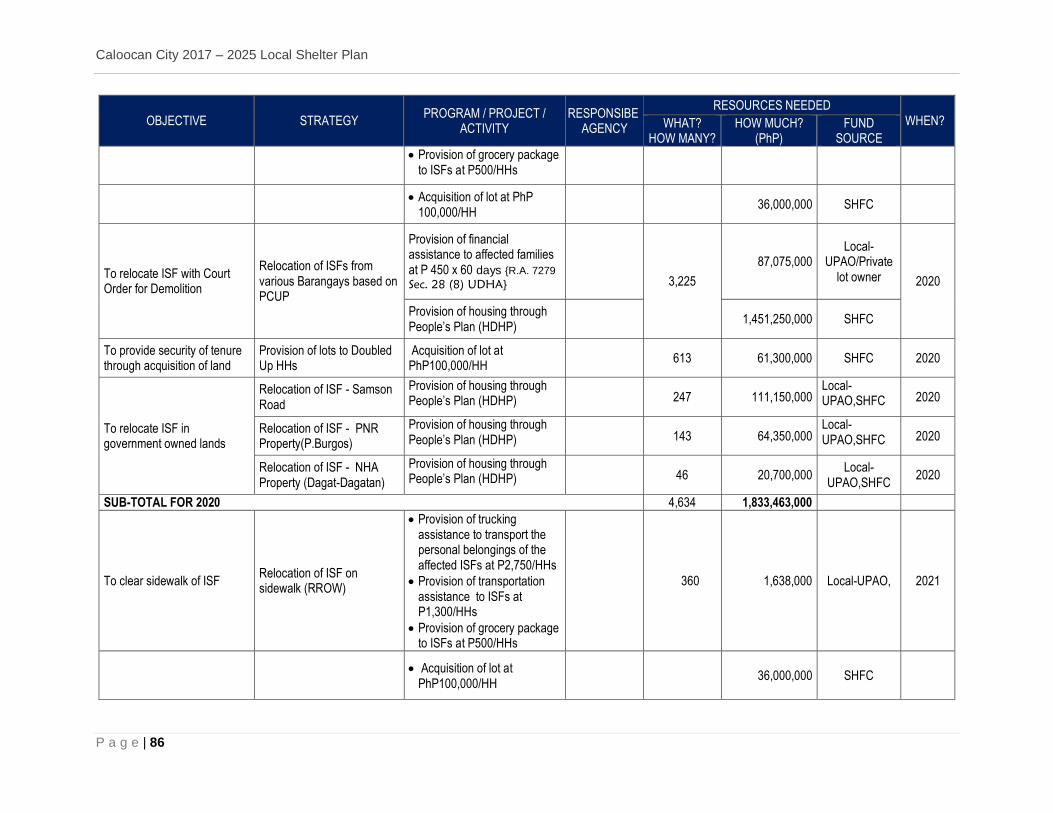
Caloocan City 2017 – 2025 Local Shelter Plan
P a g e | 86
OBJECTIVE STRATEGY PROGRAM / PROJECT /
ACTIVITY RESPONSIBE
AGENCY
RESOURCES NEEDED WHEN? WHAT?
HOW MANY? HOW MUCH?
(PhP) FUND
SOURCE
Provision of grocery package to ISFs at P500/HHs
Acquisition of lot at PhP
100,000/HH 36,000,000 SHFC
To relocate ISF with Court Order for Demolition
Relocation of ISFs from various Barangays based on PCUP
Provision of financial assistance to affected families at P 450 x 60 days {R.A. 7279
Sec. 28 (8) UDHA}
3,225
87,075,000 Local-
UPAO/Private lot owner 2020
Provision of housing through People’s Plan (HDHP)
1,451,250,000 SHFC
To provide security of tenure through acquisition of land
Provision of lots to Doubled Up HHs
Acquisition of lot at PhP100,000/HH
613 61,300,000 SHFC 2020
To relocate ISF in government owned lands
Relocation of ISF - Samson Road
Provision of housing through People’s Plan (HDHP)
247 111,150,000
Local-UPAO,SHFC 2020
Relocation of ISF - PNR Property(P.Burgos)
Provision of housing through People’s Plan (HDHP)
143 64,350,000
Local-UPAO,SHFC 2020
Relocation of ISF - NHA Property (Dagat-Dagatan)
Provision of housing through People’s Plan (HDHP)
46 20,700,000
Local-UPAO,SHFC
2020
SUB-TOTAL FOR 2020 4,634 1,833,463,000
To clear sidewalk of ISF Relocation of ISF on sidewalk (RROW)
Provision of trucking assistance to transport the personal belongings of the affected ISFs at P2,750/HHs
Provision of transportation assistance to ISFs at P1,300/HHs
Provision of grocery package to ISFs at P500/HHs
360 1,638,000 Local-UPAO, 2021
Acquisition of lot at
PhP100,000/HH 36,000,000 SHFC
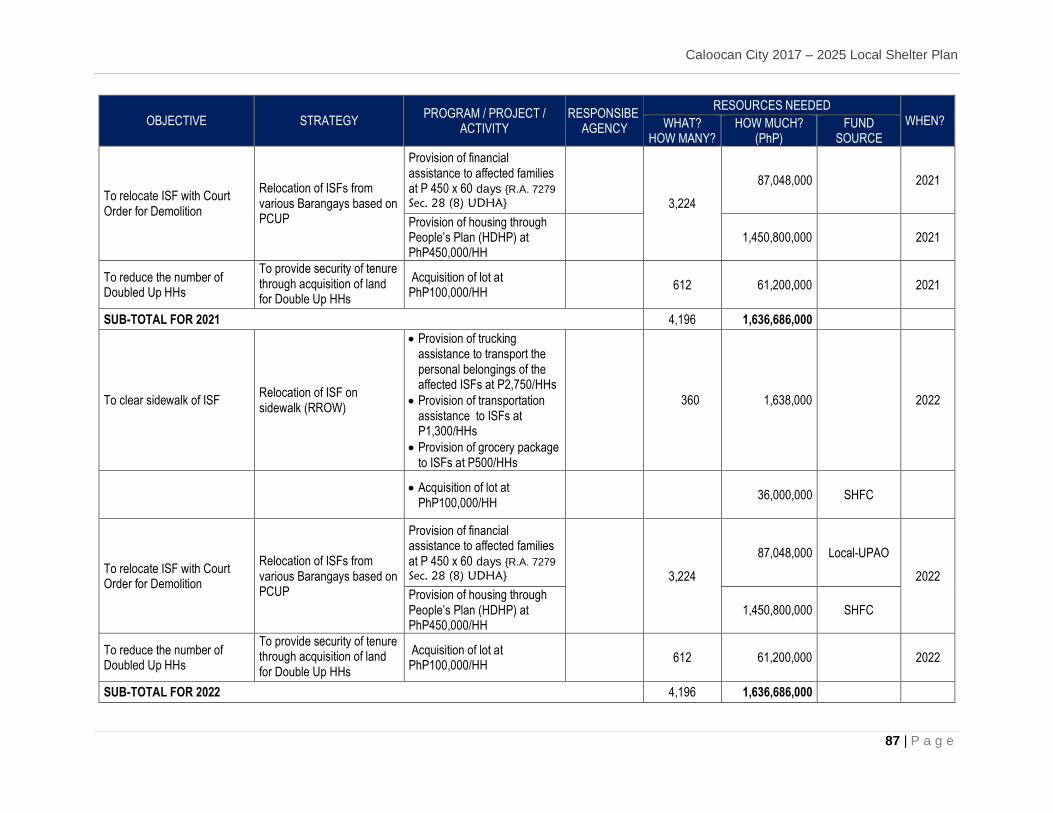
Caloocan City 2017 – 2025 Local Shelter Plan
87 | P a g e
OBJECTIVE STRATEGY PROGRAM / PROJECT /
ACTIVITY RESPONSIBE
AGENCY
RESOURCES NEEDED WHEN? WHAT?
HOW MANY? HOW MUCH?
(PhP) FUND
SOURCE
To relocate ISF with Court Order for Demolition
Relocation of ISFs from various Barangays based on PCUP
Provision of financial assistance to affected families at P 450 x 60 days {R.A. 7279
Sec. 28 (8) UDHA}
3,224
87,048,000
2021
Provision of housing through People’s Plan (HDHP) at PhP450,000/HH
1,450,800,000
2021
To reduce the number of Doubled Up HHs
To provide security of tenure through acquisition of land for Double Up HHs
Acquisition of lot at PhP100,000/HH
612 61,200,000
2021
SUB-TOTAL FOR 2021 4,196 1,636,686,000
To clear sidewalk of ISF Relocation of ISF on sidewalk (RROW)
Provision of trucking assistance to transport the personal belongings of the affected ISFs at P2,750/HHs
Provision of transportation assistance to ISFs at P1,300/HHs
Provision of grocery package to ISFs at P500/HHs
360 1,638,000
2022
Acquisition of lot at
PhP100,000/HH 36,000,000 SHFC
To relocate ISF with Court Order for Demolition
Relocation of ISFs from various Barangays based on PCUP
Provision of financial assistance to affected families at P 450 x 60 days {R.A. 7279
Sec. 28 (8) UDHA}
3,224
87,048,000 Local-UPAO
2022
Provision of housing through People’s Plan (HDHP) at PhP450,000/HH
1,450,800,000 SHFC
To reduce the number of Doubled Up HHs
To provide security of tenure through acquisition of land for Double Up HHs
Acquisition of lot at PhP100,000/HH
612 61,200,000
2022
SUB-TOTAL FOR 2022 4,196 1,636,686,000
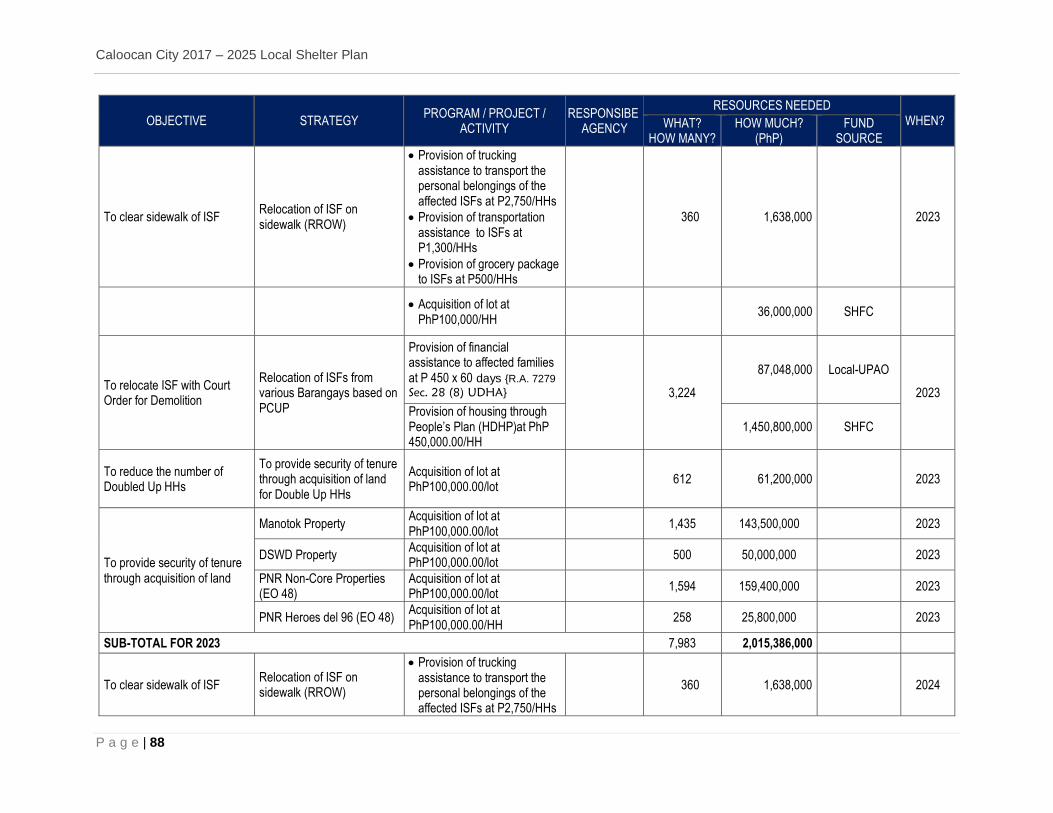
Caloocan City 2017 – 2025 Local Shelter Plan
P a g e | 88
OBJECTIVE STRATEGY PROGRAM / PROJECT /
ACTIVITY RESPONSIBE
AGENCY
RESOURCES NEEDED WHEN? WHAT?
HOW MANY? HOW MUCH?
(PhP) FUND
SOURCE
To clear sidewalk of ISF Relocation of ISF on sidewalk (RROW)
Provision of trucking assistance to transport the personal belongings of the affected ISFs at P2,750/HHs
Provision of transportation assistance to ISFs at P1,300/HHs
Provision of grocery package to ISFs at P500/HHs
360 1,638,000
2023
Acquisition of lot at
PhP100,000/HH 36,000,000 SHFC
To relocate ISF with Court Order for Demolition
Relocation of ISFs from various Barangays based on PCUP
Provision of financial assistance to affected families at P 450 x 60 days {R.A. 7279
Sec. 28 (8) UDHA}
3,224
87,048,000 Local-UPAO
2023
Provision of housing through People’s Plan (HDHP)at PhP 450,000.00/HH
1,450,800,000 SHFC
To reduce the number of Doubled Up HHs
To provide security of tenure through acquisition of land for Double Up HHs
Acquisition of lot at PhP100,000.00/lot
612 61,200,000 2023
To provide security of tenure through acquisition of land
Manotok Property Acquisition of lot at PhP100,000.00/lot
1,435 143,500,000 2023
DSWD Property Acquisition of lot at PhP100,000.00/lot
500 50,000,000 2023
PNR Non-Core Properties (EO 48)
Acquisition of lot at PhP100,000.00/lot
1,594 159,400,000 2023
PNR Heroes del 96 (EO 48) Acquisition of lot at PhP100,000.00/HH
258 25,800,000 2023
SUB-TOTAL FOR 2023 7,983 2,015,386,000
To clear sidewalk of ISF Relocation of ISF on sidewalk (RROW)
Provision of trucking assistance to transport the personal belongings of the affected ISFs at P2,750/HHs
360 1,638,000
2024
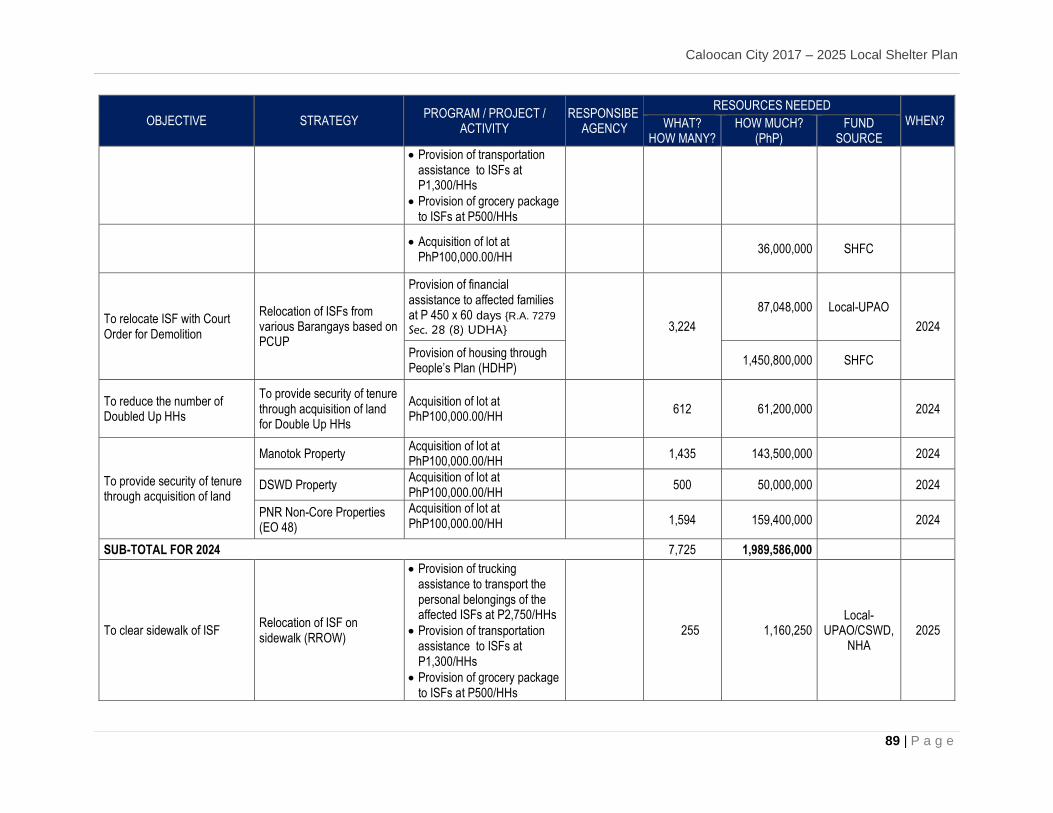
Caloocan City 2017 – 2025 Local Shelter Plan
89 | P a g e
OBJECTIVE STRATEGY PROGRAM / PROJECT /
ACTIVITY RESPONSIBE
AGENCY
RESOURCES NEEDED WHEN? WHAT?
HOW MANY? HOW MUCH?
(PhP) FUND
SOURCE
Provision of transportation assistance to ISFs at P1,300/HHs
Provision of grocery package to ISFs at P500/HHs
Acquisition of lot at
PhP100,000.00/HH 36,000,000 SHFC
To relocate ISF with Court Order for Demolition
Relocation of ISFs from various Barangays based on PCUP
Provision of financial assistance to affected families at P 450 x 60 days {R.A. 7279
Sec. 28 (8) UDHA}
3,224
87,048,000 Local-UPAO
2024
Provision of housing through People’s Plan (HDHP)
1,450,800,000 SHFC
To reduce the number of Doubled Up HHs
To provide security of tenure through acquisition of land for Double Up HHs
Acquisition of lot at PhP100,000.00/HH
612 61,200,000 2024
To provide security of tenure through acquisition of land
Manotok Property Acquisition of lot at PhP100,000.00/HH
1,435 143,500,000 2024
DSWD Property Acquisition of lot at PhP100,000.00/HH
500 50,000,000 2024
PNR Non-Core Properties (EO 48)
Acquisition of lot at PhP100,000.00/HH
1,594 159,400,000 2024
SUB-TOTAL FOR 2024 7,725 1,989,586,000
To clear sidewalk of ISF Relocation of ISF on sidewalk (RROW)
Provision of trucking assistance to transport the personal belongings of the affected ISFs at P2,750/HHs
Provision of transportation assistance to ISFs at P1,300/HHs
Provision of grocery package to ISFs at P500/HHs
255 1,160,250 Local-
UPAO/CSWD, NHA
2025
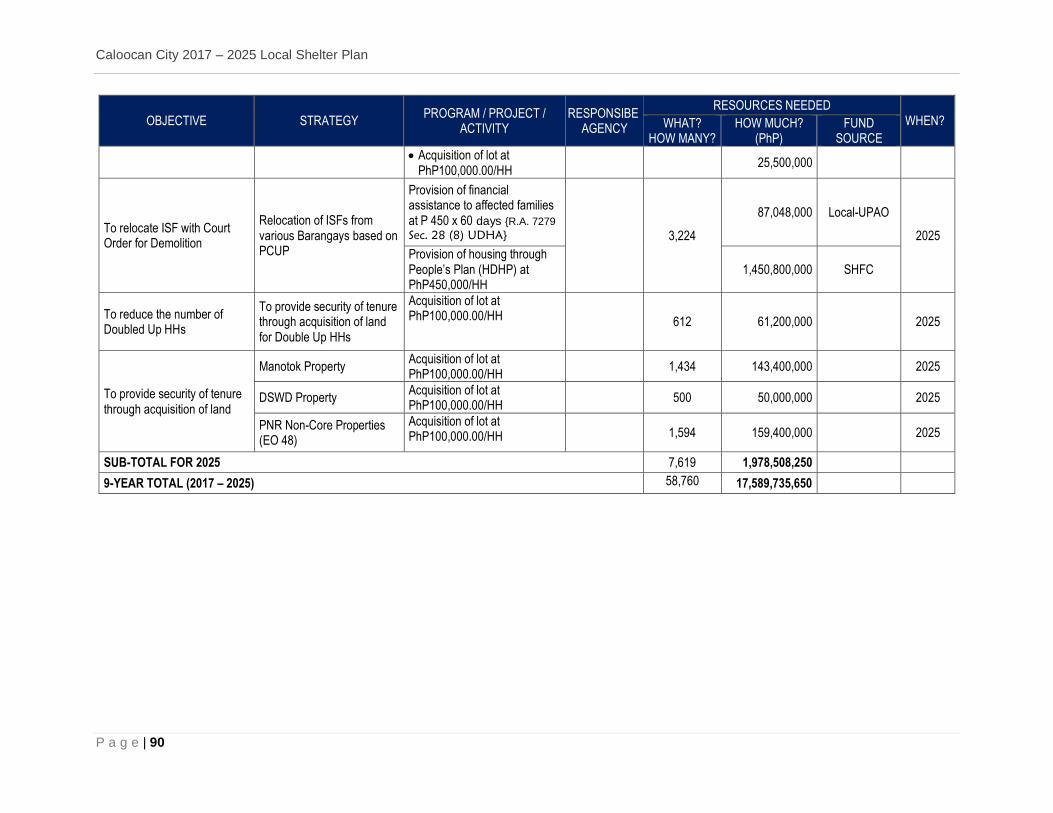
Caloocan City 2017 – 2025 Local Shelter Plan
P a g e | 90
OBJECTIVE STRATEGY PROGRAM / PROJECT /
ACTIVITY RESPONSIBE
AGENCY
RESOURCES NEEDED WHEN? WHAT?
HOW MANY? HOW MUCH?
(PhP) FUND
SOURCE
Acquisition of lot at
PhP100,000.00/HH 25,500,000
To relocate ISF with Court Order for Demolition
Relocation of ISFs from various Barangays based on PCUP
Provision of financial assistance to affected families at P 450 x 60 days {R.A. 7279
Sec. 28 (8) UDHA}
3,224
87,048,000 Local-UPAO
2025
Provision of housing through People’s Plan (HDHP) at PhP450,000/HH
1,450,800,000 SHFC
To reduce the number of Doubled Up HHs
To provide security of tenure through acquisition of land for Double Up HHs
Acquisition of lot at PhP100,000.00/HH
612 61,200,000 2025
To provide security of tenure through acquisition of land
Manotok Property Acquisition of lot at PhP100,000.00/HH
1,434 143,400,000 2025
DSWD Property Acquisition of lot at PhP100,000.00/HH
500 50,000,000 2025
PNR Non-Core Properties (EO 48)
Acquisition of lot at PhP100,000.00/HH
1,594 159,400,000 2025
SUB-TOTAL FOR 2025 7,619 1,978,508,250
9-YEAR TOTAL (2017 – 2025) 58,760 17,589,735,650
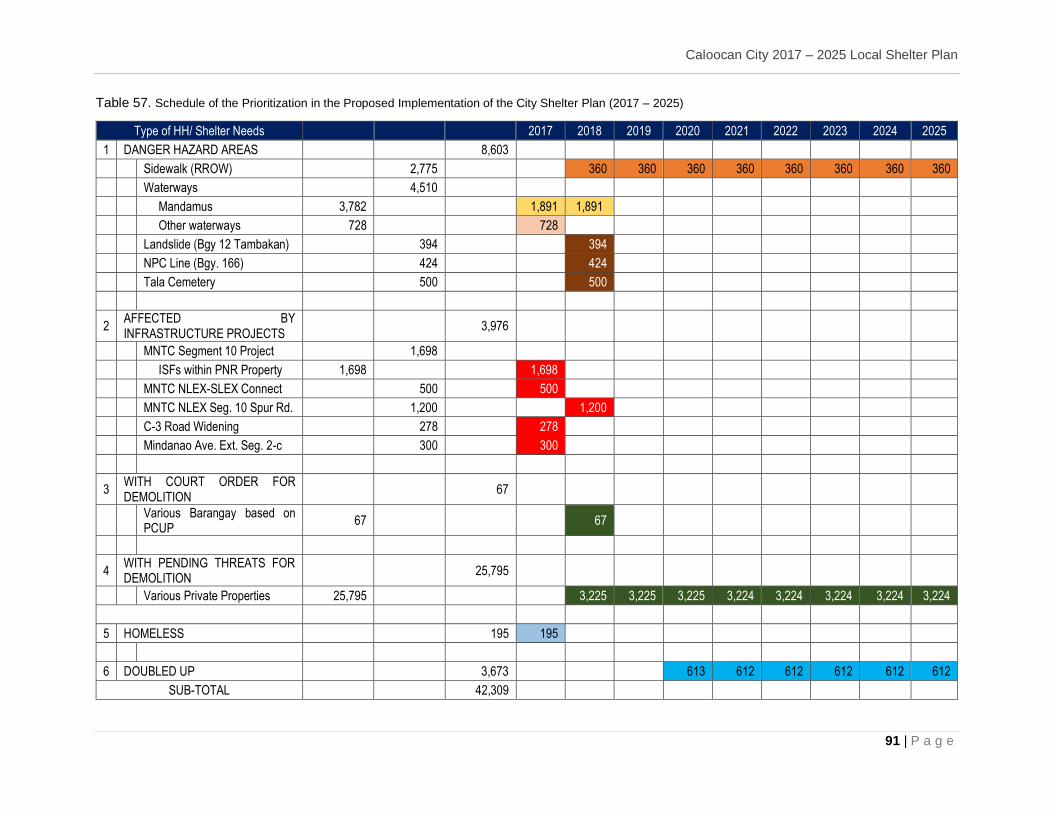
Caloocan City 2017 – 2025 Local Shelter Plan
91 | P a g e
Table 57. Schedule of the Prioritization in the Proposed Implementation of the City Shelter Plan (2017 – 2025)
Type of HH/ Shelter Needs 2017 2018 2019 2020 2021 2022 2023 2024 2025
1 DANGER HAZARD AREAS 8,603
Sidewalk (RROW) 2,775 360 360 360 360 360 360 360 360
Waterways 4,510
Mandamus 3,782 1,891 1,891
Other waterways 728 728
Landslide (Bgy 12 Tambakan) 394 394
NPC Line (Bgy. 166) 424 424
Tala Cemetery 500 500
2 AFFECTED BY INFRASTRUCTURE PROJECTS
3,976
MNTC Segment 10 Project 1,698
ISFs within PNR Property 1,698 1,698
MNTC NLEX-SLEX Connect 500 500
MNTC NLEX Seg. 10 Spur Rd. 1,200 1,200
C-3 Road Widening 278 278
Mindanao Ave. Ext. Seg. 2-c 300 300
3 WITH COURT ORDER FOR DEMOLITION
67
Various Barangay based on PCUP
67 67
4 WITH PENDING THREATS FOR DEMOLITION
25,795
Various Private Properties 25,795 3,225 3,225 3,225 3,224 3,224 3,224 3,224 3,224
5 HOMELESS 195 195
6 DOUBLED UP 3,673 613 612 612 612 612 612
SUB-TOTAL 42,309
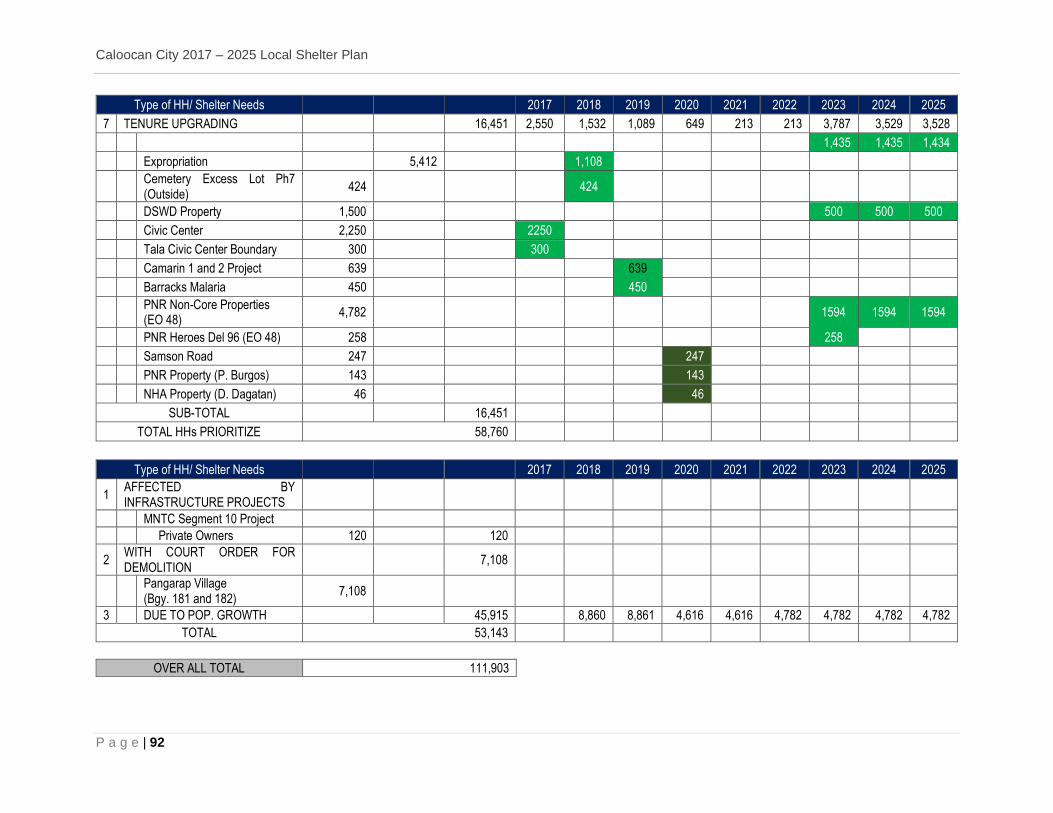
Caloocan City 2017 – 2025 Local Shelter Plan
P a g e | 92
Type of HH/ Shelter Needs 2017 2018 2019 2020 2021 2022 2023 2024 2025
7 TENURE UPGRADING 16,451 2,550 1,532 1,089 649 213 213 3,787 3,529 3,528
1,435 1,435 1,434
Expropriation 5,412 1,108
Cemetery Excess Lot Ph7 (Outside)
424 424
DSWD Property 1,500 500 500 500
Civic Center 2,250 2250
Tala Civic Center Boundary 300 300
Camarin 1 and 2 Project 639 639
Barracks Malaria 450 450
PNR Non-Core Properties (EO 48)
4,782 1594 1594 1594
PNR Heroes Del 96 (EO 48) 258 258
Samson Road 247 247
PNR Property (P. Burgos) 143 143
NHA Property (D. Dagatan) 46 46
SUB-TOTAL 16,451
TOTAL HHs PRIORITIZE 58,760
Type of HH/ Shelter Needs 2017 2018 2019 2020 2021 2022 2023 2024 2025
1 AFFECTED BY INFRASTRUCTURE PROJECTS
MNTC Segment 10 Project
Private Owners 120 120
2 WITH COURT ORDER FOR DEMOLITION
7,108
Pangarap Village (Bgy. 181 and 182)
7,108
3 DUE TO POP. GROWTH 45,915 8,860 8,861 4,616 4,616 4,782 4,782 4,782 4,782
TOTAL 53,143
OVER ALL TOTAL 111,903
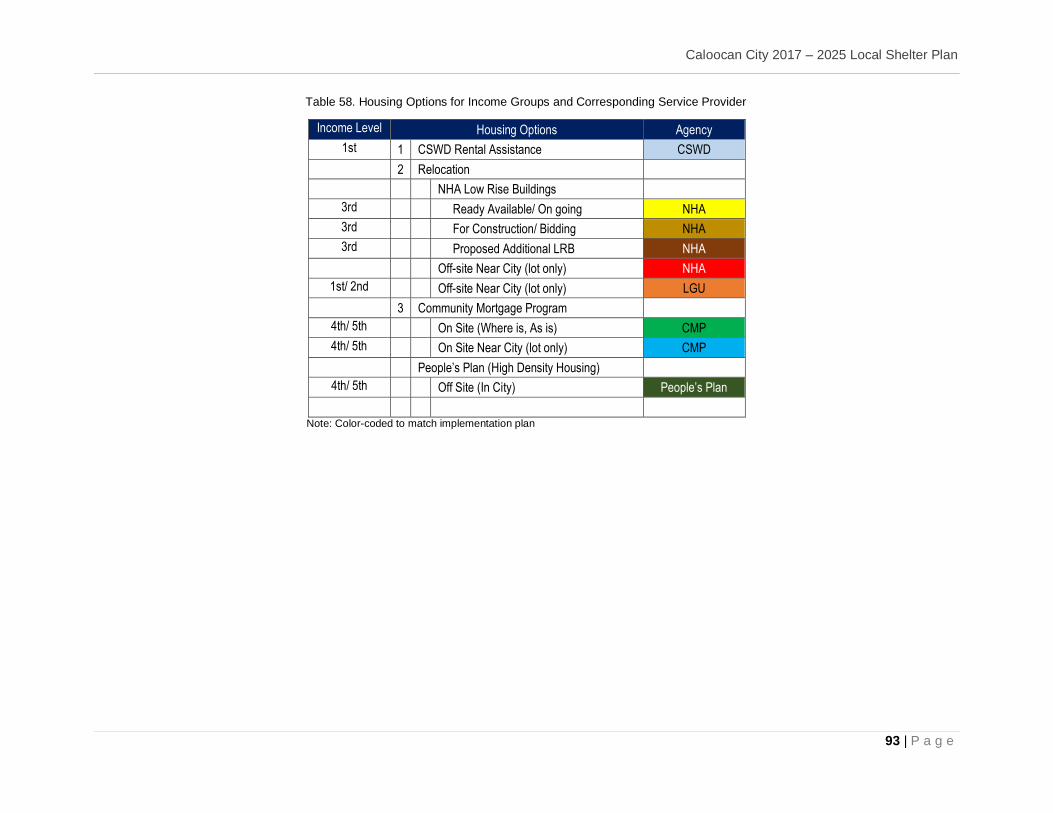
Caloocan City 2017 – 2025 Local Shelter Plan
93 | P a g e
Table 58. Housing Options for Income Groups and Corresponding Service Provider
Income Level Housing Options Agency
1st 1 CSWD Rental Assistance CSWD
2 Relocation
NHA Low Rise Buildings
3rd Ready Available/ On going NHA
3rd For Construction/ Bidding NHA 3rd Proposed Additional LRB NHA
Off-site Near City (lot only) NHA 1st/ 2nd Off-site Near City (lot only) LGU
3 Community Mortgage Program
4th/ 5th On Site (Where is, As is) CMP
4th/ 5th On Site Near City (lot only) CMP
People’s Plan (High Density Housing)
4th/ 5th Off Site (In City) People’s Plan
Note: Color-coded to match implementation plan
Caloocan City 2017 – 2025 Local Shelter Plan
P a g e | 94
7 MONITORING AND EVALUATION SCHEMES
7.1 MEANS OF IMPLEMENTATION The following Strategies in the areas of governance, coordination, financing, valuation and partnerships are adopted to facilitate the implementation of the framework of this plan. Other mechanism that may be appropriated during the formulation of the Action Plan shall be included.
Establish appropriate management and institutional arrangements and coordination mechanisms for shelter initiatives at the national, sub-national and local levels.
Maximize government financing instruments and local levels as source of funds for the
National Framework Strategy.
Install policy and incentive mechanism to facilitate and leverage private sector investments in shelter provision.
Provide and access scaled-up, new and additional financial resources to support the
requirements of the National Framework, including sectoral and local financing requirements.
Development of appropriate assessment tool such as carrying capacity assessment
incorporating an appropriate valuation methodology to improve decision-making, policy development, research and development (R&D), payment and incentive mechanism, and other shelter-related endeavors.
Establish partnerships among national and local government agencies, business,
professional and other private groups, community-based organizations, academic and scientific organizations, and civil society organizations.
7.2 MONITORING AND EVALUATION OF THE FRAMEWORK The Caloocan City Local Housing Board, in coordination with concerned agencies and stakeholder groups, shall install a monitoring and evaluation (M&E) system to track the implementation progress of the provisions of this Framework and its conformity to the National Climate Change Action Plan and Local Climate Change Action Plan. As per Section 48, Article X of Republic Act 7279, “The Housing and Urban Development Coordinating Council and the local government units shall submit a detailed annual report with respect to the implementation of this Act to the President and the Congress of the Republic of the Philippines”.
Caloocan City 2017 – 2025 Local Shelter Plan
95 | P a g e
8 SANGGUNIANG PANLUNGSOD APPROVAL
(See attached documents)
ANNEXES
BIBLIOGRAPHY 2010 Census of Population and Housing. National Statistics Office, 2010. Print and web. 2015 Census of Population. Philippine Statistics Authority, 2016. Print and web. 2016 - 2025 Comprehensive Land Use Plan – Integrating Disaster Risk Reduction and Climate Change Adaptation. Caloocan City Government, 2016. Print. LGU’s Guidebook for Local Housing Project/ Program. Makati City: Housing and Urban Development Coordinating Council. Print Training Workshop on the Local Shelter Plan Formulation. Modules I-VI, Manila: Housing and Urban Development Coordinating Council, April 2016. Print
Caloocan City 2017 – 2025 Local Shelter Plan
P a g e | 96
REFERENCE MAPS
North Caloocan Population Maps
South Caloocan Population Maps North Caloocan Land Suitability Map South Caloocan Land Suitability Map
Map of Informal Settlements, North Caloocan Map of Informal Settlements, North Caloocan Existing Land Use Map - North Caloocan City Proposed Land Use Map – North Caloocan City
Existing Land Use Map - South Caloocan City Proposed Land Use Map – South Caloocan City Existing Residential Land Use Map, North Caloocan City 2013 Proposed Residential Land Use Map, North Caloocan City
Existing Residential Land Use Map, South Caloocan City 2013 Proposed Residential Land Use Map, South Caloocan City
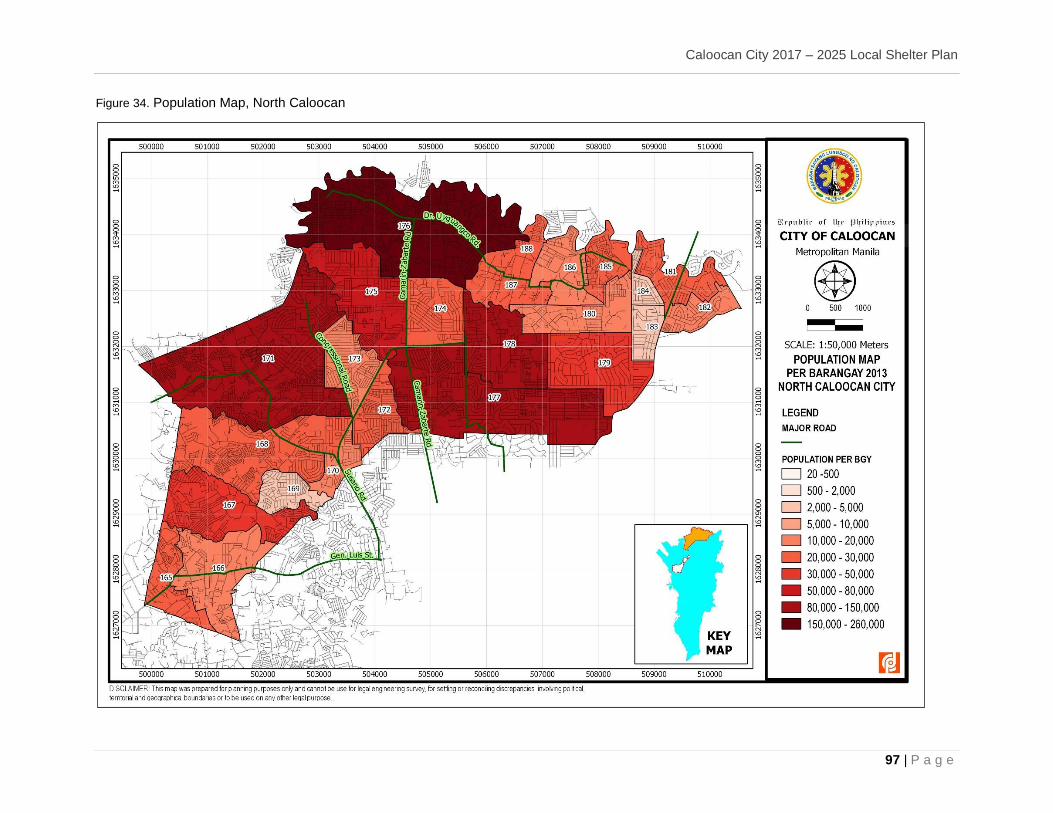
Caloocan City 2017 – 2025 Local Shelter Plan
97 | P a g e
Figure 34. Population Map, North Caloocan
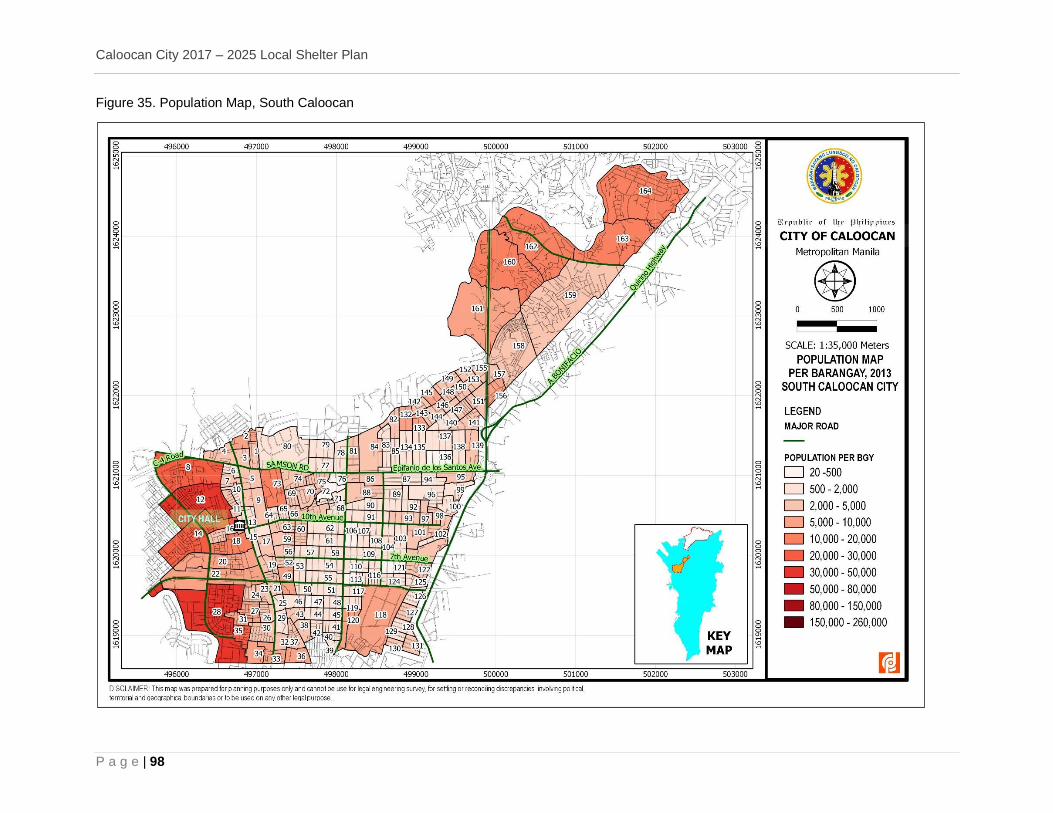
Caloocan City 2017 – 2025 Local Shelter Plan
P a g e | 98
Figure 35. Population Map, South Caloocan
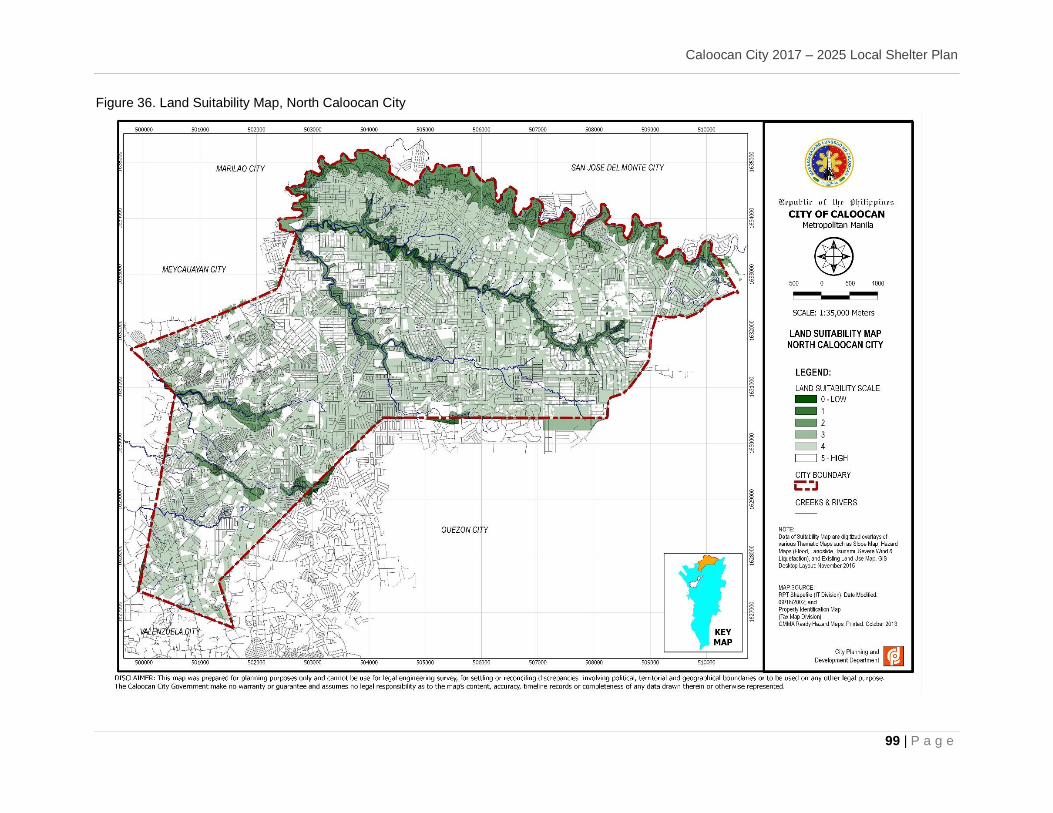
Caloocan City 2017 – 2025 Local Shelter Plan
99 | P a g e
Figure 36. Land Suitability Map, North Caloocan City
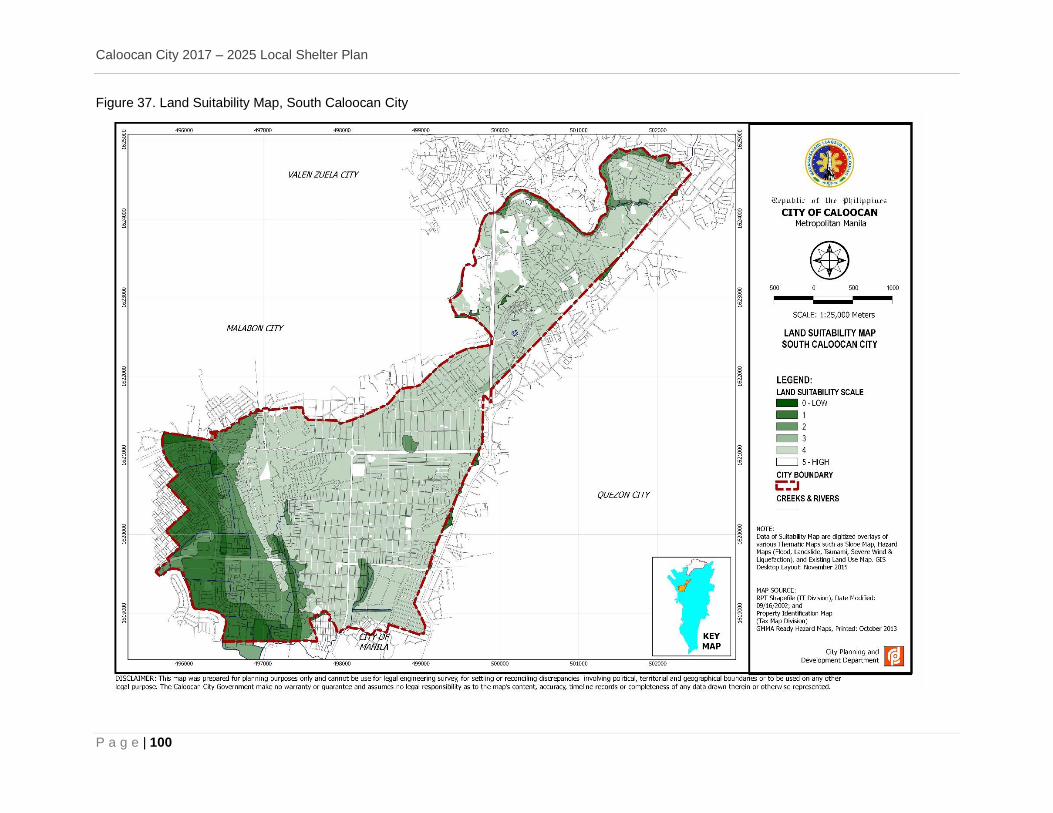
Caloocan City 2017 – 2025 Local Shelter Plan
P a g e | 100
Figure 37. Land Suitability Map, South Caloocan City
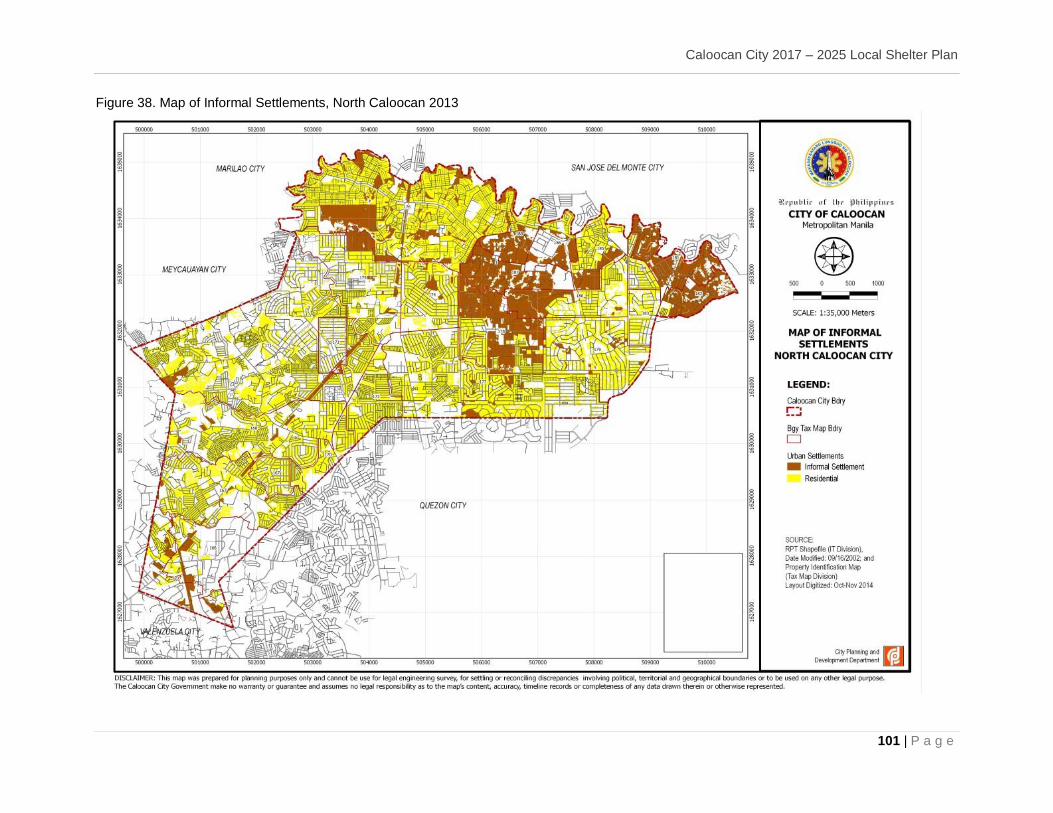
Caloocan City 2017 – 2025 Local Shelter Plan
101 | P a g e
Figure 38. Map of Informal Settlements, North Caloocan 2013
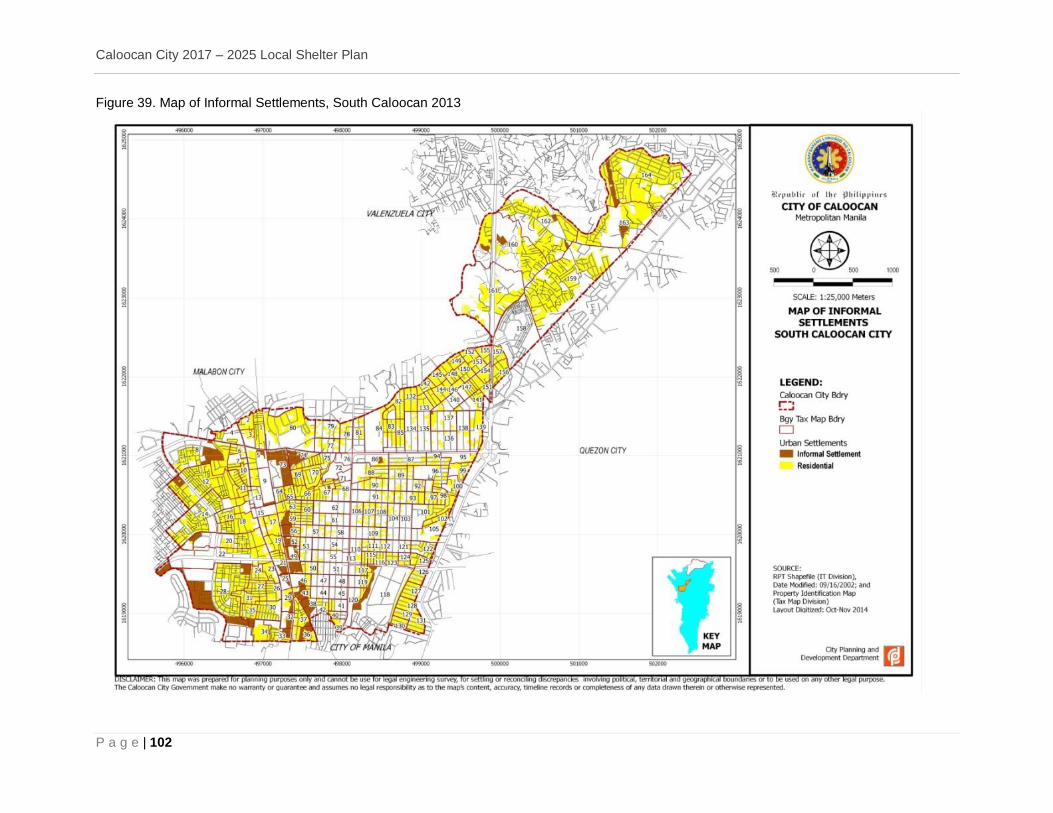
Caloocan City 2017 – 2025 Local Shelter Plan
P a g e | 102
Figure 39. Map of Informal Settlements, South Caloocan 2013
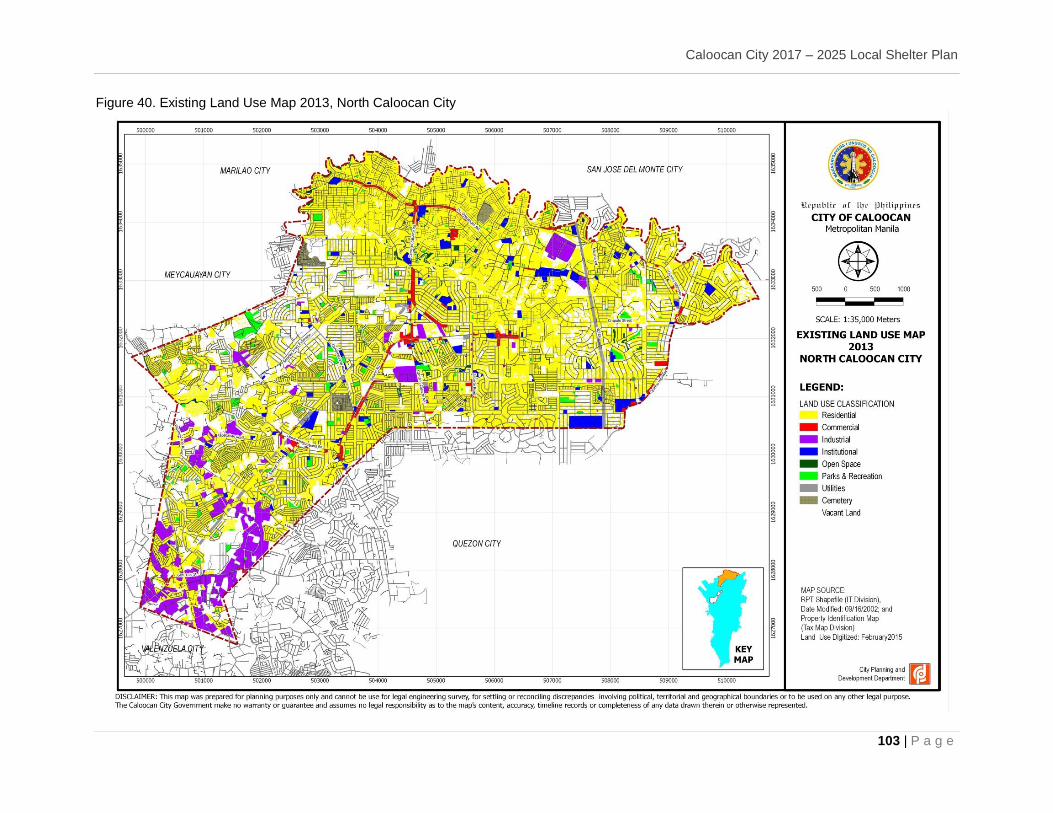
Caloocan City 2017 – 2025 Local Shelter Plan
103 | P a g e
Figure 40. Existing Land Use Map 2013, North Caloocan City
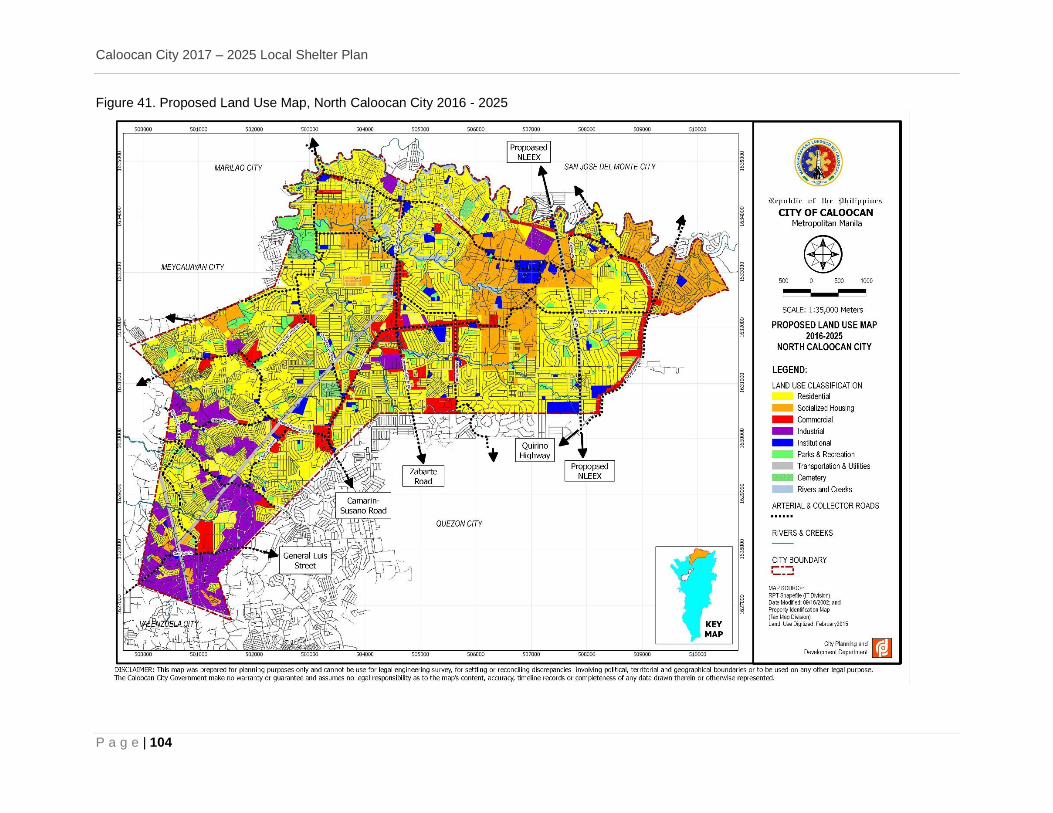
Caloocan City 2017 – 2025 Local Shelter Plan
P a g e | 104
Figure 41. Proposed Land Use Map, North Caloocan City 2016 - 2025
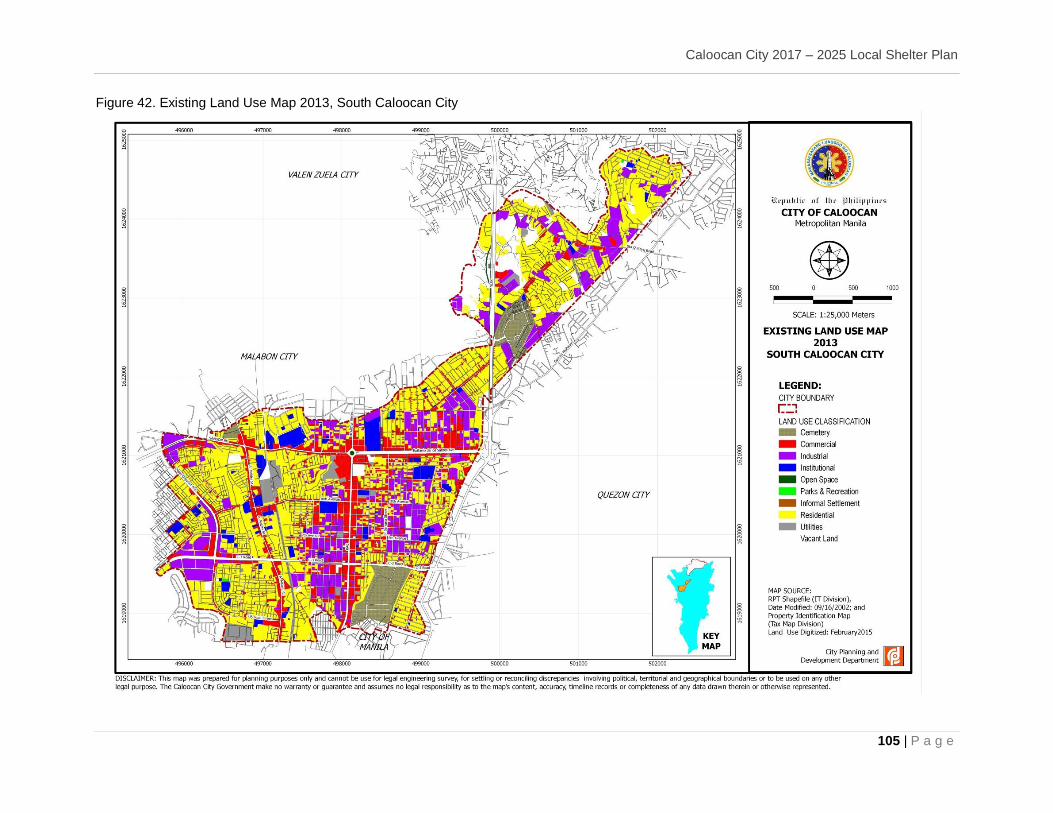
Caloocan City 2017 – 2025 Local Shelter Plan
105 | P a g e
Figure 42. Existing Land Use Map 2013, South Caloocan City
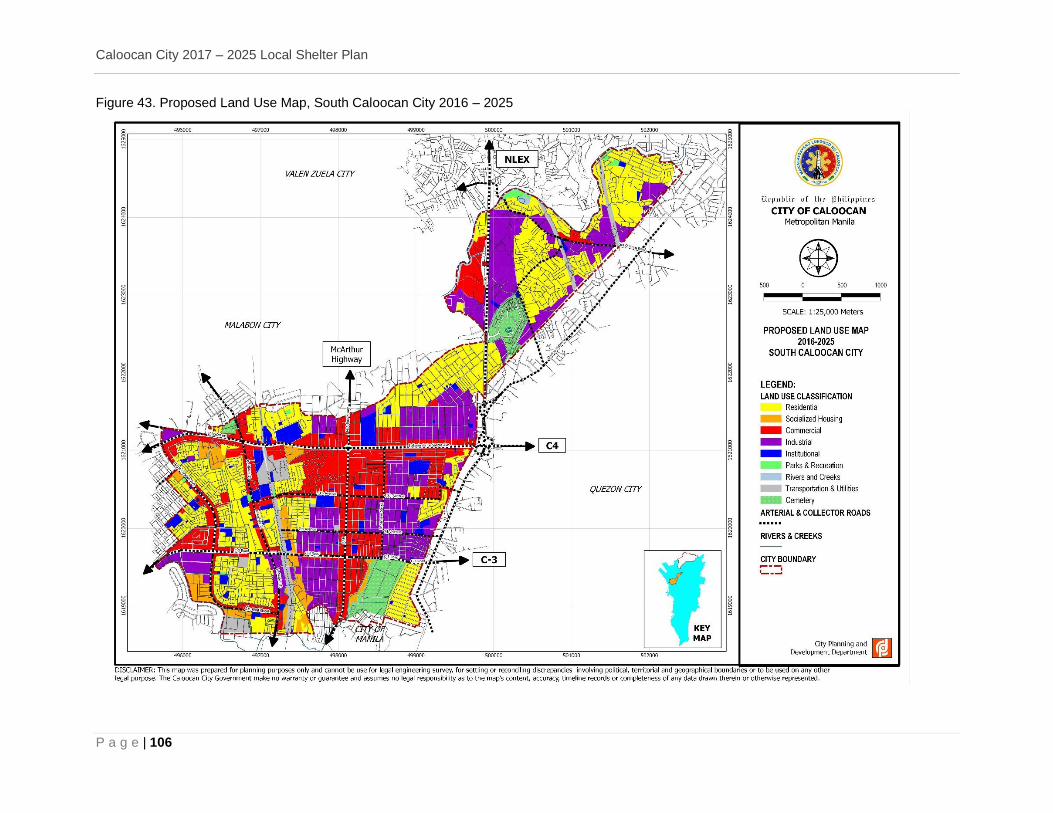
Caloocan City 2017 – 2025 Local Shelter Plan
P a g e | 106
Figure 43. Proposed Land Use Map, South Caloocan City 2016 – 2025
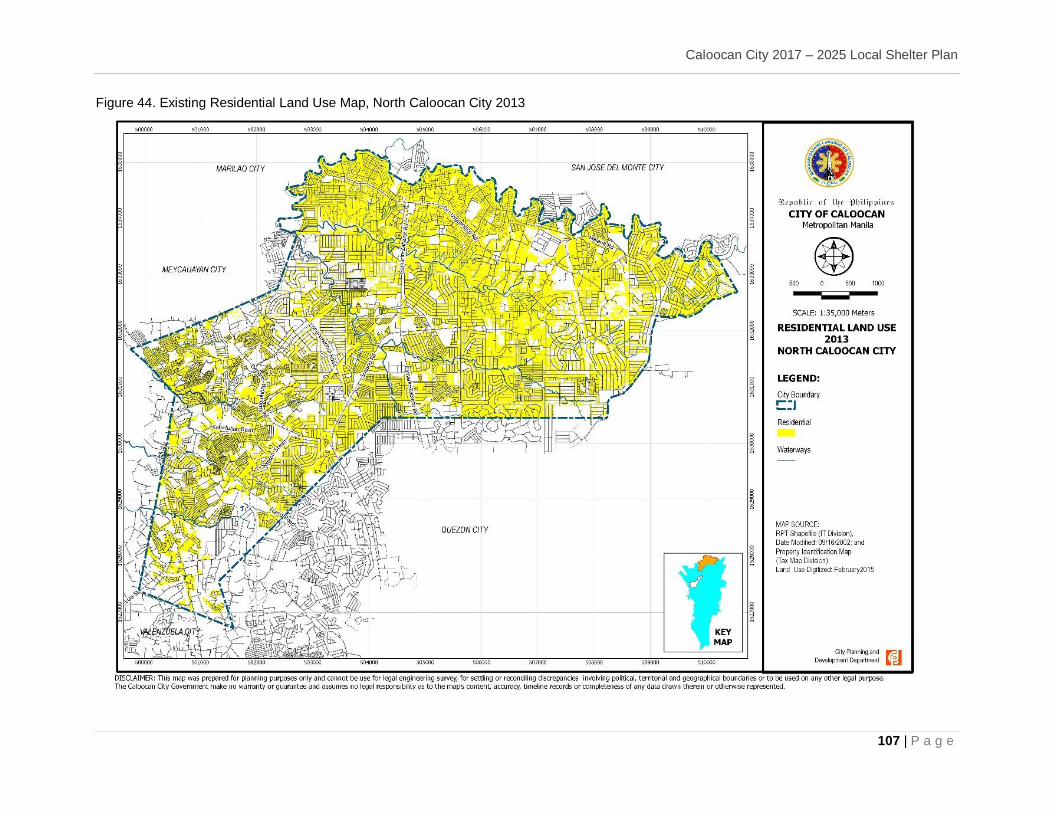
Caloocan City 2017 – 2025 Local Shelter Plan
107 | P a g e
Figure 44. Existing Residential Land Use Map, North Caloocan City 2013
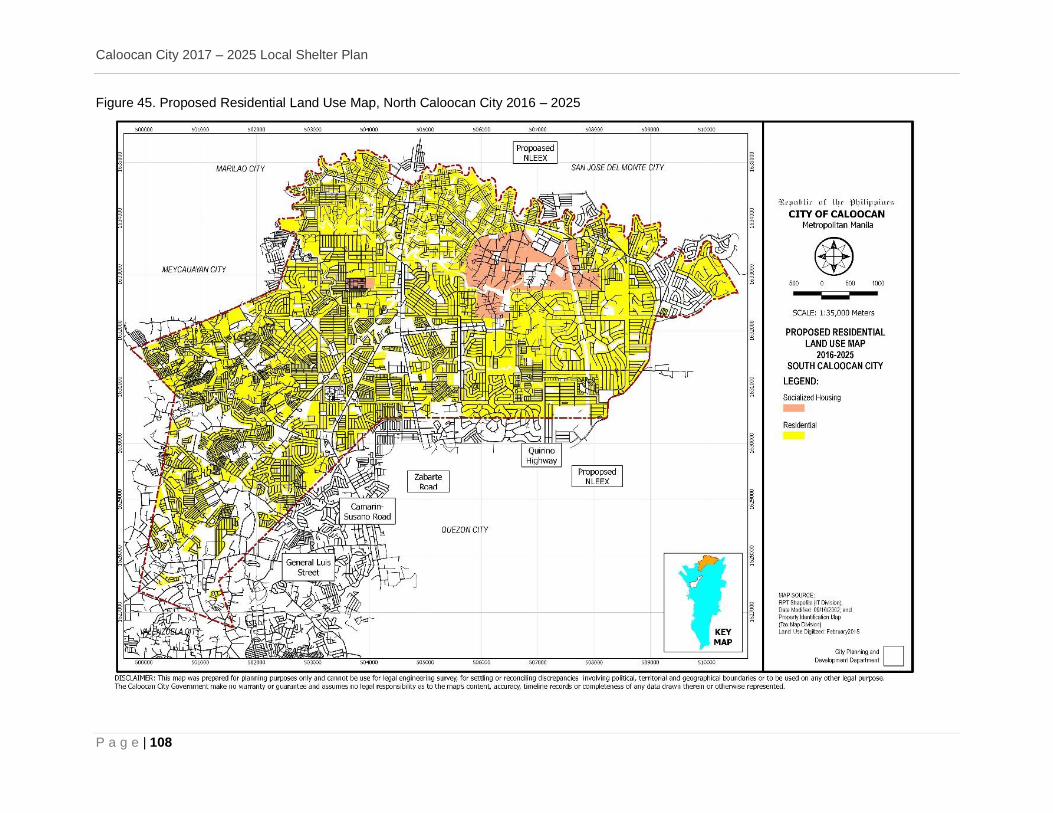
Caloocan City 2017 – 2025 Local Shelter Plan
P a g e | 108
Figure 45. Proposed Residential Land Use Map, North Caloocan City 2016 – 2025
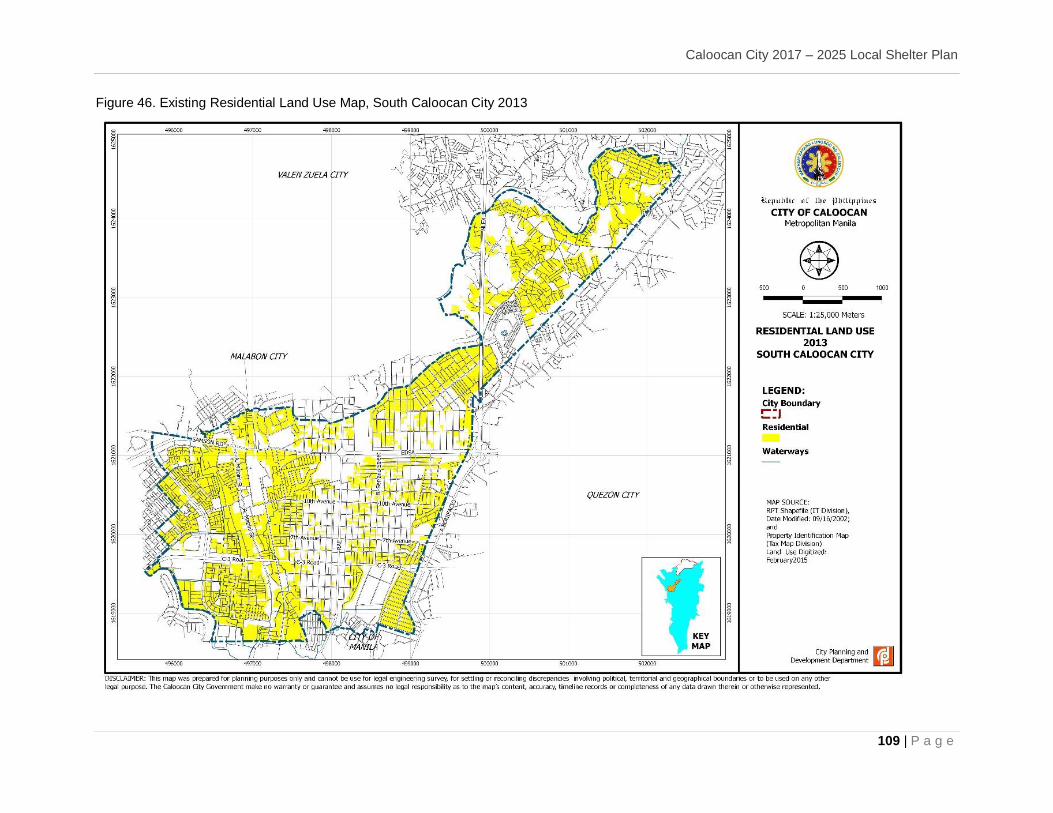
Caloocan City 2017 – 2025 Local Shelter Plan
109 | P a g e
Figure 46. Existing Residential Land Use Map, South Caloocan City 2013
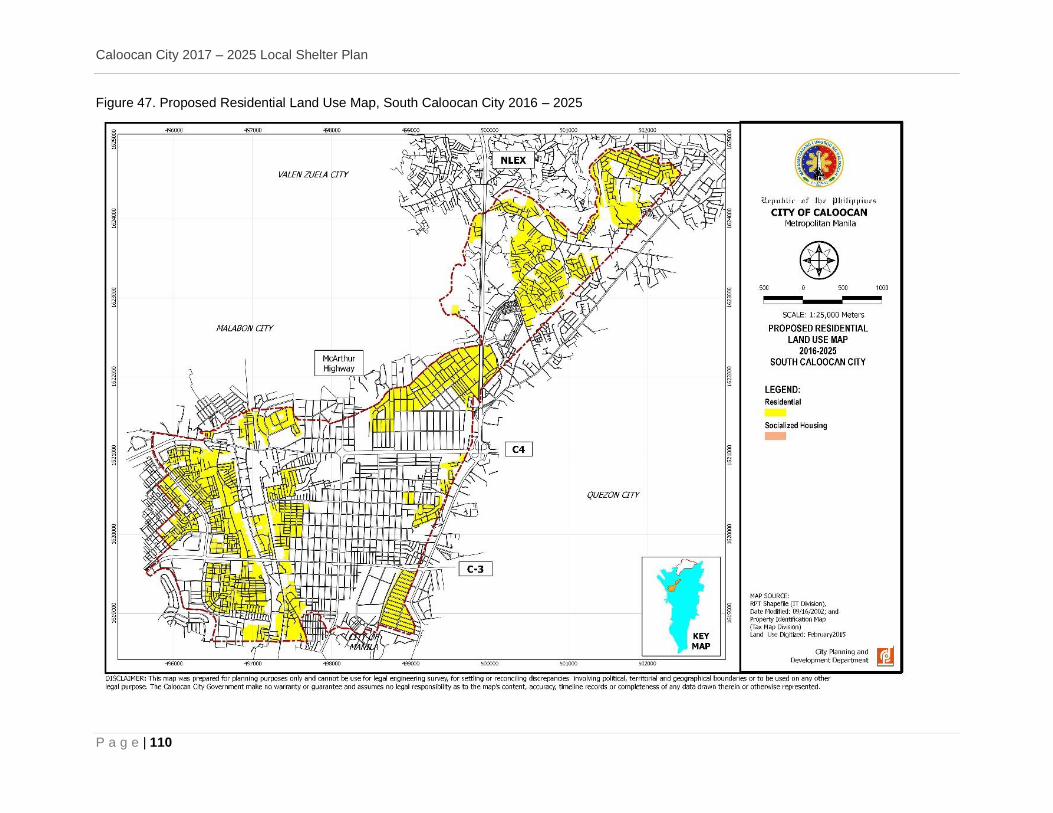
Caloocan City 2017 – 2025 Local Shelter Plan
P a g e | 110
Figure 47. Proposed Residential Land Use Map, South Caloocan City 2016 – 2025
Caloocan City 2017 – 2025 Local Shelter Plan
111 | P a g e
DOCUMENTATIONS SANGGUNIANG PANLUNGSOD RESOLUTION NO.2651 S.2017 ”A resolution Adopting and Approving the City Development Council (CDC) Resolution No. CM-OGM 17-001”. CDC RESOLUTION CM-OGM 17-001 “A Resolution Endorsing to the Sangguniang Panlungsod the Proposed Caloocan City 2017 – 2019 Local Shelter Plan for Review, Adoption and Approval of the same”. RESOLUTION NO. 01-17 “A Resolution Approving the Draft of the Local Shelter Plan of Caloocan City”. EXECUTIVE ORDER NO. 023-16
Reorganization of the Caloocan City Housing and Urban Development Board CALOOCAN CITY HOUSING AND URBAN DEVELOPMENT BOARD - Minutes of the Meeting February 28, 2017 – Bulwagang Katipunan, Caloocan City Hall – Main - Attendance PHOTOS
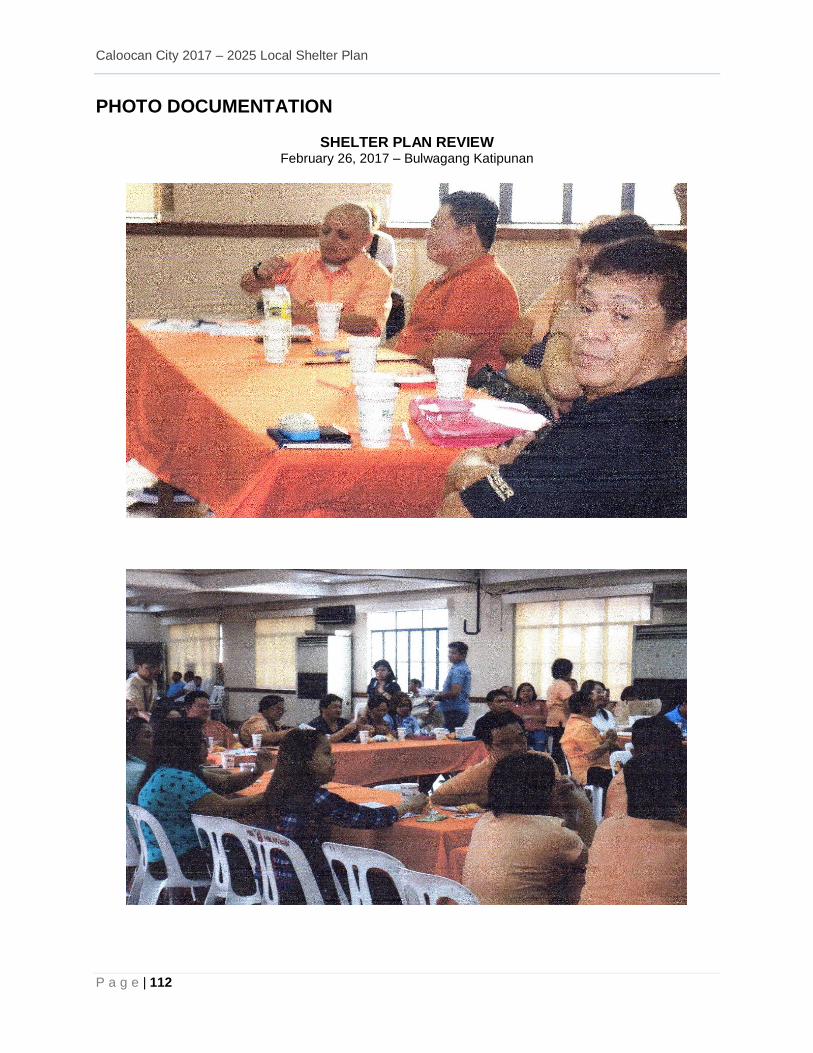
Caloocan City 2017 – 2025 Local Shelter Plan
P a g e | 112
PHOTO DOCUMENTATION
SHELTER PLAN REVIEW February 26, 2017 – Bulwagang Katipunan
Caloocan City 2017 – 2025 Local Shelter Plan
113 | P a g e
SHELTER PLAN REVIEW February 26, 2017 – Bulwagang Katipunan
Caloocan City 2017 – 2025 Local Shelter Plan
P a g e | 114
SHELTER PLAN REVIEW February 26, 2017 – Bulwagang Katipunan