Graphene-Supported Platinum and Platinum-Ruthenium ...
18
23 Graphene-Supported Platinum and Platinum-Ruthenium Nanoparticles for Fuel Cell Applications Lifeng Dong 1,2 , Qianqian Liu 1 , Li Wang 2 and Kezheng Chen 2 1 Department of Physics, Astronomy, and Materials Science, Missouri State University, 2 College of Materials Science and Engineering, Qingdao University of Science and Technology, 1 U.S.A. 2 P. R. China 1. Introduction As one of the most promising alternative energies, fuel cells have been receiving increased attention recently due to the depletion of fossil fuels and the increase in environmental pollution. Among different types of fuel cells, direct ethanol fuel cells (DEFCs) and direct methanol fuel cells (DMFCs) are excellent power sources due to their high energy density, low pollutant emission, low operating temperature, and ease of handling liquid ethanol/methanol fuel (Lamy et al., 2002; Long et al., 2000; Maillard et al., 2003). However, critical obstacles remain that inhibit broad applications of DEFCs and DMFCs, including low electrocatalytic activity of anode/cathode electrodes and the high cost of noble metal, platinum (Pt)-based catalysts. In order to enhance catalytic activity and to reduce the usage of Pt-based catalysts, one strategy is to explore novel carbon materials as catalyst supports and to effectively disperse Pt-based particles on these supports (Chen et al., 2007; Sanganna Gari et al., 2010; Girishkumar et al., 2006; Halder et al., 2009; Maiyalagan, 2008; Selvaraj & Alagar, 2007; Rajesh et al., 2003; Tang et al., 2004; Tsai et al., 2006; Zhao et al., 2004). Vulcan XC-72R carbon black has been the most widely-used catalyst support for the preparation of fuel cell catalysts because of its exceptional electronic conductivity and surface area (Guo et al., 2008; Lin et al., 2005; Maiyalagan et al., 2005). During the past several years, a few research groups have investigated graphene, one type of novel carbon nanostructures, as a catalyst support and have demonstrated that graphene can improve the electrocatalytic activity of Pt nanoparticles more effectively for methanol and ethanol oxidation than Vulcan XC-72R carbon black (Dong et al., 2010; Seger et al., 2009; Yoo et al., 2009). In this chapter, a series of atomic force microscopy (AFM) and electron microscopy techniques, including scanning electron microscopy (SEM) and scanning transmission electron microscopy (STEM), were employed to characterize the morphology of Pt nanoparticles, platinum-ruthenium (Pt-Ru) nanoparticles, and graphene sheets as well as the distribution of Pt and Pt-Ru nanoparticles on the graphene supports. Effects of graphene supports on electrocatalytic activity of Pt and Pt-Ru nanoparticles for methanol and ethanol oxidations were investigated using cyclic voltammetry. In comparison to Vulcan XC-72R www.intechopen.com
-
Upload
khangminh22 -
Category
Documents
-
view
0 -
download
0
Transcript of Graphene-Supported Platinum and Platinum-Ruthenium ...

23
Graphene-Supported Platinum and Platinum-Ruthenium Nanoparticles for
Fuel Cell Applications
Lifeng Dong1,2, Qianqian Liu1, Li Wang2 and Kezheng Chen2 1Department of Physics, Astronomy, and Materials Science, Missouri State University,
2College of Materials Science and Engineering, Qingdao University of Science and Technology,
1U.S.A. 2P. R. China
1. Introduction
As one of the most promising alternative energies, fuel cells have been receiving increased attention recently due to the depletion of fossil fuels and the increase in environmental pollution. Among different types of fuel cells, direct ethanol fuel cells (DEFCs) and direct methanol fuel cells (DMFCs) are excellent power sources due to their high energy density, low pollutant emission, low operating temperature, and ease of handling liquid ethanol/methanol fuel (Lamy et al., 2002; Long et al., 2000; Maillard et al., 2003). However, critical obstacles remain that inhibit broad applications of DEFCs and DMFCs, including low electrocatalytic activity of anode/cathode electrodes and the high cost of noble metal, platinum (Pt)-based catalysts. In order to enhance catalytic activity and to reduce the usage of Pt-based catalysts, one strategy is to explore novel carbon materials as catalyst supports and to effectively disperse Pt-based particles on these supports (Chen et al., 2007; Sanganna Gari et al., 2010; Girishkumar et al., 2006; Halder et al., 2009; Maiyalagan, 2008; Selvaraj & Alagar, 2007; Rajesh et al., 2003; Tang et al., 2004; Tsai et al., 2006; Zhao et al., 2004). Vulcan XC-72R carbon black has been the most widely-used catalyst support for the preparation of fuel cell catalysts because of its exceptional electronic conductivity and surface area (Guo et al., 2008; Lin et al., 2005; Maiyalagan et al., 2005). During the past several years, a few research groups have investigated graphene, one type of novel carbon nanostructures, as a catalyst support and have demonstrated that graphene can improve the electrocatalytic activity of Pt nanoparticles more effectively for methanol and ethanol oxidation than Vulcan XC-72R carbon black (Dong et al., 2010; Seger et al., 2009; Yoo et al., 2009). In this chapter, a series of atomic force microscopy (AFM) and electron microscopy techniques, including scanning electron microscopy (SEM) and scanning transmission electron microscopy (STEM), were employed to characterize the morphology of Pt nanoparticles, platinum-ruthenium (Pt-Ru) nanoparticles, and graphene sheets as well as the distribution of Pt and Pt-Ru nanoparticles on the graphene supports. Effects of graphene supports on electrocatalytic activity of Pt and Pt-Ru nanoparticles for methanol and ethanol oxidations were investigated using cyclic voltammetry. In comparison to Vulcan XC-72R
www.intechopen.com

Physics and Applications of Graphene - Experiments
526
carbon black, graphene-supported Pt and Pt-Ru catalysts demonstrate better electrocatalytic activities in terms of oxidation potential, forward oxidation peak current density, and the ratio of forward peak current density to reverse peak current density. This study indicates that graphene can serve as an effective catalyst support for both direct methanol and ethanol fuel cells. These systematic characterizations provide detailed information on the morphology and structures of Pt and Pt-Ru nanoparticles supported on graphene sheets, and this information will help to design and synthesize graphene-supported Pt/Pt-Ru nanoparticles for fuel cell applications.
2. Structural characterization and electrocatalytic measurements
2.1 Synthesis of Pt and Pt-Ru nanoparticles For the synthesis of graphene-supported Pt and Pt-Ru catalysts, 1 g of graphene oxide powder
was dispersed in 100 ml of ethylene glycol (EG) and sonicated for 30 min (Li et al., 2003).
Graphene oxide was prepared from graphite powder in accordance with the Hummers-
Offeman method (Hummers et al., 1958). Hexachloroplatinic EG solution (15 ml) (7.4 mg
H2PtCl6 per ml of EG) was added into the graphene oxide solution and mechanically stirred
for 2 h. Sodium hydroxide was added to adjust the pH of the solution to 11.0, and then the
solution was fluxed under flowing argon at 130 °C for 3 h. The solid was filtered, washed with
deionized water, and dried in an oven at 80 °C for 12 h. For the synthesis of graphene-
supported Pt-Ru catalysts, the only difference was to add 15 ml of EG solution, including both
H2PtCl6 and ruthenium chloride (RuCl3) (7.4 mg H2PtCl6 and 7.4 mg RuCl3 per ml of EG) into
the graphene oxide solution. Similar procedures were used to prepare carbon black (Vulcan
XC-72R) supported Pt and Pt-Ru catalysts.
2.2 Electron microscopy and microanalysis The morphology of Pt and Pt-Ru nanoparticles and their distributions on carbon black and
graphene were investigated using an FEI Quanta 200 field emission scanning electron
microscope (FESEM). The FESEM system is equipped with an Everhart-Thornley secondary
electron detector (SED), a low-vacuum SED, a gaseous SED, a backscattered electron
detector (BSED), a scanning transmission electron microscopy detector (STEM), and an
Oxford INCA 250 silicon drift X-ray energy dispersive spectrometer (EDS).
2.3 Atomic force microscopy A Multimode Nanoscope IIIa atomic force microscopy (AFM) system was used to examine surface characteristics of graphene sheets and nanoparticles supported on the graphene sheets. The AFM system was equipped with an E-type scanner and a standard silicon
cantilever with a length of 115-135 μm and a tip radius less than 10 nm. All images were obtained using tapping mode in air at room temperature with a 1.0 Hz scan rate, a 0º scan angle, and a 261.0 Hz tapping frequency. Both topographical and phase images were captured for each real-time scan. Nanoscope III 6.13rl software was used for off-line image flattening and analysis.
2.4 Electrocatalytic activity measurements Electrocatalytic activities of Pt and Pt-Ru nanoparticles on different supports (Vulcan XC-72R carbon black and graphene) were measured in a conventional three-electrode cell using a CHI
www.intechopen.com

Graphene-Supported Platinum and Platinum-Ruthenium Nanoparticles for Fuel Cell Applications
527
600C electrochemical work station. Ag/AgCl served as a reference electrode, Pt wire as a counter electrode, and glassy carbon coated with carbon black- and graphene-supported nanoparticles as a working electrode. For the preparation of a working electrode, 3.8 mg of
catalyst powder was dispersed in 1 ml of ethanol solution and sonicated for 30 min; 30 μl of the suspension was placed onto the surface of a glassy carbon electrode and dried for 15 min;
and 10 μl of 5% Nafion 117 solution was sequentially applied and dried for 15 min. Electrocatalytic oxidation of methanol on graphene and carbon black-supported Pt and Pt-Ru nanoparticles was measured in 1 M CH3OH + 0.5 M H2SO4 electrolyte by cyclic voltammetry between -0.3 V and 1.0 V. The potentials were measured and reported with respect to the Ag/AgCl electrode. After methanol oxidation measurements, the electrodes were stored in distilled water for 30 min prior to ethanol oxidation measurements. Electrocatalytic oxidation of ethanol was measured in 1 M CH3CH2OH + 0.5 M H2SO4
electrolyte by cyclic voltammetry between -0.3 V and 1.0 V. Prior to electrochemical characterizations, all electrolyte solutions were de-aerated under flowing nitrogen gas for 20 min. Electrical current density was calculated by normalizing electrical current on the surface of 3 mm diameter glassy carbon electrodes. In order to ensure the reproducibility of experimental results, all electrocatalyst powders, including graphene- and carbon black-supported Pt and Pt-Ru nanoparticles, were synthesized three times; the same amount of catalytic powder was cautiously loaded onto the electrodes.
3. Electron microscopy study of Pt nanoparticles
Pt-Ru nanoparticles were synthesized using the same procedures and the same reaction parameters as for Pt nanoparticles, and thereby had similar morphology and similar distributions on catalytic supports (graphene and carbon black) compared to Pt nanoparticles. In this study, we report only the study of the morphology of Pt nanoparticles and their distributions on catalytic supports using electron microscopy and atomic force microscopy.
3.1 Scanning electron microscopy characterization The Everhart-Thornley secondary electron detector and the solid state backscattered electron detector are the two most commonly-used detectors for a scanning electron microscope (SEM). Low energy SEs (less than 50 eV, with a most probable energy of 3 – 5 eV) are emitted from the surface and immediate sub-surface of a specimen and provide information regarding the surface topography of the specimen; high energy BSEs reveal areas having different chemical compositions because heavy elements with high atomic number backscatter incident electrons more strongly than light elements with low atomic number (Goldstein et al., 2003). For a sample characterization using SE/BSE detectors, nanoparticle powder was directly affixed onto the surface of double-stick conductive copper tape, which in turn was attached to an aluminum SEM sample stub. Fig. 1a and Fig. 1c are SE images of Pt nanoparticles supported on graphene and carbon black, respectively. Graphene sheets are rippled and crumpled, with a dimension of several
hundred nm to several μm; Vulcan XC-72R carbon black supports are spherical particles with a dimension of 30 nm to 100 nm. Few small particles exist on the surface of both graphene and carbon black supports, yet it is difficult to identify the locations of these particles due to weak contrast between small particles and their supports. However, simultaneously obtained BSE images (Fig. 1b and Fig. 1d) clearly reveal the dimension and
www.intechopen.com

Physics and Applications of Graphene - Experiments
528
200 nm
(a) (b)
(c) (d)
Fig. 1. SE (a, c) and BSE (b, d) images recorded simultaneously from Pt nanoparticles
supported on graphene and carbon black, respectively. SE images demonstrate the surface
morphology of graphene and carbon black, while the Z-contrast effect in the BSE imaging
permits identification of Pt nanoparticles. All images were acquired at the same
magnification for comparison.
distribution of those particles on the surface of graphene and carbon black, an observation
which confirms that BSE imaging is a Z-contrast technique that yields compositional
contrast information. Atomic numbers Z for Pt and C are 78 and 6, respectively. The signal
from the BSE detector is proportional to the backscatter coefficient, which nearly
monotonically increases with increasing Z. In Fig. 1b and Fig. 1d, the higher Z particles
appear brighter than the lower Z background structures. The bright particles are Pt
nanoparticles with a size of less than 10 nm. These nanoparticles are difficult to identify in
SE images (Fig. 1a and Fig. 1c). SE images reveal the morphology and dimension of
graphene and carbon black supports, while BSE images demonstrate the morphology and
distribution of Pt nanoparticles associated with the surface of the graphene and carbon black
support materials. SE and BSE imaging are complementary concurrent techniques for the
characterization of Pt nanoparticles and supporting materials.
www.intechopen.com

Graphene-Supported Platinum and Platinum-Ruthenium Nanoparticles for Fuel Cell Applications
529
3.2 Scanning transmission electron microscopy characterization
200 nm
(a) (b)
(c) (d)
Fig. 2. Pt nanoparticles supported on graphene sheets were simultaneously imaged with SE (a), BSE (b), STEM-BF (c), and STEM-HAADF (d) detectors. Different detectors concurrently reveal different information regarding the morphology of graphene sheets and Pt nanoparticles as well as the distribution of Pt nanoparticles on the graphene sheets. Multiple graphene layers, white arrows; sheet folds and very few graphene layers, black arrows.
With the development of technology and improved manufacturing techniques, SEMs are more commonly equipped with a STEM detector for revealing internal structures of a specimen. A retractable STEM detector, attached to the FEI Quanta 200 FESEM system, consists of three different modes of detection: bright field (BF), dark field (DF), and high angle annular dark field (HAADF). The STEM-BF detector collects electrons transmitted through the specimen. Both mass-thickness and diffraction contrast contribute to the BF image formation; the STEM-DF detector gathers electrons diffracted in crystalline areas and incoherent Rutherford scattering electrons; and the STEM-HAADF detector collects electrons scattered to high angles (50 to 200 mrad) where the scattering is predominately incoherent Rutherford scattering and roughly proportional to the square of the atomic number (Z). SE and BSE in combination with STEM-BF/DF/HAADF provide information
www.intechopen.com
Physics and Applications of Graphene - Experiments
530
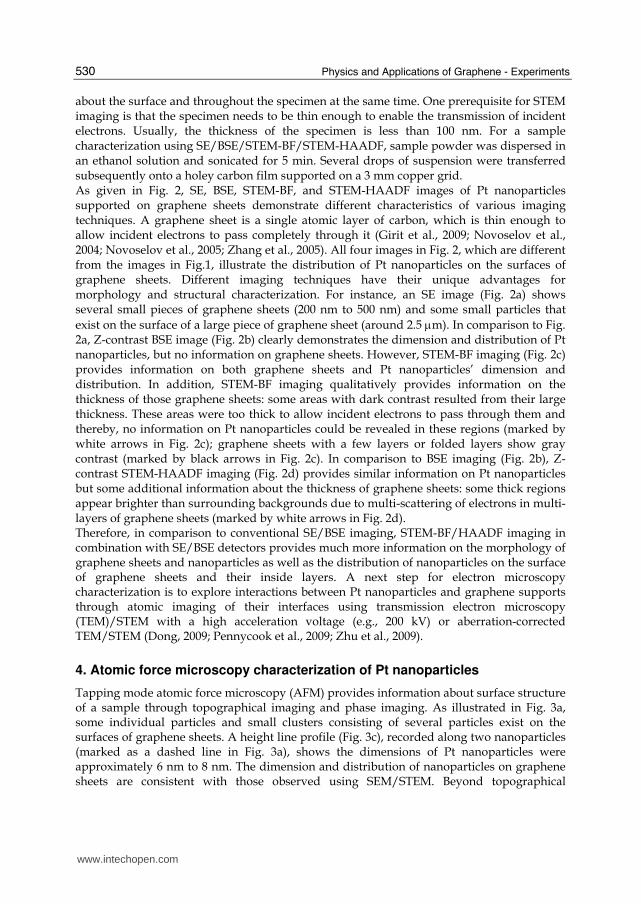
about the surface and throughout the specimen at the same time. One prerequisite for STEM imaging is that the specimen needs to be thin enough to enable the transmission of incident electrons. Usually, the thickness of the specimen is less than 100 nm. For a sample characterization using SE/BSE/STEM-BF/STEM-HAADF, sample powder was dispersed in an ethanol solution and sonicated for 5 min. Several drops of suspension were transferred subsequently onto a holey carbon film supported on a 3 mm copper grid. As given in Fig. 2, SE, BSE, STEM-BF, and STEM-HAADF images of Pt nanoparticles supported on graphene sheets demonstrate different characteristics of various imaging techniques. A graphene sheet is a single atomic layer of carbon, which is thin enough to allow incident electrons to pass completely through it (Girit et al., 2009; Novoselov et al., 2004; Novoselov et al., 2005; Zhang et al., 2005). All four images in Fig. 2, which are different from the images in Fig.1, illustrate the distribution of Pt nanoparticles on the surfaces of graphene sheets. Different imaging techniques have their unique advantages for morphology and structural characterization. For instance, an SE image (Fig. 2a) shows several small pieces of graphene sheets (200 nm to 500 nm) and some small particles that
exist on the surface of a large piece of graphene sheet (around 2.5 μm). In comparison to Fig. 2a, Z-contrast BSE image (Fig. 2b) clearly demonstrates the dimension and distribution of Pt nanoparticles, but no information on graphene sheets. However, STEM-BF imaging (Fig. 2c) provides information on both graphene sheets and Pt nanoparticles’ dimension and distribution. In addition, STEM-BF imaging qualitatively provides information on the thickness of those graphene sheets: some areas with dark contrast resulted from their large thickness. These areas were too thick to allow incident electrons to pass through them and thereby, no information on Pt nanoparticles could be revealed in these regions (marked by white arrows in Fig. 2c); graphene sheets with a few layers or folded layers show gray contrast (marked by black arrows in Fig. 2c). In comparison to BSE imaging (Fig. 2b), Z-contrast STEM-HAADF imaging (Fig. 2d) provides similar information on Pt nanoparticles but some additional information about the thickness of graphene sheets: some thick regions appear brighter than surrounding backgrounds due to multi-scattering of electrons in multi-layers of graphene sheets (marked by white arrows in Fig. 2d). Therefore, in comparison to conventional SE/BSE imaging, STEM-BF/HAADF imaging in combination with SE/BSE detectors provides much more information on the morphology of graphene sheets and nanoparticles as well as the distribution of nanoparticles on the surface of graphene sheets and their inside layers. A next step for electron microscopy characterization is to explore interactions between Pt nanoparticles and graphene supports through atomic imaging of their interfaces using transmission electron microscopy (TEM)/STEM with a high acceleration voltage (e.g., 200 kV) or aberration-corrected TEM/STEM (Dong, 2009; Pennycook et al., 2009; Zhu et al., 2009).
4. Atomic force microscopy characterization of Pt nanoparticles
Tapping mode atomic force microscopy (AFM) provides information about surface structure of a sample through topographical imaging and phase imaging. As illustrated in Fig. 3a, some individual particles and small clusters consisting of several particles exist on the surfaces of graphene sheets. A height line profile (Fig. 3c), recorded along two nanoparticles (marked as a dashed line in Fig. 3a), shows the dimensions of Pt nanoparticles were approximately 6 nm to 8 nm. The dimension and distribution of nanoparticles on graphene sheets are consistent with those observed using SEM/STEM. Beyond topographical
www.intechopen.com

Graphene-Supported Platinum and Platinum-Ruthenium Nanoparticles for Fuel Cell Applications
531
(a) (b)
0
5
10
15
20
25
0 20 40 60
nm
nm
(c)
Fig. 3. AFM topography (a) and phase (b) images of Pt nanoparticles supported on graphene sheets. A line height profile (c), recorded along two nanoparticles (marked as a dashed line in Fig. 3a), shows that the dimensions of Pt nanoparticles were approximately 6 nm to 8 nm.
information, phasing imaging detects variations in composition, viscoelasticity, adhesion, and others, since these parameters affect the phase of the oscillation of a cantilever (Liu et al., 2009; Tamayo & Garcia, 1997). In comparison to topographical imaging (Fig. 3a), the phase imaging in Fig. 3b clearly provides more information on the morphology of Pt nanoparticles and their distribution on graphene sheets. Besides those nanoparticles observed in Fig. 3a, some individual particles with smaller dimensions were revealed through the phase imaging mode. However, it is challenging to obtain detailed information on large pieces of graphene sheets due to their intrinsic tendency to fold and crumple
together. AFM also lacks depth of field, yet SEM can have a depth of field of several μm.
5. Electrocatalytic activity for methanol oxidation
The electrocatalytic activity of methanol oxidation on carbon black- and graphene-supported Pt and Pt-Ru nanoparticles was characterized by cyclic voltammetry in an electrolyte of 1 M CH3OH and 0.5 M H2SO4 at 50 mV/s. The voltammograms of each sample
www.intechopen.com

Physics and Applications of Graphene - Experiments
532
became stable after the fifth cycle. The resulting voltammograms from the fifth cycle are shown in Fig. 4. The efficiencies of the Pt and Pt-Ru nanoparticles on methanol oxidation were compared with regard to oxidation potential, forward oxidation peak current density, and the ratio of the forward peak current density to the reverse peak current density; these data are summarized in Table 1.
Electrode Forward Sweep Reverse Sweep IF/IR Ratio
E (V) IF (mA/cm2) E (V) IR (mA/cm2)
Pt-graphene 0.65 19.1 0.46 2.93 6.52
Pt-CB 0.59 9.76 0.43 7.01 1.39
Pt-Ru-graphene 0.50 16.5 - - -
Pt-Ru-CB 0.58 5.23 0.36 1.51 3.46
Table 1. Comparison of electrocatalytic activity of methanol oxidation on graphene and carbon black-supported Pt and Pt-Ru nanoparticles.
Graphene-supported Pt nanoparticles have a higher activity for methanol oxidation and a better tolerance to CO in comparison to carbon black-supported Pt nanoparticles (Fig. 4a). On the forward potential sweep, the current increases slowly at lower potentials, then quickly increases at potentials higher than 0.5 V, and oxidation occurs at approximately 0.65 V. The magnitude of the peak current density is directly proportional to the amount of methanol oxidized at the electrode. The peak current density observed with graphene is approximately 19 mA/cm2, nearly two times the peak current density for carbon black (9.8 mA/cm2); this result suggests that graphene plays a critical role in promoting methanol oxidation of Pt nanoparticles. In the reverse potential sweep, an oxidation peak is observed around 0.46 V, putatively associated with the removal of CO and other residual carbon species formed on the electrode in the forward sweep. The reverse anodic peak current density (2.93 mA/cm2) is much lower than those measurements for carbon black (7.01 mA/cm2). The ratio of the forward anodic peak current density (IF) to the reverse anodic peak current density (IR) can be used to describe the tolerance of Pt catalysts to CO and other carbonaceous species. Graphene-supported Pt nanoparticles have a ratio of 6.52, much higher than carbon black-supported Pt nanoparticles (1.39), a result which suggests that graphene-supported Pt nanoparticles generate a more complete oxidation of methanol to carbon dioxide. As shown in Fig. 4c, the addition of Ru results in a negative shift of oxidation potential of methanol at all two electrodes with the decreasing of IR and the increase of the IF to IR ratio. The oxidation peak potential of methanol was 0.50 V compared with an oxidation of 0.65 V for graphene-Pt nanoparticles. This observation suggests that the presence of Ru can significantly decrease the barrier to methanol oxidation and that Pt-Ru nanoparticles perform in a better fashion than Pt nanoparticles. Conversely, the oxidation potential of methanol at carbon black-supported Pt-Ru nanoparticles minimally shifts 0.02 V (0.58 V to 0.56 V). These data indicate that graphene-supported Pt-Ru may be an ideal candidate for direct methanol fuel cell electrodes. The above data also clearly support the proposition that Ru-Pt nanoparticles can effectively advance the oxidation of methanol to CO2 and inhibit the accumulation of CO and other carbonaceous species formed on the graphene and carbon black electrodes. For graphene electrodes especially, there is no obvious reverse peak in Fig. 4b. Similar effects of Ru on other catalysts for methanol oxidation have been reported by a number of research groups (Long et al., 2000; Maillard et al., 2003).
www.intechopen.com

Graphene-Supported Platinum and Platinum-Ruthenium Nanoparticles for Fuel Cell Applications
533
-20
-15
-10
-5
0
5
10
15
20
25
-0.5 0.0 0.5 1.0
Cu
rre
nt
De
nsi
ty (
mA
/cm
2)
Potential (V)
Pt-Graphene
Pt-CB
-20
-15
-10
-5
0
5
10
15
20
25
-0.5 0.0 0.5 1.0
Cu
rre
nt
De
nsi
ty (
mA
/cm
2)
Potential (V)
Pt-Ru-Graphene
Pt-Ru-CB
0
5
10
15
20
25
30
0.0 5.0 10.0
Cu
rre
nt
De
nsi
ty (
mA
/cm
2)
(mV/s)1/2
Pt-Graphene
Pt-CB
0
5
10
15
20
25
30
0.0 5.0 10.0
Cu
rre
nt
De
nsi
ty (
mA
/cm
2)
(mV/s)1/2
Pt-Ru-Graphene
Pt-Ru-CB
(a) (b)
(c) (d)
Fig. 4. Electrocatalytic activity of graphene and Vulcan XC-72R carbon black-supported Pt
and Pt-Ru nanoparticles for methanol oxidation: cyclic voltammograms of Pt nanoparticles
(a) and Pt-Ru nanoparticles (c) in 1 M CH3OH/0.5 M H2SO4 at 50 mV/s between -0.3 V and
+1.0 V vs. Ag/AgCl; and the relationship of peak current density vs. scan rate for Pt
nanoparticles (b) and Pt-Ru nanoparticles (d).
As given in Fig. 4b and Fig. 4d, for all graphene- and carbon black-supported Pt and Pt-Ru
nanoparticles, the forward oxidation current density (IF) is proportional to the square root of
the scan rate, suggesting that the oxidation behavior of methanol at all electrodes is
controlled by diffusion processes. The slopes for graphene supports are larger than those for
carbon black, indicative of a faster diffusion process of methanol on the surfaces of graphene
sheets than that for methanol on the carbon black substrata.
Chronoamperometry was used to characterize the stability of the electrodes for methanol
oxidation activity. The current density-time plots of graphene- and carbon black-supported
Pt and Pt-Ru nanoparticles in 1 M CH3OH/0.5 M H2SO4 at 0.4 V are shown in Fig. 5. During
the 60-min test period, graphene-supported nanoparticles behave in a more stable fashion
than those nanoparticles supported on carbon-black, and graphene-supported Pt-Ru
nanoparticles were more stable than graphene-supported Pt nanoparticles. These results
www.intechopen.com

Physics and Applications of Graphene - Experiments
534
suggest that the addition of Ru onto Pt nanoparticles lowers not only oxidation potential
(0.65 V to 0.5 V), but also increases the tolerance of Pt nanoparticles to CO and thereby
improves the stability of Pt nanoparticles for methanol oxidation.
0.0
1.0
2.0
3.0
4.0
0 1,000 2,000 3,000
Cu
rre
nt D
en
sity
(m
A/c
m2)
Time (s)
Pt-Ru-Graphene
Pt-Graphene
Pt-Ru-CB
Pt-CB
Fig. 5. Chronoamperogram curves for graphene- and carbon black-supported Pt and Pt-Ru nanoparticles in 1 M CH3OH/0.5 M H2SO4. The potential was 0.4 V vs. Ag/AgCl.
6. Electrocatalytic activity for ethanol oxidation
In comparison to direct methanol fuel cells, fuel cells based on direct ethanol oxidation possess several advantages, such as demonstrating enhanced safety, having a higher energy density (8.01 vs. 6.09 kW/kg), and being more easily produced in large quantities from agricultural products and from the fermentation of biomass (Lamy et al., 2002). A complete ethanol electro-oxidation involves the release of 12 electrons per molecule and the cleavage of the C-C bond. Experimental studies have revealed that ethanol is largely and partially oxidized to acetaldehyde and acetic acid (two- and four-electron oxidation, respectively) instead of being fully oxidized (12-electron oxidation) (Wang & Liu, 2007). The ethanol electro-oxidation was considered more complicated than that for methanol, and consequently, needs more active and selective catalysts. In this study, we investigated effects of graphene as a catalyst support for ethanol electro-oxidation of Pt and Pt-Ru nanoparticles in comparison to the extensively-used Vulcan XC-72R carbon black.
Electrode Forward Sweep Reverse Sweep IF/IR Ratio
E (V) IF (mA/cm2) E (V) IR (mA/cm2)
Pt-graphene 0.72 16.2 0.48 4.43 3.66
Pt-CB 0.65 13.8 0.46 15.3 0.90
Pt-Ru-graphene 0.66 18.1 0.46 5.23 3.46
Pt-Ru-CB 0.64 7.50 0.36 4.93 1.52
Table 2. Comparison of electrocatalytic activity of ethanol oxidation on graphene and carbon black-supported Pt and Pt-Ru nanoparticles.
Compared with carbon black, graphene enhances considerably the electrocatalytic activity of Pt nanoparticles for ethanol oxidation by increasing the forward oxidation current density and decreasing the reverse peak current density (Fig. 6 and Table 2). As discussed above, the
www.intechopen.com

Graphene-Supported Platinum and Platinum-Ruthenium Nanoparticles for Fuel Cell Applications
535
IF to IR ratio describes the catalyst tolerance to CO-like intermediates formed on electrodes during the forward potential sweep. The high forward peak current density (16.2 mA/cm2) and the high IF to IR ratio (3.66) for graphene-supported Pt nanoparticles indicate that graphene effectively enhances the complete oxidation of ethanol to CO2, and fewer CO-like carbonaceous species accumulate on the electrode surface. The forward peak current density and the IF to IR ratio for carbon black-supported Pt nanoparticles were 16.2 mA/cm2 and 0.9, respectively. As given in Fig. 6c, the addition of Ru effectively lowers the potentials for ethanol oxidations and increases the IF to IR ratios. The oxidation peak potential of ethanol was 0.66 V for graphene-supported Pt-Ru nanoparticles in comparison to an oxidation potential of 0.72 V for graphene-supported Pt nanoparticles, and the potential shift of ethanol oxidation is 0.06 V. However, no significant shifts of oxidation potential for ethanol were observed for carbon black-supported Pt nanoparticles (from 0.65 V to 0.64 V).
-20
-15
-10
-5
0
5
10
15
20
25
-0.5 0.0 0.5 1.0
Cu
rre
nt
De
nsi
ty (
mA
/cm
2)
Potential (V)
Pt-Ru-Graphene
Pt-Ru-CB
-20
-15
-10
-5
0
5
10
15
20
25
-0.5 0.0 0.5 1.0
Cu
rre
nt
De
nsi
ty (
mA
/cm
2)
Potential (V)
Pt-Graphene
Pt-CB
0
5
10
15
20
25
0.0 5.0 10.0
Cu
rre
nt
De
nsi
ty (
mA
/cm
2)
(mV/s)1/2
Pt-Graphene
Pt-CB
0
5
10
15
20
25
0.0 5.0 10.0
Cu
rre
nt
De
nsi
ty (
mA
/cm
2)
(mV/s)1/2
Pt-Ru-Graphene
Pt-Ru-CB
(a) (b)
(c) (d)
Fig. 6. Electrocatalytic activity of graphene- and Vulcan XC-72R carbon black-supported Pt and Pt-Ru nanoparticles for ethanol oxidation: cyclic voltammograms of Pt nanoparticles (a) and Pt-Ru nanoparticles (c) in 1M CH3CH2OH/0.5M H2SO4 at 50 mV/s between -0.3 V and +1.0 V vs. Ag/AgCl; the relationship of peak current density vs. scan rate for Pt nanoparticles (b) and Pt-Ru nanoparticles (d).
www.intechopen.com

Physics and Applications of Graphene - Experiments
536
The forward peak potentials for ethanol oxidation are much higher in comparison to methanol oxidation. For example, the peak potentials for ethanol oxidations on graphene- and carbon black-supported Pt nanoparticles were 0.72 V and 0.65V, respectively; the peak potentials for methanol oxidations on graphene- and carbon black-supported Pt nanoparticles were 0.65 V and 0.59 V, respectively. These results suggest that ethanol oxidation needs more energy than does methanol oxidation. Similar phenomena occur on graphene- and carbon black-supported Pt-Ru nanoparticles (Table 1 and Table 2). As shown in Fig. 6b and 6d, for both graphene and carbon black-supported Pt and Pt-Ru nanoparticles, the forward oxidation peak current density (IF) is proportional to the square root of the scan rate, suggesting that the oxidation of ethanol at all electrodes is a diffusion-controlled phenomenon. Graphene has a larger slope than that for carbon black, suggesting that the diffusion efficiency of ethanol inside graphene sheets is higher than that inside carbon black and therefore, can enhance the efficiency and capacity of fuel cells. The stability of the electrodes for ethanol oxidation was studied using chronoamperometry. The current density-time plots of graphene- and carbon black-supported Pt and Pt-Ru nanoparticles in 1 M CH3CH2OH/0.5 M H2SO4 at 0.4 V are shown in Fig. 7. Graphene-supported nanoparticles appear to be more stable than those nanoparticles supported on carbon-black, and graphene-supported Pt-Ru nanoparticles were more stable than graphene-supported Pt nanoparticles. Initial current density for carbon black-supported Pt-Ru nanoparticles was higher than that for graphene-supported Pt catalysts, but ethanol oxidation activity on carbon black supports deteriorated more rapidly than that on graphene. After 200 s, graphene-supported Pt nanoparticles demonstrated higher oxidation activity than those supported on carbon-black supports. These results indicate that the addition of Ru onto Pt nanoparticles lowers not only oxidation potential (0.72 V to 0.66 V), but also increases the tolerance of Pt nanoparticles to CO and thereby improves the stability of Pt nanoparticles for ethanol oxidation.
0.0
0.5
1.0
1.5
2.0
2.5
3.0
0 1,000 2,000 3,000
Cu
rre
nt D
en
sity
(m
A/c
m2
)
Time (s)
Pt-Ru-Graphene
Pt-Graphene
Pt-Ru-CB
Pt-CB
Fig. 7. Chronoamperogram curves for graphene- and carbon black-supported Pt and Pt-Ru nanoparticles in 1 M CH3CH2OH/0.5 M H2SO4. The potential was 0.4 V vs. Ag/AgCl.
Experimental results on electrocatalytic activity of both methanol and ethanol oxidations clearly demonstrates that graphene-supported Pt and Pt-Ru nanoparticles possess superior electrocatalytic activity compared to Vulcan XC-72R carbon black. Exceptional electrical conductivity and large surface area are two critical parameters for the development of novel
www.intechopen.com

Graphene-Supported Platinum and Platinum-Ruthenium Nanoparticles for Fuel Cell Applications
537
catalyst supports for direct methanol and ethanol fuel cells. Graphene sheets possess both advantages when compared to Vulcan XC-72R carbon black.
7. Conclusion
Different imaging techniques have their various unique advantages for morphology and structural characterization. AFM tapping mode imaging can clearly reveal the morphology of nanoparticles and their distributions on graphene supports; however, it is challenging to image folded or crumpled graphene sheets. In comparison to both AFM imaging and conventional SE/BSE SEM imaging, concurrent STEM/SEM imaging can provide much more detailed information on the morphology of graphene sheets and nanoparticles as well as the distribution of nanoparticles on graphene supports. Future work on electron microscopy characterization will explore interactions between Pt nanoparticles and graphene supports through atomic imaging of their interfaces using high resolution TEM/STEM techniques. In comparison to Vulcan XC-72R carbon black as a catalyst support, graphene-supported Pt and Pt-Ru nanoparticles have lower oxidation potentials, higher forward oxidation peak current density, higher ratios of forward peak current density to reverse peak current density, and better stability for both methanol and ethanol oxidation. These findings clearly demonstrate that as catalyst supports, graphene can more effectively enhance electrocatalytic activity of Pt and Pt-Ru nanoparticles for the oxidation of methanol and ethanol into CO2. A next step will be the exploration of a facile and efficient method to synthesize graphene-supported Pt and Pt-Ru nanoparticles with controlled properties, which includes the formation of nanoparticles on defined locations, the density of nanoparticles located on graphene sheets, the size of nanoparticles, and the size and thickness of graphene sheets (Dong, 2009).
8. Acknowledgments
The authors thank Dr. Michael M. Craig for helpful discussions and Raghavendar Reddy Sanganna Gari and Zhou Li for their help with some experiments. This work was partially supported by a Summer Faculty Fellowship from Missouri State University, the American Chemical Society Petroleum Research Fund (47532-GB10), the Cottrell College Science Award from Research Corporation for Science Advancement, and the National Science Foundation (DMR-0821159). L. F. Dong also acknowledges financial support by the Taishan Scholar Overseas Distinguished Professorship program from the Shandong Province Government, P. R. China.
9. References
Chen, C. C.; Chen, C. F.; Chen, C. M. & Chuang, F. T. (2007). Modification of multi-walled
carbon nanotubes by microwave digestion method as electrocatalyst supports for
direct methanol fuel cell applications. Electrochemistry Communications, 9, 159-163.
Dong, L. F. (2009). DNA-templated synthesis of Pt nanoparticles on single-walled carbon
nanotubes. Nanotechnology, 20, 465602.
www.intechopen.com
Physics and Applications of Graphene - Experiments
538
Dong, L. F.; Sanganna Gari, R. R.; Li, Z.; Craig, M. M. & Hou, S. F. (2010). Graphene-
supported platinum and platinum-ruthenium nanoparticles with high
electrocatalytic activity for methanol and ethanol oxidation. Carbon, 48, 781-787.
Girishkumar, G.; Hall, T. D.; Vinodgopal, K. & Kamat, P. V. (2006). Single wall carbon
nanotube supports for portable direct methanol fuel cells. Journal of Physical
Chemistry B, 110, 107-114.
Girit, C.; Meyer, J. C.; Erni, R.; Rossell, M. D.; Kisielowski, C.; Yang, L.; Park, C. H.;
Crommie, M. F.; Cohen, M. L.; Louie, S. G. & Zettl, A. (2009). Graphene at the edge:
stability and dynamics. Science, 323, 1705-1708.
Goldstein, J.; Newbury, D. E.; Joy, D. C.; Lyman, C. E.; Echlin, P.; Lifshin, E.; Sawyer, L. &
Michael, J. R. (2003). Scanning Electron Microscopy and X-ray Microanalysis, Springer,
New York.
Guo, Y. L.; Zheng, Y. Z. & Huang, M. H. (2008). Enhanced activity of PtSn/C anodic
electrocatalyst prepared by formic acid reduction for direct ethanol fuel cells.
Electrochimica Acta, 53, 3102-3108.
Halder, A.; Sharma, S.; Hegde, M. S. & Ravishankar, N. (2009). Controlled attachment of
ultrafine platinum nanoparticles on functionalized carbon nanotubes with high
electrocatalytic activity for methanol oxidation. Journal of Physical Chemistry C, 113,
1466-1473.
Hummers, W. S. & Offeman, R. E. (1958). Preparation of graphitic oxide. Journal of the
American Chemical Society, 80, 1339-1339.
Lamy, C.; Lima, A.; LeRhun, V.; Delime, F.; Cutanceau, C. & Leger, J. M. (2002). Recent
advances in the development of direct alcohol fuel cells. Journal of Power Sources,
105, 283-296.
Li, W. Z.; Liang, C. H.; Zhou, W. J.; Qiu, J. S.; Zhou, Z. H.; Sun, G. Q. & Qin, X. (2003).
Preparation and characterization of multiwalled carbon nanotube-supported
platinum for cathode catalysts of direct methanol fuel cells. Journal of Physical
Chemistry B, 107, 6292-6299.
Lin, Y. H.; Cui, X. L.; Yen, C. H. & Wai, C. M. (2005). PtRu/carbon nanotube nanocomposites
synthesized in supercritical fluid: a novel electrocatalyst for direct methanol fuel
cells. Langmuir, 21, 11474-11479.
Liu, H.; Fu, S. Y.; Zhu, J. Y.; Li, H. & Zhan, H. Y. (2009). Visualization of enzymatic
hydrolysis of cellulose using AFM phase imaging. Enzyme and Microbial Technology,
4, 274-281.
Long, J. W.; Stroud, R. M.; Swider-Lyons, K. E. & Rolison, D. R. (2000). How to make
electrocatalysts more active for direct methanol oxidation avoid PtRu bimetallic
alloys! Journal of Physical Chemistry B, 104, 9772-9776.
Maillard, F.; Gloaguen, F. & Leger, J. M. (2003). Preparation of methanol oxidation
electrocatalysts: ruthenium deposition on carbon supported platinum
nanoparticles. Journal of Applied Electrochemistry, 33, 1-8.
Maiyalagan, T. (2008) Synthesis and electro-catalytic activity of methanol oxidation on
nitrogen containing carbon nanotubes supported Pt electrodes. Applied Catalysis B:
Environmental, 80, 286-295.
www.intechopen.com

Graphene-Supported Platinum and Platinum-Ruthenium Nanoparticles for Fuel Cell Applications
539
Maiyalagan, T.; Viswanathan, B. & Varadaraju, U. V. (2005). Nitrogen containing carbon
nanotubes as supports for Pt-alternate anodes for fuel cell application.
Electrochemistry Communications, 7, 905-912.
Novoselov, K. S.; Geim, A. K.; Morozov, S. V.; Jiang, D.; Zhang, Y.; Dubonos, S. V.;
Grigorieva, I. V. & Firsov, A. A. (2004). Electric field effect in atomically thin carbon
films. Science, 306, 666-669.
Novoselov, K. S.; Geim, A. K.; Morozov, S. V.; Jiang, D.; Katsnelson, M. I.; Grigorieva, I. V.;
Dubonos, S. V. & Firsov, A. A. (2005). Two-dimensional gas of massless Dirac
fermions in graphene. Nature, 438, 197-200.
Pennycook, S. J.; Varela, M.; Lupini, A. R., Oxley, M. P. & Chisholm, M. F. (2009). Atomic-
resolution spectroscopic imaging: past, present, and future. Journal of Electron
Microscopy, 58, 87-97.
Rajesh, B.; Thampi, K. R.; Bonard, J. M.; Xanthopoulos, N.; Mathieu, H. J. & Viswanathan, B.
(2003). Carbon nanotubes generated from template carbonization of polyphenyl
acetylene as the support for electrooxidation of methanol. Journal of Physical
Chemistry B, 107, 2701-2708.
Sanganna Gari, R. R.; Li, Z. & Dong, L. F. (2010). Effects of different carbon nanotube
supported catalysts on methanol and ethanol electro-oxidation, In: Nanomaterials for
Polymer Electrolyte Membrane Fuel Cells, Swider-Lyons, K. & Park, B. (Ed.), T08-17.1.-
17.6., Materials Research Society, Warrendale, PA.
Seger, B. & Kamat, P. V. (2009). Electrocatalytically active graphene-platinum
nanocomposites: role of 2-D carbon support in PEM fuel cells. Journal of Physical
Chemistry C, 113, 7990-7995.
Selvaraj, V. & Alagar, M. (2007). Pt and Pt-Ru nanoparticles decorated polypyrrole/multi-
walled carbon nanotubes and their catalytic activity towards methanol oxidation.
Electrochemistry Communications, 9, 1145-1153.
Tamayo, J. & Garcia, R. (1997). Effects of elastic and inelastic interactions on phase contrast
images in tapping-mode scanning force microscopy. Applied Physics Letters, 71,
2394.
Tang, H.; Chen, J. H.; Huang, Z. P.; Wang, D. Z.; Ren, Z. F.; Nie, L. H.; Kuang, Y. F. & Yao, S.
Z. (2004). High dispersion and electrocatalytic properties of platinum on well-
aligned carbon nanotube arrays. Carbon, 42, 191-197.
Tsai, M. C.; Yeh, T. K. & Tsai, C. H. (2006). An improved electrodeposition technique for
preparing platinum and platinum-ruthenium nanoparticles on carbon nanotubes
directly grown on carbon cloth for methanol oxidation. Electrochemistry
Communications, 8, 1445-1452.
Wang, H. F. & Liu, Z. P. (2007). Selectivity of direct ethanol fuel cell dictated by a unique
partial oxidation channel. Journal of Physical Chemistry C, 111, 12157-12160.
Yoo, E. J.; Okata, T.; Akita, T.; Kohyama, M.; Nakamura, J. & Honma, I. (2009). Enhanced
electrocatalytic activity of Pt subnanoclusters on graphene nanosheet surface. Nano
Letters, 9, 2255-2259.
Zhang, Y. B.; Tan, Y. W.; Stormer, H. L. & Kim, P. (2005). Experimental observation of the
quantum Hall effect and Berry’s phase in graphene. Nature, 438, 201-204.
www.intechopen.com

Physics and Applications of Graphene - Experiments
540
Zhao, X. S.; Li, W. Z.; Jiang, L. H.; Zhou, W. J.; Xin, Q.; Yi, B. L. & Sun, G. Q. (2004). Multi-
wall carbon nanotube supported Pt-Sn nanoparticles as an anode catalyst for the
direct ethanol fuel cell. Carbon, 42, 3263-3265.
Zhu, Y.; Inada, H.; Nakamura, K. & Wall, J. (2009). Imaging single atoms using secondary
electrons with an aberration-corrected electron microscope. Nature Materials, 8, 808-
812.
www.intechopen.com

Physics and Applications of Graphene - ExperimentsEdited by Dr. Sergey Mikhailov
ISBN 978-953-307-217-3Hard cover, 540 pagesPublisher InTechPublished online 19, April, 2011Published in print edition April, 2011
InTech EuropeUniversity Campus STeP Ri Slavka Krautzeka 83/A 51000 Rijeka, Croatia Phone: +385 (51) 770 447 Fax: +385 (51) 686 166www.intechopen.com
InTech ChinaUnit 405, Office Block, Hotel Equatorial Shanghai No.65, Yan An Road (West), Shanghai, 200040, China
Phone: +86-21-62489820 Fax: +86-21-62489821
The Stone Age, the Bronze Age, the Iron Age... Every global epoch in the history of the mankind ischaracterized by materials used in it. In 2004 a new era in material science was opened: the era of grapheneor, more generally, of two-dimensional materials. Graphene is the strongest and the most stretchable knownmaterial, it has the record thermal conductivity and the very high mobility of charge carriers. It demonstratesmany interesting fundamental physical effects and promises a lot of applications, among which are conductiveink, terahertz transistors, ultrafast photodetectors and bendable touch screens. In 2010 Andre Geim andKonstantin Novoselov were awarded the Nobel Prize in Physics "for groundbreaking experiments regarding thetwo-dimensional material graphene". The two volumes Physics and Applications of Graphene - Experimentsand Physics and Applications of Graphene - Theory contain a collection of research articles reporting ondifferent aspects of experimental and theoretical studies of this new material.
How to referenceIn order to correctly reference this scholarly work, feel free to copy and paste the following:
Lifeng Dong, Qianqian Liu, Li Wang and Kezheng Chen (2011). Graphene-Supported Platinum and Platinum-Ruthenium Nanoparticles for Fuel Cell Applications, Physics and Applications of Graphene - Experiments, Dr.Sergey Mikhailov (Ed.), ISBN: 978-953-307-217-3, InTech, Available from:http://www.intechopen.com/books/physics-and-applications-of-graphene-experiments/graphene-supported-platinum-and-platinum-ruthenium-nanoparticles-for-fuel-cell-applications

© 2011 The Author(s). Licensee IntechOpen. This chapter is distributedunder the terms of the Creative Commons Attribution-NonCommercial-ShareAlike-3.0 License, which permits use, distribution and reproduction fornon-commercial purposes, provided the original is properly cited andderivative works building on this content are distributed under the samelicense.