
Synthesis and characterization of ruthenium dioxide nanostructures
Upload
khangminh22Category
view
2download
0
The Pennsylvania State University
The Graduate School
Eberly College of Science
AMINOETHYLGLYCINE-DERIVATIZED RUTHENIUM COMPLEXES:
MODEL ARCHITECTURES FOR PHOTOCHEMICAL PROCESSES
A Dissertation in
Chemistry
by
Carl P. Myers
2011 Carl P. Myers
Submitted in Partial Fulfillment of the Requirements
for the Degree of
Doctor of Philosophy
May 2011

ii
The dissertation of Carl P. Myers was reviewed and approved* by the following:
Mary Elizabeth Williams Associate Professor of Chemistry Thesis Advisor Chair of Committee
Thomas E. Mallouk DuPont Professor of Materials Chemistry and Physics
Alex Radosevich Assistant Professor of Chemistry
Theresa Mayer Professor of Electrical Engineering
Barbara J. Garrison Shapiro Professor of Chemistry Head of the Department of Chemistry
*Signatures are on file in the Graduate School

iii
ABSTRACT
Transition metal coordination chemistry and amide peptide coupling chemistry can be
exploited to synthesize a wide variety of compounds with ever increasing complexity.
Employing these methodologies in the field of artificial photosynthesis could be a tractable
solution to the often difficult synthetic challenge of linking donors and acceptors together in a
systematic fashion. Successful application of these techniques would provide a wide ranging
library of metals and ligands to fine tune compounds by which excited state energy or electrons
may be passed from one complex to another, ultimately to do work, e.g. catalyze a reaction. This
thesis describes the design and synthesis of peptide sequences capable of binding transition metal
ions to self-assemble heterometallic complexes and the resulting photophysical effects of that
complexation.
Tris(bipyridine)ruthenium(II) complexes were derivatized with aminoethylglycine (aeg)
backbones that are arranged in a “hairpin” configuration. Pendant bipyridine (bpy) ligands are
complementary to each other and addition of transition metal ions (copper (II), zinc (II), or
palladium (II)) form [M(bpy)2]2+ complex(es) through intra-molecular ligand coordination.
Peptide coupling chemistry was used to design and synthesize sequences that bind solution metals
in a predetermined fashion. To accomplish this, advances in peptide coupling techniques were
improved greatly through application of solution phase syntheses that produced gram scale
quantities of di-and tri-peptides, a significant advancement over milligram scale yields through
solid-phase supported syntheses. Metal binding of Cu2+ ions was measured through fluorescence
quenching measurements (steady state and transient) that indicated stoichiometric metal binding
to the peptide scaffolds. Through peptide coupling chemistry, we successfully increased the
donor-acceptor (Ru-Cu) distance to provide information as to whether energy or electron transfer
dominated the emission quenching event.
iv
To answer unexpected observations of [Ru(bpy)3]2+ quenching by Zn2+, the effects of
metal ion binding on the peptide scaffold and [Ru(bpy)3]2+ were measured through NMR
spectroscopy. The Ru-hairpin structure was assigned using two-dimensional NMR techniques
and indicated two major conformations at room temperature in dimethylsulfoxide solutions thus
complicating the spectra. A model compound was synthesized excluding sources of hindered
rotation to paint a clearer picture and the effect of Zn2+ binding was measured through NMR
titrations that indicated a significant change in chemical environment of Ru-coordinated bpy
ligands.
An advantage of [Ru(bpy)3]2+ complexes is bpy ligands maybe be charged with a varying
number of reactive acyl chloride groups. Reaction of these with amine-terminated peptides can
easily increase the number of aeg strands. To demonstrate this, the number of hairpins was also
increased from one to two or three placing [Ru(bpy)3]2+ at the center of a multimetallic complex
and imparting metal coordination in three dimensions. These complexes were compared with
single hairpin complexes capable of binding two Cu2+ centers to further emphasize peptide
dictation on [Ru(bpy)3]2+ photophysical properties. These complexes also served as a starting
point to synthesize a tri-heterometallic complex.
The peptide scaffold also offers the unique possibility of linking known donor-acceptor
pairs to determine if photocatalysis is possible on our peptides. [Ru(Me2 bpy)3]2+ is liked with
one, two, and three [(bpy)Pd(CH3)(CH3CN)]+ complexes through the aeg backbone, that when
irradiated with light (> 455 nm) are able to photocatalyze the dimerization of α-methyl styrene.
These compounds represent the first example of a photocatalytic reaction performed on our
scaffolds.
Finally, a series of compounds is presented that demonstrate the modularity of these
species along with a discussion of transient absorption spectroscopy measured for single hairpins.
The complexes presented are designed and synthesized with the specific intension of exploiting

v
the modularity in metal complex coordination chemistry and peptide coupling chemistry to
increase spectroscopic complexity, complex rigidity, and metal identity. These are presented
with basic characterization and a discussion of their intended purpose.

vi
TABLE OF CONTENTS
LIST OF FIGURES .....................................................................................................xiii
LIST OF TABLES.......................................................................................................xxiii
LIST OF ABBREVIATIONS......................................................................................xxiv
ACKNOWLEDGEMENTS.........................................................................................xxvii
Chapter 1 Directed Self-Assembly of Inorganic Redox Complexes with Artificial Peptide Scaffolds ..................................................................................................1
1.1 Introduction .............................................................................................1 1.1.1 Synthetic Mimics of Biomolecules. .....................................................1 1.1.2 DNA with “Metallobase” Pairs. ..........................................................2 1.1.3 Amino Acid Based Structures. .............................................................3 1.2 Electron Donors and Acceptors Linked by a Peptide Backbone.............5 1.2.1 Photoinduced Electron Transfers in Substituted Oligoproline
Chains.....................................................................................................5 1.2.2 Solvent Dependence of Electron Transfer in Substituted
Oligoprolines. .........................................................................................7 1.2.3 Mechanism of Electron Transfers in Substituted Oligoprolines. .........9 1.3 Metallobases in Peptide Nucleic Acid Architectures ..............................11 1.3.1 Inorganic Complexes Linked to Peptide Nucleic Acid. .......................11 1.3.1.1. Redox Tagged PNA Strands.............................................................13 1.3.1.2 Electrochemical Detection of DNA Using Redox Tagged PNA.......13 1.3.1.3. Click Chemistry for Tagging PNA with Redox Probes. ..................14 1.3.2 Metallobases in PNA Duplexes............................................................14 1.3.2.1. Metal Binding in Ligand-Containing PNA Duplexes. .....................15 1.3.2.2 Hydroxyquinoline-Metallobase PNA Duplexes................................15 1.3.2.3 Variation of Position and Number of Metallobases in PNA
Duplexes.................................................................................................16 1.3.2.4 Electrochemistry of Fc-Modified PNA Monolayers on Au
Electrodes. ..............................................................................................19 1.4 Metal Coordination Based Assembly of Artificial Peptides ...................22 1.4.1 Ligand-Substituted Aeg Oligopeptides. ...............................................22 1.4.1.1 Ligand Substituted Monomer Synthesis............................................24 1.4.1.2 Coordination of Four-Coordinate Metals to Single-Strand
Ligand-Substituted Aeg Oligopeptides. .................................................24 1.4.1.3 Variation of the Number and Type of Complexes in Pyridine-
Substituted Oligopeptides. .....................................................................25 1.4.2 Metal Coordination Based Crosslinking of Bpy-Substituted Aeg
Tripeptides..............................................................................................26 1.4.3 Heterometallic Structures Tethered by Aeg Oligopeptides..................27

vii
1.4.4 Octahedral Metal Complex Crosslinks in -Tpy-Substituted Oligopeptides. ........................................................................................28
1.4.4.1 Metal Crosslinking of Tpy-Substituted Oligopeptides......................28 1.4.4.2. Thin Film Electrochemistry of Metal-Linked -Tpy
Oligopeptides. ........................................................................................30 1.4.4.3. Spectroelectrochemistry of Fe-Linked -Tpy Oligopeptide
Duplexes.................................................................................................30 1.4.5 Photoinduced Energy and Electron Transfers in Metallated Aeg
Oligopeptides. – Overview of Thesis Research .....................................32 1.4.5.1 Aeg-Substituted Ru(bpy)3
2+ Complexes Bind Cu2+ and Zn2+. ..........34 1.4.5.2 Solution Structures with NMR. .........................................................37 1.4.5.3 Inorganic Analogs of Nucleic Acid Hairpins using Aeg-
Substituted [Ru(bpy)3]2+ Complexes......................................................38
1.4.5.4 Metal Binding in Two and Three Directions.....................................43 1.4.5.5 Bipyridine-Modified Peptides as Scaffolds for Photocatalysis. .......45 1.4.5.6 Analysis of Quenching Mechanism, Structural Constraints, and
Future Directions....................................................................................47 1.5 Conclusions. ............................................................................................50 1.6 References. ..............................................................................................50
Chapter 2 Aminoethylglycine-Functionalized Ru(bpy)32+ with Pendant
Bipyridines Self-Assemble Multimetallic Complexes by Cu and Zn Coordination .........................................................................................................56
2.1 Introduction .............................................................................................56 2.2 Experimental............................................................................................60 2.2.1 Chemicals. ............................................................................................60 2.2.2 Synthesis...............................................................................................60 2.2.2.1 Synthesis of Bpy(aeg-OtButyl)2 (1). .................................................60 2.2.2.2 Synthesis of [Ru(bpy)2(bpy[aeg-OtButyl]2)](NO3)2 (Ru-0). .............61 2.2.2.3 Synthesis of [Ru(bpy)2(bpy[aeg-(bpy)-OtButyl]2)](NO3)2 (Ru-1). ...63 2.2.2.4 Synthesis of Bpy(aeg-(AC)-OtButyl)2 (4).........................................63 2.2.2.5 Synthesis of [Ru(bpy)2(bpy[aeg-(AC)-OtButyl]2)](NO3)2 (Ru-
AC). ........................................................................................................65 2.2.2.6 Synthesis of Methyl bpy(aeg-OtButyl) (6)........................................65 2.2.2.7 Synthesis of [Ru(bpy)2(Mebpy[aeg-OtButyl])](NO3)2 (Ru-SS0). ....67 2.2.2.8 Synthesis of [Ru(bpy)2(Mebpy[aeg-(bpy)OtButyl])](NO3)2 (Ru-
SS)...........................................................................................................67 2.2.3 Methods. ...............................................................................................69 2.2.4 General Procedure for Coordination and Isolation of Heterometallic
Complexes. .............................................................................................70 2.3 Results and Discussion ............................................................................75 2.3.1 Syntheses. .............................................................................................75 2.3.2 Formation of Heterometallic Complexes. ............................................79 2.3.3 Electrochemistry...................................................................................84

viii
2.3.4 Absorbance and Emission Spectra. ......................................................86 2.3.5 Spectrophotometric Emission Titrations. .............................................88 2.3.6 Emission Properties of Heterometallic Complexes. .............................93 2.4 Acknowledgments ...................................................................................99 2.5 References ...............................................................................................99
Chapter 3 NMR Investigations of Zn2+ Binding to Ru Hairpin Complexes...............103
3.1 Introduction .............................................................................................103 3.2 Methods ...................................................................................................106 3.3 Experimental............................................................................................107 3.3.1 Chemicals and Reagents.......................................................................107 3.3.2 Synthesis of Starting Materials.............................................................107 3.3.2.1 Synthesis of CH3-Bpy-en-boc (1)......................................................108 3.3.2.2 General Preparation Method of CH3-Bpy-en (1a).............................108 3.3.2.3 Synthesis of [Ru(bpy)2((bpy COOCH3)2]](BF4)2 ..............................109 3.3.2.4 Synthesis of [Ru(bpy)2(bpy(CO2H)2))](PF6)2....................................109 3.3.2.5 Synthesis of [Ru(bpy)2(bpy(COCl)2)](PF6)2 .....................................110 3.3.2.6 Synthesis of [Ru(bpy)2(bpy[en-bpy]2)](PF6)2 (Ru-M) .....................110 3.4 Results and Discussion ............................................................................111 3.4.1 Temperature Dependent and Two Dimensional NMR on Ru-1...........111 3.4.2 1H NMR Titrations of Ru-1 with Zn2+..................................................119 3.4.3 Synthesis and NMR Experiments with Ru-M......................................119 3.5 Conclusions .............................................................................................137 3.6 References ...............................................................................................138
Chapter 4 Impacts on the Location and Number of [Cu(bpy)2]2+ Crosslinks on the
Emission Photodynamics of [Ru(bpy)3]2+ with Pendant
Oligo(aminoethylglycine) Chains.........................................................................141
4.1 Introduction .............................................................................................141 4.2 Experimental............................................................................................146 4.2.1 Chemicals and Reagents.......................................................................146 4.2.2 Synthesis of Starting Materials.............................................................146 4.2.3 Oligopeptide Syntheses. .......................................................................146 4.2.3.1 Amine and Acid Deprotection...........................................................146 4.2.3.2 Synthesis of NH2-[aeg(bpy)]-OtButyl (1). ........................................147 4.2.3.3 Synthesis of NH2-[aeg(ac)-aeg(bpy)]-OtButyl (2). ...........................148 4.2.3.4 Synthesis of NH2-[(aeg(ac))2-aeg(bpy)]-OtButyl (3). .......................148 4.2.3.5 Synthesis of Synthesis of NH2-[aeg(bpy)]2-OtButyl (4). ..................150 4.2.3.6 Synthesis of NH2-[aeg(bpy)-aeg(ac)-aeg(bpy)]-OtButyl (5).............153 4.2.4 Synthesis of [Ru(bpy)2(bpy (COOMe)2)](PF6)2 ...................................153 4.2.5 Synthesis of [Ru(bpy)2(bpy(CO2H)2)](PF6)2. .......................................155 4.2.6 Synthesis of [Ru(bpy)2(bpy(COCl)2)](PF6)2 ........................................155 4.2.7 General Approach for Ru Hairpin Complex Syntheses. ......................158

ix
4.2.7.1 Characterization of [Ru(bpy)2(bpy([aeg(ac)-aeg(bpy)-OtButyl])2)](NO3)2 (Ru-2)......................................................................158
4.2.7.2 Characterization of [Ru(bpy)2(bpy([(aeg(ac))2-aeg(bpy)-OtButyl])2)](NO3)2 (Ru-3)......................................................................160
4.2.7.3 Characterization of [Ru(bpy)2(bpy([aeg(bpy)]2-OtButyl)2)](NO3)2 (Ru-4). ....................................................................................................160
4.2.7.4 Characterization of [Ru(bpy)2(bpy[aeg(bpy)-aeg(ac)-aeg(bpy)-OtButyl)2)(NO3)2 (Ru-5). .......................................................................160
4.2.8 Synthesis of Ruthenium-Copper Complexes........................................164 4.3 Methods. ..................................................................................................165 4.4 Results and Discussion ............................................................................167 4.4.1 Synthesis of Oligopeptides. ..................................................................167 4.4.2 Synthesis of Ru Complexes..................................................................169 4.4.3 Ru-Cu Heterometallic Complexes........................................................171 4.4.4 Copper Coordination Emission Titrations............................................174 4.4.5 Time-Resolved Emission Spectroscopy. ..............................................184 4.5 Conclusions. ............................................................................................192 4.6 Acknowledgements. ................................................................................193 4.7 References ...............................................................................................193
Chapter 5 [Ru(bpy)3]2+ with Pendant Oligo(aminoethylglycine): Variation on the
Number of Chains to Form Multimetallic Structures with Cu(II) and Pd(II).......199
5.1 Introduction .............................................................................................199 5.2 Experimental............................................................................................202 5.2.1 Methods ................................................................................................202 5.2.2 Chemicals and Reagents.......................................................................204 5.2.3 Synthesis...............................................................................................204 5.2.3.1 Synthesis of [Ru(bpy)(4,4’-(CO2CH3)2 bpy)2](PF6)2. .......................204 5.2.3.2 Synthesis of [Ru(bpy)(4,4’-(CO2H)2-bpy)2](PF6)2............................205 5.2.3.3 Synthesis of [Ru(4,4’-(CO2CH3)2-bpy)3](BF4)2 ................................205 5.2.3.4 Synthesis of [Ru(4,4’-dicarboxylic acid bpy)3](PF6)2 ......................205 5.2.3.5 Synthesis of [Ru(bpy)(4,4’-[aeg(bpy)-OtButyl]2bpy)2](NO3)2
(Ru-6) .....................................................................................................206 5.2.3.6 Synthesis of [Ru(4,4’-[aeg(bpy)-OtButyl]2 bpy])3](NO3)2 (Ru-7)...206 5.2.3.7 Synthesis of Ruthenium-Copper and Ruthenium-Palladium
Complexes..............................................................................................208 5.3 Results and Discussion ............................................................................210 5.3.1 Synthesis of Multiple Aeg Hairpin Complexes....................................210 5.3.2 Spectrophotometric Emission Titrations with Cu2+ and Pd2+...............219 5.3.3 Spectroscopy.........................................................................................227 5.3.4 Triheterometallic Complexes ...............................................................230 5.4 Conclusions .............................................................................................232 5.5 References. ..............................................................................................232

x
Chapter 6 Aminoethylglycine-linked Ru-Pd Complexes Catalyze Dimerization of α-Methylstyrene....................................................................................................237
6.1 Introduction .............................................................................................237 6.2 Experimental............................................................................................238 6.2.1 Chemicals and Reagents.......................................................................238 6.2.2 Synthesis...............................................................................................240 6.2.2.1 Synthesis of Ruthenium and Ligand Starting Materials....................240 6.2.2.1.1 Synthesis of 4-Methyl-4’ethyl ester bpy (mbpyee) or 4-Methyl-
4’methyl ester bpy (mbpyme) ................................................................240 6.2.2.1.2 Synthesis of [Ru(Me2bpy)2(mbpyme)](PF6)2 .................................241 6.2.2.1.3 Synthesis of [Ru(Me2bpy)(mbpyee)2](PF6)2 ..................................241 6.2.2.1.4 Synthesis of [Ru(mbpyme)3](PF6)2 ................................................242 6.2.2.2 General Approach to [Ru(Me2bpy)3]
2+ Carboxylic Acid Derivatives .............................................................................................242
6.2.2.2.1 Characterization of [Ru(Me2bpy)2(mbpyCA)](PF6).......................242 6.2.2.2.2 Characterization of [Ru(Me2bpy)(mbpyCA)2](PF6)2 .....................243 6.2.2.2.3 Characterization of [Ru(mbpyCA)3](PF6)2.....................................243 6.2.2.3 General Approach to [Ru(Me2bpy)3]
2+ aeg scaffolds........................243 6.2.2.3.1 Characterization of [Ru(Me2bpy)2(4-methyl-4’-aeg(bpy)-
OtBu)](PF6)2 (CS-1)...............................................................................244 6.2.2.3.2 Characterization of [Ru(Me2bpy)(4-methyl-4’-aeg(bpy)-
OtBu)2](PF6)2 (CS-2)..............................................................................244 6.2.2.3.3 Characterization of [Ru(4-methyl-4’-aeg(bpy)-OtBu)3](PF6)2
(CS-3) .....................................................................................................244 6.2.2.4 General synthetic method for Ru-Pd complexes ...............................245 6.2.2.4.1 Characterization of CS-1[Pd(CH3)Cl] ............................................245 6.2.2.4.2 Characterization of CS-2[Pd(CH3)Cl]2...........................................245 6.2.2.4.3 Characterization of CS-3[Pd(CH3)Cl]3...........................................245 6.2.2.4.4 Characterization of CS-1[Pd(CH3)(CH3CN)].................................246 6.2.2.4.5 Characterization of CS-2[Pd(CH3)(CH3CN)]2 ...............................246 6.2.2.4.6 Characterization of CS-3[Pd(CH3)(CH3CN)]3 ...............................246 6.2.3 Methods ................................................................................................246 6.3 Results and Discussion ............................................................................248 6.3.1 Synthesis and Characterization of Ruthenium Scaffolds .....................248 6.3.2 Synthesis and Characterization of Ruthenium-Palladium Catalysts ....253 6.3.3 Photoinitiated Dimerization of α-methylstyrene ..................................257 6.4 References ...............................................................................................262
Chapter 7 Metal-centered Aminoethylglycine Complexes: Conclusions and Future Outlook......................................................................................................267
7.1 Introduction ............................................................................................267 7.2 Transient Absorption Spectroscopy ........................................................267 7.3 Pyrene-Derivatized Ruthenium Hairpin Complexes ..............................273

xi
7.3.1 Pyrene Energy Transfer .......................................................................273 7.3.1.1 Synthesis of Pyrene- Ru Hairpin Complexes ...................................275 7.3.1.1.1 Synthesis of Methyl-bpy-CH2-pyrene ............................................275 7.3.1.1.2 Synthesis of Ru(bpy)(methyl-bpy-pyrene)Cl2................................275 7.3.1.1.3 Synthesis of [Ru(bpy)(methyl-bpy-pyrene)(4,4’-dimethylester
bpy)](PF6)2 .............................................................................................275 7.3.1.1.4 Synthesis of [Ru(bpy)(methyl-bpy-pyrene)(bpy(aeg-
OtBu)2)](NO3)2.......................................................................................276 7.3.1.1.5 Synthesis of [Ru(bpy)(methyl-bpy-pyrene)(bpy[aeg(bpy)-
Otbutyl]2)](PF6)2 (Ru-pyr-1) ..................................................................276 7.3.1.2 Discussion..........................................................................................277 7.3.2 Pyrene-Terminated Ruthenium Hairpin Complexes ............................280 7.3.2.1 Synthesis of Pyrene-Terminated Ruthenium Complexes..................281 7.3.2.1.1 Synthesis of Fmoc-aeg(bpy)-pyrene...............................................281 7.3.2.1.2 Synthesis of [Ru(bpy)2(bpy[aeg(bpy)-pyrene]2)](NO3)2 (Ru-
pyr-2) ......................................................................................................281 7.3.2.2 Discussion..........................................................................................282 7.4 Ru Di hairpin with Two different hairpins ..............................................284 7.4.1. Syntheses Toward Two Different Hairpins........................................285 7.4.1.1 Synthesis of Bpy-(en-fmoc)2 ............................................................285 7.4.1.2 Synthesis of Ru(bpy)( bpy-[en-fmoc]2)Cl2........................................285 7.4.1.3 Synthesis of [Ru(bpy)(4,4’-[en-fmoc]-bpy)(4,4’-dimethylester
bpy)](NO3)2 ............................................................................................286 7.4.1.4 Synthesis of [Ru(bpy)(4,4’-di[en-fmoc] bpy)(4,4’-di[aeg-OtBu]
bpy)](NO3)2 ............................................................................................286 7.4.1.5 Synthesis of [Ru(bpy)(bpy-[en-fmoc]2)(bpy-[aeg-
(bpy)OtBu]2)](NO3)2 (RuHP2-δ) ............................................................287 7.4.2 Discussion.............................................................................................287 7.5 Crystallization Attempts..........................................................................290 7.5.1 Synthesis of Structurally Rigid Compounds ........................................290 7.5.1.1 Synthesis of Fmoc-aeg(bpy)-OtBu (bpy-mon β)...............................290 7.5.1.2 Synthesis of H2N-aeg(bpy)-OtBu (H2N-bpy mon β).........................291 7.5.1.3 Synthesis of [Ru(bpy)2(methyl-bpy-aeg(bpy)-OtBu)](NO3)2 (Ru-
SS β) .......................................................................................................291 7.5.1.4 Synthesis of 4,4’-diisopropylester bpy (bpydipe) .............................292 7.5.1.5 Synthesis of Ru(bpydipe)2Cl2............................................................292 7.5.1.6 Synthesis of [Ru(diisopropylester-bpy)2(Methyl-bpy-aeg-
OtBu)](NO3)2 (Ru-SS-γ) .......................................................................293 7.5.1.7 Synthesis of [Ru(diisopropylester-bpy)2(Methyl-bpy-aeg-
OtBu)](NO3)2 (Ru-SS-γ-Os) .................................................................293 7.5.2 Discussion.............................................................................................293 7.6 Osmium-Centered Oligopeptides ...........................................................296 7.6.1 Syntheses Toward Osmium Aeg Complexes .......................................296 7.6.1.1 Synthesis of [Os(bpy)2(4-CH3-4’-CH2COOCH3 bpy)](PF6)2 ...........296 7.6.1.2 Synthesis of [Os(bpy)2(4-CH3-4’-CH2COOH bpy)](PF6)2 ...............297

xii
7.6.1.3 Synthesis of [Fmoc-aeg(Os(bpy)3)-OtBu](PF6)2 (Os-mon) ..............297 7.6.2 Discussion.............................................................................................298 7.7 Conclusions .............................................................................................298 7.8 References. ..............................................................................................300

xiii
LIST OF FIGURES
Figure 1-1: Cartoon of general structures of donor-acceptor assemblies. ..................4
Figure 1-2: Chromophore, donor, and acceptor linked by A) oligolysine and B) oligoproline...........................................................................................................6
Figure 1-3: Nanosecond transient absorption difference spectra for the oligoproline redox triad 1. Following a 4-ns pulse from a 460 nm laser (1.5 mJ per pulse), spectra were recorded at intervals from 2 ns to 777 ns for a 1.0 μM peptide triad 1 in freeze-pump thaw degassed acetonitrile at 25 ºC. Reproduced with permission from Ref 36. Copyright (1996) National Academy of Sciences, U. S. A..............................................................................8
Figure 1-4: Structures of DNA and PNA. A, C, G, and T are the nucleobases adenine, cytosine, guanine, and thymine. Reproduced with permission from Ref 46. Copyright (1997) the Royal Society of Chemistry. .................................12
Figure 1-5: Cartoon representations of possible structures of metal-bpy containing PNA Duplexes. Reproduced with permission from Ref 54. Copyright (2006) the American Chemical Society. .............................................17
Figure 1-6: (a) Chemical structure of thymine containing ss PNA that has a C-terminus cysteine and an N-terminus ferrocene, where n = 3 – 7. (b) Panel B shows a schematic representation of PNA molecules self-assembled on a gold surface, in which the blue circle represents cysteine, the red curl represents PNA, and the light brown circle represents ferrocene. Reproduced with permission from Ref 55. Copyright (2008) the American Chemical Society. .....20
Figure 1-7: Structure of aminoethylglycine (aeg) oligopeptide with pendant substitutions acetyl (AC), pyridine (py), bipyridine (bpy), terpyridine (tpy), and phenyl-terpyridine (Φ-tpy). R groups are linked via amide coupling through the acetic acid. (n = 1 – 10) .....................................................................23
Figure 1-8: Titration curves for the changes in absorbance upon addition of oligopeptide to (A) Co(II) at 514 nm and (B) Fe(II) at 567 nm for oligopeptides (■)Φ-tpy aeg monopeptide, (●) (Φ-tpy aeg)2 dipeptide, (♦) (Φ-tpy aeg)3 tripeptide, and (▼) (Φ-tpy aeg)4 tetrapeptide in methanolic solutions. Insets show representative absorbance differences for spectra acquired during titration with (Φ-tpy aeg)3 tripeptide. Reproduced with permission from Ref 67. Copyright (2007) the American Chemical Society ......29
Figure 1-9: (A) Sequential cyclic voltammograms of [Fe4((Φ-tpy aeg)4)2]8+ using
a Pt electrode and a potential scan rate of 50 mVs-1. (B) Cyclic voltammogram of the same film in 0.2 M TBAP in ACN using a scan rate of

xiv
50 mVs-1. Reproduced with permission from Ref 67. Copyright (2007) the American Chemical Society. ................................................................................31
Figure 1-10: (A) Absorbance at 567 nm for a film of [Fe3((Φ-tpy aeg)3)2]6+ on
ITO-coated glass in 0.2 M TBAP in ACN as the potential is swept from 0.35 to 1.35 V at 50 mVs-1. Reproduced with permission from Ref 67. Copyright (2007) the American Chemical Society................................................................33
Figure 1-11: Structures of [Ru(bpy)3]2+ single strand and hairpin complexes...........35
Figure 1-12: Cartoon representation of binding motifs in ligand substituted aeg strands. a) Singe stranded Ru(bpy)3
2+ complexes crosslinked by the addition of Cu2+. b) Bpy dipeptide duplex forms parallel and antiparallel isomers when coordinating two Cu2+ ions. c) Ru hairpin motif prevents isomer formation; Cu2+ binding crosslinks strands. .........................................................36
Figure 1-13: (A) Plot of emission intensity of CH3CN solutions containing (•) 140 μM Ru-1 with addition of 5 μL aliquots of 5.3 mM Cu(NO3)2; (O) 58.7 μM Ru-2 with additions of 5 μL aliquots of 3.41 mM Cu(NO3)2; (1) 104 μM Ru-3 with additions of 5 μL aliquots of 4.86 mM Cu(NO3)2. (B) Plot of emission intensity of CH3CN solutions of (•) 95.0 μM Ru-4 and (O) 57.6 μM Ru-5 after incremental additions of 7 μL of 2.83 mM Cu(NO3)2 and 5 μL of 3.86 x 10⁻³ mM Cu(NO3)2, respectively, versus the molar ratio of Cu2+ to Ru2+. (Inset) Expanded region of the titration curve at higher Cu2+ concentrations. Reproduced with permission from Ref 71. Copyright (2009) the American Chemical Society. ..........................................................................40
Figure 1-14: Molecular ion peaks observed by positive ion electrospray mass spectrometry, plotted together with the calculated mass and isotopic splitting patters for [Ru-5(Cu)2](PF6)6. Reproduced with permission from Ref 71. Copyright (2009) the American Chemical Society. .............................................42
Figure 1-15: Structures of Mono-, Di-, and Tri-hairpin [Ru(bpy)3]2+ complexes. .....44
Figure 1-16: Structures of Scaffolds for Photocatalysis. ............................................46
Figure 1-17: Complex structures showing pyrene inclusion and increased structural rigidity. .................................................................................................49
Scheme 2-1: Schematic of metal coordination induced linkage of bipyridine-substituted peptide dimers for (A) linear chain that can form isomers and (B) hairpin structure that limit isomer formation........................................................58
Figure 2-1: 1H NMR spectrum of Ru-0 at 400 MHz in CH3CN. Solvent peaks are removed for clarity..........................................................................................62

xv
Figure 2-2: 1H NMR spectrum of Ru-1 at 360 MHz in CH3CN. Solvent peaks are removed for clarity..........................................................................................64
Figure 2-3: 1H NMR spectrum of Ru-AC at 360 MHz in d6 dmso. Solvent peaks are removed for clarity..........................................................................................66
Figure 2-4: 1H NMR spectrum of Ru-SS at 400 MHz in d6 dmso. Solvent peaks are removed for clarity..........................................................................................68
Figure 2-5: 1H NMR spectrum of [(Ru-1)-Cu](PF6)4 at 400 MHz in CH3CN. Solvent peaks are removed for clarity. .................................................................71
Figure 2-6: 1H NMR spectrum of [(Ru-SS)2-Cu](PF6)6 at 400 MHz in CH3CN. Solvent peaks are removed for clarity. .................................................................72
Figure 2-7: 1H NMR spectrum of [(Ru-1)-Zn](PF6)4 at 400 MHz in CH3CN. Solvent peaks are removed for clarity. .................................................................73
Figure 2-8: 1H NMR spectrum of [(Ru-SS)2-Zn](PF6)6 at 400 MHz in CH3CN. Solvent peaks are removed for clarity. .................................................................74
Scheme 2-2: Synthetic steps toward Ru hairpin complexes. i) Δ 90% ethanol; overnight. ii) HOBT, HBTU, DIPEA, in CH2Cl2; 2 days. iii) HOBT, EDC, DIPEA, in CH2Cl2; 2 days. ...................................................................................77
Scheme 2-3: Synthetic steps toward single stranded complexes. i) Δ 90% ethanol; overnight. ii) HOBT, HBTU, DIPEA, in CH2Cl2; 2 days. ...................78
Scheme 2-4: Coordination geometries of compounds Ru-1 and Ru-SS. ..................80
Figure 2-9: Aromatic region of 1H NMR spectra of (A) Ru-1, (B) (Ru-1)-Zn, and (C) (Ru-1)-Cu at 400 MHz in CD3CN. .........................................................81
Figure 2-10: Aromatic region of 1H NMR spectra of (A) Ru-SS, (B) (Ru-SS)2-Zn, and (C) (Ru-SS)2-Cu at 400 MHz in d6 dimethylsulfoxide. ..........................82
Figure 2-11: (A) Emission spectra of 0.14 mM Ru-1 in acetonitrile upon incremental additions of 5 µL of 5.3 mM Cu(NO3)2 in CH3CN. Inset: Emission spectra of 0.15 mM Ru-1 in methanol upon addition of 10 µL aliquots of 6.7 mM Zn(Ac)2 in methanol. (B) Plot of emission intensity at λem,max = 650 nm (λex = 469 nm) versus the volume of added metal salt solution (5.3 mM Cu2+ ●; 6.7 mM Zn2+ ○) and pure CH3CN (■); and versus the relative ratio of added metal ion to Ru2+. Titration curves are normalized to the initial Ru peak emission intensity............................................89

xvi
Figure 2-12: (A) Plot of the change in fluorescence emission of 0.21 mM Ru-SS in acetonitrile at λem,max = 632 nm (λex = 456 nm) as a function of added volume of metal salt solution (4.4 mM Cu2+; 4.6 mM Zn2+ ) or CH3CN (■); and versus the relative ratio of added metal ion to Ru2+. Titration curves are normalized to the initial Ru peak emission intensity. (B) Plot of the change in fluorescence emission of 0.23 mM Ru-AC in aerated CH3CN λem,max 650 nm (λex = 469 nm) upon addition of 7 µL aliquots of 5.9 mM Cu(NO3)2 in CH3CN..................................................................................................................91
Figure 2-13: Plot of emission intensity (counts) vs. total Cu(NO3)2 concentration for 0.14 mM Ru-1 and 0.21 mM Ru-SS in CH3CN.............................................92
Figure 2-14: (A) Time-resolved emission at 650 nm following excitation at 469 nm of () 0.14 mM Ru-1 in nitrogen-purged CH3CN versus with the addition of one molar equivalent of either (▼) Zn(Ac)2 or (□) Cu(NO3)2. (B) Time-resolved emission at λem,max = 650 nm (λex = 469 nm) of () 0.23 mM Ru-AC, and following the addition of one molar equivalent of (□) Cu(NO3)2 or (▼) Zn(Ac)2 in nitrogen purged CH3CN. (C) Time-resolved emission at λem,max = 632 nm (λex = 456 nm) of () 0.21 mM Ru-SS, and following the addition of one-half molar equivalent of (□) Cu(NO3)2 or (▼) Zn(Ac)2. ..........94
Figure 2-15: Decay of the emission intensity of dearated solutions of (A) 35 M Ru-1 (ex = 469 nm, em,max = 650 nm) containing the indicated molar ratio of Cu2+:Ru2+ following addition of 2.55 mM Cu(NO3)2 in CH3CN. (B) Transient emission of 50 M Ru-SS (ex = 456 nm, em,max = 632 nm) for solutions containing indicated amounts of Cu2+:Ru2+ following addition of 2.1 mM Cu(NO3)2 in CH3CN. ............................................................................................96
Scheme 3-1: Structures of Ru-0, and Ru-SS, Ru-1, and Ru-M ...............................104
Figure 3-1: Plot of maximum peak emission intensity as a function of added Zn2+ for Ru-1 (●), Ru-SS (▲), and Ru-M (■) in CH3CN. ........................................105
Figure 3-2: Temperature dependent 1H NMR spectra of Ru-1 in d6 dmso at 300 MHz ......................................................................................................................112
Figure 3-3: Aromatic region of temperature dependent 1H NMR spectra of Ru-1 in d6 dmso at 300 MHz. ........................................................................................113
Figure 3-4: Overlaid temperature dependent 1H NMR spectra of Ru-1 taken at (black) 25 °C (1) and (red) 25 °C (2) from Figure 3-3. Difference spectrum shown above. ........................................................................................................114
Figure 3-5: Titration of 23.7 mM Ru-1 with 225 mM Zn(acetate)2 in CD3OD at 400 MHz. The numbers are the ratio of Zn2+:Ru2+..............................................120

xvii
Scheme 3-2: Synthetic steps toward Ru-M................................................................121
Figure 3-6: Cyclic voltammogram of Ru-M in 0.2 M TBAP in CH3CN vs. SCE taken at a scan rate of 50 mV/sec on a glassy carbon working electrode.............123
Figure 3-7: Molecular ion peaks observed by positive ion electrospray mass spectrometry, plotted together with the calculated mass and isotopic splitting patterns for [Ru-M(Zn)](PF6)4. a) [Ru-M(Zn)]4+; b) [[Ru-M(Zn)](PF6)]
3+; c) [[Ru-M(Zn)](PF6)2]
2+. ......................................................................................124
Figure 3-8: 1H NMR spectrum of Ru-M in d6 dmso at 400 MHz..............................125
Figure 3-9: COSY spectrum of Ru-M in d6 dmso at 400 MHz.................................126
Figure 3-10: Aromatic region of the COSY spectrum of Ru-M in d6 dmso at 400 MHz. .....................................................................................................................127
Figure 3-11: 1H NMR spectra during the titration of 354 mM Zn(acetate)2 with compound 33.6 mM Ru-M in d6 dmso. ...............................................................129
Figure 3-12: Aromatic region of the 1H NMR spectrum during a titration of 354 mM 33.6 Zn(acetate)2 with compound Ru-M in d6 dmso including guiding lines.......................................................................................................................130
Figure 3-13: Possible rearrangement within Ru-hairpin complexes. A) Ru-1 or Ru-M; B) Predicted Ru-Zn hairpin complex; C) Coordination of excess Zn2+ to hairpin scaffold. ................................................................................................133
Figure 3-14: A) Change in total integration over 7.4 – 8.0 (red) and 8.25 – 8.63 ppm (black). B) Change in chemical shift for Ru-M showing selected protons G (●), M(○), L (▼), O (□), J (∆), K (■), and N (♦)...........................134
Figure 4-1: Two motifs for self-assembly of oligopeptides with pendant ligands by metal ion coordination: A) self-complementary bpy-substituted aeg dipeptides form parallel and anti-parallel isomers when crosslinked with Cu2+ (blue spheres).19a B) Attachment of aeg strands to [Ru(bpy)3]
2+ (red sphere) pre-directs alignment, Cu2+ binds to close the “hairpin loop”.............................143
Scheme 4-1: Oligopeptide hairpin substituted Ru complexes....................................145
Figure 4-2: 1H NMR spectrum of Fmoc-2 in CDCl3 at 360 MHz..............................149
Figure 4-3: 1H NMR spectrum of Fmoc-3 in CDCl3 at 360 MHz..............................151
Figure 4-4: 1H NMR spectrum of Fmoc-4 in CDCl3 at 360 MHz..............................152
Figure 4-5: 1H NMR spectrum of Fmoc-5 in CDCl3 at 400 MHz..............................154

xviii
Figure 4-6: 1H NMR spectrum of [Ru(bpy)2(COOMe)2](PF6)2 in d6 dmso at 300 MHz. (Water peak at 3.3 ppm was removed for clarity.) .....................................156
Figure 4-7: 1H NMR spectrum of [Ru(bpy)2(bpy(COOH)2)](PF6)2 in d6 dmso at 300 MHz. Small water impurity is at 3.33 ppm. ..................................................157
Figure 4-8: 1H NMR spectrum of Ru-2 in CD2Cl2 at 400 MHz.................................159
Figure 4-9: 1H NMR of Ru-3 in CD2Cl2 at 400 MHz.................................................161
Figure 4-10: 1H NMR spectrum of Ru-4 in CD2Cl2 at 400 MHz. ..............................162
Figure 4-11: 1H NMR spectrum of Ru-5 in CD2Cl2 at 400 MHz...............................163
Scheme 4-2: Synthetic steps toward di and tripeptides. (i) HBTU, HOBT, DIPEA, CH2Cl2, overnight; (ii) DBU, octanethiol, tetrahydrofuran, overnight...168
Figure 4-12: Cyclic voltammograms of acetonitrile solutions containing A) 1.09 mM Ru-2 (black line) or 5.09 mM Fmoc-aeg(bpy)-OtButyl (red line) with 0.2 M tetrabutylammonium perchlorate supporting electrolyte, obtained using a 0.068 cm2 area glassy carbon working electrode and a potential scan rate of 75 mV/s. Currents are normalized to concentration. B) potential window increased to include irreversible Fmoc-aeg(bpy)-OtButyl ligand-centered reduction. ..............................................................................................................170
Figure 4-13: Comparison of the time-dependent emission of () 47.8 μM Ru-1; () 39.80 μM Ru-2; () 43.14 μM Ru-3; () 37.6 μM Ru-4; and () 40.14 μM Ru-5 at em, max following a 800 ps excitation pulse at ex = 469 nm in deoxygenated solutions in CH3CN. Decay curves are normalized to complex concentration. Inset: Emission spectrum of Ru-2 in deoxygenated CH3CN...........................................................................................173
Figure 4-14: Molecular ion peaks observed by positive ion electrospray mass spectrometry, plotted together with the calculated mass and isotopic splitting patterns for [Ru-2(Cu)](PF6)4. .............................................................................175
Figure 4-15: Molecular ion peaks observed by positive ion electrospray mass spectrometry, plotted together with the calculated mass and isotopic splitting patterns for [Ru-3(Cu)](PF6)4. .............................................................................176
Figure 4-16: Molecular ion peaks observed by positive ion electrospray mass spectrometry, plotted together with the calculated mass and isotopic splitting patterns for [Ru-4(Cu)2](PF6)4. ............................................................................177

xix
Figure 4-17: Molecular ion peaks observed by positive ion electrospray mass spectrometry, plotted together with the calculated mass and isotopic splitting patterns for [Ru-5(Cu)2](PF6)6. ............................................................................178
Figure 4-18: Normalized emission intensity (em = 650 nm) of Ru-4 hairpin complex in CH3CN solutions following excitation at λex = 469 nm during a titration of sequential addition of Cu2+. ................................................................181
Figure 4-19: (A) Plot of emission intensity of CH3CN solutions containing (●) 140 M Ru-1 with addition of 5 µL aliquots of 5.3 mM Cu(NO3)2; (○) 58.7 M Ru-2 with additions of 5 µL aliquots of 3.41 mM Cu(NO3)2; (▼) 104 M Ru-3 with additions of 5 µL aliquots of 4.86 mM Cu(NO3)2. (B) Plot of emission intensity of CH3CN solutions of (●) 95.0 M Ru-4 and (○) 57.6 M Ru-5 after incremental additions of 7 µL of 2.83 mM Cu(NO3)2 and 5 µL of 3.86 x 10⁻³ mM Cu(NO3)2, respectively, versus the molar ratio of Cu2+ to Ru2+. Inset: Expanded region of the titration curve at higher Cu2+ concentrations. ......................................................................................................182
Figure 4-20: Comparison of emission titrations of Ru-2 (●) and Ru-4 (○) with Cu(NO3)2 and Ru(bpy)3
2+ (▼) with [Cu(bpy)2](NO3)2. .......................................183
Figure 4-21: Depiction of the sequential binding of two Cu2+ ions (blue sphere) by Ru-4 or Ru-5 (red sphere)...............................................................................185
Figure 4-22: Arrhenius plot of the non-radiative relaxation rate (knr) for (●) 41 μM Ru-1-(Cu); (○) 53 μM Ru-2-(Cu); (▼) 40 μM Ru-3-(Cu); () 36 μM Ru-4-(Cu)2; and (■) 17 μM Ru-5-(Cu)2 in deoxygenated CH3CN solutions. ...188
Scheme 5-1: [Ru(bpy)3]2+ hairpin structures. ..............................................................201
Figure 5-1: 1H NMR spectrum of Ru-6 in CD2Cl2 at 400 MHz.................................207
Figure 5-2: 1H NMR spectrum of Ru-7 in CD2Cl2 at 400 MHz.................................209
Scheme 5-2: Synthetic Steps toward Ru-6 and Ru-7.a ..............................................211
Figure 5-3: Cyclic Voltammograms of Ru-1, Ru-6, and Ru-7 taken at a scan rate of 50 mV/sec in 0.2 M TBAP in CH3CN vs. SCE. ..............................................212
Figure 5-4: Plot of ln(knr) vs emission energy demonstrating linear agreement with energy gap.....................................................................................................215
Figure 5-5: Selected molecular ion peaks observed by positive ion electrospray mass spectrometry, plotted together with the calculated mass and isotopic

xx
splitting patterns for [Ru-1(Cu)](PF6)4. a [Ru-1(Cu)]4+; b {[Ru-1(Cu)]4+(PF6)}
3+; c {[Ru-1(Cu)]4+(PF6)2}2+..........................................................216
Figure 5-6: Selected molecular ion peaks observed by positive ion electrospray mass spectrometry, plotted together with the calculated mass and isotopic splitting patterns for A) [Ru-6(Cu)2](PF6)6 and B) [Ru-6(Pd)2](PF6)6. (a) [Ru-6(Cu)2]
6+; [Ru-6(Cu)2]6+ • CH3CN; [Ru-6(Cu)2]
6+ • 2 CH3CN; (b) [[Ru-6(Cu)2](PF6)]
5+; (c) [[Ru-6(Cu)2](PF6)2]4+; (d) [[Ru-6(Cu)2](PF6)3]
3+; (e) [[Ru-6(Cu)2](PF6)4]
2+; (f) [Ru-6(Pd)2]6+; (g) [[Ru-6(Pd)2](PF6)]
5+, (h) [[Ru-6(Pd)2](PF6)2]
4+; (i) [[Ru-6(Pd)2](PF6)3]3+; (j) [[Ru-6(Pd)2](PF6)4]
2+. ......217
Figure 5-7: Selected molecular ion peaks observed by positive ion electrospray mass spectrometry, plotted together with the calculated mass and isotopic splitting patterns for A) [Ru-7(Cu)3](PF6)8 and B) [Ru-7(Pd)3](PF6)8. (a) [Ru-7(Cu)3]
8+ • 3 CH3CN; (b) [[Ru-7(Cu)3](PF6)]7+, [[Ru-7(Cu)3](PF6)]
7+ • CH3CN; (c) [[Ru-7(Cu)3](PF6)3]
5+; (d) [[Ru-7(Cu)3](PF6)4]4+;(e) [[Ru-
7(Cu)3](PF6)5]3+. (f) [[Ru-7(Pd)3](PF6)]
7+; (g) [[Ru-7(Pd)3](PF6)2]6+; (h)
[[Ru-7(Pd)3](PF6)3]5+; (i) [[Ru-7(Pd)3](PF6)4]
4+; (j) [[Ru-7(Pd)3](PF6)5]3+. ......218
Figure 5-8: A) Plot of peak emission intensity of CH3CN solutions of (●) 140 μM Ru-1 with additions of 5 μL aliquots of 5.3 mM Cu(NO3)2, (■) 98.4 μM Ru-6 with addition of 6 μL aliquots of 4.37 mM Cu(NO3)2, and (▼) 89.4 μM Ru-7 with additions of additions of 3 μL aliquots of 7.43 mM Cu(NO3)2. Insets: Expanded regions at higher Cu/Ru ratios B) Plot of peak emission intensity of CH3CN solutions of (●) 83.3 μM Ru-1 with additions of 3 μL aliquots of 6.16 mM [Pd(CH3CN)4](BF4)2 (with guiding lines to show minor breaks in curve), (■) 108 μM Ru-6 with addition of 2 μL aliquots of 1.62 mM [Pd(CH3CN)4](BF4)2, and (▼) 95.9 μM Ru-7 with additions of additions of 4 μL aliquots of 9.52 mM [Pd(CH3CN)4](BF4)2. ............................................220
Figure 5-9: Comparison of emission titrations of Ru-dicopper complexes of Ru-6 and Ru-410b and Ru-510b hairpin complexes .....................................................222
Figure 5-10: Comparison of first Cu2+ binding sites in Ru complexes with double (A) and single (B and C) hairpins.........................................................................224
Figure 5-11: Emission titrations curves with Ru-6 and with previously reported single hairpins Ru-4 and Ru-5 showing different quenching efficiencies of Cu2+ on [Ru(bpy)3]
2+ at 1 and 2 equivalents of Cu:Ru during an emission titration. Cartoon representation below shows Cu2+ binding within the peptide...................................................................................................................225
Figure 5-12: Molecular modeling using Hyperchem 6.0 to show possible distances between A) intra-hairpin crosslinking, B) inter-hairpin crosslinking, and C) dimerization of Ru(bpy)3
2+ centers......................................226

xxi
Figure 5-13: Normalized transient emission decay curves measured at λmax,em for heterometallic complexes following an 800 ps laser pulse at λmax,abs. Insets show residuals. A) Ru-1(Cu) (black), Ru-6(Cu)2 (blue), and Ru-7(Cu)3 (red). B) Ru-1(Pd) (black), Ru-6(Pd)2 (blue), and Ru-7(Pd)3 (red). .................228
Figure 5-14: Selected molecular ion peaks observed by positive ion electrospray mass spectrometry, plotted together with the calculated mass and isotopic splitting patterns for [Ru-6(CuPd)](PF6)6. A) (a) [Ru-6(CuPd)]6+; (b) [Ru-6(CuPd)]6+ • CH3CN; (c) [[Ru-6(CuPd)](PF6)]
5+; (d) [[Ru-6(CuPd)](PF6)2]
4+; (e) [[Ru-6(CuPd)](PF6)3]3+; (f) [[Ru-6(CuPd)](PF6)4]
2+. B) (g) [[Ru-6(M,M’)](PF6)3]
3+ showing evidence of Ru-6 coordinated with two Cu, two Pd, and one Cu and one Pd. .............................................................231
Scheme 6-1: Synthetic steps toward ruthenium catalyst scaffolds for A) CS-1, B) CS-2, and CS-3.....................................................................................................239
Figure 6-1: Cyclic voltammograms for 0.786 mM CS-1, 0.787 mM CS-2, and 0.894 mM CS-3 in 0.2 M TBAP in CH3CN vs. SCE scanned at 50 mV/sec.......250
Figure 6-2: Plot of lnknr vs. Emission energy showing energy gap relationship. ......252
Figure 6-3: Mass spectrometry data compared with theoretical models for a) [CS-1(PdCl)]2+; b) [[CS-1(PdCl)](PF6)]
+; c) [CS-1(PdCH3CN)]3+; d) [[CS-1(PdCH3CN)](PF6)]
2+ and e) [[CS-1(PdCH3CN)](PF6)2]+...................................254
Figure 6-4: Mass spectrometry data compared with theoretical models for a) [CS-2(PdCl)2]
2+; b) [CS-2(PdCH3CN)2]4+; c) [[CS-2(PdCH3CN)2](PF6)]
3+ and d) [[CS-2(PdCH3CN)2](PF6)2]
2+. ...................................................................255
Figure 6-5: Mass spectrometry data compared with theoretical models for a) [CS-3(PdCl)3]
2+; b) [CS-3(PdCH3CN)3]5+; c) [[CS-3(PdCH3CN)3](BF4)]
4+ and d) [[CS-3(PdCH3CN)3](PF6)2]
2+. ...................................................................256
Figure 6-6: Example 1H NMR spectra for Ru-2[Pd-CH3CN]2 during a photocatalytic experiment. A) Before irradiation. B) Irradiation for 85 minutes with light > 455 nm. C) Purchased 2,4-diphenyl-4-methyl-1-pentene. D) Difference between A and B normalized to integration of CD3NO2 peak at 4.33 ppm. Positive peaks indicative of new species in solution; negative peaks indicative of reacted material. .......................................259
Figure 6-7: A) Plot of % α-methyl styrene consumed vs. time for 36.4 mM CS-1[PdSol] (w/light, ●), CS-1[PdSol] (no light, ○), 17.0 mM CS-2[PdSol]2 (▼), and 17.0 mM CS-3[PdSol]3 (■). B) Ratio of product: reactant vs. time during Photocatalysis experiment for CS-1[PdSol] (w/light, ●), CS-2[PdSol]2 (▼), and CS-3[PdSol]3 (■). ................................................................260

xxii
Figure 7-1: Femtosecond transient absorption spectra of Ru-1-(Cu) taken between 0 and 3 ns. Arrows indicate the simultaneous growth of bpy•/- (black) and the bleach of MLCT band (red). ........................................................268
Figure 7-2: Energy level diagram for Ru-Cu complexes............................................270
Figure 7-3: Energy Level Diagram for Ru-pyr-1.1 ....................................................274
Scheme 7-1: A) Synthetic steps toward pyrene-derivatized Ru hairpin. B) Synthetic steps toward pyrene-terminated Ru hairpin..........................................278
Figure 7-4: Emission titration of Ru-pyr-1 with Cu2+ in CH3CN..............................279
Figure 7-5: Emission spectrum of Ru-pyr-2 hairpin (black) and Ru-pyr-2 + 1 eq Zn2+ (red) excited at 343 nm. This was purged with N2 for 5 minutes, but not purged again after the addition of Zn2+. The decrease in emission intensity for pyrene and Ru might be from the introduction of small amounts of O2......................................................................................................................283
Scheme 7-2: Synthetic steps toward RuHP2-δ. ..........................................................289
Scheme 7-3: A) Synthetic steps toward β-series single strand Ru-Os complexes. B) Synthetic steps toward γ-series single strand Ru-Os complexes. ....................295
Figure 7-6: Cyclic Voltammogram of Os-mon (black) overlayed with Ru-2 (red) scanned at 50 mV/sec in 0.2 M TBAP in CH3CN vs. SCE. .................................299

xxiii
LIST OF TABLES
Table 2-1: Electrochemical characterization of compounds Ru-1, Ru-AC, and Ru-SS. ..................................................................................................................85
Table 2-2: Photophysical Data for Ru Hairpins. ........................................................87
Table 2-3: Summary of Lifetime titration data ...........................................................97
Table 3-1: 1H and 13C chemical shifts for Ru-0 at 25 °C in d6 dmso. Non-amide bpy ligands (red) are equivalent. Protons on the amide containing, bridging, bpy ligand are equivalent. Peptide chains are equivalent. Secondary amine protons (Proton E) not observed.12 .......................................................................115
Table 3-2: 1H and 13C Chemical Shifts for Ru-1. .......................................................117
Table 3-3: Chemical Shifts for Ru-1 peptide strands. ................................................118
Table 3-4: 1H chemical shifts for Ru-M. ....................................................................128
Table 3-5: Kinetic and thermodynamic data for Zn2+ bipyridine complexes, listed with Cu2+ and Ni2+ for comparison.27 ...................................................................132
Table 3-6: Chemical shift information for selected protons in Ru-M. .......................136
Table 4-1: Photophysical and Electrochemical Data for Ru Hairpin Complexes......172
Table 4-2: Photophysical data for Ru-Cu Heterometallic Complexes.......................187
Table 4-3: Temperature-dependent emission decay data taken in freeze-pump thawed CH3CN. ....................................................................................................189
Table 5-1: Photophysical Properties of Heterometallic Complexes. .........................214
Table 6-1: Summary of Photophysical Data.a ............................................................251
Table 7-1: Summary of transient absorption data.a .....................................................271

xxiv
LIST OF ABBREVIATIONS
abs absorption
ACN acetonitrile
aeg N-(2-aminoethyl)glycine
BOC butyloxycarbonyl
bpy 2,2’-bipyridine
Bz η6-benzene
Cacld calculated
COSY homonuclear correlation spectroscopy
DCM dichloromethane
DIPEA N,N’-diisopropylethylamine
dmso dimethylsulfoxide
DMF N,N’-dimethylformamide
DNA deoxyribonucleic acid
ε molar absorbtivity
E0 formal potential
EDC 1-[3-dimethylamino]-propyl]-3-ethylcarbodiimide hydrochloride
Ea activation energy
em emission
en ethylene diamine
ESI+ positive ion electrospray ionization mass spectrometry
EtOAc ethylacetate
EtOH ethanol
η dielectric constant

xxv
Fc ferrocene
Fmoc 9-fluorenylmethoxycarbonyl
HBTU 2-(1H-benzotriazole-1-yl)-1,1,3,3-tetramethyluronium hexafluorophosphate
HMBC heteronuclear multiple bond coherence
HMQC heteronuclear multiple quantum coherence
HOBT 1-hydroxypyridone
HR high resolution
I integrated emission
i current
iDNA inorganic DNA
kr rate of radiative decay
knr rate of nonradiative decay
λ wavelength
max maximum
mbpyee 4-methyl-4’-ethylester bipyridine
mbpyme 4-methyl-4’methylester bipyridine
MebpyAA 4-methyl-4’-acetic acid bipyridine
MeOH methanol
min minute
MLCT metal-to-ligand charge transfer
MS mass spectrometry
m/z mass to charge ratio
n number
NMR nuclear magnetic resonance
OtBu tert-butoxy

xxvi
pda pyridine-2,6-dicarboxylate
ph or Φ phenyl
Φ quantum yield
PNA peptide nucleic acid
ppm parts per million
py pyridine
pyr pyrene
R gas constant, 8.314 J(mol)-1K-1
RNA ribonucleic acid
SCE saturated calomel electrode
SS single stranded
T temperature
τ lifetime
TBAP n-tetrabutylammonium perchlorate
THF tetrahydrofuran
TFA trifluoroacetic acid
tpy 2,2;6’2’’-terpyridine
UV ultraviolet
V volt
Vis visible

xxvii
ACKNOWLEDGEMENTS
I would first like to thank my research advisor, Professor Mary Elizabeth Williams. I
will always be thankful for the guidance and freedom that I was given over the years and her
encouragement pushed me to become a better scientist. This was a luxury I will not soon forget.
It was a privilege to have worked in her group.
I had the pleasure of working with many wonderful people in the Williams lab, including
the founding group members, whose personalities and enthusiasm made working along side them
a true enjoyment. Thank you to group members, both past and present for the many memories.
Special thanks to my advisors prior to attending Penn State for it was through their
foundation that prepared me for graduate research. First, I thank my undergraduate research
advisor Professor Jeffrey J. Rack at Ohio University for giving me the opportunity to be the first
undergraduate in his lab. His guidance and support lead me here and for that I am truly grateful.
Also to Jon Rau and Tom Baker, my supervisors at Los Alamos National Laboratory, who
introduced me to a much wider range of science than I imagined. Their encouragement prepared
me greatly for graduate school.
I would like to thank Professor Scott Showalter for his expertise in NMR spectroscopy
and eagerness to collaborate on experiments. All high-resolution mass spectrometry data were
collected by James Miller in the Proteomics and Mass Spectrometry Core Facility at Penn State.
Special thanks to him for his insight. Transient absorption spectroscopy was collected through
collaborations with Professor Jeffrey J. Rack at Ohio University and Professor Claudia Turro at
The Ohio State University. Thanks to them for their generosity and eagerness to collaborate.
I would be nowhere without the amazing women in my life. To my mother, Laurie, and
sister, Ashley, I send my sincerest and deepest thanks. Absolutely none of this would be possible
without their constant understanding and support. Their unwavering and infinite faith in me has

xxviii
been an undeserved constant over the years and words cannot express my gratitude. Thank you
for everything.
I would like to thank Heather, who has been an absolute blessing during these past few
years. She possesses a rare grace and I am extremely fortunate to have her in my life and by my
side as my source of comfort, motivation, and encouragement.
Finally, to the friends that I have made over the years, you can never be replaced. It was
an honor to have shared these experiences with you. I wish you all the best and sincerely hope to
keep in touch with you all.
The research presented here was generously funded by the Department of Energy (DE-
FG02-08ER 15986). Great thanks to the Department of Chemistry at Penn State and the
American Chemical Society travel grants to attend conferences and present the work I achieved.

Chapter 1 Directed Self-Assembly of Inorganic Redox Complexes with Artificial Peptide Scaffolds
1.1 Introduction
Nature utilizes self-assembly to create macromolecules that are capable of performing the
functions necessary for life. For example, photosynthetic organisms self-assemble
supramolecular structures that are capable of undergoing electron transfer reactions after the
absorption of a photon, leading to chemically functional charge separated states. In so doing, this
multi-step process provides the necessary energy requirements to fuel biological systems.
Making synthetic supramolecular analogs of biological electron transfer cascades may ultimately
lead to molecular computing, photocatalysts, solar fuel production, etc. Much attention has been
paid to this topic and several reviews describe approaches to this challenge that include organic1-3
and inorganic4-6 examples and others utilizing fullerenes and ruthenium compounds.7,8 The
synthetic challenge is to build large structures capable of long range, sequential electron transfers
that are robust and versatile. In this review, we describe tactics that, in combination, mimic two
of the prevalent strategies in nature: self-assembly by molecular recognition, and the use of
repeating units of amino acids to form larger peptides, proteins, and enzymes.
1.1.1 Synthetic Mimics of Biomolecules.
Natural structures primarily rely on hydrogen bonding to assemble complex tertiary
architectures. For example double stranded (ds) DNA hybridizes by self assembly using hydrogen
bonding recognition of nucleic acid complements (e.g. A – T and G – C base pairing). The
predominant approach in inorganic synthetic analogs is to rely on metal coordination chemistry as

2
a means of self-assembly. For example, Hupp and coworkers self- assembled molecular squares
and rectangles with Re carbonyl complex corners and symmetrical nitrogen heterocycles (e.g.
4,4’-bipyridine or pyrazine) walls.9 This chemistry has been expanded to form assemblies with
complex catalytic and photochemical properties.10-13 Likewise, Stang and coworkers have been
instrumental in developing well-controlled assembly of molecular geometries using metal-ligand
interactions, primarily with Pd and Pt.14 These structures have been reported for potential
applications in molecular recognition and catalysis.15-18
Macromolecules that make up living organisms are built from repeating units.
Nucleobases present in RNA and DNA along a sugar phosphate backbone with simple linkages
can be arranged in any sequence and length. Like nucleic acids, proteins are comprised of amino
acids; the sequence and type of modular repeating units define the function of the macromolecule.
This review describes synthetic analogs that take inspiration from these, with the goal of using the
versatility of modular units without the need for de novo synthesis of new structures. Together
with metal coordination based self-assembly, polyfunctional and reconfigurable inorganic redox
structures can be readily prepared.
1.1.2 DNA with “Metallobase” Pairs.
Several research groups have replaced nucleic acid base pairs in duplex DNA with
inorganic complexes, often called “metallobase” pairs, to produce hybrid assemblies. In this
methodology, analogous to A-T and G-C Watson-Crick base pairs, ligands on opposite chains are
“complementary” with respect to coordinative saturation of the metal center. For example, for a
four-coordinate metal (e.g. Cu2+, Zn2+, or Pt2+) the ligand pairs bidentate-bidentate (e.g.
bipyridine-bipyridine, 2 x 2) or tridentate-monodentate (e.g. terpyridine-pyridine, 3 x 1) are

3
complementary ligand pairs. Alternatively using octahedral metals such as Fe2+ or Co2+, the
tridentate-tridentate pair (e.g. terpyridine-terpyridine, 3 x 3) would be complementary.
Shionoya and coworkers designed a number of hybrid DNA systems that incorporate
metal complexes into the sugar phosphate scaffold.19-23 Meggers et al. incorporated artificial
bases into DNA duplexes: in one example, dipic ligands were inserted in the oligonucleotide and
Cu2+ formed coordinative crosslinks.24 This structure was later crystallographically characterized
as helical.25 Additional refinements using this strategy incorporated Ag+ metal ions26 and
modified the backbone to glycol nucleic acid (GNA).27
1.1.3 Amino Acid Based Structures.
Amino acid building blocks provide a facile approach toward synthesizing large
structures capable of performing redox processes. Polyamide backbones have the structural
simplicity and programmability to synthesize a variety of structures that control the placement
and identity of metal complexes and allow electronic communication between metal centers.
When combined with chromophores, electron donors and acceptors, these structures can form the
electron transfer cascades necessary for artificial photosynthesis. This review describes recent
efforts that couple metal complexes with polyamides that ultimately will be used for the purposes
of electron transfer in long-range cascades and formation of long-lived charge separate states.
We focus on structures as depicted in Figure 1-1. Figure 1-1A shows a linear array of donors
and acceptors linked through a repeating backbone. Note that all functional components of this
system stem from a single strand and are essentially on the same side because off the secondary
structure of the peptide. We further describe assemblies that form duplex structures either with
(Figure 1-1B) or without (Figure 1-1C) the assistance of natural Watson-Crick base pairs.

4
Figure 1-1: Cartoon of general structures of donor-acceptor assemblies.

5
1.2 Electron Donors and Acceptors Linked by a Peptide Backbone
An approach for systematically synthesizing large structures of chromophores, electron
donors and acceptors uses peptide coupling chemistry to arrange these in specific arrays. Several
examples describing the combination of [Ru(bpy)3]2+ complexes with organic donors and
acceptors such as anthraquinone (ANQ) and phenothiazine (PTZ) have been described and their
general structures are shown in Figure 1-2. These molecules have been extensively reviewed in
the literature4,5 – we briefly summarize some of the results here by way of introduction to metal
complex containing oligopeptide assemblies.
1.2.1 Photoinduced Electron Transfers in Substituted Oligoproline Chains.
In initial studies of photoinitiated electron transfers in the peptide-linked donor-acceptor
molecules, [Ru(bpy)3]2+ was linked with organic donors and acceptors by substituting a
bipyridine ligand28-31 to a lysine monomer32-34 within a repeating lysine oligopeptide chain
(Figure 1-2A).35 Modifications of this strategy led to examples of a polysubstituted oligoproline
strand, shown in Figure 1-2B, in which the photophysical properties were studied.36 In both
cases, these oligopeptides were synthesized using a solid phase resin support to afford a
predetermined sequence of pendant redox species or functional groups in specific positions along
the backbone. Oligoproline chains had an α-helical structure, so that careful selection of the
substituted amino acid location arranged the chromophore, donor, and acceptor species on the
same side of helix rod with a separation distance of ~ 9 Å.
By monitoring the growth and decay of peaks associated with active species in the
transient absorption spectra, the mechanism of excited state relaxation was elucidated.36

6
Figure 1-2: Chromophore, donor, and acceptor linked by A) oligolysine and B)oligoproline.

7
Examples of the transient absorption spectra following excitation of the Ru complex at 460 nm
are shown in Figure 1-3. Photoexcitation at this wavelength caused a metal to ligand charge
transfer (MLCT) in the Ru complex, forming the PTZ-RuIII(bpy)2(bpy•)-ANQ species that quickly
decayed by electron transfer from PTZ Ru to give PTZ+-RuII(bpy)2(bpy•)-ANQ. A second
rapid electron transfer from bpy• ANQ led to the charge separated species PTZ+-RuII(bpy)3-
ANQ• ; the charge separation efficiency and lifetime were 53 % and 175 ns, respectively.
Monitoring the absorbance of the oxidized PTZ and reduced ANQ species, these exhibited a
monoexponential decay to the ground state at the same rate, indicative of a direct electron transfer
from ANQ • PTZ+.
To increase the charge separation efficiency using the oligoproline backbone, Meyer et
al. designed and synthesized a chain that included two pendant [Ru(bpy)3]2+ complexes in the
sequence PTZ-Ru-Ru-ANQ.37 In comparison with the previously reported triad,36 the emission
transient of the di-Ruthenium containing oligoproline assembly revealed a biexponential decay
with excited state lifetimes τ = 50 ns and τ = 1120 ns. The transient absorption spectra contained
bands associated with the Ru-bpy•- radical anion, PTZ•+ and ANQ•. Addition of the second Ru
chromophore dramatically increased the charge separation lifetime (2000 ns), however the
efficiency of charge separation in this array was only ~ 20 %.36 Temperature dependent studies
ruled out back electron transfer via transfer to either of the Ru complexes. Additional possible
relaxation pathways were RuRu energy transfer and quenching of RuII* by ANQ, which were
also largely ruled out because of their low relatively efficiency.
1.2.2 Solvent Dependence of Electron Transfer in Substituted Oligoprolines.
A thorough investigation of the solvent dependencies of the photodynamics in these
systems was reported.39 Using a 13- unit oligoproline, an assembly was synthesized with a 3-

8
Figure 1-3: Nanosecond transient absorption difference spectra for the oligoprolineredox triad 1. Following a 4-ns pulse from a 460 nm laser (1.5 mJ per pulse), spectrawere recorded at intervals from 2 ns to 777 ns for a 1.0 μM peptide triad 1 in freeze-pump thaw degassed acetonitrile at 25 ºC. Reproduced with permission from Ref 36. Copyright (1996) National Academy of Sciences, U. S. A.

9
proline separation between PTZ and [Ru(bpy)3]2+ and again between the Ru complex and ANQ.
The photophysical and electrochemical properties of the molecule were analyzed in dichloethane
(DCE), butyronitrile (BuCN), acetonitrile (ACN), and dimethylacetamide (DMA). Based on CD
spectra, it was confirmed that the proline II helical structure was maintained in the series of
solvents. Further, in all solvents, the transient absorption spectra contain bands that were
attributed to the appearance of PTZ•+ and ANQ•- at 520 and 600 nm, respectively, and the
[Ru(bpy)3]2+ quenching time scale was 10-20 ns. Decays of these transient species were
monoexponential, consistent with direct charge recombination to return to the ground state.
Comparison of the relative reduction potentials further supported the electron transfer
mechanism. In comparison to the driving force for the RuIII(bpy)2(bpy•) ANQ electron
transfer, the free energy of the PTZ RuIII(bpy)2(bpy•) electron transfer quench (ΔG) is more
favorable by -0.44, -0.36, -0.34, and -0.24 eV in DCE, BuCN, ACN, and DMA, respectively.
Quantum yields for formation of the charge separated state were 33 % in DCE, 54 % in BuCN, 86
% in ACN, and 43 % in DMA. Based on the differences in ΔG and quenching quantum yields, a
solvent-dependent competition between formation of the charge separated state PTZ•+-Ru-ANQ•-
and back electron transfer to return RuII and PTZ to the ground state was hypothesized. However,
once charge separation occurred, recombination was by direct ANQ•- PTZ•+ electron transfer.
Analysis of the ANQ and PTZ redox potentials showed that this highly favorable reaction
occurred in the Marcus inverted region.40 The rate of back electron transfer was solvent
dependent and occurred through-bond and/or through-space.
1.2.3 Mechanism of Electron Transfers in Substituted Oligoprolines.
In a follow up study, Meyer and coworkers tested the through-space electron transfer
mechanism in the oligoproline-based assemblies by synthesizing a series of strands with varying

10
distances between redox species.41 Electron transfer rate varies with solvent reorganization
energy, internuclear separation, and electronic coupling between the reactive species, and the
distance dependence of these varies for through-bond and through-space interactions.42-44
Therefore, the distance between Ru and PTZ was varied by 2, 3, 4 and 5 proline units, giving rise
to variation of linear distances to 8, 20.2, 16.8, and 21.4 Å, respectively. The separation distance
decreases when the number of prolines is increased from 3 to 4 because of the helical twist
inherent of the oligopeptide. Using these structures, the mechanism of electron transfer for short
distances (i.e. 2 – 4 proline units) could be through-bond but for long distance (i.e. 5 proline
units), electron transfer was more likely through-space. However, analysis of the rate versus
distance correlation revealed that the dominant charge separation mechanism was through-space
electron transfer quenching with some contributions from through-bond electronic coupling.
Conversely, the back electron transfer was dominated by singlet - singlet electron transfer. The
photoinduced electron transfer pathway was complex, occurred in both the normal and inverted
regions, and the reaction dynamics were largely governed by nuclear motions.
These seminal studies demonstrated that multifunctional redox assemblies could be
tethered with an oligopeptide scaffold. Using this motif, charge separated states were created by
photoinitiated electron transfers between the tethered donor and acceptor species. Hydrogen
bonding of the oligopeptide created an alpha helical structure, with controllable and predictable
distances between redox species based on the modular units of the amino acids on the backbone.
These experiments were the first demonstration of using modular amino acid repeating units to
control the placement of and electron transfers between inorganic species. The structures provide
critical understanding for building and studying the photophysics of hybrid inorganic-organic
molecules, which is now being extended to more complex architectures and assemblies and
ultimately to redox cascades and molecular electronics devices.

11
1.3 Metallobases in Peptide Nucleic Acid Architectures
DNA modified with metal-binding ligands in place of natural nucleobases offers a unique
motif for controlled arrangement of metal centers within a double-stranded scaffold.19-27
Coordination of a transition metal ion by pendant and complementary ligands forms coordinative
crosslinks which have been called “metallobases”. Precise placement of these metal centers may
enable the construction of large arrays of complexes, each contributing their unique properties
toward electron transfer. To avoid the ionic interaction of metal ions with the backbone
phosphates, peptide nucleic acid (PNA) has instead been employed.
1.3.1 Inorganic Complexes Linked to Peptide Nucleic Acid.
Peptide nucleic acid was first designed to interact with DNA to bind into the major
groove of a DNA duplex forming a triplex in solution.45 Since that time, its dynamics as a DNA
analog have been well documented and several reviews exist on the subject.46,47 PNA is based on
substitution of natural nucleic acids along an aminoethylglycine (aeg) peptide backbone that is
charge neutral. Recognition between aeg strands, or between PNA and DNA, occurs through
hydrogen bonding between complementary nucleic acid base pairs to form double stranded
duplexes analogous to duplex DNA. Figure 1-4 shows a PNA-DNA hybrid duplex to illustrate
their structural differences.46 By virtue of the lack of electrostatic repulsion between the strands,
PNA duplexes have greater stability than their ds DNA counterparts. Metal complexes that can
serve as electron donors and acceptors have been incorporated into the PNA scaffold by
covalently linking ligands to the secondary amines in the aeg backbone.

12
Figure 1-4: Structures of DNA and PNA. A, C, G, and T are the nucleobases adenine,cytosine, guanine, and thymine. Reproduced with permission from Ref 46. Copyright (1997) the Royal Society of Chemistry.

13
1.3.1.1. Redox Tagged PNA Strands.
Metzler-Nolte and coworkers developed methods to incorporate metal complexes within
a PNA framework:48 in 2002, Mo(CO)3 was coordinated to bis(picolyl)amine (bpa) substituted
PNA strands for potential use as biomolecular labels by infrared spectroscopy detection. A
benefit of the bpa ligand was its ease of modification with a carboxylic acid for coupling to the
free amines present in the peptides. These compounds exhibited one-electron oxidations at ~ -
0.25 V in acetonitrile. Electronic spectra were dominated by MLCT bands at 327 nm and 420 nm
and extinction coefficients (ε) ranging from 6.1 x 10³ to 7.0 M-1 cm-1. Each complex also had a
unique infrared CO stretching frequency (1779 – 1906 cm-1), providing spectroscopic signatures
potentially useful for biomolecular labeling.
1.3.1.2 Electrochemical Detection of DNA Using Redox Tagged PNA.
The use of PNA in DNA detection is potentially advantageous because PNA-DNA
interactions are stronger and less dependent on salt concentration. For this reason, Metzler-Nolte
and coworkers synthesized a series of metallocene-functionalized PNA oligomers for direct,
electrochemical detection of DNA.49 These aeg oligopeptides were synthesized via solid-phase
techniques and capped at their termini with either ferrocene (Fc) or cobaltocenium (Cc+). A
solution containing the PNA-metallocene compounds was introduced to a Au electrode surface
containing a monolayer of thiol-terminated DNA. Electrochemical techniques were used to
probe the hybridization of the redox-tagged PNA sequences to the DNA on the electrode surface.
In the case of PNA-Fc, an oxidation wave was observed at 0.44 V which was assigned to the Fc0/+
redox couple. Electrochemistry of the Cc+-substituted PNA analog, with a more rigid linker,

14
revealed a reduction peak at -0.92 V when hybridized to the surface. These are the first
descriptions of electrochemical experiments using redox-active inorganic modified PNA
structures.
1.3.1.3. Click Chemistry for Tagging PNA with Redox Probes.
These early studies demonstrated linking redox active species to the PNA scaffold. Since
that initial report, more sophisticated techniques for metallocene addition to peptides have been
developed. Using a Cu(I) catalyst, Metzler-Nolte et al. utilized [3+2] dipolar cycloaddition, or
“click” chemistry, to link Fc complexes derivatized with terminal azides to react with peptide
chains containing alkynes.50 This chemistry was recently expanded to create a library of Fc-based
peptide structures with varying oxidation potentials based on electronic substituents pendant from
the Fc cyclopentadienyl ring.51
1.3.2 Metallobases in PNA Duplexes.
The first example of a ligand-modified duplex PNA structure for coordination of a metal
ion to form a metallobase crosslink was described by Achim and coworkers.52 A bipyridine (bpy)
derivative, 5-acetic acid-5’-methyl-2,2’-bipyridine, was inserted into two complementary PNA
strands using coupling reagents and solid phase synthesis. The ligand was placed in the center of
each strand in the 10-base pair sequences:
H-GTAGMTCACT-LysNH2
H2N-Lys-CATCNAGTGA-H
where M = N = bpy. These were purified by HPLC and characterized by MALDI-TOF mass
spectrometry.

15
1.3.2.1. Metal Binding in Ligand-Containing PNA Duplexes.
It is known that bpy forms the square planar complexes [Ni(bpy)2]2+, [Pd(bpy)2]
2+, and
[Pt(bpy)2]2+; addition of these transition metal ions coordinatively crosslinked the bpy-substituted
PNA strands. Following hybridization to form the PNA duplex by complementary base pairing,
circular dichroism (CD) was used to monitor metal binding in the duplex PNA structure. These
data showed that both with and without Ni2+, the single strand complements form double stranded
duplex structures.
Melting temperatures (Tm) were measured to determine the stability of PNA duplexes: in
fully complementary duplexes, Tm was 66.5 ºC and base pair mismatches led to a destabilization
by ~ 15-16 ºC. Substitution of one of the nucleic acid base pairs with bpy ligands led to a
decrease in Tm by 16 – 19 ºC. However after addition of Ni2+ to this duplex, Tm increased to 59
ºC. This result indicated both an increase in stability for the duplex (compared to unmatched) and
coordination of Ni2+ by the free bpy ligands. No effect on melting temperature was observed
after the addition of K2[PdCl4] or K2[PtCl4].
1.3.2.2 Hydroxyquinoline-Metallobase PNA Duplexes.
The lower Tm in the metal-linked PNA duplex versus the fully complementary PNA
structure may have been due to slight destabilization of the base pairs adjacent to the Ni complex
through disruption of their hydrogen bonding or π-stacking ability. Steric hindrance prevented
[Ni(bpy)2]2+ from adopting a planar geometry, and forced it into a slightly distorted square planar
which could have effected the nearby base pairs. To test this assumption, Achim et al.
incorporated 8-hydroxyquinonline (HQ) into the PNA scaffold.53 This ligand readily formed

16
square planar complexes with Cu2+ to give [Cu(HQ)2] and had previously been used in synthetic
DNA analog scaffolds to greatly increase duplex stability.27
Several variations of 10-bp complementary PNA strands were synthesized, substituted
with and without a single HQ ligand at defined positions. In the absence of Cu2+ in solution, the
melting temperature of HQ-substituted PNA was 21 ºC less than unsubstituted (fully
complementary) PNA. However, after the addition of 1 equivalent of Cu2+, Tm increased by > 33
ºC, higher than the fully complementary PNA duplex. An interesting finding was that the Cu2+
bound sufficiently strongly to the HQ ligands that this occurred even in the presence of nucleic
acid base pair mismatches. However in the absence of any Watson-Crick base pairs, PNA
duplexes did not form by metal coordination alone. EPR and UV-visible titrations were used to
confirm the presence of [Cu(HQ)2] and their square planar geometry. The EPR spectra suggested
that both cis- and trans- isomers of the [Cu(HQ)2] complex form within the PNA duplex, and that
small solvent molecules were not coordinated in the axial positions.
1.3.2.3 Variation of Position and Number of Metallobases in PNA Duplexes.
The position and number of metal complexes within the duplex were significant in
determining the global properties of the structure. In detailed studies of these effects,54 Cu2+ and
Co2+ were added to bpy-modified 10-bp PNA duplexes containing 1 to 3 sets of bpy ligand pairs.
Further, the positions of these along the PNA backbone were varied to determine the effect of
metallobase position within the scaffold. Figure 1-5 shows a cartoon of the possible structures
used in this study.
Placement of the bpy ligand pair at the end of the PNA duplex resulted in a Tm that was
essentially the same as an unmodified PNA duplex. This is in stark contrast to previous work53
with bpy ligands in the center of the PNA duplex, and resulted from “fraying” in the ends of the

17
Figure 1-5: Cartoon representations of possible structures of metal-bpy containing PNA Duplexes. Reproduced with permission from Ref 54. Copyright (2006) the AmericanChemical Society.
18
peptide strand. These researchers further determined that increasing the number of bpy
substitutions within the PNA duplex led to a decrease in overall stability (i.e., lower Tm).
Addition of the metal ions Ni2+, Co2+, and Cu2+ to PNA sequences containing a single bpy ligand
pair in the center of the duplex caused stabilization of the duplex by +14 ºC, +6 ºC, and +4 ºC,
respectively. This trend reflected larger binding affinity of bpy for Ni2+. However, when the bpy
ligands were placed at the end of the PNA chains, addition of metal ions had a greater effect on
stabilization of the duplex: Ni2+, Co2+ and Cu2+ increased Tm by +20 ºC, +13 ºC, and +10 ºC,
respectively, which was attributed to linking the frayed ends of the duplex.
When two pairs of bpy ligands were inserted into the PNA duplex, addition of two molar
equivalents of Ni2+ raised the melting temperature to 45 ºC, +9 ºC higher than the unmetallated
form. However, this melting point is lower than in PNA duplexes containing a single Ni
metallobase (Tm = 57 ºC), suggesting lower stability. The authors hypothesized that addition of
the second metal caused a decrease in stability because of repulsion of the charged metal centers
within the duplex. It was also possible that a single PNA strand containing four metal binding
sites coordinated to a single Ni2+ atom before duplex formation occurs.
By monitoring changes in the π π* region in the spectrum, UV-visible titrations of the
addition of Ni2+ or Cu2+ to the PNA sequences containing a single pair of bpy ligands revealed a
1:1 coordination stoichiometry. Titrations with PNA sequences containing two sets of bpy ligands
revealed a 1:1 ratio for Ni2+ titrations, not the 2:1 that would be expected for the formation of two
adjacent [Ni(bpy)2]2+ complexes. Analogous observations were made using Cu2+, suggesting that
each metal ion formed a [M(bpy)3]2+ complex within the PNA duplex structure, leaving a single
uncoordinated bpy ligand (Figure 1-5). At higher metal concentrations, very small inflection
points in the titration curve pointed toward a conversion to two [M(bpy)2]2+ complexes.
Titrations with a PNA sequence containing three bpy ligand sets showed an increase in
absorbance between 300 – 320 nm as a result of changes in the π π* transition.

19
Spectrophotometric titrations with Ni2+ and Cu2+ resulted in titration curves that reached a plateau
at a stoichiometry of 2:1 metal ion per PNA duplex, suggestive of the formation of two
[M(bpy)3]2+ complexes. At high metal ion concentrations, there again existed a slight inflection
point at 3:1 Ni2+: duplex, indicating the transformation of two [Ni(bpy)3]2+ complexes into three
[Ni(bpy)2]2+ complex crosslinks in the PNA duplex.
Copper-linked PNA duplexes were also investigated using EPR spectroscopy. In
duplexes containing two and three bpy ligand sets, and respectively 1 and 2 molar equivalents of
Cu2+, the EPR spectra were consistent with formation of [Cu(bpy)2]2+ and [Cu(bpy)3]
2+
metallobase crosslinks. These data, compared with UV-vis titrations, suggested the existence of
[Cu(bpy)3]2+ in each of the samples. However, broadening of the EPR spectra made conclusive
analysis difficult: line broadening could have resulted from slight binding of the metal with
nearby base pairs, the presence of a mixture of structures within the sample, or from slight
coupling between the metal centers. The latter of these was dismissed based on large M-M
distance within the PNA duplexes.
1.3.2.4 Electrochemistry of Fc-Modified PNA Monolayers on Au Electrodes.
In an effort to understand the role of charge transport (CT) in single stranded PNA,
Achim and coworkers synthesized a series of single stranded PNA strands containing only
thymine (n = 3 – 7). The C-terminus was modified with cysteine and the N-terminus contained
ferrocene (Fc) as the redox probe.55 When these compounds were exposed to a Au electrode
surface, self-assembled monolayers (SAMs) formed. Figure 1-6 shows an example structure of
these species and their relative packing on a monolayer surface.
Figure 1-6B shows a cartoon of the two major orientations of the Fc-thymine PNA
strands on the electrode surface. At low surface coverages, many of the PNA oligomers laid flat

20
Figure 1-6: (a) Chemical structure of thymine containing ss PNA that has a C-terminus cysteine and an N-terminus ferrocene, where n = 3 – 7. (b) Panel B shows a schematic representation of PNA molecules self-assembled on a gold surface, in which the blue circle represents cysteine, the red curl represents PNA, and the light brown circlerepresents ferrocene. Reproduced with permission from Ref 55. Copyright (2008) the American Chemical Society.

21
on the surface, resulting in a small electrode-Fc separation distance. Conversely, at high surface
coverages, more of the PNA strands oriented perpendicular to the surface maximizing the
distance between the electrode and Fc terminus. During an electrochemical experiment, the
measured current would thus be the average of oligomers in a range of orientations relative to the
electrode surface. To selectively address only the oligomers oriented perpendicular to the
surface, the potential was scanned from 0.35 to 0.65 V in a 1 M NaCl solution at a scan rate of 1 -
10 V/s. As a result, redox silent Fe-Cl species were formed by displacement of a Cp ring. Species
lying flat on the surface were preferentially destroyed because of their proximity to the electrode
and fast scan rate, as evidenced by a disappearance of their contribution to the current.
Monitoring the oxidation peak maxima as a function of the scan rate allowed the
determination of the heterogeneous electron transfer rate constant (k0) for the series of oligomers
as a function of length of the PNA strand: as the number of thymines increased from 3 to 7, k0
decreased from 2000 to 0.018 s-1. Plotting the rate constant versus the electron transfer
distance,56,57 the tunneling decay constant was β = 0.86 Å-1 (3.0/base). The maximum electron
transfer rate constant (i.e. at ro) was 5.8 x 10⁸ s-1, which is slower than in double-stranded DNA,
but could have been because of an absence in base stacking in the single stranded PNA.
The experiments described above lay the groundwork for future PNA-DNA hybrids for
use in molecular electronics: although it has not yet been demonstrated in the metal-linked PNA
duplexes, several groups have described electron transfer through double stranded DNA duplexes
and the potential for use in molecular electronics.58-63 By analogy, the PNA-based systems could
be applied to create molecular circuitry, for example by coupling electron donors and acceptors to
the strand termini and between the strands to form molecular wires. The initial report discussed
above provided the foundation for ultimate application in electronic devices, and demonstrated
that charge transport through the PNA strands is indeed possible.

22
1.4 Metal Coordination Based Assembly of Artificial Peptides
Using the scaffold of duplex DNA and PNA to form a redox cascade for long range
electron transfer is somewhat restricted because of the electrochemically irreversible
electrochemistry of the nucleic acids. Eliminating nucleic acids and utilizing only metal-ligand
interaction (as in Figure 1-1C) between polyamide strands is a facile approach that resolves the
issues of metal binding to nucleobases and backbone phosphates, and furthermore excludes base
pairs’ undesirable electrochemical properties. We have recently reported supramolecular
systems that use metal complexes to crosslink artificial peptide strands without the assistance of
nucleic acid pairing. In these structures, the metal complexes bind to ligands that decorate the
oligopeptide chains, and in some cases form coordinative crosslinks (i.e. metallobases) between
two strands, forming duplex and hairpin structures.64-71
1.4.1 Ligand-Substituted Aeg Oligopeptides.
Oligomers have been built from an aeg backbone containing only pendant ligands which
coordinate metal ions. Examples of this class of compounds and the ligands used are shown in
Figure 1-7. The ligands were chosen for their denticity and resulting metal complex product, and
typically use the nitrogen donor ligands pyridine (py), bipyridine (bpy), terpyridine (tpy), and
phenyl-terpyridine (Φ-tpy). Formation of multimetallic structures using the substituted
oligopeptide strands has been based on the 1 x 3, 2 x 2 and 3 x 3 molecular recognition motifs
described above.
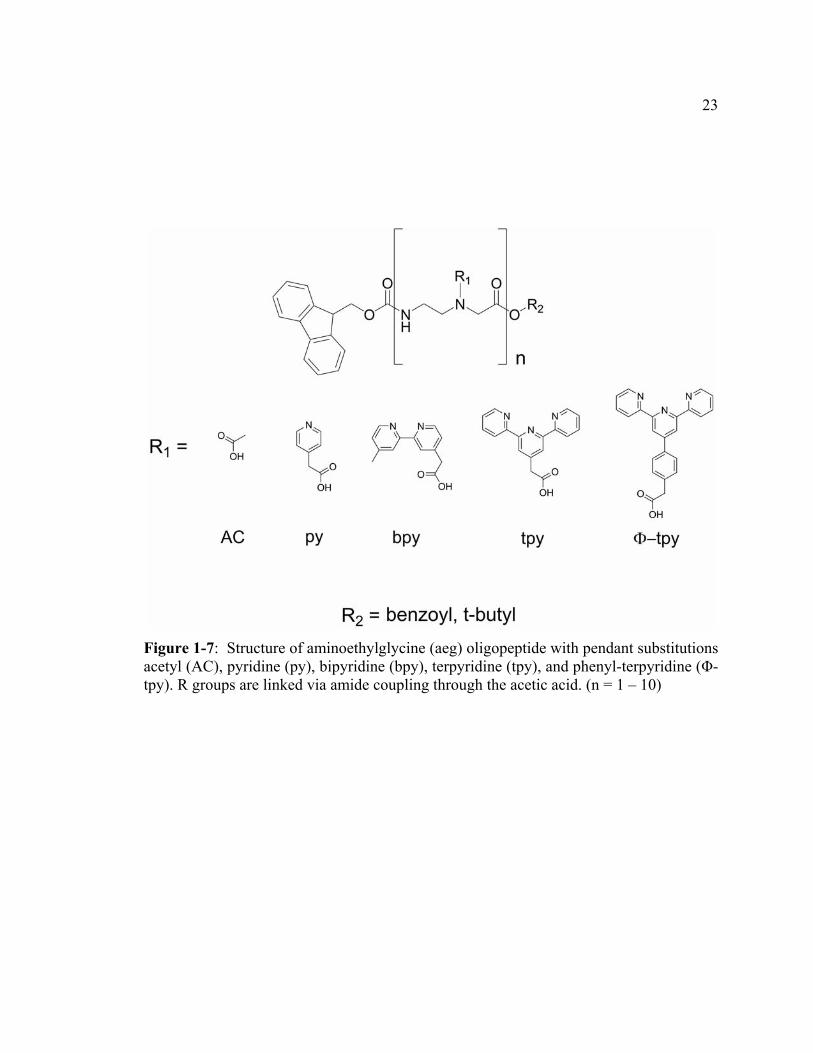
23
Figure 1-7: Structure of aminoethylglycine (aeg) oligopeptide with pendant substitutionsacetyl (AC), pyridine (py), bipyridine (bpy), terpyridine (tpy), and phenyl-terpyridine (Φ-tpy). R groups are linked via amide coupling through the acetic acid. (n = 1 – 10)

24
1.4.1.1 Ligand Substituted Monomer Synthesis.
Our first report in 200564 of an aminoethylglycine (aeg) backbone was synthesized with
the pendant ligands pyridine or bipyridine. Monomers were synthesized by amide coupling an
acetic acid derivative of the appropriate ligand using standard reagents (e.g., HOBT, HBTU,
EDC, DIPEA, etc.) to an Fmoc-protected (N terminus) and t-Butyl-protected (C terminus) aeg
unit. Yields ranged from 30 – 60 % for ligand-substituted monomer syntheses. After this, either
the t-butyl or Fmoc group was cleaved to yield the primary carboxylic acid or amine terminus,
respectively, making these available for chain extension via additional amide coupling reactions.
Oligopeptides were synthesized on solid phase supports using Fmoc-PAL-PEG-PS resin
and, once cleaved from the resin, the products were purified by HPLC. Products yields were
limited by the loading on the resin and in some cases this method afforded only very low
compound yields (< 5 mg). A pyridine hexapeptide (e.g. six pendant py ligands on the strand,
Fmoc-(py aeg)6) and bipyridine tripeptide (e.g. three pendant bpy ligands, Fmoc-(bpy aeg)3) were
characterized by 1H NMR spectroscopy and mass spectrometry to confirm their purity and
identity.
1.4.1.2 Coordination of Four-Coordinate Metals to Single-Strand Ligand-Substituted Aeg Oligopeptides.
During spectrophotometric titration, reaction of Fmoc-(py aeg)6 with [Cu(pda)H2O] (pda
= pyridine dicarboxylic acid) showed stoichiometric binding of 6 molar equivalents of Cu to form
six [Cu(pda)(py)] complexes tethered along the hexapeptide backbone. High resolution mass
spectrometry confirmed the identity of the hexametallated product. Similarly, [Cu(tpy)(H2O)]2+
was also titrated against the Fmoc-(py aeg)6 hexamer, resulting in binding of six [Cu(tpy)(py)]2+

25
complexes on the backbone. This result suggested that electrostatic repulsions did not
significantly affect stoichiometric metal coordination and assembly along the aeg scaffold.
Molecular modeling provided insight to the solution phase structures of these
multimetallic species. In the case of the [Cu(pda)(py)] containing Fmoc-(py aeg)6 hexamer, the
neutral charge allowed π-stacking of adjacent metal complexes. Modeling predicted a metal-
metal distance of ~ 4 Å and a helical pitch of 16 – 17 Å. However, models of the
[Cu(tpy)(py)]2+-containing hexapeptide showed an average metal-metal distance of about 20 Å
due to electrostatic repulsion of the metal complexes.
The solution structure models were supported by analysis of their EPR spectra. The
[Cu(tpy)(py)]2+ decorated hexapeptide had an EPR spectrum with a classic line shape (g║ = 2.28;
g┴ = 2.06; A║ = 167 x 104 cm-1) that was similar to a monometallic Cu complex. This result
implied that each Cu complex on the aeg scaffold was electronically identical, non-interacting
(i.e. separated by at least 6 Å), consistent with the electrostatic repulsion expected in the model.
In contrast, the EPR spectrum of the [Cu(pda)(py)] substituted hexapeptide had significantly
broadened lines and there was a decrease in the hyperfine coupling (g║ = 2.35; g┴ = 2.09; A║ =
130 x 104 cm-1), implying weakly interacting Cu complexes and delocalization of unpaired
electrons.
1.4.1.3 Variation of the Number and Type of Complexes in Pyridine-Substituted Oligopeptides.
We then reported the synthesis of a series of aeg oligopeptides of varying length that
contained up to ten pendant pyridine ligands.65 These species were synthesized on solid phase
support and characterized by NMR, mass spectrometry and pH titrations to further confirm the
number of free pyridine ligands per aeg strand. Reaction of the free pyridine ligands with

26
[Cu(tpy)(H2O)]2+, [Cu(pda)(H2O)], and [Pt(tpy)(H2O)]2+ afforded a series of peptide strands with
[M(tpy)(py)]2+ or [M(pda)(py)] complexes tethered to the backbone.
UV-vis spectrophotometric titrations of metal complexes with the py-substituted
oligopeptides provided binding stoichiometries that agreed well with the number of pendant py
ligands. An interesting finding during the titrations was that the same binding stoichiometry was
observed when using either [M(tpy)(H2O)]2+ or [M(pda)(H2O)], even when using oligopeptides
with as many as ten monomer units. Since electrostatic repulsion between [M(tpy)(py)]2+ centers
could hinder subsequent binding of additional complexes, the observed stoichiometries showed
that this was not the case.
Oligopeptides containing pendant [Pt(tpy)(py)]2+ complexes offered the opportunity for
electrochemical investigations. Cyclic voltammograms of these multimetallic structures
contained two sequential, one-electron, reversible waves at formal potentials -0.6 and -1.1 V
versus SCE that were attributed to tpy-centered reductions. No evidence of adsorption to the
electrode surface was observed, even for the largest decapeptide which, when fully oxidized, had
a total charge of +20 because of the ten pendant Pt complexes. The electrochemical data were
consistent with Pt complexes with independent electronic behavior as a result of electrostatic
repulsion between the +2 charged species. Chronoamperometric experiments provided direct
measure of the molecules’ diffusion coefficients, which were related to the structures’
hydrodynamic radii with the Stokes-Einstein equation.
1.4.2 Metal Coordination Based Crosslinking of Bpy-Substituted Aeg Tripeptides.
The bipyridine tripeptide (Fmoc-(bpy aeg)3) contained three pendant bipyridine ligands
available for metal coordination and as such, spectrophotometric titrations using Fe2+ and Cu2+
were (separately) evaluated. Addition of Fe2+ resulted in the formation of an absorbance band

27
centered at 540 nm, consistent with MLCT transition of the [Fe(bpy)3]2+ complex. This band
increased in absorbance and reached a maximum at ~ 1:1 molar equivalence of Fe2+: bpy
tripeptide. Analysis by mass spectrometry revealed the molecular ion peak for the species
consisting of two bipyridine tripeptides crosslinked by two Fe2+ centers. This result implied the
formation of two [Fe(bpy)3]2+ complexes crosslinking the two tripeptide strands.
Separate reaction of the tripeptide with Cu2+ resulted in a spectrophotometrically
observed equivalence point of ~1.6 Cu: peptide. Together with mass spectrometry, this led to the
conclusion that two tripeptide strands were crosslinked by three Cu2+ ions, forming three
[Cu(bpy)2]2+ coordinative crosslinks. These compounds marked for the first time oligopeptide
duplex self-assembly without the assistance of nucleic acid base pairs.
1.4.3 Heterometallic Structures Tethered by Aeg Oligopeptides.
In the first demonstration of using the artificial aeg oligopeptides to prepare
heterometallic complexes, we prepared structures containing combinations of Pt2+ and Cu2+ with
Fe2+, Cu2+, and Zn2+.66 This study demonstrated a synthetic technique in which peptides were
grown outwardly from a central backbone unit rather than from a solid resin bead. The resulting
tripeptide contained the ligand sequence py-bpy-py. Using the varying denticity of the ligands,
the oligopeptide was sequentially reacted with [Cu(tpy)(H2O)]2+ or [Pt(tpy)(H2O)]2+ followed by
Fe2+, Cu2+ or Zn2+ ions. The former of these were used to bind to the pendant py ligands, whereas
the free metal ions formed either [M(bpy)2]2+ or [M(bpy)3]
2+ complexes, crosslinking two or three
peptide strands, respectively. Spectrophotometric and electrochemical data were consistent with
the formation of the multi- heterometallic structures.

28
1.4.4 Octahedral Metal Complex Crosslinks in -Tpy-Substituted Oligopeptides.
To be able to incorporate octahedral metal coordinative crosslinks, a series of Φ-tpy
substituted oligopeptides with lengths ranging from one to four monomers was synthesized.67
The oligopeptides were characterized using temperature-dependent NMR spectroscopy, which
provided information about the complex solution-phase structure and dynamics. Although the
complexity of the NMR spectra increased as the oligopeptide length increased, full proton
assignments were made using the two dimensional techniques HMQC and COSY.
1.4.4.1 Metal Crosslinking of Tpy-Substituted Oligopeptides.
The oligopeptides were used to coordinate Co2+ and Fe2+ ions, giving [M(-tpy)2]2+
complex crosslinked structures whose spectroscopic and electrochemical properties were
compared.67 Spectro-photometric titrations, such as those shown in Figure 1-8, were used to
assess the coordination of the metal ions. When monitoring the wavelength for the MLCT
transition of the [M(-tpy)2]2+ complex for both the Co2+ and Fe2+ titrations, the MLCT band
increased and leveled at a finite absorbance. As seen in the titration curves in Figure 1-8, the
absorbance leveled at stoichiometric ratios of metal to oligopeptide duplex that indicated the
major titration product was dictated by the number of ligands per peptide, and consistent with the
[M(-tpy)2]2+ crosslinked peptide duplexes. Molecular ion peaks observed in the mass spectra of
these were consistent with structures in which two oligopeptides were crosslinked by [M(-
tpy)2]2+ complexes: in each case, peptides containing one, two, three, or four free -tpy ligands
bound one, two, three, or four metal ions.
Electrochemistry was used to further confirm solution structure and differentiate between
crosslinked duplexes and coordination polymers. In the cyclic voltammetry of both the Fe and

29
Figure 1-8: Titration curves for the changes in absorbance upon addition of oligopeptide to (A) Co(II) at 514 nm and (B) Fe(II) at 567 nm for oligopeptides (■)Φ-tpy aeg monopeptide, (●) (Φ-tpy aeg)2 dipeptide, (♦) (Φ-tpy aeg)3 tripeptide, and (▼) (Φ-tpy aeg)4 tetrapeptide in methanolic solutions. Insets show representative absorbancedifferences for spectra acquired during titration with (Φ-tpy aeg)3 tripeptide. Reproduced with permission from Ref 67. Copyright (2007) the American Chemical Society
30
Co-linked oligopeptide duplexes, redox couples corresponding to the FeIII/II and CoIII/II oxidation
were observed at 0.99 V and 0.27 V, respectively. Evaluation of the oxidative waves using
chronocoulometry provided measurements of the solution diffusion coefficients (D) of the
complexes, which decreased with increasing peptide length. The linearity of this relationship
indicated that the major species in solution were the metal-linked oligopeptide duplexes and not
coordination polymers. Although these experiments did not conclusively eliminate the possibility
of alternative registers and polymer formation, they suggested that the majority of species in
solution were duplexes and other structures were below the experimental limits of detection.
1.4.4.2. Thin Film Electrochemistry of Metal-Linked -Tpy Oligopeptides.
The [Fe(-tpy)2]2+ and [Co(-tpy)2]
2+ crosslinked oligopeptides were deposited onto Pt
electrode surfaces by cycling the potential through the oxidative wave, which caused the peak
current to incrementally increase. An example of these cyclic voltammograms is shown in
Figure 1-9A, and shows sequential cycles of an [Fe(-tpy)2]2+ dipeptide duplex, during which the
molecule is adsorbed to the electrode. The surface layer thickness was controlled by selecting the
number of sequential scans; depending on the oligopeptide length, the maximum surface
coverages ranged from ~ 4 – 22 x 1011 molecule/cm2. After deposition, the electrode was rinsed
and placed in a solution containing only electrolyte. The adsorbed peptides remained on the
electrode surface even through many cycles, as shown in Figure 1-9B.
1.4.4.3. Spectroelectrochemistry of Fe-Linked -Tpy Oligopeptide Duplexes.
The films were further studied using spectroelectrochemistry, for which the metal-
containing oligopeptides were deposited on the surface of an indium tin oxide (ITO) coated glass

31
Figure 1-9: (A) Sequential cyclic voltammograms of [Fe4((Φ-tpy aeg)4)2]8+ using a Pt
electrode and a potential scan rate of 50 mVs-1. (B) Cyclic voltammogram of the same film in 0.2 M TBAP in ACN using a scan rate of 50 mVs-1. Reproduced with permission from Ref 67. Copyright (2007) the American Chemical Society.

32
electrode. A potential scan was applied to deposit the peptide to the surface, after which the
electrode was rinsed and placed in an electrolyte solution. The absorbance of the film at 567 nm
was monitored as a function of time as the applied potential was switched between oxidative and
reductive potentials (0.35 and 1.35 V). Figure 1-10 shows a plot of absorbance at 567 nm vs.
time as the potential of the ITO electrode is switched, and clearly illustrates the reversible nature
of the FeIII/II reaction. The consistent return to the baseline absorbance during this experiment
confirmed that the metal-linked peptide remained adhered to and did not diffuse away from the
electrode surface. Furthermore, the process of oxidation did not degrade the peptide or cause new
electrochemical waves to appear in the CV (e.g. the reaction is chemically reversible). In total,
these experiments demonstrated the robust nature and electroactivity of the metal-bis- -
terpyridine crosslinked oligopeptides.
1.4.5 Photoinduced Energy and Electron Transfers in Metallated Aeg Oligopeptides. – Overview of Thesis Research
Compounds containing [Ru(bpy)3]2+ moieties are promising candidates for artificial
photosynthesis and photocatalysis.72-75 In addition to having strong absorbance and emission
bands in the visible region of the spectrum, following excitation at the MLCT, the long-lived
triplet excited state ( > 1 s ) and reversible oxidation and reduction reactions offer favorable
conditions for electron donation according to the reactions:
(1) [RuII(bpy)3]2+ + hν [RuIII(bpy)2(bpy•)]2+
(2) [RuIII(bpy)2(bpy•)]2+ + A [RuIII(bpy)3]3+ + A•
(3) [RuIII(bpy)2(bpy•)]2+ + D [RuII(bpy) 2(bpy•)]+ + D+
where A is an electron acceptor and D is an electron donor.

33
Figure 1-10: (A) Absorbance at 567 nm for a film of [Fe3((Φ-tpy aeg)3)2]6+ on ITO-
coated glass in 0.2 M TBAP in ACN as the potential is swept from 0.35 to 1.35 V at 50mVs-1. Reproduced with permission from Ref 67. Copyright (2007) the AmericanChemical Society.
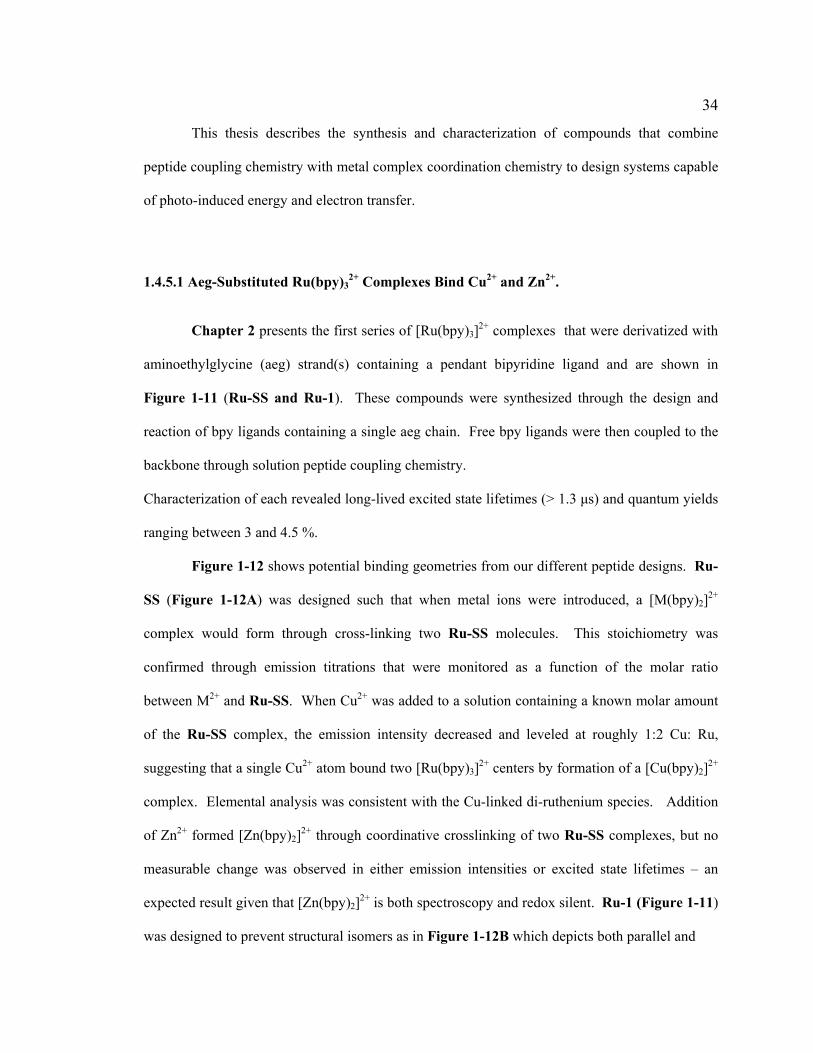
34
This thesis describes the synthesis and characterization of compounds that combine
peptide coupling chemistry with metal complex coordination chemistry to design systems capable
of photo-induced energy and electron transfer.
1.4.5.1 Aeg-Substituted Ru(bpy)32+ Complexes Bind Cu2+ and Zn2+.
Chapter 2 presents the first series of [Ru(bpy)3]2+ complexes that were derivatized with
aminoethylglycine (aeg) strand(s) containing a pendant bipyridine ligand and are shown in
Figure 1-11 (Ru-SS and Ru-1). These compounds were synthesized through the design and
reaction of bpy ligands containing a single aeg chain. Free bpy ligands were then coupled to the
backbone through solution peptide coupling chemistry.
Characterization of each revealed long-lived excited state lifetimes (> 1.3 μs) and quantum yields
ranging between 3 and 4.5 %.
Figure 1-12 shows potential binding geometries from our different peptide designs. Ru-
SS (Figure 1-12A) was designed such that when metal ions were introduced, a [M(bpy)2]2+
complex would form through cross-linking two Ru-SS molecules. This stoichiometry was
confirmed through emission titrations that were monitored as a function of the molar ratio
between M2+ and Ru-SS. When Cu2+ was added to a solution containing a known molar amount
of the Ru-SS complex, the emission intensity decreased and leveled at roughly 1:2 Cu: Ru,
suggesting that a single Cu2+ atom bound two [Ru(bpy)3]2+ centers by formation of a [Cu(bpy)2]
2+
complex. Elemental analysis was consistent with the Cu-linked di-ruthenium species. Addition
of Zn2+ formed [Zn(bpy)2]2+ through coordinative crosslinking of two Ru-SS complexes, but no
measurable change was observed in either emission intensities or excited state lifetimes – an
expected result given that [Zn(bpy)2]2+ is both spectroscopy and redox silent. Ru-1 (Figure 1-11)
was designed to prevent structural isomers as in Figure 1-12B which depicts both parallel and

35
Figure 1-11: Structures of [Ru(bpy)3]2+ single strand and hairpin
complexes.

36
Figure 1-12: Cartoon representation of binding motifs in ligand substituted aeg strands.a) Singe stranded Ru(bpy)3
2+ complexes crosslinked by the addition of Cu2+. b) Bpy dipeptide duplex forms parallel and antiparallel isomers when coordinating two Cu2+
ions. c) Ru hairpin motif prevents isomer formation; Cu2+ binding crosslinks strands.

37
anti-parallel alignment of oligopeptide strands. This “hairpin” structure (Figure 1-12C) contains
two complementary peptide strands separated by a short linker and in the presence of a solution
metal ion (Cu2+ or Zn2+), would bind metal ions by “zipping up” the peptide. Elemental analysis,
mass spectrometry, and emission titrations confirmed that binding of Cu2+ to Ru-1 occurred in a
1:1 ratio Cu2+: Ru-1, decreasing emission intensity by ~ 97 %.
1.4.5.2 Solution Structures with NMR.
A consistent observation was that coordination of Zn2+ quenches the [Ru(bpy)3]2+ hairpin
emission by ~ 25 %, an unexpected result since [Zn(bpy)2]2+ does not absorb in the visible
spectrum and is a d10 metal complex precluding energy or electron transfer quenching. We
hypothesized that to form [Zn(bpy)2]2+ the bridging bpy ligand (coordinated to Ru) may bend or
twist out of plane to provide the necessary angles to form a square planar complex, which could
potentially decrease the emission quantum yield of [Ru(bpy)3]2+. Chapter 3 describes the
complex challenge of employing NMR spectroscopy to assign 13C and 1H signals to Ru-1
(Figure 1-11) to monitor the effects of Zn2+ binding on its structure.
Using two-dimensional NMR techniques (COSY, HMQC, HMBC), full assignments
were made to Ru-1 and once assigned, titrations of Zn2+ were conducted in the NMR tube to
monitor changes in the 1H spectrum as a function of added metal. However, because rotomers
give the appearance of multiple locked structures in solution, deciphering how Zn2+ binding
lowers Ru(bpy)32+ emission quantum yield proved difficult – a less complex structure was
needed. To help elucidate this further a model compound (Ru-M) was designed; this is identical
to Ru-1, but lacked the chain termini –CH2–COOtBu, simplifying analysis of the solution
structure. With a fully assigned 1H spectrum of Ru-M, titrations of Zn2+ in to a solution of Ru-M
revealed a more explicit transition between bound and unbound bpy ligands. We were able to

38
identify chemical shifts associated with Zn2+ binding using plots of the integrated peak area for
select proton resonances versus molar ratio of Zn2+ to Ru-M. Structural rearrangement was
observed by increases or decreases in total integration over select portions of the spectrum.
Further, by comparison of the peaks corresponding to the protons on the Ru-coordinated bpy
ligands before and after Zn2+ binding, we identified distinct changes in the chemical shifts of the
protons on the amide-containing Ru-bound bpy ligand, which is the ligand nearest to
[Zn(bpy)2]2+. Protons belonging to remaining Ru-coordinated bpy ligands experience little to no
change in chemical shift. Since only protons nearest to [Zn(bpy)2]2+ shift, we conclude that a
distinct change in chemical environment occurs as a result of metal binding to the hairpin
scaffold.
1.4.5.3 Inorganic Analogs of Nucleic Acid Hairpins using Aeg-Substituted [Ru(bpy)3]2+
Complexes.
One of the major challenges inherent to using the ligand-substituted oligopeptides
without nucleic acid base pairing to guide orientation and prealignment is the possibility of
forming isomers, as illustrated in Figure 1-12. For example, for a bipyridine dipeptide both
parallel and antiparallel alignments are possible. In addition, misalignment leading to polymer
formation can occur and is certainly a greater concern as ligand and peptide sequences become
longer. To discourage this, with respect to the structural motif shown in Figure 1-12C,68,71 we
have expanded the methodology of Ru-1 and synthesized other examples of
[Ru(bpy)2(bpy(aeg2))]2+ (i.e. Ru-hairpins), complexes Ru-2 through Ru-5, shown in Figure 1-11.
Chapter 4 discusses this work.
Because of the synthetic requirements to make these complexes, new synthetic
methodologies to produce these compounds in solution and to increase peptide length, coupling

39
efficiency, and collected material yields were reported.71 Higher coupling yields (30 – 60 %)
enabled isolation of product in gram scale quantities. The Ru compounds were characterized by a
battery of methods including UV-vis absorbance spectroscopy, fluorescence spectroscopy,
excited state transient decay, electrochemistry, and mass spectrometry. Comparison of the excited
state lifetimes, extinction coefficients, quantum yields, and electrochemical properties revealed
only minor variations between the series of Ru complexes.
Complexes Ru-1 – Ru-5 all contained free bipyridine ligands that were available for
metal coordination. Addition of Cu2+ or Zn2+ resulted in formation of [M(bpy)2]2+ complexes
pendant from the [Ru(bpy)3]2+ bridge, crosslinking the aeg strands. Incorporation of the acetyl
spacer units in the aeg strands (Figure 1-11) increased the distance between Ru and the
coordinated metal. In complexes Ru-4 and Ru-5, addition of a second set of bpy ligands allowed
for complexation of a second metal ion.
Because [Cu(bpy)2]2+ is a known [Ru(bpy)3]
2+ emission quencher, a series of emission
titrations were performed with known amounts of the Ru hairpin complex. As Cu2+ was titrated
into a solution containing the Ru complex, the emission intensity of [Ru(bpy)3]2+ decreased until
it reached a minimum value and then leveled off. Figure 1-13 shows a plot of the peak emission
intensity (at 650 nm) as a function of the molar ratio of Cu to Ru. In the cases of Ru-1, Ru-2,
and Ru-3, the emission intensity steadily decreased and then leveled at a ratio of ~ 1:1 Cu:Ru, as
shown in Figure 1-13A. At the equivalence point, the quenching efficiencies were 97, 95, and 90
%, for Ru-1, Ru-2, and Ru-3, respectively, likely reflecting the increased distance between
[Ru(bpy)3]2+, and the quencher [Cu(bpy)2]
2+.
Compounds Ru-4 and Ru-5 contain two sets of free bpy ligands and as such were
capable of coordinating two Cu2+ metal centers. Identical titration experiments were performed
and the emission intensities as a function of the molar ratio of Cu to Ru were plotted; shown in
Figure 1-13B, the emission intensity decreased in two distinct stages. The shapes of these

40
Figure 1-13: (A) Plot of emission intensity of CH3CN solutions containing (•) 140 μM Ru-1 with addition of 5 μL aliquots of 5.3 mM Cu(NO3)2; (O) 58.7 μM Ru-2 with additions of 5 μL aliquots of 3.41 mM Cu(NO3)2; (1) 104 μM Ru-3 with additions of 5 μL aliquots of 4.86 mM Cu(NO3)2. (B) Plot of emission intensity of CH3CN solutions of (•) 95.0 μM Ru-4 and (O) 57.6 μM Ru-5 after incremental additions of 7 μL of 2.83 mM Cu(NO3)2 and 5 μL of 3.86 x 10⁻³ mM Cu(NO3)2, respectively, versus the molar ratio of Cu2+ to Ru2+. (Inset) Expanded region of the titration curve at higher Cu2+ concentrations.Reproduced with permission from Ref 71. Copyright (2009) the American ChemicalSociety.

41
titration curves were attributed to two bound [Cu(bpy)2]2+ sites within the aeg scaffolds. After two
equivalents of Cu are added to either Ru-4 or Ru-5, their emission intensity decreased to 97 %,
equivalent to Ru-1-(Cu). This was expected since the distance between Ru and the nearest set of
bpy ligands was roughly identical and thus the emission quenching efficiency should be
approximately equal.
Elemental analysis confirmed the Ru:Cu ratios for all compounds. Shown in Figure 1-14
for [Ru-5(Cu)2]6+, mass spectrometry was also used to conclusively determine the identity of the
major species by analysis and comparison to calculated isotope splitting models. In all cases,
multiple molecular ion peaks were observed in the mass spectra, corresponding to species with
varying numbers of associated PF6- counteranions.
Excited state quenching of [Ru(bpy)3]2+ by [Cu(bpy)2]
2+ can mechanistically occur by
either electron or energy transfer, or a combination of these. Using the excited state redox
potentials, electron transfer between the bpy• and CuII to form the [RuIII(bpy)3]3+ and [CuI(bpy)2]
1+
species has a calculated driving force of ΔG ≈ -0.7 eV. However, because [Cu(bpy)2]2+ has a
weak, broad absorbance band that directly overlaps with the emission band of [Ru(bpy)3]2+,
determination of the extent of energy transfer quenching remains difficult. To ultimately enable
the use of these structures for molecular electronics applications, it is important to study and
understand the interplay between structure, redox properties, and quenching mechanism.
By measuring the excited state lifetimes of Ru-Cu systems,, dynamics as a function of
distance and number of Cu centers and as a function of temperature were obtained. Together with
the quantum yields and temperature-dependent measurements, the non-radiative (knr) rates and
activation energies (Ea) were calculated and compared. As the distance between Ru and Cu
increased, knr decreased and Ea increased. In the cases of Ru-4(Cu)2 and Ru-5(Cu)2, which each
contained two [Cu(bpy)2]2+ complexes, these had knr and Ea values similar to Ru-1(Cu), which
was expected because the Ru-Cu distances are the same in the three compounds.

42
Figure 1-14: Molecular ion peaks observed by positive ion electrospray massspectrometry, plotted together with the calculated mass and isotopic splitting patters for [Ru-5(Cu)2](PF6)6. Reproduced with permission from Ref 71. Copyright (2009) theAmerican Chemical Society.

43
1.4.5.4 Metal Binding in Two and Three Directions.
In Chapters 2-4, peptides were used to coordinate solution ions to form linear molecular
wires. Chapter 5 discusses the synthesis of [Ru(bpy)3]2+ scaffolds that impart a three-
dimensional structure in which multiple hairpins are pendant from a single [Ru(bpy)3]2+ center.
These complexes more resemble natural systems in that electron and energy transfer can occur in
more than one direction. These di- and tri-hairpins are compared with the mono-hairpin Ru-1 (as
discussed in Chapters 2 – 4), and are shown in Figure 1-15. These complexes were synthesized
in a similar fashion using [Ru(bpy)3]2+ starting materials with four and six reactive acyl chloride
groups, followed by reaction with excess amine terminated peptides to yield the structures shown.
Characterization of these revealed increasing emission quantum yield and excited state lifetime
with number of amide substituents.
Coordination of Cu2+ to Ru-6 revealed a very similar two-step titration curve with Ru-4
and Ru-5 with total quenching efficiency of ~ 98 % at a molar ratio of two equivalents of
Cu2+:Ru-6. Addition of Cu2+ to Ru-7 however exhibited a much more complex curve than
expected. Distinct elbows could be seen in the curve but these occurred at half-equivalent
intervals, an observation attributed to rearrangement of the scaffold between inter- and intra-
hairpin binding.
For the first time, and because of its potential catalytic capabilities, Pd2+ was added to
these scaffolds and its effects on [Ru(bpy)3]2+ emission were measured. Titrations showed
quenching to a lesser degree than Cu2+, however titration curves seamed to be featureless until
reaching a 2:1 (in the dihairpin) or 3:1 (in the trihairpin) molar equivalent of Pd:Ru, after which
emission intensity was constant.
This chapter also demonstrates the difficulty in controlling metal ion placement within

44
Figure 1-15: Structures of Mono-, Di-, and Tri-hairpin [Ru(bpy)3]
2+ complexes.

45
our scaffolds with the current pendant bpy ligand motif. Ru-6 was combined with both Cu2+ and
Pd2+ to synthesis a [Ru-6(CuPd)]6+ complex. While this complex was observed in the mass
spectrum, [Ru-6(Cu]2]6+ and [Ru-6(Pd)2]
6+ were also observed.
1.4.5.5 Bipyridine-Modified Peptides as Scaffolds for Photocatalysis.
Designing peptide sequences with ligands capable of binding solution metal ions for
multi-site, multi-step reactions for uses in artificial photosynthesis and photoinduced catalysis is
an obtainable goal. The aeg backbone offers sufficient variation in ligand identity to which
appropriate metal complexes may be selectively bound. It can also act as a scaffold to combine
and energy donors and acceptors in such a way that photoinitiated energy or electron transfer is
favorable and catalysis occurs. Chapter 6 illustrates the first example of using the aeg backbone
to do this and the compounds to accomplish this are shown in Figure 1-16. These complexes are
designed to bring together a single donor, [Ru(4,4’-dimethyl bpy)3]2+, and one, two, or three
acceptors ([Pd(bpy)(CH3)(CH3CN)]+) in such a way that when irradiated with light (λex > 455 nm)
the complex photocatalyzes the dimerization of α-methylstyrene. Reactions are monitored using
NMR spectroscopy to show that photocatalysis occurs using the peptide scaffold to tether the
donor and acceptor.
Each complex is shown to photocatalyze this dimerization reaction and during a 100 fold
excess monomer consumption study, we found a trend of reaction time of CS-2 > CS-1 > CS-3.
This was attributed to an increase in amide substituents that increased the overall electron
withdrawing nature of the Ru-coordinated ligands, and subsequently decreased the rate of
electron donation to the catalytic site. These studies represented the first photocatalytic reaction
performed on an aminoethylglycine backbone.

46
Figure 1-16: Structures of Scaffolds for Photocatalysis.

47
1.4.5.6 Analysis of Quenching Mechanism, Structural Constraints, and Future Directions.
Chapter 7 discusses potential future studies in a variety of areas which exploit the
versatility of the aeg backbone though peptide coupling chemistry and metal complex
coordination chemistry. A series of proof of concept compounds and experiments were
conducted. In one, transient absorption spectroscopy was used to monitor the photophysical
processes that occur in our Ru-Cu hairpin complexes following the absorption of a photon.
Analysis of key spectral features (decay of bpy•/- vs. recovery of the MLCT ground state)
indicated that both occurred on roughly the same time scale, suggestive of an energy transfer
mechanism. However, with respect to the large driving force for excited state electron transfer
between [Ru(bpy)2(bpy•/-+)]2+ [Cu(bpy)2]2+ (- 0.7 eV), back electron transfer may be faster than
the time scale of the experiment. This work represents an ongoing study combing peptide
coupling chemistry in conjunction with temperature dependent emission, transient absorption
spectroscopy, and future studies of solvent dependencies for quenching mechanism determination
in our Ru-Cu peptides.
Pyrene-based complexes offer a versatile array of applications and for our peptide
systems provide a variety of spectroscopic or diagnostic variations leading toward more efficient
light harvesting or structural information. Synthesizing [Ru(bpy)3] + with multiple functionalities2
has become commonplace in the design of light harvesting complexes. For example, pyrene
attached to the Ru center has been shown to act as an “energy reservoir” increasing excited
lifetimes to > 5 μsec at room temperature. When pyrene-derivatized complexes are synthesized,
π-stacking of the pyrene to form a dimer is indicated by excimer emission. Based on the system
design, an increase or decrease in intensity indicates metal binding and allows structural
inferences to be made. With respect to this, the first [Ru(bpy)3]2+ hairpin complexes derivatized

48
with pyrene were synthesized and are shown in Figure 1-17. The first combines pyrene with a
Ru-coordinated bpy ligand to act as an energy donor and reservoir and is then combined with
Cu2+ to form a potential energy transfer cascade (Ru-pyr 1). The second complex terminates the
chains of the [Ru(bpy)3]2+ hairpin to yield a complex emission spectrum and first evidence of
excimer formation in these systems (Ru-pyr 2). These complexes are briefly characterized and
their photophysical properties measured. These results provide starting points for larger, more
complex structures with multiple fluorophores.
Multiple binding possibilities, discussed in detail in Chapter 5, highlight the need for
greater control over metal complex coordination. Toward this aim, a Ru-dihairpin complex was
synthesized containing two distinctly different hairpin portions. The first is identical to Ru-1
with two aeg strands containing pendant bpy ligands. The second contain two ethylene strands
that are fmoc protected; the terminal amines can be deprotected though the addition of base,
enabling acid-terminated metal complexes or acid-terminated ligands to be coupled. This
complex represents the first dihairpin system that is potentially capable of containing
heteroligands (i.e. bpy and hydroxyquinoline) or exerting selective control over the placement of
metal ions in the array.
Structural flexibility indeed plagues our ability to obtain x-ray crystal structures. As
Chapter 3 discusses, multiple aeg conformations and metal binding motifs are possible in
solution, all of which are encouraged by the flexibility of the backbone. Two attempts were made
to design compounds that control complex structure both in terms of flexibility and its interaction
with neighboring molecules. The first decreases the flexibility of the backbone by replacing the
pendant ligand 4-methyl,4’-aceticacid bipyridine with 4-methyl,4-carboxylic acid bipyridine
(Figure 1-15, Ru-SS β). The removal of a CH2 decreases a single mode of flexibility with the
aim that a more rigid structure will form. The second method decorates Ru-coordinated bpy
ligands and aeg chain termini with carboxylic acids to encourage hydrogen bonding between

49
Figure 1-17: Complex structures showing pyrene inclusion and increased structural rigidity.
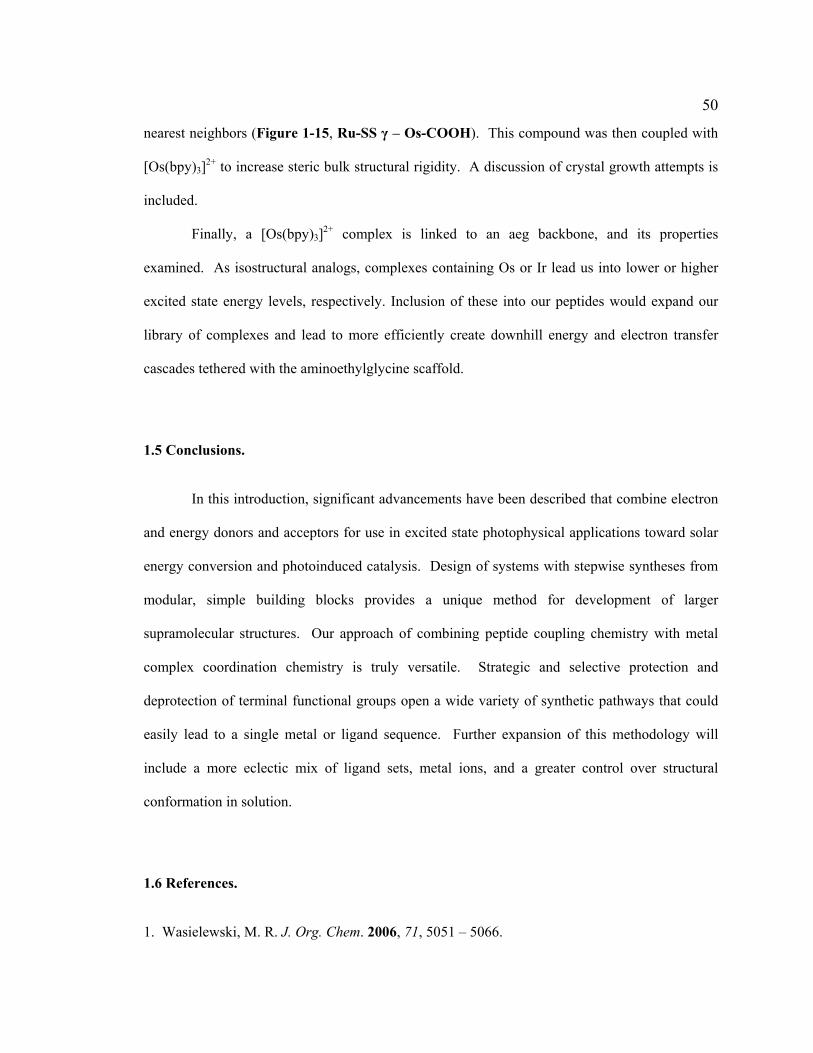
50
nearest neighbors (Figure 1-15, Ru-SS γ – Os-COOH). This compound was then coupled with
[Os(bpy)3]2+ to increase steric bulk structural rigidity. A discussion of crystal growth attempts is
included.
Finally, a [Os(bpy)3]2+ complex is linked to an aeg backbone, and its properties
examined. As isostructural analogs, complexes containing Os or Ir lead us into lower or higher
excited state energy levels, respectively. Inclusion of these into our peptides would expand our
library of complexes and lead to more efficiently create downhill energy and electron transfer
cascades tethered with the aminoethylglycine scaffold.
1.5 Conclusions.
In this introduction, significant advancements have been described that combine electron
and energy donors and acceptors for use in excited state photophysical applications toward solar
energy conversion and photoinduced catalysis. Design of systems with stepwise syntheses from
modular, simple building blocks provides a unique method for development of larger
supramolecular structures. Our approach of combining peptide coupling chemistry with metal
complex coordination chemistry is truly versatile. Strategic and selective protection and
deprotection of terminal functional groups open a wide variety of synthetic pathways that could
easily lead to a single metal or ligand sequence. Further expansion of this methodology will
include a more eclectic mix of ligand sets, metal ions, and a greater control over structural
conformation in solution.
1.6 References.
1. Wasielewski, M. R. J. Org. Chem. 2006, 71, 5051 – 5066.

51
2. Wasielewski, M. R. Chem. Rev. 1992, 92, 435 – 461.
3. Lewis, F. D.; Letsinger, R. L.; Wasielewski, M. R. Acc. Chem. Res. 2001, 34, 159 – 170.
4. Meyer, T. J. Acc. Chem. Res. 1989, 22, 163 – 170.
5. Alstrum-Acevedo, J. H.; Brennaman, M. K.; Meyer, T. J. Inorg. Chem. 2005, 44, 6802 – 6827.
6. Huynh, M. H. V.; Meyer, T. J.; Chem. Rev. 2007, 107, 5004 – 5064.
7. Lomoth, R.; Magnuson, A.; Sjodin, M.; Huang, P.; Styring, S.; Hammarstrom, L. Photosynth.
Rev. 2006, 87, 25 – 40.
8. Martin, N.; Sanchez, L.; Illescas, B.; Perez, I. Chem. Rev. 1998, 98, 2527 – 2548.
9. Slone, R. V.; Hupp, J. T.; Stern, C. L.; Albrecht-Schmitt, T. E. Inorg. Chem. 1996, 35, 4096 –
4097.
10. Lee, S. J.; Mulfort, K. L.; O’Donnel, J. L.; Zuo, X.; Goshe, A. J.; Wesson, P. J.; Nguyen, S.
T.; Hupp, J. T.; Tiede, D. M. Chem. Commun. 2006, 4581 – 4583.
11. Lee, S. J.; Mulfort, K. L.; Zuo, X.; Goshe, A. J.; Wesson, P. J.; Nguyen, S. T.; Hupp, J. T.;
Tiede, D. M. J. Am. Chem. Soc. 2008, 130, 836 – 838.
12. Kelley, R. F.; Lee, S. J.; Wilson, T. M.; Nakamura, Y.; Tiede, D.; Osuka, A.; Hupp, J. T.;
Wasielewski, M. R. J. Am. Chem. Soc. 2008, 130, 4277 – 4284.
13. Jensen, R. A.; Kelley, R. F.; Lee, S. J.; Wasielewski, M. R.; Hupp, J. T.; Tiede, D. M. Chem.
Commun. 2008, 16, 1886 – 1888.
14. Stang, P. J.; Cao, D. H. J. Am. Chem. Soc. 1994, 116, 4981 – 4982.
15. Stang, P. J.; Olenyuk, B. Organometallics 1997, 16, 3094 – 3096.
16. Resendiz, M. J. E.; Noveron, J. C.; Disteldorf, H.; Fischer, S.; Stang, P. J. Org. Lett. 2004, 6,
651 – 653.
17. Seidel, S. R.; Stang, P. J. Acc. Chem. Res. 2002, 35, 972 – 983.
18. Northrop, B. H.; Zheng, Y. R.; Chi, K. W.; Stang, P. J. Acc. Chem. Res. 2009, 42, 1554 –
1563.

52
19. Tanaka, K.; Shionoya, M. J. J. Org. Chem. 1999, 64, 5002 – 5003.
20. Tanaka, K.; Yamada, Y.; Shionoya, M. J. Am. Chem. Soc. 2002, 124, 8802 – 8803.
21. Tanaka, K.; Tengeigi, A.; Kato, T.; Toyama, N.; Shiro, M.; Shionoya, M. J. Am. Chem. Soc.
2002, 124, 12494 – 12498.
22. Tanaka, K.; Tengeiji, A.; Kato, T.; Toyama, N.; Shionoya, M. Science 2003, 299, 1212 –
1213.
23. Takezawa, Y.; Maeda, W.; Tanaka, K.; Shionoya, M. Angew. Chem. Int. Ed. 2009, 48, 1081
– 1084.
24. Meggers, E.; Holland, P. L.; Tolman, W. B.; Romesberg, F. E.; Schultz, P. G. J. Am. Chem.
Soc. 2000, 122, 10714 – 10715.
25. Atwell, S.; Meggers, E.; Spraggon, G.; Schultz, P. G. J. Am. Chem. Soc. 2001, 123, 12364 –
12367.
26. Zimmermann, N.; Meggers, E.; Schultz, P. G. J. Am. Chem. Soc. 2002, 124, 13684 – 13685.
27. Zhang, L.; Meggers, E. J. Am. Chem. Soc. 2005, 127, 74 – 75.
28. Boyde, S.; Strouse, G. F.; Jones, W. E.; Meyer, T. J. J. Am. Chem. Soc. 1989, 111, 7448 –
7454.
29. Chen, P.; Duesing, R.; Tapolsky, G.; Meyer, T. J. J. Am. Chem. Soc. 1989, 111, 8305 –
8306.
30. Jones, W. E.; Bignozzi, C. A.; Chen, P.; Meyer, T. J. Inorg. Chem. 1993, 32, 1167 – 1178.
31. Opperman, K. A.; Mecklenburg, S. L.; Meyer, T. J. Inorg. Chem. 1994, 33, 5295 – 5301.
32. Mecklenburg, S. L.; McCaffety, D. G.; Schoonover, J. R.; Peek, B. M.; Erickson, B. W.;
Meyer, T. J. Inorg. Chem. 1994, 33, 2974 – 2983.
33. Mecklenburg, S. L.; Peek, B. M.; Erickson, B. W.; Meyer, T. J. J. Am. Chem. Soc. 1991,
113, 8540 – 8542.

53
34. Mecklenburg, S. L.; Peek, B. M.; Schoonover, J. R.; McCafferty, D. G.; Wall, C. G.;
Erickson, B. W.; Meyer, T. J. J. Am. Chem. Soc. 1993, 115, 5479 – 5495.
35. McCafferty, D. G.; Bishop, B. M.; Wall, C. G.; Hughes, S. G.; Mecklenberg, S. L.; Meyer, T.
J.; Erickson, B. W. Tetrahedron, 1995, 51, 1093 – 1106.
36. McCafferty, D. G.; Friesen, D. A.; Danielson, E.; Wall, C. G.; Saderholm, M. J.; Erickson, B.
W.; Meyer, T. J. Proc. Natl. Acad. Sci, USA. 1996, 93, 8200 – 8204.
37. Slate, C. A.; Striplin, D. R.: Moss, J. A.; Chen, P.; Erickson, B. W.; Meyer, T. J. J. Am.
Chem. Soc. 1998, 120, 4885 – 4886.
38. Slate, C. A.; Binstead, R. A.; Meyer, T. J.; Erickson, B. W. Lett. Peptide Sci. 1999, 6, 61 –
69.
39. Striplin, D. R.; Reece, S. Y.; McCafferty, D. G.; Wall, C. G.; Friesen, D. A.; Erickson, B. W.;
Meyer, T. J. J. Am. Chem. Soc. 2004, 126, 5282 – 5291.
40. Siders, P.; Marcus, R. A. J. Am. Chem. Soc. 1981, 103, 748 – 752.
41. Serron, S. A.; Aldridge, W. S.; Fleming, C. N.; Danell, R. M.; Baik, M. H.; Sykora, M.;
Dattelbaum, D. M.; Meyer, T. J. J. Am. Chem. Soc. 2004, 126, 14506 – 14514.
42. Marcus, R. A. Annu. Rev. Phys. Chem. 1964, 15, 155 – 1596.
43. Sutin, N. Prog. Inorg. Chem. 1983, 30, 441 – 499.
44. Marcus, R. A.; Siddarth, P. Photoprocesses in Transition Metal Complexes, Biosystems and
Other Molecules; Kochanski, E., Ed.; Kluwer Academic Publishers; Netherlands, 1992.
45. Nielsen, P. E.; Egholm, M.; Berg, R. H.; Buchardt, O. Science 1991, 254, 1497 – 1500.
46. Nielsen, P. E.; Haaima, G. Chem. Soc. Rev. 1997, 26, 73 – 78.
47. Rasmussen, H.; Kastrup, J. S.; Nielsen, J. N.; Nielsen, J. M.; Nielsen, P. E. Nat. Struct. Biol.
1997, 4, 98 – 101.
48. van Staveren, D. R.; Bothe, E.; Weyhermuller, T.; Metzler-Nolte, N. Eur. J. Inorg. Chem.
2002, 6, 1518 – 1529.

54
49. Maurer, A.; Kraatz, H. B.; Metzler-Nolte, N. Eur. J. Inorg. Chem. 2005, 16, 3207 – 3210.
50. Koster, S. D.; Dittrich, J.; Gasser, G.; Husken, N.; Castaneda, I. C. H.; Jios, J. L.; Della
Vedova, C. O.; Metzler-Nolte, N. Organometallics 2008, 27, 6326 – 6332.
51. Husken, N.; Gasser, G.; Koster, S. D.; Metzler-Nolte, N. Bioconjugate Chem. 2009, 20, 1578
– 1586.
52. Popescu, D. L.; Parolin, T. J.; Achim, C. J. Am. Chem. Soc. 2003, 125, 6354 – 6355.
53. Watson, R. M.; Skorik, Y. A.; Patra, G. K.; Achim, C. J. Am. Chem. Soc. 2005, 127, 14628 –
14639.
54. Franzini, R. M.; Watson, R. M.; Patra, G. K.; Breece, R. M.; Tierney, D. L.; Hendrich, M. P.;
Achim, C. Inorg. Chem. 2006, 45, 9798 – 9811.
55. Paul, A.; Watson, R. M.; Lund, P.; Xing, Y.; Burke, K.; He, Y.; Borguet, E.; Achim, C.;
Waldeck, D. H. J. Phys. Chem. C 2008, 112, 7233 – 7240.
56. Marcus, R. A. J. Chem. Phys. 1956, 24, 966 – 978.
57. Marcus, R. A. J. Chem. Phys. 1965, 43, 3477 – 3489.
58. Genereux, J. C.; Barton, J. K. Chem. Rev. 2010, 110, 1642 – 1662.
59. Delaney, S.; Barton, J. K. J. Org. Chem. 2003, 68, 6475 – 6483.
60. Treadway, C. R.; Hill, M. G.; Barton, J. K. Chem. Phys. 2002, 281, 409 – 428.
61. Lewis, F. D. Pure Apply. Chem. 2006, 78, 2287 – 2295.
62. Frank, N. L.; Meade, T. J. Inorg. Chem. 2003, 42, 1039 – 1044.
63. Wang, P.; Miller, J. E.; Henling, L. M.; Stern, C. L.; Frank, N. L.; Eckermann, A. L.; Meade,
T. J. Inorg. Chem. 2007, 46, 9853 – 9862.
64. Gilmartin, B. P.; Ohr, K.; McLaughlin, R. L.; Koerner, R.; Williams, M. E. J. Am. Chem.
Soc. 2005, 127, 9546 – 9555.
65. Ohr, K.; Gilmartin, B. P.; Williams, M. E. Inorg. Chem. 2005, 44, 7876 – 7885.
66. Gilmartin, B. P.; McLaughlin, R. L.; Williams,M. E. Chem. Mater. 2005, 17, 5446 – 5454.

55
67. Ohr. K.; McLaughlin, R. L.; Williams, M. E. Inorg. Chem. 2007, 46, 965 – 974.
68. Myers, C. P.; Gilmartin, B. P.; Williams,M. E. Inorg. Chem. 2008, 47, 6738 – 6747.
69. Levine, L. A.; Youm, H.; Yennawar, H. P.; Williams, M. E. Eur. J. Inorg. Chem. 2008, 4083
– 4091.
70. Levine, L. A.; Kirin, S. I.; Myers, C. P.; Showalter, S. A.; Williams, M. E. Eur. J. Inorg.
Chem. 2009, 613 – 621.
71. Myers, C. P.; Miller, J. R.; Williams, M. E. J. Am. Chem. Soc. 2009, 131, 15291 – 15300.
72. Kalyanasundaram, K. Coord. Chem. Rev. 1982, 46, 159 – 244.
73. Fukuzumi, S. Eur. J. Inorg. Chem. 2008, 9, 1351 – 1362.
74. Cady, C. W.; Crabtree, R. H.; Brudvig, G. W. Coord. Chem. Rev. 2008, 252, 444 – 455.
75. Falkenstrom, M.; Johansson, O.; Hammarstrom, L. Inorg. Chim. Acta. 2007, 360, 741 – 750.

Chapter 2
Aminoethylglycine-Functionalized Ru(bpy)32+ with Pendant Bipyridines Self-Assemble
Multimetallic Complexes by Cu and Zn Coordination
2.1 Introduction
The ability to shuttle energy and electrons is critically important in biology and especially
photosynthesis. Artificial synthetic systems that exert an analogous high level of control could
enable solar cells and molecular electronics with unprecedented abilities and efficiencies.
Realization of highly optimized molecular devices will ultimately require arrangement of
molecular components to maximize efficiency and direct energy and electron transfers while
minimizing relaxation and charge recombination pathways. A wide variety of molecular systems
in which chromophores, electron donors and acceptors are covalently linked have been reported;1-
3 structure and function are intimately related, since both electron transfer over long distances and
long lived charge separation require overlap and alignment of functional moieties. A remaining
challenge is to design supramolecular systems with controlled relative arrangement of
chromophores, electron donors and acceptors, and catalytic centers that ultimately can be used for
efficient photosynthesis of fuels such as methane or hydrogen gas. Biological systems
accomplish the complex task of self-assembly using hydrogen bonding, weak van der Waals
forces, and electrostatic attraction to form very large molecules (i.e. enzymes, duplex DNA, etc).
Synthetic mimics that use self-assembly to drive the formation of large, functional molecules may
provide the means to create artificial analogs of natural and technologically important systems.

57
Several reports have described the use of weak interactions to construct functional biomimetic
structures,4-7 but making an array of building blocks that self-assemble into many possible
functional structures remains a synthetic challenge.
Inorganic coordination chemistry is an attractive approach for assembly of complex
supramolecular structures because of the tunability of the coordination geometry, metal ion
lability, and redox states. Our group makes artificial oligopeptides consisting of an
aminoethylglycine (aeg) backbone with pendant ligands (e.g., pyridine, bipyridine, terpyridine)
that self-assemble into multimetallic structures upon coordination of transition metals.8-11
Polyfunctional oligopeptides containing pyridine and bipyridine ligands have also been prepared
and used to create heterometallic structures.11 The coordination geometry of the metal and the
denticity of the pendant ligands has led in some cases to the formation of double-stranded
duplexes linked by multiple metal ions as depicted in Scheme 2-1A.8,10 For example, two
artificial tripeptides containing three pendant bipyridine ligands were cross-linked by three Cu2+
ions forming a multimetallic structure with the metal complexes held in close proximity by the
aeg chains. However the bpy-substituted tripeptide strands can align in either a parallel or
antiparallel fashion as shown in the cartoon in Scheme 2-1A. Furthermore, although mass
spectrometry and electrochemical experiments did not detect the presence of misaligned duplexes
(i.e., polymeric species) these remain possible with this structural motif. Problems associated
with imperfect geometric control would be expected to grow with the length of the oligopeptide
and therefore our group has sought to specifically design aeg oligopeptide structures that reduce
or eliminate misalignment and isomer formation. Additional refinement of the molecular design
is needed to prepare heterometallic, multifunctional assemblies with a higher degree of control
over the relative locations of the metal ions.
To address these two challenges, inspiration is taken from self-complementary nucleic
acid sequences that fold on themselves to form hairpin loops.12,13 Recent reports have

58
M2+2
OR
2
A) B)
Bipyridine dimer4-coordinate metal (Cu, Zn etc) Short linker Metal coordinated to linker
OR
M2+ M2+
M2+ M2+
M2+ M2+
M2+
M2+
M2+
M2+
Scheme 2-1: Schematic of metal coordination induced linkage of bipyridine-substituted peptide dimers for (A) linear chain that can form isomers and (B) hairpin structure that limit isomerformation.

59
demonstrated incorporation of redox- and photo-active species into DNA hairpins as a means to
precisely control the location of these with nucleic acid duplexes.14,15 By analogy, we have
designed artificial peptide analogs with two complementary ligand substituted aeg chains that
form a hairpin upon metal coordination as shown in Scheme 2-1B. Co-attachment of the aeg
chains to a linker pre-directs the chains so that addition of a metal ion causes them to crosslink
and align; our strategy is to use a single metal complex as the linker region for preparing
heterometallic complexes. We have chosen to utilize [Ru(bpy)3]2+ for this function because it is
substitutionally inert and can therefore be used as a functional building block for amide coupling
chemistry as the artificial oligopeptides are attached and modified. The well-known
photophysical and redox properties of [Ru(bpy)3]2+ also make it an ideal choice for our longer-
term aim of using these multimetallic assemblies for photoinduced electron and energy
transfer.1,3,16-19
In this paper, we present the synthesis and characterization of a model molecular system
that follows the hairpin design rules to controllably self-assemble heterometallic structures. These
employ two aminoethylglycine units attached to [Ru(bpy)3]2+ complexes; addition of bipyridine
ligands to the aeg scaffold leaves these sites available for coordination to Cu2+ and Zn2+. The
resulting heterometallic structures contain two or three metal complexes that are tethered by aeg
strands but which lack a conjugated bridging ligand. This initial study serves as the preliminary
step for using the artificial peptides and hairpin motif for forming polyfunctional and photoactive
inorganic structures.

60
2.2 Experimental
2.2.1 Chemicals.
The syntheses of cis-dichlorobis(2,2’-bipyridine)ruthenium (II) ([Ru(bpy)2Cl2]),20 2,2’-
bipyridyl-4,4’-dicarboxylic acid chloride (bpy-diacyl chloride),21 tert-butyl N-
(aminoethyl)glycinate (aeg-OtButyl),22 4'-methyl-2,2'-bipyridine-4-acetic acid,23 4’-methyl-2,2’-
bipyridine-4-carboxylic acid,24 and 4-(chlorocarbonyl)-4’-methyl-2,2’-bipyridine25 were
performed as previously reported. N-Hydroxybenzotriazole (HOBT) and 1-ethyl-3-(3-
dimethyllaminopropyl)carbodiimide hydrochloride (EDC) were purchased from Advanced
ChemTech. O-Benzotriazole-N,N,N’,N’-tetramethyl-uronium-hexafluorophosphate (HBTU) was
purchased from NovaBiochem. Zinc (II) acetate (98%) was purchased from Fisher Scientific
and Copper (II) nitrate (99.9%) was purchased from J. T. Baker. All solvents were used as
received without further purification unless otherwise noted.
2.2.2 Synthesis.
2.2.2.1 Synthesis of Bpy(aeg-OtButyl)2 (1).
Using a modification of a previously reported synthesis,26 to 75 mL of dry THF was
added 0.468 g (1.66 mmol) bpy-diacid chloride and 1.1 mL triethylamine (7.9 mmol)
immediately giving a white precipitate; the mixture was then cooled in an ice bath with stirring.
Separately, 1.58 g aeg-OtButyl (9.96 mmol) was dissolved in 60 mL of dry THF and stirred in an
ice bath. The acid chloride mixture was added via canulate to the aeg-OtButyl solution over 10
min, and stirred under N2 for 20 min at 0°C, then 20 min at 45-50°C. Finally, the solution was

61
cooled to 0°C and the Et3NHCl was removed by vacuum filtration. The pale yellow solution was
concentrated by evaporation to give a yellow oil. Purification was performed by passing the
crude oil down a silica column using ethanol as the mobile phase. A 600 mg amount of the
yellow oil was collected (1.08 mmol, 65%). 1H NMR, 300 MHz, CDCl3: 1.38 (s, 18H); 2.85 (t,
4H); 3.3 (s, 4H); 3.5 (q, 4H); 7.73 (dd, 2H); 7.8 (t, 2H); 8.7 (m, 4H) (As typically observed in
peptides and peptide nucleic acid, secondary amine protons are not observed.)27 MS (ESI+) [M +
H+] calcd 557.1; found 557.2.
2.2.2.2 Synthesis of [Ru(bpy)2(bpy[aeg-OtButyl]2)](NO3)2 (Ru-0).
To 125 mL ethanol, 303.4 mg (0.63 mmol) Ru(bpy)2Cl2 and ~ 600 mg (0.94 mmol) of
bpy(aeg-OtButyl)2 were added, and the solution refluxed overnight under nitrogen. After cooling
to room temperature, the solvent was removed by rotary evaporation. The red residue was
purified by column chromatography using silica gel and 5:4:1, CH3OH:H2O:Sat. KNO3 (aq). The
solvent of the red solution was removed by rotary evaporation to leave the product, solid KNO3
and some dissolved silica. To this, 2 mL CH3CN and 15 mL CH2Cl2 was added and the solution
filtered to remove some salts. The red solution was dried over Na2SO4 and the solvent removed
to give the pure product. Collected 0.45 g (0.41 mmol, 66%) 1H NMR, 400 MHz, CD3CN
(Figure 2-1): 1.41 (s, 18H); 3.30 (t, 4H); 3.74 (t, 4H); 3.77 (s, 4H); 7.38 (q, 4H); 7.73 (t, 4H);
7.76 (dd, 2H); 7.83 (d, 2H); 8.04 (q, 4H); 8.52 (m, 4H); 8.92 (t, 2H); 9.28 (s, 2H). (Secondary
amine protons are again not observed.)27 MS (ESI+) [M2+] calcd, 485.0; found, 485.1. HRMS
(ESI+) [M2+ + BF4-] calcd for C48H56BN10O6F4Ru, 1057.3457; found 1057.3445.

62
Figure 2-1: 1H NMR spectrum of Ru-0 at 400 MHz in CH3CN. Solvent peaks are removed for clarity

63
2.2.2.3 Synthesis of [Ru(bpy)2(bpy[aeg-(bpy)-OtButyl]2)](NO3)2 (Ru-1).
A 50 mL solution of 160 mg 4'-Methyl-2,2'-bipyridine-4-acetic acid (0.70 mmol), 253 mg
HBTU (0.66 mmol), and 102 mg HOBt (0.66 mmol) in CH2Cl2 was stirred for 15 min at 0°C.
After this time, 300 µL diisopropylethylamine (4.2 mmol) was added and the solution stirred for
an additional hour. A 200 mg amount of Ru-0 (0.182 mmol) was added and the solution stirred
overnight, allowing it to reach room temperature. An additional 160 mg of 4'-methyl-2,2'-
bipyridine-4-acetic acid was added and the solution was stirred for an additional day. The solvent
was removed by evaporation and the compound purified first on silica using 10% MeOH/CH2Cl2,
then 5:4:1, CH3CN:H2O:Sat. KNO3, then isolated as for Ru-0, (aq) giving 0.23 g of the pure
product (0.183 mmol, 83%). 1H NMR, 360 MHz, CD3CN (Figure 2-2): 1.35–1.40 (t, 18 H);
2.16–2.22 (m, 6 H); 2.33–2.37 (d, 2H); 3.52–3.77 (m, 9H); 3.84–4.05 (m, 4H); 4.20 (s, 1H);
7.02–7.19 (m, 4H); 7.33–7.47 (m, 4H); 7.64 – 7.83 (m, 6H); 7.87 (m, 3H); 8.06 (m, 5H); 8.18 –
8.36 (m-m, 6H); 8.52 (m, 4H); 8.69–9.08 (m–m, 4H). MS (ESI+) [M2+] calcd, 695.0; found,
695.1. HRMS (ESI+) [M2+] calcd for C74H76N14O8Ru, 695.2512; found 695.2479.
2.2.2.4 Synthesis of Bpy(aeg-(AC)-OtButyl)2 (4).
A solution of 0.300 g (0.54 mmol) bpy(aeg-OtButyl)2 (1), 0.728 g (5.4 mmol) HOBt, and
1.04 g (5.4 mmol) EDC in 125 mL CH2Cl2 was stirred at room temperature for two days. After
this time, the solution was extracted three times with 10 mL H2O and then dried over Na2SO4.
The product was further purified using silica gel (10% MeOH/CH2Cl2 eluent) to give 0.24 g of
the final product (0.37 mmol, 70%). 1H NMR, 360 MHz, CDCl3: 1.42 (d, 18H); 2.02 (d, 6H);
3.50 (m, 4H); 3.61 (s, 4H); 3.97 (d, 4H); 7.35 (m, 2H); 7.68 (t, 2H); 8.67 (m, 4H). MS (ESI+) [M

64
Figure 2-2: 1H NMR spectrum of Ru-1 at 360 MHz in CH3CN. Solvent peaks are removed for clarity.

65
+ H+] calcd 641.2; found 641.3.
2.2.2.5 Synthesis of [Ru(bpy)2(bpy[aeg-(AC)-OtButyl]2)](NO3)2 (Ru-AC).
A solution of 0.181 g (0.37 mmol) Ru(bpy)2Cl2 and 0.24 g (0.37 mmol) 4 was refluxed
overnight in 125 mL ethanol. The solvent was removed by rotary evaporation and the product
purified on silica using 10% MeOH/CH2Cl2, then 5:4:1 CH3CN:H2O:KNO3 (sat.). The
compound was isolated as for Ru-0. The solvent was removed by rotary evaporation to give the
red product. Collected 0.19 g of the red product (0.16 mmol, 43%) 1H NMR, 360 MHz, d6 dmso
(Figure 2-3): 1.39 (d, 18H); 1.98 (d, 6H); 3.43 (s, 4H); 3.50 (s, 4H); 3.94 (s, 2H); 4.14 (s, 2H);
7.49 (t, 2H); 7.54 (t, 2H); 7.70 (d, 2H); 7.74 (t, 2H); 7.80 (t, 2H); 7.93 (t, 2H); 8.18 (q, 4H); 8.84
(d, 4H); 9.14 (m, 4H). MS (ESI+) [M2+] calcd 527.1; found 527.18.
2.2.2.6 Synthesis of Methyl bpy(aeg-OtButyl) (6).
A solution of 4.06 g (2.3 mmol) aeg-OtButyl was dissolved in 200 mL THF and cooled to
0°C in an ice bath. To this was added dropwise a solution of 1.0 g (4.7 mmol) 4-
(chlorocarbonyl)-4’-methyl-2,2’-bipyridine and 2 mL NEt3 (14.1 mmol) in 100 mL THF over 20
min. The resulting solution was stirred for 20 min at 0°C, then 20 min at 50°C. The solution was
cooled to 0°C, the NHEt3Cl was filtered off and the solvent removed by rotary evaporation. The
crude residue was purified on a silica column with 10% MeOH/CH2Cl2 to give 1.3 g of pure
yellow oil (3.5 mmol, 75% yield). 1H NMR, 360 MHz, CDCl3: 1.42 (s, 9H); 2.42 (s, 3H); 2.87
(t, 2H); 3.33 (s, 2H); 3.52 (q, 2H); 7.13 (dd, 1H); 7.42 (t, 1H); 7.76 (dd, 1H); 8.23 (s, 1H); 8.5 (d,
1H); 8.67 (s, 1H); 8.75 (dd, 1H). (Secondary amine protons not observed.)27 MS (ESI+) [M +
H+] calcd 371.2; found 371.2.
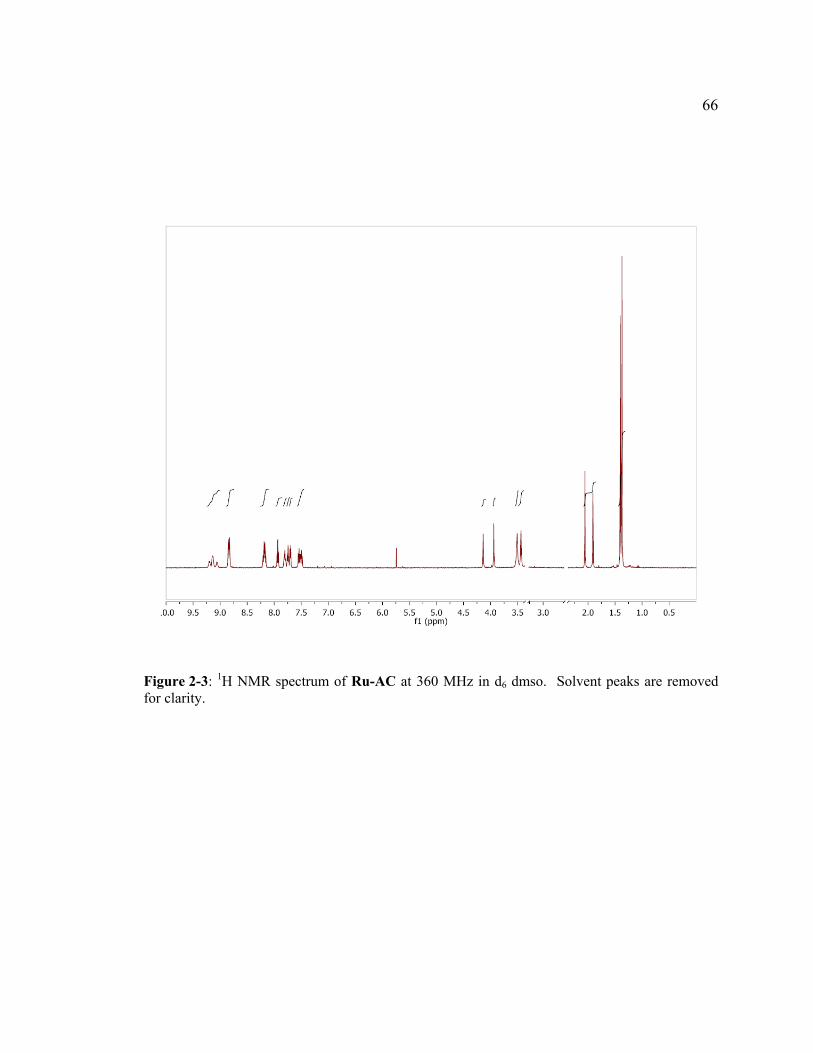
66
Figure 2-3: 1H NMR spectrum of Ru-AC at 360 MHz in d6 dmso. Solvent peaks are removed for clarity.

67
2.2.2.7 Synthesis of [Ru(bpy)2(Mebpy[aeg-OtButyl])](NO3)2 (Ru-SS0).
A solution of 1.3 g (3.5 mmol) 6 and 1.45 g (3 mmol) Ru(bpy)2Cl2 was refluxed in 100
mL ethanol overnight under N2. The product was purified over silica using 5:4:1 CH3OH: H2O:
sat. KNO3 (aq) following procedures for Ru-0. The solvent was removed to give 1.3 g of red
solid (1.4 mmol; 47% yield). 1H NMR, 400 MHz, d6 dmso: 1.42 (s, 9H); 2.56 (s, 3H); 3.13 (t,
2H), 3.30 (s, 2H); 3.53 (q, 2H); 7.42 (d, 1H); 7.50 (m, 4H); 7.58 (d, 1H); 7.71 (m, 3H); 7.76 (m,
2H); 7.9 (d, 1H); 8.15 (m, 4H); 8.78 (s, 1H); 8.82 (d, 4H); 9.08 (s, 1H); 9.21 (t, 1H). (Secondary
amine protons not observed.)27 MS (ESI+) [M2+ + 1NO3-] cald 846.2; found 846.2.
2.2.2.8 Synthesis of [Ru(bpy)2(Mebpy[aeg-(bpy)OtButyl])](NO3)2 (Ru-SS).
A solution of 0.251 g 4'-methyl-2,2'-bipyridine-4-acetic acid (1.10 mmol), 0.161 g (1.05
mmol) HOBT, 0.397 g (1.05 mmol) HBTU, and 0.37 mL diisopropylethylamine (2.2 mmol) in
175 mL CH2Cl2 was stirred for 15 min at 0°C. After this time, 0.50 g (0.55 mmol)
[Ru(bpy)2(Mebpy[aeg-OtButyl])](NO3)2 was added and the resulting red solution was stirred
overnight under N2. The solvent was removed by rotary evaporation; the red residue was
dissolved in a minimal amount of CH3CN and filtered to remove excess 4'-methyl-2,2'-
bipyridine-4-acetic acid. The solvent was removed and the red reside purified by silica using
10% MeOH/CH2Cl2 and then with 5:4:1 CH3CN: H2O: sat. KNO3 (aq) to elute the product,
isolated according to the method for Ru-1. A 0.34 g amount (0.30 mmol) (49%) was collected.
1H NMR, 400 MHz, d6 dmso (Figure 2-4): 1.35 (d, 9H); 2.34 (d, 3H); 2.49 (d, 3H); 3.33 (s, 1H);
3.45 – 3.67 (m, 4H); 3.76 – 4.35 (s – s , 3H); 7.23 (m, 2H); 7.39 (d, 1H); 7.54 (m, 5H); 7.68 –
7.91 (m – m, 6H); 8.06 – 8.30 (s – s, 6H); 8.44 (m, 2H); 8.67 (s, 1H); 8.85 (d, 4H); 8.97 (s, 1H);

68
Figure 2-4: 1H NMR spectrum of Ru-SS at 400 MHz in d6 dmso. Solvent peaks are removed for clarity.

69
9.16 (t, 1H). MS (ESI+) [M2+] calc 497.2; found 497.2. HRMS (ESI+) [M2+ + NO3-] calcd for
C53H52N11O7Ru, 1056.3095; found 1056.3192.
2.2.3 Methods.
UV-vis absorbance spectra were obtained with a double-beam spectrophotometer
(Varian, Cary 500). Positive-ion electrospray mass spectrometry (ESI+) was performed at the
Penn State Mass Spectrometry Facility using a Mariner mass spectrometer (Perspective
Biosystems). All NMR spectra were collected on either 300, 360, or 400 MHz spectrometers
(Bruker). Emission spectra were measured at room temperature using a Photon Technology
Instrument (PTI) using an 814 photomultiplier detection system. Time resolved emission was
monitored following excitation from a PTI N2 dye laser (model GL-302) averaging 20 decays
with a 50 µs collection time per point. The solutions of such were dearated with N2 gas.
Quantum yields were determined using literature methods28 by measuring the absorbance and
emission spectra of each compound in deaerated solutions at least 5 concentrations and correcting
for the instrument response.
All electrochemical measurements were obtained using a CH Instruments potentiostat
(Model 660) with 0.31 cm diameter glassy carbon working and Pt wire counter electrodes with a
Ag quasi reference electrode. Solutions were prepared from distilled CH3CN containing 0.2 M
tetrabutylammonium perchlorate supporting electrolyte that was recrystallized twice from
ethylacetate. The solutions were prepared, stored, and analyzed in a N2 saturated environment.
Spectrophotometric emission titrations were conducted in CH3CN or MeOH solutions at
room temperature in the presence of air using known concentrations of Ru compounds (~ 1 x 10⁻⁴
M). The compounds were excited at their maximum MLCT absorbance and monitored at their
maximum emission wavelength. Spectra were taken after serial addition of small aliquots (~ 10

70
µL) of Cu2+ in CH3CN or Zn2+ solution in CH3OH (~ 5 x 10⁻³ M). The mixtures were stirred for
10 min before spectra were measured. Aliquots of the titration solutions were examined by mass
spectrometry. Ru-1 + Cu(acetate)2: MS (ESI+) [M4+ + 1 acetate] calcd 504.09; found 504.09.
Ru-1 + Zn(acetate)2: MS (ESI+) [M4+] calcd 363.6; found 363.6.
2.2.4 General Procedure for Coordination and Isolation of Heterometallic Complexes.
A slight excess of copper (II) nitrate dissolved in water was added to a solution of the
Ru-1 in water. The solution was allowed to stir for 30 min. After this time, a saturated solution
of NH4PF6 was added, producing a dark-red precipitate. The solid was collected by filtration,
rinsed with water to remove excess metal and PF6- ions, and then further dried with diethyl ether.
The (Ru-SS)2-Cu complex was analogously prepared and isolated. [(Ru-1)-Cu](PF6)4 MS
(ESI+) [M4+ + 2 PF6-] calcd 871.7; found 871.7. 1H NMR, 400 MHz, CD3CN (Figure 2-5): 1.39
(s, 18H); 2.27 (s, 6H); 3.56 (s, 8H); 3.99 (s, 3H); 4.15 (s, 1H); 7.43 (s, 4H); 7.71 (s, 8H); 7.90 (s,
2H); 8.09 (s, 4H); 8.52 (s, 4H); 8.84 (s, 2H). Elemental Analysis Calculated: 43.70 C; 3.77 H;
9.64 N; 4.97 Ru; 3.12 Cu. Found: 43.20 C; 3.72 H; 9.70 N; 4.96 Ru; 3.16 Cu. [(Ru-SS)2-
Cu](PF6)6 1H NMR, 400 MHz, CD3CN (Figure 2-6): 1.33 (s, 18H); 2.51 (d, 6H); 3.19 – 3.76 (s,
12H); 3.86 – 4.44 (d, 4H); 7.06 (s, 2H); 7.39 (s, 2H); 7.50 (s, 10H); 7.56 (d, 2H); 7.65 – 7.80 (m,
10H); 7.86 (s, 2H); 8.14 (s, 8H); 8.70 (s, 2H); 8.80 (d, 8H); 8.99 (s, 2H). Elemental Analysis
Calculated: 43.58 C; 3.59 H; 9.59 N; 6.92 Ru; 2.18 Cu. Found: 40.84 C; 3.44 H; 9.44 N; 6.62
Ru; 2.15 Cu.
The (Ru-1)-Zn complex was similarly prepared, however because Zn(PF6)2 is insoluble
in water, following addition of only 1 molar equivalent of zinc (II) acetate, NH4PF6 was added
and the solid filtered to give the red product. This powder was washed with H2O and ether,
redissolved in CH3CN, and then filtered again to remove unreacted Zn(PF6)2. The solvent was

71
Figure 2-5: 1H NMR spectrum of [(Ru-1)-Cu](PF6)4 at 400 MHz in CH3CN. Solvent peaks are removed for clarity.

72
Figure 2-6: 1H NMR spectrum of [(Ru-SS)2-Cu](PF6)6 at 400 MHz in CH3CN. Solvent peaks are removed for clarity.

73
Figure 2-7: 1H NMR spectrum of [(Ru-1)-Zn](PF6)4 at 400 MHz in CH3CN. Solvent peaks are removed for clarity.

74
Figure 2-8: 1H NMR spectrum of [(Ru-SS)2-Zn](PF6)6 at 400 MHz in CH3CN. Solvent peaks are removed for clarity.

75
removed under vacuum to give the dry solid for elemental analysis. [(Ru-1)-Zn](PF6)4 1H
NMR, 400 MHz, CD3CN (Figure 2-7): 1.39 (m, 18H); 2.21 (s, 4H); 2.57 (d, 6H); 3.47 – 3.80
(mm, 8H); 3.89 – 4.32 (mm, 8H); 7.34 – 7.48 (m, 8H); 7.58 – 7.75 (m, 10H); 7.80 – 7.94 (m,
4H); 8.03 – 8.13 (q, 4H); 8.32 – 8.42 (m, 2H); 8.46 – 8.55 (m, 6H); 8.70 – 8.89 (m, 2H).
Elemental Analysis Calculated: 43.66, C; 3.76, H; 9.63, N; 4.96, Ru; 3.21, Zn. Found: 44.12, C;
3.83, H; 10.33, N; 5.02, Ru; 2.51, Zn. MS (ESI+) [M4+ + 2 PF6-] calcd 872.2; found 872.2.
2.3 Results and Discussion
2.3.1 Syntheses.
We have shown previously that stoichiometric binding of transition metals to artificial
oligopeptides leads to the formation of stable duplexes in which the metals crosslink two aeg
strands.8-11 Based on those initial studies, we recognized that a major design consideration is the
prevention of strand misalignment and formation of parallel and antiparallel isomers (Scheme 2-
1A). Using DNA and RNA hairpin loops for inspiration as a structural motif, we aimed to
synthesize the artificial oligopeptides in Scheme 2-1B, which would bind a four-coordinate metal
ion, closing a bpy-containing aeg ‘hairpin’. To demonstrate this approach, the building block
compound 1, which contains two aminoethyl glycine chains attached at the 4 and 4’ positions on
the bipyridine ligand, was synthesized. Key aspects of 1 are the ability of the bipyridine ligand to
coordinate a metal ion while the secondary amines in the aeg strands are available for amide
coupling chemistry to carboxylic acid-containing functional groups. Terminal acids on the aeg
strands remain t-butyl protected but could be used for further extension and elaboration of the

76
chains. Scheme 2-2 contains the two synthetic strategies that have initially been used to make the
inorganic hairpin complexes. Reaction of 1 with Ru(bpy)2Cl2 affords the aeg disubstituted Ru
tris(bipyridine) complex Ru-0 in 66% yield following purification by silica gel chromatography.
High resolution mass spectrometry reveals the expected molecular ion peak for Ru-0 and analysis
by 1H NMR spectroscopy unequivocally confirms its purity (Figure 2-1). Addition of excess
4’methyl-2,2’-bipyridine-4-acetic acid to Ru-0 with HBTU, HOBT, and diisopropylethylamine
(DIPEA) slowly forms Ru-1 over the course of two days. Pure product in 83% yield is again
obtained by column chromatography, with identification confirmed by high resolution mass
spectrometry. Integration of the peaks in the 1H NMR spectrum verifies the purity of Ru-1;
additional peaks from the pendant bpy ligands, together with hindered rotation of these around
the amide bond, cause the spectrum to become more complex (see Figure 2-2) which has been
observed previously in substituted aeg oligomers.10 Following the design in Scheme 2-1B, Ru-1
contains two free bipyridine ligands available for coordination to added metal ion. Although an
identical synthetic method could be used, the double-stranded control molecule Ru-AC with
pendant acetyls in place of the free bpy ligands was synthesized in the parallel route shown in
Scheme 2-2. Purification of 4 by column chromatography was empirically determined to be
more facile than separation of Ru-1 from Ru-AC. Therefore, ligand 4 was first synthesized by
coupling acetic acid to 2 with EDC, HOBT, and DIPEA. Pure product was obtained in 70% yield
and analytically confirmed by mass spectrometry and 1H NMR (Figure 2-3). This was
subsequently reacted with Ru(bpy)2Cl2 to form the tris(bipyridine) analog Ru-AC which was
isolated in 43% yield.
Ru complexes containing single aeg chains (i.e. “single stranded”) were also synthesized
according to the steps shown in Scheme 2-3 for comparison to the “double-stranded” Ru hairpins
(Ru-1 and Ru-AC) . To prepare these the monosubstituted bipyridine ligand 6 was synthesized
from 4-(chlorocarbonyl)-4’-methyl-2,2’-bipyridine and aminoethylglycine. Following

77
Scheme 2-2: Synthetic steps toward Ru hairpin complexes. i) Δ 90% ethanol; overnight. ii) HOBT, HBTU, DIPEA, in CH2Cl2; 2 days. iii) HOBT, EDC, DIPEA, in CH2Cl2; 2 days.

78
Scheme 2-3: Synthetic steps toward single stranded complexes. i) Δ 90% ethanol; overnight. ii)HOBT, HBTU, DIPEA, in CH2Cl2; 2 days.

79
purification, this was reacted with Ru(bpy)2Cl2 to form complex Ru-SS0. This was purified by
column chromatography and fully characterized before coupling 4’methyl-2,2’-bipyridine-4-
aecetic acid to the free secondary amine on the aeg. The resulting complex Ru-SS was made,
purified, and isolated in 49% yield, and confirmed by mass spectrometry and 1H NMR (Figure 2-
4).
2.3.2 Formation of Heterometallic Complexes.
In compounds Ru-1 and Ru-SS, the aminoethylglycine arms contain free bipyridine
ligand(s) that can be used to coordinate to a second transition metal. Both Cu2+ and Zn2+ form
bis(bipyridyl) complexes29-31 so that it was expected that addition of either metal ion to Ru-1 or
Ru-SS would result in formation of these complexes, testing the hairpin strategy for making
hetero- and multimetallic aeg-linked structures. Scheme 2-4A and 2-4B schematically depict the
multimetallic structures that are envisaged following coordination of Cu2+ or Zn2+ in the Ru-1
hairpin and Ru-SS single-stranded complexes, respectively. Molecular modeling predicts that
these structures would hold bound Cu and Zn in close proximity (~7 Å) to the Ru(bpy)3 complex;
in the case of Cu2+ this would be expected to impact the photophysical behavior of the Ru
complex.32-35
Figures 2-9 and 2-10 contain the aromatic regions of the 1H NMR spectra for Ru-1, Ru-
SS, and their respective heterometallic complexes. Comparison of the spectra for Ru-1 and (Ru-
1)-Zn (Figure 2-9A and 2-9 B) reveals that the major differences are shifts of the peaks
associated with the free bipyridine ligands in Ru-1 (7.0-7.2, 7.75 – 7.8, and 8.2 – 8.35 ppm) that
are attributed to coordination of Zn2+. In contrast, the peaks in the 1H NMR spectrum of (Ru-1)-
Cu (Figure 2-9C) are significantly broadened as a result of coordination to the paramagnetic Cu2+
ion, and the peaks from the pendant bipyridines are shifted out of the spectral window. Further

80
4-coordinate metal (Cu, Zn etc)
Bipyridine-based linker
Free bipyridine
Ru(bpy)32+
A)
B)M2+
M2+
M2+
Scheme 2-4: Coordination geometries of compounds Ru-1 and Ru-SS.
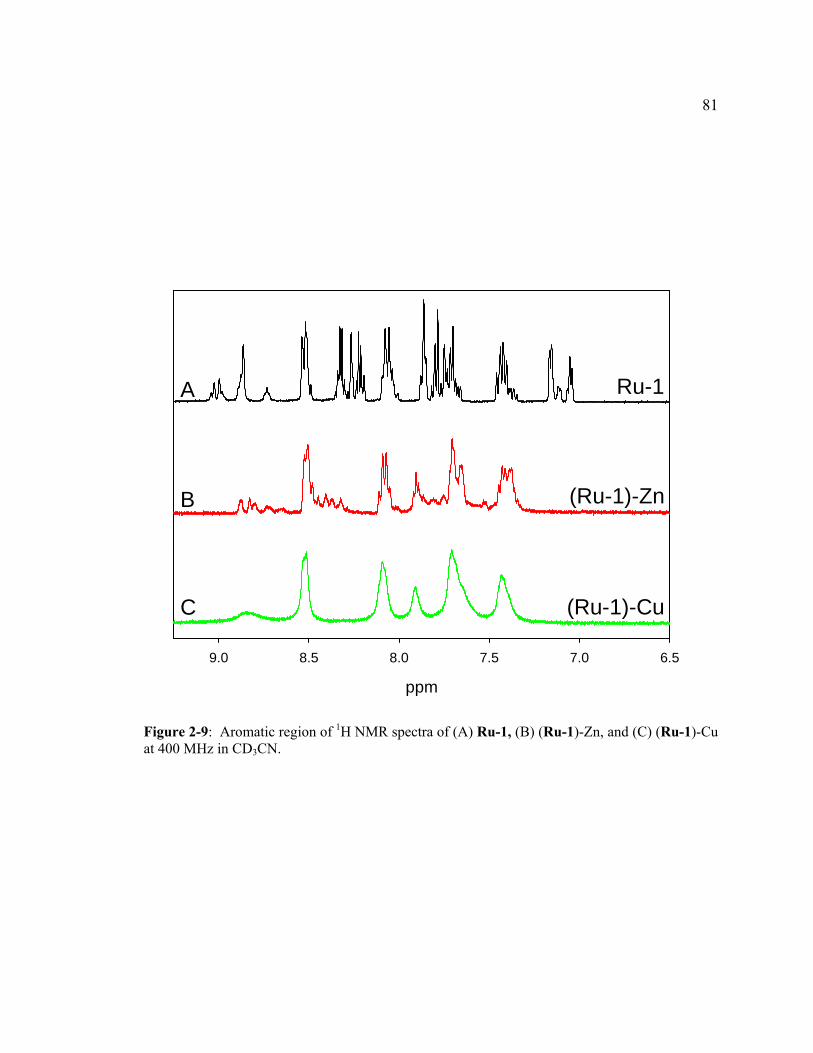
81
ppm
6.57.07.58.08.59.0
A
B
C
Ru-1
(Ru-1)-Zn
(Ru-1)-Cu
Figure 2-9: Aromatic region of 1H NMR spectra of (A) Ru-1, (B) (Ru-1)-Zn, and (C) (Ru-1)-Cu at 400 MHz in CD3CN.

82
ppm
6.57.07.58.08.59.09.5
A
B
C
Ru-SS
(Ru-SS)2-Zn
(Ru-SS)2-Cu
Figure 2-10: Aromatic region of 1H NMR spectra of (A) Ru-SS, (B) (Ru-SS)2-Zn, and (C) (Ru-SS)2-Cu at 400 MHz in d6 dimethylsulfoxide.
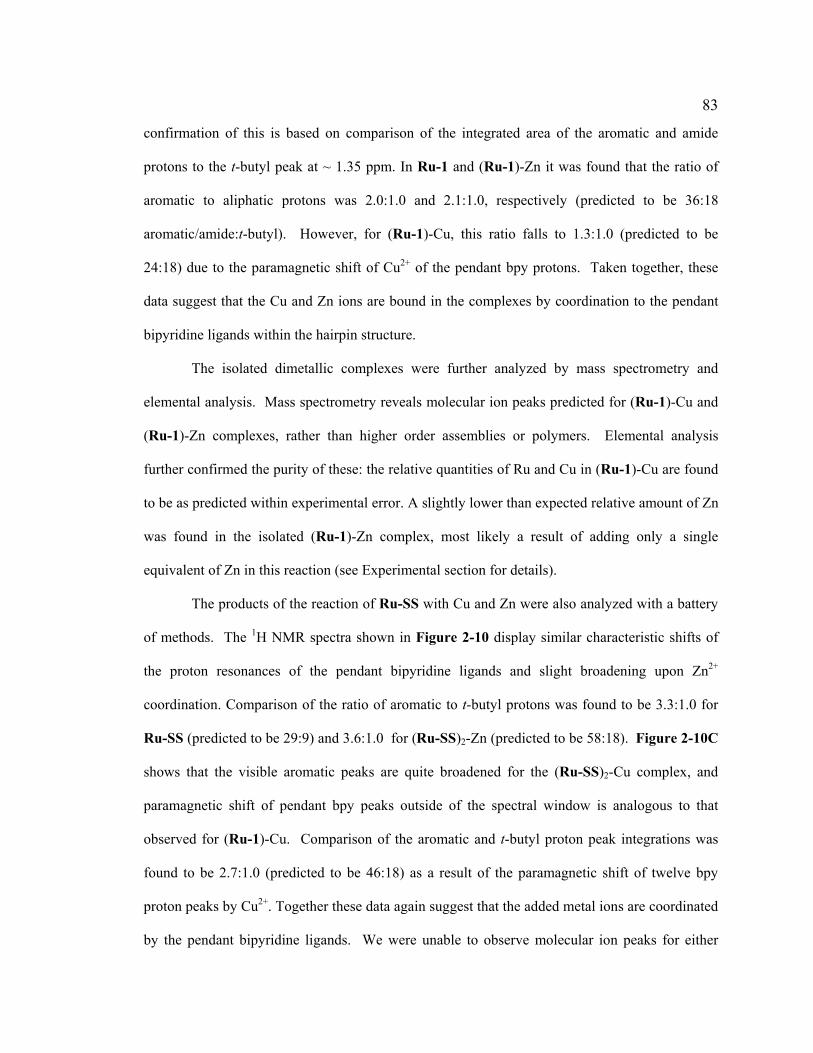
83
confirmation of this is based on comparison of the integrated area of the aromatic and amide
protons to the t-butyl peak at ~ 1.35 ppm. In Ru-1 and (Ru-1)-Zn it was found that the ratio of
aromatic to aliphatic protons was 2.0:1.0 and 2.1:1.0, respectively (predicted to be 36:18
aromatic/amide:t-butyl). However, for (Ru-1)-Cu, this ratio falls to 1.3:1.0 (predicted to be
24:18) due to the paramagnetic shift of Cu2+ of the pendant bpy protons. Taken together, these
data suggest that the Cu and Zn ions are bound in the complexes by coordination to the pendant
bipyridine ligands within the hairpin structure.
The isolated dimetallic complexes were further analyzed by mass spectrometry and
elemental analysis. Mass spectrometry reveals molecular ion peaks predicted for (Ru-1)-Cu and
(Ru-1)-Zn complexes, rather than higher order assemblies or polymers. Elemental analysis
further confirmed the purity of these: the relative quantities of Ru and Cu in (Ru-1)-Cu are found
to be as predicted within experimental error. A slightly lower than expected relative amount of Zn
was found in the isolated (Ru-1)-Zn complex, most likely a result of adding only a single
equivalent of Zn in this reaction (see Experimental section for details).
The products of the reaction of Ru-SS with Cu and Zn were also analyzed with a battery
of methods. The 1H NMR spectra shown in Figure 2-10 display similar characteristic shifts of
the proton resonances of the pendant bipyridine ligands and slight broadening upon Zn2+
coordination. Comparison of the ratio of aromatic to t-butyl protons was found to be 3.3:1.0 for
Ru-SS (predicted to be 29:9) and 3.6:1.0 for (Ru-SS)2-Zn (predicted to be 58:18). Figure 2-10C
shows that the visible aromatic peaks are quite broadened for the (Ru-SS)2-Cu complex, and
paramagnetic shift of pendant bpy peaks outside of the spectral window is analogous to that
observed for (Ru-1)-Cu. Comparison of the aromatic and t-butyl proton peak integrations was
found to be 2.7:1.0 (predicted to be 46:18) as a result of the paramagnetic shift of twelve bpy
proton peaks by Cu2+. Together these data again suggest that the added metal ions are coordinated
by the pendant bipyridine ligands. We were unable to observe molecular ion peaks for either

84
(Ru-SS)2-Cu or (Ru-SS)2-Zn; similar to our prior observations of other trimetallic oligopeptides,
which is most likely a result of inefficient ionization or lack of gas phase stability of the highly
charged (+6) complex. Although the low observed mass percent of C is likely the result of small
salt impurity, the elemental analysis results have the expected mass Ru:Cu ratio, confirming that
the isolated material contains 2 Ru for each Cu ion. The presence of only one pendant ligand per
Ru complex rules out the possibility that these are coordination polymers, so that even in the
absence of mass spectral data, the elemental analysis and NMR provide strong evidence that the
product is (Ru-SS)2-Cu as in Scheme 2-4B.
2.3.3 Electrochemistry.
Because the redox properties of [Ru(bpy)3]2+ complexes are well known, cyclic
voltammetry was used to further characterize the three aeg-substituted complexes Ru-1, Ru-AC
and Ru-SS. Electrochemical data for each of these in acetonitrile solutions are collected in Table
2-1. Ru-1 and Ru-AC exhibit single one-electron oxidative waves at 1.46 V and 1.45 V,
respectively, that are attributed to the Ru (III/II) reaction; this reaction is observed at slightly
lower oxidative potential (1.27 V) in Ru-SS. A series of reduction reactions is observed for each
of the complexes; these are assigned to one-electron bpy-centered reductions that vary in formal
potential based on the substitution of the ligand. The first three observed reductions are assigned
to the ligands coordinated to the Ru metal center; more reductive potentials are required to reduce
the pendant, uncoordinated bpy ligands in Ru-1 and Ru-AC. For example, the first reduction of
Ru-1 and Ru-AC occurs at -1.01 V and -0.98 V and is assigned to the di-substituted aeg
bipyridine because the electron withdrawing nature of the amides lowers the necessary
overpotential to reduce the ligand. The two subsequent reductions at -1.36 and -1.56 V are

85
Table 2-1: Electrochemical characterization of compounds Ru-1, Ru-AC, and Ru-SS.
aPotentials were measured in 0.2 M tetrabutylammonium perchlorate in dearated CH3CN vs. Ag quasi reference electrode.
Ru-1 Ru-AC Ru-SS E Ru3+/2+
(V)a 1.46 1.45 1.27 E Ru2+/1+
(V)a -1.01 -0.98 -1.27 E Ru1+/0
(V)a -1.36 -1.34 -1.50 E Ru0/-1
(V)a -1.56 -1.57 -1.75

86
assigned to the two remaining bpy ligands on the Ru center. In comparison the first bpy
reduction of compound Ru-SS occurs at -1.27 V, and is assigned to the bipyridine containing one
methyl and one amide group, which is shifted from Ru-1 and Ru-AC because it contains only a
single amide; the remaining two reductions of Ru-SS occur at -1.50 and -1.74 V.
2.3.4 Absorbance and Emission Spectra.
Absorption and emission spectra of the three Ru complexes were also obtained in
acetonitrile solutions for comparison of their photophysical properties; these data are collected
and summarized in Table 2-2. Complexes Ru-1 and Ru-AC have identical visible absorption
maxima (λabs, max) at 469 nm that are a result of a metal-to-ligand charge transfer (MLCT). This is
consistent with the equivalent oxidation and reduction potentials for these two compounds; in
both cases absorption at the maximum MLCT absorbance causes an electron transfer from the
central metal atom to one of the bpy ligands. Based on the relative formal potentials, the
equilibrated, lowest energy product is [RuIII(bpy)2(bpy(aeg(X)2)•-]2+* (X is bpy or acetyl in Ru-1
and Ru-AC, respectively), i.e. with the radical electron on the aeg-substituted bpy. In contrast,
the MLCT band for Ru-SS is slightly blue-shifted and appears at 456 nm, consistent with the
more negative reduction potential of the monosubstituted aeg-bpy.
Analogous trends are observed in the emission spectra of the three complexes following
excitation at their MLCT maxima; the emission maximum (λem, max) of Ru-1 and Ru-AC are both
centered at 650 nm whereas Ru-SS appears at a slightly higher energy (632 nm). Emission
quantum yields (Ф) of the complexes in thoroughly deaerated solutions were determined using
established procedures and with the known quantum yield of Ru(bpy)32+ as a standard.28 The data
in Table 2-2 shows that the quantum yields for all three compounds are essentially equivalent
within experimental error.

87
Table 2-2: Photophysical Data for Ru Hairpins.
a Visible absorption maximum wavelength (MLCT) in acetonitrile solution. b Emission maximum wavelength in deaerated acetonitrile solutions following excitation at maximum MLCT absorbance. c Emission quantum yields following excitation at the MLCT maximum, calculated using Ru(bpy)3
2+ in CH3CN (Φ=0.062) as a reference.45 d
Excited state lifetimes in deaerated acetonitrile solutions, determined from the fit of the exponential decay of theemission at the peak wavelength for each complex. e Rate of radiative decay and f rate of nonradiative decay,calculated using τ-1=kr + knr and Φ = kr/(kr + knr).
Ru-1 Ru-AC Ru-SS M2+ - Cu Zn - Cu Zn - Cu Zn
λabs, max (nm)a 469 469 456 λem, max (nm)b 650 650 632
Фc 0.045 ± 0.004
0.0029 ±
0.0001
0.039 ± 0.003
0.040 ± 0.003
- - 0.043 ± 0.003
0.0015 ± 0.0001
0.044 ±
0.004
τd (µsec) 1.25 ± 0.02
0.035 ± 0.001
1.33 ± 0.02
1.22 ± 0.02
0.99 ± 0.01
1.11 ± 0.02
1.42 ± 0.02
0.019 ± 0.001
1.43 ± 0.01
kr x 104 (sec)-1e 3.6 8.3 2.9 3.3 - - 3.0 7.9 3.1 knr x 107 (sec)-1
f 0.076 2.8 0.072 0.079 - - 0.067 5.2 0.067
88
2.3.5 Spectrophotometric Emission Titrations.
To examine the impact of metal ion coordination by the bpy-modified aeg strands on the
spectroscopic behavior of the attached Ru complexes, the emission spectra were monitored
following sequential addition of aliquots of Cu2+ or Zn2+. Figure 2-11A shows the emission
spectra of the double-stranded Ru-1 in acetonitrile as Cu2+ solution is added to the cuvette. The
emission peak intensity sequentially decreases as Cu2+ is added, but the peak wavelength does not
change. The Figure 2-11A inset shows the analogous data for the experiment with Zn2+
additions, in which a relatively smaller decrease in the emission intensity is observed. These
decreases in emission are shown quantitatively in Figure 2-11B, which plots the decreases in
intensity at 650 nm versus the volume of added metal titrant solution and the control experiment
using equivalent aliquots of acetonitrile. The latter confirms that observed decrease in emission
intensity is not a result of dilution of the Ru complex.
A striking difference between the titrations with metal ions is the nearly complete
quenching of Ru-1 (by 97%) after serial addition of Cu2+ versus only ~ 13% quenching upon
addition of Zn2+. By plotting these data as the relative molar ratio of metal ion to Ru2+ (upper
axis), it is apparent that addition of Cu2+ and Zn2+ causes a decrease in emission until the solution
contains a metal to Ru ratio of 1.05:1 and 1.04:1, respectively. Further additions of metal ion do
not impact the intensity. The stoichiometric ratios provided by these titration curves are strong
evidence for formation of the complexes shown in Scheme 2-4. To confirm the identity of these
species, the products of the Cu and Zn titration reactions of Ru-1 were analyzed by mass
spectrometry and compared to the results for the bulk scale preparations of the heterometallic
complexes (vide supra). In both cases, the mass spectrometry data of the titration products reveal

89
Volume added (L)
0 20 40 60 80 100 120 140
Nor
mal
ized
Em
issi
on In
tens
ity
0.0
0.2
0.4
0.6
0.8
1.0
Moles M2+/Ru2+
0.0 0.2 0.4 0.6 0.8 1.0 1.2 1.4 1.6 1.8
wavelength (nm)
550 600 650 700 750 800 850
Nor
mal
ized
Em
issi
on
Inte
nsity
0.0
0.2
0.4
0.6
0.8
1.0
wavelength (nm)600 700 800
Nor
m.
Em
. In
t.
0.00
0.25
0.50
0.75
1.00
A
BCu
Zn
solvent only
Figure 2-11: (A) Emission spectra of 0.14 mM Ru-1 in acetonitrile upon incremental additions of 5 µL of 5.3 mM Cu(NO3)2 in CH3CN. Inset: Emission spectra of 0.15 mM Ru-1 in methanol upon addition of 10 µL aliquots of 6.7 mM Zn(Ac)2 in methanol. (B) Plot of emission intensity at λem,max = 650 nm (λex = 469 nm) versus the volume of added metal salt solution (5.3 mM Cu2+
●; 6.7 mM Zn2+ ○) and pure CH3CN (■); and versus the relative ratio of added metal ion to Ru2+. Titration curves are normalized to the initial Ru peak emission intensity.

90
the presence of molecular ion peaks associated with dimetallic (Ru-1)-Cu and (Ru-1)-Zn, which
result in the observed effects on the emission spectra.
For additional comparison, the spectrophotometric titration experiment was also
performed using the single-stranded complex; Figure 2-12A shows the emission titration
plots for addition of Cu2+, Zn2+, and acetonitrile to a cuvette containing compound Ru-SS in
acetonitrile. Addition of Cu2+ again causes a reduction in emission intensity analogous to that
observed for complex Ru-1 (Figure 2-12). However, addition of Cu2+ causes a serial decrease in
emission until the molar ratio of Cu to Ru is 0.52:1 (i.e., 1.9 Ru: 1 Cu), at which point the
intensity remains relatively constant. This ratio is consistent with the formation of the trimetallic
complex that is created by Cu bis(bipyridine) linking two Ru tris(bipyridine) complexes (vide
supra). In contrast to the data in Figure 2-12, addition of Zn2+ to Ru-SS does not cause a
significant decrease in emission intensity and its impact is equivalent to dilution with aliquots of
acetonitrile. A comparison of emission titrations between Ru-1 and Ru-SS is shown in Figure 2-
13.
We have previously used acetyl-modified structural analogs to assess the degree of
binding of metal ions to the aeg backbone versus pendant heterocyclic ligands.9 Compound Ru-
AC was synthesized with two acetyl groups in place of free bipyridine ligands on the aeg chains
as a control to examine if and how interactions of Cu2+ with the aeg chains impact emission.
Figure 2-12B shows that the emission intensity of complex Ru-AC gradually decreases as Cu2+
is titrated into the solution, however it does not reach a constant level even after two equivalents
of Cu have been added. Comparison of the shapes of the titration curves in Figures 2-11 – 2-12
for Cu2+ binding in Ru-1, Ru-AC, and Ru-SS shows a more shallow decent of the titration curve
in Figure 2-12B, which is likely a result of relatively weak binding to the aeg backbone in
complex Ru-AC.36

91
Moles Cu2+ / mole Ru2+
0.0 0.5 1.0 1.5 2.0
Nor
ma
lized
Em
issi
on In
tens
ity
0.0
0.2
0.4
0.6
0.8
1.0
Volume added (uL)
0 10 20 30 40 50 60 70
No
rmal
ize
d E
mis
sio
n In
tens
ity
0.0
0.2
0.4
0.6
0.8
1.0
Moles M2+/Ru2+
0.0 0.2 0.4 0.6 0.8 1.0 1.2 1.4
B
ACu
Zn solvent only
Figure 2-12: (A) Plot of the change in fluorescence emission of 0.21 mM Ru-SS in acetonitrile at λem,max = 632 nm (λex = 456 nm) as a function of added volume of metal salt solution (4.4 mMCu2+; 4.6 mM Zn2+ ) or CH3CN (■); and versus the relative ratio of added metal ion to Ru2+.Titration curves are normalized to the initial Ru peak emission intensity. (B) Plot of the change in fluorescence emission of 0.23 mM Ru-AC in aerated CH3CN λem,max 650 nm (λex = 469 nm) upon addition of 7 µL aliquots of 5.9 mM Cu(NO3)2 in CH3CN.

92
[Cu]total
0 5e-5 1e-4 1e-4 2e-4
Em
issi
on
Inte
nsity
(co
unts
)
0.0
2.0e+5
4.0e+5
6.0e+5
8.0e+5
1.0e+6
1.2e+6
Figure 2-13: Plot of emission intensity (counts) vs. total Cu(NO3)2 concentration for 0.14 mM Ru-1 and 0.21 mM Ru-SS in CH3CN.

93
2.3.6 Emission Properties of Heterometallic Complexes.
Emission quantum yields (Ф) were quantitatively obtained to directly compare the
relative degree of quenching due to coordination of added Zn2+ and Cu2+ by the free bpy ligands
in Ru-1 and Ru-SS. These data are collected in Table 2-2 and reveal that coordination of Cu2+
causes quenching of the emission of Ru-1 and Ru-SS by more than an order of magnitude.
Interestingly, although the (Ru-SS)2-Cu has only one Cu for two Ru complexes, the Cu2+ is able
to quench emission as efficiently as in (Ru-1)-Cu. This data suggests that the central Cu
bis(bipyridine) complex quenches both Ru tris(bpy) centers that it crosslinks. Although
picosecond transient absorption spectroscopy is outside the scope of this initial report, in similar
Ru-Cu systems the electron transfer rate can be very fast (ket ~ 4 x 10⁹ s-1)37,38 compared to Ru
excited state relaxation. It is possible that a single Cu2+ can quench first one and then the other
[Ru(bpy)3]2+* complex. Ongoing transient absorption spectroscopies are expected to provide
additional insight into these and more complex, higher nuclearity systems.
A consistently reproducible finding is that Zn2+ quenches emission of Ru-1 by 13%; the
quantum yield of (Ru-1)-Zn dimetallic complex is 3.9%. Analogous quenching in the (Ru-SS)2-
Zn complex is not observed. To further elucidate the photophysical properties of these systems,
the emission lifetimes (τ) of the Ru complexes before and after addition of Cu2+ and Zn2+ were
measured in deaerated solutions. Decays of the intensity at the emission maximum wavelength
following an 800 ps laser pulse at their respective MLCT maxima are shown in Figure 2-14 for
Ru-1, Ru-AC, and Ru-SS. These data were fit to a monoexponential decay to obtain the values
of τ listed in Table 2-2; all three complexes Ru-1, Ru-AC, and Ru-SS have long-lived
(microsecond) excited states typical for Ru(bpy)32+ complexes,17 and with the lowest energy
charge-separated species [RuIII(bpy)2(bpyaeg2•-)]2+*.

94
time (ns)
200 400 600 800 1000
Nor
mal
ized
Em
issi
on In
tens
ity
0.0
0.2
0.4
0.6
0.8
1.0
time (ns)
200 400 600 800 1000
Nor
mal
ized
Em
issi
on In
tens
ity
0.0
0.2
0.4
0.6
0.8
1.0
time (ns)
200 400 600 800 1000
Nor
mal
ized
Em
issi
on In
tens
ity
0.0
0.2
0.4
0.6
0.8
1.0
A
B
C
Figure 2-14: (A) Time-resolved emission at 650 nm following excitation at 469 nm of () 0.14 mM Ru-1 in nitrogen-purged CH3CN versus with the addition of one molar equivalent of either(▼) Zn(Ac)2 or (□) Cu(NO3)2. (B) Time-resolved emission at λem,max = 650 nm (λex = 469 nm) of () 0.23 mM Ru-AC, and following the addition of one molar equivalent of (□) Cu(NO3)2 or (▼) Zn(Ac)2 in nitrogen purged CH3CN. (C) Time-resolved emission at λem,max = 632 nm (λex = 456 nm) of () 0.21 mM Ru-SS, and following the addition of one-half molar equivalent of (□) Cu(NO3)2 or (▼) Zn(Ac)2.

95
Addition of Cu2+ dramatically decreases the emission lifetime, and the curve is best fit to
a biexponential decay. A solution containing the dimetallic (Ru-1)-Cu complex excited state
exhibits a fast 35 ns decay with a longer lifetime component of 1.15 µs. To investigate the origin
of these two components, the emission lifetimes were measured during the Cu titration of Ru-1
and complied in Table 2-3; Figure 2-15A shows the emission decays for Ru-1 with increasing
amounts of added Cu2+. Sub-stoichiometric additions of Cu to the Ru complex are best fit to
biexponential decays that are indicative of two species in solution (i.e. with a short and a long
lifetime). The relative contribution of the species with the long lived excited state decreases as the
amount of added Cu2+ increases; for example at a 1:1 stoichiometric ratio of Cu:Ru, the short
lifetime species contributes 98% of the overall emission decay. When 33% excess Cu is added
(i.e. 4 Cu:3 Ru) the emission decay is monoexponential and reveals a 30 ns lifetime indicative of
a single species in solution. Taken together, these data suggest a solution equilibrium between
Ru-1 and (Ru-1)-Cu, and that the shorter lifetime species is the (Ru-1)-Cu dimetallic complex.39
Analogously, the fit to trimetallic (Ru-SS)2-Cu is best fit to a biexponential decay
function with a short-lived 19 ns excited state and a component with lifetime of 1.38 µs; the
transient emission during titration (see Table 2-3 for complete list of τ) of Ru-SS with Cu2+ is
shown in Figure 2-15B. These data similarly suggest the presence of both bound and unbound
Cu2+ in the solution containing Ru-SS and again, the longer lifetime component is attributed to
uncomplexed Ru-SS.
Although coordination of Zn to Ru-3 causes modest quenching, its excited state lifetime
is not affected (τ = 1.33 µs). Analogously, the lifetime of (Ru-SS)2-Zn is equivalent to that for
Ru-SS. In contrast to Ru-1 and Ru-SS, the lifetime of the titration product of Ru-AC with Cu2+
remains relatively long lived (0.99 µs). This is consistent with either a lower local concentration
of Cu2+ due to weaker coordination or a larger separation of the Ru and Cu ions in this species.
Emission quenching can result from excited state electron transfer, energy transfer, or a

96
Figure 2-15: Decay of the emission intensity of dearated solutions of (A) 35 M Ru-1 (ex = 469 nm, em,max = 650 nm) containing the indicated molar ratio of Cu2+:Ru2+ following addition of 2.55 mM Cu(NO3)2 in CH3CN. (B) Transient emission of 50 M Ru-SS (ex = 456 nm, em,max = 632 nm) for solutions containing indicated amounts of Cu2+:Ru2+ following addition of 2.1 mM Cu(NO3)2 in CH3CN.
Time (ns)0 200 400 600 800 1000 1200
Co
unts
0
50
100
150
200
Time (ns)0 200 400 600 800 1000 1200
Co
unts
0
20
40
60
80
100
120
A B
0 Cu:1 Ru
0.3 Cu :1 Ru
0.6 Cu :1 Ru
1 Cu:1 Ru 1.3 Cu:1 Ru
0 Cu :1 Ru
0.17 Cu :1 Ru
0.33 Cu :1 Ru
0.5 Cu :1 Ru
0.66 Cu:1 Ru

97
Table 2-3: Summary of Lifetime titration data
Compound Cu:Ru
molar ratio Exponential
Decay Fit Lifetime(s)
(ns) (A) Ru-1 0:1 Single 1206 ± 75
1:3 Double 40 ± 3 (2.3 x 10³);
1114 ± 30 (1.1 x 10²)
2:3 Double 36 ± 3 (5.8 x 10²);
1033 ± 54 (5.6 x 101)
3:3 Double 30 ± 4 (1.0 x 10³); 1367 ± 200 (3.0)
4:3 Single 30 ± 3 Ru-SS 0:1 Single 1448 ± 52
1:6 Double 9 ± 2 (1.0 x 10⁴);
1445 ± 35 (8.5 x 101)
2:6 Double 25 ± 3 (5.1 x 10²);
1271 ± 247 (3.5 x 101)
3:6 Double 20 ± 5 (1.1 x 10²);
964 ± 84 (9.2)
4:6 Double 19 ± 3 (1.2 x 10³); 1359 ± 103 (6.8)

98
combination of both processes.40-43 Quenching of [Ru(bpy)3]2+* emission in the presence of Cu2+
can occur by excited state electron transfer from [RuIII(bpy)2(bpy•-)]2+* to form a charge-separated
state Ru3+ and Cu1+,17,38,44 but this can be experimentally challenging to confirm. Conversely, the
spectral overlap of the [Ru(bpy)3]2+ emission band with the (weak but) broad absorbance band of
[Cu(bpy)2]2+ can result in energy transfer quenching. In our Ru-Cu heterometallic complexes,
both of these are possible and likely excited state decay pathways. However, Zn bis(bipyridine) is
both spectroscopically and electrochemically silent so that it cannot quench [Ru(bpy)3]2+ emission
by either electron or energy transfer. Because of this, the modest quench that is observed in the
(Ru-1)-Zn complex (i.e. in the titration curve in Figure 2-11) could be due to a slight structural
destabilization caused by Zn2+ chelation. For example, the pincer action of the two pendant aeg
chains may require a twist or bow in the amide-functionalized bpy ligand. This is not observed in
the (Ru-SS)2-Zn complex because there is not an analogous steric constraint.
Using the excited state lifetimes and quantum yields, the rate constants for radiative (kr)
and non-radiative (knr) relaxation pathways were determined (Table 2-2). It is apparent from
these data that kr and knr are approximately the same for Ru-1 and (Ru-1)-Zn, and Ru-SS and
(Ru-SS)2-Zn. These are consistent with equivalent excited state decay pathways in this series of
complexes. However, Cu chelation by both Ru-1 and Ru-SS causes a dramatic (1000x) increase
in knr, indicative of a new, fast relation pathway. We are currently undertaking spectroscopic
investigations on picosecond timescales to understand the relaxation pathways and mechanisms
in these and the heterometallic Ru-Cu complexes.

99
2.4 Acknowledgments
We gratefully acknowledge financial support of this work by a Packard Fellowship for
Science and Engineering, and a grant from the National Science Foundation (CHE-0718373).
We thank C. Thode, C. Morgan, and J. Youngblood for helpful discussions.
2.5 References
1. Pfennig, B. W.; Goertz, J. K.; Wolff, D. W.; Cohen, J. L. Inorg. Chem. 1998, 37, 2608 –
2811.
2. Chakraborty, S.; Wadas, T. J.; Hester, H.; Flaschenreim, C.; Schmehl, R.; Eisenberg, R.
Inorg. Chem. 2005, 44, 6284 – 6293.
3. Larson, S. L.; Elliot, C. M.; Kelley, D. F. J. Phys. Chem. 1995, 99, 6530 – 6539.
4. Tamiaki, H.; Miyatake, T.; Tanikaga, T.; Holzwarth, A. R.; Schaffner, K. Angew. Chem. Int.
Ed. Engl. 1996, 35, 772 – 774.
5. Wasielewski, M. R. J. Org. Chem. 2006, 71, 5051 – 5066.
6. Rybtchinski, B.; Sinks, L. E.; Wasielewski, M. R. J. Am. Chem. Soc. 2004, 126, 12268 –
12269.
7. Wasielewski, M. R. Chem. Rev. 1992, 92, 435 – 461
8. Gilmartin, B. P.; Ohr, K.; McLaughlin, R. L.; Koerner, R.; Williams, M. E. J. Am. Chem.
Soc. 2005, 127, 9546-9555.
9. Ohr, K.; Gilmartin, B. P.; Williams, M. E. Inorg. Chem. 2005, 44, 7876-7885.

100
10. Ohr, K.; McLaughlin, R. L.; Williams, M. E. Inorg. Chem. 2007, 46, 965-974.
11. Gilmartin, B. P.; McLaughlin, R. L.; Williams, M. E. Chem. Mater. 2005, 17, 5446 – 5454.
12. Borer, P. N.; Uhlenbeck, O. C.; Dengler, B.; Tinaco, I. J. Mol. Bio. 1973, 73, 483 – 496.
13. Hilbers, C. W.; Haasnoot, C. A. G.; de Bruin, S. H.; Joordens, J. J. M.; Van der Marel, G. A.;
Van Boom, J. H. Biochimie. 1985, 67, 685 – 695.
14. Lewis, F. D.; Helvoigt, S. A.; Letsinger, R. L. Chem. Commun. 1999, 327 – 328.
15. Egli, M.; Tereshko, V.; Mushudov, G. N.; Sanishvili, R.; Liu, X.; Lewis, F. D. J. Am. Chem.
Soc. 2003, 125, 10842 – 10849.
16. Geiber, B.; Alsfasser, R. Eur. J. Inorg. Chem. 1998, 957 – 963.
17. Kalyanasundaram, K. Coord. Chem. Rev. 1982, 46, 159 – 244.
18. Serron S. A.; Aldridge, W. S.; Fleming, C. N.; Danell, R. M.; Baik, M. H.; Sykora, M.;
Dattelbaum, D. M.; Meyer, T. J. J. Am. Chem. Soc. 2004, 126, 14506 – 14514.
19. Borgstrom, M.; Ott, S.; Lomoth, R.; Bergquist, J.; Hammarstrom, L.; Johansson, O. Inorg.
Chem. 2006, 45, 4820 – 4829.
20. Sullivan, B. P.; Salmon, D. J.; Meyer, T. J. Inorg. Chem. 1978, 17, 3334-3341.
21. Ko, C. C.; Wu, L. X.; Wong, K.; Zhu, N.; Wing-Wah Yam, V. Chem. Eur. J. 2004, 10, 766-
776.
22. Bondebjerg, J.; Grunnet, M.; Jespersen, T.; Meldal, M. ChemBioChem. 2003, 4, 186-194.
23. Ciana, L. D.; Hamachi, I.; Meyer, T. J. J. Org. Chem. 1989, 54, 1731-1735.

101
24. McCafferty, D. G.; Bishop, B. M.; Wall, C. G.; Hughes, S. G.; Mecklenberg, S. L.; Meyer, T.
J.; Erickson, B. W. Tetrahedron. 1995, 51, 1093-1106.
25. Uppadine, L. H.; Redman, J. E.; Dent, S. W.; Drew, M. G. B.; Beer, P. D. Inorg. Chem.
2001, 40, 2860-2869.
26. Rowland, J. M.; Thornton, M. L.; Olmstead, M. M.; Mascharak, P. K. Inorg. Chem. 2001,
40, 1069 – 1073.
27. Lambert, J. B.; Mazzola, E. P. The Chemical Shift. Nuclear Magnetic Resonance
Spectroscopy; Pearson Education Inc: Upper Saddle River, NJ, 2004: pp 75 – 76.
28. Williams. A. T. R.; Winfield, S. A.; Miller, J. N. Analyst 1983, 108, 1067 – 1071.
29. Fabian, I.; Diebler, H. Inorg. Chem. 1987, 26, 925 – 928.
30. Hathaway, B. J.; Procter, I. M.; Slade, R. C.; Tomlison, A. A. G. J. Chem. Soc. 1969, 2219 –
2224.
31. Yasuda, M.; Sone, K.; Yamasaki, K. J. Phys. Chem. 1956, 60, 1667 – 1668.
32. Pellegrin, Y.; Quaranta, A.; Dorlet, P.; Charlot, M. F.; Leibl, W.; Aukauloo, A. Chem. Eur. J.
2005, 11, 3698 – 3710.
33. Bolletta, F.; Costa, I.; Fabbrizzi, L.; Licchelli, M.; Montalti, M.; Pallavicini, P.; Prodi, L.;
Zaccheroni. J. Chem. Soc., Dalton Trans. 1999, 1381 – 1385.
34. Geiber, B.; Alsfasser, R. Inorg. Chim. Acta. 2003, 348, 179 – 186.
35. Geiber, B.; Alsfasser, R. Dalton. Trans. 2003, 612 – 618.

102
36. Conners, K. A. Binding Constants: The Measurements of Molecular Complex Stability; John
Wiley and Sons: New York, NY, 1987.
37. Montalti, M.; Wadhwa, S.; Kim, W. Y.; Kipp, R. A.; Schmehl, R. H. Inorg. Chem. 2000, 39,
76 – 84.
38. Mellace, M. G.; Fagalde, F.; Katz, N. E.; Hester, H. R.; Schmehl, R. J. Photochem. Photobio.
2006, 181, 28 – 32.
39. Soler, M.; McCusker, J. K. J. Am. Chem. Soc. 2008, 130, 4708 – 4724.
40. Venturi, M.; Marchioni, F.; Ribera, B. F.; Balzani, V.; Opris, D. M.; Schluter, A. D. Chem.
Phys. Chem. 2006, 7, 229 – 239.
41. Furue, M.; Ishibashi, M.; Satoh, A.; Oguni, T.; Maryuama, K.; Sumi, K.; Kamachi. Coord.
Chem. Rev. 2000, 208, 103 – 113.
42. Hoselton, M. A.; Lim, C. T.; Schwarz, H. A.; Sutin, N. J. Am. Chem. Soc. 1978, 100, 2383 –
2388.
43. Hoffman, M. Z.; Bolletta, F.; Moggi, L.; Hug, G. L. J. Phys. Chem. Ref. Data 1989, 18, 219
– 543.
44. Demas, J. N.; Addington, J. W.; Peterson, S. H.; Harris, E. W. J. Phys. Chem. 1977, 81,
1039 – 1043.
45. Lu, W.; Chan, M. C. W.; Zhu, N.; Che, C. M.; Li, C.; Hui, Z. J. Am. Chem. Soc. 2004, 126,
7639 – 7651.

Chapter 3
NMR Investigations of Zn2+ Binding to Ru Hairpin Complexes.
3.1 Introduction
Mimicking nature’s ability to harness light energy is a challenge for the artificial
photosynthetic community and may reviews exist on the subject.1-4 One of the largest challenges
is the synthesis of donor-acceptor arrays with redox and spectroscopic properties that are
sufficiently tuned to allow excited state energy or electrons to be transferred from one site to
another. Because these multisite structures are often difficult to synthesize, systems with
interchangeable pieces (ligands, metal ions) offer the most versatility in tackling this challenge.
Our group synthesizes multifunctional oligopeptides that are capable of binding solution metal
ions to form one-dimensional molecular wires though the self-assembly of metal complexes.5-10
Using amide coupling chemistry we design oligopeptides with ligand sequences that dictate metal
coordination within our scaffolds. Among these we have described a series of aminoethylglycine
(aeg)-derivatized [Ru(bpy)3]2+ complexes11-12 that bind the solution metal ions Cu2+ and Zn2+, as
shown in the structures in Scheme 3-1 (See Chapter 2 for more details). Elemental analysis,
mass spectrometry, and 1H NMR spectroscopy, confirm that when both the Ru complex and
metal ion are present in solution, metal bis bipyridine complexes form and either close the hairpin
loop or crosslink two [Ru(bpy)3]2+ centers (Scheme 2-4). A consistent observation is that Zn2+
quenches [Ru(bpy)3]2+ emission by 26 % in Ru-1, but not Ru-SS (Figure 3-1).11 This is
unexpected since [Zn(bpy)2]2+ is both redox and spectroscopically silent, preventing both energy
and electron transfer quenching. We instead hypothesize that quenching is the result of structural
changes that occur during binding, and turn to NMR spectroscopy for experimental evidence.

104
Scheme 3-1: Structures of Ru-0, and Ru-SS, Ru-1, and Ru-M

105
Moles Zn2+ / Ru2+
0.0 0.2 0.4 0.6 0.8 1.0 1.2 1.4 1.6
Nor
mal
ized
Em
issi
on In
tens
ity
0.6
0.7
0.8
0.9
1.0
Figure 3-1: Plot of maximum peak emission intensity as a function of added Zn2+ for Ru-1 (●), Ru-SS (▲), and Ru-M (■) in CH3CN.

106
The use of NMR spectroscopy to measure metal binding into peptides, proteins, and synthetic
mimics has been widely used. For example, studies have examined the self-assembly and folding
of β-hairpins and polypeptides.13,14 In addition, the effects of metal binding on the NMR spectra
of peptide and peptide-like scaffold have been reported,15-17 as well as hydrogen bonding as a
result from metal-ligand interation.18
In both Ru-1 and Ru-SS, Zn2+ binds to pendant bpy ligands.11 However, binding to Ru-1
is more sterically confined, since formation of a [Zn(bpy)2]2+ complex may require twisting or
bending of the Ru-coordinated bridging bipyridine ligand (designated by arrows in Scheme 3-1
Ru-1), which may result in lower the quantum yield (Φ) of the complex. This is clearly not the
case for Ru-SS in which these steric constraints do not exist. This chapter contains initial work
aimed at understanding the observation that Zn(II) quenches Ru emission in Ru-1 but not in Ru-
SS and uses 1H and 13C NMR spectroscopy in conjunction with spectrophotometric titrations
during metal addition and binding, monitored with 1H NMR spectroscopy to determine solution
phase structure and measure metal binding. Further, Ru-M was synthesized as a structural analog
to simplify the hairpin structure and metal binding ro Ru-M was measured through identical
experiments and compared with Ru-1.
3.2 Methods
Mass spectrometric analysis was performed on a Waters LCT Premier time-of-flight
(TOF) mass spectrometer at the Penn State Mass Spectrometry Facility. Samples were
introduced into the mass spectrometer using direct infusion via a syringe pump. The mass
spectrometer was scanned from 100-2500 m/z in positive ion mode using electrospray ionization
(ESI+). NMR spectra were collected using 300, 360, or 400 MHz spectrometers (Bruker) in the
Lloyd Jackman Nuclear Magnetic Resonance Facility. Titrations performed in the NMR were

107
prepared by dissolving a known mass of Ru-peptide in either d6 dmso or d4 methanol (34 mM)
using a 400 MHz Bruker Spectrometer. A zinc acetate solution (~ 350 mM) was prepared
separately and incremental amounts were added to the Ru sample and shaken for 10 minutes.
Molar ratios were verified by comparison of integration ratios of the acetate anion and either the
tBu protons in Ru-1 or bpy-methyl protons in Ru-M. Temperature dependent NMR was
measured on a 300 MHz Bruker spectrometer in d6 dmso over a range from 25 – 120 °C taken in
temperature increments of ~ 20 °C after allowing the solution to equilibrate for 15 minutes. Two-
dimensional NMR spectra were measured on a 400 MHz Bruker spectrometer.
3.3 Experimental
3.3.1 Chemicals and Reagents.
N-Hydroxybenzotriazole (HOBT) and was purchased from Advanced ChemTech and O-
Benzotriazole-N,N,N’,N’-tetramethyl-uronium-hexafluorophosphate (HBTU) was purchased
from NovaBiochem. Zinc (II) acetate (99.9%) was purchased from J. T. Baker. All solvents were
used as received without further purification unless otherwise noted.
3.3.2 Synthesis of Starting Materials.
The syntheses of tert-butyl-2-aminoethylcarbamate (TBAC),19 [Ru(bpy)2(bpy[aeg-
OtBu]2)](NO3)2 (Ru-0),11 [Ru(bpy)2(bpy[aeg-(bpy)-OtButyl]2)](NO3)2 (Ru-1)11 4'-methyl-2,2'-
bipyridine-4-acetic acid (MeBpyAA),20 and Ru(bpy)2Cl221 were performed and the products
characterized as previously reported.

108
3.3.2.1 Synthesis of CH3-Bpy-en-boc (1)
To 250 mL CH2Cl2, 3.0 g MeBpyAA, 4.35 g HBTU, 2.06 g HOBT, and 7.5 mL
diisopropylethylamine (DIPEA) were added with stirring in an ice bath. After 10 minutes, 1.4 g
TBAC was added and the resulting solution stirred for two days, and allowed to reach room
temperature as the ice melted. The solvent was then removed by rotary evaporation and the crude
oil reside was purified over silica (10% MeOH/CH2Cl2) to elute the product and some HBTU.
The solid was recrystallized from water to yield small white crystals. Collected 1.70 g (35%) 1H
NMR CDCl3, 400 MHz: 1.36 (s, 9H); 2.41 (s, 3H); 3.22 (q, J = 5.45 Hz, 2H); 3.34 (q, J = 5.45
Hz, 2H); 3.59 (s, 2H); 5.19 (t, J = 5.23 Hz, 1H); 6.46 (s, 1H); 7.12 (d, J = 4.90 Hz, 1H); 7.25 (d, J
= 5.07 Hz, 1H); 8.20 (s, 1H); 8.26 (s, 1H); 8.49 (d, J = 4.94 Hz, 1H); 8.59 (d, J = 5.00 Hz, 1H).
1H NMR d6 dmso, 400 MHz: 1.35 (s, 9H); 2.40 (s, 3H); 2.98 (q, 2H); 3.09 (q, 2H); 3.54 (s, 2H);
6.81 (t, 1H); 7.27 (d, 1H); 7.32 (d, 1H); 8.21 (t, 1H); 8.22 (s, 1H); 8.30 (s, 1H); 8.52 (d, 1H); 8.56
(d, 1H). MS (ESI+) [M + H+] calcd, 372.2; found, 372.3.
3.3.2.2 General Preparation Method of CH3-Bpy-en (1a)
A sample of CH3-Bpy-en-boc was stirred in 5:5:4 MeOH:H2O:HCl overnight. After this
time, the methanol was removed by rotary evaporation and the aqueous solution was extracted
with CH2Cl2 (3 x 50 mL). The aqueous solvent was removed and the residue dried under high
vacuum overnight to give the pure amine. 1H NMR, CD3CN, 300 MHz: 2.24 (q, J = 5.42 Hz,
4H); 2.55 (s, 3H); 7.27 (m, 1H); 7.51 (m, 1H); 7.74 (m, 1H); 7.86 (m, 1H); 8.54 (s, 1H); 8.89 (s,
1H). MS (ESI+) [M + H+] Calc: 271.3; Found: 271.3.

109
3.3.2.3 Synthesis of [Ru(bpy)2((bpy COOCH3)2]](BF4)2
This synthesis is modified from that previously reported.22 To 150 mL of a 1:1 (v:v)
ethanol:ethylene glycol solution was added 0.50 g [Ru(bpy)2Cl2] (1.03 mmol), 0.402 g AgBF4
(2.06 mmol), and 0.351 g bpy(CO2Me)2 (1.30 mmol) and the resulting solution refluxed for 6
hours. After this time, the red solution was cooled to room temperature and filtered to remove
solid AgCl. The ethanol was removed by rotary evaporation and a saturated aqueous solution of
NH4PF6 was added, immediately resulting in formation of a red precipitate. The solid was
dissolved in CH2Cl2, dried over Na2SO4, and the CH2Cl2 removed by rotary evaporation to give
the final product. A 0.89 g amount of red solid was collected (88 % yield). 1H NMR, 300 MHz,
d6 dmso: 3.98 (s, 6H); 7.49 (t, 2H); 7.56 (t, 2H); 7.70 (d, 2H); 7.72 (d, 2H); 7.90 (d, 2H); 8.0 (d,
2H); 8.19 (t, 2H); 8.21 (t, 2H); 8.84 (d, 2H); 8.86 (d, 2H); 9.34 (d, 2H).
3.3.2.4 Synthesis of [Ru(bpy)2(bpy(CO2H)2))](PF6)2
This is an improved synthesis based on a previous report.23 A 0.5 g sample of
[Ru(bpy)2(bpy(CO2Me)2](PF6)2 was refluxed in 100 mL of 2 M NaOH for 3 hours. After this
time, the solution was cooled in an ice bath and the base was neutralized by dropwise addition of
conc. HCl. To this was added 5 mL of aqueous saturated NH4PF6, which induced precipitation a
red solid that was isolated by filtration, sequentially washed with cold water and diethyl ether,
and then dried to give the final product. Collected 0.45 g (92 % yield) 1H NMR, 300 MHz, d6
dmso: 7.50 (t, 2H); 7.56 (t, 2H); 7.71 (d, 2H); 7.76 (d, 2H); 7.89 (d, 2H); 7.96 (d, 2H); 8.18 (t,
2H); 8.21 (t, 2H); 8.85 (d, 2H); 8.87 (d, 2H); 9.26 (s, 2H); 14.24 (s, 2H).

110
3.3.2.5 Synthesis of [Ru(bpy)2(bpy(COCl)2)](PF6)2
A suspension of [Ru(bpy)2(bpy(CO2H)2)](PF6)2 was warmed in 50 mL CH2Cl2 and 2 mL
SOCl2 overnight. The solution was cooled to room temperature and filtered to give a red solid
that was washed with cold, dry CH2Cl2 and used immediately.
3.3.2.6 Synthesis of [Ru(bpy)2(bpy[en-bpy]2)](PF6)2 (Ru-M)
To 125 mL CH2Cl2 was added 2.3 g (8.5 mmol) CH3bpy-en and 15 mL dry triethylamine,
and the resulting solution cooled in an ice bath, and stirred for 20 minutes. After this time, 0.50 g
[Ru(bpy)2(bpy(COCl)2)](PF6)2 (0.51 mmol) was slowly added as a solid. This was stirred rapidly
overnight. The next day, the solvent was removed by rotary evaporation. The red residue was
purified by column chromatography over silica using 5:4:1 MeOH:H2O; sat KNO3 (aq) to elute
the pure product. The compound was isolated by removing the solvent to dryness, then adding 10
mL MeOH and 50 mL H2O. To this, a saturated solution of NH4PF6 was added to precipitate the
pure compound. The red solid was collected on a medium frit and washed with water and cold
methanol, then dried with diethyl ether. Collected 0.35 g (47 % yield). 1H NMR d6 dmso, 400
MHz: 2.49 (s, 6H); 3.28 (q, 4H); 3.40 (q, 4H); 3.65 (s, 4H); 7.53 (m, 8H); 7.71 (d, 2H); 7.74 (d,
2H); 7.80 (d, 2H); 7.92 (d, 2H); 8.18 (q, 4H); 8.38 (m, 4H); 8.62 (t, 4H); 8.85 (d, 4H); 9.11 (s,
2H); 9.14 (t, 2H). MS (ESI+) [M2+ + PF6-] calc 1307.3; found 1307.5. HRMS (ESI+) [M2+ + PF6
-]
calcd: 1301.3327; found: 1307.3141. Photophysical Characterization: λmax,abs = 470 nm (ε =
13,300); λmax,em = 648 nm (Φ = 0.045); τ = 1.31 ± 0.02 μsec; kr = 3.36 x 10⁴ sec-1; knr = 7.30 x 10⁵
sec-1.

111
3.4 Results and Discussion
3.4.1 Temperature Dependent and Two Dimensional NMR on Ru-1
1H NMR spectra of our peptides have always been complex.9,11 Relative 1H integrations
of the aliphatic and aromatic regions have demonstrated purity of the compounds, however
specific 1H assignments have proven to be difficult because of hindered rotation and the presence
of rotomers in room temperature solutions giving the appearance of inequivalent 1H signals from
structurally equivalent protons. Coalescence of proton signals at elevated temperatures is
characteristic of the presence of rotomers in our systems and have been previously reported for a
series of phenyl-terpyridine substituted aeg oligopeptides.9 Variable temperature 1H NMR
spectra are shown in Figure 3-2 for Ru-1 (aromatic region in Figure 3-3) to examine this
phenomenon in more detail. As the temperature is raised from 25 °C to 120 °C, proton signals
coalesce to form peaks with more discrete band shapes. For example, at ~ 7.3 ppm, multiple
peaks coalesce and then split to form two distinct doublets at 120 ºC. Multiplets that appear
around 8.0 – 8.4 ppm at 25 ºC are very clearly a singlet and a few overlapping signals at 120 ºC.
Re-cooling the solution from 120 ºC to 25 ºC results in an identical proton spectrum, indicating
that Ru-1 does not decompose at these elevated temperatures. Figure 3-4 shows overlaid and
difference 1H NMR spectra before and after heating, confirming compound stability.
We sought to assign 1H and 13C spectra of Ru-1 to give us a greater understanding
of the solution structure at room temperature. The 1H spectrum for Ru-0 was first
assigned. Ru-0, shown in Scheme 3-1, is the structural analog of Ru-1 but without
pendant bpy ligands that could hinder rotation in solution. Table 3-1 lists the assigned
chemical shifts that were gathered from COSY, HMQC and HMBC two-dimensional NMR
spectra for Ru-0. Bipyridine ligands coordinated to Ru (labels Ru 2 – Ru 5 in Table 3-1) have

112
Figure 3-2: Temperature dependent 1H NMR spectra of Ru-1 in d6 dmso at 300 MHz

113
Figure 3-3: Aromatic region of temperature dependent 1H NMR spectra of Ru-1 in d6 dmso at 300 MHz.

114
ppm
7.07.58.08.59.09.5
ppm
7.07.58.08.59.09.5
Figure 3-4: Overlaid temperature dependent 1H NMR spectra of Ru-1 taken at (black) 25 °C (1) and (red) 25 °C (2) from Figure 3-3. Difference spectrum shown above.

115
Table 3-1: 1H and 13C chemical shifts for Ru-0 at 25 °C in d6 dmso. Non-amide bpy ligands (red)are equivalent. Protons on the amide containing, bridging, bpy ligand are equivalent. Peptide chains are equivalent. Secondary amine protons (Proton E) not observed.12
Atom 1H 13C Ru 1 - 156.2 Ru 2 8.86, 8.88 (d) 124.3 Ru 3 8.18, 8.20 (t) 137.9 Ru 4 7.51, 7.56 (t) 127.6 Ru 5 7.74, 7.76 (d) 150.9
Ru L 1 7.97 (d) 151.8 Ru L 2 7.97 (d) 125.2 Ru L 3 - 156.7 Ru L 4 9.15 (s) 121.5
R8u L 5 - 141.6 A - 163.5 B 9.24 (t) - C 3.61 (q) 36.47 D 3.09 (t) 46.31 E - - F 3.83 (s) 48.7 G - 166.5 H - 82.47 I 1.43 (s) 27.21

116
multiple signals, reflecting the orientation cis or trans from the amide-containing bpy ligand.
Structurally identical protons in the peptide strands and bridging bpy ligand exhibit single
chemical shifts indicating that at room temperature no significant rotamers exist (Figure 2-1).
Complete 1H and 13C assignments were first made for the [Ru(bpy)3]2+ core of Ru-1,
listed in Table 3-2. Generally, chemical shift assignments for this portion of the molecule are
similar to identical parts of Ru-0 however the bpy protons adjacent to the amide (Ru L 4) are
shifted slightly upfield by ~ 0.1 ppm. Comparing the spectrum of Ru-0 with that of Ru-1 taken
at 120 °C shows that these protons appear at the same chemical shift, suggesting that the pendant
bipyridine ligands may cause an environment whereby these protons are slightly shielded.
Table 3-3 lists 1H chemical shifts for the peptide strand at room temperature in d6 dmso.
The striking difference between Ru-0 and Ru-1 is that the aeg protons in Ru-1 appears to be in
two distinct chemical environments. Using the 2D NMR techniques as above, each proton signal
couples with only its neighbor and there is no overlap of between signals, further supporting two
distinct chemical environments. The pendant bpy ligand and t-butyl chain termini are large and
sterically bulky, are likely to hinder rotation, and may cause the peptide strands to “lock” in
place. Based on the NMR spectra, two distinct conformations of peptide are inferred. Although
molecular motion occurs and would switch the molecule between the two conformations, this
must occur on a slower timescale relative to the NMR experiment. Increasing the temperature
during VT NMR (Figure 3-2 and 3-3) unlocks these conformations, speeds up molecular
motions, and gives rise to chemically equivalent proton sites. This phenomenon is likely also
solvent dependent because the proton spectrum of these compounds varies with solvent (see
Section 3.4.2).

117
Table 3-2: 1H and 13C Chemical Shifts for Ru-1.
Atom Proton Carbon Ru 1 - 156.1 Ru 2 8.84 124.4 Ru 3 8.17 138.1 Ru 4 7.49, 7.54 127.8 Ru 5 7.706, 7.786 151, 151.4
Ru L 1 7.92 151.9 Ru L 2 7.83 125.1 Ru L 3 - 156.8 Ru L 4 9.03 121.6 Ru L 5 - 141.6

118
Table 3-3: Chemical Shifts for Ru-1 peptide strands.
Atom Environment 1
Environment 2
Atom Environment 1 Environment 2
H C H C H C H C A - 163.1 162.8 Bpy A 8.27 121.4 8.24 121.6 B 9.07 - 9.23 - Bpy B - 145.5 145.5 C 3.48 37.24 3.58 38.3 Bpy C 7.24 124.7 7.21 124.8 D 3.60 47.57 3.48 46.23 Bpy D 8.47 148.7 8.42 148.7 E 4.30 50.83 4.02 48.62 Bpy E - 154.8 154.8 F - 168.1 - 168.1 Bpy F 154.8 154.8 G - 81.39 - 81.39 Bpy G 8.09 121.0 8.15 121.1 H 1.34 27.53 1.34 27.53 Bpy H 7.20 124.8 7.24 124.7 I - 169.5 - 169.5 Bpy I 8.43 148.7 8.43 148.7 J 3.95 37.96 3.75 38.52
Me 2.38 20.64 2.31 20.61

119
3.4.2 1H NMR Titrations of Ru-1 with Zn2+
To monitor the effects of metal binding on solution phase peptide structure, we conducted
a titration of Zn2+ against Ru-1 in d4 MeOH and these results are shown in Figure 3-5. As Zn2+ is
titrated into the NMR tube, protons peaks shift that are characteristic of metal-ligand binding.
We anticipated 1:1 Zn:Ru stoichiometric binding, at which point Zn2+ crosslinks the peptide
strands forming a [Zn(bpy)2]2+ complex. If this were true, unbound bpy peaks would remain
visible until a 1:1 ratio; this is clearly not the case. However, the three multiplets at ~ 7.25 ppm
and two multiplets at 8.3 ppm decrease in area and then disappear completely between 0.42 and
0.66 molar equivalents of Zn2+ to Ru-1. New peaks concurrently grow in around 7.7 and 8.6
ppm; the cluster of peaks ~8.6 ppm is poorly defined until ratios between 0.88 and 1.10:1 Zn2+:
Ru-1, at which point discrete peaks are observed. The point at which peaks disappear and resolve
is unexpected. To shed further insight, compound Ru-M was synthesized as a structural analog.
3.4.3 Synthesis and NMR Experiments with Ru-M
The 1H spectrum of Ru-1 is uncomplicated because the pendant bpy ligands are absent.
Likewise, when bpy ligands are present, and the –CH2-OtBu chain termini are gone, we expect
similar structural simplicity. To this end, Ru-M was synthesized according to Scheme 3-2. This
structure is analogous to Ru-1 in that the ethylene bridge between [Ru(bpy)3]2+ and free bpy
ligands is retained, the distance between them is identical, but the -CH2-O-tBu terminus is absent
to simplify the structural characterization via NMR. As expected, Ru-M and Ru-1 exhibited
similar photophysical properties (Section 3.3.2.6), with lifetimes and quantum yields that are in

120
Figure 3-5: Titration of 23.7 mM Ru-1 with 225 mM Zn(acetate)2 in CD3OD at 400 MHz. The numbers are the ratio of Zn2+:Ru2+.

121
Scheme 3-2: Synthetic steps toward Ru-M.
(i) CH2Cl2, HCl, overnight, room temperature; (ii) NEt3, CH2Cl2, overnight, room temperature.

122
agreement because each contains an identical diamide-containing [Ru(bpy)3]2+ core. Figure 3-6
shows a cyclic voltammogram of Ru-M; this contains a one-electron oxidation at 1.25 V, and
three sequential one-electron reductions at -1.28, -1.64, and -1.87 V, in good agreement with the
electrochemical properties of Ru-1. Finally, Ru-M was reacted with Zn2+ and after precipitation
through anion exchange by the addition of NH4PF6, was identified using mass spectrometry
(Figure 3-7), which demonstrated the successful formation of Ru-M(Zn).
Figure 3-8 shows the 1H NMR spectrum of Ru-M taken in d6 dmso at room temperature
and it is immediately clear that it is less complicated than that for Ru-1, and has well-defined
peaks even at low temperatures, apparently because of the free rotation in the absence of bulky
tBu groups. Figures 3-9 (full) and 3-10 (aromatic) contain COSY spectra of Ru-M; even with
free bpy ligands on the aeg strands, the peak correlations are well resolved. Full 1H and 13C
assignments for Ru-M are listed in Table 3-4. Comparing the spectra of Ru-M and Ru-1, the
chemical shifts are in good agreement, although some differences exist. Within the [Ru(bpy)3]2+
core of the complex, proton chemical shifts are identical between Ru-M and Ru-1 accept for HG,
which differs by ~ 0.08 ppm versus the analogous proton in Ru-1 at room temperature, but more
closely resembles the 120 °C spectrum.
We measured Ru-M emission as a function of added Zn2+ (Figure 3-1) and observed
quenching of ~ 14 % at 1:1 Zn2+:Ru-M. Since Ru-M contains discrete, well-defined peaks in 1H
NMR, has similar photophysical characteristics as Ru-1, and the addition of Zn2+ resulted in
similar quenching as Ru-1, we conclude that Ru-M serves as an appropriate model system to
study the structural effects of metal binding on to our scaffolds.
Ru-M was subjected to a similar Zn2+ titration experiment as Ru-1, as shown in Figure
3-11 and as before, the spectrum evolves as several equivalents Zn2+ are added. Figure 3-12
compares the aromatic region of these spectra. As a result of metal binding, proton peaks

123
Potential (V)
-2-101
Nor
ma
lized
Cur
rent
(i/M
)
-0.02
-0.01
0.00
0.01
0.02
0.03
Figure 3-6: Cyclic voltammogram of Ru-M in 0.2 M TBAP in CH3CN vs. SCE taken at a scan rate of 50 mV/sec on a glassy carbon working electrode.

124
m/z
754 756 758 760 762 764
m/z
455 456 457 458 459 460
m/z
305 306 307 308 309
Theoretical
Measured
a b c
Figure 3-7: Molecular ion peaks observed by positive ion electrospray mass spectrometry,plotted together with the calculated mass and isotopic splitting patterns for [Ru-M(Zn)](PF6)4. a) [Ru-M(Zn)]4+; b) [[Ru-M(Zn)](PF6)]
3+; c) [[Ru-M(Zn)](PF6)2]2+.

125
Figure 3-8: 1H NMR spectrum of Ru-M in d6 dmso at 400 MHz.

126
Figure 3-9: COSY spectrum of Ru-M in d6 dmso at 400 MHz.

127
Figure 3-10: Aromatic region of the COSY spectrum of Ru-M in d6 dmso at 400 MHz.

128
Table 3-4: 1H chemical shifts for Ru-M.
Proton Chemical Shift A 9.14 (t) B 8.39 (t) C 3.39 (q) D 3.29 (q) E 3.65 (s) F 2.06 (s) G 9.11 (s) H 8.62 (d) I 7.45 (d) J 8.18 (t) K 7.55 (t) L 7.91 (d) M 7.80 (d) N 8.85 (d) O 7.75 (d) P 8.26 (s) Q 8.34 (s)

129
ppm
0246810
1Ru : 0 Zn
1 Ru : 0.82 Zn
1 Ru : 1.22 Zn
1 Ru : 1.58 Zn
1 Ru : 1.92 Zn
1 Ru : 0.40 Zn
1 Ru : 2.30 Zn
1 Ru : 2.94 Zn
1 Ru : 3.12 Zn
Figure 3-11: 1H NMR spectra during the titration of 354 mM Zn(acetate)2 with compound 33.6 mM Ru-M in d6 dmso.

130
ppm
7.58.08.59.0
G N J L M O K
1 Ru : 0 Zn
1 Ru : 0.82 Zn
1 Ru : 1.22 Zn
1 Ru : 1.58 Zn
1 Ru : 1.92 Zn
1 Ru : 0.40 Zn
1 Ru : 2.30 Zn
1 Ru : 2.94 Zn
1 Ru : 3.12 Zn
Figure 3-12: Aromatic region of the 1H NMR spectrum during a titration of 354 mM 33.6 Zn(acetate)2 with compound Ru-M in d6 dmso including guiding lines.

131
assigned to the free bpy ligands are immediately shifted by the addition of 0.4 eq Zn2+. For
example, the peak at 7.45 and the cluster centered at ~ 8.5 ppm disappear to form very broad
signals and then continue to sharpen over the next 2.5 eq of Zn2+. Line broadening is observed
when exchange between two states occurs on rates comparable with the time scale of the NMR
experiment.24 Zinc-bpy complexes dissociate with kd ~ 16 sec-1 (Kd = 6.3 x10⁻⁶ M-1),25 which is
roughly on the NMR time scale (~ milliseconds). Given this rate, Kd << [Ru-M] = 34 mM, and
the Zn2+:Ru-M ratio at which this occurs is roughly 0.5:1, broadening of this type is expected.
Table 3-5 provides Zn2+ dissociation and formation rate constants with bipyridine which are
compared with Cu2+ and Ni2+.
The NMR spectra continue to evolve over the course of the experiment as Zn2+ is
added, which we attribute to rearrangement of Zn2+ atom(s) within the scaffold as
illustrated in Figure 3-13. To better understand this, the integration of peaks from 7.4 –
8 and the cluster at 8.5 ppm were plotted as a function of added Zn2+ (Figure 3-14A).
We first compare the peaks around 8.5 ppm (Figure 3-14A, black). As the concentration
of Zn2+ increases, the integrated area of this region drops and then rises again to a plateau
at ~ a 1:1 Zn2+:Ru-M ratio. After this point the total proton integration does not change,
however the shapes of the signals continue to change and do so past 3 added molar
equivalents of Zn2+. From these data, we infer initial crosslinking of Ru-M hairpin by
Zn2+ to form a [Zn(bpy)2]2+ complex (Figure 3-13B). We further observed the
emergence of a peak centered at ~ 7.6 ppm which is obvious only at higher Zn2+
concentrations. We examined this peak by comparing the integration between 7.8 – 8
ppm as a function of added Zn2+ (Figure 3-14A, red). Between 7.4 – 8 ppm there are
two triplets, assigned to Ru-coordinated bpy ligands; at higher Zn2+ concentrations, a new

132
Table 3-5: Kinetic and thermodynamic data for Zn2+ bipyridine complexes, listed with Cu2+ and Ni2+ for comparison.27
Ion Log kf Log kd Log K Zn2+ 6.0 1.2 5.2 Cu2+ ≥ 7.0 -0.7 8.0 Ni2+ 3.2 -4.3 7.1

133
Figure 3-13: Possible rearrangement within Ru-hairpin complexes. A) Ru-1 or Ru-M; B) Predicted Ru-Zn hairpin complex; C) Coordination of excess Zn2+ to hairpin scaffold.

134
A)
B)
Moles Zn2+ / Moles Ru-M
0.0 0.5 1.0 1.5 2.0 2.5 3.0
In
tegr
atio
n 8
.25
- 8.
63 p
pm
4
6
8
10
Moles Zn2+ / Moles Ru-M
0.0 0.5 1.0 1.5 2.0 2.5 3.0
-0.02
0.00
0.02
0.04
0.06G
M
L
O
N
K
J
Figure 3-14: A) Change in total integration over 7.4 – 8.0 (red) and 8.25 – 8.63 ppm (black). B) Change in chemical shift for Ru-M showing selected protons G (●), M(○), L (▼), O (□), J (∆), K (■), and N (♦).

135
overlapping peak grows in as a shoulder, and then shifts. Figure 3-14A (red) shows the
total integration over this area in our titration experiment and as the concentration of Zn2+
increases, the area also increases until reaching a leveling of ~ 8 total protons at ~ 2 Zn2+: 1
Ru-M. Four of these are from pre-existing peaks, so an increase of ~ 4 protons is observed in
this region. The Zn2+:Ru-M ratio at which it levels is suggestive of the formation of a Ru-Zn2
type complex. These data suggest that in the second phase, subsequent addition of Zn2+ results in
breaking the hairpin in favor of two pendant [Zn(bpy)(solvent)2]2+ complexes (Figure 3-13C),.
Zinc is known to form [Zn(bpy)3]2+ and its properties have been well characterized.26,27
However, mass spectrometry analysis of solutions specifically prepared at lower Zn2+:Ru-1 ratios
(2:3) revealed no molecular ion masses indicating larger identifiable aggregates. If Zn tris bpy
complexes are forming in solution, they likely dissociate in favor of the structure in Figure 3-
13B, or are not observed in the mass spectrum because of the instability in the gas phase.
Because our spectroscopic observations of [Ru(bpy)3]2+ emission quenching by Zn2+
inspired a structural explanation, we examined the chemical shifts of Ru-bound bpy ligands,
labeled in Figure 3-12 by vertical lines. Using the guiding lines, it is clear that some signals shift
and some do not. In conjunction with 2D NMR spectroscopy, we identified the proton signals
with the largest changes as those that belong to the bridging, amide-containing bpy ligand. A
summary of the chemical shift, splitting, and coupling constants of these are listed in Table 3-6
and a plot of their changes as a function of added Zn2+ is shown in Figure 3-14B. Protons HG and
HM exhibit the largest chemical shifts of 0.06 and 0.03 ppm downfield (relative to their chemical
shifts in the absence of Zn2+), a ~190 and 95 fold difference compared to the spectral resolution of
the experiment, respectively. These protons (in addition to amide proton HA) are also closest to a
bound [Zn(bpy)2]2+ complex and the chemical shift could be the result of a new distinct chemical
environment. These results show that Ru-bound bpy ligands exhibited significant spectra shifts
during the Zn2+ titration, suggestive of a structural change in the [Ru(bpy)3]2+ structure.

136
Table 3-6: Chemical shift information for selected protons in Ru-M. 1H Chemical Shift/ppm
splitting, J Zn eq 0 0.40 0.82 1.22 1.58 1.92 2.30 2.94 3.12
G 9.11 s
9.10 s
9.12 s
9.13 s
9.14 s
9.15 s
9.16 s
9.16 s
9.17 s
M 7.81 d, 5.85
7.81 d, 4.77
7.82 d, 5.31
7.84 d, 5.85
7.83 d, 5.66
7.84 d,
5.71
7.84 d, 5.96
7.84 d,
5.90
7.84 d, 6.11
L 7.93 d, 5.85
7.93 d, 5.85
7.93 d, 5.85
7.94 d, 5.85
7.94 d, 5.89
7.94 d, 5.97
7.94 d, 5.71
7.94 d, 5.90
7.94 d, 5.86
O 7.73 d, 5.30
7.73 d, 5.28
7.73 d, 5.58
7.73 d, 5.58
7.73 d, 5.61
7.73 d, 5.45
7.73 d, 5.49
7.73 d, 5.69
7.73 d, 5.61
O’ 7.76 d, 5.30
7.76 d, 4.12
7.76 d, 5.58
7.76 d, 5.58
7.76 d, 5.68
7.76 d, 5.44
7.76 d, 5.49
7.76 d, 5.41
7.76 d, 5.35
K 7.52 t, 6.49
7.51 t, 6.07
7.51 t, 6.65
7.51 t, 6.61
7.50 t, 6.65
7.51 t, 6.42
7.51 t, 6.50
7.51 t, 6.46
7.51 t, 6.62
K’ 7.56 t, 6.59
7.56 t, 6.36
7.56 t, 6.60
7.56 t, 6.61
7.55 t, 6.45
7.56 t, 6.52
7.56 t, 6.50
7.56 t, 6.74
7.56 t, 6.56
J 8.18 t, 7.95
8.18 t, 7.64
8.18 t, 8.05
8.18 t, 8.10
8.18 t, 7.90
8.18 t, 8.08
8.18 t, 7.94
8.18 t, 7.73
8.18 t, 8.02
J’ 8.20 t, 7.87
8.20 t, 7.97
8.20 t, 8.14
8.20 t, 8.10
8.20 t, 8.05
8.20 t, 8.18
8.20 t, 8.34
8.20 t, 7.73
8.20 t, 8.02
N 8.86 d, 7.79
8.86 d, 7.76
8.85 d, 7.88
8.86 d, 7.88
8.85 d, 8.10
8.85 d, 7.77
8.85 d, 7.88
8.85 d, 8.15
8.85 d, 8.02

137
Our observations of [Ru(bpy)3]2+ quenching by Zn2+ lead us to hypothesize that the
amide-containing, bridging bpy ligand may undergo a twist or bend to provide the room required
to form [Zn(bpy)2]2+. If this were true, proton HG would likely appear at a different chemical
shift; the above result suggests that this is the case. However, analysis of integrations and
chemical shifts at higher added Zn2+ concentrations implies that Zn2+ breaks the hairpin in favor
of forming a Ru-(Zn)2 complex, as discussed above. If the bridging amide ligand twisted in some
fashion to form [Zn(bpy)2]2+, this would be relieved as more Zn2+ was added forming a complex
like Figure 3-13C. As a result, [Ru(bpy)3]2+ emission intensity should increase and a return of
the chemical shift of HG to its original chemical shift would be observed, however neither of these
are experimentally observed. From this observation, we infer that the addition of Zn2+ causes a
different chemical environment around [Ru(bpy)3]2+ and it is unlikely that a twist or bend of the
bpy ligand is the major contributor to decreased [Ru(bpy)3]2+ emission. A more likely scenario is
that the hairpin scaffolds in Ru-1 and Ru-M likely hold Zn2+ close enough that the Ru-
coordinated bpy result in distinct chemical shifts from near-neighbor effects. Since this was not
observed in Zn2+ binding to Ru-SS, we conclude that the resulting Ru-Zn-Ru complex is
expanded and the flexibility of the backbone allows for longer Ru-Zn distances, decreasing any
near-neighbor effects.
3.5 Conclusions
This chapter discussed efforts using NMR spectroscopy to understand peptide solution
structure and metal binding and its effect on [Ru(bpy)3]2+ emission. It is clear from VT and 2D
NMR that unmetallated peptide hairpin scaffolds are present in two major conformations at room
temperature and one uniform conformation at elevated temperatures. Multiple conformations are
a result of hindered rotations provided by either bulky pendant bpy ligands or t-butyl moieties;

138
removal of either groups results in equivalent chemical environments. NMR titrations with
model complexes provide insight into metal binding within these peptides and have given us a
clearer picture of the chemical environment of [Ru(bpy)3]2+. Molecular modeling and DFT
calculations may give insight into the charge density of the amide-containing Ru-coordinated
bridging ligand and whether nearby Zn2+ metal complexes could impact its local chemical
environment.
3.6 References
1. Fukuzumi, S. Phys. Chem. Chem. Phys. 2008, 10, 2283 – 2297.
2. Gust, D.; Moore, T. A.; Moore, A. L. Acc. Chem. Res. 2009, 42, 1890 – 1898.
3. Concepcion, J. J.; Jurss, J. W.; Brennaman, M. K.; Hoertz, P. G.; Patrociinio, A. O. T.; Iha, N.
Y. M.; Templeton, J. L.; Meyer, T. J. Acc. Chem. Res. 2009, 42, 1954 0 1965.
4. McConnell, I.; Li, G.; Brudvig, G. W. Chemistry and Biology, 2010, 17, 434 – 447.
5. 19. Gilmartin, B. P.; Ohr, K.; McLaughlin, R. L.; Koerner, R.; Williams, M. E. J. Am. Chem.
Soc. 2005, 127, 9546–9555.
6. Ohr, K.; Gilmartin, B. P.; Williams, M. E. Inorg. Chem. 2005, 44, 7876–7885.
7. Gilmartin, B. P.; McLaughlin, R. L.; Williams, M. E. Chem. Mater. 2005, 17, 5446–5454.
8. Levine, L. A.; Morgan, C. M.; Ohr, K.; Williams, M. E. J. Am. Chem. Soc. 2005, 127, 16764
– 16765.
9. Ohr, K.; McLaughlin, R. L.; Williams, M. E. Inorg. Chem. 2007, 46, 965–974.

139
10. Levine, L. A.; Youm, H. W.; Yennawar, H. P.; Williams, M. E. Eur. J. Inorg. Chem. 2008,
26, 4083 – 4091.
11. Myers, C. P.; Gilmartin, B. P.; Williams, M. E. Inorg. Chem. 2008, 47, 6738 – 6747.
12. Myers, C. P.; Miller, J. R.; Williams, M. E. J. Am. Chem. Soc. 2009, 131, 15291 – 15300.
13. Floudas, G.; Spiess, H. W. Macromol. Rapid. Commun. 2009, 30, 278 – 298.
14. Lewandowska, A.; Oldziej, S.; Liwo, A.; Scheraga, H. A. Biophys. Chem. 2010, 151, 1 – 9.
15. Albrecht, M. Chem. Rev. 2001, 101, 3547 – 3497.
16. Laugnani, A. C.; Keller, M.; Slattery, J. M.; Krossing, I.; Briet, B. Chem. Eur. J. 2009, 15,
10405 – 10422.
17. Jansco, A.; Kolozsi, A.; Gyurcsik, B.; Nagy, N. V.; Gajda, T. J. Inorg. Biochem. 2009, 103,
1634 – 1643.
18. Knight, L. K.; Freixa, Z.; van Leeuwen, P. W. N. M.; Reek, J. N. H. Organometallics 2006,
25, 954 – 960.
19. Jaramillo, D.; Wheate, N. J.; Ralph, S. F.; Howard, W. A.; Tor, Y.; Aldrich-Wright, J. R.
Inorg. Chem. 2006, 45, 6004 – 6013.
20. Ciana, L. D.; Hamachi, I.; Meyer, T. J. J. Org. Chem. 1989, 54, 1731-1735.
21. Sullivan, B. P.; Salmon, D. J.; Meyer, T. J. Inorg. Chem. 1978, 17, 3334-3341.
22. Martre, A.; Laguitton-Pasquier, H.; Deronzier, A.; Harriman, A. J. Phys. Chem. B 2003, 107,
2684 – 2692.
23. Uppadine, L. H.; Keene, F. R.; Beer, P. D. J. Chem. Soc., Dalton Trans. 2001, 2188 – 2198.
24. Friebolin, H. Basic One- and Two-Deminsional NMR Spectrscopy, 4th ed.; Wiley-VCH
Verlag GmbH & Co. KGaA: Heidelberg, Germany, 2005.
140
25. Holyer, R. H.; Hubbard, C. D.; Kettle, S. F. A.; Wilkins, R. G. Inorg. Chem. 1965, 4, 929 –
935.
26. Hatch, D. M.; Wacholtz, W. F.; Mague, J. T. J. Chem. Cryst. 2005, 35, 327 – 338.
27. Nozaki, K.; Takamori, K.; Nakatsugawa, Y.; Ohno, T. Inorg. Chem. 2006, 45, 6161 – 6178.

Chapter 4
Impacts on the Location and Number of [Cu(bpy)2]2+ Crosslinks on the Emission
Photodynamics of [Ru(bpy)3]2+ with Pendant Oligo(aminoethylglycine) Chains
4.1 Introduction
Nature uses self-assembly of macromolecules built from modular repeating units to
organize intricate structures capable of complex functions. For example, photosynthetic
organisms have mastered molecular recognition and self-assembly, forming large structures that
use light to funnel energy and electrons. Synthetic biomimetic molecules for artificial
photosynthesis must be designed to specifically control the relative placement of chromophores
and electron donors and acceptors to create long-lived charge separated states capable of
performing chemical work. Multifunctional molecular systems, largely containing covalently
linked moieties, have been synthesized to investigate and control photoinduced charge transport;1-
3 large architectures, both inorganic4-9 and organic,10-13 have been used to demonstrate the ability
to mimic photosynthetic light harvesting. By virtue of their size and complexity, these
supramolecular structures can be synthetically challenging to make. There have been several
recent examples of using relatively weak intermolecular forces (versus covalent bonds) to self-
assemble mesoscale structures from molecular and supramolecular components.14
Amino acid building blocks are the modular repeat units of biology. Employing
biomimetic strategies to drive the formation of large, functional molecules could lead to artificial
analogs of natural and technologically important systems. Our aim has been to use artificial
analogs of amino acids to exploit straightforward amide coupling chemistries and construct
oligopeptides in readily reconfigurable sequences. Ligand-substituted aminoethylglycine is used

142
to build oligomers that, by analogy to molecular recognition and assembly in nature, coordinate
transition metal ions and self-assemble into multifunctional supramolecular structures. These are
a tractable approach for making highly complex architectures needed to realize artificial
photosynthesis.
Assembly of complex supramolecular structures by inorganic coordination chemistry is a
promising route for construction of artificial photosynthetic systems because the coordination
number and geometry, photochemistry, metal ion lability, redox states, etc. are all tunable based
on the ligand and transition metal.15-18 We have demonstrated that artificial oligopeptides based
on the modular ligand-substituted aminoethylglycine (aeg) self-assemble into multimetallic
structures when transition metal ions coordinate to the pendant ligands.19,20 Polyfunctional
oligopeptides have been used to induce self-assembly of heterometallic structures,19c,20 or to cause
coordinative crosslinking between oligopeptide strands to form double-stranded duplexes linked
by multiple metal ions.19a,c,20 Metal-based recognition and assembly of artificial aeg strands to
form duplex structures is shown in Figure 4-1A: molecular recognition is driven by
complementary denticity of the ligands with respect to coordinative saturation of the target metal
ion.19,20 This strategy can result in the formation of parallel and antiparallel isomers. To improve
our control over the structural geometries in the metal-linked oligopeptide duplexes, we have
begun to design aeg oligopeptides that reduce or eliminate misalignment and isomer formation,
and that enable facile preparation of heterometallic, multifunctional assemblies. One of our recent
approaches20 has been to take inspiration from hairpin loops in self-complementary nucleic acid
sequences.21 By analogy, we have designed artificial peptide analogs with two complementary
ligand substituted aeg chains that coordinatively crosslink the hairpin loop, as in Figure 4-1B.
In the first study of the “hairpin” motif for construction of heterometallic complexes,20a
the preparation of [Ru(bpy)3]2+ compounds derivatized with two bipyridine (bpy)-containing aeg
substituents was reported. Both aeg strands with a single pendant bpy are substituted from the

143
Figure 4-1: Two motifs for self-assembly of oligopeptides with pendant ligands by metal ion coordination: A) self-complementary bpy-substituted aeg dipeptides form parallel and anti-parallel isomers when crosslinked with Cu2+ (blue spheres).19a B) Attachment of aeg strands to [Ru(bpy)3]
2+ (red sphere) pre-directs alignment, Cu2+ binds to close the “hairpin loop”.

144
same ligand in the Ru complex, so that they are pre-programmed for “loop” formation (Figure 4-
1B). Addition of Cu2+ or Zn2+ ions was shown to coordinatively crosslink the chains, forming
heterometallic structures. Time-resolved emission spectroscopy of these revealed that
coordination of Cu2+ dramatically reduced the [Ru(bpy)3]2+ quantum yield and excited state
lifetime. Several possible mechanisms could give rise to the excited state quenching of the Ru
core. In this paper we leverage the modular, expandable artificial peptide backbone to synthesize
a series of molecules and study the photodynamics of these structures, with the ultimate goal of
using this understanding to build more complex and potentially useful architectures with long
lived charge separated states capable of performing chemical work.
Our aims here are twofold. First, since both energy and electron transfer quenching
mechanisms are distinctly distant-dependent,22 solution phase peptide coupling chemistry is used
to increase the length of the oligopeptide and therefore the distance between [Ru(bpy)3]2+ and
[Cu(bpy)2]2+. Secondly, modification of the peptide to contain additional pendant bipyridine
ligands and form heterotrimetallic complexes tests the impact on additional redox sites on the
photophysical behavior. Scheme 4-1 shows the series of aeg-modified [Ru(bpy)3]2+ hairpin
structures that are synthesized and studied in this paper. Time-resolved and temperature
dependent emission spectroscopy are used to understand the role of the variation of structure on
the emission lifetimes of these complexes. These compounds provide a unique way to vary
structure using variable combinations of aeg modular units, and to therefore build increasingly
complex heterofunctional architectures. We find that the dynamics point toward photoinduced
electron transfer as the dominant quenching mechanism, laying the groundwork for the use of this
approach to build large, oligopeptide-linked architectures for artificial photosynthesis.

145
Scheme 4-1: Oligopeptide hairpin substituted Ru complexes

146
4.2 Experimental
4.2.1 Chemicals and Reagents.
N-Hydroxybenzotriazole (HOBT) and 1-ethyl-3-(3-dimethylaminopropyl)carbodiimide
hydrochloride (EDC) were purchased from Advanced ChemTech. O-Benzotriazole-N,N,N’,N’-
tetramethyl-uronium-hexafluorophosphate (HBTU) was purchased from NovaBiochem. Copper
(II) nitrate (99.9%) was purchased from J. T. Baker. All solvents were used as received without
further purification unless otherwise noted. Tetrabutylammonium perchlorate (TBAP) was
recrystallized three times from ethyl acetate.
4.2.2 Synthesis of Starting Materials.
The syntheses of cis-dichlorobis(2,2’-bipyridine)ruthenium (II) (e.g. [Ru(bpy)2Cl2]),23
2,2’-bipyridyl-4,4’-dicarboxylic acid chloride (bpy(COCl)2),24 Fmoc-aeg(bpy)-OtButyl,23 Fmoc-
aeg(bpy)-COOH19a and Fmoc-aeg(ac)-OtButyl19b monomers, [Ru(bpy)2(bpy[aeg-(bpy)-
OtButyl]2)](NO3)2 (e.g. Ru-1)20a and [(Ru-1)-Cu](PF6)420a were performed and the products
characterized as previously reported.
4.2.3 Oligopeptide Syntheses.
4.2.3.1 Amine and Acid Deprotection.
Fmoc deprotection was accomplished using a modified literature procedure.25 Briefly, a
sample of Fmoc-protected oligopeptide was stirred overnight with 1 molar equivalent 1,8-
diazabicyclo[5.4.0]undec-7-ene (DBU) and 10 molar equivalents decane thiol in THF. After this

147
time, the solvent was removed by rotary evaporation and the product re-dissolved in 75 mL of
0.15 M HCl. The aqueous solution was extracted 5 times with 50 mL hexanes, the organic layers
were combined and back-extracted with 0.15 M HCl and all aqueous portions combined. The
acidic aqueous solution was adjusted to a pH of 9-10 with saturated Na2CO3 and the aqueous
layer extracted 5 times with 50 mL CH2Cl2, the organic fractions combined and dried with
Na2SO4. Dichloromethane was removed by rotary evaporation to give the pure amine-terminated
oligopeptide. In each case, removal of the Fmoc was confirmed by mass spectrometry and by
noting the absence of Fmoc proton peaks in the aromatic region of the 1H NMR spectra.
Cleavage of the tert-butyl protecting groups from select oligopeptides to form terminal
carboxylic acids was accomplished by acid hydrolysis in a 25/75 (v/v) trifluoroacetic
acid/dichloromethane solution. The solution was stirred for 4 hours and the solvent removed by
rotary evaporation. Diethyl ether was added to precipitate a pale yellow solid. The ether was
decanted and the solid dried by vacuum to give the pure carboxylic acid-terminated oligopeptide.
In each case, removal of the t-butyl was confirmed by the absence of the proton peaks of the t-
butyl group in the 1H NMR spectrum.
4.2.3.2 Synthesis of NH2-[aeg(bpy)]-OtButyl (1).
The Fmoc-protected bpy-substituted aeg monomer (Fmoc-aeg(bpy)-OtButyl)19a was
synthesized as previously reported. The Fmoc protecting group removed and the product isolated
as described above, giving 1.20 g of solid (85 % yield). 1H NMR, 300 MHz, CDCl3: 1.38 (s, 9H);
2.36 (s, 3H); 2.78 (t, 2H); 3.37 – 3.43 (t-t, 2H); 3.65 (d, 2H); 3.91 (d, 2H); 7.05 (d, 1H); 7.23 (dd,
1H); 8.15 (s, 1H); 8.22 (d, 1H); 8.45 (d, 1H); 8.55 (d, 1H). MS (ESI+) [M + H+] Calc: 385.2;
Found: 385.2.

148
4.2.3.3 Synthesis of NH2-[aeg(ac)-aeg(bpy)]-OtButyl (2).
The acid terminus of the Fmoc-aeg(ac)-OtButyl monomer was deprotected as described
above, and 5.04 g of the product (Fmoc-aeg(ac)-COOH, 16 mmol) was dissolved in 600 mL
CH2Cl2 with 4.58 g HBTU (16 mmol), 2.01 g HOBT (16 mmol) and 19.6 mL
diisopropylethylamine (DIPEA, 112 mmol), and stirred for 15 min at 0ºC. A 3.76 g amount of
H2N-aeg(bpy)-OtButyl (1, 9.78 mmol) was added to the solution and stirred overnight at room
temperature. Solvent was removed by rotary evaporation and the pale yellow residue purified by
column chromatography with silica gel using 5/95 (v/v) CH3OH/CH2Cl2 to give 2.46 g (33.5 %)
of the Fmoc-protected dipeptide 2. 1H NMR, 360 MHz, CDCl3 (Figure 4-2): 1.42 (d, 9H); 2.01
(d, 3H); 2.38 (d, 3H); 3.22 – 3.54 (m-m, 7H); 3.54 – 3.64 (m, 1H); 3.66 (s, 1H); 3.79 – 4.03 (s-s,
4H); 4.15 (m, 1H); 4.32 (d, 2H); 7.08 (t, 1H); 7.15 – 7.27 (m, 3H); 7.27 – 7.38 (m, 3H); 7.53 (t,
2H); 7.70 (d, 2H); 8.18 (t, 2H); 8.44 (d, 1H); 8.57, (m, 1H). MS (ESI+) [M + H+] Calc: 749.4;
Found: 749.5. The Fmoc was cleaved and dipeptide 2 isolated as described above; a 1.42 g
amount of the pure product was collected (82 % yield). 1H NMR, 360 MHz, CDCl3: 1.39 (d, 9H);
1.94 (d, 3H); 2.37 (s, 3H); 3.31 – 3.52 (m-m, 10H); 3.82 (d, 2H); 3.90 (d, 2H); 4.02 (s, 1H); 7.08
(s, 1H); 7.21 (m, 1H); 8.14 (m, 2H); 8.43 (d, 1H); 8.54 (s, 1H). MS (ESI+) [M + H+] Calc: 527.6;
Found: 527.4.
4.2.3.4 Synthesis of NH2-[(aeg(ac))2-aeg(bpy)]-OtButyl (3).
To 1 L CH2Cl2 were added 7.15 g Fmoc-aeg(ac)-COOH (18.7 mmol), 6.52 g HBTU
(18.7 mmol), 2.86 g HOBT (18.7 mmol) and 38 mL DIPEA (221 mmol) were stirred at 0º C for
15 min. A 6.56 g amount of H2N-aeg(ac)-aeg(bpy)-OtButyl (2, 12.5 mmol) was added, and the
mixture stirred overnight. Solvent was removed and the crude residue purified with column

149
Figure 4-2: 1H NMR spectrum of Fmoc-2 in CDCl3 at 360 MHz.

150
chromatography on silica using 9/95 (v/v) CH3OH/CH2Cl2: a 3.78 g (34 % yield) amount of the
Fmoc-protected tripeptide was obtained. 1H NMR, 400 MHz, CDCl3 (Figure 4-3): 1.41 (d, 9H);
1.99 (m-m, 6H); 2.37 (s, 3H); 3.22 – 3.70 (m-m, 14H); 3.72 – 4.06 (m-m, 6H); 4.06 – 4.37 (m-m,
3H); 7.09 (t, 1H); 7.16 (m, 1H); 7.25 (m, 3H); 7.33 (m, 2H); 7.38 – 7.58 (m-d, 3H); 7.70 (d, 2H);
7.94 – 8.23 (m-m, 3H); 8.44 (m, 1H); 8.55 (m, 1H). MS (ESI+) [M + H+] Calc: 892.0; Found:
891.7. The Fmoc protecting group was cleaved and tripeptide 3 isolated and purified as described
above, yielding 2.13 g (75 % yield) of the pure compound. 1H NMR, 360 MHz, CDCl3: 1.43 (d,
9H); 1.93 – 2.17 (m-m, 6H); 2.41 (s, 3H); 3.26 – 3.53 (m-m, 11H); 3.57 (m, 2H); 3.68 (d, 1H);
3.74 – 4.07 (m-m, 6H); 7.11 (s, 1H); 7.25 (m, 3H); 8.20 (m, 2H); 8.47 (s, 1H); 8.59 (s, 1H). MS
(ESI+) [M + H+] Calc: 669.8; Found: 669.6.
4.2.3.5 Synthesis of Synthesis of NH2-[aeg(bpy)]2-OtButyl (4).
To 250 mL CH2Cl2 were added 4.37 g Fmoc-aeg(bpy)-COOH (7.95 mmol), 3.02 g
HBTU (7.97 mmol), 1.22 g HOBT (7.95 mmol), and 9.0 mL DIPEA (53 mmol) and the mixture
stirred for 15 min at 0º C. A 2.41 g amount of H2N-aeg(bpy)-OtButyl (1, 6.28 mmol) was added
and the solution stirred for 3 days at room temperature. Solvent was removed and the crude
residue purified by column chromatography with silica using 5/95 (v/v) CH3OH/CH2Cl2 to yield
3.20 g of the Fmoc-protected product (43.9 % yield). 1H NMR, 360 MHz, CDCl3 (Figure 4-4):
1.41 (d, 9H); 2.37 (m, 6H); 3.22 – 3.74 (m-m 10H); 3.74 – 4.12 (m-m, 6 H); 4.12 – 4.41 (m-m,
3H); 7.04 (m, 2H); 7.10 – 7.38 (m-m, 7H); 7.43 (m, 1H); 7.54 (t, 2H); 7.70 (m, 2H); 8.16 (m,
4H); 8.32 – 8.61 (d-m, 4H). MS (ESI+) [M + H+] Calc: 917.4; Found: 917.7. The Fmoc group
was cleaved and 2.45 g of dipeptide 4 isolated as described above, yielding 1.55 g (82%), 1H
NMR, 400 MHz, CDCl3: 1.40 (m, 9H); 2.37 (d, 6H); 3.27 – 3.57 (m-m, 7H); 3.57 – 3.72, 3H);
3.72 – 4.07, 7H); 7.00 – 7.20 (m-m, 3H); 8.02 – 8.31 (m-m, 5H); 8.32 – 8.58 (m-m, 4H).

151
Figure 4-3: 1H NMR spectrum of Fmoc-3 in CDCl3 at 360 MHz.

152
Figure 4-4: 1H NMR spectrum of Fmoc-4 in CDCl3 at 360 MHz

153
MS (ESI+) [M + H+] Calc: 695.4; Found: 695.5.
4.2.3.6 Synthesis of NH2-[aeg(bpy)-aeg(ac)-aeg(bpy)]-OtButyl (5).
A 2.30 g amount of Fmoc-aeg(bpy)-COOH (4.18 mmol) was combined with 1.62 g
HBTU (4.18 mmol), 0.66 g HOBT (4.18 mmol), and 4.0 mL DIPEA (18 mmol) in 250 mL
CH2Cl2, and the mixture stirred for 15 min at 0º C. A 1.52 g amount of H2N-aeg(AC)-aeg(bpy)-
OtButyl (3, 2.89 mmol) was added to the solution, and stirred for 3 days at room temperature.
Solvent was removed and the crude residue purified by column chromatography silica using 5/95
(v/v) CH3OH/CH2Cl2 to yield 1.21 g of the Fmoc-protected tripeptide (40 % yield). 1H NMR,
400 MHz, CDCl3 (Figure 4-5): 1.41 (d, 9H); 1.99 (m, 3H); 2.37 (s, 6H); 3.22 – 3.74 (m-m,
14H); 3.74 – 4.12 (m-m, 8H); 4.12 – 4.41 (m-m, 3H); 7.07 (m, 2H); 7.12 – 7.38 (m-m, 7H); 7.40
(m, 1H); 7.47 (t, 1H); 7.54 (d, 2H); 7.69 (m, 2H); 8.15 (m, 4H); 8.31 – 8.59 (m-m, 4H). MS
(ESI+) [M + H+] Calc: 1059.22; Found: 1059.7. Following the standard procedure above, the
Fmoc was cleaved and tripeptide 5 was isolated, giving 0.805 g (85 % yield). 1H NMR, 360
MHz, CDCl3: 1.40 (m, 9H); 1.98 (m, 3H); 2.38 (s, 6H); 3.25 (t, 2H); 3.29 – 3.58 (m-m, 12H);
3.64 (m, 2H); 3.82 (d, 2H); 3.85 – 4.05 ( m-m, 6H); 7.08 (d, 2H); 7.14 – 7.30 (m-m, 2H); 8.17 (d,
4H); 8.44 (d, 2H); 8.54 (d, 2H). MS (ESI+) [M + H+] Calc: 837.4; Found: 837.7.
4.2.4 Synthesis of [Ru(bpy)2(bpy (COOMe)2)](PF6)2
This synthesis is modified from that previously reported.26 To 150 mL of a 1:1 (v:v)
ethanol:ethylene glycol solution was added 0.50 g [Ru(bpy)2Cl2] (1.03 mmol), 0.402 g AgBF4
(2.06 mmol), and 0.351 g bpy(CO2Me)2 (1.30 mmol) and the resulting solution refluxed for 6
hours. After this time, the red solution was cooled to room temperature and filtered to remove

154
Figure 4-5: 1H NMR spectrum of Fmoc-5 in CDCl3 at 400 MHz

155
solid AgCl. The ethanol was removed by rotary evaporation and a saturated aqueous solution of
NH4PF6 was added, immediately resulting in formation of a red precipitate. The solid was
dissolved in CH2Cl2, dried over Na2SO4, and the CH2Cl2 removed by rotary evaporation to give
the final product. A 0.89 g amount of red solid was collected (88 % yield). 1H NMR, 300 MHz,
d6 dmso (Figure 4-6): 3.98 (s, 6H); 7.49 (t, 2H); 7.56 (t, 2H); 7.70 (d, 2H); 7.72 (d, 2H); 7.90 (d,
2H); 8.0 (d, 2H); 8.19 (t, 2H); 8.21 (t, 2H); 8.84 (d, 2H); 8.86 (d, 2H); 9.34 (d, 2H).
4.2.5 Synthesis of [Ru(bpy)2(bpy(CO2H)2)](PF6)2.
This is an improved syntheses on that which was previously reported.27 A 0.5 g sample
of [Ru(bpy)2(bpy(CO2Me)2](PF6)2 was refluxed in 100 mL of 2 M NaOH for 3 hours. After this
time, the solution was cooled in an ice bath and the base was neutralized by dropwise addition of
conc. HCl. To this was added 5 mL of aqueous saturated NH4PF6 , which induced precipitation a
red solid that was isolated by filtration, sequentially washed with cold water and diethyl ether,
and then dried to give the final product. Collected 0.45 g (92 % yield) 1H NMR, 300 MHz, d6
dmso (Figure 4-7): 7.50 (t, 2H); 7.56 (t, 2H); 7.71 (d, 2H); 7.76 (d, 2H); 7.89 (d, 2H); 7.96 (d,
2H); 8.18 (t, 2H); 8.21 (t, 2H); 8.85 (d, 2H); 8.87 (d, 2H); 9.26 (s, 2H); 14.24 (s, 2H).
4.2.6 Synthesis of [Ru(bpy)2(bpy(COCl)2)](PF6)2
A suspension of [Ru(bpy)2(bpy(CO2H)2)](PF6)2 was warmed in 50 mL CH2Cl2 and 2 mL
SOCl2 overnight. The solution was cooled to room temperature and filtered to give a red solid
which was washed with cold, dry CH2Cl2 and used immediately.
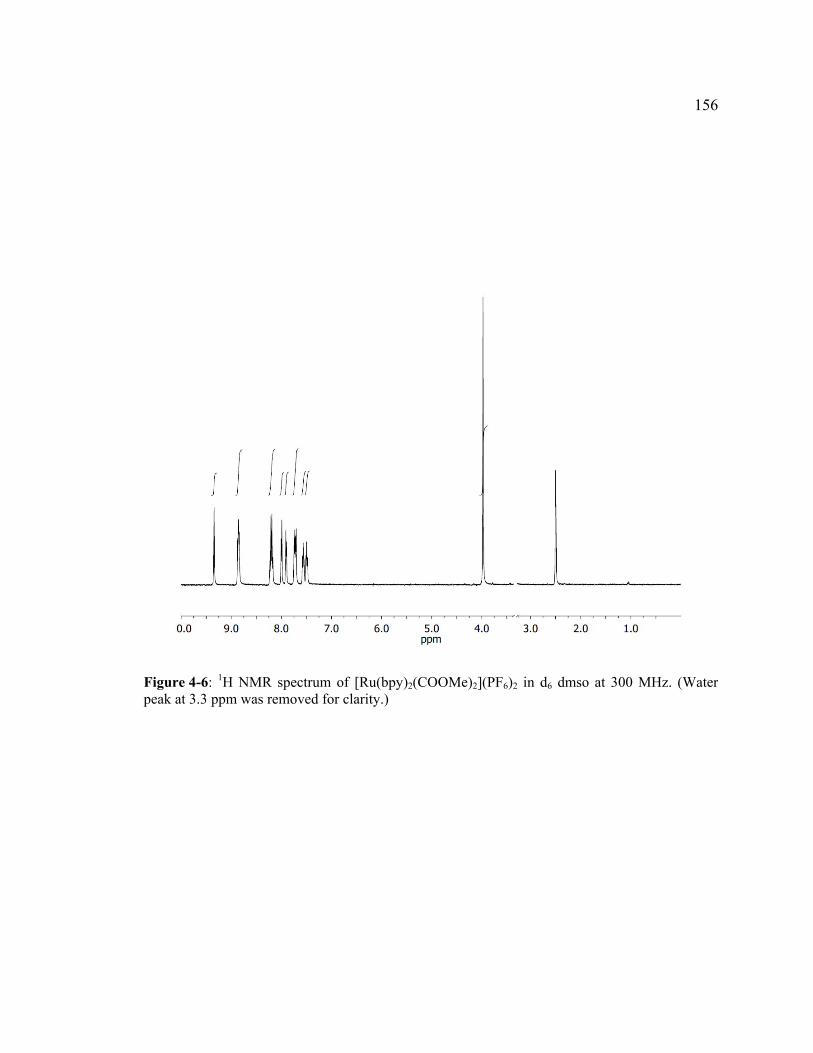
156
Figure 4-6: 1H NMR spectrum of [Ru(bpy)2(COOMe)2](PF6)2 in d6 dmso at 300 MHz. (Water peak at 3.3 ppm was removed for clarity.)

157
Figure 4-7: 1H NMR spectrum of [Ru(bpy)2(bpy(COOH)2)](PF6)2 in d6 dmso at 300 MHz. Small water impurity is at 3.33 ppm.

158
4.2.7 General Approach for Ru Hairpin Complex Syntheses.
Starting with the heteroleptic Ru complex [Ru(bpy)2(bpy(COOMe)2)]2+,26 this was
converted to the dicarboxylic acid complex ([Ru(bpy)2(bpy(CO2H)2)]2+)27 by base hydrolysis with
2 M NaOH followed by acidification with conc. HCl. The product was refluxed in 50 mL
CH2Cl2 and 2 mL SOCl2 overnight to form the diacid chloride complex,
[Ru(bpy)2(bpy(COCl)2)]2+. The solution was cooled to room temperature and filtered to give a
red solid which was washed with cold, dry CH2Cl2 and used immediately. To form the Ru
hairpin complexes, the [Ru(bpy)2(bpy(COCl)2)]2+ was combined with ~ 8 molar equivalents of
amine-terminated oligopeptide (1 – 5) and 2 mL triethylamine in 50 mL dry CH2Cl2. The reaction
was stirred overnight at room temperature and the solvent removed by rotary evaporation. The
remaining red residue was purified first by column chromatography with alumina using a 10/90
(v/v) CH3OH/CH2Cl2 mobile phase. The first red band was collected and further purified on
silica 5:4:1 (volume ratio) CH3OH:H2O:sat KNO3 (aq) solution. In all cases, the products are
isolated using previously reported methods20a and characterized as below:
4.2.7.1 Characterization of [Ru(bpy)2(bpy([aeg(ac)-aeg(bpy)-OtButyl])2)](NO3)2 (Ru-2)
The isolated product was an 0.099 g amount of red solid (68% yield). 1H NMR, 400
MHz, CD2Cl2 (Figure 4-8): 1.40 (m, 18H); 2.00 (m, 6H); 2.38 (s, 6H); 3.21 – 3.76 (m-m, 18H);
3.76 – 4.21 (d-d, 10H); 7.04 – 7.33 (s-s, 4H); 7.40 (m, 5H); 7.60 – 8.10 (m-m, 13H); 8.19 (m,4H);
8.48 (m, 8H); 8.97 – 9.51 (m-m, 4H). HR MS (ESI+) [M2+ + NO3-] Calc: 1736.6377; Found:
1736.6498. Elemental Anal. [Ru-2 • CH2Cl2] Calc: 55.47 C; 5.24 H; 14.87 N. Found: 55.59 C;
5.17 H; 14.91 N.

159
Figure 4-8: 1H NMR spectrum of Ru-2 in CD2Cl2 at 400 MHz.

160
4.2.7.2 Characterization of [Ru(bpy)2(bpy([(aeg(ac))2-aeg(bpy)-OtButyl])2)](NO3)2 (Ru-3).
A 280 mg amount of the product (51 % yield) was isolated. 1H NMR, 400 MHz, CD2Cl2
(Figure 4-9): 1.40 (m, 18H); 1.80 – 2.11 (m-m, 12H); 2.39 (s, 6H); 3-16 – 3.74 (m-m, 26H);
3.74 – 4.15 (m-m, 14H); 7.11 (m, 2H); 7.19 (d, 1H); 7.27 (s, 1H); 7.43 (s, 5H); 7.57 – 8.11 (m-m,
14H); 8.21 (m, 5H); 8.42 (m, 3H); 8.50 (m, 6H); 8.91 – 9.52 (m-m, 4H). HR MS (ESI+) [M2+]
Calc: 979.9009; Found: 979.8941. Elemental Anal. Ru-3 • 1 CH2Cl2 Calc: 54.84 C; 5.49 H;
15.50 N. Found: 54.53 C; 5.56 H; 15.18 N.
4.2.7.3 Characterization of [Ru(bpy)2(bpy([aeg(bpy)]2-OtButyl)2)](NO3)2 (Ru-4).
The reaction yielded a 539 mg amount of product (72 % yield). 1H NMR, 400 MHz,
CD2Cl2 (Figure 4-10): 1.37 (m, 18H); 2.20 (m, 4H); 2.32 (m, 8H); 3.21 – 3.98 (m-m, 28H); 3.98
– 4.35 (m, 6H); 6.92 – 7.27 (m, 8H); 7.37 (s, 4H); 7.60 (s, 3H); 7.72 (s, 4H); 7.79 – 8.02 (m, 8H);
8.02 – 8.55 (m, 19H); 8.93 – 9.49 (m, 3H). HR MS (ESI+) [M2+] Calc: 1005.3947; Found:
1005.3943. Elemental Anal. Ru-4 • 1.67 CH2Cl2 Calc: 57.85 C; 5.11 H; 14.76 N. Found: 58.07
C; 5.10 H; 14.78 N.
4.2.7.4 Characterization of [Ru(bpy)2(bpy[aeg(bpy)-aeg(ac)-aeg(bpy)-OtButyl)2)(NO3)2 (Ru-5).
A total of 183 mg of Ru-5 (74 % yield) was obtained. 1H NMR, 400 MHz, CD2Cl2
(Figure 4-11): 1.41 (m, 18H); 1.87 – 2.12 (m, 6H); 2.27 (d, 4H); 2.39 (s, 8H); 3.19 – 3.64 (m,
20H); 3.64 – 3.80 (m, 8H); 3.83 (s, 3H); 3.86 – 4.01 (m, 7H); 4.01 – 4.23 (m, 6H); 7.01 – 7.30
(m-m, 8H); 7.44 (t, 4H); 7.67 (s, 2H); 7,71 – 7.92 (m-m, 8 H); 7.92 – 8.10 (m, 6H); 8.11 – 8.60

161
Figure 4-9: 1H NMR of Ru-3 in CD2Cl2 at 400 MHz.
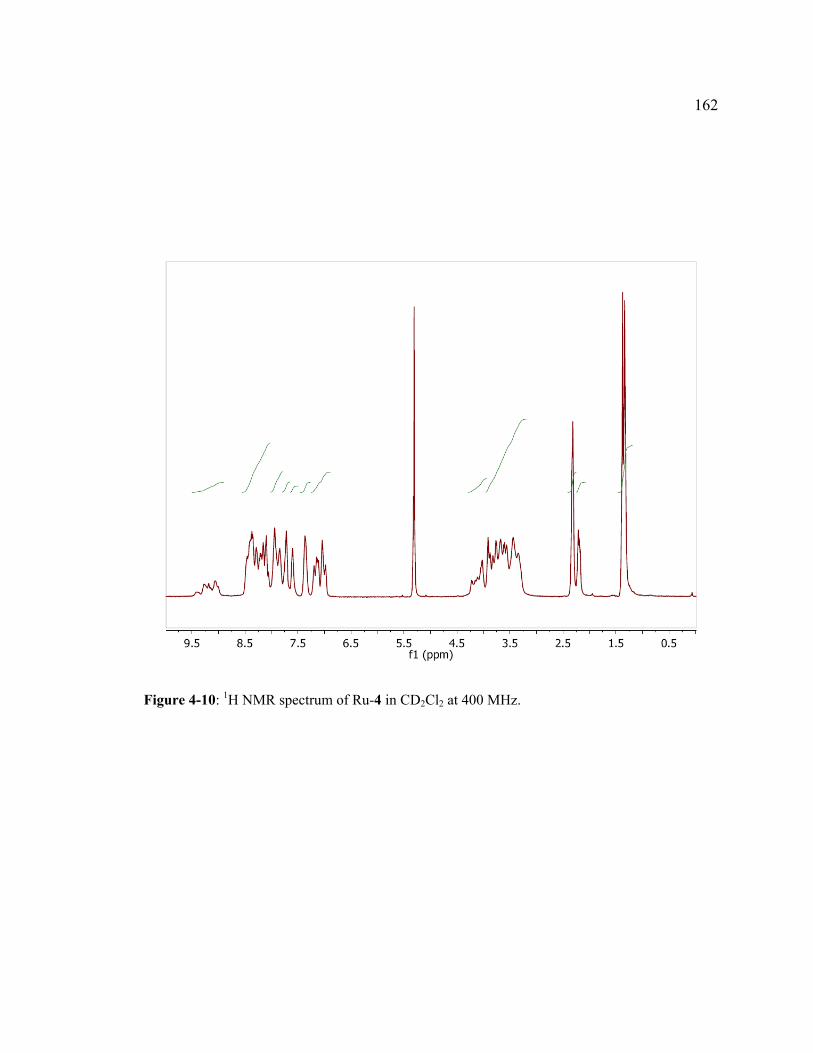
162
Figure 4-10: 1H NMR spectrum of Ru-4 in CD2Cl2 at 400 MHz.

163
Figure 4-11: 1H NMR spectrum of Ru-5 in CD2Cl2 at 400 MHz.

164
(m-m, 20H); 8.92 – 9.52 (m-m, 4H). HR MS (ESI+) [M2+] Calc: 1147.4690; Found: 1147.4626.
Elemental Anal. Ru-5 • 1.5 CH2Cl2 Calc: 57.30 C; 5.34 H; 15.40 N. Found: 57.43 C; 5.34 H;
15.44 N.
4.2.8 Synthesis of Ruthenium-Copper Complexes.
To prepare heterometallic samples for analysis, the standard procedure was to first
dissolve a known quantity of Ru-oligopeptide complex in water. For complexes Ru-2 and Ru-3,
a 1.2 molar equivalent amount of Cu2+ (from ~ 50 mM Cu(NO3)2 (aq)) was added and the
resulting solution stirred for two hours. For complexes Ru-4 and Ru-5, 1 molar equivalent
amount of Cu(NO3)2 (aq) was added and the solution stirred for one hour; an additional 1.1 molar
equivalents were then added and the solution stirred for an hour.
In all cases, the product was isolated by addition of an aqueous saturated solution of
NH4PF6, which immediately formed a red-brown solid that was collected on a medium frit and
washed with water (3 x 15 mL) and diethyl ether (5 x 15 mL) to give the heterometallic complex.
Identity and purity of these compounds were determined by mass spectrometry and elemental
analysis. [Ru-2(Cu)](PF6)4 MS (ESI+) [M4+ + 2PF6-] Calc: 1013.7; Found: 1013.7. [M4+ + 1PF6
-]
calcd 627.5; found 627.5. Elemental Anal Calc: 4.36 Ru; 2.74 Cu. Found: 4.50 Ru; 2.95 Cu.
[Ru-3(Cu)](PF6)4 MS (ESI+) [M4+ + 2 PF6-] calcd, 1155.8; found, 1155.9. [M4+ + 1 PF6
-] Calc:
722.2; Found: 722.2. [M4+] Calc: 505.4; Found: 505.4. Elemental Anal [Ru-3(Cu)](PF6)4 Calc:
3.88 Ru; 2.44 Cu; Found: 3.65 Ru ; 2.57 Cu. [Ru-4(Cu)2](PF6)6 MS (ESI+) [M6+ + 4PF6-] Calc:
1359.3; Found: 1359.3. [M6+ + 3PF6-] calcd, 857.8; found, 857.9. [M6+ + 2PF6
-] Calc: 607.1;
Found: 607.2. [M6+ + 1PF6-] Calc: 456.7; Found: 456.8. [M6+] Calc: 356.4; Found: 356.5.
Elemental Anal [Ru-4(Cu)2](PF6)6 Calc: 3.36 Ru; 4.22 Cu. Found: 3.45 Ru; 4.50 Cu. [Ru-
5(Cu)2](PF6)6 MS (ESI+) [M6+ + 4PF6-] Calc: 1501.3; Found: 1501.4. [M6+ + 3PF6
-] Calc: 952.6;

165
Found: 952.6. [M6+ + 2PF6-] Calc: 678.2; Found: 678.2. [M6+ + 1PF6
-] Calc: 513.6; Found:
513.6. [M6+] Calc: 403.8; Found: 403.8. Elemental Anal [Ru-5(Cu)2](PF6)6 •NH4PF6 Calc: 2.92
Ru; 3.68 Cu; Found: 2.82 Ru ; 3.55 Cu.
4.3 Methods.
UV-visible absorbance spectra were obtained with a double-beam spectrophotometer
(Varian, Cary 500). Emission spectra were measured using a Photon Technology International
(PTI) fluorescence spectrometer using an 814 photomultiplier detection system. Time resolved
emission decays were measured following excitation using a N2 dye laser (PTI model GL-302),
averaging 16 decays with a 50 µs collection time per point. In variable temperature experiences,
temperature was controlled using a constant temperature bath and flow-through cell housing and
measured using a thermocouple adhered on the outer surface of the quartz cuvette. Samples were
allowed to equilibrate each at temperature for a minimum of 10 minutes (with stirring) prior to
measurement. Quantum yields and radiative and nonradiative decay rates28 at all temperatures
were determined using samples from which oxygen had been using removed in repetitive freeze-
pump-thaw cycles, and finally measured in a sealed cell under nitrogen. Quantum yields were
determined using the relationship:29
2
))101/((
))101/((
refA
ref
A
refrefI
I
Eq (4-1)
where is the radiative quantum yield of the sample; is the known quantum yield of
[Ru(bpy)3]2+ in acetonitrile = 0.062;30 I is the integrated emission, A is the absorbance at the
excitation wavelength; and is the dielectric constant of the solvent, which is assumed to be the
same for the acetonitrile solutions of sample and reference. The rates of radiative (kr) and

166
nonradiative (knr) decay were determined using the measured excited state lifetime () and the
equations:28
nrr kk 1 Eq (4-2)
nrr
r
kk
k
Eq (4-3)
Spectrophotometric emission titrations were conducted in CH3CN solutions at room
temperature in the presence of air using known concentrations of Ru compounds. The
compounds were excited at their MLCT absorbance maxima (ex = 469 nm) and monitored at
their emission maxima (em = 650 nm). Spectra were obtained after stirring the solution with
each known volumes (2 – 15 L) of standard Cu2+ solutions (2 – 4 mM) in CH3CN for 15 min.
Mass spectrometric analysis was performed on a Waters LCT Premier time-of-flight
(TOF) mass spectrometer at the Penn State Mass Spectrometry Facility. Samples were
introduced into the mass spectrometer using direct infusion via a syringe pump. The mass
spectrometer was scanned from 100-2500 m/z in positive ion mode using electrospray ionization
(ESI). NMR spectra were collected using either a 360 or 400 MHz spectrometers (Bruker) in the
Lloyd Jackman Nuclear Magnetic Resonance Facility. Elemental analysis was performed by
Galbraith Industries, with replicate analysis of all metal ratios in the heterometallic structures.
All electrochemical measurements were obtained using a CH Instruments potentiostat
(Model 660) with 0.31 cm diameter glassy carbon working and Pt wire counter electrodes with a
Ag quasi reference electrode. Solutions were prepared from distilled CH3CN containing 0.2 M
TBAP supporting electrolyte; the solutions were deoxygenated by purging with solvent-saturated
N2. Potentials are reported vs. a saturated calomel electrode reference scale using ferrocene as an
internal potential reference standard.

167
4.4 Results and Discussion
4.4.1 Synthesis of Oligopeptides.
Our earlier report of aeg-substituted [Ru(bpy)3]2+ complexes used amide coupling
chemistry to link a bpy-substituted aeg monomer to the Ru complex, and left the chain termini
ester-protected.20a In principle, cleavage of the esters to produce terminal acid groups could be
used to then extend the chains via sequential coupling of additional monomeric units. Our
attempts to use this approach to synthesize the dipeptide-containing Ru complexes resulted in
only very small reaction yields, and an alternative route that prepares and attaches the full-length
oligopeptide was instead used. Scheme 4-2 contains the synthetic steps to synthesize the series of
di- and tripeptides used in these experiments. Deprotection of either the acid or amine termini is
accomplished using the same reagents as solid phase peptide synthesis, but requires isolation
from the solution mixture prior to further reaction. Following selective deprotection of the
monomers, dipeptides were synthesized using standard peptide coupling reagents. For example,
reaction of H2N-aeg(bpy)-OtButyl (1) with Fmoc-aeg(bpy)-COOH with HBTU, HOBT, and
DIPEA produced Fmoc-protected dipeptide 4 in 43.9% yield. Analogous reaction of 1 with
Fmoc-aeg(ac)-COOH gave Fmoc-protected dipeptide 2 in 33.5% yield. As shown in Scheme 4-
2, the Fmoc group was cleaved from dipeptide 2 and its terminal amine was further coupled with
either Fmoc-aeg(ac)-COOH or Fmoc-aeg(bpy)-COOH to afford tripeptides 3 and 5 in 34 % and
40 % yield, respectively. In each case, synthesis of the di- and tripeptides required more time
because of the necessary intermediate purification steps, however the desired materials were
made in gram scale quantities that are not readily achievable with solid-phase peptide synthetic
methods. The purity and identity of the oligopeptides were confirmed by 1H NMR spectroscopy
and mass spectrometry, respectively.

168
Scheme 4-2: Synthetic steps toward di and tripeptides. (i) HBTU, HOBT, DIPEA, CH2Cl2, overnight; (ii) DBU, octanethiol, tetrahydrofuran, overnight.

169
4.4.2 Synthesis of Ru Complexes.
Ruthenium hairpin complexes Ru-2, Ru-3, Ru-4 and Ru-5 were synthesized by reaction
of an excess of amine-terminated di- or tripeptide with [Ru(bpy)2(bpy(COCl)2)]2+ with triethyl
amine in dry dichloromethane. This approach rapidly enabled yields of > 50 % in hundreds of
mg scales. Molecular ion peaks observed in the electrospray mass spectra conclusively identified
the products. Purity of these compounds was assessed by 1H NMR spectroscopy and elemental
analysis. NMR spectra confirmed the expected relative integrations of protons for the di-
substituted Ru complexes; elemental analyses revealed the tendency to retain small amounts of
solvent even after extensive drying. Slight differences between the theoretical and observed mass
percentages of C, H and N, which are likely the result of residual salt (KNO3) from the final
purification column.
Analysis of the redox properties of the Ru complexes was performed using cyclic
voltammetry. Figure 4-12A contains a cyclic voltammogram of an acetonitrile solution of Ru-2
(black line), which is representative of the series of Ru complexes in that each has a reversible
one-electron oxidation at ~1.3 V that is due to the metal centered RuIII/II couple. Three one-
electron reductions are observed in the voltammogram, which are assigned to ligand-centered
reductions of the [Ru(bpy)3]2+ core. The first of these appears at -1.27 V, and is due to the
reduction of the diamide-substituted bpy ligand (e.g. [Ru(bpy)(bpy(aeg)2)] [Ru(bpy)(bpy.-
(aeg)2)]), which is shifted to more positive potentials than the other two bpy ligands in the
complex because of the electron withdrawing nature of the amides. Reductions of the other two
ligands appear at ~ -1.65 V and -1.9 V, and are accompanied with a small amount of chemical
irreversibility, as evidenced by the new (but small) oxidative peaks (~ -0.15 V) during the return
scans. We do not observe separate reduction waves associated with uncoordinated bipyridine

170
Potential (V)
-2-101
Nor
mal
ized
Cu
rren
t (A
)
-0.02
-0.01
0.00
0.01
0.02
0.03
Potential (V)
-2-101
Nor
mal
ized
Cur
rent
(A
)
-0.02
-0.01
0.00
0.01
0.02
0.03
A)
B)
Figure 4-12: Cyclic voltammograms of acetonitrile solutions containing A) 1.09 mM Ru-2 (black line) or 5.09 mM Fmoc-aeg(bpy)-OtButyl (red line) with 0.2 M tetrabutylammonium perchlorate supporting electrolyte, obtained using a 0.068 cm2 area glassy carbon working electrode and a potential scan rate of 75 mV/s. Currents are normalized to concentration. B) potential window increased to include irreversible Fmoc-aeg(bpy)-OtButyl ligand-centered reduction.

171
ligands, consistent with the voltammogram of the bpy monomer (red line); these are outside the
scanned potential window at larger overpotentials (Figure 4-12B). These data are summarized in
Table 4-1, and exhibit only very minor differences in the redox couples across the five Ru
complexes, reflective of their similar central structure.
Absorbance and emission spectra were also measured for each of the Ru complexes in
acetonitrile solutions. In Table 4-1, each of the complexes has an absorbance band with a peak ~
469 nm that is a result of the well-known metal-to-ligand charge transfer band of [Ru(bpy)3]2+.31
The extinction coefficients () and peak maxima do not vary as a function of the pendant aeg
strands in the series of Ru complexes. In solutions that are thoroughly degassed, the quantum
yields and peak wavelengths of the emission band (following excitation at 469 nm) also do not
significantly vary among the Ru complexes. Of central interest to our work is understanding the
processes following photoexcitation of the Ru center by monitoring the transient emission at 650
nm following pulsed excitation. The emission transients of Ru-1 through Ru-5 show that each
has a monoexponential emission decay, indicative of a single species radiatively relaxing to the
ground state. Slight differences in intensity for these decay curves reflect minor variation of the
quantum yields (Figure 4-13). Fits of these emission decay lines provide the excited state
lifetimes, , which are given in Table 4-1 and are approximately the same for all of the
complexes.
4.4.3 Ru-Cu Heterometallic Complexes.
To understand the photophysical behaviors and characterize the heterometallic
complexes, experiments were conducted with samples made at either the preparatory scale or
studied as a function of added Cu2+ during spectrophotometric titrations. Bulk scale synthesis of
ruthenium-copper complexes provided the material necessary for elemental analysis and mass

172
Table 4-1: Photophysical and Electrochemical Data for Ru Hairpin Complexes.
Ru-1 Ru-2 Ru-3 Ru-4 Ru-5 max, abs (nm) a
(, M-1cm-1 x 1000) 469
(13.4) 469
(13.6) 469
(13.5) 469
(13.3) 469
(13.4)
max, em (nm)b 650 650 650 650 650 Фc 0.0405 0.0468 0.0434 0.0541 0.0506
d (µsec) 1.18 1.16 1.12 1.21 1.20 kr x 104 (sec-1) e 3.43 4.02 3.87 4.47 4.20 knr x 105 (sec-1) e 8.12 8.19 8.54 7.80 7.88 Eo Ru3+/2+
(V)f 1.29 1.29 1.29 1.28 1.28 Eo Ru2+/1+
(V)f -1.26 -1.27 -1.35 - 1.27 -1.27 Eo Ru1+/0
(V)f -1.65 -1.65 -1.54 -1.65 -1.63 Eo Ru0/-1
(V)f -1.88 -1.91 -1.99 -1.90 -1.89 a Maximum absorbance wavelength and extinction coefficient for the metal to ligand charge transferband. b Peak emission wavelength following excitation at max,abs. c Emission quantum yields following excitation at max,abs , determined using Eq 1 [Ru(bpy)3]
2+ in CH3CN (Ф = 0.062) as a reference.30d Excited state lifetime in dearated CH3CN solutions, determined from the emission decay following pulsed excitation at max,abs.
e Rates of radiative (kr) and nonradiative decay (knr) calculated using Eq 2 and 3. f Reaction formal potentials vs. SCE, measured in 0.2 M TBAP indearated CH3CN.

173
time (ns)
0 1000 2000 3000 4000 5000
Nor
mal
ized
Em
issi
on In
tens
ity
0.0
2.0e+6
4.0e+6
6.0e+6
8.0e+6
1.0e+7
1.2e+7
1.4e+7
wavelength (nm)
600 700 800
Nor
m. E
m. I
nt.
0.0
0.5
1.0
Figure 4-13: Comparison of the time-dependent emission of () 47.8 μM Ru-1; () 39.80 μM Ru-2; () 43.14 μM Ru-3; () 37.6 μM Ru-4; and () 40.14 μM Ru-5 at em, max
following a 800 ps excitation pulse at ex = 469 nm in deoxygenated solutions in CH3CN. Decay curves are normalized to complex concentration. Inset: Emission spectrum of Ru-2 in deoxygenated CH3CN.

174
spectrometry. A challenge for inorganic supramolecular analysis is the ionization of large and
highly charged species, which presents difficulties especially when these contain labile metal
ions. However, using softer ionization methods, we were able to obtain mass spectra for all of the
heterometallic complexes. In each case, molecular ion peaks for species with charges ranging
from +2 up to +6 were observed for Ru-2(Cu), Ru-3(Cu), Ru-4(Cu)2, and Ru-5(Cu)2 in Figures
4-14, 4-15, 4-16, and 4-17, respectively. For example in Figure 4-17, peaks corresponding to
M2+, M3+, M4+, M5+ and M6+ molecular ions were observed for the trimetallic [Ru-5(Cu)2]6+
complex associated with decreasing numbers of PF6- anions. In comparison with the calculated
isotopic splitting patterns expected for these species, these data conclusively identify the
heterometallic complexes.
Elemental analysis was used to further characterize the multimetallic complexes: with the
pure Ru complexes in hand, elemental analyses focused on the comparison of the relative
amounts of Cu and Ru in the products. We had previously reported the Ru:Cu mole ratio in Ru-
1(Cu) to be 1: 0.99.20 In the new dimetallic structures, the determined molar ratios of Ru:Cu in
the Ru-2(Cu), and Ru-3(Cu) complexes are 1 Ru: 0.96 Cu and 1 Ru: 1.11 Cu, respectively. In
complexes Ru-4(Cu)2 and Ru-5(Cu)2 these values were found to be 1 Ru:2.07 Cu and 1 Ru:2.00
Cu, respectively. These elemental analyses confirm that the isolated products contain the
expected molar ratios of Ru and Cu for the pure heterometallic species, with minor differences
between theoretical and experimental molar ratios of Ru and Cu that are most likely the result of
solvent or salt.
4.4.4 Copper Coordination Emission Titrations.
In Scheme 4-1, the structural variations were designed to probe the impact of the spacing
and number of coordinated Cu2+ ions on the quenching of [Ru(bpy)3]2+ emission. Crystallization

175
m/z
433 434 435 436
m/z
625 626 627 628 629 630
m/z
1010 1012 1014 1016 1018
Theoretical
Measured
M2+ M3+ M4+
Figure 4-14: Molecular ion peaks observed by positive ion electrospray mass spectrometry,plotted together with the calculated mass and isotopic splitting patterns for [Ru-2(Cu)](PF6)4.

176
m/z
1152 1154 1156 1158 1160
m/z
720 721 722 723 724 725
m/z
504 505 506 507 508
M2+ M3+ M4+Theoretical
Measured
Figure 4-15: Molecular ion peaks observed by positive ion electrospray mass spectrometry,plotted together with the calculated mass and isotopic splitting patterns for [Ru-3(Cu)](PF6)4.
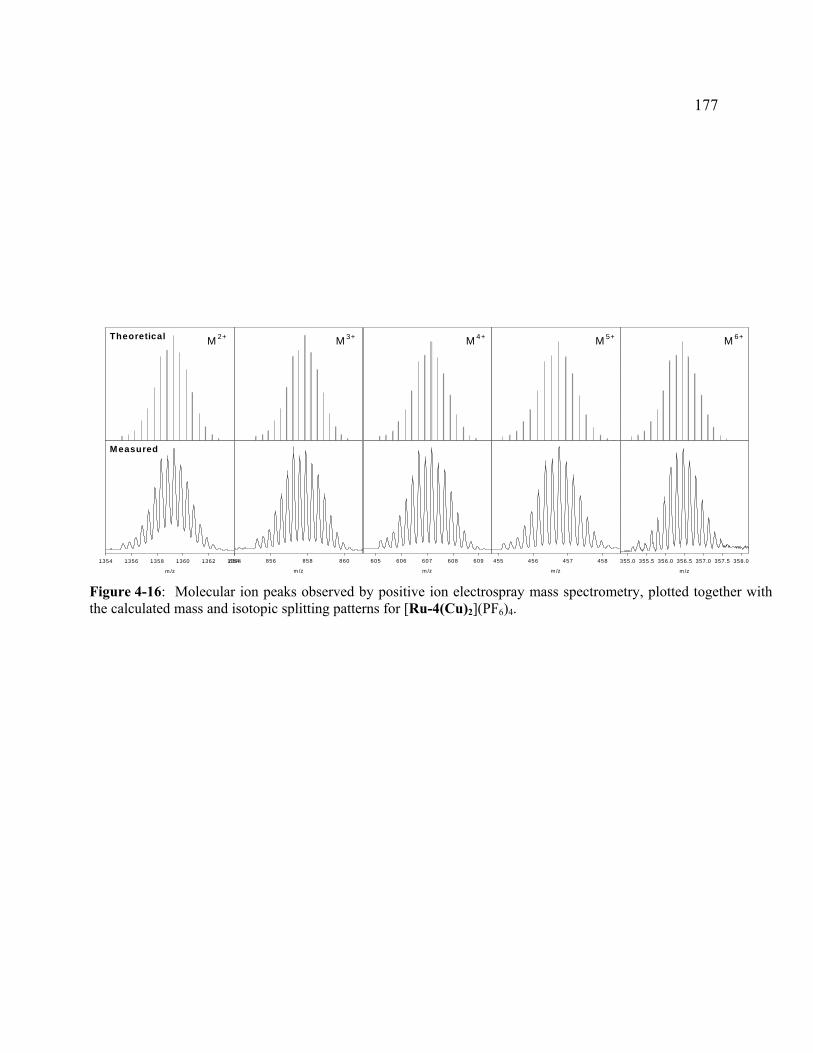
177
m /z
1354 1356 1358 1360 1362 1364
m /z
854 856 858 860
m /z
605 606 607 608 609
m /z
455 456 457 458
m /z
355.0 355.5 356.0 356.5 357.0 357.5 358.0
Theoretical
Measured
M 2+ M 3+ M 4+ M 5+ M 6+
Figure 4-16: Molecular ion peaks observed by positive ion electrospray mass spectrometry, plotted together with the calculated mass and isotopic splitting patterns for [Ru-4(Cu)2](PF6)4.

178
m/z
402.5 403.0 403.5 404.0 404.5 405.0
m/z
512 513 514 515
m/z
676 677 678 679 680 681
m/z
950 952 954 956
m/z
1496 1498 1500 1502 1504 1506
M2+ M3+ M4+ M5+ M6+Theoretical
Measured
Figure 4-17: Molecular ion peaks observed by positive ion electrospray mass spectrometry, plottedtogether with the calculated mass and isotopic splitting patterns for [Ru-5(Cu)2](PF6)6.

179
attempts are still ongoing in our labs, however for understanding the solution phase emission
quenching dynamics, the metal-metal distances in solution are more germane. We therefore
qualitatively consider the relative molecular structures and dynamics and compare these to
observed spectroscopic results. In a fully-extended (all-trans) aminoethylglycine chain (modeled
using Hyperchem 6.0, and which has been described for peptide nucleic acid chains32), the
(through space) distance between substituents (e.g. bpy or ac) is ~ 7 Å; we use this as an
approximation of the distances between tethered metal complexes. [Note that the distance
through-bond, using known bond lengths, is ~ 13 Å between substituents.] In solution, the aeg
chains are most certainly flexible and the solution structures dynamic, so that the separation
distance between metal centers is likely to vary. However, it is probable that the length of the
oligopeptides and the charges of the metal complexes place some energetic restraints on this. In
the case of Ru-1, the single aeg backbone unit is short and the Cu crosslink is relatively strained
compared to the longer strands of Ru-2 and Ru-3. As a result, the through-space distance
between Ru and Cu in Ru-3 (~ 23 Å maximum) is expected to be larger than in Ru-2 (~16 Å
maximum) and Ru-1 (~ 9 Å maximum), but to also vary more greatly because of the
conformational dynamics of the longer, flexible tripeptide backbone. When additional metals
crosslink the strands, e.g. in Ru-4 (Ru-Cu distance ~ 9 Å, Cu – Cu ~ 7 Å, maximum) and Ru-5
(Ru-Cu ~ 9 Å, Cu – Cu ~ 14 Å, maximum), these are expected to somewhat limit the chain
flexibility. Electrostatic repulsions of the +2 charged metal complexes would bias the structures
toward more extended conformations but not completely limit the dynamic nature of the chains’
motions. This qualitative picture is applied to the measured emission quenching and rates to
understand the role of structure on photochemistry of the multimetallic complexes.
In complex Ru-1, coordination to a molar equivalent of Cu2+ ion resulted in 97%
quenching of the photoemission of the Ru complex.20a Our interest in understanding the process
by which this occurs led us to examine the role of the number and separation of Cu2+ ions bound
180
by the Ru hairpin complexes. The emission spectra for Ru hairpin complexes following
excitation at 469 nm are identical for the series of Ru complexes. In each case emission is initially
bright but incremental addition of Cu2+ to the solution causes the emission intensity to decrease as
can be seen in Figure 4-18 for the addition of Cu2+ to Ru-4. Figure 4-19A plots the
spectrophotometric titration data for complexes containing a pair of free bipyridine ligands (e.g.
Ru-1, Ru-2, and Ru-3), monitoring the emission intensity at em = 650 nm following addition of
Cu2+. These data reveal that for these complexes the emission intensity decreases with Cu2+ until
reaching a stoichiometric point of [Cu] ≈ [Ru], after which the intensity levels and is constant.
These molar ratios are consistent with the formation of the dimetallic complexes containing
[Cu(bpy)2]2+ coordinative crosslinks, and which are observed in the bulk-scale preparation, Ru-1-
(Cu), Ru-2-(Cu), and Ru-3-(Cu). The final intensities of the titration curves in Figure 4-19A
(i.e. after the equivalence point) are similar for the three compounds, and correspond to
quenching of the initial Ru(bpy)3 emission by 97%, 95% and 90% in Ru-1-(Cu), Ru-2-(Cu) and
Ru-3-(Cu), respectively. Differences in the quenching efficiency of the bound Cu2+ ion are
attributed to the length of the oligopeptide, and the relative rates are quantitatively examined in
thoroughly dearated solutions below. In a control experiment, titration of [Cu(bpy)2]2+ into a
solution containing [Ru(bpy)3]2+ (i.e. without an aeg linker) at identical concentrations, no
quenching of the Ru emission is observed (Figure 4-20) even after 5 molar equivalents of Cu
have been added.
Compounds Ru-4 and Ru-5 each contain four free bipyridine ligands that are available
for Cu2+ binding to form [Cu(bpy)2]2+ crosslinks. Metal binding stoichiometry was determined by
the spectrophotometric emission titration as a function of Cu(NO3)2 added to the solution. In
Figure 4-19B, the emission intensities of Ru-4 and Ru-5 (at 650 nm) are plotted versus the
relative amount of added Cu2+. A striking difference between these titration curves and those in
Figure 4-19A (and reported previously20a) is that in both complexes the emission is quenched in

181
Wavelength (nm)
550 600 650 700 750 800 850
Nor
mal
ized
Em
issi
on In
tens
ity
0.0
0.2
0.4
0.6
0.8
1.0
Figure 4-18: Normalized emission intensity (em = 650 nm) of Ru-4 hairpin complex in CH3CN solutions following excitation at λex = 469 nm during a titration of sequential addition of Cu2+.

182
B
Moles Cu2+/Ru2+
0 1 2 3 4
Nor
mal
ized
Em
issi
on In
tens
ity
0.0
0.2
0.4
0.6
0.8
1.0
moles Cu2+/Ru2+
1 2 3 4
No
rm. E
mit.
Int.
0.00
0.05
0.10
0.15
Moles Cu2+/Ru2+
0.0 0.2 0.4 0.6 0.8 1.0 1.2 1.4 1.6
Nor
mal
ized
Em
issi
on In
tens
ity
0.0
0.2
0.4
0.6
0.8
1.0
A
B
Figure 4-19: (A) Plot of emission intensity of CH3CN solutions containing (●) 140 M Ru-1with addition of 5 µL aliquots of 5.3 mM Cu(NO3)2; (○) 58.7 M Ru-2 with additions of 5 µL aliquots of 3.41 mM Cu(NO3)2; (▼) 104 M Ru-3 with additions of 5 µL aliquots of 4.86 mM Cu(NO3)2. (B) Plot of emission intensity of CH3CN solutions of (●) 95.0 M Ru-4 and (○) 57.6 M Ru-5 after incremental additions of 7 µL of 2.83 mM Cu(NO3)2 and 5 µL of 3.86 x 10⁻³ mM Cu(NO3)2, respectively, versus the molar ratio of Cu2+ to Ru2+. Inset: Expanded region of the titration curve at higher Cu2+ concentrations.

183
Moles Cu2+ / Ru2+
0 1 2 3 4 5
Nor
mal
ized
Em
issi
on In
tens
ity
0.0
0.2
0.4
0.6
0.8
1.0
Figure 4-20: Comparison of emission titrations of Ru-2 (●) and Ru-4 (○) with Cu(NO3)2 and Ru(bpy)3
2+ (▼) with [Cu(bpy)2](NO3)2.

184
two distinct phases. For both compounds, the intensity decreases until the Cu2+ concentration is
equal to the Ru complex concentration, at which point the Ru emission is quenched by ~ 84%,
less than observed in Ru-1, Ru-2, and Ru-3. As more Cu2+ is added to Ru-4 and Ru-5, so that
[Cu] > [Ru], the emission intensity continues to decrease until ~ 2 molar equivalents of Cu2+ are
in the solution (inset of Figure 4-19B). After 2 equivalents of Cu2+ are injected, the emission is
quenched by 97% for both Ru-4 and Ru-5.
We attribute the two inflections of the titration curves in Figure 4-19B to the sequential
binding of two Cu2+ ions each by Ru-4 and Ru-5. As depicted in Figure 4-21, during the titration
the first Cu2+ ion to bind can form [Cu(bpy)2]2+ by coordination with two of the four pendant bpy
ligands (note that the close proximity on the backbone prevents bpy ligands on the same aeg
chain from wrapping around the same metal ion).19a Our observations of Cu2+ binding by Ru-1,
Ru-2 and Ru-3 suggest slightly different quenching efficiencies based on the location of the
[Cu(bpy)2]2+ crosslink. The lower observed quenching efficiency of Ru-4 and Ru-5 at one molar
equivalent of Cu2+ is consistent with having a mixture of locations of the Cu2+ between the two
dipeptide strands (i.e. via pathway I or II in Figure 4-21, or other possible isomers). Lability of
the copper ion, together with further addition of Cu2+, enables rearrangement and binding of a
second metal ion (reaction I’ or II’ in Figure 4-21) and ultimate quenching efficiency of 97%. In
both Ru-4-(Cu)2 and Ru-5-(Cu)2, because the closest Ru-Cu distance is equivalent to that in the
Ru-1-(Cu) dimetallic complex, the quenching efficiencies are approximately the same.
4.4.5 Time-Resolved Emission Spectroscopy.
To obtain quantitative rate information about the process by which the Ru excited state is
quenched, the solutions were carefully deoxygenated (by several cycles of freeze-pump-thaw)
and the time-dependent emission decays and quantum yields were examined. The emission

185
Figure 4-21: Depiction of the sequential binding of two Cu2+ ions (blue sphere) by Ru-4 or Ru-5(red sphere)

186
transients following an 800 ps excitation pulse were fit to monoexponential decays to give the
excited state lifetimes listed in Table 4-2 for each of the heterometallic complexes. In comparison
with monometallic Ru-1, the excited state lifetimes are ~ 2 orders of magnitude shorter when
Cu2+ is bound. Using solutions with known concentrations, the absorbance and integrated
emission peaks were measured and used to determine the emission quantum yields (Table 4-2).
Similar to the impact on lifetime, the quantum yields decrease drastically upon Cu2+ coordination.
Together with the quantum yields, the excited state lifetimes were used to determine the
rate of radiative (kr) and nonradiative (knr) relaxation. In Ru-1, the radiative and nonradiative
relaxation rates are relatively similar in magnitude (~105 s-1). Addition of Cu2+ does not change
the radiative relaxation rate but causes a ~ 30-fold increase in the nonradiative relaxation rate, the
latter of which is dependent on the number and location of the [Cu(bpy)2]2+ crosslinks. For the
dimetallic complexes, knr slightly decreases as the [Cu(bpy)2]2+ complex is moved farther away
from the Ru center. Addition of a second Cu2+ to the complex slightly increases knr.
The temperature dependence of the relaxation rates following excitation in the series of
complexes was also measured to begin to understand the dynamics in these systems. In all cases,
the quantum yields and excited state lifetimes were measured as a function of temperature to
accurately obtain the values of kr and knr (Table 4-3). Figure 4-22 contains the activation plots
for the calculated values of knr for each of the heterometallic compounds; using the slopes of
these lines, the activation energy (Ea) and intercepts (A) are determined (Table 4-2). For
comparison, these data were also obtained for Ru-1, in which the excited state is long lived and
there is no bound [Cu(bpy)2]2+. Consistent with the trends observed for knr, Ea increases with the
distance between Ru and Cu (e.g. Ru-1-(Cu), Ru-2-(Cu) and Ru-3-(Cu)) yet the barriers for the
trimetallic structures (e.g. Ru-4-(Cu)2 and Ru-5-(Cu)2) are similar and approximately the same
as in Ru-1-(Cu). The intercepts are approximately the same for all of the heterometallic
complexes, consistent with an intramolecular quenching mechanism that requires similar

187
Table 4-2: Photophysical data for Ru-Cu Heterometallic Complexes
Ru-1 Ru-1-(Cu) Ru-2-(Cu) Ru-3-(Cu) Ru-4-(Cu)2
Ru-5-(Cu)2
τ a (ns) 1180 34.3 38.0 51.5 32.0 32.7 Ф a 0.0405 0.00100 0.00168 0.00186 0.00119 0.0012
kr x 104 (sec-1) a 3.43 2.93 4.42 3.60 3.74 3.63 Ea, kr (kJ/mol) b 2.76 ± 0.5 1.29 ± 0.4 10.6 ± 0.3 7.86 ± 0.6 3.9 ± 0.4 1.9 ± 0.3
log Akr c 5.1 ± 0.1 4.7 ± 0.1 6.5 ± 0.1 5.9 ± 0.1 5.3±0.1 4.9 ± 0.01
knr x 107 (sec-1) a
0.081 2.91
2.62 1.93 3.14 3.05
Ea, knr (kJ/mol) b 2.0 ± 0.5 3.5 ± 0.3 7.5 ± 0.4 10.0 ± 0.4 4.4 ± 0.3 3.5 ± 0.3
log Aknr c 6.3 ± 0.1 8.1 ± 0.1 8.7 ± 0.1 9.0 ± 0.1 8.3 ± 0.1 8.1 ± 0.1
a emission lifetime (), quantum yield (), radiative and nonradiative (kr and knr) rate constants at 25oC in dearated CH3CN solutions. b activation energy, determined from the slopes of Arrheniusplots as in Figure 6. c Intercept of the activation plot, in s-1.

188
1000/T (K-1)
3.1 3.2 3.3 3.4 3.5 3.6 3.7
log(
k nr)
7.1
7.2
7.3
7.4
7.5
Figure 4-22: Arrhenius plot of the non-radiative relaxation rate (knr) for (●) 41 μM Ru-1-(Cu); (○) 53 μM Ru-2-(Cu); (▼) 40 μM Ru-3-(Cu); () 36 μM Ru-4-(Cu)2; and (■) 17 μM Ru-5-(Cu)2 in deoxygenated CH3CN solutions.

189
Table 4-3: Temperature-dependent emission decay data taken in freeze-pump thawed CH3CN.
Compound T (C) τ (ns) kr (sec-1) / 104 knr (sec-1) / 107 0 38.7 4.0 2.58 5 36.6 4.20 2.73 15 36.91 4.04 2.70 25 34.3 4.24 2.93 35 32.6 4.29 3.06 40 31.73 4.26 3.15
Ru-1(Cu)
50 29.94 4.47 3.33 0 51 2.64 1.96 5 47.5 2.89 2.10 15 41.2 3.48 2.42 25 38 3.86 2.62 35 34.2 4.60 2.92
Ru-2(Cu)
41 33.3 4.85 3.00 0 74.9 2.76 1.33 5 68.6 2.90 1.46 15 59.9 3.12 1.69 25 51.5 3.61 1.93 35 43.9 4.71 2.27 40 42.5 4.13 2.35
Ru-3(Cu)
50 38.3 4.74 2.60 0 36.85 3.02 2.71 5 35.82 3.00 2.79 15 34.06 3.17 2.93 25 31.4 3.35 3.11 35 29.97 3.53 3.33
Ru-4(Cu)2
40 28.47 3.76 3.51 0 37.21 3.67 2.69 5 35.21 3.79 2.84 15 34.89 3.75 2.87 25 32.74 3.94 3.05 35 30.92 4.07 3.23
Ru-5(Cu)2
51 28.93 4.18 3.46

190
molecular rearrangements for the series of structures.
As is often the case with excited state quenching in donor-acceptor assemblies,
quenching of the emissive Ru complex could occur by energy22 or electron transfer mechanisms
or a combination of these.22 Experimentally distinguishing the contributions of these possible
pathways is challenging, however the above data do offer some insight into these systems. The
weak extinction coefficient of the [Cu(bpy)2]2+ complex makes energy transfer a possible but
likely minor component of the excited state quenching.20a,33 The favorable redox potentials of the
excited state Ru complex (Eo Ru3+/2+* ~ - 0.64 V vs. SCE)34 and tethered Cu complexes (Eo Cu2+/1+
= 0.04 V vs. SCE) make quenching by electron transfer an energetically favorable pathway (G ~
-0.7 eV),7b following the reaction:
])([])([])([)]()([ 232*
2 bpyCubpyRubpyCubpybpyRu IIIIIIIII Eq (4-4)
It is important to note that the electron donor and acceptor species are tethered by two aeg strands
(indicated by the dash in Eq 4-4), essentially holding them at locations that are expected to be
close to the precursor state. In this quenching route, charge recombination by back electron
transfer (G ~ -1.2 eV) would restore the ground state Ru(II) and Cu(II) complexes. In the
heterometallic complexes, the measured knr are most likely dominated by the reaction in Eq 4-4,
since the rate constants increase by orders of magnitude in the complexes containing Cu2+.
Addition of a second bound Cu2+ to Ru-4 and Ru-5 slightly increases knr, which could be due to
electron hopping between Cu centers (vide infra) or the impact of increased structural rigidity
with the added metal crosslink. The latter of these would be expected to increase knr in either
electron or energy transfer mechanism.
The modular nature of the aeg backbone allows us to easily prepare a series of molecules
with increasing separation between the electron donor and acceptor sites. While it is clear from
these data that knr and the separation distance are inversely related, it is striking that this

191
dependence is relatively shallow. That is, electron transfer via tunneling through-bond would
predict an exponential relationship between knr and distance ( exp-r); energy transfer quenching
would have an inverse distance dependence ( r-6) – these are clearly not the case, even given the
inexactly known and dynamic Ru-Cu separation in solution. It is possible that the quenching
mechanism changes as distance increases;33b over this range of structures the similarity in
measured rates is not suggestive of mechanistic changes. Further, as the Ru-Cu distance
increases the slower knr is a function of the higher activation barriers and not changes in the pre-
exponential term. Larger barriers as a function of distance are consistent with additional outer
sphere contributions, including solvent and counterion reorganization, prior to either electron or
energy transfer.35 The comparable intercepts implies that any molecular rearrangements to bring
the Ru and Cu complexes into the precursor state prior to quenching are similar for the series of
complexes: this would require concerted motion of the Cu-complex-linked strands on a short time
scale. The current molecules and experiments are unable to distinguish between molecular
folding to enable short distance events and quenching over larger distances, but ongoing studies
in our group aim to resolve this question.
In the trimetallic complexes, if quenching occurs by electron transfer to the nearest Cu,
there is also the smaller probability of directly reducing the more distal Cu2+ complex. In either
case, an initial electron transfer step would result in formation of adjacent and mixed valent Cu
complexes:
])([])([])([])([])([)]()([ 22322*
2 bpyCubpyCubpyRubpyCubpyCubpybpyRu IIIIIIIIIIIII
Eq (4-5)
which is a charge-separated species that could undergo charge recombination to return to the
initial ground state or alternatively, the electron could self-exchange between neighboring Cu
complexes according to:

192
])([])([])([])([])([)]()([ 22322*
2 bpyCubpyCubpyRubpyCubpyCubpybpyRu IIIIIIIIIIIII
Eq (4-6)
The product in Equation 4-6 would have a greater charge separation distance (and could
form by direct electron transfer from the excited state Ru complex), but would also undergo back
electron transfer to return to the divalent Ru complex. The time resolved and temperature
dependent data in Table 4-2 only allow us to conclude that the rate of nonradiative decay is the
same for Ru-4-(Cu)2 and Ru-5-(Cu)2 and approximately the same as for the Ru-1-Cu species, all
of which have the same distance between Ru and the closest Cu crosslink. If electron transfer is
the quenching mechanism in these systems, differences would expected for the back electron
transfer rates for Ru-1-Cu, Ru-4-(Cu)2 and Ru-5-(Cu)2 but these may only be observable in
transient absorption experiments that are outside the scope of the current report.
4.5 Conclusions.
In this chapter we have shown the use of flexible artificial oligopeptide construction to
prepare a series of [Ru(bpy)3]2+ complexes with pendant bpy ligands that coordinate Cu2+ to form
[Cu(bpy)2]2+ crosslinks. Variation of the oligopeptide sequences provides heterometallic
complexes with variable spacing between the Ru and Cu centers and that are di- or tri-metallic.
The [Cu(bpy)2]2+ crosslinks quench the excited state emission of the Ru complex. Time resolved
and temperature dependent emission studies point toward an electron transfer quenching
mechanism but do not rule out energy transfer. These results demonstrate that self-assembly of
structures made from metal coordination based recognition of artificial oligopeptides provide a
controlled arrangement of chromophores, electron donors and acceptors in a new approach for
mimicking photosynthesis. Absorption and emission maxima, electron transfer rates, and
quantum yields are a function of both ligand and metal identity and the distance between them.

193
Interactions between these species are tunable using our modular peptides, providing a readily
tailorable set of structures and enabling the construction of more complex architectures and
foreshadow a future in which light energy is efficiently harnessed and used. Our ongoing studies
aim to use the modular artificial amino acid subunits to construct polyfunctional structures with
redox and energy cascades to create long-lived charge-separated states, and to apply time-
resolved spectroscopic techniques to study these.
4.6 Acknowledgements.
We are grateful for financial support from the U.S. Department of Energy (DE-FG02-
08ER15986). We thank L. A. Levine for helpful comments for the mass spectrometry
experiments.
4.7 References
1. (a) Wasielewski, M. R. J. Org. Chem. 2006, 71, 5051–5066; (b) Wasielewski, M. R. Chem.
Rev. 1992, 92, 435–461; (c) Lewis, F. D.; Letsinger, R. L.; Wasieleski, M. R. Acc. Chem.
Soc. 2001, 34, 159 – 170.
2. (a) Meyer, T. J. Acct. Chem. Res. 1989, 22, 163 – 170. (b) Alstrum-Acevedo, J. H.;
Brennaman, M. K.; Meyer, T. J. Inorg. Chem. 2005, 44, 6802 – 6827. (c) Huynh, M. H. V.;
Meyer, T. J. Chem. Rev. 2007, 107, 5004 – 5064.
3. (a) Lomoth, R.; Magnuson, A.; Sjodin, M.; Huang, P.; Styring, S.; Hammarstrom, L.
Photosynthesis Research 2006, 87, 25 – 40. (b) Martin, N.; Sanchez, L.; Illescas, B.; Perez, I.
Chem. Rev. 1998, 98, 2527 – 2547.

194
4. Kodis, G.; Herrerro, C.; Palacios, R.; Marino-Ochoa, E.; Gould, S.; de la Garza, L.; van
Grondelle, R.; Gust, D.; Moore, T. A.; Moore, A. L.; Kennis, J. T. M. J. Phys. Chem. B 2004,
108, 414 – 425.
5. (a) Abrahamsson, M. L. A.; Baudin, H. B.; Tran, A.; Philouze, C.; Berg, K. E.; Raymond-
Johansson, M. K.; Sun, L.; Akermark, B.; Styring, S.; Hammarstrom, L. Inorg. Chem, 2002,
41, 1534 – 1544. (b) Haung, P.; Hogblom, J; Anderlund, M. F.; Sun, L.; Manguson, A.;
Styring, S. J. Inorg. Biochem. 2004, 98, 733 – 745. (c) Falkenstrom, M; Johansson, O.;
Hammarstrom, L. Inorg. Chim. Acta 2007, 360, 741 – 750.
6. (a) Du, P.; Schneider, J.; Jarosz, P.; Zhang, J.; Brennessel, W. W.; Eisenberg, R. J. Phys.
Chem. B 2007, 111, 6887 – 6894. (b) Lazarides, T.; McCormick, T.; Du, P.; Luo, G.; Lindley,
B.; Eisenberg, R. J. Am. Chem. Soc. 2009, 131, 9192 – 9194. (c) Du, P.; Schneider, J.; Luo,
G.; Brennessel, W. W.; Eisenberg, R. Inorg. Chem. 2009, 48, 4952 – 4962. (d) Jarosz, P.
Lotito, K.; Schneider, J.; Kumaresan, D.; Schmehl, R.; Eisenberg, R. Inorg. Chem. 2009, 48,
2420 – 2428.
7. (a) Balazs, G. C.; del Guerzo, A.; Schmehl, R. H. Photochem. Photobiol. Sci. 2005, 4, 89 –
94. (b) Mellace, M. G.; Fagalde, F.; Katz, N. E.; Hester, H. R.; Schmehl, R. J. Photochem.
Photobiol A: Chem. 2006, 181, 28 – 32. (c) Wang, X.; Guerzo, A. D.; Baitalik, S.; Simon,
G.; Shaw, G. B.; Chen, L. X.; Schmehl, R. Photosynth. Research, 2006, 87, 83 – 103.
8. Tran, E.; Cohen, A. E.; Murray, R. W.; Rampi, M. A.; Whitesides, G. M. J. Am. Chem. Soc.
2009, 131, 2141 – 2150.
9. (a) Concepcion, J. J.; Jurss, J. W.; Templeton, J. L.; Meyer, T. J. Proc. Nat. Acc. Sci. 2008,
105, 17632 – 17635. (b) Concepcion, J. J.; Brennaman, M. K.; Deyton, J. R.; Lebedeva, N.
V.; Forbes, M. D. E.; Papanikolas, J. M.; Meyer, T. J. J. Am. Chem. Soc. 2007, 129, 6968 –

195
6969. (c) Fleming, C. N.; Brennaman, M. K.; Papanikolas, J. M.; Meyer, T. J. Dalton
Trans. 2009, 20, 3903 – 3910.
10. (a) Lewis, F. D.; Liu, X.; Wu, Y.; Zuo, X. J. Am. Chem. Soc. 2003, 125, 12729 – 12731. (b)
Lewis, F. D.; Wu, Y.; Zhang, L.; Zuo, X.; Hayes, R. T.; Wasielewski, M. R. J. Am. Chem.
Soc. 2004, 126, 8206 -8215. (c) Zeidan, T. A.; Carmieli, R.; Kelley, R. F.; Wilson, T. M.
Lewis, F. D.; Wasielewski, M. R. J. Am. Chem. Soc. 2008, 130, 13945 – 13955. (d)
Daublain, P.; Siegmund, K.; Hariharan, M.; Vura-Weis, J.; Wasielewski, M. R.; Lewis, F. D.;
Shafirovich, V.; Wang, Q.; Raytchev, M.; Fiebig, T. Photochem. Photobiol. Sci. 2008, 7,
1501 – 1508.
11. (a) Funston, A. M.; Silverman, E. E.; Miller, J. R.; Schanze, K. S. J. Phys. Chem. B 2004,
108, 1544 – 1555. (b) Paulson, B. P.; Miller, J. R.; Gan, W. X.; Closs, G. J. Am. Chem. Soc.
2005, 127, 4860 – 4868. (c) Asaoka, S.; Takeda, N.; Iyoda, T.; Cook, A. R.; Miller, J. R. J.
Am. Chem. Soc. 2008, 130, 11912 – 11920.
12. (a) Visoly-Fisher, I.; Daie, K.; Teraznon, Y.; Herrero, C.; Fungo, R.; Otero, L.; Durantini, D.;
Silber, J. J.; Sereno, L.; Gust, D.; Moore, T. A.; Moore, A. L.; Lindsay, S. M. Proc. Nat. Acc.
Sci. 2006, 103, 8686 – 8690. (b) He, J.; Fu, Q.; Lindsay, S.; Ciszek, J. W.; Tour, J. M. J. Am.
Chem. Soc.2006, 128, 14828 – 14835. (c) He, J.; Chen, F.; Lindsay, S. Appl. Phys. Lett.
2007, 90, 072112-1 – 072112-3. (d) He. J.; Lin, L.; Liu, H.; Zhang, P.; Lee, M.; Sankey, O.
F.; Lindsay, S. M. Nanotechnology 2009, 20, 075102-1 – 075201-8.
13. He, J.; Forzani, E. S.; Nagahara, L. A.; Tao, N.; Lindsay, S. J. Phys.: Condens. Matter
2008, 20, 374120.
14. (a) Rybtchinski, B.; Sinks, L. E.; Wasielewski, M. R. J. Am. Chem. Soc. 2004, 126, 12268–
12269. (b) Palacios, R. E.; Kodis, G.; Herrero, C.; Ochoa, E. M.; Gervaldo, M.; Gould, S. L.;

196
Kennis, J. T. M.; Gust, D.; Moore, T. A.; Moore, A. L. J. Phys. Chem. B 2006, 110, 25411 –
25420. (c) Imahori, H. J. Phys. Chem. B 2004, 108, 6130 – 6143.
15. (a) Jensen, R. A.; Kelley, R. F.; Lee, S. J.; Wasielewski, M. R.; Hupp, J. T.; Tiede, D. M.
Chem. Commun. 2008, 16, 1886 – 1888. (b) Slone, R. V.; Hupp, J. T.; Stern, C. L.; Albrecht-
Schmitt, T. E. Inorg. Chem. 1996, 35, 4096 – 4097.
16. (a) Kryschenko, Y. K.; Seidel, S. R.; Arif, A. M.; Stang, P. J. J. Am. Chem. Soc. 2003, 125,
5193 – 5198. (b) Northrop, B. H.; Yang, H. B.; Stang, P. J. Inorg. Chem. 2008, 47, 11257 –
11268. (c) Yang, H.; Northrop, B. H.; Zheng, Y.; Ghosh, K.; Lyndon, M. M.; Muddiman, D.
C.; Stang, P. J. J. Org. Chem. 2009, 74, 3524 – 3527. (d) Ghosh, K.; Hu, J.; White, H. S.;
Stang, P. J. J. Am. Chem. Soc. 2009, 131, 6695 – 6697.
17. (a) Kuciauskas, D.; Monat, J. E.; Villahermosa, R.; Gray, H. B.; Lewis, N. S.; McCusker, J.
K. J. Phys. Chem. B 2002, 106, 9347 – 9358. (b) Khalil, M.; Marcus, M. A.; Smeigh, A. L.;
McCusker, J. K.; Chong, H. H. W.; Schoenlein, R. W. J. Phys. Chem. A 2006, 110, 38 – 44.
(c) Guo, D.; McCusker, J. K. Inorg. Chem. 2007, 46, 3257 – 3274. (d) Soler, M.; McCusker,
J. K. J. Am. Chem. Soc. 2008, 130, 4708 – 4724.
18. (a) McGarrah, J. E.; Hupp, J. T.; Smirnov, S. N. J. Phys. Chem. A 2009, 113, 6430 – 6436.
(b) Kelley, R. F.; Lee, S. J.; Wilson, T. M.; Nakamura, Y.; Tiede, D. M.; Osuka, A.; Hupp, J.
T.; Wasielewski, M. R. J. Am. Chem. Soc. 2008, 130, 4277 – 4284.
19. (a) Gilmartin, B. P.; Ohr, K.; McLaughlin, R. L.; Koerner, R.; Williams, M. E. J. Am. Chem.
Soc. 2005, 127, 9546–9555. (b) Ohr, K.; Gilmartin, B. P.; Williams, M. E. Inorg. Chem.
2005, 44, 7876–7885. (c) Gilmartin, B. P.; McLaughlin, R. L.; Williams, M. E. Chem. Mater.
2005, 17, 5446–5454. (d) Levine, L. A.; Morgan, C. M.; Ohr, K.; Williams, M. E. J. Am.
Chem. Soc. 2005, 127, 16764 – 16765. (e) Ohr, K.; McLaughlin, R. L.; Williams, M. E.

197
Inorg. Chem. 2007, 46, 965–974. (f) Levine, L. A.; Youm, H. W.; Yennawar, H. P.;
Williams, M. E. Eur. J. Inorg. Chem. 2008, 26, 4083 – 4091.
20. (a) Myers, C. P.; Gilmartin, B. P.; Williams, M. E. Inorg. Chem. 2008, 47, 6738 – 6747. (b)
Levine, L. A,; Kirin, S. I.; Myers, C. P.; Showalter, S. A.; Williams, M. E. Eur. J. Inorg.
Chem. 2009, 5, 613 – 621.
21. (a) Borer, P. N.; Uhlenbeck, O. C.; Dengler, B.; Tinaco, I. J. Mol. Biol. 1973, 73, 483–496.
(b) Hilbers, C. W.; Haasnoot, C. A. G.; de Bruin, S. H.; Joordens, J. J. M.; Van der Marel,
G. A.; Van Boom, J. H. Biochimie 1985, 67, 685–695.
22. (a) Saini, S.; Srinivas, G.; Bagchi, B. J. Phys. Chem. B 2009, 113, 1817 – 1832. (b) Davis,
W. B.; Wasielewski, M. R.; Ratner, M. A.; Mujica, V.; Nitzan, A. J. Phys. Chem. A 1997,
101, 6158 – 6164.
23. Sullivan, B. P.; Salmon, D. J.; Meyer, T. J. Inorg. Chem. 1978, 17, 3334-3341.
24. Ko, C. C.; Wu, L. X.; Wong, K.; Zhu, N.; Wing-Wah Yam, V. Chem. Eur. J. 2004, 10, 766-
776.
25. Sheppeck, J. E.; Kar, H.; Hong, H. Tetrahedron Lett. 2000, 41, 5329 – 5333.
26. Martre, A.; Laguitton-Pasquier, H.; Deronzier, A.; Harriman, A. J. Phys. Chem. B 2003, 107,
2684 – 2692.
27. Uppadine, L. H.; Keene, F. R.; Beer, P. D. J. Chem. Soc., Dalton Trans. 2001, 2188 – 2198.
28. Meyer, T. J. Pure & Appl. Chem. 1986, 58, 1193 – 1206.
29. Williams. A. T. R.; Winfield, S. A.; Miller, J. N. Analyst 1983, 108, 1067 – 1071.

198
30. Lu, W.; Chan, M. C. W.; Zhu, N.; Che, C. M.; Li, C.; Hui, Z. J. Am.Chem. Soc. 2004, 126,
7639–7651.
31. Kalyanasundaram, K. Coord. Chem. Rev. 1982, 46, 159–244.
32. (a) Nielsen, P. E.; Haaima, G. Chem. Soc. Rev. 1997, 26, 73 – 78. (b) Rasmussen, H.;
Kastrup, J. S.; Nielsen, J. N.; Nielsen, J. M.; Nielsen, P. E. Nat. Struct. Biol. 1997, 4, 98 –
101.
33. (a) Baggott, J. E.; Billing, M. J. J. Phys. Chem. 1980, 84, 3012 – 3019. (b) Milosavljevic, B.
H.; Thomas, J. K. J. Chem. Soc. Faraday Trans. 1985, 81, 735 – 744. (c) Geiber, B.;
Alsfasser, R. Eur. J. Inorg. Chem. 1998, 957 – 963. (d) Bolletta, B.; Costa, I.; Fabbrizzi, L.;
Licchelli, M.; Montalti, M.; Pallavicini, P.; Prodi, L.; Zaccheroni, N. J. Chem. Soc., Dalton
Trans. 1999, 1381 – 1385. (e) Ajayakumar, G.; Sreenath, K.; Gopidas, K. R. Dalton Trans.
2009, 1180 – 1186.
34. Orellana, G.; Quiroga, M. L.; Braun, A. M. Helv. Chim. Acta 1987, 70, 2073 – 2086.
35. (a) Sutin, N. Prog. Inorg. Chem. 1983, 30, 441 – 499. (b) Marcus, R. A.; Siddarth, P in
Photoprocesses in Transition Metal Complexes, Biosystems and Other Molecules; E.
Kochanski, Ed.; Kluwer Academic Publishers: Netherlands, 1992.

Chapter 5
[Ru(bpy)3]2+ with Pendant Oligo(aminoethylglycine): Variation on the Number of Chains to
Form Multimetallic Structures with Cu(II) and Pd(II)
5.1 Introduction
Artificial photosynthetic systems require a harmony of structure and function by specific
arrangement of donors and acceptors for efficient conversion of solar energy to chemical fuel.
Molecular mimics ranging from simple donor-acceptor systems to more complex energy and
electron transfer cascades have been reported.1-6 These structures are often synthetically
challenging to make and structural variations that tune their properties, such as the donor-acceptor
ratios and distances, can therefore be cumbersome and limited. To address this, an approach that
would be advantageous is to mimic nature and design artificial systems built from modular units
of amino acid analogs, which would improve the ease of synthesis. There have been several
reported bio-inspired structures that are designed to insert metal ions into modified DNA
duplexes and nucleic acid structural mimics such as GNA and PNA.7-11 A significant challenge is
the directed self-assembly of heterometallic architectures, and of the metal-containing nucleic
acid analogs, there are only a few examples of structures containing more than one type of bound
metal ion.9c,8c,8e,10f,11 However, using differences in ligand affinity and substitutional inertness,
there have been many examples of heterometallic structures. For example, mercury and silver
sandwich-type structures12 and coordination polymers with terpyridine-ligands on the scaffold
formed complexes to give materials with Cu-Fe, Cu-Co, and Cu-Ni materials.13
Our aim is to develop modular and bio-inspired molecules built from artificial amino
acids to create supramolecular systems that use specific metal-ligand interactions (i.e. metal-

200
ligand denticity) to direct self-assembly of heterometallic structures. Using amide coupling
chemistry enables construction of larger structures analogous to natural photosynthetic and
catalytic centers. Our group has used this strategy to design and synthesize systems that
coordinate metal ions and assemble supramolecular structures held together with an oligoamide
aminoethylglycine (aeg) backbone.14-17 A goal is to use these to create molecular assemblies
capable of electronic, energetic, or magnetic communication between metals.
The versatility of this approach has been demonstrated using several geometries and
ligands; the metal-containing structures are categorized as single strand with pendant metal
complexes,14-15 or double-stranded duplexes crosslinked by metal ions.16 To better direct
assembly and to prepare heterometallic structures, we introduced modified Ru tris(bipyridine)
complexes containing pendant aeg chains with free bipyridine ligands.17 These coordinate metal
ions to form “hairpin-loop”-like structures. Our previous studies investigated [Ru(bpy)3]2+
complexes containing a single aeg hairpin loop (Scheme 5-1, Ru-1). Addition of Cu2+ results in
formation of [Cu(bpy)2]2+ and quenches the [Ru(bpy)3]
2+ emission by ~ 98%. In this report, we
synthesized heterometallic structures that, like natural enzymes and catalytic centers, have larger
three-dimensional structures. [Ru(bpy)3]2+ complexes containing two and three aeg hairpins (Ru-
6 and Ru-7 in Scheme 5-1) are made to study and compare the impact of coordinating one to
three Cu2+ ions on the Ru photophysical properties.
We further extend this approach to preparation of heterometallic Ru-Pd structures: Pd (II)
also readily forms bis bipyridyl complexes and when closely attached to [Ru(bpy)3]2+, has been
shown to yield compounds with photocatalytic properties.18 Compounds Ru-1, Ru-6 and Ru-7
are used to prepare the Ru-Pd analogs of the Ru-Cu complexes; because of the variation in
substitutional inertness, available redox potentials and visible light absorbance, comparison of
these provides insights into the mechanisms of emission quenching and binding. In this paper,
we first synthesize and then examine and compare the photophysical properties of the series of

201
Scheme 5-1: [Ru(bpy)3]2+ hairpin structures.

202
Ru complexes containing varying numbers of either Cu2+ or Pd2+. Finally, using Ru-6 the
feasibility of using this motif to create a tri-heterometallic Ru-Cu-Pd complex is tested, since the
aeg scaffold design is a potential starting point for the self-assembly of tri-functional complexes,
which would tether multiple donor-acceptor pathways and potentially increase charge separation
distances and life times.
5.2 Experimental
5.2.1 Methods
UV-visible absorbance spectra were obtained with a double-beam spectrophotometer
(Varian, Cary 500). Emission spectra were measured using a Photon Technology International
(PTI) fluorescence spectrometer using an 814 photomultiplier detection system. Time resolved
emission decays were measured following excitation using a N2 pumped dye laser (800 ps
excitation, PTI model GL-302), averaging 16 decays with a 50 µs collection time per point.
Samples used for quantum yields and radiative and non-radiative decay rate constants,19 were
prepared from solutions of known concentration and volume of either Ru-6 or Ru-7. A
stoichiometric amount of Cu2+ or Pd2+ was added during which the emission intensities were
monitored. The point at which intensity was constant was assumed to be the equivalence point.
Oxygen was removed in repetitive freeze-pump-thaw cycles, were measured in a sealed cell
under nitrogen. Quantum yields were determined using the relationship:20
2
))101/((
))101/((
refA
ref
A
refrefI
I
(Eq 5-1)
where is the radiative quantum yield of the sample; ref is the known quantum yield of
[Ru(bpy)3]2+ in acetonitrile = 0.062;21 I is the integrated emission, A is the absorbance at the

203
excitation wavelength; and is the dielectric constant of the solvent, which is assumed to be the
same for the acetonitrile solutions of sample and reference. The rate constants of radiative (kr)
and nonradiative (knr) decay were determined using the measured excited state lifetime (τ) and the
equations:19
nrr kk 1 (Eq 5-2)
nrr
r
kk
k
(Eq 5-3)
Spectrophotometric emission titrations were conducted in CH3CN solutions at room
temperature in the presence of air using known concentrations of Ru compounds. The
compounds were excited at their MLCT absorbance maxima (λabs in Table 1) and monitored at
their emission maxima (λem in Table 1). Spectra were obtained after stirring each with known
volumes (2 – 15 μL) of standard Cu2+ solutions (2 – 4 mM) in CH3CN for a minimum of 15 min.
Mass spectrometric analysis was performed on a Waters LCT Premier time-of-flight
(TOF) mass spectrometer at the Penn State Mass Spectrometry Facility. Samples were introduced
into the mass spectrometer using direct infusion via a syringe pump. The mass spectrometer
scanned from 100-2000 m/z in positive ion mode using electrospray ionization (ESI+). NMR
spectra were collected using either a 360 or 400 MHz spectrometers (Bruker) in the Lloyd
Jackman Nuclear Magnetic Resonance Facility. Elemental analysis was performed by Galbraith
Industries.
All electrochemical measurements were obtained using a CH Instruments potentiostat
(Model 660) with 0.31 cm diameter glassy carbon working and Pt wire counter electrodes with a
Ag quasi reference electrode. Solutions were prepared from distilled CH3CN containing 0.2 M
TBAP supporting electrolyte; the solutions were deoxygenated by purging with solvent-saturated
N2. Potentials are reported vs. a saturated calomel electrode (SCE) reference scale using ferrocene
as an internal potential reference standard.

204
5.2.2 Chemicals and Reagents.
O-Benzotriazole-N,N,N’,N’-tetramethyl-uronium-hexafluorophosphate (HBTU) was
purchased from NovaBiochem. Copper (II) nitrate (99.9%) was purchased from J. T. Baker and
tetrakis(acetonitrile)palladium (II) tetrafluoroborate (99 %) was purchased from Strem
Chemicals. All solvents were used as received without further purification unless otherwise
noted. Tetrabutylammonium perchlorate (TBAP) was recrystallized three times from ethyl
acetate. The synthesis of [(Bz)Ru(bpy)Cl]Cl,22 [Ru(bpy)2(bpy[aeg(bpy)-Otbutyl]2)](NO3)2 (Ru-
1),17a [Ru-1(Cu)](PF6)4,17a H2N-aeg(bpy)-OtButyl,17b and 4,4’-dimethyoxycarbonyl-2,2’-
bipyridine [(CO2CH3)2 bpy]23 were performed as previously reported.
5.2.3 Synthesis
5.2.3.1 Synthesis of [Ru(bpy)(4,4’-(CO2CH3)2 bpy)2](PF6)2.
A solution of 0.499 g (1.13 mmol) [BzRu(bpy)Cl]Cl, 0.716 g (2.63 mmol) 4,4’-
(CO2CH3)2 bpy, and 0.478 g (2.46 mmol) AgBF4 were refluxed in 50 mL 40 % (v/v) ethylene
glycol/H2O for 3 hours. After this time the solution was cooled in an ice bath and filtered to
remove AgCl. A saturated aqueous solution of NH4PF6 was added to produce a red precipitate
that was filtered, redissolved in CH2Cl2, dried over solid Na2SO4, and then dried to yield the pure
product. Collected 1.15 g (85 % yield). 1H NMR, 360 MHz, CD3CN: 3.98 (s, 6H); 3.99 (s, 6H);
7.40 (t, J = 7 Hz, 2H); 7.64 (d, J = 6 Hz, 2H); 7.78 (d-d, J = 6 Hz, J = 1.5 Hz, 2H); 7.81 – 7.93
(m, 6H); 8.09 (t, J = 8 Hz, 2H); 8.51 (d, J = 8 Hz, 2H); 9.04 (d, J = 2 Hz, 2H). MS (ESI+) [M2+]
Calcd: 401.0; Found: 401.4.

205
5.2.3.2 Synthesis of [Ru(bpy)(4,4’-(CO2H)2-bpy)2](PF6)2
A solution of 1.15 g (1.05 mmol) [Ru(bpy)(4,4’-(CO2CH3)2 bpy)2](PF6)2 in 125 mL 2 M
NaOH was refluxed for 3 hours. The solution was then cooled in an ice bath and the pH adjusted
to 3 with conc. HCl. A saturated aqueous solution of NH4PF6 was added to produce a red
precipitate that was filtered and washed with water (30 mL) and copious amounts of diethylether
to give the desired product. Collected 0.92 g (89 % yield). 1H NMR, 400 MHz, CD3OD: 7.50 (t,
J = 7 Hz, 2H); 7.79 (d, J = 5 Hz, 2H); 7.95 (d, J = 6 Hz, 2H); 8.00 (m, 6H); 8.16 (t, J = 8 Hz, 2H);
8.72 (d, J = 8 Hz, 2H); 9.16 (s, 4H). MS (ESI+) [M2+] Calcd: 372.8; Found: 372.8.
5.2.3.3 Synthesis of [Ru(4,4’-(CO2CH3)2-bpy)3](BF4)2
In 75 mL 50 % (v/v) ethylene glycol / water, 0.288 g (1.10 mmol) RuCl3•3H2O, 1.05 g
(3.86 mmol) 4,4’-(CO2CH3)2 bpy, and 0.70 g (3.55 mmol) AgBF4 were refluxed for 3 hours.
After this time, the solution was cooled in an ice bath and the precipitate filtered to give the
product and AgCl. The solid was re-dissolved in CH2Cl2 and filtered again to remove AgCl,
leaving the product in CH2Cl2 that was then dried over Na2SO4. The solvent was removed by
rotary evaporation to give the pure product. Collected 0.98 g (81.3 % yield) 1H NMR, 300 MHz,
CD2Cl2: 4.04 (s, 18H); 8.03 (s, 12H); 9.02 (s, 6H). MS (ESI+) [M2+] Calc: 459.1; Found 459.3.
5.2.3.4 Synthesis of [Ru(4,4’-dicarboxylic acid bpy)3](PF6)2
A solution of 1.15 g (1.05 mmol) [Ru(4,4’-(CO2CH3)2 bpy)3](BF4)2 in 125 mL of 2 M
NaOH was refluxed for 3 hours. The solution was then cooled in an ice bath and the pH adjusted
to 3 with conc. HCl. A saturated aqueous solution of NH4PF6 was added to produce a red
precipitate that was filtered and washed with water (30 mL) and copious amounts of diethylether

206
to give the desired product. Collected 0.415 g (93 % yield). 1H NMR, 300 MHz, d6 dmso: 7.91
(d, J = 6 Hz, 12H); 9.30 (s, 6H); 14.28 (s, 6H). MS (ESI+) [M2+] Calcd: 415.5; Found 415.4.
5.2.3.5 Synthesis of [Ru(bpy)(4,4’-[aeg(bpy)-OtButyl]2bpy)2](NO3)2 (Ru-6)
To 150 mL dry CH2Cl2, 1.81 g (4.7 mmol) H2N-aeg(bpy)-OtButyl, and 3 mL NEt3 (21.5
mmol) were added and cooled in an ice bath. To this was added 0.5175 g (0.5 mmol)
[Ru(bpy)(4,4’-(COCl)2-bpy)2](PF6) and the solution stirred for 5 hours. After this time 0.76 g (2
mmol) HBTU and 0.31 g (2 mmol) HOBT were added and the resulting solution stirred
overnight. Solvent was removed by rotary evaporation and the red residue was purified first over
neutral alumina using 10% MeOH/CH2Cl2 collecting the red band to elute first, and second over
silica using 5:4:1 CH3OH:H2O:sat. KNO3 (aq) and was isolated by methods previously
reported.17a Collected 0.388 g (33 % yield) 1H NMR, 400 MHz, CD2Cl2: 1.44 (m, 36H); 2.33 (s,
8H); 2.41 (s, 4H); 3.59 – 3.86 (m, 18H); 3.88 – 4.26 (m-s, 14H); 7.08 (s, 4H); 7.19 (s, 1H); 7.29
(s, 3H); 7.46 (m, 2H); 7.61 – 7.90 (m-m 6H); 7.90 – 8.14 (m-m, 9H); 8.14 – 8.51 (m-m, 15H);
8.97 – 9.17 (m-m, 2H); 9.17 – 9.47 (m-m, 6H). (Figure 5-1) HRMS (ESI+) [M2+] Calc:
1105.4473; Found: 1105.4436. Elemental Analysis [Ru-6 • 0.5 CH2Cl2] Calcd: 59.98 C; 5.47
H; 14.14 N. Found: 59.89 C; 5.53 N; 14.07 N.
5.2.3.6 Synthesis of [Ru(4,4’-[aeg(bpy)-OtButyl]2 bpy])3](NO3)2 (Ru-7)
A 0.500 g (0.444 mmol) amount of [Ru(4,4’-(CO2H)2 bpy)3](PF6)2 was suspended and
warmed in 10% SOCl2/CH2Cl2 overnight. The solution was then filtered and washed with dry
CH2Cl2 (2 x 15 mL). The solid was suspended in 25 mL dry CH2Cl2 and added to a stirring, N2
purged, solution of 3.06 g (7.98 mmol) H2N-aeg(bpy)-OtButyl and the resulting solution was
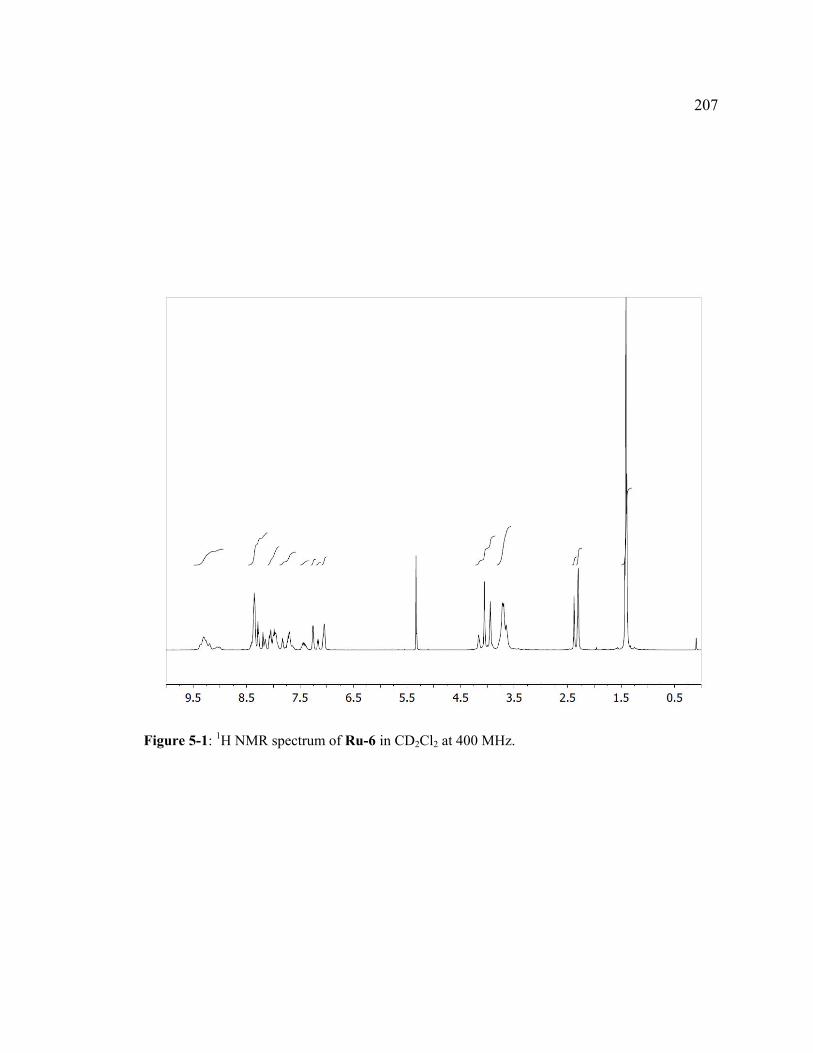
207
Figure 5-1: 1H NMR spectrum of Ru-6 in CD2Cl2 at 400 MHz.

208
stirred overnight. After this time, 1.01 g (2.66 mmol) HBTU, 0.407 g (2.66 mmol) HOBT, and 3
mL (17.2 mmol) DIPEA were added and the resulting mixture was stirred for 3 days. The
suspended Ru complex slowly dissolves as the reaction proceeds. After this time, the solvent was
removed by rotary evaporation and purified as in Ru-6. Collected 0.634 g (45.2 % yield). 1H
NMR, 400 MHz, CD2Cl2: 1.39 (m, 54H); 2.30 (m, 11H); 2.36 (m, 7H); 3.67 (s, 27H); 3.90 (m,
9H); 3.97 – 4.17 (m, 12H); 7.04 (s, 6H); 7.12 (m, 2H); 7.23 (m, 4H); 7.60 – 8.44 (m-m, 36H);
8.64 – 9.34 (m-m, 12H). (Figure 5-2) HRMS (ESI+) [M2+] Calc: 1516.1429; Found: 1516.1427.
Elemental Analysis Ru-7 • 3 CH2Cl2 Calc: 58.10 C; 5.50 H; 13.14 N. Found: 59.01 C; 6.05 H;
13.14 N.
5.2.3.7 Synthesis of Ruthenium-Copper and Ruthenium-Palladium Complexes
[Ru-6M2](PF6)6 and [Ru-7M3](PF6)8 (where M is Cu2+ or Pd2+) were synthesized by
dissolving Ru-6 or Ru-7, adding 2.1 or 3.1 equivalents of the appropriate metal salt,
respectively. The reaction solutions were either 1:1 MeOH/H2O for the Cu2+ reaction or 1:1
CH3CN:H2O for Pd2+. After 3 hours, a saturated methanolic solution of NH4PF6 was added to
produce a dark precipitate. The solid was collected on a medium frit and washed with water and
diethyl ether to yield the heterometallic complexes. [Ru-6Cu2](PF6)6 MS (ESI+) [M6+ + 4 PF6-]
Calcd: 1459.3; Found: 1459.2. [M6+ + 3 PF6-] Calcd: 924.5; Found: 924.5. [M6+ + 2 PF6
-]
Calcd: 657.2; Found: 657.1. [M6+ + 1 PF6-] Calcd: 496.7; Found: 496.7. [M6+] Calcd: 389.8;
Found: 389.8. Elemental Analysis. Calc: 3.96 Cu; 3.15 Ru; Found: 4.10 Cu; 3.01 Ru (2.2 Cu: 1
Ru). [Ru-7Cu3](PF6)8 MS (ESI+) [M8+ + 5 PF6-] Calcd: 1316.0; Found: 1316.0. [M8+ + 4 PF6
-]
Calcd: 950.7; Found 950.7. [M8+ + 3 PF6-] Calcd: 731.6; Found: 731.5. [M8+ + 2 PF6
- +
CH3CN] Calcd: 592.3; Found 592.3. [M8+ + PF6- + 2 CH3CN] Calcd: 492.9; Found: 492.9.
[M8+ + 2 PF6-] Calcd: 585.5; Found 585.5. [M8+ + PF6
- + CH3CN] Calcd: 487.0; Found: 487.0.

209
Figure 5-2: 1H NMR spectrum of Ru-7 in CD2Cl2 at 400 MHz.

210
[M8+ + 3 CH3CN] Calcd: 418.3; Found: 418.2. Elemental Analysis. Calc: 4.35 Cu; 2.31 Ru;
Found: 4.69 Cu; 2.39 Ru (3.1 Cu: 1 Ru).
[Ru-1(Pd)](PF6)4 MS (ESI+) [M4+ + 2 PF6-] Calcd: 893.2; Found: 893.2. [M4+ + PF6
-]
Calcd: 547.1; Found: 547.1. [M4+] Calcd: 374.1; Found: 374.1. Elemental Analysis. Calc:
5.12 Pd; 4.87 Ru; Found: 4.54 Pd; 4.10 Ru (1.05 Pd: 1 Ru). [Ru-6Pd2](PF6)6 MS (ESI+) [M6+ +
4 PF6-] Calcd: 1502.3; Found: 1502.3. [M6+ + 3 PF6
-] Calcd: 953.2; Found: 953.2. [M6+ + 2
PF6-] Calcd: 678.7; Found: 678.7. [M6+ + 1 PF6
-] Calcd: 513.9; Found: 513.9. [M6+] Calcd:
404.1; Found: 404.1. Elemental Analysis. Calc: 6.46 Pd; 3.07 Ru; Found: 4.98 Pd; 2.55 Ru (1.9
Pd: 1 Ru). [Ru-7Pd3](PF6)8 MS (ESI+) [M8+ + 5 PF6-] Calcd: 1359.0; Found: 1359.1. [M8+ + 4
PF6-] Calcd: 982.7; Found: 982.8. [M8+ + 3 PF6
-] Calcd: 757.2; Found: 757.3. [M8+ + 2 PF6-]
Calcd: 607.0; Found 607.1. [M8+ + PF6-] Calcd: 499.4; Found: 499.5. Elemental Analysis. Calc:
7.08 Pd; 2.24 Ru; Found: 7.38 Pd; 1.85 Ru (3.8 Pd: 1 Ru).
5.3 Results and Discussion
5.3.1 Synthesis of Multiple Aeg Hairpin Complexes
Functionalization of Ru complexes with aeg strands is easily accomplished by reacting
amine-terminated bpy-modified aeg monomer with [Ru(bpy)(bpy(COCl)2)2]2+ and
[Ru(bpy(COCl)2)3]2+ , as shown in Scheme 5-2. These syntheses follow the approach previously
reported for the single hairpin complex,17b which is versatile because varying the number of acyl
chlorides on the [Ru(bpy)3]2+ starting material determines the extent of substitution with aeg
hairpins. Ru-6 and Ru-7 are prepared in yields of 33 and 43%, respectively, and fully
characterized using 1H NMR, mass spectrometry, and elemental analysis. Cyclic voltammetry of
Ru-6 and Ru-7 in CH3CN solutions are shown in Figure 5-3 in comparison with Ru-1. Each

211
Scheme 5-2: Synthetic Steps toward Ru-6 and Ru-7.a
a (i) ethylene glycol / H2O (40% v/v) , AgBF4, 3 hours; (ii) 2 M NaOH, 3 hours; (iii) SOCl2 / CH2Cl2 (10 % v/v), overnight; (iv) excess H2N-aeg(bpy)-Otbutyl, NEt3, overnight.

212
Potential (V)
-2-101
Nor
mal
ized
Cur
rent
(i/M
)
-0.02
0.00
0.02
0.04
0.06
0.08
0.10
0.12
Ru-1
Ru-6
Ru-7
Figure 5-3: Cyclic Voltammograms of Ru-1, Ru-6, and Ru-7 taken at a scan rate of 50 mV/sec in 0.2 M TBAP in CH3CN vs. SCE.

213
revealed one-electron reversible oxidations assigned to the RuIII/II couple at 1.31 and 1.37 V,
respectively. At negative potentials, three sequential one-electron reductions were observed at -
1.14, -1.33, and -1.70 V for Ru-6 and – 1.12, -1.29, and -1.53 V for Ru-7; these are reductions of
the bpy ligands coordinated to Ru. Reductions of the uncoordinated pendant bpy ligands are not
observed in the experimental window, but occur at more negative potentials.17b
In oxygen-free CH3CN solutions, Ru complexes strongly absorb blue light and relax by
photoemission; Table 5-1 compares their photophysical properties. As the number of aeg-
substituted ligands increases, the peak emission wavelength shifts to higher energy, and the
quantum yield (Φ) and excited state lifetime () also increase. This effect is attributed to the
energy gap law:19,24 increasing the number of amide substitutions on the bpy ligands results in
greater backbonding between Ru and non-chromophoric ligands, and increases the gap between
ground state and excited state energy levels (Figure 5-4).
Like Ru-1, the aeg strands in Ru-6 and Ru-7 contain pendant bpy ligands that are
available for metal coordination; we have previously shown that Ru-1 binds one Cu2+ by
formation of [Cu(bpy)2]2+.17a,b Since Ru-6 and Ru-7 contain two and three aeg hairpins, they have
four and six pendant bpy ligands that are able to bind two and three metal ions as bis(bipyridine)
complexes, respectively. Formation of other metal bpy complexes, such as [M(bpy)]2+ or
[M(bpy)3]2+, are also possible and would depend on the relative concentrations and the proximity
of available ligands. Each Ru complex was reacted with either Cu2+ in water/MeOH solutions or
Pd2+ in water/CH3CN solutions and the product isolated by anion exchange. Elemental analysis of
the isolated products indicates that the solids contain Cu:Ru ratios that are consistent with tri- and
tetrametallic complexes. However, elemental analysis of Ru-7(Pd)3 contained high amounts of
Pd which may be a result of inter- versus intra-hairpin coordination (see below). The identities of
these heterometallic complexes were determined using mass spectrometry as shown in Figures 5-
5, 5-6 and 5-7. Comparison of observed molecular ion peaks with calculated mass-to-charge

214
Table 5-1: Photophysical Properties of Heterometallic Complexes.
absa (nm)
(ε / 104) λem
b (nm) Φc τd (ns) kr x 104 e
(sec-1) knr x 105 f
(sec-1) Ru-1 0.040 1180 3.43 8.12
Ru-1(Cu) 1 x 10⁻³ 34 ± 3 2.93 291 Ru-1(Pd)
469 (13.4) 650 0.022 461±110 4.77 21.2
Ru-2 0.10 1586 ± 50 6.3 5.7
Ru-2(Cu)2 g 1 x 10⁻³
7±1 (50 %); 25±3 (50 %)
14.3 4.0
1430 400
Ru-2(Pd)2 g
475 (18.1) 635
0.015 175±10 (57 %) 800 ±50 (43 %)
8.6 1.9
56 12
Ru-3 0.190 1650± 20 11.5 4.91
Ru-3(Cu)3 g 5 x 10⁻⁴
6±1 (87 %); 22±7 (13 %)
83.3 2.27
1670 456
Ru-3(Pd)3 g
468 (22.4) 623
2.3 x 10⁻³ 4±2 (19 %)
94±5 (51 %) 393±20 (30 %)
57.5 2.4 0.6
2500 106 25
awavelength of the MLCT absorbance maxima;b wavelength of the emission maxima following excitation atabs;
c quantum yield; d excited state lifetime; e radiative and f non-radiative relaxation rate constant; g % in parentheses indicates partial contribution determined from the decay fit.

215
Emission Energy (cm-1/1000)
15.4 15.6 15.8 16.0
ln(k
nr)
12.6
12.8
13.0
13.2
13.4
13.6
13.8
Ru-1
Ru-6
Ru-7
slope = -1.20
Figure 5-4: Plot of ln(knr) vs emission energy demonstrating linear agreement with energy gap

216
THEORETICAL
MEASURED
a b c
m/z
890 892 894 896 898
m/z
544 546 548 550
m/z
372 374 376
a b c
Figure 5-5: Selected molecular ion peaks observed by positive ion electrospray mass spectrometry, plotted together with the calculated mass and isotopic splitting patterns for [Ru-1(Cu)](PF6)4.
a [Ru-1(Cu)]4+; b {[Ru-1(Cu)]4+(PF6)}3+; c {[Ru-1(Cu)]4+(PF6)2}
2+.

217
m/z
390 395 400 405
A)
m/z
495 496 497 498 499
dcbaTheoretical
Measured
e
m/z
1456 1458 1460 1462 1464
m/z
924 927
m/z
656 658 660
B)
m/z
402 403 404 405 406
m/z
512 513 514 515 516
m/z
676 678 680 682
m/z
951 954 957
m/z
1496 1500 1504 1508
f g h i jTheoretical
Measured
Figure 5-6: Selected molecular ion peaks observed by positive ion electrospray massspectrometry, plotted together with the calculated mass and isotopic splitting patterns for A) [Ru-6(Cu)2](PF6)6 and B) [Ru-6(Pd)2](PF6)6. (a) [Ru-6(Cu)2]
6+; [Ru-6(Cu)2]6+ • CH3CN; [Ru-
6(Cu)2]6+ • 2 CH3CN; (b) [[Ru-6(Cu)2](PF6)]
5+; (c) [[Ru-6(Cu)2](PF6)2]4+; (d) [[Ru-
6(Cu)2](PF6)3]3+; (e) [[Ru-6(Cu)2](PF6)4]
2+; (f) [Ru-6(Pd)2]6+; (g) [[Ru-6(Pd)2](PF6)]
5+, (h) [[Ru-6(Pd)2](PF6)2]
4+; (i) [[Ru-6(Pd)2](PF6)3]3+; (j) [[Ru-6(Pd)2](PF6)4]
2+.

218
m/z
417.5 418.0 418.5 419.0
A)Measured
Theoretical a b c d e
Col 29 vs Col 30
Col 24 vs Col 25
Col 9 vs Col 10
m/z
486 488 490 492 494
m/z
730 731 732 733 734
m/z
949.5 951.0 952.5
m/z
1312 1314 1316 1318 1320
m/z
981 984
m/z
755 756 757 758 759 760
m/z
605 606 607 608 609
m/z
1354 1356 1358 1360 1362 1364
m/z
498 499 500 501
Measured
Theoretical f g h i j
B)
Figure 5-7: Selected molecular ion peaks observed by positive ion electrospray massspectrometry, plotted together with the calculated mass and isotopic splitting patterns for A) [Ru-7(Cu)3](PF6)8 and B) [Ru-7(Pd)3](PF6)8. (a) [Ru-7(Cu)3]
8+ • 3 CH3CN; (b) [[Ru-7(Cu)3](PF6)]7+,
[[Ru-7(Cu)3](PF6)]7+ • CH3CN; (c) [[Ru-7(Cu)3](PF6)3]
5+; (d) [[Ru-7(Cu)3](PF6)4]4+;(e) [[Ru-
7(Cu)3](PF6)5]3+. (f) [[Ru-7(Pd)3](PF6)]
7+; (g) [[Ru-7(Pd)3](PF6)2]6+; (h) [[Ru-7(Pd)3](PF6)3]
5+; (i) [[Ru-7(Pd)3](PF6)4]
4+; (j) [[Ru-7(Pd)3](PF6)5]3+.
219
ratios and isotopic splitting patterns identifies the molecular ions Ru-6(Cu)2, Ru-6(Pd)2, Ru-
7(Cu)3 and Ru-7(Pd)3. No evidence of a Ru-7(Pd)4 species or other structures containing more
than stoichiometric amounts of Pd were observed in mass spectrometry experiments. Because of
the soft ionization technique that is used, some of the molecular ions observed include CH3CN
(e.g. Figure 5-6-A-a, in which [Ru-6(Cu)2]6+ + 1 and 2 additional CH3CN molecules, and Figure
5-7-A-a for [Ru-7(Cu)3]8+ + 3 CH3CN molecules) and varying numbers of anions. In solution, it
is likely that the axial positions are occupied by solvent molecules, i.e. H2O or CH3CN, so their
presence in mass spectrometry experiments is expected. Together, the elemental analysis and
mass spectra conclusively identify the products as the desired Ru-Cu heterometallic species. On
the other hand, Ru-Pd molecular ion peaks associated with CH3CN molecules were not observed.
The elemental and mass spectrometry data of the Ru-Pd compounds suggests that these contain
the [Ru-6(Pd)2]6+ and [Ru-7(Pd)3]
8+ products but some impurities containing an excess of Pd are
present in each sample.
5.3.2 Spectrophotometric Emission Titrations with Cu2+ and Pd2+
We have previously used spectrophotometric titrations to confirm metal binding
stoichiometry and quantify quenching efficiencies.17a-b Emission titrations were therefore
conducted to examine the effects of Cu2+ and Pd2+ coordination on the emission of Ru-1, Ru-6,
and Ru-7 and are shown in Figure 5-8. When Cu2+ is added to Ru-1, shown again here for
comparison in Figure 5-8A, a consistent observation is that coordination of Cu2+ causes a steady
decrease in emission intensity until reaching ~ 1:1 Cu:Ru-1, after which the intensity remains
relatively constant. Addition of Pd2+ to the same Ru structure also reduces the emission intensity
of the Ru complex, but yields a titration curve with a different shape. Shown in Figure 5-8B, the
titration of Ru-1 with Pd2+ produces response that is shallower and does not level at a constant

220
Moles Cu2+ / Ru2+
0 1 2 3 4
Nor
mal
ized
Em
issi
on In
ten
sity
0.0
0.2
0.4
0.6
0.8
1.0
A)
Moles Pd2+ / Ru2+
0 1 2 3 4
No
rmal
ized
Em
issi
on
Inte
nsi
ty
0.0
0.2
0.4
0.6
0.8
1.0
B)
Moles Cu2+ / Ru2+
1.0 1.5 2.0 2.5 3.0 3.5 4.0
Nor
m.
Em
. In
t.0.00
0.02
0.04
0.06
0.08
0.10
Figure 5-8: A) Plot of peak emission intensity of CH3CN solutions of (●) 140 μM Ru-1 with additions of 5 μL aliquots of 5.3 mM Cu(NO3)2, (■) 98.4 μM Ru-6 with addition of 6 μL aliquots of 4.37 mM Cu(NO3)2, and (▼) 89.4 μM Ru-7 with additions of additions of 3 μL aliquots of 7.43 mM Cu(NO3)2. Insets: Expanded regions at higher Cu/Ru ratios B) Plot of peak emission intensity of CH3CN solutions of (●) 83.3 μM Ru-1 with additions of 3 μL aliquots of 6.16 mM [Pd(CH3CN)4](BF4)2 (with guiding lines to show minor breaks in curve), (■) 108 μM Ru-6 with addition of 2 μL aliquots of 1.62 mM [Pd(CH3CN)4](BF4)2, and (▼) 95.9 μM Ru-7 with additions of additions of 4 μL aliquots of 9.52 mM [Pd(CH3CN)4](BF4)2.

221
value, even after two molar equivalents of Pd2+ are added. At 1 and 2 molar equivalents of added
Pd2+, the [Ru(bpy)3]2+ is quenched by 43 % and 58 %, respectively. The differences between the
shapes of the Cu2+ and Pd2+ titration curves may reflect strain around the larger Pd2+ center or its
kinetically slower binding to bpy. The continued decrease in emission intensity after one added
equivalent of Pd2+ suggests that additional Pd2+ binds to the Ru, either by breaking [Pd(bpy)2]2+ to
form [Pd(bpy)(CH3CN)]2+ or because [Pd(bpy)2]2+ is not formed on this experimental time scale,
leaving available bpy sites for Pd coordination.
Whereas Ru-1 emission intensity decreases and levels at ~ 1:1 Cu:Ru-1,17a,b titration of
Ru-6 with Cu2+ results in a quenching curve with two distinct phases, similar to other structures
previously shown to bind two Cu2+ ions (Figure 5-9).17b Between 0 and 1 molar equivalents of
added Cu2+, the emission intensity linearly drops until at 1 Cu: 1 Ru it is quenched by 94%.
Continued addition of Cu2+ causes further linear decrease of emission intensity until 2 molar
equivalents are added, at which point the quenching efficiency is constant and 98%. These
inflection points suggest sequential binding of Cu2+ to Ru-6, with crosslinking one hairpin at 1
Cu: 1 Ru (at either site) and the remaining hairpin at 2 Cu: 1 Ru and can be described by the
equilibrium expressions (assuming Ru-6):
Ru-6 + M Ru-6(M) (R 5-1)
Ru-6(M) + M Ru-6(M)2 (R 5-2)
where M is Cu2+ (or Pd2+, below). In this model, the second metal ion preferentially binds free
bpy ligand rather than dissociation of or exchange with the first metal ion. During the titrations,
the solution likely contains a mixture of Ru-6, Ru-6(M) and Ru-6(M)2, at relative quantities
determined by the association constants. The observed stoichiometric points in Figure 5-8 are
indicative of the molar ratio of Cu:Ru for the most prevalent species.
The titration curve of Cu2+ into Ru-7 is more structured than for Ru-6: like Ru-1 and Ru-
6, the emission intensity of Ru-7 decreases as Cu2+ is added, however at 1 molar equivalent of

222
moles Cu/Ru vs Norm. Emit. Int moles Cu/RuHP2 vs Norm. Emit. Int. Cu/Ru Ru-bpy vs normalized em.
moles Cu/Ru vs Norm. Emit. Int
moles Cu/RuHP2 vs Norm. Emit. Int.
Cu/Ru Ru-bpy vs normalized em.
moles Cu/Ru vs Norm. Emit. Int
moles Cu/RuHP2 vs Norm. Emit. Int.
Cu/Ru Ru-bpy vs normalized em.
Moles Cu / Ru
0 1 2 3 4
Nor
mal
ized
Em
issi
on In
tens
ity
0.0
0.2
0.4
0.6
0.8
1.0
Moles Cu / Ru
1 2 3 4
Nor
m.
Em
. In
t.
0.00
0.05
0.10
0.15
Ru-bpy-bpy HP
Ru-bpy-AC-bpy HP
Ru-2
Figure 5-9: Comparison of emission titrations of Ru-dicopper complexes of Ru-6 and Ru-410b
and Ru-510b hairpin complexes

223
added Cu the quenching efficiency is only 88%. We hypothesize that this is a result of the
initially higher quantum yield of Ru-7. Further addition of Cu2+ results in inflection points in the
titration curve at ~ 1.5, 2.0, 2.5 and 3.0 eq Cu:Ru-7. Binding to this scaffold is clearly complex.
Because of the labile nature of Cu2+ and the multiple possible combinations of binding sites in the
structure, it is possible that [Cu(bpy)2]2+ complexes are formed by crosslinking bpy ligands within
a single hairpin (i.e. intra-hairpin) or between different bpy hairpins (inter-hairpin). In some
cases, unbound bpy ligands may be held at a distance incapable of forming additional
[Cu(bpy)2]2+. Continued addition of Cu2+ likely causes rearrangement to fully saturate the
complex.
Quenching efficiency is directly impacted by the proximity of the bound metal ion to
[Ru(bpy)3]2+. Ru-6 and Ru-7 have multiple sites to which metal ions can bind, shown
schematically in Figure 5-10 and compared to compounds that we have previously reported. In
comparison with Ru hairpin structures that bound two Cu2+ atoms in a different configuration
(Figure 5-10D,E and Figure 5-11),17b the quenching efficiency of two Cu2+ ions bound to Ru-6 is
greater because these are held ~ 7Å from the Ru center in one of two equivalent possible sites.
In Figure 5-8B, the titrations with Pd2+ are strikingly different than Cu2+. For both Ru-6 and Ru-
7, addition of Pd2+ causes a linear decrease (with the same slope) in emission intensity, and does
not level off until molar ratios of ~ 2 and 3 Pd2+/Ru2+, respectively, are reached. As in the Cu2+
titrations, [Ru(bpy)3]2+ is quenched more efficiently as additional Pd2+ ions are bound, although in
all cases Pd2+ quenching efficiency is lower than when the equivalent amount of Cu2+ is added.
Pd2+ has a stronger binding affinity for bpy ligands than Cu2+, making rearrangement less facile.
In solution we are likely seeing the ensemble average of intra-, inter-, and [Ru(bpy)3]2+
crosslinking so featureless, so mildly featureless titration curves can be expected, possible
examples of different binding structures are depicted in Figure 5-12. Further, [Ru(bpy)3]2+
quenching by Pd-bpy complexes is likely by ligand-centered electron transfer and we would

224
Figure 5-10: Comparison of first Cu2+ binding sites in Ru complexes with double (A) and single (Band C) hairpins.

225
Figure 5-11: Emission titrations curves with Ru-6 and with previously reported single hairpins Ru-4 and Ru-5 showing different quenching efficiencies of Cu2+ on [Ru(bpy)3]
2+ at 1 and 2 equivalents of Cu:Ru during an emission titration. Cartoon representation below shows Cu2+
binding within the peptide.

226
Figure 5-12: Molecular modeling using Hyperchem 6.0 to show possible distances between A)intra-hairpin crosslinking, B) inter-hairpin crosslinking, and C) dimerization of Ru(bpy)3
2+
centers

227
expect different quenching efficiencies between [Pd(bpy)]2+ and [Pd(bpy)2]2+. However, because
of the high local concentration of the second bpy ligand, and since we see no inflection points
within the titration curve, this suggests that R 5-2 >> R 5-1 and the result is a [Ru(bpy)3]2+-
([Pd(bpy)2]2+)n=1-3 heterodimer in this steady state experiment.
5.3.3 Spectroscopy
To quantitatively examine the effect of Cu2+ and Pd2+ coordination to the Ru complexes,
their photophysical properties with and without bound metal ion were measured in thoroughly
deoxygenated solutions. The data in Table 5-1 shows that binding either of these metal ions
reduces the quantum yield of the Ru complex, but that Cu2+ attenuates quantum yield an order of
magnitude more than Pd2+. Figure 5-13 shows the transient emission for the series of Ru
complexes with bound metal, which substantially differ: following excitation at λabs, Ru-6(Cu)2,
Ru-6(Pd)2 and Ru-7(Cu)3 display biexponential decays, and Ru-7(Pd)3 best fits a triexponential
decay. The excited state lifetimes (τ) determined from fitting these data (residuals are shown in
the Figure 5-13 insets) are compared in Table 5-1, together with the relative percentage of the
two contributions to each of the decay processes. In all cases, emission lifetimes for Pd-
coordinated Ru scaffolds are longer than their Cu analogs. The multiple components in these
decays are likely the result from multiple configurations of bound metal ion within the hairpins,
including inter- and intra-hairpin crosslinking as in Figure 5-10 A,B, together with added
relaxation pathways provided by coordination of multiple Cu2+ centers (via energy or electron
transfer). In the tri- and tetrametallic structures, the pathway(s) with shorter τ increasingly
contributes to the excited state relaxation as the number of coordinated metal ions increases.
Using molecular modeling, the metal-metal distances were estimated for the differing
binding configurations (Figure 5-12) in Ru-7. These predict that the separation between the

228
time (ns)
0 1000 2000 3000 4000
Nor
mal
ized
Em
issi
on In
tens
ity
0.0
0.2
0.4
0.6
0.8
1.0
time (ns)
0 1000 2000 3000 4000
Res
. N
orm
. E
m.
Int.
-0.10
-0.05
0.00
0.05
0.10
time (ns)
50 100 150 200 250
Nor
mal
ize
d E
mis
sion
Inte
nsity
0.0
0.2
0.4
0.6
0.8
1.0
time (ns)
50 100 150 200 250
Res
. N
orm
. E
m.
Int.
-0.10
-0.05
0.00
0.05
0.10
A)
B)
Figure 5-13: Normalized transient emission decay curves measured at λmax,em for heterometallic complexes following an 800 ps laser pulse at λmax,abs. Insets show residuals. A) Ru-1(Cu) (black), Ru-6(Cu)2 (blue), and Ru-7(Cu)3 (red). B) Ru-1(Pd) (black), Ru-6(Pd)2 (blue), and Ru-7(Pd)3 (red).

229
metals is between 8 - 12 Å, depending on the geometry of the structure. In solution, the
flexibility of the aeg backbone allows the M-M distances to be somewhat dynamic and although
these values are roughly the same, molecular motion of the different binding motifs may prefer
one distance over another.
With the measured values of Φ and τ, the radiative (kr) and nonradiative relaxation rate
constants (knr) are calculated for each of the species. We find that knr increases with the number of
tethered [Cu(bpy)2]2+ or [Pd(bpy)2]
2+centers. Because it increasingly contributes to excited state
relaxation, the faster component in the decay of the tri- and tetrametallic complexes is consistent
with a new relaxation pathway as a result of binding more than one quenching site. The higher
value may be a reflection of the increased probability of quenching by a bound Cu or Pd complex
or a new reaction as the number of tethered species increases. We note that during Ru-Pdx
sample preparation there is a possibility of slight impurities including not fully formed
[Pd(bpy)2]2+ complexes that may add to the complexity of the spectroscopy. Work is underway to
purify Ru-Pd peptides further to conclusively rule this out.
The absorbance spectrum25 of [Pd(bpy)2]2+ does not overlap the emission spectrum of
[Ru(bpy)3]2+, precluding Förster energy transfer. It is possible to form Pd(I) complexes although
we were unable to locate any examples of mononuclear [Pd(bpy)2]1+, and all examples of Pd(I)
existed in a Pd-Pd dimer form.26 Pd has been uses in tandem with [Ru(bpy)3]2+ emitting species,
which claim electron transfer via a bridging ligand27 although the total stability of a Pd(I) species
in these cases is unlikely given that typical Pd reductions occur in increments of 2 electrons.
[Ru(bpy)3]2+ has been combined Pd(II) bpy analogues which demonstrated catalytic activity18b,28
so quenching of [Ru(bpy)3]2+ by Pd(II) that leads toward chemical work is possible. Cyclic
voltammograms of Ru-Pd dimers showed a single reduction of a bridging ligand centered around
~ 0.68 V (vs. SCE) that was attributed to a Pd-coordinated ligand.18b If we assume an electron
transfer quenching mechanism, the driving force is likely much lower than Cu2+ (ΔE ~ -0.7 eV),

230
which would certainly explain Pd2+’s weaker effects on [Ru(bpy)3]2+ emission. The specific
quenching mechanism here is unknown (presumably ligand centered electron or excitation
transfer); we are currently examining transient absorption spectra to give insight into this
mechanism which is part of larger study, and is outside the scope of this present work.
5.3.4 Triheterometallic Complexes
We desire total control over metal species and binding location but our current scaffolds
contain many identical binding sites so metal coordination to a particular location can not be
adequately controlled. To illustrate the complexity in this challenge with our current system, we
attempted to synthesize a tri-heterometallic complex using Ru-6 to form [Ru-6(CuPd)]6+ by the
steps:
Ru-6 + Pd Ru-6(Pd) (R 5-3)
Ru-6(Pd) + Cu Ru-6(CuPd) (R 5-4)
To a sample of Ru-6, one equivalent of Pd2+ was added and the solution stirred for one hour after
which one equivalent of Cu2+ was added and stirred for an additional hour. The product was
precipitated through anion exchange with NH4PF6 and then identified through mass spectrometry
as the desired tri-heterometallic complex, shown in Figure 5-14A, compared with predicted
mass-to-charge ratio and isotopic splitting patterns. Using this method of sequential l metal ion
addition, it is possible to synthesize tri-heterometallic complexes however, as Figure 5-14B
illustrates, it does not prevent Ru-6(Cu)2 or Ru-6(Pd)2 as a product. We were unable to isolate
the product in Reaction 5-3, Ru-6(Pd), from Ru-6 and Ru-6(Pd)2 that would make Ru-6(CuPd)
more easily formed. We are currently developing methods to more adequately control this.
We measured the emission lifetime of a solution containing the product of Reaction 5-4
and compared it with that of Ru-6(Pd)2 and Ru-6(Cu)2 to determine knr and kr for Ru-6(CuPd),
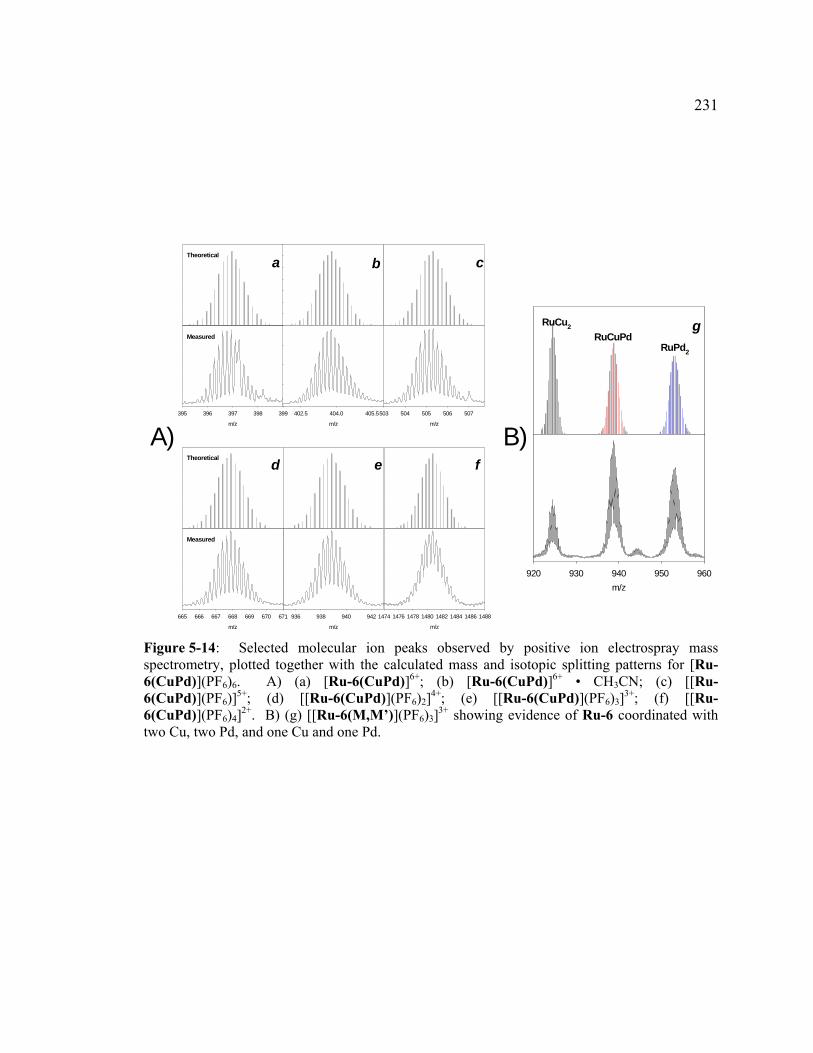
231
m/z
395 396 397 398 399
m/z
503 504 505 506 507
m/z
402.5 404.0 405.5
m/z
1474 1476 1478 1480 1482 1484 1486 1488
m/z
936 938 940 942
m/z
665 666 667 668 669 670 671
Measured
Theoretical
a b c
d e f
Measured
Theoretical
g
m/z
920 930 940 950 960
RuCuPdRuPd2
RuCu2
A) B)
Figure 5-14: Selected molecular ion peaks observed by positive ion electrospray mass spectrometry, plotted together with the calculated mass and isotopic splitting patterns for [Ru-6(CuPd)](PF6)6. A) (a) [Ru-6(CuPd)]6+; (b) [Ru-6(CuPd)]6+ • CH3CN; (c) [[Ru-6(CuPd)](PF6)]
5+; (d) [[Ru-6(CuPd)](PF6)2]4+; (e) [[Ru-6(CuPd)](PF6)3]
3+; (f) [[Ru-6(CuPd)](PF6)4]
2+. B) (g) [[Ru-6(M,M’)](PF6)3]3+ showing evidence of Ru-6 coordinated with
two Cu, two Pd, and one Cu and one Pd.

232
however we were unable to measure anything larger than a tri-exponential decay yielding
lifetimes of 8, 39, and 270 ns, and given the complexity of the quenching events, a pure sample of
Ru-6(CuPd) would be required before photophysical characterization can be completed.
5.4 Conclusions
Efficient transfer of energy and charge separation is critical to artificial photosynthesis.
This current work demonstrates additional geometries of our Ru-aeg complexes which bind
transition metal centers Cu2+ and Pd2+ to create three-dimensional structures which are in contrast
to our previous linear designs. While it is possible to synthesize tri-heterometallic structures, we
are challenged by obtaining spectroscopically pure samples. Our aim is to have complete control
over metal binding and metal location.
5.5 References.
1 Abrahamsson, M. L. A.; Baudin, H. B.; Tran, A.; Philouze, C.; Berg, K. E.; Raymond-
Johansson, M. K.; Sun, L.; Akermark, B.; Styring, S.; Hammarstrom, L. Inorg. Chem. 2002,
41, 1534–1544..
2. Du, P.; Schneider, J.; Jarosz, P.; Zhang, J.; Brennessel, W. W.; Eisenberg, R. J. Phys. Chem. B
2007, 111, 6887–6894.
3. Jarosz, P; Lotito, K.; Schneider, J.; Kumaresan, D.; Schmehl, R.; Eisenberg, R. Inorg. Chem.
2009, 48, 2420–2428.

233
4. Guldi, D. M.; Feng, L.; Radhakrishnan, S. G.; Nikawa, H.; Yamada, M.; Mizorogi, N.;
Tsuchiya, T.; Akasaka, T.; Nagase, S.; Herranz, M. A.; Martin, N. J. Am. Chem. Soc. 2010,
132, 9078 – 9086.
5. Knight, T. E.; McCusker, J. K. J. Am. Chem. Soc. 2010, 132, 2208 – 2221.
6. Fukuzumi, S.; Ohkubo, K. Coord. Chem. Rev. 2010, 254, 372 – 385.
7. a) van Staveren, D. R.; Bothe, E.; Weyhermuller, T.; Metzler-Nolte, N. Eur. J. Inorg. Chem.
2002, 6, 1518 – 1529. b) Maurer, A.; Kraatz, H. B.; Metzler-Nolte, N. Eur. J. Inorg. Chem.
2005, 16, 3207 – 3210. c) Koster, S. D.; Dittrich, J.; Gasser, G.; Husken, N.; Castaneda, I.
C. H.; Jios, J. L.; Della Vedova, C. O.; Metzler-Nolte, N. Organometallics 2008, 27, 6326 –
6332. d) Husken, N.; Gasser, G.; Koster, S. D.; Metzler-Nolte, N. Bioconjugate Chem.
2009, 20, 1578 – 1586.
8. a) Meggers, E.; Holland, P. L.; Tolman, W. B.; Romesberg, F. E.; Schultz, P. G. J. Am. Chem.
Soc. 2000, 122, 10714 – 10715. b) Atwell, S.; Meggers, E.; Spraggon, G.; Schultz, P. G. J.
Am. Chem. Soc. 2001, 123, 12364 – 12367. c) Zimmermann, N.; Meggers, E.; Schultz, P.
G. J. Am. Chem. Soc. 2002, 124, 13684 – 13685. d) Zhang, L.; Meggers, E. J. Am. Chem.
Soc. 2005, 127, 74 – 75. e) Schlegel, M. K.; Zhang, L.; Pagano, N.; Meggers, E. Org.
Biomol. Chem. 2009, 7, 476 – 482.
9. a) Popescu, D. L.; Parolin, T. J.; Achim, C. J. Am. Chem. Soc. 2003, 125, 6354 – 6355. b)
Watson, R. M.; Skorik, Y. A.; Patra, G. K.; Achim, C. J. Am. Chem. Soc. 2005, 127, 14628
– 14639. c) Franzini, R. M.; Watson, R. M.; Patra, G. K.; Breece, R. M.; Tierney, D. L.;
Hendrich, M. P.; Achim, C. Inorg. Chem. 2006, 45, 9798 – 9811. d) Paul, A.; Watson, R.
M.; Lund, P.; Xing, Y.; Burke, K.; He, Y.; Borguet, E.; Achim, C.; Waldeck, D. H. J. Phys.
Chem. C 2008, 112, 7233 – 7240.
234
10. a) Tanaka, K.; Shionoya, M. J. J. Org. Chem. 1999, 64, 5002 – 5003. b) Tanaka, K.;
Yamada, Y.; Shionoya, M. J. Am. Chem. Soc. 2002, 124, 8802 – 8803. c) Tanaka, K.;
Tengeigi, A.; Kato, T.; Toyama, N.; Shiro, M.; Shionoya, M. J. Am. Chem. Soc. 2002, 124,
12494 – 12498. d) Tanaka, K.; Tengeiji, A.; Kato, T.; Toyama, N.; Shionoya, M. Science
2003, 299, 1212 – 1213. e) Takezawa, Y.; Maeda, W.; Tanaka, K.; Shionoya, M. Angew.
Chem. Int. Ed. 2009, 48, 1081 – 1084. f) Tanaka, K.; Tengeiji, A.; Kato, T.; Toyama, N.;
Shionoya, M. Science, 2003, 299, 1212 – 1213.
11. a) Tanaka, K.; Clever, G. H.; Takezawa, Y.; Yamada, Y.; Kaul, C.; Shionoya, M.; Carell, T.
Nat. Nanotech. 2006, 1, 190 – 194. b) Clever, G. H.; Carell, T. Angew. Chem. Int. Ed.
2007, 46, 250 – 253. c) Clever, G. H.; Kaul, C.; Carell, T. Angew. Chem. Int. Ed. 2007, 46,
6226 – 6236.
12. a) Hiraoka, S.; Shiro, M.; Shionoya, M. J. Am. Chem. Soc. 2004, 126, 1214 – 1218. b)
Hiraoka, S.; Goda, M.; Shionoya, M. J. Am. Chem. Soc. 2009, 131, 4592 – 4593.
13. Gasnier, A.; Barbe, J.-M.; Bucher, C.; Duboc, C.; Moutet, J.-C.; Saint-Aman, E.; Terech, P.;
Royal, G. Inorg. Chem. 2010, 49, 2592 – 2599.
14. Ohr, K.; Gilmartin, B. P.; Williams, M. E. Inorg. Chem. 2005, 44, 7876–7885.
15. a) Gilmartin, B. P.; McLaughlin, R. L.; Williams, M. E. Chem. Mater. 2005, 17, 5446–5454.
b) Levine, L. A.; Morgan, C. M.; Ohr, K.; Williams, M. E. J. Am. Chem. Soc. 2005, 127,
16764 – 16765.
16. a) Gilmartin, B. P.; Ohr, K.; McLaughlin, R. L.; Koerner, R.; Williams, M. E. J. Am. Chem.
Soc. 2005, 127, 9546–9555. b) Ohr, K.; McLaughlin, R. L.; Williams, M. E. Inorg. Chem.

235
2007, 46, 965–974. c) Coppock, M. B.; Kapelewski, M. T.; Youm, H. W.; Levine, L. A.;
Miller, J. R.; Myers, C. P.; Williams, M. E. Inorg. Chem. 2010, 49, 5126 – 5133.
17. a) Myers, C. P.; Gilmartin, B. P.; Williams, M. E. Inorg. Chem. 2008, 47, 6738 – 6747. b)
Myers, C. P.; Miller, J. R.; Williams, M. E. J. Am. Chem. Soc. 2009, 131, 15291 – 15300.
c) Levine, L. A,; Kirin, S. I.; Myers, C. P.; Showalter, S. A.; Williams, M. E. Eur. J. Inorg.
Chem. 2009, 5, 613 – 621.
18. a) Wehman, P.; Dol, G. C.; Moorman, E. R.; Kamer, P. C. J.; van Leeuwen, P. W. N. M.;
Fraanje, J.; Goubitz, K. Organometallics, 1994, 13, 4856 – 4869. b) Inagaki, A.; Yatsuda,
S.; Edure, S.; Suzuki, A.; Takahashi, T.; Akita, M. Inorg. Chem. 2007, 46, 2432 – 2445.
19. Meyer, T. J. Pure & Appl. Chem. 1986, 58, 1193 – 1206.
20. Williams. A. T. R.; Winfield, S. A.; Miller, J. N. Analyst 1983, 108, 1067 – 1071.
21. Lu, W.; Chan, M. C. W.; Zhu, N.; Che, C. M.; Li, C.; Hui, Z. J. Am.Chem. Soc. 2004, 126,
7639–7651.
22. Freedman, D. A.; Evju, J. K.; Pomije, M. K.; Mann, K. R. Inorg. Chem. 2001, 40, 5711 –
5715.
23. Schwalbe, M.; Schafer, B.; Gorls, H.; Rau, S.; Tschierlei, S.; Schmitt, M.; Popp, J.; Vaughan,
G.; Henry, W.; Vos. J. G. Eur. J. Inorg. Chem. 2008, 3310 – 3319.
24. Meyer, T. J.; Caspar, J. V. Inorg. Chem. 1983, 22, 2444 – 2453.
25. Livingstone, S. E.; Wheelahan, B. Aust. J. Chem. 1964, 17, 219 – 229.
26. a) Leoni, P.; Papucci, S.; Pasquali, M. Inorg. Chim. Acta. 1999, 284, 246 – 251. b)
Murahashi, T.; Okuno, T.; Nagai, T.; Kurosawa, H. Organometallics, 2002, 21, 3679 –

236
3682. c) Krause, J.; Goddard, R.; Mynott, R.; Porschke, K. R. Organometallics, 2001, 20,
1992 – 1999. d) Akerstedt, J.; Gorlov, M.; Fischer, A.; Kloo, L. J. Organo. Chem. 2010,
695, 1513 – 1517. e) Boyd, P. D. W.; Edwards, A. J.; Gardiner, M. G.; Ho, C. C.; Lemee-
Cailleau, M. H.; McGuinness, D. S.; Riapanitra, A.; Steed, J. W.; Stringer, D. N.; Yates, B.
F. Angew. Chem. Int. Ed. 2010, 49, 6315 – 6318.
27. Tschierlei, S.; Presselt, M.; Kuhnt, C.; Yartsev, A.; Pascher, T.; Sundstrom, V.; Karnahl, M.;
Schwalbe, M.; Schafer, B.; Rau, S.; Schmitt, M.; Dietzek, B.; Popp, J. Chem. Eur. J. 2009,
15, 7678 – 7688.
28. a) Osawa, M.; Nagai, H.; Akita, M. Dalton Trans. 2007, 827 – 829. b) Inagaki, A.; Edure,
S.; Yatsuda, S.; Akita, M. Chem. Commun. 2005, 5468 – 5470.

Chapter 6
Aminoethylglycine-linked Ru-Pd Complexes Catalyze Dimerization of α-Methylstyrene
6.1 Introduction
Linking donors and acceptors together in an efficient manner is crucial to artificial
photosynthesis. Connections between these components have taken many forms such as linear
oligoproline arrays,1-4 molecular rectangles5,6 or organic assemblies.7-9 For this to be a viable
method, one needs control over metal complex identity and inter-metal distance to create fully
functional energy and electron transfer cascades. Our group uses an aminoethylglycine (aeg)
backbone with pendant ligands that bind solution metal ions to form multi- and heterometallic
complexes.10-15 Typically these have focused on homometallic species, however we have recently
introduced a series of [Ru(bpy)3]2+ complexes derivatized with aeg in a variety of peptide
sequences and geometries.16,17,18 Coordination with Cu2+ ions produced up to 98 % emission
quenching which was found to be conditional on peptide sequence and geometry (Chapters 2-4).
Given that the peptide is a suitable material to bring donor and acceptor close enough to induce
excited state quenching, we sought to include known donor-acceptor catalytic pairs to expand the
possible library. Recently, several examples have reported that combine [Ru(bpy)3]2+ with
[(bpy)Pd(CH3)(solvent)]+ complexes, and these were shown to photocatalyze the dimerization of
styrene and α-methylstyrene.19-25 Complexes of this type could be easily incorporated in to our
systems.
This chapter presents our first attempts to use the aeg scaffold to link together a known
donor acceptor pair as proof of concept for using our peptides for photocatalysis in linked donor-
acceptor arrays. The donor, [Ru(bpy)3]2+, has been slightly modified compared to our previous
238
reports. Here, ruthenium-coordinated bipyridine ligands have been replaced with 4,4’-dimethyl
bpy (Me2bpy) to utilize the electron donating nature of the methyl groups to push electron density
toward the Pd acceptor. Since this has been shown to increase styrene dimerization23 reaction
time by ~ thirty hours, we sought to use the same substituents effects to increase the likelihood of
electron transfer as much as possible, given the aeg backbone flexibility could potentially reduce
the efficiency of the reaction.
We designed three catalytic scaffolds (CS), (shown in Scheme 6-1), that are able to bind
one, two, and three Pd(CH3)(L) (L = Cl-, CH3CN) complexes. We measure the photophysical
properties of the Ru and Ru-Pd complexes and catalytic ability toward dimerization of α-
methylstyrene as a function of the number of Pd catalysts surrounding [Ru(Me2bpy)3]2+ as the
first proof of concept study of linking donors and acceptors with the aminoethylglycine scaffold.
6.2 Experimental
6.2.1 Chemicals and Reagents.
O-Benzotriazole-N,N,N’,N’-tetramethyl-uronium-hexafluorophosphate (HBTU) was
purchased from NovaBiochem. Copper (II) nitrate (99.9%) was purchased from J. T. Baker and
tetrakis(acetonitrile)palladium (II) tetrafluoroborate (99 %) was purchased from Strem
Chemicals. All solvents were used as received without further purification unless otherwise
noted. Tetrabutylammonium perchlorate (TBAP) was recrystallized three times from ethyl
acetate.

239
Scheme 6-1: Synthetic steps toward ruthenium catalyst scaffolds for A) CS-1, B) CS-2, and CS-3.
i) 50 / 50 ethylene glycol / ethanol, AgNO3, ∆ overnight. ii) 2.5 M NaOH, ∆ 3 hours, HCl. iii) 6 % v/v SOCl2/CH2Cl2, ∆ overnight. iv) excess H2H-aeg(bpy)-OtBu, NEt3, room temp – 4 hours, HBTU, HOBT, DIPEA, overnight.

240
6.2.2 Synthesis
The synthesis of [(Bz)Ru(Me2bpy)Cl]Cl,26 H2N-aeg(bpy)-OtButyl,17 and (η2,η2-
cycloocta-1,5-diene)chloromethylpalladium(II)27 [(cod)Pd(CH3)(Cl)] were performed as
previously reported.
6.2.2.1 Synthesis of Ruthenium and Ligand Starting Materials
6.2.2.1.1 Synthesis of 4-Methyl-4’ethyl ester bpy (mbpyee) or 4-Methyl-4’methyl ester bpy (mbpyme)
Esterification of 4-methyl-4’carboxylic acid bpy was performed by refluxing a sample of
the acid in ethanol or methanol with 3 mL H2SO4 overnight. The solvent was then removed by
rotary evaporation and the acid residue poured into 100 mL H2O. The aqueous solution was
neutralized with NaHCO3 to produce a white solid which was then extracted with CH2Cl2 (4 x 10
mL). The organic was dried with Na2SO4 and the solvent removed to yield the pure product.
Yields varied between 70-80 % and easily produced > 3 grams product. mbpyee: 1H NMR, 300
MHz, CDCl3: 1.39 (t, J = 7.13 Hz, 3H); 2.40 (s, 3H); 4.40 (q, J = 7.17 Hz, 2H); 7.12 (d, J = 4.18
HZ, 1H); 7.82 (dd, J = 5.03, 1.57 Hz, 1H); 8.20 (s, 1H); 8.53 (d, J = 5.05 Hz, 1H); 8.77 (d, J =
5.08 Hz, 1H); 8.87 (s, 1H). MS (ESI+) [M + H+] Calcd: 243.1; Found: 243.0. mbpyme: 1H
NMR, 400 MHz, d6 dmso: 2.42 (s, 3H); 3.93 (s, 3H); 7.32 (d, J = 4.78 Hz, 1H); 7.86 (d, J = 4.78
Hz, 1H); 8.25 (s, 1H); 8.65 (d, J = 4.92 Hz, 1H); 8.81 (s, 1H); 8.87 (d, J = 4.92 Hz, 1H). MS
(ESI+) [M + H+] Calcd: 229.1; Found: 229.1

241
6.2.2.1.2 Synthesis of [Ru(Me2bpy)2(mbpyme)](PF6)2
To 125 mL ethanol, 0.901 g (1.67 mmol) Ru(Me2bpy)2Cl2, 0.508 g (2.01 mmol) mbpyee,
and 0.564 (3.34 mmol) AgNO3 were added and refluxed overnight. After this time, the solvent
was removed and the red residue redissolved in H2O and filtered through a medium frit. To the
red solution, 20 mL saturated NH4PF6 was added which produced a red precipitate that was
filtered and washed with water. The solid was redissolved in CH2Cl2, dried with Na2SO4, and the
solvent then removed by rotary evaporation to yield the final product. Collected 1.12 g (68 %
yield) 1H NMR, 360 MHz, CD3CN: 2.51 (m, 15H); 3.96 (s, 3H); 7.23 (m, 5H); 7.49 (d, J = 5.88
Hz, 1H); 7.49 (d, J = 5.88 Hz, 1H); 7.52 (m, 3H); 7.57 (d, J = 5.88 Hz, 1H); 7.73 (dd, J = 5.88,
1.88 Hz, 1H); 7.92 (d, J = 5.89 Hz, 1H); 8.33 (s, 4H); 8.48 (s, 1H); 8.85 (s, 1H). MS (ESI+) [M2+]
Calcd: 349.1; Found: 349.4.
6.2.2.1.3 Synthesis of [Ru(Me2bpy)(mbpyee)2](PF6)2
A solution of 125 mL ethanol was added 0.500 g [(Bz)Ru(Me2bpy)Cl]Cl (1.15 mmol),
0.697 g mbpyee (2.80 mmol), and 0.392 g AgNO3 (2.30 mmol), was refluxed overnight. The
following day the solution was filtered to remove AgCl and the ethanol removed by rotary
evaporation. To this, 50 mL H2O was added and the solution filtered again after which 20 mL
saturated aqueous NH4PF6 was added to produce a red solid. This was filtered and washed with
water and then redissolved in CH2Cl2, dried with Na2SO4 after which the solvent was again
removed to give the final product. Collected 0.94 g (77.0 % yield). 1H NMR, 360 MHz, d6
dmso: 1.42 (m, 6H); 2,59 (m, 12H); 4.48 (m, 4H); 7.41 (m, 4H); 7.56 (d, J = 5.92, 1H); 7.64 (m,
3H); 7.96 (m, 4H); 8.77 (s, 2H); 9.05 (m, 2H); 9.12 (s, 1H); 9.15 (s, 1H). MS (ESI+) [M2+] Calc:
384.9; Found: 384.7.

242
6.2.2.1.4 Synthesis of [Ru(mbpyme)3](PF6)2
To 50 mL ethanol was refluxed 0.394 g RuCl3•3 H2O (1.51 mmol), 0.882 g AgBF4 (4.53
mmol), and 1.24 g mbpyme (5.44 mmol) was added and then refluxed overnight. The solution
was filtered to remove AgCl and the solvent removed by rotary evaporation. The red residue was
purified by column chromatography on silica with 10 % MeOH / CH2Cl2. Collected 0.74 g (51 %
yield) 1H NMR, 360 MHz, CD3CN: 2.55 (s, 9H); 3.97 (s, 9H); 7.27 (t, J = 6.29 Hz, 3H); 7.51
(m, 3H); 7.74 (m, 3H); 7.86 (m, 3H); 8.54 (s, 3H); 8.89 (s, 3H). MS (ESI+) [M2+] Calc: 393.1;
Found: 393.0.
6.2.2.2 General Approach to [Ru(Me2bpy)3]2+ Carboxylic Acid Derivatives
Ester complexes were cleaved by base hydrolysis by refluxing a sample of the ester in 3
M NaOH for 5 hours. After this time, the solution was cooled to room temperature and the pH
adjusted to ~ 1 by the addition of conc. HCl. A saturated solution of NH4PF6 was added to
produce a red solid, which was collected on a medium frit. This was rinsed with water (3 x 50
mL) and ether (5 x 50 mL) to yield the pure compounds which exhibited the following
characteristics with yields greater than 90 %:
6.2.2.2.1 Characterization of [Ru(Me2bpy)2(mbpyCA)](PF6)
1H NMR, 300 MHz, CD3CN: 2.51 (m, 15H); 7.21 (m, 4H); 7.49 (m, 4H); 7.76 (d, J =
5.93 Hz, 1H); 7.84 (d, J = 5.93, 1H); 8.32 (s, 3H); 8.50 (s, 1H); 8.88 (s, 1H). MS (ESI+) [M2+]
Calc: 342.1; Found: 342.2.

243
6.2.2.2.2 Characterization of [Ru(Me2bpy)(mbpyCA)2](PF6)2
1H NMR, 300 MHz, d6 dmso: 2.51 (m, 12H); 7.33 (m, 4H); 7.53 (m, 4H); 7.81 (m, 4H);
8.68 (s, 2H); 8.92 (s, 2H); 9.01 (s, 2H). MS (ESI+) [M2+] Calcd: 357.1; Found: 357.2.
6.2.2.2.3 Characterization of [Ru(mbpyCA)3](PF6)2
1H NMR, 360 MHz, d6 dmso, 2.52 (s, 9H); 7.34 – 7.39 (d – d, J = 5.96 Hz, 3H); 7.53 –
7.61 (d – d, J = 5.72 Hz, 3H); 7.57 – 7.95 (m-m, 6H); 8.99 (d, J = 6.46 Hz, 3H); 9.07 (s, 3H). MS
(ESI+) [M2+] Calcd: 403.2; Found: 403.4
6.2.2.3 General Approach to [Ru(Me2bpy)3]2+ aeg scaffolds
Each catalytic scaffold was synthesized by starting with [Ru(Me2bpy)3-n(CH3-bpy-
COOCH3)n=1-3]2+ which was then converted to the carboxylic acid complex though base
hydrolysis followed by acidification with conc. HCl. The product was then mildly heated
overnight in 50 mL CH2Cl2 and 4 mL SOCl2 to yield [Ru(Me2bpy)3]2+ complexes with one, two,
or three acid chloride moieties which were then precipitated by addition of heptane to form a dark
brown solid. The solid was filtered, washed with heptane, and then quickly combined with a two-
fold excess (per acid chloride site) of the amine-terminated bpy aeg compound with 4 mL
triethylamine in 100 mL dry CH2Cl2. After 5 hours of stirring, stoichiometric amounts
(calculated using the number of acid chloride sites on the Ru complex) of HBTU, HOBT, and
DIPEA were added and the resulting solution was stirred overnight. The following day, the
solvent was removed by rotary evaporation and the red residue dissolved in a minimal amount of
methanol. To this, 20 mL of a saturated solution of NH4PF6 was added which produced a red
solid. The solid was filtered, dissolved in CH2Cl2 and dried with Na2SO4. The volume was again

244
reduced by rotary evaporation and the residue was purified over silica with 10 % methanol / 90 %
CH2Cl2, collecting the major red band. The solvent was again removed by rotary evaporation to
yield the pure compound as a PF6- salt and exhibited the following:
6.2.2.3.1 Characterization of [Ru(Me2bpy)2(4-methyl-4’-aeg(bpy)-OtBu)](PF6)2 (CS-1)
Collected 0.383 g (50.6 % yield) 1H NMR, 400 MHz, CD2Cl2: 1.48 (s, 9H); 2.34 – 2.50
(s-s, 3H); 2.58 (m, 14H); 7.12 – 7.32 (d-m, 7H); 7.43 – 7.85 (m-m, 7H); 7.89 – 8.02 (t-t, 1H);
8.08 – 8.20 (s-s, 1H); 8.21 – 8.49 (s-d, 8H); 8.69 (d, 2H). HRMS (ESI+) [M2+] Calc: 525.1;
Found: 525.3. Elemental Anal. [CS-1 • 0.5 CH2Cl2] Calcd: 49.95 C; 4.45 H; 10.13 N. Found:
49.74 C; 4.44 H; 10.27 N.
6.2.2.3.2 Characterization of [Ru(Me2bpy)(4-methyl-4’-aeg(bpy)-OtBu)2](PF6)2 (CS-2)
Collected 0.302 g (34.0 % yield) 1H NMR, 400 MHz, CD2Cl2: 1.47 (m, 18H); 2.31 (m,
3H); 2.39 – 2.63 (m-m, 15H); 3.69 (m, 10H); 3.87 (m, 2H); 4.04 (m, 2H); 4.14 (m, 2H); 7.08 –
7.36 (m-m, 8H); 7.40 – 7.58 (m-m, 3H); 7.61 – 8.19 (m-m, 9H); 8.20 – 8.51 (m-m, 10H); 8.68
(m, 2H). MS (ESI+) [M2+] Calc: 723.3; Found: 723.4. Elemental Anal. [CS-2 • 2 CH2Cl2]
Calcd: 50.40 C; 4.65 H; 10.29 N. Found: 50.78 C; 4.63 H; 10.77 N.
6.2.2.3.3 Characterization of [Ru(4-methyl-4’-aeg(bpy)-OtBu)3](PF6)2 (CS-3)
Collected 0.190 g (23.0 % yield) 1H NMR, 400 MHz, CD2Cl2: 1.43 (m, 27H); 2.38 (m,
18H); 3.69 (m, 14H); 3.86 (m, 4H); 4.01 (s, 3H); 4.11 (s, 3H); 7.08 – 7.32 (m-m, 9H); 7.43 (m,
3H); 7.55 – 7.82 (m-m, 6H); 7.82 – 8.12 (m-m, 6H); 8.12 – 8.44 (m-m, 12H); 8.65 (m, 3H). MS

245
(ESI+) [M2+] Calcd: 921. 6; Found: 921.6. Elemental Anal. [CS-3 • 2 CH2Cl2] Calcd: 52.68 C;
4.90 H; 10.95 N. Found: 52.61 C; 5.54 H; 10.91 N.
6.2.2.4 General synthetic method for Ru-Pd complexes
A sample of CS-1, CS-2, or CS-3 was dissolved in dry CH2Cl2 and to this 1.5, 2.5, or 3.5
equivalents of Pd(cod)(CH3)Cl was added, respectively, and the resulting solution stirred
overnight. After this time, the solvent was removed by rotary evaporation and the solid
transferred to a fine frit where it was rinsed with copious amounts of 20 % CHCl3 / 80 % ethyl
acetate. The solid was dried in vacuum overnight and then stored in a nitrogen atmosphere.
6.2.2.4.1 Characterization of CS-1[Pd(CH3)Cl]
MS (ESI+) [M2+] Calcd: 604.1; Found: 604.1. [M2+ + 1 PF6-] Calcd: 1352.3; Found:
1352.3. Elemental Anal. Calcd: 6.75 Ru; 7.11 Pd. Found: 5.20 Ru; 7.69 Pd. (1.4 Pd: 1 Ru)
6.2.2.4.2 Characterization of CS-2[Pd(CH3)Cl]2
MS (ESI+) [M2+] Calcd: 880.2; Found: 880.2. Elemental Anal. Calcd: 4.93 Ru; 10.4
Pd. Found: 3.65 Ru; 8.79 Pd. (2.29 Pd: 1 Ru)
6.2.2.4.3 Characterization of CS-3[Pd(CH3)Cl]3
MS (ESI+) [M2+] Calcd: 1156.2; Found: 1156.2. Elemental Anal. Calcd: 3.88 Ru; 12.26
Pd. Found: 2.96 Ru; 9.83 Pd. (3.15 Pd: 1 Ru)

246
Chloride ligands were removed by adding a stoichiometric amount of AgPF6 in nitrogen
purged CH3CN and stirring for several hours during which a white precipitate was formed. This
was removed by centrifugation and the red solutions concentrated by rotary evaporation to yield
the final catalytic compound.
6.2.2.4.4 Characterization of CS-1[Pd(CH3)(CH3CN)]
MS (ESI+) [M3+] Calcd: 404.1; Found: 404.1. [M3+ + 1 PF6-] Calcd: 678.6; Found:
678.6. [M3+ + 2 PF6-] Calcd: 1502.3; Found: 1502.3.
6.2.2.4.5 Characterization of CS-2[Pd(CH3)(CH3CN)]2
MS (ESI+) [M4+] Calcd: 442.9; Found: 442.9. [M4+ + 1 PF6-] Calcd: 638.8; Found:
638.8. [M4+ + 2 PF6-] Calcd: 1030.7; Found: 1030.7.
6.2.2.4.6 Characterization of CS-3[Pd(CH3)(CH3CN)]3
MS (ESI+) [M5+] Calcd: 466.1; Found: 466.1. [M5+ + 1 BF4-] Calcd: 604.4; Found:
604.4. [M5+ + 1 PF6-] Calcd: 618.9; Found: 618.9.
6.2.3 Methods
UV-visible absorbance spectra were obtained with a double-beam spectrophotometer
(Varian, Cary 500). Emission spectra were measured using a Photon Technology International
(PTI) fluorescence spectrometer using an 814 photomultiplier detection system. Time resolved

247
emission decays were measured following excitation using a N2 dye laser (PTI model GL-302),
averaging 16 decays with a 50 µs collection time per point. Quantum yields and radiative and
nonradiative decay rates28 at all temperatures were determined using samples from which oxygen
had been using removed in repetitive freeze-pump-thaw cycles, and finally measured in a sealed
cell under nitrogen. Quantum yields were determined using the relationship:29
2
))101/((
))101/((
refA
ref
A
refrefI
I
Eq 6-1
where is the radiative quantum yield of the sample; is the known quantum yield of
[Ru(bpy)3]2+ in acetonitrile = 0.062;30 I is the integrated emission, A is the absorbance at the
excitation wavelength; and is the dielectric constant of the solvent, which is assumed to be the
same for the acetonitrile solutions of sample and reference. The rates constants of radiative (kr)
and nonradiative (knr) decay were determined using the measured excited state lifetime () and the
equations:28
nrr kk 1 Eq 6-2
nrr
r
kk
k
Eq 6-3
Mass spectrometric analysis was performed on a Waters LCT Premier time-of-flight
(TOF) mass spectrometer at the Penn State Mass Spectrometry Facility. Samples were
introduced into the mass spectrometer using direct infusion via a syringe pump. The mass
spectrometer scanned from 100-2500 m/z in positive ion mode using electrospray ionization
(ESI). NMR spectra were collected using either 360 or 400 MHz spectrometers (Bruker) in the
Lloyd Jackman Nuclear Magnetic Resonance Facility. Elemental analysis was performed by
Galbraith Industries, with replicate analysis of all metal ratios in the heterometallic structures.

248
All electrochemical measurements were obtained using a CH Instruments potentiostat
(Model 660) with 0.31 cm diameter glassy carbon working and Pt wire counter electrodes with a
Ag quasi reference electrode. Solutions were prepared from distilled CH3CN containing 0.2 M
TBAP supporting electrolyte; the solutions were deoxygenated by purging with solvent-saturated
N2. Potentials are reported vs. a saturated calomel electrode reference scale using ferrocene as an
internal potential reference standard.
Photocatalytic reactions were performed using a Newport lamp (Model 67005) equipped
with a 300 W Xe lamp with IR and 455 nm long pass light filters. To monitor catalysis, samples
were prepared in NMR tubes with CS concentrations of ~25 mM and a 100 fold excess of α-
methylstyrene in CD3NO2.
6.3 Results and Discussion
6.3.1 Synthesis and Characterization of Ruthenium Scaffolds
We have previously functionalized [Ru(bpy)3]2+ with multiple aminoethylglycine chains
by varying the number of acid chloride groups pendant from [Ru(bpy)3]2+ to form hairpin
structures of varying peptide sequence17 and multiple hairpins18 which are discussed in detail in
Chapters 3 – 5. We utilize these same principles here to synthesize catalytic scaffolds (CS) by
the methods shown in Scheme 6-1. Obtaining [Ru(Me2bpy)3]2+ with one, two, or three
carboxylic acid groups is straightforward using Ru starting materials already coordinated with
two, one, or zero dmbpy ligands. The remaining coordination sites are then occupied by 4-
methyl-4’-methylester bpy (or ethyl ester), the ester of which is easily converted to the carboxylic
acid through base hydrolysis. Reaction of these with SOCl2 and then with an excess of H2N-
aeg(bpy)OtBu gave CS-1, CS-2, and CS-3 in 50.6, 30.4, and 23.0 % yields, respectively, after

249
purification with column chromatography. These compounds were characterized using 1H NMR,
mass spectrometry, and elemental analysis to confirm their identities and purities.
We examined the electrochemical characteristics of these using cyclic voltammetry
experiments, shown in Figure 6-1. Each compound exhibited a one-electron oxidation assigned
to the RuII/III couple and three sequential one-electron reductions assigned to the reduction of Ru-
coordinated bpy ligands. In CS-1, the most positive reductive wave is due to the reduction of the
amide-containing bpy ligand which is shifted to higher potentials because of the electron
withdrawing nature of the amide moiety. CS-2 and CS-3 also have shifted reductions relative to
CS-1, an expected observation given CS-2 and CS-3 each contain two and three amide-
derivatized bpy ligands, respectively. Pendant bpy ligands on aeg strands exhibit irreversible
reductions well outside this potential window.17 The difference in oxidation and reduction
potentials increases with the number of amide substituents, which is attribute this to energy gap
considerations in light of increased delocalization and accepting ability of ligands not involved in
MLCT.28,31
Table 6-1 compares their photophysical properties. Each compound exhibits strong
absorbance bands in the visible region assigned to the well-known MLCT transition. Each
compound contains characteristic long lived excited states (τ > 1 μsec) and relaxes through the
red emission of a red photon.32 In conjunction with the electrochemical experiments above,
emission energy increases with the number of amide substituents and shows good energy gap
relationship with calculated values of knr, as shown in the plot of ln(knr) vs. emission energy
determined from maximum peak emission in cm-1 in Figure 6-2.

250
Potential (V)
-2-101
Cur
rent
/ co
nc.
(i/M
)
-0.02
0.00
0.02
0.04
0.06
0.08
0.10
CS-1
CS-2
CS-3
Figure 6-1: Cyclic voltammograms for 0.786 mM CS-1, 0.787 mM CS-2, and 0.894 mM CS-3in 0.2 M TBAP in CH3CN vs. SCE scanned at 50 mV/sec.

251
Table 6-1: Summary of Photophysical Data.a
Compound λabs (nm) (εb) λem
(nm) Φc τ (ns)
kr
(s-1/104) knr
(s-1/105)
CS-1 0.033 1075 ±
20 3.07 8.99
CS -1(PdCl) 0.018 750 ± 25 2.4 13.1 CS -1(Pdsol)
463 (15.0) 652
0.021 884 ± 20 2.40 11.0
CS -2 0.075 1390 ±
30 5.40 6.65
CS -2(PdCl)2 0.026 1112 ±
30 2.37 8.76
CS -2(Pdsol)2
468 (16.5) 638
0.032 1122 ±
30 2.88 8.62
CS -3 0.11 1684 ±
40 6.53 5.28
CS -3(PdCl)3 0.050 1315 ±
30 3.62 6.91
CS -3(Pdsol)3
466 (15.3) 626
0.059 1375 ±
30 4.46 7.16
a) Measured in solutions of CH3CN; oxygen was removed by several freeze-pump thaw cycles. b) Values are ε = cm-1M-1/1000. c) with [Ru(bpy)3]
2+ as reference Φ = 0.0615 in CH3CN.30

252
Emission Energy (1000*cm-1)
15.4 15.6 15.8 16.0
ln(k
nr)
13.1
13.2
13.3
13.4
13.5
13.6
13.7
13.8
slope = -0.84
Figure 6-2: Plot of lnknr vs. Emission energy showing energy gap relationship.

253
6.3.2 Synthesis and Characterization of Ruthenium-Palladium Catalysts
Each Ru-Pdn (n=1-3) compound was synthesized in an identical manner by stirring a
solution of either CS-1, CS-2, or CS-3 with 1.5, 3, or 4 molar equivalents of (cod)Pd(CH3)(Cl)
overnight in CH2Cl2. Palladium-bpy complexes formed by cod displacement and coordination of
the bpy ligand. Solids rinsed with ethyl acetate/CHCl3 solutions yielded Ru-Pd complexes with
no evidence of bound or unbound cod in the NMR, suggesting that all Pd starting material and
cod had been rinsed away. Stirring of CS-Pd-Cl complexes in the presence of stoichiometric
amounts of AgBF4 removed the Cl- ligand from Pd to form AgCl which was removed by
centrifugation, leaving behind a solution containing Pd complexes coordinated to CH3CN. The
identity of CS-Pd-Cl and CS-Pd-CH3CN complexes was determined using mass spectrometry,
Figures 6-3 – 6-5, which show sequential loss of both anions. At times, both anions were
identified, for example, [CS-3(PdCH3CN)3]5+ was observed with both BF4 and PF6 anions
(Figure 6-5C and D).
Mass spectrometry of these solids confirmed the presence of the target Ru-Pd species,
however elemental analysis indicated an excess of Pd in the samples. Because 1H NMR spectra
did not contain evidence for the presence of starting material, the elemental analysis data suggests
that excess Pd is associated with the Ru complex. Palladium complexes of this type have been
shown previously to coordinate to a variety of functional groups, many of which are contained
within our aeg backbone, e.g. secondary33 and tertiary amines,34 carbonyls35,36 and amides37-39 in
addition to bpy ligands. Although we expect that Pd would have a higher affinity for the bpy
ligand,40 it is clear that it also binds to the peptide and we are currently investigating the
likelihood of binding locations.

254
m/z
600 602 604 606 608
m/z
1345 1350 1355 1360
m/z
401 402 403 404 405 406 407
m/z
674 676 678 680 682 684
m/z
1495 1500 1505 1510
ea b c dTheoretical
Measured
Figure 6-3: Mass spectrometry data compared with theoretical models for a) [CS-1(PdCl)]2+; b) [[CS-1(PdCl)](PF6)]
+; c) [CS-1(PdCH3CN)]3+; d) [[CS-1(PdCH3CN)](PF6)]2+ and e) [[CS-
1(PdCH3CN)](PF6)2]+.

255
m/z
876 878 880 882 884
m/z
636 638 640 642
X Data
1026 1028 1030 1032 1034 1036
m/z
440 441 442 443 444 445 446
a b c dTheoretical
Measured
Figure 6-4: Mass spectrometry data compared with theoretical models for a) [CS-2(PdCl)2]2+; b)
[CS-2(PdCH3CN)2]4+; c) [[CS-2(PdCH3CN)2](PF6)]
3+ and d) [[CS-2(PdCH3CN)2](PF6)2]2+.

256
m/z
1152 1154 1156 1158 1160 1162
Theoretical
Measured
m/z
464 465 466 467 468 469
m/z
602 604 606 608
m/z
616.5 618.0 619.5 621.0
a b c d
Figure 6-5: Mass spectrometry data compared with theoretical models for a) [CS-3(PdCl)3]2+; b) [CS-
3(PdCH3CN)3]5+; c) [[CS-3(PdCH3CN)3](BF4)]
4+ and d) [[CS-3(PdCH3CN)3](PF6)2]2+.

257
To demonstrate the use of the Ru-Pd complexes as potential photocatalysts, we first
measured their photophysical properties for evidence of [Ru(Me2bpy)3]2+ excited state quenching,
a necessary characteristic for light harvesting compounds. Table 6-1 lists the photophysical
properties of CS-1, CS-2, and CS-3 containing bound Pd(CH3)(Cl) and [Pd(CH3)(CH3CN)]+. In
each case, Φ and τ decreased when Pd was bound to the Ru complex. For example, CS-1
emission Φ decreased by ~ 1.5 % upon coordination of Pd(CH3)(Cl). A more dramatic effect is
observed with CS-3, in which quantum yield decreased by 6 %, likely as a result of additional
coordinated Pd and therefore additional relaxation pathways around the chromophore. We
consistently observed a slight increase in both excited state lifetime and emission quantum after
the Cl- ligand was removed from Pd. By replacing the Cl- with a CH3CN ligand, the charge of
the Pd complex increases from 0 to +1. We attributed the increase in excited state stability (and
consequently decreased quenching ability by Pd), to slight electrostatic repulsion between the
[Ru(Me2bpy)3]2+ and the [Pd(bpy)(CH3)(CH3CN)]+, which would increase the average distance
between Ru and Pd by forcing the aeg linker to a more linear form.
We attempted to use cyclic voltammetry to measure the bpy ligand reduction of
Pd(bpy)(CH3)(Cl), however the electrochemistry in this region was completely irreversible.
Reversibility of this couple has been shown to be conditional on the substitution around the bpy
ligand.21 For example, methyl substitutions at the 5- and 5’- position resulted in reversible one-
electron ligand centered reductions while 4- and 4’- were chemically irreversible, as in our
pendant ligands.
6.3.3 Photoinitiated Dimerization of α-methylstyrene
Literature precedence suggests that when [Ru(bpy)3]2+ and Pd(bpy)(CH3)(CH3CN) are
linked and irradiated with light > 455 nm, the heterometallic complex is able to catalyze the

258
dimerization of styrene. We sought to examine if this reaction was possible using our flexible
linker, aminoethylglycine, to bring together donor and catalytic acceptor. Each catalyst was
combined with a large molar excess of styrene in deuterated nitromethane solutions and irradiated
with a 300 W lamp equipped with a 455 nm long pass and IR filters. The reaction was monitored
by 1H NMR spectroscopy, acquiring spectra before and after irradiation. An example is shown in
Figure 6-6. Initially, the spectrum contains only peaks associated with the α-methyl styrene
starting material (Figure 6-6A). If left to stand for several hours in the dark, no reaction is
observed. After irradiation for 85 minutes at wavelengths > 455 nm, the NMR spectrum shown
in Figure 6-6B is observed. Comparison of this spectrum with commercially available 2,4-
diphenyl-4-methyl-1-pentene (α-methyl styrene dimer, Figure 6-6C) shows that peaks
corresponding to the dimer have grown in, whereas peaks assigned to the monomer have
disappeared (Figure 6-6D). These data conclusively demonstrate photocatalytic dimerization of
α-methyl styrene. The aliphatic region of Figure 6-6B and D contain many small peaks which
are attributed to side reactions or further polymerization. These spectra are of reaction mixtures
so these peaks are expected however future purification would be necessary before these products
could be used further.
To compare the catalytic ability between the set of Ru-Pd complexes, we measured the
rate of consumption of α-methyl styrene prepared in a 100:1 molar excess of styrene:Ru. The
reaction was monitored using NMR spectroscopy and the percentage of styrene consumed vs.
time is shown in Figure 6-7A. In the absence of light, no evidence of dimerization was observed,
indicated by the open circles. In the presence of light, all three complexes were able to almost
fully react the styrene over the course of the experiment, however the striking aspect was the
difference in rates between the three Ru complexes. Using CS-1(PdCH3CN) as our baseline, we
compare the effects of tethering additional Pd complexes to the [Ru(Me2bpy)3]2+ donor:
increasing from n = 1 to 2 consumes the styrene at a faster rate, expected given the increased

259
ppm
02468
A)
B)
C)D)
Figure 6-6: Example 1H NMR spectra for Ru-2[Pd-CH3CN]2 during a photocatalytic experiment. A) Before irradiation. B) Irradiation for 85 minutes with light > 455 nm. C) Purchased 2,4-diphenyl-4-methyl-1-pentene. D) Difference between A and B normalized to integration of CD3NO2 peak at 4.33 ppm. Positive peaks indicative of new species in solution;negative peaks indicative of reacted material.

260
time (minutes)
0 20 40 60 80 100 120 140
% M
onom
er C
onsu
med
0.0
0.2
0.4
0.6
0.8
1.0
time (minutes)
0 20 40 60 80 100 120 140
Rat
io D
ime
r:M
ono
me
r
0
2
4
6
8
10
12
14
16
A)
B)
Figure 6-7: A) Plot of % α-methyl styrene consumed vs. time for 36.4 mM CS-1[PdSol] (w/light, ●), CS-1[PdSol] (no light, ○), 17.0 mM CS-2[PdSol]2 (▼), and 17.0 mM CS-3[PdSol]3
(■). B) Ratio of product: reactant vs. time during Photocatalysis experiment for CS-1[PdSol] (w/light, ●), CS-2[PdSol]2 (▼), and CS-3[PdSol]3 (■).

261
number of catalytic (Pd) sites. However, when n is increased to 3, CS-3[PdCH3CN]3 consumes
the styrene at a slower rate. Dimerization reaction rates were previously shown to depend on the
electron donating ability of Ru-coordinated ligands; bipyridine vs. dimethyl bipyridine ligands
coordinated to Ru resulted in a ~ 30 hour decrease in total reaction time.23 In our systems,
decreasing the number of methyl groups and increasing the number of amides on the bipyridine
ligands likely decreases the likelihood of preferentially pushing electrons in a single directions,
and increasing the likelihood of greater electron delocalization over the ligands.41 To more
systematically study this effect, a general formula of [Ru(4-methyl-4’-methylamide)3]2+ could be
used. This would maintain that each Ru-coordinated ligand contained one methyl and one amide
group. Replacement of the amide with an one, two, or three aeg backbones would ensure that Ru
ligands have the same electron withdrawing/donating ligand effects, and therefore can be
expected to have the same electronic structures in the excited state, regardless of how many
peptides are attached.
While each catalysts formed styrene dimers, none of the reactions proceeded as cleanly as
2 monomers 1 dimer; analysis of the alkene proton integration showed that at the end of the
reaction, the concentration of dimer was not 50 % of the initial monomer concentration. A small
but measurable amount of monomer starting material was consistently observed in the spectra.
Comparison of the ratio of dimer:monomer provides insight into the relative amount of dimer
produced. Figure 6-7B contains a plot of the ratio of dimer:monomer over the course of the
reaction. As the concentration of monomer approaches zero, the ratio of dimer:monomer should
approach infinity, even if the dimer is further reacted. This is clearly not the case. Both CS-
1(PdCH3CN) and CS-3(PdCH3CN)3 only react until ~ 8:1 dimer:monomer whereas CS-
2(PdCH3CN)2 reaches ~ 16:1. The aliphatic region of the proton spectrum in Figure 6-6B
suggests that other unknown species are formed during the reaction.

262
A better purification method is required to obtain pure catalytic samples. In an attempt to
purify CS-1(PdCl) by column chromatography using alumina, CHCl3 mobile phase eluted a faint
yellow band that was, presumably, starting material. The mobile phase was changed to CH3CN
which eluted a dark orange band assumed to be the product. Analysis with mass spectrometry
revealed the predominant species was CS-1(PdCH3CN) and very little CS-1(PdCl) was detected.
Addition of AgBF4 to the product resulted in only trace amounts of AgCl indicating that most of
the Cl- ligand had been removed during the purification process. The yield after purification
varied depending on the length of the column, since much of the product adsorbed to the alumina.
Collected yields ranged between 20 – 40 %.
It is still unclear whether coordination of Pd to bpy is required for this reaction; Pd bound
to the backbone may in fact produce catalytic complexes. A control of this experiment would be
to combine Pd(CH3)(CH3CN) with Ru-0 in Chapter 2 which does not contain free bpy ligands.16
Analysis of the catalytic capability of this would provide insight into the role of the peptide and
information that would help in the design of either a better catalyst or improved methods for
attaching this catalyst to the backbone. For example, it may be possible to attach Pd to methyl-
bpy-acetic acid and then couple the metal complex to the aeg backbone, as in Chapter 2.
However, it is clear that in order to understand and fully characterize the photocatalytic
dimerization of styrene with this series of structures, that the pure compounds must be prepared
and isolated, and that the structures containing one methyl and one amide substituent per bpy
ligand should be used.
6.4 References
1. Slate, C. A.; Striplin, D. R.; Moss, J. A.; Chen, P.; Erickson, B. W.; Meyer, T. J. J. Am. Chem.
Soc. 1998, 120, 4885 – 4886.

263
2. Striplin, D. R.; Reece, S. Y.; McCafferty, D. G.; Wall, C. G.; Friesenn, D. A.; Erickson, B.
W.; Meyer, T. J. J. Am. Chem. Soc. 2004, 126, 5282 – 5291.
3. Serron, S. A.; Aldridge, W. S.; Fleming, C. N.; Danell, R. M.; Baik, M.-H.; Sykora, M.;
Dattelbaum, D. M.; Meyer, T. J. J. Am. Chem. Soc. 2004, 126, 14506 – 14514.
4. Aldridge, W. S.; Hornstein, B. J.; Serron, S.; Dattelbaum, D. M.; Schoonover, J. R.; Meyer, T.
J. J. Org. Chem. 2006, 71, 5186 – 5190.
5. Kaim, W.; Schwederski, B.; Dogan, A.; Fiedler, J.; Kuehl, C. J.; Stang, P. J. Inorg. Chem.
2002, 41, 4025 – 4028.
6. Zhao, G.-J.; Northrop, B. H.; Ham, K.-L.; Stang, P. J. J. Phys. Chem. A. 2010, 114, 9007 –
9013.
7. Wasielewski, M. R. Acc. Chen. Res. 2009, 42, 1910 – 1921.
8. She, C.; Lee, S. J.; McGarrah, J. E.; Vura-Weis, J.; Wasielewski, M. R.; Chen, H.; Schatz, G.
C.; Ratner, M. A.; Hupp, J. T. Chem. Commun. 2010, 46, 547 – 549.
9. Ricks, A. B.; Solomon, G. C.; Colvin, M. T.; Scott, A. M.; Chen. K.; Ratner. M. A.;
Wasielewski, M. R. J. Am. Chem. Soc. 2010, 132, 15427 – 15434.
10. Ohr, K.; Gilmartin, B. P.; Williams, M. E. Inorg. Chem. 2005, 44, 7876–7885.
11. Gilmartin, B. P.; McLaughlin, R. L.; Williams, M. E. Chem. Mater. 2005, 17, 5446–5454.
12. Levine, L. A.; Morgan, C. M.; Ohr, K.; Williams, M. E. J. Am. Chem. Soc. 2005, 127, 16764
– 16765.

264
13. Gilmartin, B. P.; Ohr, K.; McLaughlin, R. L.; Koerner, R.; Williams, M. E. J. Am. Chem.
Soc. 2005, 127, 9546–9555.
14. Ohr, K.; McLaughlin, R. L.; Williams, M. E. Inorg. Chem. 2007, 46, 965–974.
15. Coppock, M. B.; Kapelewski, M. T.; Youm, H. W.; Levine, L. A.; Miller, J. R.; Myers, C. P.;
Williams, M. E. Inorg. Chem. 2010, 49, 5126 – 5133.
16. Myers, C. P.; Gilmartin, B. P.; Williams, M. E. Inorg. Chem. 2008, 47, 6738 – 6747.
17. Myers, C. P.; Miller, J. R.; Williams, M. E. J. Am. Chem. Soc. 2009, 131, 15291 – 15300.
18. Myers, C. P.; Ostheimer, S. E; Miller, J. J.; Williams, M. E. Inorg. Chem. submitted.
19. Inagaki, A.; Edure, S.; Yatsuda, S.; Akita, M. Chem. Commun. 2005, 5468 – 5470.
20. Osawa, M.; Nagai, H.; Akita, M. Dalton Trans. 2007, 827 – 829.
21. Inagaki, A.; Yatsuda, S.; Edure, S.; Suzuki, A.; Takahashi, T.; Akita, M. Inorg. Chem. 2007,
46, 2432 – 2445.
22. Rau, S.; Walther, D.; Vos, J. G. Dalton Trans. 2007, 915 – 919.
23. Inagaki, A.; Nakagawa, H.; Akita, M.; Inoue, K.; Sakai, M.; Fujii, M. Dalton Trans. 2008,
6709 – 6723.
24. Jakob, A.; Ecorchard, P.; Kohler, K.; Lang. H. J. Organomet. Chem. 2008, 693, 3479 –
3489.
25. Saita, T.; Nitadori, H.; Inagaki, A.; Akita, M. J. Organomet. Chem. 2009, 694, 3125 – 3133.
26. Freedman, D. A.; Evju, J. K; Pomije, M. K.; Mann, K. R. Inorg. Chem. 2001, 40, 5711 –
5715.

265
27. Rulke, R. E.; Ernsting, J. M.; Spek, A. L.; Elsevier, C. J.; van Leeuwen, P. W. N. M.; Vrieze,
K. Inorg. Chem. 1993, 32, 5769 – 5778.
28. Meyer, T. J. Pure & Appl. Chem. 1986, 58, 1193 – 1206.
29. Williams. A. T. R.; Winfield, S. A.; Miller, J. N. Analyst 1983, 108, 1067 – 1071.
30. Lu, W.; Chan, M. C. W.; Zhu, N.; Che, C. M.; Li, C.; Hui, Z. J. Am.Chem. Soc. 2004, 126,
7639–7651.
31. Meyer, T. J.; Caspar, J. V. Inorg. Chem. 1983, 22, 2444 – 2453.
32. Kalyanasundaram, K. Coord. Chem. Rev. 1982, 46, 159–244.
33. Lin, Y.-C.; Yu, K.-H.; Huang, S.-L.; Liu, Y.-H.; Wang, Y.; Liu, S.-T.; Chen, J.-T. Dalton
Trans. 2009, 9058 – 9067.
34. Yang, F.-Z.; Wang, Y.-H.; Chang, M.-C.; Yu, K.-H.; Huang, S.-L.; Liu, Y.-H.; Wang, Y.;
Liu, S.-T. Chen, J.-T. Inorg. Chem. 2009, 48, 7639 – 7644.
35. Elsegood, M. R. J.; Smith, M. B.; Dale, S. H. Acta Cryst. 2007, 63, m7 – m9.
36. Zhang, J.; Vaidya, T.; Brennessel, W. W.; Frontier, A. J.; Eisenberg, R. Organometallics,
2010, 29, 3341 – 3349.
37. Reddy, P. M.; Reddy, M. B.; Rohini, R.; Shanker, K.; Ravinder, V. Arc. Apl. Sci. Res. 2009,
1, 12 – 17.
38. Butsch, K.; Gust, R.; Klein, A.; Ott, I.; Romanski, M. Dalton Trans. 2010, 39, 4331 – 4340.
39. Lee, D.-H.; Lee, J.-H.; Park, B. K.; Kim, E. Y.; Kim, Y.; Kim, C.; Lee. I.-M. Inorg. Chim.
Acta. 2009, 362, 5097 – 5102.
266
40. Rotondo, A.; Bruno, G.; Cusumano, M.; Rotondo, E. Inorg. Chim. Acta 2009, 362, 4767 –
4773.
41. Wasylenko, D. J.; Ganesamoorthy, C.; Henderson, M. A.; Koivisto, B. D.; Osthoff, H. D.;
Berlinguette, C. P. J. Am. Chem. Soc. 2010, 132, 16094 – 16106.

Chapter 7
Metal-centered Aminoethylglycine Complexes: Conclusions and Future Outlook.
7.1 Introduction
This thesis presented work centered on demonstrating the versatility of metal-ligand
coordination chemistry in conjunction with amide coupling chemistry. Complexes based on
[Ru(bpy)3]2+-structures allow for a high degree of variation in terms of ligand and metal
substitution and pendant substituents. This chapter presents initial proof of concept experiments
aimed at expanding the metallated aminoethylglycine motif toward more complex systems with
goals including the production of advanced downhill energy transfer systems, greater analysis of
peptide interactions, and higher control on solution-phase and solid-phase structures.
7.2 Transient Absorption Spectroscopy
In chapter 4, Equations 4-4 and 4-6 describe an electron transfer quenching mechanism
resulting in the formation of [Ru(bpy)3]3+ and [Cu(bpy)2]
1+. While examination of activation
energies did not provide a clear mechanism, we turned toward transient absorption spectroscopy
for insight. Figure 7-1 shows femtosecond transient absorption spectra taken at time intervals
between 0 and 3 ns following excitation of a 100 fs pulse at 332 nm. During the time scale of this
experiment, absorption of a photon resulted in a bleach of the MLCT band at 470 nm and an
increase in absorbance at 380 nm as indicated by the arrows. The absorbance at 380 nm is
assigned to bpy•/-. However, the time scale of the experiment was not long enough to allow the
excited state to relax, so that we were unable to obtain evidence for either energy or electron

268
Figure 7-1: Femtosecond transient absorption spectra of Ru-1-(Cu) taken between 0 and 3 ns. Arrows indicate the simultaneous growth of bpy•/- (black) and the bleach of MLCT band (red).

269
transfer. Single wavelength nanosecond transient absorption measurements were used to monitor
the decay of all excited state species. Full spectra were constructed at a variety of time intervals,
however no evidence for the presence of [Cu(bpy)2]1+ was observed on time scales between 3 ns –
10 μs, which may be a result of the low ε (~ 1200 M-1cm-1)1 for [Cu(bpy)2]1+ and relatively high ε
of [Ru(bpy)3]2+ (~ 13,500 M-1cm-1) or because the concentration of Cu+ remained too low.
However, key characteristics of the [Ru(bpy)3]2+ transient spectrum are indicative of quenching
mechanism, as illustrated in Figure 7-2. In [Ru(bpy)]2+ the rate of bpy•/- decay (kbpy)is
approximately equal to the rate of recovery of the ground state (kMLCT). When [Ru(bpy)3]2+ is
tethered to an electron acceptor, why hypothesize kbpy (kbpy,2 in Figure 7-2) should be much faster
than kMLCT (kMLCT,2 in Figure 4-2) indicating that an electron from bpy•/- is transferred elsewhere
resulting in neutral bpy ligand and a reduced species.2
After photoexcitation at λex = 480 nm, compounds Ru-1 through Ru-5 exhibited a bleach
of the MLCT absorption at 470 nm and a simultaneous increase in the absorbance at 380 nm due
to formation of bpy•/-. The transient decays of these were fit to single exponential functions, and
the resulting data are shown in Table 7-1. These data show that for [Ru(bpy)3]2+ kMLCT and kbpy
are identical within error indicating that the excited state decay and ground state recovery occur
simultaneously. Based on transient emission data, it is known that this is due to charge
recombination and emission of a photon. After the addition of Cu2+, all compounds revealed a ~
2 order of magnitude increase in kMLCT and kbpy, consistent with our determinations of knr from
transient emission data (Table 7-1). Trends through the series of structures are also consistent
between transient absorption and emission data; a decrease in rates is observed as distance
increases from Ru-1(Cu) to Ru-3(Cu), and values for Ru-4(Cu)2 and Ru-5(Cu)2 were
approximately the same as Ru-1(Cu).
Within error, there were no differences between observed kMLCT and kbpy among any of
the Ru-Cu complexes (excluding Ru-2(Cu)) suggesting that both occurred at the same time. In

270
Figure 7-2: Energy level diagram for Ru-Cu complexes.

271
Table 7-1: Summary of transient absorption data.a
Compound Emission
c (ns) kem / 105
(sec-1) MLCT d
(ns) kb / 105 (sec-1)
bpy•/- e (ns)
kbpy / 105 (sec-1)
Ru-1 1180 b 8.47 1173 ±
14 8.52 ±
0.1 1164 ±
36 8.59 ±
0.2
Ru-2 1160 b 8.62 1149 ±
38 8.70 ±
0.3 1155 ±
35 8.66 ±
0.2
Ru-3 1120 b 8.93 1134 ±
33 8.82 ±
0.2 1147 ±
49 8.72 ±
0.4
Ru-4 1210 b 8.26 1250 ±
70 8.00 ±
0.4 1238 ±
60 8.08 ±
0.4
Ru-5 1200 b 8.33 1217 ±
34 8.22 ±
0.2 1267 ±
62 7.89 ±
0.4 Ru-1-(Cu) 28 ± 2 357 ± 24 29 ± 1 345 ± 11 28 ± 1 357 ± 12 Ru-2-(Cu) 28 ± 2 357 ± 24 37 ± 2 270 ± 14 28 ± 3 357 ± 34 Ru-3-(Cu) 46 ± 1 217 ± 5 48 ± 2 208 ± 8 47 ± 3 213 ± 13 Ru-4-(Cu)2 21 ± 1 476 ± 21 23 ± 1 435 ± 18 23 ± 5 435 ± 78 Ru-5-(Cu)2 23 ± 1 435 ± 18 24 ± 2 417 ± 32 25 ± 2 400 ± 30
a All measurements made in nitrogen purged CH3CN at room temperature with λex = 480 nm. B Transposed from Table 4-1. c monitored at λem = 650 nm for all compounds. d lifetime of the rate of recovery of the MLCT after photoexcitation. e lifetime of the decay of the bpy•/- monitored at 380 nm.

272
the presence of a single Cu2+ if electron transfer quenching occurs forming [Cu(bpy)2]+ we would
expect to see differences in kMLCT,2 that would reflect differences in peptide length. Since this is
not observed, one explanation is that we are measuring the motion of the flexible aeg backbone
and not a distance dependence effect. Decreased quenching rates could result from the increased
time necessary to bring [Cu(bpy)2]2+ into proximity with [Ru(bpy)3]
2+ for electron transfer
quenching to occur. We also observe that kMLCT,2 and kbpy,2 are equal for Ru-4(Cu)2 and Ru-
5(Cu)2. Since adding a second [Cu(bpy)2]2+ could encourage intervalence charge transfer
between the Cu centers, creating a greater charge separation distance (see Eq 4-6). However,
because kMLCT and kbpy are equal for Ru-4(Cu)2 and Ru-5(Cu)2, quenching likely occurs by
reaction with the nearest [Cu(bpy)2]2+ complex and the addition of a second [Cu(bpy)2]
2+ has no
significant effect. It is of note that Ru-2(Cu), exhibited a consistent 80 sec-1 difference in kMLCT,2
and kbpy,2 that could indicate a brief charge separation of ~ 10 ns. Work is currently underway to
examine this observation.
Chapter 4 discussed the likelihood of energy or electron transfer and although both are
possible, the data here show that transient absorption is also unable to definitively confirm a
single mechanism or quantify the extent multiple mechanisms participate in excited state
relaxation. The weak ε of [Cu(bpy)2]+’s makes direct observation of the reduced species
impossible in the presence of the Ru complex and in addition, the flexibility of the aeg backbone
may allow for a range of donor acceptor distances within a single pure sample. Together, this
makes distinguishing electron or energy transfer in our systems a significant challenge. It is
possible that the mechanism is either Förster or Dexter quenching3-5 because both yield
indistinguishable products (ground state donor and excited state acceptor). If electron transfer
quenching results in discreet single electron transfer steps (e.g. RuII CuII followed by CuI
RuIII), back electron transfer must be faster than the resolution of the instrument (< 1 ns) and
given the large driving force for back electron transfer (∆G ~ -1.2 eV), this is entirely possible.

273
Inclusion of bulky redox-silent side groups in place of acetyl spacers may hinder flexibility and
prevent the illusion that things are happening faster than they are. In addition, an acceptor with
no spectral overlap with [Ru(bpy)3]2+ could be used so that energy transfer can be excluded. It
would be advantageous for this acceptor to undergo an irreversible reduction so that electron
transfer from [Ru(bpy)3]2+ to A resulted in a permanently reduced (and easily identifiable) A- and
[Ru(bpy)3]3+.
7.3 Pyrene-Derivatized Ruthenium Hairpin Complexes
7.3.1 Pyrene Energy Transfer
The synthesis of [Ru(bpy)3]2+ complexes is amenable to a wide variety of ligand
variations and substitutions and therefore combining it with organic excited state donors is a
possibility. For example, [Ru(bpy)3]2+ has been combined with planar aromatic molecules such
as anthracene, naphthalene, and pyrene for light harvesting compounds.6 Of these, pyrene offers
the most efficient excited state interaction and many studies have been done to illustrate this6-10
though the most attractive application is its use as an “energy resevior”.6-7 Figure 7-3 shows a
simplified energy level diagram for a potential [Ru(bpy)3]2+-pyrene system. The [Ru(bpy)3]
2+
3MLCT and the 3pyrene are isoenergetic and excitation of a Ru-pyrene complex at λRu,abs,max
allows for up to 85 % excitation transfer to the pyrene as measured though analysis of emission
decay curves. Remarkably, the excited lifetime of this dimer was 5.23 μsec at room temperature
and 70 msec at 77 K. Incorporation of pyrene moieties into our scaffolds as energy reservoirs or
donors would be an extremely advantageous addition and could lead to more efficient light
harvesting and energy transfer conversion. This section discuses progress toward the synthesis
and use of the first pyrene-[Ru(bpy)3]2+ hairpin complex and its metal binding with Cu2+.

274
Figure 7-3: Energy Level Diagram for Ru-pyr-1.1

275
7.3.1.1 Synthesis of Pyrene- Ru Hairpin Complexes
7.3.1.1.1 Synthesis of Methyl-bpy-CH2-pyrene
To 150 mL dry THF was added 1.40 g Pyrene-CH2-NH2 (6.06 mmol), 0.4 g methyl-bpy-
acid chloride (1.72 mmol), and 2 mL NEt3 were added and stirred overnight. After this time the
solvent was removed by rotary evaporation and the residue purified over silica using 15 %
CH2Cl2 in MeOH to give the pure product. Collected 0.234 g (31.7 % yield). 1H NMR, 400
MHz, d6 dmso: 2.37 (s, 3H); 5.22 (d, 2H); 7.28 (d, 1H); 7.88 (d, 1H); 8.10 (m, 4H); 8.26 (m, 5H);
8.50 (t, 2H); 8.80 (t, 2H); 9.67 (t, 1H).
7.3.1.1.2 Synthesis of Ru(bpy)(methyl-bpy-pyrene)Cl2
To 5 mL DMF was added 0.222 g [(Bz)Ru(bpy)Cl]Cl (0.548 mmol), 0.234 g methyl-
bpy-pyrene (0.548 mmol) and 0.191 g LiCl (4.55 mmol) and the resulting solution refluxed for 5
hours. After this time, the solution was cooled to room temperature, poured into 10 mL acetone
and placed in the freezer overnight. After this time the solution was filtered to give dark green
solid that was largely insoluble in most solvents. Collected 0.178 g (43 % yield).
7.3.1.1.3 Synthesis of [Ru(bpy)(methyl-bpy-pyrene)(4,4’-dimethylester bpy)](PF6)2
A solution containing 0.05 g (0.066 mmol) Ru(bpy)(methyl-bpy-pyrene)Cl, 0.0257 g
(1.32 mmol) AgBF4 and 0.036 g (1.32 mmol) 4,4’-dimethylester bpy were refluxed overnight in
50 mL ethanol. After this time the solvent was removed by rotary evaporation and the red residue

276
was purified over silica with 5:4:1 CH3CN:H2O:KNO3sat,aq. The dark orange band was collected
the solvent was removed by rotary evaporation. The complex was dissolved in methanol and then
precipitated by addition of a saturated solution of NH4PF6 to produce a red solid that was filtered
and washed with methanol and water. Collected 0.034 g (45 % yield). 1H NMR, 400 MHz, d6
dmso: 2.53 (s, 3H); 3.93 (s, 6H); 5.30 (d, 2H); 7.30 – 7.60 (d-d, 4 H); 7.63 – 7.78 (d-d, 2H); 7.79
– 7.92 (m-m, 4H); 7.95 (d, 2H); 8.0 – 8.22 (d-m, 7H); 8.22 – 8.33 (m-m, 4H); 8.48 (d, 1H); 8.75
(s, 1H); 8.84 (d, 2H); 9.15 (s, 1H); 9.31 (s, 2H); 9.74 (t, 1H). MS (ESI+) [M2+ + 1PF6-] Calc:
1102.2; Found 1102.1.
7.3.1.1.4 Synthesis of [Ru(bpy)(methyl-bpy-pyrene)(bpy(aeg-OtBu)2)](NO3)2
To 25 mL ethanol, 0.178 g Ru(bpy)(bpy-pyrene)Cl2 (0.235 mmol) and 0.164 g 1
(Chapter 2) (0.295 mmol) were refluxed overnight. The solvent was removed through rotary
evaporation and the red residue was purified over silica with 5:4:1 MeOH:H2O:sat. KNO3 (aq) to
yield 0.123 g of a red solid (38.2 % yield). 1H NMR, 360 MHz, CD3CN: 1.48 (m, 18 H); 2.42 (d,
3H); 3.26 (m, 4H); 3.70 (m, 4H); 3.89 (m, 4H); 5.23 (d-d, 2H); 7.21 (t, 1H); 7.37 (m, 2H); 7.51
(m, 1H); 7.62 – 7.86 (m-m, 10H); 7.97 – 8.25 (m-m, 11H); 8.45 (m, 4H); 8.88 (m, 3H); 8.95 (d,
1H); 9.21 (d, 2H). MS (ESI+) [M2+] Calc: 620.7; Found: 620.7.
7.3.1.1.5 Synthesis of [Ru(bpy)(methyl-bpy-pyrene)(bpy[aeg(bpy)-Otbutyl]2)](PF6)2 (Ru-pyr-1)
In 50 mL dry CH2Cl2 0.123 g [Ru(bpy)(methyl-bpy-pyrene)(bpy(aeg-OtBu)2)](NO3)2
(0.090 mmol), 0.082 g Methyl-bpy acetic acid (3.60 mmol), 0.120 g HBTU (3.6 mmol), 0.052 g
HOBT (3.60 mmol), and 1 mL DIPEA was added and stirred overnight. After this time, an
additional 0.082 g methyl-bpy-acetic acid was added and the solution was allowed to stir for an

277
additional day. The compound was purified as previously reported11 to give 0.137 g of a red solid
(85.2 % yield). 1H NMR, 360 MHz, CD3CN: 1.42 (m, 18H); 2.20 (m, 3H); 2.25 – 2.51 (m, 6H);
3.52 (m, 8H); 3.91 (m-m, 6H); 4.18 (d, 2H); 5.38 (d, 2H); 6.91 – 9.10 (m-m, 44H). MS (ESI+)
[M2+] Calc: 830.8; Found: 830.7.
7.3.1.2 Discussion
Scheme 7-1A depicts the synthetic steps toward Ru-pyr-1, which contains the same
[Ru(bpy)3]2+-hairpin system described in detail in Chapters 1-5, but now contains a pyrene
moiety pendant from a Ru-coordinated bpy ligand. The pyrene, while not directly conjugated to
Ru through the bpy is available to provide energy to the [Ru(bpy)3]2+ 3MLCT by a through-space
energy transfer mechanism. Complexation of a solution metal ion (i.e. Cu2+, Pd2+) by the free bpy
ligands could lead toward an energy/electron transfer cascade as depicted in Figure 7-3.
Of consideration is the orientation of pyrene relative to the hairpin portion of the complex; both
cis and trans isomers are possible. A cis orientation would place the pyrene directly above the
hairpin moiety of the complex; whereas a trans orientation would be further away. Because of
this structural variation, and given that these synthetic steps yield both isomers, careful
consideration must be made when choosing the second added metal. It would be optimal for a
trans pyrene, and thus as far away from a [M(bpy)2]2+ complex as possible to discourage direct
energy transfer from pyrene [M(bpy)2]2+. Separation of geometric isomers has been shown
previously through syntheses and separation12,13 of key intermediates and this methodology could
easily be applied here.
Figure 7-4 shows an emission titration of Cu2+ into Ru-pyr-1. As before, emission
intensity decreases and then reaches a minimum of ~ 97 % quenching at ~ 1:1 Cu2+:Ru-pyr-1
implying stoichiometric binding of Cu2+ into the pyrene derivatized scaffold. There is a slight
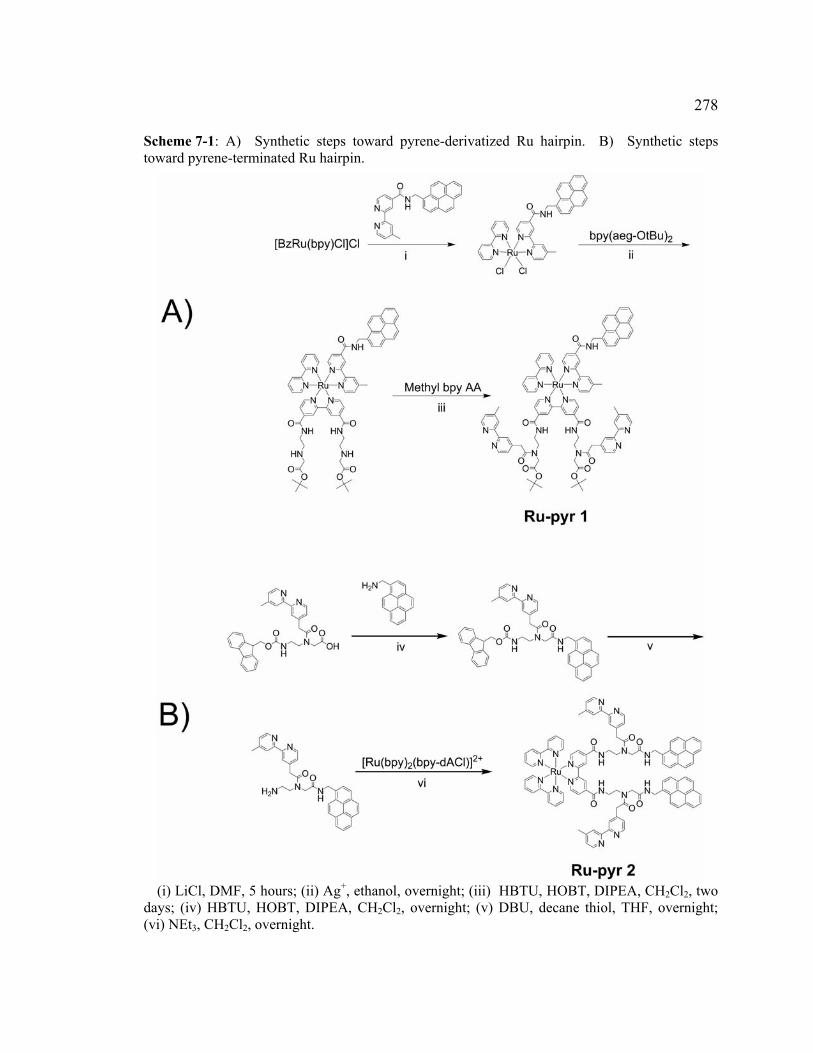
278
Scheme 7-1: A) Synthetic steps toward pyrene-derivatized Ru hairpin. B) Synthetic steps toward pyrene-terminated Ru hairpin.
(i) LiCl, DMF, 5 hours; (ii) Ag+, ethanol, overnight; (iii) HBTU, HOBT, DIPEA, CH2Cl2, two
days; (iv) HBTU, HOBT, DIPEA, CH2Cl2, overnight; (v) DBU, decane thiol, THF, overnight; (vi) NEt3, CH2Cl2, overnight.

279
moles Cu/Ru
0.0 0.2 0.4 0.6 0.8 1.0 1.2
Nor
m. E
mit.
Int.
0.0
0.2
0.4
0.6
0.8
1.0
Figure 7-4: Emission titration of Ru-pyr-1 with Cu2+ in CH3CN.

280
change in the overall slope of the curve around 0.4-0.5 Cu2+:Ru-pyr-1 which may be indicative
of rearrangement or is a function of the cis/trans geometries of pyrene. Structures analogous to
this would be a great improvement to our Ru-based molecular wires, since large aromatic groups
may act as antennas and funnel energy toward bound metals in the hairpin. Increasing the excited
state lifetime of the donor could increase the likelihood of electron transfer making more efficient
molecular wires.
7.3.2 Pyrene-Terminated Ruthenium Hairpin Complexes
Throughout this thesis, the binding of Cu2+ to the Ru-aeg scaffolds has been monitored
though the decrease in emission intensity of the [Ru(bpy)3]2+ moiety. Through combinations of
mass spectrometry, NMR spectroscopy, and elemental analysis we have concluded that Cu2+ bind
to the free bpy ligands. However, there exists no measure of peptide chain distances. In the
absence of a crystal structure, we must rely strictly on spectroscopic inference. Incorporation of
pyrene into strategic points along the aeg scaffold may shed light on the nature of metal binding.
Pyrene has been incorporated into structures for the purpose of Cu2+ binding detection and
includes a variety of different structures. Pyrenylquinoline complexes have been synthesized
containing a single pyrene; when Cu2+ binds forming a [Cu(pyrquin)2]2+ complex, excimer
emission is observed.14 In addition, several “on-off” sensors have been synthesized where
excimer emission occurs before metal binding.15,16 This decrease in excimer emission indicates
that the metal induced a conformational change within the complex and prevented adequate π-
stacking to occur. This section discusses the inclusion of pyrene terminated aeg to the hairpin
design.

281
7.3.2.1 Synthesis of Pyrene-Terminated Ruthenium Complexes
7.3.2.1.1 Synthesis of Fmoc-aeg(bpy)-pyrene
To 250 mL CH2Cl2 was added 4.31 g (7.84 mmol) Fmoc-aeg(bpy)-COOH, 2.97 g (7.84
mmol) HBTU, 1.20 g (7.84 mmol) HOBT, and 7 mL (40.2 mmol) DIPEA and the resulting
solution stirred at 0 C for 15 minutes. After this time, 1.45 g (6.27 mmol) pyrene-NH2 was added
and the solution stirred overnight in the dark which formed a precipitate. The solvent was then
reduced to ~ 100 mL and the solution placed in the freezer for 4 hours, filtered, and then washed
with 3 x 20 mL cold CH2Cl2 and 3 x 20 mL cold acetone to yield the pure product. Collected
3.25 g (68 % yield). 1H NMR, 400 MHz, d6 dmso: 2.39 (s, 3H); 3.14 (d, 1H); 3.28 (d, 1H); 3.41
(t, 1H); 3.52 (t, 1H); 3.73 (s, 1H); 3.91 (s, 1H); 4.04 (s, 1H); 4.21 (m, 3H); 4.31 (d, 1H); 5.06 (dd,
2H); 7.18 – 7.42 (m-m, 6H); 7.63 (d, 2H); 7.86 (d, 2H); 8.05 (m, 2H); 8.13 (m, 2H); 8.17 – 8.32
(m-m, 6H); 8.36 (d, 1H); 8.39 – 8.49 (m-m, 2H); 8.53 (d, 1H); 8.66 (t, 1H). MS (ESI+) [M + H+]
Calc: 764.9; Found: 764.6.
7.3.2.1.2 Synthesis of [Ru(bpy)2(bpy[aeg(bpy)-pyrene]2)](NO3)2 (Ru-pyr-2)
A 0.156 g (0.158 mmol) sample [Ru(bpy)2(4,4’-COOCl bpy)](PF6)2 was combined with 3
mL NEt3 and 0.343 g (0.633 mmol) H2N-aeg(bpy)-pyrene (prepared identically to H2N-aeg(bpy)-
OtBu, see Chapter 4) in 150 mL CH3CN and stirring at room temperature overnight. After this
time, 0.125 g (0.330 mmol) and 0.062 (0.405 mmol) were added and the resulting solution stirred
for an additional day. The compound was purified as per the hairpin complexes described in
detail in Chapter 4. Collected 60 mgs of a red solid (21.5 % yield). 1H NMR, 360 MHz, d6
dmso: 2.17 (s, 3H); 2.24 (s, 3H); 3.41 – 3.79 (m-m, 10H); 3.95 (s, 2H); 4.12 (s, 2H); 4.26 (s,

282
2H); 5.04 (s, 4H); 7.04 – 7.26 (m-m, 4H); 7.34 (m, 2H); 7.35 (m, 2H); 7.74 (m, 6H); 7.90 (m,
2H); 7.96 – 8.47 (m-m, 31H); 8.66 – 9.33 (s-s, 9H). MS (ESI+) [M2+] calc 852.4; found 852.1.
7.3.2.2 Discussion
The synthesis of Ru-pyr-2 is shown in Scheme 7-1B and mirrors the synthetic
procedures described in previous chapters. A major challenge was in the final purification of the
complex; replacement of t-butyls with pyrene drastically lowers the solubility in more polar
solvents, especially solvent mixtures containing high concentrations of water. Several columns
were needed before purification was completed.
Ru-pyr-2 is structurally analogous to previously reported hairpins, however aeg strands
terminated with pyrene offer potential structural diagnostic characteristics. Figure 7-5 shows the
emission spectrum of Ru-pyr-2 when excited at 343 nm, the pyrene λmax,abs. Excitation at this
wavelength produces three main components: pyrene emission at ~ 385 nm, [Ru(bpy)3]2+
emission at 650 nm, and pyrene excimer emission at ~ 500 nm. Of note are the relative
intensities of the emission bands. Although the pyrene emission quantum yields are much higher
than [Ru(bpy)3]2+ (95 % vs. 6 % in O2-free CH3CN), in the Ru-pyrene structure the majority of
the emitted photons are a result of Ru relaxation. This is because of their close proximity of
pyrene and Ru in the structure and the direct overlap of [Ru(bpy)3]2+ absorbance with pyrene
emission, which causes energy transfer from pyrene [Ru(bpy)3]2+. The small amount of
emission at 500 nm is attributed to pyrene excimer emission.14-16 Pyrene chain termini are in very
close proximity and π-stacking between them leading to excimer emission can be expected.
Typically, when pyrene excimer emission is observed emission from the monomer is significantly
decreased.14 We do expect some disruption of pyrene π-stacking by the aromatic bpy ligands
which could explain the low intensity of pyrene in the spectrum.

283
wavelength (nm)
400 500 600 700 800
Inte
nsity
(co
unts
)
0
2e+5
4e+5
6e+5
8e+5
excimer
pyrene
Ru(bpy)32+
Figure 7-5: Emission spectrum of Ru-pyr-2 hairpin (black) and Ru-pyr-2 + 1 eq Zn2+ (red) excited at 343 nm. This was purged with N2 for 5 minutes, but not purged again after the addition of Zn2+. The decrease in emission intensity for pyrene and Ru might be from the introduction of small amounts of O2.

284
After the addition of 1 eq Zn2+ to the sample, both the pyrene and [Ru(bpy)3]2+ emission
decrease slightly. However what is most striking is that no excimer emission is observed after the
addition of Zn2+ suggesting that formation of [Zn(bpy)2]2+ between the peptide strands prevents
adequate π-stacking between pyrene moieties. This difference in excimer emission may further
our diagnostic tools to monitor metal binding in solution. In these hairpin complexes or in single
strand aeg oligomers, chain termini are easily modified with pyrene and monitoring either an
increase or decrease in excimer emission intensity could give information on peptide-peptide
alignment. For example, in a self-complementary sequence (i.e. py-bpy-tpy-pyrene) excimer
emission should not occur because pyrene moieties should be on opposite ends of the duplex.
Comparison of this with palindrome sequences (i.e. py-bpy-py-pyrene with tpy-bpy-tpy-pyrene)
excimer emission should occur 50 % of the time reflecting the two different binding alignments
these molecules can form.
These pyrene-based examples serve to illustrate the feasibility of pyrene into our systems.
Its inclusion opens many new doors including excited state reservoirs and other modes to
fluorescently monitor metal binding.
7.4 Ru Di hairpin with Two different hairpins
This thesis has shown the efficient binding of solution metal ions Cu2+, Zn2+ and Pd2+
which has become commonplace in these Ru hairpin structures. While it is easy for a single
species metal to bind, metals of different identity, i.e. one Cu2+ and one Pd2+ in a di-hairpin like
Ru-2, present a significant challenge. For example, Ru-2 (Chapter 5 [Ru(bpy)3]2+ dihairpin) was
reacted with one equivalent of Cu2+ and then one equivalent of Pd2+ to form the tris heterometallic
complex Ru-2(CuPd) but did not prevent Ru-2(Cu)2 and Ru-2(Pd)2 (see Chapter 5). Without
the incorporation of purification steps at specific points in the synthesis, or selective protection of

285
the ligands, the current scaffolds have reached their complexity limit in terms of their control of
metal binding. This section discusses the progress made to exert synthetic control and design
complexes toward pre-specified metal binding locations. This is the same [Ru(bpy)3]2+ di-hairpin
complex as discussed in Chapter 5, but now with inequivalent hairpin portions, each with their
own functionality and different protecting groups.
7.4.1. Syntheses Toward Two Different Hairpins
7.4.1.1 Synthesis of Bpy-(en-fmoc)2
To 200 mL tetrahydrofuran was added 3 g (9.41 mmol) Fmoc-enHCl and 4 mL (30.8
mmol) NEt3 and over the next several minutes the solid Fmoc-enHCl slowly dissolved. Once
completely dissolved a 30 mL solution containing 1 g (3.57 mmol) 4,4’-(COCl)2bpy was added
and after ~ 20 seconds a white precipitate formed. The solution was allowed to stir overnight.
After this time, the solvent was removed via rotary evaporation after which 30 mL CH2Cl2 was
added. The solid was filtered and rinsed several times with 30 mL aliquots of CH2Cl2 to give the
pure product. Collected 1.43 g (52 % yield). 1H NMR, 300 MHz, d6 dmso: 3.22 (q, 4H); 3.36
(m, 4H); 4.20 (t, 2H); 4.30 (d, 4H); 7.29 (t, 4H); 7.38 (t, 4H); 7.45 (t, 2H); 7.66 (d, 4H); 7.85 (d,
6H); 8.79 (m, 4H); 8.98 (t, 2H).
7.4.1.2 Synthesis of Ru(bpy)( bpy-[en-fmoc]2)Cl2
A sample of 0.205 g (0.506 mmol) [(Bz)Ru(bpy)Cl]Cl was added to 50 mL HPLC grade
CH3CN and irradiated on a white light lamp (300 W) for 3 days to produce Ru(bpy)(CH3CN)xCl2.
The solvent was removed by rotary evaporation and the red solid dissolved in 50 mL acetone. To

286
this, 0.390 g (0.505 mmol) bpy-(en-fmoc)2 was added and the solution refluxed with stirring for 3
days under N2. After this time, the solution cooled to room temperature, filtered, and then added
to 200 mL diethyl ether to produce a dark purple precipitate. The solid was filtered and rinse
with copious amounts of either to give a dark purple/green solid. Collected 0.358 g (64 % yield).
7.4.1.3 Synthesis of [Ru(bpy)(4,4’-[en-fmoc]-bpy)(4,4’-dimethylester bpy)](NO3)2
To 125 mL methanol was added 0.40 g (0.364 mmol) Ru(bpy)(4,4’-bpy-[en-fmoc]2)Cl2,
0.300 g (1.10 mmol) 4,4’(COOCH3)2-bpy, and 0.123 g (0.724 mmol) AgNO3 that was then
refluxed for 5 hours which produced a red-colored solution and a white precipitate. The reaction
was cooled to room temperature and filtered to remove AgCl. The solution was concentrated and
the red residue was purified over silica with 10 % MeOH/CH2Cl2 first to elute several yellow-
brown colored bands. The solvent was changed to CH3CN which eluted the pure compound.
Collected 0.140 g (27 % yield). 1H NMR, 360 MHz, CD3CN: 3.32 (m, 4H); 3.48 (m, 4H); 3.95
(s, 3H); 3.98 (s, 3H); 4.15 (m, 2H); 4.21 (d, 4H); 6.28 (m, 2H); 7.20 (m, 4H); 7.30 (m, 4H); 7.38
(q, 2H); 7.56 (d, 4H); 7.64 (d, 1H); 7.68 (d, 1H); 7.71 – 7.84 (m-d, 10H); 7.91 (t, 2H); 8.06 (q,
2H); 8.51 (d, 2H); 8.80 (t, 2H); 9.02 (d, 2H); 9.23 (s, 2H). MS (ESI+) [M2+] Calcd: 651.2;
Found: 651.3.
7.4.1.4 Synthesis of [Ru(bpy)(4,4’-di[en-fmoc] bpy)(4,4’-di[aeg-OtBu] bpy)](NO3)2
A 100 mL solution of methanol:acetone (9:1) was charged with 0.435 g (0.395 mmol)
Ru(bpy)(bpy-[en-fmoc]2)Cl2, 0.549 g (0.987 mmol) bpy(aeg-OtBu)2, and 0.140 g (0.824 mmol)
AgNO3 and was refluxed for 6 hours to yield a red solution. This was purified as previously
reported11 to give 0.238 g of the pure product. (35.2 % yield.) 1H, 360 MHz, CD3CN: 1.35 (d,

287
18H); 3.20 (q, 4H); 3.30 (m, 4H); 3.45 (m, 4H); 3.63 (m, 4H); 3.66 (d, 4H); 4.13 (m, 2H); 4.21 (t,
4H); 6.26 (s, 2H); 7.18 (m, 4H); 7.29 (m, 4H); 7.38 (t, 1H); 7.54 (m, 4H); 7.64 – 7.83 (m-m,
14H); 7.86 (d, 1H); 8.01 (q, 2H); 8.45 (d, 2H); 8.63 (m, 2H); 9.03 (m, 2H); 9.10 (s, 2H); 9.28 (d,
2H). MS (ESI+) [M2+] Calc: 793.3; Found: 793.3.
7.4.1.5 Synthesis of [Ru(bpy)(bpy-[en-fmoc]2)(bpy-[aeg-(bpy)OtBu]2)](NO3)2 (RuHP2-δ)
To 100 mL dry CH2Cl2 was added 0.254 g (1.11 mmol) MebpyAA, 0.422 g (1.11 mmol)
HBTU, 0.17 g (1.11 mmol) HOBT, and 100 μL (4.44 mmol) DIPEA and the resulting solution
was stirred at 0 ºC for 15 minutes. After this time 0.238 g (0.139 mmol) [Ru(bpy)(bpy-[en-
fmoc]2)(bpy-[aeg-OtBu]2)](NO3)2 was added and stirred overnight. An additional amount of 0.25
g (1.11 mmol) MebpyAA acid was added and stirred for one more day. This was purified as
previously reported11 to collect 183 mg of the pure product (61.7 % yield). 1H, 400 MHz,
CD2Cl2: 1.41 (m, 18H); 2.33 (d, 6H); 3.32 – 3.82 (m-m, 17H); 3.82 – 4.30 (m-m, 13H); 6.31 (s,
2H); 7.04 (m, 2H); 7.10 – 7.48 (m-m, 12H); 7.48 – 7.65 (m, 6H); 7.65 – 7.82 (m, 8H); 7.82 – 8.09
(m-m, 8H); 8.09 – 8.23 (m-m, 2H); 8.23 – 8.44 (m-m, 6H); 8.85 – 9.50 (m-m, 8H). MS (ESI+)
[M2+] Calc: 1003.4; Found: 1003.5.
7.4.2 Discussion
Compound RuHP2-δ was designed and synthesized as per the steps in Scheme 7-2 in an
attempt to make a dihairpin compound that, when simultaneously combined with equimolar
amounts of Pd2+ and Cu2+, would result only in a Pd-Ru-Cu sequence (see Chapter 5). While
that particular stage was not achieved, this complex is first di-hairpin complex containing two
different hairpins. First, [(Bz)Ru(bpy)Cl]Cl was irradiated to form Ru(bpy)(CH3CN)xCl2 and

288
then reacted with bpy(en-fmoc)2 to form Ru(bpy)(bpy-(en-boc)2Cl2. Formation of the (CH3CN)x
adduct is crucial here because to remove the Bz ligand from [(Bz)Ru(bpy)Cl]Cl, higher boiling
solvents (e.g. ethanol, dimethylformamide, etc) must be used; reactions with bpy(en-fmoc)2 at
these higher temperatures tended to cleave the fmoc protecting groups. Using
Ru(bpy)(CH3CN)xCl2 allowed this step to be carried in boiling acetone, which was hot enough for
the reaction to proceed, but not so hot as to cleave the protecting groups. Reaction of the
dichloride complex with Ag+ and an excess of bpy(aegOtBu)2 was carried out in
methanol/acetone mixtures to easily form the [Ru(bpy3)]2+ complex. Reaction with methyl-bpy-
acetic using standard coupling techniques already described efficiently yielded RuHP2-δ.
From this starting material, two reactions were attempted. First, Pd2+ was coordinated to
the free bpy ligands. The amines were then deprotected by cleavage of the fmoc with DBU and
then immediately reacted with a solution containing MebpyAA, HBTU, HOBT, and DIPEA.
After stirring overnight, the solid was precipitated, and reacted with a single equivalent of Cu2+.
This final reaction solution was examined with mass spectrometry which did not reveal any
evidence of Cu-Ru-Pd. However, molecular ion peaks characteristic of a Ru-Pd compound were
observed. Addition of the second metal in this manor is likely difficult as it relies on perfect
coupling between MebpyAA and the free amines and assumes no exchange of Pd2+ between Ru-
scaffolds and the large excess of MebpyAA in solution. An alternative route might be to form a
fully saturated [M(bpy)2]2+ complex with two free carboxylic acid groups prior to reaction with
this amine-terminated dihairpin.
A more intriguing compound is a di-hairpin with two pairs of ligands that are different.
For example, after fmoc deprotection, 8-hydroxyquinoline (hq) could be coupled to form hq and
bpy hairpins as in RuHP2-δ’ in Scheme 7-2. Since metal complex redox chemistry can be turned
with ligands, addition of an metal could form [M(bpy)2]2+ and M(hq)2, each with their own
characteristic redox chemistry. Further, addition of an appropriate metal may preferentially bind

289
Scheme 7-2: Synthetic steps toward RuHP2-δ.
(i) CH3CN, hν, 3 days; (ii) acetone, Δ, 3 days; (iii) Ag+, 80 % MeOH / 20 % acetone, 4 hours; (iv) CH2Cl2, HBTU, HOBT, DIPEA, 2 days. (v) DBU, THF, overnight. (vi) HQ-COOH, HBTU, HOBT, DIPEA, CH2Cl2, overnight.

290
to hq first leaving bpy ligands uncoordinated that could later complex a different metal center. If
Zn2+ is coordinated to hq forming a fluorescent compound, energy transfer from Zn(hq)2
[Ru(bpy)3]2+ may be possible. Because of the versatility of peptide coupling chemistry, and
potential substitution patterns surrounding Ru, complexes containing multiple metal centers of
differing identity could be easily realized.
7.5 Crystallization Attempts
Combining peptides with metal complex coordination chemistry has many challenges; a
significant one is preparing structurally pure samples that allow crystal formation. Chapter 3
accurately illustrates the complexity of this dilemma with the most predominant variable is the
flexibility of the aeg backbone. Multiple conformations and binding motifs are possible and with
the existence of rotamers in solution, the likelihood of crystal formation is indeed difficult. The
peptide contains many CH2 groups that allow rotation around single bonds; each one of these
decreases the rigidity of the complex and hinders crystal growth. This section focuses on
synthetic efforts with respect to two different structural aspects. First, by decreasing the
flexibility of the over all complex though the addition of bulky rigid groups, and second, though
the incorporation of additional carboxylic acids to encourage hydrogen bonding between metal
complexes.
7.5.1 Synthesis of Structurally Rigid Compounds
7.5.1.1 Synthesis of Fmoc-aeg(bpy)-OtBu (bpy-mon β)
To 125 mL dry CH2Cl2 was added 2.01 g (9.39 mmol) methyl-bpy-carboxylic acid, 3.33 g
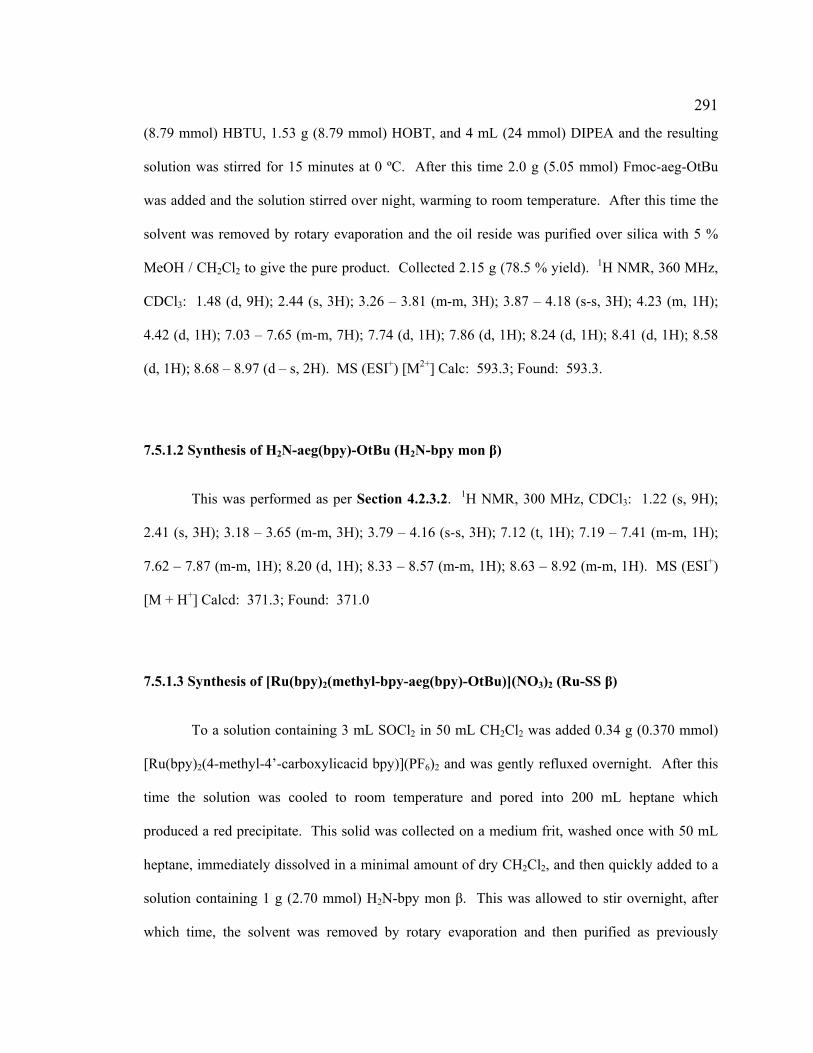
291
(8.79 mmol) HBTU, 1.53 g (8.79 mmol) HOBT, and 4 mL (24 mmol) DIPEA and the resulting
solution was stirred for 15 minutes at 0 ºC. After this time 2.0 g (5.05 mmol) Fmoc-aeg-OtBu
was added and the solution stirred over night, warming to room temperature. After this time the
solvent was removed by rotary evaporation and the oil reside was purified over silica with 5 %
MeOH / CH2Cl2 to give the pure product. Collected 2.15 g (78.5 % yield). 1H NMR, 360 MHz,
CDCl3: 1.48 (d, 9H); 2.44 (s, 3H); 3.26 – 3.81 (m-m, 3H); 3.87 – 4.18 (s-s, 3H); 4.23 (m, 1H);
4.42 (d, 1H); 7.03 – 7.65 (m-m, 7H); 7.74 (d, 1H); 7.86 (d, 1H); 8.24 (d, 1H); 8.41 (d, 1H); 8.58
(d, 1H); 8.68 – 8.97 (d – s, 2H). MS (ESI+) [M2+] Calc: 593.3; Found: 593.3.
7.5.1.2 Synthesis of H2N-aeg(bpy)-OtBu (H2N-bpy mon β)
This was performed as per Section 4.2.3.2. 1H NMR, 300 MHz, CDCl3: 1.22 (s, 9H);
2.41 (s, 3H); 3.18 – 3.65 (m-m, 3H); 3.79 – 4.16 (s-s, 3H); 7.12 (t, 1H); 7.19 – 7.41 (m-m, 1H);
7.62 – 7.87 (m-m, 1H); 8.20 (d, 1H); 8.33 – 8.57 (m-m, 1H); 8.63 – 8.92 (m-m, 1H). MS (ESI+)
[M + H+] Calcd: 371.3; Found: 371.0
7.5.1.3 Synthesis of [Ru(bpy)2(methyl-bpy-aeg(bpy)-OtBu)](NO3)2 (Ru-SS β)
To a solution containing 3 mL SOCl2 in 50 mL CH2Cl2 was added 0.34 g (0.370 mmol)
[Ru(bpy)2(4-methyl-4’-carboxylicacid bpy)](PF6)2 and was gently refluxed overnight. After this
time the solution was cooled to room temperature and pored into 200 mL heptane which
produced a red precipitate. This solid was collected on a medium frit, washed once with 50 mL
heptane, immediately dissolved in a minimal amount of dry CH2Cl2, and then quickly added to a
solution containing 1 g (2.70 mmol) H2N-bpy mon β. This was allowed to stir overnight, after
which time, the solvent was removed by rotary evaporation and then purified as previously

292
reported.11 Collected 0.337 g of a red solid (82.4 % yield.) 1H, 360 MHz, CD3CN: 1.36 (d, 9H);
2.35 (d, 3H); 2.46 (d, 3H); 3.52 (m, 2H); 3.72 (m, 2H); 3.93 (s, 1H); 4.16 (d, 1H); 7.09 (dd, 1H);
7.18 – 7.42 (m-m, 6H); 7.54 (d, 1H); 7.62 – 7.81 (m-m, 5H); 7.84 (s, 1H); 8.02 (m, 4H); 8.08 –
8.29 (m-m, 3H); 8.42 – 8.71 (m-m, 6H); 9.08 (ds, 1H); 9.24 (t, 1H). MS (ESI+) [M2+] Calc:
490.2; Found: 490.5.
7.5.1.4 Synthesis of 4,4’-diisopropylester bpy (bpydipe)
Was prepared as previously reported.17,19
7.5.1.5 Synthesis of Ru(bpydipe)2Cl2
This compound was synthesized in a similar manner to Ru(bpy)2Cl2. In 6 mL 50 %
ethylene glycol 50 % ethanol, 1.13 g (3.44 mmol) bpydipe, 0.429 g (1.64 mmol) RuCl3, and 0.461
g (11.0 mmol) LiCl were added and refluxed for 5 hours during which time the solution turned a
dark purple color. The solution was cooled to room temperature and pored into 50 mL water,
producing a dark precipitate. This was filtered and the solid was further purified by column
chromatography using silica and 5 % MeOH/CH2Cl2 to collect a very dark green band. Collected
0.624 g (45.8 % yield.). 1H NMR, 360 MHz, CDCl3: 1.33 (dd, 12H); 1.46 (dd, 12H); 5.23 (sep,
2H); 5.38 (sep, 2H); 7.24 (s, 2H); 7.45 (d, 2H); 7.66 (d, 2H); 8.10 (d, 2H); 8.61 (s, 2H); 8.79 (s,
2H). MS (ESI+) [M + H+] Calc: 829.7; Found: 829.6.

293
7.5.1.6 Synthesis of [Ru(diisopropylester-bpy)2(Methyl-bpy-aeg-OtBu)](NO3)2 (Ru-SS-γ)
To 40 mL ethanol was added 0.055 g (66.4 μmol) Ru(bpydipe)2Cl2, 0.028 g (144 μmol)
AgBF4, and 0.104 g (280 μmol) (Mebpy(aeg-OtBu) and the resulting mixture was refluxed for 3
hours. After this time the solvent was removed by rotary evaporation and the crude red residue
was purified over silica with 5 % MeOH / CH2Cl2 to yield the pure product. The nitrate salt was
formed though a small plug of silica and 5:4:1 CH3CN:H2O:KNO3 (sat, aq). Collected 0.052 g
(62.6 % yield). 1H NMR, 400 MHz, CD3CN: 1.39 (m, 24H); 1.46 (s, 9H); 2.56 (s, 3H); 3.24 (t,
2H); 3.67 (q, 2H); 3.72 (s, 2H); 5.28 (m, 4H); 7.30 (d, 1H); 7.50 (d, 1H); 7.65 (dd, 1H); 7.78 –
7.94 (m-m, 10H); 8.50 (s, 1H); 8.77 (s, 1H); 9.02 (s, 4H). MS (ESI+) [M2+] Calc: 564.2; Found:
564.4
7.5.1.7 Synthesis of [Ru(diisopropylester-bpy)2(Methyl-bpy-aeg-OtBu)](NO3)2 (Ru-SS-γ-Os)
To 25 mL CH2Cl2, 0.052 g (41.5 μmol) of the product above was combined with 0.052 g
(51.6 μmol) [Os(bpy)2(Mebpycarboxylic acid)](PF6)2, 0.020 g (52.7 μmol) HBTU, 0.010 g (52.7
μmol) HOBT, and 0.5 mL (211 μmol) DIPEA in 25 mL dry CH2Cl2 and stirred overnight. An
additional amount of 0.052 g (51.6 μmol) [Os(bpy)2(Mebpycarboxylic acid)](PF6)2 was added
and stirred for an additional day. The solvent was removed and purified using 5:4:1
CH3CN:H2O:KNO3 (sat, aq) to yield the pure product. Collected 0.026 g (30.1 % yield). MS
(ESI+) [M4+ + 2 PF6-] Calc: 1017.8; Found: 1017.8. [M4+ 1 PF6
-] Calc: 657.8; Found: 657.8.
[M4+] Calc: 457.1; Found 457.1.
7.5.2 Discussion
The [Ru(bpy)3]2+-single stranded peptide (see Chapter 2, Ru-SS) contains the fewest

294
peptide strands within the molecule. Using this design, two additional single-stranded
[Ru(bpy)3]2+ complexes were designed and their syntheses are shown in Scheme 7-3. First, in
Scheme 7-3A, Ru-SS β was synthesized. This structure increases the rigidity of the complex by
using 4-methyl-4’-carboxlyic acid instead of the acetic acid bipyridine used in the previous
chapters. The removal of this CH2 group decreases a single point of rotation that may give
heterometallic structures a more rigid binding motif and consequently a more defined solution
phase structure. This compound was combined with Cu2+ to form a Ru-Cu-Ru structure but to
date, no crystals have been observed. It is possible that solvent conditions or temperature
prevented suitable crystal formation. Any precipitation that did occur was either in the form of a
powder (slow evaporation of CH3CN/H2O solutions) or sticky oil (ether diffusion). It is possible
that geometric isomers also prevent crystal growth and separation of these might be
advantageous.12,13
The second series is shown in Scheme 7-3B, Ru-SS-γ. The [Ru(bpy)3]2+ portion of the
complex contains four isopropyl groups that may be cleaved to form carboxylic acids. These
acids may encourage hydrogen bonding between neighbors to better pack during crystal growth.
Further, since t-butyls are more easily cleaved than i-propyl groups, it is possible to react Ru-SS-
γ with acid, cleaving only the t-butyl, and keeping the four other carboxylic acid groups
protected. In this manner, only one end of the molecule may be further functionalized.
Alternatively, addition of –OH cleaves both the t-butyl and i-propyl groups to yield 5 acid termi.
This is potential synthetic advantage over fmoc and t-butyl protected peptides for situations in
which simultaneous deprotection is desired.
To increase the bulk of the complex, Ru-SS-γ-Os was synthesized, after which the i-
propyl and t-butyl groups were cleaved by NaOH, the acids were protonated, and the product
precipitated through anion exchange with NH4PH6. Formation of acid groups was confirmed by
1H NMR. A solution of this compound was allowed to evaporate slowly in a 1:1 CH3CN:H2O

295
Scheme 7-3: A) Synthetic steps toward β-series single strand Ru-Os complexes. B) Synthetic steps toward γ-series single strand Ru-Os complexes.
(i) DBU, decane thiol, THF, overnight; (ii) NEt3, CH2Cl2, overnight; (iii) ethanol, reflux, overnight; (iv) 50 % ethylene glycol/ethanol, reflux, 5 hours; (v) AgNO3, ethanol, reflux, 3 hours; (vi) HBTU, HOBT, DIPEA, CH2Cl2, overnight; (vii) 50 % MeOH/H2O, overnight.

296
mixture but unfortunately produced no crystals. This compound was combined with 40 %
Zn(acetate)2 which produced suitable crystals for x-ray crystallography. Unfortunately, we were
unable to solve the structure because of interference from smaller crystals on the parent. This
represents the most promising results that could lead toward ultimately obtaining a crystal
structure. Currently, the solution is still being evaporated slowly to encourage larger crystals to
form.
7.6 Osmium-Centered Oligopeptides
Simple changes in metal species can increase the complexity of our molecules and allow
us to synthesize more efficient energy and electron transfer cascades. Of the many possibilities,
[Os(bpy)3]2+ is a logical starting point as its photophysical and electrochemical properties have
been well documented,19,20 and is a useful energy transfer tool in conjunction with [Ru(bpy)3]2+
complexes.21-23 Finally, we present a small portion of synthesis with some initial characterization
to expand the aeg library.
7.6.1 Syntheses Toward Osmium Aeg Complexes
7.6.1.1 Synthesis of [Os(bpy)2(4-CH3-4’-CH2COOCH3 bpy)](PF6)2
To 50 mL ethanol was added 0.320 g (0.567 mmol) Os(bpy)2CO3,24 0.436 g (1.80 mmol)
4-CH3-4’-CH2COOCH3 bpy, and ~ 0.5 g (3.07 mmol) NH4PF6 and the resulting solution refluxed
for 8 hours. After this time the solvent was removed by rotary evaporation and the black/green
reside purified on silica with 10 % methanol 90 % CH2Cl2 collecting the dark green band.
Collected 0.429 g (73.0 % yield). 1H NMR, 360 MHz, d6 dmso: 2.59 (s, 3H); 3.65 (s, 3H); 4.00

297
(s, 2H); 7.29 (d, 1H); 7.40 (m-m, 6H); 7.61 (m-m, 5H); 7.94 (t, 4H); 8.64 (s, 1H); 8.74 (s, 1H);
8.80 (d, 4H). MS (ESI+) [M2+ + PF6-] Calc: 891.2; Found: 891.3.
7.6.1.2 Synthesis of [Os(bpy)2(4-CH3-4’-CH2COOH bpy)](PF6)2
In 100 mL 2 M NaOH was added 0.429 g (0.414 mmol) [Os(bpy)2(4-CH3-4’-
CH2COOCH3 bpy)](PF6)2 and was refluxed for 3 hours. After this time the pH was neutralized
with conc. HCl and the precipitated by the addition of a saturated solution of NH4PF6 (aq) to
produce a black solid. Collected 0.313 g (74.0 % yield.). 1H NMR, 360 Mhz, d6 dmso: 2.58 (s,
3H); 3.90 (s, 2H); 7.28 (d, 1H); 7.40 (m-m, 6H); 7.61 (m-m, 5H); 7.94 (t, 4H); 8.67 ( s, 1H); 8.75
(s, 1H); 8.80 (d, 4H); 12.82 (s, 1H). MS (ESI+) [M2+] Calc: 365.4; Found: 365.0.
7.6.1.3 Synthesis of [Fmoc-aeg(Os(bpy)3)-OtBu](PF6)2 (Os-mon)
A solution of 0.313 g (0.306 mmol) [Os(bpy)2(4-CH3-4’-CH2COOH bpy)](PF6)2, 0.116
g (0.306 mmol) HBTU, 0.047 g (0.306 mmol) HOBT, and 0.5 mL (2.88 mmol) DIPEA was
stirred in 75 mL CH2Cl2 at 0 °C for 15 minutes. After this time 0.133 g (0.336 mmol) Fmoc-aeg-
OtBu was added and the resulting solution stirred overnight. After this time, the solvent was
removed by rotary evaporation and the product purified on silica with 10 % methanol 90 %
CH2Cl2 to and then 5:4:1 CH3CN:H2O:KNO3aq,sat give the pure product. Collected 0.152 g (40.2
% yield). 1H NMR, 400 MHz, CD2Cl2: 1.49 (s, 9H); 2.63 (s, 3H); 3.25 – 3.75 (m-m, 4H); 4.0
(m, 1H); 4.07 – 4.46 (m-m, 6H); 7.16 (d, 1H); 7.22 – 7.52 (m-m, 12H); 7.52 – 7.92 (m-m, 12H);
8.54 (d, 2H); 8.63 (d, 2H); 8.71 (s, 1H); 8.82 (s, 1H). HSMS (ESI+) [M2+ + NO3]+ Calc:
1170.3680; Found: 1170.3773. Elemental Anal. Os-1 • 0.5 CH2Cl2 Calcd: 53.19 C; 4.35 H;
10.98 N. Found: 53.19 C; 4.44 H; 10.84 N.

298
7.6.2 Discussion
To demonstrate this, Os-mon was synthesized in good yield through metal complex
coordination and peptide coupling chemistries and purified through identical methods as the Ru-
peptide complexes. It was characterized using 1H NMR, mass spectrometry, and elemental
analysis. This complex also was briefly characterized with cyclic voltammetry, shown in Figure
7-6, and shows very similar features as Ru-2 (Chapter 4), shown for comparison. A one-
electron oxidation is observed at +0.69 V vs. SCE, assigned to the OsII/III couple. Three, one-
electron reductions were also observed at -1.37, -1.56, and -1.86 V; these are assigned to
reduction of Os-coordinated bpy ligands.
Osmium or iridium analogues of the complexes already presented are easily obtainable
because of their similar reaction chemistries with [Ru(bpy)3]2+.24,25 Absorbance and emission
energies follow Ir (λabs ~ 300 nm; λem ~ 450 - 600 nm)26 >Ru (λabs ~ 460 nm; λem ~ 650 nm) > Os
(λabs ~ 480 nm; λem ~ 725 nm). Complexes linking multiple redox and fluorescent centers of this
type for energy and electron transfer cascades can be easily realized.21-23,27
7.7 Conclusions
Peptide coupling chemistry and metal complex coordination chemistry provide a myriad
of possibilities for the design of larger supramolecular structures. Expanding the project in these
areas will allow us to consider more complex and structurally rigid systems, linking energy and
electron donors and acceptors in more efficient ways. Relative spatial interactions and fine
tuning of redox properties through a greater ligand and metal library will lead us toward our goal
of synthesizing complexes through self-assembly for artificial photosynthetic applications.

299
Potential (V)
-2-101
Nor
mal
ized
Cur
rent
(A
)
-0.02
-0.01
0.00
0.01
0.02
Figure 7-6: Cyclic Voltammogram of Os-mon (black) overlayed with Ru-2 (red) scanned at 50 mV/sec in 0.2 M TBAP in CH3CN vs. SCE.
300
7.8 References.
1. Williams, R. M.; De Cola, L.; Hartl, F.; Lagref, J.J.; Planeix, J. M.; De Cian, A.; Hosseini, M.
W. Coord. Chem. Rev. 2002, 230, 253 – 261.
2. McCafferty, D. G.; Friesen, D. A.; Danielson, E.; Wall, C. G.; Saderholm, M. J.; Erickson, B.
W.; Meyer, T. J. Proc. Natl. Acad. Sci, USA. 1996, 93, 8200 – .
3. Soler, M.; McCusker, J. K. J. Am. Chem. Soc. 2008, 130, 4708 – 4724.
4. Speiser, S. Chem. Rev. 1996, 96, 1953-1976.
5. Scandola, F.; Balzani, V. J. Chem. Educ. 1983, 60, 814-823.
6. Wilson, G. J.; Launikonis, A.; Sasse, W. H. F.; Mau, A. W.-H. J. Phys. Chem. A 1997, 101,
4860 – 4866.
7. Morales, A. F.; Accorsi, G.; Armaroli, N.; Barigelletti, F.; Pope, S. J. A.; Ward, M. D. Inorg.
Chem. 2002, 41, 6711 – 6719.
8. Carvalho, I. M. M.; Moreira, I. S.; Gehlen, M. H. Inorg. Chem. 2003, 42, 1525 – 1531.
9. Larsen, J.; Puntoriero, F.; Pascher, T.; McClenaghan, N.; Campagna, S.; Akesson, E.;
Sundstrom, V. ChemPhysChem 2007, 8, 2643 – 2651.
10. Gu, J.; Chem, J.; Schmehl, R. H. J. Am. Chem. Soc. 2010, 132, 7338 – 7346.
11. Myers, C. P.; Gilmartin, B. P.; Williams, M. E. Inorg. Chem. 2008, 47, 6738 – 6747.
12. Rutherford, T. J.; Keene, F. R. Inorg. Chem. 1997, 36, 2872 – 2878.

301
13. Sun, P.; Krishnan, A.; Yadav, A.; Singh, S.; MacDonnell, F. M.; Armstrong, D. W. Inorg.
Chem.2007, 46, 10312 – 10320.
14. Jung, H.S.; Park, M.; Han, D. Y.; Kim, E.; Lee, C.; Ham, S.; Kim, J. S. Org. Lett. 2009, 11,
3378 – 3381.
15. Kumar, M.; Dhir, A.; Bhalla, V. Eur. J. Org. Chem. 2009, 4534 – 4540.
16. Moriuchi-Kawakami, T.; Hisada, Y.; Shibutani, Y. Chem. Cent. J. 2010, doi:10.1186/1752-
153X-4-7.
17. Delaive, P. J.; Lee, J. T.; Abruna, H.; Sprintschnik, H. W.; Meyer, T. J.; Whitten, D. G. Adv.
Chem. Ser. 1978, No. 168, 26 – 42.
18. Guarr, T.; McGuire, M. E.; McLendon, G. J. Am. Chem. Soc. 1985, 107, 5104 – 5111.
19. Decurtins, S.; Felix, F.; Ferguson, J.; Gudel, H. U.; Ludi, A. J. Am. Chem. Soc. 1980, 102,
4102 – 4106.
20. Jung, M. C.; Munro, N.; Shi, G.; Michael, A. C.; Weber, S. G. Anal. Chem. 2006, 78, 1761 –
1768
21. Sykora, M.; Maxwell, K. A.; DeSimone, J. M.; Meyer, T. J. Pro. Nat. Acc. Sci. 2000, 97,
7687 – 7691.
22. Fleming, C. N.; Dupray, L. M.; Papanikolas, J. M.; Meyer, T. J. J. Phys. Chem. A 2002,
106, 2328 – 2334.
23. Bichenkova, E. V.; Yu, X.; Bhadra, P.; Heissigerova, H.; Pope, S. J. A.; Coe, B. J.; Faulkner,
S.; Douglas, K. T. Inorg. Chem. 2005, 44, 4112 – 4114.
302
24. Kober, E. M.; Caspar, J. V.; Sullivan, B. P.; Meyer, T. J. Inorg. Chem. 1988, 27, 4587 –
4598.
25. Bolinger, C. M.; Story, N.; Sullivan, B. P.; Meyer, T. J. Inorg. Chem. 1988, 27, 4582 – 4587.
26. De Angelis, F.; Fantacci, S.; Evans, N.; Klein, C.; Zakeeruddin, S. M.; Moser, J.-E.;
Kalyanasundaram, K.; Bolink, H. J.; Gratzel, M.; Nazeeruddin, M. K. Inorg. Chem. 2007,
46, 5989 – 6001.
27. Cavazzini, M.; Quici, S.; Scalera, C.; Puntoriero, F.; La Ganga, G.; Campagna, S. Inorg.
Chem. 2009, 48, 8578 – 8592.

VITA
Carl Philip Myers
Education 2005-2011 Ph.D., Chemistry The Pennsylvania State University, University Park, PA
1999-2004 B.S., Chemistry Ohio University, Athens, OH
Honors and Awards
2011 Koerner Dissertation Award 2010 American Chemical Society Division of Inorganic
Chemistry Student Travel Award 2009 Department of Chemistry Graduate Student Leadership
and Service Award 2009 Geiger Graduate Research Fellowship 2008 Dan H. Waugh Memorial Teaching Award Honorable
Mention 2008 Apple Graduate Research Fellowship 2007, 2008, 2009, 2010 PSU Department of Chemistry Travel Award
Publications
Myers, C. P.; Miller, J. R.; Williams, M. E.* “[Ru(bpy)3]2+ with Pendant
Oligo(aminoethylglycine): Variation of the Number of Chains to Form Multimetallic Structures with Cu(II).” Inorg. Chem. 2010, Submitted.
Coppock, M. B.; Kapelewski, M. T.; Youm, H. W.; Levine, L. A.; Miller, J. R.; Myers, C. P.; Williams, M. E.* “Preprogrammed Assembly of CuII Crosslinked Antiparallel Dipeptide Duplexes Using Heterofunctional Ligand-Substituted Aminoethylglycine.” Inorg. Chem. 2010, 49, 5126 – 5133.
Myers, C. P.; Williams, M. E.* “Directed Self-Assembly of Inorganic Redox Complexes with Artificial Peptide Scaffolds.” Coord. Chem. Rev. 2010, 254, 2416 – 2428.
Myers, C. P.; Miller, J. R.; Williams, M. E.* “Impacts of the Location and Number of [Cu(bpy)2]
2+ Crosslinks on the Emission Photodynamics of [Ru(bpy)3]2+ with Pendant
Oligo(aminoethylglycine) Chains.” J. Am. Chem. Soc. 2009, 131, 15291 - 15300.
Levine, L. A.; Kirin, S. I.; Myers, C. P.; Showalter, S. A.; Williams, M. E.* “Heterometallic Ferrocene-Rhenium Complexes Linked by an Aminoethylglycine Scaffold.” Eur. J. Inorg. Chem. 2009, 5, 613 – 621.
Myers, C. P.; Gilmartin, B. P.; Williams, M. E.* “Aminoethylglycine-Functionalized Ru(bpy)3
2+ with Pendant Bipyridines Self-Assemble Multimetallic Complexes by Copper and Zinc Coordination.” Inorg. Chem. 2008, 47, 6738 – 6747.
Copyright © 2022 FDOKUMEN


![Ruthenium(II)-CO complexes of N-[(2-pyridyl)methyliden]- (or )-aminonaphthalene: Synthesis, spectral studies, crystal structure, redox properties and DFT calculation](https://static.fdokumen.com/doc/165x107/6333d41a76a7ca221d08680d/rutheniumii-co-complexes-of-n-2-pyridylmethyliden-or-aminonaphthalene.jpg)