WPIC Platinum Quarterly Q2 2021
28
Page 1 of 28 PLATINUM QUARTERLY Q2 2021 © World Platinum Investment Council Ltd 2021 9th September 2021 FOREWORD This edition of Platinum Quarterly presents platinum supply and demand developments for the second quarter of 2021 and gives an updated forecast for 2021. It also provides the WPIC’s views on issues and trends relevant to investors considering exposure to platinum as an investment asset, plus an update on how our product partnerships continue to meet investors’ needs. The Platinum Quarterly data and commentary (starting on page 7) are prepared independently for the WPIC by Metals Focus. Platinum demand in the second quarter of 2021 continued the very positive year-on-year growth trends of the preceding two quarters, rising by 23%. The pace of economic recovery during the second quarter accelerated in comparison to the first quarter, as largely successful vaccination programs and widespread fiscal support increased economic activity. Automotive, industrial and jewellery platinum demand were up significantly year-on-year but weaker than in the first quarter while investment demand was well below the record level in Q2 2020. Mining supply benefitted from strong operational improvement compared to the severe COVID-19 restrictions in 2020 as well as the faster than anticipated processing of material built up during processing outages in 2020, helping to lift total supply by 55% year-on-year. This moved the market to a surplus of 161 koz, after four consecutive quarterly deficits. Platinum supply and demand – updating 2021 forecasts For 2021 total platinum supply is now forecast to rise 17% year-on-year to 7,943 koz, but still remain below pre-pandemic 2019 levels. Total platinum demand is now expected to rise by 1% year-on-year to 7,753 koz. As a result, the platinum market is forecast to be in a modest surplus in 2021 of 190 koz from our previous projection of a -158 koz deficit. Total platinum supply in 2021 reflects an expected 21% (+1,058 koz) recovery in refined production and a 2% (+31 koz) increase in recycling supply. Total platinum demand in 2021 is expected to be 1% (+59 koz) up on 2020 levels, as higher demand in the automotive (+529 koz), jewellery (+69 koz), and industrial (+493 koz) segments exceeds much lower investment demand (-1,033 koz). Q2 2021 surplus of 161 koz on strong mining recovery from the COVID pandemic and faster ACP backlog processing Supply in the second quarter of 2021 was 65% higher than in the second quarter of 2020. This recovery was primarily due to South African mines being able to operate at 97% of planned capacity, as operating protocols prevented widespread COVID-related disruption, but with quarterly output boosted as the Anglo American Platinum converter plant (ACP) ran at a higher rate than previously expected, processing more of the semi-finished material built up during the ACP outages in 2020. Producers also supplemented sales by reducing refined working inventory by 34 koz to meet strong demand for their platinum. Russian production was 22% lower year-on-year due to mine flooding and concentrator repairs, while North American output was 13% lower as a result of a strike and safety related stoppages. Second quarter recycling supply was 30% higher year-on-year, driven largely by strong recovery in autocatalyst recycling from the COVID-affected logistical constraints in 2020. Demand in the second quarter rose 23% (+352 koz) year-on-year to 1,907 koz on a continued recovery in demand across key end-use sectors. Automotive demand, up 75%, industrial demand, up 46%, and jewellery demand, up 19%, benefitted from the continued easing of COVID-related lockdown measures in most regions, enabled by the acceleration of mass vaccination programs, combined with continued government stimulus packages. Platinum automotive demand would have been some 50 koz higher if semiconductor shortages had not limited vehicle production in the second quarter. Investment demand was down 50% to 191 koz. Bar and coin demand remained high compared to historical levels, while ETF demand softened and the unprecedented increase in exchange stocks in 2020 was not repeated. 2021 Supply – higher mine supply on COVID-related recovery and outperformance of ACP For 2021, total platinum supply is now forecast to rise by 17% year-on-year to 7,943 koz following the significant reductions experienced during 2020, with refined production rising by 21% to 6,047 koz and recycling supply by 2% to 1,936 koz. Since the recommissioning of the Anglo Platinum ACP Phase A unit in December 2020, the plant has operated above expectations, enabling more semi-finished material that built up during the ACP outages in 2020 to be processed this year. This higher ACP operating rate, combined with South African miners’ ongoing success in avoiding further operational challenges from COVID infections, is driving the increase in mine supply in 2021. In contrast, Russian supply is expected to fall by 12% (-83 koz) due
-
Upload
khangminh22 -
Category
Documents
-
view
1 -
download
0
Transcript of WPIC Platinum Quarterly Q2 2021
Page 1 of 28
PLATINUM QUARTERLYQ2 2021
© World Platinum Investment Council Ltd 2021
9th September 2021
FOREWORD
This edition of Platinum Quarterly presents platinum supply and demand developments for the second quarter of 2021 and gives an updated forecast for 2021. It also provides the WPIC’s views on issues and trends relevant to investors considering exposure to platinum as an investment asset, plus an update on how our product partnerships continue to meet investors’ needs. The Platinum Quarterly data and commentary (starting on page 7) are prepared independently for the WPIC by Metals Focus.
Platinum demand in the second quarter of 2021 continued the very positive year-on-year growth trends of the preceding two quarters, rising by 23%. The pace of economic recovery during the second quarter accelerated in comparison to the first quarter, as largely successful vaccination programs and widespread fiscal support increased economic activity. Automotive, industrial and jewellery platinum demand were up significantly year-on-year but weaker than in the first quarter while investment demand was well below the record level in Q2 2020. Mining supply benefitted from strong operational improvement compared to the severe COVID-19 restrictions in 2020 as well as the faster than anticipated processing of material built up during processing outages in 2020, helping to lift total supply by 55% year-on-year. This moved the market to a surplus of 161 koz, after four consecutive quarterly deficits.
Platinum supply and demand – updating 2021 forecasts
For 2021 total platinum supply is now forecast to rise 17% year-on-year to 7,943 koz, but still remain below pre-pandemic 2019 levels. Total platinum demand is now expected to rise by 1% year-on-year to 7,753 koz. As a result, the platinum market is forecast to be in a modest surplus in 2021 of 190 koz from our previous projection of a -158 koz deficit.
Total platinum supply in 2021 reflects an expected 21% (+1,058 koz) recovery in refined production and a 2% (+31 koz) increase in recycling supply.
Total platinum demand in 2021 is expected to be 1% (+59 koz) up on 2020 levels, as higher demand in the automotive (+529 koz), jewellery (+69 koz), and industrial (+493 koz) segments exceeds much lower investment demand (-1,033 koz).
Q2 2021 surplus of 161 koz on strong mining recovery from the COVID pandemic and faster ACP backlog processing
Supply in the second quarter of 2021 was 65% higher than in the second quarter of 2020. This recovery was primarily due to South African mines being able to operate at 97% of planned capacity, as operating protocols prevented widespread COVID-related disruption, but with quarterly output boosted as the Anglo American Platinum converter plant (ACP) ran at a higher rate than previously expected, processing more of the semi-finished material built up during the ACP outages in 2020. Producers also supplemented sales by reducing refined working inventory by 34 koz to meet strong demand for their platinum.
Russian production was 22% lower year-on-year due to mine flooding and concentrator repairs, while North American output was 13% lower as a result of a strike and safety related stoppages. Second quarter recycling supply was 30% higher year-on-year, driven largely by strong recovery in autocatalyst recycling from the COVID-affected logistical constraints in 2020.
Demand in the second quarter rose 23% (+352 koz) year-on-year to 1,907 koz on a continued recovery in demand across key end-use sectors. Automotive demand, up 75%, industrial demand, up 46%, and jewellery demand, up 19%, benefitted from the continued easing of COVID-related lockdown measures in most regions, enabled by the acceleration of mass vaccination programs, combined with continued government stimulus packages. Platinum automotive demand would have been some 50 koz higher if semiconductor shortages had not limited vehicle production in the second quarter. Investment demand was down 50% to 191 koz. Bar and coin demand remained high compared to historical levels, while ETF demand softened and the unprecedented increase in exchange stocks in 2020 was not repeated.
2021 Supply – higher mine supply on COVID-related recovery and outperformance of ACP
For 2021, total platinum supply is now forecast to rise by 17% year-on-year to 7,943 koz following the significant reductions experienced during 2020, with refined production rising by 21% to 6,047 koz and recycling supply by 2% to 1,936 koz.
Since the recommissioning of the Anglo Platinum ACP Phase A unit in December 2020, the plant has operated above expectations, enabling more semi-finished material that built up during the ACP outages in 2020 to be processed this year. This higher ACP operating rate, combined with South African miners’ ongoing success in avoiding further operational challenges from COVID infections, is driving the increase in mine supply in 2021. In contrast, Russian supply is expected to fall by 12% (-83 koz) due

Page 2 of 28
PLATINUM QUARTERLY Q2 2021
© World Platinum Investment Council Ltd 2021
to delays in fully recommissioning operations following February’s concentrator shutdown and the impact of mine flooding and resulting remediation work. Recycling supply is expected to show limited growth during 2021, with volumes forecast to rise by only 2% (+31 koz) versus 2020 levels, muted due to limited processing capacity and the year-to-date adverse platinum price movement.
2021 Demand – strong automotive and industrial demand plus jewellery recovery counters lower investment demand
Demand in 2021 is now forecast to grow by a modest 1% (+59 koz), as notably strong growth from automotive and industrial end-use sectors and the recovery in jewellery offsets lower investor demand.
Automotive demand in 2021 is expected to recover by 22% (+529 koz) above the 2020 levels, and importantly also 2% (+58 koz) above 2019 levels, despite concerns over the ongoing impact of the global microchip shortages on vehicle production. Key to this growth is the impact on both light-duty and heavy-duty vehicle platinum loadings of tighter emissions standards applicable in a number of major auto markets this year. In addition, platinum demand is being boosted by platinum for palladium substitution in major European, North American and Chinese markets.
Platinum demand in industrial applications is expected to increase 25% (+493 koz) above 2020 levels, as the impact of continued economic recovery and planned manufacturing capacity expansions boost demand to record high levels. Glass demand is expected to increase by 69% (+268 koz) driven by capacity additions in China’s LCD substrate and glass fibre sector, the latter to meet the country’s burgeoning composites demand. In the chemical and petroleum sectors, capacity additions are also expected to significantly boost platinum demand this year, growing by 14% (+80 koz) and 65% (+71 koz) respectively.
In 2021, platinum jewellery demand is expected to grow by 4% (+69 koz) over 2020 levels. Sustained strong year-on-year growth in North America is expected to take the region’s demand to record levels while growth in Europe and India is expected to more than counter further softening of demand in China.
Compared to record high annual volumes in 2020, investment demand is expected to reduce significantly, at 521 koz versus 1,554 koz. This is primarily on lower ETF demand in South Africa due to rotation from ETFs to platinum mining equities offering healthy dividend yields and that the unprecedented increase in exchange stocks in 2020 was not repeated.
The platinum market surplus in 2021, after two consecutive deficits and despite very strong automotive and industrial demand growth, is mainly due to lower forecast investment demand, and stronger than previously projected supply growth. The latter is being driven by a faster rate of processing of the platinum contained in semi-processed material built up during process outages in 2020.
6,811
1,103 17 28-8 44 31 7,943
6,500
7,000
7,500
8,500
8,000
2020 South Africa Zim North America Russia Other From stocks Recycling 2021f
-83
Annual total supply and changes 2020 to 2021f (koz)

Page 3 of 28
PLATINUM QUARTERLY Q2 2021
© World Platinum Investment Council Ltd 2021
The platinum investment case – post Q2 platinum price weakness, transitory mine supply surge, global semiconductor shortage and no official substitution data, weakens short-term investment demand outlook
Platinum prices were well supported through much of the second quarter, averaging $1,183/oz, up 49% year-on-year, and the highest quarterly average since Q1 2015, benefitting from a notably strong recovery in automotive and industrial demand during the first half of the year. However, since the end of Q2 2021 the platinum price has weakened, trading below $975/oz on negative investor sentiment towards industrial metals. This was driven by concerns of slower global growth during the second half of the year than previously anticipated, in part due to increased COVID delta variant infections globally, and expectations of a ‘sooner rather than later’ move by the US Federal Reserve to taper asset purchases. For platinum, this macro-driven negative sentiment has been exacerbated by platinum miners’ mid-year results indicating a surge in platinum production during the second quarter, plus news flow regarding the global semiconductor chip shortage constraining the recovery in automotive production. Indeed, this negative sentiment is illustrated by moves in NYMEX net money manager positioning, which by mid-August was at its shortest level since July 2019 of over -440 koz. The platinum market surplus in Q2 2021 of +161 koz and the forecast surplus for 2021 of +190 koz may well contribute further to the negative sentiment of some investors.
However, current platinum supply/demand balances and news flow supportive of negative price sentiment may not fully reflect several key dynamics at play during 2021. These include: 1) the transitory nature of higher mine supply in 2021 and 2022; 2) platinum automotive demand growth despite chip shortages; 3) significantly higher platinum and lower palladium imports into China – both still unexplained; and 4) platinum being far less available than widely thought.
1. The pick-up in mine supply this year is partly due to operating largely without the COVID-related mining shutdowns or ACP converter plant outages suffered in 2020. Output from mining in 2021 should all be processed into refined metal and be available for sale but with additional refined production arising from processing of the built-up (post-smelter, pre-ACP) material accumulated in 2020. Of the c.500 koz of platinum contained in this material, we originally expected 200 koz would be processed in 2020 and 300 koz in 2022. Increased processing in H1 2021 has revised our expectations to 300 koz being added to mine output in 2021 and 200 koz added in 2022. What is not immediately apparent is that supply growth in 2021, contributing to both the Q2 surplus and the annual surplus, is transitory in nature and falls away at the end of 2022. It also highlights that output from mining operations in 2021 is below the level of output in 2019 and 2018 and at the level expected to be in place at the end of 2022.
2. Automotive demand surged in the first half of the year by 36% year-on-year, as production and sales rebounded from the COVID impacted lows in the first half of 2020. Indeed, despite the constraining impact of the global semiconductor-chip shortage on the rate of recovery in auto manufacturing, auto sector platinum demand is expected recover to above pre-pandemic levels this year, with H2 2021 levels now expected to be the highest second half result since 2017. Rather than vehicle production volume growth alone, it is the impact of higher platinum loadings to meet tighter emissions legislation together with platinum for palladium substitution in key European, North American and Chinese markets that is expected to elevate automotive platinum demand above 2019 volumes. Indeed, the mid-year application of China VI regulations for all heavy-duty vehicles, following from the early 2021 introduction of China 6a measures for light vehicles and Euro 6d/temp measures in the EU, plus the continued phased implementation of Tier 3 regulations in the US, will drive automotive platinum growth in 2021 and beyond.
7,694
529 69
493 -1,033
7,753
6,000
6,500
7,000
7,500
8,000
8,500
9,000
2020 Automotive Jewellery Industrial Investment 2021f
Annual total demand and changes 2020 to 2021f (koz)

Page 4 of 28
PLATINUM QUARTERLY Q2 2021
© World Platinum Investment Council Ltd 2021
3. The unanticipated surge in Chinese platinum imports in 2021 is not yet fully accounted for in demand forecasts. Over the first seven months of the year, China imported a record 1.92 moz of platinum, with the monthly rate rising as H1 2021 progressed. Imports in Q2 2021 are the highest quarterly volume on record, driven, we believe, by surging industrial and automotive demand. While details of platinum substitution for palladium in autocatalysts remains unpublished, it is noteworthy that over the same period China’s palladium imports have softened considerably, down by 46% compared to 2020. These opposing trends do not, in isolation, provide evidence of substitution in China, but they do not contradict a situation where the speed and volume of palladium being replaced by platinum is far greater than current forecasts suggest.
4. The weak platinum price trends since the end of the second quarter, appear contrary to a lack of availability of platinum as suggested by the spike and sustained elevation in platinum lease rates. The platinum lease rate, the annual cost of borrowing metal from the market and based on a 1-month lease, rose to over 2.5% in mid-July, compared to average levels in the 4 years preceding COVID of 0.1%. We believe this recent lease rate spike was driven by unavailability of platinum to meet stronger than expected demand. Put more simply, parties contractually committed to supply platinum, that planned (as usual) to buy it, either could not find a supplier with stock and had to lease the platinum, or with balance sheets stretched due to the high price and inventory cost of palladium and rhodium chose to lease. However, the spike in lease rates occurred at the same time as holders of NYMEX futures chose to take physical delivery of over 160 koz, suggesting a genuine shortage of platinum was the main driver.
Demand growth potential – rapidly rising vehicle loadings, sustained substitution pressure, industrial capacity additions, and growing interest in the hydrogen economy, support upside for platinum investment demand
Platinum’s short-term demand growth potential appears poised to be able to quickly erase this year’s expected surplus. Crucially, we believe it can reverse the recent decline in investment demand as either more information becomes available or more investors consider the dynamics presented above.
Demand growth appears likely due to: 1) higher loadings and rising production of heavy-duty vehicles; 2) increasing platinum substitution for palladium; 3) Industrial demand growth; and 4) interest in the burgeoning hydrogen economy.
1. The trimming of light vehicle (LV) forecasts in 2021 raised investor concerns over platinum automotive demand, yet heavy-duty (HD) vehicle production appears to have been relatively unaffected by chip shortages. The HD vehicle sector globally saw production volumes grow by 5% to c.4.36 million vehicles in 2020 according to the International Organization of Motor Vehicle Manufacturers (OICA). This unexpected growth contrasted with the COVID-driven LV weakness and was principally driven by the 31% surge in Chinese HD diesel production. Over the first half of 2021, Chinese HD diesel production has risen by 20% to c.1 million units, while North American and European markets have experience growth of 33% and 34% respectively, as infrastructure and construction focussed stimulus policies have spurred continued HD sector growth. Positive HD production trends, plus the impact of tightening HD emissions regulations, are a key driver of automotive platinum demand growth.
China VI emission standards, which are significantly more stringent than China V, apply nationally for all HD vehicles from July 2021. Johnson Matthey (JM) expects platinum group metal loadings to treble to meet the tighter standard. Chinese HD vehicle production and sales are typically strongly correlated with investment in construction and infrastructure. It is expected that in H2 2021 such investment will increase due to concerns regarding the potential for economic underperformance in China. This suggests upside potential for forecast Chinese HD diesel production. Platinum demand upside could be higher when platinum loadings per HD vehicle are considered. China now has the strictest emissions regulations globally, yet HD platinum loadings for China VI vehicles based on Johnson Matthey forecasts appear to be c.50% of HD vehicle loadings in North America.
Current concerns regarding semiconductor chip shortages appear overly negative and vehicle production forecasts remain volatile. However, we believe that the LV sector remains at risk of upside revisions as chip production recovers in the second half of the year, with pent up automotive demand (from COVID restrictions and chip related constraints in H1 2021) then potentially driving higher auto production rates through the remainder of this year and into 2022.
2. Despite the palladium premium to platinum rising from an average of $150/oz in 2018, to over $1,600/oz in the second quarter of 2021, some market assessments claim that the ounce impact of substitution on platinum demand will only be material in two to three years’ time, rising to well over 1.5 moz per annum. However, published platinum automotive demand is accelerating at a faster rate than vehicle production growth and, while clearly confirming rising loadings, this also implies rising volumes of substitution.

Page 5 of 28
PLATINUM QUARTERLY Q2 2021
© World Platinum Investment Council Ltd 2021
3. Industrial demand for platinum is a key long-term demand driver, strongly correlated with global economic growth. With the exception of COVID-impacted 2020, industrial demand for platinum has grown consistently since the WPIC demand data from 2013 was first published. Platinum industrial demand arises from three categories: products made from platinum (e.g. thermocouples and stents), small top-up needs as industrial catalysts and manufacturing equipment wear out, and lastly the significantly larger volumes of metal required when new process plant capacity is built, with capacity-driven demand typically being less vulnerable to short-term economic headwinds. This year, industrial demand is expected to reach a record annual volume of 2.45 moz, 22% up on COVID-impacted 2020 levels, and 15% up on pre-pandemic volumes, driven by capacity additions in glass manufacturing, chemical production and petroleum refining sectors.
In China, it is significant capacity additions in chemical, glass and petroleum production, that have dramatically increased the country’s platinum industrial demand in recent years. For example, Chinese petroleum refining capacity has almost tripled over the last 20 years to keep pace with the rapid growth in domestic energy demand, while paraxylene capacity has grown by 120% since 2019. We believe that such industrial capacity additions are a key driver behind China’s platinum demand growth in 2021 and beyond.
4. Global hydrogen policy directives and investment commitments continue to expand providing an increasingly positive longer-term demand picture for platinum. The China Hydrogen Alliance, a state sponsored hydrogen industry group, is currently predicting that given current investment trends, the value of the country’s low carbon and green hydrogen energy industry in terms of production, will reach 1 trillion yuan ($152.6 billion) by 2025, and by 2030 that China’s annual demand for hydrogen will reach 35 million tons, accounting for at least 5% of China’s energy needs. Indeed, we believe that surging investment in the Chinese hydrogen economy could be a factor supporting higher platinum imports this year. Globally, the Hydrogen Council estimates that 228 large-scale green hydrogen projects are now under development. Increased scale is key to bringing the cost of green hydrogen to levels competitive with other energy sources. IHS Markit estimates that green hydrogen production costs have fallen by 50% since 2015, and will fall another 30% by 2025 as investment in green hydrogen and renewable energy generation capacity accelerates, with costs becoming competitive with other fuel sources by 2030. Competitive green hydrogen costs are key to achieving current global targets of c.4% fuel cell electric vehicle (FCEV) market penetration by 2030.
Platinum’s demand growth potential remains compelling but increased information flow appears necessary to see total investment demand growth re-instated. It appears likely that this information flow will occur over the next several months due to the significant level of activity underway in, for example, loadings growth, substitution for palladium and investor interest in the application of platinum-based hydrogen technologies.
WPIC initiatives highlights
As the global economy continues to recover from the severe impact of the COVID-19 pandemic last year, less severe yet ongoing negative impacts occurring this year, and large-scale government stimulus funding continues, more investors are considering an increased need for alternative hard assets like commodities, including platinum. This attraction to platinum is enhanced as more investors become aware of platinum’s key role in the increasingly certain hydrogen economy. Platinum’s constrained supply and significant demand growth potential increases the likelihood of new and existing investors increasing their holdings. We believe these factors will not only support continued investor interest in platinum, but also drive increased investor demand through the remainder of 2021 and beyond.
We continue to focus on increasing the number and impact of our product partnerships in our four key target markets, China, Japan, North America and Europe.
In Europe and North America, we continued to work closely with our partners to strengthen their focus on platinum and increase investor awareness of platinum as economic growth returns yet global risk levels remain elevated. Investor appetite for platinum bar and coin products, despite being lower than in the first quarter, remains at historically high levels. The release of an additional 40,000 Platinum 2021 American Eagle bullion coins helped meet strong investor demand for platinum in Q2 2021 and contributed to a notably strong performance in the first half of 2021. We are now seeing a slowdown in market demand reflected by the increased availability of products, as well as the easing of product premiums. However, we continue to work closely with our partners to support marketing activities to promote platinum investment and enhance awareness of platinum’s strategic role in applications core to establishing the hydrogen economy and in global decarbonisation.

Page 6 of 28
PLATINUM QUARTERLY Q2 2021
© World Platinum Investment Council Ltd 2021
ContentsForeword P1 Summary Table P7 Second Quarter 2021 Review P8 2021 Outlook P13
Expanded Tables P19 Glossary of Terms P24 Copyright and Disclaimer P28
In China, WPIC initiated and jointly hosted the inaugural Shanghai Platinum Week in June with support from global leaders in the platinum industry. The week-long event significantly strengthened awareness of platinum and the platinum investment case and expanded our market-development footprint. During this week, Shanghai Gold Coins Investment Company confirmed its plan to add platinum to celebrate its 40th anniversary of Panda coins, an initiative to diversify its offering and to meet the growing demand for platinum investment. The recent growth in platinum coins produced by international mints and WPIC’s increasing efforts in China also enhance its enthusiasm for platinum. Furthermore, a series of policies were recently implemented by China to support its hydrogen and FCEV industries, which increased investor interest in platinum. The significant increase in China platinum imports in the first six months included, we believe, investors and fabricators increasing ownership and taking advantage of the range-bound price.
WPIC continues with its expansion in Japan after signing a partnership with Rakuten Securities in the first quarter. We enhanced our investor development program by partnering with Japan Bullion Market Association (JBMA) which continues to attract interest from domestic investors and the media. We observed a flow of investment in Q2 2021, which contributed to partly offset the earlier net selling. WPIC communication on FCEVs in the Tokyo Olympics Games helped attract investor attention to platinum for its growing role in Japan’s commitment to the hydrogen economy.
We also deepened our long-established partnership with the Singapore Bullion Market Association (SBMA) in the second quarter and started distributing market insights to local investors through the SBMA.
We believe that our efforts to increase platinum investment product availability and attractiveness to more investors around the world is well positioned to support future investment demand growth.
Paul Wilson, CEO

Page 7 of 28
PLATINUM QUARTERLY Q2 2021
Prepared for World Platinum Investment Council by Metals Focus Limited (2019 onwards) and prior years by SFA (Oxford)
Table 1: Supply, demand and above ground stocks summary
2018 2019 2020 2021f 2020/2019 Growth %
2021f/2020 Growth %
Q1 2021 Q2 2021
Platinum Supply-demand Balance (koz)
SUPPLY
Refined Production 6,125 6,100 4,989 6,047 -18% 21% 1,468 1,557
South Africa 4,470 4,399 3,298 4,402 -25% 33% 1,036 1,165
Zimbabwe 465 458 448 465 -2% 4% 114 128
North America 345 356 337 365 -5% 8% 83 75
Russia 665 716 704 621 -2% -12% 184 136
Other 180 170 202 194 19% -4% 51 52
Increase (-)/Decrease (+) in Producer Inventory +10 +2 -84 -40 N/A N/A -26 +34
Total Mining Supply 6,135 6,102 4,906 6,007 -20% 22% 1,442 1,591
Recycling 1,935 2,118 1,905 1,936 -10% 2% 493 477
Autocatalyst 1,420 1,584 1,427 1,454 -10% 2% 361 365
Jewellery 505 476 422 424 -11% 1% 118 98
Industrial 10 57 56 58 -2% 3% 14 14
Total Supply 8,070 8,220 6,811 7,943 -17% 17% 1,935 2,068
DEMAND
Automotive 3,075 2,838 2,366 2,895 -17% 22% 715 664
Autocatalyst 2,930 2,838 2,366 2,895 -17% 22% 715 664
Non-road 145 † † † † † † †
Jewellery 2,245 2,099 1,820 1,889 -13% 4% 477 461
Industrial 1,935 2,129 1,955 2,448 -8% 25% 679 591
Chemical 570 694 585 665 -16% 14% 119 204
Petroleum 235 219 109 179 -50% 65% 35 40
Electrical 205 144 130 134 -10% 3% 33 35
Glass 250 236 391 658 65% 69% 286 112
Medical and Biomedical 240 249 238 246 -4% 3% 62 59
Other 435 587 502 565 -14% 13% 143 141
Investment 15 1,253 1,554 521 24% -66% 157 191
Change in Bars, Coins 280 283 586 361 107% -38% 18 111
Change in ETF Holdings -245 991 509 110 -49% -78% 106 31
Change in Stocks Held by Exchanges -20 -20 458 50 N/A -89% 33 49
Total Demand 7,270 8,319 7,694 7,753 -8% 1% 2,028 1,907
Balance 800 -99 -883 190 N/A N/A -93 161
Above Ground Stocks 3,270 3,551** 2,667 2,857 -25% 7%
Source: Metals Focus 2019 - 2021, SFA (Oxford) 2018.
Notes:1. **Above Ground Stocks 3,650 koz as of 31 December 2018 (Metals Focus).2. † Non-road automotive demand is included in autocatalyst demand.3. All estimates are based on the latest available information, but they are subject to revision in subsequent quarterly reports. 4. The WPIC did not publish quarterly estimates for 2013 or the first two quarters of 2014. However, quarterly estimates from Q3 2014, to Q4 2017 are contained in
previously published PQs which are freely available on the WPIC website. Quarterly estimates from Q2 2018 and half-yearly estimates from H1 2018 are included in Tables 3 and 4 respectively, on pages 20 and 21 (supply, demand and above ground stocks). Details of regional recycling supply in Table 6 on page 23 are only published from 2019.
5. Data from Metals Focus and SFA (Oxford) may not have been prepared on the same or directly comparable basis.6. Prior to 2019 SFA data is independently rounded to the nearest 5 koz.

Page 8 of 28
PLATINUM QUARTERLY Q2 2021
Prepared for World Platinum Investment Council by Metals Focus Limited
2021 SECOND QUARTER PLATINUM MARKET REVIEW
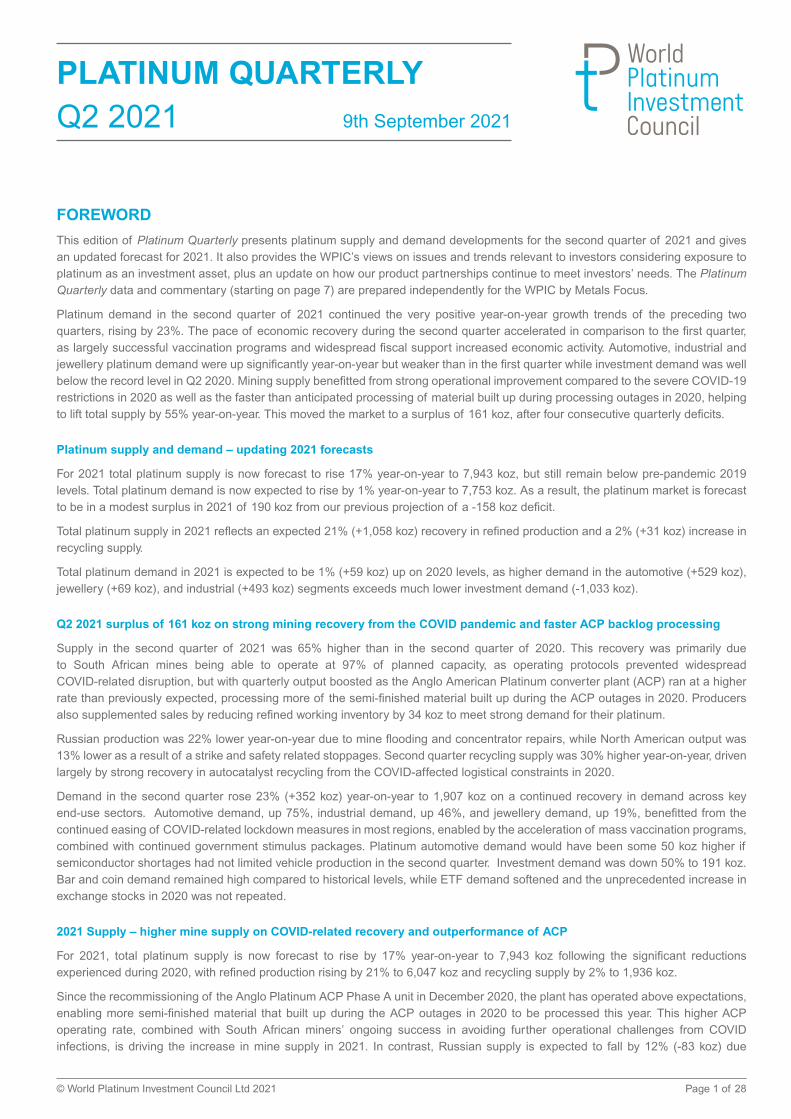
During Q2’21, global platinum demand was up sharply against a pandemic-affected Q2’20, but eased back a fraction quarter-on-quarter. The growth experienced in Q1’21 continued, albeit unevenly across different regions. Industrialised countries which were bolstered by significant fiscal support and accelerated vaccination rates saw economic activity rapidly returning to more normal conditions. However, some sectors remained hampered by the consequences of the pandemic which exposed vulnerabilities in certain supply chains, most notably semi-conductor chips. Despite the ongoing challenges, Q2’21 platinum demand increased by 23% (+352 koz) year-on-year to 1,907 koz. However, this improvement was outstripped by total supply rising by 55% (+733 koz) to 2,068 koz. Overall, this resulted in a surplus of 161 koz, compared with a deficit of -93 koz in the previous quarter. The Q2’21 surplus was also the highest since Q1’20 (+167 koz).
2,068
1,907
161
Chart 1: Supply-demand balance, koz, Q2 2021
Total Supply Balance Total Demand
Source: Metals Focus
Supply
Global mine supply jumped 65% (+615 koz) year-on-year to 1,557 koz, the highest quarter for two years, as the major producer South Africa recovered from the extreme disruption of Q2’20, supporting refined output with a drawdown of semi-finished inventory.
South African output jumped 124% (+644 koz) year-on-year due to a return to full operations at the Anglo American Platinum Converter Plant (ACP) following the shutdown in Q2’20. As part of the ongoing process of recovery from the ACP shutdown around 140 koz of semi-finished stock, that had been built up as a result of last year’s outages, was refined. Separately, Q2’20 was heavily impacted by COVID-19 restrictions resulting in a loss of around 45% of mined output. The third wave of COVID-19 created operational challenges, particularly towards the end of the quarter, with some deteriorating safety performances and increased rates of absenteeism. However, protocols continued to successfully mitigate against widespread disruption, with mines operating at an estimated 97% of planned capacity.
Zimbabwean production increased by 17% (+18 koz) year-on-year as a backlog of matte from the Unki smelter was processed through the ACP and refined. Russian output was curtailed by the ongoing remediation of flooding at two mines and constrained concentrator capacity due to a building structural failure. The result was a 22% fall to 136 koz (-39 koz), a new low for the data series. Artisanal volumes, which are highly price sensitive, remained weak as planned expansions are yet to occur. North American volumes fell by 13% (-12 koz) primarily due to a strike at a Canadian mine and a safety related work stoppage at a mine in Montana.
Metal released to the market exceeded refined volumes as producers supplemented sales drawing down an estimated 34 koz of finished metal working inventory, citing strong demand.
Recycling
Global recycling rose by 30% (+109 koz) year-on-year during Q2’21 to 477 koz, mostly as result of strong autocatalyst recoveries, which surged by 42% year-on-year (+108 koz) to 365 koz. The dramatic growth rate owed much to the impact of lockdown restrictions on recycling last year, especially in Western Europe. However, since that time and over the past 6-9 months supply has remained historically high. As a result, much of the recycling industry continues to operate at close to full capacity, with extended processing lead times. Interestingly, elevated palladium and rhodium prices have encouraged some smelters and refiners to focus on lots which

Page 9 of 28
PLATINUM QUARTERLY Q2 2021
Prepared for World Platinum Investment Council by Metals Focus Limited
942
25
368
1,33
5 1,55
7
34 47
7
2,06
8
Refined production
Q2 2020 Q3 2020 Q4 2020 Q1 2021 Q2 2021
Producer inventory Recycling Total
Source: Metals Focus
Chart 2: Platinum supply, koz
379
388
403
385
1,55
5
664
461 59
1
191
1,90
7
Automotive
Q2 2020 Q3 2020 Q4 2020 Q1 2021 Q2 2021
Jewellery Industrial Investment Total
Source: Metals Focus
Chart 3: Platinum demand, koz
are rich in these two metals. As a result, there is some evidence of silicone carbide spent converters (which are principally diesel particulate filters (DPFs) that tend to be platinum-rich) being stockpiled. Jewellery recycling inched up by 1% year-on-year (+1 koz) in Q2’21 to 98 koz due to strong gains in Japan (as collection activities began normalising) being countered by marked losses in China (resulting from low old-for-new exchange and heavy inventory melt during the February price spike). Price-driven losses in China also largely explain the global 17% quarter-on-quarter fall.
Demand
Overall platinum demand rose by 23% (+352 koz) year-on-year in Q2’21 even though investment demand halved. Autocatalyst and industrial demand stood out, with most sub-sectors achieving a strong recovery against the COVID-impacted Q2’20. Autocatalyst demand grew 75% (+285 koz), while industrial demand rose 46% (+188 koz), consisting of: chemical demand up 83% (+93 koz), petroleum up 121% (+22 koz) and glass up 39% (+31 koz). Jewellery fabrication rose by a more modest 19% (+73 koz), with Chinese weakness countering much of the strong growth elsewhere. Meanwhile, investor demand halved compared to the previous year. This reflected easing in both exchange warehouse inflows and sharply lower inflows into ETFs. Finally, strong bar and coin demand in North America was offset by heavy liquidations in Japan leading to a 10% (-12 koz) decline in bar and coin against Q2’20.

Page 10 of 28
PLATINUM QUARTERLY Q2 2021
Prepared for World Platinum Investment Council by Metals Focus Limited
Automotive demand
Automotive demand jumped 75% (+285 koz) year-on-year in Q2’21 to 664 koz as global light vehicle production recovered compared to a pandemic-hit quarter in 2020, although it remained 10% below Q2’19 levels. Global light vehicle production for the quarter was up 51% and heavy-duty vehicle production grew by 12%. Had it not been for stoppages across the world as the semiconductor shortage persisted (and in many instances, worsened), demand for platinum would have been higher. During Q2’21, chip-related production losses were estimated at around 1.9M light-duty units and so platinum demand was almost 50 koz lower than previously anticipated.
Automotive demand for platinum in Europe surged 82% (+127 koz) as year-on-year production increased in all powertrain segments. Platinum loadings per vehicle were higher, due to a combination of the implementation of Euro 6d with a stricter conformity factor and some substitution gains this year. However, the number of diesel internal combustion engines produced in the quarter was 35% lower than that of Q2’19 levels. Western European diesel’s share of new car sales fell to 23% for the quarter.
In North America, despite the impact of severe weather in Q1’21 and persistent chip shortages, vehicle production improved dramatically when compared to a pandemic impacted Q2’20. As a result, platinum demand in North America saw a marked increase year-on-year of 130% (+51 koz). In this region, stronger platinum demand reflected rising vehicle numbers, and specifically a higher number of diesel vehicles produced and a modest level of substitution of palladium with platinum.
In China, pre-buying of heavy-duty vehicles ahead of the implementation of China VI boosted platinum demand, especially since preference was given to diesel trucks ahead of gas powered vehicles. However, the country did not escape the global chip shortage and light-duty production declined by 5% in the quarter. However, with light duty loadings increasing between 30-50% from China 5 to China 6a and b and heavy-duty loadings more than doubling due to China VI, this helped lift platinum demand by 7% (+5 koz).
In the ’Rest of the World’, though economic activity was hampered by the resurgence of lockdown measures in some countries, vehicle production improved significantly, rising by 111% on Q2’20 resulting in platinum automotive demand more than doubling.
Jewellery demand
During Q2’21, global platinum jewellery demand jumped by 19% (+73 koz) year-on-year to 461 koz. However, the performance was flattered by a lockdown affected Q2’20, with the Q2’21 total comfortably the second lowest second quarter in our quarterly series. The year-on-year gain would have been far stronger were it not for a sharp drop in China where jewellery demand fell to a historic low. European fabrication also rebounded, up 125% (+36 koz) in Q2’21 and up 1% on Q2’19. Much was due to a sea change in consumer sentiment and the re-start of weddings. Further strong, export-centred gains for the high-end jewellery and watch brands also helped.
North American jewellery fabrication in Q2’21 surged by 141% (+65 koz) and by 29% versus Q2’19. This stunning result was largely down to improving consumer sentiment, a rebounding economy, still constrained expenditure on services (especially travel) and the re-start of weddings. Retailers’ growing enthusiasm to stock the metal (in part due to still helpful price differentials versus gold) also contributed.
In contrast, Chinese platinum jewellery fabrication in Q2’21 fell 25% (-54 koz) due to fierce competition from gold jewellery and COVID-related disruption across Guangdong Province (which recorded decent sales in Q2’20) over most of May and June. Almost all manufacturers and showrooms suffered double-digit declines. Despite some support from festive demand in May around Labour Day Holiday, (“I love you day”, 20th May), and Mother’s Day sales were comparatively weak on the previous quarter and lagged gold purchases, which saw a 64% increase. Lacklustre sales of heavier platinum plain designs, which last year had benefited from consumer bargain-hunting (on the back of the metal’s sharp price correction and retail price promotions) also contrasted with gold this quarter, which showed healthy buying of larger gold jewellery pieces.
Japanese jewellery demand was up by nearly a third year-on-year, reflecting the low base in 2020. However, demand in the country remained historically low. For example, it was more than 20% lower than it had been in the same period of 2019. The ongoing COVID-19 crisis in the country, higher platinum prices, a preference for value-added products as well as gems and pearls and continued weakness of exports are all factors that have been weighing on Japanese demand.
In India, jewellery fabrication rose by 156% to 9 koz in Q2’21, flattered by a very low base in Q2’20. However, fabrication more than halved compared to Q1’21 as the second wave of COVID infections heavily impacted the market. Jewellery manufacturing was also impacted by the cautious approach adopted by retailers.

Page 11 of 28
PLATINUM QUARTERLY Q2 2021
Prepared for World Platinum Investment Council by Metals Focus Limited
Industrial demand
Industrial demand in Q2’21 was +46% (+188 koz) higher than in Q2’20 and up 10% (+54 koz) on Q2’19. Despite some resurgence of COVID-19 and a slow vaccination roll-out in some regions, consumer demand underpinned much of the industrial recovery for most consuming segments.
Petroleum
Platinum demand posted a sharp year-on-year rise in Q2’21, with volumes more than doubling (+22 koz) to 40 koz. To a large extent, this steep rebound reflects the very low base in 2020 when the global oil industry was hit hard by the pandemic. That said, on a quarter-on-quarter basis, volumes were also higher in Q2, albeit by a more modest 5 koz. Importantly, demand has now recovered to be close to the long-run quarterly average. An ongoing ramp-up in oil refining runs was the driving force behind this improvement. According to the latest IEA report, after stagnating in May, global refining throughput increased by 1.6 million barrels per day in June, the largest monthly increase since July 2020.
Chemical
Platinum chemical demand rose both on a year-on-year (+93 koz) and quarter-on-quarter (+85 koz) basis to 204 koz in Q2’21. While most areas witnessed gains, most important was the strong performance in the Chinese petrochemical sector. This came as a result of new capacity additions, after Zhejiang Petrochemical confirmed in June that the company started test runs of its Phase II’s paraxylene (PX) line (with commercial operations expected in H2). Platinum use in the silicone market continued to strengthen, as the ongoing economic recovery boosted its use in a wide range of applications, including consumer products and construction. Turning to the nitric acid market, platinum offtake remained broadly steady compared to the previous quarter, though notably higher than last year.
Medical
Despite the positive quarterly results released by several large medical device companies and evidence of a recovery in procedures, gains in platinum demand from medical applications have been capped. North America appears to be ahead of Europe and emerging markets. Although demand has improved for active pharmaceutical ingredients (APIs), containing platinum, which are used in chemotherapy treatments that include either carboplatin, oxaliplatin and cisplatin, the impact of resurging virus cases curtailed the recovery in the quarter. Overall, therefore, platinum use in the medical sector declined by 2% (-1 koz) on a pandemic affected Q2’20and remained marginally below 2019 levels.
Glass
New fibreglass and LCD tank capacity installations resulted in a 39% increase in platinum demand year-on-year to 112 koz in Q2’21. Similar to other segments, the extent of the gains was partly a reflection of pandemic-related challenges having affected investments in Q2 last year. Having said this, there is no doubt that demand is healthy even in absolute terms, helped by strong demand for related end-products. Most new investments continue to be made in China and were notably plants whose start-ups were delayed due to last year’s crisis.
Electrical
Demand from the electrical segment rose by 19% (+6 koz) year-on-year, due to the rebound of HDD shipments and gains in semiconductor applications, aided by the lower base last year. Solid demand from the active nearline market, increases in data centre projects, coupled with the extra momentum of high-capacity HDDs (partly fuelled by growing demand for storage-based cryptocurrency), contributed to higher metal loadings per disk which in turn helped platinum usage.
Other
Demand from the Other Industrial segment in Q2’21 increased by 36% (+37 koz), chiefly reflecting last year’s lower total. Despite the recovery in new vehicle sales and aftermarket business, the growth in spark plugs and sensor demand was somewhat curtailed due to vehicle output constraints owing to the global auto-chip shortage.

Page 12 of 28
PLATINUM QUARTERLY Q2 2021
Prepared for World Platinum Investment Council by Metals Focus Limited
-200
0
400
200
600
koz
Chart 4: Platinum Investment, koz
Q2 2020 Q3 2020 Q4 2020 Q1 2021 Q2 2021
Source: Metals Focus
Bars and coins ETFs Exchange stocks
Investment demand
Overall investment demand in the quarter fell 50% (-194 koz) as the pace of ETF buying and exchange warehouse stock inflows slowed.
Bar and coin demand fell by 10% year-on-year to 111 koz. However, it still remained historically high. Performances varied markedly by region, with North America achieving another strong total, while Japanese investment returned to positive territory, but only modestly.
Despite falling 16% (-15 koz) on Q1’21, North America was the star performer in volume terms during Q2’21, with coin and bar demand of 79 koz. This compared with just 20 koz during Q2’20, although the total that quarter was hit by lockdown restrictions and many refineries focussing on delivering Comex-approved gold bars into New York at the expense of many other products. By contrast, demand this year has been notably strong, reflecting the health of the wider North American precious metals market. Although premiums have eased, largely reflecting greater product availability, selling back remains insignificant.
Although Japanese retail investment returned to positive territory in Q2’21, at 13 koz, the total for the period was historically low. Elevated local platinum prices in April and May continued to encourage some selling back and while the June correction did fuel a spike in demand, this was short-lived. Turnover has also been under pressure due to the ongoing COVID-19 pandemic discouraging many investors from visiting dealers.
ETF holdings grew modestly in Q2’21 by 31 koz as investor interest prevailed especially in Europe and to a lesser extent in North America. This was lower than the 123 koz growth seen in Q2’20 when platinum traded at a 49% discount to Q2’21 price levels. Exchange inventory increased a further 49 koz to end the quarter at 739 koz, a record high. The inflow reflected several factors, including risk mitigation requirements by financial institutions, following last year’s dramatic events, as well as the continued exchange-for-physical (EFP) premium (though this was markedly smaller than during much of last year).

Page 13 of 28
PLATINUM QUARTERLY Q2 2021
Prepared for World Platinum Investment Council by Metals Focus Limited
-665 -745
-235 -330
305
800
-99
-883
190
Chart 5: Supply-demand balance, koz, 2013-2021f
2013 2014 2015 2016 2017 2018 2019 2020 2021f
Source: Metals Focus 2019-2021, SFA (Oxford) 2013-2018
2021 OUTLOOK
The World Bank’s global growth expectations have been revised up from the 4% expected at the start of this year to 5.6% on the back of stronger than expected recoveries in major economies, such as China and the United States. While many countries still contend with a resurging pandemic, brought about by new virus variants, the economic outlook has nonetheless been revised up for most. Both platinum demand and supply have benefited from the economic recovery in the first half and we expect this to broadly continue for the rest of the year. Industrial activity, while likely to be uneven as the pandemic hits some industries harder than others, will surge ahead of 2020 driving demand for platinum in most sectors. As the future prospects for platinum demand continue to strengthen, we expect investment demand to remain positive, albeit at a lower rate than previously anticipated. We forecast 2021 demand in total to increase by 1% (+59 koz) to 7,753 koz. A strong recovery in mine production and modest growth in recycling will see total supply rise by 17% (+1,132 koz) to 7,943 koz. As a result, 2021 is forecast to generate a surplus of +190 koz compared to the deficit of -883 koz in 2020, as the latter was driven by investment inflows of 1.6 moz which contrasts with the forecast investment total of 521 koz for this year.
Supply
Global refined supply is expected to rebound to near 2019 levels in 2021, rising by 21% (+1,058 koz) to 6,047 koz on the back of the South African recovery following the extreme disruptions of 2020. South Africa is anticipated to add 1,103 koz year-on-year, a 33% increase to 4,402 koz. The country’s output continues to exceed earlier production guidance, with the ACP operating ahead of expectations and the largely successful navigation of COVID-19 pandemic challenges. The outperformance of the ACP is enabling a faster drawdown of the in-process inventory than originally guided. 300 koz of semi-finished inventory is now expected to be released over the year, a 100 koz increase over our previous expectations. The drawdown of the excess inventory will continue into 2022, however the accelerated depletion reduces volumes available for refining next year by a reciprocal quantity. Thus, the release of a remaining 200 koz is now estimated in 2022. COVID-19 continues to present some risk to the rest of this year, with some deteriorating safety performances and impact on project development with the delay of a mill commissioning. On a positive note, mining companies’ vaccine roll-out initiatives have meant workforce rates exceed the national average, with the latest data indicating 22% of mine workers have received a first vaccine dose. In addition, record industry margins have permitted an easing of cost restraints, with some miners mitigating absenteeism by increasing contracted labour and raising capital spend to facilitate operational flexibility in order to meet planned output.

Page 14 of 28
PLATINUM QUARTERLY Q2 2021
Prepared for World Platinum Investment Council by Metals Focus Limited
Chart 6: Changes in supply, 2020 vs. 2021f koz
Source: Metals Focus
Russia
North America
South Africa
202
194
-8
2020 2021f
1,90
5
1,93
6
+31
2020 2021f
3,29
8
4,40
2
+1,103
2020 2021f
448
465
+17
2020 2021f
704
621
-83
2020 2021f
337 36
5
+28
2020 2021f
Other Zimbabwe
Recycling
Russian output is projected to decline by 12% this year (-83 koz) due to disruptions resulting from mine flooding and ongoing remediation. A return to full operations is planned for November (a 5-month delay on previous expectations of a 4-month timeframe), as additional underground mine support work is required. Construction defects at a concentrator, identified following the building collapse in February, have now been rectified. The concentrator is operating at 85% capacity with a return to full capacity expected in October. The total impact from these events is anticipated to be -69 koz less refined output.
North American volumes are forecast to grow by 8% (+28 koz) as a project in Montana ramps-up, while Zimbabwe is expected to add 17 koz, up 4%, as the backlog of semi-finished inventory is refined in South Africa.
As disruption eases and record PGM pricing supports robust industry balance sheets we expect a build of producer refined inventory to more normal levels with a net 40 koz increase.
Recycling
Total recycling of platinum is forecast to rise by 2% (+31 koz) in 2021 to 1,936 koz. Global autocatalyst recycling is forecast to rise by just 2% (+26 koz) to 1,454 koz. In spite of the modest growth rate, the total will remain close to 2019’s record high total of 1,584 koz. This largely reflects the historical fitment of platinum-bearing autocatalysts during the late 2000s, especially in Europe and North America. We are also aware of some material, including those containing platinum-rich silicon carbide, being stockpiled because of a lack of processing capacity. Looking ahead, the point at which some of this material is sold will be partly determined by available processing capacity as well as how the platinum price performs in the coming months.
Jewellery recycling in 2021 is now expected to be broadly stable, with the global total up just 1% year-on-year (+2 koz), chiefly as a modest rise in China is largely balanced by a slight dip in Japan. This represents a sizeable change from the last report when +8% was forecast. Our estimates for China and Japan have been lowered notably due to the cut to our 2021 price forecast and a surprisingly sluggish Q2 in both countries.

Page 15 of 28
PLATINUM QUARTERLY Q2 2021
Prepared for World Platinum Investment Council by Metals Focus Limited
7,694 7,753
+529
+69+80
+71+5
+268+8 +63
-1,033
7,000
7,500
8,000
9,000
8,500
2020 Automotive Jewellery Chemical Petroleum Electrical Glass Medical andBiomedical
Other Investment 2021f
Source: Metals Focus
koz
Chart 7: Changes in demand by category, 2020 vs. 2021f
Industrial demand
Demand
Total demand in 2021 is expected to grow by 1% (+59 koz) to 7,753 koz. A bumper recovery in car sales and production drives autocatalyst demand (+529 koz), while a recovery in the luxury goods market sees a modest growth in jewellery (+69 koz). In addition, the ongoing economic recovery spurs healthy growth in all industrial sectors (+493 koz). We forecast growth of 110 koz in ETF holdings, down 78% (-399 koz) from the substantial rise seen last year. Coin and bar demand is also forecast to decline from the previous year record high in this series, down 38% (-225 koz) to 361 koz.
Automotive demand
Autocatalyst demand for platinum is expected to rebound strongly this year, up 22% (+529 koz) on 2020 and even higher than 2019 (+2%, +58 koz), notwithstanding a further downward revision in vehicle production numbers, due to the ongoing semiconductor shortage. Despite growing numbers of battery electric vehicles, LMC Automotive global engine vehicle report at time of writing indicated that total light-duty vehicle production will rise by 13% to 84m, of which 95% will have a PGM-bearing aftertreatment system. While the recovery in platinum requirements is mostly driven by the substantial increase in units compared to last year, tighter emissions legislations covering an increasing number of vehicles globally will also benefit platinum demand. The growth of heavy-duty vehicle production is forecast to be a more modest 5% this year. Nevertheless, platinum demand within that segment is expected to grow by an impressive 57%, as more than half of the units produced worldwide are now expected to be fitted with Euro VI equivalent aftertreatment systems.
In Europe, full year demand is expected to grow ahead of 2020 despite the headwinds experienced due to the chip shortage and preferential incentives offered for the purchase of battery electric and hybrid vehicles (most of which have gasoline engines). Western Europe’s diesel market share is forecast to decline to 23%, a 2% downward revision since Q1’21. In spite of these headwinds, stricter emissions compliance requirements and lower conformity factors (meaning a lower allowance for real driving condition tests to vary from the legislated limit) support growing demand for platinum. In addition, persistently higher palladium prices will continue to support rising platinum loadings as current palladium loadings are substituted by platinum, to help improve economics while ensuring legislative compliance.

Page 16 of 28
PLATINUM QUARTERLY Q2 2021
Prepared for World Platinum Investment Council by Metals Focus Limited
In North America, healthy platinum demand can be ascribed to a stronger recovery in larger passenger vehicle sales ahead of conventional size cars. SUV and pick-up truck production is set to increase by 20% this year, while conventional passenger vehicle production is expected to decline moderately. In keeping with other regions, due to the economic benefit of substituting some palladium with platinum, a number of gasoline vehicles will contain platinum and at higher loading levels.
Similarly, despite overtaking Europe as the world’s number one BEV market, China’s healthy platinum demand reflects higher light-duty vehicle production, tighter emissions legislation for both light and heavy-duty vehicles and a shift towards higher platinum ratios to achieve compliance and due to substitution. Unlike North America, smaller conventional cars are still favoured, the production of which is set to grow ahead of SUV and pick-up models.
In the Rest of the World, platinum autocatalyst use is expected to grow by 151 koz as India leapfrogs to Bharat VI and countries such as Mexico see increasing production of Euro VI heavy-duty vehicles.
Jewellery demand
This year global jewellery consumption is forecast to rise by 4% (+69 koz) to 1,889 koz. Even so, this will be the second year that the total has failed to reach 2,000 koz. This reflects weakness in China, which will almost offset healthy gains in every other key market.
Jewellery fabrication in North America is expected to close the year with a healthy 35% year-on-year increase (and, more meaningfully, a 10% rise on a pre-pandemic 2019). That said, second half gains should slow notably from the first, as more travel resumes, stimulus cheques end, the rush to buy bridal jewellery eases, inventory replacement normalises and, finally, the spread of the Delta-variant casts a shadow. However, a still improving economy, high levels of savings and price differentials with gold will sustain consumption, and our full year forecast has been raised by 30 koz since the last Platinum Quarterly.
Full year 2021 fabrication in Europe looks set to enjoy a marked 20% rebound as COVID damage fades, with strong gains seen for both local, bridal-dominated sales and for the export-oriented high-end jewellery and watch brands. The latter’s offtake might just surpass 2019 levels, but the mass market’s slower recovery in Q1’21 means the full year may well fall short of pre-pandemic levels.
In response to the worse-than-expected demand in Q2’21 we have revised the expected decline for China’s platinum jewellery fabrication in 2021 from 2% to 14% (now -116 koz). This revision reflects growing competition from the gold market and evidence of more cautious inventory replenishment of platinum across the jewellery supply chain.
For India, we have maintained our bullish outlook and expect fabrication and consumption to post double-digit growth; fabrication up 35% (+17 koz) and consumption up 29%. The strong second half recovery will be driven by the onset of the wedding season and an economic recovery as some level of normalcy returns.
Industrial demand
The use of platinum in industrial applications is expected to increase by 25% (+493 koz). Chemical demand is forecast to rise by 14% (+80 koz) and petroleum will rebound by 65% (+71 koz). Glass demand sees growth of 69% (+268 koz) due to expansions previously planned for 2020. Other Industrial Demand, which includes fuel cell applications, automotive sensors and spark plugs, will grow by 13% (+63 koz), while medical platinum demand is expected to rise by 3% (+8 koz).

Page 17 of 28
PLATINUM QUARTERLY Q2 2021
Prepared for World Platinum Investment Council by Metals Focus Limited
20207,694
Chart 8: Demand end-use shares, 2020 vs. 2021f
Source: Metals Focus
Automotive31%
Glass 5%
Electrical 2%
Petroleum 1%
Chemical 8%
Investment20%
Industrial25%
Medical andBiomedical 3%
Other6%
Jewellery24%
2021f7,753
Automotive37%
Glass 9%
Electrical 2%
Petroleum 2%
Chemical 9%
Investment7%
Industrial32%
Medical andBiomedical 3%
Other7%
Jewellery24%
Petroleum
While rising Delta variant cases have weighed somewhat on near-term economic prospects, a further recovery in global oil refining output is expected in H2’21. Notably higher oil prices, an ongoing economic recovery and crude inventory drawdown, all point to a gradual pick-up in refining capacity utilisation rates. Meanwhile we do not expect a repeat of last year’s plant decommissioning. Moreover, leaving aside ongoing capacity expansion capacity in China, platinum demand will also benefit from the start-up of new units elsewhere later this year, after construction was severely affected last year by the COVID crisis. Among these, Uzbekistan is expected to launch its first gas-to-liquids plant in Q4’21. All of these factors should bode well for a recovery in platinum demand in the petroleum industry, with volumes expected to rise by 65% (+71 koz) to 179 koz in 2021.
Chemical
Demand is projected to rise by 14% (+80 koz) to 665 koz in 2021, with gains expected in all key applications. For the silicone industry, much of this growth reflects a rebound from the COVID-19 driven low base, as the global economy gradually improves. With regards to nitric acid, platinum demand will benefit from a small pick-up in capacity additions, the result of sharp gains in fertilizer prices and tighter supplies so far this year. Turning to the petrochemical industry, demand is on track to record a small increase from an already elevated base in 2020, after capacity additions in China came on stream as scheduled. Meanwhile, Saudi Aramco is expected to start a new PX unit in Saudi Arabia later this year.
Glass
Following an exceptional first and healthy second quarters, we are firmly on track to meet our expectations of global glass demand enjoying strong gains in 2021. We have in fact upgraded our projections since the Q1’21 report, and now forecast a global total of 658 koz, up by 69% year-on-year. In addition to all the planned capacity additions that we had identified before still looking likely to go ahead, we have identified some extra glass-fibre plants likely to come on stream. Overall, a substantial increase in fibreglass capacity in China is expected in 2021 in response to growing demand for composites in the country. Some of the largest additions are from Xingtai Jinniu’s two new production lines, Jushi’s Tongxiang plant’s third production line and Changhai’s new production line.
Medical
Platinum use in pharmaceutical and biomedical devices is forecast to recover in 2021, growing by 3% year-on-year (+8 koz) to 246 koz. Even though many companies servicing the medical sector are broadly optimistic for H2, there is growing concern that the recovery remains vulnerable to further virus-related disruptions as can be seen in countries such as India, Japan and Australia.

Page 18 of 28
PLATINUM QUARTERLY Q2 2021
Prepared for World Platinum Investment Council by Metals Focus Limited
Electrical
The electrical sector is expected to grow by 3% (+5 koz) to 134 koz as business activities heavily reliant on cloud storage and growing enterprise procurement capabilities continue to expand in the second half. However, the HDD market is likely to remain in a long-term secular decline due to growing adoption of SSDs in both consumer-grade applications (such as PC/laptop, nearline and game consoles) and enterprise storage solutions. Moreover, uncertainty that the spread of new COVID-19 variants pose, along with possible a deceleration in crypto-mining, may weigh on HDDs shipments and, by extension, platinum offtake.
Other
The adverse effect on the automotive sector, brought about by the chip shortage, is unlikely to be fully resolved until next year, but it is expected to ease gradually in the second half of 2021. As such, the delayed production is forecast to weigh on platinum demand in spark plugs and sensors in the coming months. As a result, while Other Industrial platinum demand is expected to grow 13% (+63 koz) this year, reaching 565 koz, the chip supply disruption will curb upside potential, meaning that the global total will fall short of 2019 levels.
Investment demand
Bar and coin investment is set to weaken sharply this year, by 38% (-225 koz) to 361 koz. The weakness reflects the impact of heavy liquidations in Japan at the start of the year, which contrasts sharply with another strong performance in North America.
This year, North America is forecast to post comfortably the highest regional total. There has been some bargain hunting on price dips, but ultimately investors have been keen to buy all the major precious metals. Looking ahead, we expect net buying to continue over the remainder of this year, but not at the same intensity compared with the first half.
ETF holdings grew by 137 koz in the first half of the year breaching 4 moz in the quarter for the first time on record. Some liquidations then emerged, taking the total back down to 3.9 moz as some investors took profit while others rotated in favour of mining equities (to benefit from healthy dividend yields). Overall, we expect global ETF holdings to rise by 110 koz this year, the smallest gain in three years following bumper inflows in 2019 and 2020 totalling 1.5 moz. Although the anticipated increase in 2021 is modest, this will nonetheless see ETF holdings very close to 4m by year-end.
At the end of June exchange stock stood at 740 koz up 82 koz from Q4’20 as the EFP premium continued to incentivise inflows and as market-makers’ risk departments maintained directives for higher levels of accessible warehouse stocks against futures positions. However, in July sizeable outflows emerged of 160 koz. This drawdown was driven by a combination of the EFP trading at a discount, leading to outflows, and an increase in demand for physical platinum in plate or bar form. For the rest of the year, we expect the market to shift back to a contango, with a positive EFP attracting inflows once again. In addition, the overhang of the pandemic will see risk departments retain current measures further supporting inflows. Overall, we forecast a net increase of 50 koz for the full year.
ABOVE GROUND STOCKS
We expect platinum to record a surplus of 190 koz in 2021 as supply recovers strongly, while demand edges just a fraction higher. We expect to see a 1.04 moz reversal from last year’s deficit position of -883 koz. Overall, this will result in above-ground stocks rising to 2,857 koz covering 4 months’ worth of demand.
The WPIC definition of above ground stocks is the year-end estimate of the cumulative platinum holdings not associated with exchange-traded funds, metal held by exchanges or working inventories of mining producers, refiners, fabricators or end-users.

Page 19 of 28
PLATINUM QUARTERLY Q2 2021
Prepared for World Platinum Investment Council by Metals Focus Limited (2019 onwards) and prior years by SFA (Oxford)
Table 2: Supply, demand and above ground stocks summary – annual comparison
2013 2014 2015 2016 2017 2018 2019 2020 2021f 2020/2019 Growth %
2021f/2020 Growth %
Platinum Supply-demand Balance (koz)
SUPPLY
Refined Production 6,070 4,875 6,160 6,045 6,130 6,125 6,100 4,989 6,047 -18% 21%
South Africa 4,355 3,135 4,480 4,265 4,385 4,470 4,399 3,298 4,402 -25% 33%
Zimbabwe 405 405 405 490 480 465 458 448 465 -2% 4%
North America 355 395 365 390 360 345 356 337 365 -5% 8%
Russia 740 740 710 715 720 665 716 704 621 -2% -12%
Other 215 200 200 185 185 180 170 202 194 19% -4%
Increase (-)/Decrease (+) in Producer Inventory -215 +350 +30 +30 +30 +10 +2 -84 -40 N/A N/A
Total Mining Supply 5,855 5,225 6,190 6,075 6,160 6,135 6,102 4,906 6,007 -20% 22%
Recycling 1,980 2,035 1,705 1,840 1,895 1,935 2,118 1,905 1,936 -10% 2%
Autocatalyst 1,120 1,255 1,185 1,210 1,325 1,420 1,584 1,427 1,454 -10% 2%
Jewellery 855 775 515 625 560 505 476 422 424 -11% 1%
Industrial 5 5 5 5 10 10 57 56 58 -2% 3%
Total Supply 7,835 7,260 7,895 7,915 8,055 8,070 8,220 6,811 7,943 -17% 17%
DEMAND
Automotive 3,130 3,245 3,245 3,350 3,290 3,075 2,838 2,366 2,895 -17% 22%
Autocatalyst 2,990 3,095 3,105 3,215 3,150 2,930 2,838 2,366 2,895 -17% 22%
Non-road 140 150 140 135 140 145 † † † † †
Jewellery 2,945 3,000 2,840 2,505 2,460 2,245 2,099 1,820 1,889 -13% 4%
Industrial 1,490 1,610 1,740 1,855 1,725 1,935 2,129 1,955 2,448 -8% 25%
Chemical 535 540 510 560 565 570 694 585 665 -16% 14%
Petroleum 50 60 205 215 100 235 219 109 179 -50% 65%
Electrical 195 215 205 195 210 205 144 130 134 -10% 3%
Glass 145 205 235 255 205 250 236 391 658 65% 69%
Medical and Biomedical 220 220 225 230 235 240 249 238 246 -4% 3%
Other 345 370 360 400 410 435 587 502 565 -14% 13%
Investment 935 150 305 535 275 15 1,253 1,554 521 24% -66%
Change in Bars, Coins -5 50 525 460 215 280 283 586 361 107% -38%
Change in ETF Holdings 905 215 -240 -10 105 -245 991 509 110 -49% -78%
Change in Stocks Held by Exchanges 35 -115 20 85 -45 -20 -20 458 50 N/A -89%
Total Demand 8,500 8,005 8,130 8,245 7,750 7,270 8,319 7,694 7,753 -8% 1%
Balance -665 -745 -235 -330 305 800 -99 -883 190 N/A N/A
Above Ground Stocks 3,475* 2,730 2,495 2,165 2,470 3,270 3,551** 2,667 2,857 -25% 7%
Source: Metals Focus 2019 - 2021, SFA (Oxford) 2013 - 2018.
Notes:
1. Above Ground Stocks: *4,140 koz as of 31st December 2012 (SFA (Oxford)). **3,650 koz as of 31 December 2018 (Metals Focus).
2. † Non-road automotive demand is included in autocatalyst demand.
3. Data from Metals Focus and SFA (Oxford) may not have been prepared on the same or directly comparable basis.
4. Prior to 2019 SFA data is independently rounded to the nearest 5 koz.

Page 20 of 28
PLATINUM QUARTERLY Q2 2021
Table 3: Supply and demand summary – quarterly comparison
Q2 2019
Q3 2019
Q4 2019
Q1 2020
Q2 2020
Q3 2020
Q4 2020
Q1 2021
Q2 2021
Q2’21/Q2’20 Growth %
Q2’21/Q1’21 Growth %
Platinum Supply-demand Balance (koz)
SUPPLY
Refined Production 1,666 1,532 1,581 1,248 942 1,496 1,303 1,468 1,557 65% 6%
South Africa 1,219 1,119 1,186 843 521 1,062 873 1,036 1,165 124% 13%
Zimbabwe 119 119 108 108 110 115 115 114 128 17% 12%
North America 99 79 94 98 87 71 82 83 75 -13% -10%
Russia 189 174 149 150 175 196 182 184 136 -22% -26%
Other 41 41 42 50 49 52 51 51 52 6% 3%
Increase (-)/Decrease (+) in Producer Inventory -26 -29 +45 +54 +25 -112 -51 -26 +34 37% N/A
Total Mining Supply 1,640 1,503 1,626 1,302 967 1,384 1,252 1,442 1,591 65% 10%
Recycling 548 516 522 436 368 525 577 493 477 30% -3%
Autocatalyst 415 386 387 353 257 389 428 361 365 42% 1%
Jewellery 119 116 121 70 97 121 134 118 98 1% -17%
Industrial 14 14 15 13 13 14 15 14 14 9% 3%
Total Supply 2,188 2,019 2,149 1,738 1,335 1,909 1,829 1,935 2,068 55% 7%
DEMAND
Automotive 736 668 681 638 379 639 710 715 664 75% -7%
Autocatalyst 736 668 681 638 379 639 710 715 664 75% -7%
Non-road † † † † † † † † † N/A N/A
Jewellery 535 529 496 393 388 510 529 477 461 19% -3%
Industrial 537 533 502 469 403 484 599 679 591 46% -13%
Chemical 205 162 190 176 112 124 174 119 204 83% 71%
Petroleum 55 55 55 33 18 21 36 35 40 121% 16%
Electrical 36 37 36 32 29 33 36 33 35 19% 6%
Glass 32 71 12 50 80 109 151 286 112 39% -61%
Medical and Biomedical 62 62 62 60 60 60 60 62 59 -2% -5%
Other 147 146 147 118 104 137 143 143 141 36% -2%
Investment 126 251 82 71 385 962 136 157 191 -50% 22%
Change in Bars, Coins 89 54 29 305 123 97 60 18 111 -10% >±300%
Change in ETF Holdings 50 207 47 -213 123 523 76 106 31 -75% -71%
Change in Stocks Held by Exchanges -13 -10 6 -20 138 342 -1 33 49 -65% 47%
Total Demand 1,934 1,981 1,761 1,571 1,555 2,595 1,974 2,028 1,907 23% -6%
Balance 254 37 388 167 -221 -685 -145 -93 161 N/A N/A
Source: Metals Focus 2019 - 2021, SFA (Oxford) 2018.
Notes:
1. † Non-road automotive demand is included in autocatalyst demand.
2. Data from Metals Focus and SFA (Oxford) may not have been prepared on the same or directly comparable basis.
3. Prior to 2019 SFA data is independently rounded to the nearest 5 koz.
Prepared for World Platinum Investment Council by Metals Focus Limited (2019 onwards) and prior years by SFA (Oxford)

Page 21 of 28
PLATINUM QUARTERLY Q2 2021
Table 4: Supply and demand summary – half-yearly comparison
H2 2018 H1 2019 H2 2019 H1 2020 H2 2020 H1 2021 H1’21/H1’20 Growth %
H1’21/H2’20 Growth %
Platinum Supply-demand Balance (koz)
SUPPLY
Refined Production 3,230 2,988 3,113 2,191 2,799 3,025 38% 8%
South Africa 2,400 2,094 2,305 1,364 1,934 2,201 61% 14%
Zimbabwe 240 230 228 218 230 243 12% 5%
North America 180 184 173 185 153 158 -14% 4%
Russia 325 393 324 325 379 320 -2% -15%
Other 85 87 83 99 103 103 4% 0%
Increase (-)/Decrease (+) in Producer Inventory -40 -14 +16 +79 -162 +8 -89% N/A
Total Mining Supply 3,190 2,973 3,129 2,269 2,637 3,033 34% 15%
Recycling 985 1,079 1,038 804 1,102 970 21% -12%
Autocatalyst 745 811 773 610 817 726 19% -11%
Jewellery 240 239 237 167 255 216 29% -15%
Industrial 0 29 29 27 29 29 7% -3%
Total Supply 4,175 4,053 4,167 3,073 3,738 4,004 30% 7%
DEMAND
Automotive 1,480 1,488 1,349 1,017 1,349 1,379 36% 2%
Autocatalyst 1,405 1,488 1,349 1,017 1,349 1,379 36% 2%
Non-road 75 † † † † † N/A N/A
Jewellery 1,110 1,074 1,025 780 1,039 939 20% -10%
Industrial 970 1,094 1,035 872 1,083 1,270 46% 17%
Chemical 290 343 351 287 298 324 13% 9%
Petroleum 110 109 109 51 57 75 46% 31%
Electrical 105 71 73 62 68 68 11% 0%
Glass 135 152 84 130 260 398 205% 53%
Medical and Biomedical 115 124 124 119 119 120 1% 1%
Other 215 294 293 222 280 285 28% 2%
Investment 0 921 333 456 1,098 348 -24% -68%
Change in Bars, Coins 120 200 82 428 158 129 -70% -18%
Change in ETF Holdings -110 737 254 -90 599 137 N/A -77%
Change in Stocks Held by Exchanges -10 -17 -4 118 341 82 -30% -76%
Total Demand 3,560 4,577 3,742 3,126 4,569 3,936 26% -14%
Balance 615 -524 425 -53 -830 68 N/A N/A
Source: Metals Focus 2019 - 2021, SFA (Oxford) 2018.
Notes:
1. † Non-road automotive demand is included in autocatalyst demand.
2. Data from Metals Focus and SFA (Oxford) may not have been prepared on the same or directly comparable basis.
3. Prior to 2019 SFA data is independently rounded to the nearest 5 koz.
Prepared for World Platinum Investment Council by Metals Focus Limited (2019 onwards) and prior years by SFA (Oxford)

Page 22 of 28
PLATINUM QUARTERLY Q2 2021
Table 5: Regional demand – annual and quarterly comparison
2013 2014 2015 2016 2017 2018 2019 2020 2021f 2020/2019
Growth %
2021f/2020
Growth %Q2
2020Q3
2020Q4
2020Q1
2021Q2
2021
Platinum gross demand (koz)
Automotive 3,135 3,240 3,250 3,345 3,280 3,065 2,838 2,366 2,895 -17% 22% 379 639 710 715 664
North America 425 465 480 410 375 355 340 297 Western Europe 1,350 1,395 1,450 1,635 1,550 1,330 1,444 1,079
Japan 585 585 510 450 435 430 303 242 China 130 125 145 195 230 220 185 280 India 165 170 180 170 175 195 †† ††
Rest of the World 480 500 485 485 515 535 566 467
Jewellery 2,945 3,000 2,840 2,505 2,460 2,245 2,099 1,820 1,889 -13% 4% 388 510 529 477 461
North America 200 230 250 265 280 280 341 277Western Europe 220 220 235 240 250 255 237 196
Japan 335 335 340 335 340 345 372 316China 1,990 1,975 1,765 1,450 1,340 1,095 871 832India 140 175 180 145 175 195 102 48
Rest of the World 60 65 70 70 75 75 176 151
Chemical 535 540 510 560 565 570 694 585 665 -16% 14% 112 124 174 119 204
North America 55 55 50 50 50 50 77 90 Western Europe 110 105 75 110 115 110 125 113
Japan 10 10 10 15 15 15 66 62 China 195 215 230 225 215 215 236 180
Rest of the World 165 155 145 160 170 180 190 141
Petroleum 50 60 205 215 100 235 219 109 179 -50% 65% 18 21 36 35 40
North America 40 25 -25 90 55 55 30 5 Western Europe -45 -20 70 10 5 20 14 11
Japan 10 -35 5 0 -40 5 7 6 China 80 -5 45 80 45 10 66 35
Rest of the World -35 95 110 35 35 145 103 52
Electrical 195 215 205 195 210 205 144 130 134 -10% 3% 29 33 36 33 35
North America 10 15 15 10 15 15 38 35 Western Europe 5 10 10 10 10 10 27 23
Japan 15 15 15 15 15 15 20 16 China 75 70 70 80 90 85 28 31
Rest of the World 90 105 95 80 80 80 31 25
Glass 145 205 235 255 205 250 236 391 658 65% 69% 80 109 151 286 112
North America 5 10 0 20 5 5 7 -20 Western Europe -10 15 10 5 5 35 59 25
Japan 0 -25 -5 -10 -10 0 -40 -88 China 90 115 130 150 110 80 180 365
Rest of the World 60 90 100 90 95 130 30 108
Medical 220 220 225 230 235 240 249 238 246 -4% 3% 60 60 60 62 59
Other industrial 345 370 360 400 410 435 587 502 565 -14% 13% 104 137 143 143 141
Bar & Coin Investment -5 50 525 460 215 280 283 586 361 107% -38% 123 97 60 18 111North America 159 242
Western Europe 52 75 Japan 46 240
Rest of the World 25 29
ETF Investment 905 215 -240 -10 105 -245 991 509 110 -49% -78% 123 523 76 106 31North America 125 526
Western Europe 509 237 Japan -13 58
Rest of the World 370 -312
Change in Stocks Held by Exchanges 35 -115 20 85 -45 -20 -20 458 50 N/A -89% 138 342 -1 33 49
Investment 935 150 305 535 275 15 1,253 1,554 521 24% -66% 385 962 136 157 191
Total Demand 8,505 8,000 8,135 8,240 7,740 7,260 8,319 7,694 7,753 -8% 1% 1,555 2,595 1,974 2,028 1,907
Source: Metals Focus 2019 - 2021, SFA (Oxford) 2013 - 2018.
Notes:
1. †† India automotive demand is included in Rest of the World.
3. Data from Metals Focus and SFA (Oxford) may not have been prepared on the same or directly comparable basis.
4. Prior to 2019 SFA data is independently rounded to the nearest 5 koz.
Prepared for World Platinum Investment Council by Metals Focus Limited (2019 onwards) and prior years by SFA (Oxford)

Page 23 of 28
PLATINUM QUARTERLY Q2 2021
Table 6: Regional recycling – annual and quarterly comparison
2013 2014 2015 2016 2017 2018 2019 2020 2021f 2020/2019
Growth %
2021f/2020
Growth %Q2
2020Q3
2020Q4
2020Q1
2021Q2
2021
Platinum recycling supply (koz)
Automotive 1,120 1,255 1,185 1,210 1,325 1,420 1,584 1,427 1,454 -10% 2% 257 389 428 361 365
North America 520 458
Western Europe 802 738
Japan 116 103
China 36 32
Rest of the World 111 96
Jewellery 855 775 515 625 560 505 476 422 424 -11% 1% 97 121 134 118 98
North America 3 3
Western Europe 4 4
Japan 187 162
China 276 248
Rest of the World 5 5
Industrial 5 5 5 5 10 10 57 56 58 -2% 3% 13 14 15 14 14
North America 3 3
Western Europe 11 10
Japan 34 34
China 7 7
Rest of the World 2 2
Source: Metals Focus 2019 - 2021, SFA (Oxford) 2013 - 2018.
Prepared for World Platinum Investment Council by Metals Focus Limited (2019 onwards) and prior years by SFA (Oxford)

Page 24 of 28
PLATINUM QUARTERLY Q2 2021
Prepared for World Platinum Investment Council by Metals Focus Limited
GLOSSARY OF TERMS
Above ground stocks
The year-end estimate of the cumulative platinum holdings not associated with exchange-traded funds, metal held by exchanges or working inventories of mining producers, refiners, fabricators or end-users. Typically, unpublished vaulted metal holdings from which a supply-demand shortfall can be readily supplied or to which a supply-demand surplus can readily flow.
ADH
Alkane dehydrogenation: catalytic conversion of alkanes to alkenes. Broad term encompassing BDH and PDH.
BDH
Butane dehydrogenation; catalytic conversion of isobutane to isobutylene.
Bharat
The Government of India introduced Bharat emission standards (BSES) to reduce and regulate the output of air pollutants from internal combustion and spark-ignition engine equipment, including motor vehicles.
Bharat Stage V/VI standards (BS-V, BS-VI)
Early in 2016 the Indian government announced the intention to ‘leapfrog’ Bharat Stage V and move directly to Bharat Stage VI, equivalent to Euro 6, in 2020.This intention, despite lockdown, has not been altered.
China Vehicle Emission Standards
China’s vehicle emission standards are set nationally by the Ministry of Environmental Protection and are regionally and locally enforced by Environmental Protection Bureaus. A number of cities and provinces in China continue the historic practice of early introduction of new standards.
China 6
As of December 2016, China adopted China 6 standards that apply nationwide to light-duty passenger vehicles from July 2020 (China 6a) and July 2023 (China 6b). These standards incorporate elements of Euro 6 and U.S. Tier 2 regulations for tailpipe and evaporative emissions. China 6b includes mandatory on-road emissions testing modelled after the EU RDE regulation (also known as Euro 6d TEMP) with a few enhancements and modifications. A number of cities and provinces adopted China 6b in July 2019 and many automakers have proceeded to adopt China 6b early for all their production.
China VI
In June 2018, China finalized China VI standards that will apply to new heavy-duty diesel vehicles nationwide in two stages. The first stage, China VI-a, originally targeted to have become applicable by July 2020 for new models but has been delayed by 6 months to January 2021, and all new HDVs targeted for compliance in July 2021. The second stage, China VI-b will apply to gas engines nationwide starting in January 2021 and all new HDVs in July 2023.
Compounds (Platinum based)
Platinum combines with other elements to form chemical mixtures that are used as catalysts in chemical processes as well as in plating, metal deposition and other industrial processes.
Diesel oxidation catalyst (DOC)
A DOC oxidises harmful carbon monoxide and unburnt hydrocarbons, produced by incomplete combustion of diesel fuel, to non-toxic carbon dioxide and water.
Diesel particulate filter (DPF) and catalysed diesel particulate filter (CDPF)
A DPF physically filters particulates (soot) from diesel exhaust. A CDPF adds a PGM catalyst coating to facilitate oxidation and removal of the soot. The terms are often used interchangeably.
Electrolysis of water
Water electrolysers are electrochemical devices used to split water molecules into hydrogen and oxygen. An electrical current is applied to the electrolyser cell, and water is split into oxygen and hydrogen. The electrolysis system comprises of the system, the stack and the cell.
Emissions Legislation
Regulations that necessitate the fitment of autocatalyst systems dealing with the treatment of vehicle tailpipe emissions such as carbon monoxide (CO), particulate matter, hydrocarbons and oxides of nitrogen (NOx). There are a range of standards specific to various regions and countries with varying minimum emissions targets and deadlines for compliance.
EPA
Environmental Protection Agency regulating the US vehicle and engine emission standards for pollutants.

Page 25 of 28
PLATINUM QUARTERLY Q2 2021
Prepared for World Platinum Investment Council by Metals Focus Limited
ETF
Exchange-traded fund. A security that tracks an index, commodity, or basket of assets. Platinum ETFs included in demand are backed by physical metal (LPPM good delivery bars stored in a secure vault approved by the listing exchange).
Euro V/VI emission standards
EU emission standards for heavy-duty vehicles. Euro V legislation was introduced in 2008-09 and Euro VI in 2013/2014; similar standards have later been adopted in some other countries.
Euro 5/6 emission standards
EU emission standards for light-duty vehicles. Euro 5 legislation was introduced in 2009-11 and Euro 6 in 2014/2015. The limits set in Euro 6 have remained unchanged, but the measuring methods have become more stringent progressively including Euro 6 a, b, c, d and Euro 6d-Temp, now in place. For CO2, the laboratory based WLTP and for NOx RDE.
FCM
Fuel Consumption Monitoring describes the recording of actual consumption during the life of the vehicle. Applicable under Euro 6d to all new vehicles from 1/01/2020 and all new registrations from 1/01/2021.
Forward prices
The price of a commodity at a future point in time. Typically comprises of the spot price as well as the risk-free interest rate and cost of carry.
GTL
Gas-to-liquids is a process that converts natural gas to liquid hydrocarbons such as gasoline or diesel fuel.
HAMR
Heat-Assisted Magnetic Recording. A magnetic recording technology which involves spot-heating the drive platters with laser beam.
HDD
Hard disk drive. Data storage device that stores digital data by magnetic platers.
HDV
Heavy-duty vehicle.
ICE
Internal combustion engine.
IoT
Internet of Things. Networking system that allows data to be sent to and received from objects and devices through internet.
ISC
In Service Conformity which requires vehicles to not only conform with exhaust emission standards when they are new but also while in use.
Jewellery alloys
The purity of platinum jewellery is invariably expressed in parts per 1,000. For example, the most common variant, pt950, is 95% fine platinum, with the rest of the jewellery alloy made up of other metals such as cobalt or copper. Different markets would typically prescribe the purity levels for qualification and hallmarking of the jewellery as platinum jewellery.
Jewellery demand
Captures the first transformation of unwrought platinum into a semi-finished or finished jewellery product.
Koz
Thousand ounces.
LCD
Liquid-crystal display used for video display.
LCV
Light commercial vehicle.
Lean NOx traps (LNT)
Platinum/rhodium-based, catalyses the chemical reduction of NOx in diesel engine exhaust to harmless nitrogen.
Lease rates
The lease rate is defined as the rate at which the owner of the commodity lends or sells it and buys it back from the borrower in the market.
Page 26 of 28
PLATINUM QUARTERLY Q2 2021
Prepared for World Platinum Investment Council by Metals Focus Limited
LPPM
The London Platinum and Palladium Market (LPPM) is a trade association representing the interests of the platinum and palladium market. It provides guidance and benchmarks on the form and governance of platinum and palladium delivered to the market and publishes a list of the companies that comply with the guidelines and purity. This list is known as the Good Delivery List. As at May 2020 the Good Delivery Lists consists of 31 platinum refiners, 28 palladium refiners, 15 full members, 41 associate members, 45 affiliate members and 2 affiliated exchange members.
MAMR
Microwave-Assisted Magnetic Recording. A magnetic recording technology by writing in the drive platters with a microwave field.
Metal-in-concentrate
PGMs contained in the concentrate produced after the crushing, milling and froth flotation processes in the concentrator. It is a measure of a mine’s output before the smelting and refining stages.
MLCC
Multi-layer ceramic capacitors. A number of individual thin film capacitors stacked as a whole.
moz
Million ounces.
NEDC
New European Driving Cycle vehicle emissions test set out in United Nations Vehicle Regulation 101 maintained by the United Nations Economic Commission for Europe and updated and reviewed from time to time. The WLTP is aimed to significantly enhance and replace this regulation.
Net demand
A measure of the requirement for new metal, i.e., net of recycling.
Non-road engines
Non-road engines are diesel engines used, for example, in construction, agricultural and mining equipment, often using engine and emissions technology similar to on-road heavy-duty diesel vehicles.
Ounce conversion
One metric tonne = 1,000 kilogrammes (kg) or 32,151 troy ounces.
oz
A unit of weight commonly used for precious metals. 1 troy oz = 31.103 grams.
PDH
Propane dehydrogenation, where propane is converted to propylene.
PEM Electrolyser Technology
One of four key water electrolyser technologies. The electrode on oxygen side (anode) contains iridium oxide while the electrode on hydrogen side (cathode) typically contains platinum. Transport layers are platinum-coated sintered porous titanium, and the bipolar plates would typically have platinum on with other metals.
PGMs
Platinum group metals.
PMR
Precious metals refinery.
Pricing benchmarks
A price for a commodity that is traded on a liquid market that is used as a reference for buyers and sellers. In the case of platinum, the most commonly referenced benchmark is the LBMA Platinum Price, which is administered and distributed by the London Metals Exchange. The LBMA Platinum Price is discovered through an auction process.
Producer inventory
As used in the supply-demand balance, the change in producer inventory is the difference between reported refined production and metal sales.
PX
Paraxylene is a chemical produced from petroleum naphtha extracted from crude oil using a platinum catalyst. This is used in the production of terephthalic acid which is used to manufacture polyester.
Refined production
Processed platinum output from refineries typically of a minimum 99.95% purity in the form of ingot, sponge or grain.
Page 27 of 28
PLATINUM QUARTERLY Q2 2021
Prepared for World Platinum Investment Council by Metals Focus Limited
RDE
The Real Driving Emissions (RDE) test measures the pollutants such as NOx, emitted by cars while driven on the road. It is in addition to laboratory tests. RDE testing was implemented in September 2017 for new types of cars and has applied to all registrations from September 2019.
Secondary supply
Covers the recovery of platinum from fabricated products, including unused trade stocks. Excludes scrap generated during manufacturing (known as production or process scrap). Autocatalyst and jewellery recycling are shown in the country where the scrap is generated, which may differ from where it is refined.
Selective catalytic reduction (SCR)
Selective Catalytic Reduction (SCR) is an emissions control technology system that injects a liquid-reductant agent (urea) into the outlet stream of a diesel engine. The automotive-grade urea, known by the trade name AdBlue. The system typically requires a platinum bearing DOC ahead of the SCR unit.
SGE
Shanghai Gold Exchange.
SSD
Solid-state drive. Data storage device that uses memory chips to store data, typically using flash memory.
Stage 4 regulations
Non-road mobile machinery (NRMM) is regulated by increasingly stringent regulations set out in tiers from Stage 1 to 5. This was last reviewed in May 2018 with deadlines set for 2020 and 2021. A submission by industry bodies requesting a delay in implementation as yet to be ruled on.
Three-way catalyst
Used in gasoline cars to remove hydrocarbons, carbon monoxide and NOx. Largely palladium-based now, they also include some rhodium.
US Vehicle Emission Standards
US vehicle and engine emission standards for pollutants, are established by the US Environmental Protection Agency (EPA) based on the Clean Air Act (CAA). The State of California has the right to introduce its own emission regulations. Engine and vehicle emission regulations are adopted by the California Air Resources Board (CARB), a regulatory body within the California EPA. Vehicles can in every year be certified in different emission classes, called “bins”. The fleet average emissions over all “bins” are then regulated and reduced from year to year. To achieve the required fleet average, every year more vehicles have to be registered in the lower bins.
Tier 3
Emission regulation issued by EPA. The regulation defines common targets until 2025 in the USA.
Tier 4 stage
Non-road mobile machinery (NRMM) is regulated by increasingly stringent regulations set out in tiers from Stage 1 to 5. This was last reviewed in May 2018 with deadlines set for 2020 and 2021. A submission by industry bodies requesting a delay in implementation yet to be ruled on.
Washcoat
The layer that contains the active catalytic materials, such as PGMs, that is applied on the inactive, often ceramic, substrate within an autocatalyst block or component.
WIP
Work in progress.
WLTP
Worldwide Harmonised Light Vehicle Test Procedure is a laboratory test to measure pollutant emissions and fuel consumption. WLTP replaces the New European Driving Cycle (NEDC). It became applicable to new car types from September 2017 and new registrations from September 2018.
WPIC
The World Platinum Investment Council.

Page 28 of 28
PLATINUM QUARTERLY Q2 2021
© World Platinum Investment Council Ltd 2021
IMPORTANT NOTICE AND DISCLAIMER: This publication is general and solely for educational purposes. The publisher, The World Platinum Investment Council, has been formed by the world’s leading platinum producers to develop the market for platinum investment demand. Its mission is to stimulate investor demand for physical platinum through both actionable insights and targeted development, providing investors with the information to support informed decisions regarding platinum and working with financial institutions and market participants to develop products and channels that investors need. No part of this report may be reproduced or distributed in any manner without attribution to the authors. The research for the period 2019 and 2020 attributed to Metals Focus in the publication is © Metals Focus Copyright reserved. All copyright and other intellectual property rights in the data and commentary contained in this report and attributed to Metals Focus, remain the property of Metals Focus, one of our third-party content providers, and no person other than Metals Focus shall be entitled to register any intellectual property rights in that information, or data herein. The analysis, data and other information attributed to Metals Focus reflect Metal Focus’ judgment as of the date of the document and are subject to change without notice. No part of the Metals Focus data or commentary shall be used for the specific purpose of accessing capital markets (fundraising) without the written permission of Metals Focus.
The research for the period 2013 to 2018 attributed to SFA in the publication is © SFA Copyright reserved. All copyright and other intellectual property rights in the data for the period 2013-2018 contained in this report remain the property of SFA, one of our third-party content providers, and no person other than SFA shall be entitled to register any intellectual property rights in the information, or data herein. The analysis, data and other information attributed to SFA reflect SFA’s judgment as of the date of the document. No part of the data or other information shall be used for the specific purpose of accessing capital markets (fundraising) without the written permission of SFA.
This publication is not, and should not be construed to be, an offer to sell or a solicitation of an offer to buy any security. With this publication, neither the publisher nor its content providers intend to transmit any order for, arrange for, advise on, act as agent in relation to, or otherwise facilitate any transaction involving securities or commodities regardless of whether such are otherwise referenced in it. This publication is not intended to provide tax, legal, or investment advice and nothing in it should be construed as a recommendation to buy, sell, or hold any investment or security or to engage in any investment strategy or transaction. Neither the publisher nor its content providers are, or purports to be, a broker-dealer, a registered investment advisor, or otherwise registered under the laws of the United States or the United Kingdom, including under the Financial Services and Markets Act 2000 or Senior Managers and Certifications Regime or by the Financial Conduct Authority.
This publication is not, and should not be construed to be, personalized investment advice directed to or appropriate for any particular investor. Any investment should be made only after consulting a professional investment advisor. You are solely responsible for determining whether any investment, investment strategy, security or related transaction is appropriate for you based on your investment objectives, financial circumstances and risk tolerance. You should consult your business, legal, tax or accounting advisors regarding your specific business, legal or tax situation or circumstances.
The information on which this publication is based is believed to be reliable. Nevertheless, neither the publisher nor its content providers can guarantee the accuracy or completeness of the information. This publication contains forward-looking statements, including statements regarding expected continual growth of the industry. The publisher and Metals Focus note that statements contained in the publication that look forward in time, which include everything other than historical information, involve risks and uncertainties that may affect actual results and neither the publisher nor its content providers accept any liability whatsoever for any loss or damage suffered by any person in reliance on the information in the publication.
The logos, services marks and trademarks of the World Platinum Investment Council are owned exclusively by it. All other trademarks used in this publication are the property of their respective trademark holders. The publisher is not affiliated, connected, or associated with, and is not sponsored, approved, or originated by, the trademark holders unless otherwise stated. No claim is made by the publisher to any rights in any third-party trademarks.
WPIC Research MiFID II Status
The World Platinum Investment Council (WPIC) has undertaken an internal and external review of its content and services for MiFID II. As a result, WPIC highlights the following to the recipients of its research services, and their Compliance/Legal departments:
WPIC research content falls clearly within the Minor Non-Monetary Benefit Category and can continue to be consumed by all asset managers free of charge. WPIC research can be freely shared across investment organisations.
WPIC does not conduct any financial instrument execution business. WPIC does not have any market making, sales trading, trading or share dealing activity. (No possible inducement).
WPIC content is disseminated widely and made available to all interested parties through a range of different channels, therefore qualifying as a “Minor Non-Monetary Benefit” under MiFID II (ESMA/FCA/AMF). WPIC research is made freely available through the WPIC website. WPIC does not have any permissioning requirements on research aggregation platforms.
WPIC does not, and will not seek, any payment from consumers of our research services. WPIC makes it clear to institutional investors that it does not seek payment from them for our freely available content.
More detailed information is available on the WPIC website: http://www.platinuminvestment.com/investment-research/mifid-ii