Q2 REPORT - Ovintiv Investor Relations
96
For the period ended June 30, 2019 2019 Q2 REPORT
-
Upload
khangminh22 -
Category
Documents
-
view
2 -
download
0
Transcript of Q2 REPORT - Ovintiv Investor Relations

For the period ended June 30, 2019
2019Q2 REPORT

news release Encana Reports 2019 Second Quarter Financial and Operating Results Company generates free cash flow and growing margins through cost management and strong production
Second quarter 2019 highlights:
Financial performance driven by strong liquids production and cost focus.o Net earnings of $336 million, or $0.24/share, with non-GAAP operating earnings of $290 million, or
$0.21/share.o Cash from operating activities of $906 million with non-GAAP cash flow of $877 million, or $0.64/share.o Non-GAAP free cash flow of $127 million.
Increased forecast for annualized G&A and operating cost synergies to $175 million from original $125 milliontarget.
Record oil and condensate production of 235 thousand barrels per day (Mbbls/d), and total production of 592thousand barrels of oil equivalent per day (MBOE/d).
Anadarko Basin production increased 18 MBOE/d proforma Q1 to Q2 to a record 163 MBOE/d. STACK well costs further reduced to $6.5 million, exceeding $1 million savings target by 40 percent. Permian Basin achieves record average quarterly production of 104 MBOE/d. Montney liquids production increased 55 percent year-to-date, Q2 liquids at 54 Mbbls/d. Total costs decreased to $12.78 per barrel of oil equivalent (BOE), increasing non-GAAP consolidated cash flow
margin of $16.27/BOE. Original guidance ranges for production and capital investments reiterated, post recent disposition of assets. Executing previously announced plan for $1.25 billion share buyback in 2019.
CALGARY, July 31, 2019 — Encana Corporation (NYSE, TSX: ECA) today announced its second quarter 2019 financial and operating results and plans to hold a conference call with analysts and investors today at 7 a.m. MT (9 a.m. ET). Please see dial-in details within this release. Additional details can be found on the Company’s website at www.encana.com.
“Encana is performing exceptionally well,” said Encana President & CEO Doug Suttles. “The combination of our high-quality portfolio and relentless focus on efficiency is delivering strong returns, growth and free cash flow.”
Second Quarter Summary
For the second quarter of 2019, Encana posted net earnings of $336 million, or $0.24/share. Non-GAAP operating earnings for the second quarter were $290 million, or $0.21/share.
Cash from operating activities in the second quarter was $906 million. Non-GAAP cash flow increased 50 percent over the comparable period in 2018 to $877 million, or $0.64/share. Non-GAAP cash flow in the second quarter was impacted by $19 million of restructuring and acquisition costs.
Through the end of the second quarter, the Company had repurchased 149.4 million Encana common shares at an average price of $6.94 per share. Investment in the program to date totals $1,037 million.
At the end of the second quarter, Encana had more than $3.4 billion of total liquidity including approximately $167 million in cash and cash equivalents.
Encana’s second quarter capital investment totaled $750 million, in line with beginning of the year expectations for a front-end loaded 2019 investment profile.
Suttles added, “Our business is growing and generating free cash flow and we are firmly on track to deliver on our capital investment outlook for this year. Our free cash flow is significant and will be used to fund the share buyback and strengthen our balance sheet.”
Encana Corporation2

3Encana Corporation
Q2 Report | For the period ended June 30, 2019
Second Quarter Production and Operating Highlights
Total production in the quarter was 591,800 barrels of oil equivalent per day (BOE/d), up 11 percent year-over-year on a proforma basis. Second quarter liquids production increased 16 percent year-over-year proforma, to about 324,000 barrels per day (bbls/d). Oil and condensate production during the period was 234,600 bbls/d.
Capital Investment and Production
Reportable (1) Proforma (2) (for the period ended June 30) Q2 2019 Q2 2018 Q2 2019 Q2 2018 Upstream Capital Expenditures ($ millions) 749 593 749 964
Oil (Mbbls/d) 179.3 84.6 179.3 166.8 NGLs – Plant Condensate (Mbbls/d) 55.3 33.7 55.3 39.3 NGLs – Other (Mbbls/d) 89.4 37.0 89.4 74.2 Oil and NGLs Total (Mbbls/d) 324.0 155.3 324.0 280.3 Natural gas (MMcf/d) 1,607 1,095 1,607 1,518 Total production (MBOE/d) 591.8 337.9 591.8 533.2
(1) Reportable includes Encana and Newfield Upstream capital and combined production volumes for Q2 2019. Q2 2018includes Encana’s capital and production as previously reported.
(2) Proforma includes Encana and Newfield Upstream capital and combined production volumes for both Q2 2019 and Q22018.
Permian Second quarter production in the Permian Basin averaged a record 104 MBOE/d (84 percent liquids). Encana continues to demonstrate efficiency gains with its four-rig program focused on cube development. A recent 14-well pad in Martin County, Texas, commenced production and is averaging 14,900 bbls/d after 90 days.
Anadarko Second quarter Anadarko Basin production achieved a record 163 MBOE/d. Recent significant growth is largely attributable to the 31 percent quarter-over-quarter increase in STACK oil production. Oil and condensate now accounts for about 37 percent of Anadarko Basin production volumes and averaged 60 Mbbls/d in the second quarter.
Importantly, Encana continued to enhance returns in STACK through additional reductions in completed well costs. Since closing the acquisition of Newfield in mid-February, well costs have been reduced by $1.4 million to $6.5 million (pre-Encana 2018 average was $7.9 million). Eighty-nine gross STACK wells in the Meramec completed year to date are tracking type curve including 18 gross cube-style wells that are showing strong oil productivity.
Montney Second quarter Montney production averaged 203 MBOE/d (27 percent liquids). Liquids production during the quarter averaged 54 Mbbls/d. Third-party outages and planned maintenance negatively impacted quarterly average production by about 6.8 MBOE/d. Cycle times were reduced by more than 10 percent quarter over quarter, averaging less than 70 days. Wells on production in the year are outperforming the oil and condensate type curve by approximately 25 percent.
Outlook At current commodity prices, Encana expects to generate significant free cash flow in the second half of 2019. Capital investment in the second half of 2019 is expected to be $500–$600 million per quarter with overall production of 565–585 MBOE/d, excluding volumes from Arkoma and China.
For more detailed information on the Company’s assets and second quarter results, please refer to the Corporate Presentation at https://www.encana.com/investors/.
Risk Management Program As of June 30, 2019, Encana has hedged approximately 154 Mbbls/d of expected oil and condensate production at an average price of $59.48 per barrel for the balance of 2019. The Company also has about 936 million cubic feet per day (MMcf/d) of its expected remaining 2019 natural gas production hedged at an average price of $2.73 per thousand cubic feet (Mcf). Encana has also hedged approximately 80 Mbbls/d of expected oil and condensate production at an average price of $57.05 per barrel for 2020. The Company also has about 490 MMcf/d of its expected 2020 natural gas production hedged at an average price of $2.71 per Mcf.
Encana Corporation4
Q2 Report | For the period ended June 30, 2019
Dividend Declared On July 30, 2019, the Board declared a dividend of $0.01875 per common share payable on September 30, 2019, to common shareholders of record as of September 13, 2019.
Conference Call Information A conference call and webcast to discuss the 2019 second quarter financial and operating results will be held today at 7 a.m. MT (9 a.m. ET). To participate, please dial 888-231-8191 (toll-free in North America) or 647-427-7450 (international)approximately 10 minutes prior to the conference call. The live audio webcast of the conference call, including slides, willalso be available on Encana's website, www.encana.com, under Investors/Presentations & Events. The webcast will bearchived for approximately 90 days.
Second Quarter Summary
(for the period ended June 30) ($ millions, except as indicated) Q2 2019 Q2 2018 Cash from (used in) operating activities Deduct (add back): Net change in other assets and liabilities Net change in non-cash working capital
906
(15) 44
475
(5) (106)
Non-GAAP cash flow1 877 586 Non-GAAP cash flow margin1 ($/BOE) 16.27 19.09
Non-GAAP cash flow1 877 586 Less: capital expenditures 750 595 Non-GAAP free cash flow1 127 (9)
Net earnings (loss) Before-tax (addition) deduction:
Unrealized gain (loss) on risk management Restructuring charges Non-operating foreign exchange gain (loss) Gain (loss) on divestitures
336
83 (17)
46 -
(151)
(326) -
(32) 1
Income tax 112 (66)
(357) 8
After-tax (addition) deduction 46 (349) Non-GAAP operating earnings1 290 198
(1) Non-GAAP cash flow, non-GAAP cash flow margin, non-GAAP free cash flow and non-GAAP operating earnings aredefined in Note 1.
Realized Pricing Summary
Q2 2019 Q2 2018 Liquids ($/bbl) WTI 59.82 67.88 Encana realized liquids prices1 Oil 60.14 58.00 NGLs – Plant Condensate 53.57 54.48 NGLs – Other 14.75 23.77 Natural gas NYMEX ($/MMBtu) 2.64 2.80 Encana realized natural gas price1 ($/Mcf) 2.22 3.03
(1) Prices include the impact of realized gain (loss) on risk management.

5Encana Corporation
Q2 Report | For the period ended June 30, 2019
Total Costs Summary
(for the period ended June 30) ($ per BOE) Q2 2019 Q2 2018 Production, Mineral and Other Taxes 1.36 1.13 Upstream Transportation and Processing 6.54 7.73 Upstream Operating1 3.40 3.40 Administrative1 1.48 1.36 Total Costs(2) ($/BOE) 12.78 13.62
(1) Excluding long-term incentive costs and restructuring costs.(2) Total costs are a non-GAAP measure as defined in note 1.
NOTE 1: Non-GAAP measures
Certain measures in this news release do not have any standardized meaning as prescribed by U.S. GAAP and, therefore, are considered non-GAAP measures. These measures may not be comparable to similar measures presented by other companies and should not be viewed as a substitute for measures reported under U.S. GAAP. These measures are commonly used in the oil and gas industry and/or by Encana to provide shareholders and potential investors with additional information regarding the Company’s liquidity and its ability to generate funds to finance its operations. For additional information regarding non-GAAP measures, see the Company’s website. This news release contains references to non-GAAP measures as follows:
Non-GAAP Cash Flow is a non-GAAP measure defined as cash from (used in) operating activities excluding netchange in other assets and liabilities, net change in non-cash working capital and current tax on sale of assets.Non-GAAP Cash Flow Margin is a non-GAAP measure defined as Non-GAAP Cash Flow per BOE ofproduction. Non-GAAP Free Cash Flow is a non-GAAP measure defined as Non-GAAP Cash Flow in excess ofcapital investment, excluding net acquisitions and divestitures.
Non-GAAP Operating Earnings (Loss) is a non-GAAP measure defined as net earnings (loss) excluding non-recurring or non-cash items that management believes reduces the comparability of the company's financialperformance between periods. These items may include, but are not limited to, unrealized gains/losses on riskmanagement, impairments, restructuring charges, non-operating foreign exchange gains/losses, gains/losses ondivestitures and gains on debt retirement. Income taxes may include valuation allowances and the provisionrelated to the pre-tax items listed, as well as income taxes related to divestitures and U.S. tax reform, andadjustments to normalize the effect of income taxes calculated using the estimated annual effective income taxrate.
Total Costs per BOE is a non-GAAP measure defined as the summation of production, mineral and other taxes,upstream transportation and processing expense, upstream operating expense and administrative expense,excluding the impact of long-term incentive and restructuring costs, per BOE of production. Management monitorsTotal Costs per BOE as a measure of operating performance.
ADVISORY REGARDING OIL AND GAS INFORMATION - The conversion of natural gas volumes to barrels of oil equivalent (BOE) is on the basis of six thousand cubic feet to one barrel. BOE is based on a generic energy equivalency conversion method primarily applicable at the burner tip and does not represent economic value equivalency at the wellhead. Readers are cautioned that BOE may be misleading, particularly if used in isolation.
ADVISORY REGARDING FORWARD-LOOKING STATEMENTS – This news release contains forward-looking statements or information (collectively, "FLS") within the meaning of applicable securities legislation, including Section 27A of the Securities Act of 1933, as amended, and Section 21E of the Securities Exchange Act of 1934, as amended. FLS include: meeting Encana’s annual guidance, including capital outlook, returns, free cash flow, production targets and liquids growth, and repeatable performance in future years; quality of asset portfolio and commitment to delivering shareholder value; estimated G&A synergies and additional savings in well costs; ability to generate free cash flow and amount and use thereof; amount and timing of share buyback; benefits of cube development; portfolio refinement and timing of closing thereof; and outcomes of risk management program. FLS involve assumptions, risks and uncertainties that may cause such statements not to occur or results to differ materially. These assumptions include: future commodity prices and differentials; assumptions in corporate guidance; data contained in key modeling statistics; availability of attractive hedges and enforceability of risk management program; access to transportation and processing facilities; and expectations and projections made in light of Encana's historical experience and its perception of historical trends. Risks and uncertainties include: integration of Newfield’s business and ability to achieve anticipated benefits; ability to generate sufficient cash flow to meet obligations; commodity price volatility; ability to secure adequate transportation and potential pipeline curtailments; variability and discretion to declare and pay dividends, if any; amount and timing of share

Encana Corporation6
Q2 Report | For the period ended June 30, 2019
repurchases; timing and costs of well, facilities and pipeline construction; business interruption, property and casualty losses or unexpected technical difficulties; counterparty and credit risk; impact of changes in credit rating and access to liquidity, including ability to issue commercial paper; currency and interest rates; risks inherent in Encana's corporate guidance; failure to achieve cost and efficiency initiatives; risks in marketing operations; risks associated with technology; changes in or interpretation of laws or regulations; risks associated with existing or potential lawsuits and regulatory actions; impact of disputes arising with partners, including suspension of certain obligations and inability to dispose of assets or interests in certain arrangements; ability to acquire or find additional reserves; imprecision of reserves estimates and estimates of recoverable quantities; and other risks and uncertainties as described in Encana’s Annual Report on Form 10-K and Quarterly Report on Form 10-Q and as described from time to time in Encana's other periodic filings as filed on SEDAR and EDGAR.
Although Encana believes such FLS are reasonable, there can be no assurance they will prove to be correct. The above assumptions, risks and uncertainties are not exhaustive. FLS are made as of the date hereof and, except as required by law, Encana undertakes no obligation to update or revise any FLS.
Further information on Encana Corporation is available on the company’s website, www.encana.com, or by contacting:
Investor contact: (281) 210-5110(403) 645-3550
Media contact: (281) 210-5253
SOURCE: Encana Corporation
7Encana Corporation
Q2 Report | For the period ended June 30, 2019
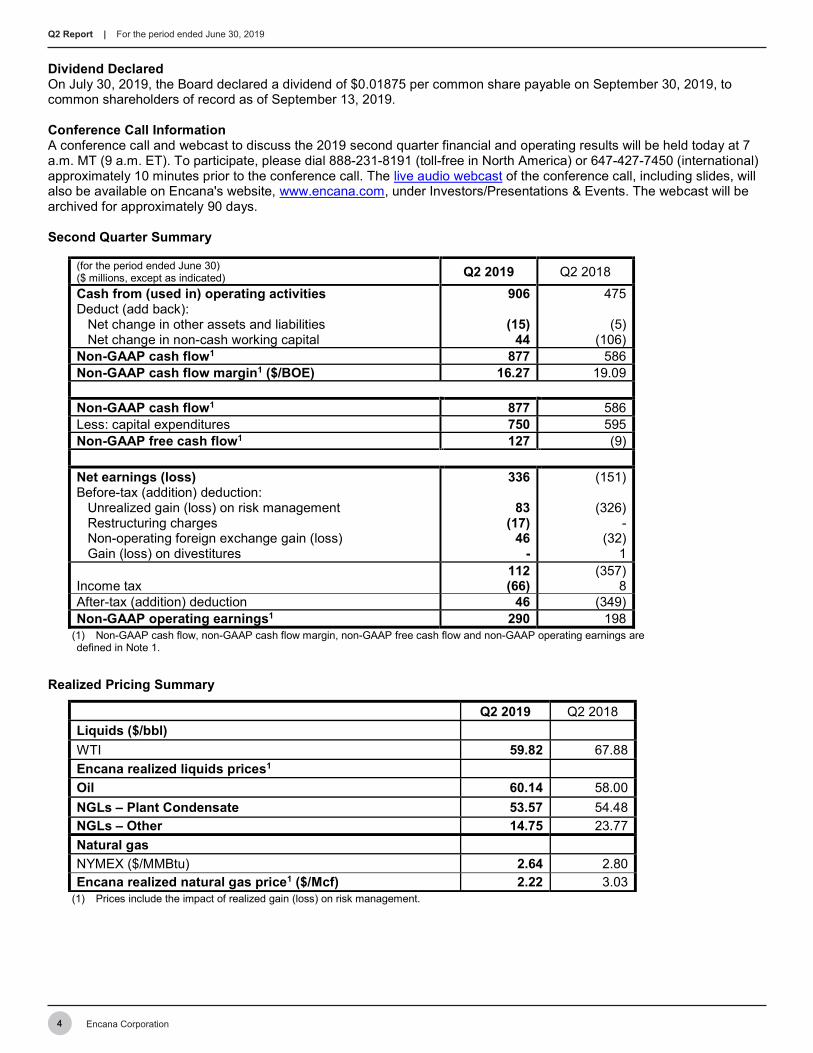
UNITED STATES SECURITIES AND EXCHANGE COMMISSION Washington, D.C. 20549
FORM 10-Q (Mark One) [X] QUARTERLY REPORT PURSUANT TO SECTION 13 OR 15(d) OF THE SECURITIES EXCHANGE ACT
OF 1934
For the quarterly period ended June 30, 2019
or
[ ] TRANSITION REPORT PURSUANT TO SECTION 13 OR 15(d) OF THE SECURITIES EXCHANGE ACT OF 1934
Commission file number 1-15226
ENCANA CORPORATION (Exact name of registrant as specified in its charter)
Canada 98-0355077(State or other jurisdiction of incorporation or organization) (I.R.S. Employer Identification No.)
Suite 4400, 500 Centre Street S.E., P.O. Box 2850, Calgary, Alberta, Canada, T2P 2S5 (Address of principal executive offices)
Registrant’s telephone number, including area code (403) 645-2000
Indicate by check mark whether the registrant (1) has filed all reports required to be filed by Section 13 or 15(d) of the Securities Exchange Act of 1934 during the preceding 12 months (or for such shorter period that the registrant was required to file such reports), and (2) has been subject to such filing requirements for the past 90 days. Yes [X] No [ ]
Indicate by check mark whether the registrant has submitted electronically every Interactive Data File required to be submitted pursuant to Rule 405 of Regulation S-T (§232.405 of this chapter) during the preceding 12 months (or for such shorter period that the registrant was required to submit such files). Yes [X] No [ ]
Indicate by check mark whether the registrant is a large accelerated filer, an accelerated filer, a non-accelerated filer, smaller reporting company, or an emerging growth company. See the definitions of “large accelerated filer,” “accelerated filer,” “smaller reporting company,” and “emerging growth company” in Rule 12b-2 of the Exchange Act.
Large accelerated filer [X] Accelerated filer [ ] Non-accelerated filer [ ] Smaller reporting company [ ]
Emerging growth company [ ]
If an emerging growth company, indicate by check mark if the registrant has elected not to use the extended transition period for complying with any new or revised financial accounting standards provided pursuant to Section 13(a) of the Exchange Act. [ ]
Indicate by check mark whether the registrant is a shell company (as defined in Rule 12b-2 of the Exchange Act).
Yes [ ] No [X]
Securities registered pursuant to Section 12(b) of the Act: Title of each class Trading Symbol(s) Name of each exchange on which registered Common Shares ECA New York Stock Exchange
Number of registrant’s common shares outstanding as of July 26, 2019 1,346,445,569

Encana Corporation8
Q2 Report | For the period ended June 30, 2019
ENCANA CORPORATION FORM 10-Q
TABLE OF CONTENTS
PART I
Item 1. Financial Statements 12 Condensed Consolidated Statement of Earnings 12 Condensed Consolidated Statement of Comprehensive Income 12 Condensed Consolidated Balance Sheet 13 Condensed Consolidated Statement of Changes in Shareholders’ Equity 14 Condensed Consolidated Statement of Cash Flows 16 Notes to Condensed Consolidated Financial Statements 17
Item 2. Management’s Discussion and Analysis of Financial Condition and Results of Operations 48 Item 3. Quantitative and Qualitative Disclosures about Market Risk 74 Item 4. Controls and Procedures 76
PART II
Item 1. Legal Proceedings 77 Item 1A. Risk Factors 77 Item 2. Unregistered Sales of Equity Securities and Use of Proceeds 77 Item 3. Defaults Upon Senior Securities 77 Item 4. Mine Safety Disclosures 77 Item 5. Other Information 77 Item 6. Exhibits 78 Signatures 79

9Encana Corporation
Q2 Report | For the period ended June 30, 2019
DEFINITIONS
Unless the context otherwise indicates, references to “us,” “we,” “our,” “ours,” “Encana” and the “Company” refer to Encana Corporation and its consolidated subsidiaries. In addition, the following are other abbreviations and definitions of certain terms used within this Quarterly Report on Form 10-Q:
“AECO” means Alberta Energy Company and is the Canadian benchmark price for natural gas. “ASU” means Accounting Standards Update. “bbl” or “bbls” means barrel or barrels. “BOE” means barrels of oil equivalent. “Btu” means British thermal units, a measure of heating value. “DD&A” means depreciation, depletion and amortization expenses. “FASB” means Financial Accounting Standards Board. “Mbbls/d” means thousand barrels per day. “MBOE/d” means thousand barrels of oil equivalent per day. “Mcf” means thousand cubic feet. “MD&A” means Management’s Discussion and Analysis of Financial Condition and Results of Operations. “MMBOE” means million barrels of oil equivalent. “MMBtu” means million Btu. “MMcf/d” means million cubic feet per day. “NCIB” means normal course issuer bid. “NGL” or “NGLs” means natural gas liquids. “NYMEX” means New York Mercantile Exchange. “NYSE” means New York Stock Exchange. “OPEC” means Organization of the Petroleum Exporting Countries. “SEC” means United States Securities and Exchange Commission. “TSX” means Toronto Stock Exchange. “U.S.”, “United States” or “USA” means United States of America. “U.S. GAAP” means U.S. Generally Accepted Accounting Principles. “WTI” means West Texas Intermediate.
CONVERSIONS
In this Quarterly Report on Form 10-Q, a conversion of natural gas volumes to BOE is on the basis of six Mcf to one bbl. BOE is based on a generic energy equivalency conversion method primarily applicable at the burner tip and does not represent economic value equivalency at the wellhead. Given that the value ratio based on the current price of oil as compared to natural gas is significantly different from the energy equivalency of 6:1, utilizing a conversion on a 6:1 basis may be misleading as an indication of value, particularly if used in isolation.
CONVENTIONS
Unless otherwise specified, all dollar amounts are expressed in U.S. dollars, all references to “dollars”, “$” or “US$” are to U.S. dollars and all references to “C$” are to Canadian dollars. All amounts are provided on a before tax basis, unless otherwise stated. In addition, all information provided herein is presented on an after royalties basis.
The term “liquids” is used to represent oil, NGLs and condensate. The term “liquids rich” is used to represent natural gas streams with associated liquids volumes. The term “play” is used to describe an area in which hydrocarbon accumulations or prospects of a given type occur. Encana’s focus of development is on hydrocarbon accumulations known to exist over a large

Encana Corporation10
Q2 Report | For the period ended June 30, 2019
areal expanse and/or thick vertical section and are developed using hydraulic fracturing. This type of development typically has a lower geological and/or commercial development risk and lower average decline rate, when compared to conventional development.
The term “core asset” refers to plays that are the focus of the Company’s current capital investment and development plan. The Company continually reviews funding for development of its plays based on strategic fit, profitability and portfolio diversity and, as such, the composition of plays identified as a core asset may change over time.
References to information contained on the Company’s website at www.encana.com are not incorporated by reference into, and does not constitute a part of, this Quarterly Report on Form 10-Q.
FORWARD-LOOKING STATEMENTS AND RISK
This Quarterly Report on Form 10-Q contains certain forward-looking statements or information (collectively, “forward-looking statements”) within the meaning of applicable securities legislation, including the United States Private Securities Litigation Reform Act of 1995. Forward-looking statements include: composition of the Company’s core assets, including allocation of capital and focus of development plans; growth in long-term shareholder value; vision of being a leading North American energy producer; statements with respect to the Company’s strategic objectives including capital allocation strategy, focus of investment, growth of high margin liquids volumes, operating and capital efficiencies and ability to preserve balance sheet strength; ability to deliver free cash flow and balance growth with return of capital to shareholders; ability to lower costs and improve efficiencies to achieve competitive advantage; ability to repeat and deploy successful practices across the Company’s multi-basin portfolio; statements with respect to the expected synergies of the Newfield acquisition; anticipated commodity prices; success of and benefits from technology and innovation, including cube development approach and advanced completion designs; ability to optimize well and completion designs; future well inventory; anticipated drilling, number of drilling rigs and the success thereof; anticipated drilling costs and cycle times; anticipated proceeds and future benefits from various joint venture, partnership and other agreements; estimates of reserves and resources; expected production and product types; statements regarding anticipated cash flow, non-GAAP cash flow margin and leverage ratios; anticipated cash and cash equivalents; anticipated hedging and outcomes of risk management program, including exposure to certain commodity prices and foreign exchange fluctuations, amount of hedged production, market access and physical sales locations; impact of changes in laws and regulations; compliance with environmental legislation and claims related to the purported causes and impact of climate change, and the costs therefrom; adequacy of provisions for abandonment and site reclamation costs; financial flexibility and discipline; ability to meet financial obligations, manage debt and financial ratios, finance growth and comply with financial covenants; impact to the Company as a result of changes to its credit rating; access to the Company’s credit facilities; planned dividend and the declaration and payment of future dividends, if any; the terms of the Company’s substantial issuer bid, including timing for launch and completion thereof, sources and availability of funding thereof, and price range and number of common shares Encana may purchase thereunder; adequacy of the Company’s provision for taxes and legal claims; projections and expectation of meeting the targets contained in the Company’s corporate guidance and related statements in respect of funding; ability to manage cost inflation and expected cost structures, including expected operating, transportation and processing and administrative expenses; competitiveness and pace of growth of the Company’s assets within North America and against its peers; outlook of oil and gas industry generally and impact of geopolitical environment; expected future interest expense; the Company’s commitments and obligations and anticipated payments thereunder; and the possible impact and timing of accounting pronouncements, rule changes and standards.
Readers are cautioned against unduly relying on forward-looking statements which, by their nature, involve numerous assumptions, risks and uncertainties that may cause such statements not to occur, or results to differ materially from those expressed or implied. These assumptions include: future commodity prices and differentials; foreign exchange rates; ability to access credit facilities and shelf prospectuses; assumptions contained in the Company’s corporate guidance, five-year plan and as specified herein; data contained in key modeling statistics; availability of attractive hedges and enforceability of risk management program; effectiveness of the Company’s drive to productivity and efficiencies; results from innovations; expectation that counterparties will fulfill their obligations under the gathering, midstream and marketing agreements; access to transportation and processing facilities where Encana operates; assumed tax, royalty and regulatory regimes; and expectations and projections made in light of, and generally consistent with, Encana’s historical experience and its perception of historical trends, including with respect to the pace of technological development, benefits achieved and general industry expectations.
11Encana Corporation
Q2 Report | For the period ended June 30, 2019
Risks and uncertainties that may affect these business outcomes include: ability to generate sufficient cash flow to meet obligations; commodity price volatility; ability to secure adequate transportation and potential pipeline curtailments; variability and discretion of Encana’s board of directors (the “Board of Directors”) to declare and pay dividends, if any; timing and costs of well, facilities and pipeline construction; business interruption, property and casualty losses or unexpected technical difficulties, including impact of weather; counterparty and credit risk; impact of a downgrade in credit rating and its impact on access to sources of liquidity; fluctuations in currency and interest rates; risks inherent in the Company’s corporate guidance; failure to achieve cost and efficiency initiatives; risks inherent in marketing operations; risks associated with technology; changes in or interpretation of royalty, tax, environmental, greenhouse gas, carbon, accounting and other laws or regulations; risks associated with existing and potential lawsuits and regulatory actions made against the Company; impact of disputes arising with its partners, including suspension of certain obligations and inability to dispose of assets or interests in certain arrangements; the Company’s ability to acquire or find additional reserves; imprecision of reserves estimates and estimates of recoverable quantities, including future net revenue estimates; risks associated with past and future acquisitions or divestitures of certain assets or other transactions or receipt of amounts contemplated under the transaction agreements (such transactions may include third-party capital investments, farm-outs or partnerships, which Encana may refer to from time to time as “partnerships” or “joint ventures” and the funds received in respect thereof which Encana may refer to from time to time as “proceeds”, “deferred purchase price” and/or “carry capital”, regardless of the legal form) as a result of various conditions not being met; and other risks described herein and in Item 1A. Risk Factors of the Annual Report on Form 10-K for the fiscal year ended December 31, 2018 (“2018 Annual Report on Form 10-K”) and risks and uncertainties impacting Encana's business as described from time to time in the Company's other periodic filings with the SEC.
Although the Company believes the expectations represented by such forward-looking statements are reasonable, there can be no assurance that such expectations will prove to be correct. Readers are cautioned that the assumptions, risks and uncertainties referenced above are not exhaustive. Forward-looking statements are made as of the date of this document and, except as required by law, the Company undertakes no obligation to update publicly or revise any forward-looking statements. The forward-looking statements contained in this Quarterly Report on Form 10-Q are expressly qualified by these cautionary statements.
The reader should read carefully the risk factors described herein and in Item 1A. Risk Factors of the 2018 Annual Report on Form 10-K for a description of certain risks that could, among other things, cause actual results to differ from these forward-looking statements.

12 Condensed Consolidated Financial StatementsPrepared in conformity with U.S. GAAP in US$
Q2 Report | For the period ended June 30, 2019
PART I
Item 1. Financial Statements
Condensed Consolidated Statement of Earnings (unaudited)
Three Months Ended Six Months Ended June 30, June 30,
(US$ millions, except per share amounts) 2019 2018 2019 2018
Revenues (Notes 3, 4) Product and service revenues $ 1,848 $ 1,277 $ 3,420 $ 2,537 Gains (losses) on risk management, net (Note 22) 190 (312 ) (165 ) (276 ) Sublease revenues 17 18 35 35 Total Revenues 2,055 983 3,290 2,296
Operating Expenses (Note 3) Production, mineral and other taxes 73 35 121 64 Transportation and processing (Note 11) 412 272 750 521 Operating (Notes 11, 19, 20) 187 137 352 248 Purchased product 222 248 520 521 Depreciation, depletion and amortization 532 300 909 575 Accretion of asset retirement obligation (Note 14) 10 8 19 16 Administrative (Notes 11, 18, 19, 20) 81 99 308 130 Total Operating Expenses 1,517 1,099 2,979 2,075
Operating Income (Loss) 538 (116 ) 311 221 Other (Income) Expenses
Interest (Note 5) 99 81 186 173 Foreign exchange (gain) loss, net (Notes 6, 22) (55 ) 25 (92 ) 116 (Gain) loss on divestitures, net - (1 ) 1 (4 ) Other (gains) losses, net (Notes 8, 20) (3 ) - 25 (3 ) Total Other (Income) Expenses 41 105 120 282
Net Earnings (Loss) Before Income Tax 497 (221 ) 191 (61 ) Income tax expense (recovery) (Note 7) 161 (70 ) 100 (61 )
Net Earnings (Loss) $ 336 $ (151 ) $ 91 $ -
Net Earnings (Loss) per Common Share Basic & Diluted (Note 15) $ 0.24 $ (0.16 ) $ 0.07 $ -
Weighted Average Common Shares Outstanding (millions) Basic & Diluted (Note 15) 1,381.0 960.0 1,301.2 965.7
Condensed Consolidated Statement of Comprehensive Income (unaudited)
Three Months Ended Six Months Ended June 30, June 30,
(US$ millions) 2019 2018 2019 2018
Net Earnings (Loss) $ 336 $ (151 ) $ 91 $ - Other Comprehensive Income (Loss), Net of Tax
Foreign currency translation adjustment (Note 16) 4 (25 ) 38 (1 ) Pension and other post-employment benefit plans (Notes 16, 20) (23 ) - (24 ) (1 )
Other Comprehensive Income (Loss) (19 ) (25 ) 14 (2 ) Comprehensive Income (Loss) $ 317 $ (176 ) $ 105 $ (2 )
See accompanying Notes to Condensed Consolidated Financial Statements

13Condensed Consolidated Financial StatementsPrepared in conformity with U.S. GAAP in US$ 13
Q2 Report | For the period ended June 30, 2019
Condensed Consolidated Balance Sheet (unaudited)
As at As at June 30, December 31,
(US$ millions) 2019 2018
Assets Current Assets
Cash and cash equivalents $ 167 $ 1,058 Accounts receivable and accrued revenues 1,195 789 Risk management (Notes 21, 22) 268 554 Income tax receivable 320 275
1,950 2,676 Property, Plant and Equipment, at cost: (Note 10)
Oil and natural gas properties, based on full cost accounting Proved properties 49,643 41,241 Unproved properties 4,155 3,730
Other (Note 2) 916 2,122 Property, plant and equipment 54,714 47,093 Less: Accumulated depreciation, depletion and amortization (39,434 ) (38,121 ) Property, plant and equipment, net (Note 3) 15,280 8,972
Restricted Cash (Note 8) 57 - Other Assets (Notes 2, 10, 11) 1,241 147 Risk Management (Notes 21, 22) 103 161 Deferred Income Taxes 515 835 Goodwill (Notes 3, 8) 2,601 2,553
(Note 3) $ 21,747 $ 15,344
Liabilities and Shareholders’ Equity Current Liabilities
Accounts payable and accrued liabilities $ 2,351 $ 1,490 Current portion of operating lease liabilities (Notes 2, 11) 87 - Income tax payable 1 1 Risk management (Notes 21, 22) 7 25 Current portion of long-term debt (Note 12) - 500
2,446 2,016 Long-Term Debt (Note 12) 7,052 3,698 Operating Lease Liabilities (Notes 2, 11) 1,000 - Other Liabilities and Provisions (Notes 2, 11, 13) 605 1,769 Risk Management (Notes 21, 22) 4 22 Asset Retirement Obligation (Note 14) 499 365 Deferred Income Taxes 126 27
11,732 7,897 Commitments and Contingencies (Note 24) Shareholders’ Equity
Share capital - authorized unlimited common shares 2019 issued and outstanding: 1,346.5 million shares (2018: 952.5 million shares) (Note 15) 7,318 4,656
Paid in surplus 1,358 1,358 Retained earnings 327 435 Accumulated other comprehensive income (Note 16) 1,012 998
Total Shareholders’ Equity 10,015 7,447 $ 21,747 $ 15,344
See accompanying Notes to Condensed Consolidated Financial Statements

14 Condensed Consolidated Financial StatementsPrepared in conformity with U.S. GAAP in US$
Q2 Report | For the period ended June 30, 2019
Condensed Consolidated Statement of Changes in Shareholders’ Equity (unaudited)
Three Months Ended June 30, 2019 (US$ millions) Share
Capital Paid in
Surplus
Retained Earnings
(Accumulated Deficit)
Accumulated Other
Comprehensive Income
Total Shareholders’
Equity
Balance, March 31, 2019 $ 7,827 $ 1,358 $ 144 $ 1,031 $ 10,360 Net Earnings (Loss) - - 336 - 336 Dividends on Common Shares ($0.01875 per share) (Note 15) - - (25 ) - (25 ) Common Shares Purchased under Normal Course Issuer Bid (Note 15) (509 ) - (128 ) - (637 ) Other Comprehensive Income (Loss) (Note 16) - - - (19 ) (19 ) Balance, June 30, 2019 $ 7,318 $ 1,358 $ 327 $ 1,012 $ 10,015
Three Months Ended June 30, 2018 (US$ millions) Share
Capital Paid in
Surplus
Retained Earnings
(Accumulated Deficit)
Accumulated Other
Comprehensive Income
Total Shareholders’
Equity
Balance, March 31, 2018 $ 4,707 $ 1,358 $ (354 ) $ 1,065 $ 6,776 Net Earnings (Loss) - - (151 ) - (151 ) Dividends on Common Shares ($0.015 per share) (Note 15) - - (14 ) - (14 ) Common Shares Purchased under Normal Course Issuer Bid (Note 15) (33 ) - (56 ) - (89 ) Common Shares Issued Under Dividend Reinvestment Plan (Note 15) - - - - - Other Comprehensive Income (Loss) (Note 16) - - - (25 ) (25 ) Balance, June 30, 2018 $ 4,674 $ 1,358 $ (575 ) $ 1,040 $ 6,497
See accompanying Notes to Condensed Consolidated Financial Statements
15Condensed Consolidated Financial StatementsPrepared in conformity with U.S. GAAP in US$ 15
Q2 Report | For the period ended June 30, 2019
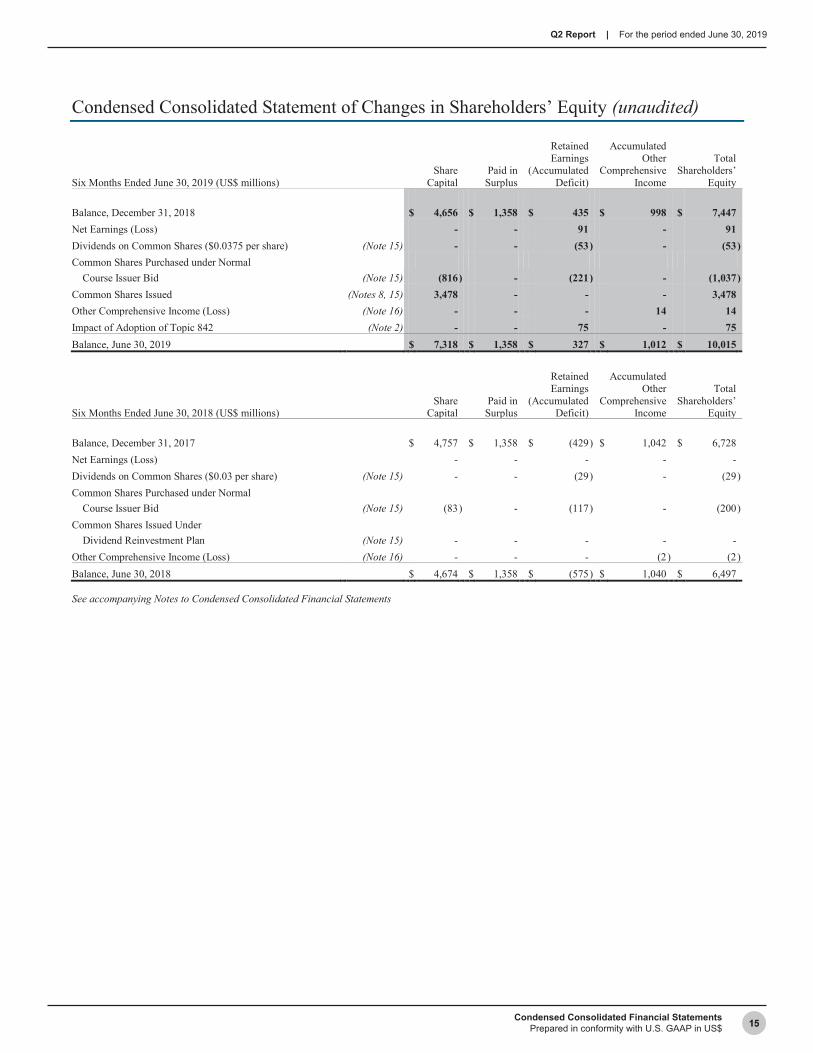
Condensed Consolidated Statement of Changes in Shareholders’ Equity (unaudited)
Six Months Ended June 30, 2019 (US$ millions) Share
Capital Paid in
Surplus
Retained Earnings
(Accumulated Deficit)
Accumulated Other
Comprehensive Income
Total Shareholders’
Equity
Balance, December 31, 2018 $ 4,656 $ 1,358 $ 435 $ 998 $ 7,447 Net Earnings (Loss) - - 91 - 91 Dividends on Common Shares ($0.0375 per share) (Note 15) - - (53 ) - (53 ) Common Shares Purchased under Normal Course Issuer Bid (Note 15) (816 ) - (221 ) - (1,037 ) Common Shares Issued (Notes 8, 15) 3,478 - - - 3,478 Other Comprehensive Income (Loss) (Note 16) - - - 14 14 Impact of Adoption of Topic 842 (Note 2) - - 75 - 75 Balance, June 30, 2019 $ 7,318 $ 1,358 $ 327 $ 1,012 $ 10,015
Six Months Ended June 30, 2018 (US$ millions) Share
Capital Paid in
Surplus
Retained Earnings
(Accumulated Deficit)
Accumulated Other
Comprehensive Income
Total Shareholders’
Equity
Balance, December 31, 2017 $ 4,757 $ 1,358 $ (429 ) $ 1,042 $ 6,728 Net Earnings (Loss) - - - - - Dividends on Common Shares ($0.03 per share) (Note 15) - - (29 ) - (29 ) Common Shares Purchased under Normal Course Issuer Bid (Note 15) (83 ) - (117 ) - (200 ) Common Shares Issued Under Dividend Reinvestment Plan (Note 15) - - - - - Other Comprehensive Income (Loss) (Note 16) - - - (2 ) (2 ) Balance, June 30, 2018 $ 4,674 $ 1,358 $ (575 ) $ 1,040 $ 6,497
See accompanying Notes to Condensed Consolidated Financial Statements

16 Condensed Consolidated Financial StatementsPrepared in conformity with U.S. GAAP in US$
Q2 Report | For the period ended June 30, 2019
Condensed Consolidated Statement of Cash Flows (unaudited)
Three Months Ended Six Months Ended June 30, June 30,
(US$ millions) 2019 2018 2019 2018
Operating Activities
Net earnings (loss) $ 336 $ (151 ) $ 91 $ -
Depreciation, depletion and amortization 532 300 909 575
Accretion of asset retirement obligation (Note 14) 10 8 19 16
Deferred income taxes (Note 7) 158 (6 ) 96 -
Unrealized (gain) loss on risk management (Note 22) (83 ) 326 344 258
Unrealized foreign exchange (gain) loss (Note 6) (35 ) 29 (60 ) 179
Foreign exchange on settlements (Note 6) (22 ) 4 (35 ) (46 )
(Gain) loss on divestitures, net - (1 ) 1 (4 )
Other (19 ) 77 (66 ) 8
Net change in other assets and liabilities (15 ) (5 ) (26 ) (16 )
Net change in non-cash working capital (Note 23) 44 (106 ) 162 (114 )
Cash From (Used in) Operating Activities 906 475 1,435 856
Investing Activities
Capital expenditures (Note 3) (750 ) (595 ) (1,486 ) (1,103 )
Acquisitions (Note 9) (19 ) - (41 ) (2 )
Corporate acquisition, net of cash and restricted cash acquired (Note 8) - - 94 -
Proceeds from divestitures (Note 9) 4 46 6 65
Net change in investments and other (30 ) 105 24 80
Cash From (Used in) Investing Activities (795 ) (444 ) (1,403 ) (960 )
Financing Activities
Net issuance (repayment) of revolving long-term debt (Note 12) 761 - 761 -
Repayment of long-term debt (Note 12) (500 ) - (500 ) -
Purchase of common shares (Note 15) (637 ) (89 ) (1,037 ) (200 )
Dividends on common shares (Note 15) (25 ) (14 ) (53 ) (29 )
Finance lease payments and other financing arrangements (Note 11) (21 ) (23 ) (41 ) (45 )
Cash From (Used in) Financing Activities (422 ) (126 ) (870 ) (274 )
Foreign Exchange Gain (Loss) on Cash, Cash Equivalents
and Restricted Cash Held in Foreign Currency 1 (2 ) 4 (5 )
Increase (Decrease) in Cash, Cash Equivalents and Restricted Cash (310 ) (97 ) (834 ) (383 )
Cash, Cash Equivalents and Restricted Cash, Beginning of Period 534 433 1,058 719
Cash, Cash Equivalents and Restricted Cash, End of Period $ 224 $ 336 $ 224 $ 336
Cash, End of Period $ 39 $ 24 $ 39 $ 24
Cash Equivalents, End of Period 128 312 128 312
Restricted Cash, End of Period 57 - 57 -
Cash, Cash Equivalents and Restricted Cash, End of Period $ 224 $ 336 $ 224 $ 336
See accompanying Notes to Condensed Consolidated Financial Statements

17Notes to Condensed Consolidated Financial StatementsPrepared in conformity with U.S. GAAP in US$
Q2 Report | For the period ended June 30, 2019
1. Basis of Presentation and Principles of Consolidation
Encana is in the business of the exploration for, the development of, and the production and marketing of oil, NGLs and natural gas.
The interim Condensed Consolidated Financial Statements include the accounts of Encana and entities in which it holds a controlling interest. All intercompany balances and transactions are eliminated on consolidation. Undivided interests in oil and natural gas exploration and production joint ventures and partnerships are consolidated on a proportionate basis. Investments in non-controlled entities over which Encana has the ability to exercise significant influence are accounted for using the equity method.
The interim Condensed Consolidated Financial Statements are prepared in conformity with U.S. GAAP and the rules and regulations of the SEC. Pursuant to these rules and regulations, certain information and disclosures normally required under U.S. GAAP have been condensed or have been disclosed on an annual basis only. Accordingly, the interim Condensed Consolidated Financial Statements should be read in conjunction with the annual audited Consolidated Financial Statements and the notes thereto for the year ended December 31, 2018, which are included in Item 8 of Encana’s 2018 Annual Report on Form 10-K.
The interim Condensed Consolidated Financial Statements have been prepared following the same accounting policies and methods of computation as the annual audited Consolidated Financial Statements for the year ended December 31, 2018, except as noted below in Note 2. The disclosures provided below are incremental to those included with the annual audited Consolidated Financial Statements.
These unaudited interim Condensed Consolidated Financial Statements reflect, in the opinion of Management, all normal and recurring adjustments necessary to present fairly the financial position and results of the Company as at and for the periods presented. Interim condensed consolidated financial results are not necessarily indicative of consolidated financial results expected for the fiscal year.
2. Recent Accounting Pronouncements
Changes in Accounting Policies and Practices
On January 1, 2019, Encana adopted ASC Topic 842, Leases (“Topic 842”) and related amendments, using the modified retrospective approach recognizing a cumulative effect adjustment at the beginning of the reporting period in which Topic 842 was applied. Results for reporting the periods beginning after January 1, 2019, are presented in accordance with Topic 842, while prior periods have not been restated and are reported in accordance with ASC Topic 840, Leases (“Topic 840”). On transition, Encana elected certain practical expedients permitted under Topic 842 which include:
• No reassessment of the classification of leases previously assessed under Topic 840, whether expired or existingcontracts contain leases, or initial direct costs of existing leases; and
• Application of Topic 842 prospectively to all new or modified land easements after January 1, 2019.
Encana also elected the short-term lease exemption, which does not require a right-of-use (“ROU”) asset or lease liability to be recognized on the Consolidated Balance Sheet when the lease term is 12 months or less. The policy and disclosures required under Topic 842 are included in Note 11, Leases.

18 Notes to Condensed Consolidated Financial StatementsPrepared in conformity with U.S. GAAP in US$
Q2 Report | For the period ended June 30, 2019
In accordance with Topic 842, Encana recognized a ROU asset and corresponding lease liability for all operating leases on the Consolidated Balance Sheet, other than leases with lease terms of 12 months or less. Prior to the adoption of Topic 842, operating leases were not recognized on the Consolidated Balance Sheet. There was no impact to finance leases on transition to Topic 842. The impact from recognizing operating leases on Encana’s Condensed Consolidated Balance Sheet is as follows:
Restated Reported as at Impact of Balances as at
(US$ millions) December 31, 2018 Adoption January 1, 2019
Property, Plant and Equipment, at cost: Oil and natural gas properties, based on full cost accounting
Proved properties $ 41,241 $ - $ 41,241 Unproved properties 3,730 - 3,730
Other 2,122 (1,261 ) 861 Property, plant and equipment 47,093 (1,261 ) 45,832 Less: accumulated depreciation, depletion and amortization (38,121 ) 128 (37,993 ) Property, plant and equipment, net 8,972 (1,133 ) (1 ) 7,839
Other Assets 147 1,015 (1), (2 ) 1,162 Deferred Income Taxes 835 (28 ) 807 Total Assets 15,344 (146 ) 15,198
Current Liabilities Accounts payable and accrued liabilities 1,490 (12 ) (1 ) 1,478 Current portion of operating lease liabilities - 67 (2 ) 67 Income tax payable 1 - 1 Risk management 25 - 25 Current portion of long-term debt 500 - 500
2,016 55 2,071
Operating Lease Liabilities - 948 (2 ) 948 Other Liabilities and Provisions 1,769 (1,224 ) (1 ) 545 Total Liabilities 7,897 (221 ) 7,676
Retained Earnings 435 75 (1 ) 510 Total Shareholders’ Equity 7,447 75 7,522 Total Liabilities and Shareholders’ Equity $ 15,344 $ (146 ) $ 15,198
(1) In accordance with Topic 840, Encana accounted for The Bow office building as a failed sales leaseback and at the effective date of January 1, 2019,The Bow office building remained as such. On transition to Topic 842, Encana re-assessed whether a sale would have occurred at the effective date and determined that a sale occurred. As a result, Encana derecognized the asset and financing liability resulting from the failed sale leaseback transactionmeasured under Topic 840, recognizing the difference as an adjustment to retained earnings in the Condensed Consolidated Balance Sheet. Upon transition to Topic 842, The Bow office building was determined to be an operating lease for which a ROU asset and corresponding liability was recordedat the present value of remaining minimum lease payments.
(2) ROU assets for operating leases are measured at the amount equal to the lease liability and the unamortized balance of any lease incentives prior to the transition date. The lease liabilities for operating leases were measured at the present value of the remaining minimum lease payments outstanding as atJanuary 1, 2019.
Although Topic 842 did not have a material impact on the Condensed Consolidated Statements of Earnings or Cash Flows, the change in the accounting of The Bow office building resulted in: i) operating lease expense under Topic 842 reported in administrative expense, whereas for the comparative periods presented under Topic 840, Encana recorded depreciation and interest expense in the Condensed Consolidated Statement of Earnings; and ii) cash outflows presented in cash used in operating activities under Topic 842, whereas for the comparative periods presented under Topic 840, interest and financing cash outflows are presented in cash used in operating activities and cash used in financing activities, respectively, in the Condensed Consolidated Statement of Cash Flows.
On January 1, 2019, Encana adopted ASU 2018-02 “Reclassification of Certain Tax Effects from Accumulated Other Comprehensive Income”. The amendments allow for a reclassification from accumulated other comprehensive income to retained earnings for stranded tax effects resulting from the Tax Cuts and Jobs Act (“U.S. Tax Reform”). While Encana has other post-employment benefit plans which were affected by the U.S. Tax Reform, the impact was not material to the Company’s Consolidated Financial Statements. As a result, the Company did not take the election provided in the amendment.

19Notes to Condensed Consolidated Financial StatementsPrepared in conformity with U.S. GAAP in US$
Q2 Report | For the period ended June 30, 2019
New Standards Issued Not Yet Adopted
As of January 1, 2020, Encana will be required to adopt ASU 2017-04, “Simplifying the Test for Goodwill Impairment”. The amendment eliminates the second step of the goodwill impairment test which requires the Company to measure the impairment based on the excess amount of the carrying value of the reporting unit’s goodwill over the implied fair value of its goodwill. Under this amendment, the goodwill impairment will be measured based on the excess amount of the reporting unit’s carrying value over its respective fair value. The amendment will be applied prospectively at the date of adoption. Encana does not expect the amendment to have a material impact on the Company’s Consolidated Financial Statements.
3. Segmented Information
Encana’s reportable segments are determined based on the Company’s operations and geographic locations as follows:
• Canadian Operations includes the exploration for, development of, and production of oil, NGLs and natural gas and otherrelated activities within the Canadian cost center.
• USA Operations includes the exploration for, development of, and production of oil, NGLs and natural gas and otherrelated activities within the U.S. cost center.
• China Operations includes the exploration for, development of, and production of oil, NGLs and natural gas and otherrelated activities within the China cost center.
• Market Optimization is primarily responsible for the sale of the Company’s proprietary production. These results arereported in the Canadian and USA Operations. Market optimization activities include third-party purchases and sales ofproduct to provide operational flexibility and cost mitigation for transportation commitments, product type, delivery pointsand customer diversification. These activities are reflected in the Market Optimization segment. Market Optimization sellssubstantially all of the Company’s upstream production to third-party customers. Transactions between segments are basedon market values and are eliminated on consolidation.
Corporate and Other mainly includes unrealized gains or losses recorded on derivative financial instruments. Once the instruments are settled, the realized gains and losses are recorded in the reporting segment to which the derivative instruments relate. Corporate and Other also includes amounts related to sublease rentals.
As of February 14, 2019, Encana’s segmented results reflect the business combination as discussed in Note 8.

20 Notes to Condensed Consolidated Financial StatementsPrepared in conformity with U.S. GAAP in US$
Q2 Report | For the period ended June 30, 2019
Results of Operations (For the three months ended June 30)
Segment and Geographic Information
Canadian Operations USA Operations China Operations 2019 2018 2019 2018 2019 2018
Revenues Product and service revenues $ 389 $ 379 $ 1,188 $ 607 $ 21 $ - Gains (losses) on risk management, net 67 73 41 (57 ) - - Sublease revenues - - - - - - Total Revenues 456 452 1,229 550 21 -
Operating Expenses Production, mineral and other taxes 4 4 69 31 - - Transportation and processing 217 207 136 31 - - Operating 27 35 148 84 8 - Depreciation, depletion and amortization 95 85 429 202 - - Total Operating Expenses 343 331 782 348 8 -
Operating Income (Loss) $ 113 $ 121 $ 447 $ 202 $ 13 $ -
Market Optimization Corporate & Other Consolidated 2019 2018 2019 2018 2019 2018
Revenues Product and service revenues $ 250 $ 291 $ - $ - $ 1,848 $ 1,277 Gains (losses) on risk management, net (1 ) (2 ) 83 (326 ) 190 (312 ) Sublease revenues - - 17 18 17 18 Total Revenues 249 289 100 (308 ) 2,055 983
Operating Expenses Production, mineral and other taxes - - - - 73 35 Transportation and processing 59 34 - - 412 272 Operating 5 13 (1 ) 5 187 137 Purchased product 222 248 - - 222 248 Depreciation, depletion and amortization - 1 8 12 532 300 Accretion of asset retirement obligation - - 10 8 10 8 Administrative - - 81 99 81 99 Total Operating Expenses 286 296 98 124 1,517 1,099
Operating Income (Loss) $ (37 ) $ (7 ) $ 2 $ (432 ) 538 (116 )
Other (Income) Expenses Interest 99 81 Foreign exchange (gain) loss, net (55 ) 25 (Gain) loss on divestitures, net - (1 ) Other (gains) losses, net (3 ) - Total Other (Income) Expenses 41 105
Net Earnings (Loss) Before Income Tax 497 (221 ) Income tax expense (recovery) 161 (70 )
Net Earnings (Loss) $ 336 $ (151 )
21Notes to Condensed Consolidated Financial StatementsPrepared in conformity with U.S. GAAP in US$
Q2 Report | For the period ended June 30, 2019
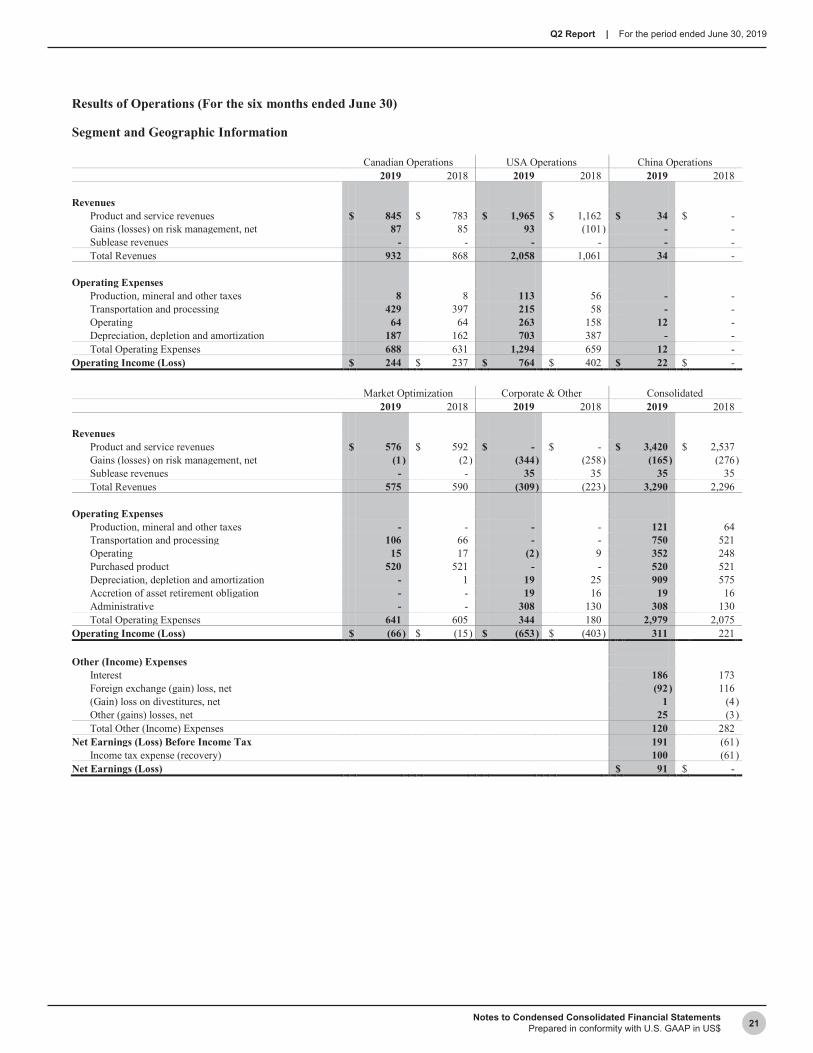
Results of Operations (For the six months ended June 30)
Segment and Geographic Information
Canadian Operations USA Operations China Operations 2019 2018 2019 2018 2019 2018
Revenues Product and service revenues $ 845 $ 783 $ 1,965 $ 1,162 $ 34 $ - Gains (losses) on risk management, net 87 85 93 (101 ) - - Sublease revenues - - - - - - Total Revenues 932 868 2,058 1,061 34 -
Operating Expenses Production, mineral and other taxes 8 8 113 56 - - Transportation and processing 429 397 215 58 - - Operating 64 64 263 158 12 - Depreciation, depletion and amortization 187 162 703 387 - - Total Operating Expenses 688 631 1,294 659 12 -
Operating Income (Loss) $ 244 $ 237 $ 764 $ 402 $ 22 $ -
Market Optimization Corporate & Other Consolidated 2019 2018 2019 2018 2019 2018
Revenues Product and service revenues $ 576 $ 592 $ - $ - $ 3,420 $ 2,537 Gains (losses) on risk management, net (1 ) (2 ) (344 ) (258 ) (165 ) (276 ) Sublease revenues - - 35 35 35 35 Total Revenues 575 590 (309 ) (223 ) 3,290 2,296
Operating Expenses Production, mineral and other taxes - - - - 121 64 Transportation and processing 106 66 - - 750 521 Operating 15 17 (2 ) 9 352 248 Purchased product 520 521 - - 520 521 Depreciation, depletion and amortization - 1 19 25 909 575 Accretion of asset retirement obligation - - 19 16 19 16 Administrative - - 308 130 308 130 Total Operating Expenses 641 605 344 180 2,979 2,075
Operating Income (Loss) $ (66 ) $ (15 ) $ (653 ) $ (403 ) 311 221
Other (Income) Expenses Interest 186 173 Foreign exchange (gain) loss, net (92 ) 116 (Gain) loss on divestitures, net 1 (4 ) Other (gains) losses, net 25 (3 ) Total Other (Income) Expenses 120 282
Net Earnings (Loss) Before Income Tax 191 (61 ) Income tax expense (recovery) 100 (61 )
Net Earnings (Loss) $ 91 $ -

22 Notes to Condensed Consolidated Financial StatementsPrepared in conformity with U.S. GAAP in US$
Q2 Report | For the period ended June 30, 2019
Intersegment Information
Market Optimization Marketing Sales Upstream Eliminations Total
For the three months ended June 30, 2019 2018 2019 2018 2019 2018
Revenues $ 2,135 $ 1,359 $ (1,886 ) $ (1,070 ) $ 249 $ 289
Operating Expenses Transportation and processing 153 109 (94 ) (75 ) 59 34 Operating 5 13 - - 5 13 Purchased product 2,015 1,243 (1,793 ) (995 ) 222 248 Depreciation, depletion and amortization - 1 - - - 1
Operating Income (Loss) $ (38 ) $ (7 ) $ 1 $ - $ (37 ) $ (7 )
Market Optimization Marketing Sales Upstream Eliminations Total
For the six months ended June 30, 2019 2018 2019 2018 2019 2018
Revenues $ 3,371 $ 2,690 $ (2,796 ) $ (2,100 ) $ 575 $ 590
Operating Expenses Transportation and processing 292 215 (186 ) (149 ) 106 66 Operating 15 17 - - 15 17 Purchased product 3,131 2,472 (2,611 ) (1,951 ) 520 521 Depreciation, depletion and amortization - 1 - - - 1
Operating Income (Loss) $ (67 ) $ (15 ) $ 1 $ - $ (66 ) $ (15 )
Capital Expenditures
Three Months Ended Six Months Ended June 30, June 30,
2019 2018 2019 2018
Canadian Operations $ 108 $ 211 $ 265 $ 379 USA Operations 641 382 1,218 720 Market Optimization - - - - Corporate & Other 1 2 3 4
$ 750 $ 595 $ 1,486 $ 1,103
Goodwill, Property, Plant and Equipment and Total Assets by Segment
Goodwill Property, Plant and Equipment Total Assets As at As at As at
June 30, December 31, June 30, December 31, June 30, December 31, 2019 2018 2019 2018 2019 2018
Canadian Operations $ 668 $ 640 $ 1,125 $ 999 $ 1,997 $ 1,852 USA Operations 1,933 1,913 13,914 6,591 16,822 9,104 China Operations (1) - - - - 70 - Market Optimization - - 1 1 242 295 Corporate & Other - - 240 1,381 2,616 4,093
$ 2,601 $ 2,553 $ 15,280 $ 8,972 $ 21,747 $ 15,344
(1) China Operations total assets includes $57 million in restricted cash, which has been segregated from general operating cash to fund future reclamation costs.

23Notes to Condensed Consolidated Financial StatementsPrepared in conformity with U.S. GAAP in US$
Q2 Report | For the period ended June 30, 2019
4. Revenues from Contracts with Customers
The following tables summarize the Company’s revenues from contracts with customers and other sources of revenues. Encana presents realized and unrealized gains and losses on certain derivative contracts within revenues.
Revenues (For the three months ended June 30)
Canadian Operations USA Operations China Operations 2019 2018 2019 2018 2019 2018
Revenues from Customers Product revenues (1)
Oil $ 2 $ 2 $ 947 $ 516 $ 21 $ - NGLs 230 216 136 71 - - Natural gas 158 164 105 29 - -
Service revenues Gathering and processing 2 2 2 - - -
Product and Service Revenues 392 384 1,190 616 21 -
Other Revenues Gains (losses) on risk management, net (2) 67 73 41 (57 ) - - Sublease revenues - - - - - - Other Revenues 67 73 41 (57 ) - -
Total Revenues $ 459 $ 457 $ 1,231 $ 559 $ 21 $ -
Market Optimization Corporate & Other Consolidated 2019 2018 2019 2018 2019 2018
Revenues from Customers Product revenues (1)
Oil $ 38 $ 28 $ - $ - $ 1,008 $ 546 NGLs 1 3 - - 367 290 Natural gas 206 246 - - 469 439
Service revenues Gathering and processing - - - - 4 2
Product and Service Revenues 245 277 - - 1,848 1,277
Other Revenues Gains (losses) on risk management, net (2) (1 ) (2 ) 83 (326 ) 190 (312 ) Sublease revenues - - 17 18 17 18 Other Revenues (1 ) (2 ) 100 (308 ) 207 (294 )
Total Revenues $ 244 $ 275 $ 100 $ (308 ) $ 2,055 $ 983
(1) Includes revenues from production and revenues of product purchased from third parties, but excludes intercompany marketing fees transacted betweenthe Company’s operating segments.
(2) Canadian Operations, USA Operations and Market Optimization include realized gains (losses) on risk management. Corporate and Other includesunrealized gains (losses) on risk management.

24 Notes to Condensed Consolidated Financial StatementsPrepared in conformity with U.S. GAAP in US$
Q2 Report | For the period ended June 30, 2019
Revenues (For the six months ended June 30)
Canadian Operations USA Operations China Operations 2019 2018 2019 2018 2019 2018
Revenues from Customers Product revenues (1)
Oil $ 3 $ 5 $ 1,556 $ 989 $ 34 $ - NGLs 434 396 233 123 - - Natural gas 413 385 181 61 - -
Service revenues Gathering and processing 2 4 3 - - -
Product and Service Revenues 852 790 1,973 1,173 34 -
Other Revenues Gains (losses) on risk management, net (2) 87 85 93 (101 ) - - Sublease revenues - - - - - - Other Revenues 87 85 93 (101 ) - -
Total Revenues $ 939 $ 875 $ 2,066 $ 1,072 $ 34 $ -
Market Optimization Corporate & Other Consolidated 2019 2018 2019 2018 2019 2018
Revenues from Customers Product revenues (1)
Oil $ 98 $ 50 $ - $ - $ 1,691 $ 1,044 NGLs 4 5 - - 671 524 Natural gas 459 519 - - 1,053 965
Service revenues Gathering and processing - - - - 5 4
Product and Service Revenues 561 574 - - 3,420 2,537
Other Revenues Gains (losses) on risk management, net (2) (1 ) (2 ) (344 ) (258 ) (165 ) (276 ) Sublease revenues - - 35 35 35 35 Other Revenues (1 ) (2 ) (309 ) (223 ) (130 ) (241 )
Total Revenues $ 560 $ 572 $ (309 ) $ (223 ) $ 3,290 $ 2,296
(1) Includes revenues from production and revenues of product purchased from third parties, but excludes intercompany marketing fees transacted betweenthe Company’s operating segments.
(2) Canadian Operations, USA Operations and Market Optimization include realized gains (losses) on risk management. Corporate and Other includesunrealized gains (losses) on risk management.
The Company’s revenues from contracts with customers consists of product sales including oil, NGLs and natural gas, as well as the provision of gathering and processing services to third parties. Encana had no contract asset or liability balances during the periods presented. As at June 30, 2019, receivables and accrued revenues from contracts with customers were $1,008 million ($662 million as at December 31, 2018).
Encana’s product sales are sold under short-term contracts with terms that are less than one year at either fixed or market index prices or under long-term contracts exceeding one year at market index prices.
The Company’s gathering and processing services are provided on an interruptible basis with transaction prices that are for fixed prices and/or variable consideration. Variable consideration received is related to recovery of plant operating costs or escalation of the fixed price based on a consumer price index. As the service contracts are interruptible, with service provided on an “as available” basis, there are no unsatisfied performance obligations remaining at June 30, 2019.

25Notes to Condensed Consolidated Financial StatementsPrepared in conformity with U.S. GAAP in US$
Q2 Report | For the period ended June 30, 2019
As at June 30, 2019, all remaining performance obligations are priced at market index prices or are variable volume delivery contracts. As such, the variable consideration is allocated entirely to the wholly unsatisfied performance obligation or promise to deliver units of production, and revenue is recognized at the amount for which the Company has the right to invoice the product delivered. As the period between when the product sales are transferred and Encana receives payments is generally 30 to 60 days, there is no financing element associated with customer contracts. In addition, Encana does not disclose unsatisfied performance obligations for customer contracts with terms less than 12 months.
5. Interest
Three Months Ended Six Months Ended June 30, June 30,
2019 2018 2019 2018
Interest Expense on: Debt $ 93 $ 67 $ 175 $ 133 The Bow office building (See Note 2) - 16 - 32 Finance leases (See Note 11) 4 4 7 9 Other 2 (6 ) 4 (1 )
$ 99 $ 81 $ 186 $ 173
Upon adoption of Topic 842 on January 1, 2019, The Bow office building was determined to be an operating lease with lease costs recognized in administrative expense. Previously, payments related to The Bow were recognized as interest expense and principal repayments. See Notes 2 and 11 for further information.
For the three and six months ended June 30, 2018, other included $11 million of interest recovered due to the resolution of certain tax items relating to prior taxation years.
6. Foreign Exchange (Gain) Loss, Net
Three Months Ended Six Months Ended June 30, June 30,
2019 2018 2019 2018
Unrealized Foreign Exchange (Gain) Loss on: Translation of U.S. dollar financing debt issued from Canada $ (92 ) $ 90 $ (185 ) $ 212 Translation of U.S. dollar risk management contracts issued from Canada (7 ) 1 (18 ) 10 Translation of intercompany notes 64 (62 ) 143 (43 )
(35 ) 29 (60 ) 179 Foreign Exchange on Settlements of:
U.S. dollar financing debt issued from Canada (11 ) 1 (12 ) 1 U.S. dollar risk management contracts issued from Canada 1 (3 ) 1 (10 ) Intercompany notes (11 ) 3 (23 ) (47 )
Other Monetary Revaluations 1 (5 ) 2 (7 ) $ (55 ) $ 25 $ (92 ) $ 116

26 Notes to Condensed Consolidated Financial StatementsPrepared in conformity with U.S. GAAP in US$
Q2 Report | For the period ended June 30, 2019
7. Income Taxes
Three Months Ended Six Months Ended June 30, June 30,
2019 2018 2019 2018
Current Tax Canada $ 2 $ (66 ) $ 2 $ (66 ) United States 1 1 2 2 Other Countries - 1 - 3
Total Current Tax Expense (Recovery) 3 (64 ) 4 (61 )
Deferred Tax Canada 72 (25 ) 34 (28 ) United States 85 3 61 7 Other Countries 1 16 1 21
Total Deferred Tax Expense (Recovery) 158 (6 ) 96 - Income Tax Expense (Recovery) $ 161 $ (70 ) $ 100 $ (61 ) Effective Tax Rate 32.4 % 31.7 % 52.4 % 100.0 %
Encana’s interim income tax expense is determined using the estimated annual effective income tax rate applied to year-to-date net earnings before income tax plus the effect of legislative changes and amounts in respect of prior periods. The estimated annual effective income tax rate is impacted by expected annual earnings, income tax related to foreign operations, the effect of legislative changes, non-taxable capital gains and losses, tax differences on divestitures and transactions, and partnership tax allocations in excess of funding.
On June 28, 2019, Alberta Bill 3, the Job Creation Tax Cut (Alberta Corporate Tax Amendment) Act, was signed into law resulting in a reduction of the Alberta corporate tax rate from 12 percent to 11 percent effective July 1, 2019, with further one percent rate reductions to take effect every year on January 1 until the general corporate tax rate is eight percent on January 1, 2022. During the three months ended June 30, 2019, the deferred tax expense of $158 million includes an adjustment of $55 million resulting from the re-measurement of the Company’s deferred tax position due to the Alberta tax rate reduction.
During the three and six months ended June 30, 2019, the current income tax expense was primarily due to amounts recorded in respect of prior periods. During the three and six months ended June 30, 2018, the current income tax recovery was primarily due to the resolution of certain tax items relating to prior taxation years. During the three and six months ended June 30, 2019, the deferred tax expense was primarily due to net earnings before income tax in the period and the impact of the Alberta tax rate reduction discussed above.
The effective tax rate of 52.4 percent for the six months ended June 30, 2019 is higher than the Canadian statutory tax rate of 26.6 percent primarily due to the re-measurement of the Company’s deferred tax position resulting from the Alberta tax rate reduction. The effective tax rate of 100 percent for the six months ended June 30, 2018, was higher than the Canadian statutory tax rate of 27 percent primarily due to the resolution of certain tax items relating to prior taxation years.
8. Business Combination
Newfield Exploration Company Acquisition
On February 13, 2019, Encana completed the business combination with Newfield Exploration Company, a Delaware corporation (“Newfield”), pursuant to its Agreement and Plan of Merger with Newfield (the “Merger”). As a result of the Merger, Newfield stockholders received 2.6719 Encana common shares for each share of Newfield common stock that was issued and outstanding immediately prior to the effective date of the Merger. Encana issued approximately 543.4 million common shares representing a value of $3.5 billion and paid approximately $5 million in cash in respect of Newfield’s cash-settled incentive awards. Following the acquisition, Newfield’s senior notes totaling $2.45 billion remained outstanding. Transaction costs of approximately $33 million were included in other (gains) losses, net.

27Notes to Condensed Consolidated Financial StatementsPrepared in conformity with U.S. GAAP in US$
Q2 Report | For the period ended June 30, 2019
Newfield’s operations focused on the exploration and development of oil and gas properties located in the Anadarko and Arkoma Basins of Oklahoma, the Williston Basin of North Dakota and the Uinta Basin of Utah, as well as offshore oil assets located in China. The assets acquired generated revenues of $947 million and net earnings of $44 million for the period from February 14, 2019 to June 30, 2019. The results of Newfield’s operations have been included in Encana’s Consolidated Financial Statements as of February 14, 2019.
Purchase Price Allocation
The transaction was accounted for under the acquisition method, which requires that the assets acquired and liabilities assumed be recognized at their fair values as of the acquisition date, with any excess of the purchase price over the estimated fair value of identified net assets acquired recorded as goodwill. The purchase price allocation represents the consideration paid and the fair values of the assets acquired, and liabilities assumed as of the acquisition date. The purchase price allocation is subject to change based on information that may not yet be available, including, the valuation of any pre-acquisition contingencies, final appraisals and tax returns that provide the underlying tax basis of the net assets and liabilities acquired and uncertain tax positions. The Company expects the purchase price allocation to be completed within 12 months following the acquisition date, during which time the value of the net assets and liabilities acquired may be revised as appropriate.
Preliminary Purchase Price Allocation
Consideration: Fair value of Encana's common shares issued (1) $ 3,478 Fair value of Newfield liability awards paid in cash (2) 5
Total Consideration $ 3,483
Assets Acquired: Cash and cash equivalents $ 46 Accounts receivable and accrued revenues 486 Other current assets 50 Proved properties 5,903 Unproved properties 838 Other property, plant and equipment 22 Restricted cash 53 Other assets 105 Goodwill (3) 20
Liabilities Assumed: Accounts payable and accrued liabilities (3) (793 ) Long-term debt (2,603 ) Operating lease liabilities (76 ) Other long-term liabilities (3) (60 ) Asset retirement obligation (184 ) Deferred income taxes (3) (324 )
Total Purchase Price $ 3,483
(1) The fair value was based on the NYSE closing price of the Encana common shares of $6.40 on February 13, 2019.(2) The fair value was based on a price of $6.50 per notional unit which was determined using a volume-weighted average of the trading price of Encana
common shares on the NYSE on each of the five consecutive trading days ending on the trading day that was three trading days prior to February 13, 2019.(3) During the three months ended June 30, 2019, additional information related to pre-acquisition liabilities and contingencies was obtained resulting in a
measurement period adjustment. Changes in the fair value estimates comprised an increase in other liabilities of $9 million, of which the total liability is presented in accounts payable and accrued liabilities, a decrease in deferred tax liabilities of $2 million and a corresponding increase in goodwill of $7 million.
The Company used the income approach valuation technique for the fair value of assets acquired and liabilities assumed. The carrying amounts of cash and cash equivalents, accounts receivable and accrued revenues, restricted cash and other current assets, and accounts payable and accrued liabilities approximate their fair values due their nature and/or the short-term maturity of the instruments. The fair values of long-term debt, ROU assets and operating lease liabilities were categorized within Level 2 of the fair value hierarchy and were determined using quoted prices and rates from an available pricing source. The fair values of the proved and unproved properties, other property, plant and equipment, other assets, other long-term liabilities and asset retirement obligation were categorized within Level 3 and were determined using relevant market assumptions, including discount rates, future commodity prices and costs, timing of development activities, projections of oil and gas reserves, and estimates for abandonment and reclamation.

28 Notes to Condensed Consolidated Financial StatementsPrepared in conformity with U.S. GAAP in US$
Q2 Report | For the period ended June 30, 2019
Goodwill arose from the Newfield acquisition primarily from the requirement to recognize deferred taxes on the difference between the fair value of the assets acquired and liabilities assumed and the respective carry-over tax basis. Goodwill is not amortized and is not deductible for tax purposes.
Unaudited Pro Forma Financial Information
The following unaudited pro forma financial information combines the historical financial results of Encana with Newfield and has been prepared as though the acquisition had occurred on January 1, 2018. The pro forma information is not intended to reflect the actual results of operations that would have occurred if the business combination had been completed at the date indicated. In addition, the pro forma information is not intended to be a projection of Encana’s results of operations for any future period.
Additionally, pro forma earnings were adjusted to exclude acquisition-related costs incurred of approximately $71 million and severance payments made to employees which totaled $130 million for the six months ended June 30, 2019. The pro forma financial information does not include any cost savings or other synergies that may result from the Merger or any estimated costs that have been or will be incurred to integrate the assets.
For the six months ended June 30, (US$ millions, except per share amounts) 2019 2018
Revenues $ 3,570 $ 3,299 Net Earnings (Loss) $ 231 $ 98
Net Earnings (Loss) per Common Share Basic & Diluted $ 0.18 $ 0.06
9. Acquisitions and Divestitures
Three Months Ended Six Months Ended June 30, June 30,
2019 2018 2019 2018
Acquisitions Canadian Operations $ - $ - $ - $ 2 USA Operations 19 - 41 - Total Acquisitions 19 - 41 2
Divestitures Canadian Operations (1 ) (44 ) - (57 ) USA Operations (3 ) (2 ) (6 ) (8 ) Total Divestitures (4 ) (46 ) (6 ) (65 )
Net Acquisitions & (Divestitures) $ 15 $ (46 ) $ 35 $ (63 )
Acquisitions
For the six months ended June 30, 2019, acquisitions in the Canadian and USA Operations were nil (2018 - $2 million) and $41 million (2018 - nil), respectively, which primarily included seismic purchases and water rights.
Divestitures
For the six months ended June 30, 2019, divestitures in the USA Operations were $6 million (2018 - $8 million), which primarily included the sale of certain properties that did not complement Encana’s existing portfolio of assets.
During the six months ended June 30, 2018, divestitures in the Canadian Operations were $57 million, which primarily included the sale of certain Pipestone assets located in Alberta.
Amounts received from the Company’s divestiture transactions have been deducted from the respective Canadian and U.S. full cost pools.

29Notes to Condensed Consolidated Financial StatementsPrepared in conformity with U.S. GAAP in US$
Q2 Report | For the period ended June 30, 2019
10. Property, Plant and Equipment, Net
As at June 30, 2019 As at December 31, 2018 Accumulated Accumulated
Cost DD&A Net Cost DD&A Net
Canadian Operations Proved properties $ 14,886 $ (14,014 ) $ 872 $ 13,996 $ (13,261 ) $ 735 Unproved properties 229 - 229 237 - 237 Other 24 - 24 27 - 27
15,139 (14,014 ) 1,125 14,260 (13,261 ) 999
USA Operations Proved properties 34,701 (24,748 ) 9,953 27,189 (24,099 ) 3,090 Unproved properties 3,926 - 3,926 3,493 - 3,493 Other 35 - 35 8 - 8
38,662 (24,748 ) 13,914 30,690 (24,099 ) 6,591
Market Optimization 8 (7 ) 1 7 (6 ) 1 Corporate & Other 905 (665 ) 240 2,136 (755 ) 1,381
$ 54,714 $ (39,434 ) $ 15,280 $ 47,093 $ (38,121 ) $ 8,972
Canadian and USA Operations property, plant and equipment include internal costs directly related to exploration, development and construction activities of $121 million, which have been capitalized during the six months ended June 30, 2019 (2018 - $109 million).
Finance Lease Arrangements
The Company has two lease arrangements that are accounted for as finance leases, which include an office building and an offshore production platform. As at June 30, 2019, the total carrying value of assets under finance lease was $40 million ($41 million as at December 31, 2018), net of accumulated amortization of $671 million ($650 million as at December 31, 2018). Long-term liabilities for the finance lease arrangements are included in other liabilities and provisions in the Condensed Consolidated Balance Sheet and are disclosed in Note 13.
Other Arrangement
As at December 31, 2018, Corporate and Other property, plant and equipment and total assets included a carrying value of $1,133 million related to The Bow office building. Upon adoption of Topic 842 on January 1, 2019, The Bow office building was determined to be an operating lease as discussed in Note 2. As at June 30, 2019, other assets included a ROU asset of $914 million related to The Bow office building.

30 Notes to Condensed Consolidated Financial StatementsPrepared in conformity with U.S. GAAP in US$
Q2 Report | For the period ended June 30, 2019
11. Leases
Leases entered into for the right to use an asset are classified as either an operating or finance lease. Upon commencement of the lease, a ROU asset and corresponding lease liability are recognized on the Condensed Consolidated Balance Sheet for all operating and finance leases. Encana has elected the short-term lease exemption, which does not require a ROU asset or lease liability to be recognized on the Condensed Consolidated Balance Sheet when the lease term is 12 months or less and does not include an option to purchase the underlying asset that the lessee is reasonably certain to exercise.
Upon commencement of the lease, ROU assets are recognized based on the initial measurement of the lease liability and adjusted for any lease payments made before commencement date of the lease, less any lease incentives and including any initial direct costs incurred. Lease liabilities are initially measured at the present value of future minimum lease payments over the lease term. The discount rate used to determine the present value is the rate implicit in the lease unless that rate cannot be determined, in which case Encana’s incremental borrowing rate is used.
Rights to extend or terminate a lease are included in the lease term when there is reasonable certainty the right will be exercised. Factors used to assess reasonable certainty of rights to extend or terminate a lease include current and forecasted drillings plans, anticipated changes in development strategies, historical practice in extending similar contracts and current market conditions. Encana’s lease contracts include rights to extend leases after the initial term, ranging from month-to-month to less than 10 years.
Operating lease ROU assets and liabilities are subsequently measured at the present value of the lease payments not yet paid and discounted at the initial discount rate at commencement of the lease, less any impairments to the ROU asset. Operating lease expense and revenue from subleases are recognized in the Condensed Consolidated Statement of Earnings on a straight-line basis over the lease term. Finance lease ROU assets are amortized on a straight-line basis over the estimated useful life of the asset if the lessee is reasonably certain to exercise a purchase option or ownership of the leased asset transfers at the end of the lease term, otherwise the leased assets are amortized over the lease term. Amortization of finance lease ROU assets is included in depreciation, depletion and amortization in the Condensed Consolidated Statement of Earnings.
Variable lease payments include changes in index rates, mobilization and demobilization costs related to oil and gas equipment and certain costs associated with office and building leases. Variable lease payments are recognized when incurred. Lease and non-lease components are accounted for as a single lease component for compression, coolers and office subleases.
Operating leases include drilling rigs, compressors, marine vessels, camps, office and buildings, certain land easements and various equipment utilized in the development and production of oil, NGLs and natural gas. Finance leases include an office building and an offshore production platform. Subleases relate to office and building leases.
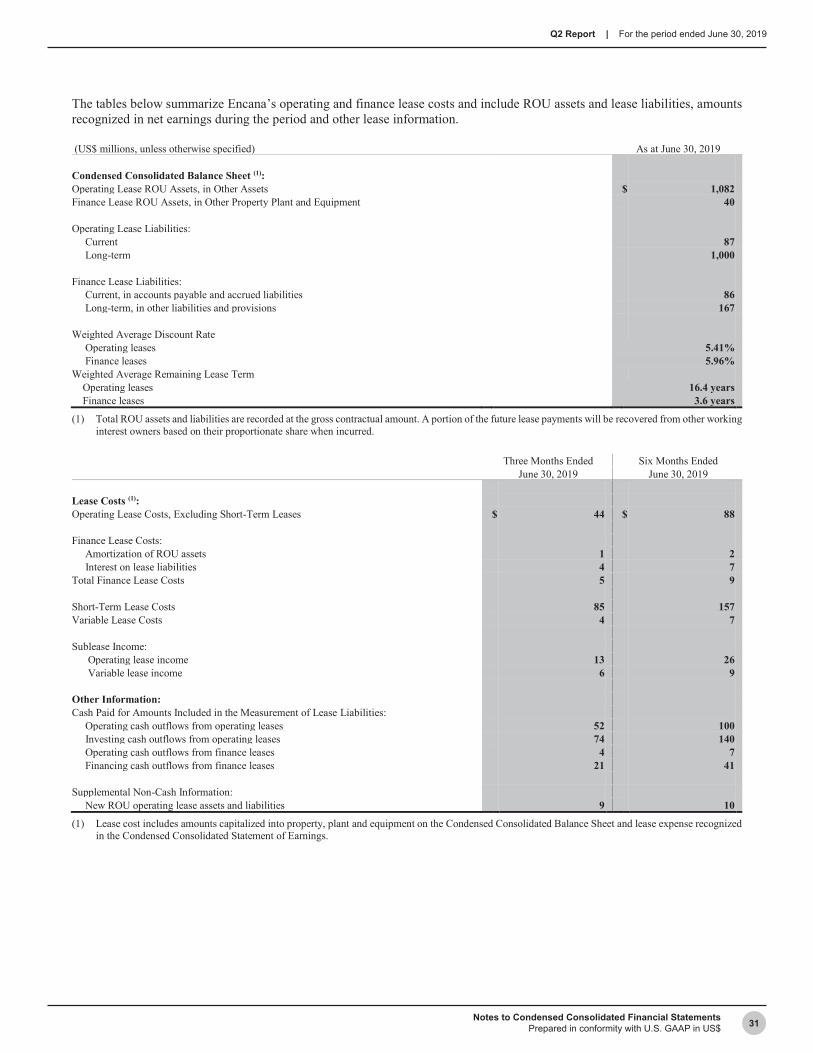
31Notes to Condensed Consolidated Financial StatementsPrepared in conformity with U.S. GAAP in US$
Q2 Report | For the period ended June 30, 2019
The tables below summarize Encana’s operating and finance lease costs and include ROU assets and lease liabilities, amounts recognized in net earnings during the period and other lease information.
(US$ millions, unless otherwise specified) As at June 30, 2019
Condensed Consolidated Balance Sheet (1): Operating Lease ROU Assets, in Other Assets $ 1,082 Finance Lease ROU Assets, in Other Property Plant and Equipment 40
Operating Lease Liabilities: Current 87 Long-term 1,000
Finance Lease Liabilities: Current, in accounts payable and accrued liabilities 86 Long-term, in other liabilities and provisions 167
Weighted Average Discount Rate Operating leases 5.41% Finance leases 5.96%
Weighted Average Remaining Lease Term Operating leases 16.4 years Finance leases 3.6 years
(1) Total ROU assets and liabilities are recorded at the gross contractual amount. A portion of the future lease payments will be recovered from other working interest owners based on their proportionate share when incurred.
Three Months Ended Six Months Ended June 30, 2019 June 30, 2019
Lease Costs (1): Operating Lease Costs, Excluding Short-Term Leases $ 44 $ 88
Finance Lease Costs: Amortization of ROU assets 1 2 Interest on lease liabilities 4 7
Total Finance Lease Costs 5 9
Short-Term Lease Costs 85 157 Variable Lease Costs 4 7
Sublease Income: Operating lease income 13 26 Variable lease income 6 9
Other Information: Cash Paid for Amounts Included in the Measurement of Lease Liabilities:
Operating cash outflows from operating leases 52 100 Investing cash outflows from operating leases 74 140 Operating cash outflows from finance leases 4 7 Financing cash outflows from finance leases 21 41
Supplemental Non-Cash Information: New ROU operating lease assets and liabilities 9 10
(1) Lease cost includes amounts capitalized into property, plant and equipment on the Condensed Consolidated Balance Sheet and lease expense recognizedin the Condensed Consolidated Statement of Earnings.

32 Notes to Condensed Consolidated Financial StatementsPrepared in conformity with U.S. GAAP in US$
Q2 Report | For the period ended June 30, 2019
Operating lease expense is reflected in the Condensed Consolidated Statement of Earnings as follows:
Three Months Ended Six Months Ended June 30, 2019 June 30, 2019
Operating Lease Expense Transportation and processing $ - $ 1 Operating 27 48 Administrative (1) 28 56 Total Operating Lease Expense $ 55 $ 105
(1) Includes operating lease expense of $23 million and $46 million for the three and six months ended June 30, 2019, respectively, related to The Bow office building.
The following table outlines the Company’s future lease payments and lease liabilities related to the Company’s operating and finance leases as at June 30, 2019:
2019 2020 2021 2022 2023 Thereafter Total
Operating Leases (1) Expected Future Lease Payments $ 76 $ 130 $ 113 $ 98 $ 86 $ 1,178 $ 1,681 Less: Discounting 594 Present Value of Future Operating Lease Payments $ 1,087 Sublease Income (undiscounted) $ (21 ) $ (42 ) $ (42 ) $ (38 ) $ (37 ) $ (573 ) $ (753 )
Finance Leases Expected Future Lease Payments $ 50 $ 99 $ 87 $ 8 $ 8 $ 30 $ 282 Less: Discounting 29 Present Value of Future Finance Lease Payments $ 253 Sublease Income (undiscounted) (2) $ (4 ) $ (8 ) $ (8 ) $ (8 ) $ (7 ) $ (24 ) $ (59 )
(1) Lease payments are presented based on the gross contractual amount. A portion of the future lease payments will be recovered from other working interest owners based on their proportionate share when incurred.
(2) Classified as operating lease.
There are no commitments for leases with terms greater than one year that have not yet commenced at June 30, 2019.
Refer to Notes 14 and 25 under Item 8 of Encana’s 2018 Annual Report on Form 10-K for comparative period disclosure of future lease payments and sublease income related to capital and operating leases and The Bow office building. Operating leases in the table above includes The Bow office building which was determined to be an operating lease on transition to Topic 842 as disclosed in Note 2. Under Topic 840, The Bow was accounted for as a financing transaction under a failed sales leaseback.

33Notes to Condensed Consolidated Financial StatementsPrepared in conformity with U.S. GAAP in US$
Q2 Report | For the period ended June 30, 2019
12. Long-Term Debt
As at As at June 30, December 31,
2019 2018
U.S. Dollar Denominated Debt Revolving credit and term loan borrowings $ 761 $ - U.S. Unsecured Notes:
6.50% due May 15, 2019 - 500 3.90% due November 15, 2021 600 600 5.75% due January 30, 2022 (See Note 8) 750 - 5.625% due July 1, 2024 (See Note 8) 1,000 - 5.375% due January 1, 2026 (See Note 8) 700 - 8.125% due September 15, 2030 300 300 7.20% due November 1, 2031 350 350 7.375% due November 1, 2031 500 500 6.50% due August 15, 2034 750 750 6.625% due August 15, 2037 462 462 6.50% due February 1, 2038 505 505 5.15% due November 15, 2041 244 244
Total Principal 6,922 4,211
Increase in Value of Debt Acquired 165 22 Unamortized Debt Discounts and Issuance Costs (35 ) (35 ) Total Long-Term Debt $ 7,052 $ 4,198
Current Portion $ - $ 500 Long-Term Portion 7,052 3,698
$ 7,052 $ 4,198
As at June 30, 2019, total long-term debt had a carrying value of $7,052 million and a fair value of $7,889 million (as at December 31, 2018 - carrying value of $4,198 million and a fair value of $4,511 million). The estimated fair value of long-term borrowings is categorized within Level 2 of the fair value hierarchy and has been determined based on market information of long-term debt with similar terms and maturity, or by discounting future payments of interest and principal at interest rates expected to be available to the Company at period end.
As at June 30, 2019, the Company had outstanding commercial paper of $761 million maturing at various dates with a weighted average interest rate of approximately 3.11 percent. These amounts are supported, and Management expects that they will continue to be supported, by revolving credit facilities that have no repayment requirements within the next year and which expire in 2022.
13. Other Liabilities and Provisions
As at As at June 30, December 31,
2019 2018
The Bow Office Building $ - $ 1,224 Finance Lease Obligations (See Note 11) 167 211 Unrecognized Tax Benefits 176 167 Pensions and Other Post-Employment Benefits 166 105 Long-Term Incentive Costs (See Note 19) 25 34 Other Derivative Contracts (See Notes 21, 22) 9 10 Other 62 18
$ 605 $ 1,769
Upon adoption of Topic 842 on January 1, 2019, The Bow office building was determined to be an operating lease. See Notes 2 and 11 for further information.

34 Notes to Condensed Consolidated Financial StatementsPrepared in conformity with U.S. GAAP in US$
Q2 Report | For the period ended June 30, 2019
14. Asset Retirement Obligation
As at As at June 30, December 31,
2019 2018
Asset Retirement Obligation, Beginning of Year $ 455 $ 514 Liabilities Incurred 11 17 Liabilities Acquired (See Note 8) 184 - Liabilities Settled and Divested (26 ) (56 ) Change in Estimated Future Cash Outflows - (20 ) Accretion Expense 19 32 Foreign Currency Translation 14 (32 ) Asset Retirement Obligation, End of Period $ 657 $ 455
Current Portion $ 158 $ 90 Long-Term Portion 499 365
$ 657 $ 455
15. Share Capital
Authorized
The Company is authorized to issue an unlimited number of no par value common shares and Class A Preferred Shares limited to a number equal to not more than 20 percent of the issued and outstanding number of common shares at the time of issuance. No Class A Preferred Shares are outstanding.
Issued and Outstanding
As at June 30, 2019
As at December 31, 2018
Number (millions) Amount
Number (millions) Amount
Common Shares Outstanding, Beginning of Year 952.5 $ 4,656 973.1 $ 4,757 Common Shares Purchased (149.4 ) (816 ) (20.7 ) (102 ) Common Shares Issued 543.4 3,478 - - Common Shares Issued Under Dividend Reinvestment Plan - - 0.1 1 Common Shares Outstanding, End of Period 1,346.5 $ 7,318 952.5 $ 4,656
On February 13, 2019, Encana completed the acquisition of all the issued and outstanding shares of common stock of Newfield whereby Encana issued approximately 543.4 million common shares to Newfield shareholders, representing an exchange ratio of 2.6719 Encana common shares for each share of Newfield common stock held. See Note 8 for further information on the business combination.
Normal Course Issuer Bid
On February 27, 2019, the Company announced that the TSX accepted the Company’s notice of intention to purchase, for cancellation, up to approximately 149.4 million Encana common shares pursuant to a NCIB over a 12-month period from March 4, 2019 to March 3, 2020.
During the six months ended June 30, 2019, the Company purchased approximately 149.4 million common shares under its current NCIB for total consideration of approximately $1,037 million. Of the amount paid, $816 million was charged to share capital and $221 million was charged to retained earnings.
All purchases were made in accordance with the NCIB at prevailing market prices plus brokerage fees, with consideration allocated to share capital up to the average carrying amount of the shares, with any excess allocated to retained earnings.

35Notes to Condensed Consolidated Financial StatementsPrepared in conformity with U.S. GAAP in US$
Q2 Report | For the period ended June 30, 2019
For the six months ended June 30, 2018, the Company purchased approximately 16.8 million common shares under the previous NCIB which was in place from February 28, 2018 to February 27, 2019 for total consideration of approximately $200 million. Of the amount paid, $83 million was charged to share capital and $117 million was charged to accumulated deficit.
For the twelve months ended December 31, 2018, the Company purchased approximately 20.7 million common shares under the previous NCIB which was in place from February 28, 2018 to February 27, 2019 for total consideration of approximately $250 million. Of the amount paid, $102 million was charged to share capital and $148 million was charged to retained earnings.
Dividend Reinvestment Plan
On February 28, 2019, Encana suspended its dividend reinvestment plan (“DRIP”). During the twelve months ended December 31, 2018, Encana issued 69,329 common shares totaling $0.6 million under the DRIP.
Dividends
During the three months ended June 30, 2019, Encana declared and paid dividends of $0.01875 per common share totaling $25 million (2018 - $0.015 per common share totaling $14 million). During the six months ended June 30, 2019, Encana declared and paid dividends of $0.0375 per common share totaling $53 million (2018 - $0.03 per common share totaling $29 million).
For the three and six months ended June 30, 2018, the dividends paid included $0.1 million and $0.4 million, respectively, in common shares issued in lieu of cash dividends under the DRIP.
On July 30, 2019, the Board of Directors declared a dividend of $0.01875 per common share payable on September 30, 2019 to common shareholders of record as of September 13, 2019.
Earnings Per Common Share
The following table presents the computation of net earnings (loss) per common share:
Three Months Ended Six Months Ended June 30, June 30,
(US$ millions, except per share amounts) 2019 2018 2019 2018
Net Earnings (Loss) $ 336 $ (151 ) $ 91 $ -
Number of Common Shares: Weighted average common shares outstanding - Basic 1,381.0 960.0 1,301.2 965.7 Effect of dilutive securities - - - -
Weighted Average Common Shares Outstanding - Diluted 1,381.0 960.0 1,301.2 965.7
Net Earnings (Loss) per Common Share Basic & Diluted $ 0.24 $ (0.16 ) $ 0.07 $ -
Encana Stock Option Plan
Encana has share-based compensation plans that allow employees to purchase common shares of the Company. Option exercise prices are not less than the market value of the common shares on the date the options are granted. All options outstanding as at June 30, 2019 have associated Tandem Stock Appreciation Rights (“TSARs”) attached. In lieu of exercising the option, the associated TSARs give the option holder the right to receive a cash payment equal to the excess of the market price of Encana’s common shares at the time of the exercise over the original grant price. Historically, most holders of options with TSARs have elected to exercise their stock options as a Stock Appreciation Right (“SAR”) in exchange for a cash payment. As a result, outstanding TSARs are not considered potentially dilutive securities.
Encana Restricted Share Units
Encana has a share-based compensation plan whereby eligible employees and Directors are granted Restricted Share Units (“RSUs”). An RSU is a conditional grant to receive the equivalent of an Encana common share upon vesting of the RSUs and
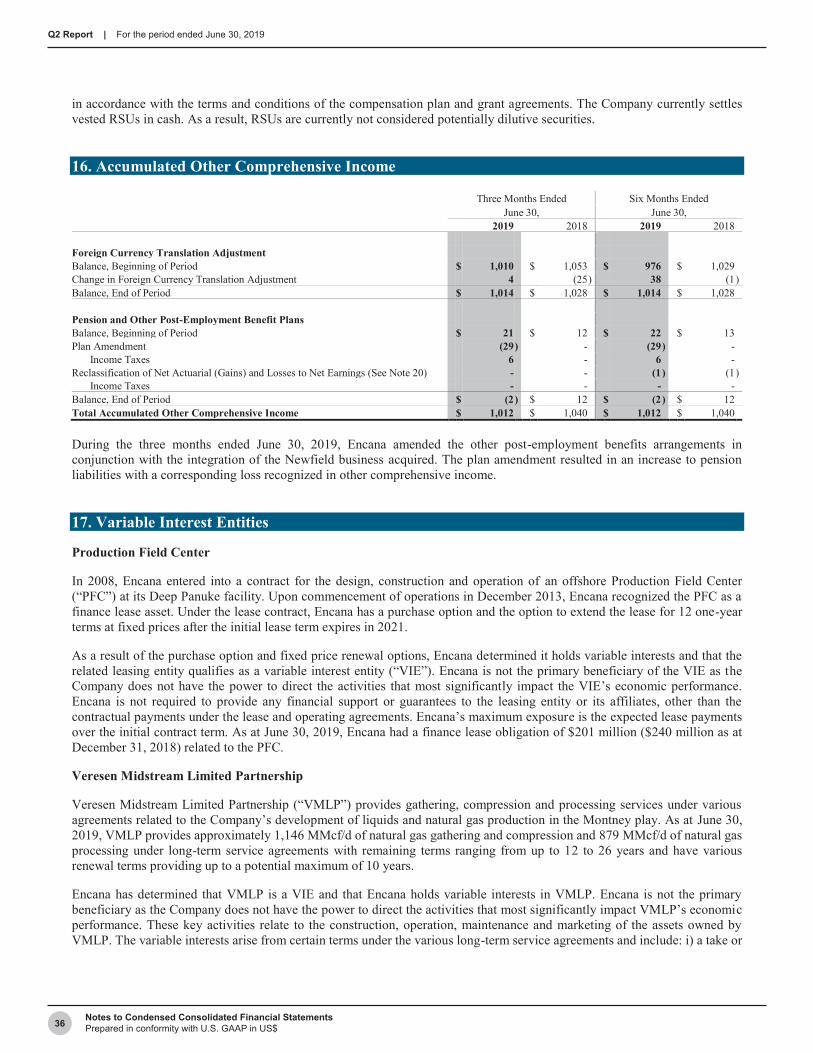
36 Notes to Condensed Consolidated Financial StatementsPrepared in conformity with U.S. GAAP in US$
Q2 Report | For the period ended June 30, 2019
in accordance with the terms and conditions of the compensation plan and grant agreements. The Company currently settles vested RSUs in cash. As a result, RSUs are currently not considered potentially dilutive securities.
16. Accumulated Other Comprehensive Income
Three Months Ended Six Months Ended June 30, June 30,
2019 2018 2019 2018
Foreign Currency Translation Adjustment Balance, Beginning of Period $ 1,010 $ 1,053 $ 976 $ 1,029 Change in Foreign Currency Translation Adjustment 4 (25 ) 38 (1 ) Balance, End of Period $ 1,014 $ 1,028 $ 1,014 $ 1,028
Pension and Other Post-Employment Benefit Plans Balance, Beginning of Period $ 21 $ 12 $ 22 $ 13 Plan Amendment (29 ) - (29 ) -
Income Taxes 6 - 6 - Reclassification of Net Actuarial (Gains) and Losses to Net Earnings (See Note 20) - - (1 ) (1 )
Income Taxes - - - - Balance, End of Period $ (2 ) $ 12 $ (2 ) $ 12 Total Accumulated Other Comprehensive Income $ 1,012 $ 1,040 $ 1,012 $ 1,040
During the three months ended June 30, 2019, Encana amended the other post-employment benefits arrangements in conjunction with the integration of the Newfield business acquired. The plan amendment resulted in an increase to pension liabilities with a corresponding loss recognized in other comprehensive income.
17. Variable Interest Entities
Production Field Center
In 2008, Encana entered into a contract for the design, construction and operation of an offshore Production Field Center (“PFC”) at its Deep Panuke facility. Upon commencement of operations in December 2013, Encana recognized the PFC as a finance lease asset. Under the lease contract, Encana has a purchase option and the option to extend the lease for 12 one-year terms at fixed prices after the initial lease term expires in 2021.
As a result of the purchase option and fixed price renewal options, Encana determined it holds variable interests and that the related leasing entity qualifies as a variable interest entity (“VIE”). Encana is not the primary beneficiary of the VIE as the Company does not have the power to direct the activities that most significantly impact the VIE’s economic performance. Encana is not required to provide any financial support or guarantees to the leasing entity or its affiliates, other than the contractual payments under the lease and operating agreements. Encana’s maximum exposure is the expected lease payments over the initial contract term. As at June 30, 2019, Encana had a finance lease obligation of $201 million ($240 million as at December 31, 2018) related to the PFC.
Veresen Midstream Limited Partnership
Veresen Midstream Limited Partnership (“VMLP”) provides gathering, compression and processing services under various agreements related to the Company’s development of liquids and natural gas production in the Montney play. As at June 30, 2019, VMLP provides approximately 1,146 MMcf/d of natural gas gathering and compression and 879 MMcf/d of natural gas processing under long-term service agreements with remaining terms ranging from up to 12 to 26 years and have various renewal terms providing up to a potential maximum of 10 years.
Encana has determined that VMLP is a VIE and that Encana holds variable interests in VMLP. Encana is not the primary beneficiary as the Company does not have the power to direct the activities that most significantly impact VMLP’s economic performance. These key activities relate to the construction, operation, maintenance and marketing of the assets owned by VMLP. The variable interests arise from certain terms under the various long-term service agreements and include: i) a take or

37Notes to Condensed Consolidated Financial StatementsPrepared in conformity with U.S. GAAP in US$
Q2 Report | For the period ended June 30, 2019
pay for volumes in certain agreements; ii) an operating fee of which a portion can be converted into a fixed fee once VMLP assumes operatorship of certain assets; and iii) a potential payout of minimum costs in certain agreements. The potential payout of minimum costs will be assessed in the eighth year of the assets’ service period and is based on whether there is an overall shortfall of total system cash flows from natural gas gathered and compressed under certain agreements. The potential payout amount can be reduced in the event VMLP markets unutilized capacity to third-party users. Encana is not required to provide any financial support or guarantees to VMLP.
As a result of Encana’s involvement with VMLP, the maximum total exposure, which represents the potential exposure to Encana in the event the assets under the agreements are deemed worthless, is estimated to be $2,389 million as at June 30, 2019. The estimate comprises the take or pay volume commitments and the potential payout of minimum costs. The take or pay volume commitments associated with certain gathering and processing assets are included in Note 24 under Transportation and Processing. The potential payout requirement is highly uncertain as the amount is contingent on future production estimates, pace of development and the amount of capacity contracted to third parties. As at June 30, 2019, there were no accounts payable and accrued liabilities outstanding related to the take or pay commitment.
18. Restructuring Charges
In February 2019, in conjunction with the Newfield business combination as described in Note 8, Encana announced workforce reductions to better align staffing levels and the organizational structure with the Company’s strategy. During the three and six months ended June 30, 2019, the Company incurred total restructuring charges of $17 million and $130 million, respectively, before tax, primarily related to severance costs. As at June 30, 2019, $42 million remains accrued and is expected to be paid during the remainder of 2019 and in 2020.
Restructuring charges are included in administrative expense presented in the Corporate and Other segment in the Condensed Consolidated Statement of Earnings.
Three Months Ended Six Months Ended June 30, June 30,
2019 2018 2019 2018
Severance and Benefits $ 16 $ - $ 128 $ - Outplacement, Moving and Other Expenses 1 - 2 - Restructuring Expenses $ 17 $ - $ 130 $ -
As at As at June 30, December 31,
2019 2018
Outstanding Restructuring Accrual, Beginning of Year $ - $ - Restructuring Expenses Incurred 130 - Restructuring Costs Paid (88 ) - Outstanding Restructuring Accrual, End of Period (1) $ 42 $ -
(1) Included in accounts payable and accrued liabilities in the Condensed Consolidated Balance Sheet.
19. Compensation Plans
Encana has a number of compensation arrangements under which the Company awards various types of long-term incentive grants to eligible employees and Directors. They may include TSARs, Performance TSARs, SARs, Performance Share Units (“PSUs”), Deferred Share Units (“DSUs”) and RSUs. These compensation arrangements are share-based.
Encana accounts for TSARs, Performance TSARs, SARs, PSUs and RSUs as cash-settled share-based payment transactions and, accordingly, accrues compensation costs over the vesting period based on the fair value of the rights determined using the Black-Scholes-Merton and other fair value models.

38 Notes to Condensed Consolidated Financial StatementsPrepared in conformity with U.S. GAAP in US$
Q2 Report | For the period ended June 30, 2019
The following weighted average assumptions were used to determine the fair value of the share units outstanding:
As at June 30, 2019 As at June 30, 2018 US$ Share
Units C$ Share
Units US$ Share
Units C$ Share
Units
Risk Free Interest Rate 1.49% 1.49% 1.84% 1.84% Dividend Yield 1.46% 1.49% 0.46% 0.45% Expected Volatility Rate (1) 43.62% 41.75% 57.56% 54.08% Expected Term 2.9 yrs 2.6 yrs 1.8 yrs 2.0 yrs Market Share Price US$5.13 C$6.72 US$13.05 C$17.17
(1) Volatility was estimated using historical rates.
The Company has recognized the following share-based compensation costs:
Three Months Ended Six Months Ended June 30, June 30,
2019 2018 2019 2018
Total Compensation Costs of Transactions Classified as Cash-Settled $ (20 ) $ 109 $ 44 $ 82 Less: Total Share-Based Compensation Costs Capitalized 3 (31 ) (15 ) (22 ) Total Share-Based Compensation Expense (Recovery) $ (17 ) $ 78 $ 29 $ 60
Recognized on the Condensed Consolidated Statement of Earnings in: Operating $ (2 ) $ 22 $ 12 $ 16 Administrative (15 ) 56 17 44
$ (17 ) $ 78 $ 29 $ 60
As at June 30, 2019, the liability for share-based payment transactions totaled $63 million ($165 million as at December 31, 2018), of which $38 million ($131 million as at December 31, 2018) is recognized in accounts payable and accrued liabilities and $25 million ($34 million as at December 31, 2018) is recognized in other liabilities and provisions in the Condensed Consolidated Balance Sheet.
As at June 30,
2019
As at December 31,
2018
Liability for Cash-Settled Share-Based Payment Transactions: Unvested $ 48 $ 148 Vested 15 17
$ 63 $ 165
The following units were granted primarily in conjunction with the Company’s annual grant of long-term incentive awards. The TSARs, SARs, PSUs and RSUs were granted at the volume-weighted average trading price of Encana’s common shares for the five days prior to the grant date.
Six Months Ended June 30, 2019 (thousands of units)
TSARs 1,066 SARs 1,517 PSUs 7,643 DSUs 89 RSUs 10,799

39Notes to Condensed Consolidated Financial StatementsPrepared in conformity with U.S. GAAP in US$
Q2 Report | For the period ended June 30, 2019
20. Pension and Other Post-Employment Benefits
The Company has recognized total benefit plans expense which includes pension benefits and other post-employment benefits (“OPEB”) for the six months ended June 30 as follows:
Pension Benefits OPEB Total 2019 2018 2019 2018 2019 2018
Net Defined Periodic Benefit Cost $ - $ - $ 10 $ 3 $ 10 $ 3 Defined Contribution Plan Expense 11 12 - - 11 12 Total Benefit Plans Expense $ 11 $ 12 $ 10 $ 3 $ 21 $ 15
Of the total benefit plans expense, $12 million (2018 - $11 million) was included in operating expense and $4 million (2018 - $4 million) was included in administrative expense. Excluding service costs, net defined periodic benefit costs of $5 million (2018 - nil) were recorded in other (gains) losses, net.
The net defined periodic benefit cost for the six months ended June 30 is as follows:
Defined Benefits OPEB Total 2019 2018 2019 2018 2019 2018
Service Cost $ - $ - $ 5 $ 3 $ 5 $ 3 Interest Cost 3 4 2 1 5 5 Expected Return on Plan Assets (3 ) (4 ) - - (3 ) (4 ) Amounts Reclassified from Accumulated Other Comprehensive Income:
Amortization of net actuarial (gains) and losses - - (1 ) (1 ) (1 ) (1 ) Curtailment - - 4 - 4 - Total Net Defined Periodic Benefit Cost (1) $ - $ - $ 10 $ 3 $ 10 $ 3
(1) The components of total net defined periodic benefit cost, excluding the service cost component, are included in other (gains) losses, net.

40 Notes to Condensed Consolidated Financial StatementsPrepared in conformity with U.S. GAAP in US$
Q2 Report | For the period ended June 30, 2019
21. Fair Value Measurements
The fair values of cash and cash equivalents, accounts receivable and accrued revenues, and accounts payable and accrued liabilities approximate their carrying amounts due to the short-term maturity of those instruments. The fair values of restricted cash and marketable securities included in other assets approximate their carrying amounts due to the nature of the instruments held.
Recurring fair value measurements are performed for risk management assets and liabilities and other derivative contracts, as discussed further in Note 22. These items are carried at fair value in the Condensed Consolidated Balance Sheet and are classified within the three levels of the fair value hierarchy in the following tables. There have been no significant transfers between the hierarchy levels during the period.
Fair value changes and settlements for amounts related to risk management assets and liabilities are recognized in revenues and foreign exchange gains and losses according to their purpose.
As at June 30, 2019
Level 1 Quoted
Prices in Active
Markets
Level 2 Other
Observable Inputs
Level 3 Significant
Unobservable Inputs
Total Fair Value Netting (1)
Carrying Amount
Risk Management Assets Commodity Derivatives:
Current assets $ - $ 267 $ 48 $ 315 $ (59 ) $ 256 Long-term assets - 117 9 126 (27 ) 99
Foreign Currency Derivatives: Current assets - 12 - 12 - 12 Long-term assets - 4 - 4 - 4
Risk Management Liabilities Commodity Derivatives:
Current liabilities $ - $ 66 $ - $ 66 $ (59 ) $ 7 Long-term liabilities - 31 - 31 (27 ) 4
Other Derivative Contracts Current in accounts payable and accrued liabilities $ - $ 3 $ - $ 3 $ - $ 3 Long-term in other liabilities and provisions - 9 - 9 - 9
As at December 31, 2018
Level 1 Quoted
Prices in Active
Markets
Level 2 Other
Observable Inputs
Level 3 Significant
Unobservable Inputs
Total Fair Value Netting (1)
Carrying Amount
Risk Management Assets Commodity Derivatives:
Current assets $ - $ 492 $ 139 $ 631 $ (77 ) $ 554 Long-term assets - 177 - 177 (16 ) 161
Risk Management Liabilities Commodity Derivatives:
Current liabilities $ - $ 81 $ - $ 81 $ (77 ) $ 4 Long-term liabilities - 38 - 38 (16 ) 22
Foreign Currency Derivatives: Current liabilities - 21 - 21 - 21
Other Derivative Contracts Current in accounts payable and accrued liabilities $ - $ 4 $ - $ 4 $ - $ 4 Long-term in other liabilities and provisions - 10 - 10 - 10
(1) Netting to offset derivative assets and liabilities where the legal right and intention to offset exists, or where counterparty master netting arrangements contain provisions for net settlement.
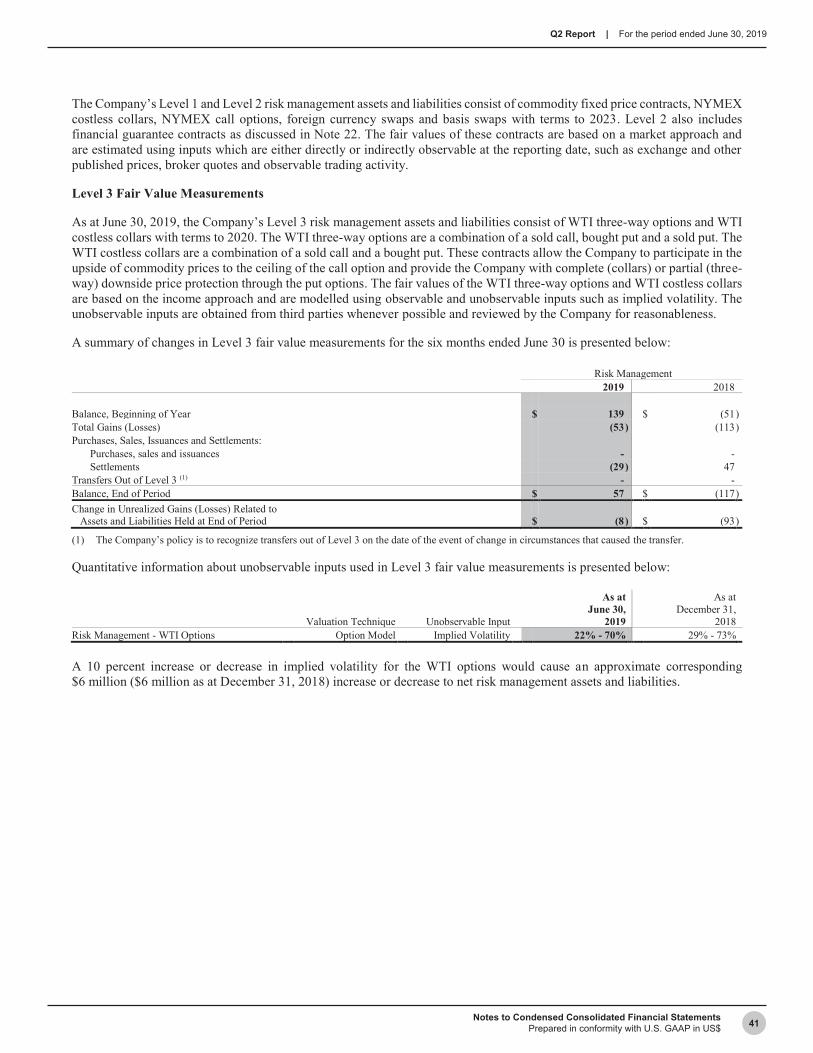
41Notes to Condensed Consolidated Financial StatementsPrepared in conformity with U.S. GAAP in US$
Q2 Report | For the period ended June 30, 2019
The Company’s Level 1 and Level 2 risk management assets and liabilities consist of commodity fixed price contracts, NYMEX costless collars, NYMEX call options, foreign currency swaps and basis swaps with terms to 2023. Level 2 also includes financial guarantee contracts as discussed in Note 22. The fair values of these contracts are based on a market approach and are estimated using inputs which are either directly or indirectly observable at the reporting date, such as exchange and other published prices, broker quotes and observable trading activity.
Level 3 Fair Value Measurements
As at June 30, 2019, the Company’s Level 3 risk management assets and liabilities consist of WTI three-way options and WTI costless collars with terms to 2020. The WTI three-way options are a combination of a sold call, bought put and a sold put. The WTI costless collars are a combination of a sold call and a bought put. These contracts allow the Company to participate in the upside of commodity prices to the ceiling of the call option and provide the Company with complete (collars) or partial (three-way) downside price protection through the put options. The fair values of the WTI three-way options and WTI costless collars are based on the income approach and are modelled using observable and unobservable inputs such as implied volatility. The unobservable inputs are obtained from third parties whenever possible and reviewed by the Company for reasonableness.
A summary of changes in Level 3 fair value measurements for the six months ended June 30 is presented below:
Risk Management 2019 2018
Balance, Beginning of Year $ 139 $ (51 ) Total Gains (Losses) (53 ) (113 ) Purchases, Sales, Issuances and Settlements:
Purchases, sales and issuances - - Settlements (29 ) 47
Transfers Out of Level 3 (1) - - Balance, End of Period $ 57 $ (117 ) Change in Unrealized Gains (Losses) Related to Assets and Liabilities Held at End of Period $ (8 ) $ (93 )
(1) The Company’s policy is to recognize transfers out of Level 3 on the date of the event of change in circumstances that caused the transfer.
Quantitative information about unobservable inputs used in Level 3 fair value measurements is presented below:
Valuation Technique Unobservable Input
As at June 30,
2019
As at December 31,
2018 Risk Management - WTI Options Option Model Implied Volatility 22% - 70% 29% - 73%
A 10 percent increase or decrease in implied volatility for the WTI options would cause an approximate corresponding $6 million ($6 million as at December 31, 2018) increase or decrease to net risk management assets and liabilities.
42 Notes to Condensed Consolidated Financial StatementsPrepared in conformity with U.S. GAAP in US$
Q2 Report | For the period ended June 30, 2019
22. Financial Instruments and Risk Management
A) Financial Instruments
Encana’s financial assets and liabilities are recognized in cash and cash equivalents, accounts receivable and accrued revenues, restricted cash, other assets, accounts payable and accrued liabilities, risk management assets and liabilities, long-term debt, and other liabilities and provisions.
B) Risk Management Activities
Encana uses derivative financial instruments to manage its exposure to cash flow variability from commodity prices and fluctuating foreign currency exchange rates. The Company does not apply hedge accounting to any of its derivative financial instruments. As a result, gains and losses from changes in the fair value are recognized in net earnings.
Commodity Price Risk
Commodity price risk arises from the effect that fluctuations in future commodity prices may have on future cash flows. To partially mitigate exposure to commodity price risk, the Company has entered into various derivative financial instruments. The use of these derivative instruments is governed under formal policies and is subject to limits established by the Board of Directors. The Company’s policy is to not use derivative financial instruments for speculative purposes.
Crude Oil and NGLs - To partially mitigate crude oil and NGL commodity price risk, the Company uses WTI-based contracts such as fixed price contracts, options and costless collars. Encana has also entered into basis swaps to manage against widening price differentials between various production areas and benchmark price points.
Natural Gas - To partially mitigate natural gas commodity price risk, the Company uses NYMEX-based contracts such as fixed price contracts, options and costless collars. Encana has also entered into basis swaps to manage against widening price differentials between various production areas and benchmark price points.
Foreign Exchange Risk
Foreign exchange risk arises from changes in foreign currency exchange rates that may affect the fair value or future cash flows of the Company’s financial assets or liabilities. To partially mitigate the effect of foreign exchange fluctuations on future commodity revenues and expenses, the Company may enter into foreign currency derivative contracts. As at June 30, 2019, Encana has entered into $500 million notional U.S. dollar denominated currency swaps at an average exchange rate of US$0.7516 to C$1, which mature monthly through the remainder of 2019 and $250 million notional U.S. dollar denominated currency swaps at an average exchange rate of US$0.7443 to C$1, which mature monthly throughout 2020.
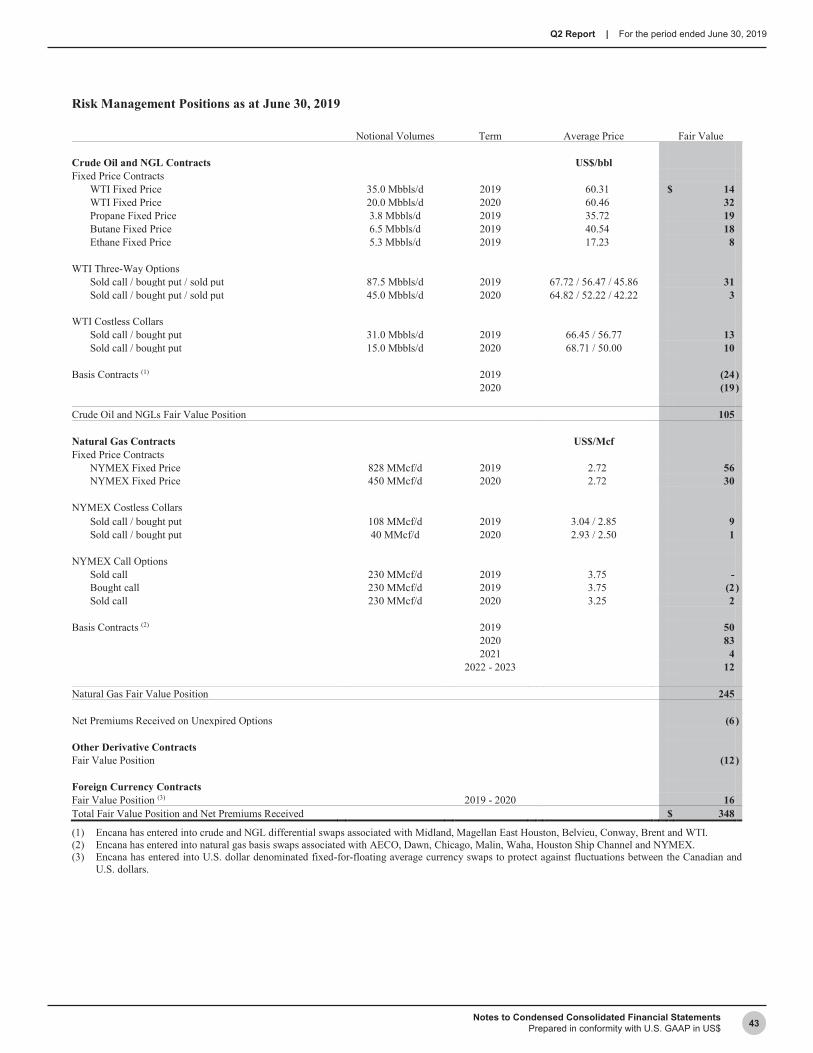
43Notes to Condensed Consolidated Financial StatementsPrepared in conformity with U.S. GAAP in US$
Q2 Report | For the period ended June 30, 2019
Risk Management Positions as at June 30, 2019
Notional Volumes Term Average Price Fair Value
Crude Oil and NGL Contracts US$/bbl Fixed Price Contracts
WTI Fixed Price 35.0 Mbbls/d 2019 60.31 $ 14 WTI Fixed Price 20.0 Mbbls/d 2020 60.46 32 Propane Fixed Price 3.8 Mbbls/d 2019 35.72 19 Butane Fixed Price 6.5 Mbbls/d 2019 40.54 18 Ethane Fixed Price 5.3 Mbbls/d 2019 17.23 8
WTI Three-Way Options Sold call / bought put / sold put 87.5 Mbbls/d 2019 67.72 / 56.47 / 45.86 31 Sold call / bought put / sold put 45.0 Mbbls/d 2020 64.82 / 52.22 / 42.22 3
WTI Costless Collars Sold call / bought put 31.0 Mbbls/d 2019 66.45 / 56.77 13 Sold call / bought put 15.0 Mbbls/d 2020 68.71 / 50.00 10
Basis Contracts (1) 2019 (24 ) 2020 (19 )
Crude Oil and NGLs Fair Value Position 105
Natural Gas Contracts US$/Mcf Fixed Price Contracts
NYMEX Fixed Price 828 MMcf/d 2019 2.72 56 NYMEX Fixed Price 450 MMcf/d 2020 2.72 30
NYMEX Costless Collars Sold call / bought put 108 MMcf/d 2019 3.04 / 2.85 9 Sold call / bought put 40 MMcf/d 2020 2.93 / 2.50 1
NYMEX Call Options Sold call 230 MMcf/d 2019 3.75 - Bought call 230 MMcf/d 2019 3.75 (2 ) Sold call 230 MMcf/d 2020 3.25 2
Basis Contracts (2) 2019 50 2020 83 2021 4
2022 - 2023 12
Natural Gas Fair Value Position 245
Net Premiums Received on Unexpired Options (6 )
Other Derivative Contracts Fair Value Position (12 )
Foreign Currency Contracts Fair Value Position (3) 2019 - 2020 16 Total Fair Value Position and Net Premiums Received $ 348
(1) Encana has entered into crude and NGL differential swaps associated with Midland, Magellan East Houston, Belvieu, Conway, Brent and WTI.(2) Encana has entered into natural gas basis swaps associated with AECO, Dawn, Chicago, Malin, Waha, Houston Ship Channel and NYMEX. (3) Encana has entered into U.S. dollar denominated fixed-for-floating average currency swaps to protect against fluctuations between the Canadian and
U.S. dollars.

44 Notes to Condensed Consolidated Financial StatementsPrepared in conformity with U.S. GAAP in US$
Q2 Report | For the period ended June 30, 2019
Earnings Impact of Realized and Unrealized Gains (Losses) on Risk Management Positions
Three Months Ended Six Months Ended June 30, June 30,
2019 2018 2019 2018
Realized Gains (Losses) on Risk Management Commodity and Other Derivatives:
Revenues (1) $ 107 $ 14 $ 179 $ (18 ) Foreign Currency Derivatives:
Foreign exchange (1 ) 3 (1 ) 10 $ 106 $ 17 $ 178 $ (8 )
Unrealized Gains (Losses) on Risk Management Commodity and Other Derivatives:
Revenues (2) $ 83 $ (326 ) $ (344 ) $ (258 ) Foreign Currency Derivatives:
Foreign exchange 17 (8 ) 37 (26 ) $ 100 $ (334 ) $ (307 ) $ (284 )
Total Realized and Unrealized Gains (Losses) on Risk Management, net Commodity and Other Derivatives:
Revenues (1) (2) $ 190 $ (312 ) $ (165 ) $ (276 ) Foreign Currency Derivatives:
Foreign exchange 16 (5 ) 36 (16 ) $ 206 $ (317 ) $ (129 ) $ (292 )
(1) Includes realized gains of $1 million and $3 million for the three and six months ended June 30, 2019, respectively, (2018 - gains of $2 million and $3 million, respectively) related to other derivative contracts.
(2) Includes unrealized losses of $1 million and $1 million for the three and six months ended June 30, 2019, respectively, (2018 - losses of $1 million and $1 million, respectively) related to other derivative contracts.
Reconciliation of Unrealized Risk Management Positions from January 1 to June 30
2019 2018
Fair Value
Total Unrealized
Gain (Loss)
Total Unrealized
Gain (Loss)
Fair Value of Contracts, Beginning of Year $ 654 Change in Fair Value of Contracts in Place at Beginning of Year and Contracts Entered into During the Period (129 ) $ (129 ) $ (292 ) Settlement of Other Derivative Contracts 3 Amortization of Option Premiums During the Period (2 ) Fair Value of Contracts Realized During the Period (178 ) (178 ) 8 Fair Value of Contracts and Net Premiums Received, End of Period $ 348 $ (307 ) $ (284 )
Risk management assets and liabilities arise from the use of derivative financial instruments and are measured at fair value. See Note 21 for a discussion of fair value measurements.

45Notes to Condensed Consolidated Financial StatementsPrepared in conformity with U.S. GAAP in US$
Q2 Report | For the period ended June 30, 2019
Unrealized Risk Management Positions
As at As at June 30, December 31,
2019 2018
Risk Management Assets Current $ 268 $ 554 Long-term 103 161
371 715
Risk Management Liabilities Current 7 25 Long-term 4 22
11 47
Other Derivative Contracts Current in accounts payable and accrued liabilities 3 4 Long-term in other liabilities and provisions 9 10
Net Risk Management Assets (Liabilities) and Other Derivative Contracts $ 348 $ 654
C) Credit Risk
Credit risk arises from the potential that the Company may incur a loss if a counterparty to a financial instrument fails to meet its obligation in accordance with agreed terms. While exchange-traded contracts are subject to nominal credit risk due to the financial safeguards established by the NYSE and the TSX, over-the-counter traded contracts expose Encana to counterparty credit risk. This credit risk exposure is mitigated through the use of credit policies approved by the Board of Directors governing the Company’s credit portfolio including credit practices that limit transactions according to counterparties’ credit quality. Mitigation strategies may include master netting arrangements, requesting collateral and/or transacting credit derivatives. The Company executes commodity derivative financial instruments under master agreements that have netting provisions that provide for offsetting payables against receivables. As a result of netting provisions, the Company’s maximum exposure to loss under derivative financial instruments due to credit risk is limited to the net amounts due from the counterparties under the derivative contracts, as disclosed in Note 21. As at June 30, 2019, the Company had no significant credit derivatives in place and held no collateral.
As at June 30, 2019, cash equivalents include high-grade, short-term securities, placed primarily with financial institutions and companies with strong investment grade ratings. Any foreign currency agreements entered into are with major financial institutions that have investment grade credit ratings.
A substantial portion of the Company’s accounts receivable are with customers in the oil and gas industry and are subject to normal industry credit risks. As at June 30, 2019, approximately 96 percent (97 percent as at December 31, 2018) of Encana’s accounts receivable and financial derivative credit exposures were with investment grade counterparties.
As at June 30, 2019, Encana had two counterparties whose net settlement position individually accounted for more than 10 percent of the fair value of the outstanding in-the-money net risk management contracts by counterparty. These counterparties accounted for 26 percent and 12 percent of the fair value of the outstanding in-the-money net risk management contracts. As at December 31, 2018, Encana had four counterparties whose net settlement position accounted for 30 percent, 13 percent, 12 percent and 10 percent of the fair value of the outstanding in-the-money net risk management contracts.
During 2015 and 2017, Encana entered into agreements resulting from divestitures, which may require Encana to fulfill certain payment obligations on the take or pay volume commitments assumed by the purchasers. The circumstances that would require Encana to perform under the agreements include events where a purchaser fails to make payment to the guaranteed party and/or a purchaser is subject to an insolvency event. The agreements have remaining terms from two to five years with a fair value recognized of $12 million as at June 30, 2019 ($14 million as at December 31, 2018). The maximum potential amount of undiscounted future payments is $179 million as at June 30, 2019, and is considered unlikely.
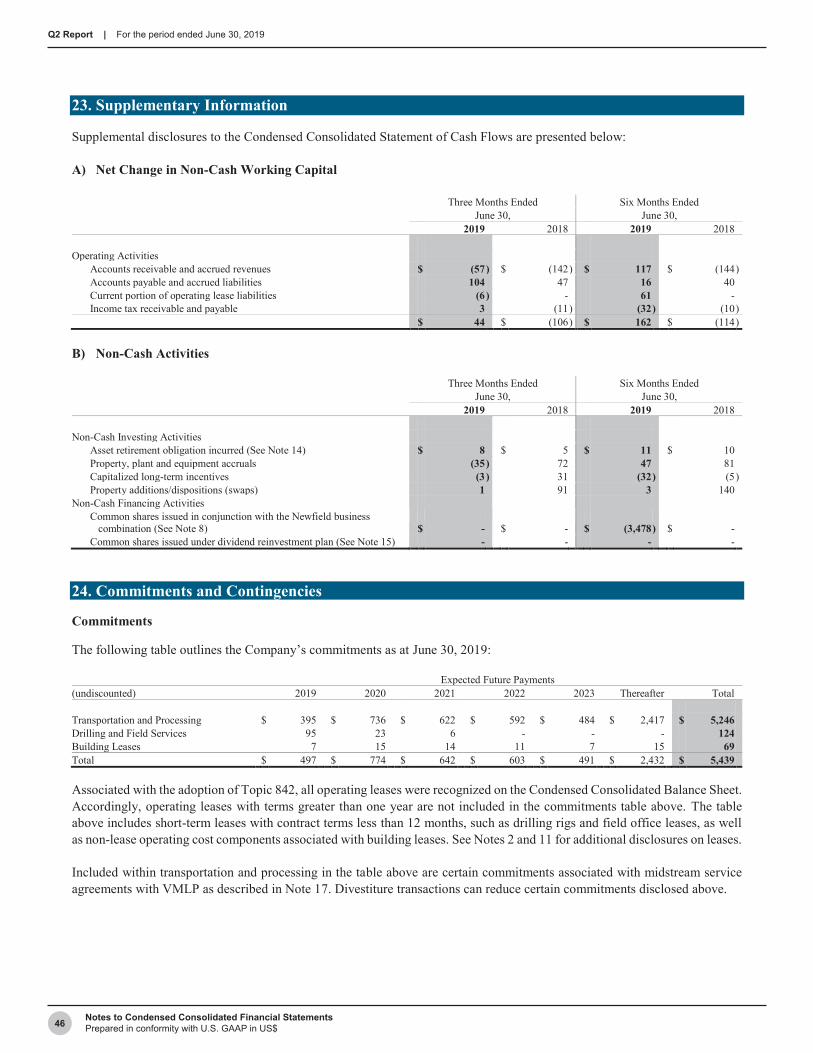
46 Notes to Condensed Consolidated Financial StatementsPrepared in conformity with U.S. GAAP in US$
Q2 Report | For the period ended June 30, 2019
23. Supplementary Information
Supplemental disclosures to the Condensed Consolidated Statement of Cash Flows are presented below:
A) Net Change in Non-Cash Working Capital
Three Months Ended Six Months Ended June 30, June 30,
2019 2018 2019 2018
Operating Activities Accounts receivable and accrued revenues $ (57 ) $ (142 ) $ 117 $ (144 ) Accounts payable and accrued liabilities 104 47 16 40 Current portion of operating lease liabilities (6 ) - 61 - Income tax receivable and payable 3 (11 ) (32 ) (10 )
$ 44 $ (106 ) $ 162 $ (114 )
B) Non-Cash Activities
Three Months Ended Six Months Ended June 30, June 30,
2019 2018 2019 2018
Non-Cash Investing Activities Asset retirement obligation incurred (See Note 14) $ 8 $ 5 $ 11 $ 10 Property, plant and equipment accruals (35 ) 72 47 81 Capitalized long-term incentives (3 ) 31 (32 ) (5 ) Property additions/dispositions (swaps) 1 91 3 140
Non-Cash Financing Activities Common shares issued in conjunction with the Newfield business combination (See Note 8) $ - $ - $ (3,478 ) $ - Common shares issued under dividend reinvestment plan (See Note 15) - - - -
24. Commitments and Contingencies
Commitments
The following table outlines the Company’s commitments as at June 30, 2019:
Expected Future Payments (undiscounted) 2019 2020 2021 2022 2023 Thereafter Total
Transportation and Processing $ 395 $ 736 $ 622 $ 592 $ 484 $ 2,417 $ 5,246 Drilling and Field Services 95 23 6 - - - 124 Building Leases 7 15 14 11 7 15 69 Total $ 497 $ 774 $ 642 $ 603 $ 491 $ 2,432 $ 5,439
Associated with the adoption of Topic 842, all operating leases were recognized on the Condensed Consolidated Balance Sheet. Accordingly, operating leases with terms greater than one year are not included in the commitments table above. The table above includes short-term leases with contract terms less than 12 months, such as drilling rigs and field office leases, as well as non-lease operating cost components associated with building leases. See Notes 2 and 11 for additional disclosures on leases.
Included within transportation and processing in the table above are certain commitments associated with midstream service agreements with VMLP as described in Note 17. Divestiture transactions can reduce certain commitments disclosed above.

47Notes to Condensed Consolidated Financial StatementsPrepared in conformity with U.S. GAAP in US$
Q2 Report | For the period ended June 30, 2019
Contingencies
Encana is involved in various legal claims and actions arising in the normal course of the Company’s operations. Although the outcome of these claims cannot be predicted with certainty, the Company does not expect these matters to have a material adverse effect on Encana’s financial position, cash flows or results of operations. Management’s assessment of these matters may change in the future as certain of these matters are in early stages or are subject to a number of uncertainties. For material matters that the Company believes an unfavorable outcome is reasonably possible, the Company discloses the nature and a range of potential exposures. If an unfavorable outcome were to occur, there exists the possibility of a material impact on the Company’s consolidated net earnings or loss for the period in which the effect becomes reasonably estimable. The Company accrues for such items when a liability is both probable and the amount can be reasonably estimated. Such accruals are based on the Company’s information known about the matters, estimates of the outcomes of such matters and experience in handling similar matters.
In conjunction with the acquisition of Newfield as described in Note 8, various legal claims and actions arising in the normal course of Newfield’s operations were assumed by Encana. On March 29, 2019, Newfield and its wholly-owned subsidiary entered into an Agreement and Mutual Release with Sapura Energy Berhad, formerly known as SapuraKencana Petroleum Berhad, and Sapura Exploration and Production Inc., formerly known as SapuraKencana Energy Inc. (collectively, “Sapura”) to settle arbitration claims arising from Sapura’s purchase of Newfield’s Malaysian business in February 2014. Under the Agreement and Mutual Release, Newfield and its wholly-owned subsidiary paid Sapura $22.5 million. The settlement amount including legal fees was included in the purchase price allocation as part of the current liabilities assumed by Encana at the acquisition date. Although the outcome of any remaining legal claims and actions assumed by Encana following the acquisition of Newfield cannot be predicted with certainty, the Company does not expect these matters to have a material adverse effect on Encana’s financial position, cash flows or results of operations.
48 Management’s Discussion and AnalysisPrepared using U.S. GAAP in US$
Q2 Report | For the period ended June 30, 2019
Item 2. Management’s Discussion and Analysis of Financial Condition and Results of Operations
The MD&A is intended to provide a narrative description of Encana’s business from management’s perspective. This MD&A should be read in conjunction with the unaudited interim Condensed Consolidated Financial Statements and accompanying notes for the period ended June 30, 2019 (“Consolidated Financial Statements”), which are included in Part I, Item 1 of this Quarterly Report on Form 10-Q and the audited Consolidated Financial Statements and accompanying notes and MD&A for the year ended December 31, 2018, which are included in Items 8 and 7, respectively, of the 2018 Annual Report on Form 10-K. Common industry terms and abbreviations are used throughout this MD&A and are defined in the Definitions,Conversions and Conventions sections of this Quarterly Report on Form 10-Q. This MD&A includes the following sections:
• Executive Overview• Results of Operations• Liquidity and Capital Resources• Non-GAAP Measures
Executive Overview
Strategy
Encana is a leading North American energy producer that is focused on developing its multi-basin portfolio of oil, NGLs and natural gas producing plays. Encana is committed to growing long-term shareholder value through a combination of profitable growth and generating cash flows in excess of capital expenditures. The Company is pursuing the key business objectives of preserving balance sheet strength, exercising a disciplined capital allocation strategy by investing in a limited number of core assets, maximizing profitability through operational and capital efficiencies, returning capital to shareholders through sustainable dividends and investing in high margin liquids plays to drive cash flow.
In executing its strategy, Encana focuses on its core values of One, Agile and Driven, which guide the organization to be flexible, responsive, determined and motivated with a commitment to excellence and a passion to succeed as a team. Encana rapidly deploys successful ideas and practices across its assets, becoming more efficient as innovative and sustainable improvements are implemented.
Encana continually reviews and evaluates its strategy and changing market conditions. In 2019, Encana is focusing on quality cash flow growth from high margin, scalable, top tier assets located in some of the best plays in North America, referred to as the “Core Assets”. As at June 30, 2019, these comprised Permian and Anadarko in the U.S., and Montney in Canada. These top tier assets form a multi-basin portfolio of oil, NGLs and natural gas producing plays enabling flexible and efficient investment of capital into high margin liquids plays that support sustainable cash flow generation. The Company’s other upstream assets, including Eagle Ford, Duvernay, Williston and Uinta continue to deliver operating cash flows for the Company.
For additional information on Encana’s strategy, its reporting segments and the plays in which the Company operates as at December 31, 2018, refer to Items 1 and 2 of the 2018 Annual Report on Form 10-K. On February 13, 2019, Encana completed the acquisition of Newfield; as such, the post-acquisition results of operations of Newfield are included in the Company’s interim consolidated results beginning February 14, 2019. For additional information on the business combination and segmented results, refer to Notes 8 and 3, respectively, to the Consolidated Financial Statements included in Part I, Item 1 of this Quarterly Report on Form 10-Q. For additional information on the reserves volumes acquired with the Newfield acquisition, refer to Exhibit 99.4 in the Company’s Current Report on Form 8-K filed on February 28, 2019 regarding Supplemental Pro Forma Oil, Natural Gas Liquids and Natural Gas Reserves Information as of December 31, 2018.
In evaluating its operations and assessing its leverage, the Company reviews performance-based measures such as Non-GAAP Cash Flow, Non-GAAP Cash Flow Margin, Total Costs and debt-based metrics such as Debt to Adjusted Capitalization and Net Debt to Adjusted EBITDA, which are non-GAAP measures and do not have any standardized meaning under U.S. GAAP. These measures may not be similar to measures presented by other issuers and should not be viewed as a substitute for measures reported under U.S. GAAP. Additional information regarding these measures, including reconciliations to the closest GAAP measure, can be found in the Non-GAAP Measures section of this MD&A.

49Management’s Discussion and AnalysisPrepared using U.S. GAAP in US$
Q2 Report | For the period ended June 30, 2019
Highlights
During the first six months of 2019, Encana focused on executing its 2019 capital plan, generating cash from operating activities and returning capital to shareholders through dividends and share buybacks. Since the completion of the Newfield acquisition in February, the Company has substantially integrated the businesses as of the end of the second quarter, and is on track to exceed the synergies previously announced from the strategic combination. Higher upstream product revenues in the first six months of 2019 compared to 2018 resulted from higher production volumes, partially offset by lower average realized prices, excluding the impact of risk management activities. Total production volumes increased by 60 percent compared to 2018 primarily due to the Newfield acquisition and successful drilling programs. The increase was partially offset by lower average realized liquids prices of 19 percent, primarily due to lower NGL and oil benchmark prices. Encana also focused on optimizing realized prices from the diversification of the Company’s downstream markets.
Significant Developments
• Completed the acquisition of all issued and outstanding shares of common stock of Newfield whereby Encana issuedapproximately 543.4 million common shares on February 13, 2019. The acquired operations are focused on thedevelopment of oil-rich properties primarily located in the Anadarko Basin in Oklahoma. Following the acquisition,Newfield’s senior notes totaling $2.45 billion remain outstanding.
• Purchased, for cancellation, 149.4 million common shares for total consideration of approximately $1,037 million,thereby fully executing the Company’s previously announced NCIB for up to 10 percent of Encana’s public float ofcommon shares.
• Announced a substantial issuer bid (the “Offer”) to purchase, for cancellation, up to $213 million of outstandingcommon shares, which commenced on July 8, 2019 and expires on August 14, 2019.
• Reached an agreement with the China National Offshore Oil Corporation (“CNOOC”) to terminate Encana’sproduction sharing contract, which governs the Company’s China Operations. The transaction is effectiveJuly 31, 2019, and is subject to the satisfaction of certain conditions.
Financial Results
Three months ended June 30, 2019
• Reported net earnings of $336 million, including net gains on risk management in revenues of $190 million, beforetax, a net foreign exchange gain of $55 million, before tax, and restructuring charges of $17 million, before tax.
• Generated cash from operating activities of $906 million, Non-GAAP Cash Flow of $877 million and Non-GAAPCash Flow Margin of $16.27 per BOE.
• Returned capital to shareholders through the purchase, for cancellation, of approximately 93.5 million common sharesfor total consideration of approximately $637 million and paid dividends of $0.01875 per common share totaling$25 million.
Six months ended June 30, 2019
• Reported net earnings of $91 million, including a net loss on risk management in revenues of $165 million, beforetax, restructuring charges of $130 million, before tax, a net foreign exchange gain of $92 million, before tax, andacquisition costs of $33 million, before tax.
• Generated cash from operating activities of $1,435 million, Non-GAAP Cash Flow of $1,299 million and Non-GAAPCash Flow Margin of $13.53 per BOE.
• Returned capital to shareholders through the purchase, for cancellation, of approximately 149.4 million commonshares for total consideration of approximately $1,037 million and paid dividends of $0.0375 per common sharetotaling $53 million.
• Held cash and cash equivalents of $167 million and had $4.0 billion in available credit facilities of which Encana’s$2.5 billion revolving credit facility supported the issuance of $761 million of commercial paper as at June 30, 2019.

50 Management’s Discussion and AnalysisPrepared using U.S. GAAP in US$
Q2 Report | For the period ended June 30, 2019
Capital Investment
• Directed $543 million, or 72 percent, of total capital spending to Permian, Anadarko and Montney in the secondquarter of 2019 and $1,087 million, or 73 percent, during the first six months of 2019.
• Focused on highly efficient capital activity and short-cycle high margin projects providing flexibility to respond tofluctuations in commodity prices.
Production
Three months ended June 30, 2019
• Produced average oil and NGL volumes of 324.0 Mbbls/d which accounted for 55 percent of total production volumes.Average oil and plant condensate production volumes of 234.6 Mbbls/d were 72 percent of total liquids productionvolumes.
• Produced average natural gas volumes of 1,607 MMcf/d which accounted for 45 percent of total production volumes.
Six months ended June 30, 2019
• Produced average oil and NGL volumes of 277.9 Mbbls/d which accounted for 52 percent of total production volumes.Average oil and plant condensate production volumes of 202.8 Mbbls/d were 73 percent of total liquids productionvolumes.
• Produced average natural gas volumes of 1,514 MMcf/d which accounted for 48 percent of total production volumes.
Revenues and Operating Expenses
• Focused on market diversification to other downstream markets to optimize realized commodity prices and revenuesthrough a combination of derivative financial instruments and transportation contracts.
• Continued to benefit from secured pipeline transportation capacity to the Dawn and Houston markets to protect againstAECO and Midland differentials to NYMEX and WTI, respectively; maintained access to local markets throughexisting transportation contracts.
• Incurred Total Costs in the second quarter and the first six months of 2019 of $12.78 per BOE and $13.06 per BOE,respectively, a decrease compared to 2018 of $0.84 per BOE and $0.51 per BOE, respectively. Total Costs includesproduction, mineral and other taxes, upstream transportation and processing expense, upstream operating expense andadministrative expense. Total Costs excludes the impact of long-term incentive and restructuring costs. Significantitems in the second quarter and the first six months of 2019 impacting Total Costs include:
o Lower upstream transportation and processing expense in the second quarter and the first six months of 2019compared to 2018 of $1.19 per BOE and $0.88 per BOE, respectively, primarily due to the higher proportionof total production volumes from the USA Operations, which benefit from lower than average per BOEtransportation and processing costs. Production volumes in the USA Operations were higher in the secondquarter and first six months of 2019 compared to 2018 due to the Newfield acquisition; and
o Higher administrative expense, excluding long-term incentive costs and restructuring costs, in the secondquarter and the first six months of 2019 compared to 2018 of $0.12 per BOE and $0.24 per BOE, respectively,primarily due to the change in accounting treatment for The Bow office building.
• Preserved operational efficiencies achieved in previous years and minimized the effect of inflationary costs.

51Management’s Discussion and AnalysisPrepared using U.S. GAAP in US$
Q2 Report | For the period ended June 30, 2019
Subsequent Events
On July 8, 2019, the Company announced an agreement to sell its Arkoma Basin natural gas assets, comprising approximately 140,000 net acres in Oklahoma, for total cash consideration of $165 million. The sale is expected to close in the third quarter of 2019 and is subject to customary closing conditions, regulatory approvals and other adjustments.
On July 31, 2019, Encana completed the termination of the Company’s production sharing contract with CNOOC in China. Subsequently, Encana no longer has operations remaining in China. Encana’s exit from China supports the Company’s strategy to focus development on core assets.
2019 Outlook
Industry Outlook
The oil and gas industry is cyclical and commodity prices are inherently volatile. Oil prices during 2019 are expected to reflect global supply and demand dynamics as well as the geopolitical and macroeconomic environment. At a meeting in December 2018, OPEC and certain non-OPEC countries (collectively “OPEC”) agreed to reduce crude oil production, beginning in January 2019 for an initial period of six months, seeking to balance the global oil market in response to changing fundamentals. In early July 2019, OPEC agreed to extend production cuts for an additional period of nine months from July 2019 to March 2020. Risks to the global economy, including trade disputes, U.S. sanctions policy, U.S. production growth, and potential oil supply outages in major producing countries resulting from geopolitical instability, could further contribute to price volatility in 2019. OPEC is scheduled to meet again in December 2019 to review production levels which could potentially result in other supply adjustments and contribute to price fluctuations.
Natural gas prices in 2019 will be affected by the timing of supply and demand growth and the effects of seasonal weather. Natural gas prices in western Canada have seen significant negative price pressure as strong supply continues to surpass regional demand and stress effective pipeline capacity. Despite initial price strength related to lower than normal storage in 2019, mild summer weather and continued production increases in both the Northeast U.S. and associated gas production in the Permian Basin are putting downward pressure on U.S. natural gas prices. As a result, potential for improvement in longer-term U.S. natural gas prices remains limited.
Company Outlook
Encana is well positioned in the current price environment in order to balance growth with the generation of cash flows in excess of capital expenditures. The Company enters into derivative financial instruments which mitigate price volatility and help sustain revenues during periods of lower prices. A portion of the Company’s production is sold at prevailing market prices which also allows Encana to participate in potential price increases. As at June 30, 2019, the Company has hedged approximately 153.5 Mbbls/d of expected crude oil and condensate production and 936 MMcf/d of expected natural gas production for the remainder of the year. Additional information on Encana’s hedging program can be found in Note 22 to the Consolidated Financial Statements included in Part I, Item 1 of this Quarterly Report on Form 10-Q.
Markets for crude oil and natural gas are exposed to different price risks. While the market price for crude oil tends to move in the same direction as the global market, regional differentials may develop. Natural gas prices may vary between geographic regions depending on local supply and demand conditions. Encana proactively utilizes transportation contracts to diversify the Company’s downstream markets, reducing significant exposure to any given market. Through a combination of derivative financial instruments and transportation capacity, Encana has mitigated the majority of its exposure to Midland and AECO pricing in 2019. In addition, Encana continues to seek new markets to yield higher returns.
The Company’s full year 2019 guidance ranges discussed within Capital Investment, Production and Operating Expenses in this Outlook section reflect the Reportable Guidance ranges.

52 Management’s Discussion and AnalysisPrepared using U.S. GAAP in US$
Q2 Report | For the period ended June 30, 2019
Capital Investment
Encana is on track to meet its full year 2019 capital investment guidance of $2.5 billion to $2.7 billion and expects to fund its capital program from 2019 cash generated from operating activities. During the first six months of 2019, the Company spent $1,486 million, of which $517 million was directed to Permian with 57 net wells drilled, $378 million was directed to Anadarko with 32 net wells drilled since the Newfield acquisition closed on February 13, 2019, and $192 million was directed to Montney with 47 net wells drilled. Capital investment in the Core Assets is expected to be optimized by Encana’s cube development approach to maximize returns and recovery. Capital investment in Montney is expected to be allocated to both Cutbank Ridge and Pipestone areas with a focus on maximizing returns from high margin liquids. The remainder of the capital investment, primarily directed to Eagle Ford, Duvernay, Williston and Uinta, is expected to optimize operating free cash flows.
Encana continually strives to improve well performance and lower costs through innovative techniques. Encana's large-scale cube development model utilizes multi-well pads and advanced completion designs to access stacked pay resource to maximize returns and resource recovery from its reservoirs. Encana deployed cube development in Anadarko in the second quarter of 2019, which reduced well costs by approximately $1.4 million per well in 2019 compared to Newfield’s 2018 well costs, exceeding the Company’s previously announced expected savings of $1 million per well. The impact of Encana’s disciplined capital program and continuous innovation create flexibility and opportunity to grow cash flows and production volumes going forward.
Production
Encana’s shift to a more balanced portfolio has reduced the extent of exposure to commodity market volatility and positioned the Company to generate sustainable future cash flows. During the first six months of 2019, average liquids production volumes were 277.9 Mbbls/d, or 52 percent of total production volumes, and average natural gas production volumes were 1,514 MMcf/d, or 48 percent of total production volumes. In 2019, the Company plans to continue growing liquids production and expects liquids to exceed 50 percent of total production volumes on an annualized basis. The Company is on track to meet its full year 2019 production volumes guidance ranges for liquids of 290.0 Mbbls/d to 310.0 Mbbls/d and natural gas of 1,500 MMcf/d to 1,600 MMcf/d as a result of the Newfield acquisition and the Company’s capital plans for its Core Assets.
Operating Expenses
For 2019, Encana has guided towards Total Costs in the range of $12.75 per BOE to $13.25 per BOE. Total Costs includes production, mineral and other taxes, upstream transportation and processing expense, upstream operating expense and administrative expense. Total Costs excludes the impact of long-term incentive and restructuring costs. In the first six months of 2019, Total Costs of $13.06 per BOE are within the full year 2019 guidance range and are expected to trend downward as integration synergies are realized. Upstream transportation and processing expense was $6.70 per BOE, while upstream operating expense and administrative expense, excluding long-term incentive costs and restructuring costs, were $3.43 per BOE and $1.67 per BOE, respectively. Encana expects efficiency improvements and effective supply chain management, including favorable price negotiations, to offset any inflationary pressures.
Workforce reductions and operating efficiencies have reduced operating and administrative costs by $44 million to date and are expected to be reduced by approximately $175 million on an annualized basis, compared to the combined costs of Newfield and Encana prior to the acquisition. These synergies surpass the Company’s original estimate of $125 million and exclude expected restructuring costs to be incurred in 2019. To date, restructuring costs of $130 million have been incurred.
Additional information on Encana’s 2019 Corporate Guidance can be accessed on the Company’s website in the Corporate Presentation at www.encana.com.

53Management’s Discussion and AnalysisPrepared using U.S. GAAP in US$
Q2 Report | For the period ended June 30, 2019
Results of Operations
Selected Financial Information
Three months ended June 30, Six months ended June 30, ($ millions) 2019 2018 2019 2018
Product and Service Revenues Upstream product revenues $ 1,594 $ 984 $ 2,839 $ 1,941 Market optimization 250 291 576 592 Service revenues 4 2 5 4
Total Product and Service Revenues 1,848 1,277 3,420 2,537
Gains (Losses) on Risk Management, Net 190 (312 ) (165 ) (276 ) Sublease Revenues 17 18 35 35 Total Revenues 2,055 983 3,290 2,296
Total Operating Expenses (1) 1,517 1,099 2,979 2,075 Operating Income (Loss) 538 (116 ) 311 221 Total Other (Income) Expenses 41 105 120 282 Net Earnings (Loss) Before Income Tax 497 (221 ) 191 (61 ) Income Tax Expense (Recovery) 161 (70 ) 100 (61 )
Net Earnings (Loss) $ 336 $ (151 ) $ 91 $ -
(1) Total Operating Expenses include non-cash items such as DD&A, accretion of asset retirement obligations and long-term incentive costs.
As Encana completed the Newfield acquisition on February 13, 2019, the post-acquisition results of the operations of Newfield are included in the Company’s interim consolidated results beginning February 14, 2019. As a result of the Newfield business combination and the addition of the Anadarko asset to Encana’s portfolio, the Company’s Core Assets were redefined to include Permian and Anadarko in the U.S. and Montney in Canada. The 2018 Core Assets production presentation has been updated to align with the Company’s 2019 Core Assets and reflects Permian and Montney.
Revenues
Encana’s revenues are substantially derived from sales of oil, NGLs and natural gas production. Increases or decreases in Encana’s revenue, profitability and future production are highly dependent on the commodity prices the Company receives. Prices are market driven and fluctuate due to factors beyond the Company’s control, such as supply and demand, seasonality and geopolitical and economic factors. The Canadian Operations realized prices are linked to Edmonton Condensate and AECO, as well as other downstream natural gas benchmarks, including Dawn. The USA Operations realized prices generally reflect WTI and NYMEX benchmark prices, as well as other downstream oil benchmarks, including Houston. The other downstream benchmarks reflect the diversification of the Company’s markets. Realized NGL prices are significantly influenced by oil and other benchmark prices and the NGL production mix. Recent trends in benchmark prices relevant to Encana are shown in the table below.
Benchmark Prices Three months ended June 30, Six months ended June 30,
(average for the period) 2019 2018 2019 2018
Oil & NGLs WTI ($/bbl) $ 59.82 $ 67.88 $ 57.36 $ 65.37 Houston ($/bbl) 66.57 70.59 63.69 68.48 Edmonton Condensate (C$/bbl) 74.73 88.84 70.97 84.28
Natural Gas NYMEX ($/MMBtu) $ 2.64 $ 2.80 $ 2.89 $ 2.90 AECO (C$/Mcf) 1.17 1.03 1.56 1.44 Dawn (C$/MMBtu) 3.13 3.60 3.49 3.71

54 Management’s Discussion and AnalysisPrepared using U.S. GAAP in US$
Q2 Report | For the period ended June 30, 2019
Production Volumes and Realized Prices
Three months ended June 30, Six months ended June 30, Production Volumes (1) Realized Prices (2) Production Volumes (1) Realized Prices (2)
2019 2018 2019 2018 2019 2018 2019 2018
Oil (Mbbls/d, $/bbl)Canadian Operations 0.2 0.4 $ 53.31 $ 58.13 0.3 0.4 $ 44.20 $ 56.87 USA Operations 175.7 84.2 59.12 66.57 149.6 83.4 57.19 64.97 China Operations 3.4 - 67.84 - 2.8 - 66.96 - Total 179.3 84.6 59.27 66.52 152.7 83.8 57.35 64.93
NGLs – Plant Condensate (Mbbls/d, $/bbl) Canadian Operations 44.1 29.9 54.66 67.55 41.4 28.7 52.31 64.48 USA Operations 11.2 3.8 46.65 57.20 8.7 3.2 45.57 55.05 Total 55.3 33.7 53.04 66.38 50.1 31.9 51.14 63.51
NGLs – Other (Mbbls/d, $/bbl)Canadian Operations 15.8 12.5 6.95 26.27 15.9 11.5 13.54 27.99 USA Operations 73.6 24.5 13.19 22.37 59.2 23.1 14.92 21.51 Total 89.4 37.0 12.09 23.69 75.1 34.6 14.63 23.66
Total Oil & NGLs (Mbbls/d, $/bbl)Canadian Operations 60.1 42.8 42.12 55.38 57.6 40.6 41.57 54.06 USA Operations 260.5 112.5 45.60 56.61 217.5 109.7 45.22 55.53 China Operations 3.4 - 67.84 - 2.8 - 66.96 - Total 324.0 155.3 45.19 56.27 277.9 150.3 44.68 55.14
Natural Gas (MMcf/d, $/Mcf)Canadian Operations 988 949 1.70 1.84 1,020 942 2.16 2.16 USA Operations 619 146 1.87 2.07 494 143 2.03 2.29 Total 1,607 1,095 1.76 1.87 1,514 1,085 2.12 2.17
Total Production (MBOE/d, $/BOE)Canadian Operations 224.8 200.9 18.72 20.50 227.8 197.6 20.20 21.37 USA Operations 363.6 137.0 35.85 48.72 299.8 133.6 36.15 48.08 China Operations 3.4 - 67.84 - 2.8 - 66.96 - Total 591.8 337.9 29.52 31.93 530.4 331.2 29.46 32.14
Production Mix (%)Oil & Plant Condensate 40 35 38 35 NGLs – Other 15 11 14 10 Total Oil & NGLs 55 46 52 45 Natural Gas 45 54 48 55
Production Growth Year Over Year (%) (3)
Total Oil & NGLs 109 85 Natural Gas 47 40 Total Production 75 60
Core Assets Production (4) Oil (Mbbls/d) 118.9 55.5 101.2 55.0 NGLs – Plant Condensate (Mbbls/d) 47.6 26.3 42.7 24.3 NGLs – Other (Mbbls/d) 79.1 28.3 65.5 26.3 Total Oil & NGLs (Mbbls/d) 245.6 110.1 209.4 105.6 Natural Gas (MMcf/d) 1,348 926 1,280 908 Total Production (MBOE/d) 470.3 264.4 422.6 256.8 % of Total Encana Production 79 78 80 78
(1) Average daily.(2) Average per-unit prices, excluding the impact of risk management activities.(3) Includes production impacts of acquisitions and divestitures.(4) Core Assets production presentation aligns with the Company’s 2019 Core Assets, which include Permian, Anadarko and Montney. Core Assets
production for 2018 has been updated and reflects Permian and Montney.

55Management’s Discussion and AnalysisPrepared using U.S. GAAP in US$
Q2 Report | For the period ended June 30, 2019
Upstream Product Revenues Three months ended June 30,
($ millions) Oil NGLs - Plant
Condensate NGLs -
Other Natural
Gas (1) Total
2018 Upstream Product Revenues $ 511 $ 203 $ 80 $ 187 $ 981 Increase (decrease) due to:
Sales prices (28 ) (56 ) (53 ) (34 ) (171 ) Production volumes 485 119 71 105 780
2019 Upstream Product Revenues $ 968 $ 266 $ 98 $ 258 $ 1,590
Six months ended June 30,
($ millions) Oil NGLs - Plant
Condensate NGLs -
Other Natural
Gas (1) Total
2018 Upstream Product Revenues $ 985 $ 366 $ 148 $ 428 $ 1,927 Increase (decrease) due to:
Sales prices (91 ) (98 ) (74 ) (17 ) (280 ) Production volumes 692 196 124 170 1,182
2019 Upstream Product Revenues $ 1,586 $ 464 $ 198 $ 581 $ 2,829
(1) Natural gas revenues for the second quarter and the first six months of 2019 exclude certain other revenue and royalty adjustments with no associated production volumes of $4 million and $10 million, respectively (2018 - royalty adjustments of $3 million and $14 million, respectively).
Oil Revenues
Three months ended June 30, 2019 versus June 30, 2018
Oil revenues increased $457 million compared to the second quarter of 2018 primarily due to:
• Higher average oil production volumes of 94.7 Mbbls/d increased revenues by $485 million. Higher volumes wereprimarily due to the Newfield acquisition (76.9 Mbbls/d) and successful drilling programs in Anadarko and Permian(19.7 Mbbls/d);
partially offset by:
• Lower average realized oil prices of $7.25 per bbl, or 11 percent, decreased revenues by $28 million. The decreasereflected a lower WTI benchmark price which was down 12 percent.
Six months ended June 30, 2019 versus June 30, 2018
Oil revenues increased $601 million compared to the first six months of 2018 primarily due to:
• Higher average oil production volumes of 68.9 Mbbls/d increased revenues by $692 million. Higher volumes wereprimarily due to the Newfield acquisition (58.2 Mbbls/d) and successful drilling programs in Permian and Anadarko(12.9 Mbbls/d), partially offset by the sale of the San Juan assets in the fourth quarter of 2018 (2.7 Mbbls/d); and
• Lower average realized oil prices of $7.58 per bbl, or 12 percent, decreased revenues by $91 million. The decreasereflected a lower WTI benchmark price which was down 12 percent.

56 Management’s Discussion and AnalysisPrepared using U.S. GAAP in US$
Q2 Report | For the period ended June 30, 2019
NGL Revenues
Three months ended June 30, 2019 versus June 30, 2018
NGL revenues increased $81 million compared to the second quarter of 2018 primarily due to:
• Higher average plant condensate production volumes of 21.6 Mbbls/d increased revenues by $119 million. Highervolumes were primarily due to successful drilling programs in Montney and Anadarko (14.1 Mbbls/d), the Newfieldacquisition (5.6 Mbbls/d) and reduced third-party plant downtime and pipeline restrictions in Montney (1.8 Mbbls/d);and
• Higher average other NGL production volumes of 52.4 Mbbls/d increased revenues by $71 million. Higher volumeswere primarily due to the Newfield acquisition (35.6 Mbbls/d) and successful drilling programs in Anadarko, Montneyand Permian (19.0 Mbbls/d);
partially offset by:
• Lower average realized plant condensate prices of $13.34 per bbl, or 20 percent, decreased revenues by $56 million.The decrease reflected lower Edmonton Condensate and WTI benchmark prices which were down 16 percent and12 percent, respectively, as well as fluctuations in regional pricing relative to the Edmonton Condensate and WTIbenchmark prices; and
• Lower average realized other NGL prices of $11.60 per bbl, or 49 percent, decreased revenues by $53 million reflectinglower other NGL benchmark prices.
Six months ended June 30, 2019 versus June 30, 2018
NGL revenues increased $148 million compared to the first six months of 2018 primarily due to:
• Higher average plant condensate production volumes of 18.2 Mbbls/d increased revenues by $196 million. Highervolumes were primarily due to successful drilling programs in Montney and Anadarko (13.9 Mbbls/d) and the Newfieldacquisition (4.2 Mbbls/d); and
• Higher average other NGL production volumes of 40.5 Mbbls/d increased revenues by $124 million. Higher volumeswere primarily due to the Newfield acquisition (26.9 Mbbls/d) and successful drilling programs in Anadarko, Montneyand Permian (15.8 Mbbls/d);
partially offset by:
• Lower average realized plant condensate prices of $12.37 per bbl, or 19 percent, decreased revenues by $98 million.The decrease reflected lower Edmonton Condensate and WTI benchmark prices which were down 16 percent and12 percent, respectively, as well as fluctuations in regional pricing relative to the Edmonton Condensate and WTIbenchmark prices; and
• Lower average realized other NGL prices of $9.03 per bbl, or 38 percent, decreased revenues by $74 million reflectinglower other NGL benchmark prices.
Natural Gas Revenues
Three months ended June 30, 2019 versus June 30, 2018
Natural gas revenues increased $71 million compared to the second quarter of 2018 primarily due to:
• Higher average natural gas production volumes of 512 MMcf/d increased revenues by $105 million primarily due to theNewfield acquisition (450 MMcf/d), successful drilling programs in Montney, Anadarko and Permian (65 MMcf/d), andreduced third-party plant downtime and pipeline restrictions in Montney (25 MMcf/d), partially offset by lowerproduction in Other Upstream Operations primarily due to natural declines (24 MMcf/d) and the sale of the San Juanassets in the fourth quarter of 2018 (9 MMcf/d); and
• Lower average realized natural gas prices $0.11 per Mcf, or six percent, decreased revenues by $34 million reflectinglower Dawn and NYMEX benchmark prices which were down 13 percent and six percent, respectively, weakeningregional pricing in the USA Operations, partially offset by a higher AECO benchmark price which was up 14 percent.

57Management’s Discussion and AnalysisPrepared using U.S. GAAP in US$
Q2 Report | For the period ended June 30, 2019
Six months ended June 30, 2019 versus June 30, 2018
Natural gas revenues increased $153 million compared to the first six months of 2018 primarily due to:
• Higher average natural gas production volumes of 429 MMcf/d increased revenues by $170 million primarily due to theNewfield acquisition (341 MMcf/d) and successful drilling programs in Montney, Permian and Anadarko(122 MMcf/d), partially offset by lower production in Other Upstream Operations primarily due to natural declines(21 MMcf/d) and the sale of the San Juan assets in the fourth quarter of 2018 (9 MMcf/d); and
• Lower average realized natural gas prices of $0.05 per Mcf, or two percent, decreased revenues by $17 million primarilydue to weakening regional pricing.
Gains (Losses) on Risk Management, Net
As a means of managing commodity price volatility, Encana enters into commodity derivative financial instruments on a portion of its expected oil, NGL and natural gas production volumes. The Company’s commodity price mitigation program reduces volatility and helps sustain revenues during periods of lower prices. Additional information on the Company’s commodity price positions as at June 30, 2019 can be found in Note 22 to the Consolidated Financial Statements included in Part I, Item 1 of this Quarterly Report on Form 10-Q.
The following tables provide the effects of Encana’s risk management activities on revenues.
Three months ended June 30, Six months ended June 30, ($ millions) 2019 2018 2019 2018
Realized Gains (Losses) on Risk Management Commodity Price (1)
Oil $ 15 $ (65 ) $ 46 $ (121 ) NGLs - Plant Condensate 3 (37 ) 15 (58 ) NGLs - Other 22 - 33 - Natural Gas 67 116 83 160
Other (2) - - 2 1 Total 107 14 179 (18 )
Unrealized Gains (Losses) on Risk Management 83 (326 ) (344 ) (258 ) Total Gains (Losses) on Risk Management, Net $ 190 $ (312 ) $ (165 ) $ (276 )
Three months ended June 30, Six months ended June 30, (Per-unit) 2019 2018 2019 2018
Realized Gains (Losses) on Risk Management Commodity Price (1)
Oil ($/bbl) $ 0.87 $ (8.52 ) $ 1.65 $ (8.04 ) NGLs - Plant Condensate ($/bbl) $ 0.53 $ (11.90 ) $ 1.60 $ (9.97 ) NGLs - Other ($/bbl) $ 2.66 $ 0.08 $ 2.44 $ 0.04 Natural Gas ($/Mcf) $ 0.46 $ 1.16 $ 0.30 $ 0.81
Total ($/BOE) $ 1.96 $ 0.44 $ 1.84 $ (0.32 )
(1) Includes realized gains and losses related to the Canadian and USA Operations. (2) Other primarily includes realized gains or losses from Market Optimization and other derivative contracts with no associated production volumes.
Encana recognizes fair value changes from its risk management activities each reporting period. The changes in fair value result from new positions and settlements that occur during each period, as well as the relationship between contract prices and the associated forward curves. Realized gains or losses on risk management activities related to commodity price mitigation are included in the Canadian Operations, USA Operations and Market Optimization revenues as the contracts are cash settled. Unrealized gains or losses on fair value changes of unsettled contracts are included in the Corporate and Other segment.

58 Management’s Discussion and AnalysisPrepared using U.S. GAAP in US$
Q2 Report | For the period ended June 30, 2019
Market Optimization Revenues
Market Optimization product revenues relate to activities that provide operational flexibility and cost mitigation for transportation commitments, product type, delivery points and customer diversification. The Company also purchases and sells third-party volumes under long-term marketing arrangements associated with the Company’s previous divestitures.
Three months ended June 30, Six months ended June 30, ($ millions) 2019 2018 2019 2018
Market Optimization $ 250 $ 291 $ 576 $ 592
Three months ended June 30, 2019 versus June 30, 2018
Market Optimization revenues decreased $41 million compared to the second quarter of 2018 primarily due to:
• Lower sales of third-party purchased volumes ($28 million) and lower benchmark prices ($13 million) related to naturalgas.
Six months ended June 30, 2019 versus June 30, 2018
Market Optimization revenues decreased $16 million compared to the first six months of 2018 primarily due to:
• Lower sales of third-party purchased natural gas volumes ($50 million) and lower benchmark prices ($36 million);
partially offset by:
• Higher sales of third-party purchased liquids volumes primarily due to changing conditions relating to Canadian marketcurtailments, resulting in additional third-party purchases to meet firm sales commitments in the first quarter of 2019($70 million).
Sublease Revenues
Sublease revenues primarily include amounts related to the sublease of office space in The Bow office building recorded in the Corporate and Other segment. Additional information on The Bow office sublease can be found in Note 11 to the Consolidated Financial Statements included in Part I, Item 1 of this Quarterly Report on Form 10-Q.
Operating Expenses
Production, Mineral and Other Taxes
Production, mineral and other taxes include production and property taxes. Production taxes are generally assessed as a percentage of oil and natural gas production revenues. Property taxes are generally assessed based on the value of the underlying assets.
Three months ended June 30, Six months ended June 30, ($ millions) 2019 2018 2019 2018
Canadian Operations $ 4 $ 4 $ 8 $ 8 USA Operations 69 31 113 56 Total $ 73 $ 35 $ 121 $ 64
Three months ended June 30, Six months ended June 30, ($/BOE) 2019 2018 2019 2018
Canadian Operations $ 0.22 $ 0.21 $ 0.20 $ 0.22 USA Operations $ 2.07 $ 2.48 $ 2.08 $ 2.31 Total $ 1.36 $ 1.13 $ 1.26 $ 1.06

59Management’s Discussion and AnalysisPrepared using U.S. GAAP in US$
Q2 Report | For the period ended June 30, 2019
Three months ended June 30, 2019 versus June 30, 2018
Production, mineral and other taxes increased $38 million compared to the second quarter of 2018 primarily due to:
• Higher production volumes as a result of the Newfield acquisition ($37 million) and higher assessed property values inPermian ($2 million);
partially offset by:
• The sale of the San Juan assets in the fourth quarter of 2018 ($2 million).
Six months ended June 30, 2019 versus June 30, 2018
Production, mineral and other taxes increased $57 million compared to the first six months of 2018 primarily due to:
• Higher production volumes as a result of the Newfield acquisition ($53 million), higher assessed property values inPermian ($5 million) and the recovery of certain production taxes in 2018 in the USA Operations ($4 million);
partially offset by:
• The sale of the San Juan assets in the fourth quarter of 2018 ($3 million).
Transportation and Processing
Transportation and processing expense includes transportation costs incurred to move product from production points to sales points including gathering, compression, pipeline tariffs, trucking and storage costs. Encana also incurs costs related to processing provided by third parties or through ownership interests in processing facilities to bring raw production to sales-quality product.
Three months ended June 30, Six months ended June 30, ($ millions) 2019 2018 2019 2018
Canadian Operations $ 217 $ 207 $ 429 $ 397 USA Operations 136 31 215 58 Upstream Transportation and Processing 353 238 644 455
Market Optimization 59 34 106 66 Total $ 412 $ 272 $ 750 $ 521
Three months ended June 30, Six months ended June 30, ($/BOE) 2019 2018 2019 2018
Canadian Operations $ 10.60 $ 11.29 $ 10.40 $ 11.09 USA Operations $ 4.09 $ 2.51 $ 3.95 $ 2.39 Upstream Transportation and Processing $ 6.54 $ 7.73 $ 6.70 $ 7.58
Three months ended June 30, 2019 versus June 30, 2018
Transportation and processing expense increased $140 million compared to the second quarter of 2018 primarily due to:
• Higher production volumes as a result of the Newfield acquisition and successful drilling in Anadarko ($105 million),and growth in Montney ($27 million);
partially offset by:
• Lower U.S./Canadian dollar exchange rate ($7 million).
Upstream transportation and processing decreased $1.19 per BOE compared to the second quarter of 2018 primarily due to a higher proportion of total production volumes in the USA Operations resulting from the Newfield acquisition.

60 Management’s Discussion and AnalysisPrepared using U.S. GAAP in US$
Q2 Report | For the period ended June 30, 2019
Six months ended June 30, 2019 versus June 30, 2018
Transportation and processing expense increased $229 million compared to the first six months of 2018 primarily due to:
• Higher production volumes as a result of the Newfield acquisition and successful drilling in Anadarko ($160 million),and growth in Montney ($66 million);
partially offset by:
• Lower U.S./Canadian dollar exchange rate ($16 million).
Upstream transportation and processing decreased $0.88 per BOE compared to the first six months of 2018 primarily due to a higher proportion of total production volumes in the USA Operations resulting from the Newfield acquisition.
Operating
Operating expense includes costs paid by Encana, net of amounts capitalized, to operate oil and gas properties in which the Company has a working interest. These costs primarily include labour, service contract fees, chemicals and fuel.
Three months ended June 30, Six months ended June 30, ($ millions) 2019 2018 2019 2018
Canadian Operations $ 27 $ 35 $ 64 $ 64 USA Operations 148 84 263 158 China Operations 8 - 12 - Upstream Operating Expense 183 119 339 222
Market Optimization 5 13 15 17 Corporate & Other (1 ) 5 (2 ) 9 Total $ 187 $ 137 $ 352 $ 248
Three months ended June 30, Six months ended June 30, ($/BOE) 2019 2018 2019 2018
Canadian Operations $ 1.27 $ 1.89 $ 1.54 $ 1.75 USA Operations $ 4.46 $ 6.75 $ 4.84 $ 6.52 China Operations $ 27.68 $ - $ 23.80 $ - Upstream Operating Expense (1) $ 3.39 $ 3.86 $ 3.52 $ 3.67
(1) Upstream Operating Expense per BOE for the second quarter and first six months of 2019 includes a recovery of long-term incentive costs of $0.01/BOEand long-term incentive costs of $0.09/BOE, respectively (2018 - long-term incentive costs of $0.46/BOE and $0.17/BOE, respectively).
Three months ended June 30, 2019 versus June 30, 2018
Operating expense increased $50 million compared to the second quarter of 2018 primarily due to:
• The Newfield acquisition and growth in Anadarko ($91 million), and higher activity in Permian ($4 million);
partially offset by:
• A recovery of long-term incentive costs resulting from the decrease in Encana’s share price in the second quarter of2019 compared to long-term incentive costs resulting from an increase in the share price in the second quarter of 2018($24 million), lower activity in Eagle Ford ($6 million), lower salaries and benefits in the Canadian Operations ($3million) and the sale of the San Juan assets in the fourth quarter of 2018 ($3 million).

61Management’s Discussion and AnalysisPrepared using U.S. GAAP in US$
Q2 Report | For the period ended June 30, 2019
Six months ended June 30, 2019 versus June 30, 2018
Operating expense increased $104 million compared to the first six months of 2018 primarily due to:
• The Newfield acquisition and growth in Anadarko, as well as higher activity in Permian and Montney ($140 million);
partially offset by:
• Lower activity in Eagle Ford ($7 million), lower salaries and benefits in the Canadian Operations ($5 million), the saleof the San Juan assets in the fourth quarter of 2018 ($5 million) and lower long-term incentive costs resulting from adecrease in Encana’s share price ($4 million).
Additional information on Encana’s long-term incentives can be found in Note 19 to the Consolidated Financial Statements included in Part I, Item 1 of this Quarterly Report on Form 10-Q.
Purchased Product
Purchased product expense includes purchases of oil, NGLs and natural gas from third parties that are used to provide operational flexibility and cost mitigation for transportation commitments, product type, delivery points and customer diversification. The Company also purchases and sells third-party volumes under long-term marketing arrangements associated with the Company’s previous divestitures.
Three months ended June 30, Six months ended June 30, ($ millions) 2019 2018 2019 2018
Market Optimization $ 222 $ 248 $ 520 $ 521
Three months ended June 30, 2019 versus June 30, 2018
Purchased product expense decreased $26 million compared to the second quarter of 2018 primarily due to:
• Lower third-party purchased volumes ($17 million) and lower benchmark prices ($9 million) related to natural gas.
Six months ended June 30, 2019 versus June 30, 2018
Purchased product expense decreased $1 million compared to the first six months of 2018 primarily due to:
• Lower third-party purchased natural gas volumes ($45 million) and lower benchmark prices ($29 million);
partially offset by:
• Higher third-party purchased liquids volumes primarily due to changing conditions relating to Canadian marketcurtailments in the first quarter of 2019, resulting in additional third-party purchases to meet firm sales commitments inthe first quarter of 2019 ($73 million).
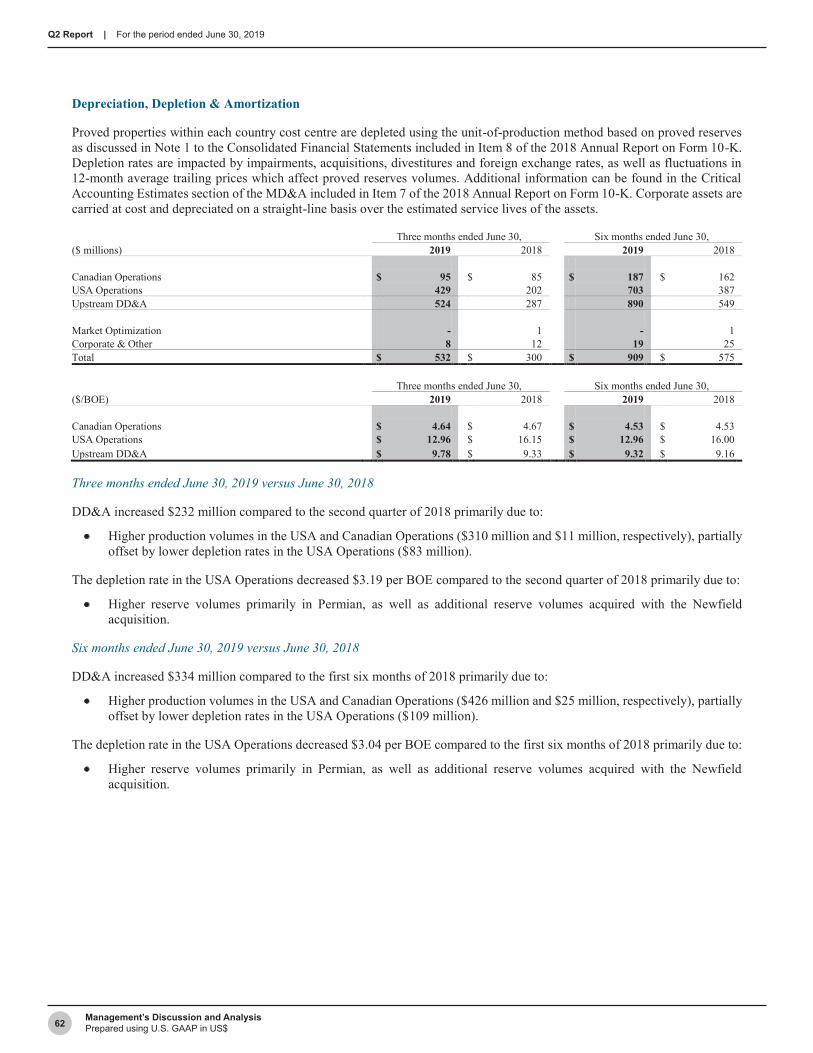
62 Management’s Discussion and AnalysisPrepared using U.S. GAAP in US$
Q2 Report | For the period ended June 30, 2019
Depreciation, Depletion & Amortization
Proved properties within each country cost centre are depleted using the unit-of-production method based on proved reserves as discussed in Note 1 to the Consolidated Financial Statements included in Item 8 of the 2018 Annual Report on Form 10-K. Depletion rates are impacted by impairments, acquisitions, divestitures and foreign exchange rates, as well as fluctuations in 12-month average trailing prices which affect proved reserves volumes. Additional information can be found in the CriticalAccounting Estimates section of the MD&A included in Item 7 of the 2018 Annual Report on Form 10-K. Corporate assets arecarried at cost and depreciated on a straight-line basis over the estimated service lives of the assets.
Three months ended June 30, Six months ended June 30, ($ millions) 2019 2018 2019 2018
Canadian Operations $ 95 $ 85 $ 187 $ 162 USA Operations 429 202 703 387 Upstream DD&A 524 287 890 549
Market Optimization - 1 - 1 Corporate & Other 8 12 19 25 Total $ 532 $ 300 $ 909 $ 575
Three months ended June 30, Six months ended June 30, ($/BOE) 2019 2018 2019 2018
Canadian Operations $ 4.64 $ 4.67 $ 4.53 $ 4.53 USA Operations $ 12.96 $ 16.15 $ 12.96 $ 16.00 Upstream DD&A $ 9.78 $ 9.33 $ 9.32 $ 9.16
Three months ended June 30, 2019 versus June 30, 2018
DD&A increased $232 million compared to the second quarter of 2018 primarily due to:
• Higher production volumes in the USA and Canadian Operations ($310 million and $11 million, respectively), partiallyoffset by lower depletion rates in the USA Operations ($83 million).
The depletion rate in the USA Operations decreased $3.19 per BOE compared to the second quarter of 2018 primarily due to:
• Higher reserve volumes primarily in Permian, as well as additional reserve volumes acquired with the Newfieldacquisition.
Six months ended June 30, 2019 versus June 30, 2018
DD&A increased $334 million compared to the first six months of 2018 primarily due to:
• Higher production volumes in the USA and Canadian Operations ($426 million and $25 million, respectively), partiallyoffset by lower depletion rates in the USA Operations ($109 million).
The depletion rate in the USA Operations decreased $3.04 per BOE compared to the first six months of 2018 primarily due to:
• Higher reserve volumes primarily in Permian, as well as additional reserve volumes acquired with the Newfieldacquisition.

63Management’s Discussion and AnalysisPrepared using U.S. GAAP in US$
Q2 Report | For the period ended June 30, 2019
Administrative
Administrative expense represents costs associated with corporate functions provided by Encana staff in Calgary, Denver and The Woodlands offices. Costs primarily include salaries and benefits, general office, information technology, restructuring and long-term incentive costs.
Three months ended June 30, Six months ended June 30, ($ millions) 2019 2018 2019 2018
Administrative, excluding Long-Term Incentive and Restructuring Costs $ 79 $ 43 $ 161 $ 86
Long-term incentive costs (15 ) 56 17 44 Restructuring costs 17 - 130 -
Total Administrative $ 81 $ 99 $ 308 $ 130
Three months ended June 30, Six months ended June 30, ($/BOE) 2019 2018 2019 2018
Administrative, excluding Long-Term Incentive and Restructuring Costs $ 1.48 $ 1.36 $ 1.67 $ 1.43
Long-term incentive costs (0.28 ) 1.84 0.18 0.74 Restructuring costs 0.31 - 1.36 -
Total Administrative $ 1.51 $ 3.20 $ 3.21 $ 2.17
Three months ended June 30, 2019 versus June 30, 2018
Administrative expense in the second quarter of 2019 decreased $18 million compared to the second quarter of 2018 primarily due to a recovery of long-term incentive costs resulting from a decrease in Encana’s share price in the second quarter of 2019 compared to long-term incentive costs resulting from an increase in the share price in the second quarter of 2018 ($71 million), partially offset by the impact from adopting ASC Topic 842, “Leases”, as discussed further below ($28 million), restructuring costs incurred in 2019 ($17 million) and costs related to the Newfield acquisition ($9 million), including non-recurring integration expenses of $4 million.
Six months ended June 30, 2019 versus June 30, 2018
Administrative expense in the first six months of 2019 increased $178 million compared to the first six months of 2018 primarily due to restructuring costs incurred in 2019 ($130 million), the impact from adopting ASC Topic 842, “Leases”, as discussed further below ($56 million) and costs related to the Newfield acquisition ($17 million), including non-recurring integration expenses of $8 million, partially offset by lower long-term incentive costs resulting from a decrease in Encana’s share price ($27 million).
During the first six months of 2019, Encana completed workforce reductions in conjunction with the Newfield acquisition to better align staffing levels and the organizational structure. Additional information on restructuring charges can be found in Note 18 to the Consolidated Financial Statements included in Part I, Item 1 of this Quarterly Report on Form 10-Q.
On January 1, 2019, Encana adopted ASC Topic 842 which requires all operating leases to be recognized on the Balance Sheet. As a result, The Bow office building was determined to be an operating lease with the lease payments recorded in administrative expense starting in 2019. Previously, payments related to The Bow office building were recognized as interest expense and principal repayment. Prior periods have not been restated and are reported in accordance with ASC Topic 840, “Leases”. Additional information on the adoption of ASC Topic 842 can be found in Notes 2 and 11 to the Consolidated Financial Statements included in Part I, Item 1 of this Quarterly Report on Form 10-Q.

64 Management’s Discussion and AnalysisPrepared using U.S. GAAP in US$
Q2 Report | For the period ended June 30, 2019
Other (Income) Expenses
Three months ended June 30, Six months ended June 30, ($ millions) 2019 2018 2019 2018
Interest $ 99 $ 81 $ 186 $ 173 Foreign exchange (gain) loss, net (55 ) 25 (92 ) 116 (Gain) loss on divestitures, net - (1 ) 1 (4 ) Other (gains) losses, net (3 ) - 25 (3 ) Total Other (Income) Expenses $ 41 $ 105 $ 120 $ 282
Interest
Interest expense primarily includes interest on Encana’s long-term debt arising from U.S. dollar denominated unsecured notes. Additional information on changes in interest can be found in Note 5 to the Consolidated Financial Statements included in Part I, Item 1 of this Quarterly Report on Form 10-Q.
Interest expense in the second quarter of 2019 increased $18 million compared to the second quarter of 2018 due to higher interest expense on long-term debt primarily relating to Newfield’s outstanding senior notes and issuances under the Company’s U.S. commercial paper (“U.S. CP”) program ($30 million) and an interest recovery due to the resolution of certain tax items relating to prior taxation years in 2018 ($11 million), partially offset by the change in accounting treatment for The Bow office building as a result of the adoption of ASC Topic 842 ($16 million) and lower interest expense resulting from the repayment of the Company’s $500 million senior note in the second quarter of 2019 ($4 million).
Interest expense in the first six months of 2019 increased $13 million compared to the first six months of 2018 due to higher interest expense on long-term debt primarily relating to Newfield’s outstanding senior notes and issuances under the Company’s U.S. CP program ($46 million) and an interest recovery due to the resolution of certain tax items relating to prior taxation years in 2018 ($11 million), partially offset by the change in accounting treatment for The Bow office building as a result of the adoption of ASC Topic 842 ($32 million), capitalized interest ($5 million) and lower interest expense resulting from the repayment of the Company’s $500 million senior note in the second quarter of 2019 ($4 million).
Additional information on the adoption of ASC Topic 842 can be found in Notes 2 and 11 to the Consolidated Financial Statements included in Part I, Item 1 of this Quarterly Report on Form 10-Q.
Foreign Exchange (Gain) Loss, Net
Foreign exchange gains and losses primarily result from the impact of fluctuations in the Canadian to U.S. dollar exchange rate. Additional information on changes in foreign exchange gains or losses can be found in Note 6 to the Consolidated Financial Statements included in Part I, Item 1 of this Quarterly Report on Form 10-Q. Additional information on foreign exchange rates and the effects of foreign exchange rate changes can be found in Item 3 of this Quarterly Report on Form 10-Q.
Three months ended June 30, 2019 versus June 30, 2018
In the second quarter of 2019, Encana recorded a net foreign exchange gain of $55 million compared to a loss in 2018 of $25 million primarily due to:
• Unrealized foreign exchange gains on the translation of U.S. dollar financing debt issued from Canada compared tolosses in 2018 ($182 million), realized foreign exchange gains on the settlement of intercompany notes compared tolosses in 2018 ($14 million) and realized foreign exchange gains on the settlement of U.S. dollar financing debt issuedfrom Canada compared to losses in 2018 ($12 million);
partially offset by:
• Unrealized foreign exchange losses on the translation of intercompany notes compared to gains in 2018 ($126 million).
65Management’s Discussion and AnalysisPrepared using U.S. GAAP in US$
Q2 Report | For the period ended June 30, 2019
Six months ended June 30, 2019 versus June 30, 2018
In the first six months of 2019, Encana recorded a net foreign exchange gain of $92 million compared to a loss in 2018 of $116 million primarily due to:
• Unrealized foreign exchange gains on the translation of U.S. dollar financing debt issued from Canada compared tolosses in 2018 ($397 million) and unrealized foreign exchange gains on the translation of U.S. dollar risk managementcontracts issued from Canada compared to losses in 2018 ($28 million);
partially offset by:
• Unrealized foreign exchange losses on the translation of intercompany notes compared to gains in 2018 ($186 million)and lower realized foreign exchange gains on the settlement of intercompany notes compared to 2018 ($24 million).
Other (Gains) Losses, Net
Other (gains) losses, net, primarily includes other non-recurring revenues or expenses and may also include items such as interest income, interest received from tax authorities, reclamation charges relating to decommissioned assets and adjustments related to other assets.
Other losses in the first six months of 2019 primarily includes legal fees and transaction costs related to the Newfield acquisition of $33 million, partially offset by interest income of $9 million.

66 Management’s Discussion and AnalysisPrepared using U.S. GAAP in US$
Q2 Report | For the period ended June 30, 2019
Income Tax
Three months ended June 30, Six months ended June 30, ($ millions) 2019 2018 2019 2018
Current Income Tax Expense (Recovery) $ 3 $ (64 ) $ 4 $ (61 ) Deferred Income Tax Expense (Recovery) 158 (6 ) 96 - Income Tax Expense (Recovery) $ 161 $ (70 ) $ 100 $ (61 )
Effective Tax Rate 32.4% 31.7% 52.4% 100.0%
Income Tax Expense (Recovery)
Three months ended June 30, 2019 versus June 30, 2018
In the second quarter of 2019, Encana recorded an income tax expense of $161 million compared to an income tax recovery of $70 million in 2018. Income tax expense for the three months ended June 30, 2019, was impacted by the Alberta tax rate reduction as discussed below. The income tax recovery recorded for the three months ended June 30, 2018, was mainly a result of the resolution of certain tax items relating to prior taxation years.
On June 28, 2019, Alberta Bill 3, the Job Creation Tax Cut (Alberta Corporate Tax Amendment) Act, was signed into law resulting in a reduction of the Alberta corporate tax rate from 12 percent to 11 percent effective July 1, 2019, with further one percent rate reductions to take effect every year on January 1 until the general corporate tax rate is eight percent on January 1, 2022. During the three months ended June 30, 2019, the deferred tax expense of $158 million includes an adjustment of $55 million resulting from the re-measurement of the Company’s deferred tax position due to the Alberta tax rate reduction.
Six months ended June 30, 2019 versus June 30, 2018
In the first six months of 2019, Encana recorded an income tax expense of $100 million compared to an income tax recovery of $61 million in 2018, primarily due to the impact of the Alberta tax rate reduction discussed above and net earnings before income tax in the first six months of 2019, compared to a net loss before income tax in 2018 and the tax impact resulting from the resolution of certain tax items relating to prior taxation years in 2018.
Effective Tax Rate
Encana’s interim income tax expense is determined using the estimated annual effective income tax rate applied to year-to-date net earnings before income tax plus the effect of legislative changes and amounts in respect of prior periods. The estimated annual effective income tax rate is primarily impacted by expected annual earnings, income tax related to foreign operations, the effect of legislative changes, non-taxable capital gains and losses, tax differences on divestitures and transactions, and partnership tax allocations in excess of funding.
The Company’s effective tax rate was 32.4 percent for the second quarter and 52.4 percent for the first six months of 2019, which are higher than the Canadian statutory rate of 26.6 percent primarily resulting from the re-measurement of the Company’s deferred tax position due to the Alberta tax rate reduction, partially offset by the impact of the foreign jurisdictional tax rates relative to the Canadian statutory tax rate applied to jurisdictional earnings and partnership tax allocations in excess of funding.
Tax interpretations, regulations and legislation in the various jurisdictions in which the Company and its subsidiaries operate are subject to change and interpretation. As a result, there are tax matters under review for which the timing of resolution is uncertain. The Company believes that the provision for income taxes is adequate.

67Management’s Discussion and AnalysisPrepared using U.S. GAAP in US$
Q2 Report | For the period ended June 30, 2019
Liquidity and Capital Resources
Sources of Liquidity
The Company has the flexibility to access cash equivalents and a range of funding alternatives at competitive rates through committed revolving credit facilities as well as debt and equity capital markets. Encana closely monitors the accessibility of cost-effective credit and ensures that sufficient liquidity is in place to fund capital expenditures and dividend payments. In addition, the Company may use cash and cash equivalents, cash from operating activities, or proceeds from asset divestitures to fund its operations or to manage its capital structure as discussed below. At June 30, 2019, $71 million in cash and cash equivalents was held by U.S. subsidiaries. The cash held by U.S. subsidiaries is accessible and may be subject to additional Canadian income taxes and U.S. withholding taxes if repatriated.
The Company’s capital structure consists of total shareholders’ equity plus long-term debt, including the current portion. The Company’s objectives when managing its capital structure are to maintain financial flexibility to preserve Encana’s access to capital markets and its ability to meet financial obligations and finance internally generated growth, as well as potential acquisitions. Encana has a practice of maintaining capital discipline and strategically managing its capital structure by adjusting capital spending, adjusting dividends paid to shareholders, issuing new shares, purchasing shares for cancellation, issuing new debt or repaying existing debt.
As at June 30, ($ millions, except as indicated) 2019 2018
Cash and Cash Equivalents $ 167 $ 336 Available Credit Facility – Encana (1) 2,500 2,500 Available Credit Facility – U.S. Subsidiary (1) 1,500 1,500 Issuance of U.S. Commercial Paper (761 ) - Total Liquidity $ 3,406 $ 4,336
Long-Term Debt, including current portion (2) $ 7,052 $ 4,198 Total Shareholders’ Equity (3) $ 10,015 $ 6,497
Debt to Capitalization (%) (4) 41 39 Debt to Adjusted Capitalization (%) (5) 28 23
(1) Collectively, the “Credit Facilities”.(2) Long-Term Debt as at June 30, 2019, includes outstanding U.S. CP totaling $761 million and the senior notes acquired in conjunction with the Newfield
business combination on February 13, 2019, totaling $2,450 million.(3) Shareholders’ Equity reflects the common shares issued to Newfield shareholders on February 13, 2019, totaling $3,478 million and the common shares
purchased, for cancellation, under Encana’s NCIB program. (4) Calculated as long-term debt, including the current portion, divided by shareholders’ equity plus long-term debt, including the current portion.(5) A non-GAAP measure which is defined in the Non-GAAP Measures section of this MD&A.
At the end of the second quarter of 2019, the Company had $761 million of commercial paper outstanding under its U.S. CP program to provide for short-term funding requirements, which is supported by Encana’s $2.5 billion revolving credit facility. Further details on the U.S. CP program can be found in the Sources and Uses of Cash section of this MD&A.
Encana is currently in compliance with, and expects that it will continue to be in compliance with, all financial covenants under the Credit Facilities. Management monitors Debt to Adjusted Capitalization, which is a non-GAAP measure defined in the Non-GAAP Measures section of this MD&A, as a proxy for Encana’s financial covenant under the Credit Facilities, which requires debt to adjusted capitalization to be less than 60 percent. As at June 30, 2019, Debt to Adjusted Capitalization was 28 percent. The definitions used in the covenant under the Credit Facilities adjust capitalization for cumulative historical ceiling test impairments that were recorded as at December 31, 2011 in conjunction with the Company’s January 1, 2012 adoption of U.S. GAAP. Additional information on financial covenants can be found in Note 13 to the Consolidated Financial Statements included in Item 8 of the 2018 Annual Report on Form 10-K.
The Company’s debt-based metrics have increased over the prior year due to the increase in long-term debt resulting from the Newfield acquisition. Further details on the Company’s debt-based metrics can be found in the Non-GAAP Measures section of this MD&A.
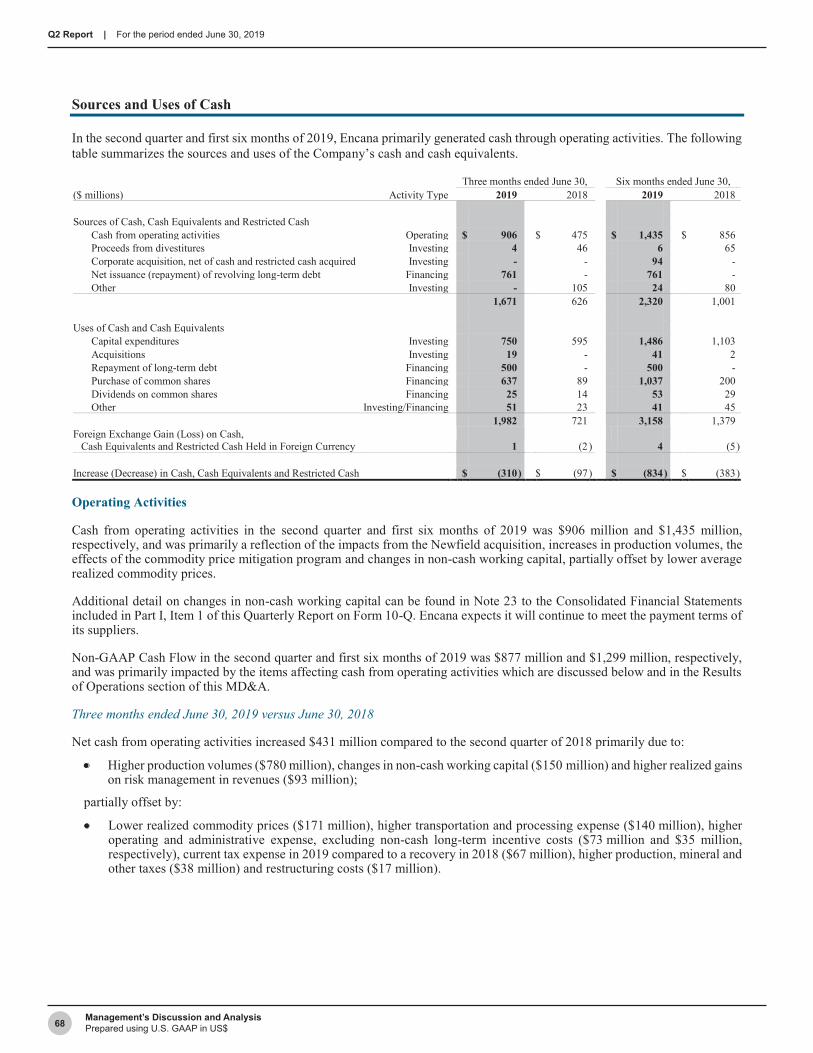
68 Management’s Discussion and AnalysisPrepared using U.S. GAAP in US$
Q2 Report | For the period ended June 30, 2019
Sources and Uses of Cash
In the second quarter and first six months of 2019, Encana primarily generated cash through operating activities. The following table summarizes the sources and uses of the Company’s cash and cash equivalents.
Three months ended June 30, Six months ended June 30, ($ millions) Activity Type 2019 2018 2019 2018
Sources of Cash, Cash Equivalents and Restricted Cash Cash from operating activities Operating $ 906 $ 475 $ 1,435 $ 856 Proceeds from divestitures Investing 4 46 6 65 Corporate acquisition, net of cash and restricted cash acquired Investing - - 94 - Net issuance (repayment) of revolving long-term debt Financing 761 - 761 - Other Investing - 105 24 80
1,671 626 2,320 1,001
Uses of Cash and Cash Equivalents Capital expenditures Investing 750 595 1,486 1,103 Acquisitions Investing 19 - 41 2 Repayment of long-term debt Financing 500 - 500 - Purchase of common shares Financing 637 89 1,037 200 Dividends on common shares Financing 25 14 53 29 Other Investing/Financing 51 23 41 45
1,982 721 3,158 1,379 Foreign Exchange Gain (Loss) on Cash, Cash Equivalents and Restricted Cash Held in Foreign Currency 1 (2 ) 4 (5 )
Increase (Decrease) in Cash, Cash Equivalents and Restricted Cash $ (310 ) $ (97 ) $ (834 ) $ (383 )
Operating Activities
Cash from operating activities in the second quarter and first six months of 2019 was $906 million and $1,435 million, respectively, and was primarily a reflection of the impacts from the Newfield acquisition, increases in production volumes, the effects of the commodity price mitigation program and changes in non-cash working capital, partially offset by lower average realized commodity prices.
Additional detail on changes in non-cash working capital can be found in Note 23 to the Consolidated Financial Statements included in Part I, Item 1 of this Quarterly Report on Form 10-Q. Encana expects it will continue to meet the payment terms of its suppliers.
Non-GAAP Cash Flow in the second quarter and first six months of 2019 was $877 million and $1,299 million, respectively, and was primarily impacted by the items affecting cash from operating activities which are discussed below and in the Results of Operations section of this MD&A.
Three months ended June 30, 2019 versus June 30, 2018
Net cash from operating activities increased $431 million compared to the second quarter of 2018 primarily due to:
• Higher production volumes ($780 million), changes in non-cash working capital ($150 million) and higher realized gainson risk management in revenues ($93 million);
partially offset by:
• Lower realized commodity prices ($171 million), higher transportation and processing expense ($140 million), higheroperating and administrative expense, excluding non-cash long-term incentive costs ($73 million and $35 million,respectively), current tax expense in 2019 compared to a recovery in 2018 ($67 million), higher production, mineral andother taxes ($38 million) and restructuring costs ($17 million).

69Management’s Discussion and AnalysisPrepared using U.S. GAAP in US$
Q2 Report | For the period ended June 30, 2019
Six months ended June 30, 2019 versus June 30, 2018
Net cash from operating activities increased $579 million compared to the first six months of 2018 primarily due to:
• Higher production volumes ($1,182 million), changes in non-cash working capital ($276 million) and realized gains onrisk management in revenues in the first six months of 2019 compared to realized losses in 2018 ($197 million);
partially offset by:
• Lower realized commodity prices ($280 million), higher transportation and processing expense ($229 million),restructuring costs ($130 million), higher operating and administrative expense, excluding non-cash long-term incentivecosts ($126 million and $106 million, respectively), current tax expense in 2019 compared to a recovery in 2018($65 million), higher production, mineral and other taxes ($57 million) and acquisition costs ($33 million).
Investing Activities
Cash used in investing activities in the first six months of 2019 was $1,403 million primarily due to capital expenditures. Capital expenditures increased $383 million compared to the first six months of 2018 due to an increase in the Company’s capital program for 2019 relating to the Anadarko asset acquired in the Newfield acquisition ($378 million). Capital expenditures exceeded cash from operating activities by $51 million and the difference was funded using cash on hand.
Corporate acquisition in the first six months of 2019 was $94 million, which reflected the net cash and restricted cash acquired upon the Newfield business combination. The restricted cash acquired was $53 million and is segregated from general operating cash to fund the future reclamation costs in China.
Acquisitions in the first six months of 2019 were $41 million which included seismic purchases and water rights.
Divestitures in the first six months of 2019 were $6 million, which primarily included the sale of certain properties that did not complement Encana’s existing portfolio of assets. Divestitures in the first six months of 2018 were $65 million, which primarily included the sale of certain Pipestone assets in Alberta.
Capital expenditures and acquisition and divestiture activity are summarized in Notes 3, 8 and 9 to the Consolidated Financial Statements included in Part I, Item 1 of this Quarterly Report on Form 10-Q.
Financing Activities
Net cash used in financing activities over the past three years has been impacted by Encana’s strategy to enhance liquidity, strengthen its balance sheet and return value to shareholders through the purchase of common shares under a NCIB. The Company has paid dividends each of the past three years and increased its dividend in the first quarter of 2019.
Net cash used in financing activities in the first six months of 2019 increased $596 million compared to the first six months of 2018 primarily due to the purchase of common shares under a NCIB as discussed below ($837 million), repayment of long-term debt ($500 million), as well as increased dividends paid ($24 million) in the first six months of 2019 compared to the first six months of 2018, partially offset by the issuance of commercial paper under the Company’s U.S. CP program ($761 million). Further detail on Encana’s U.S. CP program can be found below.
Encana’s long-term debt totaled $7,052 million at June 30, 2019 and $4,198 million at December 31, 2018. On May 15, 2019, the Company repaid the $500 million 6.50 percent senior note using proceeds from the U.S. CP program.
Following the completion of the Newfield acquisition on February 13, 2019, Newfield’s senior notes totaling $2.45 billion remained outstanding as at June 30, 2019. These include a $750 million 5.75 percent senior note due January 30, 2022, a $1.0 billion 5.625 percent senior note due July 1, 2024 and a $700 million 5.375 percent senior note due January 1, 2026. For additional information on long-term debt, refer to Note 12 to the Consolidated Financial Statements included in Part I, Item 1 of this Quarterly Report on Form 10-Q. The increase in long-term debt resulting from the Newfield acquisition increased the Company’s debt-based metrics. Further details on the Company’s debt-based metrics can be found in the Non-GAAP Measures section of this MD&A.

70 Management’s Discussion and AnalysisPrepared using U.S. GAAP in US$
Q2 Report | For the period ended June 30, 2019
The Company has access to two credit facilities totaling $4.0 billion, which remain committed through July 2022. The Credit Facilities provide financial flexibility and allow the Company to fund its operations, development activities or capital programs. At June 30, 2019, no amounts were outstanding under the Credit Facilities. During the second quarter of 2019, the Company utilized its U.S. CP program which is supported by Encana’s $2.5 billion revolving credit facility. At June 30, 2019, Encana had $761 million of commercial paper outstanding under its U.S. CP program with an average term of 61 days and a weighted average interest rate of approximately 3.11 percent. Management expects these amounts will continue to be supported by the revolving credit facility that has no repayment requirements within the next year.
The Credit Facilities, together with cash and cash equivalents less any outstanding commercial paper, provide Encana with total liquidity of $3.4 billion. At June 30, 2019, Encana also had approximately $138 million in undrawn letters of credit issued in the normal course of business primarily as collateral security, to support future abandonment liabilities and for transportation arrangements.
Encana has filed a Canadian shelf prospectus and a U.S. shelf registration statement, under which the Company may issue from time to time, debt securities, common shares, Class A preferred shares, subscription receipts, warrants, units, share purchase contracts and share purchase units in Canada and/or the U.S. At June 30, 2019, $6.0 billion remained accessible under the Canadian shelf prospectus. The ability to issue securities under the Canadian shelf prospectus or U.S. shelf registration statement is dependent upon market conditions.
Dividends
Encana pays quarterly dividends to shareholders at the discretion of the Board of Directors.
Three months ended June 30, Six months ended June 30, ($ millions, except as indicated) 2019 2018 2019 2018
Dividend Payments (1) $ 25 $ 14 $ 53 $ 29 Dividend Payments ($/share) $ 0.01875 $ 0.015 $ 0.0375 $ 0.03
(1) 2018 includes common shares issued in lieu of cash dividends under Encana’s Dividend Reinvestment Plan (“DRIP”). On February 28, 2019, the Company announced the suspension of its DRIP effective immediately.
As previously announced, the Company increased its dividend by 25 percent in the first quarter of 2019 as part of Encana’s commitment to returning capital to shareholders. The increase in dividends paid of $24 million was due to additional common shares issued as part of the Newfield acquisition, in addition to the 25 percent increase in the dividend per share, partially offset by common shares purchased, for cancellation, pursuant to the previously announced NCIB in February 2019.
On July 30, 2019, the Board of Directors declared a dividend of $0.01875 per common share payable on September 30, 2019 to common shareholders of record as of September 13, 2019.
Normal Course Issuer Bid
On February 27, 2019, the Company announced it received approval from the TSX to purchase up to approximately 149.4 million common shares, for cancellation, pursuant to a NCIB over a 12-month period commencing March 4, 2019 and ending March 3, 2020. In the second quarter and first six months of 2019, the Company used cash on hand to purchase, for cancellation, approximately 93.5 million and 149.4 million common shares, respectively, for total consideration of approximately $637 million and $1,037 million, respectively.
In the second quarter and first six months of 2018, the Company used cash on hand to purchase, for cancellation, approximately 6.8 million and 16.8 million common shares, respectively, for total consideration of approximately $89 million and $200 million, respectively, under the previous NCIB which commenced on February 28, 2018 and expired on February 27, 2019.
For additional information on the NCIB, refer to Note 15 to the Consolidated Financial Statements included in Part I, Item 1 of this Quarterly Report on Form 10-Q.

71Management’s Discussion and AnalysisPrepared using U.S. GAAP in US$
Q2 Report | For the period ended June 30, 2019
Substantial Issuer Bid
On June 10, 2019, the Company announced its intention to purchase, for cancellation, up to $213 million of its outstanding common shares through a substantial issuer bid, which commenced on July 8, 2019 and expires on August 14, 2019, unless the Offer is extended, withdrawn or varied.
The Offer is not conditional on receipt of financing or on any minimum number of common shares being tendered to the Offer, but is subject to other conditions. Encana intends to fund any purchases of common shares pursuant to the Offer from cash on hand, drawing on existing credit facilities or through the issuance of commercial paper.
Off-Balance Sheet Arrangements
For information on off-balance sheet arrangements and transactions, refer to the Off-Balance Sheet Arrangements section of the MD&A included in Item 7 of the 2018 Annual Report on Form 10-K.
Commitments and Contingencies
For information on commitments and contingencies, refer to Note 24 to the Consolidated Financial Statements included in Part I, Item 1 of this Quarterly Report on Form 10-Q.
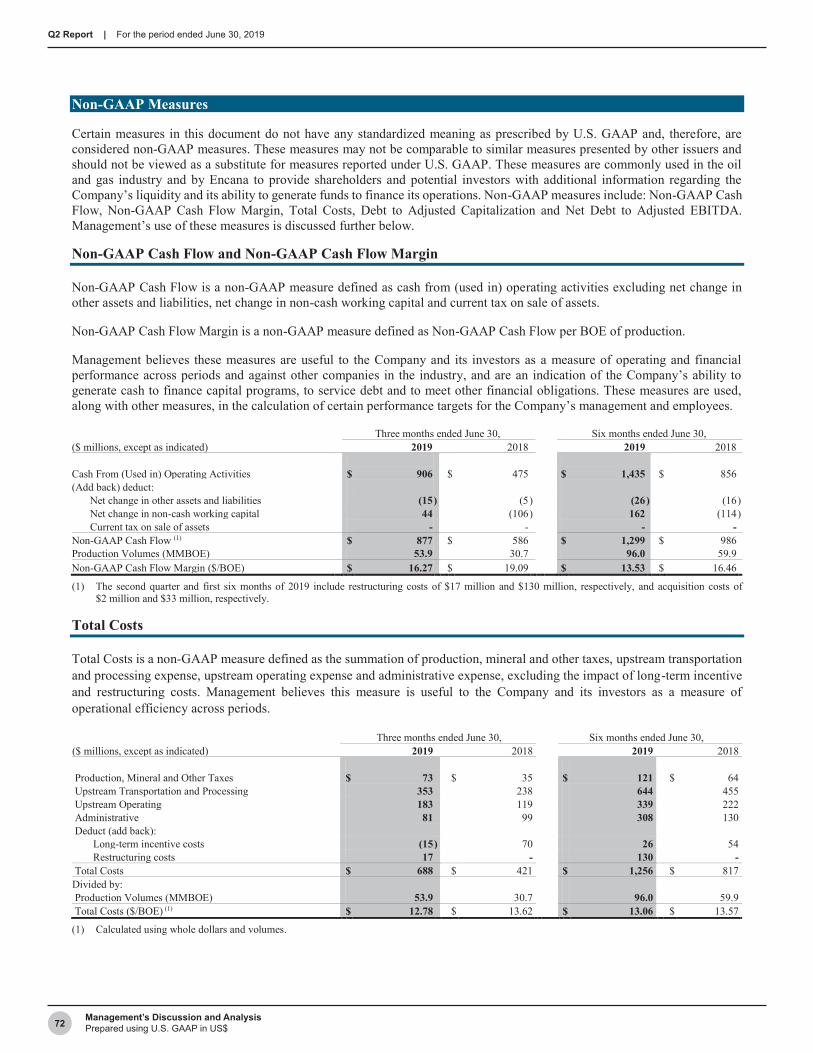
72 Management’s Discussion and AnalysisPrepared using U.S. GAAP in US$
Q2 Report | For the period ended June 30, 2019
Non-GAAP Measures
Certain measures in this document do not have any standardized meaning as prescribed by U.S. GAAP and, therefore, are considered non-GAAP measures. These measures may not be comparable to similar measures presented by other issuers and should not be viewed as a substitute for measures reported under U.S. GAAP. These measures are commonly used in the oil and gas industry and by Encana to provide shareholders and potential investors with additional information regarding the Company’s liquidity and its ability to generate funds to finance its operations. Non-GAAP measures include: Non-GAAP Cash Flow, Non-GAAP Cash Flow Margin, Total Costs, Debt to Adjusted Capitalization and Net Debt to Adjusted EBITDA. Management’s use of these measures is discussed further below.
Non-GAAP Cash Flow and Non-GAAP Cash Flow Margin
Non-GAAP Cash Flow is a non-GAAP measure defined as cash from (used in) operating activities excluding net change in other assets and liabilities, net change in non-cash working capital and current tax on sale of assets.
Non-GAAP Cash Flow Margin is a non-GAAP measure defined as Non-GAAP Cash Flow per BOE of production.
Management believes these measures are useful to the Company and its investors as a measure of operating and financial performance across periods and against other companies in the industry, and are an indication of the Company’s ability to generate cash to finance capital programs, to service debt and to meet other financial obligations. These measures are used, along with other measures, in the calculation of certain performance targets for the Company’s management and employees.
Three months ended June 30, Six months ended June 30, ($ millions, except as indicated) 2019 2018 2019 2018
Cash From (Used in) Operating Activities $ 906 $ 475 $ 1,435 $ 856 (Add back) deduct:
Net change in other assets and liabilities (15 ) (5 ) (26 ) (16 ) Net change in non-cash working capital 44 (106 ) 162 (114 ) Current tax on sale of assets - - - -
Non-GAAP Cash Flow (1) $ 877 $ 586 $ 1,299 $ 986 Production Volumes (MMBOE) 53.9 30.7 96.0 59.9 Non-GAAP Cash Flow Margin ($/BOE) $ 16.27 $ 19.09 $ 13.53 $ 16.46
(1) The second quarter and first six months of 2019 include restructuring costs of $17 million and $130 million, respectively, and acquisition costs of $2 million and $33 million, respectively.
Total Costs
Total Costs is a non-GAAP measure defined as the summation of production, mineral and other taxes, upstream transportation and processing expense, upstream operating expense and administrative expense, excluding the impact of long-term incentive and restructuring costs. Management believes this measure is useful to the Company and its investors as a measure of operational efficiency across periods.
Three months ended June 30, Six months ended June 30, ($ millions, except as indicated) 2019 2018 2019 2018
Production, Mineral and Other Taxes $ 73 $ 35 $ 121 $ 64 Upstream Transportation and Processing 353 238 644 455 Upstream Operating 183 119 339 222 Administrative 81 99 308 130 Deduct (add back):
Long-term incentive costs (15 ) 70 26 54 Restructuring costs 17 - 130 -
Total Costs $ 688 $ 421 $ 1,256 $ 817 Divided by: Production Volumes (MMBOE) 53.9 30.7 96.0 59.9 Total Costs ($/BOE) (1) $ 12.78 $ 13.62 $ 13.06 $ 13.57
(1) Calculated using whole dollars and volumes.

73Management’s Discussion and AnalysisPrepared using U.S. GAAP in US$
Q2 Report | For the period ended June 30, 2019
Debt to Adjusted Capitalization
Debt to Adjusted Capitalization is a non-GAAP measure which adjusts capitalization for historical ceiling test impairments that were recorded as at December 31, 2011. Management monitors Debt to Adjusted Capitalization as a proxy for Encana’s financial covenant under the Credit Facilities which require debt to adjusted capitalization to be less than 60 percent. Adjusted Capitalization includes debt, total shareholders’ equity and an equity adjustment for cumulative historical ceiling test impairments recorded as at December 31, 2011 in conjunction with the Company’s January 1, 2012 adoption of U.S. GAAP.
($ millions, except as indicated) June 30, 2019 December 31, 2018
Long-Term Debt, including current portion $ 7,052 $ 4,198 Total Shareholders’ Equity 10,015 7,447 Equity Adjustment for Impairments at December 31, 2011 7,746 7,746 Adjusted Capitalization $ 24,813 $ 19,391 Debt to Adjusted Capitalization 28% 22%
The increase in Debt to Adjusted Capitalization is primarily due to the increase in long-term debt resulting from the Newfield acquisition.
Net Debt to Adjusted EBITDA
Net Debt to Adjusted EBITDA is a non-GAAP measure whereby Net Debt is defined as long-term debt, including the current portion, less cash and cash equivalents and Adjusted EBITDA is defined as trailing 12-month net earnings (loss) before income taxes, DD&A, impairments, accretion of asset retirement obligation, interest, unrealized gains/losses on risk management, foreign exchange gains/losses, gains/losses on divestitures and other gains/losses.
Management believes this measure is useful to the Company and its investors as a measure of financial leverage and the Company’s ability to service its debt and other financial obligations. This measure is used, along with other measures, in the calculation of certain financial performance targets for the Company’s management and employees.
($ millions, except as indicated) June 30, 2019 December 31, 2018
Long-Term Debt, including current portion $ 7,052 $ 4,198 Less:
Cash and cash equivalents 167 1,058 Net Debt 6,885 3,140
Net Earnings (Loss) 1,160 1,069 Add back (deduct):
Depreciation, depletion and amortization 1,606 1,272 Impairments - - Accretion of asset retirement obligation 35 32 Interest 364 351 Unrealized (gains) losses on risk management (433 ) (519 ) Foreign exchange (gain) loss, net (40 ) 168 (Gain) loss on divestitures, net - (5 ) Other (gains) losses, net 45 17 Income tax expense (recovery) 255 94
Adjusted EBITDA (trailing 12-month) $ 2,992 $ 2,479 Net Debt to Adjusted EBITDA (times) 2.3 1.3
The increase in Net Debt is primarily due to the increase in long-term debt resulting from the Newfield acquisition, whereas Adjusted EBITDA only includes Newfield’s results of operations for the post-acquisition period from February 14, 2019 to June 30, 2019. The Company expects Net Debt to Adjusted EBITDA to trend downward through the remainder of 2019.
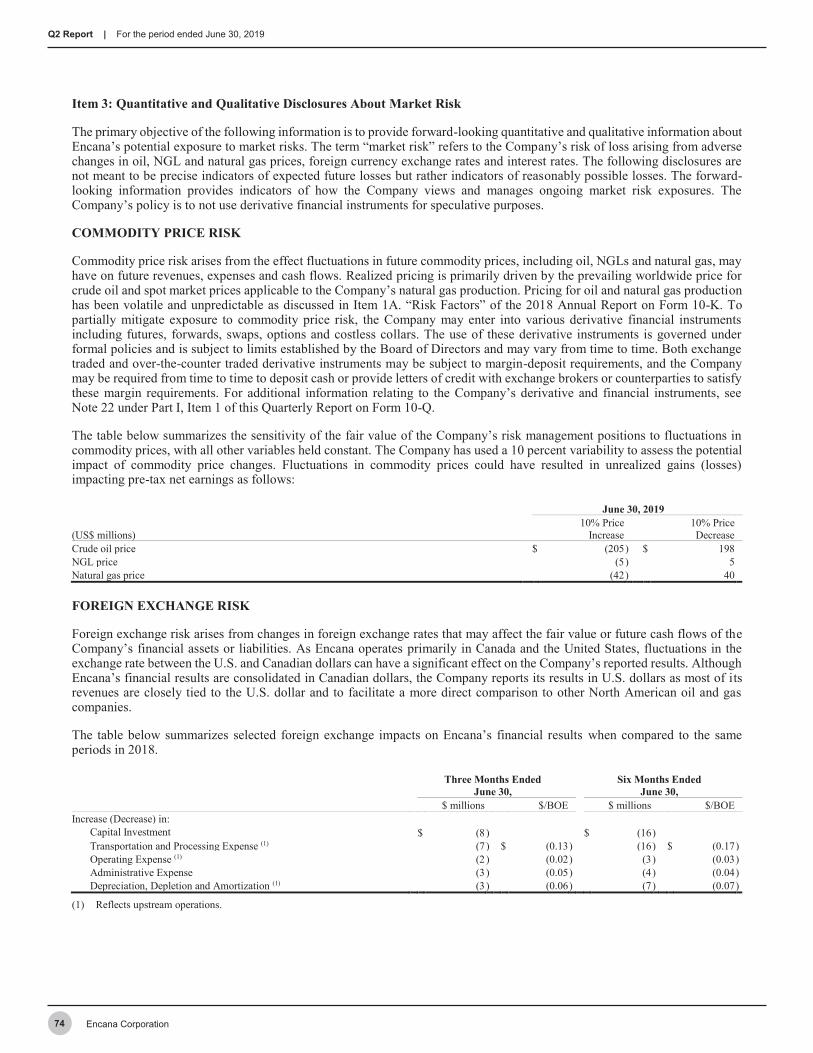
Encana Corporation74
Q2 Report | For the period ended June 30, 2019
Item 3: Quantitative and Qualitative Disclosures About Market Risk
The primary objective of the following information is to provide forward-looking quantitative and qualitative information about Encana’s potential exposure to market risks. The term “market risk” refers to the Company’s risk of loss arising from adverse changes in oil, NGL and natural gas prices, foreign currency exchange rates and interest rates. The following disclosures are not meant to be precise indicators of expected future losses but rather indicators of reasonably possible losses. The forward-looking information provides indicators of how the Company views and manages ongoing market risk exposures. The Company’s policy is to not use derivative financial instruments for speculative purposes.
COMMODITY PRICE RISK
Commodity price risk arises from the effect fluctuations in future commodity prices, including oil, NGLs and natural gas, may have on future revenues, expenses and cash flows. Realized pricing is primarily driven by the prevailing worldwide price for crude oil and spot market prices applicable to the Company’s natural gas production. Pricing for oil and natural gas production has been volatile and unpredictable as discussed in Item 1A. “Risk Factors” of the 2018 Annual Report on Form 10-K. To partially mitigate exposure to commodity price risk, the Company may enter into various derivative financial instruments including futures, forwards, swaps, options and costless collars. The use of these derivative instruments is governed under formal policies and is subject to limits established by the Board of Directors and may vary from time to time. Both exchange traded and over-the-counter traded derivative instruments may be subject to margin-deposit requirements, and the Company may be required from time to time to deposit cash or provide letters of credit with exchange brokers or counterparties to satisfy these margin requirements. For additional information relating to the Company’s derivative and financial instruments, see Note 22 under Part I, Item 1 of this Quarterly Report on Form 10-Q.
The table below summarizes the sensitivity of the fair value of the Company’s risk management positions to fluctuations in commodity prices, with all other variables held constant. The Company has used a 10 percent variability to assess the potential impact of commodity price changes. Fluctuations in commodity prices could have resulted in unrealized gains (losses) impacting pre-tax net earnings as follows:
June 30, 2019
(US$ millions) 10% Price
Increase 10% Price Decrease
Crude oil price $ (205 ) $ 198 NGL price (5 ) 5 Natural gas price (42 ) 40
FOREIGN EXCHANGE RISK
Foreign exchange risk arises from changes in foreign exchange rates that may affect the fair value or future cash flows of the Company’s financial assets or liabilities. As Encana operates primarily in Canada and the United States, fluctuations in the exchange rate between the U.S. and Canadian dollars can have a significant effect on the Company’s reported results. Although Encana’s financial results are consolidated in Canadian dollars, the Company reports its results in U.S. dollars as most of its revenues are closely tied to the U.S. dollar and to facilitate a more direct comparison to other North American oil and gas companies.
The table below summarizes selected foreign exchange impacts on Encana’s financial results when compared to the same periods in 2018.
Three Months Ended June 30,
Six Months Ended June 30,
$ millions $/BOE $ millions $/BOE Increase (Decrease) in:
Capital Investment $ (8 ) $ (16 ) Transportation and Processing Expense (1) (7 ) $ (0.13 ) (16 ) $ (0.17 ) Operating Expense (1) (2 ) (0.02 ) (3 ) (0.03 ) Administrative Expense (3 ) (0.05 ) (4 ) (0.04 ) Depreciation, Depletion and Amortization (1) (3 ) (0.06 ) (7 ) (0.07 )
(1) Reflects upstream operations.

75Encana Corporation
Q2 Report | For the period ended June 30, 2019
Foreign exchange gains and losses also arise when monetary assets and monetary liabilities denominated in foreign currencies are translated and settled, and primarily include:
• U.S. dollar denominated financing debt issued from Canada• U.S. dollar denominated risk management assets and liabilities held in Canada• U.S. dollar denominated cash and short-term investments held in Canada• Foreign denominated intercompany loans
To partially mitigate the effect of foreign exchange fluctuations on future commodity revenues and expenses, the Company may enter into foreign currency derivative contracts. As at June 30, 2019, Encana has entered into $500 million notional U.S. dollar denominated currency swaps at an average exchange rate of US$0.7516 to C$1, which mature monthly through the remainder of 2019 and $250 million notional U.S. dollar denominated currency swaps at an average exchange rate of US$0.7443 to C$1, which mature monthly throughout 2020.
As at June 30, 2019, Encana had $4.5 billion in U.S. dollar long-term debt and $201 million in U.S. dollar finance lease obligations issued from Canada that were subject to foreign exchange exposure.
The table below summarizes the sensitivity to foreign exchange rate fluctuations, with all other variables held constant. The Company has used a 10 percent variability to assess the potential impact from Canadian to U.S. foreign currency exchange rate changes. Fluctuations in foreign currency exchange rates could have resulted in unrealized gains (losses) impacting pre-tax net earnings as follows:
June 30, 2019
(US$ millions) 10% Rate
Increase 10% Rate Decrease
Foreign currency exchange $ (180 ) $ 220
INTEREST RATE RISK
Interest rate risk arises from changes in market interest rates that may affect the fair value or future cash flows from the Company’s financial assets or liabilities. The Company may partially mitigate its exposure to interest rate changes by holding a mix of both fixed and floating rate debt and may also enter into interest rate derivatives to partially mitigate effects of fluctuations in market interest rates.
As at June 30, 2019, the Company had floating rate debt of $761 million. Accordingly, the sensitivity in net earnings for each one percent change in interest rates on floating rate debt was $6 million (2018 - nil).

Encana Corporation76
Q2 Report | For the period ended June 30, 2019
Item 4: Controls and Procedures
DISCLOSURE CONTROLS AND PROCEDURES
Encana’s Chief Executive Officer and Chief Financial Officer performed an evaluation of the Company’s disclosure controls and procedures as defined in Rules 13a-15(e) and 15d-15(e) of the Securities Exchange Act of 1934, as amended (“Exchange Act”). The Company’s disclosure controls and procedures are designed to ensure that information required to be disclosed by the Company in reports it files or submits under the Exchange Act is recorded, processed, summarized, and reported within the time periods specified in the rules and forms of the SEC, and to ensure that the information required to be disclosed by the Company in reports that it files or submits under the Exchange Act, is accumulated and communicated to the Company’s management, including the principal executive officer and principal financial officer, as appropriate, to allow timely decisions regarding required disclosure. Based on this evaluation, the Chief Executive Officer and Chief Financial Officer have concluded that the Company’s disclosure controls and procedures were effective as of June 30, 2019.
CHANGES IN INTERNAL CONTROL OVER FINANCIAL REPORTING
For the six months ended June 30, 2019, management’s assessment of, and conclusion on, the effectiveness of internal control over financial reporting did not include the internal controls of the entities acquired in the Newfield acquisition on February 13, 2019. Newfield’s total assets and total revenues represented approximately 27 percent of the Company’s consolidated total assets at June 30, 2019 and approximately 31 percent and 29 percent of the Company’s consolidated total revenues for the three and six months ended June 30, 2019, respectively. Under guidelines established by the SEC, companies are permitted to exclude acquisitions from their assessment of internal control over financial reporting for a period of up to one year following an acquisition while integrating the acquired company. The Company is in the process of integrating Newfield’s and the Company’s internal controls over financial reporting. As a result of these integration activities, certain controls will be evaluated and may be changed. Except as noted above, there were no changes in the Company’s internal control over financial reporting that occurred during the second quarter of 2019 that have materially affected, or are reasonably likely to materially affect, the Company’s internal control over financial reporting.

77Encana Corporation
Q2 Report | For the period ended June 30, 2019
PART II
Item 1. Legal Proceedings
Please refer to Item 3 of the 2018 Annual Report on Form 10-K and Note 24 of Encana’s Condensed Consolidated Financial Statements under Part I, Item 1 of this Quarterly Report on Form 10-Q.
Item 1A. Risk Factors
There have been no material changes from the risk factors disclosed in Item 1A. Risk Factors in the 2018 Annual Report on Form 10-K.
Item 2. Unregistered Sales of Equity Securities and Use of Proceeds
Issuer Purchase of Equity Securities
On February 26, 2018, Encana announced it had received approval from the TSX to purchase, for cancellation, up to 35 million common shares pursuant to a NCIB over a 12-month period from February 28, 2018 to February 27, 2019. On February 27, 2019, Encana announced it had received approval from the TSX to purchase, for cancellation, up to approximately 149.4 million common shares pursuant to a NCIB over a 12-month period from March 4, 2019 to March 3, 2020. On May 1, 2019, Encana received exemptive relief from the securities regulatory authorities in each of the provinces and territories of Canada to allow the purchase of up to 10% of its public float of common shares through the facilities of the NYSE and other U.S.-based trading systems as part of Encana's NCIB announced on February 27, 2019. The exemptive relief applies to a NCIBcommenced by Encana within a period of 36 months, with purchases to be made in compliance with applicable U.S. rulesgoverning share repurchases and Part 6 (Order Protection) of National Instrument 23-101 Trading Rules. The exemptive reliefdoes not impact the aggregate maximum number of common shares that Encana may repurchase under the NCIB across allmarkets.
During the three months ended June 30, 2019, the Company purchased approximately 93.5 million common shares for total consideration of approximately $637 million at a weighted average price of $6.81. The following table presents the common shares purchased during the three months ended June 30, 2019.
Period Total Number of
Shares Purchased
AveragePrice Paid
per Share (1)
Total Number of Shares Purchased as Part of Publicly
Announced Plans or Programs
Maximum Number of Shares That May Yet be Purchased
Under the Plans or Programs April 1 to April 30, 2019 36,522,400 $ 7.23 36,522,400 57,022,939 May 1 to May 31, 2019 57,022,939 6.54 57,022,939 - June 1 to June 30, 2019 - - - - Total 93,545,339 $ 6.81 93,545,339 -
(1) Includes commissions.
Item 3. Defaults Upon Senior Securities
None.
Item 4. Mine Safety Disclosures
Not applicable.
Item 5. Other Information
None.
Encana Corporation78
Q2 Report | For the period ended June 30, 2019
Item 6. Exhibits
Exhibit No Description 4.1 Amended and Restated Shareholder Rights Plan Agreement, dated as of April 30, 2019, between Encana Corporation and AST
Trust Company (Canada), as rights agent (incorporated by reference to Exhibit 4.1 to Encana’s Current Report on Form 8-K filed May 1, 2019, SEC File No. 001-15226).
10.1 Second Amending Agreement dated as of May 6, 2019, among Encana Corporation as borrower, the financial institutions party thereto as lenders and Royal Bank of Canada as agent (incorporated by reference to Exhibit 10.1 to Encana’s Current Report on Form 8-K filed May 7, 2019, SEC File No. 001-15226).
10.2 Change in Control Agreement between Encana Corporation and Corey Code effective May 1, 2019 (incorporated by reference to Exhibit d(13) to Encana’s Tender Offer Statement on Schedule TO filed on July 8, 2019, SEC File No. 005-78843)
31.1 Certification of Chief Executive Officer pursuant to Rule 13a-14(a) or 15d-14(a) of the Securities Exchange Act of 1934. 31.2 Certification of Chief Financial Officer pursuant to Rule 13a-14(a) or 15d-14(a) of the Securities Exchange Act of 1934. 32.1 Certification of Chief Executive Officer pursuant to 18 U.S.C. Section 1350. 32.2 Certification of Chief Financial Officer pursuant to 18 U.S.C. Section 1350. 101.INS XBRL Instance Document - the instance document does not appear in the Interactive Data File because its XBRL tags are
embedded within the Inline XBRL document. 101.SCH XBRL Taxonomy Schema Document. 101.CAL XBRL Calculation Linkbase Document. 101.DEF XBRL Definition Linkbase Document. 101.LAB XBRL Label Linkbase Document. 101.PRE XBRL Presentation Linkbase Document.

79Encana Corporation
Q2 Report | For the period ended June 30, 2019
SIGNATURES
Pursuant to the requirements of the Securities Exchange Act of 1934, the registrant has duly caused this report to be signed on its behalf by the undersigned, thereunto duly authorized.
ENCANA CORPORATION
By: /s/ Corey D. Code
Name: Corey D. Code Title: Executive Vice-President &
Chief Financial Officer
Dated: August 1, 2019

Encana Corporation
Interim Supplemental Information(unaudited)
For the period ended June 30, 2019
U.S. Dollars / U.S. Protocol

81Supplemental InformationPrepared in US$
Q2 Report | For the period ended June 30, 2019
Supplemental Financial Information (unaudited)
Financial Results
(US$ millions, unless otherwise specified) Year-to-
date Q2 Q1 Year Q4 Q3 Q2 Year-
to-date Q2 Q1
Net Earnings (Loss) 91 336 (245) 1,069 1,030 39 - (151) 151 Per share - basic and diluted (1) 0.07 0.24 (0.20) 1.11 1.08 0.04 - (0.16) 0.16
Non-GAAP Operating Earnings (Loss) (2) 455 290 165 822 305 163 354 198 156 Per share - basic and diluted (1) 0.35 0.21 0.14 0.86 0.32 0.17 0.37 0.21 0.16
Non-GAAP Cash Flow (3) 1,299 877 422 2,115 540 589 986 586 400 Per share - basic and diluted (1) 1.00 0.64 0.35 2.20 0.57 0.62 1.02 0.61 0.41
Effective Tax Rate usingCanadian Statutory Rate 26.6% 27.0%
Foreign Exchange Rates (US$ per C$1)Average 0.750 0.748 0.752 0.772 0.758 0.765 0.783 0.775 0.791 Period end 0.764 0.764 0.748 0.733 0.733 0.773 0.759 0.759 0.776
Non-GAAP Operating Earnings Summary
Net Earnings (Loss) 91 336 (245) 1,069 1,030 39 - (151) 151 Before-tax (Addition) Deduction:
Unrealized gain (loss) on risk management (344) 83 (427) 519 941 (164) (258) (326) 68 Restructuring charges (130) (17) (113) - - - - - -Non-operating foreign exchange gain (loss) 83 46 37 (184) (76) 24 (132) (32) (100) Gain (loss) on divestitures (1) - (1) 5 1 - 4 1 3
(392) 112 (504) 340 866 (140) (386) (357) (29) Income tax 28 (66) 94 (93) (141) 16 32 8 24
After-tax (Addition) Deduction (364) 46 (410) 247 725 (124) (354) (349) (5)Non-GAAP Operating Earnings (Loss) (2) 455 290 165 822 305 163 354 198 156
Non-GAAP Cash Flow Summary
Cash From (Used in) Operating Activities 1,435 906 529 2,300 559 885 856 475 381 (Add back) Deduct:
Net change in other assets and liabilities (26) (15) (11) (60) (27) (17) (16) (5) (11) Net change in non-cash working capital 162 44 118 245 46 313 (114) (106) (8) Current tax on sale of assets - - - - - - - - -
Non-GAAP Cash Flow (3) 1,299 877 422 2,115 540 589 986 586 400Non-GAAP Cash Flow Margin ($/BOE) (4) 13.53 16.27 10.02 16.05 14.56 16.93 16.46 19.09 13.70
(1)
Year-to-date Q2 Q1 Year Q4 Q3
Q2 Year-to-date Q2 Q1
Weighted Average Common Shares OutstandingBasic 1,301.2 1,381.0 1,221.3 959.8 952.5 955.1 965.7 960.0 971.5 Diluted 1,301.2 1,381.0 1,221.3 959.8 952.5 955.1 965.7 960.0 971.5
(2)
(3)
(4) Non-GAAP Cash Flow Margin is a non-GAAP measure calculated as Non-GAAP Cash Flow per BOE of production.
Financial Metrics2019 2018
Year-to-date Year
Debt to Adjusted Capitalization (1) (2) 28% 22%Net Debt to Adjusted EBITDA (1) (2) (3) 2.3x 1.3x
(1)
(2)(3) Adjusted EBITDA only includes Newfield's results of operations for the post-acquisition period from February 14, 2019 to June 30, 2019.
The Company's debt-based metrics have increased over the prior year due to the increase in long-term debt resulting from the Newfield Exploration Company ("Newfield") acquisition.
These financial metrics are non-GAAP measures monitored by Management as indicators of the Company's overall financial strength. These non-GAAP measures are defined andcalculated in the Non-GAAP Definitions and Reconciliations document located on the Company's website.
Non-GAAP Cash Flow is a non-GAAP measure defined as cash from (used in) operating activities excluding net change in other assets and liabilities, net change in non-cash workingcapital and current tax on sale of assets.
2018
Non-GAAP Operating Earnings (Loss) is a non-GAAP measure defined as net earnings (loss) excluding non-recurring or non-cash items that Management believes reduces thecomparability of the Company's financial performance between periods. These items may include, but are not limited to, unrealized gains/losses on risk management, impairments,restructuring charges, non-operating foreign exchange gains/losses, gains/losses on divestitures and gains on debt retirement. Income taxes may include valuation allowances and theprovision related to the pre-tax items listed, as well as income taxes related to divestitures and U.S. tax reform, and adjustments to normalize the effect of income taxes calculated usingthe estimated annual effective income tax rate.
2018
Net Earnings (Loss), Non-GAAP Operating Earnings (Loss) and Non-GAAP Cash Flow per common share are calculated using the weighted average number of Encana common sharesoutstanding as follows:
(millions)
2019
2019

82 Supplemental InformationPrepared in US$
Q2 Report | For the period ended June 30, 2019
Supplemental Operating Information (unaudited)
Production Volumes by Product
(average) % of
Oil & NGLs Year-to-
date Q2 Q1 Year Q4 Q3 Q2 Year-
to-date Q2 Q1
Oil (Mbbls/d) 55 152.7 179.3 125.8 89.9 96.5 95.5 83.8 84.6 83.0 NGLs - Plant Condensate (Mbbls/d) 18 50.1 55.3 44.9 39.0 50.9 41.0 31.9 33.7 30.2
Oil & Plant Condensate (Mbbls/d) 73 202.8 234.6 170.7 128.9 147.4 136.5 115.7 118.3 113.2 Butane (Mbbls/d) 7 18.4 21.2 15.6 12.0 14.5 13.1 10.2 11.1 9.3 Propane (Mbbls/d) 10 28.2 32.7 23.7 16.3 19.4 17.6 14.1 15.2 12.9 Ethane (Mbbls/d) 10 28.5 35.5 21.4 10.9 11.4 11.5 10.3 10.7 9.8
NGLs - Other (Mbbls/d) 27 75.1 89.4 60.7 39.2 45.3 42.2 34.6 37.0 32.0 Oil & NGLs (Mbbls/d) 100 277.9 324.0 231.4 168.1 192.7 178.7 150.3 155.3 145.2
Natural Gas (MMcf/d) 1,514 1,607 1,421 1,158 1,265 1,197 1,085 1,095 1,075
Total (MBOE/d) 530.4 591.8 468.2 361.2 403.4 378.2 331.2 337.9 324.4
Production Volumes by Segment
(average) Year-to-
date Q2 Q1 Year Q4 Q3 Q2 Year-
to-date Q2 Q1
Oil (Mbbls/d)Canadian Operations 0.3 0.2 0.3 0.4 0.4 0.3 0.4 0.4 0.4 USA Operations 149.6 175.7 123.2 89.5 96.1 95.2 83.4 84.2 82.6 China Operations (1) 2.8 3.4 2.3 - - - - - -
152.7 179.3 125.8 89.9 96.5 95.5 83.8 84.6 83.0 NGLs - Plant Condensate (Mbbls/d)
Canadian Operations 41.4 44.1 38.7 35.2 46.8 36.3 28.7 29.9 27.5 USA Operations 8.7 11.2 6.2 3.8 4.1 4.7 3.2 3.8 2.7
50.1 55.3 44.9 39.0 50.9 41.0 31.9 33.7 30.2 NGLs - Other (Mbbls/d)
Canadian Operations 15.9 15.8 16.1 14.0 18.6 14.4 11.5 12.5 10.4 USA Operations 59.2 73.6 44.6 25.2 26.7 27.8 23.1 24.5 21.6
75.1 89.4 60.7 39.2 45.3 42.2 34.6 37.0 32.0
NGLs - Total (Mbbls/d)Canadian Operations 57.3 59.9 54.8 49.2 65.4 50.7 40.2 42.4 37.9 USA Operations 67.9 84.8 50.8 29.0 30.8 32.5 26.3 28.3 24.3
125.2 144.7 105.6 78.2 96.2 83.2 66.5 70.7 62.2
Oil & NGLs (Mbbls/d)Canadian Operations 57.6 60.1 55.1 49.6 65.8 51.0 40.6 42.8 38.3 USA Operations 217.5 260.5 174.0 118.5 126.9 127.7 109.7 112.5 106.9 China Operations (1) 2.8 3.4 2.3 - - - - - -
277.9 324.0 231.4 168.1 192.7 178.7 150.3 155.3 145.2
Natural Gas (MMcf/d)Canadian Operations 1,020 988 1,054 1,007 1,106 1,038 942 949 936 USA Operations 494 619 367 151 159 159 143 146 139
1,514 1,607 1,421 1,158 1,265 1,197 1,085 1,095 1,075
Total (MBOE/d)Canadian Operations 227.8 224.8 230.7 217.5 250.1 224.1 197.6 200.9 194.3 USA Operations 299.8 363.6 235.2 143.7 153.3 154.1 133.6 137.0 130.1 China Operations (1) 2.8 3.4 2.3 - - - - - -
530.4 591.8 468.2 361.2 403.4 378.2 331.2 337.9 324.4 (1) The Company acquired its China Operations as part of the Newfield business combination on February 13, 2019. Production from China Operations is presented beginning February 14,
2019.
2018
20182019
2019

83Supplemental InformationPrepared in US$
Q2 Report | For the period ended June 30, 2019
Supplemental Financial & Operating Information (unaudited)Results of OperationsRevenues and Realized Gains (Losses) on Risk Management
(US$ millions) Year-to-
date Q2 Q1 Year Q4 Q3 Q2 Year-
to-date Q2 Q1
Canadian OperationsRevenues, excluding Realized Gains (Losses) on Risk Management (1)
Oil 3 2 1 7 1 1 5 2 3 NGLs (2) 430 228 202 863 214 257 392 213 179 Natural Gas 400 153 247 826 270 188 368 159 209
833 383 450 1,696 485 446 765 374 391 Realized Gains (Losses) on Risk Management
Oil - - - - - - - - - NGLs (2) 29 12 17 (90) 12 (44) (58) (37) (21) Natural Gas 58 55 3 190 (5) 52 143 110 33
87 67 20 100 7 8 85 73 12
USA OperationsRevenues, excluding Realized Gains (Losses) on Risk Management (1)
Oil 1,549 945 604 2,093 527 586 980 509 471 NGLs (2) 232 136 96 289 70 97 122 70 52 Natural Gas 181 105 76 126 35 31 60 28 32
1,962 1,186 776 2,508 632 714 1,162 607 555 Realized Gains (Losses) on Risk Management
Oil 46 15 31 (235) (27) (87) (121) (65) (56) NGLs (2) 19 13 6 1 4 (3) - - - Natural Gas 25 12 13 28 7 4 17 6 11
90 40 50 (206) (16) (86) (104) (59) (45)
China Operations (3)
Revenues, excluding Realized Gains (Losses) on Risk Management (1)
Oil 34 21 13 - - - - - - 34 21 13 - - - - - -
(1)(2)(3) The Company acquired its China Operations as part of the Newfield business combination on February 13, 2019. Results from China Operations are presented beginning February 14, 2019.
There were no realized gains (losses) on risk management associated with China Operations for the three or six months ended June 30, 2019.
2018
Includes plant condensate.Excludes other revenues with no associated production volumes, but includes intercompany marketing fees transacted between the Company's operating segments.
2019
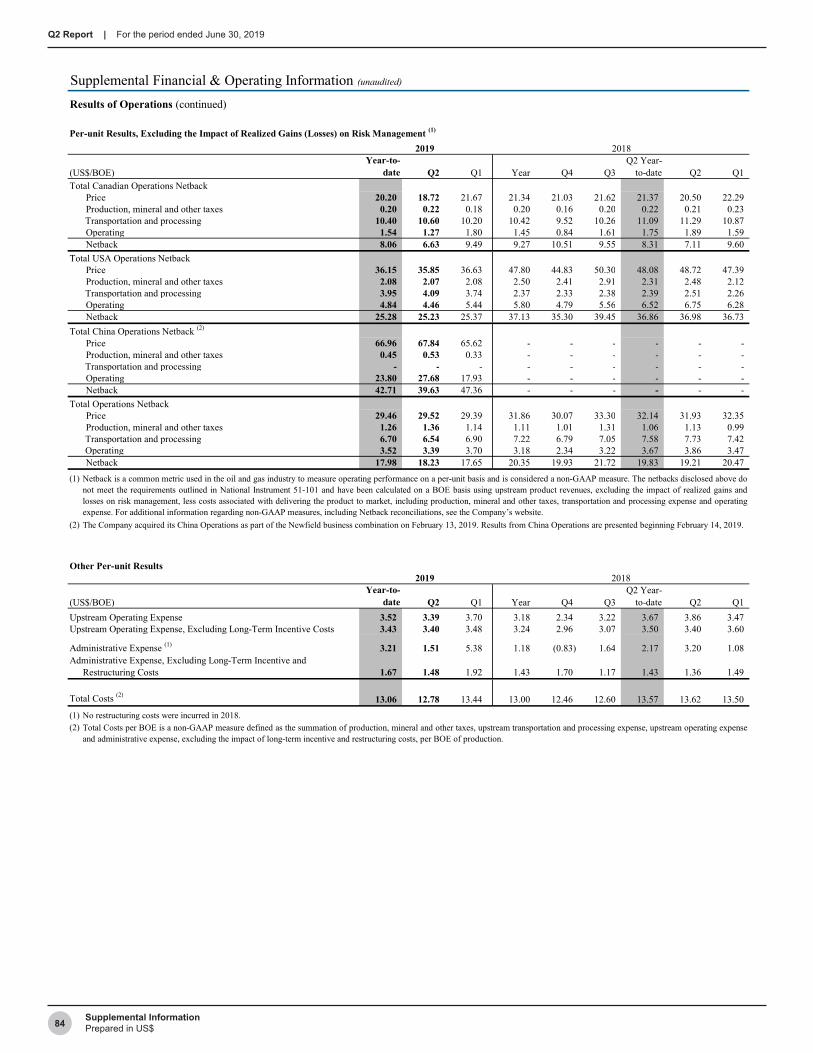
84 Supplemental InformationPrepared in US$
Q2 Report | For the period ended June 30, 2019
Supplemental Financial & Operating Information (unaudited)Results of Operations (continued)
Per-unit Results, Excluding the Impact of Realized Gains (Losses) on Risk Management (1)
(US$/BOE) Year-to-
date Q2 Q1 Year Q4 Q3 Q2 Year-
to-date Q2 Q1Total Canadian Operations Netback
Price 20.20 18.72 21.67 21.34 21.03 21.62 21.37 20.50 22.29 Production, mineral and other taxes 0.20 0.22 0.18 0.20 0.16 0.20 0.22 0.21 0.23
Transportation and processing 10.40 10.60 10.20 10.42 9.52 10.26 11.09 11.29 10.87 Operating 1.54 1.27 1.80 1.45 0.84 1.61 1.75 1.89 1.59 Netback 8.06 6.63 9.49 9.27 10.51 9.55 8.31 7.11 9.60
Total USA Operations NetbackPrice 36.15 35.85 36.63 47.80 44.83 50.30 48.08 48.72 47.39 Production, mineral and other taxes 2.08 2.07 2.08 2.50 2.41 2.91 2.31 2.48 2.12
Transportation and processing 3.95 4.09 3.74 2.37 2.33 2.38 2.39 2.51 2.26 Operating 4.84 4.46 5.44 5.80 4.79 5.56 6.52 6.75 6.28 Netback 25.28 25.23 25.37 37.13 35.30 39.45 36.86 36.98 36.73
Total China Operations Netback (2)
Price 66.96 67.84 65.62 - - - - - - Production, mineral and other taxes 0.45 0.53 0.33 - - - - - -
Transportation and processing - - - - - - - - - Operating 23.80 27.68 17.93 - - - - - - Netback 42.71 39.63 47.36 - - - - - -
Total Operations Netback 29.46 29.52 29.39 31.86 30.07 33.30 32.14 31.93 32.35
Production, mineral and other taxes 1.26 1.36 1.14 1.11 1.01 1.31 1.06 1.13 0.99 Transportation and processing 6.70 6.54 6.90 7.22 6.79 7.05 7.58 7.73 7.42 Operating 3.52 3.39 3.70 3.18 2.34 3.22 3.67 3.86 3.47 Netback 17.98 18.23 17.65 20.35 19.93 21.72 19.83 19.21 20.47
(1)
(2)
Other Per-unit Results
(US$/BOE) Year-to-
date Q2 Q1 Year Q4 Q3 Q2 Year-
to-date Q2 Q1Upstream Operating Expense 3.52 3.39 3.70 3.18 2.34 3.22 3.67 3.86 3.47Upstream Operating Expense, Excluding Long-Term Incentive Costs 3.43 3.40 3.48 3.24 2.96 3.07 3.50 3.40 3.60
Administrative Expense (1) 3.21 1.51 5.38 1.18 (0.83) 1.64 2.17 3.20 1.08Administrative Expense, Excluding Long-Term Incentive and
Restructuring Costs 1.67 1.48 1.92 1.43 1.70 1.17 1.43 1.36 1.49
Total Costs (2) 13.06 12.78 13.44 13.00 12.46 12.60 13.57 13.62 13.50(1) No restructuring costs were incurred in 2018.(2)
The Company acquired its China Operations as part of the Newfield business combination on February 13, 2019. Results from China Operations are presented beginning February 14, 2019.
2018
Total Costs per BOE is a non-GAAP measure defined as the summation of production, mineral and other taxes, upstream transportation and processing expense, upstream operating expenseand administrative expense, excluding the impact of long-term incentive and restructuring costs, per BOE of production.
Price
Netback is a common metric used in the oil and gas industry to measure operating performance on a per-unit basis and is considered a non-GAAP measure. The netbacks disclosed above donot meet the requirements outlined in National Instrument 51-101 and have been calculated on a BOE basis using upstream product revenues, excluding the impact of realized gains andlosses on risk management, less costs associated with delivering the product to market, including production, mineral and other taxes, transportation and processing expense and operatingexpense. For additional information regarding non-GAAP measures, including Netback reconciliations, see the Company’s website.
2018
2019
2019
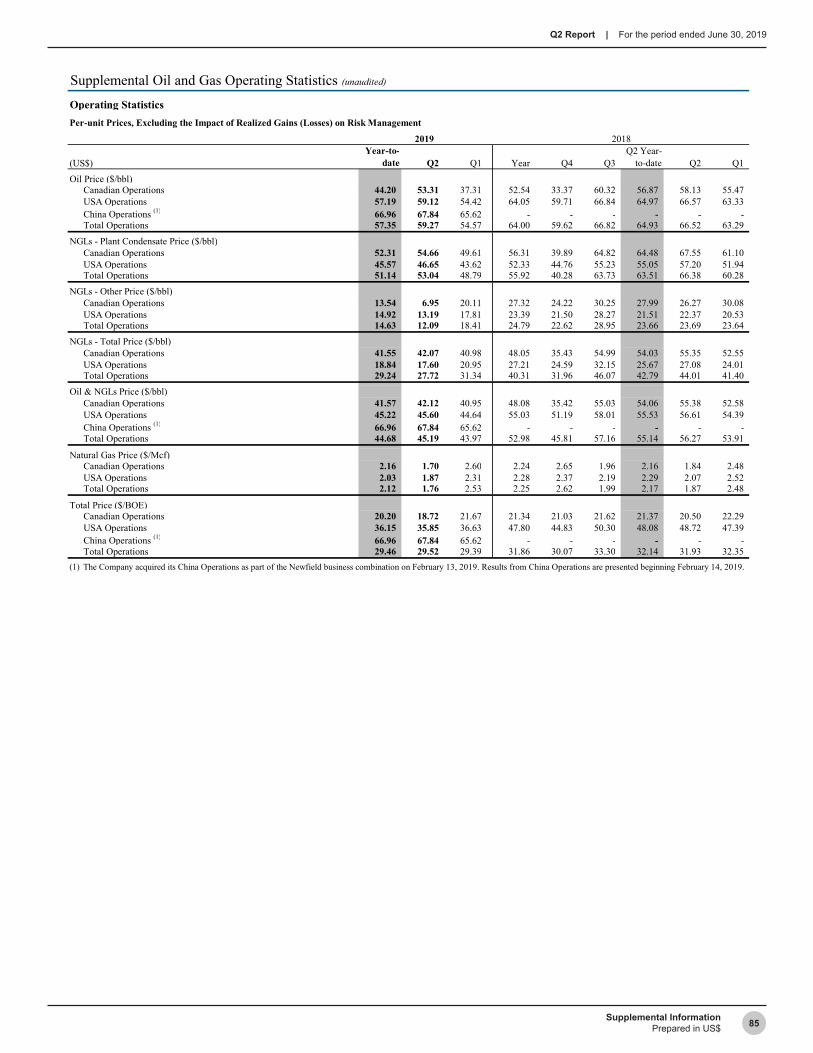
85Supplemental InformationPrepared in US$
Q2 Report | For the period ended June 30, 2019
Supplemental Oil and Gas Operating Statistics (unaudited)Operating Statistics Per-unit Prices, Excluding the Impact of Realized Gains (Losses) on Risk Management
(US$) Year-to-
date Q2 Q1 Year Q4 Q3 Q2 Year-
to-date Q2 Q1Oil Price ($/bbl)
Canadian Operations 44.20 53.31 37.31 52.54 33.37 60.32 56.87 58.13 55.47 USA Operations 57.19 59.12 54.42 64.05 59.71 66.84 64.97 66.57 63.33 China Operations (1) 66.96 67.84 65.62 - - - - - - Total Operations 57.35 59.27 54.57 64.00 59.62 66.82 64.93 66.52 63.29
NGLs - Plant Condensate Price ($/bbl)Canadian Operations 52.31 54.66 49.61 56.31 39.89 64.82 64.48 67.55 61.10 USA Operations 45.57 46.65 43.62 52.33 44.76 55.23 55.05 57.20 51.94 Total Operations 51.14 53.04 48.79 55.92 40.28 63.73 63.51 66.38 60.28
NGLs - Other Price ($/bbl)Canadian Operations 13.54 6.95 20.11 27.32 24.22 30.25 27.99 26.27 30.08 USA Operations 14.92 13.19 17.81 23.39 21.50 28.27 21.51 22.37 20.53 Total Operations 14.63 12.09 18.41 24.79 22.62 28.95 23.66 23.69 23.64
NGLs - Total Price ($/bbl)Canadian Operations 41.55 42.07 40.98 48.05 35.43 54.99 54.03 55.35 52.55 USA Operations 18.84 17.60 20.95 27.21 24.59 32.15 25.67 27.08 24.01 Total Operations 29.24 27.72 31.34 40.31 31.96 46.07 42.79 44.01 41.40
Oil & NGLs Price ($/bbl)Canadian Operations 41.57 42.12 40.95 48.08 35.42 55.03 54.06 55.38 52.58 USA Operations 45.22 45.60 44.64 55.03 51.19 58.01 55.53 56.61 54.39 China Operations (1) 66.96 67.84 65.62 - - - - - - Total Operations 44.68 45.19 43.97 52.98 45.81 57.16 55.14 56.27 53.91
Natural Gas Price ($/Mcf)Canadian Operations 2.16 1.70 2.60 2.24 2.65 1.96 2.16 1.84 2.48 USA Operations 2.03 1.87 2.31 2.28 2.37 2.19 2.29 2.07 2.52 Total Operations 2.12 1.76 2.53 2.25 2.62 1.99 2.17 1.87 2.48
Total Price ($/BOE)Canadian Operations 20.20 18.72 21.67 21.34 21.03 21.62 21.37 20.50 22.29 USA Operations 36.15 35.85 36.63 47.80 44.83 50.30 48.08 48.72 47.39 China Operations (1) 66.96 67.84 65.62 - - - - - - Total Operations 29.46 29.52 29.39 31.86 30.07 33.30 32.14 31.93 32.35
(1)
2018
The Company acquired its China Operations as part of the Newfield business combination on February 13, 2019. Results from China Operations are presented beginning February 14, 2019.
2019
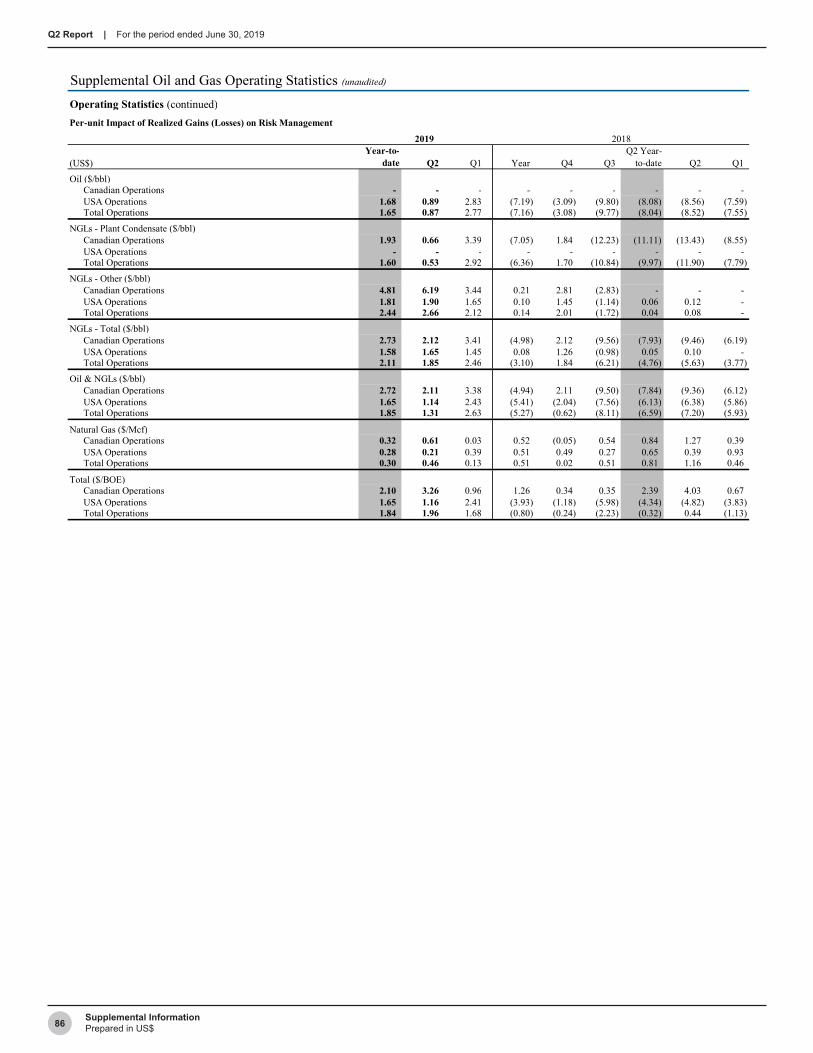
86 Supplemental InformationPrepared in US$
Q2 Report | For the period ended June 30, 2019
Supplemental Oil and Gas Operating Statistics (unaudited)Operating Statistics (continued)Per-unit Impact of Realized Gains (Losses) on Risk Management
(US$) Year-to-
date Q2 Q1 Year Q4 Q3 Q2 Year-
to-date Q2 Q1Oil ($/bbl)
Canadian Operations - - - - - - - - - USA Operations 1.68 0.89 2.83 (7.19) (3.09) (9.80) (8.08) (8.56) (7.59) Total Operations 1.65 0.87 2.77 (7.16) (3.08) (9.77) (8.04) (8.52) (7.55)
NGLs - Plant Condensate ($/bbl)Canadian Operations 1.93 0.66 3.39 (7.05) 1.84 (12.23) (11.11) (13.43) (8.55) USA Operations - - - - - - - - - Total Operations 1.60 0.53 2.92 (6.36) 1.70 (10.84) (9.97) (11.90) (7.79)
NGLs - Other ($/bbl)Canadian Operations 4.81 6.19 3.44 0.21 2.81 (2.83) - - - USA Operations 1.81 1.90 1.65 0.10 1.45 (1.14) 0.06 0.12 - Total Operations 2.44 2.66 2.12 0.14 2.01 (1.72) 0.04 0.08 -
NGLs - Total ($/bbl)Canadian Operations 2.73 2.12 3.41 (4.98) 2.12 (9.56) (7.93) (9.46) (6.19) USA Operations 1.58 1.65 1.45 0.08 1.26 (0.98) 0.05 0.10 - Total Operations 2.11 1.85 2.46 (3.10) 1.84 (6.21) (4.76) (5.63) (3.77)
Oil & NGLs ($/bbl)Canadian Operations 2.72 2.11 3.38 (4.94) 2.11 (9.50) (7.84) (9.36) (6.12) USA Operations 1.65 1.14 2.43 (5.41) (2.04) (7.56) (6.13) (6.38) (5.86) Total Operations 1.85 1.31 2.63 (5.27) (0.62) (8.11) (6.59) (7.20) (5.93)
Natural Gas ($/Mcf)Canadian Operations 0.32 0.61 0.03 0.52 (0.05) 0.54 0.84 1.27 0.39 USA Operations 0.28 0.21 0.39 0.51 0.49 0.27 0.65 0.39 0.93 Total Operations 0.30 0.46 0.13 0.51 0.02 0.51 0.81 1.16 0.46
Total ($/BOE)Canadian Operations 2.10 3.26 0.96 1.26 0.34 0.35 2.39 4.03 0.67 USA Operations 1.65 1.16 2.41 (3.93) (1.18) (5.98) (4.34) (4.82) (3.83) Total Operations 1.84 1.96 1.68 (0.80) (0.24) (2.23) (0.32) 0.44 (1.13)
20182019

87Supplemental InformationPrepared in US$
Q2 Report | For the period ended June 30, 2019
Supplemental Oil and Gas Operating Statistics (unaudited)Operating Statistics (continued)Per-unit Results, Including the Impact of Realized Gains (Losses) on Risk Management
(US$) Year-to-
date Q2 Q1 Year Q4 Q3 Q2 Year-
to-date Q2 Q1Oil Price ($/bbl)
Canadian Operations 44.20 53.31 37.31 52.54 33.37 60.32 56.87 58.13 55.47 USA Operations 58.87 60.01 57.25 56.86 56.62 57.04 56.89 58.01 55.74 China Operations (1) 66.96 67.84 65.62 - - - - - - Total Operations 59.00 60.14 57.34 56.84 56.54 57.05 56.89 58.00 55.74
NGLs - Plant Condensate Price ($/bbl)Canadian Operations 54.24 55.32 53.00 49.26 41.73 52.59 53.37 54.12 52.55 USA Operations 45.57 46.65 43.62 52.33 44.76 55.23 55.05 57.20 51.94 Total Operations 52.74 53.57 51.71 49.56 41.98 52.89 53.54 54.48 52.49
NGLs - Other Price ($/bbl)Canadian Operations 18.35 13.14 23.55 27.53 27.03 27.42 27.99 26.27 30.08 USA Operations 16.73 15.09 19.46 23.49 22.95 27.13 21.57 22.49 20.53 Total Operations 17.07 14.75 20.53 24.93 24.63 27.23 23.70 23.77 23.64
NGLs - Total Price ($/bbl) Canadian Operations 44.28 44.19 44.39 43.07 37.55 45.43 46.10 45.89 46.36 USA Operations 20.42 19.25 22.40 27.29 25.85 31.17 25.72 27.18 24.01 Total Operations 31.35 29.57 33.80 37.21 33.80 39.86 38.03 38.38 37.63
Oil & NGLs Price ($/bbl) Canadian Operations 44.29 44.23 44.33 43.14 37.53 45.53 46.22 46.02 46.46 USA Operations 46.87 46.74 47.07 49.62 49.15 50.45 49.40 50.23 48.53 China Operations (1) 66.96 67.84 65.62 - - - - - - Total Operations 46.53 46.50 46.60 47.71 45.19 49.05 48.55 49.07 47.98
Natural Gas Price ($/Mcf)Canadian Operations 2.48 2.31 2.63 2.76 2.60 2.50 3.00 3.11 2.87 USA Operations 2.31 2.08 2.70 2.79 2.86 2.46 2.94 2.46 3.45 Total Operations 2.42 2.22 2.66 2.76 2.64 2.50 2.98 3.03 2.94
Total Price ($/BOE)Canadian Operations 22.30 21.98 22.63 22.60 21.37 21.97 23.76 24.53 22.96 USA Operations 37.80 37.01 39.04 43.87 43.65 44.32 43.74 43.90 43.56 China Operations (1) 66.96 67.84 65.62 - - - - - - Total Operations 31.30 31.48 31.07 31.06 29.83 31.07 31.82 32.37 31.22
Total Netback ($/BOE)Canadian Operations 10.16 9.89 10.45 10.53 10.85 9.90 10.70 11.14 10.27 USA Operations 26.93 26.39 27.78 33.20 34.12 33.47 32.52 32.16 32.90 China Operations (1) 42.71 39.63 47.36 - - - - - - Total Operations 19.82 20.19 19.33 19.55 19.69 19.49 19.51 19.65 19.34
(1)
2018
The Company acquired its China Operations as part of the Newfield business combination on February 13, 2019. Results from China Operations are presented beginning February 14, 2019.
2019

88 Supplemental InformationPrepared in US$
Q2 Report | For the period ended June 30, 2019
Supplemental Oil and Gas Operating Statistics (unaudited)
Results by Play
(average) Year-to-
date Q2 Q1 Year Q4 Q3 Q2 Year-
to-date Q2 Q1
Oil Production (Mbbls/d)Canadian Operations
Montney 0.2 0.2 0.2 0.3 0.2 0.2 0.3 0.3 0.3 Other Upstream Operations (1)
Duvernay 0.1 - 0.1 0.1 0.1 0.1 0.1 0.1 0.1 Other - - - - 0.1 - - - -
Total Canadian Operations 0.3 0.2 0.3 0.4 0.4 0.3 0.4 0.4 0.4
USA Operations (2)
Permian 62.2 65.1 59.3 58.8 63.8 61.9 54.7 55.2 54.2 Anadarko 38.8 53.6 23.7 - - - - - - Other Upstream Operations (1)
Eagle Ford 25.4 25.2 25.5 28.4 29.8 31.3 26.3 26.8 25.8 Williston 10.4 14.6 6.2 - - - - - - Uinta 12.8 17.2 8.4 - - - - - - Other - - 0.1 2.3 2.5 2.0 2.4 2.2 2.6
Total USA Operations 149.6 175.7 123.2 89.5 96.1 95.2 83.4 84.2 82.6
Total China Operations (2) 2.8 3.4 2.3 - - - - - -
Total Encana 152.7 179.3 125.8 89.9 96.5 95.5 83.8 84.6 83.0
NGLs - Plant Condensate Production (Mbbls/d)Canadian Operations
Montney 36.0 38.7 33.3 28.6 38.8 30.5 22.5 24.2 20.8 Other Upstream Operations (1)
Duvernay 5.4 5.4 5.4 6.6 8.0 5.8 6.2 5.7 6.8 Other - - - - - - - - (0.1)
Total Canadian Operations 41.4 44.1 38.7 35.2 46.8 36.3 28.7 29.9 27.5
USA Operations (2)
Permian 1.9 2.4 1.5 2.1 2.1 2.5 1.8 2.1 1.5 Anadarko 4.8 6.5 3.1 - - - - - - Other Upstream Operations (1)
Eagle Ford 1.3 1.4 1.3 1.6 1.8 2.0 1.3 1.6 1.1 Williston 0.4 0.6 0.2 - - - - - - Uinta 0.2 0.2 - - - - - - - Other 0.1 0.1 0.1 0.1 0.2 0.2 0.1 0.1 0.1
Total USA Operations 8.7 11.2 6.2 3.8 4.1 4.7 3.2 3.8 2.7
Total Encana 50.1 55.3 44.9 39.0 50.9 41.0 31.9 33.7 30.2 (1)
(2)
2018
Other Upstream Operations includes production volumes from plays that are not part of the Company's current strategic focus. USA Other primarily included San Juan until the assetwas divested on December 27, 2018.No reportable production in 2018 for legacy Newfield assets as the Company acquired them as part of the business combination on February 13, 2019. Production from legacyNewfield assets is presented beginning February 14, 2019.
2019
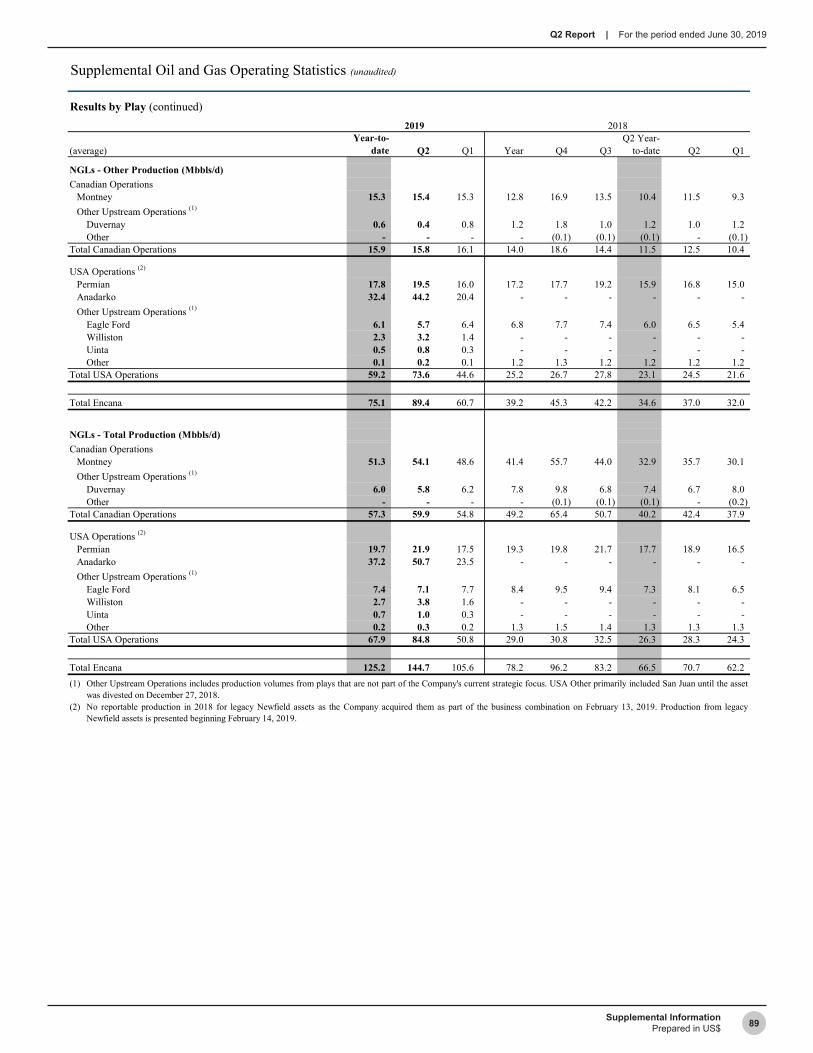
89Supplemental InformationPrepared in US$
Q2 Report | For the period ended June 30, 2019
Supplemental Oil and Gas Operating Statistics (unaudited)
Results by Play (continued)
(average) Year-to-
date Q2 Q1 Year Q4 Q3 Q2 Year-
to-date Q2 Q1
NGLs - Other Production (Mbbls/d)Canadian Operations
Montney 15.3 15.4 15.3 12.8 16.9 13.5 10.4 11.5 9.3 Other Upstream Operations (1)
Duvernay 0.6 0.4 0.8 1.2 1.8 1.0 1.2 1.0 1.2 Other - - - - (0.1) (0.1) (0.1) - (0.1)
Total Canadian Operations 15.9 15.8 16.1 14.0 18.6 14.4 11.5 12.5 10.4
USA Operations (2)
Permian 17.8 19.5 16.0 17.2 17.7 19.2 15.9 16.8 15.0 Anadarko 32.4 44.2 20.4 - - - - - - Other Upstream Operations (1)
Eagle Ford 6.1 5.7 6.4 6.8 7.7 7.4 6.0 6.5 5.4 Williston 2.3 3.2 1.4 - - - - - - Uinta 0.5 0.8 0.3 - - - - - - Other 0.1 0.2 0.1 1.2 1.3 1.2 1.2 1.2 1.2
Total USA Operations 59.2 73.6 44.6 25.2 26.7 27.8 23.1 24.5 21.6
Total Encana 75.1 89.4 60.7 39.2 45.3 42.2 34.6 37.0 32.0
NGLs - Total Production (Mbbls/d)Canadian Operations
Montney 51.3 54.1 48.6 41.4 55.7 44.0 32.9 35.7 30.1 Other Upstream Operations (1)
Duvernay 6.0 5.8 6.2 7.8 9.8 6.8 7.4 6.7 8.0 Other - - - - (0.1) (0.1) (0.1) - (0.2)
Total Canadian Operations 57.3 59.9 54.8 49.2 65.4 50.7 40.2 42.4 37.9
USA Operations (2)
Permian 19.7 21.9 17.5 19.3 19.8 21.7 17.7 18.9 16.5 Anadarko 37.2 50.7 23.5 - - - - - - Other Upstream Operations (1)
Eagle Ford 7.4 7.1 7.7 8.4 9.5 9.4 7.3 8.1 6.5 Williston 2.7 3.8 1.6 - - - - - - Uinta 0.7 1.0 0.3 - - - - - - Other 0.2 0.3 0.2 1.3 1.5 1.4 1.3 1.3 1.3
Total USA Operations 67.9 84.8 50.8 29.0 30.8 32.5 26.3 28.3 24.3
Total Encana 125.2 144.7 105.6 78.2 96.2 83.2 66.5 70.7 62.2 (1)
(2)
2018
Other Upstream Operations includes production volumes from plays that are not part of the Company's current strategic focus. USA Other primarily included San Juan until the assetwas divested on December 27, 2018.No reportable production in 2018 for legacy Newfield assets as the Company acquired them as part of the business combination on February 13, 2019. Production from legacyNewfield assets is presented beginning February 14, 2019.
2019

90 Supplemental InformationPrepared in US$
Q2 Report | For the period ended June 30, 2019
Supplemental Oil and Gas Operating Statistics (unaudited)
Results by Play (continued)
(average) Year-to-
date Q2 Q1 Year Q4 Q3 Q2 Year-
to-date Q2 Q1
Oil & NGLs Production (Mbbls/d)Canadian Operations
Montney 51.5 54.3 48.8 41.7 55.9 44.2 33.2 36.0 30.4 Other Upstream Operations (1)
Duvernay 6.1 5.8 6.3 7.9 9.9 6.9 7.5 6.8 8.1 Other - - - - - (0.1) (0.1) - (0.2)
Total Canadian Operations 57.6 60.1 55.1 49.6 65.8 51.0 40.6 42.8 38.3
USA Operations (2)
Permian 81.9 87.0 76.8 78.1 83.6 83.6 72.4 74.1 70.7 Anadarko 76.0 104.3 47.2 - - - - - - Other Upstream Operations (1)
Eagle Ford 32.8 32.3 33.2 36.8 39.3 40.7 33.6 34.9 32.3 Williston 13.1 18.4 7.8 - - - - - - Uinta 13.5 18.2 8.7 - - - - - - Other 0.2 0.3 0.3 3.6 4.0 3.4 3.7 3.5 3.9
Total USA Operations 217.5 260.5 174.0 118.5 126.9 127.7 109.7 112.5 106.9
Total China Operations (2) 2.8 3.4 2.3 - - - - - -
Total Encana 277.9 324.0 231.4 168.1 192.7 178.7 150.3 155.3 145.2
Natural Gas Production (MMcf/d)Canadian Operations
Montney 922 893 951 894 985 938 826 841 810 Other Upstream Operations (1)
Duvernay 56 51 61 59 70 54 57 52 61 Other 42 44 42 54 51 46 59 56 65
Total Canadian Operations 1,020 988 1,054 1,007 1,106 1,038 942 949 936
USA Operations (2)
Permian 95 102 87 86 89 90 82 85 78 Anadarko 263 353 172 - - - - - - Other Upstream Operations (1)
Eagle Ford 45 42 47 52 55 56 48 49 47 Williston 17 24 10 - - - - - - Uinta 12 15 9 - - - - - - Other 62 83 42 13 15 13 13 12 14
Total USA Operations 494 619 367 151 159 159 143 146 139
Total Encana 1,514 1,607 1,421 1,158 1,265 1,197 1,085 1,095 1,075 (1)
(2)
Other Upstream Operations includes production volumes from plays that are not part of the Company's current strategic focus. Canadian Other primarily includes natural gas volumesin Horn River. USA Other primarily includes San Juan and natural gas volumes in Arkoma. Production volumes associated with San Juan were included in USA Other until the assetwas divested on December 27, 2018.
2018
No reportable production in 2018 for legacy Newfield assets as the Company acquired them as part of the business combination on February 13, 2019. Production from legacyNewfield assets is presented beginning February 14, 2019.
2019

91Supplemental InformationPrepared in US$
Q2 Report | For the period ended June 30, 2019
Supplemental Oil and Gas Operating Statistics (unaudited)
Results by Play (continued)
(average) Year-to-
date Q2 Q1 Year Q4 Q3 Q2 Year-
to-date Q2 Q1
Total Production (MBOE/d)Canadian Operations
Montney 205.1 203.1 207.3 190.7 220.0 200.6 170.8 176.2 165.3 Other Upstream Operations (1)
Duvernay 15.4 14.3 16.5 17.9 21.6 15.9 16.9 15.5 18.3 Other 7.3 7.4 6.9 8.9 8.5 7.6 9.9 9.2 10.7
Total Canadian Operations 227.8 224.8 230.7 217.5 250.1 224.1 197.6 200.9 194.3
USA Operations (2)
Permian 97.7 104.0 91.2 92.3 98.5 98.5 86.0 88.2 83.8 Anadarko 119.8 163.2 75.9 - - - - - - Other Upstream Operations (1)
Eagle Ford 40.2 39.3 41.0 45.4 48.5 49.9 41.6 43.0 40.1 Williston 15.9 22.4 9.4 - - - - - - Uinta 15.5 20.7 10.2 - - - - - - Other 10.7 14.0 7.5 6.0 6.3 5.7 6.0 5.8 6.2
Total USA Operations 299.8 363.6 235.2 143.7 153.3 154.1 133.6 137.0 130.1
Total China Operations (2) 2.8 3.4 2.3 - - - - - -
Total Encana 530.4 591.8 468.2 361.2 403.4 378.2 331.2 337.9 324.4
Total Production (MBOE/d)Total Core Assets (3) 422.6 470.3 374.4 283.0 318.5 299.1 256.8 264.4 249.1 % of Total Encana 80% 79% 80% 78% 79% 79% 78% 78% 77%
(1)
(2)
(3)
2018
Other Upstream Operations includes total production volumes from plays that are not part of the Company's current strategic focus. Canadian Other primarily includes Horn River.USA Other primarily includes Arkoma and San Juan. Production volumes associated with San Juan were included in USA Other until the asset was divested on December 27, 2018.
Core Assets production presentation has been updated to align with the Company’s 2019 Core Assets, which include Permian, Anadarko and Montney. Core Assets production for2018 has been updated and reflects Permian and Montney.
No reportable production in 2018 for legacy Newfield assets as the Company acquired them as part of the business combination on February 13, 2019. Production from legacyNewfield assets is presented beginning February 14, 2019.
2019

92 Supplemental InformationPrepared in US$
Q2 Report | For the period ended June 30, 2019
Supplemental Oil and Gas Operating Statistics (unaudited)
Results by Play (continued)
(US$ millions) Year-to-
date Q2 Q1 Year Q4 Q3 Q2 Year-
to-date Q2 Q1
Capital Expenditures Canadian Operations
Montney 192 74 118 516 71 120 325 170 155 Other Upstream Operations (1)
Duvernay 75 35 40 117 10 52 55 42 13 Other (2) (1) (1) (1) (2) 2 (1) (1) -
Total Canadian Operations 265 108 157 632 79 174 379 211 168
USA Operations (2)
Permian 517 238 279 899 181 230 488 250 238 Anadarko 378 231 147 - - - - - - Other Upstream Operations (1)
Eagle Ford 205 100 105 394 79 99 216 122 94 Williston 68 46 22 - - - - - - Uinta 31 15 16 - - - - - - Other 19 11 8 39 7 16 16 10 6
Total USA Operations 1,218 641 577 1,332 267 345 720 382 338
Market Optimization - - - - - - - - - Corporate & Other 3 1 2 11 3 4 4 2 2 Capital Expenditures 1,486 750 736 1,975 349 523 1,103 595 508 Net Acquisitions & (Divestitures) 35 15 20 (476) (404) (9) (63) (46) (17) Net Capital Investment 1,521 765 756 1,499 (55) 514 1,040 549 491
Year-to-date Q2 Q1 Year Q4 Q3
Q2 Year-to-date Q2 Q1
Drilling Activity (net wells drilled)Canadian Operations
Montney 47 25 22 129 20 28 81 41 40 Other Upstream Operations (1)
Duvernay 6 3 3 10 1 2 7 4 3 Total Canadian Operations 53 28 25 139 21 30 88 45 43
USA Operations (2)
Permian 57 30 27 110 29 26 55 29 26 Anadarko 32 20 12 - - - - - - Other Upstream Operations (1)
Eagle Ford 29 16 13 55 15 12 28 14 14 Williston 8 6 2 - - - - - - Uinta 2 1 1 - - - - - - Other 1 1 - 5 - 5 - - -
Total USA Operations 129 74 55 170 44 43 83 43 40
Total Encana 182 102 80 309 65 73 171 88 83 (1)
(2)
2018
Other Upstream Operations includes capital expenditures and net wells drilled in plays that are not part of the Company's current strategic focus. USA Other primarily includes Arkoma and San Juan. Capital expenditures and net wells drilled in San Juan were included in USA Other until the asset was divested on December 27, 2018.No reportable results in 2018 for legacy Newfield assets as the Company acquired them as part of the business combination on February 13, 2019. Results for legacy Newfield assetsare presented beginning February 14, 2019.
20182019
2019

93
Q2 Report | For the period ended June 30, 2019

94
Q2 Report | For the period ended June 30, 2019

95
Q2 Report | For the period ended June 30, 2019

Encana CorporationFurther information on Encana Corporation is available on the company’s website, www.encana.com, or by contacting:
INVESTOR RELATIONSPhone: 281.210.5110 | 403.645.2252Email: [email protected]
GENERAL INQUIRIESEncana Corporation 500 Centre Street SEPO Box 2850Calgary, AB, Canada T2P 2S5Phone: 403.645.2000Fax: 403.645.3400