
CONSTELLATION NEWHOLDCO, INC. - Investor Relations
268
As confidentially submitted to the Securities and Exchange Commission on October 21, 2021 UNITED STATES SECURITIES AND EXCHANGE COMMISSION Washington, D.C. 20549 Amendment No. 2 to FORM 10 GENERAL FORM FOR REGISTRATION OF SECURITIES PURSUANT TO SECTION 12(b) OR 12(g) OF THE SECURITIES EXCHANGE ACT OF 1934 CONSTELLATION NEWHOLDCO, INC. (Exact name of registrant as specified in its charter) Pennsylvania (State or other jurisdiction of Incorporation or organization) 87-1210716 (I.R.S. Employer Identification No.) c/o Exelon Corporation 10 South Dearborn Street P.O. Box 805379 Chicago, Illinois (Address of Principal Executive Office) 60680-5379 (Zip Code) (800) 483-3220 (Registrant’s telephone number, including area code) Securities to be registered pursuant to Section 12(b) of the Act: Title of each class to be so registered Name of each exchange on which each class is to be registered Common Stock, without par value The Nasdaq Stock Market LLC Securities to be registered pursuant to Section 12(g) of the Act: None. Indicate by check mark whether the registrant is a large accelerated filer, an accelerated filer, a non-accelerated filer, a smaller reporting company, or an emerging growth company. See the definitions of “large accelerated filer,” “accelerated filer,” “smaller reporting company,” and “emerging growth company” in Rule 12b-2 of the Exchange Act. Large accelerated filer ☐ Accelerated filer ☐ Non-accelerated filer ☒ Smaller reporting company ☐ Emerging growth company ☐ If an emerging growth company, indicate by check mark if the registrant has elected not to use the extended transition period for complying with any new or revised financial accounting standards provided pursuant to Section 13(a) of the Exchange Act. ☐
-
Upload
khangminh22 -
Category
Documents
-
view
1 -
download
0
Transcript of CONSTELLATION NEWHOLDCO, INC. - Investor Relations

As confidentially submitted to the Securities and Exchange Commission on October 21, 2021
UNITED STATES
SECURITIES AND EXCHANGE COMMISSIONWashington, D.C. 20549
Amendment No. 2
to
FORM 10
GENERAL FORM FOR REGISTRATION OF SECURITIESPURSUANT TO SECTION 12(b) OR 12(g)
OF THE SECURITIES EXCHANGE ACT OF 1934
CONSTELLATION NEWHOLDCO, INC.(Exact name of registrant as specified in its charter)
Pennsylvania
(State or other jurisdiction ofIncorporation or organization)
87-1210716(I.R.S. Employer
Identification No.)
c/o Exelon Corporation10 South Dearborn Street
P.O. Box 805379Chicago, Illinois
(Address of Principal Executive Office)60680-5379(Zip Code)
(800) 483-3220
(Registrant’s telephone number, including area code)
Securities to be registered pursuant to Section 12(b) of the Act:
Title of each class to be so registered Name of each exchange on which each class is to be registeredCommon Stock, without par value The Nasdaq Stock Market LLC
Securities to be registered pursuant to Section 12(g) of the Act: None.
Indicate by check mark whether the registrant is a large accelerated filer, an accelerated filer, a non-accelerated filer, a smaller reporting company, or anemerging growth company. See the definitions of “large accelerated filer,” “accelerated filer,” “smaller reporting company,” and “emerging growthcompany” in Rule 12b-2 of the Exchange Act. Large accelerated filer ☐ Accelerated filer ☐
Non-accelerated filer ☒ Smaller reporting company ☐
Emerging growth company ☐
If an emerging growth company, indicate by check mark if the registrant has elected not to use the extended transition period for complying with any newor revised financial accounting standards provided pursuant to Section 13(a) of the Exchange Act. ☐
INFORMATION REQUIRED IN REGISTRATION STATEMENT
CROSS-REFERENCE SHEET BETWEEN INFORMATION STATEMENT AND ITEMS OF FORM 10
Item 1. Business.
The information required by this item is contained under the sections “Summary,” “Unaudited Pro Forma Condensed Consolidated FinancialStatements,” “Overview of the U.S. Power Markets,” “Our Business” and “Where You Can Find More Information” of the informationstatement filed as Exhibit 99.1 to this Form 10 (the “information statement”). Those sections are incorporated by reference herein.
Item 1A. Risk Factors.
The information required by this item is contained under the sections “Summary—Summary of Risk Factors,” “Risk Factors” and “CautionaryNote Regarding Forward Looking Statements” of the information statement. Those sections are incorporated by reference herein.
Item 2. Financial Information.
The information required by this item is contained under the section “Management’s Discussion and Analysis of Financial Condition andResults of Operations” of the information statement. Those sections are incorporated by reference herein.
Item 3. Properties.
The information required by this item is contained under the section “Our Business—Properties and Facilities” of the information statement.That section is incorporated by reference herein.
Item 4. Security Ownership of Certain Benecial Owners and Management.
The information required by this item is contained under the section “Security Ownership of Certain Beneficial Owners and Management” ofthe information statement. That section is incorporated by reference herein.
Item 5. Directors and Executive Officers.
The information required by this item is contained under the section “Management” of the information statement. That section is incorporatedby reference herein.
Item 6. Executive Compensation.
The information required by this item is contained under the sections “Executive and Director Compensation” and “Management –Compensation Committee Interlocks and Insider Participation” of the information statement. Those sections are incorporated by referenceherein.
Item 7. Certain Relationships and Related Transactions, and Director Independence.
The information required by this item is contained under the sections “Management” and “Certain Relationships and Related PartyTransactions” of the information statement. Those sections are incorporated herein by reference.
Item 8. Legal Proceedings.
The information required by this item is contained under the sections “Our Business—Legal Proceedings” and Note 3 – Regulatory Matters andNote 19 – Commitments and Contingencies of the Notes to Consolidated Financial Statements of the information statement. Those sections areincorporated by reference herein.
Item 9. Market Price of and Dividends on the Registrant’s Common Equity and Related Stockholder Matters.
The information required by this item is contained under the sections “The Separation – Results of the Separation,” “Trading Market”,“Dividend Policy”, and “Description of Capital Stock” of the information statement. Those sections are incorporated herein by reference.

Item 10. Recent Sales of Unregistered Securities.
Not applicable.
Item 11. Description of Registrant’s Securities to be Registered.
The information required by this item is contained under the section “Description of Capital Stock” of the information statement. That section isincorporated herein by reference.
Item 12. Indemnication of Directors and Officers.
The information required by this item is contained under the sections “Certain Relationships and Related Party Transactions—Agreements withExelon Related to the Separation—Separation Agreement” and “Description of Capital Stock—Limitations on Liability of Directors andIndemnification of Directors and Officers” of the information statement. Those sections are incorporated herein by reference.
Item 13. Financial Statements and Supplementary Data.
The information required by this item is contained under the sections “Financial Statement Presentation,” “Unaudited Pro Forma CondensedConsolidated Financial Statements,” “Management’s Discussion and Analysis of Financial Condition and Results of Operations” and “Index toConsolidated Financial Statements” (inclusive of the report of independent registered public accounting firm, financial statements and notes toconsolidated financial statements described in that index) of the information statement. Those sections are incorporated by reference herein.
Item 14. Changes in and Disagreements with Accountants on Accounting and Financial Disclosure.
None.
Item 15. Financial Statements and Exhibits.
(a) List separately all nancial statements led as part of the registration statement.
The information required by this item is contained under the sections “Unaudited Pro Forma Condensed Consolidated FinancialStatements” and “Index to Consolidated Financial Statements” beginning on page F-1 of the information statement and the report ofindependent registered public accounting firm, financial statements and notes to consolidated referenced therein. Those sections areincorporated herein by reference.
(b) Furnish the exhibits required by Item 601 of Regulation S-K (§229.601 of this chapter).

The following documents are filed as exhibits hereto:
Exhibit No. Description2.1 Form of Separation Agreement by and between the Company and Exelon**3.1 Articles of Incorporation of the Company**3.2 Bylaws of the Company**4.1
Form of 4.25% Senior Note due 2022 issued by Exelon Generation Company, LLC. (File No. 333-85496, Form 8-K dated June 18,2012, Exhibit 4.1)*
4.2
Form of 5.60% Senior Note due 2042 issued by Exelon Generation Company, LLC. (File No. 333-85496, Form 8-K dated June 18,2012, Exhibit 4.2)*
4.3
Form of 6.000% Senior Notes due 2033 issued by Exelon Generation Company, LLC (File No. 333-85496, Form 8-K dated September30, 2013, Exhibit No. 4.1)*
4.4
Indenture dated as of September 28, 2007 from Exelon Generation Company, LLC to U.S. Bank National Association, as trustee (FileNo. 333-85496, Form 8-K dated September 28, 2007, Exhibit 4.1)*
4.5
Form of 6.25% Exelon Generation Company, LLC Senior Note due 2039 (File No. 333-85496, Form 8-K dated September 23, 2009,Exhibit 4.2)*
4.6
Form of 4.00% Exelon Generation Company, LLC Senior Note due 2020 (File No. 333-85496, Form 8-K dated September 30, 2010,Exhibit 4.1)*
4.7
Form of 5.75% Exelon Generation Company, LLC Senior Note due 2041 (File No. 333-85496, Form 8-K dated September 30, 2010,Exhibit 4.2)*
4.8
Indenture, dated as of September 30, 2013, among Continental Wind, LLC, the guarantors party thereto and Wilmington Trust, NationalAssociation, as trustee (File No. 333-85496, Form 8-K dated September 30, 2013, Exhibit 4.1)*
4.9
Form of Exelon Generation Company, LLC 2.950% senior notes due 2020 (File No. 333-85496, Form 8-K dated March 10, 2017,Exhibit 4.1)*
4.10 Form of Exelon Generation Company, LLC 3.400% notes due 2022 (File No. 333-85496, Form 8-K dated March 10, 2017, Exhibit 4.2)*4.11
Form of Exelon Generation Company LLC 3.250% Senior Notes due 2025 (File No. 333-85496, Form 8-K dated May 15, 2020, Exhibit4.1)*
10.1 Form of Transition Services Agreement by and between the Company and Exelon**10.2 Form of Tax Matters Agreement by and between the Company and Exelon**10.3 Form of Employee Matters Agreement by and between the Company and Exelon**10.4
Credit Agreement, dated as of November 28, 2017, as thereafter amended and conformed among ExGen Renewables IV, LLC, ExGenRenewables IV Holding, LLC, Morgan Stanley Senior Funding, Inc. as administrative agent, Wilmington Trust, National Association, asdepository bank and collateral agent, and the lenders and other agents party thereto. (Certain portions of this exhibit have been omittedby redacting a portion of text, as indicated by asterisks in the text. This exhibit has been filed separately with the U.S. Securities andExchange Commission pursuant to a request for confidential treatment.) (File No. 001-16169, Form 10-K dated February 9, 2018,Exhibit 10.94)*
10.5
Receivables Purchase Agreement, dated as of April 8, 2020, among Constellation NewEnergy, Inc. as servicer, and NewEnergyReceivables LLC, as seller, MUFG Bank, LTD., as Agent, the Conduits party thereto, the Financial Institutions party thereto and thePurchaser Agents party thereto (File No. 001-16169, Form 8-K dated April 9, 2020, Exhibit 10.1)*
10.6
Credit Agreement, among ExGen Renewables IV, LLC, the lenders party thereto, Jefferies Finance LLC, as administrative agent, andWilmington Trust, National Association, as depositary bank and collateral agent, dated December 15, 2020 (File No. 333-85496, Form8-K dated December 15, 2020, Exhibit 1.1)*
10.7
Amendment No. 2 to Receivables Purchase Agreement, dated as of March 29, 2021, among Constellation NewEnergy, Inc., as servicer,and NewEnergy Receivables LLC, as seller, MUFG Bank, LTD., as agent, the Conduits party thereto, the Financial Institutions partythereto and the Purchaser Agents party thereto (File No. 001-16169, Form 8-K, dated March 31, 2021, Exhibit 10.1)*
21.1 Subsidiaries of the Company**99.1 Amended Preliminary Information Statement, dated October 21, 2021 * Incorporated by reference.** To be filed by amendment.

SIGNATURES
Pursuant to the requirements of Section 12 of the Securities Exchange Act of 1934, the registrant has duly caused this registration statement to be
signed on its behalf by the undersigned, thereunto duly authorized.
Date: October 21, 2021 Constellation Newholdco, Inc. By: Name: Title:

Exhibit 99.1 Information contained herein is subject to completion or amendment. A Registration Statement on Form 10 relating to these securities has beenconfidentially submitted with the Securities and Exchange Commission under the Securities Exchange Act of 1934, as amended.
SUBJECT TO COMPLETION. DATED OCTOBER 21, 2021
Information Statement
Distribution of Common Stock of Constellation Newholdco, Inc.by
EXELON CORPORATIONto
EXELON CORPORATION SHAREHOLDERS
This information statement is being sent to you in connection with the separation of Constellation Newholdco, Inc. (collectively with itsconsolidated subsidiaries, the “Company”) from Exelon Corporation (“Exelon”). As a result of the separation, Exelon’s competitive power generation andcustomer-facing energy businesses conducted through Exelon Generation Company, LLC (“Generation”) and its subsidiaries will be owned by theCompany, which will be an independent, publicly-traded company. Exelon will complete the separation by distributing all of the outstanding shares of theCompany’s common stock (“Company common stock” or “our common stock”), on a pro rata basis to the holders (“Exelon shareholders”) of Exelon’scommon stock. We refer to this pro rata distribution as the “distribution,” and we refer to the separation as the “separation”.
Each Exelon shareholder will receive share(s) of our common stock for every share of Exelon common stock held by such shareholder on
, 2022, the record date. Exelon will not distribute any fractional shares of Company common stock. Instead, the distribution agent will aggregatefractional shares into whole shares, sell the whole shares in the open market at prevailing market prices and distribute the aggregate net cash proceeds fromthe sales pro rata to each holder who would otherwise have been entitled to receive a fractional share in the separation. The distribution of shares will bemade in book-entry form only. The distribution will be effective as of 12:01 a.m., Eastern time, on , 2022. Immediately after the distribution becomeseffective, the Company will be an independent, publicly-traded company.
We expect that the distribution will be tax-free to Exelon shareholders for U.S. federal income tax purposes, except to the extent of cash received
in lieu of fractional shares. You should consult your own tax advisor as to the particular consequences of the distribution to you, including the applicabilityand effect of any U.S. federal, state and local and non-U.S. tax laws.
No vote or other action of Exelon shareholders is required in connection with the separation. We are not asking you for a proxy, and
Exelon requests that you do not send Exelon a proxy. Exelon shareholders will not be required to pay any consideration for the shares of Companycommon stock they receive in the distribution, and they will not be required to surrender or exchange their shares of Exelon common stock or to take anyother action in connection with the separation.
All outstanding shares of the Company common stock are currently owned by Exelon. Accordingly, there is no current trading market for the
Company common stock. We anticipate that a limited market, commonly known as a “when-issued” trading market, will develop shortly before the recorddate, and that “regular-way” trading in shares of the Company common stock will begin on the first trading day following the distribution date. If tradingbegins on a “when-issued” basis, you may purchase or sell the Company common stock up to and including the distribution date, in which case yourtransaction will settle within two trading days after regular-way trading commences following the distribution. We intend to list the Company commonstock on the NASDAQ Stock Market, Inc. (“NASDAQ”) under the ticker symbol “ .” As discussed below under “Trading Market,” if you sell yourExelon common stock in the “regular-way” market before the distribution date, you also will be selling your right to receive shares of the Companycommon stock in connection with the distribution. However, if you sell your Exelon common stock in the “ex-distribution” market before the distributiondate, you will still receive shares of the Company common stock in the distribution.
In reviewing this information statement, you should carefully consider the matters described in “Risk Factors” beginning on page 21 of
this information statement.
1

Neither the Securities and Exchange Commission nor any state securities commission has approved or disapproved these securities or
determined if this information statement is truthful or complete. Any representation to the contrary is a criminal offense. This information statement is not an offer to sell, or a solicitation of an offer to buy, any securities.
The date of this information statement is , 2022.
A Notice of Internet Availability of Information Statement Materials containing instructions describing how to access this information statementwas first mailed to Exelon shareholders on or about , 2022.
2

TABLE OF CONTENTS
TABLE OF CONTENTS iFINANCIAL STATEMENT PRESENTATION iiINDUSTRY AND MARKET DATA iiCAUTIONARY NOTE REGARDING FORWARD-LOOKING STATEMENTS iiiSUMMARY 1RISK FACTORS 21THE SEPARATION 38TRADING MARKET 44DIVIDEND POLICY 46CAPITALIZATION 46UNAUDITED PRO FORMA CONDENSED CONSOLIDATED FINANCIAL STATEMENTS 47OVERVIEW OF THE U.S. POWER MARKETS 54OUR BUSINESS 64MANAGEMENT’S DISCUSSION AND ANALYSIS OF FINANCIAL CONDITION AND RESULTS OF OPERATIONS 95MANAGEMENT 123EXECUTIVE AND DIRECTOR COMPENSATION 126CERTAIN RELATIONSHIPS AND RELATED PARTY TRANSACTIONS 154DESCRIPTION OF CERTAIN INDEBTEDNESS 159SECURITY OWNERSHIP OF CERTAIN BENEFICIAL OWNERS AND MANAGEMENT 160DESCRIPTION OF CAPITAL STOCK 161WHERE YOU CAN FIND MORE INFORMATION 165CERTAIN DEFINED TERMS 166INDEX TO CONSOLIDATED FINANCIAL STATEMENTS F-1
Unless otherwise indicated or the context otherwise requires, references in this information statement to the “Company,” “we,” “us,” “our,” and
“our company” refer to Constellation Newholdco, Inc. and its consolidated subsidiaries, and references herein to “Exelon” refer to Exelon Corporation andits consolidated subsidiaries prior to the completion of the separation.
Each of the Company’s and Exelon’s affiliated operations is owned and operated by a separate subsidiary that has its own management, employees
and assets. References herein to the consolidated “Company,” “Exelon,” “Parent” or “its” or “our” assets and activities are not meant to imply, nor shouldthey be construed as meaning, that the Company or Exelon has any direct operating assets, employees or revenue, or that any of the subsidiaries areoperated by the Company or Exelon.
Unless otherwise indicated or the context otherwise requires, all information in this information statement gives effect to the effectiveness of our
amended and restated certificate of incorporation and amended and restated bylaws, the forms of which will be filed as exhibits to the registration statementof which this information statement forms a part.
i

FINANCIAL STATEMENT PRESENTATION
This information statement includes certain historical consolidated financial and other data for Generation and its subsidiaries. Constellation
Newholdco, Inc. will become the parent of Generation immediately prior to the separation. Constellation Newholdco, Inc. is the registrant under theregistration statement of which this information statement forms a part and will be the financial reporting entity following the consummation of theseparation. Generation is presently, and will continue to be, a financial reporting entity following the separation.
This information statement also includes an unaudited pro forma condensed consolidated balance sheet as of December 31, 2020 and unaudited
pro forma condensed consolidated statement of operations for the year ended December 31, 2020, which present our consolidated financial position andresults of operations after giving effect to the separation and distribution, and the other transactions described under “Unaudited Pro Forma CondensedConsolidated Financial Statements.” The unaudited pro forma condensed consolidated financial statements are presented for illustrative purposes only andare not necessarily indicative of the operating results or financial position that would have occurred if the relevant transactions had been consummated onthe date indicated, nor is it indicative of future operating results.
You should read the section titled “Unaudited Pro Forma Condensed Consolidated Financial Statements,” which is qualified in its entirety by
reference to the audited consolidated financial statements and related notes thereto and the financial and other information, including in the sections titled“Risk Factors,” “Capitalization” and “Management’s Discussion and Analysis of Financial Condition and Results of Operations,” in each case includedelsewhere in this information statement.
Constellation Newholdco, Inc. was formed on June 15, 2021 in connection with the separation transaction and has engaged in no activity other
than incidental to the separation. As of June 15, 2021, it has no assets or liabilities. In connection with the separation transaction, Constellation Newholdco,Inc. will become the parent of Generation and its subsidiaries, which will constitute all of its assets and business operations.
INDUSTRY AND MARKET DATA
This information statement contains estimates and projections regarding market and industry data that were obtained from internal Company
estimates as well as third-party sources, such as market research, consultant surveys, publicly available information and industry publications and surveys.We believe the information provided or made available by these third-party sources is generally reliable. However, market data is subject to change andcannot always be verified with complete certainty due to limits on the availability and reliability of raw data, the voluntary nature of the data-gatheringprocess and other limitations and uncertainties inherent in any statistical survey, interpretation or presentation of market data and management’s estimatesand projections. In addition, projections are often wrong. As a result, you should be aware that market data set forth herein, and estimates, projections andbeliefs based on that data presented herein, may not be reliable. We have not independently verified any of the data from third-party sources nor have weascertained the underlying economic assumptions relied upon therein, and we cannot guarantee its accuracy or completeness. Unless identified as a third-party source, market data is based on internal company estimates and data. Similarly, internal company estimates, which we believe to be reliable, are basedupon management’s knowledge of the industry as of the date of those estimates and have not been verified by any independent sources. Accordingly, wecannot guarantee the accuracy or completeness of any such information and you should not place undue reliance on that information when making yourinvestment decision.
ii

CAUTIONARY NOTE REGARDING FORWARD-LOOKING STATEMENTS
This information statement and other materials Exelon and we have filed or will file with the SEC (and oral communications that Exelon and we
may make) contain or incorporate by reference statements that relate to future events and expectations and, as such, constitute forward-looking statementsunder the securities laws. Forward-looking statements include those statements containing words such as “anticipates,” “believes,” “could,” “estimates,”“expects,” “forecasts,” “goal,” “guidance,” “intends,” “may,” “outlook,” “plans,” “projects,” “seeks,” “sees,” “should,” “targets,” “will,” “would,” or otherwords with similar meaning. All statements that reflect Exelon’s or our expectations, assumptions or projections about the future, other than statements ofhistorical fact, are forward-looking statements, including, without limitation, statements and guidance regarding future financial results or operatingperformance; and statements about Exelon’s or our strategies, outlook, business and financial prospects. Forward-looking statements are not guarantees offuture performance and are subject to risks, uncertainties, and changes in circumstances that are difficult to predict. Although each of Exelon and webelieve that the expectations reflected in any forward-looking statements it makes are based on reasonable assumptions, no assurance can be given thatthese expectations will be attained, and it is possible that actual results may differ materially from those indicated by these forward-looking statements dueto a variety of risks and uncertainties. Such risks and uncertainties include the following:
· deterioration in global economic and financial market conditions generally;· unfavorable changes in the markets served by Exelon and us;· competition from disruptive technologies, industry consolidation or other developments;· the loss of key customers or significant changes in the business or financial condition of customers;· political, economic, and regulatory risks relating to Exelon’s and our operations;· acts of war, terrorism or civil unrest;· pandemics or other public health crises, and adverse changes in economic and market conditions related to such pandemics or other health crises;· a material disruption of our operations, particularly at one or more of our nuclear generating facilities;· the inability to achieve the level of revenue growth, cash generation, cost savings, improvement in profitability and margins, fiscal discipline, or
strengthening of competitiveness and operations anticipated or targeted;· the impact of potential cyber-attacks and information technology or data security breaches;· the inability to develop innovative new products or implement technology initiatives successfully;· adverse changes in discount rates or investment returns on pension assets;· Exelon’s and our inability to realize expected benefits, in each case as planned and by targeted completion dates, from acquisitions, divestitures,
facility closures, curtailments, expansions or joint ventures;· a significant downturn in the business or financial condition of a significant supplier;· the outcome of contingencies, including legal proceedings, government or regulatory investigations, and environmental compliance and
remediation, which can expose Exelon and us to substantial costs and liabilities;· the expected benefits and timing of the separation, and uncertainties regarding the planned separation, including the risk that conditions to the
separation will not be satisfied and that it will not be completed pursuant to the targeted timing, asset perimeters, and other anticipated terms, if atall;
· the impact of the separation on Exelon’s businesses;· a determination by the IRS that the distribution or certain related transactions should be treated as taxable transactions;· the possibility that any consents or approvals required in connection with the separation will not be received or obtained within the expected time
frame, on the expected terms or at all;· the risk that dis-synergy costs, costs of restructuring transactions and other costs incurred in connection with the separation will exceed our
estimates; and· the impact of the separation on our businesses and the risk that the businesses will not be separated successfully or such separation may be more
difficult, time-consuming or costly than expected, which could result in additional demands on Exelon’s resources, systems, procedures andcontrols, and disruption of our ongoing business, and impact our relationships with customers, suppliers, employees and other businesscounterparties.
There can be no assurance that the distribution and separation will in fact be consummated in the manner described or at all. The above list of
factors is not exhaustive or necessarily in order of importance. For additional information on identifying factors that may cause actual results to varymaterially from those stated in forward-looking statements, see the discussions under “Risk Factors” in this information statement. Any forward-lookingstatement speaks only as of the date on which it is made, and each of Exelon and we assume no obligation to update or revise such statement, whether as aresult of new information, future events or otherwise, except as required by applicable law.
iii

SUMMARY
This summary highlights information contained in this information statement and provides an overview of the Company, our separation from
Exelon and the distribution of our common stock by Exelon to its shareholders. For a more complete understanding of our business and the separation,you should read this entire information statement carefully, particularly the sections titled “Risk Factors” and “Unaudited Pro Forma CondensedConsolidated Financial Statements” and the audited consolidated financial statements and the notes thereto included in this information statement.
Our Business
Our Company is America’s leading clean energy company, based on the production of carbon-free electricity. We are the largest supplier ofclean energy and sustainable solutions to homes, businesses, public sector, community aggregations and a range of wholesale customers (such asmunicipalities, cooperatives and other strategics) across the continental U.S., backed by more than 31,000 megawatts of generating capacity consistingof nuclear, wind, solar, natural gas and hydro assets. In 2020, the Company produced nearly 12% of the nation’s carbon-free energy (based solely ongeneration output of electricity) according to published reports on energy delivery by the U.S. Energy Information Administration, making it animportant partner to businesses and state and local governments that are setting ambitious carbon-reduction goals and seeking long-term solutions to theclimate crisis.
The Company is comprised of two primary business units: Constellation NewEnergy, Inc. and Exelon Generation Company, LLC. The
combined Company operates in 48 states, Canada and the U.K. and employs approximately people. We believe shareholder value is built on a foundation of operational excellence and the pairing of our customer facing platform with our clean
energy fleet. We are focused on optimizing cash returns through a disciplined approach to cost management and efficient operations, underpinned bystable and durable margins from our customer-facing business coupled with generation payments associated with our clean energy attributes. We arecommitted to maintaining investment grade credit ratings, to returning value to our shareholders (subject to approval by our Board of Directors) and toinvesting in clean energy solutions.
Our Operations
Customer-Facing Business: Constellation NewEnergy, Inc. Constellation is one of the nation’s largest and most innovative energy suppliers, serving diverse customers of all sizes across the U.S. through
operations focused around power supply, gas supply and energy solutions. Constellation is active in all domestic wholesale power and gas marketsspanning most of the lower 48 states and has complementary retail activity across many of those states.
Constellation Retail Has a Diverse Geographic Footprint
Power Supply. Constellation is a leader in power supply, supplying 215 TWhs annually to a customer base including utilities, municipalities,
cooperatives, commercial and industrial entities, residences, and public sector entities. Its customer base includes three-fourths of Fortune 100companies. It is the largest retail commercial and industrial power provider and the third largest residential power provider in the U.S., supplyingapproximately 145 TWh to business and public sector customers and approximately 10 TWh to residential customers.
1

Constellation’s wholesale channel-to-market serves approximately 60 TWh of power load across competitive utility load procurements and
bilateral sales to municipalities, coops, banks, and other wholesale entities. Complementary to its national portfolio, Constellation has several decades ofrelationships with wholesale counterparties across all domestic power markets as a means of both monetizing its own generation, as well as sourcingcontracted generation to meet customer and portfolio needs. With the increased trend toward customer demand for sustainability, this ability to sourcecontracted generation has provided a capital-light way for the Company to provide customers with the renewable products they are demanding tosupport a cleaner energy ecosystem.
Gas Supply. Constellation is also leader in gas supply, serving 1,600 Bcf of gas annually to a wide range of customers across many sectors,
including manufacturing, services, public sector, transportation, and utilities. We have strong capabilities across the entire natural gas value chain, whichallows us to optimize our portfolio to provide both low cost and customized solutions to our customers. Similarly, the scope of our natural gas businessprovides us wide geographic coverage across all domestic natural gas markets.
Customer Acquisition and Retention: Constellation primarily serves commerical and industrial (“C&I”) customers across the U.S. These
strong, proven customer relationships are a key part of our customer-facing business strategy. High customer satisfaction levels, market expertise,stability and scale drive growth and result in historically-proven business consistency and margins. Customer retention rates have been strong over thelast five years across C&I power customer groups, with power C&I renewal rates of 74-79% and an average contract term of 25 months and customerduration of more than six years and with gas C&I retention rates of 90-92%. Constellation is also successful at acquiring new customers by offering avariety of innovative services and products, meeting customers where they are in the buying cycle. While providing customers with the best possibleprice is a key focus, Constellation leverages its broad suite of electric and gas product structures, oftentimes customized, to provide its customers withthe commodity solution that best fits their needs. Future growth will be primarily driven from new and growing digital channels with a focus oninnovative products aimed at clean energy solutions.
Constellation is Defined by Consistent Load, Enabling Durable, Stable Cash Flows(a)
a)Reflects retail load and wholesale load auction volumes as of December 31, 2020.
Energy Solutions. Constellation benefits from significant economies of scale that allow it to structure highly tailored solutions targeted to a
customer’s unique power needs and clean energy goals. Constellation is a leader in enabling a clean energy future for its customers through a suite ofproducts and services, beyond power and natural gas, that can be integrated into existing commodity purchasing strategies. Our customer solutionsinclude specialty power and gas products matching customers’ risk tolerance and risk management needs, energy efficiency, carbon free products,energy usage and management solutions, among others. Constellation partners with its customers to provide options along the sustainabilitycontinuum, with a focus on renewable, efficiency and technology applications to meet their carbon free energy goals.
2

Generation Generation operates the largest zero-carbon fleet in the nation and one of the largest generating fleets in the country. Generation’s nuclear fleet has current generating capacity of approximately 19 gigawatts and produced 150 TWh (net ownership) of zero-
emissions electricity last year – enough to power 13.6 million homes and avoid more than 78 million metric tons of carbon emissions. Generationconsistently operates at best in class levels. In 2020, Generation recorded a capacity factor of 95.4%, second only to 2019 performance in fleet history,and an average refueling outage duration of 22 days, 11 days better than the industry average. Generation has ownership interests in thirteen nucleargenerating stations currently in service, consisting of 23 units. Generation will continue to be a leading advocate for clean energy policies aimed atpreserving and growing clean energy to combat the climate crisis.
Generation also operates more than 12 gigawatts of natural gas, oil, hydroelectric, wind, and solar generation assets, which provide a mix ofbaseload, intermediate, and peak power generation. Our fossil and renewable fleet has similarly demonstrated a track record of strong performance witha 98.4% power dispatch match1 and 93.4% renewables energy capture. 2
Collectively, the combined fleet is nearly 90% carbon-free (based on generation output of electricity) and represents the fourth largest
generation portfolio in the U.S. in terms of total generation with meaningful geographic diversity. The charts below illustrate our supply source as of December 31, 2020:
Supply Source(a)(b)
Generation Output GWh % Nuclear 175,085 62.2%Fossil (primarily natural gas and oil) 19,501 6.9%Renewable 7,052 2.5%Purchased Power 79,972 28.4%
Total 281,610 100%
a) Nuclear includes the proportionate share of output where Generation has an undivided ownership interest in jointly-owned generating plants and includes the total output of plants that are fully consolidated.
b) Renewable includes wind, hydroelectric, solar, and biomass generating assets.
Constellation employs an integrated, ratable hedging strategy to manage commodity price volatility in energy gross margins over time. The
generation portfolio has operated under a risk-mitigated ratable hedging strategy for more than a decade in which the prompt three years are hedged onan approximate rolling 90% / 60% / 30% basis – enabling cash flow stability while allowing commercial opportunities to generate value for theenterprise.
1 Dispatch match is used to measure the responsiveness of a unit to the market and is expressed as the actual energy revenue net fuel relative to therevenue net fuel when the unit is dispatched by the RTO or Constellation. Unit dispatch match is calculated as follows: (Actual Generation * (LocationalMarginal Price – Generation Cost) / (Desired Generation * (Locational Marginal Price - Generation Cost). Locational marginal price represents thehourly market price per MW of energy at the bus closest to the unit. Desired generation equals the MWs the units is asked to run by either Constellationor the RTO. Generation costs represent the full load operating costs, including fuel and variable O&M.
2 Energy capture is an indicator of how efficiently the installed assets capture the natural energy available from the wind and the sun. Energy capturerepresents an energy-based fraction, the numerator of which is the energy produced by the sum of the wind turbines/ solar panels in the year, and thedenominator of which is the total expected energy to be produced during the year. Energy capture for the combined wind and solar fleet is weighted bythe relative site projected pre-tax variable revenue, with deductions made for certain events that are non-controllable, such as force majeure events andtransmission curtailments.
3

Our Competitive Strengths
We believe that we are well-positioned to execute our business strategy and create superior value for stakeholders based on the followingcompetitive strengths:
· We are positioned to help address the climate crisis and lead to a clean energy future
As a Company, we are committed to a clean energy future, and we believe our generation fleet is essential to helping meet clean energy policy
and targets, at the state and national level. Approximately 90% of our generation fleet is emissions free (based on generation output). We do not owncoal-fired generation. According to the July 2021 Benchmarking Air Emission report, our Company produces approximately 65% more clean energythan the next leading provider and more than 8 to 15 times the clean energy of independent power producer peers. Our fleet has the lowest emissionsintensity – nearly five times less intensive than the next lowest generator.
Our Company is the Largest Producer of Clean Electricity in the U.S.(a)
a) Source: Benchmarking Air Emissions, July 2021, published by M.J. Bradley & Associates LLC. Reflects 2019 regulated and non-regulated
generation. Number in parentheses is the company’s generation ranking in that year.
Our generation fleet is essential to meeting federal and state clean energy goals. Generation produced 12% of the zero-carbon energynationwide and even more in several states in which we operate – 95% in Maryland, 82% in Illinois, 38% in Pennsylvania and 33% in New York. Eachof these states has set decarbonization and clean energy targets. Losing any of our clean assets in these states would be a significant step backward forachieving clean energy or climate goals while also creating higher costs for customers and significant economic hardship for our plant communities.
4
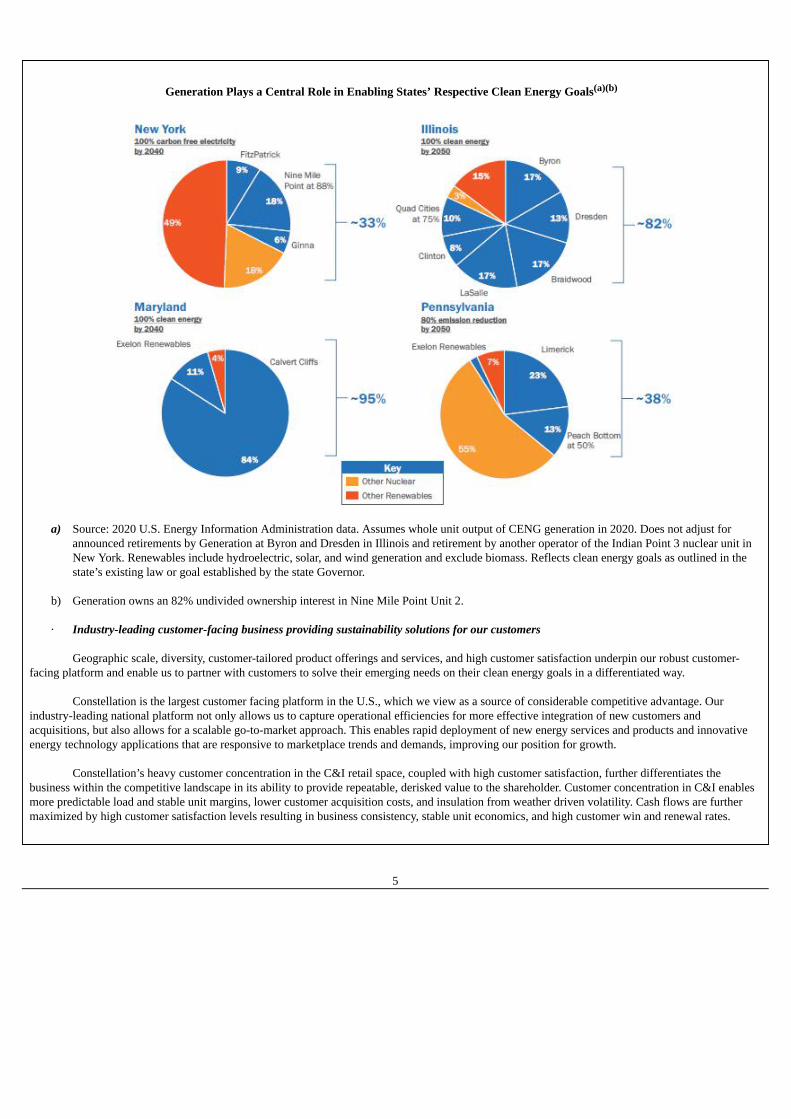
Generation Plays a Central Role in Enabling States’ Respective Clean Energy Goals(a)(b)
a) Source: 2020 U.S. Energy Information Administration data. Assumes whole unit output of CENG generation in 2020. Does not adjust for
announced retirements by Generation at Byron and Dresden in Illinois and retirement by another operator of the Indian Point 3 nuclear unit inNew York. Renewables include hydroelectric, solar, and wind generation and exclude biomass. Reflects clean energy goals as outlined in thestate’s existing law or goal established by the state Governor.
b) Generation owns an 82% undivided ownership interest in Nine Mile Point Unit 2.
· Industry-leading customer-facing business providing sustainability solutions for our customers
Geographic scale, diversity, customer-tailored product offerings and services, and high customer satisfaction underpin our robust customer-
facing platform and enable us to partner with customers to solve their emerging needs on their clean energy goals in a differentiated way. Constellation is the largest customer facing platform in the U.S., which we view as a source of considerable competitive advantage. Our
industry-leading national platform not only allows us to capture operational efficiencies for more effective integration of new customers andacquisitions, but also allows for a scalable go-to-market approach. This enables rapid deployment of new energy services and products and innovativeenergy technology applications that are responsive to marketplace trends and demands, improving our position for growth.
Constellation’s heavy customer concentration in the C&I retail space, coupled with high customer satisfaction, further differentiates the
business within the competitive landscape in its ability to provide repeatable, derisked value to the shareholder. Customer concentration in C&I enablesmore predictable load and stable unit margins, lower customer acquisition costs, and insulation from weather driven volatility. Cash flows are furthermaximized by high customer satisfaction levels resulting in business consistency, stable unit economics, and high customer win and renewal rates.
5

Constellation Benefits from Strong Customer Relationships, with Leading C&I Renewal Rates
· Best-in-class nuclear operations
Our world class operations result in industry-leading operating performance at our generation facilities. Our generation fleet has achieved an
industry-leading nuclear capacity factor of approximately 94% or higher since 2013 -- four percentage points better than the 2020 industry average ofapproximately 90%. Our 2020 average refueling outage duration was 22 days -- 11 days better than the industry average.
· Disciplined financial management focused on strong balance sheet and optimizing cash returns
Our commitment to investment grade credit ratings remains paramount as we prioritize capital allocation to support a strong balance sheet,
invest in both clean energy solutions and our customer-facing businesses, enable customer growth and return value to shareholders. We view a strong balance sheet as a competitive strength in managing through periods of commodity price volatility with heightened agility.
We are focused on allocating available cash flow to manage leverage to meet investment grade targets with incremental cash flows allocated to investingin both clean energy solutions and our customer-facing business and returning capital to shareholders. We believe a strong balance sheet and robust cashflow generation, combined with our current presence and scale in diverse markets, will position us favorably in pursuit of value-enhancing growthopportunities.
With high customer satisfaction, strong customer renewal and retention and best-in-class operating expertise, we are well-positioned to deliver
sustainable and durable cash flows. To further support cash flow, we will continue to focus on operational efficiencies and cost management whileensuring the safety and reliability of our operations. In addition, our integrated and ratable hedging activities serve to manage commodity price volatilityin energy gross margins over time.
· Committed to supporting all stakeholders through a strong commitment to environmental, social and governance practices
We are committed to the highest standards of corporate governance to help us achieve our performance goals and to maintain the trust and
confidence of our shareholders, employees, customers, regulators and other stakeholders. Environmental, Social and Governance principles have been atthe core of our business since its original founding and will continue to be core to the Company.
We will continue to support our diverse employees, customers, communities and business partners, ensuring all are able to fully and equitably
participate in social, environmental and economic progress. We will maintain the highest standards of corporate governance, operating responsibly andtransparently with a continued focus on board refreshment and diversity.
6

Our Business Strategy
Our business strategy is to maximize value for all of our stakeholders through a particular emphasis on: Focus on cash returns, business optimization, repeatable customer revenues, and capital allocation. We run our business with a focus on producing strong, robust cash flows in order to sustain our operations, maintain our investment grade
credit targets, and fund shareholder return and growth opportunities. We remain focused on operating efficiency and cost management, while ensuringsafety and operational excellence, to support stability in free cash flow generation.
We aim to achieve growth in cash flows from our customer facing business by increasing volumes and driving margin improvement across all
channels to market. Increasing volumes are expected to come from organic and acquisitive customer growth, both in commodity offerings as well asreaching previously inaccessible customers through non-commodity energy services and solutions. Increasing margins are expected to come from value-add products, services, and analytics coupled with existing offerings. We can leverage our existing platform to achieve economies of scale benefits onincremental volumes, leading to higher overall margins per customer and improved free cash flow conversion.
We also aim to achieve growth in cash flows from our generation business through a rigorous focus on operating performance and cost
optimization. We will continue to evaluate the cost-benefit analysis of all operating and capital allocation decisions to optimize value for ourstakeholders, without sacrificing our commitment to safety. Further, our ratable hedging strategies, coupled with stable revenues generated throughcapacity markets and contracts for zero emissions attributes, will enable the business to continue to mitigate cash flow volatility, while preserving long-term optionality to realize any potential upside from market price improvements and/or state and federal clean energy programs. In addition, we willcontinue advocating for clean energy policies and seek fair compensation for the zero-carbon attributes of our nuclear plants while maintaining thediscipline to retire uneconomic assets.
We will employ a disciplined approach to acquisitions that grows future cash flow and supports strategic initiatives. We will continue to
evaluate asset and business divestitures to rationalize the portfolio and optimize cash proceeds. Capital allocation decisions are made on a cash return basis, as we believe this discipline is necessary to drive consistent long-term value
creation for our shareholders. In the years ahead, we expect to deliver substantial free cash flow supported by our stable customer facing business,disciplined hedging strategy and effective cost management, with more than $1.1 billion of cost reductions realized since 2015.
Financial discipline and balance sheet commitment. We are committed to maintaining sufficient financial liquidity and an appropriate capital structure to support safe, secure and reliable
operations, even in volatile market conditions. We believe our investment grade credit rating is a source of competitive advantage, and we intend tocontinue to maintain our credit position and best-in-class balance sheet. In line with that commitment, available cash flow will first be used to manageleverage to comfortably meet investment grade credit targets, with incremental capital allocated towards shareholder return and disciplined growth.
Excellence in operations. Value is built on a foundation of operational excellence. We recognize operational efficiency, a culture of continuous improvement and
disciplined investment, and robust safety practices as critical drivers. We have robust safety programs. We have a demonstrated commitment evidenced by our exceptional safety track record, underpinned by a
strong compliance and risk management culture. At Constellation, we have strong, durable relationships with our customers resulting in stable financialmargins, underpinned by strong operational performance in our customer-facing business.
Taking the lead on driving toward a clean energy future. We are committed to enabling a clean energy future through our generation operations and our customer-facing business. Through our two
businesses, we aim to serve as an indispensable partner to businesses and the state and local governments that are setting ambitious carbon-reductiongoals and seeking long-term solutions to the climate crisis. We advocate for policies that address the climate crisis and preserve and grow clean energy.
We are differentiated by the cleanest generation fleet in the country. As environmental sustainability continues to build momentum and grows
for businesses across the country, the demand for clean and sustainable energy solutions increases. Constellation offers clean products to help customersmeet their sustainability goals. We expect our product offerings to evolve with our customers’ needs.
7

For nearly two decades, we have been a strong advocate for policies that would address the climate crisis. We will continue to be a leading
advocate at the federal level and in the states in which we operate for policies reducing greenhouse emissions, and preserving and growing clean energy.
Our Key Markets
We operate across various markets in the U.S., as well as Canada and the U.K. Our generation resources allow us to generate, procure, and sellelectricity to retail and wholesale customers, highlighting the integrated nature of our business. We also have the ability to contract for generation in themarkets in which we operate, further facilitating our ability to match generation output to customer demand (gen-to-load) and customer-to-supply as anintegrated business. We have five reportable segments covering the following geographical areas:
· Mid-Atlantic: Eastern half of PJM, which includes New Jersey, Maryland, Virginia, West Virginia, Delaware, the District of Columbia, and
parts of Pennsylvania and North Carolina
· Midwest: Western half of PJM and the U.S. footprint of MISO, excluding MISO’s Southern Region
· New York: NYISO
· Texas: ERCOT
· Other Power Regions: New England, South, West and Canada
Generation Markets PJM. 65% of our generation fleet, as measured by net generating capacity, operates within the PJM market. By MW, our generation fleet in
PJM consists of approximately 78% nuclear, 9% renewables, 8% gas and 5% oil. PJM is the largest power market in the U.S. It comprises all or parts ofDelaware, Illinois, Indiana, Kentucky, Maryland, Michigan, New Jersey, North Carolina, Ohio, Pennsylvania, Tennessee, Virginia, West Virginia and theDistrict of Columbia. PJM is one of the most advanced power markets in the U.S., with nodal day-ahead and real-time energy markets, ancillary serviceproducts, and a forward capacity market.
ERCOT. 12% of our generation fleet, as measured by net generating capacity, operates within the ERCOT market. By MW, our generation fleet
in ERCOT consists of approximately 97% gas and 3% renewables. As an energy-only market, ERCOT’s market design is different from othercompetitive electricity markets in the U.S., as its resource adequacy is predominately dependent on free market processes and energy market pricesignals.
NYISO. 6% of our generation fleet, as measured by net generating capacity, operates within the NYISO market. By MW, our generation fleet
in NYISO consists of almost 100% nuclear. NYISO features liquid day-ahead and real-time energy markets, ancillary service markets, and a spotcapacity market, called the ICAP market, which clears capacity up to 6 months in advance of the delivery period. As a result, our power assets withinNYISO can earn revenues from liquid ancillary, energy, and capacity markets.
Other power markets. The remaining 17% of our generation fleet operates in other markets, including CAISO, ISO-NE, MISO and SPP in the
U.S., and AESO in Canada. Our generation in these markets, by MW, consists of approximately 20% nuclear, 46% gas, 13% oil and 20% renewables. The CAISO market serves customers primarily in California. CAISO features day-ahead and real-time energy markets and ancillary service
markets. While CAISO does not operate a formal capacity market, it does have a mandatory resource adequacy requirement. The ISO-NE market covers the six states of Connecticut, Maine, Massachusetts, New Hampshire, Rhode Island and Vermont. It offers day-
ahead and real time energy markets, ancillary service products and a forward capacity market. MISO is an RTO that covers all or parts of 15 states: Arkansas, Illinois, Indiana, Iowa, Kentucky, Louisiana, Michigan, Minnesota, Mississippi,
Missouri, Montana, North Dakota, South Dakota, Texas, and Wisconsin, as well as the Canadian province of Manitoba. MISO operates day-ahead andreal time energy markets and ancillary service markets. Capacity requirements are addressed through bilateral transactions or a voluntary annual auctionthat MISO administers.
8

SPP has members in 14 states: Arkansas, Iowa, Kansas, Louisiana, Minnesota, Missouri, Montana, Nebraska, New Mexico, North Dakota,
Oklahoma, South Dakota, Texas and Wyoming. It also provides contract reliability coordination services in Arizona, Colorado and Utah. SPP operatesday-ahead and real-time energy markets and transmission service markets.
AESO provides the function of Independent System Operator in Alberta, Canada, where we own one generation asset. It is currently an energy-
only model and does not operate a capacity market. AESO also operates a separate ancillary services market where resources provide specific servicesthat help maintain grid reliability.
Customer Markets Our integrated business also consists of the physical delivery and marketing of power and natural gas across multiple geographical regions
through Constellation, our customer-facing business. Constellation serves power and natural gas across all competitive markets, reaching approximately2 million customers, including three-fourths of the Fortune 100, approximately 216,500 business and public sector customers, and about 1.6 millionunique residential customers. Constellation also has a vibrant non-commodity element of its customer facing business, providing sustainability,efficiency and technology solutions to provide a comprehensive suite of energy solutions to meet customers’ growing and evolving needs.
Summary of Risk Factors
An investment in the Company’s common stock is subject to a number of risks, including market, financial, regulatory and operational risksrelated to our business, our separation from Exelon, and our common stock. Set forth below are some, but not all, of these risks.
· Risks related to market and financial factors primarily include:
· the price of fuels, in particular the price of natural gas, which affects power prices,· the generation resources in the markets in which we operate,· our ability to operate our generating assets, our ability to access capital markets, and the impacts on our results of operations due to the
global outbreak (pandemic) of the 2019 novel coronavirus (COVID-19),· the impacts of on-going competition, and· emerging technologies and business models, including those related to climate change mitigation and transition to a low carbon economy.
· Risks related to regulatory, legislative and legal factors primarily include changes to, and compliance with, the laws and regulations that
govern:
· the design of power markets,· the renewal of permits and operating licenses,· environmental and climate policy, including zero emission credit programs, and· tax policy.
· Risks related to operational factors primarily include:
· changes in the global climate could produce extreme weather events, which could put our facilities at risk, and such changes could also
affect the levels and patterns of demand for energy and related services,· the safe, secure and effective operation of our nuclear facilities and the ability to manage effectively the associated decommissioning
obligations,· the ability of energy transmission and distribution companies to maintain the reliability, resiliency and safety of their energy delivery
systems, which could affect our ability to deliver energy to our customers and affect our operating costs, and· physical and cyber security risks for us as an owner-operator of generation facilities and as a participant in commodities trading.
9

· Risks related to our separation from Exelon primarily include:
· challenges to achieving the benefits of separation, including limited business diversification, loss of economies of scale in sourcing goods
and services, and the need to replicate several services provided by Exelon (such as treasury, finance, human resources, investor relationsand legal), which will require additional resources and expense,
· little control over the terms and timing of the separation (including regulatory approvals), which are determined by Exelon (and withrespect to regulatory approvals, the applicable regulator), and Exelon’s ability to change the terms at any time or elect not to proceed,
· performance by Exelon and us under the transaction agreements, including indemnification responsibilities tied to the allocation ofbusinesses and liabilities, and
· restrictions on future capital-raising or strategic transactions during the two-year period following the distribution arising from the need toprotect the tax-free treatment of the distribution.
· Risks related to our common stock primarily include:
· following the separation, there can be no assurance that the combined trading prices of Exelon common stock and our common stock will
be equal to or greater than the trading price of Exelon shares prior to the separation,· the absence of a currently existing trading market for our stock and possible volatility in the market for our stock as holders of Exelon
stock seek to reorganize their holdings based on stock index or industry strategies, investment policies or other factors, in addition to thegeneral factors affecting the market price of common stock,
· our status as a holding company dependent on cash flows from our subsidiaries to meet financial obligations, and· certain anti-takeover provisions in our charter and bylaws that could have the effect of delaying or discouraging an acquisition of our
company or a change in its management.
These and other risks relating to our business, our industry, the distribution and separation and our common stock are discussed in greater detailunder the heading “Risk Factors” on page 21 of this information statement. You should read and consider all of these risks carefully.
Company Information
Constellation Newholdco, Inc. was incorporated in Pennsylvania on June 15, 2021. Our principal executive offices are at , and our telephonenumber is . Our website is . The information and other content contained in, or accessible through, our website are not part of, and are notincorporated into, this information statement, and investors should not rely on any such information in deciding whether to invest in our common stock.
The Separation
The following provides a summary of the terms of the separation. For a more detailed description of the matters described below, see “TheSeparation” beginning on page 38 of this information statement.
Overview On February 21, 2021, Exelon’s board of directors unanimously authorized management to pursue a plan to separate its competitive generation
and customer-facing businesses into a stand-alone publicly traded company, which we refer to as the separation in this information statement. Theseparation will occur through a distribution to Exelon’s shareholders of all of the shares of common stock of the Company, which will own ExelonGeneration Company, LLC, including its competitive generation and customer-facing energy businesses. Following the distribution, Exelonshareholders will own 100% of the shares of our common stock.
Before our separation from Exelon, we will enter into a separation agreement and several other agreements with Exelon to effect the separation
and provide a framework for our relationship with Exelon after the separation. These agreements will govern the relationships between us and Exelonsubsequent to the completion of the separation and address responsibility for liabilities and obligations (including employee benefits and tax-relatedassets and liabilities) relating to the separated businesses attributable to periods prior to, at and after our separation from Exelon. For more informationon the separation agreement and related agreements, see “Certain Relationships and Related Party Transactions” in this information statement.
As more fully described in “The Separation—Reasons for the Separation”, the Exelon board of directors believes that the separation will
increase both the value of Exelon’s competitive generation, customer-facing and related businesses as well as the value of Exelon’s regulated utilitybusinesses, in both the short and long terms.
10

The separation is subject to the satisfaction or waiver of certain conditions, including the receipt of regulatory approvals from the NRC, FERC
and NYPSC. Requests for NRC, FERC and NYPSC approvals were submitted on February 25, 2021. In addition, until the distribution has occurred,Exelon’s board of directors has the right to not proceed with the distribution, even if all of the conditions are satisfied. See “The Separation—Conditionsto the Distribution” in this information statement.
Reasons for the Separation Exelon is comprised of six regulated utility operating companies that together serve more than 10 million customers, and Generation, an
electricity producer and a competitive energy retailer. The utility operating companies provide electricity transmission and distribution and gasdistribution services within relatively defined geographic areas under service terms, conditions and rates that are regulated by public utilitycommissions based on each utility’s investment in plant, property and equipment, referred to as rate base, and their operating costs. Generationgenerates electricity primarily from nuclear generating plants and sells electricity and natural gas to wholesale and retail customers within a broadgeographic area under service terms, conditions and prices determined by competitive market forces.
The Exelon board of directors believes that the separation of the competitive generation and customer-facing energy businesses from the
regulated utility businesses is in the best interest of Exelon and its shareholders for a number of reasons, including: · Direct investment identity -- Exelon’s board of directors believes that Exelon’s regulated utility businesses and our competitive businesses
appeal to different types of investors with different industry focuses, investment goals and risk profiles.
· More specialized strategic focus -- The separation will allow each company to more effectively pursue its own distinct operating prioritiesand strategies, without taking into account potentially conflicting or competing needs and objectives of two disparate businesses operatingin a single company. As a standalone company, the Company may be able to pursue investments or acquisitions in the competitive energyinfrastructure space that Exelon’s current shareholders would not find attractive as it would increase Exelon’s exposure to non-regulatedbusinesses.
· More efficient allocation of capital—The separation will permit each company to concentrate its financial resources solely on its own
operations, providing greater flexibility to invest capital in its business in a time and manner appropriate for its distinct strategy andbusiness needs.
· Allows each business to maintain risk profiles more appropriate for its shareholders —The competitive generation and customer-facing
energy businesses of Exelon are exposed to certain market risks, including, in the near term, the volatility in the price of power, natural gasand other commodities. The Company will be committed to disciplined risk-mitigation policies, including a ratable hedging strategy, andExelon’s board of directors believes that separating the Company from the regulated utilities of Exelon will give our management furtherflexibility to manage our risk.
· Aligns management incentives—The separation will permit the creation of equity-based incentive compensation programs for each of the
companies that is expected to reflect more closely the efforts and performance of each company’s management and will allow eachcompany to better recruit, retain and motivate employees pursuant to compensation policies that are appropriate for their respective linesof business.
For information about risks related to the separation, see “Risk Factors – Risks Relating to Our Separation from Exelon” below in this informationstatement. Neither Exelon nor we can assure you that, following the separation, any of the benefits described above or otherwise will be realized to theextent anticipated or at all. Questions and Answers About the Separation
The following is a summary of the terms of the separation in a question and answer format. As a summary, it may not cover all of theinformation that may be important to you. You should read the section entitled “The Separation” beginning on page 38 of this information statement fora more detailed description of the matters described below.
Q: What is the separation?
A: The separation is the spin-off distribution of our businesses from Exelon. Once the separation is complete, we will be an independent,
publicly traded company focused on our competitive power generation and customer-facing energy businesses. Exelon will continue as an independent,publicly traded company focused on its regulated utility businesses.
11

Q: Why is Exelon separating the Company from Exelon?
A: Exelon’s board of directors and management believe that the separation will provide, for each of Exelon and the Company following
the separation, a more direct investment identity, enhanced strategic and management focus, more efficient allocation of capital, and will alignmanagement incentives more effectively.
The separation will create the nation’s largest pure transmission and distribution utility and the largest carbon-free power producer and retail
energy solutions provider, each with the financial strength to drive long-term stability and innovation, with the expectation that both companies willhave compelling growth prospects as stand-alone companies and that the financial markets will ascribe valuations that more appropriately recognize theinherent strengths of each company. These benefits are more fully described under the caption “The Separation—Reasons for the Separation” below inthis information statement.
Q: Why is the separation of the two companies structured as a distribution?
A: Exelon believes that a distribution of our shares is the most efficient way to separate the Company in a manner that is intended to
enhance long-term value for Exelon shareholders. Q: What is the distribution?
A: The distribution is the method by which Exelon will effectuate the separation. In the distribution, Exelon will distribute to its
shareholders all of the shares of our common stock that it owns. Exelon will not retain any ownership interest in us. The number of shares of Exeloncommon stock you own will not change as a result of the distribution.
Q: What will I receive in the distribution?
A: As a holder of Exelon common stock, you will receive a dividend of share of our common stock for each share of Exelon common
stock you hold on the record date (see next question). Your proportionate interest in Exelon will not change as a result of the distribution. For a moredetailed description, see “The Separation” below in this information statement.
Q: What is the record date for the distribution, and when will the distribution occur?
A: The record date is p.m., Eastern Time, on , 2022. We expect that EQ Shareholder Services (the “Distribution Agent”) will act as
distribution agent and will distribute to Exelon shareholders the shares of our common stock on , 2022, which we refer to as the distribution date. Q: What will be distributed in the distribution?
A: Approximately shares of our common stock will be distributed in the distribution, based on the number of shares of Exelon common
stock outstanding as of , 2022. The actual number of shares of our common stock to be distributed will be calculated on the record date. The sharesof our common stock to be distributed by Exelon will constitute all of the shares of our common stock issued and outstanding immediately prior to thedistribution.
Q: What are the conditions to the distribution?
A: The distribution is subject to a number of conditions, including, among others
· receipt of regulatory approvals from the NRC, the NYPSC and FERC· the SEC declaring effective the registration statement of which this information statement forms a part· the receipt by Exelon of a private letter ruling from the IRS (the “IRS Ruling”) and an opinion of its counsel, Sidley Austin LLP,
together substantially to the effect that the distribution, together with certain related transactions, will qualify as a tax-freereorganization under Sections 355 and 368(a)(1)(D) of the IRC; and
· final approval of the distribution by Exelon’s board of directors.
12

For a more detailed description, see “The Separation—Conditions to the Distribution” below in this information statement.
Q: Can Exelon decide to cancel the distribution even if all of the conditions have been satisfied?
A: Yes. Exelon’s board of directors may, in its sole discretion and at any time prior to the distribution date, terminate the distribution,even if all of the conditions to the distribution have been satisfied.
Q: What do I have to do to participate in the distribution?
A: No action is required on your part, but we urge you to read this document carefully. Shareholders who hold Exelon common stock as
of the record date will not be required to pay any cash or deliver any other consideration, including any shares of Exelon common stock, to receive theshares of our common stock distributable to them in the distribution. In addition, no shareholder approval of the distribution is required or is beingsought. We are not asking you for a vote and are not requesting that you send a proxy card.
Q: How will Exelon distribute shares of Company common stock?
A: If you are a registered shareholder (meaning you own your stock directly through an account with Exelon’s transfer agent), EQ
Shareholder Services will mail you a book-entry account statement that reflects the number of shares of our common stock you own. We will not issuephysical certificates, even if requested. For a more detailed description, see “The Separation—Manner of Effecting the Separation—Distribution ofShares of Our Common Stock” below in this information statement.
Q: What if I hold my shares through a broker, bank or other nominee?
A: If you own your Exelon shares beneficially through a bank, broker or other nominee, your bank, broker or other nominee will credit
your account with the shares of our common stock you receive in the distribution. Q: If I sell my shares of Exelon common stock on or before the distribution date, will I still be entitled to receive shares of Company
common stock in the distribution?
A: If you sell your shares of Exelon common stock on or prior to the distribution date, you may also be selling your right to receive sharesof our common stock. For a more detailed description, see “Trading Market—Trading Prior to the Distribution Date” below in this informationstatement. You are encouraged to consult with your financial advisor regarding the specific implications of selling your Exelon common stock prior toor on the distribution date.
Q: How will fractional shares be treated in the distribution?
A: No fractional shares of our common stock will be distributed in connection with the distribution. Instead, the Distribution Agent will
aggregate all fractional shares into whole shares and sell the whole shares in the open market at prevailing market prices. The Distribution Agent willthen distribute the aggregate cash proceeds of the sales, net of brokerage fees and other costs, pro rata to each Exelon shareholder who would otherwisehave been entitled to receive a fractional share in the distribution. The receipt of cash in lieu of fractional shares generally will be taxable to the recipientshareholders as described in “The Separation—Material U.S. Federal Income Tax Consequences of the Separation” beginning on page 40 of thisinformation statement. For a more detailed description of the treatment of fractional shares, see “The Separation—Treatment of Fractional Shares”below in this information statement.
Q: Who will serve on the Company’s board of directors?
A: We expect to identify the members of our board of directors in an amendment to this information statement. Q: Who will manage the Company following the separation?
A: We expect to identify our management team in an amendment to this information statement.
13

Q: What are the U.S. federal income tax consequences of the distribution to U.S. shareholders?
A: It is a condition to the completion of the distribution that Exelon receive the IRS Ruling and an opinion from its counsel, Sidley Austin
LLP, together substantially to the effect that the distribution, together with certain related transactions, will qualify as a tax-free reorganization underSections 355 and 368(a)(1)(D) of the IRC. The IRS Ruling and opinion will rely on certain facts and assumptions, and certain representations from usand Exelon regarding the past and future conduct of our respective businesses and other matters. Assuming such qualification, no gain or loss will berecognized by, or includible in the income of, Exelon shareholders upon the receipt of shares of our common stock pursuant to the distribution.However, Exelon shareholders will recognize gain or loss with respect to any cash received in lieu of any fractional shares. See “The Separation—Material U.S. Federal Income Tax Consequences of the Separation” beginning on page 40 of this information statement and “Risk Factors—RisksRelating to Our Separation from Exelon” beginning on page 31 of this information statement for more information regarding the potential taxconsequences to you of the distribution.
Q: How will the Distribution affect my tax basis in Exelon common stock?
A: Assuming that the distribution is tax-free to Exelon shareholders (except with respect to cash received in lieu of fractional shares),your tax basis in Exelon common stock held by you immediately prior to the distribution will be allocated between that Exelon common stock and ourcommon stock received in the distribution in proportion to the relative fair market values of each immediately following the distribution. See “TheSeparation—Material U.S. Federal Income Tax Consequences of the Separation” beginning on page 40 of this information statement for a more detaileddescription of the effects of the distribution on your tax basis in Exelon common stock and our common stock.
Q: What if I want to sell my shares of Exelon common stock or my shares of Company common stock?
A: Neither Exelon nor the Company can make any recommendations on the purchase, retention or sale of shares. You should consult
with your financial advisors, such as your stockbroker, bank or tax advisor. If you decide to sell any shares of Exelon common stock after the record date, but before the distribution date, you should make sure your
broker, bank or other nominee understands whether you want to sell your Exelon common stock, our common stock you will be entitled to receive in thedistribution, or both. If you sell your Exelon common stock prior to the record date or sell your entitlement to receive shares of our common stock in thedistribution on or prior to the distribution date, you will not receive any shares of our common stock in the distribution. For a more detailed description,see “Trading Market—Trading Prior to the Distribution Date” below in this information statement.
Q: Are there risks associated with owning shares of Company common stock?
A: Yes. Our business is subject to both general and specific business risks relating to its operations. Our business is also subject to risks
relating to the separation, and, following the distribution, we will be subject to risks relating to being an independent, publicly traded company.Accordingly, you should read carefully the information set forth in the section entitled “Risk Factors” beginning on page 21 of this informationstatement.
Q: Will the number of Exelon shares I own change as a result of the distribution?
A: No, the number of shares of Exelon common stock you own will not change as a result of the distribution. Q: What will happen to the listing of Exelon common stock?
A: After the distribution, it is anticipated that Exelon will continue to be traded on NASDAQ under the symbol “EXC.” Q: What will the Company’s dividend policy be after the separation?
A: Any decision to declare and pay dividends will be made at the sole discretion of our board of directors and will depend on a number
of factors, including, among other things, our historic and projected financial condition, liquidity and results of operations. See “Dividend Policy”beginning on page 46 of this information statement.
Q: Will Company common stock trade on a stock market?
A: Currently, there is no public market for our common stock. Subject to the consummation of the distribution, we have applied to list our
common stock on NASDAQ under the symbol “ .” We cannot predict the trading prices for our common stock when that trading begins. Weanticipate that trading in shares of our common stock will begin on a when-issued basis on or shortly before the record date and will continue up to andincluding the distribution date. The term “when-issued” means that shares can be traded prior to the time shares are actually available or issued. On thedistribution date, any when-issued trading in respect of our common stock will end and regular way trading in shares of our common stock will begin onthe first trading day following the distribution date. “Regular way” trading refers to trading after a security has been issued and typically involves atransaction that settles on the second full business day after the date of trade.
14

If trading begins on a when-issued basis, you may purchase or sell our common stock up to and including the distribution date, but your transaction willnot settle until after the distribution date. For more information regarding regular way trading and when-issued trading, see “Trading Market—TradingPrior to the Distribution Date” below in this information statement.
Q: What will happen to Exelon restricted stock units and performance share awards in connection with the separation?
A: We expect to address the treatment of outstanding equity awards in an amendment to this information statement. Q: Will Exelon transfer to the Company any material assets or liabilities prior to the separation?
A: We do not expect any material asset or liability transfers to us from Exelon to occur other than the contribution of Exelon’s equity
interest in Generation (including its subsidiaries) that will occur prior to the separation. Q: What will be the relationship between Exelon and the Company following the distribution?
A: After the distribution, Exelon will not own any shares of our common stock, and each of the Company and Exelon will be
independent, publicly traded companies with their own management and boards of directors. However, in connection with the separation, we will enterinto a number of agreements with Exelon that will govern the distribution and allocate responsibilities for obligations arising before and after theseparation, including, among others, obligations relating to employees and taxes. Exelon and the Company will enter into a transition servicesagreement, which will provide for the provision of certain transitional services by Exelon to the Company, and vice versa, generally for up to 24 months,subject to certain exceptions for services that are expected to be provided for up to 36 months. Additionally, there are operating and maintenance, powersupply, and other agreements between Exelon’s utilities and Generation that will not be terminated in connection with the separation. For a moredetailed description, see “Certain Relationships and Related Party Transactions—Agreements with Exelon Related to the Separation” below in thisinformation statement.
Q: Will the distribution of Company common stock affect the market price of Exelon common stock?
A: As a result of the separation, we expect the trading price of shares of Exelon common stock immediately following the separation to be
different from the trading price of Exelon common shares immediately prior to the separation because the trading price will no longer reflect the valueof our businesses. Furthermore, until the market has fully analyzed the value of Exelon without our business, the price of shares of Exelon commonstock may fluctuate. There can be no assurance that, following the distribution, the combined value of Exelon common stock and Company commonstock will equal or exceed what the value of Exelon common stock would have been in the absence of the distribution.
Q: Will I have appraisal rights in connection with the distribution?
A: No. Holders of Exelon common stock are not entitled to appraisal rights in connection with the distribution. Q: Whom can I contact for more information regarding the Company and the distribution?
A: If you have questions relating to the mechanics of the distribution, you should contact the Distribution Agent at:
EQ Shareholder Services
Before the distribution, if you have other questions relating to the distribution, you should contact Exelon at: After the distribution, if you have any questions relating to the Company, you should contact us at: After the distribution, the transfer agent and registrar for our common stock will be:
EQ Shareholder Services
15

Summary / Terms of the Separation
The following is a summary of the material terms of the separation and other related transactions. Please see “The Separation” beginning onpage 38 for a more detailed description of the matters below.
Distributing Company Exelon Corporation, a Pennsylvania corporation. After the distribution, Exelon will not own any shares of
our common stock. Distributed Company Constellation Newholdco, Inc., a Pennsylvania corporation, is a wholly owned subsidiary of Exelon that
immediately before the distribution will own Generation, including its subsidiaries. After the distribution,the Company will be a separate, publicly traded company.
Distributed Securities Exelon will distribute all shares held by it of our common stock, which will be 100% of our common
stock issued and outstanding immediately prior to the distribution. Based on the approximately sharesof Exelon common stock outstanding on , 2022, and applying the distribution ratio of share of ourcommon stock for each share of Exelon common stock, approximately shares of our common stockwill be distributed to Exelon shareholders who hold Exelon common stock as of the record date.
Record Date , 2022 Distribution Date , 2022 Distribution Ratio Each holder of Exelon common stock will receive share of our common stock for each share of Exelon
common stock held on the record date. Please note that if you sell your shares of Exelon common stock onor before the distribution date, the buyer of those shares may, in certain circumstances, be entitled toreceive the shares of our common stock distributed on the distribution date. See “Trading Market—Trading Prior to the Distribution Date” below in this information statement for more information.
Fractional Shares The Distribution Agent will not distribute any fractional shares of our common stock to Exelon
shareholders. Instead, the Distribution Agent will aggregate fractional shares into whole shares, sell thewhole shares in the open market at prevailing market prices and distribute the aggregate cash proceeds,net of brokerage fees and other costs, from the sales pro rata to each holder who would otherwise havebeen entitled to receive a fractional share in the distribution. Recipients of cash in lieu of fractional shareswill not be entitled to any interest on the amounts of payments made in lieu of fractional shares. Thereceipt of cash in lieu of fractional shares generally will be taxable to the recipient shareholders asdescribed in “The Separation—Material U.S. Federal Income Tax Consequences of the Separation”beginning on page 40 of this information statement.
Distribution Procedures On the distribution date, the Distribution Agent will distribute the shares of our common stock by
crediting those shares to book-entry accounts established by the transfer agent for persons who wereshareholders of Exelon as of the record date. Shares of our common stock will be issued only in book-entry form. No paper stock certificates will be issued. You will not be required to make any payment orsurrender or exchange your shares of Exelon common stock or take any other action to receive your sharesof our common stock. However, as discussed below, if you sell shares of Exelon common stock in theregular way market between the record date and the distribution date, you will be selling your right toreceive the associated shares of our common stock in the distribution. Registered shareholders will receiveadditional information from the transfer agent shortly after the distribution date. Beneficial shareholderswill receive additional information from their brokers, banks or other nominees.
Distribution Agent EQ Shareholder Services
16

Trading Prior to or on the DistributionDate
It is anticipated that, beginning shortly before the record date, and continuing until the distribution date,shares of Exelon common stock will trade in two markets on NASDAQ -- a regular way market and anex-distribution market. Investors will be able to purchase shares of Exelon common stock without theright to receive shares of our common stock in the ex-distribution market for Exelon common stock. Anyholder of Exelon common stock who sells Exelon common stock in the regular way market on or beforethe distribution date will also be selling the right to receive shares of our common stock in the distribution.You are encouraged to consult with your financial advisor regarding the specific implications of sellingshares of Exelon common stock prior to or on the distribution date. For a more detailed description, see“Trading Market—Trading Prior to the Distribution Date” below in this information statement.
Trading Market and Symbol Subject to consummation of the distribution, we intend to list our common stock on NASDAQ under the
symbol “ .” We cannot predict the trading prices for our common stock when such trading begins. Weanticipate that trading in shares of our common stock will begin on a when-issued basis on or shortlybefore the record date and will continue up to and including the distribution date. On the first trading dayfollowing the distribution date, any when-issued trading in respect of our common stock will end andregular way trading in shares of our common stock will begin. If trading begins on a when-issued basis,you may purchase or sell our common stock up to and including the distribution date, but your transactionwill not settle until after the distribution date. For more information regarding regular way trading andwhen-issued trading, see the section entitled “Trading Market—Trading Prior to the Distribution Date”below in this information statement.
Relationship with Exelon after theDistribution
After the distribution, Exelon will not own any shares of our common stock, and each of the Companyand Exelon will be separate, publicly traded companies with their own management and boards ofdirectors. However, in connection with the separation, we will enter into a number of agreements withExelon that will govern the distribution and allocate responsibilities for obligations arising before andafter the separation, including, among others, obligations relating to employees and taxes. In addition, wewill enter into a transition services agreement pursuant to which Exelon and we will provide certaintransition services to each other on an interim basis. Additionally, there are operating and maintenance,power supply, and other agreements between Generation and Exelon’s utilities that will not be terminatedin connection with the separation. For a more detailed description, see “Certain Relationships and RelatedParty Transactions—Agreements with Exelon Related to the Separation” below in this informationstatement.
Conditions to the Distribution We expect that the distribution will be effective on , 2022, provided that the conditions set forth under
the caption “The Separation—Conditions to the Distribution” have been satisfied or waived in Exelon’ssole and absolute discretion. However, even if all of the conditions have been satisfied, Exelon mayterminate and abandon the distribution and the related transactions at any time prior to the distributiondate.
Risk Factors Our business is subject to both general and specific business risks related to financial and market factors;
regulatory, legislative and legal factors; and operating factors. Our business is also subject to risks relatingto the separation, and, following the separation, we will be subject to risks relating to being a publiclytraded company. Accordingly, you should read carefully the section entitled “Risk Factors” beginning onpage 21 of this information statement.
17

U.S. Federal Income Tax Consequences It is a condition to the completion of the separation that Exelon receive the IRS Ruling and an opinion
from its counsel, Sidley Austin LLP, together substantially to the effect that the distribution, together withcertain related transactions, will qualify as a tax-free reorganization under Sections 355 and 368(a)(1)(D)of the IRC. Assuming such qualification, no gain or loss will be recognized by, or includible in the incomeof, Exelon shareholders upon the receipt of shares of our common stock pursuant to the distribution.However, Exelon shareholders that are subject to U.S. federal income tax generally will recognize gain orloss with respect to any cash received in lieu of any fractional shares. See “The Separation—Material U.S.Federal Income Tax Consequences of the Separation” beginning on page 40 of this information statementand “Risk Factors—Risks Relating to Our Separation from Exelon” on page 31 of this informationstatement for more information regarding the potential tax consequences to you of the distribution. Each shareholder is urged to consult his, her or its tax advisor as to the specific tax consequencesof the separation transaction to such shareholder, including the effect of any state, local or non-U.S. tax laws and of changes in applicable tax laws.
Summary Historical and Unaudited Pro Forma Condensed Consolidated Financial Data
On February 21, 2021, Exelon’s board of directors authorized management to pursue a plan to separate its competitive generation and
customer-facing energy businesses into a stand-alone publicly traded company. The separation will occur through a distribution to Exelon’sshareholders of all of the shares of common stock of the Company, which will own Generation, including its competitive generation, customer-facingpower and gas supply, and related businesses. Following the distribution, Exelon shareholders will own 100% of the shares of our common stock.
The following table presents the summary historical consolidated financial information and unaudited pro forma condensed consolidated
financial information of the Company for the periods and as of the dates indicated. The summary historical consolidated financial information presented as of and for the year ended December 31, 2020 has been derived from
the historical audited consolidated financial statements of Generation, included elsewhere in this information statement. The summary unaudited pro forma condensed consolidated financial information as of and for the year ended December 31, 2020 is derived
from our unaudited pro forma condensed consolidated financial statements. The unaudited pro forma condensed consolidated statement of operationsfor the year ended December 31, 2020 gives effect to the separation and related transactions, including the purchase of the noncontrolling interest inCENG, as if they had occurred on January 1, 2020, the beginning of the most recent fiscal year for which audited financial statements are available.The unaudited pro forma condensed consolidated balance sheet as of December 31, 2020 gives effect to the separation and related transactions,including the purchase of the noncontrolling interest in CENG, as if they had occurred on December 31, 2020.
The unaudited pro forma condensed consolidated financial statements were prepared in accordance with Article 11 of Regulation S-X. The
unaudited pro forma condensed consolidated financial statements were prepared for illustrative and informational purposes only and are not intendedto represent what our results of operations or financial position would have been had the separation and the purchase of the noncontrolling interest inCENG occurred on the dates indicated. The unaudited pro forma condensed consolidated financial statements also should not be considered indicativeof our future results of operations or financial position as an independent, publicly traded company. The actual financial position and results ofoperations may differ significantly from the pro forma amounts reflected herein due to a variety of factors. See “Cautionary Note Regarding Forward-Looking Statements” included in this information statement. The unaudited pro forma condensed consolidated financial information does not reflectthe realization of any expected cost savings or other synergies as a result of the separation and related transactions, including the purchase of thenoncontrolling interest in CENG.
On November 20, 2019, Generation received notice that, pursuant to an April 1, 2014 Put Option Agreement, EDF intended to exercise its
put option to sell to Generation its 49.99% equity interest in CENG. Following the required sixty-day notice period, the put option was automaticallyexercised on January 19, 2020. On August 6, 2021, Generation and EDF entered into a settlement agreement pursuant to which Generation, through awholly owned subsidiary, purchased EDF’s equity interest in CENG for a net purchase price of $885 million, which includes, among other things, acredit for EDF’s share of the balance of a preferred distribution payable by CENG to Generation. The difference between the net purchase price andEDF’s noncontrolling interest as of the closing date was recorded to Membership interest on our Consolidated Balance Sheet.
The summary unaudited pro forma condensed consolidated financial information gives pro forma effect to the following: Separation transaction accounting adjustments
· the issuance of shares of the Company’s common stock based on the distribution ratio of share of our common stock for each share ofExelon common stock outstanding on the record date.
18

· the impact of the separation agreement, employee matters agreement, tax matters agreement, and the provisions therein.
CENG put transaction adjustments · the purchase of 49.99% noncontrolling interest in CENG from EDF in accordance with the Put Option Agreement, including the
establishment of a deferred tax liability and the borrowing of approximately $880 million under a term loan credit agreement to fund thetransaction.
· the adjustment of the provision (benefit) for income taxes related to the taxation of income previously attributable to noncontrolling
interest holders.
Autonomous entity adjustments · the incremental costs that the Company expects to incur as an independent, separate public company under the transition services
agreement.
The following summary historical consolidated financial information and unaudited pro forma condensed consolidated financial informationshould be read in conjunction with:
· Management’s Discussion and Analysis of Financial Condition and Results of Operations, which is included elsewhere within this
information statement.
· the historical audited consolidated financial statements and accompanying notes of Generation as of and for the year endedDecember 31, 2020, which are included elsewhere within this information statement.
· the accompanying notes to the pro forma financial information.
19

Historical Pro Forma
Year Ended December 31, Year Ended
December 31, (In millions, except per share data) 2020 2019 2018 2020 Statement of Operations Information: Total operating revenues $ 17,603 $ 18,924 $ 20,437 $ 17,603 Operating expenses
Purchased power and fuel 9,592 10,849 11,679 9,585 Purchased power and fuel from affiliates (7) 7 14 — Operating and maintenance 4,613 4,131 4,803 5,168 Operating and maintenance from affiliates 555 587 661 — Depreciation and amortization 2,123 1,535 1,797 2,123 Taxes other than income taxes 482 519 556 482
Total operating expenses 17,358 17,628 19,510 17,358 Gain on sales of assets and businesses 11 27 48 11 Operating income 256 1,323 975 256 Total other income and (deductions) 580 594 (610) 609 Income before income taxes 836 1,917 365 865 Income taxes 249 516 (108) 249 Equity in losses of unconsolidated affiliates (8) (184) (30) (8)Net income 579 1,217 443 608 Net (loss) income attributable to noncontrolling interests (10) 92 73 (10)Net income attributable to membership interest or commonshareholders $ 589 $ 1,125 $ 370 $ 618
Average shares of common stock outstanding(a) Basic [—] Diluted [—]
Earnings per average common share(a) Basic [—] Diluted [—]
Statement of Cash Flow Information: Net cash provided by operating activities $ 584 $ 2,873 $ 3,861 Net cash provided by (used in) investing activities 1,958 (1,867) (2,531) Net cash used in financing activities (2,664) (1,460) (981) Balance Sheet Data (at period end): Total current assets $ 6,947 $ 7,076 $ 6,947 Property, plant, and equipment, net 22,214 24,193 22,214 Total deferred debits and other assets 18,933 17,726 18,933 Total assets 48,094 48,995 48,094 Total current liabilities 5,219 7,289 5,219 Long-term debt 5,566 4,464 5,566 Long-term debt to affiliate 324 328 324 Total deferred credits and other liabilities 22,309 21,084 22,309 Total liabilities 33,418 33,165 33,418 Total member’s or shareholder's equity 12,399 13,484 12,399 Total equity 14,676 15,830 14,676
(a) The calculation of pro forma basic net income per share is calculated by dividing the pro forma net income by the weighted average number ofshares of Exelon common stock outstanding for the periods indicated, adjusted for the distribution ratio of share of our common stock for eachshare of Exelon common stock outstanding. The calculation of pro forma diluted net income per share is calculated by dividing the pro forma netincome by the weighted average number of shares of Exelon common stock outstanding and dilutive shares of common stock outstanding for theperiods indicated, adjusted for the same assumed distribution ratio. This calculation may not be indicative of the dilutive effect that will actuallyresult from share-based awards subsequently transferred to or granted by us.
20

RISK FACTORS
You should carefully consider each of the following risk factors and all of the other information set forth in this information statement. Based upon
information currently known to us, the following information identifies the material risk factors affecting our company. Additional risks and uncertaintiesnot presently known to us or that we currently believe to be immaterial may also adversely affect our business, financial condition or results of operations.In addition, past financial performance may not be a reliable indicator of future performance and historical trends should not be used to anticipate resultsor trends in future periods.
The risks we face can be categorized as risks related to: market and financial factors; regulatory, legislative and legal factors; operational
factors; our separation from Exelon; and our common stock:
· Risks related to market and financial factors primarily include:
· the price of fuels, in particular the price of natural gas, which affects power prices,· the generation resources in the markets in which we operate,· our ability to operate our generating assets, our ability to access capital markets, and the impacts on our results of operations due to the global
outbreak (pandemic) of the 2019 novel coronavirus (COVID-19),· the impacts of on-going competition, and· emerging technologies and business models, including those related to climate change mitigation and transition to a low carbon economy.
· Risks related to regulatory, legislative and legal factors primarily include changes to, and compliance with, the laws and regulations that
govern:
· the design of power markets,· the renewal of permits and operating licenses,· environmental and climate policy, including zero emission credit programs, and· tax policy.
· Risks related to operational factors primarily include:
· changes in the global climate could produce extreme weather events, which could put our facilities at risk, and such changes could also affect
the levels and patterns of demand for energy and related services,· the safe, secure and effective operation of our nuclear facilities and the ability to effectively manage the associated decommissioning
obligations,· the ability of energy transmission and distribution companies to maintain the reliability, resiliency and safety of their energy delivery systems,
which could affect our ability to deliver energy to our customers and affect our operating costs, and· physical and cyber security risks for us as an owner-operator of generation facilities and as a participant in commodities trading.
· Risks related to our separation from Exelon primarily include:
· challenges to achieving the benefits of separation, including limited business diversification, loss of economies of scale in sourcing goods and
services, and the need to replicate certain services provided by Exelon (such as treasury, finance, human resources, investor relations andlegal), which will require additional resources and expense,
· little control over the terms and timing of the separation (including regulatory approvals), which are determined by Exelon (and with respectto regulatory approvals, the applicable regulator), and Exelon may change those terms at any time or elect not to proceed,
· performance by Exelon and us under the transaction agreements, including indemnification responsibilities tied to the allocation of businessesand liabilities, and
· restrictions on future capital-raising or strategic transactions during the two-year period following the distribution arising from the need toprotect the tax-free treatment of the distribution.
21

· Risks related to our common stock primarily include:
· following the separation, there can be no assurance that the combined trading prices of Exelon common stock and our common stock will be
equal to or greater than the trading price of Exelon shares prior to the separation,· the absence of a currently existing trading market for our stock and possible volatility in the market for our stock as holders of Exelon stock
seek to reorganize their holdings based on stock index or industry strategies, investment policies or other factors, in addition to the generalfactors affecting the market price of common stock,
· our status as a holding company is dependent on cash flows from our subsidiaries to meet financial obligations, and· certain anti-takeover provisions in our charter and bylaws that could have the effect of delaying or discouraging an acquisition of our
company or a change in its management. Risks Related to Market and Financial Factors
We are exposed to price volatility associated with both the wholesale and retail power markets and the procurement of nuclear and fossilfuel. We are exposed to commodity price risk for natural gas and the unhedged portion of our electricity generation supply portfolio. Our earnings and
cash flows are therefore exposed to variability of spot and forward market prices in the markets in which we operate. Price of Fuels. The spot market price of electricity for each hour is generally determined by the marginal cost of supplying the next unit of
electricity to the market during that hour. Thus, the market price of power is affected by the market price of the marginal fuel used to generate theelectricity unit.
Cost of Fuel. We depend on nuclear fuel and fossil fuels to operate most of our generating facilities. The supply markets for nuclear fuel, natural
gas and oil are subject to price fluctuations, availability restrictions and counterparty default. Demand and Supply. The market price for electricity is also affected by changes in the demand for electricity and the available supply of
electricity. Unfavorable economic conditions, milder than normal weather, and the growth of energy efficiency and demand response programs can depressdemand. In addition, in some markets, the supply of electricity can exceed demand during some hours of the day, resulting in loss of revenue for base-loadgenerating plants such as our nuclear plants. Conversely, new demand sources such as electrification of transportation could increase demand and changedemand patterns.
Retail Competition. Our retail operations compete for customers in a competitive environment, which affects the margins we can earn and the
volumes we are able to serve. In periods of sustained low natural gas and power prices and low market volatility, retail competitors can aggressively pursuemarket share because the barriers to entry can be low and wholesale generators (including us) use their retail operations to hedge generation output.
The impact of sustained low market prices or depressed demand and over-supply could be emphasized given our concentration of base-load
electric generating capacity within primarily two geographic market regions, namely the Midwest and the Mid-Atlantic. These impacts could adverselyaffect our ability to reduce debt and provide attractive shareholder returns. In addition, such conditions may no longer support the continued operation ofcertain generating facilities, which could adversely affect our financial statements primarily through accelerated depreciation and amortization expensesand one-time charges.
Market Designs. The wholesale markets vary from region to region with distinct rules, practices and procedures. Changes in these market rules,
problems with rule implementation, or failure of any of these markets could adversely affect our business. In addition, a significant decrease in marketparticipation could affect market liquidity and have a detrimental effect on market stability.
22

Our results were negatively affected by the impacts of COVID-19. COVID-19 has disrupted economic activity in our markets and negatively affected our results of operations. The estimated impact of COVID-19
to our Net income was approximately $170 million for the year ended December 31, 2020 and is not expected to be material for the year ending December31, 2021. See “Management’s Discussion and Analysis of Financial Condition and Results of Operations — Significant 2020 and 2021 Transactions andDevelopments — COVID-19” for additional information. We cannot predict the full extent of the impacts of COVID-19, which will depend on, amongother things, the rate, and public perceptions of the effectiveness, of vaccinations and rate of resumption of business activity. In addition, any futurewidespread pandemic or other local or global health issue could adversely affect customer demand and our ability to operate our generation assets.
We are potentially affected by emerging technologies that could over time affect or transform the energy industry. Advancements in power generation technology, including commercial and residential solar generation installations and commercial micro turbine
installations, are improving the cost-effectiveness of customer self-supply of electricity. Improvements in energy storage technology, including batteries andfuel cells, could also better position customers to meet their around-the-clock electricity requirements. Improvements in energy efficiency of lighting,appliances, equipment and building materials will also affect energy consumption by customers. Changes in power generation, storage, and usetechnologies could have significant effects on customer behaviors and their energy consumption.
These developments could affect the price of energy, levels of customer-owned generation, customer expectations and current business models and
make portions of our generation facilities uneconomic prior to the end of their useful lives. These technologies could also result in further declines incommodity prices or demand for delivered energy. Each of these factors could affect our consolidated financial statements through, among other things,reduced operating revenues, increased operating and maintenance expenses, increased capital expenditures, and potential asset impairment charges oraccelerated depreciation and decommissioning expenses over shortened remaining asset useful lives.
Market performance and other factors could decrease the value of our nuclear decommissioning trust funds and employee benefit planassets, which then could require significant additional funding. Disruptions in the capital markets and their actual or perceived effects on particular businesses and the greater economy could adversely affect the
value of the investments held within our nuclear decommissioning trusts and employee benefit plan trusts. We have significant obligations in these areasand hold substantial assets in these trusts to meet those obligations. The asset values are subject to market fluctuations and will yield uncertain returns,which could fall below our projected return rates. A decline in the market value of the nuclear decommissioning trust fund investments could increase ourfunding requirements to decommission our nuclear plants. A decline in the market value of the pension and OPEB plan assets would increase the fundingrequirements associated with our pension and OPEB plan obligations. Additionally, our pension and OPEB plan liabilities are sensitive to changes ininterest rates. As interest rates decrease, the liabilities increase, potentially increasing benefit costs and funding requirements. Changes in demographics,including increased numbers of retirements or changes in life expectancy assumptions or changes to Social Security or Medicare eligibility requirementscould also increase the costs and funding requirements of the obligations related to the pension and OPEB plans.
We could be negatively affected by unstable capital and credit markets and increased volatility in commodity markets. We rely on the capital markets, particularly for publicly offered debt, as well as the banking and commercial paper markets, to meet our financial
commitments and short-term liquidity needs. Disruptions in the capital and credit markets in the United States or abroad could negatively affect our abilityto access the capital markets or draw on our bank revolving credit facilities. The banks may not be able to meet their funding commitments to us if theyexperience shortages of capital and liquidity or if they experience excessive volumes of borrowing requests within a short period of time. The inability toaccess capital markets or credit facilities, and longer-term disruptions in the capital and credit markets as a result of uncertainty, changing or increasedregulation, reduced alternatives or failures of significant financial institutions could result in the deferral of discretionary capital expenditures, affect ourability to hedge effectively our generation portfolio, require changes to our hedging strategy in order to reduce collateral posting requirements, or require areduction in discretionary uses of cash. In addition, we have exposure to worldwide financial markets, including Europe, Canada and Asia. Disruptions inthese markets could reduce or restrict our ability to secure sufficient liquidity or secure liquidity at reasonable terms. As of December 31, 2020,approximately 20%, 17%, and 16% of our available credit facilities were with European, Canadian and Asian banks, respectively.
23

The strength and depth of competition in energy markets depend heavily on active participation by multiple trading parties, which could be
negatively affected by disruptions in the capital and credit markets and legislative and regulatory initiatives that could affect participants in commoditiestransactions. Reduced capital and liquidity and failures of significant institutions that participate in the energy markets could diminish the liquidity andcompetitiveness of energy markets that are important to our business. Perceived weaknesses in the competitive strength of the energy markets could lead topressures for greater regulation of those markets or attempts to replace market structures with other mechanisms for the sale of power, including therequirement of long-term contracts.
If we were to experience a downgrade in our credit ratings to below investment grade or otherwise fail to satisfy the credit standards inour agreements with our counterparties or regulatory financial requirements, we would be required to provide significant amounts ofcollateral that could affect our liquidity and we could experience higher borrowing costs. Our business is subject to credit quality standards that could require market participants to post collateral for their obligations upon a decline in
ratings. We are also subject to certain financial requirements under NRC regulations as a result of our operation of nuclear power plants that could requireus to provide cash collateral or surety bonds if those requirements are not met. One or both events could affect adversely available liquidity and, in the caseof a rating downgrade, borrowing and credit support costs.
If we fail to meet project-specific financing agreement requirements, we could experience an impairment or loss of the financed project. We have project-specific financing arrangements and must meet the requirements of various agreements relating to those financings. Failure to
meet those arrangements could give rise to a project-specific financing default which, if not cured or waived, could result in the specific project beingrequired to repay the associated debt or other borrowings earlier than otherwise anticipated, and if such repayment were not made, the lenders or securityholders would generally have broad remedies, including rights to foreclose against the project assets and related collateral or to force our subsidiaries in theproject-specific financings to enter into bankruptcy proceedings. The impact of bankruptcy could result in the impairment of certain project assets.
Our risk management policies cannot fully eliminate the risk associated with our commodity trading activities. Our asset-based power position as well as our power marketing, fuel procurement and other commodity trading activities expose us to risks of
commodity price movements. We buy and sell energy and other products and enter into financial contracts to manage risk and hedge various positions inour power generation portfolio. We are exposed to volatility in financial results for unhedged positions as well as the risk of ineffective hedges. We attemptto manage this exposure through enforcement of established risk limits and risk management procedures. These risk limits and risk management proceduresmay not work as planned and cannot eliminate all risks associated with these activities. Even when our policies and procedures are followed, and decisionsare made based on projections and estimates of future performance, results of operations could be diminished if the judgments and assumptions underlyingthose decisions prove to be incorrect. Factors, such as future prices and demand for power, natural gas and other energy-related commodities, become moredifficult to predict and the calculations become less reliable the further into the future estimates are made. As a result, we cannot predict the impact that ourcommodity trading activities and risk management decisions could have on our consolidated financial statements.
Financial performance and load requirements could be negatively affected if we are unable to effectively manage our power portfolio. A significant portion of our power portfolio is used to provide power under procurement contracts with Exelon’s utility subsidiaries and other
customers. To the extent portions of the power portfolio are not needed for that purpose, our output is sold in the wholesale power markets. To the extentour power portfolio is not sufficient to meet the requirements of our customers under the related agreements, we must purchase power in the wholesalepower markets. Our financial results could be negatively affected if we are unable to meet cost-effectively the load requirements of our customers, manageour power portfolio or effectively address the changes in the wholesale power markets.
24

The impacts of significant economic downturns could lead to decreased volumes delivered and increased expense for uncollectiblecustomer balances. The impacts of significant economic downturns on our retail customers, such as less demand for products and services provided by commercial
and industrial customers, could result in an increase in the number of uncollectible customer balances and related expense. We could be negatively affected by the impacts of weather. Our operations are affected by weather, which affects demand for electricity and natural gas, the price of energy commodities, as well as operating
conditions. To the extent that weather is warmer in the summer or colder in the winter than assumed, we could require greater resources to meet ourcontractual commitments. Extreme weather conditions or storms have affected the availability of generation and its transmission, limiting our ability tosource or send power to where it is sold, and have also affected the transportation of natural gas to our generating assets and our ability to supply naturalgas to our customers. In addition, drought-like conditions limiting water usage could impact our ability to run certain generating assets at full capacity.These conditions, which cannot be accurately predicted, could cause us to seek additional capacity at a time when wholesale markets are tight or to seek tosell excess capacity at a time when markets are weak.
Climate change projections suggest increases to summer temperature and humidity trends, as well as more erratic precipitation and storm patterns
over the long-term in the areas where we have generation assets. The frequency in which weather conditions emerge outside the current expected climatenorms could contribute to weather-related impacts discussed above.
Beginning on February 15, 2021, our Texas-based generating assets within the ERCOT market, specifically Colorado Bend II, Wolf Hollow II,
and Handley, experienced periodic outages as a result of historically severe cold weather conditions. We estimate a reduction in Net income ofapproximately $670 million to $820 million for the full year 2021 arising from these market and weather conditions. See “Management's Discussion andAnalysis of Financial Condition and Results of Operations — Significant 2020 and 2021 Transactions and Developments — Impacts of February 21Extreme Weather Event and Texas-based Generating Assets Outages” for additional information.
Long-lived assets and other assets could become impaired. Long-lived assets – principally, generation assets –represent the single largest asset class on our statement of financial position. We evaluate the recoverability of the carrying value of long-lived assets to be held and used whenever events or circumstances indicating a
potential impairment exist. Factors such as, but not limited to, the business climate, including current and future energy and market conditions,environmental regulation, and the condition of assets are considered.
An impairment would require us to reduce the carrying value of the long-lived asset to fair value through a non-cash charge to expense by the
amount of the impairment. We could incur substantial costs in the event of non-performance by third-parties under indemnification agreements, or when we haveguaranteed their performance. We are exposed to other credit risks in the power markets that are beyond our control. We have entered into various agreements with counterparties that require those counterparties to reimburse us and hold us harmless against
specified obligations and claims. To the extent that any of these counterparties are affected by deterioration in their creditworthiness or the agreements areotherwise determined to be unenforceable, we could be held responsible for the obligations.
We have issued indemnities to third parties regarding environmental or other matters in connection with purchases and sales of assets, including
several of the Exelon utilities in connection with our absorption of their former generating assets. We could incur substantial costs to fulfill our obligationsunder these indemnities.
We have issued guarantees of the performance of third parties, which obligate us to perform in the event that the third parties do not perform. In
the event of non-performance by those third parties, we could incur substantial cost to fulfill their obligations under these guarantees. In the bilateral markets, we are exposed to the risk that counterparties that owe us money or are obligated to purchase energy or fuel from us, will
not perform under their obligations for operational or financial reasons. In the event the counterparties to these arrangements fail to perform, we could beforced to purchase or sell energy or fuel in the wholesale markets at less favorable prices and incur additional losses, to the extent amounts, if any, werealready paid to the counterparties. In the spot markets, we are exposed to risk as a result of default sharing mechanisms that exist within certain markets,primarily RTOs and ISOs. We are also a party to agreements with entities in the energy sector that have experienced rating downgrades or other financialdifficulties. In addition, our retail sales subject us to credit risk through competitive electricity and natural gas supply activities to serve commercial andindustrial companies, governmental entities and residential customers. Retail credit risk results when customers default on their contractual obligations.This risk represents the loss that could be incurred due to the nonpayment of a customer’s account balance, as well as the loss from the resale of energypreviously committed to serve the customer.
25

Risks Related to Regulatory, Legislative and Legal Factors
Federal or state legislative or regulatory actions could negatively affect the scope and functioning of the wholesale markets. Approximately 70% of our generating resources, which include directly owned assets and capacity obtained through long-term contracts, are
located in the area encompassed by PJM. Our future results of operations are impacted by (1) FERC’s and PJM's level of support for policies that favor thepreservation of competitive wholesale power markets and recognize the value of zero-carbon electricity and resiliency and for states' energy objectives andpolicies and (2) the absence of material changes to market structures that would limit or otherwise negatively affect us. Market rules in other regions couldaffect us in a similar fashion. We could also be affected by state laws, regulations or initiatives to subsidize existing or new generation.
FERC’s requirements for market-based rate authority could pose a risk that we may no longer satisfy FERC’s tests for market-based rates. A loss
of market-based rate authority would mean that we would sell power at cost-based rates. Our business is highly regulated and could be negatively affected by regulatory and legislative actions. Substantial aspects of our business are subject to comprehensive Federal or state regulation and legislation. Our consolidated financial statements are significantly affected by our sales and purchases of commodities at market-based rates, as opposed to
cost-based or other similarly regulated rates and Federal and state regulatory and legislative developments related to emissions, climate change, capacitymarket mitigation, energy price information, resilience, fuel diversity and RPS. Legislative and regulatory efforts in Illinois, New York and New Jersey topreserve the environmental attributes and reliability benefits of zero-emission nuclear-powered generating facilities through ZEC programs are or could besubject to legal and regulatory challenges and, if overturned, could result in the early retirement of certain of our nuclear plants.
Fundamental changes in regulations or other adverse legislative actions affecting our business would require changes in our business planning
models and operations. We cannot predict when or whether legislative and regulatory proposals could become law or what their effect would be. NRC actions could negatively affect the operations and profitability of our nuclear generating fleet. Regulatory risk. A change in the Atomic Energy Act or the applicable regulations or licenses could require a substantial increase in capital
expenditures or could result in increased operating or decommissioning costs. Events at nuclear plants owned by others, as well as those owned by us,could cause the NRC to initiate such actions.
Spent nuclear fuel storage. The approval of a national repository for the storage of SNF and the timing of that facility opening, will significantly
affect the costs associated with storage of SNF and the ultimate amounts received from the DOE to reimburse us for these costs. Any regulatory action relating to the timing and availability of a repository for SNF could adversely affect our ability to decommission fully our
nuclear units. We cannot predict whether a fee may be established or to what extent, in the future for SNF disposal. We could be subject to higher costs and/or penalties related to mandatory reliability standards. We, as a user of the bulk power transmission system, are subject to mandatory reliability standards promulgated by NERC and enforced by FERC.
The standards are based on the functions that need to be performed to ensure the bulk power system operates reliably and are guided by reliability andmarket interface principles. Compliance with or changes in the reliability standards could subject us to higher operating costs and/or increased capitalexpenditures. If we were found in non-compliance with the Federal and state mandatory reliability standards, we could be subject to remediation costs aswell as sanctions, which could include substantial monetary penalties.
26

We could incur substantial costs to fulfill our obligations related to environmental and other matters. We are subject to extensive environmental regulation and legislation by local, state and Federal authorities. These laws and regulations affect the
manner in which we conduct our operations and make capital expenditures, including how we handle air and water emissions, hazardous and solid waste,and activities affecting surface waters, groundwater, and aquatic and other species. Violations of these requirements could subject us to enforcementactions, capital expenditures to bring existing facilities into compliance, additional operating costs for remediation and clean-up costs, civil penalties andexposure to third parties’ claims for alleged health or property damages or operating restrictions to achieve compliance. In addition, we are subject toliability under these laws for the remediation costs for environmental contamination of property now or formerly owned by us and of propertycontaminated by hazardous substances we generated or released. Also, we are currently involved in a number of proceedings relating to sites wherehazardous substances have been deposited and could be subject to additional proceedings in the future.
We could be negatively affected by federal and state RPS and/or energy conservation legislation, along with energy conservation bycustomers. Changes to current state legislation or the development of Federal legislation that requires the use of clean, renewable and alternate fuel sources
could significantly impact us. The impact could include reduced use of some of our generating facilities with effects on our revenues and costs. Federal and state legislation mandating the implementation of energy conservation programs and new energy consumption technologies could
cause declines in customer energy consumption and lead to a decline in our revenues. See “We are potentially affected by emerging technologies that couldover time affect or transform the energy industry” above.
Our financial performance could be negatively affected by risks arising from our ownership and operation of hydroelectric facilities. FERC has the exclusive authority to license most non-Federal hydropower projects located on navigable waterways, Federal lands or connected to
the interstate electric grid. We cannot predict whether we will receive all the regulatory approvals for the renewed licenses of our hydroelectric facilities. IfFERC does not issue new operating licenses for our hydroelectric facilities or a station cannot be operated through the end of its operating license, ourresults of operations could be adversely affected by increased depreciation rates and accelerated future decommissioning costs, since depreciation rates anddecommissioning cost estimates currently include assumptions that license renewal will be received. We could also lose revenue and incur increased fueland purchased power expense to meet our supply commitments. In addition, conditions could be imposed as part of the license renewal process that couldadversely affect operations, require a substantial increase in capital expenditures, result in increased operating costs or render the project uneconomic.Similar effects could result from a change in the Federal Power Act or the applicable regulations due to events at hydroelectric facilities owned by others,as well as those owned by us.
We could be negatively affected by challenges to tax positions taken, tax law changes and the inherent difficulty in quantifying potentialtax effects of business decisions. We are required to make judgments in order to estimate our obligations to taxing authorities. These tax obligations include income, real estate,
sales and use and employment-related taxes and ongoing appeal issues related to these tax matters. These judgments include reserves established forpotential adverse outcomes regarding tax positions that have been taken that could be subject to challenge by the tax authorities.
Legal proceedings could result in a negative outcome, which we cannot predict. We are involved in legal proceedings, claims and litigation arising out of our business operations. The material ones are summarized in Note 19 —
Commitments and Contingencies of the Notes to Consolidated Financial Statements. Adverse outcomes in these proceedings could require significantexpenditures, result in lost revenue or restrict existing business activities.
27

We could be subject to adverse publicity and reputational risks, which make us vulnerable to negative customer perception and couldlead to increased regulatory oversight or other consequences. We could be the subject of public criticism. Adverse publicity of this nature could render public service commissions and other regulatory and
legislative authorities less likely to view energy companies in a favorable light, and could cause those companies, including us, to be susceptible to lessfavorable legislative and regulatory outcomes, as well as increased regulatory oversight and more stringent legislative or regulatory requirements.
Risks Related to Operational Factors
We are subject to risks associated with climate change. We periodically perform analyses to better understand how climate change could affect our facilities and operations. We primarily operate in the
Midwest and East Coast of the United States, areas that historically have been prone to various types of severe weather events, and as such we have well-developed response and recovery programs based on these historical events. However, our physical facilities could be placed at greater risk of damageshould changes in the global climate impact temperature and weather patterns and result in more intense, frequent and extreme weather events,unprecedented levels of precipitation, sea level rise, increased surface water temperatures, and/or other effects. In addition, changes to the climate mayimpact levels and patterns of demand for energy and related services, which could affect our operations. Over time, we may need to make additionalinvestments to protect our facilities from physical climate-related risks and/or adapt to changes in operational requirements as a result of climate change.
We also periodically perform analyses of potential pathways to reduce power sector and economy-wide GHG emissions to mitigate climate
change. To the extent additional GHG reduction regulation or legislation becomes effective at the Federal and/or state levels, we could incur costs to furtherlimit the GHG emissions from our operations or otherwise comply with applicable requirements. To the extent such additional regulation or legislation doesnot become effective, the potential competitive advantage offered by our low-carbon emission profile may be reduced.
Our financial performance could be negatively affected by matters arising from our ownership and operation of nuclear facilities. Nuclear capacity factors. Capacity factors for nuclear generating units significantly affect our results of operations. Lower capacity factors could
decrease our revenues and increase operating costs by requiring us to produce additional energy from primarily our fossil facilities or purchase additionalenergy in the spot or forward markets in order to satisfy our supply obligations to committed third-party sales. These sources generally have higher coststhan we incur to produce energy from our nuclear stations.
Nuclear refueling outages. In general, refueling outages are planned to occur once every 18 to 24 months. The total number of refueling outages,
along with their duration, could have a significant impact on our results of operations. When refueling outages last longer than anticipated or we experienceunplanned outages, capacity factors decrease, and we face lower margins due to higher energy replacement costs and/or lower energy sales and higheroperating and maintenance costs.
Nuclear fuel quality. The quality of nuclear fuel utilized by us could affect the efficiency and costs of our operations. Remediation actions could
result in increased costs due to accelerated fuel amortization, increased outage costs and/or increased costs due to decreased generation capabilities. Operational risk. Operations at any of our nuclear generation plants could degrade to the point where we must shut down the plant or operate at
less than full capacity. If this were to happen, identifying and correcting the causes could require significant time and expense. We could choose to close aplant rather than incur the expense of restarting it or returning the plant to full capacity. In either event, we could lose revenue and incur increased fuel andpurchased power expense to meet supply commitments.
Further, our nuclear operations produce various types of nuclear waste materials, including SNF. The approval of a national repository for the
storage of SNF and the timing of that facility opening, will significantly affect the costs associated with storage of SNF and the ultimate amounts receivedfrom the DOE to reimburse us for these costs. Any regulatory action relating to the timing and availability of a repository for SNF could adversely affectour ability to decommission fully our nuclear units. We cannot predict whether a fee may be established or to what extent, in the future for SNF disposal.
If we are required to arrange for the safe and permanent disposal of spent fuel beyond current expectations, this could lead to substantial expense
or capital expenditures.
28

For plants operated but not wholly owned by us, we could also incur liability to the co-owners. For nuclear plants not operated and not wholly
owned by us, from which we receive a portion of the plants’ output, our results of operations are dependent on the operational performance of the operatorsand could be adversely affected by a significant event at those plants. Additionally, poor operating performance at nuclear plants not owned by us couldresult in increased regulation and reduced public support for nuclear-fueled energy. In addition, closure of generating plants owned by others, or extendedinterruptions of generating plants or failure of transmission lines, could affect transmission systems that could adversely affect the sale and delivery ofelectricity in markets served by us.
Nuclear major incident risk and insurance. The consequences of a major incident could be severe and include loss of life and property damage.Any resulting liability from a nuclear plant major incident within the United States, owned or operated by us or owned by others, could exceed ourresources, including insurance coverage. We are a member of an industry mutual insurance company, NEIL, which provides property and businessinterruption insurance for our nuclear operations. Uninsured losses and other expenses, to the extent not recovered from insurers or the nuclear industry,could be borne by us. Additionally, an accident or other significant event at a nuclear plant within the United States or abroad, whether owned by us orothers, could result in increased regulation and reduced public support for nuclear-fueled energy.
As required by the Price-Anderson Act, we carry the maximum available amount of nuclear liability insurance, $450 million for each operating
site. Claims exceeding that amount are covered through mandatory participation in a financial protection pool. In addition, the U.S. Congress could imposerevenue-raising measures on the nuclear industry to pay claims exceeding the $13.8 billion limit for a single incident.
Decommissioning obligation and funding. NRC regulations require that licensees of nuclear generating facilities demonstrate reasonable
assurance that funds will be available in certain minimum amounts at the end of the life of the facility to decommission the facility. We recognize as a liability the present value of the estimated future costs to decommission our nuclear facilities. The estimated liability is based
on assumptions in the approach and timing of decommissioning the nuclear facilities, estimation of decommissioning costs and Federal and state regulatoryrequirements. The costs of such decommissioning may substantially exceed such liability, as facts, circumstances or our estimates may change, includingchanges in the approach and timing of decommissioning activities, changes in decommissioning costs, changes in Federal or state regulatory requirementson the decommissioning of such facilities, other changes in our estimates or ability to effectively execute on our planned decommissioning activities.
We make contributions to certain trust funds of the former PECO units based on amounts being collected by PECO from its customers and
remitted to us. While we, through PECO, have recourse to collect additional amounts from PECO customers (subject to certain limitations and thresholds),we have no recourse to collect additional amounts from utility customers for any of our other nuclear units if there is a shortfall of funds necessary fordecommissioning. If circumstances changed such that there was an inability to continue to make contributions to the trust funds of the former PECO unitsbased on amounts collected from PECO customers, or if we no longer had recourse to collect additional amounts from PECO customers if there was ashortfall of funds for decommissioning, the adequacy of the trust funds related to the former PECO units could be negatively affected.
Should the expected value of the NDT fund for any former ComEd unit fall below the amount of the expected decommissioning obligation for that
unit, the accounting to offset decommissioning-related activities in the Consolidated Statement of Operations and Comprehensive Income for that unitwould be discontinued, the decommissioning-related activities would be recognized in the Consolidated Statements of Operations and ComprehensiveIncome and the adverse impact to our financial statements could be material. Any changes to the PECO regulatory agreements could impact our ability tooffset decommissioning-related activities within the Consolidated Statement of Operations and Comprehensive Income, and the impact to our financialstatements could be material.
Forecasting trust fund investment earnings and costs to decommission nuclear generating stations requires significant judgment, and actual results
could differ significantly from current estimates. If the investments held by our NDT funds are not sufficient to fund the decommissioning of our nuclearunits, we could be required to take steps, such as providing financial guarantees through letters of credit or parent company guarantees or making additionalcontributions to the trusts, which could be significant, to ensure that the trusts are adequately funded and that current and future NRC minimum fundingrequirements are met.
29

We are subject to physical security and cybersecurity risks. We face physical security and cybersecurity risks. Threat sources continue to seek to exploit potential vulnerabilities in the electric generation and
natural gas industry associated with protection of sensitive and confidential information, grid infrastructure and other energy infrastructures, and theseattacks and disruptions, both physical and cyber, are becoming increasingly sophisticated and dynamic. Continued implementation of advanced digitaltechnologies increases the potentially unfavorable impacts of such attacks.
A security breach of our physical assets or information systems or those of our competitors, vendors, business partners and interconnected entities
in RTOs and ISOs, or regulators could impact the operation of the generation fleet and/or reliability of the transmission and distribution system or result inthe theft or inappropriate release of certain types of information, including critical infrastructure information, sensitive customer, vendor and employeedata, trading or other confidential data. The risk of these system-related events and security breaches occurring continues to intensify, and while we havebeen, and will likely continue to be, subjected to physical and cyber-attacks, to date we have not directly experienced a material breach or disruption to ournetwork or information systems or our operations. However, as such attacks continue to increase in sophistication and frequency, we may be unable toprevent all such attacks in the future.
If a significant breach were to occur, our reputation could be negatively affected, customer confidence in us or others in the industry could be
diminished, or we could be subject to legal claims, loss of revenues, increased costs or operations shutdown. Moreover, the amount and scope of insurancemaintained against losses resulting from any such events or security breaches may not be sufficient to cover losses or otherwise adequately compensate forany disruptions to business that could result.
In addition, new or updated security regulations or unforeseen threat sources could require changes in current measures taken by us or our
business operations and could adversely affect our consolidated financial statements. Our employees, contractors, customers and the general public could be exposed to a risk of injury due to the nature of the energyindustry. Employees and contractors throughout the organization work in, and the general public could be exposed to, potentially dangerous environments
near our operations. As a result, employees, contractors and the general public are at some risk for serious injury, including loss of life. These risks includenuclear accidents, dam failure, gas explosions, pole strikes and electric contact cases.
Natural disasters, war, acts and threats of terrorism, pandemic and other significant events could negatively impact our results ofoperations, ability to raise capital and future growth. Our fleet of power plants and the transmission infrastructure to which they are connected could be affected by natural disasters and extreme
weather events, which could result in increased costs, including supply chain costs. Natural disasters and other significant events increase our risk that theNRC or other regulatory or legislative bodies could change the laws or regulations governing, among other things, operations, maintenance, licensed lives,decommissioning, SNF storage, insurance, emergency planning, security and environmental and radiological matters. In addition, natural disasters couldaffect the availability of a secure and economical supply of water in some locations, which is essential for our continued operation, particularly the coolingof generating units.
The impact that potential terrorist attacks could have on the industry and on us is uncertain. We face a risk that our operations would be direct
targets or indirect casualties of an act of terror. Any retaliatory military strikes or sustained military campaign could affect our operations in unpredictableways, such as changes in insurance markets and disruptions of fuel supplies and markets, particularly oil. Furthermore, these catastrophic events couldcompromise the physical or cybersecurity of our facilities, which could adversely affect our ability to manage our business effectively. Instability in thefinancial markets as a result of terrorism, war, natural disasters, pandemic, credit crises, recession or other factors also could result in a decline in energyconsumption or interruption of fuel or the supply chain. In addition, the implementation of security guidelines and measures has resulted in and is expectedto continue to result in increased costs.
30

We could be significantly affected by the outbreak of a pandemic. We have plans in place to respond to a pandemic. However, depending on the
severity of a pandemic and the resulting impacts to workforce and other resource availability, the ability to operate our generating assets could be adverselyaffected.
In addition, we maintain a level of insurance coverage consistent with industry practices against property, casualty and cybersecurity losses subject
to unforeseen occurrences or catastrophic events that could damage or destroy assets or interrupt operations. However, there can be no assurance that theamount of insurance will be adequate to address such property and casualty losses.
Our business is capital intensive, and our assets could require significant expenditures to maintain and are subject to operational failure,which could result in potential liability. Our business is capital intensive and require significant investments in electric generating facilities. Equipment, even if maintained in accordance
with good utility practices, is subject to operational failure, including events that are beyond our control, and could require significant expenditures tooperate efficiently. Our consolidated financial statements could be negatively affected if we were unable to effectively manage our capital projects or raisethe necessary capital.
Our performance could be negatively affected if we fail to attract and retain an appropriately qualified workforce. Certain events, such as the separation transaction, an employee strike, loss of employees, loss of contract resources due to a major event, and an
aging workforce without appropriate replacements, could lead to operating challenges and increased costs for us. The challenges include lack of resources,loss of knowledge and a lengthy time period associated with skill development. In this case, costs, including costs for contractors to replace employees,productivity costs and safety costs, could arise. We are particularly affected due to the specialized knowledge required of the technical and supportemployees for generation operations.
We could make acquisitions or investments in new business initiatives and new markets, which may not be successful or achieve theintended financial results. We could continue to pursue growth in our existing businesses and markets and further diversification across the competitive energy value chain.
This could include investment opportunities in technology and innovation, renewables and other types of generation, and potential expansion of theexisting wholesale gas businesses. Such initiatives could involve significant risks and uncertainties, including distraction of management from currentoperations, inadequate return on capital, and unidentified issues not discovered during diligence performed prior to launching an initiative or entering amarket. Additionally, it is possible that FERC, state public utility commissions or others could impose certain other restrictions on such transactions. All ofthese factors could result in higher costs or lower revenues than expected, resulting in lower than planned returns on investment.
We may not realize or achieve the anticipated cost savings through the cost management efforts. Our future financial performance and level of profitability is dependent, in part, on various cost reduction initiatives and may be affected by the
separation transaction. We may encounter challenges in executing these cost reduction initiatives and not achieve the intended cost savings.
Risks Related to Our Separation from Exelon
We have no recent history of operating as an independent company, and our historical and pro forma financial information are notnecessarily representative of the results that we would have achieved as a separate, publicly traded company and may not be a reliableindicator of our future results. The historical information about Generation in this information statement refers to the business of Generation as integrated with Exelon.
Additionally, the pro forma financial information included in this information statement is derived from our historical financial information and (i) giveseffect to the separation and (ii) reflects our anticipated post-separation capital structure. Accordingly, the historical and pro forma financial informationdoes not necessarily reflect the financial condition, results of operations or cash flows that we would have achieved as a separate, publicly traded companyduring the periods presented or those that we may achieve in the future primarily as a result of the factors described below:
· Prior to the distribution, our business has been operated by Exelon as part of its broader corporate organization, rather than as an independentcompany. One of Exelon’s affiliates has performed various corporate functions for us, including legal, treasury, accounting, auditing, humanresources, investor relations, and finance. Our historical and pro forma financial results reflect allocations of corporate expenses from Exelon forsuch functions, which may be less than the expenses we would have incurred had we operated as a separate, publicly traded company.
31

· Currently, our business is integrated with the other businesses of Exelon. Historically, we have shared economies of scope and scale in costs,
employees and vendor relationships. While we have sought to minimize the impact on us when separating these arrangements, there is noguarantee these arrangements will continue to capture these benefits in the future.
· As a current part of Exelon, we take advantage of Exelon’s overall size and scope to obtain more advantageous procurement terms. After thedistribution, as a standalone company, we may be unable to obtain similar arrangements to the same extent as Exelon did, or on terms as favorableas those Exelon obtained, prior to completion of the distribution.
· After the completion of the distribution, the cost of capital for our business may be higher than our cost of capital prior to the distribution. Other significant changes may occur in our cost structure, management, financing and business operations as a result of operating as a company separatefrom Exelon. For additional information about the past financial performance of our business and the basis of presentation of the historical consolidatedfinancial statements and the unaudited pro forma condensed consolidated financial statements of our business, see “Unaudited Pro Forma CondensedConsolidated Financial Information,” “Management’s Discussion and Analysis of Financial Condition and Results of Operations” and the historicalconsolidated financial statements and accompanying notes included elsewhere in this information statement.
Following the separation, our financial profile will change, and we will be a smaller, less diversified company than Exelon prior to theseparation. The separation will result in us and Exelon being smaller, less diversified companies with more limited businesses concentrated in their respective
industries. As a result, we may be more vulnerable to changing market conditions, which could have a material adverse effect on our business, financialcondition and results of operations. In addition, the diversification of our revenues, costs, and cash flows will diminish as a standalone company, such thatour results of operations, cash flows, working capital and financing requirements may be subject to increased volatility and our ability to fund capitalexpenditures and investments, pay dividends and service debt may be diminished.
We may not achieve some or all of the expected benefits of the separation, and the separation may materially adversely affect ourbusiness. As discussed below under “The Separation—Reasons for the Separation,” we believe that the separation is in the best interest of our shareholders.
However, we may not be able to achieve the full strategic and financial benefits expected to result from the separation, or such benefits may be delayed ornot occur at all.
If we fail to achieve some or all of the benefits expected to result from the separation, or if such benefits are delayed, it could have a material
adverse effect on our competitive position, business, financial condition, results of operations and cash flows.
32

Exelon’s plan to separate into two independent, publicly traded companies is subject to various risks and uncertainties and may not becompleted in accordance with the expected plans or anticipated timeline, or at all, and will involve significant time and expense, whichcould disrupt or adversely affect our business. In February 2021, Exelon announced its plan to separate into two independent, publicly traded companies. The separation is subject to the
satisfaction of certain conditions (or waiver by Exelon in its sole and absolute discretion), including final approval by Exelon’s board of directors of thefinal terms of the separation and certain other conditions. Furthermore, the separation is complex in nature, and unanticipated developments or changes,including changes in the law, the macroeconomic environment, competitive conditions of Exelon’s markets, regulatory approvals or clearances, theuncertainty of the financial markets and challenges in executing the separation, could delay or prevent the completion of the proposed separation, or causethe separation to occur on terms or conditions that are different or less favorable than expected. Additionally, Exelon’s board of directors, in its sole andabsolute discretion, may decide not to proceed with the separation at any time prior to the distribution date.
The process of completing the proposed separation has been and is expected to continue to be time-consuming and involves significant costs andexpenses. The separation costs may be significantly higher than what we currently anticipate and may not yield a discernible benefit if the separation is notcompleted or is not well executed, or if the expected benefits of the separation are not realized. Executing the proposed separation will also requiresignificant amounts of management’s time and effort. Other challenges associated with effectively executing the separation include attracting, retaining andmotivating employees during the pendency of the separation and following its completion; addressing disruptions to our supply chain and other operationsresulting from separating Exelon into two independent companies; and separating Exelon’s information systems.
Until the separation occurs, Exelon has sole discretion to change the terms of the separation in ways that may be unfavorable to us. Until the separation occurs, we will be a wholly owned subsidiary of Exelon. Accordingly, Exelon will effectively have the sole and absolute
discretion to determine and change the terms of the separation, including the establishment of the record date for the distribution and the distribution date.These changes could be unfavorable to us.
In addition, Exelon may decide at any time not to proceed with the separation and distribution if at any time Exelon’s board of directors
determines, in its sole and absolute discretion, that the distribution of our common stock or the terms thereof are not in the best interests of Exelon and itsshareholders or that legal, market or regulatory conditions or other circumstances are such that the separation and distribution are no longer advisable atthat time. If Exelon’s board of directors determines to cancel the separation and distribution, Exelon’s shareholders will not receive any distribution of ourcommon stock and Exelon will be under no obligation whatsoever to its shareholders to distribute those shares.
The terms we will receive in our agreements with Exelon could be less beneficial than the terms we may have otherwise received fromunaffiliated third parties. The agreements we will enter into with Exelon in connection with the separation, including the separation agreement, a tax matters agreement, an
employee matters agreement, and a transition services agreement, were prepared in the context of the separation while we were still a wholly ownedsubsidiary of Exelon. Accordingly, during the period in which the terms of those agreements were prepared, we did not have an independent board ofdirectors or a management team that was independent of Exelon. As a result, the terms of those agreements may not reflect terms that would have resultedfrom negotiations between unaffiliated third parties. See “Certain Relationships and Related Party Transactions.”
Exelon may fail to perform under various transaction agreements that will be executed as part of the separation, which could cause us toincur expenses or losses we would not otherwise incur. In connection with the separation and prior to the distribution, we and Exelon will enter into the separation agreement and will also enter into
various other agreements, including a tax matters agreement, an employee matters agreement, and a transition services agreement. The separationagreement, the tax matters agreement and the employee matters agreement will determine the allocation of assets and liabilities between the companiesfollowing the separation for those respective areas and will include any necessary indemnifications related to liabilities and obligations. We will rely onExelon to satisfy its performance and payment obligations under these agreements. If Exelon is unable or unwilling to satisfy its obligations under theseagreements, including its indemnification obligations, we could incur operational difficulties and/or losses.
33

In connection with the separation into two public companies, each of Exelon and we will indemnify each other for certain liabilities. If weare required to pay under these indemnities to Exelon, our financial results could be negatively impacted. The Exelon indemnities may notbe sufficient to hold us harmless from the full amount of liabilities for which Exelon will be allocated responsibility, and Exelon may notbe able to satisfy its indemnification obligations in the future. Pursuant to the separation agreement and certain other agreements between Exelon and us, each party will agree to indemnify the other for certain
liabilities, in each case for uncapped amounts, as discussed further in the section entitled “Certain Relationships and Related Party Transactions — Agreements with Exelon Related to the Separation — Separation Agreement” of this information statement. Indemnities that we may be required to provideExelon are not subject to any cap, may be significant and could negatively impact our business. Third parties could also seek to hold us responsible for anyof the liabilities that Exelon has agreed to retain. Any amounts we are required to pay pursuant to these indemnification obligations and other liabilitiescould require us to divert cash that would otherwise have been used in furtherance of our operating business. Further, the indemnities from Exelon for ourbenefit may not be sufficient to protect us against the full amount of such liabilities, and Exelon may not be able to fully satisfy its indemnificationobligations.
Moreover, even if we ultimately succeed in recovering from Exelon any amounts for which we are held liable, we may be temporarily required to
bear these losses ourselves. Each of these risks could negatively affect our business, results of operations and financial condition. We may fail to have necessary systems and services in place when certain of the transaction agreements expire. If we do not have in place our own systems and services, or if we do not have agreements with other providers of these services once certain
separation transaction agreements expire, we may not be able to operate our business effectively, and our profitability may decline. We are in the process ofcreating our own, or engaging third parties to provide, systems and services to replace many of the systems and services that Exelon currently provides tous. We may incur temporary interruptions in business operations if we cannot transition effectively from Exelon’s existing operating systems, databases andprogramming languages that support these functions to our own systems. Our failure to implement the new systems and transition our data successfully andcost-effectively could disrupt our business operations and have a material adverse effect on our profitability. In addition, our costs for the operation of thesesystems may be higher than the amounts reflected in our historical combined financial statements.
If the distribution, together with certain related transactions, fails to qualify as a tax-free transaction for U.S. federal income taxpurposes, then we, Exelon and Exelon’s shareholders could be subject to significant tax liability or tax indemnity obligations. It is a condition to the completion of the separation that Exelon receive the IRS Ruling and an opinion from its counsel, Sidley Austin LLP,
together substantially to the effect that the distribution, together with certain related transactions, will qualify as a tax-free reorganization under Sections355 and 368(a)(1)(D) of the IRC.
Although a private letter ruling from the IRS is generally binding on the IRS, the IRS Ruling, if received from the IRS, will rely on certain facts,
assumptions, representations and undertakings from Exelon and us regarding the past and future conduct of Exelon’s and our business, among othermatters. Moreover, the IRS Ruling will not be a comprehensive ruling regarding all aspects of the U.S. federal income tax consequences of the separationand distribution. The opinion of counsel, if received from Exelon’s counsel, will also rely on certain facts, assumptions and covenants, as described therein,as well as on the validity of the IRS Ruling. In addition, Exelon’s counsel’s ability to provide an opinion will depend on the absence of changes in existingfacts or law between the date of this information statement and the closing date of the separation. The opinion of counsel will not be binding on the IRS orthe courts, and the IRS or the courts may not agree with such opinion.
Even if Exelon receives the IRS Ruling and opinion of counsel, the IRS could determine on audit that the distribution or any of certain related
transactions is taxable if it determines that any of the facts, assumptions, representations or undertakings upon which such ruling and opinion rely are notcorrect or have been violated or if it disagrees with the conclusions in the opinion that are not covered by the IRS Ruling, or for other reasons, including asa result of certain significant changes in the stock ownership of Exelon or us after the distribution. If the distribution or certain related transactions isultimately determined to be taxable, the distribution could be treated as a taxable dividend to you for U.S. federal income tax purposes, and you could incursignificant U.S. federal income tax liability. In addition, Exelon and/or we could incur significant U.S. federal income tax liabilities or tax indemnificationobligations, whether under applicable law or the tax matters agreement that we will enter into with Exelon, if it is ultimately determined that certain relatedtransactions were undertaken in anticipation of the distribution.
34

We may not be able to engage in desirable capital-raising or strategic transactions following the separation. Under current U.S. federal income tax law, a spin-off that otherwise qualifies for tax-free treatment can be rendered taxable to the parent
corporation and its shareholders as a result of certain post-spin-off transactions, including certain acquisitions of shares or assets of the spun-offcorporation. To preserve the tax-free treatment of the distribution, and in addition to potential tax indemnity obligations, we will agree to certain limitationsor prohibitions in the tax matters agreement that may prohibit us, for the two-year period following the distribution and except in specific circumstances,from, among other things:
· entering into any transaction pursuant to which all or a portion of the shares of our stock, or substantially all of our assets, would be acquired,
whether by merger or otherwise;· issuing equity securities beyond certain thresholds;· repurchasing shares of our stock other than in certain open-market transactions; and· ceasing to actively conduct our business.
The tax matters agreement will also prohibit us from taking or failing to take any other action that would prevent the distribution and certain relatedtransactions from qualifying as a transaction that is generally tax-free for U.S. federal income tax purposes under Sections 355 and 368(a)(1)(D) of the IRC.These restrictions may limit our ability to pursue certain equity issuances, strategic transactions, repurchases or other transactions that we may believe to bein the best interests of our shareholders or that might increase the value of our business. For more information, see the sections entitled “CertainRelationships and Related Party Transactions — Agreements with Exelon Related to the Separation — Tax Matters Agreement” and “The Separation—Material U.S. Federal Income Tax Consequences of the Separation.”
The transfer to us of certain contracts may require the consents or approvals of, or provide other rights to, third parties. If such consentsor approvals are not obtained, we may not be entitled to the benefit of such contracts, which could increase our expenses or otherwiseharm our business and financial performance. In some circumstances, we and Exelon are joint beneficiaries of contracts, and we and Exelon may need the consent of third parties in order to
split or separate the existing contracts or the relevant portion of the existing contracts between us and Exelon. Some parties may use consent requirements or other rights to seek to terminate contracts or obtain more favorable contractual terms from us,
which, for example, could take the form of adverse price changes, require us to expend additional resources in order to obtain the services or assetspreviously provided under the contract, or require us to seek arrangements with new third parties or obtain letters of credit or other forms of credit support.If we are unable to obtain required consents or approvals, we may be unable to obtain the contractual commitments that are intended to be allocated to us aspart of our separation from Exelon, and we may be required to seek alternative arrangements to obtain services and assets which may be more costly and/orof lower quality. The termination or modification of these contracts or the failure to timely complete the transfer or separation of these contracts couldnegatively impact our business, financial condition, results of operations and cash flows.
Risks Related to Our Common Stock
We cannot be certain that an active trading market for our common stock will develop or be sustained after the separation, and followingthe separation, our stock price may fluctuate significantly. A public market for our common stock does not currently exist. We anticipate that on or prior to the record date for the distribution, trading of
shares of our common stock will begin on a “when-issued” basis and will continue through the distribution date. However, we cannot guarantee that anactive trading market will develop or be sustained for our common stock after the separation. If an active trading market does not develop, you may havedifficulty selling your shares of common stock at an attractive price, or at all. In addition, we cannot predict the prices at which shares of our common stockmay trade after the separation.
35

Similarly, we cannot predict the effect of the separation on the trading prices of our common stock. After the distribution, Exelon’s common stockwill continue to be listed and traded on NASDAQ under the symbol “EXC.” Subject to the consummation of the separation, we expect our common stockto be listed and traded on NASDAQ under the symbol “ .” The combined trading prices of the shares of our common stock and Exelon common stockafter the separation, as adjusted for any changes in the combined capitalization of these companies, may not be equal to or greater than the trading prices ofExelon’s common stock prior to the separation. Until the market has fully evaluated the business of Exelon without our business, and fully evaluated us, theprice at which Exelon’s or our common stock trades may fluctuate significantly.
Many factors could cause the market price of our common stock to rise and fall, including the following:
· our business profile and market capitalization may not fit the investment objectives of Exelon’s current shareholders, causing a shift in ourinvestor base, and our common stock may not be included in some indices in which Exelon’s common stock is included, causing certain holders tosell their common stock;
· our announcements or our competitors’ announcements regarding new products or services, enhancements, significant contracts, acquisitions orstrategic investments;
· fluctuations in our quarterly or annual financial results or the quarterly or annual financial results of companies perceived to be similar to us;· the failure of securities analysts to cover our common stock after the separation;· changes in earnings estimates or recommendations by securities analysts or our ability to meet those estimates;· the operating and stock price performance of other comparable companies;· investors’ general perception of us and our industry;· changes to the regulatory and legal environment under which we operate;· changes in general economic and market conditions;· changes in industry conditions; and· the other factors described in this “Risk Factors” section and elsewhere in this information statement.
In addition, if the market for stocks in our industry, or the stock market in general, experiences a loss of investor confidence, the trading price of ourcommon stock could decline for reasons unrelated to our business, financial condition or results of operations. If any of the foregoing occurs, it could causeour stock price to fall and may expose us to lawsuits that, even if successfully defended, could be costly to defend and a distraction to management.
A significant number of shares of our common stock may be sold following the distribution, which may cause our stock price to decline. Any sales of substantial amounts of our common stock in the public market or the perception that such sales might occur, in connection with the
distribution or otherwise, may cause the market price of our common stock to decline. Upon completion of the distribution, we expect that we will have anaggregate of approximately shares of our common stock issued and outstanding (based on shares of Exelon common stock outstanding as of , 2022). Sharesdistributed to Exelon shareholders in the separation will generally be freely tradeable without restriction or further registration under the U.S. Securities Actof 1933, as amended (the “Securities Act”), except for shares owned by one of our “affiliates,” as that term is defined in Rule 405 under the Securities Act.
We are unable to predict whether large amounts of our common stock will be sold in the open market following the distribution. We are also
unable to predict whether a sufficient number of buyers of our common stock to meet the demand to sell shares of our common stock at attractive priceswould exist at that time.
36

Your percentage of ownership in us may be diluted in the future. In the future, your percentage ownership in us may be diluted because of equity issuances for acquisitions, capital market transactions or
otherwise, including any equity awards that we will grant to our directors, officers and employees. Our employees will have stock-based awards thatcorrespond to shares of our common stock after the distribution as a result of conversion of their Exelon stock-based awards. We anticipate that thecompensation committee of our board of directors may grant additional stock-based awards to our employees after the distribution. Those awards will havea dilutive effect on the number of our shares outstanding, and therefore on our earnings per share, which could adversely affect the market price of ourcommon stock. From time to time, we will issue additional stock-based awards to our employees under our employee benefits plans.
Anti-takeover provisions could enable us to resist a takeover attempt by a third party. Our amended and restated articles of incorporation and amended and restated bylaws will contain, and Pennsylvania law contains, provisions that
are intended to deter coercive takeover practices and inadequate takeover bids by making such practices or bids unacceptably expensive to the bidder and toencourage prospective acquirers to negotiate with our board of directors rather than to attempt a hostile takeover.
We believe these provisions will protect our shareholders from coercive or otherwise unfair takeover tactics by requiring potential acquirers to
negotiate with our board of directors and by providing our board of directors with more time to assess any acquisition proposal. These provisions are notintended to make us immune from takeovers; however, these provisions will apply even if the offer may be considered beneficial by some shareholders andcould delay or prevent an acquisition that our board of directors determines is not in the best interests of us and our shareholders. These provisions mayalso prevent or discourage attempts to remove and replace incumbent directors. See “Description of Common Stock — Certain Anti-Takeover Provisions.”
In addition, an acquisition or further issuance of our stock could trigger the application of Section 355(e) of the IRC, causing the distribution to be
taxable to Exelon. For a discussion of Section 355(e) of the IRC, see “The Separation — Material U.S. Federal Income Tax Consequences of theSeparation.” Under the tax matters agreement, we would be required to indemnify Exelon for the resulting tax, and this indemnity obligation mightdiscourage, delay or prevent a change of control that our shareholders may consider favorable.
The combined post-separation value of share of our common stock and one share of Exelon common stock may not equal or exceed thepre-distribution value of one share of Exelon common stock. As a result of the separation, we expect the trading price of shares of Exelon common stock immediately following the separation to be different
from the “regular-way” trading price of Exelon common shares immediately prior to the separation because the trading price will no longer reflect thevalue of our businesses. There can be no assurance that the aggregate market value of share of our common stock and one share of Exelon common stockfollowing the separation will be higher than, lower than or the same as the market value of a share of Exelon common stock if the separation did not occur.
37

THE SEPARATION
Background
On February 21, 2021, Exelon’s board of directors unanimously authorized management to pursue a plan to separate the Company from Exelon.The board considered a sale of Exelon’s competitive generation and customer-facing business as a possible alternative, but ultimately decided that aseparation was the most efficient way to separate its businesses in a manner intended to enhance long-term value to Exelon’s shareholders.
The Exelon board regularly reviews the businesses that comprise Exelon to confirm that its business mix and portfolio are in the best interests of
Exelon and its shareholders. In the more recent reviews leading to the February decision, the board determined that separating Exelon’s regulated utilitybusinesses from its competitive generation and customer-facing businesses would improve strategic and management focus and could unlock shareholdervalue. In reaching its decision to pursue the separation, the board considered a possible sale of competitive generation and customer-facing businesses tothird parties. With the assistance of advisors, that consideration included an evaluation of the potential tax costs of a sale, the effort and distractionsassociated with a sale process, the likelihood of a complete disposition to a single buyer versus a partial disposition to multiple buyers and associatedimpacts upon generation operating performance and efficiencies, and possible regulatory hurdles due to potential overlapping markets served by potentialbuyers. Those factors made a sale alternative less attractive as compared to the separation alternative, which, as described under “Reasons for theSeparation” below, achieved a number of objectives that the board felt accomplished better results for Exelon’s shareholders. The board ultimatelydetermined not to engage in a sale process and negotiations as it concluded that a separation was the most efficient way to separate Exelon’s businesses in amanner intended to enhance long term value to Exelon’s shareholders.
As a result of that separation, the Company will become a separate, publicly-traded company, and Exelon will have no continuing stock ownership
interest in the Company. Prior to the separation, Exelon will effect several internal transactions. See “—Manner of Effecting the Separation—InternalTransactions.”
To complete the separation, Exelon will, following the completion of the internal transactions, distribute to Exelon shareholders all of the
outstanding shares of our common stock. The distribution will occur on the distribution date, which is expected to be , 2022. Each holder of Exeloncommon stock will receive share of our common stock for every share of Exelon common stock held at p.m. Eastern Time, on , 2022, therecord date. After completion of the distribution:
· We will be a publicly-traded company (NASDAQ: ) and, through Generation, will own Exelon’s competitive generation and customer-facing
energy businesses; and· Exelon will continue to be a publicly-traded company (NASDAQ: EXC) and will continue to own and conduct its regulated electric
distribution and transmission and gas distribution businesses.
Each holder of Exelon common stock will continue to hold his, her or its shares in Exelon. No vote of Exelon shareholders is required or is beingsought in connection with the separation, and Exelon shareholders will not have any appraisal rights in connection with the separation.
The distribution is subject to the satisfaction or waiver of certain conditions. In addition, until the distribution has occurred, Exelon’s board of
directors has the right not to proceed with the distribution, even if all of the conditions are satisfied. See “—Conditions to the Distribution.”
Reasons for the Separation
Exelon is comprised of six regulated utility operating companies that together serve more than 10 million customers, and Generation, an electricityproducer and a competitive energy retailer. The utility operating companies provide electricity transmission and distribution and gas distribution serviceswithin relatively defined geographic areas under service terms, conditions and rates that are regulated by public utility commissions based on each utility’sinvestment in plant, property and equipment, referred to as rate base, and their operating costs. Generation generates electricity primarily from nucleargenerating plants and sells electricity and natural gas to wholesale and retail customers within a broad geographic area under service terms, conditions andprices determined by competitive market forces.
The Exelon board of directors believes that the separation of the competitive generation and customer-facing businesses from the regulated utility
businesses is in the best interest of Exelon and its shareholders for a number of reasons, including: · Direct investment identity—Exelon’s board of directors believes that Exelon’s regulated utility businesses and our competitive businesses
appeal to different types of investors with different industry focuses, investment goals and risk profiles. The utility and competitive businesseshave different investment and business characteristics, including different opportunities for growth, capital structures, business models andfinancial returns. The separation will better position each business within its peer set and will support business strategies tailored to distinctinvestment profiles and meeting unique customer needs.
· More specialized strategic focus —The separation will allow each company to more effectively pursue its own distinct operating priorities
and strategies and will enable the management of both companies to respond to changes in the industry in which operates, pursue separateopportunities for long-term growth and profitability, without taking into account potentially conflicting or competing needs and objectives oftwo disparate businesses operating in a single company. This ability will unlock strategic flexibility for each company to focus on its corebusiness strategies to better meet evolving customer needs and stakeholder goals. As a standalone company, the Company may be able topursue investments or acquisitions in the competitive energy infrastructure space that Exelon’s current shareholders would not find attractiveas it would increase Exelon’s exposure to non-regulated businesses.
· More efficient allocation of capital — The separation will permit each company to concentrate its financial resources solely on its own
operations, providing greater flexibility to invest capital in its business in a time and manner appropriate for its distinct strategy and businessneeds, all of which will facilitate a more efficient allocation of capital
38

· Allows each business to maintain risk profiles more appropriate for their shareholders — The competitive generation and customer-facing
energy businesses of Exelon are exposed to certain market risks, including, in the near term, the volatility in the price of power, natural gasand other commodities. As operated today, the competitive businesses are substantially hedged in the near-term against certain commodityrisks, because commodity price movements could adversely affect Exelon’s near-term earnings, cash flows and credit ratings if Exelon weresubstantially unhedged. The Company will be committed to disciplined risk-mitigation policies, including a ratable hedging strategy, andExelon’s board of directors believes that separating the Company from the regulated utilities of Exelon will give our management furtherflexibility to manage our risk.
· Aligns management incentives — The separation will permit the creation of equity-based incentive compensation programs for each of the
companies that is expected to reflect more closely the efforts and performance of each company’s management and will allow each companyto better recruit, retain and motivate employees pursuant to compensation policies that are appropriate for their respective lines of business.
For information about risks related to the separation, see the “Risk Factors – Risks Relating to Our Separation from Exelon” beginning on page 31
of this information statement. Neither Exelon nor we can assure you that, following the separation, any of the benefits described above or otherwise will berealized to the extent anticipated or at all.
Manner of Effecting the Separation
The general terms and conditions relating to the separation will be set forth in a separation agreement between us and Exelon, which we refer to asthe separation agreement.
Internal Transactions We were incorporated as a Pennsylvania corporation on June 15, 2021 for the purpose of holding Generation and its competitive generation and
customer-facing energy businesses. Immediately prior to the separation: · Generation will repay to Exelon an intercompany note expected to have an outstanding principal amount of $258 million.· Exelon will contribute its equity ownership in Generation, including its subsidiaries, to us.· Exelon will contribute $ in cash to us.
Distribution of Shares of Our Common Stock Under the separation agreement, the distribution will be effective as of 12:01 a.m. Eastern time, on , 2022, the distribution date. As a result
of the separation, on the distribution date, each holder of Exelon common stock will receive share of our common stock for every share of Exelon commonstock that he, she or it owns as of p.m. Eastern time, on , 2022, the record date. The actual number of shares to be distributed will bedetermined based on the number of shares of Exelon common stock outstanding as of the record date. The shares of our common stock to be distributed byExelon will constitute all of the issued and outstanding shares of our common stock held by Exelon immediately prior to the distribution.
On the distribution date, Exelon will release the shares of our common stock to the Distribution Agent to distribute to Exelon shareholders. The
Distribution Agent will credit the shares of our common stock to the book-entry accounts of Exelon shareholders established to hold their shares of ourcommon stock. The Distribution Agent will send these shareholders a statement reflecting their ownership of our common stock. Book-entry refers to amethod of recording stock ownership in our records in which no physical certificates are issued. For shareholders who own Exelon common stock througha broker or other nominee, their shares of our common stock will be credited to these shareholders’ accounts by the broker or other nominee. It may takethe Distribution Agent up to two weeks to distribute shares of our common stock to Exelon shareholders or to their bank or brokerage firm electronically byway of direct registration in book-entry form. Trading of our stock will not be affected by this delay in distribution by the Distribution Agent.
39

Exelon shareholders will not be required to make any payment or surrender or exchange their shares of Exelon common stock or take any other
action to receive their shares of our common stock. No vote of Exelon shareholders is required or sought in connection with the separation. Exelon shareholders have no appraisal rights in connection
with the separation.
Treatment of Fractional Shares
The Distribution Agent will not distribute any fractional shares of our common stock to Exelon shareholders. Instead, as soon as practicable on orafter the distribution date, the Distribution Agent will aggregate fractional shares of our common stock to which Exelon shareholders of record wouldotherwise be entitled into whole shares, sell them in the open market at the prevailing market prices and then distribute the aggregate net sale proceedsratably to Exelon shareholders who would otherwise have been entitled to receive fractional shares of our common stock. The amount of this payment willdepend on the prices at which the Distribution Agent sells the aggregated fractional shares of our common stock in the open market shortly after thedistribution date and will be reduced by any amount required to be withheld for tax purposes and any brokerage fees and other expenses incurred inconnection with these sales of fractional shares. Receipt of the proceeds from these sales generally will result in a taxable gain or loss to those Exelonshareholders. Each shareholder entitled to receive cash proceeds from these shares should consult his, her or its own tax advisor as to the shareholder’sparticular circumstances. The tax consequences of the distribution are described in more detail under “—Material U.S. Federal Income Tax Consequencesof the Separation.”
Transaction and Separation Costs
In connection with the separation, we currently estimate that the one-time separation costs we will incur, primarily employee-related costs such asrecruitment expenses, costs to establish certain stand-alone functions and information technology systems, professional services fees and other transaction-related costs during our transition to being a stand-alone public company, will range from approximately $ to $ .
Material U.S. Federal Income Tax Consequences of the Separation
The following is a summary of the material U.S. federal income tax consequences to the U.S. Holders (as defined below) of shares of Exeloncommon stock in connection with the distribution and certain related transactions. This summary is based on the IRC, the Treasury regulations promulgatedthereunder, and judicial and administrative interpretations thereof, all as in effect as of the date of this information statement, and all of which are subject todiffering interpretations and may change at any time, possibly with retroactive effect. Any such change could affect the tax consequences described below.This summary assumes that the separation will be consummated in accordance with the separation agreement and as described in this informationstatement.
This summary is limited to holders of shares of Exelon common stock that are U.S. Holders, as defined immediately below. For purposes of this
summary, a U.S. Holder is a beneficial owner of Exelon common stock that is, for U.S. federal income tax purposes: · an individual who is a citizen or a resident of the United States;· a corporation, or other entity treated as a corporation for U.S. federal income tax purposes, created or organized under the laws of the United
States or any state thereof or the District of Columbia;· an estate, the income of which is subject to U.S. federal income taxation regardless of its source; or· a trust (i) with respect to which a court within the United States is able to exercise primary jurisdiction over its administration and one or more
U.S. persons (within the meaning of Section 7701(a)(30) of the IRC) have the authority to control all of its substantial decisions, or (ii) thathas a valid election in place under applicable Treasury regulations to be treated as a U.S. person.
This summary does not discuss all tax considerations that may be relevant to Exelon shareholders in light of their particular circumstances, nor
does it address the consequences to Exelon shareholders subject to special treatment under the U.S. federal income tax laws, including: · a financial institution, regulated investment company or insurance company;· a tax-exempt organization;· a dealer or broker in securities, commodities or foreign currencies;
40

· a holder that holds Exelon common stock as part of a hedge, appreciated financial position, straddle, conversion or other risk reduction
transaction;· a holder that holds Exelon common stock in a tax-deferred account, such as an individual retirement account; or· a holder that acquired Exelon common stock pursuant to the exercise of options or similar derivative securities or otherwise as compensation.
This summary also does not address the U.S. federal income tax consequences to Exelon shareholders who do not hold shares of Exelon common
stock as a capital asset. Moreover, this summary does not address any state, local or non-U.S. tax consequences, or any federal tax other than U.S. federalincome tax consequences (such as estate or gift tax consequences or the Medicare tax on certain investment income).
If a partnership (or any other entity or arrangement treated as a partnership for U.S. federal income tax purposes) holds shares of Exelon common
stock, the tax treatment of a partner in that partnership generally will depend on the status of the partner and the activities of the partner and the partnership.Such a partner or partnership is urged to consult its tax advisor as to the tax consequences of the separation.
WE URGE YOU TO CONSULT WITH YOUR TAX ADVISOR AS TO THE SPECIFIC U.S. FEDERAL, STATE AND LOCAL, AND NON-
U.S. TAX CONSEQUENCES OF THE SEPARATION IN LIGHT OF YOUR PARTICULAR CIRCUMSTANCES. Treatment of the Separation Completion of the separation is conditioned upon Exelon’s receipt of the IRS Ruling and an opinion from its counsel, Sidley Austin LLP, together
substantially to the effect that the distribution, together with certain related transactions, will qualify as a tax-free reorganization under Sections 355 and368(a)(1)(D) of the IRC.
Although a private letter ruling from the IRS is generally binding on the IRS, the IRS Ruling, if received from the IRS, will rely on certain facts,
assumptions, representations and undertakings from Exelon and us regarding the past and future conduct of Exelon’s and our business, among othermatters. Moreover, the IRS Ruling will not be a comprehensive ruling regarding all aspects of the U.S. federal income tax consequences of the separationand distribution. The opinion of counsel, if received from Exelon’s counsel, will also rely on certain facts, assumptions and covenants, as described therein,as well as on the validity of the IRS Ruling. In addition, Exelon’s counsel’s ability to provide an opinion will depend on the absence of changes in existingfacts or law between the date of this information statement and the closing date of the separation. The opinion of counsel will not be binding on the IRS orthe courts, and the IRS or the courts may not agree with such opinion.
Even if Exelon receives the IRS Ruling and opinion of counsel, the IRS could determine on audit that the distribution or any of certain related
transactions is taxable if it determines that any of the facts, assumptions, representations or undertakings upon which such ruling and opinion rely are notcorrect or have been violated or if it disagrees with the conclusions in the opinion that are not covered by the IRS Ruling, or for other reasons, including asa result of certain significant changes in the stock ownership of Exelon or us after the distribution. If, notwithstanding the IRS Ruling and the opinion ofcounsel, it is ultimately determined that the distribution, together with certain related transactions, do not qualify as tax-free under Sections 355 and 368(a)(1)(D) of the IRC, then Exelon or we could incur significant U.S. federal income tax liabilities attributable to the separation and distribution. In addition, ifthe distribution does not qualify as tax-free under Section 355 of the Code, each Exelon shareholder that receives shares of our common stock in thedistribution would be treated as receiving a distribution in an amount equal to the fair market value of our common stock that was distributed to theshareholder, which would generally be taxed as a dividend to the extent of the shareholder’s pro rata share of Exelon’s current and accumulated earningsand profits, including Exelon’s taxable gain, if any, on the separation, then treated as a non-taxable return of capital to the extent of the shareholder’s basisin the Exelon stock and thereafter treated as capital gain from the sale or exchange of Exelon common stock. Under current U.S. federal income tax law,certain non-corporation citizens or residents of the United States (including individuals) currently are subject to U.S. federal income tax on dividends(assuming certain holding period requirements are met) and long-term capital gains (i.e., capital gains on assets held for more than one year) at reducedrates.
41

Assuming that the distribution, together with certain related transactions, will qualify for tax-free treatment, and subject to the qualifications and
limitations set forth herein (including the discussion below relating to the receipt of cash in lieu of fractional shares), for U.S. federal income tax purposes: · no gain or loss will be recognized by Exelon on the distribution;
· no gain or loss will be recognized by, or be includible in the income of, a U.S. Holder solely as a result of the receipt of our common stock in
the distribution;
· the aggregate tax basis of the shares of Exelon common stock and shares of our common stock, including any fractional share deemedreceived, in the hands of each U.S. Holder immediately after the distribution will be the same as the aggregate tax basis of the shares ofExelon common stock held by such holder immediately before the distribution, allocated between the shares of Exelon common stock andshares of our common stock, including any fractional share deemed received, in proportion to their relative fair market values immediatelyfollowing the distribution; and
· the holding period with respect to shares of our common stock received by U.S. Holders will include the holding period of their shares of
Exelon common stock, provided that such shares of Exelon common stock are held as capital assets immediately following the distribution.
U.S. Holders that have acquired different blocks of Exelon common stock at different times or at different prices are urged to consult their taxadvisors regarding the allocation of their aggregate adjusted basis among, and their holding period of, our common stock and Exelon common stock.
If a U.S. Holder receives cash in lieu of a fractional share of our common stock as part of the distribution, the U.S. Holder will be treated as
though it first received a distribution of the fractional share in the distribution and then sold it for the amount of cash actually received. Such U.S. Holderwill generally recognize capital gain or loss measured by the difference between the cash received for such fractional share and the U.S. Holder’s tax basisin that fractional share, as determined above. Such capital gain or loss will be long-term capital gain or loss if the U.S. Holder’s holding period for theExelon common stock exceeds one year on the date of the distribution. The deductibility of capital losses is subject to significant limitations.
Even if the distribution otherwise qualifies for tax-free treatment under Section 355 of the Code, the separation may result in corporate level
taxable gain to Exelon under Section 355(e) of the IRC if 50% or more, by vote or value, of the Exelon stock or our stock is treated as directly or indirectlyacquired or issued as part of a plan or series of related transactions that includes the distribution (including as a result of transactions occurring before theseparation). The process for determining whether an acquisition or issuance triggering these provisions has occurred is complex, inherently factual andsubject to interpretation of the facts and circumstances of a particular case, and any such acquisitions may not be within our or Exelon’s control. For thispurpose, any acquisitions or issuances of Exelon stock within two years before the day of the distribution, and any acquisitions or issuances of our stock orExelon stock within two years after the day of the distribution generally are presumed to be part of such a plan (subject to certain exceptions and safeharbors), although we or Exelon, as applicable, may be able to rebut that presumption. If an acquisition or issuance of our stock or Exelon stock triggers theapplication Section 355(e) of the IRC, Exelon could incur significant U.S. federal income tax liabilities attributable to the distribution and certain relatedtransactions, but the distribution would generally be tax-free to each of Exelon shareholders, as described above. Under some circumstances, the taxmatters agreement would require us to indemnify Exelon for such tax liability associated with the taxable gain.”
U.S. Treasury regulations require certain Exelon shareholders who receive our common stock in the distribution and, immediately prior to the
distribution, own (i) at least 5% of the total outstanding stock of Exelon, or (ii) securities of Exelon with an aggregate basis of $1 million or more, to attachto their U.S. federal income tax return for the year in which our stock is received a detailed statement setting forth certain information relating to the tax-free nature of the distribution. U.S. Holders are urged to consult their tax advisors to determine whether they are required to provide the foregoingstatement and the contents thereof.
Under the tax matters agreement, we will generally be required to indemnify Exelon for the resulting taxes in the event that the distribution and/or
related transactions fail to qualify for their intended tax treatment due to any action by us or any of our subsidiaries. If the distribution were to be taxable toExelon, the liability for payment of such tax by Exelon or by us under the tax matters agreement could have a material adverse effect on Exelon or us, asthe case may be.
42

WE URGE YOU TO CONSULT WITH YOUR TAX ADVISOR AS TO THE SPECIFIC U.S. FEDERAL, STATE AND LOCAL, AND NON-
U.S. TAX CONSEQUENCES OF THE SEPARATION IN LIGHT OF YOUR PARTICULAR CIRCUMSTANCES.
Results of the Separation
After the separation, we will be a publicly-traded company. Immediately following the separation, we expect to have approximately record holdersof shares of our common stock and approximately shares of our common stock outstanding, based on the number of shareholders and outstanding shares ofExelon common stock on , 2022, and assuming each holder of Exelon common stock will receive share of our common stock for every share of Exeloncommon stock. The actual number of shares to be distributed will be determined as of the record date.
We are in the process of determining the treatment of Exelon equity awards in connection with the separation. The treatment of equity awards will
be described in greater detail in a subsequent amendment to the registration statement of which this information statement forms a part. For informationregarding the treatment of equity awards of the Company’s directors and executive officers after the distribution, see “Certain Relationships and RelatedParty Transactions—Agreements with Exelon Related to the Separation—Employee Matters Agreement” and “Management.”
We are in the process of determining the treatment of bonuses in connection with the separation, in respect of (i) the current performance year, (ii)
any pre-existing awards that have been earned but that remain unpaid, and (iii) any go-forward bonus programs and/or arrangements. The treatment ofbonuses will be described in greater detail in a subsequent amendment to the registration statement of which this information statement forms a part.
Before the separation, we will enter into several agreements with Exelon to effect the separation and provide a framework for our relationship with
Exelon after the separation. These agreements will govern the relationship between us and Exelon after completion of the separation and provide for theallocation between us and Exelon of the assets, liabilities, rights and obligations of Exelon. See “Certain Relationships and Related Party Transactions—Agreements with Exelon Related to the Separation.”
Trading Prior to the Distribution Date
See “Trading Market – Trading Prior to the Distribution Date” for information regarding trading in our common stock and Exelon’s common stockprior to the distribution date.
Conditions to the Distribution
We expect that the distribution will be effective as of 12:01 a.m. Eastern time, on , 2022, the distribution date. The distribution is subject to thesatisfaction, or waiver by Exelon, of the following conditions:
· the final approval of the distribution by Exelon’s board of directors, which approval may be given or withheld in its absolute and sole discretion;· our registration statement on Form 10, of which this information statement forms a part, shall have been declared effective by the SEC, with no
stop order in effect with respect thereto;· the mailing by Exelon of this information statement (or notice of internet availability thereof) to record holders of Exelon common stock as of the
record date;· our common stock shall have been approved for listing on NASDAQ, subject to official notice of distribution;· Exelon shall have received the IRS Ruling and an opinion of its counsel, Sidley Austin LLP, together substantially to the effect that the
distribution, together with certain related transactions, will qualify as a tax-free reorganization under Sections 355 and 368(a)(1)(D) of the IRC;· the following governmental approvals and any required material governmental approvals and other consents necessary to consummate the
distribution or any portion thereof shall have been obtained and be in full force and effect:
43

· NRC consent and approval to indirectly transfer and to amend the nuclear facility operating licenses,· FERC approval to indirectly transfer control of facilities subject to its jurisdiction, through the upstream change in ownership resulting from
the separation, and· NYPSC approval of the change in the ultimate upstream ownership of three nuclear plants (FitzPatrick, Nine Mile Point and Ginna) located in
New York;· the absence of any events or developments having occurred prior to the distribution that, in the judgment of Exelon’s board of directors, would
result in the distribution having a material adverse effect on Exelon or its shareholders;· our adoption of amended and restated articles of incorporation and amended and restated bylaws and the filing of those documents with the SEC
as exhibits to the registration statement on Form 10, of which this information statement forms a part;· no order, injunction or decree issued by any governmental entity of competent jurisdiction or other legal restraint or prohibition preventing the
consummation of all or any portion of the distribution shall be in effect, and no other event shall have occurred or failed to occur that prevents theconsummation of all or any portion of the distribution;
· the internal transactions shall have been completed, except for such steps as Exelon in its sole discretion shall have determined may be completedafter the distribution date; and
· each of the separation agreement, the tax matters agreement, the employee matters agreement, the transition services agreement and the otherancillary agreements shall have been executed and delivered by each party thereto and be in full force and effect.
We are not aware of any material federal, foreign or state regulatory requirements that must be complied with or any material approvals that must
be obtained in connection with the distribution and separation, other than the aforementioned approvals of the NRC, FERC and NYPSC; compliance withSEC rules and regulations; approval for listing on NASDAQ; and the declaration of effectiveness of the registration statement on Form 10, of which thisinformation statement forms a part, by the SEC. Some of these conditions may not be met and Exelon may waive any of the conditions to the distribution.In addition, until the distribution has occurred, Exelon’s board of directors has the right to not proceed with the distribution, even if all of the conditions aresatisfied. In the event Exelon’s board of directors determines to waive a material condition to the distribution, to modify a material term of the distributionor not to proceed with the distribution, Exelon intends to promptly issue a press release or other public announcement and file a Current Report on Form 8-K to report such event.
Reasons for Furnishing this Information Statement
This information statement is being furnished solely to provide information to Exelon shareholders that are entitled to receive shares of Companycommon stock in the distribution. This information statement is not, and is not to be construed as, an inducement or encouragement to buy, hold or sell anyof our securities or any securities of Exelon. We believe that the information in this information statement is accurate as of the date set forth on the cover.Changes may occur after that date and neither Exelon nor we undertake any obligation to update the information.
TRADING MARKET
We intend to list our common stock on NASDAQ under the ticker symbol “ .”
Trading Prior to the Distribution Date
Beginning shortly before the record date and continuing up to and including the distribution date, we expect that a limited market, commonlyknown as a “when-issued” trading market, will develop in our common stock. “When-issued” trading refers to a sale or purchase made conditionallybecause the security has been authorized but not yet issued. The “when-issued” trading market will be a market for shares of our common stock that will bedistributed to Exelon shareholders on the distribution date. If you own shares of Exelon common stock at p.m. Eastern time, as of the record date, youwill be entitled to shares of our common stock distributed pursuant to the distribution. You may trade this entitlement to shares of our common stock,without trading the shares of Exelon common stock you own, on the “when-issued” market. On the first trading day following the distribution date, “when-issued” trading with respect to our common stock will end and “regular-way” trading will begin. We will announce our when-issued trading symbol whenand if it becomes available.
44

It is also anticipated that, beginning shortly before the record date and continuing up to and including the distribution date, there will be two
markets in Exelon common stock: a “regular-way” market and an “ex-distribution” market. Shares of Exelon common stock that trade on the “regular-way”market will trade with an entitlement to shares of Company common stock distributed pursuant to the distribution. Shares that trade on the “ex-distribution”market will trade without an entitlement to shares of our common stock distributed pursuant to the distribution. Therefore, if you own shares of Exeloncommon stock at the close of business on the record date and sell those shares on the “regular-way” market before the distribution date, you will be sellingyour right to receive shares of our common stock in connection with the distribution. If you own shares of Exelon common stock at the close of business onthe record date and sell those shares on the “ex-distribution” market before the distribution date, you will still receive the shares of our common stock thatyou would be entitled to receive pursuant to your ownership of the shares of Exelon common stock on the record date. However, if Exelon shareholdersown shares of Exelon common stock at p.m. Eastern time, as of the record date and sell those shares on the “ex-distribution” market up to and including thedistribution date, the selling shareholders will still receive the shares of our common stock that they would otherwise receive pursuant to the distribution.
Market for Our Common Stock
There is currently no public market for our common stock and an active trading market may not develop or may not be sustained. We cannot predict the prices at which our common stock may trade before the separation on a “when-issued” basis or after the distribution and
separation. Those prices will be determined by the marketplace. Prices at which trading in our common stock occurs may fluctuate significantly. Thoseprices may be influenced by many factors, including anticipated or actual fluctuations in our operating results or those of other companies in our industry,investor perception of the Company and the retail power and gas and power generation business, market fluctuations and general economic conditions. Inaddition, the stock market in general has experienced extreme price and volume fluctuations that have affected the performance of many stocks and thathave often been unrelated or disproportionate to the operating performance of these companies. These are just some factors that may adversely affect themarket price of our common stock. See “Risk Factors—Risks Related to Our Common Stock” for further discussion of risks relating to the trading prices ofour common stock.
Transferability of Shares of Our Common Stock
On , 2022, Exelon Corporation had approximately million shares of its common stock issued and outstanding. Based on this number, weexpect that upon completion of the distribution, we will have approximately million shares of common stock issued and outstanding. The shares of ourcommon stock that you will receive in the distribution will be freely transferable, unless you are considered an “affiliate” of ours under Rule 144 under theSecurities Act. Persons who can be considered our affiliates after the distribution generally include individuals or entities that directly, or indirectly throughone or more intermediaries, control, are controlled by, or are under common control with, us, and may include certain of our officers and directors. As ofthe distribution date, we estimate that our directors and officers will beneficially own in the aggregate less than percent of our shares. In addition,individuals who are affiliates of Exelon on the distribution date may be deemed to be affiliates of ours. Our affiliates may sell shares of our common stockreceived in the distribution only:
· under a registration statement that the SEC has declared effective under the Securities Act; or· under an exemption from registration under the Securities Act, such as the exemption afforded by Rule 144.
In general, under Rule 144 as currently in effect, an affiliate will be entitled to sell, within any three-month period commencing 90 days after the
date that the registration statement of which this information statement is a part is declared effective, a number of shares of our common stock that does notexceed the greater of:
· 1.0% of our common stock then outstanding; or· the average weekly trading volume of our common stock on NASDAQ during the four calendar weeks preceding the filing of a notice on Form
144 with respect to the sale. Sales under Rule 144 are also subject to restrictions relating to manner of sale and the availability of current public information about us.
45

In the future, we expect to adopt new equity-based compensation plans and issue stock-based awards. We currently expect to file a registration
statement under the Securities Act to register shares to be issued under these equity plans. Shares issued pursuant to awards after the effective date of thatregistration statement, other than shares issued to affiliates, generally will be freely tradable without further registration under the Securities Act.
Except for our common stock distributed in the distribution and employee-based equity awards, we will have no equity securities outstanding
immediately after the separation.
DIVIDEND POLICY
We have not made a decision on whether we will pay dividends on our common stock. Any decision to declare and pay dividends will be made atthe sole discretion of our board of directors and will depend on a number of factors, including:
· our historic and projected financial condition, liquidity and results of operations;· our capital levels and needs;· tax considerations;· any acquisitions or potential acquisitions that we may consider;· statutory and regulatory prohibitions and other limitations;· the terms of any credit agreements or other borrowing arrangements that restrict our ability to pay cash dividends;· general economic conditions; and· other factors deemed relevant by our board of directors.
As a Pennsylvania corporation, we will be subject to certain restrictions on dividends under Pennsylvania corporate law. Generally, a corporation
may only pay dividends under the Pennsylvania Business Corporation Law if the total assets of the corporation would be more than the sum of its totalliabilities plus the amount that would be needed, if the corporation were to be dissolved at the time as of which the distribution is measured, to satisfy thepreferential rights upon dissolution of shareholders whose preferential rights are superior to those receiving the distribution.
CAPITALIZATION
The following table presents Generation’s unaudited cash and capitalization as of December 31, 2020 on a historical basis, and our unaudited cash
and capitalization as of December 31, 2020 on a pro forma basis to give effect to the distribution and separation as if it occurred on December 31, 2020.You can find an explanation of the pro forma adjustments made to the historical combined financial statements under “Unaudited Pro Forma CondensedConsolidated Financial Statements.” The capitalization table below should be read together with “Unaudited Pro Forma Condensed Consolidated FinancialStatements,” “Management’s Discussion and Analysis of Financial Condition and Results of Operations” and the audited consolidated financial statementsand accompanying notes included in the “Index to Consolidated Financial Statements” section of this information statement.
We are providing the capitalization table below for informational purposes only. The capitalization table below may not reflect the capitalization
or financial condition that would have resulted had we been operated as a stand-alone public company at that date and is not necessarily indicative of ourfuture capitalization or financial condition.
We have not yet finalized our post-separation capitalization. We intend to update and include pro forma financial information reflecting our post-
separation capitalization in an amendment to this information statement.
46

UNAUDITED PRO FORMA CONDENSED CONSOLIDATED FINANCIAL STATEMENTS
On February 21, 2021, Exelon’s board of directors authorized management to pursue a plan to separate its competitive generation and customer-
facing energy businesses into a stand-alone publicly traded company. The separation will occur through a distribution to Exelon’s shareholders of all of theshares of common stock of the Company, which will own Generation, including its competitive generation, customer-facing power and gas supply, andrelated businesses. Following the distribution, Exelon shareholders will own 100% of the shares of our common stock.
The unaudited pro forma condensed consolidated financial statements have been derived from the historical audited consolidated financial
statements of Generation, included elsewhere in this information statement. The unaudited pro forma condensed consolidated statement of operations forthe year ended December 31, 2020 gives effect to the separation and related transactions, including the purchase of the noncontrolling interest in CENG, asif they had occurred on January 1, 2020, the beginning of the most recent fiscal year for which audited financial statements are available. The unaudited proforma condensed consolidated balance sheet as of December 31, 2020 gives effect to the separation and related transactions, including the purchase of thenoncontrolling interest in CENG, as if they had occurred on December 31, 2020.
The unaudited pro forma condensed consolidated financial statements were prepared in accordance with Article 11 of Regulation S-X. The
unaudited pro forma condensed consolidated financial statements were prepared for illustrative and informational purposes only and are not intended torepresent what our results of operations or financial position would have been had the separation and the purchase of the noncontrolling interest in CENGoccurred on the dates indicated. The unaudited pro forma condensed consolidated financial statements also should not be considered indicative of ourfuture results of operations or financial position as an independent, publicly traded company. The actual financial position and results of operations maydiffer significantly from the pro forma amounts reflected herein due to a variety of factors. See “Cautionary Note Regarding Forward-Looking Statements”included in this information statement. The unaudited pro forma condensed consolidated financial information does not reflect the realization of anyexpected cost savings or other synergies as a result of the separation and related transactions, including the purchase of the noncontrolling interest inCENG.
On November 20, 2019, Generation received notice that, pursuant to an April 1, 2014 Put Option Agreement, EDF intended to exercise its put
option to sell to Generation its 49.99% equity interest in CENG. Following the required sixty-day notice period, the put option was automatically exercisedon January 19, 2020. On August 6, 2021, Generation and EDF entered into a settlement agreement pursuant to which Generation, through a wholly ownedsubsidiary, purchased EDF’s equity interest in CENG for a net purchase price of $885 million, which includes, among other things, a credit for EDF’s shareof the balance of a preferred distribution payable by CENG to Generation. The difference between the net purchase price and EDF’s noncontrolling interestas of the closing date was recorded to Membership interest on our Consolidated Balance Sheet.
The following unaudited pro forma condensed consolidated statement of operations and unaudited pro forma condensed consolidated balance
sheet give pro forma effect to the following: Separation transaction accounting adjustments
· the issuance of shares of the Company’s common stock based on distribution ratio of share of our common stock for each share of Exeloncommon stock outstanding on the record date.
· the impact of the separation agreement, employee matters agreement, tax matters agreement and the provisions therein.
47

CENG put transaction adjustments · the purchase of 49.99% noncontrolling interest in CENG from EDF in accordance with the Put Option Agreement, including the
establishment of a deferred tax liability and the issuance of approximately $880 million under a term loan credit agreement to fund thetransaction.
· the adjustment of the provision (benefit) for income taxes related to the taxation of income previously attributable to noncontrolling interest
holders.
Autonomous entity adjustments · the incremental costs that the Company expects to incur as an independent, separate public company under the transition services agreement.
The following unaudited pro forma condensed consolidated financial statements should be read in conjunction with: · Management’s Discussion and Analysis of Financial Condition and Results of Operations, which are included elsewhere within this
information statement.
· the historical audited consolidated financial statements and accompanying notes of Generation as of and for the year ended December 31,2020, which are included elsewhere within this information statement.
· the accompanying notes to the pro forma financial information.
48

Constellation Newholdco, Inc.
Unaudited Pro Forma Condensed Consolidated Statement of Operations
For the Year Ended December 31, 2020 Pro Forma Adjustments (Note 2)
(In millions, except per share data) Historical
SeparationTransactionAccounting
Adjustments
CENG PutTransactionAccounting
Adjustments
AutonomousEntity
Adjustments Pro Forma Operating revenues
Operating revenues $ 16,392 $ 1,211(e) $ 17,603 Operating revenues from affiliates 1,211 (1,211)(e) —
Total operating revenues 17,603 — — — 17,603 Operating expenses
Purchased power and fuel 9,592 (7)(e) 9,585 Purchased power and fuel from affiliates (7) 7(e) — Operating and maintenance 4,613 555(e) [—](j) 5,168
[—](d) Operating and maintenance from affiliates 555 (555)(e) — Depreciation and amortization 2,123 2,123 Taxes other than income taxes 482 482
Total operating expenses 17,358 — — — 17,358 Gain on sales of assets and businesses 11 11 Operating income 256 — — — 256 Other income and (deductions)
Interest expense, net (328) [—](h) (328)Interest expense to affiliates (29) 29(b) — Other, net 937 [—](d) 937
Total other income and (deductions) 580 29 — — 609 Income before income taxes 836 29 — — 865 Income taxes 249 [—](k) [—](i) [—](k) 249 Equity in losses of unconsolidated affiliates (8) (8)Net income 579 29 — — 608 Net (loss) income attributable to noncontrollinginterests (10) [—](h) (10)Net income attributable to membership interestor common shareholders 589 29 — — 618 Average shares of common stock outstanding(Note 3):
Basic N/A [—] Diluted N/A [—]
Earnings per average common share (Note 3): Basic N/A [—] Diluted N/A [—]
49

Constellation Newholdco, Inc.
Unaudited Pro Forma Condensed Consolidated Balance Sheet
As of December 31, 2020 Pro Forma Adjustments (Note 2)
(In millions) Historical
SeparationTransactionAccounting
Adjustments
CENG PutTransactionAccounting
Adjustments Pro Forma ASSETS
Current assets Cash and cash equivalents $ 226 [—](b) [—](h) $ 226 [—](g) Restricted cash and cash equivalents 89 89 Accounts receivable
Customer accounts receivable 1,330 153(e) 1,483 Customer allowance for credit losses (32) (32)Customer accounts receivable, net 1,298 153 — 1,451 Other accounts receivable 352 [—](f) 352 Other accounts receivable, net 352 — — 352
Mark-to-market derivative assets 644 644 Receivables from affiliates 153 (153)(e) 0 Unamortized energy contract assets 38 38 Inventories, net
Fossil fuel and emission allowances 233 233 Materials and supplies 978 978
Renewable energy credits 621 621 Assets held for sale 958 958 Other 1,357 1,357
Total current assets 6,947 — — 6,947 Property, plant and equipment (net of accumulated depreciationand amortization of $13,370 as of December 31, 2020) 22,214 22,214
Deferred debits and other assets Nuclear decommissioning trust funds 14,464 14,464 Investments 184 184 Goodwill 47 47 Mark-to-market derivative assets 555 555 Prepaid pension asset 1,558 [—](c) 1,558 Unamortized energy contract assets 293 293 Deferred income taxes 6 6 Other 1,826 [—](f) 1,826
Total deferred debits and other assets 18,933 — — 18,933 Total assets $ 48,094 — — $ 48,094
50

Constellation Newholdco, Inc.
Unaudited Pro Forma Condensed Consolidated Balance Sheet
As of December 31, 2020 Pro Forma Adjustments (Note 2)
(In millions) Historical
SeparationTransactionAccounting
Adjustments
CENG PutTransactionAccounting
Adjustments Pro Forma LIABILITIES AND EQUITY
Current liabilities Short-term borrowings $ 840 [—](h) $ 840 Long-term debt due within one year 197 197 Accounts payable 1,253 107(e) 1,360 Accrued expenses 788 788 Payables to affiliates 107 (107)(e) 0 Borrowings from Exelon intercompany money pool 285 [—](b) 285 Mark-to-market derivative liabilities 262 262 Unamortized energy contract liabilities 7 7 Renewable energy credit obligation 661 661 Liabilities held for sale 375 375 Other 444 444
Total current liabilities 5,219 — — 5,219 Long-term debt 5,566 5,566 Long-term debt to affiliates 324 [—](b) 324 Deferred credits and other liabilities
Deferred income taxes and unamortized investment tax credits 3,656 [—](c) [—](h) 3,656 [—](f)
Asset retirement obligations 12,054 12,054 Pension obligations — [—](c) 0 Non-pension postretirement benefit obligations 858 [—](c) 858 Spent nuclear fuel obligation 1,208 1,208 Contractual obligation for regulatory agreement units — 3,017(e) 3,017 Payables to affiliates 3,017 (3,017)(e) 0 Mark-to-market derivative liabilities 205 205 Unamortized energy contract liabilities 3 3 Other 1,308 1,308
Total deferred credits and other liabilities 22,309 — — 22,309 Total liabilities(a) 33,418 — — 33,418
Commitments and contingencies Equity
Member’s equity Membership interest 9,624 [—](a) [—](h) 9,624
[—](c) Undistributed earnings 2,805 [—](a) 2,805 Accumulated other comprehensive loss, net (30) [—](a) (30)
Shareholders' equity Common stock — [—](a) 0 Additional paid-in capital — [—](a) 0 [—](g) Accumulated other comprehensive loss, net — [—](a) —
[—](c) Total member’s or shareholders' equity 12,399 — — 12,399
Noncontrolling interests 2,277 [—](h) 2,277 Total equity 14,676 — — 14,676
Total liabilities and equity $ 48,094 — — $ 48,094
51

Notes to Unaudited Pro Forma Condensed Consolidated Financial Statements
1. Basis of Presentation
The historical financial information as of and for the year ended December 31, 2020 is derived from and should be read in conjunction with thehistorical audited consolidated financial statements of Generation appearing elsewhere in this information statement and the assumptions outlined in Note 2below.
2. Pro Forma Adjustments and Assumptions
Separation transaction accounting adjustments
(a) Reflects the issuance of shares of Company common stock based on the distribution ratio of share of Company common stock for eachshare of Exelon common stock outstanding on the record date and reflects the elimination of historical membership interest and undistributedearnings.
(b) Reflects the repayment of $609 million of intercompany debt between Generation and Exelon and the elimination of the related interest
expense.
(c) Reflects the estimated impact to prepaid asset, pension obligation and accumulated other comprehensive income resulting from the legalseparation of the pension and OPEB plans, historically sponsored by Exelon and accounted for as multi-employer benefit plans, related tocurrent and former Exelon employees transferred to the Company in accordance with the employee matters agreement.
(d) Reflects the estimated impact to Operating and maintenance and Other, net for the presentation reclass of non-service cost components
resulting from the legal separation of the pension and OPEB plans, historically sponsored by Exelon and accounted for as multi-employerbenefit plans, related to current and former Exelon employees transferred to the Company in accordance with the employee mattersagreement.
(e) Reflects the reclassification of sales, purchases and other intercompany transactions between the Company and Exelon's utility subsidiaries,
from related party transactions to third-party transactions. Other intercompany transactions include long-term payables to ComEd and PECOrelated to nuclear decommissioning of Regulatory Agreement Units. See Note 10 — Asset Retirement Obligations of the Notes toConsolidated Financial Statements for additional information.
(f) Reflects the elimination of the deferred taxes related to tax credit carryforwards and recording of a receivable from Exelon for the
reimbursement of the tax credits when utilized by Exelon in accordance with the tax matters agreement. (g) Reflects the expected cash contribution from Exelon to the Company of $ in accordance with the separation agreement.
CENG put transaction accounting adjustments (h) Reflects the purchase of 49.99% noncontrolling interest in CENG from EDF in accordance with the Put Option Agreement, including the
establishment of a deferred tax liability and the issuance of approximately $880 million under a 364-day term loan credit agreement to fundthe transaction, which bears interest at a variable rate equal to LIBOR plus a risk premium. The interest rates assumed for purposes ofpreparing this pro forma financial information comprise of the LIBOR rate of % as of , 2021 plus the risk premium specified in thecredit agreement. A 1/8% change to the annual interest rate would change interest expense by approximately $ on an annual basis.
(i) Reflects the adjustment of the provision (benefit) for income taxes related to the taxation of income previously attributable to noncontrolling
interest holders and for the adjustments made to income (loss) before income taxes at an estimated statutory rate of approximately 25%.
52

Autonomous entity adjustments (j) Reflects the estimated incremental costs of approximately $ for the support services to be provided by Exelon's business services subsidiary,
BSC, under the transition services agreement, in addition to the corporate and shared costs allocated to Generation in its historicalconsolidated financial statements.
Historically, Exelon has charged its operating subsidiaries for a variety of support services at cost, including legal, human resources, financial,information technology and supply management services, incurred in the operation of the business. Primarily during the first year followingthe separation date, Exelon will continue to provide certain support services, including legal, financial, and information technology services tothe Company until such time as the Company can create all of the necessary stand-alone functions. The unaudited pro forma condensedconsolidated statement of operations has been adjusted to depict the Company as an independent, separate public company following theseparation.
Other transaction accounting and autonomous entity adjustments (k) Reflects the adjustment of the provision (benefit) for income taxes for the adjustments made to income (loss) before income taxes at an
estimated statutory rate of approximately 25%. 3. Pro Forma Earnings Per Share
The calculation of pro forma basic net income per share is calculated by dividing the pro forma net income by the weighted average number ofshares of Exelon common stock outstanding for the period indicated, adjusted for a distribution ratio of share of Company common stock for eachshare of Exelon common stock outstanding. For more information on the distribution ratio, see Note 2(a) above. The calculation of pro forma diluted netincome per share is calculated by dividing the pro forma net income by the weighted average number of shares of Exelon common stock outstanding anddilutive shares of common stock outstanding for the periods indicated, adjusted for the same distribution ratio. This calculation may not be indicative of thedilutive effect that will actually result from share-based awards subsequently transferred to or granted by us.
53

OVERVIEW OF THE U.S. POWER MARKETS
Prior to the 1990s, most electricity customers in the U.S. were served by regulated, vertically-integrated utilities. During the late 1990s, organized
regional competitive wholesale markets began to form and many states in the U.S. also pursued competitive retail structures allowing non-utility generatorsto sell electricity to utilities and/or retail service providers to sell to end-use customers. Deregulation of the U.S. electric industry has progressed differentlyacross the U.S., with the states in the Northeast, Mid-Atlantic, and Texas generally being the most deregulated and the states in the Southeast and much ofthe Midwest and West generally being the most regulated. A recent key trend in the U.S. power markets is the growing shift toward clean energy. Nuclearpower facilities are particularly well-positioned to respond to and benefit from this trend, as nuclear power provides reliable, carbon-free baseload power tomeet the evolving needs of power markets and customers across the U.S.
Competitive Retail Energy Markets
Retail competition in states across the U.S. ranges from full competition of generation supplier for all retail customers (commercial, industrial andresidential) to partial retail competition available up to a capped amount for industrial customers only.
The District of Columbia and thirteen states (Connecticut, Delaware, Illinois, Maine, Maryland, Massachusetts, New Hampshire, New Jersey,
New York, Ohio, Pennsylvania, Rhode Island and Texas) have implemented full retail competition for nearly all customers of investor owned utilities.These competitive jurisdictions represent nearly one-third of all electricity consumption in the continental U.S.
14 Customer Choice Jurisdictions(a)
a) Source: Retail Energy Supply Association, June 1, 2020
In these states allowing full retail competition, regulated utilities continue to provide transmission and distribution service at regulated rates.
Generation service, however, is no longer rate regulated. Instead, the rates paid by customers are those offered by competitive retail electricity suppliers or,for customers who do not receive service from competitive suppliers, utility provided POLR service that is reflective of wholesale market prices.
There are also several additional states in the U.S. that offer limited electric customer choice and may be considered “hybrid” models. For
example, states including California, Michigan, Arizona, Oregon, Nevada, Virginia, Washington and Montana allow limited portions of total load to beserved competitively at retail.
Competitive Wholesale Markets
Distinct from retail markets, which involve the sales of electricity directly to consumers, wholesale markets involve the sales of electricity amongelectric utilities and electricity marketers before it is eventually sold to end-use consumers. These jurisdictions include many of the most populous states.
54

Some regions of the country have evolved further in terms of forming ISOs or RTOs, which are FERC-regulated entities that coordinate, control,
and monitor the operation of the electrical power system. Examples include PJM, ISO-NE and NYISO. Approximately two-thirds of the nation’s wholesaleelectricity sales occur in competitive markets managed by the ISOs or RTOs. These regions have independent oversight of the wholesale markets, and areregulated by FERC, which provides oversight of the operators that encompass multiple states (all but ERCOT). ISOs and RTOs generally afford moreformalized and structured wholesale electricity markets than non-ISO or non-RTO regions and have implemented mechanisms to facilitate marketmonitoring, reliability and efficiency. ISO/RTO-guided initiatives, such as locational marginal pricing and capacity markets, are designed to send theappropriate price signal for new investment in capacity when new capacity is needed to maintain system reliability. ERCOT is unique in that its locationalmarginal pricing is based solely on system energy and congestion, with no accounting for marginal losses occurring on the system. While not yetformalized into an ISO or RTO, many of the previously fragmented dispatch and control areas in the Western part of the US are starting to combine, as theyrecognize both the operational benefits, as well as the ability to save money for customers through sharing and co-optimization of generation resources andreserves.
PJM. 65% of our generation fleet, measured by net generating capacity, operates within the PJM market. By MW, our generation fleet in PJM
consists of approximately 78% nuclear, 9% renewables, 8% gas and 5% oil. PJM is the largest power market in the US and is comprised of all or parts of13 Mid-Atlantic and Midwestern states and the District of Columbia. PJM is one of the most advanced power markets in the U.S., with nodal day-aheadand real-time energy markets, ancillary service products, and a forward capacity market (the Reliability Pricing Model or RPM) that clears capacity threeyears in advance of the capacity commitment period.
PJM forecasted 150.2 GW of peak load in the 2022/2023 delivery year with a minimum reserve margin of 14.50%. PJM relies heavily on natural
gas-fired and coal-fired generation. PJM’s installed capacity mix in 2020 includes 28% coal, 27% natural gas, 18% nuclear, 15% gas / other secondarycapacity, 5% water, 5% oil and 2% other.
Natural gas pricing is one of the primary drivers of energy prices throughout PJM. The discovery and production of vast amounts of shale gas in
the U.S., particularly from the Marcellus and Utica shales within the bounds of PJM, combined with development of significant amounts of new efficientgas-fired generation has resulted in a decline in wholesale power prices in PJM.
State policies also impact the investment decisions of resources in the PJM market, including state RPS programs, ZEC and/or CMC programs in
Illinois and New Jersey, and the Regional Greenhouse Gas Initiative (RGGI). RGGI is a mandatory greenhouse gas cap and trade program that imposescosts via the purchase of allowances for in-state fossil fuel generators. Eleven states in the Northeast and Mid-Atlantic are members of the RGGI programand Pennsylvania is in the process of joining the program.
Source: PJM Capacity By Fuel Type 2020, PJM 2022/2023 RPM Base Residual Auction Planning Period Parameters.
ERCOT. 12% of our generation fleet, measured by net generating capacity, operates within the ERCOT market. By MW, our generation fleet inERCOT consists of approximately 97% gas and 3% renewables. ERCOT is the system operator for most of Texas and is not under FERC jurisdiction dueto the market being solely located within the state of Texas and not being synchronously interconnected to another part of the U.S. The ERCOT market isprojected to have 86.8 GW of capacity available in summer 2021 to meet a peak demand of 75.2 GW, resulting in a reserve margin of 15.5%. ERCOT’sfuel mix for 2021 is projected to consist of 32% gas (combined-cycle), 28% wind, 19% coal, 12% nuclear, 6% gas, and 3% solar, with less than 0.2% frombiomass, hydro and other.
As an energy-only market, ERCOT’s market design is different from other competitive electricity markets in the U.S. Other markets, including
PJM, maintain a minimum reserve margin through regulated planning, resource adequacy requirements and/or capacity markets. In contrast, ERCOT’sresource adequacy is predominately dependent on free market processes and energy market price signals. All electricity prices are subject to a system-wideoffer cap, which is $9,000/MWh, as of July 2021.
Source: ERCOT 2021 Fuel Mix Report, ERCOT December 2020 Capacity Demand and Reserves Report.
NYISO. 6% of our generation fleet, measured by net generating capacity, operates within the NYISO Market. By MW, our generation fleet inNYISO consists of almost 100% nuclear. Established in 1999 as one of the first ISOs, NYISO features liquid day-ahead and real-time energy and ancillaryservice markets. NYISO also has a spot capacity market, called the ICAP market, which clears capacity up to 6 months in advance of the delivery period.As a result, power generation within NYISO can earn revenues from liquid ancillary, energy and capacity markets. There are four distinct supply anddemand zones in the NYISO market: ROS (generally encompassing upstate New York), Zone G-J (known as the “G-J Locality” and located in the LowerHudson Valley), Zone J (New York City), and Zone K (Long Island). The overall market is known as NYCA.
55
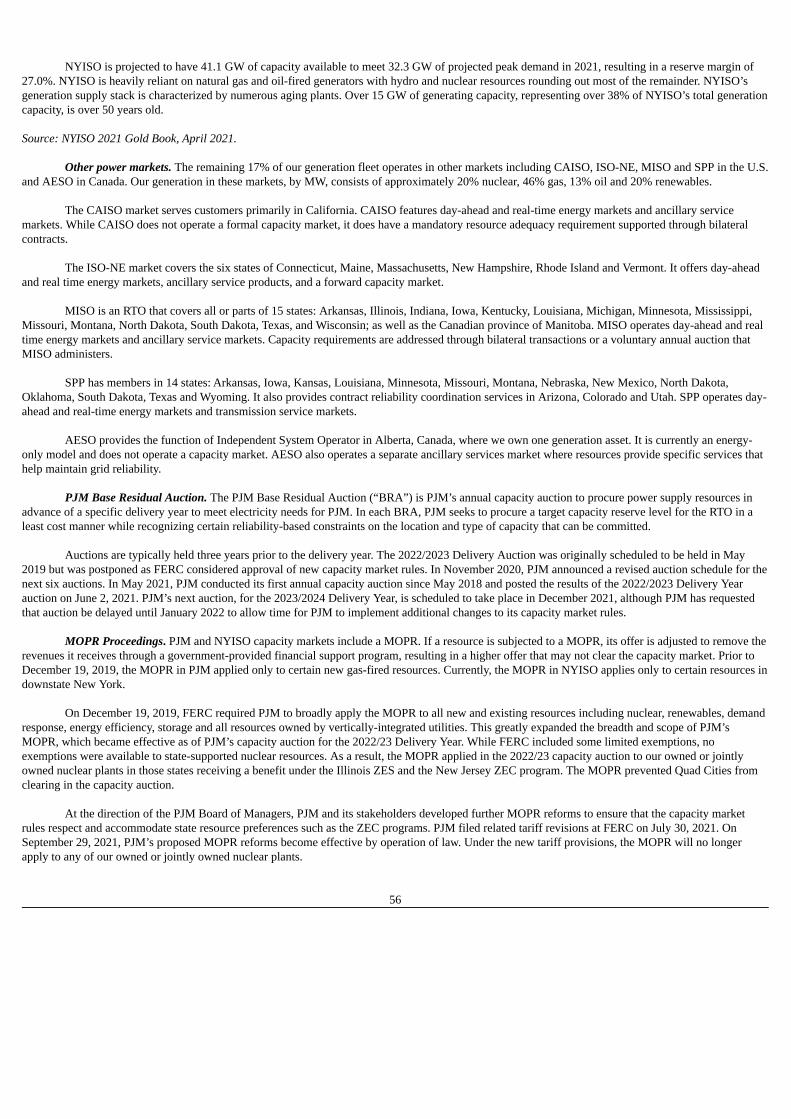
NYISO is projected to have 41.1 GW of capacity available to meet 32.3 GW of projected peak demand in 2021, resulting in a reserve margin of
27.0%. NYISO is heavily reliant on natural gas and oil-fired generators with hydro and nuclear resources rounding out most of the remainder. NYISO’sgeneration supply stack is characterized by numerous aging plants. Over 15 GW of generating capacity, representing over 38% of NYISO’s total generationcapacity, is over 50 years old.
Source: NYISO 2021 Gold Book, April 2021.
Other power markets. The remaining 17% of our generation fleet operates in other markets including CAISO, ISO-NE, MISO and SPP in the U.S.and AESO in Canada. Our generation in these markets, by MW, consists of approximately 20% nuclear, 46% gas, 13% oil and 20% renewables.
The CAISO market serves customers primarily in California. CAISO features day-ahead and real-time energy markets and ancillary service
markets. While CAISO does not operate a formal capacity market, it does have a mandatory resource adequacy requirement supported through bilateralcontracts.
The ISO-NE market covers the six states of Connecticut, Maine, Massachusetts, New Hampshire, Rhode Island and Vermont. It offers day-ahead
and real time energy markets, ancillary service products, and a forward capacity market. MISO is an RTO that covers all or parts of 15 states: Arkansas, Illinois, Indiana, Iowa, Kentucky, Louisiana, Michigan, Minnesota, Mississippi,
Missouri, Montana, North Dakota, South Dakota, Texas, and Wisconsin; as well as the Canadian province of Manitoba. MISO operates day-ahead and realtime energy markets and ancillary service markets. Capacity requirements are addressed through bilateral transactions or a voluntary annual auction thatMISO administers.
SPP has members in 14 states: Arkansas, Iowa, Kansas, Louisiana, Minnesota, Missouri, Montana, Nebraska, New Mexico, North Dakota,
Oklahoma, South Dakota, Texas and Wyoming. It also provides contract reliability coordination services in Arizona, Colorado and Utah. SPP operates day-ahead and real-time energy markets and transmission service markets.
AESO provides the function of Independent System Operator in Alberta, Canada, where we own one generation asset. It is currently an energy-
only model and does not operate a capacity market. AESO also operates a separate ancillary services market where resources provide specific services thathelp maintain grid reliability.
PJM Base Residual Auction. The PJM Base Residual Auction (“BRA”) is PJM’s annual capacity auction to procure power supply resources in
advance of a specific delivery year to meet electricity needs for PJM. In each BRA, PJM seeks to procure a target capacity reserve level for the RTO in aleast cost manner while recognizing certain reliability-based constraints on the location and type of capacity that can be committed.
Auctions are typically held three years prior to the delivery year. The 2022/2023 Delivery Auction was originally scheduled to be held in May
2019 but was postponed as FERC considered approval of new capacity market rules. In November 2020, PJM announced a revised auction schedule for thenext six auctions. In May 2021, PJM conducted its first annual capacity auction since May 2018 and posted the results of the 2022/2023 Delivery Yearauction on June 2, 2021. PJM’s next auction, for the 2023/2024 Delivery Year, is scheduled to take place in December 2021, although PJM has requestedthat auction be delayed until January 2022 to allow time for PJM to implement additional changes to its capacity market rules.
MOPR Proceedings. PJM and NYISO capacity markets include a MOPR. If a resource is subjected to a MOPR, its offer is adjusted to remove the
revenues it receives through a government-provided financial support program, resulting in a higher offer that may not clear the capacity market. Prior toDecember 19, 2019, the MOPR in PJM applied only to certain new gas-fired resources. Currently, the MOPR in NYISO applies only to certain resources indownstate New York.
On December 19, 2019, FERC required PJM to broadly apply the MOPR to all new and existing resources including nuclear, renewables, demand
response, energy efficiency, storage and all resources owned by vertically-integrated utilities. This greatly expanded the breadth and scope of PJM’sMOPR, which became effective as of PJM’s capacity auction for the 2022/23 Delivery Year. While FERC included some limited exemptions, noexemptions were available to state-supported nuclear resources. As a result, the MOPR applied in the 2022/23 capacity auction to our owned or jointlyowned nuclear plants in those states receiving a benefit under the Illinois ZES and the New Jersey ZEC program. The MOPR prevented Quad Cities fromclearing in the capacity auction.
At the direction of the PJM Board of Managers, PJM and its stakeholders developed further MOPR reforms to ensure that the capacity market
rules respect and accommodate state resource preferences such as the ZEC programs. PJM filed related tariff revisions at FERC on July 30, 2021. OnSeptember 29, 2021, PJM’s proposed MOPR reforms become effective by operation of law. Under the new tariff provisions, the MOPR will no longerapply to any of our owned or jointly owned nuclear plants.
56

Key Drivers
The U.S. energy sector is experiencing unprecedented changes that we believe will increase the demand for reliable, clean power generation andbenefit our business. We believe our generation fleet, including our nuclear assets, is well-positioned to deliver reliable, clean power and benefit from thehigher prices that higher demand is expected to drive.
Key drivers of increased demand for clean energy include:
· governmental and corporate policies designed to accelerate the de-carbonization of the economy, including continued momentum forincentives for and investment in wind and solar, along with emerging carbon-free technologies like storage and hydrogen;
· policy support for nuclear energy sources that also enable energy security, reliability and diversification;
· the rapid electrification of the U.S. economy; and
· evolving customer preferences favoring clean energy, choice and digitization, to which we believe our customer-facing business is well-
positioned to respond.
We believe existing nuclear generation, which is currently the largest source of zero emissions electricity in the U.S. accounting for approximately20% of total 2020 utility-scale electricity generation in the U.S. and complementing other zero-carbon power sources, is essential to achieving existing andfuture policy objectives for the reduction of GHG emissions. A 2018 study by the Massachusetts Institute of Technology, “The Future of Nuclear Energy ina Carbon-Constrained World,” found that the costs of achieving transformational de-carbonization targets would increase significantly without thecontribution of nuclear power.
Policy Support for De-Carbonization and Emerging Carbon-Free Technologies. Driven by societal concerns about climate change, governments,
corporations, and investors are increasingly advocating for the reduction of GHG emissions across all sectors of the economy, with reduction of GHGemissions by the energy sector being a key focus. Governments at the international, national and state levels have established or are currentlycontemplating increasingly stringent policies that require the reduction of GHG emissions over time. Corporations have also adopted targets to reduce thecarbon emissions in their business operations, spurred in part by demand from investors and customers for sustainable, environment-friendly businesspractices. Emerging technologies like storage and hydrogen are also helping to advance de-carbonization.
As decarbonization accelerates, we expect our generation fleet will play a critical role in meeting baseload power needs. Nuclear energy is key to
achieving decarbonization objectives, given its existing penetration of the U.S. market today and its greater reliability than renewable energy sources. Webelieve our business is well-positioned to benefit from growing policy support for de-carbonization, which will drive higher demand and higher prices forthe reliable, zero-carbon power our nuclear assets generate.
International Climate Change Agreements. At the international level, the U.S. is a party to the United Nations Framework Convention on Climate
Change (UNFCCC). The parties to the UNFCCC adopted the Paris Agreement at the 21st session of the UNFCCC Conference of the Parties (COP 21) onDecember 12, 2015, and it became effective on November 4, 2016. Under the Paris Agreement, the parties agreed to try to limit the global averagetemperature increase to 2°C (3.6°F) above pre-industrial levels. In doing so, parties developed their own national reduction commitments. The Bidenadministration has announced a new target of 50-52 percent reduction in U.S. Greenhouse Gas Pollution from 2005 Levels by 2030. In order to achieve thistarget and maintain high standards of reliability, the U.S. will need a reliable baseload of zero-carbon generating electricity sources, which our nuclear fleethelps provide.
57

Federal Climate Change Legislation and Regulation. Combating climate change is one of the top legislative agenda items of the Biden
administration. U.S. President Biden’s stated climate change policy targets 100% clean energy economy with net zero GHG emissions no later than 2050.Within the U.S. power sector specifically, the Biden agenda calls for zero GHG emissions from electricity generation by 2035. Since entering office inJanuary 2021, U.S. President Biden has signed a number of executive orders targeting climate change that include removing certain subsidies for the fossilfuel industry. On March 31, 2021, President Biden proposed the American Jobs Plan, a $2 trillion infrastructure plan that includes measures to combatclimate change, such as spending on electric vehicle charging and the creation of a Clean Electricity Standard requiring 100 percent of electricity in theUnited States to be generated by carbon-free sources by 2035. On Earth Day 2021, President Biden emphasized his commitment to mitigating climatechange and pledged to cut U.S. greenhouse gas pollution in half by 2030. While it remains uncertain if the American Jobs Plan or other U.S. federallegislation to reduce GHG emissions will be enacted in the near-term, such legislation would increase the need for reliable carbon-free power generation,which would benefit us as the nation’s largest carbon-free power producer.
Given the Administration’s aggressive goals for reducing emissions within the electric power sector, policymakers have recognized the urgent
need to prevent the retirement of nuclear power plants prior to the end of their licensed lives. Nuclear energy provides 20 percent of the nation’s electricityand over 50 percent of the nation’s carbon free power. A dozen nuclear reactors have closed in recent years, primarily as a result of economic challenges inmerchant power markets. Representative Bill Pascrell (D-NJ) and Senator Ben Cardin (D-MD) have introduced legislation to provide a $15/megawatt hourproduction tax credit for merchant nuclear power plants. The amount of the PTC is decreased for plants with revenues exceeding $25/megawatt hour. TheU.S. Treasury Department proposed an allocated production tax credit for nuclear plants as part of their annual “Green Book” compilation of tax prioritiesfor the Administration. The outlook for this legislation is directly tied to action on legislation extending other clean energy tax credits and remainsuncertain.
Regional and State Climate Change Legislation and Regulation. A number of states in which we operate have state and regional programs to
reduce GHG emissions, including from the power sector. Eleven northeast and mid-Atlantic states (Connecticut, Delaware, Maine, Maryland,Massachusetts, New Hampshire, New Jersey, New York, Rhode Island, Vermont and Virginia) currently participate in the RGGI, which is in the process ofstrengthening its requirements. The program requires most fossil fuel-fired power plants in the region to hold allowances, purchased at auction, for each tonof CO2 emissions. Non-emitting resources do not have to purchase or hold these allowances.
In October 2019, Governor Wolf of Pennsylvania issued an Executive Order that directed the Pennsylvania Department of Environmental
Protection to begin a rulemaking process that will allow Pennsylvania to join RGGI, with the goal of reducing carbon emissions from the electricity sector. Many states in which we operate also have state-specific programs to address GHGs, including from power plants. Most notable of these, besides
RGGI, are renewable and other portfolio standards. In 2019, New York enacted the Climate Leadership and Community Protection Act, which commits thestate to achieving net zero emissions by 2050 with interim emission reduction and renewable energy requirements in 2030 and 2040. On September 15,2021, the Illinois Public Act 102-0662 was signed into law by the Governor of Illinois (“Clean Energy Law”). The Clean Energy Law is designed toachieve 100% carbon-free power by 2045 to enable the state’s transition to a clean energy economy.
Renewable and Clean Energy Standards. According to the National Conference of State Legislatures (NCSL), thirty states and the District of
Columbia have adopted an RPS, while seven more states have set renewable energy goals. These standards impose varying levels of mandates forprocurement of renewable or clean electricity (the definition of which varies by state) and/or energy efficiency. These are generally expressed as apercentage of annual electric load, often increasing by year. Twenty-four states and the District of Columbia have 100% clean electricity targets, deep GHGreduction targets, or both, encompassing 53% of U.S. residential electricity customers. Utilities comply with these various requirements through purchasingqualifying renewables, implementing efficiency programs, acquiring sufficient credits (e.g., RECs), paying an alternative compliance payment, and/or acombination of these compliance alternatives. New York, Illinois and New Jersey adopted standards targeted at preserving the zero-carbon attributes ofcertain nuclear-powered generating facilities. We own multiple facilities participating in these programs within these states. Other states in which ourgeneration facilities operate are considering similar programs. We believe our nuclear assets can play a key role in helping states achieve these goals byproviding fuel-secure power that maintains grid reliability and complements variable renewable sources like wind and solar.
58

100% Clean Electricity Standards, 100% RPS, or High GHG Reduction Targets by State (a)
a) Source: Clean Air Task Force, state public disclosures
Corporate Clean Energy Targets. Corporations are facing increasing pressure from their customers and investors to align their businesses withinternational and national environmental and sustainability objectives, including supporting goals to reduce GHG emissions in their business operations.Leading institutional investors and money managers are increasingly considering sustainability as a key factor in investment decisions and are increasinglyadvocating for more transparency in disclosure on climate-related matters and pledging to align proxy voting to climate-rated proposals with its fiduciaryduty. An increasing number of corporations are also proactively making commitments to reducing their GHG emissions footprint over time, either throughprocuring increasing amounts of clean energy or RECs to offset their carbon footprint over time. As the nation’s largest producer of clean energy, wesupport taking bold action to address the climate change crisis and reestablish leadership in both emerging technologies and existing clean infrastructurethat together will power the future.
Emerging Carbon-Free Technologies. Emerging carbon-free technologies like storage and hydrogen are also expected to help accelerate the
economy’s de-carbonization. The U.S. added 1.1 GW / 2.6 GWh of energy storage in 2020, a significant scale-up of the market. In total, we anticipate that13.6 GW / 35.4 GWh of storage projects will be deployed from 2021 to 2023. Lower costs, state-directed mandates, a backlog of storage projects in theinterconnection queue, and utilities seeking large-scale storage capacity to support higher renewables penetration have created conditions for rapid growthof this technology in the U.S. Clean hydrogen also has the potential to drive de-carbonization, particularly as it relates to more challenging sectors likelong-haul transportation, steel, chemicals, heating and long-term power storage. Nuclear power can be used to produce clean hydrogen, and our nuclearfleet positions us well to explore this emerging space. Entering the hydrogen space could provide de-carbonization alternatives and supplements to naturalgas product offerings. Both energy storage and clean hydrogen continue to gain political and business support and are expected to help support net-zerocarbon goals.
Policy Support for Nuclear Energy In the current market environment, many merchant nuclear facilities are economically challenged as a result of the low near-term outlook for
power prices, which has been negatively impacted by low gas prices, the influx of subsidized renewable energy generation with zero marginal productioncosts, over-development of new gas-fired generation and weak demand for electricity as a result of increased energy efficiency and weak economic activity.Policy support for nuclear energy recognizes that due to its strong reliability, efficiency and carbon-free nature, nuclear power will continue to play acritical role in the clean energy transition.
59

Our nuclear plants are meaningful contributors to the clean energy mix in the states in which they operate. States may not be able to meet their
zero-carbon goals without our nuclear plants, as our plants provide a significant portion of the current carbon-free power. According to the Nuclear EnergyInstitute and the U.S. Department of Energy, a typical 1,000 MW nuclear facility in the United States needs just over 1 square mile to operate, whereaswind farms and solar plants respectively require 360 and 75 times more land area to produce the same electricity. Producing the same amount of power as atypical commercial nuclear reactor would require over 3 million solar panels or over 430 utility-scale wind turbines. This disparity highlights that nuclear iscurrently the only baseload, carbon-free solution of scale.
Current Carbon-Free Power Mix in Key States(a)
a) Source: 2020 U.S. Energy Information Administration data
Federal Policy Support for Nuclear Generation. Given the Administration’s aggressive goals for reducing emissions within the electric power
sector, policymakers have recognized the urgent need to prevent the retirement of nuclear power plants prior to the end of their licensed lives. Nuclearenergy provides 20 percent of the nation’s electricity and over 50 percent of the nation’s carbon free power. A dozen nuclear reactors have closed in recentyears, primarily as a result of economic challenges in merchant power markets. Representative Bill Pascrell (D-NJ) and Senator Ben Cardin (D-MD) haveintroduced legislation to provide a $15/megawatt hour production tax credit for merchant nuclear power plants. The amount of the PTC is decreased forplants with revenues exceeding $25/megawatt hour. The U.S. Treasury Department proposed an allocated production tax credit for nuclear plants as part oftheir annual “Green Book” compilation of tax priorities for the Administration. The outlook for this legislation is directly tied to action on legislationextending other clean energy tax credits and remains uncertain.
State Policy Support for Nuclear Generation. A number of states in which our nuclear facilities operate have established policies to support
nuclear generation. The supportive policies are driven by a number of factors, including recognition by governments and policy makers that existingnuclear generation facilities are essential to meeting policy objectives on reduction of GHG emissions, the desire to support jobs and regional economies,and the need to ensure reliability and security of the electrical grid through resource diversity.
Illinois Zero Emission Standard and Carbon Mitigation Credit Procurement. Pursuant to FEJA, on January 25, 2018, the ICC announced that our
Clinton Unit 1, Quad Cities Unit 1 and Quad Cities Unit 2 nuclear plants were selected as the winning bidders through the IPA's ZEC procurement event.We executed the ZEC procurement contracts with Illinois utilities, effective January 26, 2018, and began recognizing revenue with compensation for thesale of ZECs retroactive to the June 1, 2017 effective date of FEJA. The ZEC price was initially established at $16.50 per MWh of production, subject toannual future adjustments determined by the IPA for specified escalation and pricing adjustment mechanisms designed to lower the ZEC price based onincreases in underlying energy and capacity prices. Illinois utilities are required to purchase all ZECs delivered by the zero-emissions nuclear poweredgenerating facilities, subject to annual cost caps.
On September 15, 2021, Illinois Public Act 102-0662 was signed into law by the Governor of Illinois (“Clean Energy Law”). The Clean Energy
Law is designed to achieve 100% carbon-free power by 2045 to enable the state’s transition to a clean energy economy. The Clean Energy Law establishesdecarbonization requirements for Illinois as well as programs to support the retention and development of emissions-free sources of electricity. Amongother things, the Clean Energy Law authorizes the IPA to procure up to 54.5 million CMCs from qualifying nuclear plants for a five-year period beginningon June 1, 2022 through May 31, 2027. CMCs are credits for carbon-free attributes of eligible nuclear power plants in PJM. Our Byron, Dresden, andBraidwood nuclear plants located in Illinois will be eligible to participate in the CMC procurement process and, if awarded contracts, would be committedto operate through May 31, 2027. Selected generators will by December 3, 2021 contract directly with ComEd for the procurement of the CMCs basedupon the number of MWh produced annually by the eligible facilities, subject to specified caps and minimum performance requirements. The price to bepaid for each CMC will be determined through a competitive bidding process that includes consumer-protection measures that cap the maximumacceptable bid amount and reduce CMC prices by an energy price index, the base residual auction capacity price in the ComEd zone of PJM, and themonetized value of any federal tax credit or other subsidy if applicable. Regulatory or legal challenges regarding the validity or implementation of theClean Energy Law are possible and we cannot reasonably predict the outcome of any such challenges.
New Jersey Clean Energy Legislation. On May 23, 2018, New Jersey enacted legislation that established a ZEC program that provides
compensation for nuclear plants that demonstrate to the NJBPU that they meet certain requirements, including that they make a significant contribution toair quality in the state and that their revenues are insufficient to cover their costs and risks. Under the legislation, the NJBPU will issue ZECs to qualifyingnuclear power plants and the electric distribution utilities in New Jersey will be required to purchase those ZECs. On April 18, 2019, the NJBPU approvedthe award of ZECs to Salem 1 and Salem 2. On October 1, 2020, PSEG and Generation filed applications seeking ZECs for the second eligibility period(June 2022 through May 2025). On April 27, 2021 the NJBPU approved the award of ZECs to Salem 1 and Salem 2 for the second eligibility period, withthe subsidy extended at $10 per MWh.
60

New York Clean Energy Standard. On August 1, 2016, the NYPSC issued an order establishing the New York CES, a component of which is a
Tier 3 ZEC program targeted at preserving the environmental attributes of zero-emissions nuclear-powered generating facilities that meet the criteriademonstrating public necessity. The NYPSC has determined that our FitzPatrick, Ginna and Nine Mile Point nuclear facilities meet the criteria. The NewYork State Energy Research and Development Authority (NYSERDA) centrally procures the ZECs through a 12-year contract extending from April 1,2017 through March 31, 2029, administered in six two-year tranches. ZEC payments are made based upon the number of MWh produced by each facility,subject to specified caps and minimum performance requirements. The ZEC price for the first tranche was set at $17.48 per MWh of production and isadministratively determined using a formula based on the social cost of carbon as determined in 2016 by the federal government, subject to pricingadjustments designed to lower the ZEC price based on increases in underlying energy and capacity prices. Following the first tranche, the price will beupdated bi-annually. The ZEC price for the third tranche was set at $21.38 per MWh and took effect on April 1, 2021. The next update is scheduled tooccur on April 1, 2023. Each Load Serving Entity (LSE) is required to purchase an amount of ZECs from NYSERDA equivalent to its load ratio share ofthe total electric energy in the New York Control Area.
Electrification The push to reduce or eliminate GHG emissions could lead to acceleration of the electrification of the U.S. economy, including electrification of
transportation, industrial operations, heating and cooling, and appliances, which could materially increase demand for electricity. Widespread electrificationcould increase 2050 U.S. electricity consumption by between 20% and 38%. Higher demand for electricity will likely drive higher prices and benefit ourbusiness. We expect reliable, baseload nuclear power will be essential to meeting increased demand, well-positioning our fleet to benefit from theelectrification of the U.S. economy.
Although EV sales in North America are well behind Europe and China, increased policy support from the Biden administration, together with a
number of electric pickup trucks and SUVs, including hybrid EVs, hitting the market over the next five years will drive the U.S. market in 2021 andbeyond. Beginning in 2021, U.S. consumers will have a stronger EV lineup to choose from, including EVs from prominent producers like Tesla, Rivian,Nissan, Ford, Audi, GMC, Hyundai, and Volkswagen, among others. For example, in January 2021, General Motors announced a goal to phase out gas anddiesel-powered vehicles by 2035, which account for roughly 98% of their sales today. With over 90% of states offering incentives for setting up EVcharging infrastructure, U.S. EV market sales are projected to rise to 6.9 million units by 2025.
U.S. Passenger EV Charging Infrastructure Demand(a)
a) Source: Bloomberg NEF Electric Vehicle Outlook 2020. Note: BEV = Battery Electric Vehicle
61

U.S. EV Electricity Demand Outlook(a)
a) Source: Bloomberg NEF Electric Vehicle Outlook 2020. Note: BEV = Battery Electric Vehicle
Electrification of industrial processes, commercial equipment and residential appliances that currently run on fossil fuels will also play a role inincreasing the net demand for electricity. This trend is likely to be driven by increased corporate, investor, and customer focus on sustainability, as well asby an underlying need to increase efficiencies and manage operational costs. Electric systems tend to be relatively more efficient than existing systems,including having a higher performance lifetime and relatively superior design, yield, process controllability, and flexibility. As the costs of renewables,including energy storage, continue to decline, it is likely reducing energy and overhead costs will also be a driving factor towards the electrification ofindustrial processes and operations. Conversion of heating systems that currently run on gas and oil represents another potential source of increaseddemand for electricity. According to the International Energy Agency, heat makes up two-thirds of industrial energy demand, and almost one-fifth of globalenergy consumption, prompting efforts by energy companies and industrial manufacturers to electrify their thermal processes. For companies like us whosecore competency is safely generating and serving electricity and related products to its customers, this increasing trend toward electrification providesnatural growth opportunities.
U.S. Electricity Use by End-Use Sector | TWh(a)
a) Source: U.S. Energy Information Administration, Annual Energy Outlook 2021 (Feb 2021). Reflects the AEO2021 Reference Case.
62

Evolving Customer Preferences Evolving customer preferences that favor additional clean energy solutions, choice and access through increased digitization, will impact the
commercial power and natural gas (or energy) industry. Recent key trends include: (i) consumer preferences for additionality (i.e., meeting sustainabilitygoals by adding incremental renewable resources to the grid instead of utilizing existing spare capacity), (ii) the ability to be connected to, trace andvalidate the source of their green energy choices, (iii) value-add services and products around their energy usage, and (iv) the ability to buy, manage andmeasure their energy usage digitally. Today’s power markets provide the ability to offer more customized energy solutions and green products to betteraddress and serve the demands of customers today.
Under de-carbonization, customer preferences for additionality to meet sustainability goals through adding incremental renewable resources to thegrid will contribute to greater buildout of renewables. Consumers are also increasingly purpose-driven and knowledgeable of services that drive de-carbonization, leading them to value the ability to be connected to and trace the source of their clean energy choices. A third-party study found that 60% ofconsumers have become more aware of climate change since the start of the COVID-19 pandemic, with more than half of consumers likely to invest andupgrade to energy efficiency programs today than before.
Growing awareness of climate change and green energy helps drive customer interest in value-add services and products around their energy
usage, such as residential rooftop solar, EV charging, smart, energy-efficient home technologies, and the ability to choose 100 percent clean power incompetitive retail energy markets. Developments in power technology and automation mean that the relationship between the customer and theunderstanding of how they manage their energy is now more connected through digital applications. Increasingly, affordable technologies and the growingavailability of smart meter data are facilitating customers’ ability to make a range of unprecedented energy choices. A third-party study found that morethan half of customers are interested in time-of-use tariffs / flexible tariffs / demand-response options to increase cost savings by shifting their electricityconsumption from evenings to daytime / nights.
With the digitization of the broader economy, customers and businesses at each purchasing entry point level have increased desire for flexibility to
directly engage in their buy decisions electronically, as well as manage their energy usage digitally in real time. Digital marketplaces and monitoringsystems will facilitate greater control and opportunities for customers and businesses to more frequently engage with their energy providers and becomemore knowledgeable of their energy choices, including the products we provide.
Responding to these evolving customer preferences will facilitate continued innovation in the commercial power space and new opportunities for
providers to connect energy decision making more directly to the end-user.
63

OUR BUSINESS
Our Company is America’s leading clean energy company, based on the production of carbon-free electricity. We are the largest supplier of clean
energy and sustainable solutions to homes, businesses, public sector, community aggregations and a range of wholesale customers (such as municipalities,cooperatives, and other strategics) across the continental U.S., backed by more than 31,000 megawatts of generating capacity consisting of nuclear, wind,solar, natural gas and hydro assets. In 2020, the Company produced nearly 12% of the nation's carbon-free energy (based on generation output ofelectricity) according to published reports on energy delivery by the U.S. Energy Information Administration, making it an important partner to businessand state and local governments that are setting ambitious carbon-reduction goals and seeking long-term solutions to the climate crisis.
The Company is comprised of two primary business units: Constellation NewEnergy, Inc. and Exelon Generation Company, LLC. The combined
Company operates in 48 states, Canada and the U.K. and employs approximately 12,400 people. We believe shareholder value is built on a foundation of operational excellence and the pairing of our customer facing platform with our clean
energy fleet. We are committed to maintaining investment grade credit ratings. We are focused on optimizing cash returns through a disciplined approach tocost management and efficient operations, underpinned by stable and durable margins from our customer-facing business coupled with visible generationpayments associated with our clean energy attributes. We are committed to maintaining a strong balance sheet, to returning value to our shareholders(subject to approval by our Board of Directors) and to investing in clean energy solutions.
Our Operations
Customer-Facing Business: Constellation Constellation is one of the nation’s largest and most innovative energy suppliers, serving customers of all sizes through the U.S. Constellation is
active in all domestic wholesale power and gas markets that span the entire lower 48 states and has complementary retail activity across many of thosestates.
Constellation Retail has a Diverse Geographic Footprint
Power Supply Constellation is a leader in power supply serving 215 TWhs annually to a diverse geographic customer base, including utilities, municipality,
cooperatives, commercial, industrial, residential, public sector and three-fourths of the Fortune 100 companies. It is the largest retail commercial andindustrial power provider and the third largest residential power provider in the U.S., supplying approximately 145 TWh to business and public sectorcustomers and approximately 10 TWh to residential customers.
64

Power Load is Served Across Regions(a)
a) Includes retail and wholesale load auction volumes only. Other includes New England, South and West.
Constellation is Defined by Consistent Load, Enabling Durable, Stable Cash Flows(a)
a)Reflects retail load and wholesale load auction volumes as of December 31, 2020.
Constellation’s wholesale channel-to-market serves approximately 60 TWh of power load across competitive utility load procurements andbilateral sales to municipalities, coops, banks, and other wholesale entities. Complementary to its national portfolio, Constellation has several decades ofrelationships with wholesale counterparties across all domestic power markets as a means of both monetizing its own generation, as well as sourcingcontracted generation to meet customer and portfolio needs. With the increased trend toward customer demand for sustainability, this ability to sourcecontracted generation has provided a capital-light way for the Company to provide customers with the renewable products they are demanding to support acleaner energy ecosystem. This creates durable customer relationships and repeatable business through the ability to respond to customer and marketplacetrends. Similarly, this contracting acumen provides the ability to supplement our native generation with other non-renewable assets to meet changingportfolio needs in a balance sheet efficient manner.
Gas Supply Constellation is also a leader in gas supply serving 1,600 Bcf of gas annually to a wide range of residential, commercial, wholesale, and municipal
customers across many sectors, including manufacturing, services, public sector, transportation, and utilities. Because we have an integrated gas businessthat focuses not only on supplying customer needs, but also providing fuel for our power plants and sourcing Liquefied Natural Gas (LNG) for the EverettMarine LNG Import Terminal, we have strong capabilities across the entire natural gas value chain allowing us to optimize our portfolio to provide bothlow cost and customized solutions to our customers. Similarly, the scope of our natural gas business provides us wide geographic coverage across alldomestic natural gas markets.
65

In addition to providing energy management strategies that focus on more than just price, customers are able to focus on actively managing
costs, mitigating risk and supporting long-term budget certainty. Constellation’s gas managed products are designed to minimize volatility and achievebudget certainty over time, while providing customers the ability to create a structured plan that reduces the pressure to capture the lowest price to createprotection from volatility. It is the breadth of offerings, experience across the value chain, and customer and geographic diversity that contribute to therobust cash flows derived from the gas business. Constellation is committed to the ongoing sustainability needs of gas customers by providing renewableenergy products and solutions as options to reduce carbon emissions through Renewable Natural Gas (RNG) and Carbon Offsets for natural gasconsumption. Similarly, due to the tight interrelationship between natural gas and electricity markets, Constellation’s natural gas business also providesvaluable market intelligence useful to our overall business.
2020 Constellation Gas Sales by Market Sector and Customer Type
Customer Acquisition and Retention Constellation primarily serves C&I customers across the United States. These strong, proven customer relationships are a key part of our
customer-facing business strategy. High customer satisfaction levels, market expertise, stability and scale drive growth and result in historically-provenbusiness consistency and margins. Customer retention rates have been strong over the last five years across C&I power customer groups, with averagecontract terms of 25 months and customer duration of more than six years, with many customers beyond these metrics. Specifically, Constellation enjoyeda 79% C&I power, a 91% C&I gas, and 78% power and gas residential renewal rate in 2020, consistent with the previous four years, owing to both itscompetitive pricing as well as its strong customer relationships. Our consistently high renewal rates are driven by our ability to provide customizedsolutions and deliver focused attention to our customers’ needs, resulting in industry-leading customer satisfaction. Constellation is successful at acquiringnew customers by offering a diversity of innovative services and products, meeting customers where they are in the buying cycle. In addition to our highcustomer retention rates, we are able to acquire nearly one out of every three customers who have chosen to shop. While providing customers with the bestpossible price is a key focus, Constellation leverages its broad suite of electric and gas product structures, oftentimes customized, to provide customers withthe commodity solution that best fits their needs. It is this attention to the customer that creates the durable, repeatable value highlighted in these statistics.
Consumer purchasing strategies have trended from direct supply relationships to third party relationships with a growing number of customers
looking to third party consultants to find suppliers like Constellation to reduce costs and evaluate the increasing number of options available for expandingenergy solutions beyond commodity. Constellation has seen its third-party sourced business grow from approximately 42% of its C&I Power load to 64%between 2014 and 2020, and 20% of its C&I Gas load to 40% during the same period. In response, Constellation expanded its third-party capabilities,created scale through a comprehensive support structure, and enhanced digital applications providing tools, tracking and measurement as well as the abilityto extend the reach of Constellation’s sustainability services and products to drive additional market share.
66

Constellation Benefits From Strong Customer Relationships, with Leading C&I Renewal Rates
Energy Solutions As one of the largest customer-facing platforms in the U.S., Constellation benefits from significant economies of scale, which allow us to provide
our customers with competitively priced energy and to structure highly tailored solutions targeted to a customer’s unique power needs and clean energygoals. Our customer solutions include specialty power and gas products matching customers’ risk tolerance and risk management needs, energy efficiency,carbon free products for power and gas (RECs, EFECs, RINs, carbon offsets), energy usage and management solutions, among others. Our volumes acrossmultiple products and markets also provide us with unique market intelligence and expertise, including visibility into emerging trends and opportunities toidentify new revenue opportunities and to capture incremental margin. Similarly, the scale and scope of the portfolio provides risk-mitigating product andgeographic diversification. The scale of our industry-leading national platform also allows for quick and effective integration of new customers andacquisitions, accelerating the impact of strategic growth to the bottom-line.
Constellation is a leader in enabling a clean energy future for its customers through informative purchasing strategies that expand beyond power
and natural gas. Constellation partners with its customers to provide options along the sustainability continuum, including, renewable, efficiency andtechnology applications to meet their carbon free energy goals. Constellation offers a suite of services and products to its power and gas customers that canbe integrated into existing commodity purchasing strategies. Constellation is viewed as a center of excellence for customers looking to evaluate, understandand incorporate innovative solutions, products or technology into their existing energy strategy.
Constellation energy efficiency products provide the ability to optimize performance and maximize efficiency across customer facilities and
operations through attractive contract structures including implementation of energy efficiency upgrades at no upfront capital requirements. Additionally,these services provide scalable solutions to meet sustainability goals through investment across the life of the facility or operations and allow for budgetcertainty. The ongoing ability to optimize energy consumption for customers allows Constellation to support customer demands with the right combinationof technology and efficiency program options.
Constellation also offers Pear.ai, a smart utility expense management platform that helps customers proactively manage utility costs, understand
trends, and develop strategies to optimize spend and drive sustainability objectives. Pear.ai allows Constellation new avenues to incremental growth bycoupling the opportunities for customer usage optimization with accompanying products and solutions that Constellation can provide the customer.Services like Pear.ai allow Constellation to grow its customer base in previously inaccessible regulated markets through the offering of non-commodityenergy products.
Further, our CORe (Constellation Offsite Renewables) product serves C&I customer’s sustainability needs by matching contracted, third-party
renewable generation with customer desire for additional solutions and geographic preference. In addition to larger-scale CORe offerings, Constellationoffers a range of sustainability attribute solutions to its customers (RECs, EFECs, RINs, carbon offsets, etc.) in order to support their energy needs duringthe transition to a cleaner energy ecosystem.
67

Constellation Technology Ventures’ commercialization team collaborates with portfolio companies to deploy products and technologies across our
broad customer base to drive value for both Constellation and portfolio companies. Portfolio company solutions include electric vehicles and charginginfrastructure, sustainability monitoring and reporting tools, distributed energy resources and financing solutions, a web-based energy marketplace, andmore. For example, Constellation Technology Ventures’ commercialization of ChargePoint, a company providing a network of electric vehicle chargingstations, demonstrates our commitment to the electrification trend and immediately scalable channels-to-market for technology solutions to create value forour customers. Future growth will be driven from new and growing digital channels with a focus on innovative products aimed at clean energy solutions.New products and strategic investments will help our customers positively impact the environment, yield strong customer retention rates, and open upadditional revenue opportunities to supplement existing, economically beneficial products with solid margins.
Generation Generation operates the largest zero-carbon fleet in the nation and one of the largest generating fleets in the country. Generation’s nuclear fleet has current generating capacity of approximately 19 gigawatts and produced 150 terawatt hours of zero-emissions
electricity last year – enough to power 13.6 million homes and avoid more than 106 million metric tons of carbon emissions. Generation has ownershipinterests in thirteen nuclear generating stations currently in service, consisting of 23 units. Generation wholly owns all of its nuclear generating stations,except for undivided ownership interests in three jointly-owned nuclear stations, Quad Cities (75% ownership), Peach Bottom (50% ownership), and Salem(42.59% ownership), and Nine Mile Point Unit 2 (82% undivided ownership interest).
Generation will continue to be a leading advocate for clean energy policies aimed at preserving and growing clean energy to combat the climate
crisis. Generation operates the nation’s largest fleet of nuclear power plants and consistently operates at best in class levels. In 2020, Generation recorded
a capacity factor of 95.4%, second only to 2019 performance in fleet history, and an average refueling outage duration of 22 days, 11 days better than theindustry average. More broadly, the nuclear capacity factor has been approximately four percentage points better than the industry average annually since2013. Our stations exclude TMI located in Middletown, Pennsylvania, which permanently ceased generation operations on September 20, 2019 and OysterCreek located in Forked River, New Jersey, which permanently ceased generation operations on September 17, 2018 and was subsequently sold to HoltecInternational (Holtec) on July 1, 2019.
We operate more than 12 gigawatts of natural gas, oil, hydroelectric, wind, and solar generation assets, which provide a mix of baseload,
intermediate, and peak power generation. Our fossil and renewable fleet has similarly demonstrated a track record of strong performance with a 98.4%power dispatch match and 93.4% renewables energy capture.
68

Collectively, the combined fleet is nearly 90% carbon-free (based on generation output of electricity) and represents the fourth largest generation
portfolio in the U.S. in terms of total generation with meaningful geographic diversity. The charts below illustrate our supply source as of December 31, 2020:
Supply Source(a)(b)
a) Nuclear includes the proportionate share of output where Generation has an undivided ownership interest in jointly-owned generatingplants and includes the total output of plants that are fully consolidated.
b) Renewable includes wind, hydroelectric, solar, and biomass generating assets.
69

The following map illustrates the locations of our generation facilities as of March 31, 2021:
The Company’s Generation Fleet Map(a)
a) Note: One symbol is included per location. Some locations may have multiple generating units. Locations in tight geographicproximity may appear as one symbol. Units that are not currently operational are not captured.
Constellation employs an integrated, ratable hedging strategy to manage energy price volatility over time. As a policy, we hedge commodity risk
on a ratable basis over a rolling three-year period to reduce the financial impact of market price volatility. Constellation uses a combination of wholesaleand retail customer load sales, as well as non-derivative and derivative contracts, including financially-settled swaps, futures contracts and swap options,physical options and physical forward contracts, all with credit-approved counterparties, to hedge this anticipated exposure. The scale of our generationportfolio, along with its geographic proximity to our load, allows us to lean heavily on a generation-to-load matching strategy to structurally hedge energyprice risk. This helps to mitigate incremental collateral needs to serve load, while still allowing flexibility to serve and grow our customer business. As ofJune 30, 2021, the percentage of expected generation hedged for the Mid-Atlantic, Midwest, New York, and ERCOT reportable segments was 98%-101%for 2021. The Generation portfolio has enjoyed more than a decade of a risk-mitigated ratable hedging strategy, whereby the prompt three years are hedgedon an approximate rolling 90% / 60% / 30% basis, providing cash flow stability for its investors, while still allowing commercial opportunities to generatevalue for the enterprise. Constellation has been and will continue to be proactive in using hedging strategies to mitigate commodity price risk.
We have a scale presence in key markets, allowing us to operate integrated portfolios and capture operational synergies, including allocation of
fixed costs across a broader asset base, enhanced procurement opportunities, and diversity of cash flows. These advantages, in combination with a strongbalance sheet and significant liquidity, enable us to operate with more financial flexibility, and as such, optimize our competitive scale and operations.
Management
We have not yet finalized the composition of our Board or management following the separation. We will select the members of our Board andmanagement prior to the separation, and information concerning each member, such as biographies and the qualifications and experience each personwould bring to our Board or management, as the case may be, will be included in an amendment to the registration statement of which this informationstatement is a part.
70

Our Competitive Strengths
We believe that we are well-positioned to execute our business strategy and create superior value for stakeholders based on the followingcompetitive strengths:
· We are positioned to help address the climate crisis and lead to a clean energy future
As a Company, we are committed to a clean energy future, and we believe our generation fleet is essential to helping meet clean energy policy and
targets, at either the state or national level. Approximately 90% of our generation fleet energy output is emissions free (based on generation output), and wedo not own coal-fired generation. According to the July 2021 Benchmarking Air Emission report, our Company produces approximately 65% more cleanenergy than the next leading provider and more than 8 to 15 times the clean energy of independent power producer peers. Our fleet has the lowestemissions intensity – nearly five times less intensive than the next lowest generator.
Our generation fleet is essential to meeting federal and state clean energy goals. Generation produced 12% of the zero-carbon energy nationwide
and even more in the states we operate in – 95% in Maryland, 82% in Illinois, 38% in Pennsylvania and 33% in New York. Each state has setdecarbonization and clean energy targets. Losing any of our clean assets in these states would be a significant step backward for achieving any cleanenergy or climate goals while also creating higher costs for customers and significant economic hardship for our plant communities.
Generation Plays a Central Role in Enabling States’ Respective Clean Energy Goals(a) (b)
a) Source: 2020 U.S. Energy Information Administration data. Assumes whole unit output of CENG generation. Does not adjust for announcedretirements by Company at Byron and Dresden in Illinois and retirement by another operator of Indian Point 3 nuclear unit in New York. Note:Renewables includes hydroelectric, solar, and wind generation and excludes biomass. Reflects clean energy goals as outlined in the state’sexisting law or goal established by the state Governor.
b) Generation owns an 82% undivided ownership interest in Nine Mile Point Unit 2.
71

We believe these attributes are a clear advantage for us as the federal government and our states pursue policies that will address the climate crisis
and a clean energy future. The Company will continue to be a leading advocate for these clean policies aimed at preserving and growing clean energy. In addition to preserving the environmental value that our existing generating fleet provides, Constellation is committed to further development of
customer-focused products and capabilities that provide clean energy solutions across the power, gas, and broader energy solutions spaces. Whetherthrough venture investing via Constellation Technology Ventures, R&D efforts or expansion of our clean products for customers, commercialization ofmore mature technologies or leveraging our innovation culture, we will proactively drive a clean energy future with our customers.
· Industry-leading customer-facing business providing sustainability solutions for our customers
Geographic scale, diversity, customer-tailored product offerings and services and high customer satisfaction underpin our robust customer-facing
platform and allow us to partner with customers to solve their emerging needs on their clean energy goals in a differentiated way. Constellation is the largest customer facing platform in the U.S., which we view as a source of considerable competitive advantage. Our industry-
leading national platform not only allows us to capture operational efficiencies for more effective integration of new customers and acquisitions, but alsoallows for a scalable go-to-market approach. This allows for rapid deployment of new energy services and products and innovative energy technologyapplications that are responsive to marketplace trends and demands, improving our position for growth.
Constellation’s heavy customer concentration in the C&I retail space, coupled with high customer satisfaction, further differentiates the business
within the competitive landscape in its ability to provide repeatable, derisked value to the shareholder. Customer concentration in C&I enables morepredictable load and stable unit margins, lower customer acquisition costs, and insulation from weather driven volatility. Cash flows are further maximizedby high customer satisfaction levels resulting in business consistency, stable unit economics, and high win and renewal rates. Since 2016, the Company hasachieved retail renewal rates in excess of 70% (74-79% for C&I Power, 90-92% for C&I Gas), and the average customer duration has been six years.
Another advantage is Constellation’s industry leadership in consistently developing and providing clean energy and sustainability solutions for our
customers. Partnering with our customers to help them meet their environmental and sustainability goals provides us with solid margins, contributes tostrong customer retention rates, and opens up additional revenue opportunities.
· Best-in-class nuclear operations
Our world class operations result in industry-leading operating performance at our generation facilities. Our generation fleet has achieved an
industry-leading nuclear capacity factor of approximately 94% or higher since 2013, four percentage points better than the 2020 industry average ofapproximately 90%. Our 2020 average refueling outage duration was 22 days, 11 days better than the industry average.
72

Generation is Defined by Best-in-class Operating Performance
Nuclear Capacity Factor(a)
Average Nuclear Refueling Outage Days(b)
a) Reflects the Company’s ownership share of partially-owned units. Includes Fitzpatrick beginning in April of2017, and Oyster Creek and TMI partial year operation in 2018 and 2019, respectively. Excludes Salem and FortCalhoun. Industry average is for major operators excluding Generation and includes 3 months of Fitzpatrickprior to Generation’s acquisition.
b) Reflects partially-owned units at 100% ownership share. Includes Fitzpatrick beginning in 2018. Excludes
Salem. Industry average reflects nuclear refueling outage days as tracked by the Nuclear Energy Institute.
· Disciplined financial management focused on strong balance sheet and optimizing cash returns
Our continued commitment to investment grade credit ratings remains paramount as we prioritize capital allocation to support a strong balancesheet, invest in both clean energy solutions and our customer-facing businesses, and return value to shareholders. Our financial policy, focused on a prudenthedging strategy and effective cost management, provides us with financial flexibility, reduces the volatility of our cash flows and enables more efficientutilization of both working capital and collateral to operate the business through all cycles.
We view a strong balance sheet as a competitive strength in managing through periods of commodity price volatility with heightened agility. We
are focused on allocating available cash flow to manage leverage to meet investment grade targets with incremental cash flows allocated to investing inboth clean energy solutions and our customer-facing businesses and returning capital to shareholders. We believe a strong balance sheet and robust cashflow generation, combined with our current presence and scale in diverse markets, will position us favorably in pursuit of value-enhancing growthopportunities.
73

With high customer satisfaction, strong customer renewal and retention and best-in-class operating expertise, we are well-positioned to deliver
sustainable and durable cash flows. To further support cash flow, we will continue to focus on operational efficiencies and cost management while ensuringthe safety and reliability of our operations. In addition, our integrated and ratable hedging activities serve to manage commodity price volatility in energygross margins over time. Finally, state payments for our fleet’s carbon-free attributes and capacity payments provide visibility and consistency of cashflows. We believe the stability of our cash flow, coupled with our investment grade rating, provides a competitive advantage by improving resilience duringmarket fluctuations, decreasing reliance on external funding through low financial leverage and positioning the business for growth.
• Committed to supporting all stakeholders through a strong commitment to environmental, social and governance practices
We are committed to the highest standards of corporate governance to help us achieve our performance goals and to maintain the trust and
confidence of our shareholders, employees, customers, regulators and other stakeholders. Environmental, Social and Governance principles have been atthe core of our business since its original founding and will continue to be core to the Company.
We will continue to support our diverse employees, customers, communities and business partners, ensuring all are able to fully and equitably
participate in social, environmental and economic progress. We will maintain the highest standards of corporate governance, operating responsibly andtransparently with a continued focus on board refreshment and diversity.
Our Business Strategy
Our business strategy is to maximize value for all of our stakeholders through a particular emphasis on: Focus on cash returns, business optimization, robust customer revenues, and capital allocation We run our business with a focus on producing strong, robust cash flows in order to sustain our operations, maintain our investment grade credit
targets, and fund shareholder return and growth opportunities. We remain focused on operating efficiency and cost management, while ensuring safety andoperational excellence, to support stability in free cash flow generation.
We aim to achieve growth in cash flows from our customer facing business by increasing volumes and driving margin improvement across all
channels to market. Increasing volumes can come from organic and acquisitive customer growth, both in commodity offerings as well as reachingpreviously inaccessible customers through non-commodity energy services and solutions. Increasing margins are expected to come from value-addproducts, services, and analytics coupled with existing offerings. Additionally, customer loyalty increases with the number of products and services weprovide, contributing to repeatable, derisked cash flows. Constellation is a leader in enabling a clean energy future for its customers through informativepurchasing strategies that expand beyond power and natural gas, focused on renewable, efficiency and technology applications to meet their carbon freeenergy goals. We will continue to target growth in volumes through both organic growth channels and disciplined mergers and acquisitions. We canleverage our existing platform to achieve economies of scale benefits on incremental volumes, leading to higher overall margins per customer andimproved free cash flow conversion. Cash flows are further maximized by high customer satisfaction levels resulting in business consistency, stable uniteconomics, and high win and renewal rates. We will continue to manage cash flow volatility through prudent risk management strategies across thecustomer facing business, as described later in this document.
We also aim to achieve growth in cash flows from our generation business through a rigorous focus on operating performance and cost
optimization. We will continue to evaluate the cost-benefit analysis of all operating and capital allocation decisions to optimize value for our stakeholders,without sacrificing our commitment to safety. Further, our ratable hedging strategies, coupled with stable revenues generated through capacity markets andcontracts for zero emission attributes will enable the business to continue to mitigate cash flow volatility, while preserving long-term optionality to realizepotential upside from market price improvements and/or state and federal clean energy programs. In addition, we will continue advocating for clean energypolicies and seek fair compensation for the zero-carbon attributes of our nuclear plants while maintaining the discipline to retire uneconomic assets.
We will employ a disciplined approach to acquisitions that grows future cash flow and supports strategic initiatives. We will continue to evaluate
asset and business divestitures to rationalize the portfolio and optimize cash proceeds.
74

Capital allocation decisions are made on a cash return basis, as we believe this discipline is necessary to drive consistent long-term value creation
for our shareholders. We believe that our management team, reliable operating structure and strong commercial management enables us to deliversustainable cash flows to support the balance sheet, return value to our shareholders and invest in and grow the existing platform, while achieving attractivereturns on investment. In the years ahead, we expect to deliver substantial free cash flow supported by our stable customer facing business, disciplinedhedging strategy and effective cost management, with more than $1.1 billion of cost reductions realized since 2015.
Financial discipline and balance sheet commitment. We are committed to maintaining sufficient financial liquidity and an appropriate capital structure to support safe, secure and reliable operations,
even in volatile market conditions. We believe our investment grade credit rating is a source of competitive advantage, and we intend to continue tomaintain our credit position and best-in-class balance sheet. In line with that commitment, available cash flow will first be used to manage leverage tocomfortably meet investment grade credit targets, with incremental capital allocated towards shareholder return and disciplined growth.
Excellence in operations. Value is built on a foundation of operational excellence. We recognize operational efficiency, a culture of continuous improvement and disciplined
investment, and robust safety practices as critical drivers. We inherit robust safety programs from our predecessor company, and we have historically demonstrated a deep commitment through our
exceptional safety track record, underpinned by a strong compliance and risk management culture. At the Company, we have strong, durable relationshipswith our customers resulting in stable financial margins, underpinned by strong operational performance in our customer-facing business. Our retail powercustomer renewal rates have averaged 77% since 2016 and 91% for natural gas customer retention rates.
We will continue to evaluate the cost / benefit of all operating and capital allocation decisions to optimize value for our stakeholders. However,
above all, we will continue to prioritize safety, which is a core value for our organization. Taking the lead on driving toward a clean energy future. We are committed to enabling a clean energy future through our generation operations and our customer-facing business. Through our two
businesses, we aim to serve as an indispensable partner to businesses and the state and local governments that are setting ambitious carbon-reduction goalsand seeking long-term solutions to the climate crisis. We advocate for policies that address the climate crisis and preserve and grow clean energy.
We are differentiated by the cleanest generation fleet in the country. Since our generation fleet is nearly 90% emissions-free (based on generation
output), we would have minimal compliance costs compared to our peers.
75

Our Company is the Largest Producer of Clean Electricity in the U.S.(a)
a) Source: Benchmarking Air Emissions, July 2021, published by M.J. Bradley & Associates LLC. Reflects 2019 regulated and non-regulated
generation. Number in parentheses is the company’s generation ranking in that year.
As environmental sustainability continues to build momentum and grows for businesses across the country, the demand for clean and sustainableenergy solutions increases. Constellation offers clean products to help customers meet their sustainability goals. In addition to our current product offerings,we will innovate and develop new products to meet our customers’ needs.
For nearly two decades, our predecessor company was a strong advocate for policies that would address the climate crisis. We will continue to be
a leading advocate at the federal level and in our states for policies that will reduce greenhouse emissions, and preserve and grow clean energy.
Our Key Markets
We operate across various markets in the U.S., as well as Canada and the U.K. Our generation resources allow us to generate, procure and sellelectricity to retail and wholesale customers, highlighting the integrated nature of our business. We also have the ability to contract for generation in themarkets in which we operate, further facilitating our ability to match generation output to customer demand (gen-to-load) and customer-to-supply as anintegrated business. We have five reportable segments consisting of the Mid-Atlantic, Midwest, New York, Texas and Other Power Regions. These reflectthe following geographical areas:
· Mid-Atlantic: Eastern half of PJM, which includes New Jersey, Maryland, Virginia, West Virginia, Delaware, the District of Columbia, and parts
of Pennsylvania and North Carolina
· Midwest: Western half of PJM and the U. S. footprint of MISO, excluding MISO’s Southern Region.
· New York: NYISO
· Texas: ERCOT
· Other Power Regions: New England, South, West and Canada
76

Generation Markets At December 31, 2020, our interests in net electric generating capacity totaled 31,271 MW. Our supply sources by region are summarized below:
Supply Source (GWhs) 2020Nuclear Generation(a)
Mid-Atlantic 52,202Midwest 96,322New York 26,561
Total Nuclear Generation 175,085Fossil and Renewables
Mid-Atlantic 2,206Midwest 1,204New York 4ERCOT 11,982Other Power Regions 11,121
Total Fossil and Renewables 26,553Purchased Power
Mid-Atlantic 22,487Midwest 770ERCOT 5,636Other Power Regions 51,079
Total Purchased Power 79,972Total Supply/Sales by Region
Mid-Atlantic(b) 76,895Midwest(b) 98,332New York 26,565ERCOT 17,618Other Power Regions 62,200
Total Supply/Sales by Region 281,610 (a) Includes the proportionate share of output where Generation has an undivided ownership interest in jointly-owned generating plants and includes the
total output of plants that are fully consolidated.(b) Includes affiliate sales to PECO, BGE, Pepco, DPL, and ACE in the Mid-Atlantic region and affiliate sales to ComEd in the Midwest region.
Customer Markets Our integrated business also consists of the physical delivery and marketing of power and natural gas across multiple geographical regions through
Constellation, our customer-facing business. Constellation serves power and natural gas across all competitive markets, reaching approximately 2 millioncustomers, including three-fourths of the Fortune 100, approximately 216,500 business and public sector customers, and about 1.6 million uniqueresidential customers. Constellation also has a vibrant non-commodity element of its customer facing business, providing sustainability, efficiency andtechnology solutions to provide a comprehensive suite of energy solutions to meet customers’ growing and evolving needs.
77

Generation Resources
Nuclear Facilities. We have ownership interests in thirteen nuclear generating stations currently in service, consisting of 23 units with an aggregate of 18,880 MW of
capacity. These stations exclude TMI located in Middletown, Pennsylvania, which permanently ceased generation operations on September 20, 2019, andOyster Creek located in Forked River, New Jersey, which permanently ceased generation operations on September 17, 2018 and was subsequently sold toHoltec International (Holtec) on July 1, 2019. We wholly own all of our nuclear generating stations, except for undivided ownership interests in fourjointly-owned nuclear stations: Quad Cities (75% ownership), Peach Bottom (50% ownership), Salem (42.59% ownership) and Nine Mile Point Unit 2(82% ownership), which are consolidated in our financial statements relative to our proportionate ownership interest in each unit.
Our nuclear generating stations are all operated by Generation, with the exception of the two units at Salem, which are operated by PSEG Nuclear,
LLC (PSEG Nuclear), an indirect, wholly owned subsidiary of PSEG. In 2020, 2019 and 2018, electric supply (in GWh) generated from the nuclear generating facilities was 62%, 64% and 68%, respectively, of our
total electric supply, which also includes fossil, hydroelectric, and renewable generation and electric supply purchased for resale. Our wholesale and retailpower marketing activities are, in part, supplied by the output from the nuclear generating stations.
In May 2021, PJM conducted its first annual capacity auction since May 2018 and posted the results of the 2022/2023 Delivery Year auction on
June 2, 2021. All of Generation’s nuclear and fossil generation power plants located in the PJM market cleared in the auction, with the exception of theByron, Dresden and Quad Cities nuclear generation facilities. Despite also not clearing in the auction, the Quad Cities plant will continue to operate withsupport provided under the Illinois Future Energy Jobs Act, a clean energy law that took effect in 2017. The Minimum Offer Price Rule (MOPR) recentlyimplemented by PJM Interconnection, L.L.C. prevented Quad Cities from clearing in the capacity auction. The result is that customers in Northern Illinoisand throughout PJM will pay for more capacity from polluting generation instead of securing carbon-free megawatts from Quad Cities, at what would havebeen a lower cost absent the MOPR.
At the direction of the PJM Board of Managers, PJM and its stakeholders developed further MOPR reforms to ensure that the capacity market
rules respect and accommodate state resource preferences such as the ZEC programs. PJM filed related tariff revisions at FERC on July 30, 2021. OnSeptember 29, 2021, PJM’s proposed MOPR reforms become effective by operation of law. Under the new tariff provisions, the MOPR will no longerapply to any of our owned or jointly owned nuclear plants.
Nuclear Operations. Capacity factors, which are significantly affected by the number and duration of refueling and non-refueling outages, can
have a significant impact on our results of operations. Our generation operations from our nuclear plants have historically had minimal environmentalimpact and the plants have a safe operating history.
78

We manage our scheduled refueling outages to minimize their duration and to maintain high nuclear generating capacity factors, resulting in a
stable generation base for our wholesale and retail power marketing activities. During scheduled refueling outages, we perform maintenance and equipmentupgrades in order to minimize the occurrence of unplanned outages and to maintain safe, reliable operations. During 2020, 2019, and 2018, the nucleargenerating facilities operated by Generation, achieved capacity factors of 95.4%, 95.7%, and 94.6%, respectively, at ownership percentage.
In addition to the maintenance and equipment upgrades performed by us during scheduled refueling outages, we have extensive operating and
security procedures in place to ensure the safe operation of the nuclear units. We also have extensive safety systems in place to protect the plant, personnel,and surrounding area in the unlikely event of an accident or other incident.
Regulation of Nuclear Power Generation. Generation is subject to the jurisdiction of the NRC with respect to the operation of its nuclear
generating stations, including the licensing for operation of each unit. The NRC subjects nuclear generating stations to continuing review and regulationcovering, among other things, operations, maintenance, emergency planning, security, and environmental and radiological aspects of those stations. As partof its reactor oversight process, the NRC continuously assesses unit performance indicators and inspection results and communicates its assessment on asemi-annual basis. The NRC categorizes each nuclear unit into one of five performance bands. All nuclear units operated by Generation are categorized inthe Licensee Response Column (highest NRC performance band) except Clinton and FitzPatrick, which are in the Regulatory Response Column (secondhighest NRC performance band). The NRC may modify, suspend or revoke operating licenses and impose civil penalties for failure to comply with theAtomic Energy Act or the terms of the operating licenses. Changes in regulations by the NRC may require a substantial increase in capital expendituresand/or operating costs for nuclear generating facilities.
The generation of nuclear energy results in spent nuclear fuel (SNF). SNF generated by nuclear generating facilities is currently stored in storage
pools or in dry cask storage facilities. As a by-product of their operations, nuclear generating units also produce LLRW. LLRW is accumulated at eachgenerating station and permanently disposed of at licensed disposal facilities. The Federal Low-Level Radioactive Waste Policy Act of 1980 provides thatstates may enter into agreements to provide regional disposal facilities for LLRW and restrict use of those facilities to waste generated within the region.
Operation of nuclear generation is subject to liability, property damage and other risks associated with major incidents. NRC regulations require
that licensees of nuclear generating facilities demonstrate reasonable assurance that funds will be available in specified minimum amounts at the end of thelife of the facility to decommission the facility. The ultimate decommissioning obligation is expected to be funded by the NDTs.
Licenses. Generation has original 40-year operating licenses from the NRC for each of its nuclear units and has received 20-year operating license
renewals from the NRC for all its nuclear units except Clinton. PSEG has received 20-year operating license renewals for Salem Units 1 and 2. PeachBottom has received a second 20-year license renewal from the NRC for Units 2 and 3. On August 27, 2020, Generation announced that it intends topermanently cease generation operations at Byron in September 2021 and at Dresden in November 2021.
The following table summarizes the current license expiration dates for Generation’s operating nuclear facilities in service:
Station Unit In-Service
Date(a) Current License
Expiration Braidwood 1 1988 2046 2 1988 2047 Byron 1 1985 2044 2 1987 2046 Calvert Cliffs 1 1975 2034 2 1977 2036
79

Station Unit In-Service
Date(a) Current License
Expiration Clinton(b) 1 1987 2027 Dresden 2 1970 2029 3 1971 2031 FitzPatrick 1 1975 2034 LaSalle 1 1984 2042 2 1984 2043 Limerick 1 1986 2044 2 1990 2049 Nine Mile Point 1 1969 2029 2 1988 2046 Peach Bottom 2 1974 2053 3 1974 2054 Quad Cities 1 1973 2032 2 1973 2032 Ginna 1 1970 2029 Salem 1 1977 2036 2 1981 2040
(a) Denotes year in which nuclear unit began commercial operations. (b) Although timing has been delayed, Generation currently plans to seek license renewal for Clinton and has notified the NRC that any license renewal
application would not be filed until the first quarter of 2024. In 2019, the NRC approved a change of the operating license expiration for Clinton from2026 to 2027.
The operating license renewal process takes approximately four to five years from the commencement of the renewal process, which includes
approximately two years for Generation to develop the application and approximately two years for the NRC to review the application. Depreciationprovisions are based on the estimated useful lives of the stations, which reflect the first renewal of the operating licenses for all of Generation’s operatingnuclear generating stations except for Clinton, Peach Bottom, Byron, and Dresden. Clinton depreciation provisions are based on an estimated useful life of2027 which is the last year of the Illinois ZECs. Peach Bottom depreciation provisions are based on estimated useful life of 2053 and 2054 for Unit 2 andUnit 3, respectively, which reflects the second renewal of its operating licenses. Byron and Dresden depreciation provisions are based on the announcedshutdown dates of September 2021 and November 2021, respectively.
Nuclear Waste Storage and Disposal. There are no facilities for the reprocessing or permanent disposal of SNF currently in operation in the U.S.,
nor has the NRC licensed any such facilities. Generation currently stores all SNF generated by its nuclear generating facilities on-site in storage pools or indry cask storage facilities. Since Generation’s SNF storage pools generally do not have sufficient storage capacity for the life of the respective plant,Generation has developed dry cask storage facilities to support operations.
As of December 31, 2020, Generation had approximately 87,100 SNF assemblies (21,600 tons) stored on site in SNF pools or dry cask storage,
which includes SNF assemblies at Zion Station, for which Generation retains ownership even though the responsibility for decommissioning Zion Stationhas been assumed by another party, and TMI, which is no longer operational. See “—Decommissioning” below for additional information regarding ZionStation. All currently operating Generation-owned nuclear sites have on-site dry cask storage. TMI's on-site dry cask storage is projected to be in operationin 2021. On-site dry cask storage in concert with on-site storage pools will be capable of meeting all current and future SNF storage requirements atGeneration’s sites through the end of the license renewal periods and through decommissioning.
80

As a by-product of their operations, nuclear generating units produce LLRW. LLRW is accumulated at each generating station and permanently
disposed of at licensed disposal facilities. The Federal Low-Level Radioactive Waste Policy Act of 1980 provides that states may enter into agreements toprovide regional disposal facilities for LLRW and restrict use of those facilities to waste generated within the region. Illinois and Kentucky have enteredinto such an agreement, although neither state currently has an operational site and none is anticipated to be operational for the next ten years.
Generation ships its Class A LLRW, which represents 93% of LLRW generated at its stations, to disposal facilities in Utah and South Carolina,
which have enough storage capacity to store all Class A LLRW for the life of all stations in Generation's nuclear fleet. The disposal facility in SouthCarolina at present is only receiving LLRW from LLRW generators in South Carolina, New Jersey (which includes Salem) and Connecticut.
Generation utilizes on-site storage capacity at all its stations to store and stage for shipping Class B and Class C LLRW. Generation has a contract
through 2032 to ship Class B and Class C LLRW to a disposal facility in Texas. The agreement provides for disposal of all current Class B and Class CLLRW currently stored at each station as well as the Class B and Class C LLRW generated during the term of the agreement. However, because theproduction of LLRW from Generation’s nuclear fleet will exceed the capacity at the Texas site (3.9 million curies for 15 years beginning in 2012),Generation will still be required to utilize on-site storage at its stations for Class B and Class C LLRW. Generation currently has enough storage capacity tostore all Class B and Class C LLRW for the life of all stations in Generation’s nuclear fleet. Generation continues to pursue alternative disposal strategiesfor LLRW, including an LLRW reduction program to minimize on-site storage and cost impacts.
Nuclear Insurance. Generation is subject to liability, property damage and other risks associated with major incidents at all of its nuclear stations.
Generation has reduced its financial exposure to these risks through insurance and other industry risk-sharing provisions. Generation is self-insured to the extent that any losses may exceed the amount of insurance maintained or are within the policy deductible for its
insured losses. Such losses could have a material adverse effect on Generation’s and our future financial statements. Decommissioning. NRC regulations require that licensees of nuclear generating facilities demonstrate reasonable assurance that funds will be
available in specified minimum amounts at the end of the life of the facility to decommission the facility. The ultimate decommissioning obligation isexpected to be funded by the NDT funds.
Oyster Creek Decommissioning. On July 1, 2019, Generation completed the sale with Holtec and its indirect wholly owned subsidiary, Oyster
Creek Environmental Protection, LLC (OCEP), of Oyster Creek nuclear generating station under which OCEP has assumed the responsibility fordecommissioning that station.
Zion Station Decommissioning. On September 1, 2010, Generation completed an ASA with EnergySolutions, Inc. and its wholly owned
subsidiaries, EnergySolutions, LLC and ZionSolutions under which ZionSolutions has assumed responsibility for decommissioning Zion nucleargenerating station.
Fossil and Renewable Facilities (including Hydroelectric) We wholly own all of our fossil and renewable generating stations, with the exception of: Wyman; certain wind project entities and a biomass
project entity with minority interest owners; and EGRP, which is owned 49% by another owner. Our fossil and renewable generating stations are alloperated by us, with the exception of Wyman, which is operated by a third party. In 2020, 2019 and 2018, electric supply (in GWh) generated from ownedfossil and renewable generating facilities was 9%, 11% and 11%, respectively, of our total electric supply. The majority of this output was dispatched tosupport our wholesale and retail power marketing activities. On March 31, 2021, we closed an agreement to sell a significant portion of our solar business.
Licenses. Fossil and renewable generation plants are generally not licensed, and, therefore, the decision on when to retire plants is, fundamentally,
a commercial one. FERC has the exclusive authority to license most non-Federal hydropower projects located on navigable waterways or Federal lands, orconnected to the interstate electric grid, which include Conowingo Hydroelectric Project (Conowingo) and Muddy Run Pumped Storage Facility Project(Muddy Run). Muddy Run's license expires on December 1, 2055. On March 19, 2021, Generation received a new 50-year license for Conowingo.
81

Insurance. We maintain business interruption insurance for our renewable projects, but not for our fossil and hydroelectric operations unless
required by contract or financing agreements. We maintain both property damage and liability insurance. For property damage and liability claims for theseoperations, we are self-insured to the extent that losses are within the policy deductible or exceed the amount of insurance maintained. Such losses couldhave a material adverse effect on our future financial conditions and their results of operations and cash flows.
Contracted Generation In addition to energy produced by owned generation assets, we source electricity from plants we do not own under long-term contracts. The
following tables summarize our long-term contracts to purchase unit-specific physical power with an original term in excess of one year in duration, byregion, in effect as of December 31, 2020:
Region Number of
Agreements Expiration
Dates Capacity(MW)
Mid-Atlantic 8 2021 - 2032 183 Midwest 3 2021 - 2032 351 ERCOT 5 2021 - 2035 864 Other Power Regions 17 2021 - 2032 2,568 Total 33 3,966
2021 2022 2023 2024 2025 Thereafter Total Capacity Expiring (MW) 884 304 103 101 461 2,113 3,966
The following table shows sources of electric supply in GWh for 2020 and 2019:
Source of Electric Supply 2020 2019 Nuclear(a) 175,085 181,326 Purchases — non-trading portfolio 79,972 70,939 Fossil (primarily natural gas and oil) 19,501 21,554 Renewable(b) 7,052 7,777 Total supply 281,610 281,596
(a) Includes the proportionate share of output where Generation has an undivided ownership interest in jointly-owned generating plants and includes the
total output of plants that are fully consolidated. (b) Includes wind, hydroelectric, solar, and biomass generating assets.
The cycle of production and utilization of nuclear fuel includes the mining and milling of uranium ore into uranium concentrates, the conversionof uranium concentrates to uranium hexafluoride, the enrichment of the uranium hexafluoride, and the fabrication of fuel assemblies. Generation hasinventory in various forms and does not anticipate difficulty in obtaining the necessary uranium concentrates or conversion, enrichment, or fabricationservices to meet the nuclear fuel requirements of its nuclear units.
82

Natural gas is procured through long-term and short-term contracts, as well as spot-market purchases. Fuel oil inventories are managed so that in
the winter months sufficient volumes of fuel are available in the event of extreme weather conditions and during the remaining months to take advantage offavorable market pricing.
We use financial instruments to mitigate price risk associated with certain commodity price exposures, using both over-the-counter and exchange-
traded instruments.
Customers, Marketing and Price Risk Management
Constellation sells electricity and natural gas, including renewable energy and associated attributes, in competitive domestic energy markets toboth wholesale and retail customers. We leverage our generation portfolio to serve customers under both long-term and short-term contracts, as well as spotmarket sales. We also have the capability to contract for generation to meet customer and portfolio needs to complement our existing fleet in a capital light,de-risked way.
Power Marketing
Our integrated business operations include physical delivery and marketing of power and natural gas. We largely obtain physical power supplyfrom our owned and contracted generation in multiple geographic regions. The commodity risks associated with the output from owned and contractedgeneration is managed using various commodity transactions including sales to customers and our ratable hedging program. The main objective is to obtainlow-cost energy supply to meet physical delivery obligations to both wholesale and retail customers. We sell electricity, natural gas, and other energyrelated products and solutions to various customers, including distribution utilities, municipalities, cooperatives, and commercial, industrial, governmentaland residential customers in competitive markets.
Price and Supply Risk Management
Constellation uses a combination of wholesale and retail customer load sales, as well as non-derivative and derivative contracts, includingfinancially-settled swaps, futures contracts and swap options, and physical options and physical forward contracts, all with credit-approved counterparties,to hedge the price risk of the generation portfolio. The portfolio has enjoyed more than a decade of a risk-mitigated ratable hedging strategy, whereby theprompt 3 years are hedged on an approximate rolling 90%/60%/30% basis, providing cash flow stability for its investors while still allowing commercialopportunities to generate value for the enterprise. Constellation will continue to be proactive in using hedging strategies to mitigate commodity price.Similarly, the scale and scope of the portfolio provides risk-mitigating technology, product and geographic diversification.
The percentage of expected generation hedged is the amount of equivalent sales divided by the expected generation. Expected generation is the
volume of energy that best represents our commodity position in energy markets from owned or contracted generation based upon a simulated dispatchmodel that makes assumptions regarding future market conditions, which are calibrated to market quotes for power, fuel, load following products andoptions. Equivalent sales represent all wholesale and retail load sales, as well as hedging products, which include economic hedges and certain non-derivative contracts. A portion of our hedging strategy may be implemented through the use of fuel products based on assumed correlations between powerand fuel prices. The risk management group monitors the financial risks of the wholesale and retail power marketing activities. We also use financial andcommodity contracts for proprietary trading purposes, but this activity accounts for only a small portion of our efforts. The proprietary trading portfolio issubject to a risk management policy that includes stringent risk management limits.
Seasonality
Our operations are affected by weather, which affects demand for electricity and natural gas, as well as operating conditions. The market price forelectricity is also affected by changes in the demand for electricity and the available supply of electricity. With respect to the electric business, very warmweather in summer months and, with respect to the electric and natural gas businesses, very cold weather in winter months are referred to as “favorableweather conditions” because those weather conditions result in increased deliveries of electricity and natural gas. Conversely, mild weather reducesdemand. As a result, our operating results in the future may fluctuate substantially on a seasonal basis, especially when more severe weather conditionssuch as heat waves or extreme winter weather make such fluctuations more pronounced. The pattern of this fluctuation may change depending on the typeand location of the facilities owned, the retail load served and the terms of contracts to purchase or sell electricity.
83

Properties and Facilities
The following table presents Generation’s interests in net electric generating capacity by station at December 31, 2020:
Station(a) Location No. ofUnits
PercentOwned
(b) Primary Fuel Type
PrimaryDispatchType(c)
Net GenerationCapacity(MW)(d)
Midwest Braidwood Braidwood, IL 2 Uranium Base-load 2,386 Byron Byron, IL 2 Uranium Base-load 2,347(e)LaSalle Seneca, IL 2 Uranium Base-load 2,320 Dresden Morris, IL 2 Uranium Base-load 1,845(e)Quad Cities Cordova, IL 2 75 Uranium Base-load 1,403(f)Clinton Clinton, IL 1 Uranium Base-load 1,080 Michigan Wind 2 Sanilac Co., MI 50 51(g) Wind Intermittent 46(f)Beebe Gratiot Co., MI 34 51(g) Wind Intermittent 42(f)Michigan Wind 1 Huron Co., MI 46 51(g) Wind Intermittent 35(f)Harvest 2 Huron Co., MI 33 51(g) Wind Intermittent 30(f)Harvest Huron Co., MI 32 51(g) Wind Intermittent 27(f)Beebe 1B Gratiot Co., MI 21 51(g) Wind Intermittent 26(f)City Solar Chicago, IL 1 Solar Intermittent 9 Solar Ohio Toledo, OH 2 Solar Intermittent 4(h)Blue Breezes Faribault Co., MN 2 Wind Intermittent 3 CP Windfarm Faribault Co., MN 2 51(g) Wind Intermittent 2(f)Southeast Chicago Chicago, IL 8 Gas Peaking 296(i)Clinton BatteryStorage Blanchester, OH 1 Energy Storage Peaking 10 Total Midwest 11,911
84

Station(a) Location No. of Units
Percent Owned
(b) Primary Fuel Type
PrimaryDispatch Type(c)
Net GenerationCapacity (MW)(d)
Mid-Atlantic Limerick Sanatoga, PA 2 Uranium Base-load 2,317 Peach Bottom Delta, PA 2 50 Uranium Base-load 1,324(f)
Salem Lower AllowaysCreek Township, NJ 2 42.59 Uranium Base-load 995(f)
Calvert Cliffs Lusby, MD 2 50.01 (j) Uranium Base-load 895(f)Conowingo Darlington, MD 11 Hydroelectric Base-load 572 Criterion Oakland, MD 28 51(g) Wind Intermittent 36(f)Fair Wind Garrett County, MD 12 Wind Intermittent 30 Solar MC Various, MD 44 Solar Intermittent 44(h)Fourmile Ridge Garrett County, MD 16 51(g) Wind Intermittent 20(f)Solar New Jersey 1 Various, NJ 5 Solar Intermittent 18(h)Solar New Jersey 2 Various, NJ 2 Solar Intermittent 11(h)Solar Horizons Emmitsburg, MD 1 51(g) Solar Intermittent 16(f)Solar Maryland Various, MD 11 Solar Intermittent 8(h)Solar Maryland 2 Various, MD 3 Solar Intermittent 8(h)JBAB Solar District of Columbia 4 Solar Intermittent 7(h)Gateway Solar Berlin, MD 1 Solar Intermittent 7(h)Constellation NewEnergy Gaithersburg, MD 2 Solar Intermittent 6(h)Solar Federal Trenton, NJ 1 Solar Intermittent 5(h)
Solar New Jersey 3 Middle Township,NJ 5 51(g) Solar Intermittent 2(f)
Solar DC District of Columbia 1 Solar Intermittent 1(h)Muddy Run Drumore, PA 8 Hydroelectric Intermediate 1,070 Eddystone 3, 4 Eddystone, PA 2 Oil/Gas Peaking 760 Perryman Aberdeen, MD 5 Oil/Gas Peaking 404 Croydon West Bristol, PA 8 Oil Peaking 391 Handsome Lake Kennerdell, PA 5 Gas Peaking 268 Richmond Philadelphia, PA 2 Oil Peaking 98
85

Station(a) Location No. of Units
Percent Owned
(b) Primary Fuel Type
PrimaryDispatch Type(c)
Net GenerationCapacity (MW)(d)
Philadelphia Road Baltimore, MD 4 Oil Peaking 61 Eddystone Eddystone, PA 4 Oil Peaking 60 Delaware Philadelphia, PA 4 Oil Peaking 56 Southwark Philadelphia, PA 4 Oil Peaking 52 Falls Morrisville, PA 3 Oil Peaking 51
Moser Lower PottsgroveTwp., PA 3 Oil Peaking 51
Chester Chester, PA 3 Oil Peaking 39 Schuylkill Philadelphia, PA 2 Oil Peaking 30
Salem Lower AllowaysCreek Township, NJ 1 42.59 Oil Peaking 16(f)
Total Mid-Atlantic 9,729
Station(a) Location No. ofUnits
Percent Owned
(b) Primary Fuel Type
PrimaryDispatchType(c)
Net GenerationCapacity (MW)(d)
ERCOT Whitetail Webb County, TX 57 51(g) Wind Intermittent 47(f)
Sendero Jim Hogg andZapata County, TX 39 51(g) Wind Intermittent 40(f)
Constellation SolarTexas Various, TX 11 Solar Intermittent 13(h)Colorado Bend II Wharton, TX 3 Gas Intermediate 1,143 Wolf Hollow II Granbury, TX 3 Gas Intermediate 1,115 Handley 3 Fort Worth, TX 1 Gas Intermediate 395 Handley 4, 5 Fort Worth, TX 2 Gas Peaking 870 Total ERCOT 3,623
Station(a) Location No. ofUnits
PercentOwned
(b) Primary Fuel Type
Primary Dispatch Type(c)
NetGenerationCapacity(MW)(d)
New York Nine Mile Point Scriba, NY 2 50.01(j) Uranium Base-load 838(f)FitzPatrick Scriba, NY 1 Uranium Base-load 842 Ginna Ontario, NY 1 50.01(j) Uranium Base-load 288(f)Solar New York Bethlehem, NY 1 Solar Intermittent 3(h)Total New York 1,971
86

Station(a) Location No. of Units
PercentOwned
(b) Primary Fuel Type
PrimaryDispatchType(c)
NetGenerationCapacity(MW)(d)
Other Antelope Valley Lancaster, CA 1 Solar Intermittent 242 Bluestem Beaver County, OK 60 51 (g) (k) Wind Intermittent 101 (f)Shooting Star Kiowa County, KS 65 51 (g) Wind Intermittent 53 (f)Albany Green Energy Albany, GA 1 99 (l) Biomass Base-load 50 (f) (m)Solar Arizona Various, AZ 127 Solar Intermittent 46 (h)Bluegrass Ridge King City, MO 27 51 (g) Wind Intermittent 29 (f)California PV Energy 2 Various, CA 89 Solar Intermittent 27 (h)Conception Barnard, MO 24 51 (g) Wind Intermittent 26 (f)Cow Branch Rock Port, MO 24 51 (g) Wind Intermittent 26 (f)Solar Arizona 2 Various, AZ 56 Solar Intermittent 34 (h)California PV Energy Various, CA 53 Solar Intermittent 21 (h)Mountain Home Glenns Ferry, ID 20 51 (g) Wind Intermittent 21 (f)High Mesa Elmore Co., ID 19 51 (g) Wind Intermittent 20 (f)Echo 1 Echo, OR 21 50.49 (g) Wind Intermittent 17 (f)Sacramento PV Energy Sacramento, CA 4 51 (g) Solar Intermittent 30 (f)Cassia Buhl, ID 14 51 (g) Wind Intermittent 15 (f)Wildcat Lovington, NM 13 51 (g) Wind Intermittent 14 (f)Echo 2 Echo, OR 10 51 (g) Wind Intermittent 10 (f)Solar Georgia 2 Various, GA 8 Solar Intermittent 10 (h)Tuana Springs Hagerman, ID 8 51 (g) Wind Intermittent 9 (f)Solar Georgia Various, GA 10 Solar Intermittent 8 (h)Greensburg Greensburg, KS 10 51 (g) Wind Intermittent 6 (f)Solar Massachusetts Various, MA 10 Solar Intermittent 7 (h)Outback Solar Christmas Valley, OR 1 Solar Intermittent 6 (h)Echo 3 Echo, OR 6 50.49 (g) Wind Intermittent 5 (f)Holyoke Solar Various, MA 2 Solar Intermittent 5 (h)Three Mile Canyon Boardman, OR 6 51 (g) Wind Intermittent 5 (f)
87

Loess Hills Rock Port, MO 4 Wind Intermittent 5 California PV Energy 3 Various, CA 31 Solar Intermittent 8 (h)Denver Airport Solar Denver, CO 1 51 (g) Solar Intermittent 4 (f)Solar Net Metering Uxbridge, MA 1 Solar Intermittent 2 (h)Solar Connecticut Various, CT 1 Solar Intermittent 1 (h)Mystic 8, 9 Charlestown, MA 6 Gas Intermediate 1,413 (e)Hillabee Alexander City, AL 3 Gas Intermediate 753 Mystic 7 Charlestown, MA 1 Oil/Gas Intermediate 512 (n)Wyman 4 Yarmouth, ME 1 5.9 Oil Intermediate 35 (f)Grand Prairie Alberta, Canada 1 Gas Peaking 105 West Medway West Medway, MA 3 Oil Peaking 124 West Medway II West Medway, MA 2 Oil/Gas Peaking 192 Framingham Framingham, MA 3 Oil Peaking 31 Mystic Jet Charlestown, MA 1 Oil Peaking 9 (n)Total Other 4,037
Total 31,271
(a) All nuclear stations are boiling water reactors except Braidwood, Byron, Calvert Cliffs, Ginna, and Salem, which are pressurized water reactors.(b) 100%, unless otherwise indicated.(c) Base-load units are plants that normally operate to take all or part of the minimum continuous load of a system and, consequently, produce electricity
at an essentially constant rate. Intermittent units are plants with output controlled by the natural variability of the energy resource rather thandispatched based on system requirements. Intermediate units are plants that normally operate to take load of a system during the daytime higher loadhours and, consequently, produce electricity by cycling on and off daily. Peaking units consist of lower-efficiency, quick response steam units, gasturbines and diesels normally used during the maximum load periods.
(d) For nuclear stations, capacity reflects the annual mean rating. Fossil stations and wind and solar facilities reflect a summer rating.(e) Generation has announced it will permanently cease generation operations at Byron and Dresden nuclear facilities in 2021 and Mystic Unit 8 and 9 in
2024. See Note 7 — Early Plant Retirements of the Notes to the Consolidated Financial Statements for additional information.(f) Net generation capacity is stated at proportionate ownership share.(g) Reflects the prior sale of 49% of EGRP to a third party. See Note 21 — Variable Interest Entities of the Notes to Consolidated Financial Statements for
additional information.(h) On December 8, 2020, Generation entered into an agreement with an affiliate of Brookfield Renewable, for the sale of a significant portion of
Generation's solar business. The transaction was completed on March 31, 2021. See Note 2 — Mergers, Acquisitions, and Dispositions of the Notes tothe Consolidated Financial Statements for additional information.
(i) Generation has deactivated the site and is evaluating for potential return of service or retirement beyond 2021.(j) Reflects Generation’s interest in CENG, a joint venture with EDF, as of December 31, 2020. On August 6, 2021, Generation and EDF entered into a
settlement agreement pursuant to which Generation, through a wholly owned subsidiary, purchased EDF’s equity interest in CENG.(k) EGRP owns 100% of the Class A membership interests and a tax equity investor owns 100% of the Class B membership interests of the entity that
owns the Bluestem generating assets.(l) Generation directly owns a 50% interest in the Albany Green Energy station and an additional 49% through the consolidation of a Variable Interest
Entity.(m) On April 28, 2021, Constellation Holdings, LLC, a subsidiary of Generation, entered into a purchase agreement to sell Generation’s interest in the
Albany Green Energy biomass. Completion of the transaction is expected in the second half of 2021 and is subject to various customary closingconditions.
(n) Generation has plans to retire and cease plant operations in 2021.
88

The net generation capability available for operation at any time may be less due to regulatory restrictions, transmission congestion, fuel
restrictions, efficiency of cooling facilities, level of water supplies, or generating units being temporarily out of service for inspection, maintenance,refueling, repairs, or modifications required by regulatory authorities.
Generation maintains property insurance against loss or damage to its principal plants and properties by fire or other perils, subject to certain
exceptions. For additional information regarding nuclear insurance of generating facilities, see Note 19 – Commitments and Contingencies of the Notes toConsolidated Financial Statements. Generation is self-insured to the extent that any losses are within the policy deductible or exceed the amount ofinsurance maintained. Any such losses could have a material adverse effect in Generation’s consolidated financial condition or results of operations.
Employees
At the time of the separation, we expect to have up to 13,000 employees, of which are full-time. As of December 31, 2020, approximately 3,418 employees are covered by 22 collective bargaining agreements. The terms of the collective
bargaining agreements expire at various times and some may be subject to negotiations before the separation. Engaged Workforce We believe our employees are our greatest assets. We strive to create a workplace that is diverse, innovative, and safe for our employees. In order
to provide the services and products that our customers expect, we must create the best teams. These teams must reflect the diversity of the communitiesthat we serve. Therefore, we endeavor to attract highly qualified and diverse talent and routinely review hiring and promotion practices to ensure equitableand bias free processes are maintained to neutralize unconscious bias.
Exelon undertakes an extensive employee engagement survey every other year to help identify successes and opportunities for growth. In
2019, 81% of all Generation employees responded to the survey, and of those who responded, 78% indicated they were proud to work at Generation and88% indicated they were proud of Generation’s involvement in the community.
Career Development We provide growth opportunities, competitive compensation and benefits, and a variety of training and development programs. We are committed
to helping employees grow their skills and careers largely through training opportunities in technical, safety and business acumen areas, mentorshipprograms, and continuous feedback and development discussions and evaluations to develop a diverse talent pipeline for future jobs through training andmentoring programs. We understand that continued education leads to a more engaged, skilled and productive workforce and we support our employees intheir educational endeavors in order to attract and retain people who are committed to personal and professional development by offering tuitionreimbursement for approved higher education, certification or licensing courses.
Next Generation of Talent We are also committed to exposing young people within our communities to career opportunities in the energy industry. Through internships,
university and veteran recruiting, STEM programs, and partnerships with organizations such as the Society of Women Engineers and the National Societyof Black Engineers, we are committed to providing professional development and opportunities for the next generation of our workforce. Major focus areasinclude:
· Creating the right STEM and vocational education and awareness among young people in our areas;
· Reducing or removing educational barriers and obstacles faced by young people and underrepresented and underserved members of the
community; and
· Deepening current and executing new approaches and partnerships with employers, nonprofits, and community groups to expand training andjob opportunities for work-ready adults and youth.
89

Well-Being and Benefits Our employees are encouraged to thrive outside the workplace as well. We provide a full suite of wellness benefits targeted at supporting work-life
balance, physical, mental, and financial health. In light of the COVID-19 pandemic, our employees also received the following additional benefits: · 100% coverage of all in-network medical expenses associated with COVID-19 testing and treatment through June 2021;
· Paid time off to receive the COVID-19 vaccine; and
· Extended back-up child and elder care benefits through September 2020.
Community We are also committed to helping improve the quality of life for people in the communities where we live, work and serve. We provide
opportunities for company-sponsored volunteerism. Even in pandemic conditions, our employees donated over $5.1 million to non-profit organizations. Additionally, our employees provided nearly 50,000 hours of volunteering in 2020.
Turnover Rates. As turnover is inherent, management succession planning is performed and tracked for all executives and critical key manager
positions. Management frequently reviews succession planning to ensure we are prepared when positions become available. The table below shows the average turnover rate for all employees for the last three years of 2018 to 2020:
Retirement Age 4.80%Voluntary 3.88%Non-Voluntary 0.86%
Diversity Metrics. The following tables show diversity metrics for all employees and management as of December 31, 2020:
Employees Generation Female(a) (b) 2,492 People of Color(b) 2,083 Aged <30 1,363 Aged 30-50 6,712 Aged >50 4,407 Total Employees(c) 12,482
90

Management(d) Generation Female(a) (b) 299 People of Color(b) 220 Aged <30 51 Aged 30-50 1,220 Aged >50 841 Within 10 years of retirement eligibility 1,113 Total Employees in Management(c) 2,112
(a) We are devoted to creating an environment that allows women to stay in the workforce, grow with the company, and move up the ranks, all with parityof pay. We employ an independent third-party vendor to run regression analysis on all management positions each year. The analysis consistentlyshows that we have no systemic pay equity issues.
(b) This is based on self-disclosed information.(c) Total employees represents the sum of the aged categories.(d) Management is defined as executive/senior level officials and managers as well as all employees who have direct reports and supervisory
responsibilities. Environmental Matters
We are subject to comprehensive and complex environmental legislation and regulation at the federal, state, and local levels, includingrequirements relating to climate change, air and water quality, solid and hazardous waste, and impacts on species and habitats.
Our board of directors is responsible for overseeing the management of environmental matters. Performance of those individuals directly involved
in environmental compliance and strategy is reviewed and affects compensation as part of the annual individual performance review process.
Climate Change Mitigation We support comprehensive federal climate legislation that addresses the climate crisis and would ensure the country meets the targets set by the
Paris Climate Accord. In the absence of comprehensive federal legislation, we support the EPA moving forward with meaningful regulation of GHGemissions under the Clean Air Act.
We are currently subject to, and may become subject to additional, federal and/or state legislation and/or regulations addressing GHG emissions.
We produce electricity predominantly from low- and zero-carbon generating facilities (such as nuclear, hydroelectric, natural gas, wind, and solar PV) andneither own nor operate any coal-fueled generating assets. Our natural gas and biomass fired generating plants produce GHG emissions, most notably CO2.However, our owned-asset emission intensity, or rate of carbon dioxide equivalent (CO2e) emitted per unit of electricity generated, is among the lowest inthe industry. In addition, we sell natural gas at retail; and consumers’ use of such natural gas produces GHG emissions.
International Climate Change Agreements. At the international level, the United States is a party to the United Nations Framework Convention
on Climate Change (UNFCCC). The Parties to the UNFCCC adopted the Paris Agreement at the 21st session of the UNFCCC Conference of the Parties(COP 21) on December 12, 2015. Under the Agreement, which became effective on November 4, 2016, the parties committed to try to limit the globalaverage temperature increase and to develop national GHG reduction commitments. The Biden administration has announced a new target of 50-52 percentreduction in U.S. Greenhouse Gas Pollution from 2005 levels by 2030. In order to achieve this target and maintain high standards of reliability, the U.S.will need a reliable baseload of zero-carbon generating electricity sources, which our nuclear fleet helps provide.
Federal Climate Change Legislation and Regulation. It is highly uncertain whether federal legislation to significantly reduce GHG emissions
will be enacted in the near-term. If such legislation were adopted, it would likely increase the value of our low-carbon fleet even though we may incur costseither to further limit or offset the GHG emissions from its operations or to procure emission allowances or credits. Continued inaction could negativelyimpact the value of our low-carbon fleet.
The Clean Power Plan and Affordable Clean Energy Rule. The EPA’s 2015 Clean Power Plan (CPP) established regulations addressing carbon
dioxide emissions from existing fossil-fired power plants under Clean Air Act Section 111(d). The CPP’s carbon pollution limits could be met throughchanges to the electric generation system, including shifting generation from higher-emitting units to lower- or zero-emitting units, as well as thedevelopment of new or expanded zero-emissions generation. In July 2019, the EPA published its final Affordable Clean Energy rule, which repealed theCPP and replaced it with less stringent emissions guidelines for existing fossil-fired power plants based on heat rate improvement measures that could beachieved within the fence line of individual plants. Exelon, together with a coalition of other electric utilities, filed a lawsuit in the D.C. Circuit Court onSeptember 6, 2019, challenging the Affordable Clean Energy rule as unlawful. This lawsuit was consolidated with separate challenges to the AffordableClean Energy rule filed by various states, non-governmental organizations, and business coalitions. On January 19, 2021, the D.C. Circuit Court held theAffordable Clean Energy Rule to be unlawful, vacated the rule, and remanded it to the EPA. The EPA has indicated it will promulgate new GHG limits forexisting power plants in accordance with the D.C. Circuit Court's order.
91
State Climate Change Legislation and Regulation. A number of states in which we operate have state and regional programs to reduce GHG
emissions and renewable and other portfolio standards, which impact the power sector. See discussion below for additional information on renewable andother portfolio standards. As the nation’s largest generator of carbon-free electricity, our fleet supports these efforts to produce safe, reliable electricity withminimal GHGs.
On September 15, 2021, Illinois Public Act 102-0662 was signed into law by the Governor of Illinois. The Clean Energy Law is designed to
achieve 100% carbon-free power by 2045 to enable the state’s transition to a clean energy economy. The Clean Energy Law establishes decarbonizationrequirements for Illinois as well as programs to support the retention and development of emissions-free sources of electricity. See “Overview of the U.S.Power Markets – Key Drivers – Policy Support for Nuclear Energy – Illinois Zero Emission Standard and Carbon Mitigation Credit Procurement” abovefor more information.
Eleven northeast and mid-Atlantic states (Connecticut, Delaware, Maine, Maryland, Massachusetts, New Hampshire, New Jersey, New York,
Rhode Island, Vermont and Virginia) currently participate in the RGGI, which is in the process of strengthening its requirements. The program requiresmost fossil fuel-fired power plants in the region to hold allowances, purchased at auction, for each ton of CO2 emissions. Non-emitting resources do nothave to purchase or hold these allowances. In October 2019, the Governor of Pennsylvania issued an Executive Order directing the PA DEP to begin arulemaking process to allow Pennsylvania to join the RGGI, with the goal of reducing carbon emissions from the electricity sector. On November 7, 2020,the PA DEP proposed its rule.
Broader state programs impact other sectors as well, such as New York’s Climate Leadership and Community Protection Act, which establishes
statewide emission limits; and Massachusetts’ Clean Energy and Climate Plan, which aims to reduce GHG emissions across all sectors through increasedefficiency in buildings and vehicles, the electrification of vehicles and thermal conditioning in buildings, and the replacement of carbon intensive fuels withrenewable energy sources.
While we cannot predict the nature of future regulations or how such regulations might impact future financial statements, we have a low emission
portfolio, and GHG restrictions would likely benefit zero- and low-emission generating units relative to higher-emission fossil fuel-fired generating units. In addition, our facilities and operations are subject to the global impacts of climate change. We believe our operations could be significantly
affected by the physical risks of climate change. See “Risk Factors” beginning on page 21 of this information statement for additional information. Renewable and Clean Energy Standards Thirty states and the District of Columbia, incorporating the vast majority of states where we operate, have adopted some form of renewable or
clean energy procurement requirement. These standards impose varying levels of mandates for procurement of renewable or clean electricity (the definitionof which varies by state) and/or energy efficiency. These are generally expressed as a percentage of annual electric load, often increasing by year. We ownmultiple facilities participating in these programs within states that have adopted standards targeted at preserving the zero-carbon attributes of certainnuclear-powered generating facilities, including Illinois, New York, and New Jersey. Other states in which we operate are considering similar programs.See Note 3 — Regulatory Matters of the Notes to Consolidated Financial Statements for additional information.
Air Quality Mercury and Air Toxics Standards (MATS). In 2011, the EPA signed a final rule, known as MATS, to reduce emissions of hazardous air pollutants
from power plants. MATS requires coal-fired power plants to achieve high removal rates of mercury, acid gases, and other metals, and to make capitalinvestments in pollution control equipment and incur higher operating expenses. In 2016, in response to a Supreme Court decision requiring the EPA toconsider costs in determining whether it was appropriate and necessary to regulate power plant emissions of hazardous air pollutants, the EPA issued asupplemental finding that, after considering costs, it remained appropriate and necessary. On May 22, 2020, the EPA reversed course, publishing a finalrule revoking the "appropriate and necessary" finding underpinning MATS. A coal mining company filed a lawsuit in the D.C. Circuit Court seekingvacatur of MATS based on the EPA’s May 22, 2020 finding; on September 11, 2020, the D.C. Circuit Court granted a motion by Exelon and two otherentities to intervene in that lawsuit to defend MATS, and on September 28, 2020, the D.C. Circuit Court issued an Executive Order holding this portion ofthe MATS litigation in abeyance. On July 21, 2020, Exelon and two other entities filed a lawsuit in the D.C. Circuit Court challenging the EPA’s May 22,2020 rescission of the appropriate and necessary finding underpinning MATS. This portion of the case is also being held in abeyance in response to theDOJ’s motion filed February 12, 2021. On January 20, 2021, President Biden issued an Executive Order directing the EPA to reconsider its May 22, 2020rescission by August 2021; the EPA is expected to re-affirm the finding that it is appropriate and necessary to regulate power plant emissions of hazardousair pollutants. As a result, this litigation is likely to be rendered moot, and MATS will likely remain in place in the interim.
92

Water Quality Under the federal Clean Water Act, NPDES permits for discharges into waterways are required to be obtained from the EPA or from the state
environmental agency to which the permit program has been delegated, and permits must be renewed periodically. Certain of our facilities dischargestormwater, industrial wastewater, and/or cooling water into waterways and are therefore subject to these regulations and operate under NPDES permits.
Clean Water Act Section 316(b) is implemented through the NDPES program and requires that the cooling water intake structures at electric
power plants reflect the best technology available to minimize adverse environmental impacts. Our power generation facilities with cooling water intakesystems are subject to the EPA’s Section 316(b) regulations finalized in 2014; the regulation’s requirements have been or will be addressed through renewalof these facilities’ NPDES permits. Until the compliance requirements are determined by the applicable state permitting director on a site-specific basis foreach plant, we cannot estimate the effect that compliance with the EPA’s 2014 rule will have on the operation of its generating facilities and its financialstatements. Should a state permitting director determine that a facility must install cooling towers to comply with the rule, that facility’s economic viabilitycould be called into question. However, the final rule does not mandate cooling towers and allows state permitting directors to require alternative, lesscostly technologies and/or operational measures, based on a site-specific assessment of the feasibility, costs, and benefits of available options.
On July 28, 2016, the NJDEP issued a final permit for Salem that did not require the installation of cooling towers and allows Salem to continue to
operate utilizing the existing cooling water system with certain required system modifications. However, the permit is being challenged by anenvironmental organization, and if successful, could result in additional costs for Clean Water Act compliance. Potential cooling water system modificationcosts could be material and could adversely impact the economic competitiveness of this facility.
Under Clean Water Act Section 404 and state laws and regulations, we may be required to obtain permits for projects involving dredge or fill
activities in Waters of the United States. Where our facilities are required to secure a federal license or permit for activities that may result in a discharge to covered waters, we may be
required to obtain a state water quality certification for those facilities under Clean Water Act section 401. We are also subject to the jurisdiction of the Delaware River Basin Commission and the Susquehanna River Basin Commission, regional agencies
that primarily regulate water usage. Solid and Hazardous Waste and Environmental Remediation CERCLA provides for response and removal actions coordinated by the EPA in the event of threatened releases of hazardous substances and
authorizes the EPA either to clean up sites at which hazardous substances have created actual or potential environmental hazards or to order personsresponsible for the situation to do so. Under CERCLA, generators and transporters of hazardous substances, as well as past and present owners andoperators of hazardous waste sites, are strictly, jointly and severally liable for the cleanup costs of hazardous waste at sites, many of which are listed by theEPA on the National Priorities List (NPL). These PRPs can be ordered to perform a cleanup, can be sued for costs associated with an EPA-directed cleanup,may voluntarily settle with the EPA concerning their liability for cleanup costs, or may voluntarily begin a site investigation and site remediation understate oversight. Most states have also enacted statutes that contain provisions substantially similar to CERCLA. Such statutes apply in many states wherewe currently own or operate, or previously owned or operated, facilities, including Delaware, Illinois, Maryland, New Jersey, and Pennsylvania and theDistrict of Columbia. In addition, RCRA governs treatment, storage and disposal of solid and hazardous wastes and cleanup of sites where such activitieswere conducted.
Our operations have in the past, and may in the future, require substantial expenditures in order to comply with these Federal and state
environmental laws. Under these laws, we may be liable for the costs of remediating environmental contamination of property now or formerly owned byus and of property contaminated by hazardous substances generated by us. We own or lease a number of real estate parcels, including parcels on which ouroperations or the operations of others may have resulted in contamination by substances that are considered hazardous under environmental laws. We andour subsidiaries are, or could become in the future, parties to proceedings initiated by the EPA, state agencies, and/or other responsible parties underCERCLA and RCRA or similar state laws with respect to a number of sites or may undertake to investigate and remediate sites for which they may besubject to enforcement actions by an agency or third-party.
93

As of December 31, 2020, we have established appropriate contingent liabilities for environmental remediation requirements. In addition, we may
be required to make significant additional expenditures not presently determinable for other environmental remediation costs. See Note 3 — RegulatoryMatters and Note 19 — Commitments and Contingencies of the Notes to Consolidated Financial Statements for additional information regarding ourenvironmental matters, remediation efforts, and related impacts to our Consolidated Financial Statements.
Legal Proceedings
We are parties to various lawsuits and regulatory proceedings in the ordinary course of our business. For information regarding material lawsuitsand proceedings, see Note 3 – Regulatory Matters and Note 19 – Commitments and Contingencies of the Notes to Consolidated Financial Statements. Suchdescriptions are incorporated herein by these references.
94

MANAGEMENT’S DISCUSSION AND ANALYSIS OF
FINANCIAL CONDITION AND RESULTS OF OPERATIONS
Company Overview
Our integrated business consists of the generation, physical delivery, and marketing of power across multiple geographical regions through ourcustomer-facing business, Constellation, which sells electricity and natural gas to both wholesale and retail customers and the production and sale of powerthrough our competitive power generation business, Generation. We also sell renewable energy and other energy-related products and services. We havefive reportable segments consisting of the Mid-Atlantic, Midwest, New York, ERCOT, and Other Power Regions. For a more detailed description of thebusiness, see "Summary" and "Our Business," which are included elsewhere within this information statement.
The Separation
On February 21, 2021, Exelon’s board of directors authorized management to pursue a plan to separate its competitive generation and customer-facing businesses into a stand-alone publicly traded company, which we refer to as the separation in this information statement. The separation will occurthrough a distribution to Exelon’s shareholders of all of the shares of common stock of the Company, which will own Generation, including its competitivegeneration, customer-facing power and gas supply, and related businesses. Following the distribution, Exelon shareholders will own 100% of the shares ofour common stock. For a more detailed description of the separation, see “Summary” and "The Separation," which are included elsewhere within thisinformation statement.
Significant 2020 and 2021 Transactions and Developments
COVID-19 We have taken steps to mitigate the potential risks posed by the global outbreak (pandemic) of COVID-19. We provide a critical service to our
customers which means that it is paramount that we keep our employees who operate our businesses safe and minimize unnecessary risk of exposure to thevirus. We have taken extra precautions for our employees who work in the field and for employees who continue to work in our facilities. We haveimplemented work from home policies where appropriate, and imposed travel limitations on our employees. In addition, we have updated our existingbusiness continuity plan in the context of this pandemic.
We continue to implement strong physical and cyber-security measures to ensure that our systems remain functional in order to both serve our
operational needs with a remote workforce and keep them running to ensure uninterrupted service to our customers. There were no changes in internal control over financial reporting in 2020 as a result of COVID-19 that materially affected, or are reasonably
likely to materially affect, our internal control over financial reporting. Unfavorable economic conditions due to COVID-19 have impacted the demand for electricity and natural gas, which has resulted in a decrease in
operating revenues. As a result of COVID-19, we temporarily suspended interruption of service for all retail residential customers for non-payment and temporarily
ceased new late payment fees for all retail customers from March to May of 2020. Such measures resulted in an increase in credit loss expense. We have also incurred direct costs related to COVID-19 consisting primarily of costs to acquire personal protective equipment, costs for cleaning
supplies and services, and costs to hire healthcare professionals to monitor the health of our employees. These costs are recorded as Operating andmaintenance expense.
The estimated impact to our Net income was approximately $170 million for the year ended December 31, 2020 and is not expected to be material
for the year ending December 31, 2021. We rely on the capital markets for publicly offered debt as well as the commercial paper markets to meet our financial commitments and short-
term liquidity needs. As a result of the disruptions in the commercial paper markets in March of 2020, we borrowed $1.5 billion on our revolving creditfacility to refinance commercial paper, which we repaid on April 3, 2020. We also entered into two short-term loan agreements in March of 2020 for anaggregate of $500 million. On April 8, 2020, we received approximately $500 million in cash after entering into an accounts receivable financingarrangement. In addition, we issued long-term debt of $1.7 billion and were able to successfully complete our planned long-term debt issuances in 2020.See Liquidity and Capital Resources, Note 17 — Debt and Credit Agreements, and Note 6 — Accounts Receivable of the Notes to Consolidated FinancialStatements for additional information.
95

We assessed long-lived assets and investments for recoverability and there were no material impairment charges recorded in 2020 as a result ofCOVID-19. See Note 12 — Asset Impairments of the Notes to Consolidated Financial Statements for additional information related to other impairmentassessments in the third quarter of 2020. Certain assumptions are highly sensitive to changes. Changes in significant assumptions could potentially result infuture impairments, which could be material.
This is an evolving situation that could lead to extended disruption of economic activity in our markets. We will continue to monitor developments
affecting our workforce, customers, and suppliers and will take additional precautions that we determine to be necessary in order to mitigate the impacts.The extent to which COVID-19 may impact our ability to operate our generating assets, the ability to access capital markets, and results of operations,including demand for electricity and natural gas, will depend on the spread and proliferation of COVID-19 around the world and future developments,which are highly uncertain and cannot be predicted at this time.
Impacts of February 2021 Extreme Cold Weather Event and Texas-based Generating Assets Outages Beginning on February 15, 2021, our Texas-based generating assets within the ERCOT market, specifically Colorado Bend II, Wolf Hollow II,
and Handley, experienced periodic outages as a result of historically severe cold weather conditions. In addition, those weather conditions drove increaseddemand for service, dramatically increased wholesale power and gas prices, and also increased gas prices in certain regions.
We estimate a reduction in Net income of approximately $670 million to $820 million for the full year 2021 arising from these market and weather
conditions. The ultimate impact to our consolidated financial statements may be affected by a number of factors, including final settlement data, theimpacts of customer and counterparty credit losses, any state or federal solutions to address the financial challenges caused by the event, and relatedlitigation and contract disputes.
We expect to offset between $370 million and $450 million of this impact for the full year 2021 through a combination of enhanced revenue
opportunities, deferral of selected non-essential maintenance, and primarily one-time cost savings. CENG Put Option We own a 50.01% membership interest in CENG, a joint venture with EDF, which wholly owns the Calvert Cliffs and Ginna nuclear stations and
Nine Mile Point Unit 1, in addition to an 82% undivided ownership interest in Nine Mile Point Unit 2. CENG is 100% consolidated in our financialstatements.
On April 1, 2014, Generation entered into various agreements with EDF including a NOSA, an amended LLC Operating Agreement, an Employee
Matters Agreement, and a Put Option Agreement, among others. Under the amended LLC Operating Agreement, CENG made a $400 million specialdistribution to EDF and committed to make preferred distributions to Generation until Generation has received aggregate distributions of $400 million plusa return of 8.50% per annum. Under the Put Option Agreement, EDF has the option to sell its 49.99% equity interest in CENG to Generation exercisablebeginning on January 1, 2016 and thereafter until June 30, 2022. On November 20, 2019, Generation received notice of EDF’s intention to exercise the putoption to sell Generation its interest in CENG, and the put automatically exercised on January 19, 2020 at the end of the sixty-day advance notice period.
On August 6, 2021, Generation and EDF entered into a settlement agreement pursuant to which Generation, through a wholly owned subsidiary,
purchased EDF’s equity interest in CENG for a net purchase price of $885 million, which includes, among other things, a credit for EDF’s share of thebalance of the preferred distribution payable by CENG to Generation. The difference between the net purchase price and EDF’s noncontrolling interest asof the closing date will be recorded to Membership interest on our Consolidated Balance Sheet.
In connection with the settlement agreement, on August 6, 2021, Generation issued approximately $880 million under a term loan credit
agreement to fund the transaction, which will expire on August 5, 2022. Clean Energy Law On September 15, 2021, the Illinois Public Act 102-0662 was signed into law by the Governor of Illinois. The Clean Energy Law is designed to
achieve 100% carbon-free power by 2045 to enable the state’s transition to a clean energy economy. The Clean Energy Law establishes decarbonizationrequirements for Illinois as well as programs to support the retention and development of emissions-free sources of electricity. Among other things, theClean Energy Law authorizes the IPA to procure up to 54.5 million CMCs from qualifying nuclear plants for a five-year period beginning on June 1, 2022through May 31, 2027. CMCs are credits for carbon-free attributes of eligible nuclear power plants in PJM. The Byron, Dresden, and Braidwood nuclearplants located in Illinois will be eligible to participate in the CMC procurement process and, if awarded contracts, would be committed to operate throughMay 31, 2027. Selected generators will by December 3, 2021 contract directly with ComEd for the procurement of the CMCs based upon the number ofMWhs produced annually by the eligible facilities, subject to specified caps and minimum performance requirements.
Following enactment of the Clean Energy Law, we announced on September 15, 2021, that we have reversed our previous decision to retire Byron
and Dresden given the opportunity for additional revenue. In addition, we no longer consider the Braidwood or LaSalle nuclear plants to be at risk forpremature retirement.
Early Retirement of Facilities In August 2020, we announced that we intended to retire the Byron Generating Station in September 2021, Dresden Generating Station in
November 2021, and Mystic Units 8 and 9 at the expiration of the cost of service commitment in May 2024. As a result, we recognized certain one-timecharges in the third and fourth quarters of 2020. Further, there were ongoing annual financial impacts stemming from shortening the expected economicuseful lives of these facilities, primarily related to accelerated depreciation of plant assets (including any ARC) and accelerated amortization of nuclearfuel. Also, as a result, in the third quarter of 2020, we recognized a $500 million impairment of our New England asset group. In the second quarter of2021, an incremental decline in value resulted in an additional pre-tax impairment charge of $350 million for the New England asset group. Further, in thesecond quarter of 2021, we recorded pre-tax charges of $53 million for decommissioning-related activities that were not offset for the Byron units due tothe inability to recognize a regulatory asset at ComEd.

On September 15, 2021, we reversed our previous decision to early retire Byron and Dresden and updated the expected economic useful life forboth facilities to 2044 and 2046 for Byron Units 1 and 2, respectively, and to 2029 and 2031 for Dresden Units 2 and 3, respectively. Depreciation wastherefore adjusted beginning September 15, 2021, to reflect these extended useful life estimates.
96
Agreement for Sale of our Solar Business On December 8, 2020, we entered into an agreement with an affiliate of Brookfield Renewable, for the sale of a significant portion of our solar
business, including 360 megawatts of generation in operation or under construction across more than 600 sites across the United States. We will retaincertain solar assets not included in this agreement, primarily Antelope Valley.
Completion of the transaction contemplated by the sale agreement was subject to the satisfaction of several closing conditions which were
satisfied in the first quarter of 2021. The sale was completed on March 31, 2021 for a purchase price of $810 million. We received cash proceeds of $675million, net of $125 million long term debt assumed by the buyer and certain working capital and other post-closing adjustments. We recognized a pre-taxgain of $68 million which is included in Gain on sales of assets and businesses in our Consolidated Statements of Operations and Comprehensive Income.
Agreement for the Sale of a Biomass Facility
On April 28, 2021, we entered into a purchase agreement with ReGenerate Energy Holdings, LLC (“ReGenerate”), under which ReGenerate
agreed to purchase our interest in the Albany Green Energy biomass facility. As a result, in the second quarter of 2021, we recorded a pre-tax impairmentcharge of $140 million. The sale was completed on June 30, 2021 for a net purchase price of $36 million.
Sales of Customer Accounts Receivable On April 8, 2020, NER, a bankruptcy remote, special purpose entity, which is wholly owned by us, entered into an accounts receivable financing
facility with a number of financial institutions and a commercial paper conduit (the Purchasers) to sell certain customer accounts receivables (the Facility).We received approximately $500 million of cash in accordance with the initial sale of approximately $1.2 billion receivables. On February 17, 2021, wereceived additional cash of $250 million from the Purchasers for the remaining capacity in the Facility. The Facility was renewed on March 29, 2021. TheFacility term was extended through March 29, 2024, unless further renewed by the mutual consent of the parties, and the maximum capacity was increasedto $900 million. On March 31, 2021, we received cash of approximately $150 million in connection with the increased capacity at the time of the Facilityrenewal. See Note 6 — Accounts Receivable of the Notes to Consolidated Financial Statements for additional information.
Other Key Business Drivers
Power Markets Section 232 Uranium Petition On January 16, 2018, two Canadian-owned uranium mining companies with operations in the U.S. jointly submitted a petition to the U.S.
Department of Commerce ("DOC") seeking relief under Section 232 of the Trade Expansion Act of 1962 from imports of uranium products, alleging thatthese imports threaten national security.
The United States Nuclear Fuel Working Group ("Working Group") report was made public on April 23, 2020. The Working Group report states
that nuclear power is intrinsically tied to national security, and promises that the U.S. government will take bold actions to strengthen all parts of thenuclear fuel industry in the U.S. It recommends the Agreement Suspending the Antidumping Investigation on Uranium from the Russian Federation (the“Russian Suspension Agreement” or "RSA") be extended and to consider reducing the amount of Russian imports of nuclear fuel. The Russian SuspensionAgreement is the historical resolution of a 1991 DOC investigation that found that the Russians had been selling or “dumping” cheap uranium products intothe U.S. The RSA has been amended several times in the intervening years to allow Russia to supply limited amounts of uranium products into the U.S. Itwas set to expire at the end of 2020, but was amended on October 5, 2020 to extend for another 20 years.
The Working Group report should be viewed as policy recommendations that may be implemented by executive agencies, congress, and or
regulatory bodies. We cannot currently predict the outcome of all of the policy changes recommended by the Working Group.
97

Complaint at FERC Seeking to Alter Capacity Market Default Offer Caps On February 21, 2019, PJM's Independent Market Monitor (IMM) filed a complaint alleging that the number of performance assessment intervals
used to calculate the default offer cap for bids to supply capacity in PJM is too high, resulting in an overstated default offer cap that obviates the need formost sellers to seek unit-specific approval of their offers. The IMM argued that this allows for the exercise of market power. The IMM asked FERC torequire PJM to reduce the number of performance assessment intervals used to calculate the opportunity costs of a capacity supplier assuming a capacityobligation. This would, in turn, lower the default offer cap and allow the IMM to review more offers on a unit-specific basis. Several consumer advocatesfiled a complaint seeking similar relief several months after the IMM’s complaint. On March 18, 2021, FERC granted the complaints, finding the currentestimate of performance assessment intervals to be excessive compared to the reasonably expected number of performance assessment intervals whichresults in an unjust and unreasonable default offer cap. FERC did not establish the number of performance assessment intervals that should be used tocalculate the default offer cap and instead request briefs on the matter, including alternative approaches to mitigation in the capacity market. We submittedan initial and reply briefs on May 3, 2021 and June 9, 2021, respectively, and an answer to briefs filed by other parties on June 24, 2021. On September 2,2021, FERC issued an order adopting the IMM’s unit-specific avoidable cost offer review methodology and directed PJM to submit a compliance filingestablishing new deadlines for offer review and related other activities leading up to the base residual auction for the 2023-2024 planning year and anadditional compliance filing revising the PJM Tariff to comply with FERC’s order. We filed at FERC for rehearing on this matter on October 4, 2021. Wecannot predict the outcome of these proceedings or the financial statement impact.
Hedging Strategy Our policy to hedge commodity risk on a ratable basis over three-year periods is intended to reduce the financial impact of market price volatility.
We are exposed to commodity price risk associated with the unhedged portion of our electricity portfolio. We enter into non-derivative and derivativecontracts, including financially-settled swaps, futures contracts and swap options, and physical options and physical forward contracts, all with credit-approved counterparties, to hedge this anticipated exposure. As of December 31, 2020, the percentage of expected generation hedged for the Mid-Atlantic,Midwest, New York, and ERCOT reportable segments is 94%-97% for 2021. We have been and will continue to be proactive in using hedging strategies tomitigate commodity price risk.
We procure natural gas through long-term and short-term contracts and spot-market purchases. Nuclear fuel assemblies are obtained
predominantly through long-term uranium concentrate supply contracts, contracted conversion services, contracted enrichment services, or a combinationthereof, and contracted fuel fabrication services. The supply markets for uranium concentrates and certain nuclear fuel services are subject to pricefluctuations and availability restrictions. Approximately 60% of our uranium concentrate requirements from 2021 through 2025 are supplied by threesuppliers. In the event of non-performance by these or other suppliers, we believe that replacement uranium concentrate can be obtained, although at pricesthat may be unfavorable when compared to the prices under the current supply agreements. Non-performance by these counterparties could have a materialadverse impact on our consolidated financial statements.
See Note 16 — Derivative Financial Instruments of the Notes to Consolidated Financial Statements and “Quantitative and Qualitative Disclosures
About Market Risk” for additional information.
Critical Accounting Policies and Estimates The preparation of financial statements in conformity with GAAP requires that management apply accounting policies and make estimates and
assumptions that affect results of operations and the amounts of assets and liabilities reported in the financial statements. Management believes that theaccounting policies described below require significant judgment in their application, or incorporate estimates and assumptions that are inherently uncertainand that may change in subsequent periods. Additional information of the application of these accounting policies can be found in the Notes toConsolidated Financial Statements.
Nuclear Decommissioning Asset Retirement Obligations Our ARO associated with decommissioning our nuclear units was $11.9 billion at December 31, 2020. The authoritative guidance requires that we
estimate our obligation for the future decommissioning of our nuclear generating plants. To estimate that liability, we use an internally-developed,probability-weighted, discounted cash flow model which, on a unit-by-unit basis, considers multiple decommissioning outcome scenarios.
As a result of recent nuclear plant retirements in the industry, nuclear operators and third-party service providers are obtaining more information
about costs associated with decommissioning activities. At the same time, regulators are gaining more information about decommissioning activities whichcould result in changes to existing decommissioning requirements. In addition, as more nuclear plants are retired, it is possible that technological advanceswill be identified that could create efficiencies and lead to a reduction in decommissioning costs. The availability of NDT funds could impact the timing ofthe decommissioning activities. Additionally, certain factors such as changes in regulatory requirements during plant operations or the profitability of anuclear plant could impact the timing of plant retirements. These factors could result in material changes to our current estimates as more informationbecomes available and could change the timing of plant retirements and the probability assigned to the decommissioning outcome scenarios.
98

The nuclear decommissioning obligation is adjusted on a regular basis due to the passage of time and revisions to the key assumptions for the
expected timing and/or estimated amounts of the future undiscounted cash flows required to decommission the nuclear plants, based upon the followingmethodologies and significant estimates and assumptions:
Decommissioning Cost Studies. We use unit-by-unit decommissioning cost studies to provide a marketplace assessment of the expected costs (in
current year dollars) and timing of decommissioning activities, which are validated by comparison to current decommissioning projects within the industryand other estimates. Decommissioning cost studies are updated, on a rotational basis, for each of our nuclear units at least every five years, unlesscircumstances warrant more frequent updates. As part of the annual cost study update process, we evaluate newly assumed costs or substantive changes inpreviously assumed costs to determine if the cost estimate impacts are sufficiently material to warrant application of the updated estimates to the AROsacross the nuclear fleet outside of the normal five-year rotating cost study update cycle.
Cost Escalation Factors. We use cost escalation factors to escalate the decommissioning costs from the decommissioning cost studies discussed
above through the assumed decommissioning period for each of the units. Cost escalation studies, updated on an annual basis, are used to determineescalation factors, and are based on inflation indices for labor, equipment and materials, energy, LLRW disposal and other costs. All of the nuclear AROsare adjusted each year for the updated cost escalation factors.
Probabilistic Cash Flow Models. Our probabilistic cash flow models include the assignment of probabilities to various scenarios for
decommissioning cost levels, decommissioning approaches, and timing of plant shutdown on a unit-by-unit basis. Probabilities assigned to cost levelsinclude an assessment of the likelihood of costs 20% higher (high-cost scenario) or 15% lower (low-cost scenario) than the base cost scenario. The assumeddecommissioning scenarios include the following three alternatives: (1) DECON which assumes decommissioning activities begin shortly after thecessation of operation, (2) Shortened SAFSTOR generally has a 30-year delay prior to onset of decommissioning activities, and (3) SAFSTOR whichassumes the nuclear facility is placed and maintained in such condition that the nuclear facility can be safely stored and subsequently decontaminatedgenerally within 60 years after cessation of operations. In each decommissioning scenario, spent fuel is transferred to dry cask storage as soon as possibleuntil DOE acceptance for disposal.
The actual decommissioning approach selected once a nuclear facility is shutdown will be determined at the time of shutdown and may be
influenced by multiple factors including the funding status of the nuclear decommissioning trust fund at the time of shutdown. The assumed plant shutdown timing scenarios include the following four alternatives: (1) the probability of operating through the original 40-year
nuclear license term, (2) the probability of operating through an extended 60-year nuclear license term (regardless of whether such 20-year licenseextension has been received for each unit), (3) the probability of a second, 20-year license renewal for some nuclear units, and (4) the probability of earlyplant retirement for certain sites due to changing market conditions and regulatory environments. As power market and regulatory environmentdevelopments occur, we evaluate and incorporate, as necessary, the impacts of such developments into its nuclear ARO assumptions and estimates.
Our probabilistic cash flow models also include an assessment of the timing of DOE acceptance of SNF for disposal. We currently assume DOE
will begin accepting SNF in 2035. The SNF acceptance date assumption is based on management’s estimates of the amount of time required for DOE toselect a site location and develop the necessary infrastructure for long-term SNF storage. For additional information regarding the estimated date whenDOE will begin accepting SNF, see Note 19 — Commitments and Contingencies of the Notes to Consolidated Financial Statements.
Discount Rates. The probability-weighted estimated future cash flows for the various assumed scenarios are discounted using credit-adjusted,
risk-free rates (CARFR) applicable to the various businesses in which each of the nuclear units originally operated. We initially recognize an ARO at fairvalue and subsequently adjust it for changes to estimated costs, timing of future cash flows and modifications to decommissioning assumptions. The AROis not required or permitted to be re-measured for changes in the CARFR that occur in isolation. Increases in the ARO as a result of upward revisions inestimated undiscounted cash flows are considered new obligations and are measured using a current CARFR as the increase creates a new cost layer withinthe ARO. Any decrease in the estimated undiscounted future cash flows relating to the ARO are treated as a modification of an existing ARO cost layerand, therefore, is measured using the average historical CARFR rates used in creating the initial ARO cost layers. If our future nominal cash flowsassociated with the ARO were to be discounted at current prevailing CARFR, the obligation would increase from approximately $11.9 billion toapproximately $15.0 billion.
99

The following table illustrates the significant impact that changes in the CARFR, when combined with changes in projected amounts and expected
timing of cash flows, can have on the valuation of the ARO (dollars in millions):
Change in the CARFR applied to the annual ARO update (in millions)
(Decrease) Increaseto
ARO at December31,
2020 2019 CARFR rather than the 2020 CARFR $ (370)2020 CARFR increased by 50 basis points (390)2020 CARFR decreased by 50 basis points 490
ARO Sensitivities. Changes in the assumptions underlying the ARO could materially affect the decommissioning obligation. The impact to the
ARO of a change in any one of these assumptions is highly dependent on how the other assumptions may correspondingly change. The following table illustrates the effects of changing certain ARO assumptions while holding all other assumptions constant (dollars in millions):
Change in ARO Assumption (in millions) Increase to ARO atDecember 31, 2020
Cost escalation studies Uniform increase in escalation rates of 50 basis points $ 2,560 Probabilistic cash flow models Increase the estimated costs to decommission the nuclear plants by 10 percent 1,050 Increase the likelihood of the DECON scenario by 10 percent and decrease the likelihood of the SAFSTORscenario by 10 percent(a) 610 Shorten each unit's probability weighted operating life assumption by 10 percent(b) 1,690 Extend the estimated date for DOE acceptance of SNF to 2040 280
(a) Excludes any sites in which management has committed to a specific decommissioning approach.(b) Excludes any retired sites.
See Note 1 — Significant Accounting Policies, Note 7 — Early Plant Retirements and Note 10 — Asset Retirement Obligations of the Notes toConsolidated Financial Statements for additional information regarding accounting for nuclear AROs.
Unamortized Energy Contract Assets and Liabilities Unamortized energy contract assets and liabilities represent the remaining unamortized balances of non-derivative energy contracts that we have
acquired. The initial amount recorded represents the fair value of the contracts at the time of acquisition. The unamortized energy contract assets andliabilities are amortized over the life of the contract in relation to the expected realization of the underlying cash flows. Amortization of the unamortizedenergy contract assets and liabilities is recorded through purchased power and fuel expense or operating revenues, depending on the nature of theunderlying contract. See Note 13 — Intangible Assets of the Notes to Consolidated Financial Statements for additional information.
Impairment of Long-Lived Assets We regularly monitor and evaluate the carrying value of long-lived assets and asset groups for recoverability whenever events or changes in
circumstances indicate that the carrying value of those assets may not be recoverable. Indicators of potential impairment may include a deterioratingbusiness climate, including, but not limited to, declines in energy prices, condition of the asset, an asset remaining idle for more than a short period of time,specific regulatory disallowance, advances in technology, plans to dispose of a long-lived asset significantly before the end of its useful life, and financialdistress of a third party for assets contracted with them on a long-term basis, among others.
100

The review of long-lived assets and asset groups for impairment utilizes significant assumptions about operating strategies and estimates of future
cash flows, which require assessments of current and projected market conditions. Forecasting future cash flows requires assumptions regarding forecastedcommodity prices for the sale of power and purchases of fuel and the expected operations of assets. A variation in the assumptions used could lead to adifferent conclusion regarding the recoverability of an asset or asset group and, thus, could potentially result in material future impairments. An impairmentevaluation is based on an undiscounted cash flow analysis at the lowest level at which cash flows of the long-lived assets or asset groups are largelyindependent of the cash flows of other assets and liabilities. The lowest level of independent cash flows is determined by the evaluation of several factors,including the geographic dispatch of the generation units and the hedging strategies related to those units as well as the associated intangible assets orliabilities recorded on the balance sheet. The cash flows from the generating units are generally evaluated at a regional portfolio level with cash flowsgenerated from the customer supply and risk management activities, including cash flows from related intangible assets and liabilities on the balance sheet.In certain cases, generating assets may be evaluated on an individual basis where those assets are contracted on a long-term basis with a third party andoperations are independent of other generating assets (typically contracted renewables). For such assets the financial viability of the third party, includingthe impact of bankruptcy on the contract, may be a significant assumption in the assessment.
On a quarterly basis, we assess our long-lived assets or asset groups for indicators of impairment. If indicators are present for a long-lived asset or
asset group, a comparison of the undiscounted expected future cash flows to the carrying value is performed. When the undiscounted cash flow analysisindicates the carrying value of a long-lived asset or asset group is not recoverable, the amount of the impairment loss is determined by measuring the excessof the carrying amount of the long-lived asset or asset group over its fair value. The fair value of the long-lived asset or asset group is dependent upon amarket participant’s view of the exit price of the assets. This includes significant assumptions of the estimated future cash flows generated by the assets andmarket discount rates. Events and circumstances often do not occur as expected resulting in differences between prospective financial information andactual results, which may be material. The determination of fair value is driven by both internal assumptions that include significant unobservable inputs(Level 3) such as revenue and generation forecasts, projected capital, and maintenance expenditures and discount rates, as well as information from variouspublic, financial and industry sources.
See Note 12 — Asset Impairments of the Notes to Consolidated Financial Statements for a discussion of asset impairment assessments. Depreciable Lives of Property, Plant and Equipment We have significant investments in electric generation assets. These assets are generally depreciated on a straight-line basis, using the group,
composite or unitary methods of depreciation. The group approach is typically for groups of similar assets that have approximately the same useful livesand the composite approach is used for heterogeneous assets that have different lives. Under both methods, a reporting entity depreciates the assets over theaverage life of the assets in the group. The estimation of asset useful lives requires management judgment, supported by formal depreciation studies ofhistorical asset retirement experience. Depreciation studies are generally completed every five years, or more frequently if an event, regulatory action, orchange in retirement patterns indicate an update is necessary.
Along with depreciation study results, management considers expected future energy market conditions and generation plant operating costs and
capital investment requirements in determining the estimated service lives of our generating facilities and reassesses the reasonableness of estimated usefullives whenever events or changes in circumstances warrant. When a determination has been made that an asset will be retired before the end of its currentestimated useful life, depreciation provisions will be accelerated to reflect the shortened estimated useful life, which could have a material unfavorableimpact on future results of operations. See Note 7 — Early Plant Retirements of the Notes to the Consolidated Financial Statements for additionalinformation.
Changes in estimated useful lives of electric generation assets could have a significant impact on the future results of operations. See Note 1 —
Significant Accounting Policies of the Notes to Consolidated Financial Statements for information regarding depreciation and estimated service lives of theproperty, plant and equipment.
101

Accounting for Derivative Instruments We use derivative instruments to manage commodity price risk, foreign currency exchange risk and interest rate risk related to ongoing business
operations. Our derivative activities are in accordance with our Risk Management Policy (RMP). See Note 16 — Derivative Financial Instruments of theNotes to Consolidated Financial Statements for additional information.
We account for derivative financial instruments under the applicable authoritative guidance. Determining whether a contract qualifies as a
derivative requires that management exercise significant judgment, including assessing market liquidity as well as determining whether a contract has oneor more underlyings and one or more notional quantities. Changes in management’s assessment of contracts and the liquidity of their markets, and changesin authoritative guidance, could result in previously excluded contracts becoming in scope of new authoritative guidance.
All derivatives are recognized on the balance sheet at their fair value, except for certain derivatives that qualify for, and are elected under, NPNS.
Derivatives entered into for economic hedging and for proprietary trading purposes are recorded at fair value through earnings. NPNS. As part of our energy marketing business, we enter into contracts to buy and sell energy to meet the requirements of our customers. These
contracts include short-term and long-term commitments to purchase and sell energy and energy-related products in the retail and wholesale markets withthe intent and ability to deliver or take delivery. While some of these contracts are considered derivative financial instruments under the authoritativeguidance, certain of these qualifying transactions have been designated as NPNS transactions, which are thus not required to be recorded at fair value, butrather on an accrual basis of accounting. Determining whether a contract qualifies for the NPNS requires judgment on whether the contract will physicallydeliver and requires that management ensure compliance with all of the associated qualification and documentation requirements. Revenues and expenseson contracts that qualify as NPNS are recognized when the underlying physical transaction is completed. Contracts that qualify for the NPNS are those forwhich physical delivery is probable, quantities are expected to be used or sold in the normal course of business over a reasonable period of time and thecontract is not financially settled on a net basis.
Commodity Contracts. Identification of a commodity contract as an economic hedge requires us to determine that the contract is in accordance
with the RMP. We reassess our economic hedges on a regular basis to determine if they continue to be within the guidelines of the RMP. As a part of the authoritative guidance, we make estimates and assumptions concerning future commodity prices, load requirements, interest rates,
the timing of future transactions and their probable cash flows, the fair value of contracts and the expected changes in the fair value in deciding whether ornot to enter into derivative transactions, and in determining the initial accounting treatment for derivative transactions. Under the authoritative guidance forfair value measurements, we categorize these derivatives under a fair value hierarchy that prioritizes the inputs to valuation techniques used to measure fairvalue.
Derivative contracts are traded in both exchange-based and non-exchange-based markets. Exchange-based derivatives that are valued using
unadjusted quoted prices in active markets are generally categorized in Level 1 in the fair value hierarchy. Certain derivatives’ pricing is verified using indicative price quotations available through brokers or over-the-counter, on-line exchanges. The
price quotations reflect the average of the bid-ask mid-point from markets that we believe provide the most liquid market for the commodity. The pricequotations are reviewed and corroborated to ensure the prices are observable and representative of an orderly transaction between market participants. Ourderivatives are traded predominately at liquid trading points. The remaining derivative contracts are valued using models that consider inputs such ascontract terms, including maturity, and market parameters, and assumptions of the future prices of energy, interest rates, volatility, credit worthiness andcredit spread. For derivatives that trade in liquid markets, such as generic forwards, swaps and options, the model inputs are generally observable. Suchinstruments are categorized in Level 2.
For derivatives that trade in less liquid markets with limited pricing information, the model inputs generally would include both observable and
unobservable inputs and are categorized in Level 3. We consider nonperformance risk, including credit risk in the valuation of derivative contracts, including both historical and current market data,
in our assessment of nonperformance risk, including credit risk. The impacts of nonperformance and credit risk to date have generally not been material tothe financial statements.
102

See “Quantitative and Qualitative Disclosures About Market Risk” and Note 18 — Fair Value of Financial Assets and Liabilities and Note 16 —
Derivative Financial Instruments of the Notes to Consolidated Financial Statements for additional information regarding derivative instruments. Taxation Significant management judgment is required in determining our provision for income taxes, primarily due to the uncertainty related to tax
positions taken, as well as deferred tax assets and liabilities and valuation allowances. We account for uncertain income tax positions using a benefitrecognition model with a two-step approach including a more-likely-than-not recognition threshold and a measurement approach based on the largestamount of tax benefit that is greater than 50% likely of being realized upon ultimate settlement. Management evaluates each position based solely on thetechnical merits and facts and circumstances of the position, assuming the position will be examined by a taxing authority having full knowledge of allrelevant information. Significant judgment is required to determine whether the recognition threshold has been met and, if so, the appropriate amount of taxbenefits to be recorded in the consolidated financial statements.
We evaluate quarterly the probability of realizing deferred tax assets by reviewing a forecast of future taxable income and their intent and ability to
implement tax planning strategies, if necessary, to realize deferred tax assets. We also assess negative evidence, such as the expiration of historicaloperating loss or tax credit carryforwards, that could indicate our inability to realize our deferred tax assets. Based on the combined assessment, we recordvaluation allowances for deferred tax assets when it is more-likely-than-not such benefit will not be realized in future periods.
Actual income taxes could vary from estimated amounts due to the future impacts of various items, including future changes in income tax laws,
our forecasted financial condition and results of operations, failure to successfully implement tax planning strategies, as well as results of audits andexaminations of filed tax returns by taxing authorities. See Note 14 — Income Taxes of the Notes to Consolidated Financial Statements for additionalinformation.
Accounting for Loss Contingencies In the preparation of our financial statements, we make judgments regarding the future outcome of contingent events and record liabilities for loss
contingencies that are probable and can be reasonably estimated based upon available information. The amount recorded may differ from the actualexpense incurred when the uncertainty is resolved. Such difference could have a significant impact in our consolidated financial statements.
Environmental Costs. Environmental investigation and remediation liabilities are based upon estimates with respect to the number of sites for
which we will be responsible, the scope and cost of work to be performed at each site, the portion of costs that will be shared with other parties, the timingof the remediation work and changes in technology, regulations and the requirements of local governmental authorities. In addition, periodic reviews areperformed to assess the adequacy of other environmental reserves. These matters, if resolved in a manner different from the estimate, could have asignificant impact in the consolidated financial statements. See Note 19 — Commitments and Contingencies of the Notes to Consolidated FinancialStatements for additional information.
Other, Including Personal Injury Claims. We are self-insured for general liability, automotive liability, workers’ compensation, and personal
injury claims to the extent that losses are within policy deductibles or exceed the amount of insurance maintained. We have reserves for both open claimsasserted and an estimate of claims incurred but not reported (IBNR). The IBNR reserve is estimated based on actuarial assumptions and analysis and isupdated annually. Future events, such as the number of new claims to be filed each year, the average cost of disposing of claims, as well as the numerousuncertainties surrounding litigation and possible state and national legislative measures could cause the actual costs to be higher or lower than estimated.Accordingly, these claims, if resolved in a manner different from the estimate, could have a material impact in the consolidated financial statements.
Revenue Recognition Sources of Revenue and Determination of Accounting Treatment. We earn revenue from various business activities including: the sale of power
and energy-related products, such as natural gas, capacity, and other commodities in non-regulated markets (wholesale and retail) and the provision of otherenergy-related non-regulated products and services.
The accounting treatment for revenue recognition is based on the nature of the underlying transaction and applicable authoritative guidance. We
primarily apply the Revenue from Contracts with Customers and Derivatives guidance to recognize revenue as discussed in more detail below.
103

Revenue from Contracts with Customers. We recognize revenues in the period in which the performance obligations within contracts with
customers are satisfied, which generally occurs when power, natural gas and other energy-related commodities and services are provided to the customer.Transactions within the scope of Revenue from Contracts with Customers generally include non-derivative agreements, contracts that are designated asNPNS and spot-market energy commodity sales, including settlements with independent system operators.
The determination of our retail power and natural gas sales to individual customers is based on systematic readings of customer meters, generally
on a monthly basis. Energy delivered to customers that has not yet been billed as of the reporting period is estimated and corresponding unbilled revenue isrecorded. The measurement of unbilled revenue is based upon individual customer meter readings, forecasted volumes, and applicable rates. See Note 1 —Significant Accounting Policies of the Notes to Consolidated Financial Statements for additional information.
Derivative Revenues. We record revenues and expenses using the mark-to-market method of accounting for transactions that are accounted for as
derivatives. These derivative transactions primarily relate to commodity price risk management activities. Mark-to-market revenues and expenses include:inception gains or losses on new transactions where the fair value is observable, unrealized gains and losses from changes in the fair value of open contractsand realized gains and losses.
Factors Affecting the Comparability of our Future Results of Operations to our Historical Results of Operations
The historical audited financial information we have included in this information statement does not necessarily reflect what our financialcondition, results of operations or cash flows would have been as an independent public company during the periods presented and is not necessarilyindicative of our future financial condition, future results of operations or future cash flows. This is primarily a result of the following factors:
· The historical audited financial results reflect allocations of expenses for services historically provided by BSC, and those allocations may be
different than the comparable expenses we would have incurred as an independent company,
· Our cost of debt and other capitalization may be different from that reflected in our historical audited financial statements,
· The historical audited financial information does not reflect the changes that will occur in our cost structure, management, financingarrangements and business operations as a result of our separation from Exelon, including the costs related to being an independent company,and
· Other significant changes may occur in our cost structure, management, financing and business operations as a result of our operation as a
company separate from Exelon.
104

Results of Operations
(in millions) 2020 2019
(Unfavorable)FavorableVariance
Operating revenues $ 17,603 $ 18,924 $ (1,321)Operating expenses
Purchased power and fuel 9,585 10,856 1,271 Operating and maintenance 5,168 4,718 (450)Depreciation and amortization 2,123 1,535 (588)Taxes other than income taxes 482 519 37
Total operating expenses 17,358 17,628 270 Gain on sales of assets and businesses 11 27 (16)Operating income 256 1,323 (1,067)Other income and (deductions)
Interest expense (357) (429) 72 Other, net 937 1,023 (86)
Total other income and (deductions) 580 594 (14)Income before income taxes 836 1,917 (1,081)Income taxes 249 516 267 Equity in losses of unconsolidated affiliates (8) (184) 176 Net income 579 1,217 (638)Net (loss) income attributable to noncontrolling interests (10) 92 (102)Net income attributable to membership interest $ 589 $ 1,125 $ (536)
Year Ended December 31, 2020 Compared to Year Ended December 31, 2019. Net income attributable to membership interest decreased by $536million primarily due to:
· One-time charges and accelerated depreciation and amortization associated with our decisions in the third quarter of 2020 to early retire
Byron and Dresden nuclear facilities in 2021 and Mystic Units 8 and 9 in 2024, partially offset by the absence of accelerated depreciation andamortization due to the early retirement of TMI in September 2019;
· Impairment of the New England asset group;
· Lower capacity revenue;
· Reduction in load due to COVID-19;
· Lower realized energy prices;
· Higher nuclear outage days;
· Impact of our annual update to the nuclear ARO for Non-regulatory Agreement Units;
· Lower net unrealized and realized gains on NDT funds;
· COVID-19 direct costs; and
The decreases were partially offset by:
· Higher mark-to-market gains;
105

· Unrealized gains resulting from equity investments without readily determinable fair values that became publicly traded entities in the fourth
quarter of 2020 and were fair valued based on quoted market prices of the stocks as of December 31, 2020;
· Lower operating and maintenance expense primarily due to previous cost management programs, lower contracting costs, and lower travelcosts partially offset by lower NEIL insurance distributions;
· Lower nuclear fuel costs;
· Lower depreciation and amortization expense due to the impact of extending the operating license at Peach Bottom;
· A tax benefit related to a settlement in the first quarter of 2020, partially offset by the absence of a tax benefit related to certain research and
development activities recorded in the fourth quarter of 2019.
Operating revenues. The basis for our reportable segments is the integrated management of our electricity business that is located in differentgeographic regions, and largely representative of the footprints of ISO/RTO and/or NERC regions, which utilize multiple supply sources to provideelectricity through various distribution channels (wholesale and retail). Our hedging strategies and risk metrics are also aligned with these same geographicregions. Our five reportable segments are Mid-Atlantic, Midwest, New York, ERCOT, and Other Power Regions. See Note 5 — Segment Information ofthe Notes to Consolidated Financial Statements for additional information on these reportable segments.
The following business activities are not allocated to a region and are reported under Other: natural gas, as well as other miscellaneous business
activities that are not significant to overall operating revenues or results of operations. For the years ended December 31, 2020 compared to 2019, Operating revenues by region were as follows:
2020 vs. 2019 (in millions) 2020 2019 Variance % Change(a) Mid-Atlantic $ 4,645 $ 5,075 $ (430) (8.5)%Midwest 4,024 4,293 (269) (6.3)%New York 1,431 1,596 (165) (10.3)%ERCOT 958 1,013 (55) (5.4)%Other Power Regions 4,002 4,246 (244) (5.7)%Total electric revenues 15,060 16,223 (1,163) (7.2)%Other 2,433 2,706 (273) (10.1)%Mark-to-market gains (losses) 111 (2) 113 Total Operating revenues $ 17,603 $ 18,924 $ (1,321) (7.0)%
(a) % Change in mark-to-market is not a meaningful measure Supply Sources. Our supply sources by region are summarized below:
2020 vs. 2019 Supply Source (GWhs) 2020 2019 Variance % Change Nuclear Generation(a)
Mid-Atlantic 52,202 58,347 (6,145) (10.5)%Midwest 96,322 94,890 1,432 1.5%New York 26,561 28,088 (1,527) (5.4)%
Total Nuclear Generation 175,085 181,325 (6,240) (3.4)%Fossil and Renewables
Mid-Atlantic 2,206 2,884 (678) (23.5)%Midwest 1,240 1,374 (134) (9.8)%New York 4 5 (1) (20.0)%ERCOT 11,982 13,572 (1,590) (11.7)%Other Power Regions 11,121 11,476 (355) (3.1)%
Total Fossil and Renewables 26,553 29,311 (2,758) (9.4)%Purchased Power
Mid-Atlantic 22,487 14,790 7,697 52.0%Midwest 770 1,424 (654) (45.9)%ERCOT 5,636 4,821 815 16.9%Other Power Regions 51,079 48,673 2,406 4.9%
Total Purchased Power 79,972 69,708 10,264 14.7%Total Supply/Sales by Region(b)
Mid-Atlantic 76,895 76,021 874 1.1%Midwest 98,332 97,688 644 0.7%New York 26,565 28,093 (1,528) (5.4)%ERCOT 17,618 18,393 (775) (4.2)%Other Power Regions 62,200 60,149 2,051 3.4%
Total Supply/Sales by Region 281,610 280,344 1,266 0.5%
(a) Includes the proportionate share of output where we have an undivided ownership interest injointly-owned generating plants and includes the total output of plants that are fully consolidated.
(b) Reflects a decrease in load due to COVID-19.
106

Nuclear Fleet Capacity Factor. The following table presents nuclear fleet operating data for our plants, which reflects ownership percentage of
stations operated by us, excluding Salem, which is operated by PSEG. The nuclear fleet capacity factor presented in the table is defined as the ratio of theactual output of a plant over a period of time to its output if the plant had operated at full average annual mean capacity for that time period. We considercapacity factor to be a useful measure to analyze the nuclear fleet performance between periods. We have included the analysis below as a complement tothe financial information provided in accordance with GAAP. However, these measures are not a presentation defined under GAAP and may not becomparable to other companies’ presentations or be more useful than the GAAP information provided elsewhere in this report.
2020 2019 Nuclear fleet capacity factor 95.4% 95.7%Refueling outage days 260 209 Non-refueling outage days 19 51
ZEC Prices. We are compensated through state programs for the zero-emissions attributes of our nuclear generation. ZEC prices have a significant
impact on Operating revenues. The following table presents the average ZEC prices ($/MWh) for each of our major regions in which state programs havebeen enacted. Prices reflect the weighted average price for the various delivery periods within each calendar year. 2020 vs. 2019 State (Region) 2020 2019 Variance % Change New Jersey (Mid-Atlantic) $ 10.00 $ 10.00 $ — — Illinois (Midwest) 16.50 16.50 — — New York (New York) 19.59 19.06 0.53 2.8%
Capacity Prices. We participate in capacity auctions in each of our major regions, except ERCOT which does not have a capacity market. We alsoincur capacity costs associated with load served, except in ERCOT. Capacity prices have a significant impact on our operating revenues and purchasedpower and fuel. The following table presents the average capacity prices ($/MW Day) for each of our major regions. Prices reflect the weighted averageprice for the various auction periods within each calendar year. 2020 vs. 2019 Location (Region) 2020 2019 Variance % Change Eastern Mid-Atlantic Area Council (Mid-Atlantic and Midwest) $ 159.50 $ 163.79 $ (4.29) (2.6)%ComEd (Midwest) 194.22 207.87 (13.65) (6.6)%Rest of State (New York) 47.81 26.95 20.86 77.4%Southeast New England (Other) 200.69 269.35 (68.65) (25.5)%
Electricity Prices. The price of electricity has a significant impact on our operating revenues and purchased power cost. The following table
presents the average day-ahead around-the-clock price ($/MWh) for each of our major regions.
2020 vs. 2019 Location (Region) 2020 2019 Variance % Change PJM West (Mid-Atlantic) $ 20.95 $ 26.69 $ (5.74) (21.5)%ComEd (Midwest) 18.96 23.59 (4.63) (19.6)%Central (New York) 16.36 21.80 (5.44) (25.0)%North (ERCOT) 22.03 37.80 (15.77) (41.7)%Southwest Massachusetts (Other) (a) 23.57 31.51 (7.94) (25.2)%
(a) Reflects New England, which comprises the majority of the activity in the Other region For the years ended December 31, 2020 compared to 2019 changes in Operating revenues by region were approximately as follows: 2020 vs. 2019 (in millions) Variance % Change(a) DescriptionMid-Atlantic
$ (429 ) (8.5)% • unfavorable settled economic hedges of $(175) due to settled pricesrelative to hedged prices • unfavorable retail load revenue of $(205) primarily due to lowervolumes • unfavorable wholesale load revenue of $(95) primarily due to lowerprices; partially offset by • favorable ZEC revenues of $20 due to the approval of the NJ ZECprogram in the second quarter of 2019
Midwest
(269 ) (6.3)% • unfavorable retail load revenue of $(230) primarily due to lowervolumes • unfavorable wholesale load revenue, net of generation of $(110)primarily due to lower load volume, partially offset by higher generationdue to lower nuclear outage days • unfavorable net capacity revenues of $(50) due to lower prices,partially offset by higher volumes; partially offset by • favorable settled economic hedges of $85 due to settled prices relativeto hedged prices
New York (165 ) (10.3)% • unfavorable retail load revenue of $(70) primarily due to lowervolumes • unfavorable generation from jointly-owned nuclear stations of $(50)

due to higher outage days • unfavorable settled economic hedges of $(30) due to settled pricesrelative to hedged prices
ERCOT
(55 ) (5.4)% • unfavorable retail load revenue of $(50) primarily due to lowervolumes • unfavorable settled economic hedges of $(30) due to settled pricesrelative to hedged prices
Other Power Regions
(244 ) (5.7)% • unfavorable wholesale load revenue of $(195) primarily due to lowerprices • unfavorable settled economic hedges of $(175) due to settled pricesrelative to hedged prices; partially offset by • favorable retail load revenue of $130 primarily due to higher volumes
Other
(272 ) (10.1)% • unfavorable gas revenue of $(205) primarily due to lower prices • unfavorable revenue of $(55) related to the energy efficiency business
Mark-to-market(b)
113 • gains on economic hedging activities of $111 in 2020 compared to
losses of $2 in 2019Total $ (1,321 ) (7.0)%
(a) % Change in mark-to-market is not a meaningful measure (b) See Note 16 — Derivative Financial Instruments of the Combined Notes to Consolidated Financial Statements for additional information on mark-
to-market gains and losses.
107

Purchased power and fuel expense. See Operating revenues above for discussion of our reportable segments and hedging strategies and for
supplemental statistical data, including supply sources by region, nuclear fleet capacity factor, capacity prices, and electricity prices. The following business activities are not allocated to a region and are reported under Other: natural gas, as well as other miscellaneous business
activities that are not significant to overall purchased power and fuel expense or results of operations, and accelerated nuclear fuel amortization associatedwith nuclear decommissioning.
For the years ended December 31, 2020 compared to 2019, Purchased power and fuel expense by region was as follows:
2020 vs. 2019 (in millions) 2020 2019 Variance % Change (a) Mid-Atlantic $ 2,442 $ 2,420 $ (22) (0.9)%Midwest 1,121 1,330 209 15.6%New York 434 502 68 13.5%ERCOT 532 705 173 24.5%Other Power Regions 3,336 3,625 289 7.9%Total electric purchased power and fuel 7,865 8,582 717 8.3%Other 1,904 2,061 157 7.6% Mark-to-market (gains) losses (184) 213 397 Total purchased power and fuel $ 9,585 $ 10,856 $ 1,271 11.7%
(a) % Change in mark-to-market is not a meaningful measure
For the years ended December 31, 2020 compared to 2019 changes in Purchased power and fuel by region was approximately as follows:
2020 vs. 2019 (in millions) Variance % Change(a) DescriptionMid-Atlantic
$ (22 ) (0.9)% • unfavorable purchased power and net capacity obligation of $(130)primarily due to lower nuclear generation as a result of the permanentcease of operations at TMI and higher nuclear outage days; partiallyoffset by • favorable nuclear fuel of $50 primarily due to the permanent cease ofgeneration at TMI in the third quarter of 2019 and higher nuclear outagedays • favorable RPS expense of $55 primarily due to lower prices
Midwest
209 15.7 % • favorable purchased power of $110 primarily due to lower retail andwholesale load • favorable settlement of economic hedges of $60 due to settled pricesrelative to hedged prices
New York
68 13.5 % • favorable purchased power of $85 primarily due to lower retail loadand lower prices
ERCOT
173 24.5 % • favorable purchased power of $140 primarily due to availability ofgeneration during peak price periods
Other Power Regions
289 8.0 % • favorable purchased power and net capacity obligation of $105primarily due to lower prices • favorable fuel cost of $105 due to lower prices and lower generation • favorable RPS expense of $145 primarily due to lower prices; partiallyoffset by • unfavorable settled economic hedges of $(65) due to settled pricesrelative to hedged prices
Other
157 7.6 % • favorable net gas purchase costs and settlement of economic hedge of$215; partially offset by • unfavorable accelerated nuclear fuel amortization associated withannounced early plant retirements of $(75)
Mark-to-market(b)
397 • gains on economic hedging activities of $184 in 2020 compared to
losses of $212 million in 2019Total $ 1,271 11.7 %
(a) % Change in mark-to-market is not a meaningful measure (b) See Note 16 — Derivative Financial Instruments of the Combined Notes to Consolidated Financial Statements for additional information on mark-
to-market gains and losses.
108

The changes in Operating and maintenance expense, consisted of the following:
2020 vs. 2019 (in millions) Increase (Decrease) Asset Impairments $ 499 ARO update 125 Nuclear refueling outage costs, including the co-owned Salem plants 60 Insurance 52 COVID-19 direct costs 46 Litigation settlements 26 Change in environmental liabilities 18 Credit loss expense(a) 16 Accretion expense 14 Plant retirements and divestitures (8)Pension and non-pension postretirement benefits expense (19)Corporate allocations (35)Travel costs (38)Other (71)Labor, other benefits, contracting, materials(b) (235)Total increase $ 450
(a) Increased credit loss expense including impacts from COVID-19.(b) Primarily reflects decreased costs related to the permanent cease of generation operations at TMI, lower labor costs resulting from previous cost
management programs, and decreased contracting costs.
Depreciation and amortization expense for the year ended December 31, 2020 compared to the same period in 2019 increased primarily due tothe accelerated depreciation and amortization associated with our decision to early retire the Byron and Dresden nuclear facilities, partially offset by thepermanent cease of generation operations at TMI.
Taxes other than income taxes for the year ended December 31, 2020 compared to the same period in 2019 decreased primarily due to decreased
sales and power usage. Gain on sales of assets and businesses for the year ended December 31, 2020 compared to the same period in 2019 decreased primarily due to
our gain on sale of certain wind assets in 2019 partially offset by the loss on sale of Oyster Creek. Other, net for the year ended December 31, 2020 compared to the same period in 2019 decreased due to activity associated with NDT funds as
described in the table below.
109

(in millions) 2020 2019 Net unrealized gains on NDT funds(a) $ 391 $ 411 Net realized gains on sale of NDT funds(a) 70 253 Interest and dividend income on NDT funds(a) 90 110 Contractual elimination of income tax expense(b) 180 216 Unrealized gains from equity investments(c) 186 — Other 20 33 Total other, net $ 937 $ 1,023
(a) Unrealized gains, realized gains and interest and dividend income on the NDT funds are associated with the Non-Regulatory Agreement Units.(b) Contractual elimination of income tax expense is associated with the income taxes on the NDT funds of the Regulatory Agreement Units.(c) Unrealized gains resulting from equity investments without readily determinable fair values that became publicly traded entities in the fourth quarter of
2020 and were fair valued based on quoted market prices of the stocks as of December 31, 2020.
Interest Expense for the year ended December 31, 2020 compared to the same period in 2019 decreased primarily due to the redemption of long-term debt in 2020.
Effective income tax rates were 29.8% and 26.9% for the years ended December 31, 2020 and 2019, respectively. The change in 2020 is
primarily related to one-time income tax settlements partially offset by the absence of research and development refund claims. See Note 14 — IncomeTaxes of the Notes to Consolidated Financial Statements for additional information.
Equity in losses of unconsolidated affiliates for the year ended December 31, 2020 compared to the same period in 2019 increased primarily due
to the impairment of equity method investments in certain distributed energy companies in the third quarter of 2019. Net income attributable to noncontrolling interests for the year ended December 31, 2020 compared to the same period in 2019 decreased
primarily due to lower unrealized losses on NDT fund investments for CENG.
Liquidity and Capital Resources
All results included throughout the liquidity and capital resources section are presented on a GAAP basis. Our operating and capital expenditures requirements are provided by internally generated cash flows from operations, the sale of certain
receivables, as well as funds from external sources in the capital markets and through bank borrowings. Our business is capital intensive and requiresconsiderable capital resources. We annually evaluate our financing plan and credit line sizing, focusing on maintaining our investment grade ratings whilemeeting our cash needs to fund capital requirements, retire debt, fund pension and OPEB obligations, and invest in new and existing ventures. A broadspectrum of financing alternatives beyond the core financing options can be used to meet our needs and fund growth including monetizing assets in theportfolio via project financing, asset sales, and the use of other financing structures (e.g., joint ventures, minority partners, etc.). Our access to externalfinancing on reasonable terms depends on our credit ratings and current overall capital market business conditions. If these conditions deteriorate to theextent that we no longer have access to the capital markets at reasonable terms, we have access to credit facilities with aggregate bank commitments of $6.9billion. As a result of disruptions in the commercial paper markets due to COVID-19 in March of 2020, we borrowed $1.5 billion on our revolving creditfacility to refinance commercial paper. We repaid the $1.5 billion borrowed on the revolving credit facility on April 3, 2020 using funds from short-termloans issued in March 2020, cash proceeds from the sale of certain customer accounts receivable, and borrowings from the Exelon intercompany moneypool. See Note 6 — Accounts Receivable of the Notes to Consolidated Financial Statements for additional information on the sale of customer accountsreceivable. See Results of Operations for additional information on COVID-19. We continue to utilize our credit facilities to support our commercial paperprograms, provide for other short-term borrowings and to issue letters of credit. See the “Credit Matters” section below for additional information. Weexpect cash flows to be sufficient to meet operating expenses, financing costs and capital expenditure requirements.
We primarily use our capital resources, including cash, to fund capital requirements, including construction expenditures, retire debt, pay
dividends, fund pension and OPEB obligations, and invest in new and existing ventures. See Note 17 — Debt and Credit Agreements of the Notes toConsolidated Financial Statements for additional information of our debt and credit agreements.
110

Despite disruptions in the financial markets due to COVID-19, we issued long-term debt of $1.7 billion and were able to successfully complete
our planned long-term debt issuances in 2020. NRC Minimum Funding Requirements NRC regulations require that licensees of nuclear generating facilities demonstrate reasonable assurance that sufficient funds will be available in
certain minimum amounts to decommission the facility. These NRC minimum funding levels are typically based upon the assumption thatdecommissioning activities will commence after the end of the current licensed life of each unit. If a unit fails the NRC minimum funding test, then theplant’s owners or parent companies would be required to take steps, such as providing financial guarantees through letters of credit or parent companyguarantees or making additional cash contributions to the NDT fund to ensure sufficient funds are available. See Note 10 - Asset Retirement Obligations ofthe Notes to Consolidated Financial Statements for additional information.
If a nuclear plant were to early retire there is a risk that it will no longer meet the NRC minimum funding requirements due to the earlier
commencement of decommissioning activities and a shorter time period over which the NDT funds could appreciate in value. A shortfall could require thatwe address the shortfall by providing additional financial assurances, such as surety bonds, letters of credit, or parental guarantees, for our share of thefunding assurance. However, the amount of any guarantees or other assurance will ultimately depend on the decommissioning approach, the associatedlevel of costs, and the NDT fund investment performance going forward. Within two years after shutting down a plant, we must submit a PSDAR to theNRC that includes the planned option for decommissioning the site. As a result of the early retirement reversal, additional financial assurance is no longerrequired for Byron.
Upon issuance of any required financial assurances, each site would be able to utilize the respective NDT funds for radiological decommissioning
costs, which represent the majority of the total expected decommissioning costs. However, under the regulations, the NRC must approve an exemption inorder for us to utilize the NDT funds to pay for non-radiological decommissioning costs (i.e. spent fuel management and site restoration costs, ifapplicable). If a unit does not receive this exemption, those costs would be borne by us without reimbursement from or access to the NDT funds.
As of March 31, 2021, we would not be required to provide any additional financial assurances for TMI Unit 1 under the SAFSTOR scenario
which is the planned decommissioning option as described in the TMI Unit 1 PSDAR filed by us with the NRC on April 5, 2019. On October 16, 2019, theNRC granted our exemption request to use the TMI Unit 1 NDT funds for spent fuel management costs. An additional exemption request would berequired to allow the funds to be spent on site restoration costs, which are not expected to be incurred in the near term.
Cash Flows from Operating Activities Our cash flows from operating activities primarily result from the sale of electric energy and energy-related products and services to customers.
Our future cash flows from operating activities may be affected by future demand for and market prices of energy and our ability to continue to produceand supply power at competitive costs as well as to obtain collections from customers. See Note 3 — Regulatory Matters and Note 19 — Commitmentsand Contingencies of the Notes to Consolidated Financial Statements for additional information of regulatory and legal proceedings and proposedlegislation.
111

The following table provides a summary of the change in cash flows from operating activities for the years ended December 31, 2020 and 2019:
(Decrease) increase in cash flows from operating activities (in millions) Net income $ (638)Adjustments to reconcile net income to cash:
Non-cash operating activities 328 Pension and non-pension postretirement benefit contributions (80)Income taxes (116)Changes in working capital and other noncurrent assets and liabilities (2,633)Option premiums paid, net (110)Collateral received, net 960
Decrease in cash flows from operating activities $ (2,289) Changes in our cash flows from operations were generally consistent with changes in results of operations, as adjusted by changes in working
capital in the normal course of business, except as discussed below. In addition, significant operating cash flow impacts for 2020 and 2019 were as follows: · See Note 22 —Supplemental Financial Information of the Notes to Consolidated Financial Statements and the Consolidated Statement of
Cash Flows for additional information on non-cash operating activity.
· See Note 14 —Income Taxes of the Notes to Consolidated Financial Statements and the Consolidated Statement of Cash Flows for additionalinformation on income taxes.
· Depending upon whether we are in a net mark-to-market liability or asset position, collateral may be required to be posted with or collected
from our counterparties. In addition, the collateral posting and collection requirements differ depending on whether the transactions are on anexchange or in the OTC markets.
· Changes in working capital and other noncurrent assets and liabilities are primarily due to the revolving accounts receivable financing
arrangement entered into on April 8, 2020. See Note 6 — Accounts Receivable of the Notes to Consolidated Financial Statements foradditional information on the sales of customer accounts receivable.
Pension and Other Postretirement Benefits See Note 15 — Retirement Benefits of the Notes to Consolidated Financial Statements for additional information on planned contributions to the
qualified pension plans, planned benefit payments to non-qualified pension plans, and planned contributions to OPEB plans in 2021. Cash Flows from Investing Activities The following table provides a summary of the change in cash flows from investing activities for the years ended December 31, 2020 and 2019:
Increase (decrease) in cash flows from investing activities (in millions) Capital expenditures $ 98 Proceeds from NDT fund sales, net (87)Acquisitions of assets and businesses, net 41 Proceeds from sales of assets and businesses (6)Collection of DPP 3,771 Other investing activities 8 Increase in cash flows from investing activities $ 3,825 Significant investing cash flow impacts for 2020 and 2019 were as follows:
· Variances in capital expenditures are primarily due to the timing of cash expenditures for capital projects. Refer below for additionalinformation on projected capital expenditure spending.
112

Capital Expenditure Spending Our most recent estimate of capital expenditures for plant additions and improvements for 2021 is approximately $1.2 billion. Projected capital
expenditures and other investments are subject to periodic review and revision to reflect changes in economic conditions and other factors. Approximately 48% of projected 2021 capital expenditures are for the acquisition of nuclear fuel, with the remaining amounts primarily reflecting
additions and upgrades to existing generation facilities (including material condition improvements during nuclear refueling outages). We anticipate that wewill fund capital expenditures with internally generated funds and borrowings.
Cash Flows from Financing Activities The following table provides a summary of the change in cash flows from financing activities for the years ended December 31, 2020 and 2019: Increase (decrease) in cash flows from financing activities (in millions) Changes in short-term borrowings, net $ 200 Long-term debt, net (958)Changes in intercompany money pool 385 Distributions to member (835)Contributions from member 23 Other financing activities (19)Decrease in cash flows from financing activities $ (1,204)
Significant financing cash flow impacts for 2020 and 2019 were as follows:
· Changes in short-term borrowings, net, is driven by repayments on and issuances of notes due in less than 365 days. Refer to Note 17 -Debt and Credit Agreements of the Notes to Consolidated Financial Statements for additional information on short-term borrowings.
· Long-term debt, net, varies due to debt issuances and redemptions each year. Refer to debt issuances and redemptions tables below for
additional information.
· Changes in intercompany money pool are driven by short-term borrowing needs. Refer to more information regarding the intercompanymoney pool below.
· For the years ended December 31, 2020 and 2019, other financing activities primarily consists of debt issuance costs. See debt issuances table
below for additional information on our debt issuances.
113

Debt Issuances and Redemptions See Note 17 — Debt and Credit Agreements of the Notes to Consolidated Financial Statements for additional information of our long-term debt.
Debt activity for 2020 and 2019 were as follows: During 2020, the following long-term debt was issued:
Type Interest Rate Maturity Amount
(in millions) Use of ProceedsSenior Notes
3.25 %
June 1, 2025
$ 900 Repay existingindebtedness and for
general corporatepurposes.
EGR IV NonrecourseDebt(a)
LIBOR + 2.75% December 15, 2027 750 Repay existingindebtedness and for
general corporatepurposes.
Energy EfficiencyProject Financing(b)
3.95 % February 28, 2021 3
Funding to install energyconservation measures for
the Fort Meade project.Energy Efficiency
Project Financing(b)
2.53 %
March 31, 2021
3
Funding to install energyconservation measures forthe Fort AP Hill project.
(a) See Note 17 — Debt and Credit Agreements of the Notes to Consolidated Financial Statements for additional information of nonrecourse debt.(b) For Energy Efficiency Project Financing, the maturity dates represent the expected date of project completion, upon which the respective customer
assumes the outstanding debt.
During 2019, the following long-term debt was issued:
Type Interest Rate Maturity Amount
(in millions) Use of ProceedsEnergy Efficiency Project Financing(a)
3.95%
February 28,2021
$ 4
Funding to installenergy conservationmeasures for the Fort
Meade project.Energy Efficiency
Project Financing(a)
3.46%
February 28,2021
39
Funding to installenergy conservation
measures for theMarine Corps.
Logistics Project.Energy Efficiency
Project Financing(a)
2.53%
March 31,2021
2
Funding to installenergy conservationmeasures for the Fort
AP Hill project.
(a) For Energy Efficiency Project Financing, the maturity dates represent the expected date of project completion, upon which the respective customerassumes the outstanding debt.
114

During 2020, the following long-term debt was retired and/or redeemed:
Type Interest Rate Maturity Amount
(in millions) Senior Notes 2.95% January 15, 2020 $ 1,000 Senior Notes 4.00% October 1, 2020 550
Senior Notes(a) 5.15% December 1, 2020 550 Tax-Exempt Bonds
2.50% - 2.70%
December 1, 2025 -
June 1, 2036 412
EGR IV Nonrecourse Debt(b) 3 month LIBOR +
3.00% November 30, 2024 796 Continental Wind Nonrecourse Debt(b) 6.00% February 28, 2033 33
Antelope Valley DOE Nonrecourse Debt(b) 2.29% - 3.56% January 5, 2037 23 RPG Nonrecourse Debt(b) 4.11% March 31, 2035 9
Energy Efficiency Project Financing 3.71% December 31, 2020 4 NUKEM 3.15% September 30, 2020 3
SolGen Nonrecourse Debt 3.93% September 30, 2036 3 Energy Efficiency Project Financing 4.12% November 30, 2020 1
(a) The senior notes are legacy Constellation mirror debt that were previously held at Exelon and Generation. As part of the 2012 Constellation merger,Exelon and Generation assumed intercompany loan agreements that mirrored the terms and amounts of external obligations held by Exelon, resultingin notes payable to related parties in our Consolidated Balance Sheets.
(b) See Note 17 — Debt and Credit Agreements of the Notes to Consolidated Financial Statements for additional information of nonrecourse debt.
115

During 2019, the following long-term debt was retired and/or redeemed:
Type Interest Rate Maturity Amount
(in millions) Antelope Valley DOE Nonrecourse Debt(a) 2.33% - 3.56% January 5, 2037 $ 23
Kennett Square Capital Lease 7.83% September 20, 2020 5
Continental Wind Nonrecourse Debt(a) 6.00% February 28, 2033 32
Pollution control notes 2.50% March 1, 2019 23 RPG Nonrecourse Debt(a) 4.11% March 31, 2035 10 Energy Efficiency Project
Financing 3.46% April 30, 2019 39 EGR IV Nonrecourse debt(a) 3 month LIBOR +3.00% November 30, 2024 38 Hannie Mae, LLC Defense
Financing 4.12% November 30, 2019 1 Energy Efficiency Project
Financing 3.72% July 31, 2019 25 NUKEM 3.15% September 30, 2020 36
SolGen Nonrecourse Debt(a) 3.93% September 30, 2036 6 Energy Efficiency Project
Financing 4.17% October 31, 2019 1 Energy Efficiency Project
Financing 3.53% March 31, 2020 1 Energy Efficiency Project
Financing 4.26% September 30, 2019 1 Senior Notes 5.20% October 1, 2019 600
Dominion Federal Corp 3.17% October 31, 2019 18 Fort Detrick Project
Financing 3.55% October 31, 2019 1
(a) See Note 17 — Debt and Credit Agreements of the Notes to Consolidated Financial Statements for additional information of nonrecourse debt. From time to time and as market conditions warrant, we may engage in long-term debt retirements via tender offers, open market repurchases or otherviable options to reduce debt.
Credit Matters
We fund liquidity needs for capital investment, working capital, energy hedging and other financial commitments through cash flows fromcontinuing operations, public debt offerings, commercial paper markets and large, diversified credit facilities. The credit facilities include $6.9 billion inaggregate total commitments of which $4.7 billion was available to support additional commercial paper as of December 31, 2020, and of which nofinancial institution has more than 8% of the aggregate commitments. We had access to the commercial paper markets and had availability under ourrevolving credit facilities during 2020 to fund our short-term liquidity needs, when necessary. We routinely review the sufficiency of our liquidity position,including appropriate sizing of credit facility commitments, by performing various stress test scenarios, such as commodity price movements, increases inmargin-related transactions, changes in hedging levels, and the impacts of hypothetical credit downgrades. We have continued to closely monitor events inthe financial markets and the financial institutions associated with the credit facilities, including monitoring credit ratings and outlooks, credit default swaplevels, capital raising, and merger activity. See “Risk Factors” in this information statement for additional information regarding the effects of uncertaintyin the capital and credit markets.
116

We believe our cash flow from operating activities, access to credit markets and our credit facilities provide sufficient liquidity. If we lost our
investment grade credit rating as of December 31, 2020, we would have been required to provide incremental collateral of approximately $1.5 billion tomeet collateral obligations for derivatives, non-derivatives, normal purchases and normal sales contracts, and applicable payables and receivables, net ofthe contractual right of offset under master netting agreements, which is well within the $4.7 billion of available credit capacity of our revolver.
Project Financing Project financing is used to help mitigate risk of specific generating assets. Project financing is based upon a nonrecourse financial structure, in
which project debt is paid back from the cash generated by the specific asset or portfolio of assets. Borrowings under these agreements are secured by theassets and equity of each respective project. The lenders do not have recourse against us in the event of a default. If a specific project financing entity doesnot maintain compliance with its specific debt financing covenants, there could be a requirement to accelerate repayment of the associated debt or otherproject-related borrowings earlier than the stated maturity dates. In these instances, if such repayment was not satisfied, or restructured, the lenders orsecurity holders would generally have rights to foreclose against the project-specific assets and related collateral. The potential requirement to satisfy itsassociated debt or other borrowings earlier than otherwise anticipated could lead to impairments due to a higher likelihood of disposing of the respectiveproject-specific assets significantly before the end of their useful lives. Additionally, project finance has credit facilities. See Note 17 — Debt and CreditAgreements of the Notes to Consolidated Financial Statements for additional information on nonrecourse debt and credit facilities.
Credit Facilities We meet our short-term liquidity requirements primarily through the issuance of commercial paper and, historically, through borrowings from the
Exelon intercompany money pool. We may use our credit facilities for general corporate purposes, including meeting short-term funding requirements andthe issuance of letters of credit. See Note 17 — Debt and Credit Agreements of the Notes to Consolidated Financial Statements for additional informationof our credit facility and short term borrowing activity.
Capital Structure At December 31, 2020, our capital structure consisted of the following:
Percentage of Capital
Structure Long-term debt 27%Long-term debt to affiliates 1%Member’s equity 68%Commercial paper and notes payable 4%
Security Ratings Our access to the capital markets, including the commercial paper market, and our financing costs in those markets, may depend on our securities
ratings. Our borrowings are not subject to default or prepayment as a result of a downgrading of securities, although such a downgrading could increase
fees and interest charges under our credit agreements. As part of the normal course of business, we enter into contracts that contain express provisions or otherwise permit us and our counterparties to
demand adequate assurance of future performance when there are reasonable grounds for doing so. In accordance with the contracts and applicablecontracts law, if we are downgraded by a credit rating agency, it is possible that a counterparty would attempt to rely on such a downgrade as a basis formaking a demand for adequate assurance of future performance, which could include the posting of collateral. See Note 16 — Derivative FinancialInstruments of the Notes to Consolidated Financial Statements for additional information on collateral provisions.
117

S&P lowered Generation’s senior unsecured debt rating to ‘BBB’ from ‘BBB+’ on November 4, 2020, following public announcement by Exelon
of a strategic review of its corporate structure and consideration of separating the competitive generation and customer-facing businesses, bringingGeneration’s rating in-line with its stand-alone credit profile. The change was the result of S&P’s Group Rating Methodology and the revision of thestrategic relationship between the Company and Exelon from “core” to “moderately strategic,” removing any rating benefit from Exelon. The Group RatingMethodology and the associated impacts are unique to S&P.
Subsequently on February 24, 2021, S&P lowered Generation’s senior unsecured debt rating to ‘BBB-‘ from ‘BBB’ in response to the financial
impacts of the February 2021 weather event and Texas-based generating assets outages. See “Significant 2020 and 2021 Transactions and Developments —Impacts of February 2021 Extreme Weather Event and Texas-based Generating Assets Outages” for additional information.
The S&P ratings changes did not materially impact our financial statements. Furthermore, there were no material increases in required collateral or
financial assurances or material impacts to our anticipated access to liquidity or cost of financing. Intercompany Money Pool To provide an additional short-term borrowing option that will generally be more favorable than the cost of external financing, we have
historically participated in Exelon's intercompany money pool. Maximum amounts contributed to and borrowed from the money pool and the netcontribution or borrowing as of December 31, 2020, are presented in the following table:
For the Year Ended December 31, 2020 As of December 31, 2020
MaximumContributed(in millions)
MaximumBorrowed
(in millions) Borrowed
(in millions) $ 254 $ (980) $ (285)
Contractual Obligations and Off-Balance Sheet Arrangements
The following table summarizes the future estimated cash payments as of December 31, 2020 under existing contractual obligations, includingpayments due by period.
Payment due within
(in millions) Total 2021 2022 -2023
2024 -2025
2026and beyond
Long-term debt $ 6,066 $ 195 $ 1,024 $ 900 $ 3,947 Interest payments on long-term debt(a) 3,536 270 474 443 2,349Operating leases(b) 731 47 114 109 461Purchase power obligations(c) 1,613 512 823 264 14Fuel purchase agreements(d) 4,450 928 1,207 1,022 1,293Other purchase obligations(e) 2,286 1,208 231 155 692SNF obligation 1,208 — — — 1,208Total contractual obligations $ 19,890 $ 3,160 $ 3,873 $ 2,893 $ 9,964
(a) Interest payments are estimated based on final maturity dates of debt securities outstanding at December 31, 2020 and do not reflect anticipated futurerefinancing, early redemptions or debt issuances. Variable rate interest obligations are estimated based on rates as of December 31, 2020.
(b) Capacity payments associated with contracted generation lease agreements are net of sublease and capacity offsets of $98 million, $55 million, $44million, $44 million, $44 million and $179 million for 2021, 2022, 2023, 2024, 2025 and thereafter, respectively and $464 million in total.
(c) Purchase power obligations primarily include expected payments for REC purchases and capacity payments associated with contracted generationagreements, which may be reduced based on plant availability. Expected payments exclude payments on renewable generation contracts that arecontingent in nature.
(d) Represents commitments to purchase nuclear fuel, natural gas and related transportation, storage capacity and services, including those related toCENG.
(e) Represents the future estimated value at December 31, 2020 of the cash flows associated with all contracts, both cancellable and non-cancellable,entered into with third-parties for the provision of services and materials, entered into in the normal course of business not specifically reflectedelsewhere in this table. These estimates are subject to significant variability from period to period.
See Note 19 — Commitments and Contingencies of the Notes to Consolidated Financial Statements for additional information of other
commitments potentially triggered by future events and SNF obligation. See Note 17 — Debt and Credit Agreements of the Notes to ConsolidatedFinancial Statements for additional information on long-term debt and interest payments on long-term debt. See Note 11 — Leases of the Notes toConsolidated Financial Statements for additional information on operating leases.
118

Sales of Customer Accounts Receivable On April 8, 2020, we entered into an accounts receivable financing facility with a number of financial institutions and a commercial paper conduit
to sell certain receivables, which expires on April 7, 2021 unless renewed by the mutual consent of the parties in accordance with its terms. The facilityallows us to obtain financing at lower cost and diversify our sources of liquidity. See Note 6 — Accounts Receivable of the Notes to Consolidated FinancialStatements for additional information.
Quantitative and Qualitative Disclosures About Market Risk
We are exposed to market risks associated with adverse changes in commodity prices, counterparty credit, interest rates, and equity prices. TheRMC approves risk management policies and objectives for risk assessment, control and valuation, counterparty credit approval, and the monitoring andreporting of risk exposures. Historically, the RMC has been chaired by the chief executive officer of Exelon and included the chief risk officer, chiefstrategy officer, chief commercial officer, chief financial officer, and chief executive officer of Constellation and reported to the Finance and RiskCommittee of the Exelon Board of Directors on the scope of the risk management activities.
Commodity Price Risk Commodity price risk is associated with price movements resulting from changes in supply and demand, fuel costs, market liquidity, weather
conditions, governmental regulatory and environmental policies, and other factors. Electricity available from our own or contracted generation supply in excess of our obligations to customers is sold into the wholesale markets. To
reduce commodity price risk caused by market fluctuations, we enter into non-derivative contracts as well as derivative contracts, including swaps, futures,forwards, and options, with approved counterparties to hedge anticipated exposures. We use derivative instruments as economic hedges to mitigateexposure to fluctuations in commodity prices. We expect the settlement of the majority of our economic hedges will occur during 2021 through 2023.
In general, increases and decreases in forward market prices have a positive and negative impact, respectively, on our own and contracted
generation positions which have not been hedged. Our hedging program involves the hedging of commodity price risk for our expected generation,typically on a ratable basis over three-year periods. As of December 31, 2020, the percentage of expected generation hedged for the Mid-Atlantic, Midwest,New York, and ERCOT reportable segments is 94%-97% for 2021. The percentage of expected generation hedged is the amount of equivalent sales dividedby the expected generation. Expected generation is the volume of energy that best represents our commodity position in energy markets from owned orcontracted generation based upon a simulated dispatch model that makes assumptions regarding future market conditions, which are calibrated to marketquotes for power, fuel, load following products and options. Equivalent sales represent all hedging products, which include economic hedges and certainnon-derivative contracts, including our sales to ComEd, PECO, BGE, Pepco, DPL and ACE to serve their retail load.
A portion of our hedging strategy may be accomplished with fuel products based on assumed correlations between power and fuel prices, which
routinely change in the market. Market price risk exposure is the risk of a change in the value of unhedged positions. The forecasted market price riskexposure for our entire economic hedge portfolio associated with a $5 reduction in the annual average around-the-clock energy price based onDecember 31, 2020 market conditions and hedged position would be a decrease in pre-tax net income of approximately $15 million for 2021. Power pricesensitivities are derived by adjusting power price assumptions while keeping all other price inputs constant. We actively manage our portfolio to mitigatemarket price risk exposure for our unhedged position. Actual results could differ depending on the specific timing of, and markets affected by, pricechanges, as well as future changes in our portfolio. See Note 16 — Derivative Financial Instruments of the Notes to Consolidated Financial Statements foradditional information.
Fuel Procurement We procure natural gas through long-term and short-term contracts, and spot-market purchases. Nuclear fuel assemblies are obtained
predominantly through long-term uranium concentrate supply contracts, contracted conversion services, contracted enrichment services, or a combinationthereof, and contracted fuel fabrication services. The supply markets for uranium concentrates and certain nuclear fuel services are subject to pricefluctuations and availability restrictions. Supply market conditions may make our procurement contracts subject to credit risk related to the potential non-performance of counterparties to deliver the contracted commodity or service at the contracted prices. Approximately 60% of our uranium concentraterequirements from 2021 through 2025 are supplied by three suppliers. In the event of non-performance by these or other suppliers, we believe thatreplacement uranium concentrates can be obtained, although at prices that may be unfavorable when compared to the prices under the current supplyagreements. Non-performance by these counterparties could have a material adverse impact on our financial statements.
119

Trading and Non-Trading Marketing Activities The following table detailing our trading and non-trading marketing activities are included to address the recommended disclosures by the energy
industry’s Committee of Chief Risk Officers (CCRO). The following table provides detail on changes in our commodity mark-to-market net asset or liability balance sheet position from December 31,
2018 to December 31, 2020. It indicates the drivers behind changes in the balance sheet amounts. This table incorporates the mark-to-market activities thatare immediately recorded in earnings. This table excludes all NPNS contracts and does not segregate proprietary trading activity. See Note 16 — DerivativeFinancial Instruments of the Notes to Consolidated Financial Statements for additional information on the balance sheet classification of the mark-to-market energy contract net assets (liabilities) recorded as of December 31, 2020 and 2019.
(in millions)
Mark-to-market Energy Contract Net Assets
(Liabilities) Balance as of December 31, 2018(a) $ 548 Total change in fair value during 2019 of contracts recorded in result of operations (427)Reclassification to realized at settlement of contracts recorded in results of operations 226 Changes in allocated collateral 572 Net option premium received 29 Option premium amortization (22)Upfront payments and amortizations(b) (58)Balance as of December 31, 2019(a) $ 868 Total change in fair value during 2020 of contracts recorded in result of operations (203)Reclassification to realized at settlement of contracts recorded in results of operations 469 Changes in allocated collateral (513)Net option premium paid 139 Option premium amortization (104)Upfront payments and amortizations(b) 73 Balance as of December 31, 2020(a) $ 729
(a) Amounts are shown net of collateral paid to and received from counterparties.(b) Includes derivative contracts acquired or sold through upfront payments or receipts of cash, excluding option premiums, and the associated
amortizations.
120

Fair Values The following table presents maturity and source of fair value for mark-to-market commodity contract net assets (liabilities). The table provides
two fundamental pieces of information. First, the table provides the source of fair value used in determining the carrying amount of our total mark-to-market net assets (liabilities), net of allocated collateral. Second, the table shows the maturity, by year, of our commodity contract net assets (liabilities), netof allocated collateral, giving an indication of when these mark-to-market amounts will settle and either generate or require cash. See Note 18 — Fair Valueof Financial Assets and Liabilities of the Notes to Consolidated Financial Statements for additional information regarding fair value measurements and thefair value hierarchy.
Maturities Within
(in millions) 2021 2022 2023 2024 2025 2026 andBeyond
Total FairValue
Normal Operations, Commodity derivative contracts(a)(b):
Actively quoted prices (Level 1) $ (48) $ 8 $ 8 $ 11 $ 17 $ — $ (4)Prices provided by external sources (Level 2) 212 78 13 (1) 1 — 303Prices based on model or other valuation methods (Level 3) 215 109 75 20 10 1 430
Total $ 379 $ 195 $ 96 $ 30 $ 28 $ 1 $ 729
(a) Mark-to-market gains and losses on other economic hedge and trading derivative contracts that are recorded in the results of operations.(b) Amounts are shown net of collateral paid to and received from counterparties (and offset against mark-to-market assets and liabilities) of $416 million
at December 31, 2020.
Credit Risk We would be exposed to credit-related losses in the event of non-performance by counterparties that execute derivative instruments. The credit
exposure of derivative contracts, before collateral, is represented by the fair value of contracts at the reporting date. See Note 16—Derivative FinancialInstruments of the Notes to Consolidated Financial Statements for a detailed discussion of credit risk.
The following tables provide information on our credit exposure for all derivative instruments, normal purchases and normal sales agreements,
and payables and receivables, net of collateral and instruments that are subject to master netting agreements, as of December 31, 2020. The tables furtherdelineate that exposure by credit rating of the counterparties and provide guidance on the concentration of credit risk to individual counterparties and anindication of the duration of a company’s credit risk by credit rating of the counterparties. The figures in the table below exclude credit risk exposure fromindividual retail customers, uranium procurement contracts, and exposure through RTOs, ISOs, and commodity exchanges, which are discussed below.
Rating as of December 31, 2020 (in millions)
TotalExposure
Before CreditCollateral
CreditCollateral(a)
NetExposure
Number ofCounterparties
Greater than 10%of Net Exposure
Net Exposure ofCounterparties
Greater than 10%of Net Exposure
Investment grade $ 577 $ 27 $ 550 — $ —Non-investment grade 32 — 32 — —No external ratings
Internally rated—investment grade 165 1 164 — —Internally rated—non-investment grade 80 28 52 — —
Total $ 854 $ 56 $ 798 — $ —
121

Maturity of Credit Risk Exposure
Rating as of December 31, 2020 (in millions) Less than2 Years
2-5Years
ExposureGreater than
5 Years
Total ExposureBefore Credit
Collateral Investment grade $ 520 $ 36 $ 21 $ 577Non-investment grade 32 — — 32No external ratings
Internally rated—investment grade 128 25 12 165 Internally rated—non-investment grade 67 10 3 80
Total $ 747 $ 71 $ 36 $ 854
Net Credit Exposure by Type of Counterparty (in millions) As of December 31, 2020 Financial institutions $ 15 Investor-owned utilities, marketers, power producers 607 Energy cooperatives and municipalities 138 Other 38 Total $ 798
(a) As of December 31, 2020, credit collateral held from counterparties where we had credit exposure included $31 million of cash and $25million of letters of credit.
Credit-Risk-Related Contingent Features As part of the normal course of business, we routinely enter into physical or financial contracts for the sale and purchase of electricity, natural gas,
and other commodities. In accordance with the contracts and applicable law, if we are downgraded by a credit rating agency, especially if such downgradeis to a level below investment grade, it is possible that a counterparty would attempt to rely on such a downgrade as a basis for making a demand foradequate assurance of future performance. Depending on our net position with a counterparty, the demand could be for the posting of collateral. In theabsence of expressly agreed-to provisions that specify the collateral that must be provided, collateral requested will be a function of the facts andcircumstances of the situation at the time of the demand. See Note 16 — Derivative Financial Instruments of the Notes to Consolidated FinancialStatements for additional information regarding collateral requirements and Note 19 — Commitments and Contingencies of the Notes to ConsolidatedFinancial Statements for additional information regarding the letters of credit supporting the cash collateral.
We transact output through bilateral contracts. The bilateral contracts are subject to credit risk, which relates to the ability of counterparties to meet
their contractual payment obligations. Any failure to collect these payments from counterparties could have a material impact on our financial statements.As market prices rise above or fall below contracted price levels, we are required to post collateral with purchasers; as market prices fall below contractedprice levels, counterparties are required to post collateral with us. To post collateral, we depend on access to bank credit facilities, which serve as liquiditysources to fund collateral requirements. See “Liquidity and Capital Resources — Credit Matters” of “Management's Discussion and Analysis of FinancialCondition and Results of Operations” for additional information.
RTOs and ISOs We participate in all, or some, of the established, wholesale spot energy markets that are administered by PJM, ISO-NE, NYISO, CAISO, MISO,
SPP, AESO, OIESO, and ERCOT. ERCOT is not subject to regulation by FERC but performs a similar function in Texas to that performed by RTOs inmarkets regulated by FERC. In these areas, power is traded through bilateral agreements between buyers and sellers and on the spot energy markets that areadministered by the RTOs or ISOs, as applicable. In areas where there is no spot energy market, electricity is purchased and sold solely through bilateralagreements. For sales into the spot markets administered by an RTO or ISO, the RTO or ISO maintains financial assurance policies that are established andenforced by those administrators. The credit policies of the RTOs and ISOs may, under certain circumstances, require that losses arising from the default ofone member on spot energy market transactions be shared by the remaining participants. Non-performance or non-payment by a major counterparty couldresult in a material adverse impact on our financial statements.
122

Exchange Traded Transactions We enter into commodity transactions on NYMEX, ICE, NASDAQ, NGX, and the Nodal exchange ("the Exchanges"). The Exchange
clearinghouses act as the counterparty to each trade. Transactions on the Exchanges must adhere to comprehensive collateral and margining requirements.As a result, transactions on Exchanges are significantly collateralized and have limited counterparty credit risk.
Interest Rate and Foreign Exchange Risk We use a combination of fixed-rate and variable-rate debt to manage interest rate exposure. We may also utilize interest rate swaps to manage our
interest rate exposure. A hypothetical 50 basis point increase in the interest rates associated with unhedged variable-rate debt (excluding CommercialPaper) and fixed-to-floating swaps would result in approximately a $2 million decrease in our pre-tax income for the year ended December 31, 2020. Tomanage foreign exchange rate exposure associated with international energy purchases in currencies other than U.S. dollars, we utilize foreign currencyderivatives, which are typically designated as economic hedges. See Note 16—Derivative Financial Instruments of the Notes to Consolidated FinancialStatements for additional information.
Equity Price Risk We maintain trust funds, as required by the NRC, to fund certain costs of decommissioning its nuclear plants. As of December 31, 2020, our NDT
funds are reflected at fair value in the Consolidated Balance Sheets. The mix of securities in the trust funds is designed to provide returns to be used to funddecommissioning and to compensate us for inflationary increases in decommissioning costs; however, the equity securities in the trust funds are exposed toprice fluctuations in equity markets, and the value of fixed-rate, fixed-income securities are exposed to changes in interest rates. We actively monitor theinvestment performance of the trust funds and periodically reviews asset allocation in accordance with our NDT fund investment policy. A hypothetical 25basis points increase in interest rates and 10% decrease in equity prices would result in a $851 million reduction in the fair value of the trust assets. Thiscalculation holds all other variables constant and assumes only the discussed changes in interest rates and equity prices. See “Liquidity and CapitalResources” under “Management's Discussion and Analysis of Financial Condition and Results of Operations” for additional information of equity pricerisk as a result of the current capital and credit market conditions.
MANAGEMENT
Directors and Executive Officers
We have not yet finalized the composition of our Board or management following the separation. We will select the members of our Board andmanagement prior to the separation, and information concerning each member, such as biographies and the qualifications and experience each personwould bring to our Board or management, as the case may be, will be included in an amendment to this information statement. As of the distribution date,our Board is expected to consist of members, of whom will meet applicable regulatory and exchange listing independence requirements.
Our Corporate Governance
Our corporate governance will be structured in a manner that we believe will align our interests with those of our shareholders. Following the separation, we anticipate that our corporate governance will include the following notable features: Board Diversity. Our Nominating and Governance Committee is responsible for reviewing with the board of directors, on an annual basis, the
appropriate characteristics, skills and experience required for the board of directors as a whole and its individual members. In evaluating the suitability ofindividual candidates (both new candidates and current members), the Nominating and Governance Committee, in recommending candidates for election,and the board of directors, in approving (and, in the case of vacancies, appointing) such candidates, will take into account many factors, including thefollowing:
· personal and professional integrity, ethics and values;· experience in corporate management, such as serving as an officer or former officer of a publicly held company;
123

· experience as a board member or executive officer of another publicly held company;· strong finance experience;· diversity of expertise and experience in substantive matters pertaining to our business relative to other board members;· diversity of background and perspective, including with respect to age, gender, race, place of residence and specialized experience;· experience relevant to our business industry and with relevant social policy concerns; and· relevant academic expertise or other proficiency in an area of our business operations.
Currently, our board evaluates each individual in the context of the board of directors as a whole, with the objective of assembling a group that can
best maximize the success of the business and represent shareholder interests through the exercise of sound judgment using its diversity of experience inthese various areas.
Composition of the Board of Directors Following the Separation
Upon completion of the separation, our amended and restated articles of incorporation and amended and restated bylaws will provide that ourboard of directors may consist of no less than and no more than directors. The number of directors on our board of directors will be fixedexclusively by our board of directors, subject to the minimum and maximum number permitted by our amended and restated articles of incorporation andbylaws. We expect our board of directors to have members, of whom we expect will qualify as “independent” under the Nasdaq Stock MarketRules (the “Marketplace Rules”).
There will be no cumulative voting in the election of directors, and a director will be elected by receiving a majority of votes cast in uncontested
elections and by a plurality of the votes cast in any contest election of directors.
Committees of the Board of Directors
Following the separation, our board of directors will have an audit committee, a compensation committee, and a nominating and governancecommittee, each of which will have the composition and responsibilities described below and whose members will satisfy the applicable independencestandards of the SEC and the transition periods provided under the rules and regulations of the Marketplace Rules. The charter of each such standingcommittee will be posted on our website in connection with the separation. Our board of directors may also establish from time to time any othercommittees that it deems necessary or desirable. The members of our committees may change subject to the discretion of our board of directors.
Audit Committee Upon completion of the separation, we expect our audit committee will consist of , with serving as chair. It will function pursuant to a
written charter adopted by the board of directors. The audit committee’s responsibilities will include, among other things: · Assists the board of directors in the oversight and review of the quality and integrity of the Company’s financial statements and internal
controls over financial reporting· Appoints, retains and oversees the independent auditor and evaluates its qualifications, performance, independence and fees· Oversees the Company’s internal audit function· Reviews the processes by which the Company assesses and manages enterprise risk· Oversees compliance with the Company’s Code of Business Conduct, and the process for the receipt and responses to complaints regarding
accounting, internal controls, ethics or audit matters
The responsibilities of our audit committee will be more fully described in our audit committee charter. Our board of directors is expected todetermine that each of the committee’s members satisfy the applicable independence and other requirements of the Marketplace Rules and the SEC foraudit committees and that qualifies as an “audit committee financial expert” as defined under applicable SEC rules and regulations.
124

Compensation Committee Upon completion of the separation, we expect our compensation committee will consist of , with serving as chair. It will function
pursuant to a written charter adopted by the board of directors. The compensation committee’s responsibilities will include, among other things:
· Assists the board of directors in establishing performance criteria, evaluation, and compensation for CEO· Approves executive compensation program design for executive officers, other than the CEO· Monitors and reviews leadership and succession information for executive roles· Retains the Committee’s independent compensation consultant· Reviews Compensation Discussion and Analysis and prepares Compensation Committee Report for proxy statements
The responsibilities of our compensation committee, which are anticipated to be substantially the same as the responsibilities of Exelon’s
compensation committee, and its procedures for the consideration and determination of executive compensation, will be more fully described in ourcompensation committee charter. Our board of directors is expected to determine that each of the committee’s members satisfy the applicable independenceand other requirements of the Marketplace Rules, the SEC and the IRS for compensation committee members.
Nominating and Governance Committee Upon completion of the separation, we expect our nominating and governance committee will consist of , with serving as chair. It will
function pursuant to a written charter adopted by the board of directors. The nominating and corporate governance committee’s responsibilities willinclude, among other things:
· Identifies and recommends qualified candidates for election by the board of directors and shareholders and oversees the board of directors and
committee structure and compensation· Recommends Corporate Governance Guidelines and advises on corporate governance issues including evaluation processes for the board of
directors, committees, each director, the chair of the board of directors and CEO· Oversees the Company’s environmental strategies, including climate change and sustainability policies· Reviews the Company’s director compensation program and retains an independent compensation consultant· Has authority to retain an independent search firm to identify candidates for a director
The responsibilities of our nominating and governance committee and the process for identifying and evaluating director nominees (including
nominees recommended by shareholders) will be more fully described in our nominating and governance committee charter. Our board of directors isexpected to determine that each of the committee’s members satisfy the applicable independence and other requirements of the Marketplace Rules and theSEC for nominating and governance committee members.
Director Independence
We expect that our board of directors, upon recommendation of our nominating and governance committee, will formally determine theindependence of our directors following the separation. We expect that a majority of the directors will be independent. We expect that our board ofdirectors will determine that the following directors, who are anticipated to be elected to our board, are independent: . We expect that our board ofdirectors will determine the independence of directors annually based on a review by the directors and the nominating and governance committee. Indetermining whether a director is independent, we expect that our board of directors will determine whether each director meets the objective standards forindependence set forth in the Marketplace Rules.
Meetings of Independent Directors
We expect that our independent directors will meet regularly in executive session.
Attendance at Annual Meeting of Shareholders
Although we do not expect to have a formal policy regarding attendance by members of our board of directors at our annual meeting ofshareholders, we intend to encourage our directors to attend and expect that at least a majority of our board of directors will attend the annual meeting.
125

Shareholder Communication
We expect that our board of directors will adopt a policy that will permit shareholders and other interested parties to communicate directly with theboard, any committee of our board or any individual director.
Risk Oversight
We expect that our board of directors will rely on each of its committees to help oversee the risk management responsibilities relating to thefunctions performed by such committees. Our audit committee will periodically discuss with management our major financial risk exposures and the stepsmanagement has taken to monitor and control such exposures, including our risk assessment and risk management policies. Our compensation committeewill help the board of directors to identify our exposure to any risks potentially created by our compensation programs and practices. Our nominating andgovernance committee will oversee risks relating to our policies and assist the board of directors and management in promoting an organizational culturethat encourages robust governance practices and oversight. Each of these committees will be required to make regular reports of its actions and anyrecommendations to the board of directors, including recommendations to assist the board of directors with its overall risk oversight function.
Compensation Committee Interlocks and Insider Participation
We expect that none of the members of our compensation committee will have at any time been one of our officers or employees or have anyrelationships with us of the type that is required to be disclosed under Item 404 of Regulation S-K. We expect that none of our executive officers will haveserved at any time as a member of the board of directors, compensation committee or other board committee performing equivalent functions of any entitythat has one or more executive officers serving as one of our directors or on our compensation committee.
Code of Conduct and Ethics
Prior to the completion of the separation, our board of directors will adopt a code of conduct and ethics (the “Code of Ethics”) that will apply to allof our directors, officers and employees, including our principal executive officer, principal financial officer, principal accounting officer and personsperforming similar functions. The Code of Ethics will be available upon written request to our corporate secretary or on our website, which we currentlyintend to make available at following the completion of separation. If we amend or grant any waiver from a provision of our Code of Ethics that applies toour executive officers, we will publicly disclose such amendment or waiver on our website and as required by applicable law. The information containedon, or accessible from, our website is not part of this information statement by reference or otherwise.
EXECUTIVE AND DIRECTOR COMPENSATION
Compensation Discussion & Analysis
The Company is currently a wholly owned subsidiary (which, prior to the separation, will own Generation and its subsidiaries) of ExelonCorporation and its compensation committee has not yet been formed. All decisions regarding 2020 compensation of Generation and its subsidiaries’named executive officers were made by the Compensation and Leadership Development Committee of the Exelon board of directors (referred to in thissection as the “Exelon Compensation Committee”) if the executive previously served as an executive officer of Exelon, or otherwise by Exelonmanagement. After the distribution, the executive compensation programs, policies and practices for the Company’s executive officers will be subject to thereview and approval of the Compensation Committee of the Company board (the “Company Compensation Committee”).
For purposes of this Compensation Discussion and Analysis and the following executive compensation tables, the individuals referred to as the
“named executive officers” (“NEOs”) are Generation and its subsidiaries’ principal executive officer, principal financial officer and the three most highlycompensated executive officers of Generation and its subsidiaries’ based on 2020 compensation. The compensation discussed in this section refers tolegacy Exelon compensation plans. The compensation philosophy and design for Generation and its subsidiaries’ executive officers going forward isdiscussed in the section entitled “Management” in this information statement.
The individuals determined to be our NEOS based on 2020 compensation are listed below. The Company’s executive management has not yet
been determined and the individuals listed below may not be NEOs going forward.
126
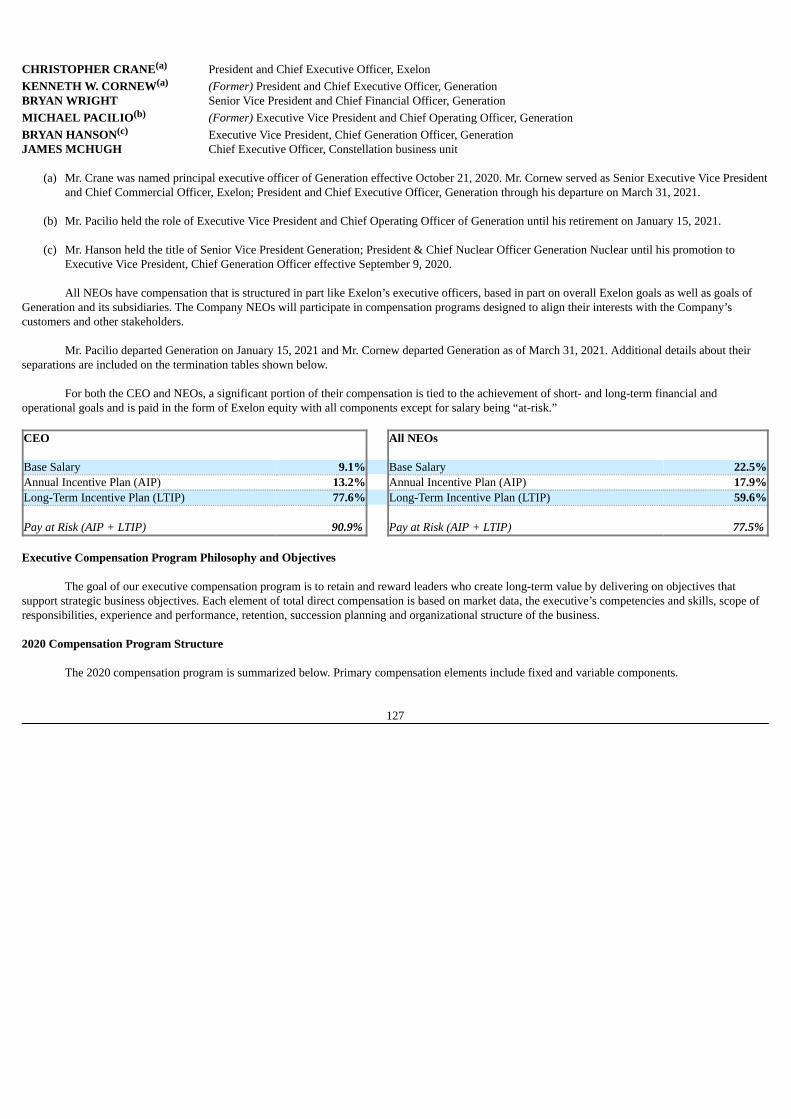
CHRISTOPHER CRANE(a) President and Chief Executive Officer, ExelonKENNETH W. CORNEW(a) (Former) President and Chief Executive Officer, GenerationBRYAN WRIGHT Senior Vice President and Chief Financial Officer, GenerationMICHAEL PACILIO(b) (Former) Executive Vice President and Chief Operating Officer, GenerationBRYAN HANSON(c) Executive Vice President, Chief Generation Officer, GenerationJAMES MCHUGH Chief Executive Officer, Constellation business unit
(a) Mr. Crane was named principal executive officer of Generation effective October 21, 2020. Mr. Cornew served as Senior Executive Vice Presidentand Chief Commercial Officer, Exelon; President and Chief Executive Officer, Generation through his departure on March 31, 2021.
(b) Mr. Pacilio held the role of Executive Vice President and Chief Operating Officer of Generation until his retirement on January 15, 2021.
(c) Mr. Hanson held the title of Senior Vice President Generation; President & Chief Nuclear Officer Generation Nuclear until his promotion to
Executive Vice President, Chief Generation Officer effective September 9, 2020.
All NEOs have compensation that is structured in part like Exelon’s executive officers, based in part on overall Exelon goals as well as goals ofGeneration and its subsidiaries. The Company NEOs will participate in compensation programs designed to align their interests with the Company’scustomers and other stakeholders.
Mr. Pacilio departed Generation on January 15, 2021 and Mr. Cornew departed Generation as of March 31, 2021. Additional details about their
separations are included on the termination tables shown below. For both the CEO and NEOs, a significant portion of their compensation is tied to the achievement of short- and long-term financial and
operational goals and is paid in the form of Exelon equity with all components except for salary being “at-risk.”
CEO
All NEOs
Base Salary 9.1% Base Salary 22.5%Annual Incentive Plan (AIP) 13.2% Annual Incentive Plan (AIP) 17.9%Long-Term Incentive Plan (LTIP) 77.6% Long-Term Incentive Plan (LTIP) 59.6% Pay at Risk (AIP + LTIP)
90.9%
Pay at Risk (AIP + LTIP)
77.5%
Executive Compensation Program Philosophy and Objectives
The goal of our executive compensation program is to retain and reward leaders who create long-term value by delivering on objectives thatsupport strategic business objectives. Each element of total direct compensation is based on market data, the executive’s competencies and skills, scope ofresponsibilities, experience and performance, retention, succession planning and organizational structure of the business.
2020 Compensation Program Structure
The 2020 compensation program is summarized below. Primary compensation elements include fixed and variable components.
127

Pay Element Form Shareholder AlignmentSalary Cash a) Fixed income at competitive, market-based levels attracts and retains top talent. AnnualIncentive Plans (“AIP”)
Cash b) Motivates executives to achieve key annual financial and operational goals that reflect commitment to superioroperations and supporting our customers and communities
Long-TermIncentivePlan (“LTIP”)
Performance Shares (67% of
LTIP)
c) Drives executive focus on long-term goals supporting utility growth, financial results, and capital stewardshipd) Rewards relative achievement of financial goals and stock price compared to utility peers (“UTY”) over three-yearperiode) Aligns the interests of executives with stockholders by capping payouts if absolute TSR is negative for the prior 36-month period
RestrictedStock
(33% ofLTIP)
f) Balances LTI portfolio providing executive with market competitive time-based award.
2020 Base Salaries
Base salaries for 2020 were determined by the Exelon Compensation Committee for Messrs. Crane and Cornew. The Exelon CompensationCommittee also set the base salary for Mr. Hanson following his promotion in September 2020. When evaluating whether to make any adjustments, theExelon Compensation Committee considers a number of factors including the outcome of the annual merit review, results of the annual market assessmentof executive compensation provided by Exelon Compensation Committee’s independent compensation consultant, the need to retain experiencedexecutives, individual performance, scope of responsibility, leadership skills and values, current compensation, internal equity, and legacy matters.
Base salaries for the remaining Generation and subsidiary NEOs are set by the Exelon CEO. Base salaries may be adjusted (1) as part of the
annual merit review or (2) based on a promotion or significant change in job scope. The Exelon CEO considers the results of the annual market assessmentin addition to the following factors when contemplating a merit review: individual performance, scope of responsibility, leadership skills and values,current compensation, internal equity, and legacy matters.
In January 2020 as part of its annual merit review, the Exelon Compensation Committee recommended Mr. Crane’s base salary be held flat based
on the annual market assessment conducted by the independent compensation consultant, Meridian Compensation Partners, LLC. At the same time, theExelon Compensation Committee approved a 2.5% increase in base salary for Mr. Cornew. For each other NEO, Mr. Crane approved a 2.5% increase inbase salary. Merit increases were effective March 1, 2020.
In September 2020, Mr. Hanson was promoted to Executive Vice President and Chief Generation Officer and his total direct compensation was
increased accordingly.
2020 Annual Incentive Plan (AIP) Overview and Goal Setting
AIP metrics are linked to business goals and strategic focus areas. The goal-setting process employs a multi-layer approach and analysis thatincorporates a blend of objective and subjective business considerations and other analytical methods to ensure that the goals are sufficiently rigorous. Suchconsiderations include:
Recent History - Goals generally reflect a logical progression of results from the recent past Relative Performance - Performance is evaluated against a relevant group of Generation and its subsidiaries’ peers Strategic Aspirations - Near- and intermediate-term goals follow a trend line consistent with long-term aspirations Shareholder Expectations - Goals are aligned with externally communicated financial guidance and shareholder expectations
128

Sustainable Sharing - Earned awards reflect a balanced degree of shared benefits between shareholders and participants The following process was used to determine 2020 AIP awards for each NEO: 1) Set AIP Target - Expressed as percentage of base salary. Mr. Crane’s annual incentive target was 145% and for the other NEOs, the annual
incentive targets ranged from 50%-100%.
2) Determine Performance Factor - Based on various financial and operating metrics.
3) Determine Individual Performance Multiplier (IPM) – IPM measures individual performance and ranged from 50% to 110% (target of100%). Messrs. Crane, Cornew, and Hanson were not eligible for an IPM. For the other NEOs, the IPMs were approved by Mr. Crane up to amaximum of 110%.
4) Apply Final Multiplier – Multiply the target award by the performance factor and then multiply the outcome by the IPM. Awards could
range from 0% to 200% of target (target of 100%).
The following tables detail the 2020 threshold, target, and distinguished, i.e., maximum, performance goals, and the results achieved for the AIP.The Exelon Compensation Committee selected the performance metrics below as they align with the long-term business strategy.
Messrs. Crane, Cornew, and Hanson (for Mr. Hanson, for September 9 – December 31, 2020 only):
2020 Goals Threshold Target Distinguished
2020 Actual Results
UnadjustedPayout as a % of Target
WeightedPerformance
Exelon Adjusted (non-GAAP) Operating EPS1* $ 2.97 $3.19 - $3.22 $ 3.57 $ 3.08 75.00% 52.5%CAIDI 92 85 80 80 200.00% 15.0%SAIFI 0.82 0.69 0.56 0.59 176.92% 13.27%Fleetwide Capacity Factor 91.954% 93.954% 95.847% 94.381% 122.56% 9.19%Dispatch Match 94.8% 97.4% 99.4% 98.4% 150.00% 11.25% Payout: 101.21% Mr. Hanson (January 1 – September 8, 2020):
2020 Goals Threshold Target Distinguished
2020 Actual Results
UnadjustedPayout as a % of Target
WeightedPerformance
Exelon Adjusted (non-GAAP) Operating EPS1* $ 2.97 $3.19 - $3.22 $ 3.57 $ 3.08 75.00% 37.5%Generation Operating Net Income ($M)* $ 1,124.0 $ 1,208.6 $ 1,353.6 $ 1,410.3 200.00% 50.00%Fleetwide Capacity Factor % 91.954% 93.954% 95.847% 94.381% 122.56% 30.64% Payout: 118.14% Mr. Wright
2020 Goals Threshold Target Distinguished
2020 Actual Results
UnadjustedPayout as a % of Target
Board Limiter
Application Average of Nuclear, Power,and Constellation KPIs 50% 100% 200% 131.86% 131.86% YES Payout: 130.00%
129

Mr. Pacilio
2020 Goals Threshold Target Distinguished
2020 Actual Results
UnadjustedPayout as a % of Target
WeightedPerformance
Exelon Adjusted (non-GAAP)Operating EPS1* $ 2.97 $3.19 - $3.22 $ 3.57 $ 3.08 75.00% 37.5%Generation Operating NetIncome ($M)* $ 1,124.0 $ 1,208.6 $ 1,353.6 $ 1,410.3 200.00% 50.00%Average of Nuclear andPower KPIs 50% 100% 200% 141.1% 141.1% 35.3% Payout: 122.78% Mr. McHugh
2020 Goals Threshold Target Distinguished
2020 Actual Results
UnadjustedPayout as a % of Target
WeightedPerformance
Exelon Adjusted (non-GAAP)Operating EPS1* $ 2.97 $3.19 - $3.22 $ 3.57 $ 3.08 75.00% 37.5%Generation Operating NetIncome ($M)* $ 1,124.0 $ 1,208.6 $ 1,353.6 $ 1,410.3 200.00% 50.0%Constellation Adj EBIT* $ 5,987.2 $ 6,507.8 $ 7,288.8 $ 6,437.4 93.24% 23.3% Payout: 110.81% (1) Exelon’s 2020 Adjusted EPS was $3.22. However, for purposes of determining the 2020 AIP payouts for Exelon executives, $3.08 was used,
which excludes the impact of $0.14 of unrealized gain from equity investments.* Exelon reports its financial results in accordance with accounting principles generally accepted in the United States (GAAP) and supplements its
reporting with certain non-GAAP financial measures, including adjusted (non-GAAP) operating earnings per share, earned ROE, and FFO/Debt toenhance investors’ understanding of Exelon’s performance. Our method of calculating adjusted (non-GAAP) operating earnings and operating ROEmay not be comparable to other companies’ presentations.
Adjusted (non-GAAP) operating earnings per share exclude certain costs, expenses, gains and losses and other specified items, including mark-to-market adjustments from economic hedging activities, unrealized gains and losses from nuclear decommissioning trust fund investments, certain costsassociated with plant retirements and divestitures, costs related to cost management programs, and other items as set forth in the table belowreconciling adjusted (non-GAAP) operating earnings from GAAP earnings, which is the most directly comparable GAAP measure. Management usesadjusted (non-GAAP) operating earnings as one of the primary indicators to evaluate performance, allocate resources, set incentive compensationtargets and plan and forecast future periods. We believe the measure enhances an investor’s overall understanding of period over period financialresults and provides an indication of Exelon’s baseline operating performance by excluding items that are considered by management to not be directlyrelated to the ongoing operations of the business. The table below reconciles reported GAAP Earnings per share to adjusted (non-GAAP) operating earnings per share for 2020 (amounts may not adddue to rounding).
2020 GAAP Earnings (Loss) Per Share 2.01 Adjustments: Mark-to-market impact of economic hedging activities (0.22)Unrealized gains related to nuclear decommissioning trust (NDT) funds (0.26)Asset impairments 0.41 Plant retirements and divestitures 0.74
130

Cost management program 0.05 Change in environmental liabilities 0.02 COVID-19 direct costs 0.05 Deferred Prosecution Agreement Payments 0.20 Asset retirement obligation 0.05 Income tax-related adjustments 0.07 Noncontrolling interests 0.11 2020 Adjusted (non-GAAP) Operating Earnings (Loss) Per Share 3.22
Earned ROE is calculated using adjusted (non-GAAP) operating earnings, reflecting all lines of business for the utility businesses (electric distribution,gas distribution, transmission), divided by average shareholder’s equity over the year. Management uses operating ROE as a measurement of the actualperformance of the company’s utility business. FFO/Debt is a coverage ratio that compares funds from operations to total debt and is a key ratio analyzed by the credit rating agencies in determiningExelon’s credit rating. An investment grade rating is critical as it increases the ability to participate in commercial business opportunities, lowerscollateral requirements, creates reliable and cost-efficient access to capital markets and increases business and financial flexibility. The ratio iscalculated following S&P’s current methodology. The most directly comparable GAAP measure to FFO is GAAP Cash Flow from Operations and themost directly comparable GAAP measure to Debt is Long-Term Debt plus Short-Term Borrowings. Management uses FFO/Debt to evaluate financialrisk by measuring the company’s ability to service debt using cash from operations. We believe the measure enhances an investor’s overallunderstanding of the creditworthiness of Exelon’s operating companies. Due to the forward-looking nature of some forecasted non-GAAP measures, information to reconcile the forecasted adjusted (non-GAAP) measures tothe most directly comparable GAAP measure may not be currently available; therefore, management is unable to reconcile these measures.
The following table shows how the formula was applied and the actual amounts awarded. The Exelon Compensation Committee applied negativediscretion to limit Mr. Wright’s payout to 130% of target.
NEO
AIP Target(%)
AIP Target
($)
FormulaicPerformance
Factor(Note 1)
IndividualPerformance
Multiplier (IPM)
Actual Award
($) Crane 145% 1,874,850 101.21% 100% 1,897,536 Cornew 100% 951,541 101.21% 100% 963,055 Wright 50% 226,504 130.00% 105% 309,178 Pacilio 85% 742,050 122.78% 110% 1,002,198 Hanson 80% 560,000 101.21% 100% 594,728 McHugh 80% 525,600 110.81% 105% 611,538
Mr. Hanson’s AIP award was prorated based on the performance goals prior to his promotion in September 2020 (performance factor of 118.14%) and theperformance goals after his promotion (101.21%). Long-Term Incentive Plan (LTIP) Overview & Goal Setting Process
The Exelon Compensation Committee grants long-term equity incentive awards annually at its January or February meeting. When the total targetequity incentive award is determined, the value is split between RSUs (33%) and performance shares (67%).
131

Restricted Stock Units (“RSUs”). RSUs granted to NEOs vest ratably over a three-year period. RSUs receive dividend equivalents that are
reinvested as additional RSUs and remain subject to the same vesting conditions as the underlying RSUs. RSUs are not subject to any performance metrics. Performance Shares. Performance shares granted to NEOs in January 2020 are earned based on performance achieved for the three-year period
ending on December 31, 2022. The performance metrics underlying the 2020-2022 performance share awards are listed below. These are the sameperformance metrics underlying the performance shares granted for the 2018-2020 and 2019-2021 performance cycles.
Performance share metrics: Why it is ImportantUtility Earned ROE* (33.3%) Average utility ROE weighted by year-end rate base. Earned ROE is calculated usingadjusted (non-GAAP) operating earnings, reflecting all lines of business for the utilitybusinesses (electric distribution, gas distribution, transmission), divided by averageshareholder’s equity over the year.
Measure of value created by utility businesses. Aligned with ourstrategy to invest in our utilities where we can earn anappropriate return.
Utility Net Income (33.3%) Aggregate utility adjusted (non-GAAP) operating earnings, including Exelon hold-conet operating income (loss)
Measures financial performance of the Utilities. Aligned withour strategy to grow our regulated utility business.
Exelon FFO/Debt* (33.4%) Funds from operations to total debt ratio. The ratio is calculated following S&P’scurrent methodology. Management uses FFO/Debt to evaluate financial risk bymeasuring ability to service debt using cash from operations
Key ratio for determining our credit rating and thereby ouraccess to capital. Aligned with our strategy to generate free cash
and reduce debt.
* See definitions of Non-GAAP measures on page 130
Setting Performance Share Targets. Performance share targets are set based on external commitments and/or probability modeling. Theperformance scale range for the Utility ROE and Utility Net Income metrics was based on the following probability levels of achievement: 95% forthreshold and 5% for distinguished with the target aligned with projected performance. The target for the Exelon FFO/Debt metric is aligned with theexpectations of credit rating agencies.
Actual Targets Disclosed After Each Cycle. Actual targets used in our performance share cycles are not disclosed until each cycle is completed to
safeguard the confidentiality of our long-term outlook on projected performance. This policy supports the propriety of our long-standing disclosurepractices to only issue annual performance guidance as part of our financial disclosure policies.
Performance Share Awards Subject to TSR Modifier and Cap. Performance share awards are subject to a total shareholder return (“TSR”) modifier
that compares Exelon’s performance relative to the performance of the UTY index on a point by point basis. Performance share awards are also subject to aTSR cap that will limit payouts at target if TSR is negative for the prior 36-month period.
The Exelon Compensation Committee used the following process to determine performance share targets and awards: (1) Establish Performance Share Award Target - Targets are set in January/February of the first year of the performance cycle.
(2) Determine Performance Multiplier - The Performance Multiplier is based on performance achieved over the three-year cycle. Performance
can range from 0% to 150% of target (target of 100%).
(3) Determine TSR Modifier - Calculated by subtracting the TSR of the UTY over the three-year performance period from Exelon’s TSR for thesame three-year period.
(4) Calculate Final Multiplier - Calculated by multiplying the Performance Multiplier by (100% + TSR Modifier). This value is the Final
Multiplier.
(5) Apply Final Multiplier & TSR Cap (if applicable) - Apply the Final Multiplier to determine the number of shares issued. If Exelon’sabsolute TSR for the final 12-month of the performance period is negative, payout will be capped at 100%. (Beginning with the 2020-2022cycle, the TSR cap will apply if TSR is negative for the prior 36-month period.) Awards can range from 0% to 200% of target (target of100%) after application of the TSR modifier.
132

2018 – 2020 Performance and Performance Share Payout Determinations
The following table details the 2018 - 2020 threshold, target, and distinguished performance goals, and the results achieved. The performancemultiplier for the 2018 - 2020 Performance Share awards was calculated to be 76.01% of target, based on the following:
Performance Share Scorecard
Metric
Weighting Threshold
(50%) 75% Target(100%) 125%
Distinguished(150%)
ActualScore
ActualAward v.Metric
WeightingUtility Earned ROE*
33.3% 8.0% 9.3% 10.7% 8.7% 25.62%
Utility Net Income 33.3% $1,587 $1,880 $2,185 $1,740 25.34%
Exelon FFO/Debt* 33.4%
≥16.0% and
<17.0%
≥17.0% and
<18.0%
≥18.0% and
<22.0% ≥22.0% and
<24.0% ≥24.0% 17.8% 25.05%
Committee Approved Performance: 76.01% The Utility Earned ROE* and Utility Net Income use interpolation between threshold, target, and distinguished levels of performance whereas theFFO/Debt* metric uses a “stair-step” approach with no interpolation between the performance levels. * See definitions of Non-GAAP measures on page 130
Payout Determinations. The Exelon Compensation Committee approved a payout of 63.65%, based on 2018 - 2020 performance and theapplication of a TSR modifier of -16.26% based on 2018 - 2020 TSR performance relative to the UTY.
The following table shows how the formula was applied and the actual amounts awarded.
NEO Target Shares
Performance Factor
ActualAward
Crane 176,541 x 63.65% = 112,368 Cornew 51,020 x 63.65% = 32,474 Wright 8,531 x 63.65% = 5,430 Pacilio 36,927 x 63.65% = 23,504 Hanson 25,346 x 63.65% = 16,133 McHugh 27,547 x 63.65% = 17,534
Performance Awards Settled in Common Stock and/or Cash. Pursuant to the terms of the long-term incentive program, all NEOs that have
achieved 200% or more of their stock ownership targets receive performance share award payouts in cash. Other performance share participants who havenot achieved 200% of their stock ownership targets receive payouts that are settled 50% in shares of Exelon common stock and 50% in cash.
133

Performance Share Goal Rigor
To ensure adequate rigor for the financial targets applicable to the 2020-2022 performance share cycle, we conducted statistical simulations tounderstand the level of difficulty of our payout range. We conducted a sensitivity analysis of reasonable value ranges for several internal and externalvariables that are significant drivers of performance, and we also examined historical levels of deviation of Generation and its subsidiaries’ performancecompared to plan.
2020 Target Compensation for Named Executive Officers
The table below lists the target value of the compensation elements for each NEO as of December 31, 2020.
Cash Compensation Long-Term Incentives
NEOBase($)
AIPTarget
Target Total Cash($)
RSUs (33% of
LTIP)($)
PerformanceShares (67% of
LTIP)($)
Target Total LTIP
($)
Target Total Direct
Compensation($)
Crane 1,293,000 145% 3,167,850 3,630,000 7,370,000 11,000,000 14,167,850Cornew 951,541 100% 1,903,082 963,204 1,955,596 2,918,800 4,821,882Wright 453,008 50% 679,512 161,040 326,960 488,000 1,167,512Pacilio 873,000 85% 1,615,050 697,125 1,415,375 2,112,500 3,727,550Hanson 700,000 80% 1,260,000 684,750 1,390,250 2,075,000 3,335,000McHugh 657,000 80% 1,182,600 552,750 1,122,250 1,675,000 2,857,600 Shareholder Engagement
The Exelon Compensation Committee regularly reviews executive compensation, taking into consideration input received through regular andongoing engagement with investors. Feedback is typically solicited throughout the year in connection with the annual meeting of shareholders and theExelon Compensation Committee’s review of the executive compensation program. The Chairs of Exelon’s Compensation and Corporate GovernanceCommittees participated in select investor discussions in 2020. Feedback from all discussions was shared with the appropriate board committee and/or thefull board. Shareholders in general expressed their approval of the ongoing executive compensation program and did not request any significant changesduring our engagement conversations.
2020 Compensation Decisions – Setting Target Total Direct Compensation (“TDC”)
Setting Target TDC for Mr. Crane: The Exelon Compensation Committee is responsible for reviewing and recommending the Exelon CEO’s targettotal direct compensation. The CEO’s compensation is then approved by the independent members of the Exelon board. The Exelon CompensationCommittee fulfills this responsibility by analyzing peer group compensation and performance data with its independent compensation consultant. TheCommittee also reviews the various elements of the CEO’s compensation in the context of the target TDC, which includes base salary, annual and long-term incentive target opportunities.
Setting Target TDC for Messrs. Cornew, and Hanson: The Exelon Compensation Committee is also responsible for approving the executive
compensation for each of Exelon’s executive officers (including Messrs. Cornew and Hanson) by analyzing peer group compensation and performancedata. Mr. Hanson’s compensation was first included under the Committee’s scope as of September 9, 2020 as a result of his promotion.
Setting Target TDC for the other NEOs: The Exelon CEO analyzes a variety of data to gauge market competitiveness, including peer group
compensation and performance data provided by Exelon’s independent compensation consultant. TDC can vary by named executive officer based oncompetencies and skills, scope of responsibilities, the executive’s experience and performance, retention, succession planning and the organizationalstructure of the businesses (e.g., internal alignment and reporting relationships).
134

Role of the Compensation Consultant
As referenced earlier, the Exelon Compensation Committee retains Meridian Compensation Partners, LLC (“Meridian”), an independentcompensation consultant, to support its duties and responsibilities. Meridian provides advice and counsel on executive and director compensation mattersand provides information and advice regarding market trends, competitive compensation programs, and strategies including as described below:
· Market data for each senior executive position, including evaluating Exelon’s compensation strategy and reviewing and confirming the peer
group used to prepare the market data,
· An independent assessment of management recommendations for changes in the compensation structure,
· Assisting management to ensure Generation and its subsidiaries’ executive compensation programs are designed and administered consistentwith the Exelon Compensation Committee’s requirements, and
· Ad hoc support on executive compensation matters and related governance trends.
Peer Groups Used for Benchmarking 2020 Executive Compensation
Exelon uses a blended peer group for assessing our executive compensation program that consists of two sub-groups: energy services peers andgeneral industry peers because (1) there are not enough energy services peers with size, scale and complexity comparable to Exelon to create a robustenergy services-only peer group, and (2) Exelon’s market for attracting talent includes general industry peers, with key executives hired from severalFortune 100 companies. When selecting general industry peers, we look for capital asset-intensive companies with size, scale and complexity similar toExelon, and we also consider the extent to which they may be subject to the effects of volatile commodity prices similar to Exelon’s sensitivity tocommodity price volatility. Exelon evaluates its peer group on an annual basis in July and adjusts for changes with our energy and general industry peerswhen needed.
Exelon’s revenues are at the 64th percentile of the following blended peer group comprising 21 companies: (1) Energy Services (11 peer companies): American Electric Power Company, Inc.; Dominion Energy, Inc.; DTE Energy; Duke Energy
Corporation; Edison International; Entergy Corporation; FirstEnergy Corporation; NextEra Energy, Inc.; Public Service Enterprise Group,Inc.; Sempra Energy; and The Southern Company.
(2) General Industry (10 peer companies): 3M Company; Deere & Company; Delta Air Lines; General Dynamics Corporation; Honeywell
International, Inc.; International Paper Company; Lockheed Martin; Marathon Petroleum Company; Northrop Grumman Corporation; andValero Energy Corporation.
Because there is a correlation between the size of an organization and its compensation levels, market data is statistically adjusted using a regressionanalysis. This commonly applied technique allows for a more precise estimate of the market value of Generation and its subsidiaries given the size andscope of responsibility for Generation and its subsidiaries’ executive roles. Each element of NEO compensation is then compared to these size-adjustedmedians of the peer group.
In preparation for the separation, we are reviewing the peers to be used for benchmarking the assessment of 2022 compensation for namedexecutive officers of the Company.
Stock Ownership
To strengthen the alignment of executive interests with those of Exelon’s shareholders, officers of Generation and its subsidiaries are required toown certain amounts of Exelon common stock five years following his or her employment or promotion to a new position (six-times base salary for Mr.Crane; two to three times base salary for the other NEOs). As of the annual measurement date of September 30, 2020, all NEOs had exceeded 200% oftheir stock ownership guidelines. We expect to adopt a similar stock ownership policy for officers of the Company.
Prohibition on Hedging and Pledging of Common Stock; Other Trading Requirements
Exelon requires executive vice presidents and above who wish to sell Exelon common stock to do so only through the adoption of a stock tradingplan meeting the requirements of SEC Rule 10b5-1(c). This requirement is designed to enable officers with the ability to diversify holdings in an orderlymanner to meet personal financial plans. Our insider trading policy includes provisions that prohibit directors and employees (including officers) andcertain of their related persons (including certain family members and entities which they own a significant interest) from engaging in short sales, put orcall options, hedging transactions, pledging, or other derivative transactions involving Exelon stock. We expect to adopt a similar policy for officers of theCompany.
135
Clawback Policy
The Exelon board of directors approved its current clawback policy in 2018. The policy provides broad discretionary ability to clawback incentivecompensation when deemed appropriate. Under the policy, the Exelon board has sole discretion to recoup incentive compensation if it determines that (a)the incentive compensation was based on the achievement of financial or other results that were subsequently restated or corrected, (b) the incentive planparticipant engaged in fraud or intentional misconduct that caused or contributed to the need for restatement or correction, (c) a lower incentive plan awardwould have been made to the participant based on the restated or corrected results, and (d) recoupment is not precluded by applicable law or employmentagreements.
The Exelon board or Exelon Compensation Committee may also seek to recoup incentive compensation paid or payable to current or former
incentive plan participants if, in its sole discretion, the Exelon board or Exelon Compensation Committee determines that (a) the current or former incentiveplan participant breached a restrictive covenant or engaged or participated in misconduct or intentional or reckless acts or omissions or serious neglect ofresponsibilities that caused or contributed to a significant financial loss or serious reputational harm to Exelon or its subsidiaries regardless of whether afinancial statement restatement or correction of incentive plan results was required, and (b) recoupment is not precluded by applicable law or employmentagreements.
We expect to adopt clawback policies that are similar to those maintained by Exelon.
Risk Management Assessment of Compensation Policies and Practices
The Exelon Compensation Committee reviews Exelon’s compensation policies and practices as they relate to the risk management practices andrisk-taking incentives. The Exelon Compensation Committee partners with Generation’s enterprise risk management group to assess and validate that thecontrols in place continued to mitigate incentive compensation risks.
Tax Consequences
Under Section 162(m) of the Internal Revenue Code (the Code), generally NEO compensation over $1 million for any year is not deductible forUnited States income tax purposes. The Compensation and Leadership Development Committee believes that it must maintain flexibility in its approach toexecutive compensation in order to structure a program that it considers to be the most effective in attracting, motivating and retaining the Company’s keyexecutives, and therefore, the deductibility of compensation is one of several factors considered when making executive compensation decisions.
136

Executive Compensation Tables
2020 Summary Compensation Table
Name Year Salary
($)
Bonus($)
(Note 1)
StockAwards
($)(Note 2)
Non-EquityIncentive PlanCompensation
($)(Note 3)
Change inPension
Value andNonquali-
fiedDeferredCompen-
sationEarnings
($)(Note 4)
All OtherCompen-
sation($)
(Note 5) Total
($) Christopher Crane President and CEO, Exelon 2020 1,293,000 — 11,000,013 1,897,536 757,754 214,500 15,162,803 Kenneth Cornew (Former) President and ChiefExecutive Officer,Generation 2020 947,189 — 2,918,828 963,055 299,794 338,335 5,467,201 Bryan Wright Senior Vice President andChief Financial Officer,Generation 2020 450,936 64,723 488,016 294,455 123,461 25,975 1,447,566 Michael Pacilio (Former) Executive VicePresident and ChiefOperating Officer,Generation 2020 869,067 91,109 2,112,544 911,089 870,150 67,338 4,921,297 Bryan Hanson Chief Generation Officer,Generation 2020 686,418 — 1,450,054 594,728 885,522 59,602 3,676,324 James McHugh Chief Executive Officer,Constellation business unit 2020 653,981 29,121 1,675,059 582,417 26,209 60,738 3,027,525 Notes to the Summary Compensation Table
(1) In recognition of their overall performance, certain NEOs received an individual performance multiplier (IPM) to their annual incentivepayments or other special recognition awards. Messrs. Crane, Cornew and Hanson were not eligible for an IPM.
(2) The amounts shown in this column include the aggregate grant date fair value of restricted stock unit and performance share unit awards for
the 2020-2022 performance period granted January 27, 2020. The grant date fair values of the stock awards have been computed inaccordance with FASB ASC Topic 718 using the assumptions described in Note 21 of the Combined Notes to Consolidated FinancialStatements included in Exelon’s 2020 Annual Report on Form 10-K. The 2020-2022 performance share award component of the stock awardvalues depicted above are subject to performance conditions and the grant date fair value assumes the achievement of the target level ofperformance; however, values may be higher based on performance including the maximum total shareholder return multiplier as follows:
137

Performance Share Award
Value
Name At Target
($)
At Maximum
($) Crane 7,370,008 14,740,016 Cornew 1,955,607 3,911,214 Wright 326,967 653,934 Pacilio 1,415,406 2,830,812 Hanson 971,540 1,943,080 McHugh 1,122,284 2,244,568
(3) The amounts shown in this column for 2020 represent payments made pursuant to the Annual Incentive Plan.
(4) The amounts shown in this column represent the change in the accumulated pension benefit for the NEOs from December 31, 2019 to
December 31, 2020. None of the NEOs had above market earnings in a non-qualified deferred compensation account in 2020.
(5) All Other Compensation: The following table describes the incremental cost of other benefits provided in 2020 that are shown in this column.
All Other Compensation
Name
Perquisites($)
(Note 1)
Reimbursementfor Income
Taxes($)
(Note 2)
ExelonContributions to
Savings Plans($)
(Note 3)
ExelonPaid
TermLife
InsurancePremiums
($)(Note 4)
Total($)
Crane 108,713 3,257 64,545 37,985 214,500 Cornew 271,930 17,363 45,290 3,752 338,335 Wright 7,500 — 14,150 4,325 25,975 Pacilio 19,340 375 43,056 4,567 67,338 Hanson 19,343 1,669 34,476 4,114 59,602 McHugh 24,382 428 31,552 4,376 60,738 Notes to All Other Compensation Table (1) Amounts reported for personal benefits provided to NEOs include: (1) transportation related benefits (including corporate aircraft, parking,
spousal and family travel); and (2) other benefits (including personal financial planning, company gifts, and matching charitable contributions).
a. Amounts reported for the personal use of corporate aircraft are based on the aggregate incremental cost to Exelon and are calculatedusing the hourly incremental cost for flight services, including federal excise taxes, fuel charges, and domestic segment fees. Exelon’s board-approved policy on corporate aircraft usage includes spousal/domestic partner and other family member usage when appropriate. Amountsreported in this column for Mr. Crane include $81,873 for personal use of corporate aircraft. b. Amounts include the value received by Mr. Cornew due to Generation’s agreement to have its relocation vendor purchase at anappraised value the Baltimore residence purchased by Mr. Cornew in connection with his relocation to Baltimore as Chief Executive Officerof Constellation business unit. The value of the benefit included is $216,640, based on a determination of the difference between the averageof two appraisals to be received and the price Mr. Cornew paid for the home in 2012 plus qualified capital improvements as provided forunder the executive relocation program’s standard terms.
138

c. Limited personal financial planning benefits valued at $16,840 for each executive are provided with usage values imputed as additionaltaxable income. Executive officers may request matching gifts to qualified charitable organizations in amounts up to $10,000 and up to$15,000 for Mr. Cornew under the Constellation Energy Group, Inc. legacy policy.
(2) Exelon provides reimbursements of tax obligations incurred when: employees are required to work outside their state of home residence andencounter double taxation in states and localities where tax credits are not permitted in home state tax filings; business-related spousal travelinvolves personal benefits and income is imputed to the employee and for required relocation and housing/living expenses incurred in compliancewith regulatory requirements.
(3) The amounts represent the respective corporate matching contributions to the NEOs’ accounts. Each of the named executive officers participated
in the 401(k) Plan and the Deferred Compensation Plan. Mr. Wright does not participate in the Deferred Compensation Plan.
(4) Exelon provides basic term life insurance, accidental death and disability insurance, and long-term disability insurance to all employees, includingNEOs. The values shown in this column include the premiums paid during 2020 for additional term life insurance policies for the NEOs and foradditional supplemental accidental death and dismemberment insurance and long-term disability over and above the basic coverage provided to allemployees.
139

2020 Grants of Plan-Based Awards
Estimated Possible Payouts UnderNon-Equity Incentive Plan Awards
(Note 1)
Estimated Possible Payouts UnderEquity Incentive Plan Awards
(Note 2)
AllOtherStock
Awards:Number
of Sharesor Units
Grant Date
Fair Valueof Stock
and Option
Awards
Name GrantDate
Threshold($)
Plan($)
Maximum ($)
Threshold(#)
Target(#)
Maximum(#)
(#)(Note 3)
($)(Note 4)
Crane 1/27/20 70,307 1,874,850 3,749,700 1/27/20 25,991 155,913 311,826 7,370,008 1/27/20 76,793 3,630,005 Cornew 1/27/20 35,683 951,541 1,903,082 1/27/20 6,897 41,371 82,742 1,955,607 1/27/20 20,377 963,221 Wright 1/27/20 56,626 226,504 453,008 1/27/20 1,153 6,917 13,834 326,967 1/27/20 3,407 161,049 Pacilio 1/27/20 46,378 742,050 1,484,100 1/27/20 4,991 29,943 59,886 1,415,406 1/27/20 14,748 697,138 Hanson 1/27/20 21,000 560,000 1,120,000 1/27/20 3,426 20,553 41,106 971,540 1/27/20 10,123 478,514 McHugh 1/27/20 32,850 525,600 1,051,200 1/27/20 3,958 23,742 47,484 1,122,284 1/27/20 11,694 552,775
Notes to Grants of Plan-Based Awards Table
(1) All NEOs have annual incentive plan target opportunities based on a fixed percentage of base salaries. Under the terms of the AIP, thresholdperformance earns 50% of the respective target, while performance at plan earns 100% of the respective target and the maximum payout is cappedat 200% of target.
a. For Messrs. Crane, Cornew, and Hanson, the possible payout at threshold for AIP was calculated at 3.75% of target based on a threshold
payout of 50% for the lowest weighted metric of 7.5%.
b. For Mr. Wright, the possible payout at threshold for AIP was calculated at 25% of target based on a threshold payout of 50% and anindividual performance multiplier of 50%.
c. For Messrs. Pacilio and McHugh, the possible payout at threshold for AIP was calculated at 6.25% of target based on threshold payout of
50% for the lowest weighted metric and an individual performance multiplier of 50%.
For additional information about the terms of these programs, see “Compensation Discussion and Analysis” above.
(2) NEOs have a long-term performance share unit target opportunity that is a fixed number of performance share units commensurate with theofficer’s position. The possible payout at threshold for performance share unit awards was calculated at 16.67% of target. The possible maximumpayout for performance share units was calculated at 150% of target, with an uncapped total shareholder return multiplier, capped at 200% oftarget. For additional information about the terms of these programs, see Compensation Discussion and Analysis and the footnotes to theSummary Compensation Table above.
140

(3) This column shows restricted stock unit awards made during the year. The vesting dates of the awards are provided in footnote 2 to the
Outstanding Equity Table below.
(4) This column shows the grant date fair value, calculated in accordance with FASB ASC Topic 718, of the performance share unit awards andrestricted stock units granted to each NEO during 2020. Fair value of performance share unit awards granted on January 27, 2020 are based on anestimated payout of 100% of target.
2020 Outstanding Equity Awards at Year End
Option Awards(Note 1) Stock Awards
Name
Number ofSecurities
UnderlyingUnexercised
OptionsThat Are
Exercisable(#)
Number ofSecurities
UnderlyingUnexercised
OptionsThat Are Not
Exercisable(#)
OptionExerciseor Base
Price($)
OptionExpiration
Date
Numberof Shares
or Units ofStock That
Have Not YetVested
(#)(Note 2)
Market Valueof Shares or
Units of StockThat Have
NotYet Vested
Based on12/31 Closing
Price $42.22($)
(Note 2)
EquityIncentive
Plan Awards:Number ofUnearned
Shares, Units or Other Rights
ThatHave Not Yet
Vested(#)
(Note 3)
Equity IncentivePlan Awards:
Market or Payout Value or
UnearnedShares, Units or
Other RightsThat Have Not
YetVested
($)(Note 3)
Crane 285,000 — 39.21 04/02/22 278,970 11,778,113 623,192 26,311,166 94,000 — 43.40 01/24/21 — — — — Cornew 70,000 — 39.81 03/12/22 77,445 3,269,728 165,362 6,981,584 Wright — — — — 12,951 546,791 27,648 1,167,299 Pacilio — — — — 56,052 2,366,515 119,684 5,053,058 Hanson — — — — 78,478 3,313,341 82,150 3,468,373 McHugh — — — — 44,905 1,895,889 94,898 4,006,594 Notes to Outstanding Equity Table
(1) Non-qualified stock options were previously granted to NEOs pursuant to the Company’s long-term incentive plans. All grants are fully vestedand expire on the tenth anniversary of the grant date.
(2) The amount shown includes unvested restricted stock unit awards and the performance share award earned for the performance period beginning
January 1, 2018 and ending December 31, 2020, which vested on January 25, 2021. The unvested restricted stock unit awards are composed of thefinal third of the award made in January 2018, which vested on January 25, 2021; two-thirds of the award made in February 2019, half of whichvested on January 25, 2021 and half of which will vest on the date of the Exelon Compensation Committee’s first regular meeting in 2022; and thefull award granted on January 27, 2020, one-third of which vested on January 25, 2021 and one-third of which will vest on the date of each of theExelon Compensation Committee’s first regular meetings in 2022 and 2023, respectively. All RSU awards accrue additional shares throughautomatic dividend reinvestment. For Mr. Hanson, the amount shown includes grants of 40,000 restricted stock units awarded on January 29,2018, which vest on January 29, 2022. All shares are valued at $42.22, the closing price on December 31, 2020.
141

(3) The amount shown includes the target performance share awards granted on February 4, 2019 for the performance period ending December 31,2021 and the target performance share awards granted on January 27, 2020 for the performance period ending December 31, 2022. These targetawards have been increased to reflect the highest level of performance for the period, 200%. All shares are valued at $42.22, the closing price onDecember 31, 2020.
142
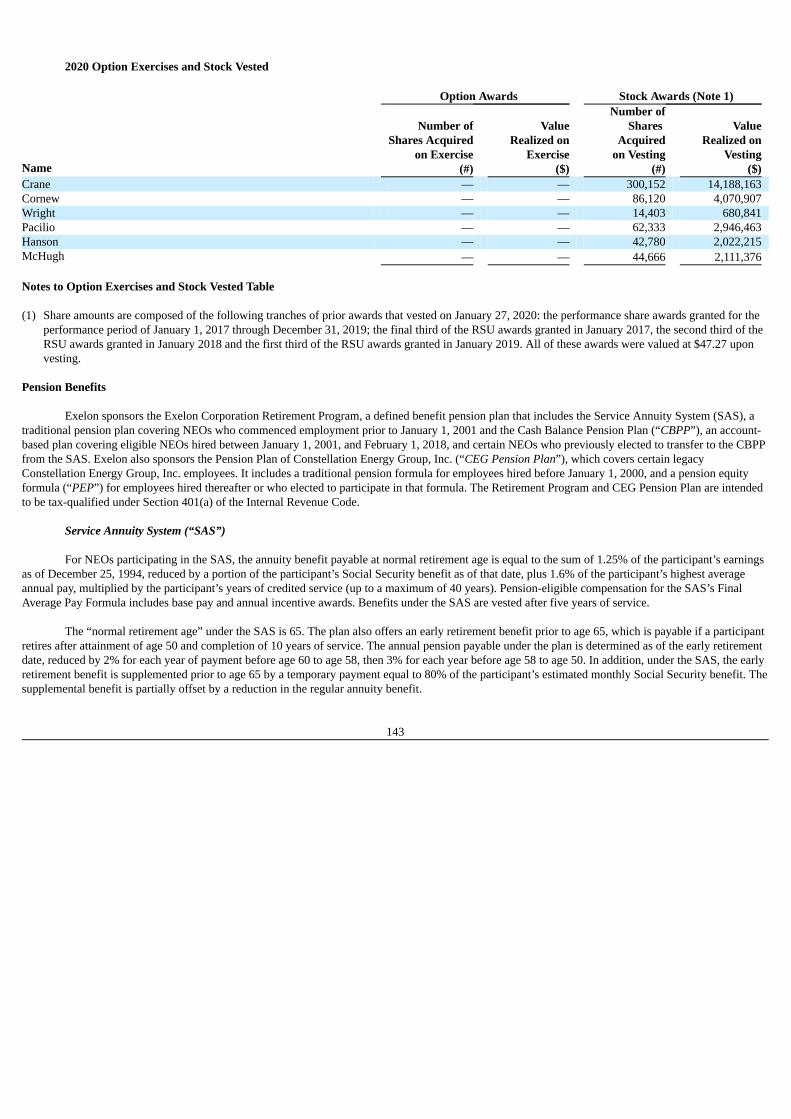
2020 Option Exercises and Stock Vested
Option Awards Stock Awards (Note 1)
Name
Number ofShares Acquired
on Exercise(#)
ValueRealized on
Exercise($)
Number ofShares
Acquiredon Vesting
(#)
ValueRealized on
Vesting($)
Crane — — 300,152 14,188,163 Cornew — — 86,120 4,070,907 Wright — — 14,403 680,841 Pacilio — — 62,333 2,946,463 Hanson — — 42,780 2,022,215 McHugh — — 44,666 2,111,376 Notes to Option Exercises and Stock Vested Table (1) Share amounts are composed of the following tranches of prior awards that vested on January 27, 2020: the performance share awards granted for the
performance period of January 1, 2017 through December 31, 2019; the final third of the RSU awards granted in January 2017, the second third of theRSU awards granted in January 2018 and the first third of the RSU awards granted in January 2019. All of these awards were valued at $47.27 uponvesting.
Pension Benefits
Exelon sponsors the Exelon Corporation Retirement Program, a defined benefit pension plan that includes the Service Annuity System (SAS), atraditional pension plan covering NEOs who commenced employment prior to January 1, 2001 and the Cash Balance Pension Plan (“CBPP”), an account-based plan covering eligible NEOs hired between January 1, 2001, and February 1, 2018, and certain NEOs who previously elected to transfer to the CBPPfrom the SAS. Exelon also sponsors the Pension Plan of Constellation Energy Group, Inc. (“CEG Pension Plan”), which covers certain legacyConstellation Energy Group, Inc. employees. It includes a traditional pension formula for employees hired before January 1, 2000, and a pension equityformula (“PEP”) for employees hired thereafter or who elected to participate in that formula. The Retirement Program and CEG Pension Plan are intendedto be tax-qualified under Section 401(a) of the Internal Revenue Code.
Service Annuity System (“SAS”)
For NEOs participating in the SAS, the annuity benefit payable at normal retirement age is equal to the sum of 1.25% of the participant’s earningsas of December 25, 1994, reduced by a portion of the participant’s Social Security benefit as of that date, plus 1.6% of the participant’s highest averageannual pay, multiplied by the participant’s years of credited service (up to a maximum of 40 years). Pension-eligible compensation for the SAS’s FinalAverage Pay Formula includes base pay and annual incentive awards. Benefits under the SAS are vested after five years of service.
The “normal retirement age” under the SAS is 65. The plan also offers an early retirement benefit prior to age 65, which is payable if a participantretires after attainment of age 50 and completion of 10 years of service. The annual pension payable under the plan is determined as of the early retirementdate, reduced by 2% for each year of payment before age 60 to age 58, then 3% for each year before age 58 to age 50. In addition, under the SAS, the earlyretirement benefit is supplemented prior to age 65 by a temporary payment equal to 80% of the participant’s estimated monthly Social Security benefit. Thesupplemental benefit is partially offset by a reduction in the regular annuity benefit.
143

Cash Balance Pension Plan (“CBPP”) For NEOs who participate in the CBPP, a notional account is established for each participant, and the account balance grows as a result of annual
benefit credits and annual investment credits. NEOs who transferred from the SAS to the CBPP also have a frozen transferred SAS benefit and received a“transition” credit based on age, service and compensation at the time of transfer. When the CBPP was initially established in 2001, it provided an annualbenefit credit of 5.75% of an employee’s base pay and annual incentive award for the year, and an annual investment credit based on the average of thatyear’s S&P 500 stock index return and the 30-year bond rate for the month of November (subject to 4% minimum). The benefit and investment credit rateshave been subsequently modified periodically pursuant to U.S. Treasury Department guidance on cash balance plans. NEO participants in the CBPPcurrently receive an annual benefit credit ranging from 7.0% to 10.5% (depending on length of service) of base salary and annual incentive award, and anannual investment credit based on the third segment spot rate of interest on long-term investment grade corporate bonds for the month of November of theyear (subject to a 4% minimum). Benefits vest after three years of service and are payable in an annuity or a lump sum at any time following termination ofemployment. Apart from the benefit credits and the vesting requirement, years of service are not relevant to a determination of accrued benefits under theCBPP.
In 2019, Generation and its subsidiaries also provided a one-time Transition Benefit Credit to all CBPP participants in recognition of the transitionto a fully fixed income investment credit rate. The amount of the credit ranged from 0% to 30.5% of 2018 annualized base pay, based on years of service asof December 31, 2007.
Pension Plan of Constellation Energy Group, Inc. (CEG Pension Plan) For NEOs who participate in the PEP, a lump sum benefit amount is computed based on covered earnings multiplied by a total credit percentage.
Covered earnings are equal to the average of the highest three of the last five twelve-month periods’ base pay plus annual incentive awards. The totalservice credit percentage is equal to the sum of the credit percentages based on the following formula: 5% per year of service through age 39, 10% per yearof service from age 40 to age 49, and 15% per year of service after age 49. No benefits are available under the PEP until a participant has at least threeyears of vesting service. Benefits payable under the PEP are paid as an annuity unless a participant elects a lump sum within 60 days after separation.
Supplemental Management Retirement Plan (“SMRP”) andConstellation Energy Group, Inc. Benefits Restoration Plan (“CEG BRP”) All NEOs participate in either the SMRP or the CEG BRP. The SMRP and CEG BRP provides supplemental benefits to the benefits provided
under the tax-qualified Retirement Program and CEG Pension Plan, respectively, for individuals whose annual compensation exceeds the limits imposedunder the Internal Revenue Code. Under the terms of the SMRP and the CEG BRP, participants are provided the amount of benefits they would havereceived under the SAS, CBPP or PEP but for the application of the Internal Revenue Code limits.
Up to two years of service credits may be provided under the SMRP upon a qualifying termination of employment under severance or change in
control agreements or awards that are intended to make up for lost pension benefits from another employer. The amount of the change in the pension value for each of the NEOs is the amount included in the Summary Compensation Table above. The
present value of each NEO’s accumulated pension benefit is shown in the following tables. The present value for CBPP participants is the account balance.
144

2020 Pension Benefits
Name Plan Name
Number ofYears Credited
Service(#)
Present Valueof Accumulated
Benefit($)
PaymentsDuring LastFiscal Year
($) Crane SAS 22.26 1,685,578 — SMRP(1) 32.26 19,344,451 — Cornew CBPP 26.59 962,826 — SMRP 26.59 2,293,831 — Wright PEP 17.33 506,333 — CEG BRP 17.33 893,213 — Pacilio SAS 38.53 3,179,938 — SMRP 38.53 11,327,758 — Hanson SAS 32.30 2,415,927 — SMRP 32.30 6,220,625 — McHugh CBPP 18.79 327,631 — SMRP 18.79 353,797 — a) Based on discount rates prescribed by the SEC proxy disclosure guidelines, Mr. Crane’s non-qualified SMRP present value is $19,344,451. Based on
lump sum plan rates for immediate distributions under the non-qualified plan, the comparable lump sum amount applicable for service throughDecember 31, 2020 is $28,495,474. Note that, in any event, payments made upon termination may be delayed by six months in accordance with U.S.Treasury Department guidance.
145

Deferred Compensation Programs
Exelon Corporation Deferred Compensation Plan The Exelon Corporation Deferred Compensation Plan is a non-qualified plan that permits the NEOs to defer certain cash compensation to
facilitate tax and retirement planning. The Deferred Compensation Plan also permits Generation and its subsidiaries to credit related matching contributionsthat would have been contributed to the Exelon Corporation Employee Savings Plan (the Exelon’s tax-qualified 401(k) plan) but for the applicable limitsunder the Internal Revenue Code.
Exelon Corporation Employee Savings Plan The Employee Savings Plan is intended to be tax-qualified under Sections 401(a) and 401(k) of the Internal Revenue Code. Exelon maintains the
Employee Savings Plan to attract and retain qualified employees, including the NEOs, and encourage retirement savings, which under the Plan may besupplemented by Generation and its subsidiaries’ matching contributions. Generation and its subsidiaries maintain the excess matching feature of theDeferred Compensation Plan to enable highly compensated employees to save for retirement to the extent they otherwise would have, were it not for thelimits established by the IRS.
Once participants in the Employee Savings Plan reach their statutory contribution limit during the year, their elected payroll contributions and
Generation and its subsidiaries’ matching contribution will be credited to their accounts in the Deferred Compensation Plans. The investment options underthe Deferred Compensation Plan consist of a basket of investment fund benchmarks substantially the same as those funds available through the EmployeeSavings Plan. Deferred amounts represent unfunded, unsecured obligations of Generation and its subsidiaries.
2020 Nonqualified Deferred Compensation
Name
ExecutiveContributions
in 2020($)
(Note 1)
RegistrantContributions
in 2020 ($)
(Note 2)
AggregateEarnings
in 2020($)
(Note 3)
AggregateWithdrawals/Distributions
($)
AggregateBalance at
12/31/20($)
(Note 4) Crane 75,425 44,179 (12,854) — 2,336,947 Cornew 19,824 24,272 (8,926) — 726,658 Wright — — — — — Pacilio 65,475 28,906 141,961 — 1,391,234 Hanson 56,510 21,897 6,846 — 200,703 McHugh 35,413 17,620 (8,029) — 72,528 Notes to Nonqualified Deferred Compensation Table
(1) The full amount shown for executive contributions is included in the base salary figures for each NEO shown above in the SummaryCompensation Table.
(2) The full amount shown under registrant contributions is included in Generation and its subsidiaries’ contributions to savings plans for each NEO
shown above in the All Other Compensation Table.
(3) The amount shown under aggregate earnings reflects the NEOs’ gain or loss based upon the individual allocation of his notional account balanceinto the basket of mutual fund benchmarks. These gains or losses do not represent current income to the NEO and have not been included in anyof the compensation tables shown above.
(4) For all NEOs the aggregate balance shown includes those amounts, both executive contributions and registrant contributions, that have been
disclosed either as base salary as described in Note 1 or as Generation and its subsidiaries’ contributions under all other compensation as describedin Note 2 for the current fiscal year ending December 31, 2020.
146

Potential Payments upon Termination or Change in Control
Each NEO is entitled to compensation in the event his or her employment terminates or upon a change in control. The Exelon CompensationCommittee adopted changes to severance and change in control benefits effective in 2020, with the amount of benefits payable being contingent upon avariety of factors, including the circumstances under which employment terminates.
Severance Benefits
NEOs are entitled to certain payments and benefits in connection with a termination of employment other than for cause (which generally includesrefusal to perform duties, willful or reckless acts or omissions, commission of a felony, a material violation of the Code of Business Conduct, or any breachof a restrictive covenant) or disability or resignation for good reason (which generally includes certain reductions in salary, demotions or materialreductions in the NEO’s position or duties) as provided for in the Senior Management Severance Plan (“SMSP”).
The “Severance Period” is 24 months after termination of employment for all NEOs except for Mr. Wright. The Severance Period for Mr. Wright
is 15 months. Benefits under the Plan include the following items.
Severance Pay Continued payment of base salary for the applicable Severance Period
Annual Incentive Target annual incentive awards for the applicable Severance Period and a pro-rated annual incentive award for the yearin which the termination of employment occurs.
Equity Awards
1. RSUs: Unvested awards are prorated based on date of termination and vest2. LTIP (including performance shares): Prorated portion vests based on actual performance; payable at the timeprovided for in the award terms3. Stock Options: Outstanding awards are exercisable to the extent the award was exercisable on the date oftermination and may be exercised until the earlier of 90 days from termination date or expiration date of award.
SMRP Benefits Benefit equal to the amount payable under the SMRP determined as if the SMSP benefit were fully vested and theseverance pay constituted covered compensation for purposes of the SMSP.
Retirement Benefits If applicable, benefits equal to the actuarial equivalent present value of any non-vested accrued benefit under Exelon’squalified defined benefit retirement plan. All current NEOs are fully vested.
Insurance, Health andWelfare Benefits
Life, disability, accident, health and other welfare benefit coverage continues during the severance pay period on thesame terms and conditions applicable to active employees, followed by retiree health coverage if applicable.1
Financial Planning Outplacement and financial planning services for at least 12 months.
1. Executives are eligible for retirement benefits, including retiree health coverage, if they are at least 55 years old and have completed at least10 years of service.
Payments under the SMSP are subject to reduction by Exelon to the extent necessary to avoid imposition of excise taxes imposed by Section 4999 of theInternal Revenue Code on excess parachute payments or under similar state or local law. Post-Termination Arrangement for Mr. Cornew
As previously announced, Mr. Cornew’s role was eliminated in connection with organizational restructurings and ongoing successionmanagement. Mr. Cornew entered into a separation agreement providing for his receipt of standard benefits provided under the non-change in controlprovisions of the SMSP, subject to customary waivers, releases, non-solicitation and non-compete provisions for two years following his departure dates.Benefits include a severance benefit equal to two times the sum of his base salary and target annual incentive awards. In addition, he is eligible for a pro-rated annual incentive award for 2021 based on the achievement of business performance metrics consistent with those applied to executive peers. Inaccordance with the terms in effect on the date of grant for outstanding equity awards, a portion of the performance share unit awards granted to Mr.Cornew will be prorated to reflect the portion of the performance period during which he was employed and all such awards will remain outstanding andsubject to their original performance-based vesting schedule. Outstanding restricted stock units will vest and any outstanding stock options will remainexercisable until their expiration date. Mr. Cornew will also be entitled to receive accrued pension benefits, health care coverage, and other SERP ordeferred compensation benefits, as applicable and as described above.
147

Mr. Cornew also received home sale relocation benefits under which Exelon’s relocation vendor purchased the Baltimore residence Mr. Cornew
acquired in connection with his relocation to Baltimore to take the role of Chief Executive Officer of Constellation business unit. The value of the benefit is$216,640, based on a determination of the difference between the average of two appraisals and the price Mr. Cornew paid for the home in 2012 plusqualified capital improvements as provided for under the executive relocation program’s standard terms.
Change in Control Benefits
NEOs are eligible for certain benefits upon certain involuntary terminations or a resignation for “good reason” (which generally includes certainreductions in compensation and benefits, reductions in position, duties or responsibilities, relocations or breaches by the company of the SMSP) inconnection with a change in control of Exelon Corporation. Pursuant to the terms of his separation agreement, Mr. Cornew is not eligible for change incontrol benefits.
Under the SMSP, a “change in control” includes any of the following: (a) when any person or group acquires 20% of Exelon’s then outstanding
common stock or of voting securities; (b) the incumbent members of the Exelon board (or new members nominated by a majority of incumbent directors)cease to constitute at least a majority of the members of the Exelon board; (c) consummation of a reorganization, merger or consolidation, or sale or otherdisposition of at least 50% of Exelon’s operating assets (excluding a transaction where Exelon shareholders retain at least 60% of the voting power); or (d)upon shareholder approval of a plan of complete liquidation or dissolution.
If the executive resigns for good reason or his or her employment is terminated by Exelon other than for cause or disability, during the period
commencing 90 days before a change of control or during the 24-month period following a change in control, the executive is entitled to the benefitsoutlined below.
Severance Pay The executive receives 2.99 times base salary (1.5 times for Mr. Wright) to be paid in substantially equal regularpayroll installments.
Annual Incentive Target annual incentive award for a period of 2.99 years (1.5 years for Mr. Wright) after termination of employmentand a pro-rated annual incentive award for the year in which the termination of employment occurs.
Equity Awards
1. RSUs: Unvested awards vest2. LTIP (including performance shares): Prorated portion vests based on actual performance; payable at the timeprovided for in the award terms3. Stock Options: Outstanding awards are immediately exercisable and may be exercised until the earlier of 5 yearsfrom termination date or expiration date of award.
SMRP BenefitsBenefit equal to the amount payable under the SMRP determined as if (1) the executive had 18 additional months (2.99years for Mr. Crane; 15 months for Mr. Wright) of age and years of service and (2) the severance pay constitutedcovered compensation for purposes of the SMRP.
Retirement Benefits Benefits equal to the actuarial equivalent present value of any non-vested accrued benefit under Exelon’s qualifieddefined benefit retirement plan. All current NEOs are fully vested.
Insurance, Health andWelfare Benefits
Life, disability, accident, health and other welfare benefit coverage continues during the severance pay period on thesame terms and conditions applicable to active employees, followed by retiree health coverage if applicable.1
Financial Planning Outplacement and financial planning services for at least 12 months.
Executives are eligible for retirement benefits, including retiree health coverage, if they are at least 55 years old and have completed at least 10 years ofservice.
148

2020 Estimated Value of Benefits to be Received Upon Retirement The following table shows the estimated value of payments and other benefits to be conferred upon the NEOs, except Mr. Cornew, assuming they
retired as of December 31, 2020. As of December 31, 2020, Mr. McHugh had not reached the minimum age required to be eligible for retirement benefits.These payments and benefits are in addition to the present value of the accumulated benefits from each NEO’s qualified and non-qualified pension plansshown in the tables within the Pension Benefit section and the aggregate balance due to each NEO that is shown in the tables within the DeferredCompensation section.
Name
Cash Payment ($)
(Note 1)
Value of UnvestedEquity Awards
($)(Note 2)
Total Value of All Payments and
Benefits ($)
(Note 3) Crane 1,898,000 27,643,000 29,541,000 Cornew — — — Wright 309,000 — 309,000 Pacilio 1,002,000 5,459,000 6,461,000 Hanson 595,000 3,748,000 4,343,000 McHugh — — — Notes to Benefits to be Received Upon Retirement Table
(1) Under the terms of the 2020 AIP, a pro-rated actual incentive award is payable upon retirement based on the number of days worked during theyear of retirement. The amount above represents the executive’s 2020 annual incentive payout after Generation or its applicablesubsidiary/business unit performance was determined.
(2) Includes the value of the executives’ unvested performance share awards granted in 2018, 2019, and 2020 assuming target performance and the
accelerated portion of the executives’ RSU awards that, per applicable awards agreements, would vest upon retirement. The value of the shares isbased on Exelon’s closing stock price on December 31, 2020 of $42.22.
(3) Estimate of total payments and benefits based on a December 31, 2020 retirement date.
149

2020 Estimated Value of Benefits to be Received Upon Termination due to Death or Disability
The following table shows the estimated value of payments and other benefits to be conferred upon the NEOs, except Mr. Cornew, assumingemployment is terminated due to death or disability as of December 31, 2020. These payments and benefits are in addition to the present value of theaccumulated benefits from the NEOs’ qualified and non-qualified pension plans shown in the tables within the Pension Benefit section and the aggregatebalance due to each NEO that is shown in tables within the Deferred Compensation section.
Name
Cash Payment($)
(Note 1)
Value of UnvestedEquity Awards
($)(Note 2)
Total Value of AllPayments and
Benefits($)
(Note 3) Crane 1,898,000 27,643,000 29,541,000 Cornew — — — Wright 309,000 1,262,000 1,571,000 Pacilio 1,002,000 5,459,000 6,461,000 Hanson 595,000 5,437,000 6,032,000 McHugh 612,000 4,321,000 4,933,000 Notes to Benefits to be Received Upon Termination due to Death or Disability Table
(1) Under the terms of the 2020 AIP, a pro-rated actual incentive award is payable upon death or disability based on the number of days workedduring the year of termination. The amount above represents the executives’ 2020 annual incentive payout after Generation’s or its applicablesubsidiary’s and/or business unit’s performance was determined.
(2) Includes the value of the executives’ unvested performance share awards granted in 2018, 2019, and 2020 assuming target performance and the
accelerated portion of the executives’ RSU awards that, per applicable awards agreements, would vest upon death or disability. The value of theshares is based on Exelon’s closing stock price on December 31, 2020 of $42.22.
(3) Estimate of total payments and benefits based on a December 31, 2020 termination due to death or disability.
150

2020 Estimated Value of Benefits to be Received Upon Involuntary Separation Not Related to a Change in Control
The following table shows the estimated value of payments and other benefits to be conferred upon the NEOs assuming they were terminated as of
December 31, 2020 under the terms of the SMSP. These payments and benefits are in addition to the present value of the accumulated benefits from theNEOs’ qualified and non-qualified pension plans shown in the tables within the Pension Benefit section and the aggregate balance due to each NEO that isshown in the tables within the Deferred Compensation section.
Name
CashPayment
($)(Note 1)
RetirementBenefit
Enhancement($)
(Note 2)
Value ofUnvested
Equity Awards($)
(Note 3)
Health andWelfareBenefit
Continuation($)
(Note 4)
PerquisitesAnd Other
Benefits($)
(Note 5)
Total Value ofAll Paymentsand Benefits
($)(Note 6)
Crane 8,234,000 2,471,000 27,643,000 112,000 40,000 38,500,000 Cornew 4,769,000 362,000 7,544,000 44,000 40,000 12,759,000 Wright 1,158,000 1,009,000 1,262,000 21,000 40,000 3,490,000 Pacilio 4,232,000 1,200,000 5,459,000 46,000 40,000 10,977,000 Hanson 3,115,000 1,411,000 4,735,000 39,000 40,000 9,340,000 McHugh 2,977,000 — 4,240,000 45,000 40,000 7,302,000 Notes to Benefits to be Received Upon Involuntary Separation Not Related to a Change in Control Table
(1) Represents the estimated severance benefit equal to 2.0 times (1.25 times for Mr. Wright) the sum of (i) current base salary and (ii) the targetannual incentive for the year of termination, plus a pro-rated annual incentive award for the year in which termination occurs. The amount aboverepresents the executives’ 2020 annual incentive payout after Generation or its applicable subsidiary/business unit performance was determined.
(2) Represents the estimated retirement benefit enhancement that consists of a one-time lump sum payment based on the actuarial present value of a
benefit under the non-qualified pension plan assuming that the severance pay period was taken into account for purposes of vesting, and theseverance pay constituted covered compensation for purposes of the non-qualified pension plan.
(3) Includes the value of the executives’ unvested performance share awards granted in 2018, 2019, and 2020 assuming target performance and the
accelerated portion of the executives’ RSU awards that, per applicable awards agreements, would vest upon an involuntary separation not relatedto a change of control. The value of the shares is based on Exelon’s closing stock price on December 31, 2020 of $42.22.
(4) Estimated costs of healthcare, life insurance, and long-term disability coverage which continue during the severance period.
(5) Estimated costs of outplacement and financial planning services for up to 12 months for all NEOs.
(6) Estimate of total payments and benefits based on a December 31, 2020 termination date.
151

2020 Estimated Value of Benefits to be Received Upon a Qualifying Termination following a Change in Control
The following table shows the estimated value of payments and other benefits to be conferred upon the NEOs, except Mr. Cornew, assuming theywere terminated upon a qualifying change in control as of December 31, 2020. These payments and benefits are in addition to the present value ofaccumulated benefits from the NEOs’ qualified and non-qualified pension plans shown in the tables within the Pension Benefit section and the aggregatebalance due to each NEO that is shown in tables within the Deferred Compensation section.
Name
CashPayment
($)(Note 1)
RetirementBenefit
Enhancement($)
(Note 2)
Value ofUnvested
Equity Awards($)
(Note 3)
Health andWelfareBenefit
Continuation($)
(Note 4)
PerquisitesAnd Other
Benefits($)
(Note 5)
Total Value of All Payments
and Benefits($)
(Note 6) Crane 11,370,000 3,976,000 27,643,000 168,000 40,000 43,197,000 Cornew — — — — — — Wright 1,328,000 1,082,000 1,262,000 26,000 40,000 3,738,000 Pacilio 5,831,000 1,854,000 5,459,000 68,000 40,000 13,252,000 Hanson 4,362,000 1,877,000 5,437,000 59,000 40,000 11,775,000 McHugh 4,148,000 — 4,321,000 68,000 40,000 8,577,000 Notes to Benefits to be Received Upon a Qualifying Termination following a Change in Control Table
(1) Represents the estimated cash severance benefit equal to 2.99 times (1.5 times for Mr. Wright) the sum of (i) current base salary and (ii) the annualincentive award at target, plus a pro-rated annual incentive award for the year in which termination occurs. The amount above represents theexecutives’ 2020 annual incentive payout after Generation or its applicable subsidiary/business unit performance was determined.
(2) Represents the estimated retirement benefit enhancement that consists of a one-time lump sum payment based on the actuarial present value of a
benefit under the non-qualified pension plan assuming that the severance pay period was taken into account for purposes of vesting, and theseverance pay constituted covered compensation for purposes of the non-qualified pension plan.
(3) Includes the value of the executives’ unvested performance shares, all of which will vest upon termination at the actual level earned and awarded
(it is assumed the 2018, 2019, and 2020 performance shares are earned at target) and the accelerated portion of the executives’ RSUs that wouldvest upon a qualifying termination following a change in control. The value of the shares is based on Exelon’s closing stock price on December31, 2020 of $42.22.
(4) Estimated costs of healthcare, life insurance and long-term disability coverage which continue during the severance period.
(5) Estimated costs of outplacement and financial planning services for up to 12 months for all NEOs.
(6) Estimate of total payments and benefits based on a December 31, 2020 termination date.
152
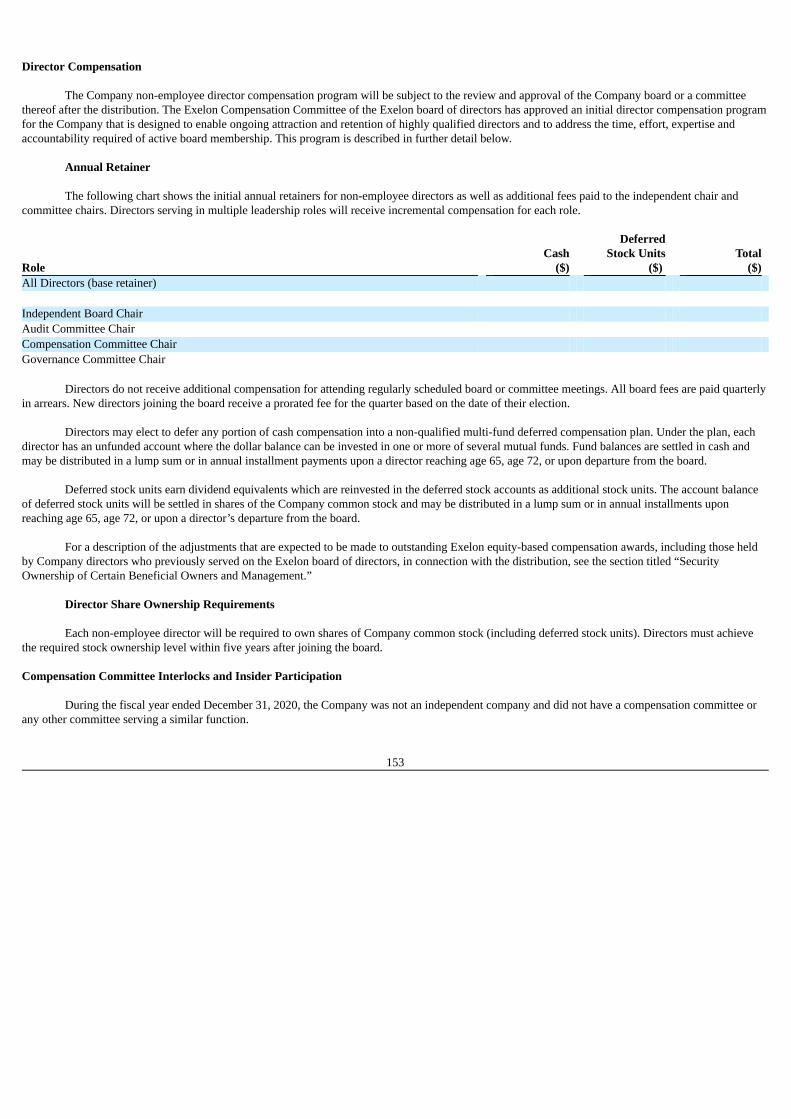
Director Compensation
The Company non-employee director compensation program will be subject to the review and approval of the Company board or a committeethereof after the distribution. The Exelon Compensation Committee of the Exelon board of directors has approved an initial director compensation programfor the Company that is designed to enable ongoing attraction and retention of highly qualified directors and to address the time, effort, expertise andaccountability required of active board membership. This program is described in further detail below.
Annual Retainer The following chart shows the initial annual retainers for non-employee directors as well as additional fees paid to the independent chair and
committee chairs. Directors serving in multiple leadership roles will receive incremental compensation for each role.
Role Cash
($)
DeferredStock Units
($) Total
($) All Directors (base retainer) Independent Board Chair Audit Committee Chair Compensation Committee Chair Governance Committee Chair
Directors do not receive additional compensation for attending regularly scheduled board or committee meetings. All board fees are paid quarterly
in arrears. New directors joining the board receive a prorated fee for the quarter based on the date of their election. Directors may elect to defer any portion of cash compensation into a non-qualified multi-fund deferred compensation plan. Under the plan, each
director has an unfunded account where the dollar balance can be invested in one or more of several mutual funds. Fund balances are settled in cash andmay be distributed in a lump sum or in annual installment payments upon a director reaching age 65, age 72, or upon departure from the board.
Deferred stock units earn dividend equivalents which are reinvested in the deferred stock accounts as additional stock units. The account balance
of deferred stock units will be settled in shares of the Company common stock and may be distributed in a lump sum or in annual installments uponreaching age 65, age 72, or upon a director’s departure from the board.
For a description of the adjustments that are expected to be made to outstanding Exelon equity-based compensation awards, including those held
by Company directors who previously served on the Exelon board of directors, in connection with the distribution, see the section titled “SecurityOwnership of Certain Beneficial Owners and Management.”
Director Share Ownership Requirements Each non-employee director will be required to own shares of Company common stock (including deferred stock units). Directors must achieve
the required stock ownership level within five years after joining the board. Compensation Committee Interlocks and Insider Participation
During the fiscal year ended December 31, 2020, the Company was not an independent company and did not have a compensation committee or
any other committee serving a similar function.
153

CERTAIN RELATIONSHIPS AND RELATED PARTY TRANSACTIONS
Existing Arrangements with Exelon
We have a number of existing arrangements whereby affiliates of Exelon and affiliates of the Company have provided various services to eachother. In connection with the separation, we (including our subsidiaries) expect to enter into agreements with Exelon that have either not existedhistorically, or that may be on different terms than the terms of the existing arrangement or agreements.
Agreements with Exelon Related to the Separation
This section of the information statement summarizes material agreements between us and Exelon that will govern the ongoing relationshipsbetween the two companies after the separation and are intended to provide for an orderly transition to our status as an independent, publicly-tradedcompany. Additional or modified agreements, arrangements and transactions, each of which would be negotiated at arm’s length, may be entered intobetween us and Exelon after the separation.
Following the separation, we and Exelon will operate independently, and neither company will have any ownership interest in the other. Before the
separation, we will enter into a separation agreement and several other agreements with Exelon related to the separation. These agreements will govern therelationship between us and Exelon after completion of the separation and provide for the allocation between us and Exelon of various assets, liabilities,rights and obligations. The following is a summary of the terms of the material agreements we expect to enter into with Exelon. These summaries arequalified in their entirety by reference to the full text of the applicable agreements, which will be filed as exhibits to the registration statement of which thisinformation statement forms a part.
Separation Agreement We intend to enter into a separation agreement with Exelon prior to the distribution of shares of our common stock to Exelon shareholders. The
separation agreement will provide for the allocation of assets and liabilities between us and Exelon and will establish certain rights and obligations betweenthe parties following the distribution. We have not yet finalized all of the terms of the separation agreement, and we intend to include additional details onthe terms of this agreement in an amendment to this information statement.
Transfer of Assets and Assumption of Liabilities. The separation agreement will provide for certain transfers of assets and assumptions of liabilities
that are necessary in connection with our separation from Exelon so that each of Exelon and the Company is allocated the assets necessary to operate itsrespective businesses and retains or assumes the liabilities allocated to it in accordance with the separation plan. The separation agreement will also providefor the settlement or extinguishment of certain liabilities and other obligations among Exelon and the Company. See “Unaudited Pro Forma CondensedConsolidated Financial Statements.”
Further Assurances. To the extent that any transfers of assets or assumptions of liabilities contemplated by the separation agreement have not been
consummated on or prior to the date of the distribution, the parties will agree to cooperate reasonably with each other and use commercially reasonableefforts to effect such transfers or assumptions as promptly as reasonably practicable following the date of the distribution. In addition, each of the partieswill agree to cooperate reasonably with the other and use commercially reasonable efforts to take or to cause to be taken all actions, and to do, or to causeto be done, all things reasonably necessary under applicable law or contractual obligations to consummate and make effective the transactionscontemplated by the separation agreement and the ancillary agreements.
Representations and Warranties. In general, neither we nor Exelon will make any representations or warranties regarding any assets or liabilities
transferred or assumed, any consents or approvals that may be required in connection with such transfers or assumptions, the value or freedom from anylien or other security interest of any assets transferred, the absence of any defenses relating to any claim of either party or the legal sufficiency of anyconveyance documents, or any other matters.
Except as expressly set forth in the separation agreement or in any ancillary agreement, all assets will be transferred on an “as is, where is” basis. The Distribution. The separation agreement will govern certain rights and obligations of the parties regarding the proposed distribution and certain
actions that must occur prior to the proposed distribution, such as the election of officers and directors and the adoption of our amended and restatedarticles of incorporation and amended and restated bylaws.
154

Prior to the distribution, Exelon will deliver all the issued and outstanding shares of our common stock to the Distribution Agent. Following the distributiondate, the Distribution Agent will electronically deliver the shares of our common stock to Exelon shareholders based on each holder of Exelon commonstock receiving share of Company common stock for every share of Exelon common stock held by such shareholder. The Exelon board of directors willhave the sole and absolute discretion to determine (and change) the terms of, and whether to proceed with, the distribution and, to the extent it determinesto so proceed, to determine the date of the distribution.
Conditions. The separation agreement will provide that the distribution is subject to the satisfaction or waiver of certain conditions. For furtherinformation regarding these conditions, see “The Separation—Conditions to the Distribution.” The Exelon board of directors may, in its sole discretion,determine the distribution date and the terms of the distribution and, until the distribution has occurred, the Exelon board of directors has the right to electnot to proceed with the distribution in its sole discretion, even if all of the conditions are satisfied.
Termination. The separation agreement will provide that it may be terminated by Exelon at any time in its sole discretion prior to the distribution. Intercompany Accounts. The separation agreement will provide that, subject to any provisions in the separation agreement or any ancillary
agreement to the contrary, prior to the distribution, intercompany accounts will be settled as will be set forth in the separation agreement. Release of Claims and Indemnification. We and Exelon will agree to broad mutual general releases pursuant to which we will each release the
other and certain related persons specified in the separation agreement from any claims against any of them that arise out of or relate to events,circumstances or actions occurring or failing to occur or alleged to occur or to have failed to occur or any conditions existing or alleged to exist at or priorto the time of the distribution. These mutual general releases will be subject to certain exceptions set forth in the separation agreement and the ancillaryagreements.
The separation agreement will provide for cross-indemnities that, except as otherwise provided in the separation agreement, are principally
designed to place financial responsibility for the obligations and liabilities of our business with us, and financial responsibility for the obligations andliabilities of Exelon’s business with Exelon.
The amount of each party’s indemnification obligations will be subject to reduction by any insurance proceeds actually received by the party being
indemnified. The separation agreement will also specify procedures with respect to claims subject to indemnification and related matters. Indemnificationwith respect to taxes will be governed solely by the tax matters agreement.
Insurance. The separation agreement will provide for the allocation among the parties of benefits under existing insurance policies for occurrences
prior to the distribution and sets forth procedures for the administration of insured claims. The separation agreement will allocate among the parties theright to proceeds and the obligation to incur deductibles under certain insurance policies.
Other Matters Governed by the Separation Agreement. Other matters governed by the separation agreement will include access to financial and
other information, confidentiality, access to and provision of records and treatment of outstanding guarantees and similar credit support. Transition Services Agreement We intend to enter into a transition services agreement with Exelon under which Exelon will provide us with certain services, we will provide
Exelon with certain services, or both of us will mutually provide certain services, for a prescribed period of time following the distribution to help ensurean orderly transition following the distribution.
155

Services. The services are expected to include specified accounting, finance, information technology, human resources, employee benefits and
other services that are currently provided on a centralized basis by Exelon Business Services Company. The most extensive of these services will be theprovision by Exelon and its third party vendors to us of information technology systems support while we establish our own standalone systems. Otherservices, such as accounting, finance, human resources, security and employee benefits, are expected to provide interim support as our and Exelon’sstaffing is filled-out post-separation. Services are to be provided in a manner, scope, nature, timeliness and quality consistent with the provision of thoseservices prior to the separation. In addition, from time to time during the term of the agreement, we and Exelon may mutually agree to expand the scope ofservices, to provide additional services and to cease provision of any services that are no longer required.
Payment. A recipient of any such services used will pay the provider for such services at agreed amounts as set forth in the agreement. Invoicesare generally expected to be sent monthly or as prescribed in the agreement.
Administration. The agreement provides for the formation of a TSA Oversight Committee to administer requests for expanded or additionalservices and requests to terminate scheduled services earlier than the term assigned to that service in the agreement. The committee will be composed ofrepresentatives from Exelon and us.
Representations and Warranties. Except as noted above with respect to the manner, scope, nature, timeliness and quality of services, neither we
nor Exelon will make any representations or warranties regarding the services provided by it under the agreement. Except as expressly set forth in theagreement, all services will be provided on an “as is, where is” basis.
Indemnification; Limitation on Liability. Each of Exelon and us, in our respective capacity as a service provider, has agreed to indemnify the other,
in its capacity as a service recipient, for losses arising from gross negligence or willful misconduct in the performance of services or a material breach ofthe agreement. The agreement limits a party’s liability to the aggregate amount received by that party in respect of services provided under the agreement.
Term; Termination. The obligation to provide a described service, and the ability to request that service, will be subject to a specified term, which,
except for specified information technology-related services, will not exceed 24 months. Specified information technology services may be provided byExelon to us for up to 36 months following the separation.
Tax Matters Agreement We intend to enter into a tax matters agreement with Exelon that will govern the respective rights, responsibilities and obligations of Exelon and
us after the separation with respect to tax liabilities and benefits, tax attributes, tax returns, tax contests and other tax sharing regarding U.S. federal, state,local and foreign income taxes, other tax matters and related tax returns.
Responsibility and Indemnification for Taxes. As a subsidiary of Exelon, we have (and will continue to have following the separation) joint and
several liability with Exelon to the IRS for the combined U.S. federal income taxes of the Exelon consolidated group relating to the taxable periods inwhich we were part of that group. However, the tax matters agreement will specify the portion of this tax liability for which we will bear responsibility, andwe and Exelon will each agree to indemnify each other against any amounts for which such indemnified party is not responsible. Specifically, we willgenerally be liable for taxes due and payable in connection with tax returns that we are required to file. We will also generally be liable for our share ofcertain taxes required to be paid by Exelon with respect to taxable years or periods (or portions thereof) ending on or prior to the separation to the extentthat we would have been responsible for such taxes under the existing Exelon tax sharing agreement.
The tax matters agreement will also provide special rules for allocating tax liabilities in the event that the separation or any other related
transaction is not completely tax-free. Our share of such taxes will be based on the facts and circumstances giving rise to such taxes, including whethersuch taxes are attributable to actions undertaken by us (or with respect to our stock).
Tax Refunds and Attributes. The tax matters agreement will provide for the allocation of certain pre-closing tax attributes between us and Exelon.
Tax attributes generally will be allocated in accordance with the principles set forth in the existing Exelon tax sharing agreement, unless otherwise requiredby law. In addition, under the tax matters agreement, we generally will be entitled to refunds for taxes for which we are responsible under the tax mattersagreement. We will also be entitled to be compensated for certain tax credit carryforwards that are utilized by Exelon after the separation.
156

Restrictive Covenants. The tax matters agreement will provide for certain covenants that may restrict our ability to pursue strategic or other
transactions if such transactions could implicate the tax-free nature of the separation. These restrictive covenants could prevent us from undertaking certaintransactions that otherwise could optimize or maximize the value of our business. Under the tax matters agreement, we may under certain circumstances bepermitted to pursue transactions that would otherwise be restricted under the tax matters agreement by obtaining a tax opinion or private letter ruling.
Tax Return Preparation. Exelon generally will prepare tax returns for pre-distribution periods for Exelon and its affiliates, other than tax returns
that we are required to file on a stand-alone basis. Representations and Warranties. We and Exelon will make certain representations to one another in the tax matters agreement as to the tax-free
status of the separation. Cooperation and Exchange of Information. Under the tax matters agreement, we and Exelon will cooperate with one another in connection with
the filing of tax returns and the conduct of tax contests. As a general matter, the party responsible under the tax matters agreement for taxes that are thesubject of a tax contest will have the right to control such tax contest, except that Exelon will in all events control tax contests relating to whether theseparation was undertaken on a tax-free basis. We may, under certain circumstances, be required to reimburse Exelon for third party costs and expensesincurred by Exelon in connection with tax contests relating to taxes for which we may be liable.
Indemnity Obligations and Payments. Under the tax matters agreement, we and Exelon generally will be required to indemnify one another against
certain liabilities, costs, or expenses arising out of the fraudulent or negligent preparation of a tax return or claim for refund. Scope. Although valid as between the parties, the tax matters agreement will not be binding on the IRS. Employee Matters Agreement We intend to enter into an employee matters agreement with Exelon that will govern the respective rights, responsibilities and obligations of
Exelon and the Company after the spin-off with respect to employment matters and employee and retiree compensation and benefits. The employee mattersagreement will govern the allocation of employees between Exelon and the Company, the treatment of Exelon equity-based awards in connection with thespin-off and the allocation and treatment of assets and liabilities related to incentive plans, retirement plans and employee health and welfare benefit plansin which transferred employees participated prior to the spin-off.
Treatment of Exelon Equity-Based Awards. In general, the employee matters agreement will provide for Exelon equity-based awards held by our
employees (including restricted stock units (RSUs), restricted stock, deferred stock units and stock options) to be converted into Company equity-basedawards of equivalent value, and awards held by Exelon employees and nonemployee directors will be adjusted to preserve value and will continue asExelon awards.
With respect to performance-based equity awards, Exelon performance share awards granted in 2020 will be replaced with an RSU award subject
solely to time-based vesting (with shares denoted in Company stock, for our employees), with the number of underlying shares determined based onprojected performance results through the end of the performance period. Exelon performance share awards granted in 2021 will be either converted to aCompany performance share award of equivalent value (for our employees) or adjusted to preserve their value (for Exelon employees). Applicableperformance criteria for Company performance share awards will be determined by our Board, and performance goals for adjusted Exelon performanceshare awards will be equitably adjusted by the Exelon Compensation Committee.
In addition, the employee matters agreement provides that, following the spin-off, we will adopt an employee stock purchase plan that is similar to
Exelon’s employee stock purchase plan. Treatment of Employee Benefit Plans. The employee matters agreement will provide for the allocation and treatment of assets and liabilities
related to the Exelon qualified and non-qualified retirement plans and employee health and welfare benefit plans in which transferred employeesparticipated prior to the spin-off.
157

With respect to retirement plans, certain qualified retirement plans (i.e., 401(k) and pension plans) that are specific to our employees will be
transferred in whole to the Company, including all associated assets and liabilities. In addition, Exelon retirement, pension and deferred compensation planswill transfer any assets and liabilities under those plans relating to current and former employees of our business to new Company plans, which we willestablish concurrently with spin-off.
With respect to health and welfare plans, we will establish and maintain new employee health and welfare benefit plans (e.g., medical, dental,
vision, life insurance, disability) in which current and former employees of our business will participate following the spin-off (including retiree health andwelfare benefit plans). The employee matters agreement further requires us to recognize the transferred employees’ (i) past Exelon service for participationand vesting purposes, (ii) payments made prior to the spin-off toward deductibles, co-payments and out-of-pocket maximums, (iii) beneficiary designationsand (iv) flexible spending account balances. In addition, the employee matters agreement provides that Company subaccounts in Exelon “voluntaryemployees’ beneficiary association” (VEBA) trusts will be transferred to new VEBA trusts that we will establish concurrently with the spin-off.
Other Benefit and Compensation Arrangements. In addition to the matters described above, the employee matters agreement includes the
following provisions relating to employee benefit and compensation arrangements:
· The Company will establish an annual bonus program for our employees for performance periods following the spin-off;
· The Company will adopt severance plans and policies for our employees that are substantially similar to the Exelon severance plans and policiesunder which they were covered prior to the spin-off;
· The Company will assume liability for our employees’ vacation, holiday, sick leave and personal days off, including vacation days accrued prior
to the spin-off; and · The Company will cooperate with Exelon following the spin-off on matters relating to the employee matters agreement, including by sharing
employee data and personnel records. Issuance and Grant of Company Common Stock to Certain Related Persons
With respect to any long-term incentive equity awards, it is expected that our compensation committee will develop programs reflectingappropriate measures, goals, targets and business objectives based on the Company’s competitive marketplace. The amount and timing of any equity-basedcompensation to be paid to certain related persons at or following the distribution will be determined by our compensation committee and will generally begranted pursuant to a new equity incentive plan to be adopted by the Company in connection with becoming an independent, publicly-traded company.These programs and/or arrangements will be described in greater detail in a subsequent amendment to the registration statement of which this informationstatement forms a part.
Policies and Procedures Regarding Related Party Transactions
In connection with the separation, we expect that our board will adopt a written policy and procedures with respect to related person transactions,which will include specific provisions for the approval of related person transactions. Pursuant to this policy, related person transactions would include atransaction, arrangement or relationship or series of similar transactions, arrangements or relationships, in which we and certain enumerated related personsparticipate, the amount involved exceeds $120,000 and the related person has a direct or indirect material interest. We expect our nominating andgovernance committee will review: (i) potential conflict of interest situations on an ongoing basis, (ii) any future proposed transaction, or series oftransactions, with related persons, and (iii) either approve or disapprove each reviewed transaction or series of related transactions with related persons.
In the event that a related person transaction is identified, such transaction will be reviewed and approved or ratified by our nominating and
governance committee. If it is impracticable for our nominating and governance committee to review such transaction, pursuant to the policy, thetransaction will be reviewed by the chair of our nominating and governance committee, whereupon the chair will report to the nominating and governancecommittee the approval or disapproval of such transaction.
In reviewing and approving related person transactions, pursuant to the policy, the nominating and governance committee, or its chair, shallconsider all information believed to be relevant and important to a review of the transaction and shall approve only those related person transactions thatare determined to be in, or not inconsistent with, our best interests and that of our shareholders, taking into account all available relevant facts andcircumstances available . Pursuant to the policy, these facts and circumstances will typically include, but not be limited to, the benefits of the transaction tous; the impact on a director’s independence in the event the related person is a director, an immediate family member of a director or an entity in which adirector is a partner, shareholder or executive officer; the availability of other sources for comparable products or services; the terms of the transaction; andthe terms of comparable transactions that would be available to unrelated third parties or to employees generally. Pursuant to the policy, we expect that nomember of the nominating and governance committee shall participate in any review, consideration or approval of any related person transaction withrespect to which the member or any of his or her immediate family members is the related person.
158

DESCRIPTION OF CERTAIN INDEBTEDNESS
Revolving Credit Facility
We expect that Generation will enter into an amended and restated credit agreement providing for a revolving credit facility. The credit agreementwill include availability for letters of credit and for short-term borrowings and is expected to be unsecured. A description of that credit agreement isexpected to be included in an amendment to the registration statement of which this information statement is a part.
Generation is also party to several bilateral credit agreements that support the issuance of letters of credit. The agreements are unsecured, have
terms generally reflective of Generation’s revolving credit agreement and include committed and uncommitted facilities. See Note 17—Debt and CreditAgreements of Notes to Consolidated Financial Statements included in this information statement for a description of these agreements that existed atDecember 31, 2020.
Generation Senior Unsecured Notes
As of December 31, 2020, Generation had approximately $4.2 billion aggregate principal amount of senior notes outstanding. The notes areunsecured and are not guaranteed by any subsidiaries of Generation. The notes range in maturity from 2022 to 2042, and bear interest ranging from 3.25%to 7.60%. The indenture governing the notes requires Generation to maintain its limited liability company existence and contains restrictions on its abilityto merge, consolidate or sell all or substantially all of its assets. The indenture does not limit the ability of Generation to incur additional indebtedness,including the issuance of additional notes.
Accounts Receivable Facility
On April 8, 2020, NewEnergy Receivables LLC (“NER”), a bankruptcy remote, special purpose entity, which is wholly-owned by us, entered intoa revolving accounts receivable financing facility with a number of financial institutions and a commercial paper conduit (“Purchasers”) to sell certaincustomer accounts receivable. The facility was renewed on March 29, 2021. In the renewal, the facility’s term was extended through March 29, 2024,unless further renewed by the mutual consent of the parties, and the maximum funding limit was increased to $900 million. Under the facility, NER maysell eligible short-term customer accounts receivable to the Purchasers in exchange for cash and subordinated interest. The transfers are reported as sales ofreceivables in Generation’s consolidated financial statements. The subordinated interest in collections upon the receivables sold to the Purchasers isreferred to as the Deferred Purchase Price, which is reflected in Other current assets on Generation’s Consolidated Balance Sheets.
Nonrecourse Debt
We have issued nonrecourse debt financing, in which approximately $2.2 billion of generating assets have been pledged as collateral at December31, 2020. Borrowings under these agreements are secured by the assets and equity of each respective project. The lenders do not have recourse against us inthe event of a default. If a specific project financing entity does not maintain compliance with its specific nonrecourse debt financing covenants, there couldbe a requirement to accelerate repayment of the associated debt or other borrowings earlier than the stated maturity dates. In these instances, if suchrepayment was not satisfied, the lenders or security holders would generally have rights to foreclose against the project-specific assets and relatedcollateral. The potential requirement to satisfy its associated debt or other borrowings earlier than otherwise anticipated could lead to impairments due to ahigher likelihood of disposing of the respective project-specific assets significantly before the end of their useful lives. See Note 17—Debt and CreditAgreements of Notes to Consolidated Financial Statements in this information statement for more information regarding these nonrecourse debt financings.
159

SECURITY OWNERSHIP OF CERTAIN BENEFICIAL OWNERS AND MANAGEMENT
As of the date of this information statement, all of the outstanding shares of our common stock are beneficially owned by Exelon. After the
separation, Exelon will not own any shares of our common stock. The percentage values are based on shares of our common stock outstanding as ofDecember 31, 2020, which will be updated closer to the distribution date.
The following tables provide information with respect to the anticipated beneficial ownership of our common stock by: · each of our shareholders who we believe (based on the assumptions described below) will beneficially own more than 5% of our outstanding
common stock;· each of our directors and nominees;· each of the individuals we expect to be our named executive officers; and· all of our directors and executive officers following the separation as a group.
To the extent our directors and executive officers own Exelon common stock at the record date of the distribution, they will participate in the
distribution on the same terms as other holders of Exelon common stock. Except as otherwise noted in the footnotes below, each person or entity identified in the tables below has sole voting and investment power with
respect to the securities owned by such person or entity. Beneficial ownership is determined in accordance with the rules of the SEC. Unless otherwiseindicated, the address of each director and executive officer is c/o the Company, .
Immediately following the separation, we estimate that approximately million shares of our common stock will be issued and outstanding, based
on the number of shares of Exelon common stock expected to be outstanding as of the record date and based on each holder of Exelon common stockreceiving share of Company common stock for each share of Exelon common stock. The actual number of shares of our common stock outstandingfollowing the separation will be determined on , 2022, the record date. Shares Percentage Name and address of beneficial owner beneficially owned of class The Vanguard Group(1) 83,391,341 8.56%100 Vanguard Blvd., Malvern, PA 19355 BlackRock, Inc.(2) 77,161,858 7.9%55 East 52nd Street, New York, NY 10055 Wellington Management Group LLP(3) 75,359,646 7.74%Wellington Group Holdings LLP Wellington Investment Advisors Holdings LLP c/o Wellington Management Company LLP 280 Congress Street, Boston, MA 02210 State Street Corporation(4) 59,883,500 6.15%State Street Financial Center One Lincoln Street, Boston, MA 02111
(1) The Vanguard Group disclosed in its Schedule 13G/A that it has sole power to vote or direct the vote of 0 shares, shared voting power over 1,573,299shares, sole power to dispose or direct the disposition of 79,113,691 shares, and shared dispositive power over 4,277,650 shares.
(2) BlackRock, Inc. disclosed in its Schedule 13G/A that it has sole power to vote or to direct the vote of 66,117,799 shares and sole power to dispose or
direct the disposition of 77,161,858 shares. (3) Wellington Management Group LLP, Wellington Group Holdings LLP, Wellington Investment Advisors Holdings LLP, and Wellington Management
Company LLP disclosed in its Schedule 13G/A that it has shared voting power over 73,362,922 shares and shared dispositive power over 75,359,646. (4) State Street Corporation disclosed in its Schedule 13G that it has shared voting power over 46,649,195 shares and shared dispositive power over
59,831,569 shares.
160

Common Stock Beneficial Ownership Underlying Options Total Shares of Common Stock Exercisable Within Beneficially Owned
Directors and Named Executive Officers (Note 1) 60 Days (Note 2) Anthony Anderson 30,999 0 30,999 Ann Berzin 100,276 0 100,276 Laurie Brlas 8,180 0 8,180 Marjorie Rodgers Cheshire 2,255 0 2,255 Yves de Balmann 79,120 0 79,120 Nicholas DeBenedictis 66,390 0 66,390 Linda Jojo 20,849 0 20,849 Paul Joskow 57,987 0 57,987 Robert Lawless 118,920 0 118,920 John Richardson 5,101 0 5,101 Mayo Shattuck III 310,619 0 310,619 John Young 8,980 0 8,980 Christopher M. Crane 717,588 285,000 1,002,588 Joseph Nigro 153,086 13,000 166,086 Kenneth W. Cornew 127,330 70,000 197,330 William A. Von Hoene, Jr. 262,670 88,000 350,670 Calvin G. Butler Jr. 139,157 0 139,157 Directors & Executive Officers as a group (24 people) (Note 3) 2,587,525 488,000 3,075,525
(1) Includes any shares as to which the individual has sole or shared voting or investment power, Directors’ deferred stock units, officers’ RSUs anddeferred shares held in the Stock Deferral Plan, and Directors’ and officers’ phantom shares held in a non-qualified deferred compensation plan whichwill be settled in cash on a 1 for 1 basis upon retirement or termination.
(2) Total share interest of Directors and executive officers, both individually and as a group, represents less than 1% of the outstanding shares of Exelon
common stock. (3) Total includes shares held by all Directors and NEOs as well as Exelon executive officers listed in Item 1, “Executive Officers of the Registrants” in
Exelon’s 2020 Annual Report on Form 10-K filed on February 24, 2021, who are not NEOs for purposes of compensation disclosure.
DESCRIPTION OF CAPITAL STOCK
Our articles of incorporation and bylaws will be amended and restated prior to the consummation of the separation. The following description ofcertain terms of our common stock as it will be in effect upon completion of the separation is a summary and is qualified in its entirety by reference to ouramended and restated articles of incorporation and our amended and restated bylaws. We have not yet finalized the terms of our amended and restatedarticles of incorporation or amended and restated bylaws and will include expanded descriptions thereof in an amendment to this information statement.The articles of incorporation and bylaws, each in a form expected to be in effect at the time of the distribution, will be included as exhibits to theregistration statement on Form 10, of which this information statement forms a part. See “Where You Can Find More Information.”
Under “Description of Capital Stock,” “we,” “us,” “our” and “our company” refer to the Company and not to any of its subsidiaries, “Articles”
refer to our articles of incorporation that are expected to be in effect prior to the consummation of the separation, and “Charter Documents” refer to ourArticles and bylaws that are expected to be in effect prior to the consummation of the separation.
Authorized Capital Stock
Prior to the distribution date, our board of directors and Exelon, as our sole shareholder, will approve and adopt amended and restated versions ofour articles of incorporation and bylaws. Under our amended and restated articles of incorporation, authorized capital stock will consist of shares of ourcommon stock, without par value, and shares of our preferred stock, without par value.
161

Common Stock
We estimate that shares of our common stock will be issued and outstanding immediately after the separation, based on the number of shares ofExelon common stock that we expect will be outstanding as of the record date. The actual number of shares of our common stock outstanding following theseparation will be determined on , 2022, the record date.
Dividends. Holders of common stock are entitled to receive ratably those dividends, if any, as may be declared from time to time by our board of
directors, in its discretion, out of funds legally available therefor, subject to any preferential dividend rights of outstanding preferred stock. Voting Rights. Except as otherwise provided in the Charter Documents or by law, the holders of common stock have the exclusive voting power,
and every holder of common stock is entitled to one vote for every share of common stock standing in the name of the shareholder on the Company’sbooks. Except as otherwise provided in the Pennsylvania Business Corporation Law (the “PBCL”) or the Charter Documents, whenever any corporateaction is to be taken by vote of the shareholders of the Company, it shall be authorized by a majority of the votes cast at a duly organized meeting ofshareholders by the holders of shares entitled to vote thereon. The shareholders of the Company may act only at a duly organized meeting. The board ofdirectors of the Company shall have the full authority permitted by law to determine the voting rights, if any, and designations, preferences, limitations, andspecial rights of any class or any series of any class of preferred stock that may be desired to the extent not determined by the Charter Documents.
Liquidation Rights. In the event of a liquidation, dissolution or winding up of the Company, the holders of the Company’s common stock are
entitled to share ratably in all assets and funds available for distribution after the payment of all of the Company’s liabilities and subject to the liquidationpreferences of any outstanding preferred stock.
Other Rights and Preferences. The Company’s common stock does not carry preemptive rights, is not redeemable, does not have any conversion
rights, is not subject to further calls and is not subject to any sinking fund provisions. The rights and preferences of holders of the Company’s commonstock are subject to the rights of any series of preferred stock that the Company may issue.
Certain Anti-Takeover Provisions
Potential Issuances of the Company’s Preferred Stock Although we do not currently have any shares of preferred stock outstanding, we are authorized under our amended and restated articles of
incorporation to issue shares of preferred stock, and the rights, preferences and privileges of holders of common stock are subject to, and may be adverselyaffected by, the rights of the holders of any series of preferred stock that we may designate and issue in the future. The Articles also authorize our board ofdirectors to establish, from the authorized but unissued shares, one or more series of the shares of preferred stock and to determine, with respect to any suchseries of the Company’s preferred shares, the terms and rights of such series, including, for example, the designation, the preferences, limitations andspecial rights.
The authorized shares of the Company, including shares of preferred stock and common stock, will be available for issuance without further action
by the Company’s shareholders, unless such action is required by applicable law or the rules of any stock exchange or automated quotation system onwhich the Company’s securities may be listed or traded.
Provisions for Shareholder Nominations and Shareholder Proposals at Annual Meetings. Our bylaws establish an advance notice procedure for shareholders to nominate candidates for election as directors or to bring other business
before annual meetings of the Company’s shareholders (the “Shareholder Notice Procedure”). The Shareholder Notice Procedure requires that writtennotice of nominations or proposals for substantive business must be received by the Company not less than 120 days nor more than 150 days prior to thefirst anniversary of the date on which the Company first mailed its proxy materials to shareholders for the prior year’s annual meeting of shareholders;provided, that nothing in the bylaws affects any rights of shareholders to request inclusion of proposals in the Company’s proxy statement pursuant to Rule14a-8 under the Exchange Act.
A shareholder who wishes to recommend a candidate (including a self-nomination) to be considered by the nominating and governance committee
of our board for nomination as a director must submit the recommendation in writing to the chair of the nominating and governance committee as set forthin the bylaws. The nominating and governance committee will consider all recommended candidates and self-nominees when making its recommendationto the full board of directors to nominate a slate of directors for election. In order to nominate a candidate for election as a director, a shareholder mustcomply with the Shareholder Notice Procedure in our bylaws and the notice must include information set forth in the bylaws. Under this procedure, anyshareholder can nominate any number of candidates for director for election at the annual meeting, but the shareholder’s nominees will not be included inthe Company’s proxy statement or form of proxy for the meeting.
162

Provisions Relating to the Election of the Company’s Board of Directors. Under our Charter Documents, shareholders are entitled to only one vote for each share held in all elections for directors. Directors shall be
elected by a plurality of votes cast in any election in which the number of nominees exceeds the number of directors to be elected. Removal of Company Directors. Under the Articles, the entire board of directors or any individual director may be removed from office by vote
of the shareholders entitled to vote thereon only for cause. Director Vacancies. Under the Articles, vacancies in the board of directors, including vacancies resulting from an increase in the number of
directors or from the failure by shareholders to elect the full authorized number of directors, may only be filled by a majority vote of the remainingmembers of the board, or by a sole remaining director, and each person so selected shall be a director to serve until the next annual meeting of shareholders,and until a successor has been selected and qualified or until his or her earlier death, resignation or removal.
Amendment to Articles. In addition to any other vote that may be required by law, applicable stock exchange rule or terms of any series of preferred stock, any amendment
to the articles requires the affirmative vote of a majority of the votes cast by all shareholders entitled to vote thereon, voting together as a single class,except for amendments on matters specified in Section 1914(c) of the PBCL that do not require shareholder approval.
Amendment to Bylaws. Except as otherwise provided for in the express terms of any series of the shares of the Company, any one or more provisions of our bylaws may
be altered or repealed by the board of directors. The shareholders or the board of directors may adopt, amend or repeal the bylaws except that the board ofdirectors may not adopt, alter or repeal bylaws that the PBCL specifies may be adopted only by shareholders.
Special Meeting of Company Shareholders. The Charter Documents do not contain a provision permitting shareholders to call a special meeting. Shareholder Action by Written Consent. The Charter Documents do not contain a provision permitting action by written consent of the shareholders. Pennsylvania Anti-Takeover Statutes. Under Section 1715 of the PBCL, directors stand in a fiduciary relation to their corporation and, as such, are required to perform their duties in
good faith, in a manner they reasonably believe to be in the best interests of the corporation and with such care, including reasonable inquiry, skill anddiligence, as a person of ordinary prudence would use under similar circumstances. In discharging their duties, directors may, in considering the bestinterests of their corporation, consider various constituencies, including, shareholders, employees, suppliers, customers and creditors of the corporation,and upon communities in which offices or other establishments of the corporation are located. Absent a breach of fiduciary duty, a lack of good faith orself-dealing, any act of the board of directors, a committee thereof or an individual director is presumed to be in the best interests of the corporation. ThePBCL expressly provides that the fiduciary duty of directors does not require them to (i) redeem or otherwise render inapplicable outstanding rights issuedunder any shareholder rights plan; (ii) render inapplicable the anti-takeover statutes set forth in Chapter 25 of the PBCL (described below); or (iii) take anyaction solely because of the effect it may have on a proposed acquisition or the consideration to be received by shareholders in such a transaction.
163

Chapter 25 of the PBCL contains several anti-takeover statutes applicable to publicly-traded corporations. Corporations may opt-out of such anti-
takeover statutes under certain circumstances. We have not opted-out of any of such statutes. Section 2538 of Subchapter 25D of the PBCL requires certain transactions with an “interested shareholder” to be approved by a majority of
disinterested shareholders. “Interested shareholder” is defined broadly to include any shareholder who is a party to the transaction or who is treateddifferently than other shareholders and affiliates of the corporation.
Subchapter 25E of the PBCL requires a person or group of persons acting in concert which acquires 20% or more of the voting shares of the
corporation to offer to purchase the shares of any other shareholder at “fair value.” “Fair value” means the value not less than the highest price paid by thecontrolling person or group during the 90-day period prior to the control transaction, plus a control premium. Among other exceptions, Subchapter 25Edoes not apply to shares acquired directly from the corporation in a transaction exempt from the registration requirements of the Securities Act of 1933, asamended, or to a one-step merger.
Subchapter 25F of the PBCL generally establishes a 5-year moratorium on a “business combination” with an “interested shareholder.” “Interested
shareholder” is defined generally to be any beneficial owner of 20% or more of the corporation's voting stock. “Business combination” is defined broadlyto include mergers, consolidations, asset sales and certain self-dealing transactions. Certain restrictions apply to business combination following the 5-yearperiod. Among other exceptions, Subchapter 25F will be rendered inapplicable if the board of directors approves the proposed business combination orapproves the interested shareholder's acquisition of 20% of the voting shares, in either case prior to the date on which the shareholder first becomes aninterested shareholder.
Subchapter 25G of the PBCL provides that “control shares” lose voting rights unless such rights are restored by the affirmative vote of a majority
of (i) the disinterested shares (generally, shares held by persons other than the acquirer, executive officers of the corporation and certain employee stockplans) and (ii) the outstanding voting shares of the corporation. “Control shares” are defined as shares which, upon acquisition, will result in a person orgroup acquiring for the first time voting control over (a) 20%, (b) 331/3% or (c) 50% or more of the outstanding shares, together with shares acquiredwithin 180 days of attaining the applicable threshold and shares purchased with the intention of attaining such threshold. A corporation may redeem controlshares if the acquiring person does not request restoration of voting rights as permitted by Subchapter 25G. Among other exceptions, Subchapter 25G doesnot apply to a merger, consolidation or a share exchange if the corporation is a party to the transaction agreement.
Subchapter 25H of the PBCL provides in certain circumstances for the recovery by the corporation of profits realized from the sale of its stock by
a controlling person or group if the sale occurs within 18 months after the controlling person or group became a controlling person or group, and the stockwas acquired during such 18-month period or within 24 months before such period. A controlling person or group is a person or group that has acquired,offered to acquire, or publicly disclosed an intention to acquire 20% or more of the voting shares of the corporation. Among other exceptions, Subchapter25H does not apply to transactions approved by both the board of directors and the shareholders prior to the acquisition or distribution, as appropriate.
Subchapter 25I of the PBCL mandates severance compensation for eligible employees who are terminated within 24 months after the approval of
a control share acquisition. Eligible employees generally are all employees employed in Pennsylvania for at least two years prior to the control shareapproval. Severance equals the weekly compensation of the employee multiplied by the employee's years of service (up to 26 years), less payments madedue to the termination.
Subchapter 25J of the PBCL requires the continuation of certain labor contracts relating to business operations owned at the time of a control
share approval.]
Limitations on Liability of Directors and Indemnification of Directors and Officers
Pennsylvania law requires that to the extent that one of our directors or officers has been successful on the merits or otherwise in defense of anyaction or proceeding referred to above or in defense of any claim, issue or matter therein, that director or officer shall be indemnified against expenses(including attorney fees) actually and reasonably incurred by him in connection therewith. Our amended and restated bylaws further provide that the rightto indemnification includes the right to have expenses reasonably incurred in defending any action or proceeding described above paid by us in advance ofthe final disposition of the action or proceeding to the fullest extent permitted by Pennsylvania law; provided that, if required by Pennsylvania law, thepayment of such expenses incurred in advance of the final disposition of the action or proceeding shall be made only upon delivery to us of an undertakingto repay all amounts so advanced without interest if it is ultimately determined that the director or officer is not entitled to be indemnified. The PBCLprovides that indemnification shall not be made in respect in any case where the act or failure to act giving rise to the claim for indemnification isdetermined by a court to have constituted willful misconduct or recklessness.
164

Our Charter Documents will provide that, to the fullest extent authorized or permitted by the PBCL, as now in effect or as amended, we may
indemnify any officer, employee or agent of the Company. Any amendment of this provision will not reduce our indemnification obligations relating toactions taken before an amendment.
We are in the process of drafting policies meant to insure our directors and officers and those of our subsidiaries against certain liabilities they may
incur in their capacities as directors and officers. Under these policies, the insurer, on our behalf, may also pay amounts for which we have grantedindemnification to the directors or officers.
Listing and Trading
We intend to have our shares of common stock listed on NASDAQ. We expect our shares to trade under the ticker symbol “ .”
Transfer Agent and Registrar
The transfer agent and registrar for our common stock is EQ Shareholder Services.
WHERE YOU CAN FIND MORE INFORMATION
We have filed a Registration Statement on Form 10 with the SEC with respect to the shares of common stock that Exelon shareholders will receivein the distribution. This information statement does not contain all of the information contained in the Registration Statement on Form 10 and the exhibitsand schedules to the Registration Statement on Form 10. Some items are omitted in accordance with the rules and regulations of the SEC. For additionalinformation relating to us and the separation, reference is made to the Registration Statement on Form 10 and the exhibits to the Registration Statement onForm 10, which are on file at the offices of the SEC. Statements contained in this information statement as to the contents of any contract or otherdocument referred to are not necessarily complete and in each instance, if the contract or document is filed as an exhibit, reference is made to the copy ofthe contract or other documents filed as an exhibit to the Registration Statement on Form 10. Each statement is qualified in all respects by the relevantreference.
The SEC maintains an Internet site at www.sec.gov, from which you can electronically access the Registration Statement on Form 10, including
the exhibits and schedules to the Registration Statement on Form 10. We maintain an Internet site at . Our Internet site and the information contained on that site, or connected to that site, are not incorporated into the
information statement or the Registration Statement on Form 10. As a result of the distribution, we will be required to comply with the full informational requirements of the Exchange Act. We will fulfill our
obligations with respect to these requirements by filing periodic reports and other information with the SEC. We plan to make available, free of charge, onour Internet site our Annual Reports on Form 10-K, Quarterly Reports on Form 10-Q, Current Reports on Form 8-K, reports filed pursuant to Section 16 ofthe Exchange Act and amendments to those reports as soon as reasonably practicable after we electronically file or furnish such materials to the SEC.
You should rely only on the information contained in this information statement or to which we have referred you. We have not authorized any
person to provide you with different information or to make any representation not contained in this information statement.
165
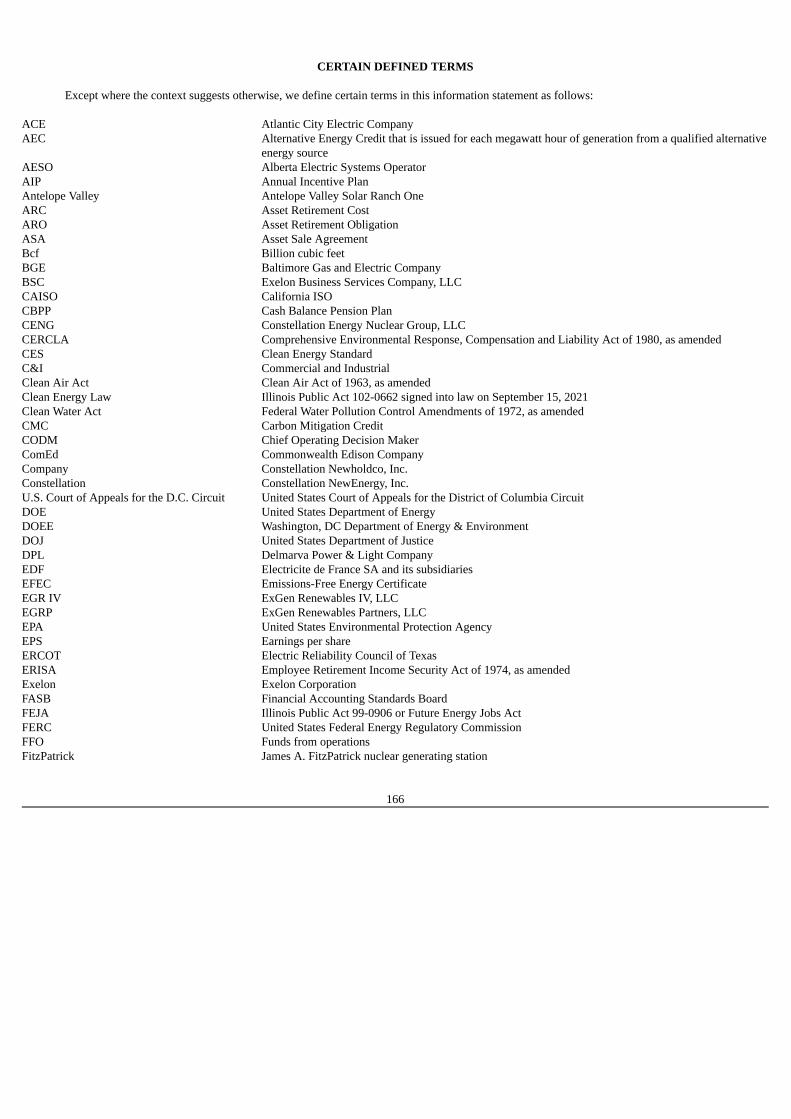
CERTAIN DEFINED TERMS
Except where the context suggests otherwise, we define certain terms in this information statement as follows:
ACE Atlantic City Electric CompanyAEC
Alternative Energy Credit that is issued for each megawatt hour of generation from a qualified alternativeenergy source
AESO Alberta Electric Systems OperatorAIP Annual Incentive PlanAntelope Valley Antelope Valley Solar Ranch OneARC Asset Retirement CostARO Asset Retirement ObligationASA Asset Sale AgreementBcf Billion cubic feetBGE Baltimore Gas and Electric CompanyBSC Exelon Business Services Company, LLCCAISO California ISOCBPP Cash Balance Pension PlanCENG Constellation Energy Nuclear Group, LLCCERCLA Comprehensive Environmental Response, Compensation and Liability Act of 1980, as amendedCES Clean Energy StandardC&I Commercial and IndustrialClean Air Act Clean Air Act of 1963, as amendedClean Energy Law Illinois Public Act 102-0662 signed into law on September 15, 2021 Clean Water Act Federal Water Pollution Control Amendments of 1972, as amendedCMC Carbon Mitigation CreditCODM Chief Operating Decision MakerComEd Commonwealth Edison CompanyCompany Constellation Newholdco, Inc.Constellation Constellation NewEnergy, Inc.U.S. Court of Appeals for the D.C. Circuit United States Court of Appeals for the District of Columbia CircuitDOE United States Department of EnergyDOEE Washington, DC Department of Energy & EnvironmentDOJ United States Department of JusticeDPL Delmarva Power & Light CompanyEDF Electricite de France SA and its subsidiariesEFEC Emissions-Free Energy CertificateEGR IV ExGen Renewables IV, LLCEGRP ExGen Renewables Partners, LLCEPA United States Environmental Protection AgencyEPS Earnings per shareERCOT Electric Reliability Council of TexasERISA Employee Retirement Income Security Act of 1974, as amendedExelon Exelon CorporationFASB Financial Accounting Standards BoardFEJA Illinois Public Act 99-0906 or Future Energy Jobs ActFERC United States Federal Energy Regulatory CommissionFFO Funds from operationsFitzPatrick James A. FitzPatrick nuclear generating station
166

FRCC Florida Reliability Coordinating CouncilFRR Fixed Resource RequirementGAAP Generally Accepted Accounting Principles in the United StatesGeneration Exelon Generation Company, LLCGHG Greenhouse GasGinna R. E. Ginna nuclear generating stationGWh Gigawatt hourICC Illinois Commerce CommissionICE Intercontinental ExchangeIPA Illinois Power AgencyIRC Internal Revenue Code of 1986, as amendedIRS Internal Revenue ServiceISO Independent System OperatorISO-NE ISO New England Inc.kW KilowattkWh Kilowatt-hourLIBOR London Interbank Offered RateLLRW Low-Level Radioactive WasteLNG Liquefied Natural GasLTIP Long-Term Incentive PlanMATS U.S. EPA Mercury and Air Toxics RuleMDE Maryland Department of the EnvironmentMISO Midcontinent Independent System Operator, Inc.MOPR Minimum Offer Price RuleMW MegawattMWh Megawatt hourNAV Net Asset ValueNASDAQ Nasdaq Stock Market, Inc.NDT Nuclear Decommissioning TrustNEIL Nuclear Electric Insurance LimitedNEO Named Executive OfficerNERC North American Electric Reliability CorporationNGX Natural Gas Exchange, Inc.NJDEP New Jersey Department of Environmental ProtectionNon-Regulatory Agreement Units
Nuclear generating units or portions thereof whose decommissioning-related activities are not subject tocontractual elimination under regulatory accounting
NOSA Nuclear Operating Services AgreementNPDES National Pollutant Discharge Elimination SystemNPNS Normal Purchase Normal Sale scope exceptionNRC United States Nuclear Regulatory CommissionNWPA Nuclear Waste Policy Act of 1982NYISO New York ISONYMEX New York Mercantile ExchangeNYPSC New York Public Service CommissionOCI Other Comprehensive IncomeOIESO Ontario Independent Electricity System OperatorOPEB Other Postretirement Employee Benefits
167

PA DEP Pennsylvania Department of Environmental ProtectionPAPUC Pennsylvania Public Utility CommissionPCAOB Public Company Accounting Oversight BoardPECO PECO Energy CompanyPepco Potomac Electric Power CompanyPepco Energy Services or PES Pepco Energy Services, Inc. and its subsidiariesPepco Holdings or PHI Pepco Holdings LLC (formerly Pepco Holdings, Inc.)PG&E Pacific Gas and Electric CompanyPJM PJM Interconnection, LLCPOLR Provider of Last ResortPPA Power Purchase AgreementPrice-Anderson Act Price-Anderson Nuclear Industries Indemnity Act of 1957PRP Potentially Responsible PartiesPSEG Public Service Enterprise Group IncorporatedPV PhotovoltaicRCRA Resource Conservation and Recovery Act of 1976, as amendedREC
Renewable Energy Credit which is issued for each megawatt hour of generation from a qualifiedrenewable energy source
Regulatory Agreement Units
Nuclear generating units or portions thereof whose decommissioning-related activities are subject tocontractual elimination under regulatory accounting
RFP Request for ProposalRGGI Regional Greenhouse Gas InitiativeRIN Renewable Identification NumberRMC Risk Management CommitteeRNF Revenue Net of Purchased Power and Fuel ExpenseROE Return on equityROU Right-of-useRPG Renewable Power GenerationRPM PJM Reliability Pricing ModelRPS Renewable Energy Portfolio StandardsRSA Restricted Stock AwardRSU Restricted Stock UnitRTO Regional Transmission OrganizationS&P Standard & Poor’s Ratings ServicesSAIFI System Average Interruption Frequency IndexSAS Service Annuity SystemSEC United States Securities and Exchange CommissionSERC SERC Reliability Corporation (formerly Southeast Electric Reliability Council)SMRP Supplemental Management Retirement PlanSNF Spent Nuclear FuelSolGen SolGen, LLCSPP Southwest Power PoolSTEM Science, Technology, Engineering, and MathematicsTDC Total Direct CompensationTMI Three Mile Island nuclear facilityTSR Total Shareholder ReturnTWh Terawatt-hour
168

Upstream Natural gas and oil exploration and production activitiesVIE Variable Interest EntityWECC Western Electric Coordinating CouncilZEC Zero Emission CreditZES Zero Emission Standard
169

INDEX TO CONSOLIDATED FINANCIAL STATEMENTS
Page Number
Consolidated financial statements of Exelon Generation Company, LLC for the years ended December 31, 2020, 2019 and 2018. Report of Independent Registered Public Accounting Firm F-2 Consolidated Statements of Operations and Comprehensive Income for the Years Ended December 31, 2020, 2019 and 2018 F-4 Consolidated Statements of Cash Flows for the Years Ended December 31, 2020, 2019 and 2018 F-5 Consolidated Balance Sheets – December 31, 2020 and 2019 F-6 Consolidated Statements of Changes in Equity for the Years Ended December 31, 2020, 2019 and 2018 F-8 Notes to Consolidated Financial Statements F-9
F-1

Report of Independent Registered Public Accounting Firm
To the Board of Directors and Member of Exelon Generation Company, LLC Opinion on the Financial Statements We have audited the consolidated financial statements, including the related notes, as listed in the index appearing under Item 15(a)(2)(i), and the financialstatement schedule listed in the index appearing under Item 15(a)(2)(ii), of Exelon Generation Company, LLC and its subsidiaries (the “Company”)(collectively referred to as the “consolidated financial statements”). In our opinion, the consolidated financial statements present fairly, in all materialrespects, the financial position of the Company as of December 31, 2020 and 2019, and the results of its operations and its cash flows for each of the threeyears in the period ended December 31, 2020 in conformity with accounting principles generally accepted in the United States of America. Change in Accounting Principle As discussed in Note 1 to the consolidated financial statements, the Company changed the manner in which it accounts for leases in 2019. Basis for Opinion These consolidated financial statements are the responsibility of the Company’s management. Our responsibility is to express an opinion on the Company’sconsolidated financial statements based on our audits. We are a public accounting firm registered with the Public Company Accounting Oversight Board(United States) (PCAOB) and are required to be independent with respect to the Company in accordance with the U.S. federal securities laws and theapplicable rules and regulations of the Securities and Exchange Commission and the PCAOB. We conducted our audits of these consolidated financial statements in accordance with the standards of the PCAOB. Those standards require that we planand perform the audit to obtain reasonable assurance about whether the consolidated financial statements are free of material misstatement, whether due toerror or fraud. The Company is not required to have, nor were we engaged to perform, an audit of its internal control over financial reporting. As part of ouraudits we are required to obtain an understanding of internal control over financial reporting but not for the purpose of expressing an opinion on theeffectiveness of the Company's internal control over financial reporting. Accordingly, we express no such opinion. Our audits included performing procedures to assess the risks of material misstatement of the consolidated financial statements, whether due to error orfraud, and performing procedures that respond to those risks. Such procedures included examining, on a test basis, evidence regarding the amounts anddisclosures in the consolidated financial statements. Our audits also included evaluating the accounting principles used and significant estimates made bymanagement, as well as evaluating the overall presentation of the consolidated financial statements. We believe that our audits provide a reasonable basisfor our opinion. Critical Audit Matters The critical audit matters communicated below are matters arising from the current period audit of the consolidated financial statements that werecommunicated or required to be communicated to the audit committee and that (i) relate to accounts or disclosures that are material to the consolidatedfinancial statements and (ii) involved our especially challenging, subjective, or complex judgments. The communication of critical audit matters does notalter in any way our opinion on the consolidated financial statements, taken as a whole, and we are not, by communicating the critical audit matters below,providing separate opinions on the critical audit matters or on the accounts or disclosures to which they relate. Annual Nuclear Decommissioning Asset Retirement Obligations (ARO) Assessment As described in Notes 1 and 10 to the consolidated financial statements, the Company has a legal obligation to decommission its nuclear generation stationsfollowing the expiration of their operating licenses. To estimate its decommissioning obligation related to its nuclear generating stations for financialaccounting and reporting purposes, management uses a probability-weighted cash flow model, which on a unit-by-unit basis, considers multiple scenariosthat include significant estimates and assumptions such as decommissioning cost studies, cost escalation rates, probabilistic cash flow models and discountrates. Management updates its ARO annually unless circumstances warrant more frequent updates, based on its review of updated cost studies and itsannual evaluation of cost escalation factors and probabilities assigned to various scenarios. As of December 31, 2020, the nuclear decommissioning AROwas approximately $11.9 billion.
F-2

The principal considerations for our determination that performing procedures relating to the Company’s annual ARO assessment is a critical audit matterare the significant judgment by management when estimating its decommissioning obligation; this in turn led to a high degree of auditor judgment,subjectivity, and effort in performing procedures and evaluating the reasonableness of management’s cash flow model and significant assumptions relatedto decommissioning cost studies. In addition, the audit effort involved the use of professionals with specialized skill and knowledge. Addressing the matter involved performing procedures and evaluating audit evidence in connection with forming our overall opinion on the consolidatedfinancial statements. These procedures included testing the effectiveness of controls relating to management’s development of the inputs, assumptions, andmodel used in management’s ARO assessment. These procedures also included, among others, testing management’s process for developing the AROestimates by evaluating the appropriateness of the cash flow model, testing the completeness and accuracy of data used by management, and evaluating thereasonableness of management’s significant assumptions related to decommissioning cost studies. Professionals with specialized skill and knowledge wereused to assist in evaluating the results of decommissioning cost studies. Impairment Assessment of Long-Lived Generation Assets As described in Notes 1 and 12 to the consolidated financial statements, the Company evaluates the carrying value of long-lived assets or asset groups forrecoverability whenever events or changes in circumstances indicate that the carrying value of those assets may not be recoverable. Indicators ofimpairment may include a deteriorating business climate, including, but not limited to, declines in energy prices, condition of the asset, or plans to disposeof a long-lived asset significantly before the end of its useful life. Management determines if long-lived assets and asset groups are impaired by comparingthe undiscounted expected future cash flows to the carrying value. When the undiscounted cash flow analysis indicates a long-lived asset or asset group isnot recoverable, the amount of the impairment loss is determined by measuring the excess of the carrying amount of the long-lived asset or asset group overits fair value. The expected future cash flows include significant unobservable inputs including revenue and generation forecasts, projected capital andmaintenance expenditures and discount rates. As of December 31, 2020, the total carrying value of long-lived generation assets subject to this evaluationwas approximately $22.2 billion. The principal considerations for our determination that performing procedures relating to the Company’s impairment assessment of long-lived generationassets is a critical audit matter are the significant judgment by management in assessing the recoverability of these asset groups; this in turn led to a highdegree of auditor judgment, subjectivity and effort in performing procedures and evaluating the reasonableness of management’s significant assumptionsrelated to revenue and generation forecasts. In addition, the audit effort involved the use of professionals with specialized skill and knowledge. Addressing the matter involved performing procedures and evaluating audit evidence in connection with forming our overall opinion on the consolidatedfinancial statements. These procedures included testing the effectiveness of controls relating to management’s development of the inputs, assumptions, andmodel used to estimate the recoverability and fair value of the Company’s long-lived generation asset groups. These procedures also included, amongothers, testing management’s process for developing expected future cash flows for long-lived generation asset groups by evaluating the appropriateness ofthe future cash flow model, testing the completeness and accuracy of the data used by management, and evaluating the reasonableness of management’ssignificant assumptions related to revenue and generation forecasts. Professionals with specialized skill and knowledge were used to assist in evaluating thereasonableness of revenue forecasts. /s/ PricewaterhouseCoopers LLPBaltimore, Maryland February 24, 2021 We have served as the Company's auditor since 2001.
F-3

Exelon Generation Company, LLC and Subsidiary Companies
Consolidated Statements of Operations and Comprehensive Income
For the Years Ended December 31, (In millions) 2020 2019 2018 Operating revenues
Operating revenues $ 16,392 $ 17,752 $ 19,169 Operating revenues from affiliates 1,211 1,172 1,268
Total operating revenues 17,603 18,924 20,437 Operating expenses
Purchased power and fuel 9,592 10,849 11,679 Purchased power and fuel from affiliates (7) 7 14 Operating and maintenance 4,613 4,131 4,803 Operating and maintenance from affiliates 555 587 661 Depreciation and amortization 2,123 1,535 1,797 Taxes other than income taxes 482 519 556
Total operating expenses 17,358 17,628 19,510 Gain on sales of assets and businesses 11 27 48 Operating income 256 1,323 975 Other income and (deductions)
Interest expense, net (328) (394) (396)Interest expense to affiliates (29) (35) (36)Other, net 937 1,023 (178)
Total other income and (deductions) 580 594 (610)Income before income taxes 836 1,917 365 Income taxes 249 516 (108)Equity in losses of unconsolidated affiliates (8) (184) (30)Net income 579 1,217 443 Net (loss) income attributable to noncontrolling interests (10) 92 73 Net income attributable to membership interest $ 589 $ 1,125 $ 370 Comprehensive income, net of income taxes
Net income $ 579 $ 1,217 $ 443 Other comprehensive income (loss), net of income taxes
Unrealized (loss) gain on cash flow hedges (2) — 12 Unrealized gain on investments in unconsolidated affiliates — 1 1 Unrealized gain (loss) on foreign currency translation 4 6 (10)Other comprehensive income 2 7 3
Comprehensive income $ 581 $ 1,224 $ 446 Comprehensive (loss) income attributable to noncontrolling interests (10) 93 74 Comprehensive income attributable to membership interest $ 591 $ 1,131 $ 372
F-4

Exelon Generation Company, LLC and Subsidiary Companies
Consolidated Statements of Cash Flows
For the Years Ended December 31, (In millions) 2020 2019 2018 Cash flows from operating activities
Net income $ 579 $ 1,217 $ 443 Adjustments to reconcile net income to net cash flows provided by operating activities:
Depreciation, amortization, and accretion, including nuclear fuel and energy contractamortization 3,636 3,063 3,415 Asset impairments 563 201 50 Gain on sales of assets and businesses (11) (27) (48)Deferred income taxes and amortization of investment tax credits 78 361 (451)Net fair value changes related to derivatives (270) 228 307 Net realized and unrealized (gains) losses on NDT fund investments (461) (663) 303 Unrealized gain on equity investments (186) — — Other non-cash operating activities 18 (124) 298 Changes in assets and liabilities:
Accounts receivable 1,125 (186) (359)Receivables from and payables to affiliates, net 24 (52) 8 Inventories (77) (47) (12)Accounts payable and accrued expenses (343) (248) 376 Option premiums paid, net (139) (29) (43)Collateral received (posted), net 479 (481) 64 Income taxes 186 302 (193)Pension and non-pension postretirement benefit contributions (255) (175) (139)Other assets and liabilities (4,362) (467) (158)
Net cash flows provided by operating activities 584 2,873 3,861 Cash flows from investing activities
Capital expenditures (1,747) (1,845) (2,242)Proceeds from NDT fund sales 3,341 10,051 8,762 Investment in NDT funds (3,464) (10,087) (8,997)Collection of DPP 3,771 — — Proceeds from sales of assets and businesses 46 52 90 Acquisitions of assets and businesses, net — (41) (154)Other investing activities 11 3 10
Net cash flows provided by (used in) investing activities 1,958 (1,867) (2,531)Cash flows from financing activities
Change in short-term borrowings 20 320 — Proceeds from short-term borrowings with maturities greater than 90 days 500 — — Issuance of long-term debt 3,155 42 15 Retirement of long-term debt (4,334) (813) (141)Retirement of long-term debt to affiliate (550) — — Changes in Exelon intercompany money pool 285 (100) 46 Distributions to member (1,734) (899) (1,001)Contributions from member 64 41 155 Other financing activities (70) (51) (55)
Net cash flows used in financing activities (2,664) (1,460) (981)(Decrease) increase in cash, restricted cash, and cash equivalents (122) (454) 349 Cash, restricted cash, and cash equivalents at beginning of period 449 903 554 Cash, restricted cash, and cash equivalents at end of period $ 327 $ 449 $ 903 Supplemental cash flow information Decrease in capital expenditures not paid $ (88) $ (34) $ (199)Increase in DPP 4,441 — — Increase (decrease) in PP&E related to ARO update 850 959 (130)
F-5

Exelon Generation Company, LLC and Subsidiary Companies
Consolidated Balance Sheets
December 31, (In millions) 2020 2019
ASSETS Current assets
Cash and cash equivalents $ 226 $ 303 Restricted cash and cash equivalents 89 146 Accounts receivable
Customer accounts receivable 1,330 2,973 Customer allowance for credit losses (32) (80)
Customer accounts receivable, net 1,298 2,893 Other accounts receivable 352 619
Other accounts receivable, net 352 619 Mark-to-market derivative assets 644 675 Receivables from affiliates 153 190 Unamortized energy contract assets 38 47 Inventories, net
Fossil fuel and emission allowances 233 236 Materials and supplies 978 1,026
Renewable energy credits 621 336 Assets held for sale 958 — Other 1,357 605
Total current assets 6,947 7,076 Property, plant, and equipment (net of accumulated depreciation and amortization of $13,370 and $12,017as of December 31, 2020 and 2019, respectively) 22,214 24,193 Deferred debits and other assets
Nuclear decommissioning trust funds 14,464 13,190 Investments 184 235 Goodwill 47 47 Mark-to-market derivative assets 555 508 Prepaid pension asset 1,558 1,438 Unamortized energy contract assets 293 336 Deferred income taxes 6 12 Other 1,826 1,960
Total deferred debits and other assets 18,933 17,726 Total assets(a) $ 48,094 $ 48,995
F-6

Exelon Generation Company, LLC and Subsidiary Companies
Consolidated Balance Sheets
December 31, (In millions) 2020 2019 LIABILITIES AND EQUITY Current liabilities
Short-term borrowings $ 840 $ 320 Long-term debt due within one year 197 2,624 Long-term debt to affiliates due within one year — 558 Accounts payable 1,253 1,692 Accrued expenses 788 786 Payables to affiliates 107 117 Borrowings from Exelon intercompany money pool 285 — Mark-to-market derivative liabilities 262 215 Unamortized energy contract liabilities 7 17 Renewable energy credit obligation 661 443 Liabilities held for sale 375 — Other 444 517
Total current liabilities 5,219 7,289 Long-term debt 5,566 4,464 Long-term debt to affiliates 324 328 Deferred credits and other liabilities
Deferred income taxes and unamortized investment tax credits 3,656 3,752 Asset retirement obligations 12,054 10,603 Non-pension postretirement benefit obligations 858 878 Spent nuclear fuel obligation 1,208 1,199 Payables to affiliates 3,017 3,103 Mark-to-market derivative liabilities 205 123 Unamortized energy contract liabilities 3 11 Other 1,308 1,415
Total deferred credits and other liabilities 22,309 21,084 Total liabilities(a) 33,418 33,165
Commitments and contingencies Equity
Member’s equity Membership interest 9,624 9,566 Undistributed earnings 2,805 3,950 Accumulated other comprehensive loss, net (30) (32)
Total member’s equity 12,399 13,484 Noncontrolling interests 2,277 2,346
Total equity 14,676 15,830 Total liabilities and equity $ 48,094 $ 48,995
(a) Our consolidated assets include $10,182 million and $9,512 million at December 31, 2020 and 2019, respectively, of certain VIEs that can only beused to settle the liabilities of the VIE. Our consolidated liabilities include $3,572 million and $3,429 million at December 31, 2020 and 2019,respectively, of certain VIEs for which the VIE creditors do not have recourse to us. See Note 21–Variable Interest Entities for additional information.
F-7

Exelon Generation Company, LLC and Subsidiary Companies
Consolidated Statements of Changes in Equity
Member’s Equity
(In millions) Membership
Interest Undistributed
Earnings
AccumulatedOther
ComprehensiveLoss, net
NoncontrollingInterests
TotalEquity
Balance, December 31, 2017 $ 9,357 $ 4,349 $ (37) $ 2,290 $ 15,959 Net income — 370 — 73 443 Sale of noncontrolling interests 6 — — — 6 Changes in equity of noncontrolling interests — — — (60) (60)Distributions to member — (1,001) — — (1,001)Contributions from member 155 — — — 155 Other comprehensive income, net of income taxes — — 2 1 3 Impact of adoption of Recognition and Measurement ofFinancial Assets and Liabilities standard — 6 (3) — 3 Balance, December 31, 2018 $ 9,518 $ 3,724 $ (38) $ 2,304 $ 15,508 Net income — 1,125 — 92 1,217 Sale of noncontrolling interests 7 — — — 7 Changes in equity of noncontrolling interests — — — (48) (48)Distributions to member — (899) — — (899)Contributions from member 41 — — — 41 Other comprehensive income (loss), net of income taxes — — 6 (2) 4 Balance, December 31, 2019 $ 9,566 $ 3,950 $ (32) $ 2,346 $ 15,830 Net income — 589 — (10) 579 Sale of noncontrolling interests 3 — — — 3 Changes in equity of noncontrolling interests — — — (59) (59)Distribution to member of deferred taxes associated with netretirement benefit obligation (9) — — — (9)Distributions to member — (1,734) — — (1,734)Contributions from member 64 — — — 64 Other comprehensive income, net of income taxes — — 2 — 2 Balance, December 31, 2020 $ 9,624 $ 2,805 $ (30) $ 2,277 $ 14,676
F-8

Notes to Consolidated Financial Statements (Dollars in millions, except per share data unless otherwise noted) 1. Significant Accounting Policies Description of Business We are a company engaged in the generation, delivery and marketing of power across multiple geographical regions through our customer-facing business,Constellation, which sells electricity to both wholesale and retail customers. We also sell natural gas, renewable energy and other energy-related productsand services. We have five reportable segments: Mid-Atlantic, Midwest, New York, ERCOT and Other Power Regions. Basis of Presentation On February 21, 2021, Exelon’s Board of Directors approved a plan to separate Exelon's utility subsidiaries and Generation, creating two publicly tradedcompanies. Under the separation plan, Exelon shareholders will retain their current shares of Exelon stock and receive a pro-rata distribution of shares ofConstellation Newholdco, Inc. stock in a transaction that is expected to be tax-free to Exelon and its shareholders for U.S. federal income tax purposes. Theactual number of shares to be distributed to Exelon shareholders will be determined prior to closing. Exelon is targeting to complete the separation in thefirst quarter of 2022, subject to final approval by its Board of Directors, this Form 10 registration statement being declared effective by the SEC, regulatoryapprovals, and satisfaction of other conditions. The transaction is subject to approval by the FERC, NRC and NYPSC and receipt of a private letter rulingfrom the IRS and tax opinion from Exelon’s tax advisors. There can be no assurance that any separation transaction will ultimately occur or, if one doesoccur, of its terms or timing. These Consolidated Financial Statements represent Generation's historical Consolidated Financial Statements presented in Exelon’s combined Form 10-Kfor the year ended December 31, 2020 filed with the SEC on February 24, 2021. The Consolidated Financial Statements have been prepared in accordancewith GAAP. The Consolidated Financial Statements include the accounts of our subsidiaries. All intercompany transactions have been eliminated. Unlessotherwise indicated or the context otherwise requires, references herein to the terms “we,” “us,” and “our” refer to Generation as historically part ofconsolidated Exelon. Through its business services subsidiary, BSC, Exelon provides us with a variety of support services at cost, including legal, human resources, financial,information technology and supply management services. The costs of BSC are directly charged or allocated to us. We own 100% of our significant consolidated subsidiaries, either directly or indirectly, except for certain consolidated VIEs, including CENG and EGRP,of which we hold a 50.01% and 51% interest, respectively. The remaining interests in these consolidated VIEs are included in noncontrolling interests onthe Consolidated Balance Sheets. See Note 21 — Variable Interest Entities for additional information of consolidated VIEs. We consolidate the accounts of entities in which we have a controlling financial interest, after the elimination of intercompany transactions. Where we donot have a controlling financial interest in an entity, proportionate consolidation, equity method accounting or accounting for investments in equitysecurities with or without readily determinable fair value is applied. We apply proportionate consolidation when we have an undivided interest in an assetand are proportionately liable for our share of each liability associated with the asset. We proportionately consolidate our undivided ownership interest injointly owned electric plants. Under proportionate consolidation, we separately record our proportionate share of the assets, liabilities, revenues andexpenses related to the undivided interest in the asset. We apply equity method accounting when we have a significant influence over an investee throughan ownership in common stock, which generally approximates a 20% to 50% voting interest. We apply equity method accounting to certain investmentsand joint ventures. Under equity method accounting, we report our interest in the entity as an investment and our percentage share of the earnings from theentity as single line items in our financial statements. We use accounting for investments in equity securities with or without readily determinable fairvalues if we lack a significant influence, which generally results when we hold less than 20% of the common stock of an entity. Under accounting forinvestments in equity securities with readily determinable fair values, the investments are reported based on quoted prices in active markets and realizedand unrealized gains and losses are included in earnings. Under accounting for investments in equity securities without readily determinable fair values, theinvestments are reported at cost adjusted for changes from observable transactions for identical or similar investments of the same issuer, less impairment,and changes in measurement are reported in earnings.
F-9

Notes to Consolidated Financial Statements
(Dollars in millions, except per share data unless otherwise noted)
Note 1 — Significant Accounting Policies
COVID-19 We have taken steps to mitigate the potential risks posed by the global outbreak (pandemic) of the 2019 novel coronavirus (COVID-19). We provide acritical service to our customers and have taken measures to keep employees who operate the business safe and minimize unnecessary risk of exposure tothe virus, including extra precautions for employees who work in the field. We have implemented work from home policies where appropriate and imposedtravel limitations on employees. In addition, we have updated our existing business continuity plan. Management makes estimates and assumptions that affect the reported amounts of assets and liabilities and disclosure of contingent assets and liabilities asof the date of the financial statements and accompanying notes, and the amounts of revenues and expenses reported during the periods covered by thosefinancial statements and accompanying notes. Management assessed certain accounting matters that require consideration of forecasted financialinformation, including, but not limited to the allowance for credit losses and the carrying value of other long-lived assets, in context with the informationreasonably available to us and the unknown future impacts of COVID-19 as of December 31, 2020 and through the date of this report. Our futureassessment of our current expectation of the magnitude and duration of COVID-19, as well as other factors, could result in material impacts to ourconsolidated financial statements in future reporting periods. Use of Estimates The preparation of financial statements in conformity with GAAP requires management to make estimates and assumptions that affect the amountsreported in the financial statements and accompanying notes. Areas in which significant estimates have been made include, but are not limited to, theaccounting for nuclear decommissioning costs and other AROs, pension and OPEB, inventory reserves, allowance for credit losses, asset impairmentassessments, derivative instruments, unamortized energy contracts, fixed asset depreciation, environmental costs and other loss contingencies, taxes andunbilled energy revenues. Actual results could differ from those estimates. Revenues Operating Revenues. Our operating revenues generally consist of revenues from contracts with customers involving the sale and delivery of energycommodities and related products and services and realized and unrealized revenues recognized under mark-to-market energy commodity derivativecontracts. We recognize revenue from contracts with customers to depict the transfer of goods or services to customers in an amount that we expect to beentitled to in exchange for those goods or services. Our primary source of revenue includes competitive sales of power, natural gas, and other energy-related products and services. At the end of each reporting period, we accrue an estimate for the unbilled amount of energy delivered or services providedto customers. Option Contracts, Swaps and Commodity Derivatives. Certain option contracts and swap arrangements that meet the definition of derivative instrumentsare recorded at fair value with subsequent changes in fair value recognized as revenue or expense. The classification of revenue or expense is based on theintent of the transaction. See Note 16 — Derivative Financial Instruments for additional information. Taxes Directly Imposed on Revenue-Producing Transactions. We collect certain taxes from customers such as sales and gross receipts taxes, along withother taxes, surcharges and fees, that are levied by state or local governments on the sale or distribution of electricity and natural gas. Some of these taxesare imposed on the customer, but paid by us, while others are imposed on us. Where these taxes are imposed on the customer, such as sales taxes, they arereported on a net basis with no impact to the Consolidated Statements of Operations and Comprehensive Income. However, where these taxes are imposedon us, such as gross receipts taxes, they are reported on a gross basis. Accordingly, revenues are recognized for the taxes collected from customers alongwith an offsetting expense. See Note 22 — Supplemental Financial Information for the taxes that are presented on a gross basis.
F-10

Notes to Consolidated Financial Statements
(Dollars in millions, except per share data unless otherwise noted)
Note 1 — Significant Accounting Policies
Leases We adopted new accounting guidance issued by the FASB related to leases as of January 1, 2019. We recognize a ROU asset and lease liability foroperating leases with a term of greater than one year. Operating lease ROU assets are included in Other deferred debits and other assets and operating leaseliabilities are included in Other current liabilities and Other deferred credits and other liabilities on the Consolidated Balance Sheets. The ROU asset ismeasured as the sum of (1) the present value of all remaining fixed and in-substance fixed payments using our incremental borrowing rate, (2) any leasepayments made at or before the commencement date (less any lease incentives received) and (3) any initial direct costs incurred. The lease liability ismeasured the same as the ROU asset, but excludes any payments made before the commencement date and initial direct costs incurred. Lease terms includeoptions to extend or terminate the lease if it is reasonably certain they will be exercised. We include non-lease components for most asset classes, which areservice-related costs that are not integral to the use of the asset, in the measurement of the ROU asset and lease liability. Expense for operating leases and leases with a term of one year or less is recognized on a straight-line basis over the term of the lease, unless anothersystematic and rational basis is more representative of the derivation of benefit from use of the leased property. Variable lease payments are recognized inthe period in which the related obligation is incurred and consist primarily of payments for purchases of electricity under contracted generation and arebased on the electricity produced by those generating assets. Operating lease expense and variable lease payments are recorded to Purchased power andfuel expense for contracted generation or Operating and maintenance expense for all other lease agreements in the Statements of Operations andComprehensive Income. Income from operating leases, including subleases, is recognized on a straight-line basis over the term of the lease, unless another systematic and rationalbasis is more representative of the pattern in which income is earned over the term of the lease. Variable lease payments are recognized in the period inwhich the related obligation is performed and consist primarily of payments received from sales of electricity under contracted generation and are based onthe electricity produced by those generating assets. Operating lease income and variable lease payments are recorded to Operating revenues in theStatements of Operations and Comprehensive Income. Our operating leases consist primarily of contracted generation, real estate including office buildings, and vehicles and equipment. We generally accountfor contracted generation in which the generating asset is not renewable as a lease if the customer has dispatch rights and obtains substantially all of theeconomic benefits. For new agreements entered after January 1, 2019, we generally do not account for contracted generation in which the generating assetis renewable as a lease if the customer does not design the generating asset. We account for land right arrangements that provide for exclusive use as leaseswhile shared use land arrangements are generally not leases. See Note 11 — Leases for additional information. Income Taxes Deferred Federal and state income taxes are recorded on significant temporary differences between the book and tax basis of assets and liabilities and fortax benefits carried forward. Investment tax credits have been deferred in the Consolidated Balance Sheets and are recognized in book income over the lifeof the related property. We account for uncertain income tax positions using a benefit recognition model with a two-step approach; a more-likely-than-notrecognition criterion; and a measurement approach that measures the position as the largest amount of tax benefit that is greater than 50% likely of beingrealized upon ultimate settlement. If it is not more-likely-than-not that the benefit of the tax position will be sustained on its technical merits, no benefit isrecorded. Uncertain tax positions that relate only to timing of when an item is included on a tax return are considered to have met the recognition threshold.We recognize accrued interest related to unrecognized tax benefits in Interest expense, net or Other, net (interest income) and recognize penalties related tounrecognized tax benefits in Other, net in the Consolidated Statements of Operations and Comprehensive Income.
F-11

Notes to Consolidated Financial Statements
(Dollars in millions, except per share data unless otherwise noted)
Note 1 — Significant Accounting Policies
Cash and Cash Equivalents We consider investments purchased with an original maturity of three months or less to be cash equivalents. Restricted Cash and Cash Equivalents Restricted cash and cash equivalents represent funds that are restricted to satisfy designated current liabilities. As of December 31, 2020 and 2019,restricted cash and cash equivalents primarily represented the project-specific nonrecourse financing structures for debt service and financing of operationsof the underlying entities. See Note 22 — Supplemental Financial Information for additional information. Allowance for Credit Losses on Accounts Receivables The allowance for credit losses reflects our best estimate of losses on the customers' accounts receivable balances based on historical experience, currentinformation, and reasonable and supportable forecasts. The allowance for credit losses for our retail customers is based on accounts receivable aging historical experience coupled with specific identificationthrough a credit monitoring process, which considers current conditions and forward-looking information such as industry trends, macroeconomic factors,changes in the regulatory environment, external credit ratings, publicly available news, payment status, payment history, and the exercise of collateral calls.The allowance for credit losses for our wholesale customers is developed using a credit monitoring process, similar to that used for retail customers. Whena wholesale customer’s risk characteristics are no longer aligned with the pooled population, we use specific identification to develop an allowance forcredit losses. Adjustments to the allowance for credit losses are recorded in Operating and maintenance expense in the Consolidated Statements ofOperations and Comprehensive Income. We have certain non-customer receivables in Other deferred debits and other assets which primarily are with governmental agencies and other high-qualitycounterparties with no history of default. As such, the allowance for credit losses related to these receivables is not material. We monitor these balancesand will record an allowance if there are indicators of a decline in credit quality. Variable Interest Entities We account for our investments in and arrangements with VIEs based on the following specific requirements:
• requires an entity to qualitatively assess whether it should consolidate a VIE based on whether the entity has a controlling financial interest,
• requires an ongoing reconsideration of this assessment instead of only upon certain triggering events, and
• requires the entity that consolidates a VIE (the primary beneficiary) to disclose (1) the assets of the consolidated VIE, if they can be used to onlysettle specific obligations of the consolidated VIE, and (2) the liabilities of a consolidated VIE for which creditors do not have recourse to thegeneral credit of the primary beneficiary.
See Note 21 — Variable Interest Entities for additional information.
F-12

Notes to Consolidated Financial Statements
(Dollars in millions, except per share data unless otherwise noted)
Note 1 — Significant Accounting Policies
Inventories Inventory is recorded at the lower of weighted average cost or net realizable value. Provisions are recorded for excess and obsolete inventory. Fossil fuel,materials and supplies, and emissions allowances are generally included in inventory when purchased. Fossil fuel and emissions allowances are expensedto purchased power and fuel expense when used or sold. Materials and supplies generally includes generating plant materials and are expensed to operatingand maintenance or capitalized to property, plant and equipment, as appropriate, when installed or used. Debt and Equity Security Investments Debt Security Investments. Debt securities are reported at fair value and classified as available-for-sale securities. Unrealized gains and losses, net of tax,are reported in OCI. Equity Security Investments without Readily Determinable Fair Values. We have certain equity securities without readily determinable fair values. Wehave elected to use the practicability exception to measure these investments, defined as cost adjusted for changes from observable transactions foridentical or similar investments of the same issuer, less impairment. Changes in measurement are reported in earnings. Equity Security Investments with Readily Determinable Fair Values. We have certain equity securities with readily determinable fair values. For equitysecurities held in NDT funds, realized and unrealized gains and losses, net of tax, on our NDT funds associated with the Regulatory Agreement Units areincluded in Noncurrent payables to affiliates. Realized and unrealized gains and losses, net of tax, on our NDT funds associated with the Non-RegulatoryAgreement Units are included in earnings. Our NDT funds are classified as current or noncurrent assets, depending on the timing of the decommissioningactivities and income taxes on trust earnings. For all other equity securities with readily determinable fair values, realized and unrealized gains and lossesare included in earnings. See Note 18 — Fair Value of Financial Assets and Liabilities and Note 10 — Asset Retirement Obligations for additionalinformation. Property, Plant and Equipment Property, plant and equipment is recorded at original cost. Original cost includes construction-related direct labor and material costs. When appropriate,original cost also includes capitalized interest. The cost of repairs and maintenance, including planned major maintenance activities and minorreplacements of property, is charged to Operating and maintenance expense as incurred. Upon retirement, the cost of property is generally charged to accumulated depreciation in accordance with the composite and group methods ofdepreciation. Upon replacement of an asset, the costs to remove the asset, net of salvage, are capitalized to gross plant when incurred as part of the cost ofthe newly-installed asset and recorded to depreciation expense over the life of the new asset. Removal costs, net of salvage, incurred for property that willnot be replaced is charged to Operating and maintenance expense as incurred. Capitalized Software. Certain costs, such as design, coding, and testing incurred during the application development stage of software projects that areinternally developed or purchased for operational use are capitalized within Property, plant and equipment. Similar costs incurred for cloud-based solutionstreated as service arrangements are capitalized within Other Current Assets and Deferred Debits and Other Assets. Such capitalized amounts are amortizedratably over the expected lives of the projects when they become operational, generally not to exceed five years. Certain other capitalized software costs arebeing amortized over longer lives based on the expected life or pursuant to prescribed regulatory requirements. Capitalized Interest. During construction, we capitalize the costs of debt funds used to finance construction projects. Capitalization of debt funds isrecorded as a charge to construction work in progress and as a non-cash credit to interest expense. See Note 8 — Property, Plant and Equipment, Note 9 —Jointly Owned Electric Utility Plant and Note 22 — Supplemental Financial Information for additional information regarding property, plant andequipment.
F-13

Notes to Consolidated Financial Statements
(Dollars in millions, except per share data unless otherwise noted)
Note 1 — Significant Accounting Policies
Nuclear Fuel The cost of nuclear fuel is capitalized within Property, plant and equipment and charged to fuel expense using the unit-of-production method. Any potentialfuture SNF disposal fees will be expensed through fuel expense. Additionally, certain on-site SNF storage costs are being reimbursed by the DOE since aDOE (or government-owned) long-term storage facility has not been completed. See Note 19 — Commitments and Contingencies for additionalinformation regarding the cost of SNF storage and disposal. Nuclear Outage Costs Costs associated with nuclear outages, including planned major maintenance activities, are expensed to Operating and maintenance expense or capitalizedto Property, plant and equipment (based on the nature of the activities) in the period incurred. Depreciation and Amortization Except for the amortization of nuclear fuel, depreciation is generally recorded over the estimated service lives of property, plant and equipment on astraight-line basis using the group, composite or unitary methods of depreciation. The group approach is typically for groups of similar assets that haveapproximately the same useful lives and the composite approach is used for dissimilar assets that have different lives. Under both methods, a reportingentity depreciates the assets over the average life of the assets in the group. The estimated service lives are based on a combination of depreciation studies,historical retirements, site licenses and management estimates of operating costs and expected future energy market conditions. See Note 7 — Early PlantRetirements for additional information on the impacts of early plant retirements, Note 8 — Property, Plant and Equipment for additional informationregarding depreciation, and Note 22 — Supplemental Financial Information for additional information regarding nuclear fuel and ARC. Asset Retirement Obligations We estimate and recognize a liability for our legal obligation to perform asset retirement activities even though the timing and/or methods of settlementmay be conditional on future events. We generally update our nuclear decommissioning ARO annually, unless circumstances warrant more frequentupdates, based on our annual evaluation of cost escalation factors and probabilities assigned to the multiple outcome scenarios within our probability-weighted discounted cash flow models. Our multiple outcome scenarios are generally based on decommissioning cost studies which are updated, on arotational basis, for each of our nuclear units at least every five years, unless circumstances warrant more frequent updates. AROs are accreted throughouteach year to reflect the time value of money for these present value obligations through a charge to Operating and maintenance expense in the ConsolidatedStatements of Operations and Comprehensive Income for Non-Regulatory Agreement Units and through a decrease in noncurrent payables to affiliates forRegulatory Agreement Units. See Note 10 — Asset Retirement Obligations for additional information. Guarantees If necessary, we recognize a liability at the time of issuance of a guarantee for the fair market value of the obligations we have undertaken by issuing theguarantee. The liability is reduced or eliminated as we are released from risk under the guarantee. Depending on the nature of the guarantee, the releasefrom risk may be recognized only upon the expiration or settlement of the guarantee or by a systematic and rational amortization method over the term ofthe guarantee. See Note 19 — Commitments and Contingencies for additional information.
F-14

Notes to Consolidated Financial Statements
(Dollars in millions, except per share data unless otherwise noted)
Note 1 — Significant Accounting Policies
Asset Impairments Long-Lived Assets. We regularly monitor and evaluate the carrying value of long-lived assets and asset groups for recoverability whenever events orchanges in circumstances indicate that the carrying value of those assets may not be recoverable. Indicators of impairment may include a deterioratingbusiness climate, including, but not limited to, declines in energy prices, condition of the asset, or plans to dispose of a long-lived asset significantly beforethe end of its useful life. We determine if long-lived assets and asset groups are impaired by comparing the undiscounted expected future cash flows to thecarrying value. When the undiscounted cash flow analysis indicates a long-lived asset or asset group is not recoverable, the amount of the impairment lossis determined by measuring the excess of the carrying amount of the long-lived asset or asset group over its fair value. See Note 12 — Asset Impairmentsfor additional information. Equity Method Investments. We regularly monitor and evaluate equity method investments to determine whether they are impaired. An impairment isrecorded when the investment has experienced a decline in value that is other-than-temporary in nature. Additionally, if the entity in which we hold aninvestment recognizes an impairment loss, we would record their proportionate share of that impairment loss and evaluate the investment for an other-than-temporary decline in value. Debt Security Investments. Declines in the fair value of debt security investments below the cost basis are reviewed to determine if such declines are other-than-temporary. If the decline is determined to be other-than-temporary, the amount of the impairment loss is included in earnings. Equity Security Investments. Equity investments with readily determinable fair values are measured and recorded at fair value with any changes in fairvalue recorded through earnings. Investments in equity securities without readily determinable fair values are qualitatively assessed for impairment eachreporting period. If it is determined that the equity security is impaired on the basis of the qualitative assessment, an impairment loss will be recognized inearnings to the amount by which the security’s carrying amount exceeds its fair value. Derivative Financial Instruments All derivatives are recognized on the balance sheet at their fair value unless they qualify for certain exceptions, including the NPNS. For derivativesintended to serve as economic hedges, changes in fair value are recognized in earnings each period. Amounts classified in earnings are included inOperating revenue, Purchased power and fuel, Interest expense, or Other, net in the Consolidated Statements of Operations and Comprehensive Incomebased on the activity the transaction is economically hedging. While the majority of the derivatives serve as economic hedges, there are also derivativesentered into for proprietary trading purposes, subject to our Risk Management Policy, and changes in the fair value of those derivatives are recorded inrevenue in the Consolidated Statements of Operations and Comprehensive Income. Cash inflows and outflows related to derivative instruments areincluded as a component of operating, investing, or financing cash flows in the Consolidated Statements of Cash Flows, depending on the nature of eachtransaction. On July 1, 2018, we de-designated our fair value and cash flow hedges. As part of the energy marketing business, we enter into contracts to buy and sell energy to meet the requirements of our customers. These contracts includeshort-term and long-term commitments to purchase and sell energy and energy-related products in the energy markets with the intent and ability to deliveror take delivery of the underlying physical commodity. NPNS are contracts where physical delivery is probable, quantities are expected to be used or soldin the normal course of business over a reasonable period of time and will not be financially settled. Revenues and expenses on derivative contracts thatqualify, and are designated, as NPNS are recognized when the underlying physical transaction is completed. While these contracts are considered derivativefinancial instruments, they are not required to be recorded at fair value, but rather are recorded on an accrual basis of accounting. See Note 16 — Derivative Financial Instruments for additional information. Retirement Benefits Exelon sponsors defined benefit pension plans and OPEB plans for essentially all current employees. The plan obligations and costs of providing benefitsunder these plans are measured as of December 31. We account for our participation in Exelon’s pension and OPEB plans by applying multi-employeraccounting. Exelon allocates costs related to its pension and OPEB plans to its subsidiaries based on both active and retired employee participation in eachplan. We include the service cost and non-service cost components in Operating and maintenance expense and Property, plant, and equipment, net in ourconsolidated financial statements. See Note 15 — Retirement Benefits for additional information.
F-15

Notes to Consolidated Financial Statements
(Dollars in millions, except per share data unless otherwise noted)
Note 1 — Significant Accounting Policies
New Accounting Standards New Accounting Standards Adopted in 2020: In 2020, we adopted the following new authoritative accounting guidance issued by the FASB. Impairment of Financial Instruments (Issued June 2016). Provides for a new Current Expected Credit Loss (CECL) impairment model for specifiedfinancial instruments including loans, trade receivables, debt securities classified as held-to-maturity investments and net investments in leases recognizedby a lessor. Under the new guidance, on initial recognition and at each reporting period, an entity is required to recognize an allowance that reflects itscurrent estimate of credit losses expected to be incurred over the life of the financial instrument based on historical experience, current conditions andreasonable and supportable forecasts. The standard was effective January 1, 2020 and requires a modified retrospective transition approach through acumulative-effect adjustment to retained earnings as of the beginning of the period of adoption. This standard is primarily applicable to our trade accountsreceivables balances. The guidance did not have a significant impact on our consolidated financial statements. 2. Mergers, Acquisitions, and Dispositions CENG Put Option We own a 50.01% membership interest in CENG, a joint venture with EDF, which wholly owns the Calvert Cliffs and Ginna nuclear stations and NineMile Point Unit 1, in addition to an 82% undivided ownership interest in Nine Mile Point Unit 2. CENG is 100% consolidated in our financial statements.See Note 21 — Variable Interest Entities for additional information. On April 1, 2014, we entered into various agreements including a NOSA, an amended LLC Operating Agreement, an Employee Matters Agreement, and aPut Option Agreement, among others with EDF. Under the amended LLC Operating Agreement, CENG made a $400 million special distribution to EDFand committed to make preferred distributions to us until we have received aggregate distributions of $400 million plus a return of 8.50% per annum.Under the Put Option Agreement, EDF has the option to sell its 49.99% equity interest in CENG to us exercisable beginning on January 1, 2016 andthereafter until June 30, 2022. On November 20, 2019, we received notice of EDF’s intention to exercise the put option to sell its interest in CENG to us,and the put automatically exercised on January 19, 2020 at the end of the sixty-day advance notice period. Under the terms of the Put Option Agreement, the purchase price is to be determined by agreement of the parties, or absent such agreement, by a third-party arbitration process. The third parties determining fair market value of EDF’s 49.99% interest are to take into consideration all rights and obligationsunder the LLC Operating Agreement and Employee Matters Agreement including but not limited to our rights with respect to any unpaid aggregatepreferred distributions and the related return. As of December 31, 2020, the total unpaid aggregate preferred distributions and related return owed to us is$619 million. At this time, we cannot reasonably predict the ultimate purchase price that will be paid to EDF for its interest in CENG. The transaction willrequire approval by the NYPSC and the FERC. The FERC approval was obtained on July 30, 2020. The process and regulatory approvals are expected toclose in the second half of 2021. Agreement for Sale of Our Solar Business On December 8, 2020, we entered into an agreement with an affiliate of Brookfield Renewable, for the sale of a significant portion of our solar business,including 360 megawatts of generation in operation or under construction across more than 600 sites across the United States. Under the terms of thetransaction, the purchase price is $810 million, subject to certain working capital and other post-closing adjustments. We will retain certain solar assets notincluded in this agreement, primarily Antelope Valley.
F-16

Notes to Consolidated Financial Statements
(Dollars in millions, except per share data unless otherwise noted)
Note 2 — Mergers, Acquisitions, and Dispositions
As a result of the transaction, in the fourth quarter of 2020, we reclassified the solar assets and liabilities in the Consolidated Balance Sheets as held forsale. The transaction is expected to result in an estimated pre-tax gain ranging from $75 million to $125 million. The gain will be recorded in Gain on salesof assets and businesses in the Consolidated Statements of Operations and Comprehensive Income upon completion of the transaction. Completion of thetransaction contemplated by the sale agreement is subject to the satisfaction of several closing conditions and is expected to occur in the first half of 2021.See Note 17 — Debt and Credit Agreements for additional information on the SolGen nonrecourse debt included as part of the transaction. Disposition of Oyster Creek On July 31, 2018, we entered into an agreement with Holtec and its indirect wholly owned subsidiary, OCEP, for the sale and decommissioning of OysterCreek located in Forked River, New Jersey, which permanently ceased generation operations on September 17, 2018. Completion of the transactioncontemplated by the sale agreement was subject to the satisfaction of several closing conditions, including approval of the license transfer from the NRCand other regulatory approvals, and a private letter ruling from the IRS, which were satisfied in the second quarter 2019. The sale was completed on July 1,2019. We recognized a loss on the sale in the third quarter of 2019, which was immaterial. Under the terms of the transaction, we transferred to OCEP substantially all the assets associated with Oyster Creek, including assets held in NDT funds,along with the assumption of liability for all responsibility for the site, including full decommissioning and ongoing management of spent fuel until thespent fuel is moved offsite. The terms of the transaction also include various forms of performance assurance for the obligations of OCEP to timelycomplete the required decommissioning, including a parental guaranty from Holtec for all performance and payment obligations of OCEP, and arequirement for Holtec to deliver a letter of credit to us upon the occurrence of specified events. Upon remeasurement of the Oyster Creek ARO, we recognized an $84 million and a $9 million pre-tax charge to Operating and maintenance expense in2018 and in 2019, respectively. See Note 10 — Asset Retirement Obligations for additional information. Disposition of Electrical Contracting Business On February 28, 2018, we completed the sale of our interest in an electrical contracting business that primarily installs, maintains, and repairs undergroundand high-voltage cable transmission and distribution systems for $87 million, resulting in a pre-tax gain which is included within Gain on sales of assetsand businesses in the Consolidated Statements of Operations and Comprehensive Income for the year ended December 31, 2018. 3. Regulatory Matters The following matters below discuss the status of our material regulatory and legislative proceedings. Illinois Regulatory Matters Zero Emission Standard. Pursuant to FEJA, on January 25, 2018, the ICC announced that our Clinton Unit 1, Quad Cities Unit 1, and Quad Cities Unit 2nuclear plants were selected as the winning bidders through the IPA's ZEC procurement event.
F-17

Notes to Consolidated Financial Statements
(Dollars in millions, except per share data unless otherwise noted)
Note 3 — Regulatory Matters
We executed the ZEC procurement contracts with Illinois utilities, including ComEd, effective January 26, 2018 and began recognizing revenue withcompensation for the sale of ZECs retroactive to the June 1, 2017 effective date of FEJA. The ZEC price was initially established at $16.50 per MWh ofproduction, subject to annual future adjustments determined by the IPA for specified escalation and pricing adjustment mechanisms designed to lower theZEC price based on increases in underlying energy and capacity prices. Illinois utilities are required to purchase all ZECs delivered by the zero-emissionsnuclear-powered generating facilities, subject to annual cost caps. For the initial delivery year, June 1, 2017 to May 31, 2018, and subsequent delivery year,June 1, 2018 to May 31, 2019, the ZEC annual cost cap was set at $235 million. For subsequent delivery years, the IPA-approved targeted ZECprocurement amounts will change based on forward energy and capacity prices. ZECs delivered to Illinois utilities in excess of the annual cost cap may bepaid in subsequent years if the payments do not exceed the prescribed annual cost cap for that year. During the first quarter of 2018, we recognized $150million of revenue related to ZECs generated from June 1, 2017 through December 31, 2017. New Jersey Regulatory Matters New Jersey Clean Energy Legislation. On May 23, 2018, New Jersey enacted legislation that established a ZEC program that provides compensation fornuclear plants that demonstrate to the NJBPU that they meet certain requirements, including that they make a significant contribution to air quality in thestate and that their revenues are insufficient to cover their costs and risks. Under the legislation, the NJBPU will issue ZECs to qualifying nuclear powerplants and the electric distribution utilities in New Jersey will be required to purchase those ZECs. On April 18, 2019, the NJBPU approved the award ofZECs to Salem 1 and Salem 2. Upon approval, we began recognizing revenue for the sale of New Jersey ZECs in the month they are generated and haverecognized $69 million and $53 million for the year ended December 31, 2020 and 2019, respectively. On May 15, 2019, New Jersey Rate Counselappealed the NJBPU's decision to the New Jersey Superior Court. Briefing has been completed, and on December 9, 2020, an oral argument took place. OnOctober 1, 2020, PSEG and us filed applications seeking ZECs for the second eligibility period (June 2022 through May 2025). The NJBPU will act on theapplications by the end of April 2021. We cannot predict the outcome of the appeal. See Note 7 - Early Plant Retirements for additional information relatedto Salem. New York Regulatory Matters New York Clean Energy Standard. On August 1, 2016, the NYPSC issued an order establishing the New York CES, a component of which is a Tier 3 ZECprogram targeted at preserving the environmental attributes of zero-emissions nuclear-powered generating facilities that meet the criteria demonstratingpublic necessity as determined by the NYPSC to be our FitzPatrick, Ginna, and Nine Mile Point nuclear facilities. On November 30, 2016 (as amended on January 13, 2017), a group of parties filed a Petition in New York State court seeking to invalidate the ZECprogram, which argued that the NYPSC did not have authority to establish the program, that it violated state environmental law and that it violated certaintechnical provisions of the State Administrative Procedures Act when adopting the ZEC program. On January 22, 2018, the court dismissed theenvironmental claims and the majority of the plaintiffs from the case but denied the motions to dismiss with respect to the remaining five plaintiffs andclaims, without commenting on the merits of the case. On October 8, 2019, the court dismissed all remaining claims. The petitioners filed a notice ofappeal on November 4, 2019 and originally had until May 4, 2020 to file their brief. Due to COVID-19 related restrictions, the court extended the deadlineto July 29, 2020. Petitioners did not file a brief by the deadline, so the case is deemed dismissed. Petitioners are permitted up to one year from July 29,2020 to file a motion to vacate the dismissal if they can show good cause for the delay. See Note 7 — Early Plant Retirements for additional information related to Ginna and Nine Mile Point. New England Regulatory Matters Mystic Units 8 & 9 and Everett Marine Terminal Cost of Service Agreement. On March 29, 2018, we notified grid operator ISO-NE of our plans to earlyretire Mystic Units 8 and 9 absent regulatory reforms on June 1, 2022. On May 16, 2018, we made a filing with FERC to establish cost-of-servicecompensation and terms and conditions of service for Mystic Units 8 & 9 for the period between June 1, 2022 - May 31, 2024. On December 20, 2018,FERC issued an order accepting the cost of service compensation, reflecting a number of adjustments to the annual fixed revenue requirement, andallowing for recovery of a substantial portion of the costs associated with the adjacent Everett Marine Terminal acquired in October 2018. Thoseadjustments were reflected in a compliance filing made on March 1, 2019. In the December 20, 2018 order, FERC also directed a paper hearing on ROEusing a new methodology. On January 22, 2019, Generation and several other parties filed requests for rehearing of certain findings in the order.
F-18

Notes to Consolidated Financial Statements
(Dollars in millions, except per share data unless otherwise noted)
Note 3 — Regulatory Matters
On July 17, 2020, FERC issued three orders, which together affirmed the recovery of key elements of Mystic's cost of service compensation, includingrecovery of costs associated with the operation of the Everett Marine Terminal. FERC directed a downward adjustment to the rate base for Mystic Units 8and 9, the effect of which will be partially offset by elimination of a crediting mechanism for third party gas sales during the term of the cost of serviceagreement. A compliance filing was submitted on September 15, 2020 and is pending. Several parties filed protests to the compliance filing on the issue ofhow gross plant in-service was calculated, and we filed an answer to the protests on October 21, 2020. On July 28, 2020, FERC ordered additionalbriefings in the ROE proceeding. On December 21, 2020, FERC issued an order on rehearing of the three July 17, 2020 orders, clarifying several cost ofservice provisions. On August 25, 2020, a group of New England generators filed a complaint seeking to extend the scope of the claw back provision in the cost-of-serviceagreement, whereby we would refund certain amounts recovered during the term of the cost of service if it returns to market afterwards. On September 14,2020, we filed an answer to the complaint arguing that the complaint is procedurally improper and a collateral attack on existing FERC orders, and pointingout that the ISO-NE tariff contains protections against the New England generators' concerns that they failed to mention. On September 28, 2020, NewEngland generators filed an answer to our answer. We cannot predict the outcome of this proceeding. On June 10, 2020, we filed a complaint with FERC against ISO-NE on the grounds that ISO-NE failed to follow its tariff with respect to its evaluation ofMystic for transmission security for the 2024 to 2025 Capacity Commitment Period (FCA 15) and that the modifications that ISO-NE made to its unfiledplanning procedures to avoid retaining Mystic should have been filed with FERC for approval. On July 27, 2020, ISO-NE issued a memo to NEPOOLannouncing its determination pursuant to its unfiled planning procedures that Mystic Units 8 and 9 are not needed for FCA 15 for transmission security. Ithad previously determined Mystic Units 8 and 9 are not needed for fuel security. On August 17, 2020, FERC issued an order denying the complaint. OnSeptember 16, 2020, we filed a request for rehearing with FERC. On October 19, 2020, FERC denied rehearing by operation of law and on December 18,2020, we appealed to the U.S. Court of Appeals for the D.C. Circuit. The timing and the outcome of this proceeding is uncertain. See Note 7 — Early Plant Retirements and Note 12 — Asset Impairments for additional information on the impacts of our August 2020 decision to retireMystic Units 8 & 9 upon expiration of the cost of service agreement. Federal Regulatory Matters PJM and NYISO MOPR Proceedings. PJM and NYISO capacity markets include a MOPR. If a resource is subjected to a MOPR, its offer is adjusted toeffectively remove the revenues it receives through a state government-provided financial support program - resulting in a higher offer that may not clearthe capacity market. Prior to December 19, 2019, the MOPR in PJM applied only to certain new gas-fired resources. Currently, the MOPR in NYISOapplies only to certain resources in downstate New York. For our facilities in PJM and NYISO that are currently receiving ZEC compensation, an expanded MOPR would require exclusion of ZEC compensationwhen bidding into future capacity auctions, resulting in an increased risk of these facilities not receiving capacity revenues in future auctions. On December 19, 2019, FERC required PJM to broadly apply the MOPR to all new and existing resources including nuclear, renewables, demandresponse, energy efficiency, storage, and all resources owned by vertically-integrated utilities. This greatly expands the breadth and scope of PJM’s MOPR,which is effective as of PJM’s next capacity auction. While FERC included some limited exemptions, no exemptions were available to state-supportednuclear resources.
F-19

Notes to Consolidated Financial Statements
(Dollars in millions, except per share data unless otherwise noted)
Note 3 — Regulatory Matters
FERC provided no new mechanism for accommodating state-supported resources other than the existing FRR mechanism (under which an entire utilityzone would be removed from PJM’s capacity auction along with sufficient resources to support the load in such zone). In response to FERC’s order, PJMsubmitted a compliance filing on March 18, 2020 wherein PJM proposed tariff language interpreting and implementing FERC's directives, and proposed aschedule for resuming capacity auctions that is contingent on the timing of FERC's action on the compliance filing. On April 16, 2020, FERC issued an order largely denying most requests for rehearing of FERC's December 2019 order but granting a few clarifications thatrequired an additional PJM compliance filing which PJM submitted on June 1, 2020. On October 15, 2020, FERC issued an order denying requests for rehearing of its April 16, 2020 order and accepting PJM’s two compliance filings, subjectto a further compliance filing to revise minor aspects of the proposed MOPR methodology. As part of that order, FERC also accepted PJM’s proposal tocondense the schedule of activities leading up to the next capacity auction. In November 2020, PJM announced that it will conduct its next capacity auctionbeginning on May 19, 2021 and ending on May 25, 2021 and will post the results on June 2, 2021. Because neither Illinois nor New Jersey have implemented an FRR program in their PJM zones, the MOPR will apply in that next capacity auction to ourowned or jointly owned nuclear plants in those states receiving a benefit under the Illinois ZES, or the New Jersey ZEC program, as applicable, increasingthe risk that those units may not clear the capacity market. We are currently working with PJM and other stakeholders to pursue the FRR option as an alternative to the PJM capacity auction. If Illinois implementsthe FRR option, our Illinois nuclear plants could be removed from PJM’s capacity auction and instead supply capacity, and be compensated under the FRRprogram, which has the potential to mitigate the current economic distress being experienced by our nuclear plants in Illinois, as discussed in Note 7 —Early Plant Retirements. Implementing the FRR program in Illinois will require both legislative and regulatory changes. Whether legislation is needed inNew Jersey would depend on how the state chooses to structure an FRR program. We cannot predict whether or when such legislative and regulatorychanges can be implemented. On February 20, 2020, FERC issued an order rejecting requests to expand NYISO’s version of the MOPR (referred to as buyer-side mitigation rules)beyond its current limited applicability to certain resources in downstate. However, on October 14, 2020, two natural gas-fired generators in New Yorkfiled a complaint at FERC seeking to expand the MOPR in NYISO to apply to all resources, new and existing, across the entire NYISO market. We arestrenuously opposing expansion of FERC’s MOPR policies in the NYISO market. While it is too early in the proceeding to predict its outcome and thereare significant differences between the NYISO and PJM markets that would justify a different result, if FERC follows its MOPR precedent in PJM andapplies the MOPR in NYISO broadly as requested in the complaint, our facilities in NYISO that are receiving ZEC compensation may be at increased riskof not clearing the capacity auction. If our state-supported nuclear plants in PJM or NYISO are subjected to the MOPR or equivalent without compensation under an FRR or similar program, itcould have a material adverse impact on our financial statements, which we cannot reasonably estimate at this time. Operating License Renewals Conowingo Hydroelectric Project. On August 29, 2012, we submitted a hydroelectric license application to FERC for a new license for the ConowingoHydroelectric Project (Conowingo). In connection with our efforts to obtain a water quality certification pursuant to Section 401 of the Clean Water Act(401 Certification) from MDE for Conowingo, we have been working with MDE and other stakeholders to resolve water quality licensing issues,including: (1) water quality, (2) fish habitat, and (3) sediment.
F-20

Notes to Consolidated Financial Statements
(Dollars in millions, except per share data unless otherwise noted)
Note 3 — Regulatory Matters
On April 21, 2016, we and the U.S. Fish and Wildlife Service of the U.S. Department of the Interior executed a settlement agreement (DOI Settlement)resolving all fish passage issues between the parties. On April 27, 2018, MDE issued its 401 Certification for Conowingo. As issued, the 401 Certification contains numerous conditions, including thoserelating to reduction of nutrients from upstream sources, removal of all visible trash and debris from upstream sources, and implementation of measuresrelating to fish passage, which could have a material, unfavorable impact on our financial statements through an increase in capital expenditures andoperating costs if implemented. On May 25, 2018, we filed complaints in federal and state court, along with a petition for reconsideration with MDE,alleging that the conditions are unfair and onerous and in violation of MDE regulations and state, federal, and constitutional law. We also requested thatFERC defer the issuance of the federal license while these significant state and federal law issues are pending. On February 28, 2019, we filed a Petition forDeclaratory Order with FERC requesting that FERC issue an order declaring that MDE waived its right to issue a 401 Certification for Conowingo becauseit failed to timely act on Conowingo’s 401 Certification application and requesting that FERC decline to include the conditions required by MDE in April2018. On October 29, 2019, we and MDE filed with FERC a Joint Offer of Settlement (Offer of Settlement) that would resolve all outstanding issues relating tothe 401 Certification. Pursuant to the Offer of Settlement, the parties submitted Proposed License Articles to FERC to be incorporated by FERC into thenew license in accordance with FERC’s discretionary authority under the Federal Power Act. Among the Proposed License Articles are modifications toriver flows to improve aquatic habitat, eel passage improvements, and initiatives to support rare, threatened and endangered wildlife. If FERC approves theOffer of Settlement and incorporates the Proposed License Articles into the new license without modification, then MDE would waive its rights to issue a401 Certification and we would agree, pursuant to a separate agreement with MDE (MDE Settlement), to implement additional environmental protection,mitigation, and enhancement measures over the anticipated 50-year term of the new license. These measures address mussel restoration and otherecological and water quality matters, among other commitments. Our commitments under the various provisions of the Offer of Settlement and MDESettlement are not effective unless and until FERC approves the Offer of Settlement and issues the new license with the Proposed License Articles. The financial impact of the DOI and MDE Settlements and other anticipated license commitments are estimated to be $11 million to $14 million per year,on average, recognized over the new license term, including capital and operating costs. The actual timing and amount of the majority of these costs are notcurrently fixed and will vary from year to year throughout the life of the new license. We cannot currently predict when FERC will issue the new license.As of December 31, 2020, $45 million of direct costs associated with Conowingo licensing efforts have been capitalized. Our current depreciationprovision for Conowingo assumes renewal of the FERC license. Peach Bottom Units 2 and 3. On July 10, 2018, we submitted a second 20-year license renewal application with the NRC for Peach Bottom Units 2 and 3,which was approved on March 6, 2020. Peach Bottom Units 2 and 3 are now licensed to operate through 2053 and 2054, respectively. See Note 8 –Property, Plant and Equipment for additional information regarding the estimated useful life and depreciation provisions for Peach Bottom. 4. Revenue from Contracts with Customers We recognize revenue from contracts with customers to depict the transfer of goods or services to customers at an amount that we expect to be entitled to inexchange for those goods or services. Our primary sources of revenue include competitive sales of power, natural gas, and other energy-related productsand services. The performance obligations, revenue recognition, and payment terms associated with these sources of revenue are further discussed in thetable below. There are no significant financing components for these sources of revenue. Unless otherwise noted, for each of the significant revenue categories and related performance obligations described below, we have the right toconsideration from the customer in an amount that corresponds directly with the value transferred to the customer for the performance completed to date.Therefore, we generally recognize revenue in the amount for which we have the right to invoice the customer. As a result, there are generally no significantjudgments used in determining or allocating the transaction price.
F-21

Notes to Consolidated Financial Statements
(Dollars in millions, except per share data unless otherwise noted)
Note 4 — Revenue from Contracts with Customers
Revenue Source Description Performance ObligationTiming of Revenue
Recognition Payment Terms
Competitive PowerSales
Sales of power and other energy-related commodities to wholesale and
retail customers across multiplegeographic regions through its
customer-facing business,Constellation.
Various including the deliveryof power (generally deliveredover time) and other energy-related commodities such ascapacity (generally deliveredover time), ZECs, RECs or
other ancillary services(generally delivered at a point in
time).
Concurrently as power isgenerated for bundled power
sale contracts. (a)
Within the monthfollowing delivery to
the customer.
Competitive Natural GasSales
Sales of natural gas on a fullrequirement basis or for an agreedupon volume to commercial and
residential customers.
Delivery of natural gas to thecustomer.
Over time as the natural gasis delivered and consumed
by the customer.
Within the monthfollowing delivery to
the customer.
Other CompetitiveProducts and Services
Sales of other energy-related productsand services such as long-term
construction and installation of energyefficiency assets and new powergenerating facilities, primarily to
commercial and industrial customers.
Construction and/or installationof the asset for the customer.
Revenues and associatedcosts are recognized
throughout the contract termusing an input method tomeasure progress towards
completion.(b)
Within 30 or 45 daysfrom the invoice
date.
(a) Certain contracts may contain limits on the total amount of revenue we are able to collect over the entire term of the contract. In such cases, weestimate the total consideration expected to be received over the term of the contract net of the constraint and allocate the expected consideration to theperformance obligations in the contract such that revenue is recognized ratably over the term of the entire contract as the performance obligations aresatisfied.
(b) The method recognizes revenue based on the various inputs used to satisfy the performance obligation, such as costs incurred and total labor hoursexpended. The total amount of revenue that will be recognized is based on the agreed upon contractually-stated amount. The average contract term forthese projects is approximately 18 months.
We incur incremental costs in order to execute certain retail power and gas sales contracts. These costs, which primarily relate to retail broker fees and salescommissions, are capitalized when incurred as contract acquisition costs and were immaterial as of December 31, 2020 and 2019. Contract Balances Contract Assets We record contract assets for the revenue recognized on the construction and installation of energy efficiency assets and new power generating facilitiesbefore we have an unconditional right to bill for and receive the consideration from the customer. These contract assets are subsequently reclassified toreceivables when the right to payment becomes unconditional. We record contract assets and contract receivables within Other current assets and Customeraccounts receivable, net, respectively, within the Consolidated Balance Sheets. The following table provides a rollforward of the contract assets reflected inour Consolidated Balance Sheets.
F-22

Notes to Consolidated Financial Statements
(Dollars in millions, except per share data unless otherwise noted)
Note 4 — Revenue from Contracts with Customers
Contract Assets Balance as of December 31, 2018 $ 187 Amounts reclassified to receivables (143)Revenues recognized 130 Balance at December 31, 2019 174 Amounts reclassified to receivables (86)Revenues recognized 68 Contract assets reclassified as held for sale(a) (12)Balance at December 31, 2020 $ 144
(a) Represents contract assets related to our solar business, which were classified as held for sale as a result of the sale agreement. See Note 2 — Mergers,Acquisitions, and Dispositions for additional information.
Contract Liabilities We record contract liabilities when consideration is received or due prior to the satisfaction of the performance obligations. We record contract liabilitieswithin Other current liabilities and Other non-current liabilities within the Consolidated Balance Sheets. These contract liabilities primarily relate to upfrontconsideration received or due for equipment service plans, solar panel leases, and the Illinois ZEC program that introduces a cap on the total considerationto be received by us. The following table provides a rollforward of the contract liabilities reflected in our Consolidated Balance Sheets. Contract Liabilities Balance as of December 31, 2017 $ 35 Consideration received or due 465 Revenues recognized (458)Balance as of December 31, 2018 42 Consideration received or due 287 Revenues recognized (258)Balance at December 31, 2019 71 Consideration received or due 282 Revenues recognized (266)Contracts liabilities reclassified as held for sale(a) (3)Balance at December 31, 2020 $ 84
(a) Represents contract liabilities related to our solar business, which were classified as held for sale as a result of the sale agreement. See Note 2 —Mergers, Acquisitions, and Dispositions for additional information.
The following table reflects revenues recognized in the years ended December 31, 2020, 2019 and 2018, which were included in contract liabilities atDecember 31, 2019, 2018, and 2017, respectively: 2020 2019 2018 Revenues recognized $ 64 $ 32 $ 11
F-23

Notes to Consolidated Financial Statements
(Dollars in millions, except per share data unless otherwise noted)
Note 4 — Revenue from Contracts with Customers
Transaction Price Allocated to Remaining Performance Obligations The following table shows the amounts of future revenues expected to be recorded in each year for performance obligations that are unsatisfied or partiallyunsatisfied as of December 31, 2020. This disclosure only includes contracts for which the total consideration is fixed and determinable at contractinception. The average contract term varies by customer type and commodity but ranges from one month to several years. This disclosure excludes ourpower and gas sales contracts as they contain variable volumes and/or variable pricing.
2021 2022 2023 2024 2025 andthereafter Total
Remaining performanceobligations $ 352 $ 124 $ 55 $ 34 $ 243 $ 808
Revenue Disaggregation We disaggregate the revenue recognized from contracts with customers into categories that depict how the nature, amount, timing, and uncertainty ofrevenue and cash flows are affected by economic factors. See Note 5 — Segment Information for the presentation of revenue disaggregation. 5. Segment Information Operating segments are determined based on information used by the CODM in deciding how to evaluate performance and allocate resources. We have five reportable segments consisting of the Mid-Atlantic, Midwest, New York, ERCOT, and all other power regions referred to collectively as“Other Power Regions.” The basis for our reportable segments is the integrated management of our electricity business that is located in different geographic regions, and largelyrepresentative of the footprints of ISO/RTO and/or NERC regions, which utilize multiple supply sources to provide electricity through various distributionchannels (wholesale and retail). Our hedging strategies and risk metrics are also aligned to these same geographic regions. Descriptions of each of our fivereportable segments are as follows:
• Mid-Atlantic represents operations in the eastern half of PJM, which includes New Jersey, Maryland, Virginia, West Virginia, Delaware, theDistrict of Columbia, and parts of Pennsylvania and North Carolina.
• Midwest represents operations in the western half of PJM and the United States footprint of MISO, excluding MISO’s Southern Region.
• New York represents operations within NYISO.
• ERCOT represents operations within Electric Reliability Council of Texas.
• Other Power Regions:
• New England represents operations within ISO-NE.
• South represents operations in the FRCC, MISO’s Southern Region, and the remaining portions of the SERC not included within MISO or
PJM.
• West represents operations in the WECC, which includes CAISO.
• Canada represents operations across the entire country of Canada and includes AESO, OIESO, and the Canadian portion of MISO.
F-24

Notes to Consolidated Financial Statements
(Dollars in millions, except per share data unless otherwise noted)
Note 5 — Segment Information
The CODM evaluates the performance of our electric business activities and allocates resources based on RNF. We believe that RNF is a usefulmeasurement of operational performance. RNF is not a presentation defined under GAAP and may not be comparable to other companies’ presentations ordeemed more useful than the GAAP information provided elsewhere in this report. Our operating revenues include all sales to third parties and affiliatedsales to the Exelon's utility subsidiaries. Purchased power costs include all costs associated with the procurement and supply of electricity includingcapacity, energy, and ancillary services. Fuel expense includes the fuel costs for our owned generation and fuel costs associated with tolling agreements.The results of our other business activities are not regularly reviewed by the CODM and are therefore not classified as operating segments or included inthe regional reportable segment amounts. These activities include natural gas, as well as other miscellaneous business activities that are not significant toour overall operating revenues or results of operations. Further, our unrealized mark-to-market gains and losses on economic hedging activities and ouramortization of certain intangible assets and liabilities relating to commodity contracts recorded at fair value from mergers and acquisitions are alsoexcluded from the regional reportable segment amounts. We do not use a measure of total assets in making decisions regarding allocating resources to orassessing the performance of these reportable segments. The following tables disaggregate the revenue recognized from contracts with customers into categories that depict how the nature, amount, timing, anduncertainty of revenue and cash flows are affected by economic factors. The disaggregation of revenues reflects our two primary products of power salesand natural gas sales, with further disaggregation of power sales provided by geographic region. The following tables also show the reconciliation ofreportable segment revenues and RNF to our total revenues and RNF for the years ended December 31, 2020, 2019, and 2018. 2020 Revenues from external customers(a)
Contracts with
customers Other(b) Total Intersegment
Revenues Total Revenues Mid-Atlantic $ 4,785 $ (168) $ 4,617 $ 28 $ 4,645 Midwest 3,717 312 4,029 (5) 4,024 New York 1,444 (12) 1,432 (1) 1,431 ERCOT 735 198 933 25 958 Other Power Regions 3,586 463 4,049 (47) 4,002 Total Competitive Businesses Electric Revenues $ 14,267 $ 793 $ 15,060 $ — $ 15,060 Competitive Businesses Natural Gas Revenues 1,283 720 2,003 — 2,003 Competitive Businesses Other Revenues(c) 355 185 540 — 540 Total Consolidated Operating Revenues $ 15,905 $ 1,698 $ 17,603 $ — $ 17,603
F-25

Notes to Consolidated Financial Statements
(Dollars in millions, except per share data unless otherwise noted)
Note 5 — Segment Information
2019 Revenues from external customers(a)
Contracts with
customers Other(b) Total Intersegment
Revenues Total Revenues Mid-Atlantic $ 5,053 $ 17 $ 5,070 $ 4 $ 5,074 Midwest 4,095 232 4,327 (34) 4,293 New York 1,571 25 1,596 — 1,596 ERCOT 768 229 997 16 1,013 Other Power Regions 3,687 608 4,295 (49) 4,246 Total Competitive Businesses Electric Revenues $ 15,174 $ 1,111 $ 16,285 $ (63) $ 16,222 Competitive Businesses Natural Gas Revenues 1,446 702 2,148 62 2,210 Competitive Businesses Other Revenues(c) 440 51 491 1 492 Total Consolidated Operating Revenues $ 17,060 $ 1,864 $ 18,924 $ — $ 18,924 2018 Revenues from external customers(a)
Contracts with
customers Other(b) Total Intersegment
Revenues Total Revenues Mid-Atlantic $ 5,241 $ 233 $ 5,474 $ 13 $ 5,487 Midwest 4,527 190 4,717 (11) 4,706 New York 1,723 (36) 1,687 — 1,687 ERCOT 572 560 1,132 1 1,133 Other Power Regions 3,530 871 4,401 (66) 4,335 Total Competitive Businesses Electric Revenues $ 15,593 $ 1,818 $ 17,411 $ (63) $ 17,348 Competitive Businesses Natural Gas Revenues 1,524 1,194 2,718 62 2,780 Competitive Businesses Other Revenues(c) 510 (202) 308 1 309 Total Consolidated Operating Revenues $ 17,627 $ 2,810 $ 20,437 $ — $ 20,437
(a) Includes all wholesale and retail electric sales to third parties and affiliated sales to Exelon's utility subsidiaries.(b) Includes revenues from derivatives and leases.(c) Represents activities not allocated to a region. See text above for a description of included activities. Includes unrealized mark-to-market gains of $110
million and losses of $4 million and $262 million for the years ended December 31, 2020, 2019, and 2018, respectively, and the elimination ofintersegment revenues.
F-26

Notes to Consolidated Financial Statements
(Dollars in millions, except per share data unless otherwise noted)
Note 5 — Segment Information
2020 2019 2018
RNF fromexternal
customers(a) Intersegment
RNF TotalRNF
RNF fromexternal
customers(a) Intersegment
RNF TotalRNF
RNF fromexternal
customers(a) Intersegment
RNF TotalRNF
Mid-Atlantic $ 2,174 $ 30 $ 2,204 $ 2,637 $ 18 $ 2,655 $ 3,022 $ 51 $ 3,073 Midwest 2,902 — 2,902 2,994 (32) 2,962 3,112 23 3,135 New York 983 14 997 1,081 13 1,094 1,112 10 1,122 ERCOT 407 19 426 338 (30) 308 501 (243) 258 Other Power Regions 759 (94) 665 694 (74) 620 883 (154) 729 Total RNF for
ReportableSegments $ 7,225 $ (31) $ 7,194 $ 7,744 $ (105) $ 7,639 $ 8,630 $ (313) $ 8,317
Other(b) 793 31 824 324 105 429 114 313 427 Total RNF $ 8,018 $ — $ 8,018 $ 8,068 $ — $ 8,068 $ 8,744 $ — $ 8,744
(a) Includes purchases and sales from/to third parties and affiliated sales to Exelon's utility subsidiaries.(b) Other represents activities not allocated to a region. See text above for a description of included activities. Primarily includes:
• unrealized mark-to-market gains of $295 million and losses of $215 million and $319 million for the years ended December 31, 2020, 2019,and 2018, respectively;
• accelerated nuclear fuel amortization associated with the announced early plant retirements as discussed in Note 7 - Early Plant Retirements
of $60 million, $13 million, and $57 million in for the years ended December 31, 2020, 2019, and 2018, respectively; and
• the elimination of intersegment RNF. 6. Accounts Receivable Allowance for Credit Losses on Accounts Receivable The following table presents the rollforward of Allowance for Credit Losses on Customer Accounts Receivable for the year ended December 31, 2020.
Allowance for Credit
Losses Balance as of December 31, 2019 $ 80 Plus: Current Period Provision for Expected Credit Losses 13 Less: Write-offs, net of recoveries(a) 5 Less: Sale of customer accounts receivable(b) 56 Balance as of December 31, 2020 $ 32
(a) Recoveries were not material.(b) See below for additional information on the sale of customer accounts receivable in the second quarter of 2020.
F-27

Notes to Consolidated Financial Statements
(Dollars in millions, except per share data unless otherwise noted)
Note 6 — Accounts Receivable Unbilled Customer Revenue We recorded $258 million and $807 million of unbilled customer revenues in Customer accounts receivables, net in the Consolidated Balance Sheets as ofDecember 31, 2020 and 2019, respectively. Sales of Customer Accounts Receivable On April 8, 2020, NER, a bankruptcy remote, special purpose entity, which is wholly-owned by us, entered into a revolving accounts receivable financingarrangement with a number of financial institutions and a commercial paper conduit (the Purchasers) to sell certain customer accounts receivable (theFacility). The Facility, whose maximum capacity is $750 million, is scheduled to expire on April 7, 2021, unless renewed by the mutual consent of theparties in accordance with its terms. Under the Facility, NER may sell eligible short-term customer accounts receivable to the Purchasers in exchange forcash and subordinated interest. The transfers are reported as sales of receivables in the consolidated financial statements. The subordinated interest incollections upon the receivables sold to the Purchasers is referred to as the DPP, which is reflected in Other current assets on our Consolidated BalanceSheet. On April 8, 2020, we derecognized and transferred approximately $1.2 billion of receivables at fair value to the Purchasers in exchange for approximately$500 million in cash purchase price and $650 million of DPP. On February 17, 2021, we received additional cash of $250 million from the Purchasers forthe remaining capacity in the Facility. The following table summarizes the impact of the sale of certain receivables: As of December 31, 2020 Derecognized receivables transferred at fair value(a) $ 1,139 Cash proceeds received 500 DPP 639
(a) Includes additional customer accounts receivable sold into the Facility of $6,608 million since the start of the financing agreement.
For the year endedDecember 31, 2020
Loss on sale of receivables(a) $ 30
(a) Reflected in Operating and maintenance expense on our Consolidated Statement of Operations and Comprehensive Income.
For the year endedDecember 31, 2020
Proceeds from new transfers $ 2,816 Cash collections received on DPP 3,771 Cash collections reinvested in the Facility 6,587 Our risk of loss following the transfer of accounts receivable is limited to the DPP outstanding. Payment of DPP is not subject to significant risks otherthan delinquencies and credit losses on accounts receivable transferred, which have historically been and are expected to be immaterial. We continue toservice the receivables sold in exchange for a servicing fee. We did not record a servicing asset or liability as the servicing fees were immaterial. We recognize the cash proceeds received upon sale in Net cash provided by operating activities in our Consolidated Statement of Cash Flows. Thecollection and reinvestment of DPP is recognized in Net cash provided by investing activities of the Consolidated Statement of Cash Flows.
F-28

Notes to Consolidated Financial Statements
(Dollars in millions, except per share data unless otherwise noted)
Note 6 — Accounts Receivable
See Note 18 — Fair Value of Financial Assets and Liabilities and Note 21 — Variable Interest Entities for additional information. Other Purchases and Sales of Customer and Other Accounts Receivables We are required, under supplier tariffs in ISO-NE, MISO, NYISO, and PJM, to sell customer and other receivables to utility companies, which includeExelon's utility subsidiaries. The following table presents the total receivables sold for the year ended December 31, 2020.
For the year endedDecember 31, 2020
Total Receivables Sold $ 824 Related Party Transactions: Receivables sold to Exelon's utility subsidiaries 252 7. Early Plant Retirements We continuously evaluate factors that affect the current and expected economic value of our plants, including, but not limited to: market power prices,results of capacity auctions, potential legislative and regulatory solutions to ensure plants are fairly compensated for benefits they provide through theircarbon-free emissions, reliability, or fuel security, and the impact of potential rules from the EPA requiring reduction of carbon and other emissions and theefforts of states to implement those final rules. The precise timing of an early retirement date for any plant, and the resulting financial statement impacts,may be affected by many factors, including the status of potential regulatory or legislative solutions, results of any transmission system reliability studyassessments, the nature of any co-owner requirements and stipulations, and NDT fund requirements for nuclear plants, among other factors. However, theearliest retirement date for any plant would usually be the first year in which the unit does not have capacity or other obligations, and where applicable, justprior to its next scheduled nuclear refueling outage. Nuclear Generation In 2015 and 2016, we identified the Clinton and Quad Cities nuclear plants in Illinois, Ginna and Nine Mile Point nuclear plants in New York, and TMInuclear plant in Pennsylvania as having the greatest risk of early retirement based on economic valuation and other factors. In 2017, PSEG made publicsimilar financial challenges facing its New Jersey nuclear plants, including Salem, of which we own a 42.59% ownership interest. PSEG is the operator ofSalem and also has the decision-making authority to retire Salem. Assuming the continued effectiveness of the Illinois ZES, New Jersey ZEC program, and the New York CES, we and CENG, through its ownership ofGinna and Nine Mile Point, no longer consider Clinton, Quad Cities, Salem, Ginna, or Nine Mile Point to be at heightened risk for early retirement.However, to the extent the Illinois ZES, New Jersey ZEC program, or the New York CES do not operate as expected over their full terms, each of theseplants, in addition to FitzPatrick, would be at heightened risk for early retirement, which could have a material impact on our future financial statements. Inaddition, FERC’s December 19, 2019 order on the MOPR in PJM may undermine the continued effectiveness of the Illinois ZES and the New Jersey ZECprogram unless Illinois and New Jersey implement an FRR mechanism under which our plants in these states would be removed from PJM’s capacityauction. See Note 3 — Regulatory Matters for additional information on the Illinois ZES, New Jersey ZEC program, New York CES, and FERC'sDecember 19, 2019 order on the MOPR in PJM.
F-29

Notes to Consolidated Financial Statements
(Dollars in millions, except per share data unless otherwise noted)
Note 7 — Early Plant Retirements
In Pennsylvania, the TMI nuclear plant did not clear in the May 2017 PJM capacity auction for the 2020-2021 planning year, the third consecutive year thatTMI failed to clear the PJM base residual capacity auction and on May 30, 2017, based on these capacity auction results, prolonged periods of lowwholesale power prices, and the absence of federal or state policies that place a value on nuclear energy for its ability to produce electricity without airpollution, we announced that we would permanently cease generation operations at TMI. On September 20, 2019, we permanently ceased generationoperations at TMI. Dresden, Byron, and Braidwood nuclear plants in Illinois are also showing increased signs of economic distress, in a market that does not currentlycompensate them for their unique contribution to grid resiliency and their ability to produce large amounts of energy without carbon and air pollution. TheMay 2018 PJM capacity auction for the 2021-2022 planning year resulted in the largest volume of nuclear capacity ever not selected in the auction,including all of Dresden, and portions of Byron and Braidwood. While all of LaSalle's capacity did clear in the 2021-2022 planning year auction, we havebecome increasingly concerned about the economic viability of this plant as well in a landscape where energy market prices remain depressed and energymarket rules remain fatally flawed. On August 27, 2020, we announced that we intend to permanently cease generation operations at Byron in September 2021 and at Dresden in November2021. The current NRC licenses for Byron Units 1 and 2 expire in 2044 and 2046, respectively, and the licenses for Dresden Units 2 and 3 expire in 2029and 2031, respectively. As a result of the decision to early retire Byron and Dresden, we recognized certain one-time charges for the year ended December 31, 2020 related tomaterials and supplies inventory reserve adjustments, employee-related costs, including severance benefit costs further discussed below, and constructionwork-in-progress impairments, among other items. In addition, as a result of the decisions to early retire Byron and Dresden, there are ongoing annualfinancial impacts stemming from shortening the expected economic useful lives of these nuclear plants primarily related to accelerated depreciation of plantassets (including any ARC), accelerated amortization of nuclear fuel, and changes in ARO accretion expense associated with the changes indecommissioning timing and cost assumptions to reflect an earlier retirement date. See Note 10 — Asset Retirement Obligations for additional informationon changes to the nuclear decommissioning ARO balance and Note 12 — Asset Impairments for impairment assessment considerations given to theMidwest asset group as a result of the early retirement decision. The total impact on the Consolidated Statements of Operations and Comprehensive Incomeis summarized in the table below.
F-30
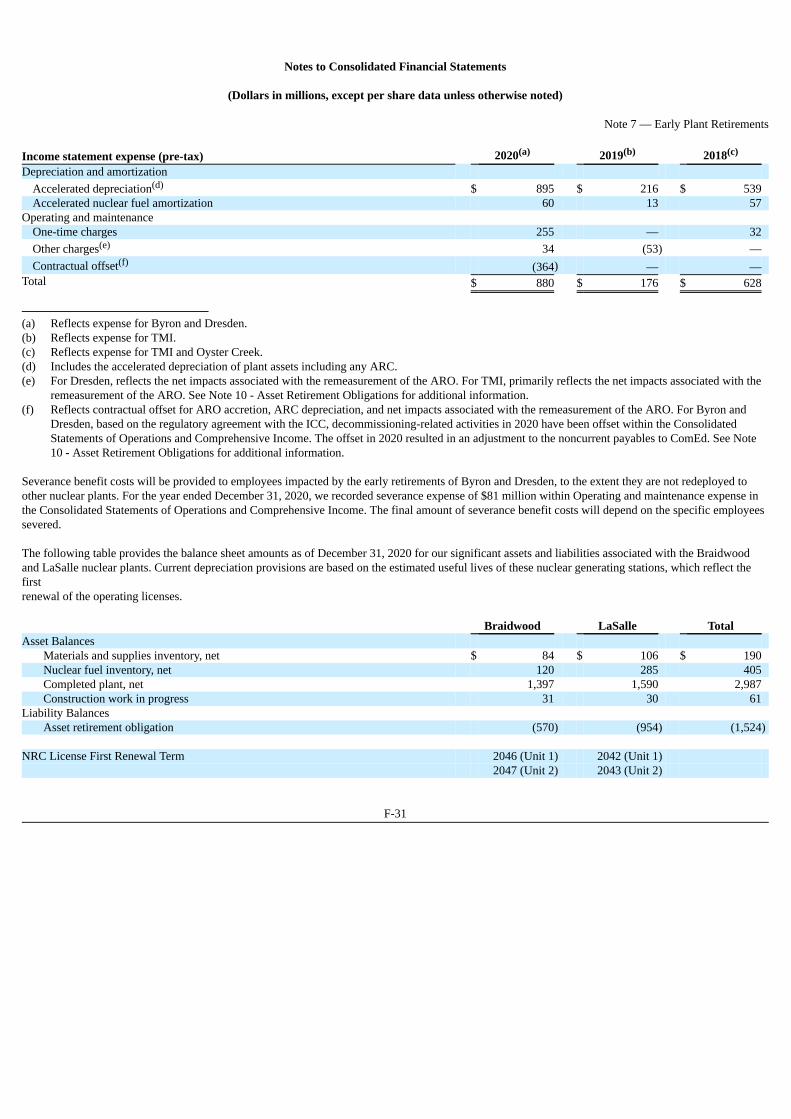
Notes to Consolidated Financial Statements
(Dollars in millions, except per share data unless otherwise noted)
Note 7 — Early Plant Retirements
Income statement expense (pre-tax) 2020(a) 2019(b) 2018(c) Depreciation and amortization
Accelerated depreciation(d) $ 895 $ 216 $ 539 Accelerated nuclear fuel amortization 60 13 57
Operating and maintenance One-time charges 255 — 32 Other charges(e) 34 (53) — Contractual offset(f) (364) — —
Total $ 880 $ 176 $ 628
(a) Reflects expense for Byron and Dresden.(b) Reflects expense for TMI.(c) Reflects expense for TMI and Oyster Creek.(d) Includes the accelerated depreciation of plant assets including any ARC.(e) For Dresden, reflects the net impacts associated with the remeasurement of the ARO. For TMI, primarily reflects the net impacts associated with the
remeasurement of the ARO. See Note 10 - Asset Retirement Obligations for additional information.(f) Reflects contractual offset for ARO accretion, ARC depreciation, and net impacts associated with the remeasurement of the ARO. For Byron and
Dresden, based on the regulatory agreement with the ICC, decommissioning-related activities in 2020 have been offset within the ConsolidatedStatements of Operations and Comprehensive Income. The offset in 2020 resulted in an adjustment to the noncurrent payables to ComEd. See Note10 - Asset Retirement Obligations for additional information.
Severance benefit costs will be provided to employees impacted by the early retirements of Byron and Dresden, to the extent they are not redeployed toother nuclear plants. For the year ended December 31, 2020, we recorded severance expense of $81 million within Operating and maintenance expense inthe Consolidated Statements of Operations and Comprehensive Income. The final amount of severance benefit costs will depend on the specific employeessevered. The following table provides the balance sheet amounts as of December 31, 2020 for our significant assets and liabilities associated with the Braidwoodand LaSalle nuclear plants. Current depreciation provisions are based on the estimated useful lives of these nuclear generating stations, which reflect thefirstrenewal of the operating licenses.
Braidwood LaSalle Total Asset Balances
Materials and supplies inventory, net $ 84 $ 106 $ 190 Nuclear fuel inventory, net 120 285 405 Completed plant, net 1,397 1,590 2,987 Construction work in progress 31 30 61
Liability Balances Asset retirement obligation (570) (954) (1,524)
NRC License First Renewal Term 2046 (Unit 1) 2042 (Unit 1) 2047 (Unit 2) 2043 (Unit 2)
F-31

Notes to Consolidated Financial Statements
(Dollars in millions, except per share data unless otherwise noted)
Note 7 — Early Plant Retirements
We continue to work with stakeholders on state policy solutions, while also advocating for broader market reforms at the regional and federal level. Theabsence of such solutions or reforms could result in future impairments of the Midwest asset group, or accelerated depreciation for specific plants over theirshortened estimated useful lives, both of which could have a material unfavorable impact on our future results of operations. Other Generation In March 2018, we notified ISO-NE of our plans to early retire, among other assets, the Mystic Generating Station's units 8 and 9 (Mystic 8 and 9) absentregulatory reforms to properly value reliability and regional fuel security. Thereafter, ISO-NE identified Mystic 8 and 9 as being needed to ensure fuelsecurity for the region and entered into a cost of service agreement with these two units for the period between June 1, 2022 - May 31, 2024. Theagreement was approved by the FERC in December 2018. On June 10, 2020, we filed a complaint with FERC against ISO-NE stating that ISO-NE failed to follow its tariff with respect to its evaluation of Mystic 8and 9 for transmission security for the 2024 to 2025 Capacity Commitment Period (FCA 15) and that the modifications that ISO-NE made to its unfiledplanning procedures to avoid retaining Mystic 8 and 9 should have been filed with FERC for approval. On August 17, 2020, FERC issued an order denyingthe complaint. As a result, on August 20, 2020, we determined we will permanently cease generation operations at Mystic 8 and 9 at the expiration of thecost of service commitment in May 2024. See Note 3 — Regulatory Matters for additional discussion of Mystic’s cost of service agreement. As a result of the decision to early retire Mystic 8 and 9, we recognized $22 million of one-time charges for the year ended December 31, 2020, related tomaterials and supplies inventory reserve adjustments, among other items. In addition, there are annual financial impacts stemming from shortening theexpected economic useful life of Mystic 8 and 9 primarily related to accelerated depreciation of plant assets. We recorded incremental Depreciation andamortization expense of $26 million for the year ended December 31, 2020. See Note 12 — Asset Impairments for impairment assessment considerationsof the New England Asset Group. 8. Property, Plant and Equipment The following table presents a summary of property, plant and equipment by asset category as of December 31, 2020 and 2019: Asset Category December 31, 2020 December 31, 2019 Electric $ 29,724 $ 29,839 Nuclear fuel(a) 5,399 5,656 Construction work in progress 450 702 Other property, plant, and equipment 11 13
Total property, plant, and equipment 35,584 36,210 Less: accumulated depreciation(b) 13,370 12,017
Property, plant, and equipment, net $ 22,214 $ 24,193
(a) Includes nuclear fuel that is in the fabrication and installation phase of $939 million and $1,025 million at December 31, 2020 and 2019, respectively.(b) Includes accumulated amortization of nuclear fuel in the reactor core of $2,774 million and $2,867 million as of December 31, 2020 and 2019,
respectively.
F-32

Notes to Consolidated Financial Statements
(Dollars in millions, except per share data unless otherwise noted)
Note 8 — Property, Plant and Equipment
The following table presents the average service life for each asset category in number of years:
Asset Category Average Service Life
(years)Electric 1-58Nuclear fuel 1-8Other property, plant, and equipment 1-10 Depreciation provisions are based on the estimated useful lives of the stations, which reflect the first renewal of the operating licenses for all of ouroperating nuclear generating stations except for Clinton, Byron, Dresden and Peach Bottom. Clinton depreciation provisions are based on an estimateduseful life through 2027, which is the last year of the Illinois ZES. Peach Bottom depreciation provisions are based on estimated useful life of 2053 and2054 for Unit 2 and Unit 3, respectively, which reflects the second renewal of its operating licenses. Beginning August 2020, Byron, Dresden, and Mysticdepreciation provisions were based on their announced shutdown dates of September 2021, November 2021, and May 2024, respectively. See Note 3 —Regulatory Matters for additional information regarding license renewals and the Illinois ZECs and Note 7 — Early Plant Retirements for additionalinformation on the impacts of early plant retirements. The following table presents the annual depreciation rates for each asset category. Nuclear fuel amortization is charged to fuel expense using the unit-of-production method and not included in the below table. Annual Depreciation Rates
December 31,
2020 December 31,
2019 December 31,
2018 Electric 6.11% 4.35% 5.37% Capitalized Interest The following table summarizes capitalized interest by year:
December 31,
2020 December 31,
2019 December 31,
2018 Capitalized interest $ 22 $ 24 $ 31 See Note 1 — Significant Accounting Policies for additional information regarding property, plant and equipment policies.
F-33

Combined Notes to Consolidated Financial Statements
(Dollars in millions, except per share data unless otherwise noted)
Note 9 — Jointly Owned Electric Utility Plant
9. Jointly Owned Electric Utility Plant Our material undivided ownership interests in jointly owned electric plants at December 31, 2020 and 2019 were as follows: Nuclear Generation
Quad Cities Peach
Bottom Salem Nine Mile Point
Unit 2 Operator Generation Generation PSEG Nuclear Generation Ownership interest 75.00% 50.00% 42.59% 82.00%Our share as of December 31, 2020 Plant in service $ 1,188 $ 1,506 $ 717 $ 990 Accumulated depreciation 670 601 265 187 Construction work in progress 13 13 39 25 Our share as of December 31, 2019 Plant in service $ 1,161 $ 1,466 $ 663 $ 951 Accumulated depreciation 627 571 249 156 Construction work in progress 13 21 53 27 Our undivided ownership interests are financed with our funds and all operations are accounted for as if such participating interests were wholly ownedfacilities. Our share of direct expenses of the jointly owned plants are included in Purchased power and fuel and Operating and maintenance expenses in theConsolidated Statements of Operations and Comprehensive Income. 10. Asset Retirement Obligations Nuclear Decommissioning Asset Retirement Obligations We have a legal obligation to decommission its nuclear power plants following the expiration of their operating licenses. To estimate our decommissioningobligation related to our nuclear generating stations for financial accounting and reporting purposes, we use a probability-weighted, discounted cash flowmodel which, on a unit-by-unit basis, considers multiple outcome scenarios that include significant estimates and assumptions, and are based ondecommissioning cost studies, cost escalation rates, probabilistic cash flow models, and discount rates. We update our ARO annually unless circumstanceswarrant more frequent updates, based on our review of updated cost studies and our annual evaluation of cost escalation factors and probabilities assignedto various scenarios. We began decommissioning the TMI nuclear plant upon permanently ceasing operations in 2019. See below section fordecommissioning of Zion Station. The financial statement impact for changes in the ARO, on an individual unit basis, due to the changes in and timing of estimated cash flows generallyresult in a corresponding change in the unit’s ARC within Property, plant, and equipment in the Consolidated Balance Sheets. If the ARO decreases for aNon-Regulatory Agreement unit without any remaining ARC, the corresponding change is recorded as decrease in Operating and maintenance expensewithin the Consolidated Statements of Operations and Comprehensive Income.
F-34

Notes to Consolidated Financial Statements
(Dollars in millions, except per share data unless otherwise noted)
Note 10 — Asset Retirement Obligations
The following table provides a rollforward of the nuclear decommissioning ARO reflected in the Consolidated Balance Sheets, from January 1, 2019 toDecember 31, 2020:
NuclearDecommission
ARO Balance at January 1, 2019 $ 10,005 Net increase due to changes in, and timing of, estimated future cash flows 864 Sale of Oyster Creek (755)Accretion expense 479 Costs incurred related to decommissioning plants (89)Balance at December 31, 2019(a) 10,504 Net increase due to changes in, and timing of, estimated future cash flows 1,022 Accretion Expense 489 Costs incurred related to decommissioning plants (93)Balance at December 31, 2020(a) $ 11,922
(a) Includes $80 million and $112 million as the current portion of the ARO at December 31, 2020 and 2019, respectively, which is included in Othercurrent liabilities in the Consolidated Balance Sheets.
The net $1,022 million increase in the ARO during 2020 for changes in the amounts and timing of estimated decommissioning cash flows was driven bymultiple adjustments throughout the year. These adjustments primarily include:
• A net increase of approximately $800 million was driven by updates to Byron and Dresden reflecting changes in assumed retirement dates andassumed methods of decommissioning as a result of the announcement to early retire these plants in 2021. Refer to Note 7 — Early PlantRetirements for additional information.
• An increase of approximately $360 million resulting from the change in the assumed DOE spent fuel acceptance date for disposal from 2030 to
2035.
• A decrease of approximately $220 million due to lower estimated decommissioning costs primarily for Limerick and Peach Bottom nuclear unitsresulting from the completion of updated cost studies.
The 2020 ARO updates resulted in an increase of $60 million in Operating and maintenance expense for the year ended December 31, 2020 within theConsolidated Statements of Operations and Comprehensive Income. The net $864 million increase in the ARO during 2019 for changes in the amounts and timing of estimated decommissioning cash flows was driven bymultiple adjustments throughout the year, some with offsetting impacts. These adjustments primarily include:
• An increase of approximately $780 million for changes in the assumed retirement timing probabilities for sites including certain economicallychallenged nuclear plants and the extension of Peach Bottom’s operating life.
• An increase of approximately $490 million for other impacts that included updated cost escalation rates, primarily for labor, equipment and
materials, and current discount rates.
• Lower estimated costs to decommission TMI, Nine Mile Point, Ginna, Braidwood, Byron, and LaSalle nuclear units of approximately $410million resulting from the completion of updated cost studies.
The 2019 ARO updates resulted in a decrease of $150 million in Operating and maintenance expense for the year ended December 31, 2019 within theConsolidated Statements of Operations and Comprehensive Income. See Note 7 — Early Plant Retirements for additional information regarding TMI andeconomically challenged nuclear plants and Note 3 — Regulatory Matters regarding the Peach Bottom second license renewal.
F-35

Notes to Consolidated Financial Statements
(Dollars in millions, except per share data unless otherwise noted)
Note 10 — Asset Retirement Obligations
NDT Funds NDT funds have been established for each generation station unit to satisfy our nuclear decommissioning obligations. Generally, NDT funds established fora particular unit may not be used to fund the decommissioning obligations of any other unit. The NDT funds associated with our nuclear units have been funded with amounts collected from the previous owners and their respective utility customers.PECO is authorized to collect funds, in revenues, for decommissioning the former PECO nuclear plants through regulated rates, and these collections arescheduled through the operating lives of the former PECO plants. The amounts collected from PECO customers are remitted to us and deposited into theNDT funds for the unit for which funds are collected. Every five years, PECO files a rate adjustment with the PAPUC that reflects PECO’s calculations ofthe estimated amount needed to decommission each of the former PECO units based on updated fund balances and estimated decommissioning costs. Therate adjustment is used to determine the amount collectible from PECO customers. On March 31, 2017, PECO filed its Nuclear Decommissioning CostAdjustment with the PAPUC proposing an annual recovery from customers of approximately $4 million. This amount reflects a decrease from thepreviously approved annual collection of approximately $24 million primarily due to the removal of the collections for Limerick Units 1 and 2 as a result ofthe NRC approving the extension of the operating licenses for an additional 20 years. On August 8, 2017, the PAPUC approved the filing and the new ratesbecame effective January 1, 2018. Any shortfall of funds necessary for decommissioning, determined for each generating station unit, is ultimately required to be funded by us, with theexception of a shortfall for the current decommissioning activities at Zion Station, where certain decommissioning activities have been transferred to athird-party (see Zion Station Decommissioning below) and the CENG units, where any shortfall is required to be funded by both us and EDF. ThroughPECO, we have recourse to collect additional amounts from PECO customers related to a shortfall of NDT funds for the former PECO units, subject tocertain limitations and thresholds, as prescribed by an order from the PAPUC. Generally, PECO, and likewise we will not be allowed to collect amountsassociated with the first $50 million of any shortfall of trust funds compared to decommissioning costs, as well as 5% of any additional shortfalls, on anaggregate basis for all former PECO units. The initial $50 million and up to 5% of any additional shortfalls would be borne by us. No recourse exists tocollect additional amounts from utility customers for any of our other nuclear units. With respect to the former ComEd and PECO units, any fundsremaining in the NDTs after all decommissioning has been completed are required to be refunded to ComEd’s or PECO’s customers, subject to certainlimitations that allow sharing of excess funds with us related to the former PECO units. With respect to our other nuclear units, we retain any fundsremaining after decommissioning. However, in connection with CENG's acquisition of the Nine Mile Point and Ginna plants and settlements with certainregulatory agencies, CENG is subject to certain conditions pertaining to NDT funds that, if met, could possibly result in obligations to make payments tocertain third parties (clawbacks). For Nine Mile Point and Ginna, the clawback provisions are triggered only in the event that the required decommissioningactivities are discontinued or not started or completed in a timely manner. In the event that the clawback provisions are triggered for Nine Mile Point, then,depending upon the triggering event, an amount equal to 50% of the total amount withdrawn from the funds for non-decommissioning activities or 50% ofany excess funds in the trust funds above the amounts required for decommissioning (including spent fuel management and decommissioning) is to be paidto the Nine Mile Point sellers. In the event that the clawback provisions are triggered for Ginna, then an amount equal to any estimated cost savingsrealized by not completing any of the required decommissioning activities is to be paid to the Ginna sellers. We expect to comply with applicableregulations and timely commence and complete all required decommissioning activities. At December 31, 2020 and 2019, the NDT funds totaled $14,599 million and $13,353 million, respectively. The NDT funds include $134 million and $163million for the current portion of the NDT at December 31, 2020 and 2019, respectively, which are included in Other current assets in the ConsolidatedBalance Sheets. See Note 22 — Supplemental Financial Information for additional information on activities of the NDT funds.
F-36

Notes to Consolidated Financial Statements
(Dollars in millions, except per share data unless otherwise noted)
Note 10 — Asset Retirement Obligations
Accounting Implications of the Regulatory Agreements with ComEd and PECO Based on the regulatory agreements with the ICC and PAPUC that dictate our obligations related to the shortfall or excess of NDT funds necessary fordecommissioning the former ComEd units on a unit-by-unit basis and the former PECO units in total, decommissioning-related activities net of applicabletaxes, including realized and unrealized gains and losses on the NDT funds, depreciation of the ARC and accretion of the decommissioning obligation aregenerally offset within the Consolidated Statements of Operations and Comprehensive Income and are recorded as related party balances on ourConsolidated Balance Sheets. For the purposes of making this determination, the decommissioning obligation referred to is different, as described below,from the calculation used in the NRC minimum funding obligation filings based on NRC guidelines. For the former PECO units, given the symmetric settlement provisions that allow for continued recovery of decommissioning costs from PECO customersin the event of a shortfall and the obligation for us to ultimately return any excess funds to PECO customers (on an aggregate basis for all seven units),decommissioning-related activities are generally offset within the Consolidated Statements of Operations and Comprehensive Income regardless of whetherthe NDT funds are expected to exceed or fall short of the total estimated decommissioning obligation. The offset of decommissioning-related activitieswithin the Consolidated Statement of Operations and Comprehensive Income results in an equal adjustment to noncurrent payables to or noncurrentreceivables from affiliates. Any changes to the existing PECO regulatory agreements could impact our ability to offset decommissioning-related activitieswithin the Consolidated Statement of Operations and Comprehensive Income, and the impact to our financial statements could be material. For the former ComEd units, given no further recovery from ComEd customers is permitted and we retain an obligation to ultimately return any unusedNDTs to ComEd customers (on a unit-by-unit basis), to the extent the related NDT investment balances are expected to exceed the total estimateddecommissioning obligation for each unit, the offset of decommissioning-related activities within the Consolidated Statement of Operations andComprehensive Income results in us recognizing a noncurrent payable to affiliates. However, given the asymmetric settlement provision that does not allowfor continued recovery from ComEd customers in the event of a shortfall, recognition of a regulatory asset at ComEd is not permissible and accounting fordecommissioning-related activities for that unit would not be offset, and the impact to the Consolidated Statements of Operations and ComprehensiveIncome could be material during such periods. As of December 31, 2020, decommissioning-related activities for all of the former ComEd units, except for Zion (see Zion Station Decommissioningbelow), are currently offset within the Consolidated Statements of Operations and Comprehensive Income. The decommissioning-related activities related to the Non-Regulatory Agreement Units are reflected in the Consolidated Statements of Operations andComprehensive Income. See Note 23 — Related Party Transactions for additional information regarding balances with affiliates. Zion Station Decommissioning In 2010, we completed an ASA under which ZionSolutions assumed responsibility for decommissioning Zion Station and we transferred to ZionSolutionssubstantially all the Zion Station’s assets, including the related NDT funds. Following ZionSolutions' completion of its contractual obligations and transfer of the NRC license to us, we will store the SNF at Zion Station until it istransferred to the DOE for ultimate disposal, and will complete all remaining decommissioning activities associated with the SNF dry storage facility.
F-37

Notes to Consolidated Financial Statements
(Dollars in millions, except per share data unless otherwise noted)
Note 10 — Asset Retirement Obligations
We had retained our obligation for the SNF as well as certain NDT assets to fund the obligation to maintain the SNF at Zion Station until transfer to theDOE and to complete all remaining decommissioning activities for the SNF storage facility. Any shortage of funds necessary to maintain the SNF anddecommission the SNF storage facility is ultimately required to be funded by us. As of December 31, 2020, the ARO associated with Zion's SNF storagefacility is $175 million and the NDT funds available to fund this obligation are $66 million. NRC Minimum Funding Requirements NRC regulations require that licensees of nuclear generating facilities demonstrate reasonable assurance that funds will be available in specified minimumamounts to decommission the facility at the end of its life. The estimated decommissioning obligations as calculated using the NRC methodology differfrom the ARO recorded in the Consolidated Balance Sheets primarily due to differences in the type of costs included in the estimates, the basis forestimating such costs, and assumptions regarding the decommissioning alternatives to be used, potential license renewals, decommissioning cost escalation,and the growth rate in the NDT funds. Under NRC regulations, if the minimum funding requirements calculated under the NRC methodology are less thanthe future value of the NDT funds, also calculated under the NRC methodology, then the NRC requires either further funding or other financial guarantees. Key assumptions used in the minimum funding calculation using the NRC methodology at December 31, 2020 include: (1) consideration of costs only forthe removal of radiological contamination at each unit; (2) the option on a unit-by-unit basis to use generic, non-site specific cost estimates;(3) consideration of only one decommissioning scenario for each unit; (4) the plants cease operation at the end of their current license lives (with noassumed license renewals for those units that have not already received renewals); (5) the assumption of current nominal dollar cost estimates that areneither escalated through the anticipated period of decommissioning, nor discounted using the CARFR; and (6) assumed annual after-tax returns on theNDT funds of 2% (3% for the former PECO units, as specified by the PAPUC). In contrast, the key criteria and assumptions used by us to determine the ARO and to forecast the target growth in the NDT funds at December 31, 2020include: (1) the use of site specific cost estimates that are updated at least once every five years; (2) the inclusion in the ARO estimate of all legallyunavoidable costs required to decommission the unit (e.g., radiological decommissioning and full site restoration for certain units, on-site spent fuelmaintenance and storage subsequent to ceasing operations and until DOE acceptance, and disposal of certain LLRW); (3) the consideration of multiplescenarios where decommissioning and site restoration activities, as applicable, are completed under possible scenarios ranging from 10 to 70 years after thecessation of plant operations; (4) the consideration of multiple end of life scenarios; (5) the measurement of the obligation at the present value of the futureestimated costs and an annual average accretion of the ARO of approximately 4% through a period of approximately 30 years after the end of the extendedlives of the units; and (6) an estimated targeted annual pre-tax return on the NDT funds of 5.6% to 6.1% (as compared to a historical 5-year annual averagepre-tax return of approximately 9.0%). We are required to provide to the NRC a biennial report by unit (annually for units that have been retired or are within five years of the current approvedlicense life), based on values as of December 31, addressing our ability to meet the NRC minimum funding levels. Depending on the value of the trustfunds, we may be required to take steps, such as providing financial guarantees through surety bonds, letters of credit, or parent company guarantees ormaking additional contributions to the trusts, which could be significant, to ensure that the trusts are adequately funded and that NRC minimum fundingrequirements are met. As a result, the cash flows and financial positions may be significantly adversely affected. We filed our biennial decommissioning funding status report with the NRC on February 24, 2021 for all units, including our shutdown units, except forZion Station which is included in a separate report to the NRC submitted by ZionSolutions, LLC. The status report demonstrated adequatedecommissioning funding assurance as of December 31, 2020 for all units except for Byron Units 1 and 2. We stated that it intends to submit its PSDARwith additional decommissioning cost information by July 1, 2021, for Byron Units 1 and 2, and will evaluate the status of funding assurance based on theupdated cost information and provide additional funding assurance by the time of shutdown if required. We will file the next decommissioning funding status report with the NRC by March 31, 2022. This report will reflect the status of decommissioningfunding assurance as of December 31, 2021 for shutdown units.
F-38

Notes to Consolidated Financial Statements
(Dollars in millions, except per share data unless otherwise noted)
Note 10 — Asset Retirement Obligations
As the future values of trust funds change due to market conditions, the NRC minimum funding status of our units will change. In addition, if changesoccur to the regulatory agreement with the PAPUC that currently allows amounts to be collected from PECO customers for decommissioning the formerPECO units, the NRC minimum funding status of those plants could change at subsequent NRC filing dates. Non-Nuclear Asset Retirement Obligations We have AROs for plant closure costs associated with the fossil and renewable generating facilities, including asbestos abatement, removal of certainstorage tanks, restoring leased land to the condition it was in prior to construction of renewable generating stations and other decommissioning-relatedactivities. See Note 1 — Significant Accounting Policies for additional information on the accounting policy for AROs. The following table provides a rollforward of the non-nuclear AROs reflected in the Consolidated Balance Sheets from January 1, 2019 to December 31,2020: Non-nuclear AROs Balance at January 1, 2019 $ 238 Net increase due to changes in, and timing of, estimated future cash flows 7 Development projects 2 Accretion expense 12 Asset divestitures (42)Payments (1)Balance at December 31, 2019 216 Net increase due to changes in, and timing of, estimated future cash flows 2 Development projects 1 Accretion expense 11 Asset divestitures (4)Payments (4)AROs reclassified to liabilities held for sale(a) (10)Balance at December 31 , 2020 $ 212
(a) Represents AROs related to our solar business, which were classified as held for sale as a result of the sale agreement. See Note 2 — Mergers,Acquisitions, and Dispositions for additional information.
F-39

Notes to Consolidated Financial Statements
(Dollars in millions, except per share data unless otherwise noted)
Note 11 — Leases
11. Leases Lessee We have operating leases for which we are the lessee. The significant types of leases are contracted generation, real estate, and vehicles and equipment. Thefollowing table outlines other terms and conditions of the lease agreements as of December 31, 2020. We do not have material finance leases in 2020 or in2019. YearsRemaining lease terms 1-35Options to extend the term 2-30Options to terminate within 1-4 The components of operating lease costs were as follows: For the years ended December 31,
2020 2019 Operating lease costs $ 194 $ 222 Variable lease costs 234 282 Short-term lease costs 2 19 Total lease costs (a) $ 430 $ 523
(a) Excludes $44 million of sublease income recorded for each of the years ended December 31, 2020 and 2019. The rental expense under the prior lease accounting guidance for the year ended December 31, 2018 was $558 million. This was inclusive of the contingentoperating lease payments associated with contracted generation agreements that are not included in the minimum future operating lease payments table.Payments made under the contracted generation lease agreements totaled to $493 million. The following table provides additional information regarding the presentation of operating lease ROU assets and lease liabilities within the ConsolidatedBalance Sheets:
As of December
31, 2020 As of December
31, 2019 Operating lease ROU assets(a)
Other deferred debits and other assets $ 726 $ 895 Operating lease liabilities(a)
Other current liabilities 132 157 Other deferred credits and other liabilities 775 925 Total operating lease liabilities $ 907 $ 1,082
(a) The operating ROU assets and lease liabilities include $528 million related to contracted generation as of December 31, 2020 and $664 million as ofDecember 31, 2019.
The weighted average remaining lease terms, in years, and the weighted average discount rates for operating leases were as follows:
Weighted AverageRemaining Lease
Terms(in Years)
Weighted AverageDiscount Rates
As of December 31, 2020 10.5 4.9%As of December 31, 2019 10.6 4.8%
F-40

Notes to Consolidated Financial Statements
(Dollars in millions, except per share data unless otherwise noted)
Note 11 — Leases
Future minimum lease payments for operating leases as of December 31, 2020 were as follows:
Year Future Minimum Lease
payments 2021 $ 145 2022 113 2023 100 2024 98 2025 99 Remaining years 640 Total 1,195 Interest 288 Total operating lease liabilities $ 907 Cash paid for amounts included in the measurement of operating lease liabilities was $204 million and $206 million for the year ended December 31, 2020and 2019, respectively. ROU assets obtained in exchange for operating lease obligations were $3 million and $14 million for the year ended December 31, 2020, and 2019,respectively. Lessor We have operating leases for which we are the lessor. The significant types of leases are contracted generation and real estate. The following table outlinesother terms and conditions of the lease agreements as of December 31, 2020. YearsRemaining lease terms 1-31Options to extend the term 1-5 The components of lease income were as follows: For the years ended December 31, 2020 2019 Operating lease income $ 47 $ 47 Variable lease income 282 258 Future minimum lease payments to be recovered under operating leases as of December 31, 2020 were as follows:
Year
Minimum leasepayments to be
recovered 2021 $ 45 2022 45 2023 45 2024 45 2025 45 Remaining years 182 Total $ 407
F-41

Notes to Consolidated Financial Statements
(Dollars in millions, except per share data unless otherwise noted)
Note 12 — Asset Impairments
12. Asset Impairments We evaluate the carrying value of long-lived assets or asset groups for recoverability whenever events or changes in circumstances indicate that thecarrying value of those assets may not be recoverable. Indicators of impairment may include a deteriorating business climate, including, but not limited to,declines in energy prices, condition of the asset, specific regulatory disallowance, or plans to dispose of a long-lived asset significantly before the end of itsuseful life. We determine if long-lived assets or asset groups are impaired by comparing the undiscounted expected future cash flows to the carrying value.When the undiscounted cash flow analysis indicates a long-lived asset or asset group is not recoverable, the amount of the impairment loss is determined bymeasuring the excess of the carrying amount of the long-lived asset or asset group over its fair value. The fair value analysis is primarily based on theincome approach using significant unobservable inputs (Level 3) including revenue and generation forecasts, projected capital and maintenanceexpenditures and discount rates. A variation in the assumptions used could lead to a different conclusion regarding the recoverability of an asset or assetgroup and, thus, could potentially result in material future impairments of our long-lived assets. Antelope Valley Solar Facility Antelope Valley, a 242 MW solar facility in Lancaster, CA, sells all of its output to PG&E through a PPA. As a result of the PG&E bankruptcy filing in thefirst quarter of 2019, we completed a comprehensive review of Antelope Valley's estimated undiscounted future cash flows and no impairment charge wasrecorded. The United States Bankruptcy Court entered an order on June 20, 2020 confirming PG&E’s plan of reorganization. On July 1, 2020 the plan becameeffective, and PG&E emerged from bankruptcy. Under the confirmed plan, PG&E will continue to honor the existing PPA agreement with Antelope Valley. See Note 17 - Debt and Credit Agreements for additional information. New England Asset Group During the first quarter of 2018, Mystic Unit 9 did not clear in the ISO-NE capacity auction for the 2021 - 2022 planning year. On March 29, 2018, wenotified grid operator ISO-NE of its plans to early retire its Mystic Units 8 and 9 absent regulatory reforms on June 1, 2022. These events suggested that thecarrying value of the New England asset group may be impaired. In the first quarter of 2018, we completed a comprehensive review of the estimatedundiscounted future cash flows of the New England asset group and no impairment charge was required. In the third quarter of 2020, in conjunction with the retirement announcement of Mystic Units 8 and 9, we completed a comprehensive review of theestimated undiscounted future cash flows of the New England asset group and concluded that the estimated undiscounted future cash flows and fair valueof the New England asset group were less than their carrying values. As a result, a pre-tax impairment charge of $500 million was recorded in the thirdquarter of 2020 within Operating and maintenance expense in the Consolidated Statements of Operations and Comprehensive Income. See Note 7 - EarlyPlant Retirements for additional information.
F-42

Notes to Consolidated Financial Statements
(Dollars in millions, except per share data unless otherwise noted)
Note 12 — Asset Impairments
Midwest Asset Group In the third quarter of 2020, in conjunction with the retirement announcements of the Byron and Dresden nuclear plants, we completed a comprehensivereview of the estimated undiscounted future cash flows of the Midwest asset group and no impairment charge was required. We will continue to monitor the recoverability of the carrying value of the Midwest asset group as certain other nuclear plants in Illinois are also showingincreased signs of economic distress, which could lead to an early retirement. See Note 7 - Early Plant Retirements for additional information. Equity Method Investments in Certain Distributed Energy Companies In the third quarter of 2019, our equity method investments in certain distributed energy companies were fully impaired due to an other-than-temporarydecline in market conditions and underperforming projects. We recorded a pre-tax impairment charge of $164 million in Equity in losses of unconsolidatedaffiliates and an offsetting pre-tax $96 million in Net income attributable to noncontrolling interests in the Consolidated Statements of Operations andComprehensive Income. As a result, we accelerated the amortization of investment tax credits associated with these companies and recorded a benefit of$46 million in Income taxes. The impairment charge and the accelerated amortization of investment tax credits resulted in a net $15 million decrease to ourearnings. See Note 21 — Variable Interest Entities for additional information. 13. Intangible Assets Our intangible assets and liabilities, included in Unamortized energy contract assets and liabilities and Other deferred debits and other assets in theConsolidated Balance Sheets, consisted of the following as of December 31, 2020 and 2019. The intangible assets and liabilities shown below areamortized on a straight line basis, except for unamortized energy contracts which are amortized in relation to the expected realization of the underlyingcash flows:
December 31, 2020 December 31, 2019
Gross AccumulatedAmortization Net Gross
AccumulatedAmortization Net
Unamortized Energy Contracts $ 1,963 $ (1,642) $ 321 $ 1,967 $ (1,612) $ 355 Customer Relationships 326 (215) 111 343 (190) 153 Trade Name 222 (197) 25 243 (193) 50 Total $ 2,511 $ (2,054) $ 457 $ 2,553 $ (1,995) $ 558 The following table summarizes the amortization expense related to intangible assets and liabilities for each of the years ended December 31, 2020, 2019,and 2018:
For the Years Ended December 31, Amortization
Expense(a) 2020 $ 81 2019 74 2018 63
(a) Amortization of unamortized energy contracts totaling $30 million, $21 million, and $14 million for the years ended December 31, 2020, 2019, and2018, respectively, was recorded in Operating revenues or Purchased power and fuel expense in the Consolidated Statements of Operations andComprehensive Income.
F-43

Notes to Consolidated Financial Statements
(Dollars in millions, except per share data unless otherwise noted)
Note 13 — Intangible Assets
The following table summarizes the estimated future amortization expense related to intangible assets and liabilities as of December 31, 2020:
For the Years Ending December 31,
EstimatedFuture
AmortizationExpense
2021 $ 81 2022 57 2023 51 2024 48 2025 41 Renewable Energy Credits Our RECs are included in Other current assets and Other deferred debits and other assets in the Consolidated Balance Sheets. Purchased RECs are recordedat cost on the date they are purchased. The cost of RECs purchased on a stand-alone basis is based on the transaction price, while the cost of RECs acquiredthrough PPAs represents the difference between the total contract price and the market price of energy at contract inception. Generally, revenue for RECsthat are sold to a counterparty under a contract that specifically identifies a power plant is recognized at a point in time when the power is produced. Thisincludes both bundled and unbundled REC sales. Otherwise, the revenue is recognized upon physical transfer of the REC to the customer. The following table presents the current and non-current REC's as of December 31, 2020 and 2019:
As of December
31, 2020 As of December
31, 2019 Current REC's $ 621 $ 336 Noncurrent REC's — 86 14. Income Taxes Components of Income Tax Expense or Benefit Income tax expense (benefit) from continuing operations is comprised of the following components: For the Years ended December 31,
2020 2019 2018 Included in operations: Federal
Current $ 130 $ 147 $ 337 Deferred 150 346 (347)Investment tax credit amortization (25) (69) (21)
State Current 40 10 6 Deferred (46) 82 (83)Total $ 249 $ 516 $ (108)
F-44

Notes to Consolidated Financial Statements
(Dollars in millions, except per share data unless otherwise noted)
Note 14 — Income Taxes
Rate Reconciliation The effective income tax rate from continuing operations varies from the U.S. federal statutory rate principally due to the following: For the years ended December 31, 2020(a) 2019(a) 2018(a) U.S. federal statutory rate 21.0% 21.0% 21.0%Increase (decrease) due to:
State income taxes, net of Federal income tax benefit 0.5 3.8 (16.6)Qualified NDT fund income 23.5 12.3 (11.8)Amortization of investment tax credit, including deferred taxes on basis difference (2.6) (3.0) (6.5)Production tax credits and other credits (5.4) (4.8) (13.5)Noncontrolling interests 3.2 (1.2) (6.1)Tax settlements (10.3) — — Tax Cuts and Jobs Act of 2017 — — 2.7 Other (0.1) (1.2) 1.3
Effective income tax rate 29.8% 26.9% (29.5)%
(a) Positive percentages represent income tax expense. Negative percentages represent income tax benefit. Tax Differences and Carryforwards The tax effects of temporary differences and carryforwards, which give rise to significant portions of the deferred tax assets (liabilities), as of December 31,2020 and 2019 are presented below: As of December 31, 2020 As of December 31, 2019
Plant basis differences $ (2,592) $ (2,814)Accrual based contracts (37) (43)Derivatives and other financial instruments (41) 88 Deferred pension and postretirement obligation (236) (220)Nuclear decommissioning activities (742) (503)Deferred debt refinancing costs 16 20 Tax loss carryforward 55 55 Tax credit carryforward 838 897 Investment in partnerships (813) (808)Other, net 347 236
Deferred income tax liabilities (net) $ (3,205) $ (3,092)Unamortized investment tax credits(a) (445) (648)Total deferred income tax liabilities (net) and unamortized investment tax credits $ (3,650) $ (3,740)
(a) Does not include unamortized investment tax credits reclassified to liabilities held for sale as of December 31, 2020.
F-45

Notes to Consolidated Financial Statements
(Dollars in millions, except per share data unless otherwise noted)
Note 14 — Income Taxes
The following table provides our carryforwards, which are presented on a post-apportioned basis, and any corresponding valuation allowances as ofDecember 31, 2020. Federal Federal general business credits carryforwards and other carryforwards $ 852 State State net operating losses and other carryforwards 1,118 Deferred taxes on state tax attributes (net) 76 Valuation allowance on state tax attributes 23 Year in which net operating loss or credit carryforwards will begin to expire(a) 2034
(a) State net operating loss carryforwards will begin expiring in 2029. Tabular Reconciliation of Unrecognized Tax Benefits The following table presents changes in unrecognized tax benefits.
Unrecognizedtax
benefits Balance at January 1, 2018 $ 468 Change to positions that only affect timing 15 Increases based on tax positions prior to 2018 21 Decreases based on tax positions prior to 2018(a) (36)Decrease from settlements with taxing authorities (53)Decreases from expiration of statute of limitations (7)Balance at December 31, 2018 408 Change to positions that only affect timing 12 Increases based on tax positions related to 2019 1 Increases based on tax positions prior to 2019 19 Decreases based on tax positions prior to 2019 (3)Decrease from settlements with taxing authorities 4 Balance at December 31, 2019 441 Increases based on tax positions related to 2020 1 Increases based on tax positions prior to 2020 23 Decreases based on tax positions prior to 2020(b) (346)Decrease from settlements with taxing authorities(b) (69)Balance at December 31, 2020 $ 50
(a) We decreased our unrecognized state tax benefits primarily due to the receipt of favorable guidance with respect to the deductibility of certaindepreciable fixed assets.
(b) Our unrecognized federal and state tax benefits decreased in the first quarter of 2020 by approximately $411 million due to the settlement of a federalrefund claim with IRS Appeals. The recognition of these tax benefits resulted in an increase in net income of $73 million in the first quarter of 2020,reflecting a decrease to income tax expense of $67 million.
F-46

Notes to Consolidated Financial Statements
(Dollars in millions, except per share data unless otherwise noted)
Note 14 — Income Taxes Recognition of unrecognized tax benefits The following table presents the unrecognized tax benefits that, if recognized, would decrease the effective tax rate. December 31, 2020 $ 39 December 31, 2019 429 December 31, 2018 408 Total amounts of interest and penalties recognized We did not record material interest and penalty expense related to tax positions reflected in the Consolidated Balance Sheets. Interest expense and penaltyexpense are recorded in Interest expense, net and Other, net, respectively, in Other income and deductions in the Consolidated Statements of Operationsand Comprehensive Income. Description of tax years open to assessment by major jurisdiction Major Jurisdiction Open YearsFederal consolidated income tax returns 2010-2019Illinois unitary corporate income tax returns 2012-2019New Jersey separate corporate income tax returns 2013-2019New York combined corporate income tax returns 2010-March 2012New York combined corporate income tax returns 2011-2019Pennsylvania separate corporate income tax returns 2011-2019 Other Tax Matters Long-Term Marginal State Income Tax Rate Quarterly, we review and update the marginal state income tax rates for changes in state apportionment. We remeasure our existing deferred income taxbalances to reflect the changes in marginal rates, which results in either an increase or a decrease to their net deferred income tax liability balances.
December 31,
2020 December 31,
2019 December 31,
2018 (Decrease) increase to Deferred Income Tax Liability and Income Tax Expense, Net of FederalTaxes $ (26) $ 9 $ (53) Allocation of Tax Benefits We are a party to an agreement with Exelon and other subsidiaries of Exelon that provides for the allocation of consolidated tax liabilities and benefits (TaxSharing Agreement). The Tax Sharing Agreement provides that each party is allocated an amount of tax similar to that which would be owed had the partybeen separately subject to tax. In addition, any net federal and state benefits attributable to Exelon is reallocated to the parties. That allocation is treated as acontribution to the capital of the party receiving the benefit. The following table presents the allocation of tax benefits from Exelon to us under the Tax Sharing Agreement. December 31, 2020 $ 64 December 31, 2019 41 December 31, 2018 155
F-47

Notes to Consolidated Financial Statements
(Dollars in millions, except per share data unless otherwise noted)
Note 14 — Income Taxes
Research and Development Activities In the fourth quarter of 2019, we recognized additional tax benefits related to certain research and development activities that qualify for federal and statetax incentives for the 2010 through 2018 tax years, which resulted in an increase in net income of $75 million for the year ended December 31, 2019,reflecting a decrease in Income tax expense of $66 million. 15. Retirement Benefits Exelon sponsors defined benefit pension plans and OPEB plans for essentially all our current employees. Substantially all non-union employees andelecting union employees hired on or after January 1, 2001 participate in cash balance pension plans. Effective January 1, 2009, substantially all newly-hired union-represented employees participate in cash balance pension plans. Effective February 1, 2018, most newly-hired non-represented, non-craft,employees are not eligible for pension benefits, and will instead be eligible to receive an enhanced non-discretionary employer contribution in an Exelondefined contribution savings plan. Effective January 1, 2018, most newly-hired non-represented, non-craft, employees are not eligible for OPEB benefitsand employees represented by Local 614 are not eligible for retiree health care benefits. Effective January 1, 2021, most non-represented, non-craft,employees who are under the age of 40 are not eligible for retiree health care benefits.
F-48

Notes to Consolidated Financial Statements
(Dollars in millions, except per share data unless otherwise noted)
Note 15 — Retirement Benefits
The table below shows the pension and OPEB plans in which our employees participated at December 31, 2020: Name of PlanQualified Pension Plans:Exelon Corporation Retirement Program(a)
Exelon Corporation Pension Plan for Bargaining Unit Employees(a)
Exelon New England Union Employees Pension Plan(a)
Exelon Employee Pension Plan for Clinton, TMI and Oyster Creek(a)
Pension Plan of Constellation Energy Group, Inc.(b)
Pension Plan of Constellation Energy Nuclear Group, LLC(c)
Nine Mile Point Pension Plan(c)
Constellation Mystic Power, LLC Union Employees Pension Plan Including Plan A and Plan B(b)
Pepco Holdings LLC Retirement Plan(d)
Non-Qualified Pension Plans:Exelon Corporation Supplemental Pension Benefit Plan and 2000 Excess Benefit Plan(a)
Exelon Corporation Supplemental Management Retirement Plan(a)
Constellation Energy Group, Inc. Senior Executive Supplemental Plan(b)
Constellation Energy Group, Inc. Supplemental Pension Plan(b)
Constellation Energy Group, Inc. Benefits Restoration Plan(b)
Constellation Energy Nuclear Plan, LLC Executive Retirement Plan(c)
Constellation Energy Nuclear Plan, LLC Benefits Restoration Plan(c)
Baltimore Gas & Electric Company Executive Benefit Plan(b)
Baltimore Gas & Electric Company Manager Benefit Plan(b)
Pepco Holdings LLC 2011 Supplemental Executive Retirement Plan(d)
Conectiv Supplemental Executive Retirement Plan(d)
OPEB Plans:PECO Energy Company Retiree Medical Plan(a)
Exelon Corporation Health Care Program(a)
Exelon Corporation Employees’ Life Insurance Plan(a)
Exelon Corporation Health Reimbursement Arrangement Plan(a)
Constellation Energy Group, Inc. Retiree Medical Plan(b)
Constellation Energy Group, Inc. Retiree Dental Plan(b)
Constellation Energy Group, Inc. Employee Life Insurance Plan and Family Life Insurance Plan(b)
Constellation Mystic Power, LLC Post-Employment Medical Account Savings Plan(b)
Exelon New England Union Post-Employment Medical Savings Account Plan(a)
Retiree Medical Plan of Constellation Energy Nuclear Group, LLC(c)
Retiree Dental Plan of Constellation Energy Nuclear Group, LLC(c)
Nine Mile Point Nuclear Station, LLC Medical Care and Prescription Drug Plan for Retired Employees(c)
Pepco Holdings LLC Welfare Plan for Retirees(d)
(a) These plans are collectively referred to as the legacy Exelon plans.(b) These plans are collectively referred to as the legacy Constellation Energy Group (CEG) Plans.(c) These plans are collectively referred to as the legacy CENG plans.(d) These plans are collectively referred to as the legacy PHI plans.
F-49

Notes to Consolidated Financial Statements
(Dollars in millions, except per share data unless otherwise noted)
Note 15 — Retirement Benefits
Costs Allocation from Exelon We account for our participation in Exelon’s pension and OPEB plans by applying multi-employer accounting. Exelon allocates costs related to its pensionand OPEB plans to its subsidiaries based on both active and retired employee participation in each plan. The amounts below represent our allocated pension and OPEB costs. We include the service cost and non-service cost components in Operating andmaintenance expense and Property, plant, and equipment, net in the consolidated financial statements.
For the Years Ended December 31, Allocated Pension and
OPEB Costs 2020 $ 115 2019 135 2018 204 Contributions Exelon allocates contributions related to its legacy Exelon pension and OPEB plans to its subsidiaries based on accounting cost. For legacy CEG, CENG,FitzPatrick, and PHI plans, pension and OPEB contributions are allocated to the subsidiaries based on employee participation (both active and retired). Thefollowing table provide our contributions to the pension and OPEB plans:
Pension Benefits OPEB 2020 2019 2018 2020 2019 2018
$ 236 $ 160 $ 128 $ 19 $ 15 11 Exelon considers various factors when making pension funding decisions, including actuarially determined minimum contribution requirements underERISA, contributions required to avoid benefit restrictions and at-risk status as defined by the Pension Protection Act of 2006 (the Act), management of thepension obligation, and regulatory implications. The Act requires the attainment of certain funding levels to avoid benefit restrictions (such as an inabilityto pay lump sums or to accrue benefits prospectively), and at-risk status (which triggers higher minimum contribution requirements and participantnotification). The projected contributions below reflect a funding strategy to make levelized annual contributions with the objective of achieving 100%funded status on an ABO basis over time. This level funding strategy helps minimize volatility of future period required pension contributions. Unlike thequalified pension plans, Exelon’s non-qualified pension plans are not funded, given that they are not subject to statutory minimum contributionrequirements. While OPEB plans are also not subject to statutory minimum contribution requirements, Exelon does fund certain of its plans. For Exelon's funded OPEBplans, contributions generally equal accounting costs, however, Exelon’s management has historically considered several factors in determining the level ofcontributions to its OPEB plans, including liabilities management, levels of benefit claims paid, and regulatory implications (amounts deemed prudent tomeet regulatory expectations and best assure continued rate recovery). The amounts below include our benefit payments related to unfunded plans. The following table provides our planned contributions to the qualified pension plans, planned benefit payments to non-qualified pension plans, andplanned contributions to OPEB plans in 2021:
Qualified
Pension Plans Non-QualifiedPension Plans OPEB
Planned contributions $ 196 $ 27 $ 24
F-50

Notes to Consolidated Financial Statements
(Dollars in millions, except per share data unless otherwise noted)
Note 15 — Retirement Benefits
Defined Contribution Savings Plan We participate in various 401(k) defined contribution savings plans that are sponsored by Exelon. The plans are qualified under applicable sections of theIRC and allow employees to contribute a portion of their pre-tax and/or after-tax income in accordance with specified guidelines. We match a percentage ofthe employee contributions up to certain limits. The following table presents matching contributions to the savings plan for the years ended December 31,2020, 2019 and 2018: For the Years Ended December 31, 2020 $ 63 2019 73 2018 86 16. Derivative Financial Instruments We use derivative instruments to manage commodity price risk, interest rate risk, and foreign exchange risk related to ongoing business operations. Authoritative guidance requires that derivative instruments be recognized as either assets or liabilities at fair value, with changes in fair value of thederivative recognized in earnings immediately. Other accounting treatments are available through special election and designation, provided they meetspecific, restrictive criteria both at the time of designation and on an ongoing basis. These alternative permissible accounting treatments include NPNS,cash flow hedges, and fair value hedges. All derivative economic hedges related to commodities, referred to as economic hedges, are recorded at fair valuethrough earnings. For all NPNS derivative instruments, accounts receivable or accounts payable are recorded when derivative settles and revenue orexpense is recognized in earnings as the underlying physical commodity is sold or consumed. Authoritative guidance about offsetting assets and liabilities requires the fair value of derivative instruments to be shown in the Notes to ConsolidatedFinancial Statements on a gross basis, even when the derivative instruments are subject to legally enforceable master netting agreements and qualify for netpresentation in the Consolidated Balance Sheets. A master netting agreement is an agreement between two counterparties that may have derivative andnon-derivative contracts with each other providing for the net settlement of all referenced contracts via one payment stream, which takes place as thecontracts deliver, when collateral is requested or in the event of default. In the tables below, which present fair value balances, the energy-related economichedges and proprietary trading derivatives are shown gross. The impact of the netting of fair value balances with the same counterparty that are subject tolegally enforceable master netting agreements, as well as netting of cash collateral, including margin on exchange positions, is aggregated in the collateraland netting columns. Our use of cash collateral is generally unrestricted unless we are downgraded below investment grade. Commodity Price Risk We employ established policies and procedures to manage our risks associated with market fluctuations in commodity prices by entering into physical andfinancial derivative contracts, including swaps, futures, forwards, options, and short-term and long-term commitments to purchase and sell energy andcommodity products. We believe these instruments, which are either determined to be non-derivative or classified as economic hedges, mitigate exposureto fluctuations in commodity prices. To the extent the amount of energy we produce differs from the amount of energy we have contracted to sell, we are exposed to market fluctuations in theprices of electricity, fossil fuels, and other commodities. We use a variety of derivative and non-derivative instruments to manage the commodity price riskof our electric generation facilities, including power and gas sales, fuel and power purchases, natural gas transportation and pipeline capacity agreements,and other energy-related products marketed and purchased. To manage these risks, we may enter into fixed-price derivative or non-derivative contracts tohedge the variability in future cash flows from expected sales of power and gas and purchases of power and fuel. The objectives for executing such hedgesinclude fixing the price for a portion of anticipated future electricity sales at a level that provides an acceptable return. We are also exposed to differencesbetween the locational settlement prices of certain economic hedges and the hedged generating units. This price difference is actively managed throughother instruments which include derivative congestion products, whose changes in fair value are recognized in earnings each period, and auction revenuerights, which are accounted for on an accrual basis.
F-51

Notes to Consolidated Financial Statements
(Dollars in millions, except per share data unless otherwise noted)
Note 16 — Derivative Financial Instruments
Additionally, we are exposed to certain market risks through our proprietary trading activities. The proprietary trading activities are a complement to ourenergy marketing portfolio but represent a small portion of our overall energy marketing activities and are subject to limits established by the RMC. The following table provides a summary of the derivative fair value balances recorded as of December 31, 2020 and 2019:
Economic
Hedges Proprietary
Trading Collateral
(a)(b) Netting(a) Subtotal December 31, 2020 Mark-to-market derivative assets (current assets) $ 2,757 $ 40 $ 103 $ (2,261) $ 639 Mark-to-market derivative assets (noncurrent assets) 1,501 4 64 (1,015) 554 Total mark-to-market derivative assets 4,258 44 167 (3,276) 1,193 Mark-to-market derivative liabilities (currentliabilities) (2,629) (23) 131 2,261 (260)Mark-to-market derivative liabilities (noncurrentliabilities) (1,335) (2) 118 1,015 (204)Total mark-to-market derivative liabilities (3,964) (25) 249 3,276 (464)Total mark-to-market derivative net assets (liabilities) $ 294 $ 19 $ 416 $ — $ 729 December 31, 2019 Mark-to-market derivative assets (current assets) $ 3,506 $ 72 $ 287 $ (3,190) $ 675 Mark-to-market derivative assets (noncurrent assets) 1,238 25 122 (877) 508 Total mark-to-market derivative assets 4,744 97 409 (4,067) 1,183 Mark-to-market derivative liabilities (currentliabilities) (3,713) (38) 357 3,190 (204)Mark-to-market derivative liabilities (noncurrentliabilities) (1,140) (11) 163 877 (111)Total mark-to-market derivative liabilities (4,853) (49) 520 4,067 (315)Total mark-to-market derivative net assets (liabilities) $ (109) $ 48 $ 929 $ — $ 868
(a) We net all available amounts allowed under the derivative authoritative guidance in the balance sheet. These amounts include unrealized derivativetransactions with the same counterparty under legally enforceable master netting agreements and cash collateral. In some cases we may have otheroffsetting exposures, subject to a master netting or similar agreement, such as trade receivables and payables, transactions that do not qualify asderivatives, letters of credit and other forms of non-cash collateral. These amounts are not material and not reflected in the table above.
(b) Of the collateral posted, $209 million and $511 million represents variation margin on the exchanges at December 31, 2020 and 2019, respectively. Economic Hedges (Commodity Price Risk) For the years ended December 31, 2020, 2019, and 2018, we recognized the following net pre-tax commodity mark-to-market gains (losses) which are alsolocated in the Net fair value changes related to derivatives line in the Consolidated Statements of Cash Flows.
F-52

Notes to Consolidated Financial Statements
(Dollars in millions, except per share data unless otherwise noted)
Note 16 — Derivative Financial Instruments
Gain (Loss) Income Statement Location 2020 2019 2018 Operating revenues $ 112 $ — $ (270)Purchased power and fuel 168 (204) (47)Total $ 280 $ (204) $ (317) In general, increases and decreases in forward market prices have a positive and negative impact, respectively, on owned and contracted generationpositions that have not been hedged. We hedge commodity price risk on a ratable basis over three-year periods. As of December 31, 2020, the percentage ofexpected generation hedged for the Mid-Atlantic, Midwest, New York, and ERCOT reportable segments is 94%-97% for 2021. Proprietary Trading (Commodity Price Risk) We also execute commodity derivatives for proprietary trading purposes. Proprietary trading includes all contracts executed with the intent of benefitingfrom shifts or changes in market prices as opposed to those executed with the intent of hedging or managing risk. Gains and losses associated withproprietary trading are reported as Operating revenues in the Consolidated Statements of Operations and Comprehensive Income and are included in theNet fair value changes related to derivatives line in the Consolidated Statements of Cash Flows. For the years ended December 31, 2020, 2019, and 2018,net pre-tax commodity mark-to-market gains and losses were not material. Interest Rate and Foreign Exchange Risk We utilize interest rate swaps, which are treated as economic hedges, to manage our interest rate exposure. On July 1, 2018, we de-designated our cash flowhedges related to interest rate risk. The notional amounts were $516 million and $569 million at December 31, 2020 and 2019, respectively. We utilize foreign currency derivatives to manage foreign exchange rate exposure associated with international commodity purchases in currencies otherthan U.S. dollars, which are treated as economic hedges. The notional amounts were $149 million and $231 million at December 31, 2020 and 2019,respectively. The mark-to-market derivative assets and liabilities as of December 31, 2020 and 2019 and the mark-to-market gains and losses for the years endedDecember 31, 2020, 2019, and 2018 were not material. Credit Risk We would be exposed to credit-related losses in the event of non-performance by counterparties on executed derivative instruments. The credit exposure ofderivative contracts, before collateral, is represented by the fair value of contracts at the reporting date. For commodity derivatives, we enter into enabling agreements that allow for payment netting with our counterparties, which reduces our exposure tocounterparty risk by providing for the offset of amounts payable to the counterparty against amounts receivable from the counterparty. Typically, eachenabling agreement is for a specific commodity and so, with respect to each individual counterparty, netting is limited to transactions involving that specificcommodity product, except where master netting agreements exist with a counterparty that allow for cross product netting. In addition to payment nettinglanguage in the enabling agreement, our credit department establishes credit limits, margining thresholds and collateral requirements for each counterparty,which are defined in the derivative contracts. Counterparty credit limits are based on an internal credit review process that considers a variety of factors,including the results of a scoring model, leverage, liquidity, profitability, credit ratings by credit rating agencies, and risk management capabilities. To theextent that a counterparty’s margining thresholds are exceeded, the counterparty is required to post collateral with us as specified in each enablingagreement. Our credit department monitors current and forward credit exposure to counterparties and their affiliates, both on an individual and an aggregatebasis.
F-53
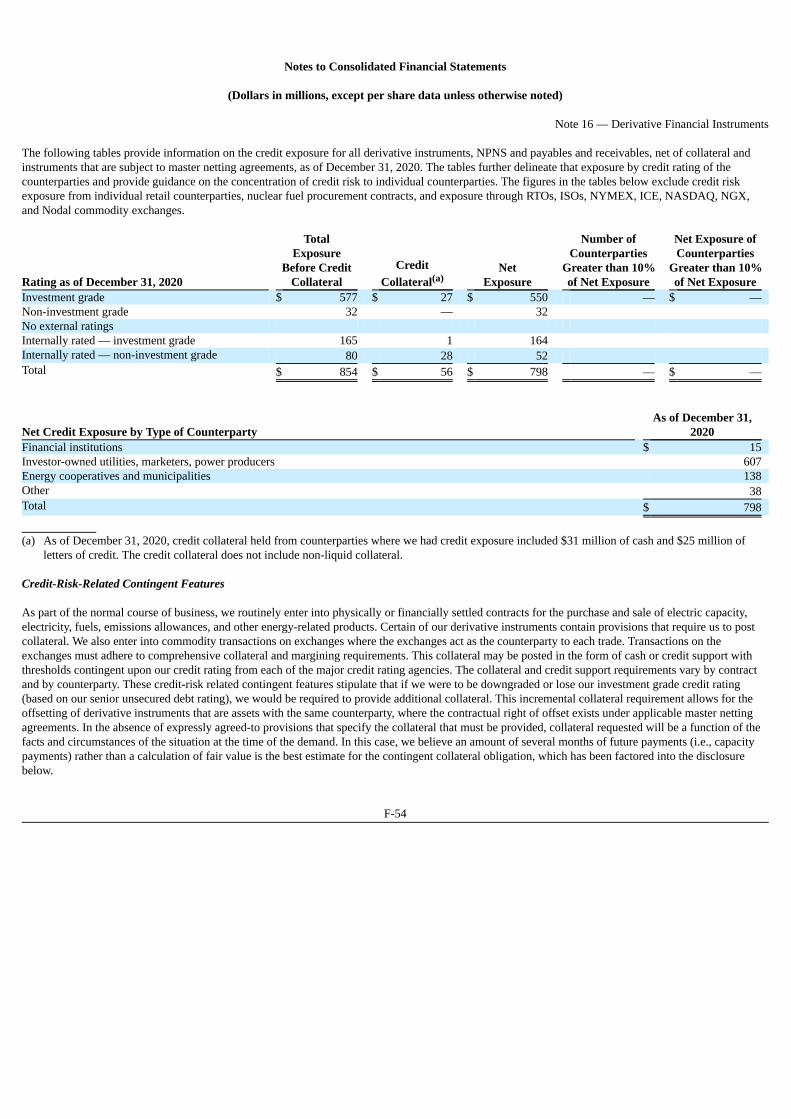
Notes to Consolidated Financial Statements
(Dollars in millions, except per share data unless otherwise noted)
Note 16 — Derivative Financial Instruments
The following tables provide information on the credit exposure for all derivative instruments, NPNS and payables and receivables, net of collateral andinstruments that are subject to master netting agreements, as of December 31, 2020. The tables further delineate that exposure by credit rating of thecounterparties and provide guidance on the concentration of credit risk to individual counterparties. The figures in the tables below exclude credit riskexposure from individual retail counterparties, nuclear fuel procurement contracts, and exposure through RTOs, ISOs, NYMEX, ICE, NASDAQ, NGX,and Nodal commodity exchanges.
Rating as of December 31, 2020
TotalExposure
Before CreditCollateral
CreditCollateral(a)
NetExposure
Number ofCounterparties
Greater than 10%of Net Exposure
Net Exposure ofCounterparties
Greater than 10%of Net Exposure
Investment grade $ 577 $ 27 $ 550 — $ — Non-investment grade 32 — 32 No external ratings Internally rated — investment grade 165 1 164 Internally rated — non-investment grade 80 28 52 Total $ 854 $ 56 $ 798 — $ —
Net Credit Exposure by Type of Counterparty As of December 31,
2020 Financial institutions $ 15 Investor-owned utilities, marketers, power producers 607 Energy cooperatives and municipalities 138 Other 38 Total $ 798
(a) As of December 31, 2020, credit collateral held from counterparties where we had credit exposure included $31 million of cash and $25 million ofletters of credit. The credit collateral does not include non-liquid collateral.
Credit-Risk-Related Contingent Features As part of the normal course of business, we routinely enter into physically or financially settled contracts for the purchase and sale of electric capacity,electricity, fuels, emissions allowances, and other energy-related products. Certain of our derivative instruments contain provisions that require us to postcollateral. We also enter into commodity transactions on exchanges where the exchanges act as the counterparty to each trade. Transactions on theexchanges must adhere to comprehensive collateral and margining requirements. This collateral may be posted in the form of cash or credit support withthresholds contingent upon our credit rating from each of the major credit rating agencies. The collateral and credit support requirements vary by contractand by counterparty. These credit-risk related contingent features stipulate that if we were to be downgraded or lose our investment grade credit rating(based on our senior unsecured debt rating), we would be required to provide additional collateral. This incremental collateral requirement allows for theoffsetting of derivative instruments that are assets with the same counterparty, where the contractual right of offset exists under applicable master nettingagreements. In the absence of expressly agreed-to provisions that specify the collateral that must be provided, collateral requested will be a function of thefacts and circumstances of the situation at the time of the demand. In this case, we believe an amount of several months of future payments (i.e., capacitypayments) rather than a calculation of fair value is the best estimate for the contingent collateral obligation, which has been factored into the disclosurebelow.
F-54

Notes to Consolidated Financial Statements
(Dollars in millions, except per share data unless otherwise noted)
Note 16 — Derivative Financial Instruments
The aggregate fair value of all derivative instruments with credit-risk related contingent features in a liability position that are not fully collateralized(excluding transactions on the exchanges that are fully collateralized) is detailed in the table below: As of December 31, Credit-Risk Related Contingent Features 2020 2019 Gross fair value of derivative contracts containing this feature(a) $ (834) $ (956)Offsetting fair value of in-the-money contracts under master netting arrangements(b) 537 649 Net fair value of derivative contracts containing this feature(c) $ (297) $ (307)
(a) Amount represents the gross fair value of out-of-the-money derivative contracts containing credit-risk-related contingent features ignoring the effectsof master netting agreements.
(b) Amount represents the offsetting fair value of in-the-money derivative contracts under legally enforceable master netting agreements with the samecounterparty, which reduces the amount of any liability for which we could potentially be required to post collateral.
(c) Amount represents the net fair value of out-of-the-money derivative contracts containing credit-risk related contingent features after considering themitigating effects of offsetting positions under master netting arrangements and reflects the actual net liability upon which any potential contingentcollateral obligations would be based.
As of December 31, 2020 and 2019, we posted or held the following amounts of cash collateral and letters of credit on derivative contracts with externalcounterparties, after giving consideration to offsetting derivative and non-derivative positions under master netting agreements. As of December 31, 2020 2019 Cash collateral posted $ 511 $ 982 Letters of credit posted 226 264 Cash collateral held 110 103 Letters of credit held 40 112 Additional collateral required in the event of a credit downgrade below investment grade 1,432 1,509 We entered into supply forward contracts with certain utilities with one-sided collateral postings only from us. If market prices fall below the benchmarkprice levels in these contracts, the utilities are not required to post collateral. However, when market prices rise above the benchmark price levels,counterparty suppliers, including us, are required to post collateral once certain unsecured credit limits are exceeded. 17. Debt and Credit Agreements Short-Term Borrowings We meet our short-term liquidity requirements primarily through the issuance of commercial paper and borrowings from the Exelon intercompany moneypool. We may use our credit facility for general corporate purposes, including meeting short-term funding requirements and the issuance of letters of credit.
F-55
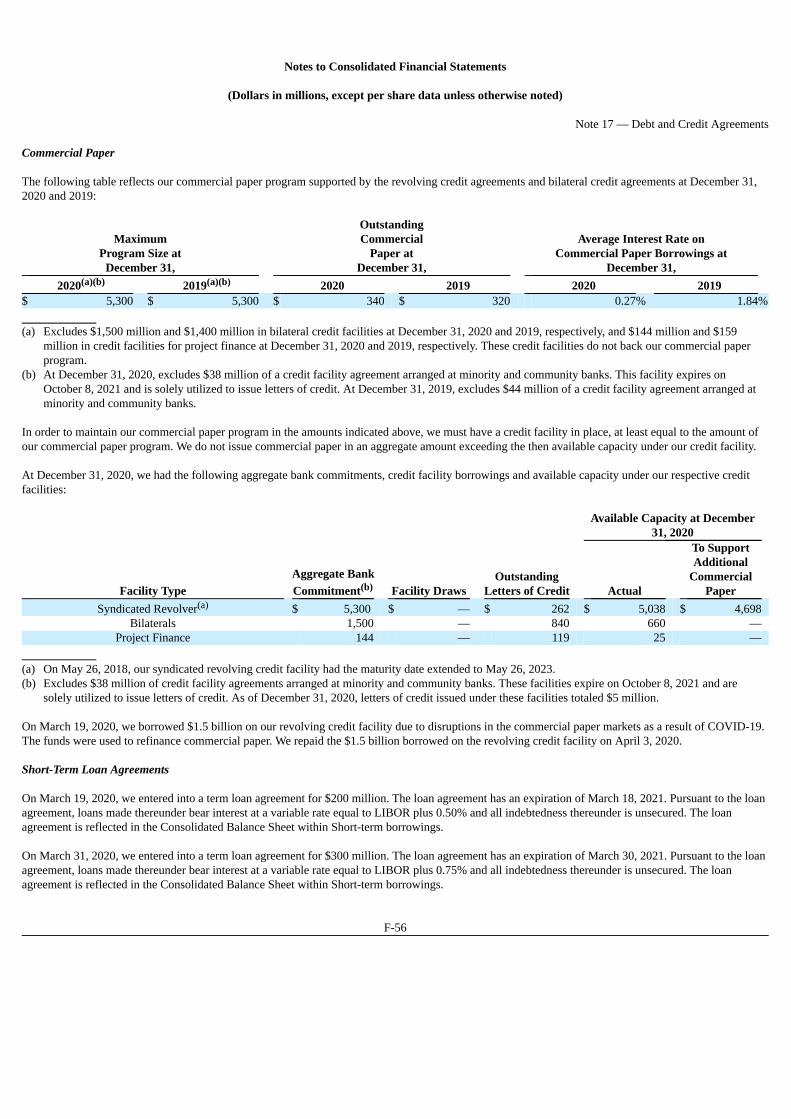
Notes to Consolidated Financial Statements
(Dollars in millions, except per share data unless otherwise noted)
Note 17 — Debt and Credit Agreements
Commercial Paper The following table reflects our commercial paper program supported by the revolving credit agreements and bilateral credit agreements at December 31,2020 and 2019:
MaximumProgram Size at
December 31,
OutstandingCommercial
Paper atDecember 31,
Average Interest Rate onCommercial Paper Borrowings at
December 31, 2020(a)(b) 2019(a)(b) 2020 2019 2020 2019 $ 5,300 $ 5,300 $ 340 $ 320 0.27% 1.84%
(a) Excludes $1,500 million and $1,400 million in bilateral credit facilities at December 31, 2020 and 2019, respectively, and $144 million and $159million in credit facilities for project finance at December 31, 2020 and 2019, respectively. These credit facilities do not back our commercial paperprogram.
(b) At December 31, 2020, excludes $38 million of a credit facility agreement arranged at minority and community banks. This facility expires onOctober 8, 2021 and is solely utilized to issue letters of credit. At December 31, 2019, excludes $44 million of a credit facility agreement arranged atminority and community banks.
In order to maintain our commercial paper program in the amounts indicated above, we must have a credit facility in place, at least equal to the amount ofour commercial paper program. We do not issue commercial paper in an aggregate amount exceeding the then available capacity under our credit facility. At December 31, 2020, we had the following aggregate bank commitments, credit facility borrowings and available capacity under our respective creditfacilities:
Available Capacity at December
31, 2020
Facility Type Aggregate BankCommitment(b) Facility Draws
OutstandingLetters of Credit Actual
To SupportAdditional
CommercialPaper
Syndicated Revolver(a) $ 5,300 $ — $ 262 $ 5,038 $ 4,698 Bilaterals 1,500 — 840 660 —
Project Finance 144 — 119 25 —
(a) On May 26, 2018, our syndicated revolving credit facility had the maturity date extended to May 26, 2023.(b) Excludes $38 million of credit facility agreements arranged at minority and community banks. These facilities expire on October 8, 2021 and are
solely utilized to issue letters of credit. As of December 31, 2020, letters of credit issued under these facilities totaled $5 million. On March 19, 2020, we borrowed $1.5 billion on our revolving credit facility due to disruptions in the commercial paper markets as a result of COVID-19.The funds were used to refinance commercial paper. We repaid the $1.5 billion borrowed on the revolving credit facility on April 3, 2020. Short-Term Loan Agreements On March 19, 2020, we entered into a term loan agreement for $200 million. The loan agreement has an expiration of March 18, 2021. Pursuant to the loanagreement, loans made thereunder bear interest at a variable rate equal to LIBOR plus 0.50% and all indebtedness thereunder is unsecured. The loanagreement is reflected in the Consolidated Balance Sheet within Short-term borrowings. On March 31, 2020, we entered into a term loan agreement for $300 million. The loan agreement has an expiration of March 30, 2021. Pursuant to the loanagreement, loans made thereunder bear interest at a variable rate equal to LIBOR plus 0.75% and all indebtedness thereunder is unsecured. The loanagreement is reflected in the Consolidated Balance Sheet within Short-term borrowings.
F-56

Notes to Consolidated Financial Statements
(Dollars in millions, except per share data unless otherwise noted)
Note 17 — Debt and Credit Agreements
Bilateral Credit Agreements The following table reflects the bilateral credit agreements at December 31, 2020:
Date Initiated Latest Amendment Date Maturity Date(a) Amount October 26, 2012 (b) October 23, 2020 October 22, 2021 $ 200 January 11, 2013 (c) January 4, 2019 March 1, 2021 100 January 5, 2016 (c) January 4, 2019 April 5, 2021 150
February 21, 2019 (c) N/A March 31, 2021 100 October 25, 2019 (c) N/A N/A 200 October 25, 2019 (c) N/A N/A 100
November 20, 2019 (c) N/A N/A 300 November 21, 2019 (c) N/A N/A 150 November 21, 2019 (c) N/A November 21, 2021 100
May 15, 2020 (c) N/A N/A 100
(a) Credit facilities that do not contain a maturity date are specific to the agreements set within each contract. In some instances, credit facilities areautomatically renewed based on the contingency standards set within the specific agreement.
(b) Bilateral credit facility relates to CENG and supports the issuance of letters of credit and funding for working capital and does not back ourcommercial paper program. During the second and third quarters of 2020, CENG drew on its bilateral credit facility. As of December 31, 2020, therewas no outstanding balance at this facility.
(c) Bilateral credit agreements solely support the issuance of letters of credit and do not back our commercial paper program. Borrowings under our revolving credit agreement bear interest at a rate based upon either the prime rate or a LIBOR-based rate, plus an adder based uponour credit rating. The adders for the prime based borrowings and LIBOR-based borrowings are 27.5 and 127.5, respectively. If we lose our investment grade rating, the maximum adders for prime rate borrowings and LIBOR-based rate borrowings would be 65 basis points and 165basis points, respectively. The credit agreement also require the borrower to pay a facility fee based upon the aggregate commitments. The fee variesdepending upon the respective credit ratings of the borrower.
F-57

Notes to Consolidated Financial Statements
(Dollars in millions, except per share data unless otherwise noted)
Note 17 — Debt and Credit Agreements
Long-Term Debt The following table present the outstanding long-term debt as of December 31, 2020 and 2019: Maturity December 31, Rates Date 2020 2019 Long-term debt
Senior unsecured notes 3.25% - 7.60% 2022 - 2042 $ 4,219 $ 5,420 Pollution control notes 2.50% - 2.70% 2020 — 412 Nuclear fuel procurement contracts 3.15% 2020 — 3 Notes payable and other 2.10% - 4.85% 2021 - 2028 111 115 Nonrecourse debt:
Fixed rates 2.29% - 6.00% 2031 - 2037 977 1,182 Variable rates 2.99% - 3.18% 2021 - 2027 765 811
Total long-term debt 6,072 7,943 Unamortized debt discount and premium, net (5) (5)Unamortized debt issuance costs (46) (42)Fair value adjustment 66 78 Long-term debt due within one year (197) (3,182)
Long-term debt $ 5,890 $ 4,792 Long-term debt maturities in the periods 2021 through 2025 and thereafter are as follows: 2021 $ 197 2022 1,025 2023 1 2024 1 2025 900 Thereafter 3,948 Total $ 6,072 Debt Covenants As of December 31, 2020, we are in compliance with debt covenants. Nonrecourse Debt We have issued nonrecourse debt financing, in which approximately $2.2 billion of generating assets have been pledged as collateral at December 31, 2020.Borrowings under these agreements are secured by the assets and equity of each respective project. The lenders do not have recourse against us in the eventof a default. If a specific project financing entity does not maintain compliance with its specific nonrecourse debt financing covenants, there could be arequirement to accelerate repayment of the associated debt or other borrowings earlier than the stated maturity dates. In these instances, if such repaymentwas not satisfied, the lenders or security holders would generally have rights to foreclose against the project-specific assets and related collateral. Thepotential requirement to satisfy its associated debt or other borrowings earlier than otherwise anticipated could lead to impairments due to a higherlikelihood of disposing of the respective project-specific assets significantly before the end of their useful lives.
F-58

Notes to Consolidated Financial Statements
(Dollars in millions, except per share data unless otherwise noted)
Note 17 — Debt and Credit Agreements
Antelope Valley Solar Ranch One. In December 2011, the DOE Loan Programs Office issued a guarantee for up to $646 million for a nonrecourse loanfrom the Federal Financing Bank to support the financing of the construction of the Antelope Valley facility. The project became fully operational in 2014.The loan will mature on January 5, 2037. Interest rates on the loan were fixed upon each advance at a spread of 37.5 basis points above U.S. Treasuries ofcomparable maturity. The advances were completed as of December 31, 2015 and the outstanding loan balance will bear interest at an average blendedinterest rate of 2.82%. As of December 31, 2020 and 2019, approximately $460 million and $485 million were outstanding, respectively. In addition, wehave issued letters of credit to support the equity investment in the project. As of December 31, 2020, we had $37 million in letters of credit outstandingrelated to the project. In December 2017, our interests in Antelope Valley were contributed to and are pledged as collateral for the EGR IV financingstructures referenced below. Antelope Valley sells all of its output to PG&E through a PPA. On January 29, 2019, PG&E filed for protection under Chapter 11 of the U.S. BankruptcyCode, which created an event of default for Antelope Valley’s nonrecourse debt that provided the lender with a right to accelerate amounts outstandingunder the loan such that they would become immediately due and payable. As a result of the event of default and in the absence of a waiver from the lenderforegoing their acceleration rights, the debt was reclassified as current in the Consolidated Balance Sheet in the first quarter of 2019. Further, distributionsfrom Antelope Valley to EGR IV were suspended. The United States Bankruptcy Court entered an order on June 20, 2020 confirming PG&E’s plan of reorganization. On July 1, 2020 the plan becameeffective, and PG&E emerged from bankruptcy. On July 21, 2020, Antelope Valley received a waiver from the DOE for the event of default and, as such,distributions from Antelope Valley to EGR IV were permitted and the debt was classified as noncurrent as of June 30, 2020. The debt continues to bepresented as noncurrent as of December 31, 2020. See Note 12 — Asset Impairments for additional information. Continental Wind, LLC. In September 2013, Continental Wind, our indirect subsidiary, completed the issuance and sale of $613 million senior securednotes. Continental Wind owns and operates a portfolio of wind farms in Idaho, Kansas, Michigan, Oregon, New Mexico and Texas with a total net capacityof 667 MW. The net proceeds were distributed to us for general business purposes. The notes are scheduled to mature on February 28, 2033. The notes bearinterest at a fixed rate of 6.00% with interest payable semi-annually. As of December 31, 2020 and December 31, 2019, approximately $415 million and$447 million were outstanding, respectively. In addition, Continental Wind has a $122 million letter of credit facility and $4 million working capital revolver facility. Continental Wind has issued lettersof credit to satisfy certain of its credit support and security obligations. As of December 31, 2020, the Continental Wind letter of credit facility had $114million in letters of credit outstanding related to the project. In 2017, our interests in Continental Wind were contributed to EGRP. Refer to Note 21 - Variable Interest Entities for additional information on EGRP. Renewable Power Generation. In March 2016, RPG, our indirect subsidiary, issued $150 million aggregate principal amount of a nonrecourse seniorsecured notes. The net proceeds were distributed to us for paydown of long term debt obligations at Sacramento PV Energy and Constellation SolarHorizons and for general business purposes. The loan is scheduled to mature on March 31, 2035. The term loan bears interest at a fixed rate of 4.11%payable semi-annually. As of December 31, 2020 and December 31, 2019, approximately $95 million and $106 million were outstanding, respectively. In 2017, our interests in RPG were contributed to EGRP. Refer to Note 21 - Variable Interest Entities for additional information on EGRP. SolGen, LLC. In September 2016, SolGen, LLC (SolGen), our indirect subsidiary, issued $150 million aggregate principal amount of a nonrecourse seniorsecured notes. The net proceeds were distributed to us for general business purposes. The loan is scheduled to mature on September 30, 2036. The termloan bears interest at a fixed rate of 3.93% payable semi-annually. As of December 31, 2020 and December 31, 2019, approximately $125 million and$131 million were outstanding, respectively. As a result of the sale agreement with an affiliate of Brookfield Renewable in the fourth quarter of 2020, theoutstanding balance was reclassified to Liabilities held for sale in the Consolidated Balance Sheet as of December 31, 2020. In 2017, our interests inSolGen were contributed to and were pledged as collateral for the EGR IV financing structure. In December 2020, as part of the EGR IV financing, SolGenwas removed from the collateral terms structured within the agreement. See EGR IV discussed below for additional information and Note 2 — Mergers,Acquisitions, and Dispositions for additional information on the sale agreement.
F-59

Notes to Consolidated Financial Statements
(Dollars in millions, except per share data unless otherwise noted)
Note 17 — Debt and Credit Agreements
ExGen Renewables IV. In November 2017, EGR IV, our indirect subsidiary, entered into an $850 million nonrecourse senior secured term loan creditfacility agreement with a maturity date of November 28, 2024. In addition to the financing, EGR IV entered into interest rate swaps with an initial notionalamount of $636 million at an interest rate of 2.32% to manage a portion of the interest rate exposure in connection with the financing. In December 2020, EGR IV entered into a financing agreement for a $750 million nonrecourse senior secured term loan credit facility, scheduled to matureon December 15, 2027. The term loan bears interest at a variable rate equal to LIBOR plus 2.75%, subject to a 1% LIBOR floor with interest payablequarterly. In addition to the financing, EGR IV entered into interest rate swaps with an initial notional amount of $516 million at an interest rate of 1.05%to manage a portion of the interest rate exposure in connection with the financing. The proceeds were used to repay the November 2017 nonrecourse senior secured term loan credit facility of $850 million, of which $709 million wasoutstanding as of the retirement date in December of 2020, and to settle the November 2017 interest rate swap. Our interests in EGRP and Antelope Valleyremained contributed to and are pledged as collateral for this financing. As of December 31, 2020, $750 million was outstanding. See Note 21 — VariableInterest Entities for additional information on EGRP and Note 16 — Derivative Financial Instruments for additional information on interest rate swaps. 18. Fair Value of Financial Assets and Liabilities We measure and classify fair value measurements in accordance with the hierarchy as defined by GAAP. The hierarchy prioritizes the inputs to valuationtechniques used to measure fair value into three levels as follows:
• Level 1 — quoted prices (unadjusted) in active markets for identical assets or liabilities that we have the ability to liquidate as of the reportingdate.
• Level 2 — inputs other than quoted prices included within Level 1 that are directly observable for the asset or liability or indirectly observable
through corroboration with observable market data.
• Level 3 — unobservable inputs, such as internally developed pricing models or third-party valuations for the asset or liability due to little orno market activity for the asset or liability.
F-60

Notes to Consolidated Financial Statements
(Dollars in millions, except per share data unless otherwise noted)
Note 18 — Fair Value of Financial Assets and Liabilities
Fair Value of Financial Liabilities Recorded at Amortized Cost The following tables present the carrying amounts and fair values of the short-term liabilities, long-term debt, and SNF obligation as of December 31, 2020and 2019. We have no financial liabilities classified as Level 1. The carrying amounts of the short-term liabilities as presented on the Consolidated Balance Sheets are representative of their fair value (Level 2) becauseof the short-term nature of these instruments. December 31, 2020 December 31, 2019 Carrying Fair Value Carrying Fair Value Amount Level 2 Level 3 Total Amount Level 2 Level 3 Total Long-Term Debt,includingamounts duewithin one year(a) $ 6,087 $ 5,648 $ 1,208 $ 6,856 $ 7,974 $ 7,304 $ 1,366 $ 8,670 SNF Obligation 1,208 909 — 909 1,199 1,055 — 1,055
(a) Includes unamortized debt issuance costs which are not fair valued. Refer to Note 17 — Debt and Credit Agreements for additional information onunamortized debt issuance costs.
F-61

Notes to Consolidated Financial Statements
(Dollars in millions, except per share data unless otherwise noted)
Note 18 — Fair Value of Financial Assets and Liabilities
We use the following methods and assumptions to estimate fair value of financial liabilities recorded at carrying cost:
Type Level ValuationLong-term Debt, including amounts due within one year
Taxable Debt Securities 2
The fair value is determined by a valuation model that is based on a conventional discounted cash flowmethodology and utilizes assumptions of current market pricing curves. We obtain credit spreads based ontrades of existing our debt securities as well as other issuers in the utility sector with similar credit ratings. Theyields are then converted into discount rates of various tenors that are used for discounting the respective cashflows of the same tenor for each bond or note.
Variable Rate FinancingDebt 2 Debt rates are reset on a regular basis and the carrying value approximates fair value.
Government Backed FixedRate Project Financing Debt 3
The fair value is similar to the process for taxable debt securities. Due to the lack of market trading data onsimilar debt, the discount rates are derived based on the original loan interest rate spread to the applicable U.S.Treasury rate as well as a current market curve derived from government-backed securities.
Non-Government BackedFixed Rate NonrecourseDebt
3
Fair value is based on market and quoted prices for its own and other nonrecourse debt with similar riskprofiles. Given the low trading volume in the nonrecourse debt market, the price quotes used to determine fairvalue will reflect certain qualitative factors, such as market conditions, investor demand, new developmentsthat might significantly impact the project cash flows or off-taker credit, and other circumstances related to theproject.
SNF Obligation
SNF Obligation 2
The carrying amount is derived from a contract with the DOE to provide for disposal of SNF from our nucleargenerating stations. When determining the fair value of the obligation, the future carrying amount of the SNFobligation is calculated by compounding the current book value of the SNF obligation at the 13-week U.S.Treasury rate. The compounded obligation amount is discounted back to present value using our discount rate,which is calculated using the same methodology as described above for the taxable debt securities, and anestimated maturity date of 2035 and 2030 for the years ended December 31, 2020 and 2019, respectively.
F-62

Notes to Consolidated Financial Statements
(Dollars in millions, except per share data unless otherwise noted)
Note 18 — Fair Value of Financial Assets and Liabilities
Recurring Fair Value Measurements The following table presents assets and liabilities measured and recorded at fair value in the Consolidated Balance Sheets on a recurring basis and theirlevel within the fair value hierarchy as of December 31, 2020 and 2019: As of December 31, 2020 As of December 31, 2019
Level 1 Level 2 Level 3
Notsubject
toleveling Total Level 1 Level 2 Level 3
Notsubject
toleveling Total
Assets Cash equivalents(a) $ 124 $ — $ — $ — $ 124 $ 214 $ — $ — $ — $ 214 NDT fund investments Cash equivalents(b) 210 95 — — 305 365 87 — — 452 Equities 3,886 2,077 — 1,562 7,525 3,353 1,801 — 1,388 6,542 Fixed income
Corporate debt(c) — 1,485 285 — 1,770 — 1,421 257 — 1,678 U.S. Treasury andagencies 1,871 126 — — 1,997 1,808 131 — — 1,939
Foreign governments — 56 — — 56 — 42 — — 42 State and municipal debt — 101 — — 101 — 90 — — 90 Other — 41 — 961 1,002 — 33 — 953 986 Fixed income subtotal 1,871 1,809 285 961 4,926 1,808 1,717 257 953 4,735 Private credit — — 212 629 841 — — 254 508 762 Private equity — — — 504 504 — — — 402 402 Real estate — — — 679 679 — — — 607 607
NDT fund investmentssubtotal(d)(e) 5,967 3,981 497 4,335 14,780 5,526 3,605 511 3,858 13,500
Rabbi trust investments Cash equivalents 4 — — — 4 4 — — — 4 Mutual funds 29 — — — 29 25 — — — 25 Life insurance contracts — 28 — — 28 — 25 — — 25
Rabbi trust investmentssubtotal 33 28 — — 61 29 25 — — 54
Investments in equities(f) 195 — — — 195 — — — — — Commodity derivative assets
Economic hedges 745 1,914 1,599 — 4,258 768 2,491 1,485 — 4,744 Proprietary trading — 17 27 — 44 — 37 60 — 97 Effect of netting andallocation of collateral(g)(h) (607) (1,597) (905) — (3,109) (908) (2,162) (588) — (3,658)
Commodity derivativeassets subtotal 138 334 721 — 1,193 (140) 366 957 — 1,183
DPP consideration — 639 — — 639 — — — — — Total assets $ 6,457 $ 4,982 $ 1,218 $ 4,335 $ 16,992 $ 5,629 $ 3,996 $ 1,468 $ 3,858 $ 14,951 Liabilities Commodity derivativeliabilities
Economic hedges (682) (1,928) (1,354) — (3,964) (1,071) (2,855) (927) — (4,853)Proprietary trading — (21) (4) — (25) — (34) (15) — (49)Effect of netting andallocation of collateral(g)(h) 540 1,918 1,067 — 3,525 1,071 2,714 802 — 4,587
Commodity derivativeliabilities subtotal (142) (31) (291) — (464) — (175) (140) — (315)
Deferred compensationobligation — (42) — — (42) — (41) — — (41)Total liabilities (142) (73) (291) — (506) — (216) (140) — (356)Total net assets $ 6,315 $ 4,909 $ 927 $ 4,335 $ 16,486 $ 5,629 $ 3,780 $ 1,328 $ 3,858 $ 14,595
F-63

Notes to Consolidated Financial Statements
(Dollars in millions, except per share data unless otherwise noted)
Note 18 — Fair Value of Financial Assets and Liabilities
(a) We exclude cash of $171 million and $177 million at December 31, 2020 and 2019, respectively, and restricted cash of $20 million and $58 million atDecember 31, 2020 and 2019, respectively.
(b) Includes $116 million and $90 million of cash received from outstanding repurchase agreements at December 31, 2020 and 2019, respectively, and isoffset by an obligation to repay upon settlement of the agreement as discussed in (e) below.
(c) Includes investments in equities sold short of $(62) million and $(48) million as of December 31, 2020 and 2019, respectively, held in an investmentvehicle primarily to hedge the equity option component of convertible debt.
(d) Includes derivative assets of $2 million and $2 million, which have total notional amounts of $1,043 million and $724 million at December 31, 2020and 2019, respectively. The notional principal amounts for these instruments provide one measure of the transaction volume outstanding as of theperiods ended and do not represent the amount of our exposure to credit or market loss.
(e) Excludes net liabilities of $181 million and $147 million at December 31, 2020 and 2019, respectively, which include certain derivative assets thathave notional amounts of $104 million and $99 million at December 31, 2020 and 2019, respectively. These items consist of receivables related topending securities sales, interest and dividend receivables, repurchase agreement obligations, and payables related to pending securities purchases. Therepurchase agreements are generally short-term in nature with durations generally of 30 days or less.
(f) Reflects equity investments held by us which were previously designated as equity investments without readily determinable fair values but are nowpublicly traded and therefore have readily determinable fair values. We recorded the fair value of these investments in Other current assets on theConsolidated Balance Sheets based on the quoted market prices of the stocks at December 31, 2020, which resulted in an unrealized gain of $186million within Other, net in the Consolidated Statement of Operations and Comprehensive Income for the year ended December 31, 2020.
(g) Collateral posted/(received) from counterparties, net of collateral paid to counterparties, totaled $(67) million, $321 million, and $162 million allocatedto Level 1, Level 2, and Level 3 mark-to-market derivatives, respectively, as of December 31, 2020. Collateral posted/(received) from counterparties,net of collateral paid to counterparties, totaled $163 million, $551 million, and $214 million allocated to Level 1, Level 2, and Level 3 mark-to-marketderivatives, respectively, as of December 31, 2019.
(h) Of the collateral posted/(received), $209 million and $511 million represents variation margin on the exchanges as of December 31, 2020 and 2019,respectively.
As of December 31, 2020, we have outstanding commitments to invest in private credit, private equity, and real estate investments of approximately $195million, $254 million, and $369 million, respectively. These commitments will be funded by our existing NDT funds. We hold investments without readily determinable fair values with carrying amounts of $55 million and $69 million as of December 31, 2020 andDecember 31, 2019, respectively. Changes in fair value, cumulative adjustments, and impairments were not material for the years ended December 31,2020 and December 31, 2019.
F-64

Notes to Consolidated Financial Statements
(Dollars in millions, except per share data unless otherwise noted)
Note 18 — Fair Value of Financial Assets and Liabilities
Reconciliation of Level 3 Assets and Liabilities The following tables present the fair value reconciliation of Level 3 assets and liabilities measured at fair value on a recurring basis during the years endedDecember 31, 2020 and 2019: For the year ended December 31, 2020
NDT Fund
Investments
Mark-to-Market
Derivatives Total Balance as of January 1, 2020 $ 511 $ 817 $ 1,328 Total realized / unrealized gains (losses)
Included in net income 2 (414) (a) (412)Included in noncurrent payables to affiliates 21 — 21
Change in collateral — (53) (53)Purchases, sales, issuances and settlements
Purchases 8 143 151 Sales — (27) (27)Settlements (45) — (45)
Transfers into Level 3 — (12) (b) (12)Transfers out of Level 3 — (24) (b) (24)Balance as of December 31, 2020 $ 497 $ 430 $ 927 The amount of total gains included in net income attributed to the change in unrealized gains (losses)related to assets and liabilities held as of December 31, 2020 $ 2 $ 6 $ 8
F-65

Notes to Consolidated Financial Statements
(Dollars in millions, except per share data unless otherwise noted)
Note 18 — Fair Value of Financial Assets and Liabilities
For the year ended December 31, 2019
NDT Fund
Investments Mark-to-Market
Derivatives Total Balance as of January 1, 2019 $ 543 $ 575 $ 1,118 Total realized / unrealized gains (losses)
Included in net income 5 (31) (a) (26)Included in noncurrent payables to affiliates 34 — 34
Change in collateral — 138 138 Purchases, sales, issuances and settlements
Purchases 44 132 176 Sales (21) (2) (23)Settlements (94) 5 (89)
Transfers into Level 3 — 5 (b) 5 Transfers out of Level 3 — (5) (b) (5)Balance as of December 31, 2019 $ 511 $ 817 $ 1,328 The amount of total gains included in net income attributed to the change in unrealized gains(losses) related to assets and liabilities held as of December 31, 2019 $ 5 $ 351 $ 356
(a) Includes a reduction for the reclassification of $420 million and $377 million of realized gains due to the settlement of derivative contracts for theyears ended December 31, 2020 and 2019, respectively.(b) Transfers into and out of Level 3 generally occur when the contract tenor becomes less and more observable, respectively, primarily due to changes inmarket liquidity or assumptions for certain commodity contracts. The following table presents the income statement classification of the total realized and unrealized gains (losses) included in income for Level 3 assets andliabilities measured at fair value on a recurring basis during the years ended December 31, 2020 and 2019:
OperatingRevenues
PurchasedPower and
Fuel Other, net Total (losses) gains included in net income for the year ended December 31, 2020 $ (404) $ (10) $ 2 Change in unrealized (losses) gains relating to assets and liabilities held for the year endedDecember 31, 2020 (31) 37 2 Total gains (losses) included in net income for the year ended December 31, 2019 $ 219 $ (245) $ 5 Change in unrealized gains (losses) relating to assets and liabilities held for the year endedDecember 31, 2019 546 (195) 5
Valuation Techniques Used to Determine Fair Value Cash Equivalents. Investments with original maturities of three months or less when purchased, including mutual and money market funds, are consideredcash equivalents. The fair values are based on observable market prices and, therefore, are included in the recurring fair value measurements hierarchy asLevel 1.
F-66

Notes to Consolidated Financial Statements
(Dollars in millions, except per share data unless otherwise noted)
Note 18 — Fair Value of Financial Assets and Liabilities
NDT Fund Investments. The trust fund investments have been established to satisfy our and CENG's nuclear decommissioning obligations as required bythe NRC. The NDT funds hold debt and equity securities directly and indirectly through commingled funds and mutual funds, which are included inequities and fixed income. Our and CENG's NDT fund investments policies outline investment guidelines for the trusts and limit the trust funds’ exposuresto investments in highly illiquid markets and other alternative investments, including private credit, private equity, and real estate. Investments withmaturities of three months or less when purchased, including certain short-term fixed income securities are considered cash equivalents and included in therecurring fair value measurements hierarchy as Level 1 or Level 2. Equities. These investments consist of individually held equity securities, equity mutual funds, and equity commingled funds in domestic and foreignmarkets. With respect to individually held equity securities, the trustees obtain prices from pricing services, whose prices are generally obtained from directfeeds from market exchanges, which we are able to independently corroborate. Equity securities held individually, including real estate investment trusts,rights, and warrants, are primarily traded on exchanges that contain only actively traded securities due to the volume trading requirements imposed by theseexchanges. The equity securities that are held directly by the trust funds are valued based on quoted prices in active markets and categorized as Level 1.Certain equity securities have been categorized as Level 2 because they are based on evaluated prices that reflect observable market information, such asactual trade information or similar securities. Certain private placement equity securities are categorized as Level 3 because they are not publicly traded andare priced using significant unobservable inputs. Equity commingled funds and mutual funds are maintained by investment companies, and fund investments are held in accordance with a stated set of fundobjectives. The values of some of these funds are publicly quoted. For mutual funds which are publicly quoted, the funds are valued based on quoted pricesin active markets and have been categorized as Level 1. For equity commingled funds and mutual funds which are not publicly quoted, the fundadministrators value the funds using the NAV per fund share, derived from the quoted prices in active markets of the underlying securities and are notclassified within the fair value hierarchy. These investments typically can be redeemed monthly or more frequently, with 30 or less days of notice andwithout further restrictions. Fixed income. For fixed income securities, which consist primarily of corporate debt securities, U.S. government securities, foreign government securities,municipal bonds, asset and mortgage-backed securities, commingled funds, mutual funds, and derivative instruments, the trustees obtain multiple pricesfrom pricing vendors whenever possible, which enables cross-provider validations in addition to checks for unusual daily movements. A primary pricesource is identified based on asset type, class, or issue for each security. With respect to individually held fixed income securities, the trustees monitorprices supplied by pricing services and may use a supplemental price source or change the primary price source of a given security if the portfoliomanagers challenge an assigned price and the trustees determine that another price source is considered to be preferable. We have obtained anunderstanding of how these prices are derived, including the nature and observability of the inputs used in deriving such prices. Additionally, we selectivelycorroborate the fair values of securities by comparison to other market-based price sources. Investments in U.S. Treasury securities have been categorizedas Level 1 because they trade in highly-liquid and transparent markets. Certain private placement fixed income securities have been categorized as Level 3because they are priced using certain significant unobservable inputs and are typically illiquid. The remaining fixed income securities, including certainother fixed income investments, are based on evaluated prices that reflect observable market information, such as actual trade information of similarsecurities, adjusted for observable differences and are categorized as Level 2. Other fixed income investments primarily consist of fixed income commingled funds and mutual funds, which are maintained by investment companiesand hold fund investments in accordance with a stated set of fund objectives. The values of some of these funds are publicly quoted. For mutual fundswhich are publicly quoted, the funds are valued based on quoted prices in active markets and have been categorized as Level 1. For fixed incomecommingled funds and mutual funds which are not publicly quoted, the fund administrators value the funds using the NAV per fund share, derived from thequoted prices in active markets of the underlying securities and are not classified within the fair value hierarchy. These investments typically can beredeemed monthly or more frequently, with 30 or less days of notice and without further restrictions.
F-67

Notes to Consolidated Financial Statements
(Dollars in millions, except per share data unless otherwise noted)
Note 18 — Fair Value of Financial Assets and Liabilities
Derivative instruments. These instruments, consisting primarily of futures and swaps to manage risk, are recorded at fair value. Over-the-counterderivatives are valued daily, based on quoted prices in active markets and trade in open markets, and have been categorized as Level 1. Derivativeinstruments other than over-the-counter derivatives are valued based on external price data of comparable securities and have been categorized as Level 2. Private credit. Private credit investments primarily consist of investments in private debt strategies. These investments are generally less liquid assets withan underlying term of 3 to 5 years and are intended to be held to maturity. The fair value of these investments is determined by the fund manager oradministrator using a combination of valuation models including cost models, market models, and income models and typically cannot be redeemed untilmaturity of the term loan. Private credit investments held directly by us are categorized as Level 3 because they are based largely on inputs that areunobservable and utilize complex valuation models. For managed private credit funds, the fair value is determined using a combination of valuation modelsincluding cost models, market models, and income models and typically cannot be redeemed until maturity of the term loan. Managed private credit fundinvestments are not classified within the fair value hierarchy because their fair value is determined using NAV or its equivalent as a practical expedient. Private equity. These investments include those in limited partnerships that invest in operating companies that are not publicly traded on a stock exchangesuch as leveraged buyouts, growth capital, venture capital, distressed investments, and investments in natural resources. These investments typically cannotbe redeemed and are generally liquidated over a period of 8 to 10 years from the initial investment date, which is based on our understanding of theinvestment funds. Private equity valuations are reported by the fund manager and are based on the valuation of the underlying investments, which includeunobservable inputs such as cost, operating results, discounted future cash flows, and market based comparable data. These valuation inputs areunobservable. The fair value of private equity investments is determined using NAV or its equivalent as a practical expedient, and therefore, theseinvestments are not classified within the fair value hierarchy. Real estate. These investments are funds with a direct investment in pools of real estate properties. These funds are reported by the fund manager and aregenerally based on independent appraisals from sources with professional qualifications, typically using a combination of market comparables anddiscounted cash flows. These valuation inputs are unobservable. The fair value of real estate investments is determined using NAV or its equivalent as apractical expedient, and therefore, these investments are not classified within the fair value hierarchy. We evaluated our NDT portfolios for the existence of significant concentrations of credit risk as of December 31, 2020. Types of concentrations that wereevaluated include, but are not limited to, investment concentrations in a single entity, type of industry, foreign country, and individual fund. As ofDecember 31, 2020, there were no significant concentrations (generally defined as greater than 10 percent) of risk in our NDT assets. See Note 10 — Asset Retirement Obligations for additional information on the NDT fund investments. Rabbi Trust Investments. The Rabbi trusts were established to hold assets related to deferred compensation plans existing for certain active and retiredmembers of executive management and directors. The Rabbi trusts' assets are included in investments in the Consolidated Balance Sheets and consistprimarily of money market funds, mutual funds, fixed income securities, and life insurance policies. Money market funds and mutual funds are publiclyquoted and have been categorized as Level 1 given the clear observability of the prices. The fair values of fixed income securities are based on evaluatedprices that reflect observable market information, such as actual trade information or similar securities, adjusted for observable differences and arecategorized in Level 2. The life insurance policies are valued using the cash surrender value of the policies, net of loans against those policies, which isprovided by a third-party. Certain life insurance policies, which consist primarily of mutual funds that are priced based on observable market data, havebeen categorized as Level 2 because the life insurance policies can be liquidated at the reporting date for the value of the underlying assets.
F-68

Notes to Consolidated Financial Statements
(Dollars in millions, except per share data unless otherwise noted)
Note 18 — Fair Value of Financial Assets and Liabilities
Deferred Compensation Obligations. Our deferred compensation plans allow participants to defer certain cash compensation into a notional investmentaccount. We include such plans in other current and noncurrent liabilities in the Consolidated Balance Sheets. The value of our deferred compensationobligations is based on the market value of the participants’ notional investment accounts. The underlying notional investments are comprised primarily ofequities, mutual funds, commingled funds, and fixed income securities which are based on directly and indirectly observable market prices. Since thedeferred compensation obligations themselves are not exchanged in an active market, they are categorized as Level 2 in the fair value hierarchy. The value of certain employment agreement obligations (which are included with the Deferred Compensation Obligation in the table above) are based on aknown and certain stream of payments to be made over time and are categorized as Level 2 within the fair value hierarchy. Investments in Equities. We hold certain investments in equity securities with readily determinable fair values in addition to those held within the NDTfunds. These equity securities are valued based on quoted prices in active markets and are categorized as Level 1. Deferred Purchase Price Consideration. We have DPP consideration for the sale of certain receivables of retail electricity. This amount is valued based onthe sales price of the receivables net of allowance for credit losses based on accounts receivable aging historical experience coupled with specificidentification through a credit monitoring process, which considers current conditions and forward-looking information such as industry trends,macroeconomic factors, changes in the regulatory environment, external credit ratings, publicly available news, payment status, payment history, and theexercise of collateral calls. Since the DPP consideration is based on the sales price of the receivables, it is categorized as Level 2 in the fair value hierarchy.See Note 6 — Accounts Receivable for additional information on the sale of certain receivables. Mark-to-Market Derivatives. Derivative contracts are traded in both exchange-based and non-exchange-based markets. Exchange-based derivatives thatare valued using unadjusted quoted prices in active markets are categorized in Level 1 in the fair value hierarchy. Certain derivatives’ pricing is verifiedusing indicative price quotations available through brokers or over-the-counter, on-line exchanges and are categorized in Level 2. These price quotationsreflect the average of the bid-ask, mid-point prices and are obtained from sources that we believe provide the most liquid market for the commodity. Theprice quotations are reviewed and corroborated to ensure the prices are observable and representative of an orderly transaction between market participants.This includes consideration of actual transaction volumes, market delivery points, bid-ask spreads, and contract duration. The remainder of derivativecontracts are valued using the Black model, an industry standard option valuation model. The Black model takes into account inputs such as contract terms,including maturity, and market parameters, including assumptions of the future prices of energy, interest rates, volatility, credit worthiness, and creditspread. For derivatives that trade in liquid markets, such as generic forwards, swaps, and options, model inputs are generally observable. Such instrumentsare categorized in Level 2. Our derivatives are predominantly at liquid trading points. For derivatives that trade in less liquid markets with limited pricinginformation, model inputs generally would include both observable and unobservable inputs. These valuations may include an estimated basis adjustmentfrom an illiquid trading point to a liquid trading point for which active price quotations are available. Such instruments are categorized in Level 3. For valuations that include both observable and unobservable inputs, if the unobservable input is determined to be significant to the overall inputs, theentire valuation is categorized in Level 3. This includes derivatives valued using indicative price quotations whose contract tenure extends intounobservable periods. In instances where observable data is unavailable, consideration is given to the assumptions that market participants would use invaluing the asset or liability. This includes assumptions about market risks such as liquidity, volatility, and contract duration. Such instruments arecategorized in Level 3 as the model inputs generally are not observable. Forward price curves for the power market utilized by the front office to managethe portfolio, are reviewed and verified by the middle office, and used for financial reporting by the back office. We consider credit and nonperformancerisk in the valuation of derivative contracts categorized in Level 2 and 3, including both historical and current market data, in our assessment of credit andnonperformance risk by counterparty. Due to master netting agreements and collateral posting requirements, the impacts of credit and nonperformance riskwere not material to the financial statements.
F-69
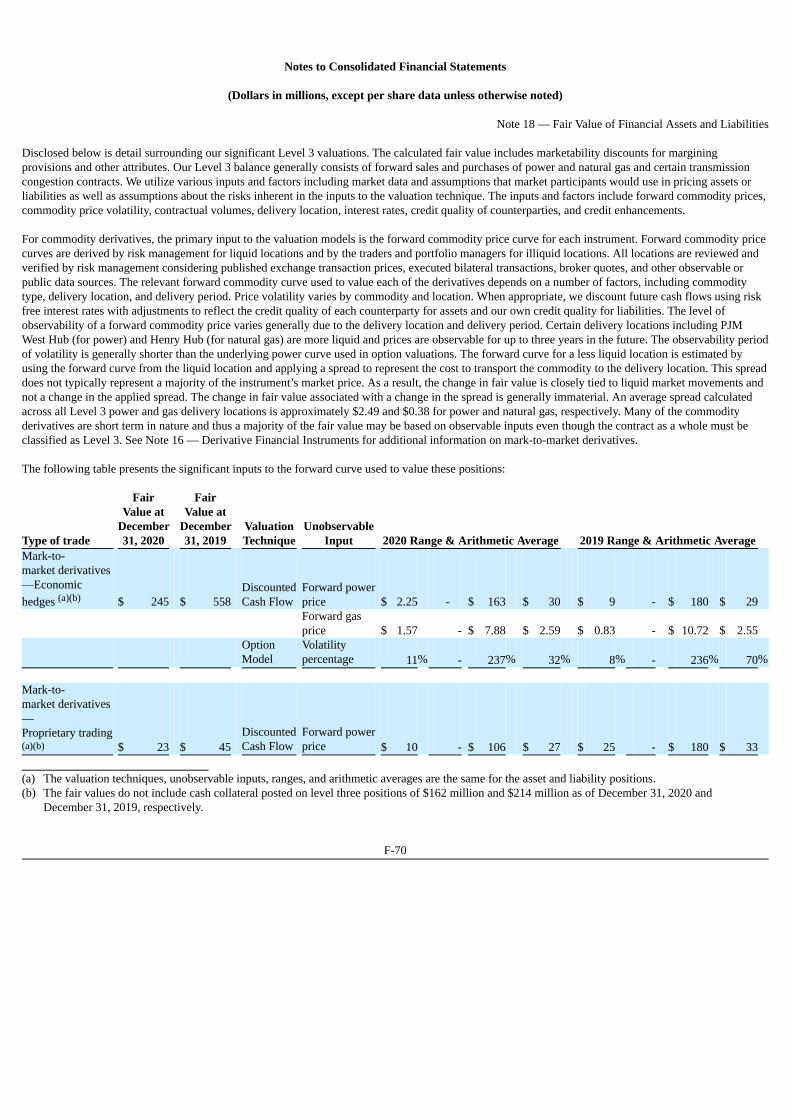
Notes to Consolidated Financial Statements
(Dollars in millions, except per share data unless otherwise noted)
Note 18 — Fair Value of Financial Assets and Liabilities
Disclosed below is detail surrounding our significant Level 3 valuations. The calculated fair value includes marketability discounts for marginingprovisions and other attributes. Our Level 3 balance generally consists of forward sales and purchases of power and natural gas and certain transmissioncongestion contracts. We utilize various inputs and factors including market data and assumptions that market participants would use in pricing assets orliabilities as well as assumptions about the risks inherent in the inputs to the valuation technique. The inputs and factors include forward commodity prices,commodity price volatility, contractual volumes, delivery location, interest rates, credit quality of counterparties, and credit enhancements. For commodity derivatives, the primary input to the valuation models is the forward commodity price curve for each instrument. Forward commodity pricecurves are derived by risk management for liquid locations and by the traders and portfolio managers for illiquid locations. All locations are reviewed andverified by risk management considering published exchange transaction prices, executed bilateral transactions, broker quotes, and other observable orpublic data sources. The relevant forward commodity curve used to value each of the derivatives depends on a number of factors, including commoditytype, delivery location, and delivery period. Price volatility varies by commodity and location. When appropriate, we discount future cash flows using riskfree interest rates with adjustments to reflect the credit quality of each counterparty for assets and our own credit quality for liabilities. The level ofobservability of a forward commodity price varies generally due to the delivery location and delivery period. Certain delivery locations including PJMWest Hub (for power) and Henry Hub (for natural gas) are more liquid and prices are observable for up to three years in the future. The observability periodof volatility is generally shorter than the underlying power curve used in option valuations. The forward curve for a less liquid location is estimated byusing the forward curve from the liquid location and applying a spread to represent the cost to transport the commodity to the delivery location. This spreaddoes not typically represent a majority of the instrument’s market price. As a result, the change in fair value is closely tied to liquid market movements andnot a change in the applied spread. The change in fair value associated with a change in the spread is generally immaterial. An average spread calculatedacross all Level 3 power and gas delivery locations is approximately $2.49 and $0.38 for power and natural gas, respectively. Many of the commodityderivatives are short term in nature and thus a majority of the fair value may be based on observable inputs even though the contract as a whole must beclassified as Level 3. See Note 16 — Derivative Financial Instruments for additional information on mark-to-market derivatives. The following table presents the significant inputs to the forward curve used to value these positions:
Type of trade
FairValue at
December31, 2020
FairValue at
December31, 2019
ValuationTechnique
UnobservableInput 2020 Range & Arithmetic Average 2019 Range & Arithmetic Average
Mark-to-market derivatives—Economichedges (a)(b) $ 245 $ 558
DiscountedCash Flow
Forward powerprice $ 2.25 - $ 163 $ 30 $ 9 - $ 180 $ 29
Forward gasprice $ 1.57 - $ 7.88 $ 2.59 $ 0.83 - $ 10.72 $ 2.55
Option Model
Volatilitypercentage 11% - 237% 32% 8% - 236% 70%
Mark-to-market derivatives—Proprietary trading(a)(b) $ 23 $ 45
DiscountedCash Flow
Forward powerprice $ 10 - $ 106 $ 27 $ 25 - $ 180 $ 33
(a) The valuation techniques, unobservable inputs, ranges, and arithmetic averages are the same for the asset and liability positions.(b) The fair values do not include cash collateral posted on level three positions of $162 million and $214 million as of December 31, 2020 and
December 31, 2019, respectively.
F-70

Notes to Consolidated Financial Statements
(Dollars in millions, except per share data unless otherwise noted)
Note 18 — Fair Value of Financial Assets and Liabilities
The inputs listed above, which are as of the balance sheet date, would have a direct impact on the fair values of the above instruments if they were adjusted.The significant unobservable inputs used in the fair value measurement of our commodity derivatives are forward commodity prices and for options is pricevolatility. Increases (decreases) in the forward commodity price in isolation would result in significantly higher (lower) fair values for long positions(contracts that give us the obligation or option to purchase a commodity), with offsetting impacts to short positions (contracts that give us the obligation orright to sell a commodity). Increases (decreases) in volatility would increase (decrease) the value for the holder of the option (writer of the option).Generally, a change in the estimate of forward commodity prices is unrelated to a change in the estimate of volatility of prices. An increase to the reserveslisted above would decrease the fair value of the positions. An increase to the heat rate or renewable factors would increase the fair value accordingly.Generally, interrelationships exist between market prices of natural gas and power. As such, an increase in natural gas pricing would potentially have asimilar impact on forward power markets. 19. Commitments and Contingencies Commercial Commitments. Commercial commitments as of December 31, 2020, representing commitments potentially triggered by future events, were asfollows: Expiration within
Total 2021 2022 2023 2024 2025 2026 andbeyond
Letters of credit $ 1,228 $ 1,164 $ 50 $ 14 $ — $ — $ —Surety bonds(a) 926 873 53 — — — —Total commercial commitments $ 2,154 $ 2,037 $ 103 $ 14 $ — $ — $ —
(a) Surety bonds—Guarantees issued related to contract and commercial agreements, excluding bid bonds. Nuclear Insurance We are subject to liability, property damage and other risks associated with major incidents at any of our nuclear stations. We have mitigated our financialexposure to these risks through insurance and other industry risk-sharing provisions. The Price-Anderson Act was enacted to ensure the availability of funds for public liability claims arising from an incident at any of the U.S. licensednuclear facilities and to limit the liability of nuclear reactor owners for such claims from any single incident. As of December 31, 2020, the current liabilitylimit per incident is $13.8 billion and is subject to change to account for the effects of inflation and changes in the number of licensed reactors at least onceevery five years with the last adjustment effective November 1, 2018. In accordance with the Price-Anderson Act, we maintain financial protection atlevels equal to the amount of liability insurance available from private sources through the purchase of private nuclear energy liability insurance for publicliability claims that could arise in the event of an incident. Effective January 1, 2017, the required amount of nuclear energy liability insurance purchased is$450 million for each operating site. Claims exceeding that amount are covered through mandatory participation in a financial protection pool, as requiredby the Price Anderson-Act, which provides the additional $13.3 billion per incident in funds available for public liability claims.
F-71

Notes to Consolidated Financial Statements
(Dollars in millions, except per share data unless otherwise noted)
Note 19 — Commitments and Contingencies
Participation in this secondary financial protection pool requires the operator of each reactor to fund its proportionate share of costs for any single incidentthat exceeds the primary layer of financial protection. Our share of this secondary layer would be approximately $2.9 billion, however any amounts payableunder this secondary layer would be capped at $434 million per year. In addition, the U.S. Congress could impose revenue-raising measures on the nuclear industry to pay public liability claims exceeding the $13.8 billionlimit for a single incident. As part of the execution of the NOSA on April 1, 2014, we executed an Indemnity Agreement pursuant to which we agreed to indemnify EDF and itsaffiliates against third-party claims that may arise from any future nuclear incident (as defined in the Price-Anderson Act) in connection with the CENGnuclear plants or their operations. Exelon guarantees our obligations under this indemnity. See Note 21 — Variable Interest Entities for additionalinformation on our operations relating to CENG. We are required each year to report to the NRC the current levels and sources of property insurance that demonstrates we possess sufficient financialresources to stabilize and decontaminate a reactor and reactor station site in the event of an accident. The property insurance maintained for each facility iscurrently provided through insurance policies purchased from NEIL, an industry mutual insurance company of which we are a member. NEIL may declare distributions to its members as a result of favorable operating experience. In recent years, NEIL has made distributions to its members,but we cannot predict the level of future distributions or if they will continue at all. Our portion of the annual distribution declared by NEIL is estimated tobe $75 million for 2020, and was $136 million and $58 million for 2019 and 2018, respectively. In addition, in March 2018, NEIL declared a supplementaldistribution. Our portion of the supplemental distribution declared by NEIL was $31 million. The distributions were recorded as a reduction to Operatingand maintenance expense within the Consolidated Statements of Operations and Comprehensive Income. Premiums paid to NEIL by its members are also subject to a potential assessment for adverse loss experience in the form of a retrospective premiumobligation. NEIL has never assessed this retrospective premium since its formation in 1973, and we cannot predict the level of future assessments, if any.The current maximum aggregate annual retrospective premium obligation for us is approximately $252 million. NEIL requires its members to maintain aninvestment grade credit rating or to ensure collectability of their annual retrospective premium obligation by providing a financial guarantee, letter ofcredit, deposit premium, or some other means of assurance. NEIL provides “all risk” property damage, decontamination and premature decommissioning insurance for each station for losses resulting from damage toits nuclear plants, either due to accidents or acts of terrorism. If the decision is made to decommission the facility, a portion of the insurance proceeds willbe allocated to a fund, which we are required by the NRC to maintain, to provide for decommissioning the facility. In the event of an insured loss, we areunable to predict the timing of the availability of insurance proceeds to us and the amount of such proceeds that would be available. In the event that one ormore acts of terrorism cause accidental property damage within a twelve-month period from the first accidental property damage under one or morepolicies for all insured plants, the maximum recovery by us will be an aggregate of $3.2 billion plus such additional amounts as the insurer may recover forall such losses from reinsurance, indemnity and any other source, applicable to such losses. For our insured losses, we are self-insured to the extent that losses are within the policy deductible or exceed the amount of insurance maintained.Uninsured losses and other expenses, to the extent not recoverable from insurers or the nuclear industry, could also be borne by us. Any such losses couldhave a material adverse effect on our financial statements.
F-72
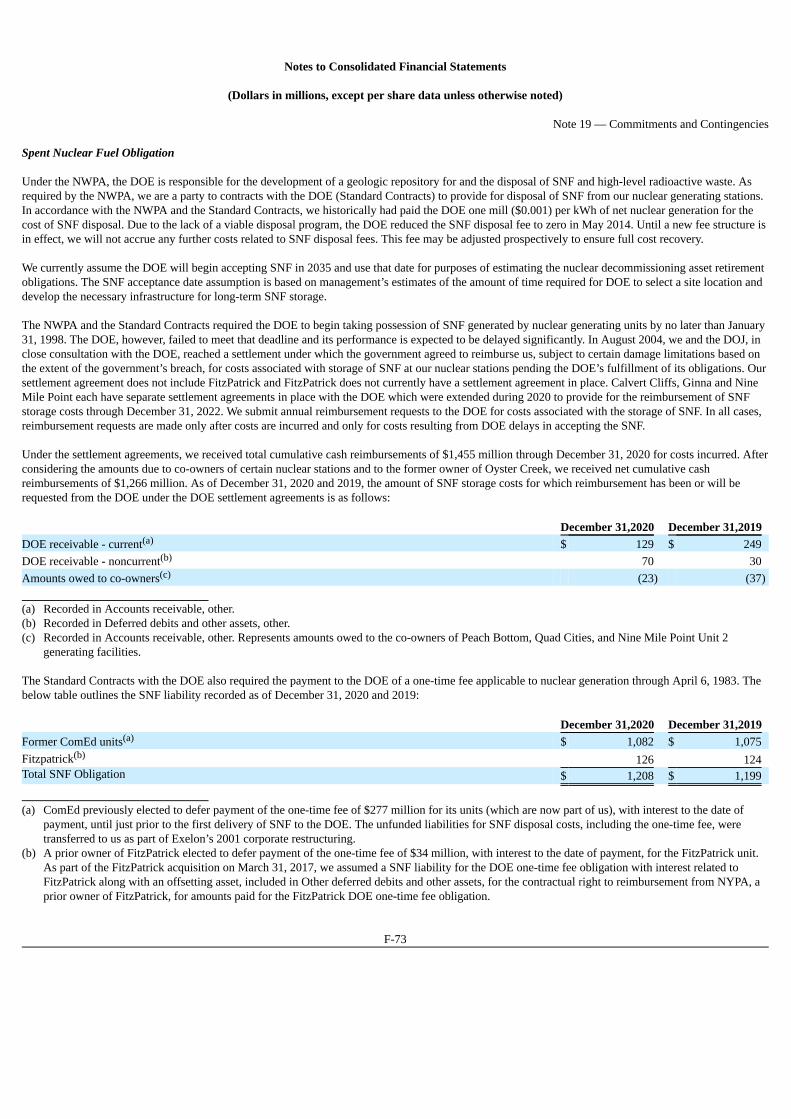
Notes to Consolidated Financial Statements
(Dollars in millions, except per share data unless otherwise noted)
Note 19 — Commitments and Contingencies
Spent Nuclear Fuel Obligation Under the NWPA, the DOE is responsible for the development of a geologic repository for and the disposal of SNF and high-level radioactive waste. Asrequired by the NWPA, we are a party to contracts with the DOE (Standard Contracts) to provide for disposal of SNF from our nuclear generating stations.In accordance with the NWPA and the Standard Contracts, we historically had paid the DOE one mill ($0.001) per kWh of net nuclear generation for thecost of SNF disposal. Due to the lack of a viable disposal program, the DOE reduced the SNF disposal fee to zero in May 2014. Until a new fee structure isin effect, we will not accrue any further costs related to SNF disposal fees. This fee may be adjusted prospectively to ensure full cost recovery. We currently assume the DOE will begin accepting SNF in 2035 and use that date for purposes of estimating the nuclear decommissioning asset retirementobligations. The SNF acceptance date assumption is based on management’s estimates of the amount of time required for DOE to select a site location anddevelop the necessary infrastructure for long-term SNF storage. The NWPA and the Standard Contracts required the DOE to begin taking possession of SNF generated by nuclear generating units by no later than January31, 1998. The DOE, however, failed to meet that deadline and its performance is expected to be delayed significantly. In August 2004, we and the DOJ, inclose consultation with the DOE, reached a settlement under which the government agreed to reimburse us, subject to certain damage limitations based onthe extent of the government’s breach, for costs associated with storage of SNF at our nuclear stations pending the DOE’s fulfillment of its obligations. Oursettlement agreement does not include FitzPatrick and FitzPatrick does not currently have a settlement agreement in place. Calvert Cliffs, Ginna and NineMile Point each have separate settlement agreements in place with the DOE which were extended during 2020 to provide for the reimbursement of SNFstorage costs through December 31, 2022. We submit annual reimbursement requests to the DOE for costs associated with the storage of SNF. In all cases,reimbursement requests are made only after costs are incurred and only for costs resulting from DOE delays in accepting the SNF. Under the settlement agreements, we received total cumulative cash reimbursements of $1,455 million through December 31, 2020 for costs incurred. Afterconsidering the amounts due to co-owners of certain nuclear stations and to the former owner of Oyster Creek, we received net cumulative cashreimbursements of $1,266 million. As of December 31, 2020 and 2019, the amount of SNF storage costs for which reimbursement has been or will berequested from the DOE under the DOE settlement agreements is as follows: December 31,2020 December 31,2019 DOE receivable - current(a) $ 129 $ 249 DOE receivable - noncurrent(b) 70 30 Amounts owed to co-owners(c) (23) (37)
(a) Recorded in Accounts receivable, other.(b) Recorded in Deferred debits and other assets, other.(c) Recorded in Accounts receivable, other. Represents amounts owed to the co-owners of Peach Bottom, Quad Cities, and Nine Mile Point Unit 2
generating facilities. The Standard Contracts with the DOE also required the payment to the DOE of a one-time fee applicable to nuclear generation through April 6, 1983. Thebelow table outlines the SNF liability recorded as of December 31, 2020 and 2019: December 31,2020 December 31,2019 Former ComEd units(a) $ 1,082 $ 1,075 Fitzpatrick(b) 126 124 Total SNF Obligation $ 1,208 $ 1,199
(a) ComEd previously elected to defer payment of the one-time fee of $277 million for its units (which are now part of us), with interest to the date ofpayment, until just prior to the first delivery of SNF to the DOE. The unfunded liabilities for SNF disposal costs, including the one-time fee, weretransferred to us as part of Exelon’s 2001 corporate restructuring.
(b) A prior owner of FitzPatrick elected to defer payment of the one-time fee of $34 million, with interest to the date of payment, for the FitzPatrick unit.As part of the FitzPatrick acquisition on March 31, 2017, we assumed a SNF liability for the DOE one-time fee obligation with interest related toFitzPatrick along with an offsetting asset, included in Other deferred debits and other assets, for the contractual right to reimbursement from NYPA, aprior owner of FitzPatrick, for amounts paid for the FitzPatrick DOE one-time fee obligation.
F-73

Notes to Consolidated Financial Statements
(Dollars in millions, except per share data unless otherwise noted)
Note 19 — Commitments and Contingencies
Interest for our SNF liabilities accrues at the 13-week Treasury Rate. The 13-week Treasury Rate in effect for calculation of the interest accrual atDecember 31, 2020 was 0.096% for the deferred amount transferred from ComEd and 0.101% for the deferred FitzPatrick amount. The following table summarizes sites for which we do not have an outstanding SNF Obligation: Description SitesFees have been paid Former PECO units, Clinton and Calvert CliffsOutstanding SNF Obligation remains with former owners Nine Mile Point, Ginna and TMI Environmental Remediation Matters General. Our operations have in the past, and may in the future, require substantial expenditures to comply with environmental laws. Additionally, underFederal and state environmental laws, we are generally liable for the costs of remediating environmental contamination of property now or formerly ownedby us and of property contaminated by hazardous substances generated by us. We own or lease a number of real estate parcels, including parcels on whichour operations or the operations of others may have resulted in contamination by substances that are considered hazardous under environmental laws. Inaddition, we are currently involved in a number of proceedings relating to sites where hazardous substances have been deposited and may be subject toadditional proceedings in the future. Unless otherwise disclosed, we cannot reasonably estimate whether we will incur significant liabilities for additionalinvestigation and remediation costs at these or additional sites identified by us, environmental agencies or others. Additional costs could have a material,unfavorable impact on our financial statements. As of December 31, 2020 and 2019, we had accrued the following undiscounted amounts for environmental liabilities in Other current liabilities and Otherdeferred credits and other liabilities within the Consolidated Balance Sheets: December 31,2020 December 31,2019Total environmental investigation andremediation liabilities $ 121 $ 105 Cotter Corporation. The EPA has advised Cotter Corporation (Cotter), a former ComEd subsidiary, that it is potentially liable in connection withradiological contamination at a site known as the West Lake Landfill in Missouri. In 2000, ComEd sold Cotter to an unaffiliated third-party. As part of thesale, ComEd agreed to indemnify Cotter for any liability arising in connection with the West Lake Landfill. In connection with Exelon’s 2001 corporaterestructuring, this responsibility to indemnify Cotter was transferred to us. Including Cotter, there are three PRPs participating in the West Lake Landfillremediation proceeding. Our investigation has identified a number of other parties who also may be PRPs and could be liable to contribute to the finalremedy. Further investigation is ongoing.
F-74

Notes to Consolidated Financial Statements
(Dollars in millions, except per share data unless otherwise noted)
Note 19 — Commitments and Contingencies
In September 2018, the EPA issued its Record of Decision (ROD) Amendment for the selection of a final remedy. The ROD Amendment modified theremedy previously selected by EPA in its 2008 ROD. While the 2008 ROD required only that the radiological materials and other wastes at the site becapped, the 2018 ROD Amendment requires partial excavation of the radiological materials in addition to the previously selected capping remedy. TheROD Amendment also allows for variation in depths of excavation depending on radiological concentrations. The EPA and the PRPs have entered into aConsent Agreement to perform the Remedial Design, which is expected to be completed by early 2022. In March 2019 the PRPs received Special NoticeLetters from the EPA to perform the Remedial Action work. On October 8, 2019, Cotter (our indemnitee) provided a non-binding good faith offer toconduct, or finance, a portion of the remedy, subject to certain conditions. The total estimated cost of the remedy, taking into account the current EPAtechnical requirements and the total costs expected to be incurred collectively by the PRPs in fully executing the remedy, is approximately $280 million,including cost escalation on an undiscounted basis, which would be allocated among the final group of PRPs. We have determined that a loss associatedwith the EPA’s partial excavation and enhanced landfill cover remedy is probable and have recorded a liability, included in the table above, that reflectsmanagement’s best estimate of Cotter’s allocable share of the ultimate cost. Given the joint and several nature of this liability, the magnitude of our ultimateliability will depend on the actual costs incurred to implement the required remedy as well as on the nature and terms of any cost-sharing arrangementswith the final group of PRPs. Therefore, it is reasonably possible that the ultimate cost and Cotter's associated allocable share could differ significantlyonce these uncertainties are resolved, which could have a material impact on our future financial statements. One of the other PRPs has indicated it will be making a contribution claim against Cotter for costs that it has incurred to prevent the subsurface fire fromspreading to those areas of the West Lake Landfill where radiological materials are believed to have been disposed. At this time, we do not have sufficientinformation to assess this claim and therefore are unable to estimate a range of loss, if any. As such, no liability has been recorded for the potentialcontribution claim. It is reasonably possible, however, that resolution of this matter could have a material, unfavorable impact on our financial statements. In January 2018, the PRPs were advised by the EPA that it will begin an additional investigation and evaluation of groundwater conditions at the West LakeLandfill. In September 2018, the PRPs agreed to an Administrative Settlement Agreement and Order on Consent for the performance by the PRPs of thegroundwater Remedial Investigation (RI)/Feasibility Study (FS). The purpose of this RI/FS is to define the nature and extent of any groundwatercontamination from the West Lake Landfill site and evaluate remedial alternatives. We estimate the undiscounted cost for the groundwater RI/FS to beapproximately $30 million. We determined a loss associated with the RI/FS is probable and have recorded a liability, included in the table above, thatreflects management’s best estimate of Cotter’s allocable share of the cost among the PRPs. At this time we cannot predict the likelihood that, or the extentto which any, remediation activities may be required and therefore cannot estimate a reasonably possible range of loss for response costs beyond thoseassociated with the RI/FS component. It is reasonably possible, however, that resolution of this matter could have a material, unfavorable impact on ourfuture financial statements. In August 2011, Cotter was notified by the DOJ that Cotter is considered a PRP with respect to the government’s clean-up costs for contaminationattributable to low level radioactive residues at a former storage and reprocessing facility named Latty Avenue near St. Louis, Missouri. The Latty Avenuesite is included in ComEd’s (now our) indemnification responsibilities discussed above as part of the sale of Cotter. The radioactive residues had beengenerated initially in connection with the processing of uranium ores as part of the U.S. Government’s Manhattan Project. Cotter purchased the residues in1969 for initial processing at the Latty Avenue facility for the subsequent extraction of uranium and metals. In 1976, the NRC found that the Latty Avenuesite had radiation levels exceeding NRC criteria for decontamination of land areas. Latty Avenue was investigated and remediated by the United StatesArmy Corps of Engineers pursuant to funding under FUSRAP. Pursuant to a series of annual agreements since 2011, the DOJ and the PRPs have tolled thestatute of limitations until August 31, 2021 so that settlement discussions can proceed. On August 3, 2020, the DOJ advised Cotter and the other PRPs thatit is seeking approximately $90 million from all the PRPs and has directed that the PRPs must submit a good faith joint proposed settlement offer. We havedetermined that a loss associated with this matter is probable under our indemnification agreement with Cotter and have recorded an estimated liability,which is included in the table above.
F-75

Notes to Consolidated Financial Statements
(Dollars in millions, except per share data unless otherwise noted)
Note 19 — Commitments and Contingencies
Benning Road Site. In September 2010, PHI received a letter from EPA identifying the Benning Road site as one of six land-based sites potentiallycontributing to contamination of the lower Anacostia River. A portion of the site was formerly the location of a Pepco Energy Services electric generatingfacility, which was deactivated in June 2012. The remaining portion of the site consists of a Pepco transmission and distribution service center that remainsin operation. In December 2011, the U.S. District Court for the District of Columbia approved a Consent Decree entered into by Pepco and Pepco EnergyServices with the DOEE, which requires Pepco and Pepco Energy Services to conduct a RI/FS for the Benning Road site and an approximately 10 to 15-acre portion of the adjacent Anacostia River. Since 2013, Pepco and Pepco Energy Services (now us, pursuant to Exelon's 2016 acquisition of PHI) have been performing RI work and have submittedmultiple draft RI reports to the DOEE. In September 2019, we and Pepco issued a draft “final” RI report which DOEE approved on February 3, 2020. Weand Pepco are developing a FS to evaluate possible remedial alternatives for submission to DOEE. The Court has established a schedule for completion ofthe FS, and approval by the DOEE, by September 16, 2021. After completion and approval of the FS, DOEE will prepare a Proposed Plan for publiccomment and then issue a ROD identifying any further response actions determined to be necessary. We have determined that a loss associated with thismatter is probable and have accrued an estimated liability, which is included in the table above. Litigation and Regulatory Matters Asbestos Personal Injury Claims. We maintain a reserve for claims associated with asbestos-related personal injury actions in certain facilities that arecurrently owned by us or were previously owned by ComEd and PECO. The estimated liabilities are recorded on an undiscounted basis and exclude theestimated legal costs associated with handling these matters, which could be material. At December 31, 2020 and 2019, we recorded estimated liabilities of approximately $89 million and $83 million, respectively, in total for asbestos-relatedbodily injury claims. As of December 31, 2020, approximately $25 million of this amount related to 261 open claims presented to us, while the remaining$64 million is for estimated future asbestos-related bodily injury claims anticipated to arise through 2055, based on actuarial assumptions and analyses,which are updated on an annual basis. On a quarterly basis, we monitor actual experience against the number of forecasted claims to be received andexpected claim payments and evaluate whether adjustments to the estimated liabilities are necessary. It is reasonably possible that additional exposure to estimated future asbestos-related bodily injury claims in excess of the amount accrued could have amaterial, unfavorable impact on our financial statements. However, management cannot reasonably estimate a range of loss beyond the amounts recorded. Fund Transfer Restrictions. Under applicable law, we can pay dividends only from retained, undistributed or current earnings. A significant loss recordedby us, may limit the dividends that we can distribute to Exelon. City of Everett Tax Increment Financing Agreement. On April 10, 2017, the City of Everett petitioned the Massachusetts Economic AssistanceCoordinating Council (EACC) to revoke the 1999 tax increment financing agreement (TIF Agreement) relating to Mystic Units 8 and 9 on the grounds thatthe total investment in Mystic Units 8 and 9 materially deviates from the investment set forth in the TIF Agreement. On October 31, 2017, a three-memberpanel of the EACC conducted an administrative hearing on the City’s petition. On November 30, 2017, the hearing panel issued a tentative decisiondenying the City’s petition, finding that there was no material misrepresentation that would justify revocation of the TIF Agreement. On December 13,2017, the tentative decision was adopted by the full EACC. On January 12, 2018, the City filed a complaint in Massachusetts Superior Court requesting,among other things, that the court set aside the EACC’s decision, grant the City’s request to decertify the Project and the TIF Agreement, and award theCity damages for alleged underpaid taxes over the period of the TIF Agreement. On January 8, 2020, the Massachusetts Superior Court affirmed thedecision of the EACC denying the City's petition. The City had until March 9, 2020 to appeal the decision and did not. As a result, the decision is final andthe case is resolved. It is reasonably possible that property taxes assessed in future periods, including those following the expiration of the TIF Agreementon June 30, 2020, could be material to our financial statements.
F-76

Notes to Consolidated Financial Statements
(Dollars in millions, except per share data unless otherwise noted)
Note 19 — Commitments and Contingencies
General. We are involved in various other litigation matters that are being defended and handled in the ordinary course of business. The assessment ofwhether a loss is probable or reasonably possible, and whether the loss or a range of loss is estimable, often involves a series of complex judgments aboutfuture events. We maintain accruals for such losses that are probable of being incurred and subject to reasonable estimation. Management is sometimesunable to estimate an amount or range of reasonably possible loss, particularly where (1) the damages sought are indeterminate, (2) the proceedings are inthe early stages, or (3) the matters involve novel or unsettled legal theories. In such cases, there is considerable uncertainty regarding the timing or ultimateresolution of such matters, including a possible eventual loss. 20. Stock-Based Compensation Plans Exelon grants stock-based awards to our employees through its LTIP, which primarily includes performance share awards, restricted stock units, and stockoptions. We also grant cash awards. The following table does not include expense related to these plans as they are not considered stock-basedcompensation plans under the applicable authoritative guidance. The following table presents the stock-based compensation expense included in our Consolidated Statements of Operations and Comprehensive Income: Year Ended December 31, 2020 2019 2018 Total stock-based compensation expense included in operating and maintenance expense $ 27 $ 37 $ 77 Income tax benefit (7) (10) (20)Total after-tax stock-based compensation expense $ 20 $ 27 $ 57 21. Variable Interest Entities At December 31, 2020 and 2019, we consolidated several VIEs or VIE groups for which we are the primary beneficiary (see Consolidated VIEs below) andhad significant interests in several other VIEs for which we do not have the power to direct the entities’ activities and, accordingly, was not the primarybeneficiary (see Unconsolidated VIEs below). Consolidated and unconsolidated VIEs are aggregated to the extent that the entities have similar risk profiles. Consolidated VIEs The table below shows the carrying amounts and classification of the consolidated VIEs’ assets and liabilities included in the consolidated financialstatements as of December 31, 2020 and 2019. The assets, except as noted in the footnotes to the table below, can only be used to settle obligations of theVIEs. The liabilities, except as noted in the footnotes to the table below, are such that creditors, or beneficiaries, do not have recourse to our general credit.
F-77

Notes to Consolidated Financial Statements
(Dollars in millions, except per share data unless otherwise noted)
Note 21 — Variable Interest Entities
December 31, 2020 December 31, 2019 Cash and cash equivalents $ 98 $ 163 Restricted cash and cash equivalents 44 85 Accounts receivable
Customer 148 151 Other 36 39
Unamortized energy contract assets 22 23 Inventories, net
Materials and supplies 244 227 Assets held for sale(a) 101 — Other current assets 669 31
Total current assets 1,362 719 Property, plant and equipment, net 5,803 6,022 Nuclear decommissioning trust funds 3,007 2,741 Unamortized energy contract assets 249 250 Other noncurrent assets 42 73
Total noncurrent assets 9,101 9,086 Total assets(b) $ 10,463 $ 9,805 Long-term debt due within one year $ 68 $ 523 Accounts payable 81 106 Accrued expenses 70 70 Unamortized energy contract liabilities 4 8 Liabilities held for sale(a) 16 — Other current liabilities 5 3
Total current liabilities 244 710 Long-term debt 889 504 Asset retirement obligations 2,318 2,128 Unamortized energy contract liabilities — 1 Other noncurrent liabilities 129 89
Total noncurrent liabilities 3,336 2,722 Total liabilities(c) $ 3,580 $ 3,432
(a) We entered into an agreement for the sale of a significant portion of our solar business. As a result of this transaction, in the fourth quarter of 2020, wereclassified the consolidated VIEs' solar assets and liabilities as held for sale. Refer to Note 2 — Mergers, Acquisitions, and Dispositions for additionalinformation on the sale of the solar business.
(b) Our balances include unrestricted assets for current unamortized energy contract assets of $22 million and $23 million, Property, plant, and equipmentof $1 million and $20 million, non-current unamortized energy contract assets of $249 million and $250 million, and Assets held for sale of $9 millionand $0 million as of December 31, 2020 and 2019, respectively.
(c) Our balances include liabilities with recourse of $8 million and $3 million as of December 31, 2020 and 2019, respectively.
F-78

Notes to Consolidated Financial Statements
(Dollars in millions, except per share data unless otherwise noted)
Note 21 — Variable Interest Entities
As of December 31, 2020 and 2019, our consolidated VIEs consist of:
Consolidated VIE or VIE groups: Reason entity is a VIE: Reason we are the primary beneficiary:CENG - A joint venture between us andEDF. We have a 50.01% equity ownership inCENG. See additional discussion below.
Disproportionate relationship between equityinterest and operational control as a result of theNOSA described further below.
We conduct the operational activities.
EGRP - A collection of wind and solar projectentities. We have a 51% equity ownership inEGRP. See additional discussion below.
Similar structure to a limited partnership and thelimited partners do not have kick out rights withrespect to the general partner.
We conduct the operational activities.
Bluestem Wind Energy Holdings, LLC - A TaxEquity structure which is consolidated byEGRP. We are a minority interest holder.
Similar structure to a limited partnership and thelimited partners do not have kick out rights withrespect to the general partner.
We conduct the operational activities.
Antelope Valley - A solar generating facility,which is 100% owned by us. Antelope Valleysells all of its output to PG&E through a PPA.
The PPA contract absorbs variability through aperformance guarantee.
We conduct all activities.
Equity investment in distributed energy company- we have a 31% equity ownership. Thisdistributed energy company has an interest in anunconsolidated VIE. (See Unconsolidated VIEsdisclosure below). We fully impaired this investment in the thirdquarter of 2019. Refer to Note 12 — AssetImpairments for additional information.
Similar structure to a limited partnership and thelimited partners do not have kick out rights withrespect to the general partner.
We conduct the operational activities.
NER - A bankruptcy remote, special purposeentity which is 100% owned by us, whichpurchases certain of our customer accountsreceivable arising from the sale of retailelectricity. NER’s assets will be available first and foremostto satisfy the claims of the creditors of NER.Refer to Note 6 —Accounts Receivable foradditional information on the sale of receivables.
Equity capitalization is insufficient to support itsoperations.
We conduct all activities.
CENG - On April 1, 2014, we, CENG, and subsidiaries of CENG executed the NOSA pursuant to which we conduct all activities associated with theoperations of the CENG fleet and provides corporate and administrative services to CENG and the CENG fleet for the remaining life of the CENG nuclearplants as if they were a part of our nuclear fleet, subject to the CENG member rights of EDF.
F-79

Notes to Consolidated Financial Statements
(Dollars in millions, except per share data unless otherwise noted)
Note 21 — Variable Interest Entities
EDF has the option to sell its 49.99% equity interest in CENG to us. On November 20, 2019, we received notice of EDF's intention to exercise the putoption to sell its interest in CENG to us and the put automatically exercised on January 19, 2020. Refer to Note 2 — Mergers, Acquisitions, andDispositions for additional information. We provide the following support to CENG:
• We executed an Indemnity Agreement pursuant to which we agreed to indemnify EDF against third-party claims that may arise from any futurenuclear incident (as defined in the Price-Anderson Act) in connection with the CENG nuclear plants or their operations. Exelon guarantees ourobligations under this Indemnity Agreement. See Note 19 — Commitments and Contingencies for more details.
• We and EDF share in the $688 million of contingent payment obligations for the payment of contingent retrospective premium adjustments for
the nuclear liability insurance.
• Exelon has executed an agreement to provide up to $245 million to support the operations of CENG as well as a $165 million guarantee ofCENG’s cash pooling agreement with its subsidiaries.
EGRP - EGRP is a collection of wind and solar project entities and some of these project entities are VIEs that are consolidated by EGRP. We own anumber of limited liability companies that build, own, and operate solar and wind power facilities some of which are owned by EGRP. While we or EGRPown 100% of the solar entities and 100% of the majority of the wind entities, it has been determined that certain of the solar and wind entities are VIEsbecause the entities require additional subordinated financial support in the form of a parental guarantee of debt, loans from the customers in order to obtainthe necessary funds for construction of the solar facilities, or the customers absorb price variability from the entities through the fixed price power and/orREC purchase agreements. We are the primary beneficiary of these solar and wind entities that qualify as VIEs because we control the design, construction,and operation of the facilities. There is limited recourse to us related to certain solar and wind entities. In 2017, our interests in EGRP were contributed to and are pledged for the EGR IV non-recourse debt project financing structure. Refer to Note 17 — Debtand Credit Agreements for additional information. Unconsolidated VIEs Our variable interests in unconsolidated VIEs generally include equity investments and energy purchase and sale contracts. For the equity investments, thecarrying amount of the investments is reflected in the Consolidated Balance Sheets in Investments. For the energy purchase and sale contracts (commercialagreements), the carrying amount of assets and liabilities in the Consolidated Balance Sheets that relate to our involvement with the VIEs arepredominately related to working capital accounts and generally represent the amounts owed by, or owed to, us for the deliveries associated with thecurrent billing cycles under the commercial agreements. As of December 31, 2020 and 2019, we had significant unconsolidated variable interests in several VIEs for which we were not the primary beneficiary.These interests include certain equity method investments and certain commercial agreements.
F-80

Notes to Consolidated Financial Statements
(Dollars in millions, except per share data unless otherwise noted)
Note 21 — Variable Interest Entities
The following table presents summary information about our significant unconsolidated VIE entities: December 31, 2020 December 31, 2019
CommercialAgreement
VIEs
EquityInvestment
VIEs Total
CommercialAgreement
VIEs
EquityInvestment
VIEs Total Total assets(a) $ 777 $ 401 $ 1,178 $ 636 $ 443 $ 1,079 Total liabilities(a) 61 223 284 33 227 260 Our ownership interest in VIE(a) — 157 157 — 191 191 Other ownership interests in VIE(a) 716 21 737 604 25 629
(a) These items represent amounts on the unconsolidated VIE balance sheets, not in our Consolidated Balance Sheets. These items are included to provideinformation regarding the relative size of the unconsolidated VIEs. We do not have any exposure to loss as they do not have a carrying amount in theequity investment VIEs as of December 31, 2020 and 2019.
As of December 31, 2020 and 2019, the unconsolidated VIEs consist of:
Unconsolidated VIE groups: Reason entity is a VIE: Reason we are not the primary
beneficiary:Equity investments in distributed energy companies- 1) We have a 90% equity ownership in a distributedenergy company. 2) We, via a consolidated VIE, have a 90% equityownership in another distributed energy company(See Consolidated VIEs disclosure above). We fully impaired this investment in the thirdquarter of 2019. Refer to Note 12 — AssetImpairments for additional information.
Similar structures to a limited partnership andthe limited partners do not have kick out rightswith respect to the general partner.
We do not conduct the operational activities.
Energy Purchase and Sale agreements - We haveseveral energy purchase and sale agreements withgenerating facilities.
PPA contracts that absorb variability throughfixed pricing.
We do not conduct the operational activities.
22. Supplemental Financial Information Supplemental Statement of Operations Information The following table provides additional information about material items recorded in the Consolidated Statements of Operations and ComprehensiveIncome. Taxes other than income taxes For the years ended December 31, 2020 2019 2018 Gross receipts(a) $ 99 $ 112 $ 114 Property 265 274 273 Payroll 113 115 130
(a) Represent gross receipts taxes related to our retail operations. The offsetting collection of gross receipts taxes from customers is recorded in revenuesin the Consolidated Statements of Operations and Comprehensive Income.
F-81

Notes to Consolidated Financial Statements
(Dollars in millions, except per share data unless otherwise noted)
Note 22 — Supplemental Financial Information
Other, Net For the years ended December 31, 2020 2019 2018 Decommissioning-related activities:
Net realized income on NDT funds(a) Regulatory Agreement Units $ 185 $ 297 $ 506 Non-regulatory Agreement Units 160 363 302
Net unrealized gains on NDT funds Regulatory Agreement Units 724 795 (715)Non-regulatory Agreement Units 391 411 (483)
Regulatory offset to NDT fund-related activities(b) (729) (876) 171 Decommissioning-related activities 731 990 (219)Unrealized gains from equity investments(c) 186 — —
(a) Realized income includes interest, dividends and realized gains and losses on sales of NDT fund investments.(b) Includes the elimination of decommissioning-related activities for the Regulatory Agreement Units, including the elimination of income taxes related
to all NDT fund activity for those units. See Note 10 — Asset Retirement Obligations for additional information regarding the accounting for nucleardecommissioning.
(c) Unrealized gains resulting from equity investments without readily determinable fair values that became publicly traded entities in the fourth quarter of2020 and were fair valued based on quoted market prices of the stocks as of December 31, 2020.
Supplemental Cash Flow Information The following tables provide additional information about material items recorded in the Consolidated Statements of Cash Flows. Depreciation, amortization and accretion For the years ended December 31, 2020 2019 2018 Property, plant and equipment(a) $ 2,070 $ 1,485 $ 1,748 Amortization of intangible assets, net(a) 53 50 49 Amortization of energy contract assets and liabilities(b) 30 21 14 Nuclear fuel(c) 983 1,016 1,115 ARO accretion(d) 500 491 489 Total depreciation, amortization and accretion $ 3,636 $ 3,063 $ 3,415
(a) Included in Depreciation and amortization in the Consolidated Statements of Operations and Comprehensive Income.(b) Included in Operating revenues or Purchased power and fuel expense in the Consolidated Statements of Operations and Comprehensive Income.(c) Included in Purchased power and fuel expense in the Consolidated Statements of Operations and Comprehensive Income.(d) Included in Operating and maintenance expense in the Consolidated Statements of Operations and Comprehensive Income.
F-82

Notes to Consolidated Financial Statements
(Dollars in millions, except per share data unless otherwise noted)
Note 22 — Supplemental Financial Information
Cash paid (refunded) during the year: For the years ended December 31, 2020 2019 2018 Interest (net of amount capitalized) $ 331 $ 373 $ 369 Income taxes (net of refunds) 70 (44) 746 Other non-cash operating activities: For the years ended December 31, 2020 2019 2018 Pension and non-pension postretirement benefit costs $ 115 $ 135 $ 204 Allowance for credit losses 17 31 48 Other decommissioning-related activity(a) (659) (506) (2)Energy-related options(b) 104 22 10 Severance costs 90 — — Provision for excess and obsolete inventory 128 — — Amortization of operating ROU asset 155 172 —
(a) Includes the elimination of decommissioning-related activities for the Regulatory Agreement Units, including the elimination of operating revenues,ARO updates and accretion, ARC amortization, investment income and income taxes related to all NDT fund activity for these units. See Note 10 —Asset Retirement Obligations for additional information regarding the accounting for nuclear decommissioning.
(b) Includes option premiums reclassified to realized at the settlement of the underlying contracts and recorded to results of operations. The following table provides a reconciliation of cash, restricted cash, and cash equivalents reported within the Consolidated Balance Sheets that sum to thetotal of the same amounts in the Consolidated Statements of Cash Flows. December 31,2020 December 31,2019 December 31,2018 December 31,2017 Cash and cash equivalents $ 226 $ 303 $ 750 $ 416 Restricted cash and cash equivalents 89 146 153 138 Cash, restricted cash, and cash equivalents - Held for Sale 12 — — — Total cash, restricted cash, and cash equivalents $ 327 $ 449 $ 903 $ 554 Supplemental Balance Sheet Information The following tables provide additional information about material items recorded in the Consolidated Balance Sheets. Investments December 31,2020 December 31,2019 Equity method investments:
Other equity method investments $ 65 $ 71 Other investments:
Employee benefit trusts and investments(a) 61 54 Equity investments without readily determinable fair values 55 69 Other available for sale debt security investments 3 41
Total investments $ 184 $ 235
(a) Debt and equity security investments are recorded at fair market value.
F-83

Notes to Consolidated Financial Statements
(Dollars in millions, except per share data unless otherwise noted)
Note 22 — Supplemental Financial Information
Accrued expenses December 31,2020 December 31,2019 Compensation-related accruals(a) $ 426 $ 422 Taxes accrued 229 222 Interest accrued 44 65
(a) Primarily includes accrued payroll, bonuses and other incentives, vacation, and benefits. 23. Related Party Transactions Operating revenues from affiliates The following table presents our Operating revenues from affiliates:
For the Years Ended
December 31, 2020 2019 2018 ComEd(a) $ 330 $ 369 $ 523 PECO(b) 190 158 128 BGE(c) 315 289 260 PHI 367 353 355
Pepco(d) 279 264 206 DPL(e) 75 70 120 ACE(f) 13 19 29 Other 9 3 2
Total operating revenues from affiliates $ 1,211 $ 1,172 $ 1,268
(a) We have an ICC-approved RFP contract with ComEd to provide a portion of ComEd’s electricity supply requirements. We also sell RECs and ZECs toComEd.
(b) We provide electric supply to PECO under contracts executed through PECO’s competitive procurement process. In addition, we have a ten-yearagreement with PECO to sell solar AECs.
(c) We provide a portion of BGE’s energy requirements under its MDPSC-approved market-based SOS commodity programs.(d) We provide electric supply to Pepco under contracts executed through Pepco's competitive procurement process approved by the MDPSC and DCPSC.(e) We provide a portion of DPL's energy requirements under its MDPSC and DPSC approved market based SOS and gas commodity programs.(f) We provide electric supply to ACE under contracts executed through ACE's competitive procurement process.
F-84

Notes to Consolidated Financial Statements
(Dollars in millions, except per share data unless otherwise noted)
Note 23 — Related Party Transactions
Operating and maintenance expense from affiliates We receive a variety of corporate support services from BSC. See Note 1 - Significant Accounting Policies for additional information regarding BSC. The following table presents the service company costs allocated to us:
Operating and maintenance fromaffiliates Capitalized costs
For the years ended December 31, For the years ended December 31,2020 2019 2018 2020 2019 2018
$ 552 $ 570 $ 652 $ 54 $ 66 $ 67 Current Receivables from/Payables to affiliates The following tables present current receivables from affiliates and current payables to affiliates: December 31, 2020
Receivables from
affiliates: Payables to affiliates:ComEd $ 78 $ 13PECO 17 —BGE 11 —Pepco 13 —DPL 3 —ACE 6 —BSC — 72Other 25 22Total $ 153 $ 107 December 31, 2019
Receivables from
affiliates: Payables to affiliates:ComEd $ 78 $ 27PECO 27 —BGE 28 —Pepco 34 —DPL 7 —ACE 7 —BSC — 67Other 9 23Total $ 190 $ 117
F-85

Notes to Consolidated Financial Statements
(Dollars in millions, except per share data unless otherwise noted)
Note 23 — Related Party Transactions
Borrowings from Exelon intercompany money pool To provide an additional short-term borrowing option that will generally be more favorable to the borrowing participants than the cost of externalfinancing, Exelon operates an intercompany money pool. We participate in the Exelon money pool. Noncurrent Receivables from/Payables to affiliates We have long-term payables to ComEd and PECO as a result of the nuclear decommissioning contractual construct whereby, to the extent NDT funds aregreater than the underlying ARO at the end of decommissioning, such amounts are due back to ComEd and PECO, as applicable, for payment to theirrespective customers. See Note 10 — Asset Retirement Obligations for additional information. The following table presents noncurrent receivables from affiliates at ComEd and PECO which are recorded as noncurrent payables to affiliates on ourConsolidated Balance Sheets: December 31, 2020 2019 ComEd $ 2,541 $ 2,622 PECO 475 480 Long-term debt to affiliates In connection with the debt obligations assumed by Exelon as part of the Constellation merger, Exelon and our subsidiaries (former Constellationsubsidiaries) assumed intercompany loan agreements that mirror the terms and amounts of the third-party debt obligations of Exelon, resulting inintercompany notes payable included in Long-term debt to affiliates in our Consolidated Balance Sheets.
F-86

Notes to Consolidated Financial Statements
(Dollars in millions, except per share data unless otherwise noted)
Note 23 — Related Party Transactions
24. Subsequent Events Impacts of February 2021 Weather Events and Texas-based Generating Assets Outages Beginning on February 15, 2021, our Texas-based generating assets within the ERCOT market, specifically Colorado Bend II, Wolf Hollow II, andHandley, experienced periodic outages as a result of historically severe cold weather conditions. In addition, those weather conditions drove increaseddemand for service, limited the availability of natural gas to fuel power plants, dramatically increased wholesale power prices and also increased gas pricesin certain regions. In response to the high demand and significantly reduced total generation on the system, ERCOT implemented load reductions tomaintain the reliability of the grid and required the use of an administrative price cap of $9,000 per megawatt hour during load shedding events. We estimate the impact to Net income for the first quarter of 2021 arising from these market and weather conditions to be approximately $560 million to$710 million. The estimated impact includes favorable results in certain regions within our wholesale gas business. The ultimate impact to our consolidatedfinancial statements may be affected by a number of factors, including final settlement data, the impacts of customer and counterparty credit losses, anystate sponsored solutions to address the financial challenges caused by the event, and litigation and contract disputes which may result. We used a combination of commercial paper and letters of credit to manage collateral needs and have posted approximately $1.4 billion of collateral withERCOT as of February 22, 2021. We continue to believe we have sufficient cash on hand and available capacity on our revolver, which was $2.4 billion asof February 22, 2021, to meet our liquidity requirements.
F-87