Investor Presentation - Carrols Restaurant Group, Inc.
18
Carrols Restaurant Group, Inc. (Nasdaq: TAST) Investor Presentation August 2018
-
Upload
khangminh22 -
Category
Documents
-
view
0 -
download
0
Transcript of Investor Presentation - Carrols Restaurant Group, Inc.
Carrols Restaurant Group, Inc. (Nasdaq: TAST)
Investor Presentation
August 2018
Safe Harbor Statement
2
Under the Private Securities Litigation Reform Act of 1995
Our presentation includes, and our response to various questions may include, forward-looking statements. Forward-looking statements, written, oral or otherwise made, represent the Company’s expectation or belief concerning future events.
Without limiting the foregoing, these statements are often identified by the words “may”, “might”, “believes”, “thinks”, “anticipates”, “plans”, “expects”, “intends” or similar expressions. In addition, expressions of our strategies, intentions or plans, are also forward-looking statements.
Such statements reflect management’s current views with respect to future events and are subject to risks and uncertainties, both known and unknown.
You are cautioned not to place undue reliance on these forward-looking statements as there are important factors that could cause actual results to differ materially from those in forward-looking statements, many of which are beyond our control.
Investors are referred to the full discussion of risks and uncertainties as included in Carrols Restaurant Group, Inc.’s filings with the Securities and Exchange Commission (SEC) including, without limitation, its Annual Report on Form 10-K.
Non-GAAP Financial Measures
EBITDA, Adjusted EBITDA and Restaurant-Level EBITDA are non-GAAP financial measures. We are presenting these financial measures because we believe they provide a more meaningful comparison of our core business operating results, as well as to those of other similar companies. We believe that these measures, when viewed with our results of operations in accordance with GAAP, provide useful information about our operating performance and permit investors to gain an understanding of the factors and trends affecting our ongoing cash earnings, from which capital investments are made and debt is serviced.
These are not measures of financial performance or liquidity under GAAP and, accordingly, should not be considered as alternatives to net income (loss) or cash flow from operating activities as indicators of operating performance or liquidity. We direct you to our filings with the SEC for a reconciliation of these non-GAAP measures to the appropriate GAAP measures.

Overview
3 (1) Restaurant count as of July 1, 2018
•807 restaurants with geographical diversity across 17 states (1)
•2017 sales of $1.09B; adjusted EBITDA of $91.4M •LTM Q2’18 sales $1.14B; adjusted EBITDA of $101.8M
Carrols is the largest Burger King franchisee in the U.S.
•Historical performance has generally exceeded overall U.S. BK system •Positive comparable restaurant sales growth in 25 of past 28 quarters •Strong financial momentum with significant growth opportunities
Best-in-class operator with strong P&L performance
•Control franchisor’s Right of First Refusal (“ROFR”) in 20 states which BKC assigned to Carrols in 2012
•Have acquired 578 Burger King restaurants since May 2012 •BKC holds 21% equity interest in Carrols •Preapproved for expansion in ROFR states; potential to grow beyond •Over 75% of restaurants have been reimaged to updated “20/20”
design since 2012
Well positioned for expansion and growth
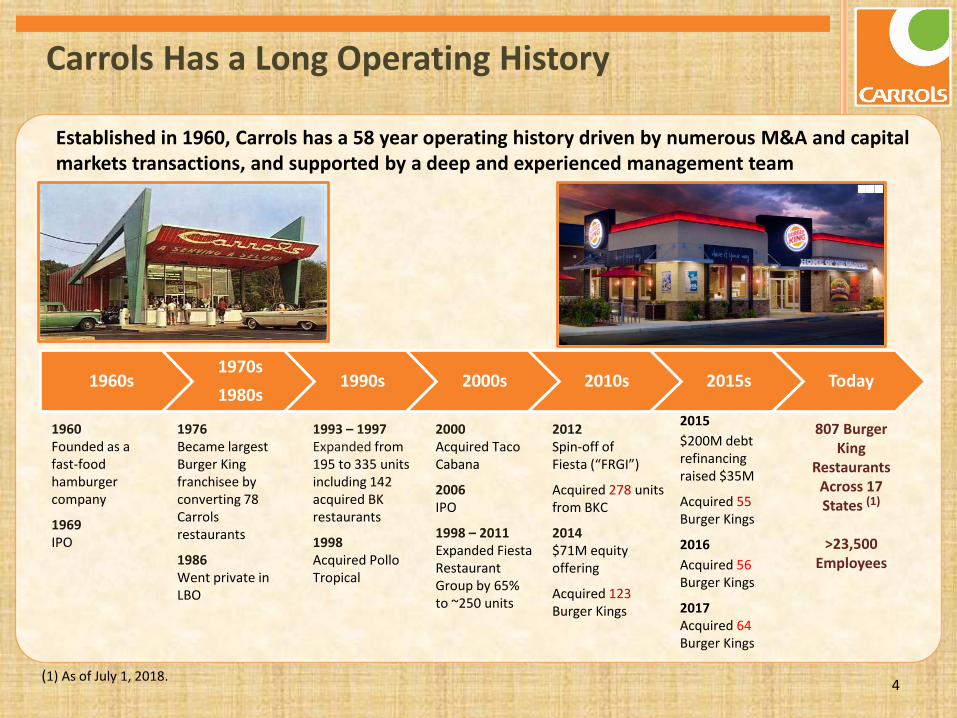
Established in 1960, Carrols has a 58 year operating history driven by numerous M&A and capital markets transactions, and supported by a deep and experienced management team
4
Carrols Has a Long Operating History
1960s 1970s 1980s
1990s 2000s 2010s 2015s Today
1960 Founded as a fast-food hamburger company
1969 IPO
1976 Became largest Burger King franchisee by converting 78 Carrols restaurants
1986 Went private in LBO
1993 – 1997 Expanded from 195 to 335 units including 142 acquired BK restaurants
1998 Acquired Pollo Tropical
2000 Acquired Taco Cabana
2006 IPO
1998 – 2011 Expanded Fiesta Restaurant Group by 65% to ~250 units
2012 Spin-off of Fiesta (“FRGI”)
Acquired 278 units from BKC
2014 $71M equity offering
Acquired 123 Burger Kings
807 Burger King
Restaurants Across 17 States (1)
>23,500
Employees
(1) As of July 1, 2018.
2015 $200M debt refinancing raised $35M
Acquired 55 Burger Kings
2016 Acquired 56 Burger Kings
2017 Acquired 64 Burger Kings
Investment Highlights
5
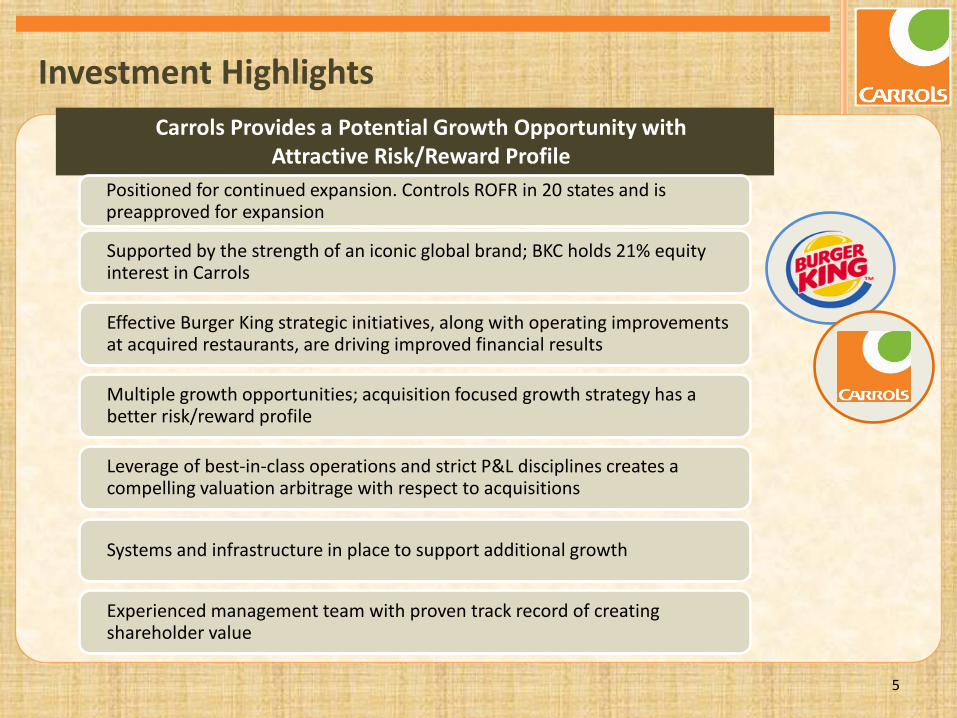
Carrols Provides a Potential Growth Opportunity with Attractive Risk/Reward Profile
Positioned for continued expansion. Controls ROFR in 20 states and is preapproved for expansion
Supported by the strength of an iconic global brand; BKC holds 21% equity interest in Carrols
Effective Burger King strategic initiatives, along with operating improvements at acquired restaurants, are driving improved financial results
Multiple growth opportunities; acquisition focused growth strategy has a better risk/reward profile
Leverage of best-in-class operations and strict P&L disciplines creates a compelling valuation arbitrage with respect to acquisitions
Systems and infrastructure in place to support additional growth
Experienced management team with proven track record of creating shareholder value
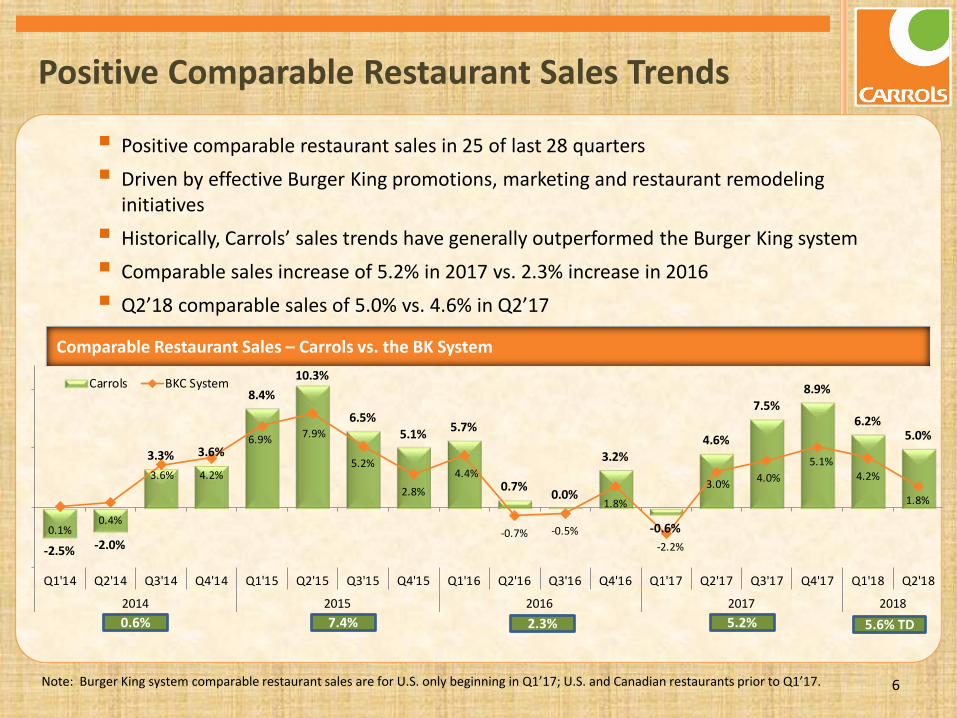
Positive comparable restaurant sales in 25 of last 28 quarters Driven by effective Burger King promotions, marketing and restaurant remodeling
initiatives Historically, Carrols’ sales trends have generally outperformed the Burger King system Comparable sales increase of 5.2% in 2017 vs. 2.3% increase in 2016 Q2’18 comparable sales of 5.0% vs. 4.6% in Q2’17
6
Positive Comparable Restaurant Sales Trends
Comparable Restaurant Sales – Carrols vs. the BK System
Note: Burger King system comparable restaurant sales are for U.S. only beginning in Q1’17; U.S. and Canadian restaurants prior to Q1’17.
-2.5% -2.0%
3.3% 3.6%
8.4%10.3%
6.5%5.1% 5.7%
0.7% 0.0%
3.2%
-0.6%
4.6%
7.5%8.9%
6.2%5.0%
0.1%0.4%
3.6% 4.2%
6.9% 7.9%
5.2%
2.8%4.4%
-0.7% -0.5%
1.8%
-2.2%
3.0% 4.0%5.1%
4.2%
1.8%
Q1'14 Q2'14 Q3'14 Q4'14 Q1'15 Q2'15 Q3'15 Q4'15 Q1'16 Q2'16 Q3'16 Q4'16 Q1'17 Q2'17 Q3'17 Q4'17 Q1'18 Q2'18
2014 2015 2016 2017 2018
Carrols BKC System
2.3% 5.2% 7.4% 0.6% 5.6% TD

Premium – Build Brand, Check and Core Business
Value Promotions – Drive Traffic
7
Effective Burger King Menu and Marketing Strategy
Premium products + value promotions = Balanced approach to drive sales and profitable traffic
Effective marketing and promotional campaigns are driving top-line sales Barbell pricing strategy with balanced marketing approach ‒Value promotions used to drive traffic ‒Premium products build brand and drive growth in core business
Food-centric advertising targets broad demographic base and has expanded brand appeal Using differentiating products and social media to effectively appeal to BK’s younger
customers Increased promotional activity over past two years driving higher QSR sales

Over 75% of restaurants have been reimaged to updated “20/20” design since 2012
Reimaged restaurants have experienced an average sales lift of ~10-12% with cash on cash returns of 12-15%
Have reduced remodeling to 30-35 units in 2017 and 2018 increasing free cash flow available for acquisitions and building new restaurants
Total 2018 spending before growth capex anticipated to be $58 to $62M. Planned spending for 13 to 15 new units and remaining 2017 construction costs estimated to be $20 to $25M.
8
Remodeling Investments; 2018 Capital Spending
Interior Images (Before and After
Reimage)
Exterior Images (Before and After
Reimage)
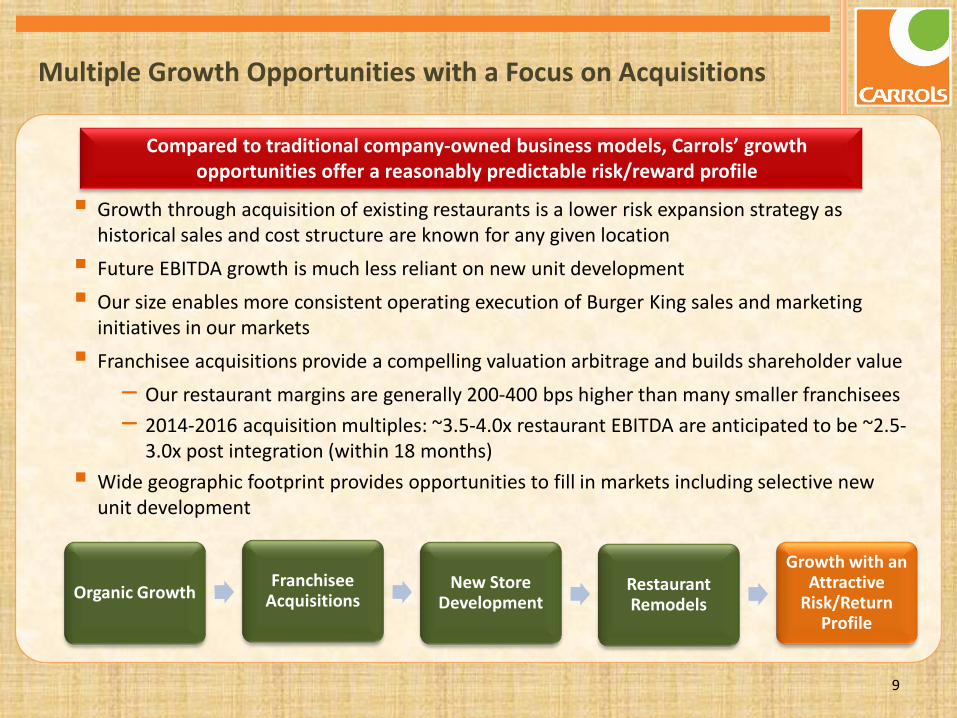
Growth through acquisition of existing restaurants is a lower risk expansion strategy as historical sales and cost structure are known for any given location Future EBITDA growth is much less reliant on new unit development Our size enables more consistent operating execution of Burger King sales and marketing
initiatives in our markets Franchisee acquisitions provide a compelling valuation arbitrage and builds shareholder value
‒ Our restaurant margins are generally 200-400 bps higher than many smaller franchisees ‒ 2014-2016 acquisition multiples: ~3.5-4.0x restaurant EBITDA are anticipated to be ~2.5-
3.0x post integration (within 18 months) Wide geographic footprint provides opportunities to fill in markets including selective new
unit development
9
Multiple Growth Opportunities with a Focus on Acquisitions
Organic Growth Franchisee
Acquisitions New Store
Development Restaurant Remodels
Growth with an Attractive
Risk/Return Profile
Compared to traditional company-owned business models, Carrols’ growth opportunities offer a reasonably predictable risk/reward profile

10
Positioned to Execute Expansion Strategy
10 (1) ROFR includes Washington, D.C. and excludes specified markets (i.e., NYC, Boston and Hartford metro markets). (2) Information based on Burger King’s 2016 Franchise Disclosure Document. Includes ~270 units in non-ROFR markets in NY, CT and MA.
88
15
117
129
36
62 54
152
32
1 5
10
19
31
36
Non-ROFR States ROFR States
Largest BK Franchisee - 807 Restaurants in 17 States (>11% of U.S.system)
Control Burger King’s right of first refusal (ROFR) in a 20-state area (1)
Preapproved to expand to 1,000 restaurants in the ROFR territory Ability to expand beyond this region with
Burger King approval BKC holds 21% equity interest in Carrols Have acquired 578 restaurants since May
2012 Demonstrated ability to effectively
integrate acquisitions and improve operating performance
Positioned for Expansion
There are over 2,000 additional franchised restaurants in the 20-state ROFR area(2)
(As of July 1, 2018)
3
17

11
Acquired 300 Restaurants Over Past 4 Years – Acquired 578 since May 2012
* Acquisition made following exercise of right of first refusal.
Date # of Units Markets
# of Fee
Owned
2014 – Acquired 123 Restaurants
4/30/14 4* Fort Wayne, IN
6/30/14 4* Pittsburgh, PA market 1
7/22/14 21 Rochester, NY and Southern Tier Western NY
10/8/14 30* Eastern North Carolina 12
11/4/14 64 Nashville, TN; Springfield, IL; Terre Haute, IN; Evansville, IN
2015 – Acquired 55 Restaurants
3/31/15 4 Northern Vermont
8/5/15 5* Rock Hill and Fort Mill, South Carolina
10/1/15 5* Wheeling, WV market 1
10/20/15 1 Kalamazoo, MI
11/17/15 8 Evansville market 5
12/1/15 23* Detroit, MI market 10
12/8/15 9 Northern New Jersey
Date # of Units Markets
# of Fee
Owned
2016 – Acquired 56 Restaurants
2/23/16 12* Central Pennsylvania
5/25/16 6* Detroit, MI 5
7/14/16 4* Detroit, MI 3
8/23/16 7 Portland, ME 6
10/4/16 3 Raleigh, NC
11/8/16 7 Columbus, OH 6
11/15/16 17 Pittsburgh & Johnstown , PA
2017 – Acquired 64 Restaurants
2/28/17 43 Cincinnati, OH
6/6/17 17* Maryland (Baltimore, Washington markets)
11/28/17 4 Maine
Q1 2018 – Acquired 1 Restaurant
2/14/18 1 Fishkill, NY (Hudson Valley)
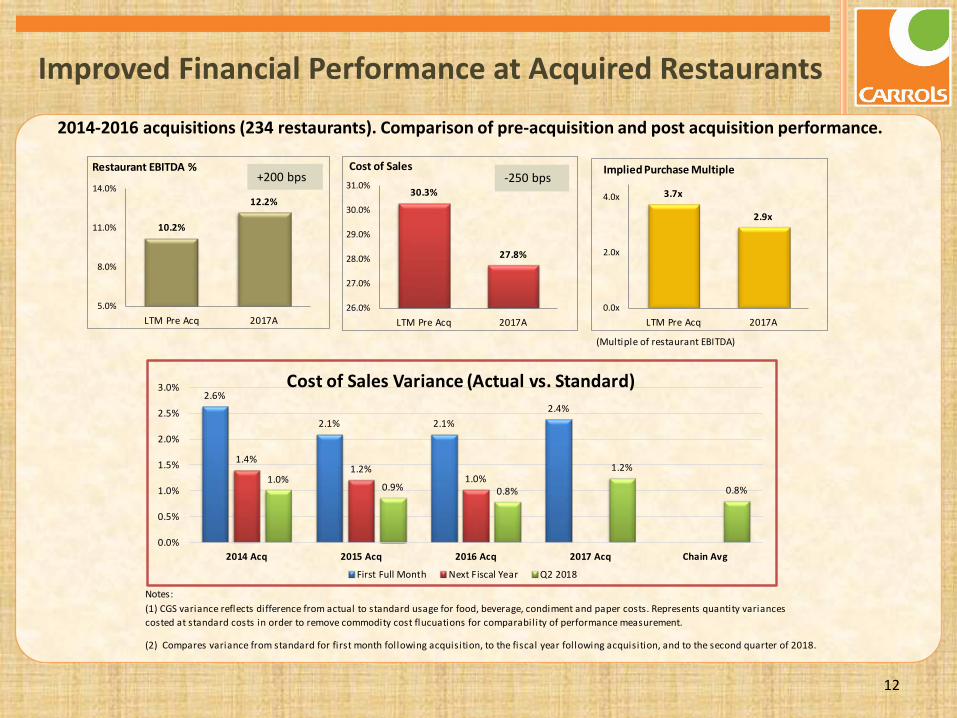
(Multiple of restaurant EBITDA)
Notes:
(2) Compares variance from standard for first month following acquisition, to the fiscal year following acquisition, and to the second quarter of 2018.
(1) CGS variance reflects difference from actual to standard usage for food, beverage, condiment and paper costs. Represents quantity variances costed at standard costs in order to remove commodity cost flucuations for comparabil ity of performance measurement.
2.6%
2.1% 2.1%2.4%
1.4%1.2%
1.0%1.0%0.9% 0.8%
1.2%
0.8%
0.0%
0.5%
1.0%
1.5%
2.0%
2.5%
3.0%
2014 Acq 2015 Acq 2016 Acq 2017 Acq Chain Avg
Cost of Sales Variance (Actual vs. Standard)
First Full Month Next Fiscal Year Q2 2018
30.3%
27.8%
26.0%
27.0%
28.0%
29.0%
30.0%
31.0%
LTM Pre Acq 2017A
Cost of Sales
10.2%
12.2%
5.0%
8.0%
11.0%
14.0%
LTM Pre Acq 2017A
Restaurant EBITDA %
3.7x
2.9x
0.0x
2.0x
4.0x
LTM Pre Acq 2017A
Implied Purchase Multiple
12
Improved Financial Performance at Acquired Restaurants
2014-2016 acquisitions (234 restaurants). Comparison of pre-acquisition and post acquisition performance.
+200 bps -250 bps
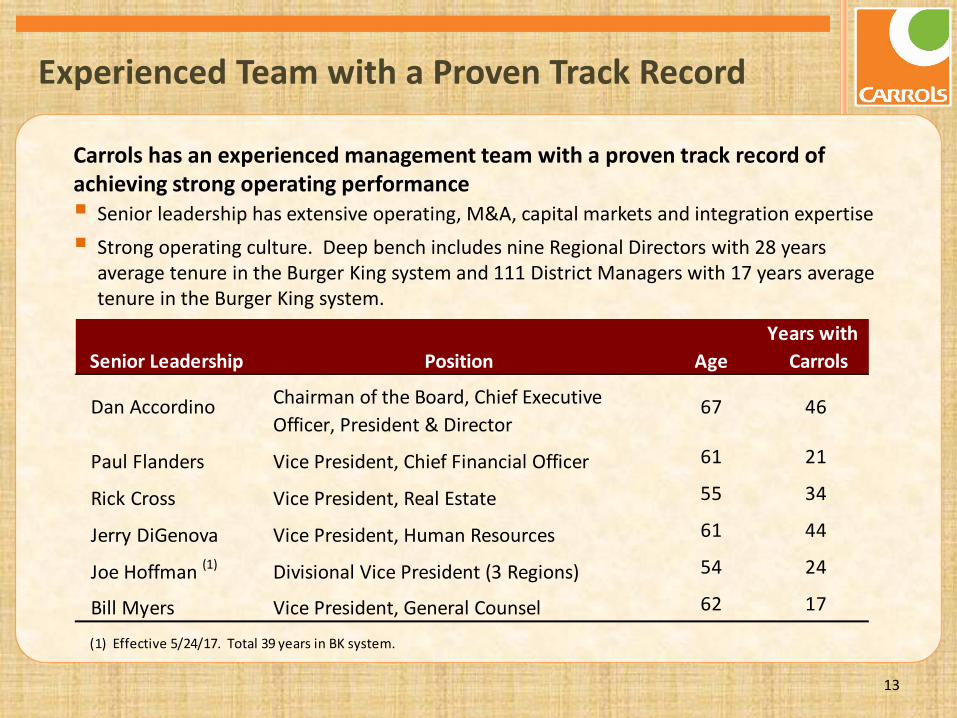
Carrols has an experienced management team with a proven track record of achieving strong operating performance Senior leadership has extensive operating, M&A, capital markets and integration expertise Strong operating culture. Deep bench includes nine Regional Directors with 28 years
average tenure in the Burger King system and 111 District Managers with 17 years average tenure in the Burger King system.
13
Experienced Team with a Proven Track Record
Years withSenior Leadership Position Age Carrols
Dan Accordino Chairman of the Board, Chief Executive Officer, President & Director
67 46
Paul Flanders Vice President, Chief Financial Officer 61 21
Rick Cross Vice President, Real Estate 55 34
Jerry DiGenova Vice President, Human Resources 61 44
Joe Hoffman (1) Divisional Vice President (3 Regions) 54 24
Bill Myers Vice President, General Counsel 62 17
(1) Effective 5/24/17. Total 39 years in BK system.
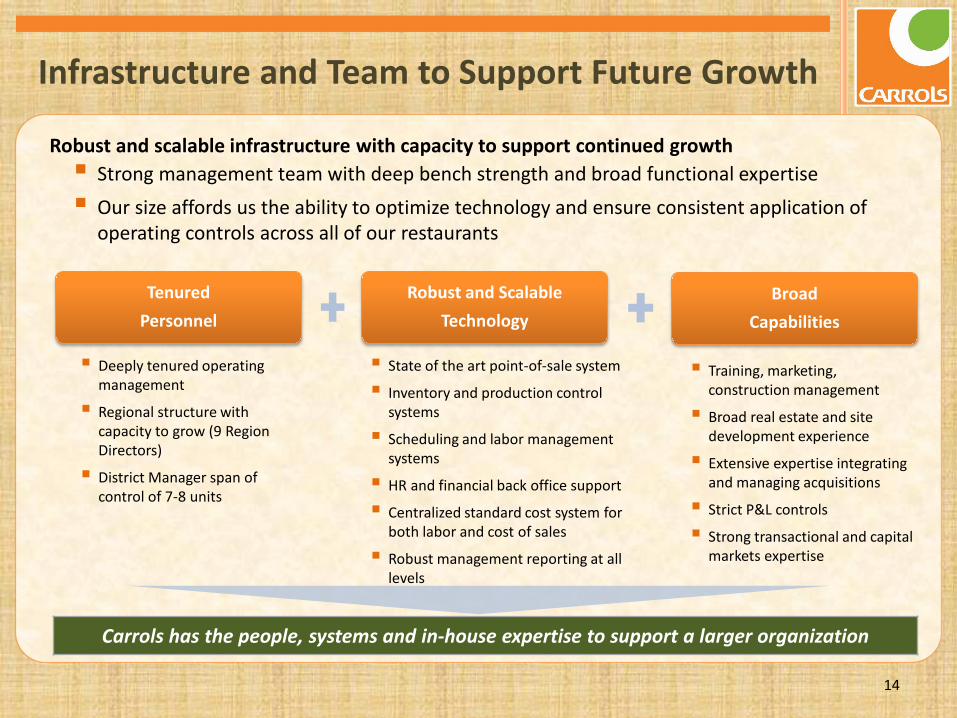
Robust and scalable infrastructure with capacity to support continued growth Strong management team with deep bench strength and broad functional expertise Our size affords us the ability to optimize technology and ensure consistent application of
operating controls across all of our restaurants
14
Infrastructure and Team to Support Future Growth
Tenured Personnel
Robust and Scalable Technology
Broad Capabilities
Deeply tenured operating management
Regional structure with capacity to grow (9 Region Directors)
District Manager span of control of 7-8 units
State of the art point-of-sale system
Inventory and production control systems
Scheduling and labor management systems
HR and financial back office support
Centralized standard cost system for both labor and cost of sales
Robust management reporting at all levels
Training, marketing, construction management
Broad real estate and site development experience
Extensive expertise integrating and managing acquisitions
Strict P&L controls
Strong transactional and capital markets expertise
Carrols has the people, systems and in-house expertise to support a larger organization
15
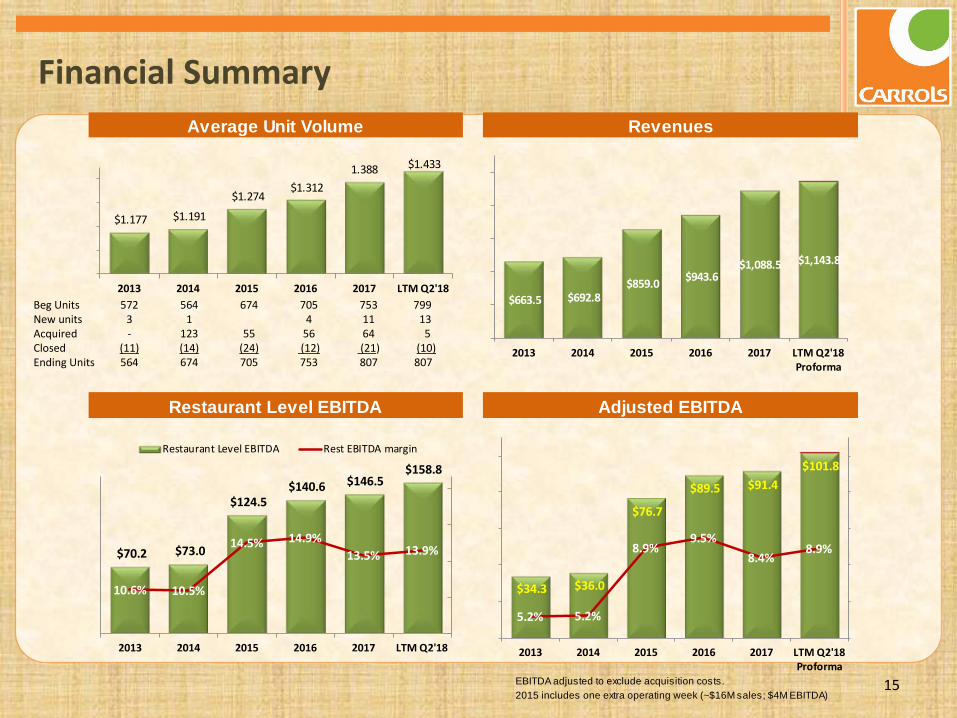
Financial Summary
EBITDA adjusted to exclude acquisition costs. 2015 includes one extra operating week (~$16M sales; $4M EBITDA)
Adjusted EBITDA
RevenuesAverage Unit Volume
Restaurant Level EBITDA
$34.3 $36.0
$76.7
$89.5 $91.4 $101.8
5.2% 5.2%
8.9%9.5%
8.4%8.9%
2013 2014 2015 2016 2017 LTM Q2'18Proforma
$70.2 $73.0
$124.5 $140.6 $146.5
$158.8
10.6% 10.5%
14.5% 14.9%13.5% 13.9%
2013 2014 2015 2016 2017 LTM Q2'18
Restaurant Level EBITDA Rest EBITDA margin
$1.177 $1.191
$1.274 $1.312
1.388 $1.433
2013 2014 2015 2016 2017 LTM Q2'18$663.5 $692.8
$859.0 $943.6 $1,088.5 $1,143.8
2013 2014 2015 2016 2017 LTM Q2'18Proforma
Beg Units 572 564 674 705 753 799 New units 3 1 4 11 13 Acquired - 123 55 56 64 5 Closed (11) (14) (24) (12) (21) (10) Ending Units 564 674 705 753 807 807

16
Financial Results and 2018 Guidance
Financial Results ($ mm)
20182016 2017 Change 2017 2018 Change Guidance
Sales $943.6 $1,088.5 $144.9 $279.5 $303.1 $23.6 $1.16 to $1.18BTotal revenue growth 15.4% 8.4%Comparable store sales (%) 2.3% 5.2% 4.6% 5.0% 3% to 4%
Restaurant-level EBITDA 140.6 146.5 5.8 40.6 47.4 6.8Margin (%) 14.9% 13.5% -1.4% 14.5% 15.6% 1.1%
Adjusted EBITDA (1) 89.5 91.4 1.9 27.5 32.8 5.3 $100 to $105M
Margin (%) 9.5% 8.4% -1.1% 9.8% 10.8% 1.0%
Income from Operations 35.7 29.5 (6.2) 12.3 13.8 1.5Adjusted Net Income (2) 17.9 9.0 (8.8) 6.6 10.0 3.4Adjusted Earnings per Share (2) 0.40$ 0.20$ (0.20)$ 0.14$ 0.22$ 0.08$
(1) Adjusted EBITDA excludes stock compensation, impairment and other lease charges, acquisition costs and other gains and losses.
(2)Adjusted net income also excludes $30.4M from 2016 reversal of valuation allowance for deferred taxes and 2017 impact of $0.8M for deferred tax revaluation for reduction in Federal tax rate.
Fiscal Year Second Quarter

Long history in capital markets with demonstrated ability to prudently employ and manage leverage
April 2014 equity offering raised $67 million
April 2015 financing raised $35M (net): ‒ $200M senior secured 2nd lien notes (8%)
‒ 7 year tenor, non-call 3 years (May 2018)
‒ 325 bps reduction in interest rate
Leverage has decreased over past 5 years due to strong operating performance and EBITDA from new acquisitions
Capital in place for additional growth: ‒ Expanded revolver in Jan 2017 to provide
additional capital for acquisitions
‒ $75M add-on to senior secured 2nd lien notes in June 2017; proceeds partially used to pay off outstanding revolver
Anticipate $10-15M of sale/leasebacks in 2018
17
Debt and Capital Structure Debt and Leverage (net of cash)
$160.5 $159.9
$209.2$223.6
$281.9 $283.7
3.86x3.20x
2.22x 2.38x2.67x 2.41x
1.00x
3.00x
5.00x
7.00x
$0.0
$100.0
$200.0
$300.0
2013 2014 2015 2016 2017 7/1/18
Total Debt Net Debt/Pro Forma Adj. EBITDA
Capitalization Table ($ M) 7/1/18
Cash 38.2$ Debt:
Revolving Credit Facility ($73M total) - Senior Secured 2nd Lien Notes 275.0 Capital leases 4.8 Lease financing obligations 3.9 Total Debt 283.7$

18
Investment Highlights Carrols Provides a Potential Growth Opportunity with
Attractive Risk/Reward Profile Positioned for continued expansion. Controls ROFR in 20 states and is preapproved for expansion
Supported by the strength of an iconic global brand; BKC holds 21% equity interest in Carrols
Effective Burger King strategic initiatives, along with operating improvements at acquired restaurants, are driving improved financial results
Multiple growth opportunities; acquisition focused growth strategy has a better risk/reward profile
Leverage of best-in-class operations and strict P&L disciplines creates a compelling valuation arbitrage with respect to acquisitions
Systems and infrastructure in place to support additional growth
Experienced management team with proven track record of creating shareholder value